Embed Size (px)
Citation preview
I
Numerical Rocket
Modeling of Pulse Detonation Engine Gasdynamics And
Performance C. I. Morris*
NASNGeorge C. Marshall Space Flight Center TD4O/Propulsion Research Center
Marshall Space Flight Center, AL USA 35812
Submitted to Journal of Propulsion and Power, Jan. 2004
Abstract Pulse detonation rocket engines (PDREs) offer potential performance improvements over con-
ventional designs, but represent a challenging modeling task. A quasi-1-D, finite-rate chemistry computational fluid dynamics model for PDREs is described and implemented. Four different PDRE geometries are evaluated in this work: a baseline detonation tube, a detonation tube with a straight extension, and a detonation tube with two types of converging-diverging (C-D) nozzles. The effect of extension length and C-D nozzle area ratio on the single-shot gasdynamics and per- formance of a PDRE is studied over a wide range of blowdown pressure ratios (1-1000). The results indicate that a C-D nozzle is generally more effective than a straight extension in improving PDRE performance, particularly at higher pressure ratios. Additionally, the results show that the blowdown process of the C-D nozzle systems could be beneficially cut off well before the pres- sure at the end-wall reaches the ambient value. The performance results are also compared to a steady-state rocket system using similar modeling assumptions.
*Research Engineer, Member AIAA
https://ntrs.nasa.gov/search.jsp?R=20040034029 2018-05-22T00:40:04+00:00Z

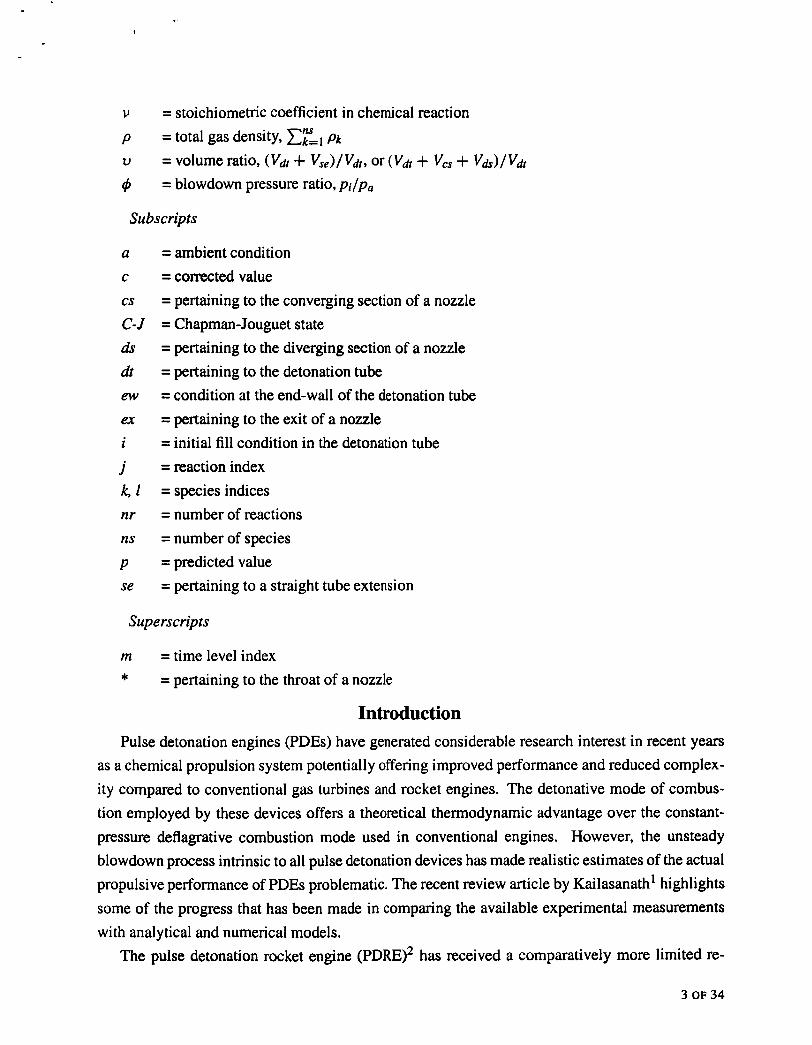
Nomenclature A = pre-exponential constant in Arrhenius relation Cpk = specific heat at constant pressure for species k D =diameter e = total energy per unit mass Eat = activation energy in Arrhenius relation F = Troe correction factor for pressure-dependent reactions Fc = Troe centering parameter for pressure-dependent reactions F = inviscid convective flux vector
h: = heat of formation of species k H = source vector for area change kbr = backward reaction rate keq = equilibrium constant kfr = forward reaction rate ko0 = high-pressure rate limit of pressure-dependent reactions ko = low-pressure rate limit of pressure-dependent reactions L =length Mk = molecular weight of species k p = ideal gas pressure, Cr=l (pk/hfk)RT P, = reduced pressure for pressure-dependent reactions R = universal gas constant S(x) = cross sectional area as a function of x t = time from detonation initiation t M = blowdown time, point in blowdown history when pew = pa tzt = point in blowdown history when thrust first drops to zero T = gas temperature U = gas velocity in the x direction U = wave velocity in the x direction U = state vector V =volume W X = distance from end-wall
Yk B E
y
= source vector for finite-rate chemistry
= mass fraction of species k, pk /p = temperature exponent in Arrhenius relation = nozzle area expansion ratio, S,/S* = ratio of specific heats
2 OF 34
v p u
4
= stoichiometric coefficient in chemical reaction = total gas density, cy=, pk
= volume ratio, (Vdt + Vse)/Vdt, or (Vdt + V,, + Vh)/Vdt = blowdown pressure ratio, pj/pa
Subscripts
a = ambient condition C = corrected value cs C-J = Chapman-Jouguet state ds dt ew ex i j = reaction index k, I = species indices nr = number of reactions ns = number of species p = predicted value se
= pertaining to the converging section of a nozzle
= pertaining to the diverging section of a nozzle = pertaining to the detonation tube = condition at the end-wall of the detonation tube = pertaining to the exit of a nozzle = initial fill condition in the detonation tube
= pertaining to a straight tube extension
Superscripts
m = time level index * = pertaining to the throat of a nozzle
Introduction Pulse detonation engines (PDEs) have generated considerable research interest in recent years
as a chemical propulsion system potentially offering improved performance and reduced complex- ity compared to conventional gas turbines and rocket engines. The detonative mode of combus- tion employed by these devices offers a theoretical thermodynamic advantage over the constant- pressure deflagrative combustion mode used in conventional engines. However, the unsteady blowdown process intrinsic to all pulse detonation devices has made realistic estimates of the actual propulsive performance of PDEs problematic. The recent review article by Kailasanath' highlights some of the progress that has been made in comparing the available experimental measurements with analytical and numerical models.
The pulse detonation rocket engine (PDRE)2 has received a comparatively more limited re-
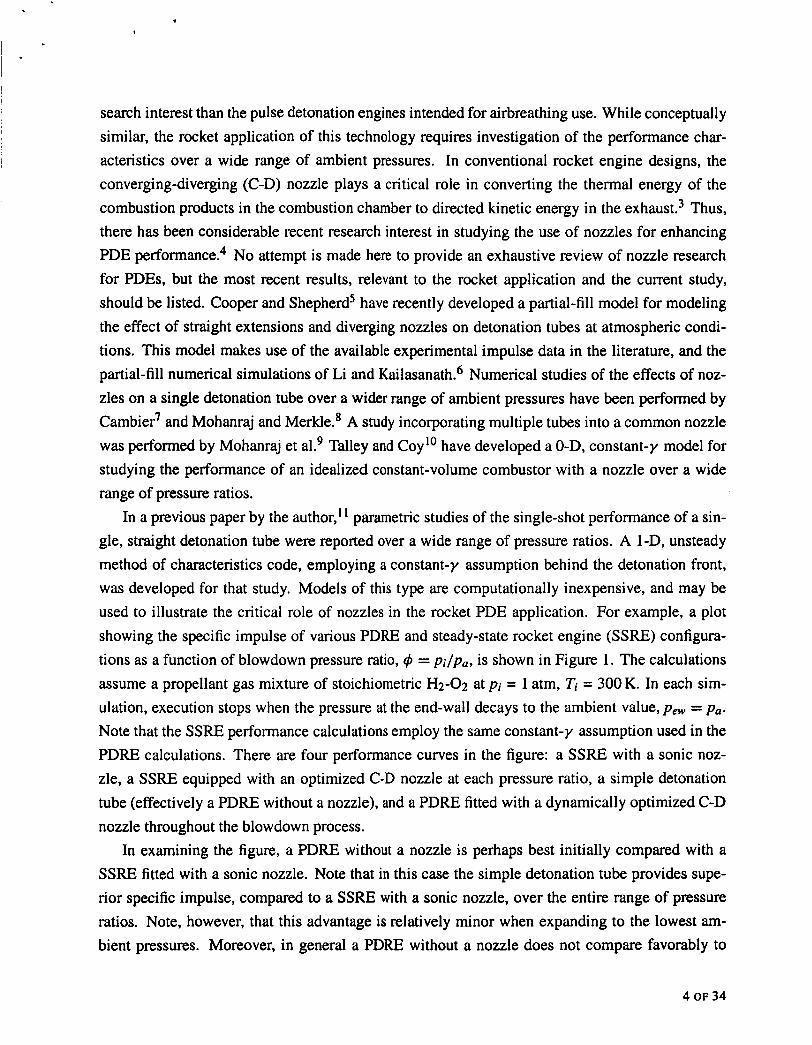
I 1 -
search interest than the pulse detonation engines intended for airbreathing use. While conceptually similar, the rocket application of this technology requires investigation of the performance char- acteristics over a wide range of ambient pressures. In conventional rocket engine designs, the converging-diverging (C-D) nozzle plays a critical role in converting the thermal energy of the combustion products in the combustion chamber to directed kinetic energy in the e~haus t .~ Thus, there has been considerable recent research interest in studying the use of nozzles for enhancing PDE perf~rmance.~ No attempt is made here to provide an exhaustive review of nozzle research for PDEs, but the most recent results, relevant to the rocket application and the current study, should be listed. Cooper and Shepherd' have recently developed a partial-fill model for modeling the effect of straight extensions and diverging nozzles on detonation tubes at atmospheric condi- tions. This model makes use of the available experimental impulse data in the literature, and the partial-fill numerical simulations of Li and Kailasanath.6 Numerical studies of the effects of noz- zles on a single detonation tube over a wider range of ambient pressures have been performed by Cambier7 and Mohanraj and Merkle.' A study incorporating multiple tubes into a common nozzle was performed by Mohanraj et Talley and Coy lo have developed a 0-D, constant-y model for studying the performance of an idealized constant-volume combustor with a nozzle over a wide range of pressure ratios.
In a previous paper by the author,' ' parametric studies of the single-shot performance of a sin- gle, straight detonation tube were reported over a wide range of pressure ratios. A 1-D, unsteady method of characteristics code, employing a constant-y assumption behind the detonation front, was developed for that study. Models of this type are computationally inexpensive, and may be used to illustrate the critical role of nozzles in the rocket PDE application. For example, a plot showing the specific impulse of various PDRE and steady-state rocket engine (SSRE) configura- tions as a function of blowdown pressure ratio, 4 = pi/p,, is shown in Figure 1. The calculations assume a propellant gas mixture of stoichiometric H2-02 at pi = 1 atm, Ti = 300K. In each sim- ulation, execution stops when the pressure at the end-wall decays to the ambient value, pew = pa. Note that the SSRE performance calculations employ the same constant-y assumption used in the PDRE calculations. There are four performance curves in the figure: a SSRE with a sonic noz- zle, a SSRE equipped with an optimized C-D nozzle at each pressure ratio, a simple detonation tube (effectively a PDRE without a nozzle), and a PDRE fitted with a dynamically optimized C-D nozzle throughout the blowdown process.
In examining the figure, a PDRE without a nozzle is perhaps best initially compared with a SSRE fitted with a sonic nozzle. Note that in this case the simple detonation tube provides supe- rior specific impulse, compared to a SSRE with a sonic nozzle, over the entire range of pressure ratios. Note, however, that this advantage is relatively minor when expanding to the lowest am- bient pressures. Moreover, in general a PDRE without a nozzle does not compare favorably to
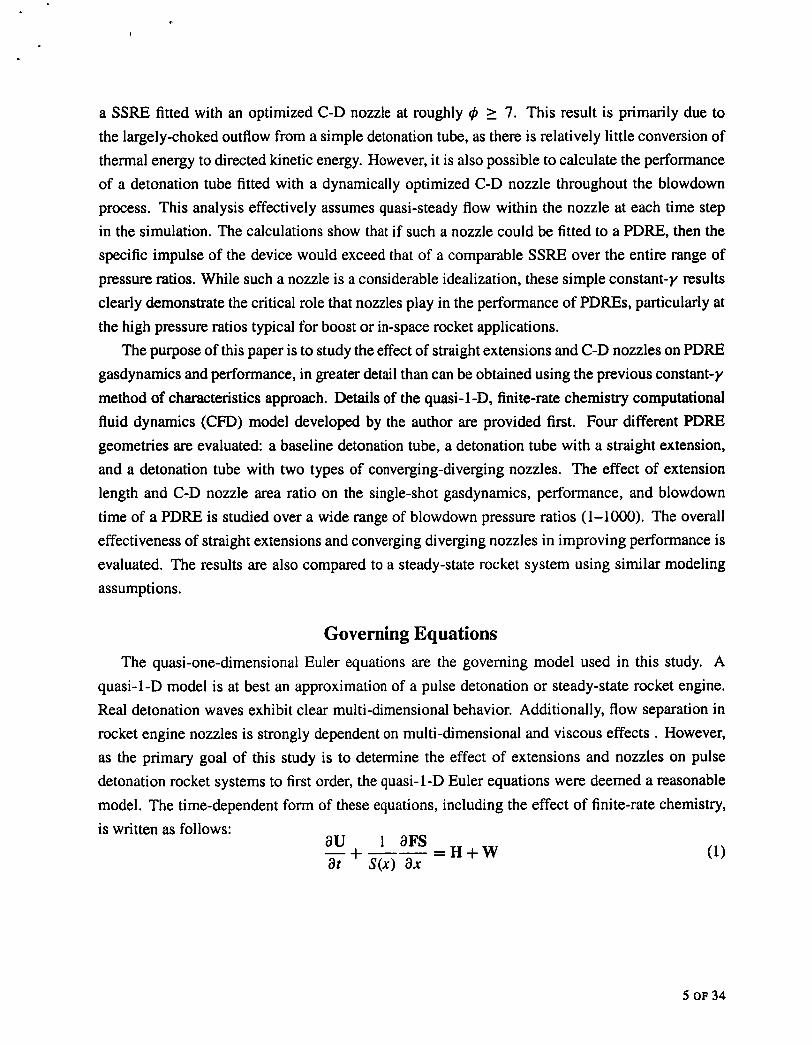
a SSRE fitted with an optimized C-D nozzle at roughly $J 2 7. This result is primarily due to the largely-choked outflow from a simple detonation tube, as there is relatively little conversion of thermal energy to directed kinetic energy. However, it is also possible to calculate the performance of a detonation tube fitted with a dynamically optimized C-D nozzle throughout the blowdown process. This analysis effectively assumes quasi-steady flow within the nozzle at each time step in the simulation. The calculations show that if such a nozzle could be fitted to a PDRE, then the specific impulse of the device would exceed that of a comparable SSRE over the entire range of pressure ratios. While such a nozzle is a considerable idealization, these simple constant-y results clearly demonstrate the critical role that nozzles play in the performance of PDREs, particularly at the high pressure ratios typical for boost or in-space rocket applications.
The purpose of this paper is to study the effect of straight extensions and C-D nozzles on PDRE gasdynamics and performance, in greater detail than can be obtained using the previous constant-y method of characteristics approach. Details of the quasi-1-D, finite-rate chemistry computational fluid dynamics (CFD) model developed by the author are provided first. Four different PDRE geometries are evaluated: a baseline detonation tube, a detonation tube with a straight extension, and a detonation tube with two types of converging-diverging nozzles. The effect of extension length and C-D nozzle area ratio on the single-shot gasdynamics, performance, and blowdown time of a PDRE is studied over a wide range of blowdown pressure ratios (1-1000). The overall effectiveness of straight extensions and converging diverging nozzles in improving performance is evaluated. The results are also compared to a steady-state rocket system using similar modeling assumptions.
Governing Equations The quasi-one-dimensional Euler equations are the governing model used in this study. A
quasi-1-D model is at best an approximation of a pulse detonation or steady-state rocket engine. Real detonation waves exhibit clear multi-dimensional behavior. Additionally, flow separation in rocket engine nozzles is strongly dependent on multi-dimensional and viscous effects . However, as the primary goal of this study is to determine the effect of extensions and nozzles on pulse detonation rocket systems to first order, the quasi-1-D Euler equations were deemed a reasonable model. The time-dependent form of these equations, including the effect of finite-rate chemistry, is written as follows:
- H + W aU 1 BFS -+--- at S ( X ) ax
5 OF 34
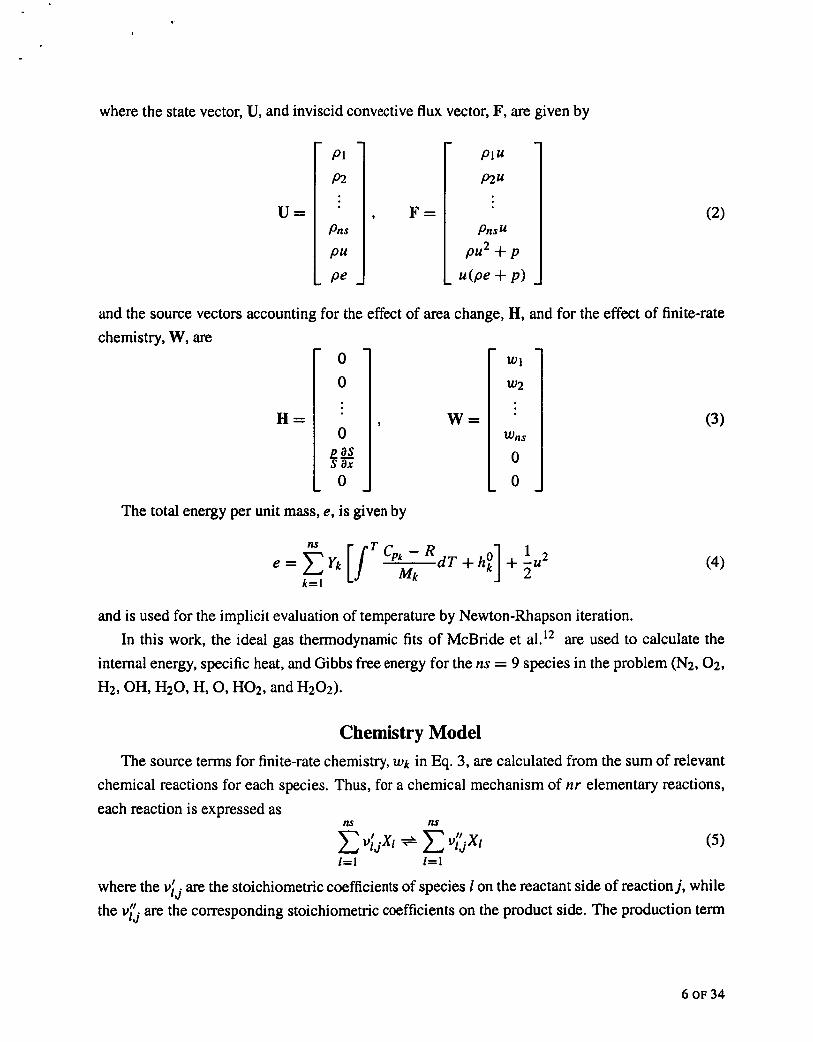
where the state vector, U, and inviscid convective flux vector, F, are given by
U = , F = 1 and the source vectors accounting for the effect of area change, H, and for the effect of finite-rate chemistry, W, are
The total energy per unit mass, e, is given by
W =
e = 2 Yk [/’ ‘ p k k - R
k=l
and is used for the implicit evaluation of temperature by Newton-Rhaps In this work, the ideal gas thermodynamic fits of McBride et a1.12
(3)
(4)
iteration. are used to calculate the
internal energy, specific heat, and Gibbs free energy for the ns = 9 species in the problem (N2,02, H2, OH, H20, H, 0, H02, and H202).
Chemistry Model The source terms for finite-rate chemistry, wk in Eq. 3, are calculated from the sum of relevant
chemical reactions for each species. Thus, for a chemical mechanism of nr elementary reactions, each reaction is expressed as
ns M
1=1 1=1
where the uiJ are the stoichiometric coefficients of species I on the reactant side of reactionj, while the u& are the corresponding stoichiometric coefficients on the product side. The production term
6 OF 34

for each species k may be written as
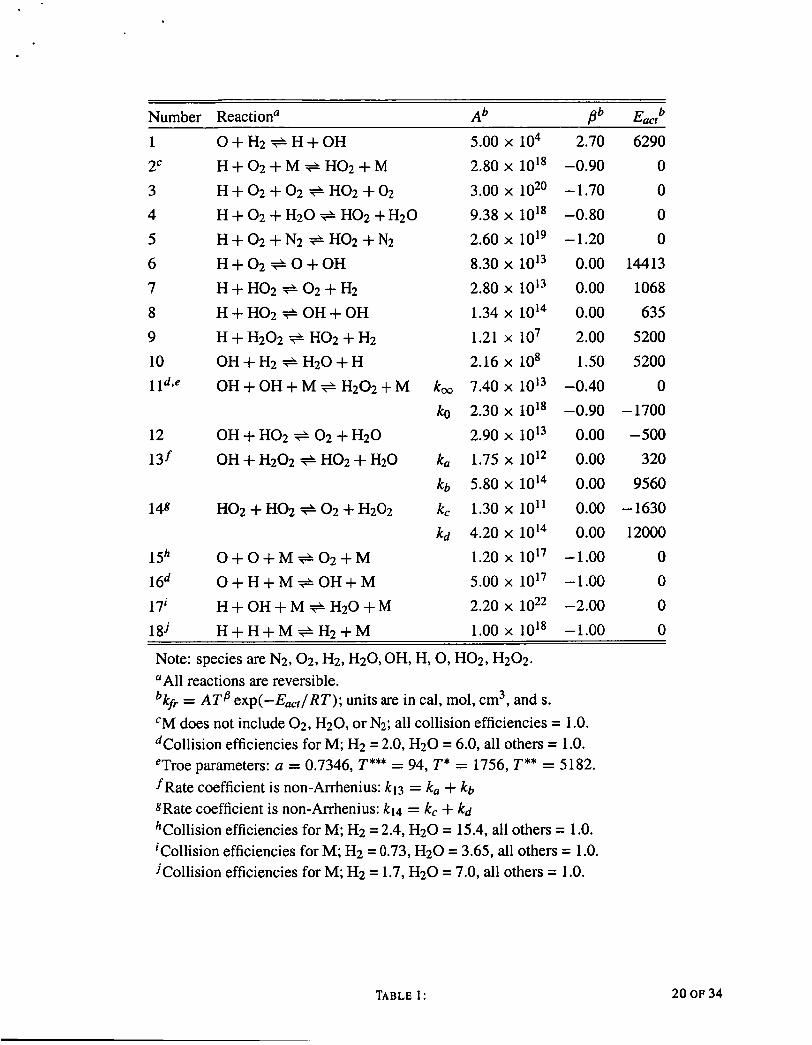
Details of the chemical kinetics mechanism for H2-02 combustion used in this work are shown in Table 1. This nr = 18 reaction mechanism was developed by Petersen and Hanson13 to model H2-02 ignition at the elevated pressures typical of practical high-speed propulsion systems. The rate coefficients for reactions without pressure dependence take on the conventional Arrhenius form:
kfri = AjTB’ exp(-E,,$/RT) (7)
Pressure-dependent reactions are modeled using the approach given by Kee: l4
where the reduced pressure, Pr, is ko [MI Pr = -
koo and the correction factor, F , is in the Troe” form:
}-’ In Fc l n P r + c
n - d(ln Pr + c)
where F, is given by
and the constants c = -0.4 - 0.67 In F,, n = -0.75 - 1.27 in F,, and d = 0.14.
is calculated from the forward rate and the equilibrium constant: All reactions in the mechanism are reversible. The reverse reaction rate for each reaction, kbr,
where the equilibrium constant, k,,, is calculated using the standard Gibbs free energy difference for each reaction.
Numerical Method The governing quasi-1-D Euler equations are solved in finite-volume form throughout the entire
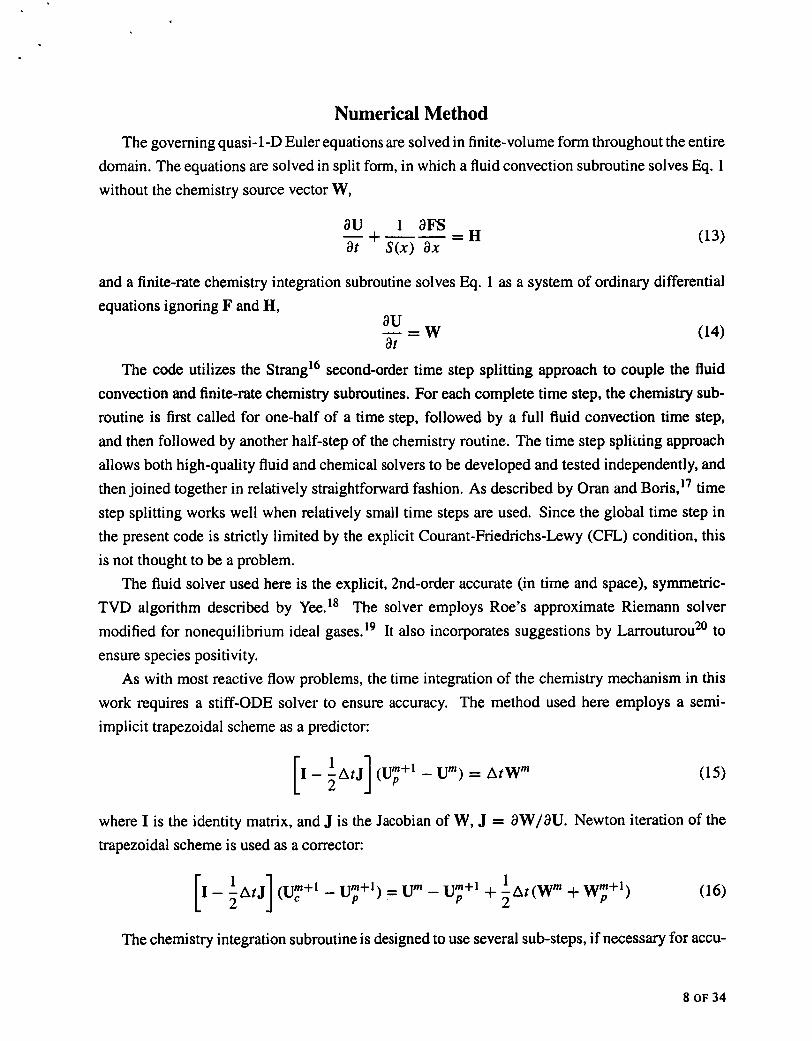
domain. The equations are solved in split form, in which a fluid convection subroutine solves Eq. 1 without the chemistry source vector W,
- H -+--- au I ~ F S at s(x) ax
and a finite-rate chemistry integration subroutine solves Eq. 1 as a system of ordinary differential equations ignoring F and H,
au at - = w
The code utilizes the Strang16 second-order time step splitting approach to couple the fluid convection and finite-rate chemistry subroutines. For each complete time step, the chemistry sub- routine is first called for one-half of a time step, followed by a full fluid convection time step, and then followed by another half-step of the chemistry routine. The time step spliiting approach allows both high-quality fluid and chemical solvers to be developed and tested independently, and then joined together in relatively straightforward fashion. As described by Oran and Boris," time step splitting works well when relatively small time steps are used. Since the global time step in the present code is strictly limited by the explicit Courant-Friedrichs-Lewy (CFL) condition, this is not thought to be a problem.
The fluid solver used here is the explicit, 2nd-order accurate (in time and space), symmetric- TVD algorithm described by Yee.18 The solver employs Roe's approximate Riemann solver modified for nonequilibrium ideal gases. l9 It also incorporates suggestions by Larrouturou20 to ensure species positivity.
As with most reactive flow problems, the time integration of the chemistry mechanism in this work requires a stiff-ODE solver to ensure accuracy. The method used here employs a semi- implicit trapezoidal scheme as a predictor:
I - -AtJ (UT+1 -Urn) = AtWm [ : I where I is the identity matrix, and J is the Jacobian of W, J = aW/aU. Newton iteration of the trapezoidal scheme is used as a corrector:
1 - -AtJ (U?" - UT+1) = Urn - UT+' + TAt(W" + W;+l) [I: 1
The chemistry integration subroutine is designed to use several sub-steps, if necessary for accu-
8 OF 34
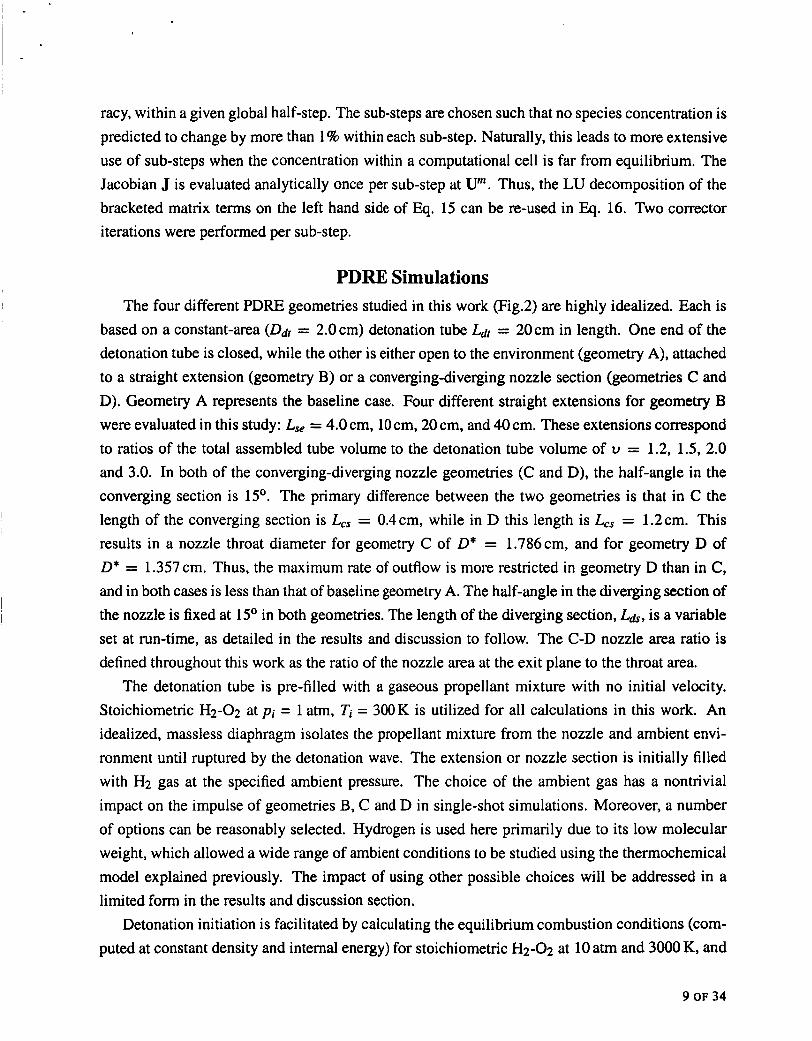
racy, within a given global half-step. The sub-steps are chosen such that no species concentration is predicted to change by more than 1% within each sub-step. Naturally, this leads to more extensive use of sub-steps when the concentration within a computational cell is far from equilibrium. The Jacobian J is evaluated analytically once per sub-step at Urn. Thus, the LU decomposition of the bracketed matrix terms on the left hand side of Eq. 15 can be re-used in Eq. 16. Two corrector iterations were performed per sub-step.
PDRE Simulations The four different PDRE geometries studied in this work (Fig.2) are highly idealized. Each is
based on a constant-area (Ddt = 2.0 cm) detonation tube Ldt = 20 cm in length. One end of the detonation tube is closed, while the other is either open to the environment (geometry A), attached to a straight extension (geometry B) or a converging-diverging nozzle section (geometries C and D). Geometry A represents the baseline case. Four different straight extensions for geometry B were evaluated in this study: Lse = 4.0 cm, 10 cm, 20 cm, and 40 cm. These extensions correspond to ratios of the total assembled tube volume to the detonation tube volume of u = 1.2, 1.5, 2.0 and 3.0. In both of the converging-diverging nozzle geometries (C and D), the half-angle in the converging section is 15'. The primary difference between the two geometries is that in C the length of the converging section is Lcs = 0.4cm, while in D this length is Lcs = 1.2cm. This results in a nozzle throat diameter for geometry C of D* = 1.786cm, and for geometry D of D* = 1.357 cm. Thus, the maximum rate of outflow is more restricted in geometry D than in C, and in both cases is less than that of baseline geometry A. The half-angle in the diverging section of the nozzle is fixed at 15' in both geometries. The length of the diverging section, Lh, is a variable set at run-time, as detailed in the results and discussion to follow. The C-D nozzle area ratio is defined throughout this work as the ratio of the nozzle area at the exit plane to the throat area.
The detonation tube is pre-filled with a gaseous propellant mixture with no initial velocity. Stoichiometric H2-02 at pi = 1 atm, Ti = 300K is utilized for all calculations in this work. An idealized, massless diaphragm isolates the propellant mixture from the nozzle and ambient envi- ronment until ruptured by the detonation wave. The extension or nozzle section is initially filled with H2 gas at the specified ambient pressure. The choice of the ambient gas has a nontrivial impact on the impulse of geometries B, C and D in single-shot simulations. Moreover, a number of options can be reasonably selected. Hydrogen is used here primarily due to its low molecular weight, which allowed a wide range of ambient conditions to be studied using the thermochemical model explained previously. The impact of using other possible choices will be addressed in a limited form in the results and discussion section.
Detonation initiation is facilitated by calculating the equilibrium combustion conditions (com- puted at constant density and internal energy) for stoichiometric H2-02 at 10 atm and 3000 K, and
then specifying these conditions in the cell adjacent to the closed end-wall. Ghost cells are utilized to specify the boundary conditions in the problem. A reflection-type
boundary condition is utilized at the closed end of the detonation tube to simulate a solid wall. The method of characteristics approach of Poinsott and Lele2' is used to calculate the exit flow bound- ary condition. For sonic (choked) or supersonic exit flow, all exit flow properties are determined by the interior flow. For subsonic exit flow, the ambient pressure is specified and the method of characteristics is used to compute the remaining flow properties. If reverse flow is detected at the exit, a subsonic inflow boundary condition is calculated using the ambient H2 gas as a constant pressure and enthalpy reservoir.
Two additional special restrictions are imposed in the simulations. In order to simulate the effect of an idealized diaphragm, only the detonation tube portion of the domain (from the closed wall to the diaphragm location) is computed initially. A reflection-type boundary condition is specified at the diaphragm location until the pressure in the adjacent cell rises 1.0% above the initial fill value. This special restriction is subsequently removed, and the entire domain is computed. Additionally, there is a check performed when the exit flow is supersonic. Since in this case the exit boundary conditions are entirely calculated from the interior flow, there is no way for the exit flow to return to a subsonic condition.8 Therefore, at each time step a check is made to determine if the pressure from a standing normal shock at the exit is less than the ambient pressure. If true, then the normal shock properties are specified in the last interior cell, and a subsonic outflow boundary condition computed at the exit.
Grid Resolution
Grid resolution is a critical issue in all finite-rate chemistry CFD models. Due to the extremely fast kinetics of the H2-02 system, numerical modeling of the reaction zone of undiluted H2-02 Chapman-Jouguet (C-J) detonations requires an exceptionally fine grid spacing. The C-J detona- tion velocity of stoichiometric H2-02 at pi = 1 atm, Ti = 300K is calculated by the NASA CEA thermochemical code22 to be 2837.1 m / s . Using the calculated frozen shock properties at this ve- locity, and the chemical lunetics mechanism described previously, the length of the steady C-J reaction zone for this mixture can be estimated as - 0.02mm. Thus, a grid spacing of roughly 1 pm would be required to resolve the reaction zone. This is not currently practical, nor is it nec- essary for the performance estimates of this study. The chief requirement here is that the grid resolution accurately calculate the C-J state and velocity.
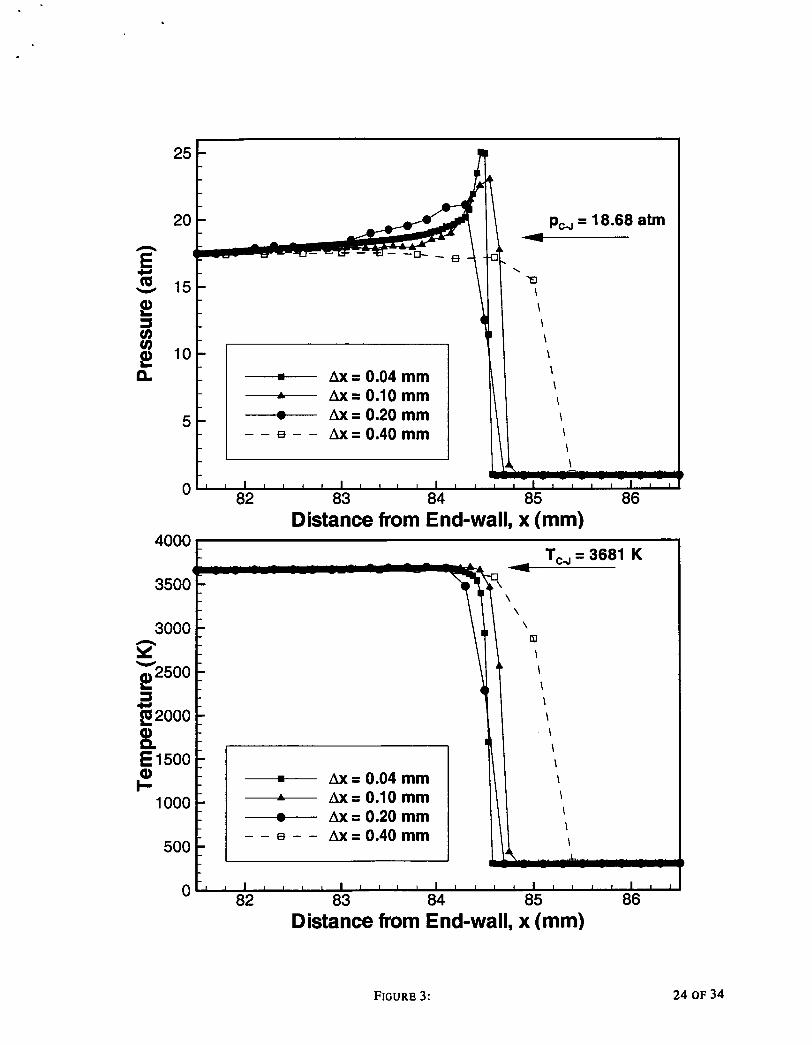
A grid resolution comparison of pressure and temperature profiles of a propagating C-J det- onation, t = 30ps after initiation, is shown in Fig. 3. The resolutions vary over one order of magnitude. As even the finest resolution here, Ax = 0.04 mm, is twice the estimated reaction zone size, none of the resolutions can accurately capture the ignition process behind the leading shock
10 OF 34
wave. Rather, in all cases, the propagating C-J detonation is smeared over several cells, resulting in the pressure spike and subsequent relaxation toward the C-J state in the finer grids. All four res- olutions capture the detonation velocity with reasonable accuracy (- 2836 m/s for Ax = 0.04 mm, - 2840 m / s for the other resolutions), though the precision of this estimate is naturally lower for the coarser grids. Note, however, that in the two finer grids the pressure relaxes to the C-J value in a significantly shorter distance than in the coarser grids. Based on these observations, a uniform grid spacing of Ax = 0.10 mm was utilized for all simulations in this study.
Thrust Calculations
The time-dependent thrust is calculated at each time step by two different methods. One mea- sure of the thrust assumes a control volume tightly bounding the solid surfaces of the PDRE, and is determined by integrating the pressure difference across all surfaces. A second measure assumes a rectangular control volume encapsulating the PDRE. This measure of thrust is determined from the sum of the time rate of change of the internal momentum integral across the domain, the mo- mentum flux from the nozzle section, and the pressure difference across the control volume. In general, there is excellent agreement between the two thrust calculations, and the time-integrated impulse calculations agree to within 0.1%. In all simulations, the calculation proceeds until the pressure at the closed end-wall decreases to the ambient value (pew = pa) . Thus, these simulations should be thought of as single-shot results.
Results and Discussion There are several critical factors which can impact the performance of a PDRE system. The
blowdown pressure ratio is one of the most important parameters governing the performance of any rocket-type system. Additionally, the length of a straight extension, or the area ratio of a C- D nozzle, can have a large effect on PDRE performance. In the following section, the essential gasdynamics of the blowdown process in the four PDRE geometries are reviewed. This is followed by a parametric study of the effect of blowdown pressure ratio, extension length, and C-D nozzle area ratio on specific impulse and blowdown time. The relative effectiveness of straight extensions and C-D nozzles in improving performance is compared. A comparison of the performance of a PDRE fitted with an optimized C-D nozzle with an equivalent steady-state rocket engine is also provided.
PDRE Blowdown Gasdynamics
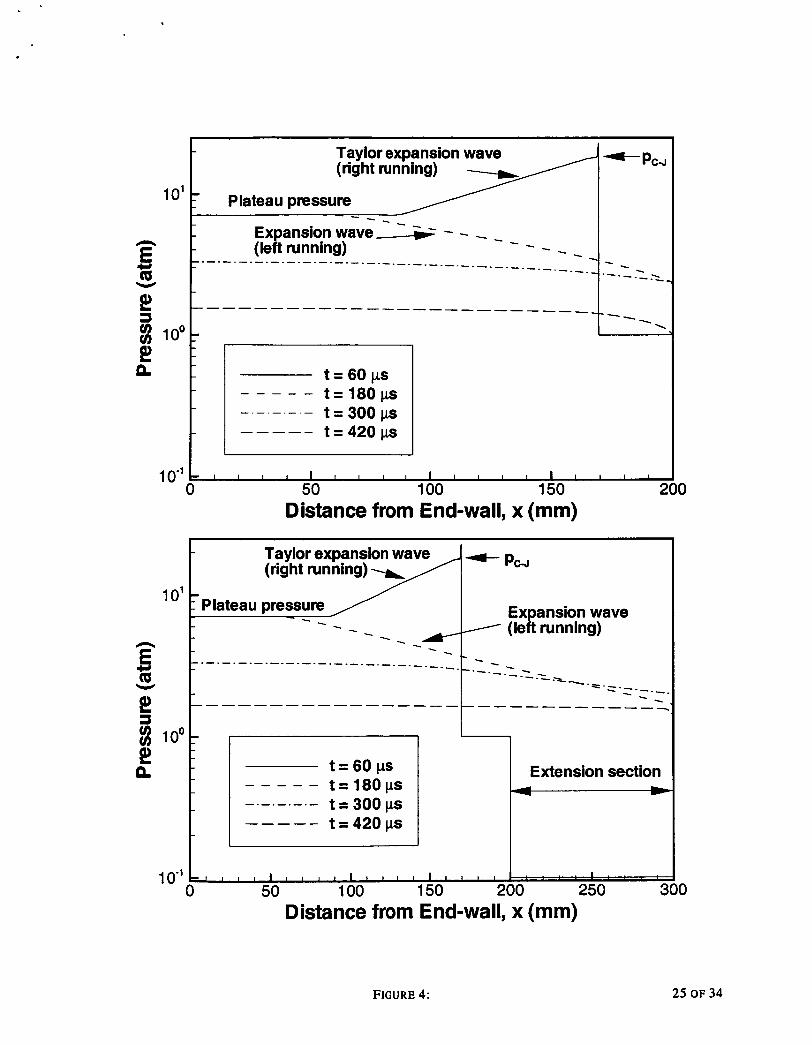
The blowdown process of a PDRE can be thought of as occurring in several different phases, typically differentiated by the location of important wave structures in the tube. Consider the simplest geometry, the baseline detonation tube (geometry A), using the standard initial conditions and pa = 0.1 atm (9 = 10). Pressure profiles, at several representative points in the blowdown
history, are shown for this case in the upper panel of Fig. 4. The detonation is initiated at the end-wall at t = 0. The subsequent propagation of the detonation wave is clearly shown in the pressure profile labeled t = 60ps. The sharp pressure rise associated with the detonation front is followed by a Taylor expansion wave which acts to slow and expand the combustion products behind the detonation front. Well behind the detonation front, the products reach a steady pressure at zero forward velocity. Once the detonation reaches the exit of the tube and breaks the idealized diaphragm, outflow begins, and an expansion wave propagates back upstream. This expansion wave expands and accelerates the combustion products toward the exit, and is visible in the t = 180 ps profile. Once this expansion reaches the end-wall, it reflects and begins propagating back downstream toward the exit again (t = 300 ps curve). Eventually, the expansion wave reaches the tube exit, and further reduces the pressure at that location (t = 420 ps). Note that the pressure at the end-wall is steady at a “plateau” value until the primary expansion wave reaches the end-wall. Similarly, the pressure at the exit plane also rapidly achieves a quasi-steady value, which holds until the primary expansion wave again reaches the exit after reflection from the end-wall.
The addition of an extension to the detonation tube (geometry B) primarily serves to increase the amount of time required for some of the waves to traverse the tube. Pressure profiles at repre- sentative times in the blowdown history of a detonation tube with a Lse = 10 cm extension section are shown in the lower panel of Fig. 4. As above, 4 = 10. As in the baseline case, a primary ex- pansion wave is initiated when the detonation reaches the end of the detonation tube. Additionally, as there is no combustible gas mixture in the extension, the detonation wave changes into a trans- mitted shock wave in the extension. When the transmitted shock reaches the exit of the extension section, it initiates a secondary expansion wave which also travels upstream toward the end-wall. This leads to pressure profiles quite similar to the baseline case. However, the overall effect of the extension is to slow the rate of pressure relaxation at the end-wall.
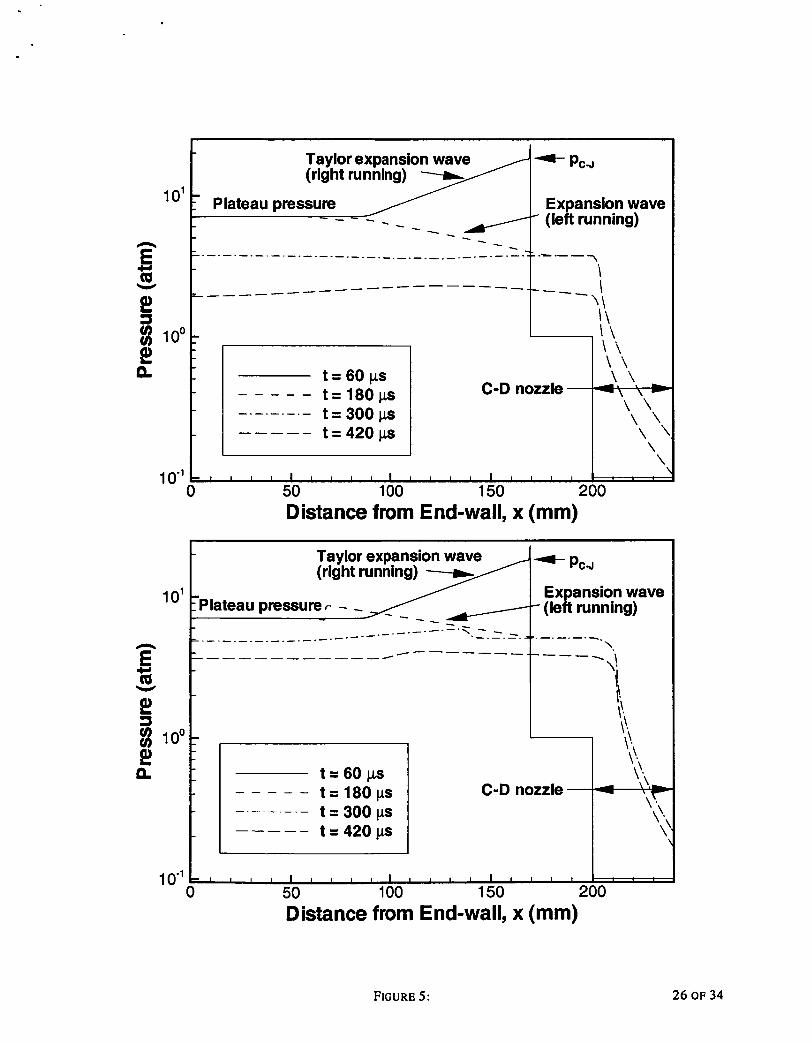
A converging-diverging nozzle has a significant effect on the pressure distribution of a PDRE. Pressure profiles are shown for two C-D nozzle example cases in the upper (geometry C with L h = 3.6 cm) and lower panels (geometry D with L h = 2.8 cm) of Fig. 5. In both cases 4 is again 10. As was the case previously, a primary expansion wave, initiated when the detonation reaches the end of the detonation tube, is a key factor in controlling the pressure relaxation at the end-wall. However, it is clear from examining the figures that the C-D nozzle acts to expand the combustion products to a much lower exit pressure than would otherwise be accomplished by the detonation tube alone. The primary difference between the two C-D nozzle cases is the significantly smaller throat in geometry D, which results in reduced mass outflow compared to geometry C. This flow restriction is significant enough that the primary expansion wave is led by a weak shock wave, clearly visible in the lower panel of the figure.
The impulse history of all four of these example cases is shown in Fig. 6. The instantaneous
thrust can be thought of as the slope of these impulse curves. As discussed previously, the primary effect of the extension in geometry B is to reduce the rate of pressure relaxation at the end-wall. This results in a modestly higher thrust in the later portions of the blowdown history, compared to the baseline geometry A. In contrast, the C-D nozzle has a more significant effect on the thrust and impulse. Geometry C has a comparatively higher thrust and resultant impulse throughout the entire outflow portion of the blowdown history. Due to the more restricted mass outflow, and internal shock wave reflections, the instantaneous thrust in geometry D is generally lower than that of the other cases. However, although the overall blowdown time is significantly longer than geometry C, the final impulse is nearly equivalent. One additional important observation which can be made from Fig. 6 is that typically the integrated impulse will achieve a value quite close to, or even slightly exceeding, the final value well before the end of the simulation. This is particularly true of the two C-D nozzle geometries, and is observed over the entire blowdown pressure range studied in this work. This point will be addressed in greater detail in the following sections.
PDRE Performance Results
The performance trends just discussed can be seen in greater detail by studying the performance of the various PDRE geometries over a wide range of blowdown pressure ratios. The specific im- pulse of the baseline detonation tube (geometry A), and the detonation tube with several extension lengths (geometry B with Lse = 4, 10, 20, and 40cm) is shown in Fig. 7. As is evident from the figure, the general performance trends of all five configurations are quite similar. There is a fairly significant improvement in performance (30-38%) over Cp = 1-10, while decidedly less so (4-8%) over 4 = 10-100. There is very little improvement in performance (- 1%) over Cp = 100-1OOO. In general, there is a definite performance improvement provided by the extension section, and this benefit increases with extension length. The one exception to this trend occurs at Cp = 2. In this particular case, there is no additional performance benefit for Lse > 10cm. This is due to the fact that the primary expansion wave, generated at the interface between the detonation tube and the extension section, is alone sufficient to reduce the pressure at the end-wall to the ambient value. In this particular case, this event occurs before the secondary expansion wave (generated when the transmitted shock reaches the exit of the extension) can reach the end-wall. Thus, there is no effect from the longer extensions at this pressure ratio. At higher blowdown pressure ratios (Cp = 5-1000) this phenomena does not occur; the pressure decay (to ambient) provided by the primary expansion at the end-wall is long enough that the secondary expansion wave can reach the end-wall in time to affect the pressure relaxation rate.
Both the blowdown pressure ratio, and the nozzle area expansion ratio, E , play critical roles in the performance of the C-D nozzle PDRE geometries. Performance results as a function of C- D nozzle area expansion ratio for geometries C and D (upper and lower panels, respectively) are
shown in Fig. 8. In each case, E , was adjusted by varying the length of the diverging section of the nozzle (Lds). Results for 4 = 1-1000 are plotted. As is the case for conventional rocket-type systems, for a given pressure ratio, the performance gain provided by a C-D nozzle will generally increase with E up to a certain optimum point. After this point performance will decrease with increasing E . The dashed curve in each graph shows the fixed E which yields optimum specific impulse for each 4. It is important to recognize that this optimum point is specific to the C-D nozzle geometry and blowdown time assumption used.
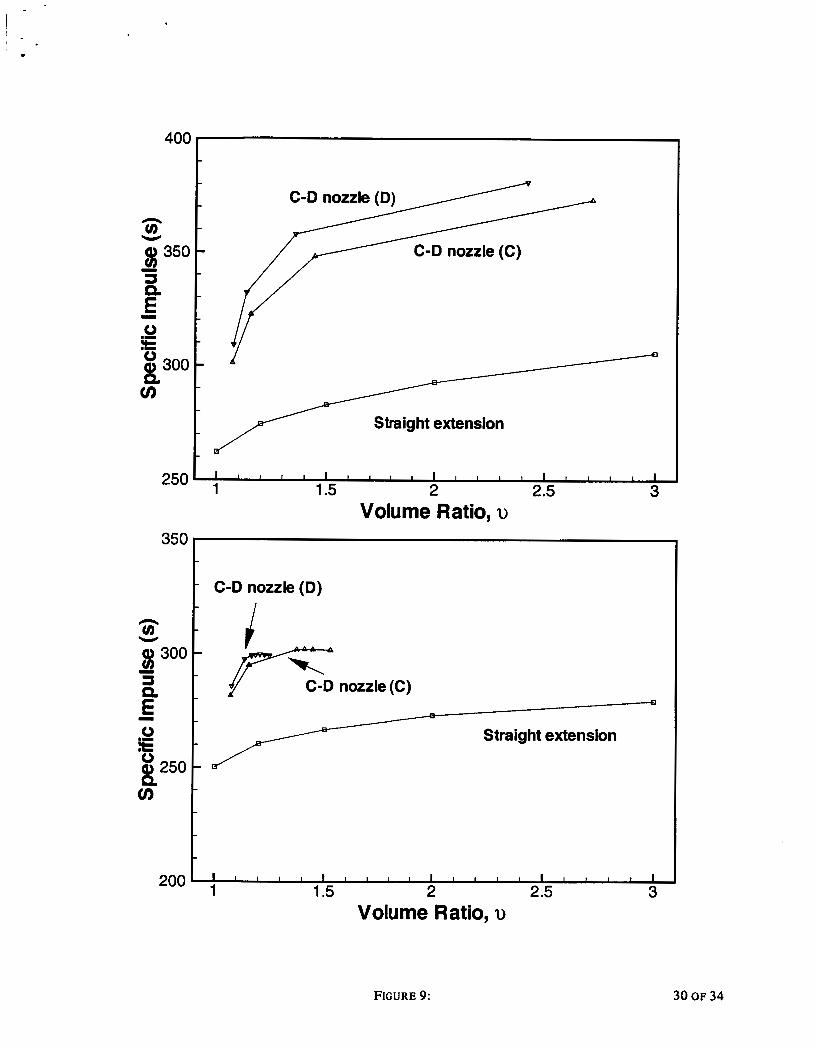
In general, there is little performance difference between the two C-D nozzle geometries. The performance of geometry D, for a fixed 4 and E , tends to be slightly lower than geometry C, primarily due to losses induced by the reflected shock waves present in the blowdown history of D. Note that a C-D nozzle is generally more effective at improving performance at higher pressure ratios than the extensions in geometry B. The specific impulse using an optimized C-D nozzle improves by 5347% over 4 = 1-10, and 20-21% over 4 = 10-100. Even over 4 = 1WlO00, the performance increases 10%. This is largely due to the ability of a C-D nozzle to convert the thermal energy of the combustion products into directed kinetic energy. This effect can also be seen by plotting specific impulse for all four geometries as a function of volume ratio, u (Fig. 9). 4 is 1000 in the upper panel of the figure, and 10 in the lower panel. It is evident from the figure that a C-D nozzle is generally a more effective use of volume than a straight extension, particularly at relatively high 4. It should be noted, however, that this observation is based on the assumption that the volume ratio range under consideration is within the range where increased nozzle expansion provides improved performance.
PDRE Blowdown Time Results
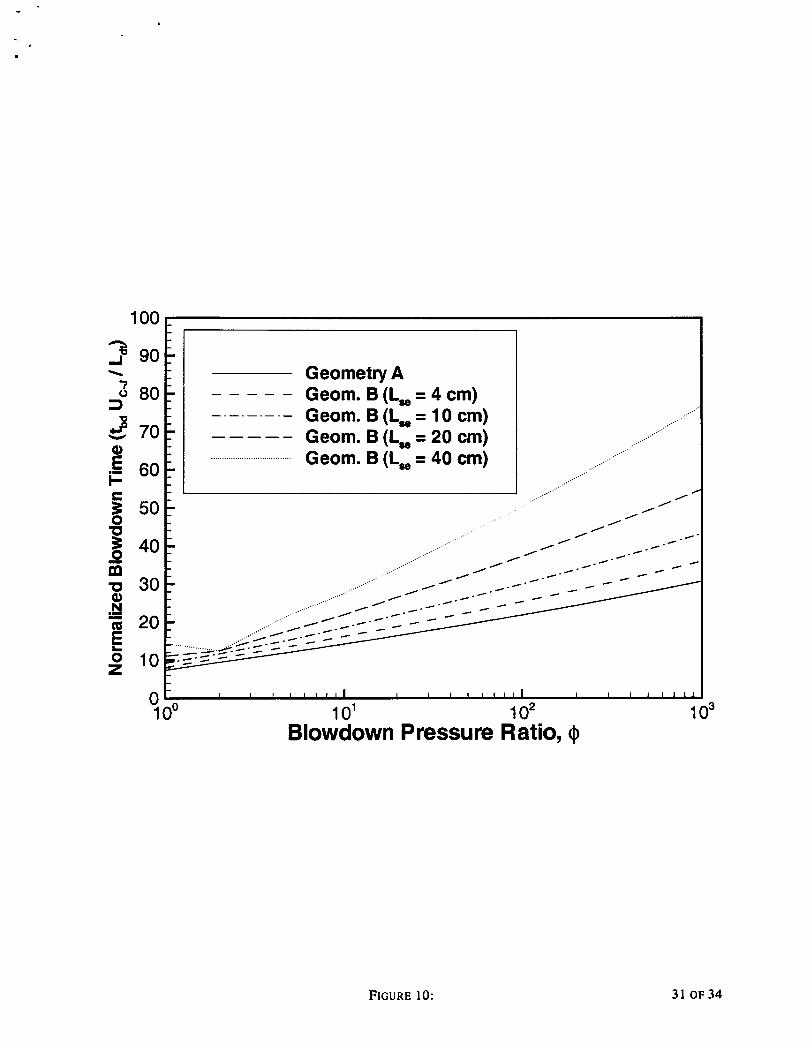
As the cycle time of an operational PDRE system is of great practical interest, it is useful to examine the effect of the blowdown pressure ratio, straight extension length, and C-D nozzle area expansion ratio on the blowdown time of the PDRE geometries considered here. The blowdown time, t M , in this work is defined as the time at which the pressure at the end-wall decays to the ambient value (Pew = pa) . The strong dependence of tu on 4 and extension length can be seen in Fig. 10. The time in that figure has been normalized by L ~ / U C - J = 70.495ps, which is the characteristic time for a C-J detonation to traverse the detonation tube. Note that at the highest blowdown pressure ratios, there is an almost directly proportional dependence of blowdown time to extension length. The obvious kink in the Lse = 20cm and Lse = 40cm curves at 4 = 2 was explained in the previous section.
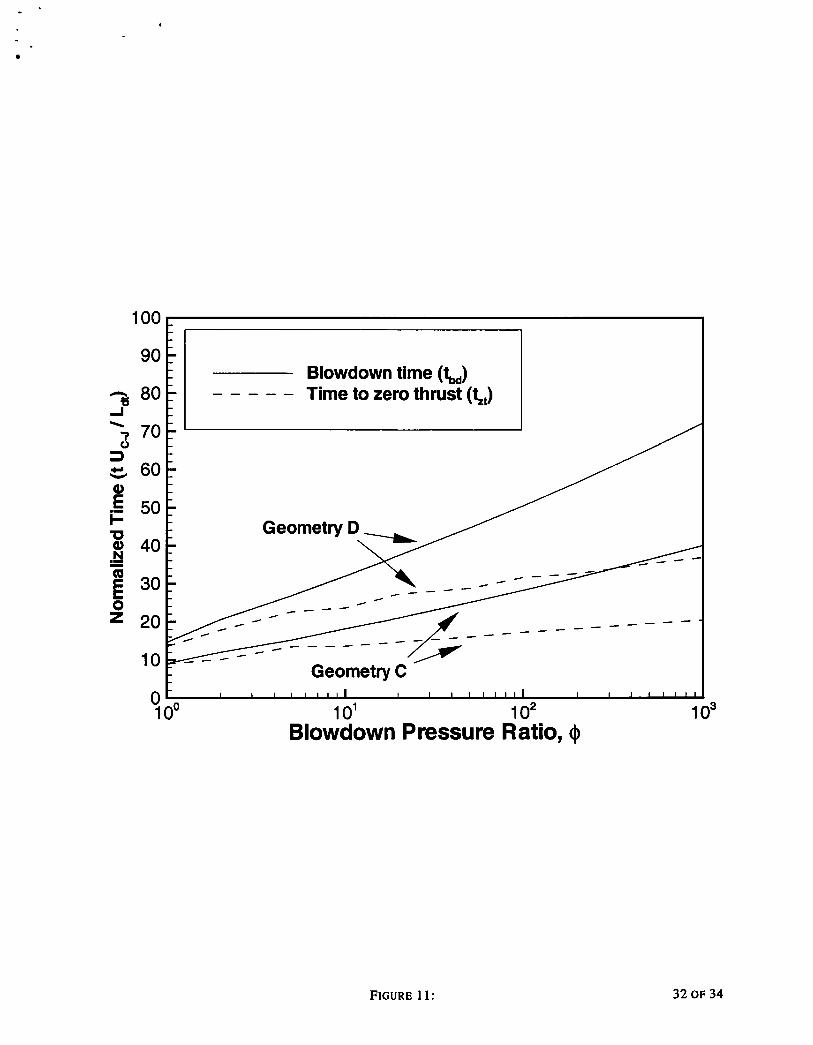
The blowdown time for the two converging-diverging nozzle PDRE geometries is shown in Fig. 11. The values have again been normalized by &/UC-J. As would be expected, tM is con- sistently longer for geometry D than C, over the entire range of blowdown pressure ratios. Note
14 OF 34
that these results assume the use of the optimum fixed C-D nozzle for each pressure ratio, though since the nozzle throat outflow is nearly always choked, ?bd is nearly independent of E at a given 9. One of the notable results of these simulations is that the instantaneous thrust of even an optimum fixed C-D nozzle is slightly negative for much of the latter portions of the blowdown time. This result is due to the fact that the C-D nozzle overexpands the residual combustion products when the pressure in the detonation tube has decayed sufficiently. Thus, it is useful to also plot the time at which the thrust first drops to zero in the blowdown history (tzl). It is evident from the figure that this point occurs considerably earlier than t ~ , particularly at the highest 4. As the instantaneous thrust, even while negative, is so small at this point, there is little difference in integrated impulse between these two time points (typically at most a loss of - 1 s of specific impulse over the in- terval). However, this observation suggests that a considerable savings in overall cycle time could be realized with an actual slight gain in performance. Note that as the end-wall is the only thrust surface for geometries A and B, tu = t~ for those cases.
Effect of Ambient Gas on Results
As these are single-shot simulations, it is logical to expect that the choice of the ambient gas in the extension and nozzle sections may influence the performance and blowdown time results. In an operational multi-cycle PDRE, the gas in these sections would likely be a mixture of the ambient atmosphere, the combustion products from the previous cycle, and any purge gases used in the cycle. Hydrogen is used as the ambient gas in all simulations in this work. However, in order to form a limited appreciation for the impact of this choice on the results, simulations using helium (He) and N2 as the ambient gas are also conducted at the pa = 0.1 atm (4 = 10) condition. In effect, due to their higher density, He, and particularly N2, provide a larger tamping mass for a given extension or nozzle volume than H2 does (see Ref. 5 for a discussion of this point). In general, the Performance results using He are only slightly higher (0-1 s of specific impulse) than those using H2. However, the use of N2 as the ambient gas yields more significant deviations from the H2 reference calculations. The greatly reduced sound speed of N2 compared to H2 results in a much stronger transmitted shock in the extension or C-D nozzle sections. In the case of a C-D nozzle, the resultant high pressure behind this shock causes additional impulse to be transmitted to the diverging section of a C-D nozzle (typically 3-4s of additional specific impulse for this condition). Blowdown time was not affected. In the case of a straight extension, the stronger transmitted shock significantly reduces the pressure variation across the primary expansion wave. This causes a comparatively higher pressure at the end-wall before the arrival of the secondary expansion wave (from the exit). Thus, both impulse and blowdown time are increased (from - 0.3% additional impulse and blowdown time at Lse = 4cm, to 12% additional impulse and 18% additional blowdown time at Lse = 40 cm).
Equivalent SSRE Model and Performance Comparison
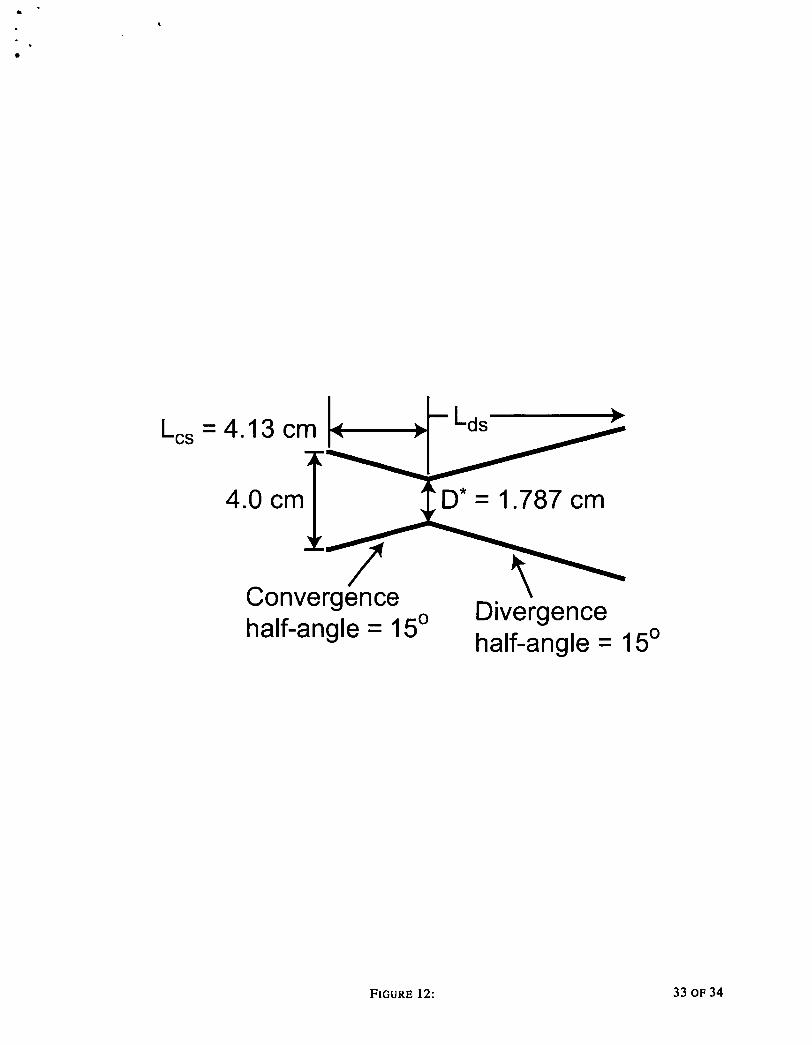
It is instructive to compare the specific impulse of a PDRE fitted with a C-D nozzle with a SSRE under equivalent modeling assumptions. While frozen and equilibrium rocket performance calculations can be readily obtained from the CEA code, these results are not directly comparable to the finite-rate chemistry model used in the current PDRE code. The primary concern is the tendency for chemistry to slow down in real nozzle systems as the temperature and pressure are reduced in the expansion process. Thus, it is best to compare the finite-rate PDRE systems with a finite-rate SSRE model. This SSRE CFD model is heavily derived from the PDRE code. The Ldt = 20cm detonation tube is replaced with a thrust chamber 0.1 cm in length, and 4.0cm in diameter (Fig. 12). This thrust chamber then converges at a constant 15' angle, over a length of 4.13 cm, to a throat D* = 1.787 cm in diameter. After the throat, the nozzle diverges at 15' to a length specified by the user. Thus, the throat diameter and nozzle expansion rate of the SSRE model closely matches that of PDRE geometry C. The equilibrium temperature, pressure and composition of stoichiometric H2-02, burned at constant pressure and enthalpy from pi = 1 atm and Ti = 300 K, form a reservoir for a subsonic inflow boundary condition into the domain. Thus, this analysis assumes that the propellant feed system of the SSRE model is the same as the PDRE.
Similar to the PDRE nozzle optimization study, the finite-rate SSRE Cm> model is run at various E until the optimum specific impulse is obtained for a given 4. However, as the solution converges to steady-state in this model, flowfield information from the highest pressure ratio case can be used to guide area selection at the lower pressure ratios. In each case, the SSRE model is run until the solution converges. In general, the specific impulse and optimum expansion ratio using finite-rate chemistry are slightly larger than that for frozen chemistry. Additionally, if the chemistry is frozen in the SSRE CFD model, there is excellent agreement (to within 0.3% in specific impulse) with the frozen-chemistry predictions of CEA.
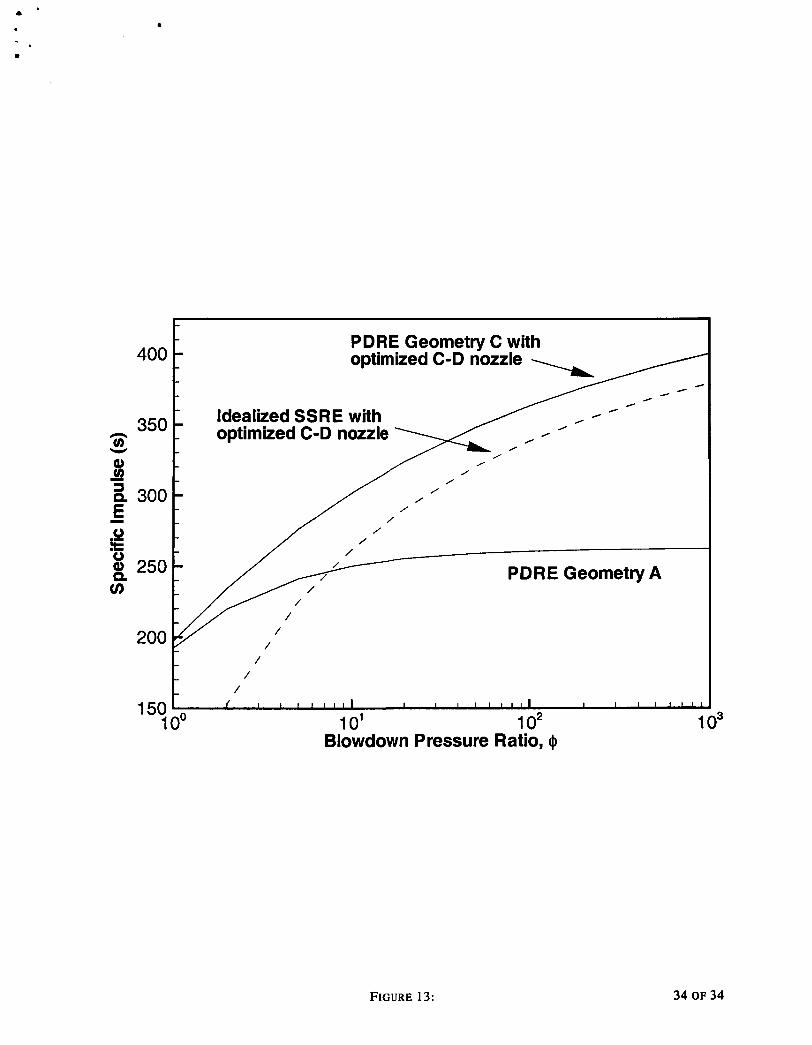
The mixture-based specific impulse for the baseline detonation tube (PDRE geometry A), PDRE geometry C fitted with an optimized fixed C-D nozzle (at each blowdown pressure ra- tio), and the equivalent optimized SSRE system is plotted for 4 =1-1000 in Fig. 13. As would be expected from the results discussed previously, the relative gain from the C-D nozzle systems becomes more pronounced at higher pressure ratios. It is interesting to note that that both the baseline and C-D nozzle PDRE systems outperform a SSRE at 4 < 7. This is due to the fact that the relative gain from the extra pressurization provided by the detonation process is greatest in this regime. Thus, the PDRE may have considerable theoretical potential for rocket-type applications when the pressure of the ambient environment is high. Additionally, at higher 4, a PDRE with an optimized fixed C-D nozzle still has a greater specific impulse than an equivalent SSRE. These results indicate that a PDRE equipped with a fixed C-D nozzle, though obviously not as efficient at generating thrust as a (theoretical) dynamically adaptive nozzle, can still yield single-shot per-
formance superior to an equivalent SSRE over a wide range of pressure ratios. Note, however, that this performance gain becomes relatively smaller at higher pressure ratios.
Conclusions A quasi-1-D, finite-rate chemistry CFD model for studying PDRE gasdynamics and perfor-
mance is described and implemented. The single-shot performance and blowdown time character- istics of four different PDRE geometries are studied, over a range of blowdown pressure ratios from 1-1000. The pressure at the end-wall is allowed to decay to the ambient value for all simulations in this work. The results show that both straight extensions and converging-diverging nozzles can provide valuable improvements to the performance of a baseline detonation tube. However, opti- mized C-D nozzles are generally more effective in increasing performance than straight extensions, particularly at higher pressure ratios. Studies of the blowdown time of the PDRE systems show a strong dependence on pressure ratio for all geometries. Straight extension length will also gener- ally increase blowdown time. Examination of the blowdown history of the optimized C-D nozzle geometries shows that the blowdown of these systems could be cut off well before the end-wall pressure reaches the ambient value, with an actual slight gain in performance. The performance of a PDRE fitted with an optimized fixed C-D nozzle is also compared with a SSRE using similar modeling assumptions. The results show that while a PDRE enjoys the largest relative performance gain over a SSRE at low pressure ratios, there is still a noticeable relative advantage for the PDRE at blowdown pressure ratios as high as 1000.
References ‘Kailasanath, K., “Recent Developments in the Research on Pulse Detonation Engines,” AZAA
*Bratkovich, T. E., Aamio, M. J., Williams, J. T., and Bussing, T. R. A., “An Introduction to
3Sutton, G. P. and Biblarz, O., Rocket Propulsion Elements, John Wiley & Sons, seventh ed.,
4Kailasanath, K., “A Review of Research on Pulse Detonation Engine Nozzles,” AIAA Paper
’Cooper, M. and Shepherd, J. E., ‘The Effect of Nozzles and Extensions on Detonation Tube
6Li, C. and Kailasanath, K., “Partial Fuel Filling in Pulse Detonation Engines,” Journal of
7Cambier, J.-L., “Preliminary Modeling of Pulse Detonation Rocket Engines,” AIAA Paper
Journal, Vol. 41, No. 2,2003, pp. 145-159.
Pulse Detonation Rocket Engines,” AIAA Paper 97-2742, July 1997.
2001, pp. 27-101.
2001-3932, July 2001.
Performance,” AIAA Paper 2002-3628, July 2002.
Propulsion and Power, Vol. 19, No. 5,2003, pp. 908-916.
99-2659, June 1999.
17 OF 34

8Mohanraj, R. and Merkle, C. L., “A Numerical Study of Pulse Detonation Engine Perfor-
9Mohanraj, R., Merkle, C. L., and Ebrahimi, H. B., “Modeling of Pulse Detonation Engine
‘OTalley, D. G. and Coy, E. B., “Constant Volume Limit of Pulsed Propulsion for a Constant y
“Morris, C. I., “Simplified Analysis of Pulse Detonation Rocket Engine Blowdown Gasdy-
12McBride, B. J., Gordon, S., and Reno, M. A., “Coefficients for Calculating Thermodynamic
13Petersen, E. L. and Hanson, R. K., “Reduced Kinetic Mechanisms for Ram Accelerator Com- bustion,” Journal of Propulsion and Power, Vol. 15, No. 4, 1999, pp. 591-4500.
14Kee, R. J., Rupley, E M., and Miller, J. A., “Chemkin-11: A FORTRAN Chemical Kinetics Package for the Analysis of Gas-Phase Chemical Kinetics,” Tech. Rep. SAND89-8009, Sandia National Laboratories, 1989.
15Troe, J., “Predictive Possibilites of Unimolecular Rate Theory,” Journal of Physical Chem-
“hang, G., “On the Construction and Comparison of Difference Schemes,” SIAM Journal of Numerical Analysis, Vol. 5 , 1968, pp. 506-517.
170ran, E. S. and Boris, J. P., Numerical Simulation of Reactive Flow, Cambridge University Press, 2nd ed., 2001, pp. 40841 1.
“Yee, H. C., “A Class of High-Resolution Explicit and Implicit Shock-Capturing Methods,” Tech. Rep. TM 101088, NASA, 1989.
19Grossman, B. and Cinnella, P., “Flux-Split Algorithms for Flows with Non-equilibrium Chemistry and Vibrational Relaxation,” Journal of Computational Physics, Vol. 88, 1990, pp. 13 1- 168.
20Larrouturou, B., “How to Preserve the Mass Fractions Positivity when Computing Compress-
21Poinsot, T. J. and Lele, S. K., “Boundary Conditions for Direct Simulations of Compressible
22Gordon, S. and McBride, B. J., “Computer Program for Calculation of Complex Chemical
mance,” AIAA Paper 2000-0315, Jan. 2000.
Operation,” AIAA Paper 2001-0475, Jan. 2001.
Ideal Gas,” Journal of Propulsion and Power, Vol. 18, No. 2,2002, pp. 400-406.
namics and Performance,” AIAA Paper 2002-3715, July 2002.
and Transport properties of Individual Species,” Tech. Rep. TM 4513, NASA, 1993.
istry, Vol. 83, No. 1, 1979, pp. 114-126.
ible Multi-component Flows,” Journal of Computational Physics, Vol. 95, 1991, pp. 59-84.
Viscous Flows,” Journal of Computational Physics, Vol. 101, 1992, pp. 104-129.
Equilibrium Compositions and Applications,” NASA Reference Publication 13 11, 1994.

List of Table Captions Table 1: Chemical kinetics mechanism for H2-02 combustion, from Petersen and Hanson.13
19 OF 34
Number Reaction' Ab fib Eacrb
1 2c 3 4 5 6 7 8 9 10 11dse
12 13f
1 4g
15h 1 6d 17' 18'
0 + H2 =+ H + OH 5.00 x lo4 2.70 H + 0 2 + M f HO2 + M 2.80 x 10l8 -0.90 H + 0 2 + 0 2 + H O 2 + 0 2 3.00 x 10²⁰ -1.70 H + 0 2 + H20 =+ HO2 +H2O 9.38 x 10l8 -0.80 H + 0 2 + N 2 +HO2+N2 2.60 1019 -1.20 H + 0 2 =+ 0 +OH 8.30 x 10¹³ 0.00
H + H02 + 0 2 + H2 2.80 1013 0.00 H + H O z + O H + O H 1.34 x 10¹⁴ 0.00
H + H202 =+ HO2 + H2 1.21 io7 2.00 OH + H2 + H20 + H 2.16 x lo8 1.50 OH + OH + M + H202 + M k, 7.40 x 10¹³ -0.40
ko 2.30 x 10l8 -0.90 OH + H02 =+ 0 2 + H2O 2.90 1013 0.00 OH + H202 'T HO2 + H20 ka 1.75 x 10l2 0.00
kb 5.80 X 0.00 H02 + H02 =+ 0 2 + H202 kc 1.30 x 10" 0.00
kd 4.20 X 0.00 O + O + M =+ 0 2 + M 1.20 1017 -1.00 O + H + M + O H + M 5.00 1017 -1.00 H + OH + M + H20 + M 2.20 x 10²² -2.00 H + H + M = + H ? + M 1.00 x 10'8 -1.00
6290 0 0 0 0
14413 1068 635
5200 5200
0 - 1700 -500
320 9560
- 1630 12000
0 0 0 0
~~ ~~ ~
Note: species are N2,02, H2, H20, OH, H, 0, HO2, H202. 'All reactions are reversible. bkfr = ATP exp(-Ea,t/RT); units are in cal, mol, cm3, and s. ,M does not include 02, H20, or N2; all collision efficiencies = 1.0. dCollision efficiencies for M; H2 = 2.0, H20 = 6.0, all others = 1.0. eTroe parameters: a = 0.7346, T*** = 94, T* = 1756, T** = 5182. f Rate coefficient is non-Arrhenius: k13 = ka + kb
gRate coefficient is non-Arrhenius: k14 = k, + kd hCollision efficiencies for M; H2 = 2.4, H20 = 15.4, all others = 1.0. 'Collision efficiencies for M; H2 = 0.73, H20 = 3.65, all others = 1.0. jCollision efficiencies for M; H2 = 1.7, H20 = 7.0, all others = 1.0.
TABLE 1:
List of Figure Captions
Figure 1: Constant-y performance comparison of a single-shot PDRE with a conventional SSRE equipped with both sonic and optimized converging-diverging nozzles. Propellant mix- ture: stoichiometric H2-02 at pi = 1 atm, Ti = 300 K.
Figure 2: Schematic of PDRE geometries studied.
Figure 3: (lower panel) profiles of a propagating C-J detonation wave at t = 30 ps after initiation.
Grid resolution comparison showing pressure (upper panel) and temperature
Figure 4: Pressure profiles for PDRE geometry A (upper panel) and B with L,, = 10cm extension (lower panel) at representative points in the blowdown history. Propellant mixture: stoichiometric H2-02 at pi = 1 atm, Ti = 300 K.p, = 0.1 atm (4 = 10).
Figure 5: Pressure profiles for PDRE geometry C with Lk = 3.6cm (upper panel), and D with Lh = 2.8 cm (lower panel), at representative points in the blowdown history. Propellant mixture: stoichiometric H2-02 atpi = 1 a h , Ti = 300 K.p, = 0.1 atm (@ = 10).
Figure 6: ric H2-02 atpi = 1 atm, Ti = 300 K.p, = 0.1 atm (@ = 10).
Impulse history for example PDRE geometries. Propellant mixture: stoichiomet-
Figure 7: and B. Propellant mixture: stoichiometric H2-02 at pi = 1 atm, Ti = 300 K.
Effect of blowdown pressure ratio on specific impulse for PDRE geometries A
Figure 8: Effect of C-D nozzle area expansion ratio on specific impulse for PDRE geometry C (upper panel) and D (lower panel). The dashed line in each graph represents the fixed e giving optimum performance at each 9. Propellant mixture: stoichiometric H2-02 at pi = 1 atm, Ti = 300 K.
Figure 9: Lower panel: 4 = 10. Propellant mixture: stoichiometric H2-02 at pi = 1 atm, Ti = 300 K.
Specific impulse plotted as a function of volume ratio. Upper panel: 4 = 1000.
Figure 10: Normalized blowdown time ( t ~ u c - ~ / L & ) plotted as a function of blowdown pres- sure ratio for PDRE geometries A and B. Propellant mixture: stoichiometric H2-02 at pi = 1 atm, Ti = 300 K.
Figure 11: Normalized time ( tUc-~/Ld) plotted as a function of blowdown pressure ratio for PDRE geometries C and D. Propellant mixture: stoichiometric H2-02 at pi = 1 atm, Ti = 300 K.
Figure 12: Schematic of SSRE geometry studied.
Figure 13: Performance comparison of various pulse detonation and steady-state rocket devices, using finite-rate quasi-1-D CFD calculations. PDRE performance is based on a single blowdown shot. Propellant mixture: stoichiometric H2-02 at pi = 1 atm, Ti = 300 K.
21 OF 34

450 - - Idealized PDRE with dynamically - - -
optimized C-D nozzle
- 400 - - Idealized SSRE with - optimized C-D nozzle n
v) v
- 4 350 3 -
I E -
Idealized detonation tube DRE without a nozzle)
Idealized SSRE with sonic nozzle
I I I I I I I L
1 oo 10' 1 o2 1 o3 Blowdown Pressure Ratio, 4
FIGURE 1: 22 OF 34

End-wall
8 Idealized :+
I I I
C)
half-angle = 15'
half-angle = 15' Divergence half-angle = 15'
FIGURE 2: 23 OF 34
25 c R
20
15 F
- Ax= 0.04 mm - Ax=O.lOmm __c__ Ax=0.20mm - - e - - Ax= 0.40 mm
pc4 = 18.68 atm - \
U \ \ \ \
\ \ \ \ \
Distance from End-wall, x (mm) 4000
a m n L Tc4=3681 K
3000 wwww 1 2 5 0 0 3 +I, "t g 2000
'"ooF I - Ax= 0.04 mm - Ax=O.lOmm ---e--- Ax=0.20mm
b = 0.40 mm
\ \
Q \ \ \ \ \ \ \ \ \ \ \ \ I
82 83 84 85 86 o b 1 I I I I I ' I I I I I I I I I ' I I I I I I
Distance from End-wall, x (mm)
FIGURE 3: 24 OF 34
10'
n
m E CI
v
E
E e 8 loo
t = 6 0 p ~ t = 180 ps
- -.- t = 300 ps t = 420 ps
- - - - - I - -----
I I I
Extension section
----
Distance from End-wall, x (mm)
FIGURE 4:
t = 6 0 p ~ t = 1 8 0 p s t = 300 ps t = 420 ps
- - - - -
----- I .'\'\
I \ \
0 50 100 150 200 Distance from End-wall, x (mm)
10'
n
Q E
E
E e
ICI
v
1 loo
200 lo-lc' I I I ' 3 1 I ' I I a I I I I 1 : z
0 50 100 150 Distance from End-wall, x (mm)
FIGURE 5 : 26 OF 34

0.1
0.09
0.08
0.07 r v)
2 0.06
8 0.05 =I
w
- - E 0.04
0.03
0.02
0.01
Geometry A - - - - - Geom. B (L- = 10 cm) -.-_---.- Geom. C (Ldr = 3.6 cm)
Geom. D (Lds = 2.8 cm)
o~'""'''""'"'' 500 1000 1500 2000 Time from Detonation Initiation (ps)
FIGURE 6: 27 OF 34

Geometry A - - - - - Geom. B (L, = 4 cm) -.-.-_-.- Geom. B (L, = 10 cm)
Geom. B (L, = 20 cm) Geom. B (L, = 40 cm)
- - _ _ _
I I I I 1 1 1 1 1 I I I I I 1 1 1 1 I I 1 1 1 1 1 1
1 oo 10' 1 o2 1 o3 Blowdown Pressure Ratio, @
150'
FIGURE 7: 28 OF 34

400
n v a 350
S I 8 I E300 0 E v) ki250
200
150 1 oo 10' 1 o2
C-D Nozzle Area Expansion Ratio, E
200
400
/ - , - - 9 4 - - -
I I I I I I I I I I I I I I I I I I
n v a 350
0 E
v)
FIGURE 8: 29 OF 34
.
400
0 E
v)
300
250
350
200
l l l l I 1 1 1 1 1 1 1 1 1 1 1 1 1 1 1 1
1 1.5 2 2.5 3 Volume Ratio, 2)
C-D nozzle (D)
0
Straight extension
l l l l I 1 1 1 1 1 1 1 1 1 1 l 1 1 1 1 1
1 1.5 2 2.5 3 Volume Ratio, 2)
FIGURE 9: 30 OF 34
1OOL
Geometry A Geom. B (L, = 4 cm) Geom. B (L, = 10 cm) Geom. B (L, = 20 cm) 70 -----
Geom. B (L, = 40 cm) 60
- - - - -
50
40
30
20
10
I I I l l 1 1 1 1 I I I I I 1 1 1 1 I I I l l l l i
1 oo 10' 1 o2 1 o3 0 1 -
Blowdown Pressure Ratio, Q
FIGURE 10: 31 OF 34
100
90 - 80 % 4 ‘7 70 3 W - 60 Q)
-E 50 + = Q) 40 .Y
30
20
10
0
I
n t I 1 I l l 1 1 1 1 I I I I I I I l l I I I I I I I I
7 O0 10’ 1 o2 1 o3 Blowdown Pressure Ratio, +
FIGURE 11: 32 OF 34
- L,, = 4.1 3 cm
D* = 1.787 cm
Divergence half-angle = 15'
4.0 cm
Convergence half-angle = 15'
FIGURE 12: 33 OF 34
400
350 n UJ W
I 8 300
I
0 E 0
v)
250
200
- - - PDRE Geometry C with - -
optimized C-D nozzle
- - - Idealized SSRE with - optimized C-D nozzle - - - - - - -
PDRE Geometry A
- / - / - /
f I 1 1 1 1 1 1 1 I I I I I l l l l I I I I l l l j
1 oo IO' 1 o2 1 o3 150'
Blowdown Pressure Ratio, (I
FIGURE 13: 34 OF 34