Embed Size (px)
Citation preview
Seediscussions,stats,andauthorprofilesforthispublicationat:http://www.researchgate.net/publication/261179216
NumericalModelingtoReduceBaghdadSoilSubsidenceandSettlementonlocationsofSewagesystems.AustralianJournalofCivilEngineering,Vol.6,No.1,2010.
ARTICLE·JUNE2010
DOWNLOADS
17
VIEWS
35
1AUTHOR:
AqeelAL-Adili
UniversityofTechnology,Iraq
33PUBLICATIONS9CITATIONS
SEEPROFILE
Availablefrom:AqeelAL-Adili
Retrievedon:14September2015
Numerical Modeling to Reduce Baghdad Soil
Subsidence and Settlement on locations of Sewage
systems
Al-ADILI, AQEEL1, N. SIVAKUGAN
2 , and GANG REN
3
1 Asst.prof, Department of Building and Construction Engineering, Uni. of Technology,
Baghdad, IRAQ. E-mail; [email protected]
2 Head, Civil & Environmental Engineering Department, James Cook University,
Townsville, Qld 4811, Australia, Telephone: +61 7 47814431, Telefax: +61 7 47816788,
Email: [email protected]
3 Lecturer, School of Civil, Environmental, and Chemical Engineering, RMIT University,
Melbourne, Vic.3001, Australia, Tel. +61 3 99252409, E-mail; gang.ren@rmit,edu.au
ABSTRACT
Sewage related subsidence is a serious problem in Baghdad, and it represents severe
damages and disturbances to services. The soils of Baghdad show a wide range of
variation in grain size distribution. The aim of this paper is to study strategies to prevent
and/or minimize soil subsidence phenomena affecting the sewerage and road systems in
Baghdad city. This was achieved through simulation of soil profiles with appropriate
properties to a depth up to 12 m at nine different locations by using PLAXIS, a finite
element 2-D modeling software. The subsidence and resulting settlements were reduced
by providing a geosynthetic-reinforced granular fill placed over a soft soil deposit, as
well as through grouting techniques. A simulation of these two types of ground
treatments suggests that the gorund improvement techniques have been quite effective in
reducing the settlement.
By using 1-layer of geotextile reinforcement with stiffness of 5 kN/m acceptable
and noticeable subsidence and settlement reduction of 12-80% were achieved for most of
the studied locations. Grouting was modeled as volume change in soft soils and weakness
cluster, and it showed reasonable results with settlement reduction from 0.5 mm to 0.1
mm at the 9 different locations.
2
It would appear that the particular simulation chosen for the calculation of this
problem model fulfils the two important treatment methods which are common with the
FE simulations.
Key words;
Soil subsidence, Grouting, PLAXIS modelling, Soil Reinforcement, Geotextile, finite
element, Interface, Slippage.
1. INTRODUCTION:
Baghdad city is located in the Mesopotamian alluvial plain. The general altitude ranges
between 30.5 and 34.85 m.a.s.l. The Tigris River divides the city into a right (Karkh)
and left (Risafa) sections. The area is characterized by arid to semi arid climate with dry
hot summers and cold winters; the mean annual rainfall is about 150 mm. The area is
underlain by quaternary alluvial deposits. The soil is relatively saline as a result of high
gypsum and salt contents of the parent formations from which the sediments were
derived and the dry climate and long periods of cultivation. Chlorides and sulfates are
the predominant types of salts.
The aim of the present work is to study the prevention and reduction of soil
subsidence phenomena affecting the sewerage and road systems in Baghdad city. This
was achieved through the study of soil sections and properties up to a depth up to 12 m at
nine different locations. It should be noted here that the city of Baghdad may be regarded
as an example of a modern city built on alluvial plain deposits and its subsidence
problems may be encountered in other cities with similar conditions.
2. SOIL PROPERTIES OF STUDY AREA
The soil of Baghdad showed a wide range of variation in grain size distribution. The top
soil generally consists of fill material with variable thickness ranging from 0.5 m to 4 m.
This is generally underlain by clay, silty clay or clayey silt, with sand lenses in places.
At depths of more than 7-8 m, the sediments are generally sandy (Al-Adili, 1998). This
study has shown that at 23 of the 33 locations studied (representing 70% of the cases),
subsidence took place within the silty clay and clayey silt layers; at 4 of the locations
(12.5%) subsidence took place within the silty sand layers. On the other hand, the
3
sewerage pipes of 69% of the areas which show no subsidence are laid within clayey
silty sand.
However, some of geotechnical properties of lean soils lead to subsidence due to low
cohesions and internal friction with high voids or pores, as well as low compressive
strength for carrying the loads coming from the sewage pipes and the self weight of the
soil.
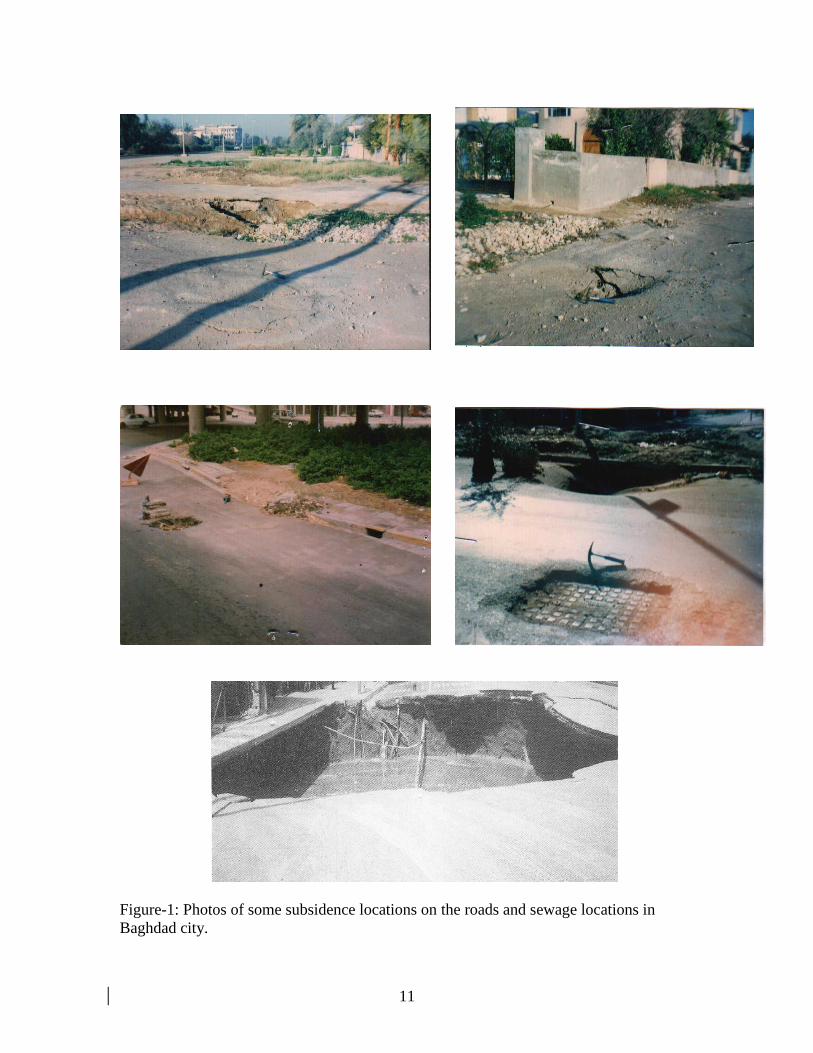
3. SOIL SUBSIDENCE PHENOMENA IN BAGHDAD SOILS
Subsidence is a serious problem in Baghdad soils at various locations of sewage systems
and it has caused a wide range of damages and disturbance to services (Figure-1). Al-
Adili (1998) concluded in his research that the main reasons for subsidence in Baghdad
soil are one or more of the following: soil liquefaction, concrete pipes corrosion,
dissolution of gypseous soil, swelling of clay, presence of loose soil, and the break down
of joints of pipes within soft soil singularity or in combination. The soft soil within the
pipes depth (or beneath pipes) with the presence (and fluctuation) of ground water table
are considered in this paper, along with the infrastructures that were simulated here as
applied load.
The numerical modeling tool used in this research is the 2-D finite element
special purpose computer package PLAXIS-8 (Brinkgrev and Vermeer, 1998), which was
used to determine the displacements of surface soils, as well as the settlement of adjacent
foundation. To minimize the boundary effect, the vertical boundary at the far end, on the
right-hand side, is set 12 m away from the centre of loading (two and half of foundation
width), that are assumed to be free in the vertical direction and restricted in horizontal
direction. The bottom horizontal boundary is restricted in both the vertical and horizontal
directions against displacements.
The plane strain analysis based on Mohr–Coulomb material model was carried
out to simulate the behavior of soils as a continuum, with undrained conditions, to model
the soil conditions at field, and to assess the settlements, as well as, the elastic – plastic
deformation, without taking the decay of excess pore pressures with time into account.
Furthermore, ground water flow in this porous medium could be described by
Darcy’s law, assumed to be steady flow, and the interface elements are treated specially
4
in ground water calculations in PLAXIS ver-8. When the element is activated there is full
coupling of the pore pressure degrees of freedom.
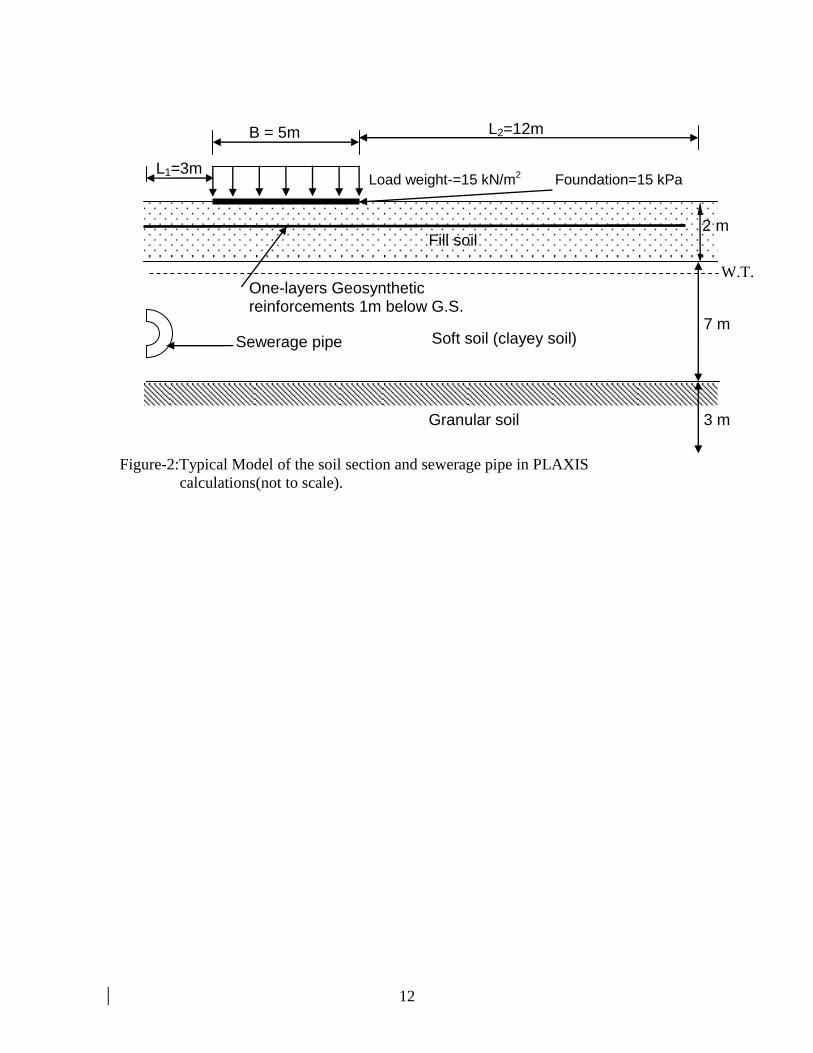
Four different materials are involved in the analysis: soft soils, granular soil, fill
material, and geosynthetic reinforcements. However, all the materials are assumed to be
non linear. Figure-2, shows the typical model for the calculation which represents one of
the nine locations studied in this research (S1), which also happens to be the worst case.
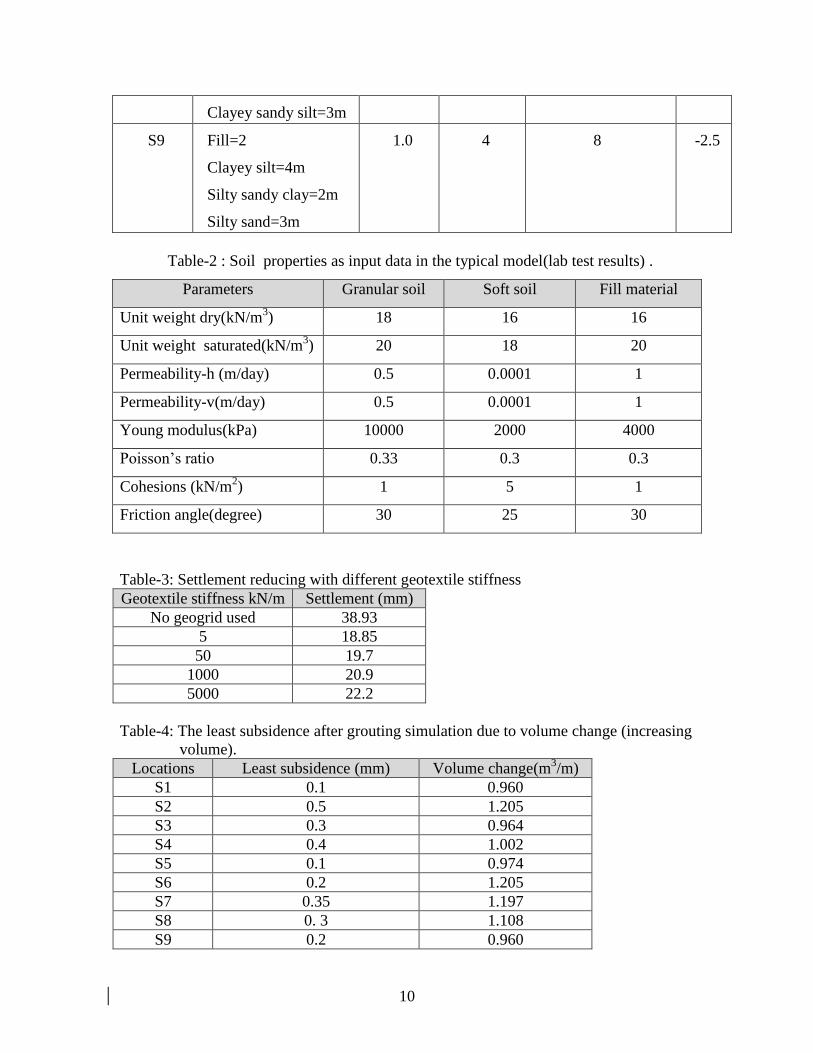
Table-1 summarizes the details pertaining to the nine locations (studied locations) that
include the soil layer thinknesses, water table location, depth and diameter of the pipe,
and the horizontal distances between the centre lines of the footing and the pipe. Table-2
shows the soil properties that were derived from laboratory tests which were used as the
input parameters in the Plaxis models.
4. REDUCING SUBSIDENCE SIMULATION
There are different procedures to prevent or reduce soil subsidence and settlement of
adjacent foundation, depending on the causes of subsidence. Among these measures, soil
reinforcement (Geotextile) and grouting are two effective methods in reducing the ground
subsidence effects.
4.1. Influence of Geotextile (geogrid) on subsidence:
Geotextile has potential application beneath footings to improve bearing capacity by
spreading the loaded area thereby reducing the contact pressures within the soil. The
interaction of the fabric, the dimensions of which are large relative to soil grains, and soil
effectively increases the angle of internal friction and cohesion (Bowels, 1988). Soil may
be strengthened by reinforcement which is placed in the direction of tensile strain so that
deformation in the soil generates tensile force in reinforcement (Jewell, 1988). Some
studies on single layer reinforced system with finite element modeling to solve such
problems are also reported in the literature (Love et al., 1987; Poran et al., 1989; Yin,
1997, 2000). Yin (1997) idealized the soft soil by a series of springs in contrast to the
present approach where it is modeled as a 2-D continuum. In this approach the reinforced
fill soil bed is treated to be an elastic half-space. With reinforced soil structures, the loads
in the reinforcement are transferred to the surrounding soil by friction at the interface.
Soil reinforcement procedure has been used to simulate the reinforcement lying
5
mid-way between the foundation and the sewage pipes, to model the construction of
superstructure as built after the pipes network were made (Figure-2), in purpose of
reducing subsidence of the soil strata above pipes as well as settlement of foundation.
A single layer of geotextile has been used for all studied locations. The geosynthetic
reinforcement layer represented by stretched elastic membranes was assumed to be rough
enough to prevent slippage at the interface with soil.
4.2. Influence of Grouting on subsidence:
Grouting is a general term means inserting special materials (e.g. stabilizing agent) in soil
body to reduce permeability, voids and pores size, and increasing soil strength.
Simulation of soil grouting in this model have been carried out by increasing volumetric
strain for particular soil cluster. However, in the field there are different materials used in
grouting such as sand-cement, cement-bentonite, silica jel, and sodium silicate. Each type
is suitable for grouting in a specific soil type. Al-Adili (1998) studied some of those
materials either for treatment and prevents soil subsidence and/or reoccurrences of soil
subsidence by reducing the soil compressibility and increase soft soil strength. The
injected material tends to travel along more permeable layers or along planes of
weakness, often emerging at a considerable distance from point of injection. Thus,
precaution on sewers or subsurface structures in the vicinity of injected soil strata
locations, due to pressure of injection which may cause displacement. From the first
author’s experience, pressure during injection should not exceed 6 bar, especially in the
vicinity of substructures and not large enough to lift the ground surface.
Different grout percentages have been examined into soft soil cluster where the
pipes that sufffered subsidence lie in, Grouting in this model has been carried out to
simulate actual structures where the subsidence occurred adjacent to the sewerage pipe
locations.
5. DISCUSSION OF THE RESULTS :
5-1. Results for reinforcement of soil with geotextile;
Reinforcement was used in this research to provide short term stability over soft
foundation soils, to maintain equilibrium until consolidation can occur in the soft
foundation soils. Reinforcement has been simulated as a horizontal layer because the
6
tensile strain is typically developed in a horizontal direction when the major loading is
applied. The results showed different results of vertical displacement reduction from 1%
to 80% depending on many variables such as pipe diameter, pipe depth, soil types and
thickness of each stratum, horizontal distance from pipe to foundations, and geogrid
stiffness.
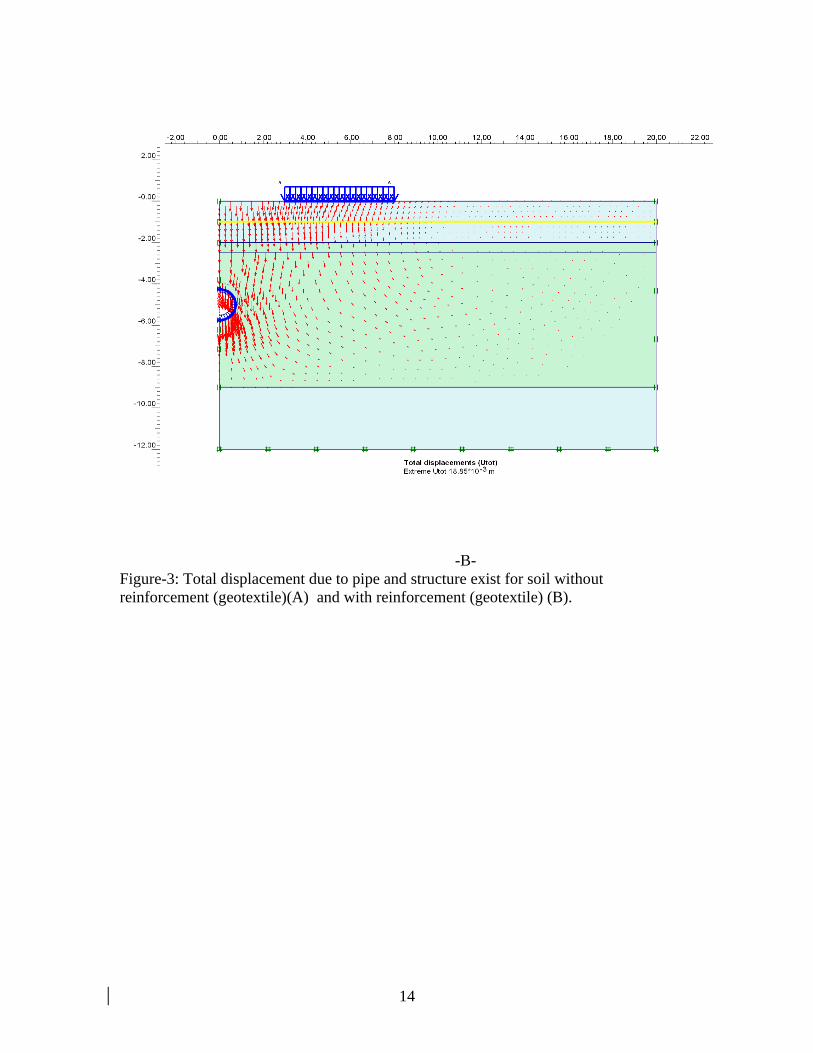
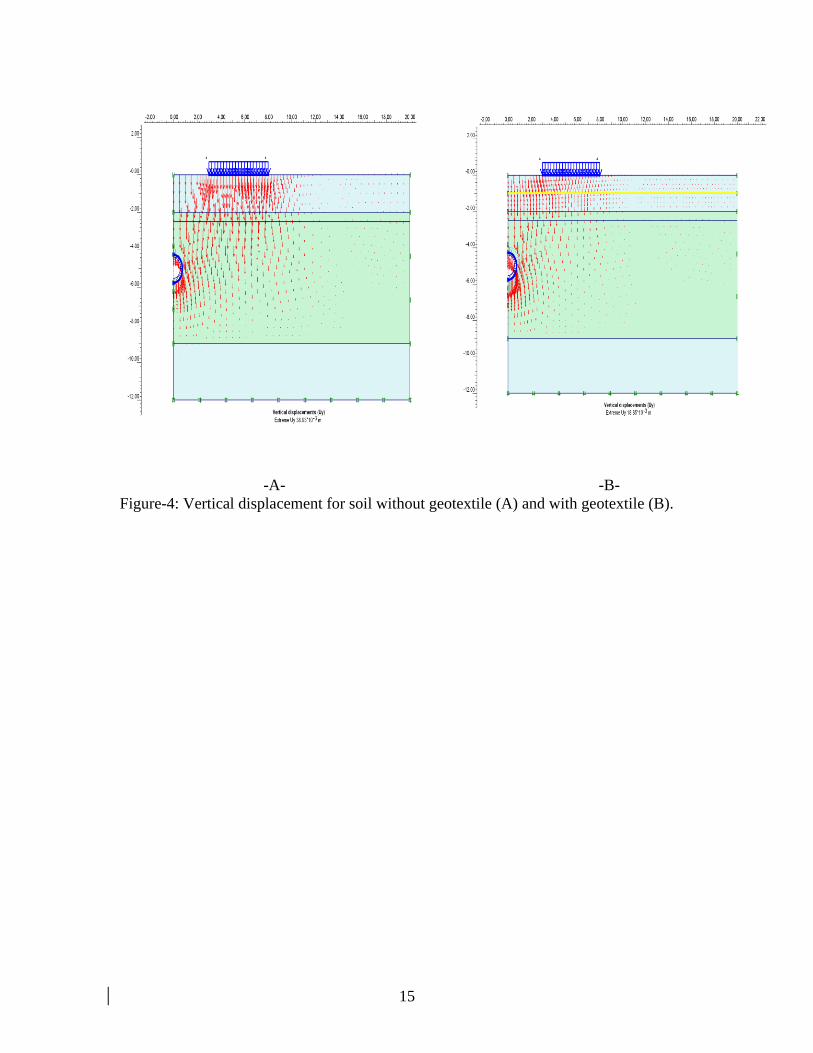
As a result of using geotextile, the total and vertical displacements have been
reduced both under the foundation and around the pipe in the reinforced soil (Figure-
3,A&B and Figure 4-A&B). With the presence of reinforcements, major parts of the
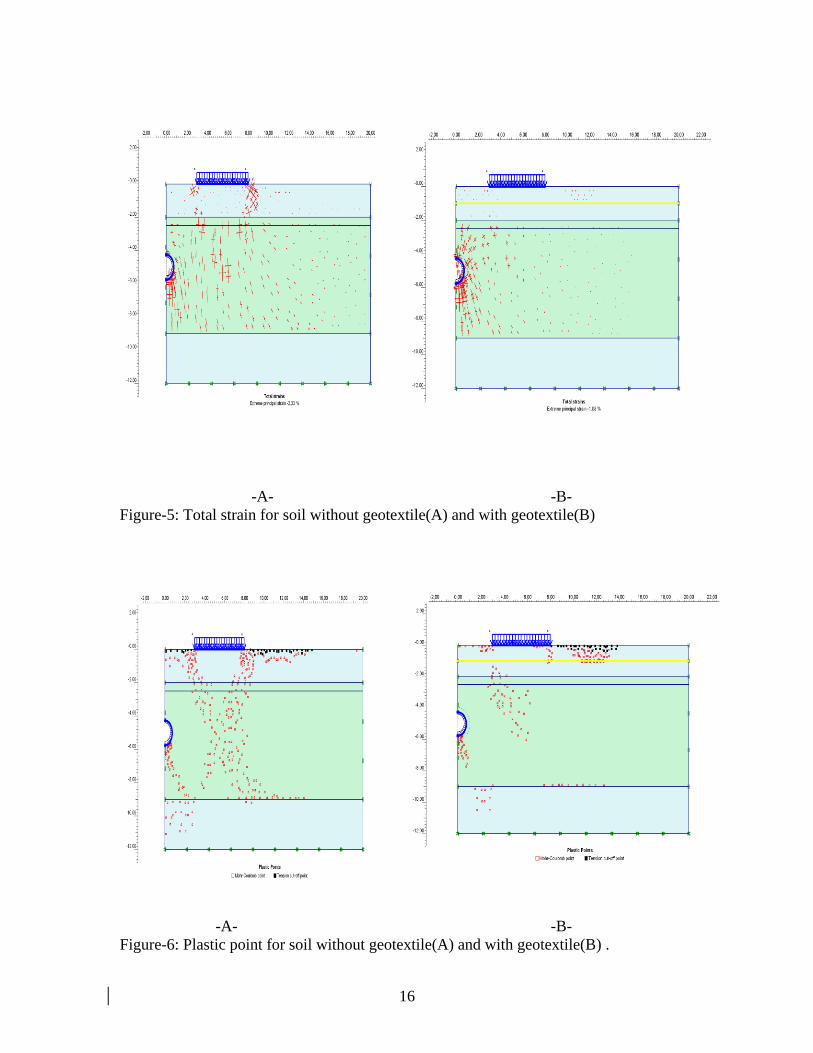
shear stress zones are taken up by the geosynthetic layers. Figure-5 showed that total
strain in soft and granular soil has lower magnitude when geotextile is present. In
contrast, the plastic locations in this model, which represent the failure points or regions
in soil clusters, were also reduced when geotextile is present (Figure-6). This figure also
showed that the tension cut-off points do not occur in reinforcement soil, especially
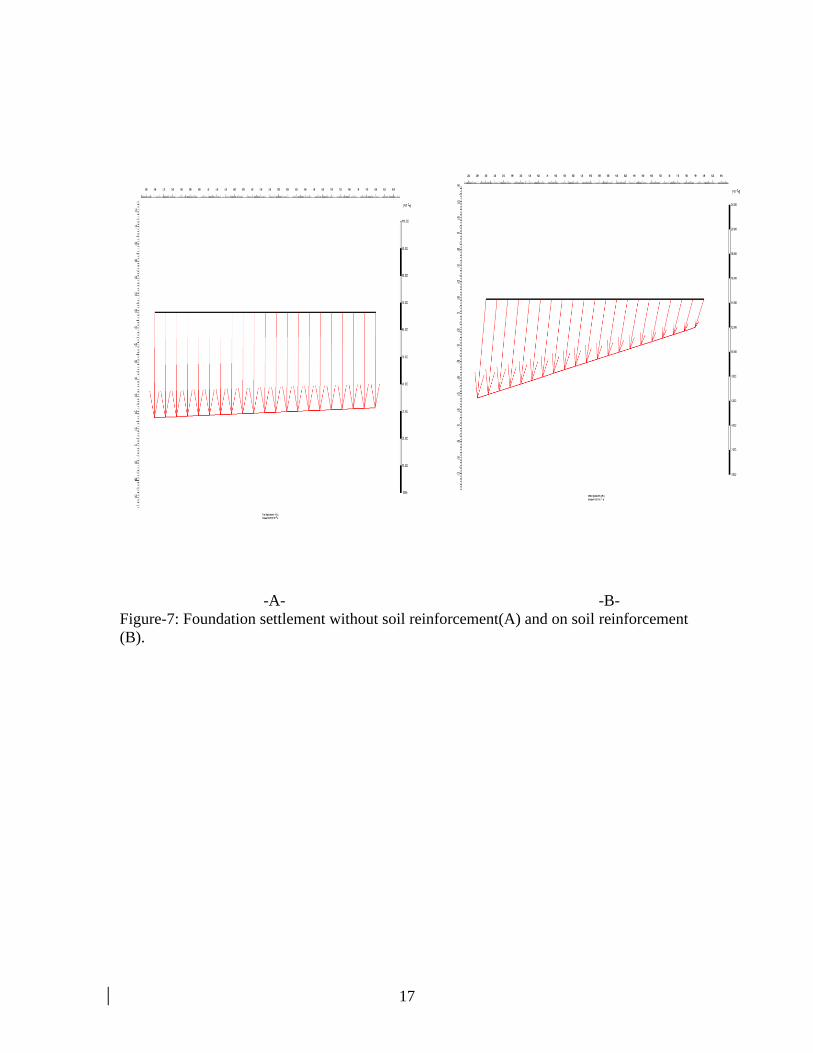
above pipe location. Among the benefits of using geotextile is reducing foundation
settlement, differential settlement and bending moments especially if the horizontal
distance of the foundations or structures from pipes location is increasing (Figure-7). The
benefits obtained from the reinforced soil results from the generation of frictional stresses
at soil-reinforcement interface. Due to these stresses the confining pressure increases
which restricts lateral strains in the soil. As a result, higher lateral stresses are induced in
the reinforced case as compared to the unreinforced case (Figure-8).
Geogrid with stiffness of 5 kN/m conduct the best results in reducing the soil
displacements for all locations (table-3). The model showed that for a particular
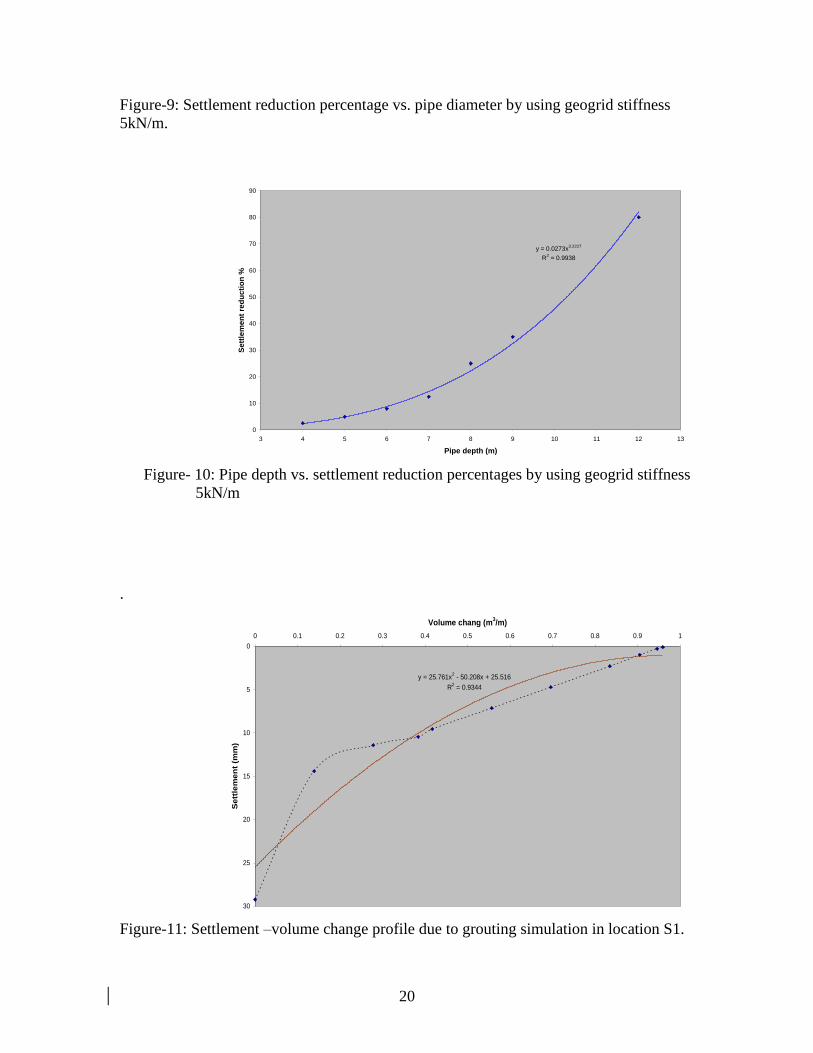
geotextile, settlement has been reduced with increase in the pipe diameter (Fig.9).
Moreover, this model revealed that there is a reverse relationship between the depth of
the sewerage pipe and settlement when using geotextile with stiffness 5 kN/m as shown
in Figure-10. From this model, no significant relationships relating geogrid depth and
ground water table depth with subsidence or settlement reduction were observed. This
could be attributed to fact that the geotextile is above the phreatic surface and the major
parts of the shear stresses are taken up by the geosynthetic layers (Deb et al., 2007). Thus,
the presence of the reinforcements causes a reduction in the outwardly acting shear
stresses leading to better performance of the foundation under the superimposed load.
7
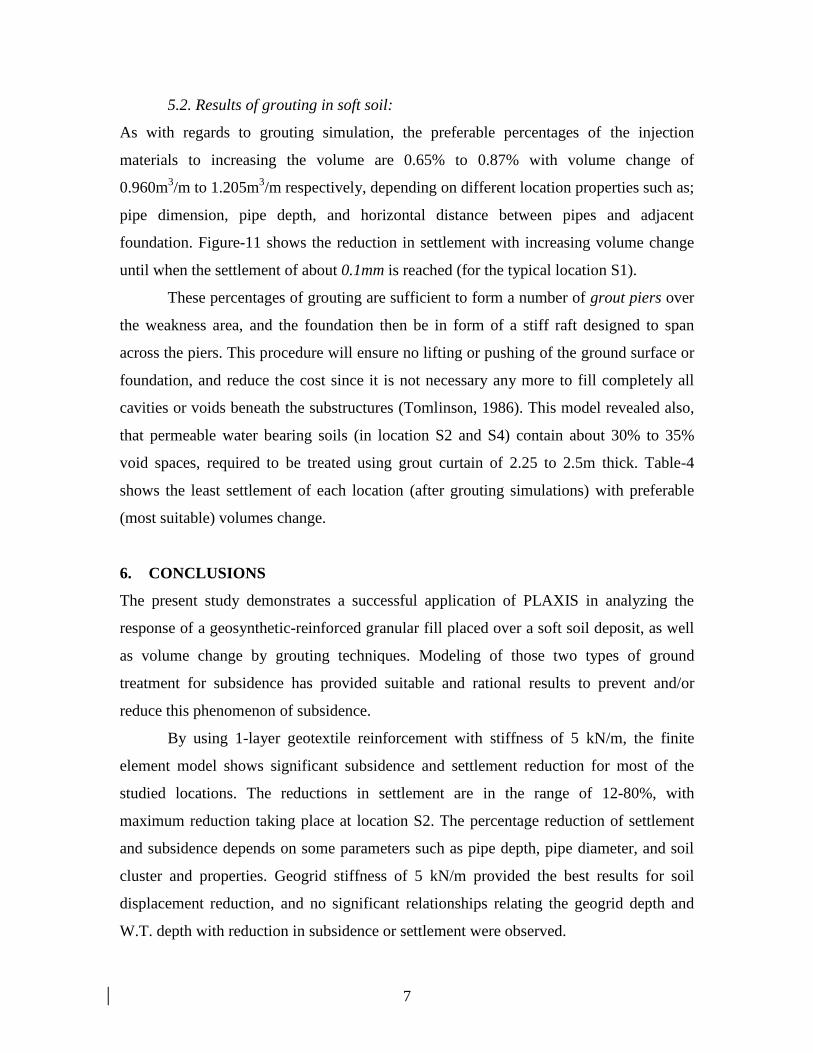
5.2. Results of grouting in soft soil:
As with regards to grouting simulation, the preferable percentages of the injection
materials to increasing the volume are 0.65% to 0.87% with volume change of
0.960m3/m to 1.205m
3/m respectively, depending on different location properties such as;
pipe dimension, pipe depth, and horizontal distance between pipes and adjacent
foundation. Figure-11 shows the reduction in settlement with increasing volume change
until when the settlement of about 0.1mm is reached (for the typical location S1).
These percentages of grouting are sufficient to form a number of grout piers over
the weakness area, and the foundation then be in form of a stiff raft designed to span
across the piers. This procedure will ensure no lifting or pushing of the ground surface or
foundation, and reduce the cost since it is not necessary any more to fill completely all
cavities or voids beneath the substructures (Tomlinson, 1986). This model revealed also,
that permeable water bearing soils (in location S2 and S4) contain about 30% to 35%
void spaces, required to be treated using grout curtain of 2.25 to 2.5m thick. Table-4
shows the least settlement of each location (after grouting simulations) with preferable
(most suitable) volumes change.
6. CONCLUSIONS
The present study demonstrates a successful application of PLAXIS in analyzing the
response of a geosynthetic-reinforced granular fill placed over a soft soil deposit, as well
as volume change by grouting techniques. Modeling of those two types of ground
treatment for subsidence has provided suitable and rational results to prevent and/or
reduce this phenomenon of subsidence.
By using 1-layer geotextile reinforcement with stiffness of 5 kN/m, the finite
element model shows significant subsidence and settlement reduction for most of the
studied locations. The reductions in settlement are in the range of 12-80%, with
maximum reduction taking place at location S2. The percentage reduction of settlement
and subsidence depends on some parameters such as pipe depth, pipe diameter, and soil
cluster and properties. Geogrid stiffness of 5 kN/m provided the best results for soil
displacement reduction, and no significant relationships relating the geogrid depth and
W.T. depth with reduction in subsidence or settlement were observed.
8
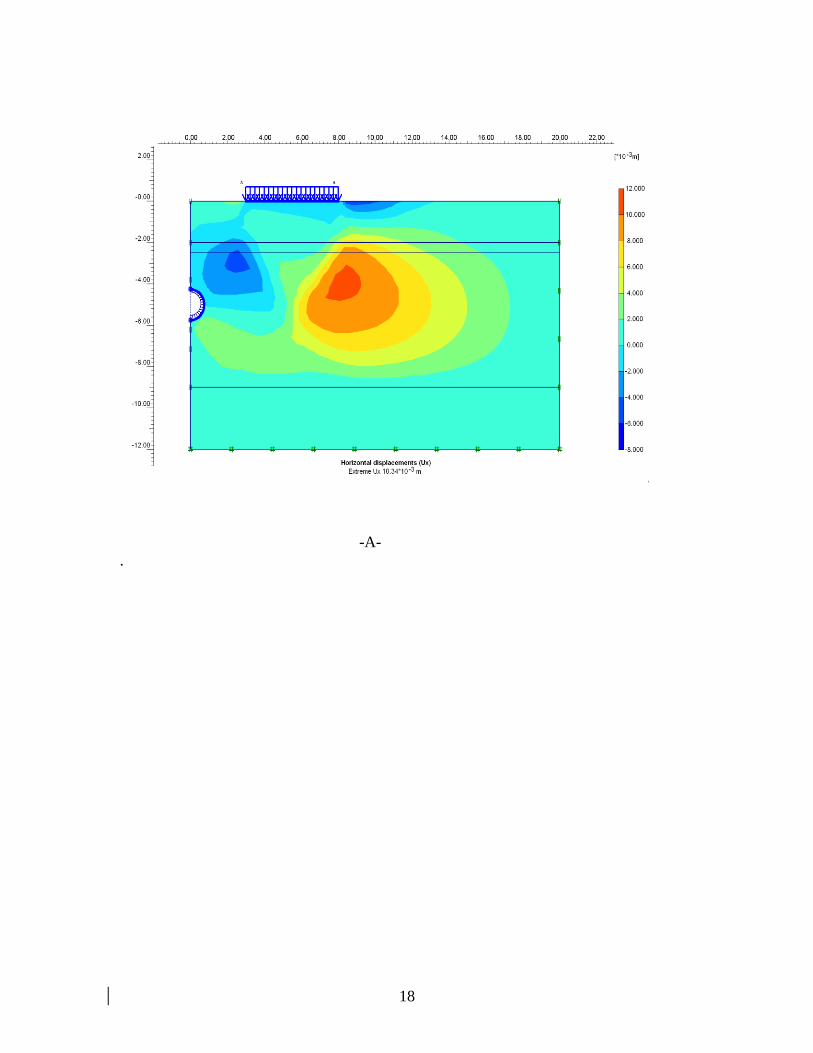
One can consider some additional benefits from the application of a more
powerful finite element method, e.g. not only an overall distribution of the vertical
displacements but also of the horizontal displacements can be obtained (see Fig.8).
Simulation of volume change as grouting in soft soils and weakness clusters
shows a reasonable result for subsidence and settlement reduction from 0.1 mm up to 0.5
mm at the 9 different locations with grouting injection carried out in the vicinity of
substructures.
However, this study showed that the particular techniques adopted in the
simulations and calculations for this problem are adequate for modelling the two ground
improvement techniques, using geosynthetics and grouting.
REFERENCES
Al-Adili, A.SH.(1998). Geotechnical Evaluation of Baghdad soil Subsidence and Their
Treatments, Ph.D. thesis, Univ. of Baghdad , 142p.
Brinkgreve, R. B. T., Vermeer, P. A. (1998), ‘PLAXIS- Finite Element Code for
‘soil and Rocks Analysis’. Version 7 and 8,A. A. Balkema-Rotterdam-Brookfield
Bowles, J. (1988) , Foundation Analysis and Design , 4th.ed., MeGraw-Hill inc.,
Newyork , 659 p.
Deb, K., Sivakugan, N., Chandra, S., and Basudhar, P. K. (2007). Numerical analysis
of multi layer geosynthetic-reinforced granular bed over soft fill, Geotechnical
and Geological engineering , Springer ,The Netherlands,(in press).
Jewell,R.A.(1988). The Mechanics of Reinforced Embankment on Soft Soils, Geotextile
and Geomembranes ,Elsevier,Voi.7, No.3. pp 34-45.
Love, J.P., Burd, H.J., Milligan, G.W.E. and Houlsby, G.T. (1987). Analytical and model
studies of reinforcement of a layer of granular fill on soft clay subgrade,
Canadian Geotecnical Journal, 24, 611-622.
Poran, C.J., Herrmann, L.R. and Romstad, K.M. (1989). Finite element analysis of
footing on geogrid-reinforced soil. Proceeding of geosynthetics, USA,231-242.
Tomlinson, M. (1988) , Foundation Design and Construction, Pitman Publ., UK, 450 p.
Yin, J. H. (1997). Modeling geosynthetic-reinforced granular fills over soft soil,
Geosynthetics International, 4(2), 165-185.

9
Yin, J. H. (2000). Comparative modeling study on reinforced beam on elastic foundation,
J. Geotech. and Envir. Eng., ASCE, 126(3), 265-271.
Table-1: Description of each study location for subsidence model .
Location Soil profile Pipe
diameter
(m)
Pipe
depth
invert (m)
Distance between
foundation and pipe
(m)
W.T.
(m)
S1 Fill= 2m
Soft soil =7m
Sandy soil=3m
1.5 6.5 3 -2.5
S2 Fill=4m
Silty clay=5m
Silty sand=4m
3 12 5 -4
S3 Fill=1m
Silty clay=4m
Clayey silty sand=6m
1.4 8 7 -2.5
S4 Fill=1m
Silty clay=7m
Clayey silty sand=3m
1.6 9 8 -1.5
S5 Fill=2m
Clayey silt=2m
Sandy clayey silt=4m
1.6 6 7 -2
S6 Fill=3.5m
Clay=5m
Clayey sand=2.5m
2 7 5 -2.5
S7 Fill=1m
Clay=2.5m
Clayey silt=3.5m
Sandy silt=2
Clayey silty sand=3m
1.4 5 8 -2
S8 Fill=2m
Silty clay=3m
1.5 6.5 7 -2.25
10
Clayey sandy silt=3m
S9 Fill=2
Clayey silt=4m
Silty sandy clay=2m
Silty sand=3m
1.0 4 8 -2.5
Table-2 : Soil properties as input data in the typical model(lab test results) .
Parameters Granular soil Soft soil Fill material
Unit weight dry(kN/m3) 18 16 16
Unit weight saturated(kN/m3) 20 18 20
Permeability-h (m/day) 0.5 0.0001 1
Permeability-v(m/day) 0.5 0.0001 1
Young modulus(kPa) 10000 2000 4000
Poisson’s ratio 0.33 0.3 0.3
Cohesions (kN/m2) 1 5 1
(degree) Friction angle 30 25 30
Table-3: Settlement reducing with different geotextile stiffness
Geotextile stiffness kN/m Settlement (mm)
No geogrid used 38.93
5 18.85
50 19.7
1000 20.9
5000 22.2
Table-4: The least subsidence after grouting simulation due to volume change (increasing
volume).
Locations Least subsidence (mm) Volume change(m3/m)
S1 0.1 0.960
S2 0.5 1.205
S3 0.3 0.964
S4 0.4 1.002
S5 0.1 0.974
S6 0.2 1.205
S7 0.35 1.197
S8 0. 3 1.108
S9 0.2 0.960
11
Figure-1: Photos of some subsidence locations on the roads and sewage locations in
Baghdad city.
12
Figure-2:Typical Model of the soil section and sewerage pipe in PLAXIS
calculations(not to scale).
7 m
2 m
B = 5m
Foundation=15 kPa
Soft soil (clayey soil)
One-layers Geosynthetic reinforcements 1m below G.S.
L1=3m
Fill soil
3 m Granular soil
Load weight-=15 kN/m2
Sewerage pipe
W.T.
L2=12m

13
-A-
14
-B-
Figure-3: Total displacement due to pipe and structure exist for soil without
reinforcement (geotextile)(A) and with reinforcement (geotextile) (B).
15
-A- -B-
Figure-4: Vertical displacement for soil without geotextile (A) and with geotextile (B).
16
-A- -B-
Figure-5: Total strain for soil without geotextile(A) and with geotextile(B)
-A- -B-
Figure-6: Plastic point for soil without geotextile(A) and with geotextile(B) .
17
-A- -B-
Figure-7: Foundation settlement without soil reinforcement(A) and on soil reinforcement
(B).
18
-A-
.

19
-B-
Figure-8: horizontal displacements as shading intensity for subsidence model without
reinforcement (A) and with reinforcement (B)
y = 5E-10x3.2071
R2 = 0.9552
0
10
20
30
40
50
60
70
80
90
900 1100 1300 1500 1700 1900 2100 2300 2500 2700 2900 3100
Pipe diametre (mm)
Se
ttle
me
nt
red
uc
tio
n %
20
Figure-9: Settlement reduction percentage vs. pipe diameter by using geogrid stiffness
5kN/m.
y = 0.0273x3.2227
R2 = 0.9938
0
10
20
30
40
50
60
70
80
90
3 4 5 6 7 8 9 10 11 12 13
Pipe depth (m)
Se
ttle
me
nt
red
ucti
on
%
Figure- 10: Pipe depth vs. settlement reduction percentages by using geogrid stiffness
5kN/m
.
y = 25.761x2 - 50.208x + 25.516
R2 = 0.9344
0
5
10
15
20
25
30
0 0.1 0.2 0.3 0.4 0.5 0.6 0.7 0.8 0.9 1
Volume chang (m3/m)
Se
ttle
me
nt
(mm
)
Figure-11: Settlement –volume change profile due to grouting simulation in location S1.