Embed Size (px)
Citation preview
Nursing and Personal Care:Funding Increase Survey
Prepared for:
Ministry of Health and Long-Term CareLong Term Care Facilities Branch5th Floor, Hepburn Block80 Grosvenor StreetToronto, Ontario
Prepared by:
Sigma-3 Policy Research Inc.248 Dupont Street, Main FloorToronto, OntarioM5R 1V7
Contact:
Dan Buchanan
[email protected]: 416.922.5666
July 16, 2003
NPC Funding Increase SurveySigma-3 Policy Research Inc.
1
Table of Contents
EXECUTIVE SUMMARY 2
1.0 INTRODUCTION 5
1.1 Background 5
1.2 Research Objectives 5
1.3 Survey Design and Methodology 6
2.0 SURVEY RESULTS 7
2.1 Allocation of NPC Increase 7
2.2 Human Resources – Before and After 16
2.3 Improvements Benefiting Residents 22
CONCLUSION 24
Appendix A: Cover Letter and Questionnaire 25
Appendix B: Technical Appendix 30
NPC Funding Increase SurveySigma-3 Policy Research Inc.
2
EXECUTIVE SUMMARY
Background
In July 2002, the Ministry of Health and Long-Term Care announced an increase in funding tothe Nursing and Personal Care (NPC) envelope for provincially funded long-term care (LTC)facilities. The increase took effect on August 1, 2002. For individual facilities this meant anincrease of $6.33 per day per resident assuming a Case Mix Index (CMI) of 100.
Purpose
Sigma-3 Policy Research Inc. was contracted to carry out a survey of long-term care facilitiesto estimate the human resource changes resulting from the increase and to identify otherpotential benefits to residents.
Nursing and Personal Care (NPC) Envelope
Funds allocated to the NPC envelope must be spent on care-related expenses. Eligibleitems under the NPC envelope include, nursing and personal support staff salaries andwages, education, restorative care, supplies and equipment (i.e. supplies for personalhygiene and grooming, diagnostic equipment and treatment supplies). Any unspentfunding is returned to the Ministry of Health and Long-Term Care.
Funding in this envelope varies each year, depending on the level of care of residents in eachfacility. The amount of funding for this envelope is determined by the facility’s CMI. The CMIis a measure used to express the levels of care requirements of each LTC facility anddetermines how funds for nursing and personal care are allocated. The CMI for an averagefacility is 100.
Methodology
The Ministry of Health and Long-Term Care, Long-Term Care Facilities Branch, developed thesurvey questionnaire with review and input from LTC industry associations and Sigma-3Policy Research Inc. It was designed to capture two (pre and post increase) point-in-time‘head counts’ and full-time equivalent (FTE) measures for all NPC-related staff positions(direct care, support and administrative). The questionnaire was pre-tested with a number ofLTC facilities representing all three LTC facility types (Charitable Homes, Municipal Homesand Nursing Homes).
A census approach to the survey was used: all 544 LTC facilities were sent a questionnaire,with responses submitted in confidence. A response rate of 76%, or 412 useablequestionnaires, was obtained. The resulting non-random sample is representative of thedistribution of facility type and the size of facilities overall.
Results were weighted based on facility type1 in order to estimate for the entire population offacilities. Data from facilities that opened subsequent to the NPC increase were excluded 1 A simplified example of ‘weighting’ follows. If Municipal and Nursing home are equally represented in thepopulation of LTC facilities (i.e., 50% Municipal and 50% Nursing Homes), but our sample is composed of 75%
NPC Funding Increase SurveySigma-3 Policy Research Inc.
3
from the analysis. Changes for these facilities were estimated based on the experience ofexisting facilities.
Results Highlights
Allocation of Increase
Each facility was asked to provide a percentage breakdown on how their NPC increase wasallocated among the various budget items.
On average, 65.8% of each facility’s increase was allocated to Direct Care salaries and wages(S&W); 13.4% was allocated to incontinence supplies; and 5.7% to “other” expenditure items.
Allocation patterns were similar across all three facility types. Direct Care S&W accounted forthe largest average allocation in all cases. The average allocation by Charitable Homes wasthe largest (69.4%); followed by Municipal Homes (67.5%); and then Nursing Homes (64.7%).
Incontinence supplies was also the second largest average allocation for all three facilitytypes, with Nursing Homes allocating the largest portion of their increase (23.8%); followed byMunicipal Homes (13.1%); and Charitable Homes (12.2%).
Facility types differ somewhat in the third largest expenditure item. Municipal Homes andNursing Homes allocated, on average, 5.8% and 6.3% of their increase to “Other” expenditureitems, respectively. Charitable Homes’ allocated, on average, only 2.6% of their increase to“Other” expenditure items.
HR Impact
The sample was weighted to account for facilities that did not reply to the questionnaire and toestimate the impact on the entire population of 544 facilities. This assumes that there were nosignificant differences between the 76% that responded to the survey and the entirepopulation.
The survey estimates a total of 42,738 full or part time individuals in the NPC area of the LTCfacilities workforce in July 2002. In March 2003, the total number of individuals employed inthe NPC area had grown to an estimated 45,088, an increase of 2,350 individuals.
In terms of full-time equivalents (FTE), this translates into an estimated total increase of1,782.5 FTEs in the NPC area of the LTC facilities workforce.
Municipal and 25% Nursing Homes, we have an imbalance favouring Municipal Homes. To make our samplemore representative of the population, the response of each Nursing Home would give the weight of 2 (makingeach Nursing Home response worth twice as much because there are too few Nursing Homes in our sample inproportion to the population) while the response of each Municipal Home is given the weight of 2/3 (making eachMunicipal response worth less than 1 because there are too many Municipal Homes in our sample in proportionto the population. Refer to Appendix B for the actual weights used for the three types of LTC facilities.
NPC Funding Increase SurveySigma-3 Policy Research Inc.
4
The different facility types were similar in terms of FTE increases per 100 beds. Nursinghomes had the largest proportionate increase with 2.8 FTEs per 100 beds, exclusive ofavoided layoffs. Municipal and Charitable Homes each had an increase of 2.7 FTEs perhundred beds, exclusive of avoided layoffs.
Survey respondents were asked if the rate increase had allowed them to avoid any layoffs.Given that the CMI determines a facility’s NPC funding allocation from the Ministry, facilitiesplan their NPC staffing needs based on this annual measure. Facilities may increase ordecrease staff according to their CMI. In cases where a facility receives a lower CMI than theprevious year, the facility may at its discretion consider laying off or reducing hours of its NPCstaff as its resident population has lighter care needs. The NPC increase enabled somefacilities whose CMI decrease to minimize staffing reductions that might otherwise have takenplace.
The survey findings indicate that 544.9 layoffs were avoided. The Charitable and NursingHomes sectors benefited the most in terms of layoffs avoided, reporting approximately 1.0FTE avoided layoffs per 100 beds (1.0 and 0.9, respectively). The Municipal Homes sectorreported approximately 0.5 FTE avoided layoffs per 100 beds.
Improvements in Quality of Resident Care
Respondents were asked a qualitative question regarding how the new NPC funding hadenabled improvements in the quality of care for facility residents.
Forty-five percent of the improvements mentioned involved “increased time and qualityprogramming.” In this category, respondents noted increased time for nurses and personalsupport workers to focus on resident care, admissions, orientation, assessment, personalgrooming, and social interaction. Others noted an improved capacity to attend to residentswith dementia and behavioural issues.
The next most common improvement, accounting for 21% of all comments, dealt with theability to provide improved bathing services for residents.
NPC Funding Increase SurveySigma-3 Policy Research Inc.
5
1.0 INTRODUCTION
1.1 Background
In July of 2002, the Ministry of Health and Long-Term Care announced an increase in funding
to the nursing and personal care envelope (NPC) for provincially funded long-term care
facilities. The increase took effect on August 1, 2002, and totaled $100M. For individual
facilities, this meant an increase of $6.33 per day per resident assuming a Case Mix Index
(CMI) of 100.2
The Ministry of Health and Long-Term Care commissioned Sigma-3 Policy Research Inc. to
carry out a survey of long-term care facilities. The purpose of the survey was to determine
how the increase was used, assess the human resource changes from before to after the
increase, and to identify any associated improvements that benefited facility residents.
1.2 Research Objectives
There were three primary objectives of the study:
1. To determine how the increase was distributed within NPC supplies, services and
personnel costs, i.e. what proportion of the increase went to which expenditure area.
2. To identify changes in human resource levels just prior to the increase (i.e. July
2002) and after the increase at the end of the fiscal year (March 2003).
3. To obtain a qualitative sense of what quality care improvements resulted from the
increase.
NPC Funding Increase SurveySigma-3 Policy Research Inc.
6
1.3 Survey Design and Methodology
The Ministry of Health and Long-Term Care, Facilities Branch, with review and input from LTC
industry associations and Sigma-3 Policy Research Inc. developed the survey questionnaire.
It was designed to capture two (pre and post increase) point-in-time ‘head counts’ and full-
time equivalent (FTE) measures for all NPC-related staff positions (both direct service,
support and administrative). The questionnaire was pre-tested with a number of LTC facilities
representing all three LTC facility types (Charitable Homes, Municipal Homes and Nursing
Homes).
Because of the small population of LTC facilities (544), a census approach to the survey was
adopted. All facilities were sent a questionnaire, and a cover letter explaining the survey
requesting the respondents’ cooperation, and that responses would be held in confidence. In
order to maximize the response rate, extensive telephone follow-up reminder calls were
placed to all late respondents and telephone support was available to respondents throughout
the data collection phase.
A response rate of 76%, or 412 useable questionnaires, was obtained.3 The resulting non-
random sample is representative of the distribution of facility types. The sample is also
representative of the size of facilities overall and for the Charitable Homes group. However,
the sample for Municipal Homes tend to be smaller with an average of 116 beds compared to
the total population of Municipal Homes where the average is 164 beds. This result would
suggest that larger municipal homes are under-represented. The sample of Nursing Homes
with an average of 116 beds tends to be somewhat larger than the total population of Nursing
Homes where the average number of beds in only 104. This would suggest that smaller
homes are under-represented.
2 NPC per diem rates are adjusted by the facilities CMI. The $6.33 per resident per day is based on an averagefacility with a CMI of 100. CMIs are determined for all facilities annually and revised CMIs take effect on April 1of each year.3 New facilities that were opened after the August rate increase were taken out of the sample.
NPC Funding Increase SurveySigma-3 Policy Research Inc.
7
For the analysis of human resource changes, results were weighted based on facility type. In
order to estimate results for the entire population of facilities, sample results are adjusted to
more accurately represent the distribution of the different facility types4.
See Appendix B for further details concerning response rates, weighting, and margins of error.
2.0 SURVEY RESULTS
Results are presented in three sections, the first, section 2.1, deals with the question of how
facilities distributed their increase across the various NPC expenditure items. In section 2.2,
an analysis of the post increase change in LTC facility human resources is presented, and
section 2.3 provides a review of the range of care improvements reported by facilities. In each
section, results are presented in total, and for each of the major facility types, i.e. Charitable
Homes, Municipal Homes, and Nursing Homes.
2.1 Allocation of the NPC Increase
LTC facilities were asked to provide a percentage breakdown of how they allocated the NPC
increase across a range of expenditure items. Expenditure items included:
• Education
• Incontinence Supplies
• Other Supplies
• Equipment
• Direct Care – Salaries and Wages
4 A simplified example of ‘weighting’ follows. If Municipal and Nursing home are equally represented in thepopulation of LTC facilities (i.e., 50% Municipal and 50% Nursing Homes), but our sample is composed of 75%Municipal and 25% Nursing Homes, we have an imbalance favoring Municipal Homes. To make our sample morerepresentative of the population, the response of each Nursing Home would give the weight of 2 (making eachNursing Home response worth twice as much because there are too few Nursing Homes in our sample inproportion to the population) while the response of each Municipal Home is given the weight of 2/3 (making eachMunicipal response worth less than 1 because there are too many Municipal Homes in our sample in proportionto the population. Refer to Appendix B for the actual weights used for the three types of LTC facilities.
NPC Funding Increase SurveySigma-3 Policy Research Inc.
8
• Nursing Care Admin – Salaries and Wages (e.g. Director of Nursing, Nurse
Educators, Infection Control Practitioners, etc.)
• Medical Director Fees
• Other (e.g. special resident needs, wage increases, restorative care,
nursing equipment repairs and maintenance, etc.)
In the following sub-sections the average allocation to each of these expenditure items is
considered.
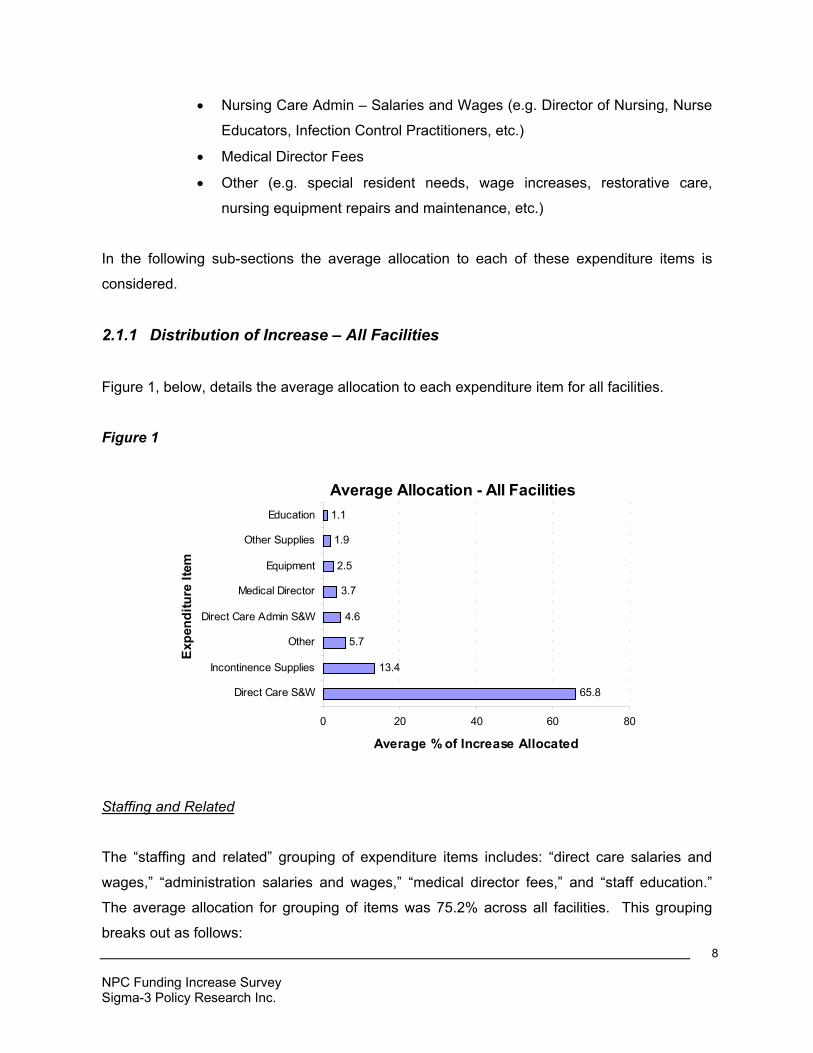
2.1.1 Distribution of Increase – All Facilities
Figure 1, below, details the average allocation to each expenditure item for all facilities.
Figure 1
Average Allocation - All Facilities
65.8
13.4
5.7
4.6
3.7
2.5
1.9
1.1
0 20 40 60 80
Direct Care S&W
Incontinence Supplies
Other
Direct Care Admin S&W
Medical Director
Equipment
Other Supplies
Education
Expe
nditu
re It
em
Average % of Increase Allocated
Staffing and Related
The “staffing and related” grouping of expenditure items includes: “direct care salaries and
wages,” “administration salaries and wages,” “medical director fees,” and “staff education.”
The average allocation for grouping of items was 75.2% across all facilities. This grouping
breaks out as follows:
NPC Funding Increase SurveySigma-3 Policy Research Inc.
9
• The overall average allocation to direct care salaries and wages was the largest of all
expenditure items at 65.8% of the NPC increase.
• The average allocation to NPC administration salaries and wages was 4.6%.
• Allocations to medical director fees averaged 3.7% of the NPC increase.
• Allocations to staff education averaged 1.1% of the NPC increase.
Supplies and Equipment
The average allocation for Supplies and Equipment, which includes “incontinence supplies,”
“other supplies” and “equipment,” was 17.8 % of the total NPC increase. This grouping
breaks down as follows:
• The average allocation to incontinence supplies was 13.4% of the total NPC increase.
• All facilities reported allocations to other supplies at an overall average of 1.9% of the
total NPC increase.
• The average allocation to equipment purchases was 2.5% of the total NPC increase.
Other Expenditures
• “Other” expenditure items have been grouped under the following headings:
Absorbed within current overspending
Wage Increases
Other (e.g. special resident needs, restorative care, nursing equipment
repairs and maintenance)
Missing / Not stated.
NPC Funding Increase SurveySigma-3 Policy Research Inc.
10
• Considerable variability exists between the three facility segments, both in terms of the
nature and the amounts of “other allocations.” These factors are discussed in detail in
the segment-specific section that follow (sections 2.1.2, 2.1.3 and 2.1.4 below).
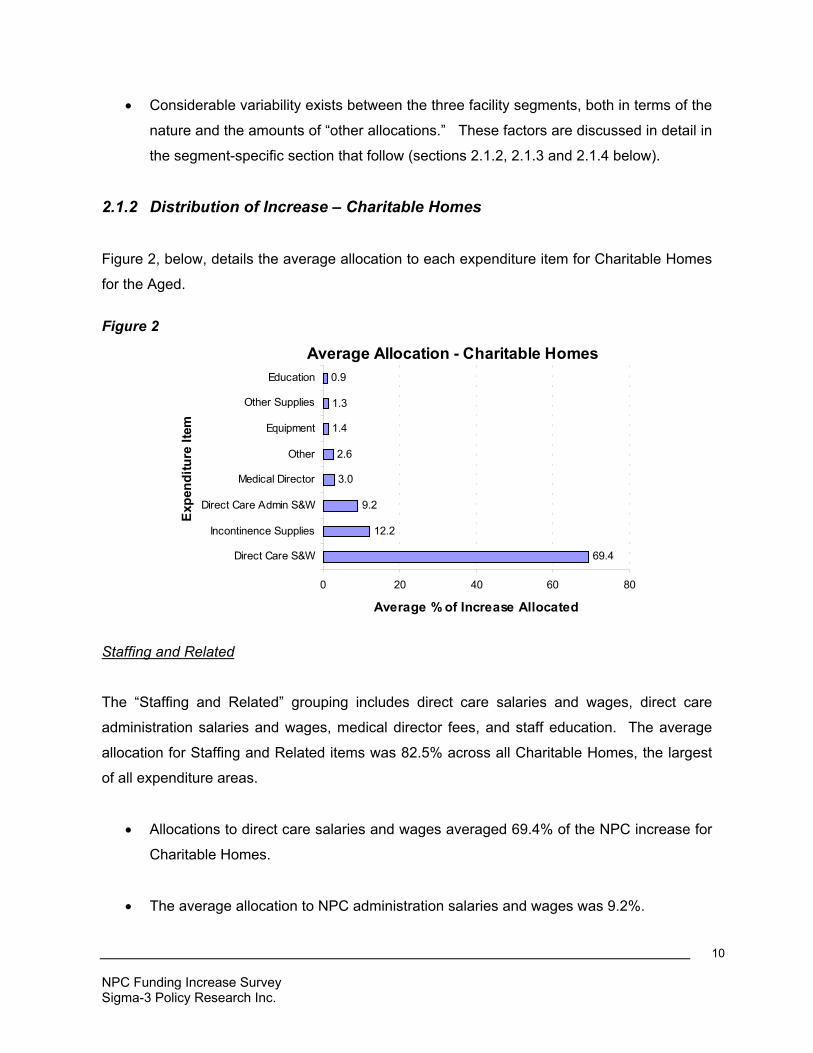
2.1.2 Distribution of Increase – Charitable Homes
Figure 2, below, details the average allocation to each expenditure item for Charitable Homes
for the Aged.
Figure 2
Average Allocation - Charitable Homes
69.4
12.2
9.2
3.0
2.6
1.4
1.3
0.9
0 20 40 60 80
Direct Care S&W
Incontinence Supplies
Direct Care Admin S&W
Medical Director
Other
Equipment
Other Supplies
Education
Expe
nditu
re It
em
Average % of Increase Allocated
Staffing and Related
The “Staffing and Related” grouping includes direct care salaries and wages, direct care
administration salaries and wages, medical director fees, and staff education. The average
allocation for Staffing and Related items was 82.5% across all Charitable Homes, the largest
of all expenditure areas.
• Allocations to direct care salaries and wages averaged 69.4% of the NPC increase for
Charitable Homes.
• The average allocation to NPC administration salaries and wages was 9.2%.
NPC Funding Increase SurveySigma-3 Policy Research Inc.
11
• Charitable Homes allocated 3.0% of their total increase to medical director fees.
• Staff education was allocated, on average, 0.9% of the NPC increase.
Supplies and Equipment
The average allocation for “Supplies and Equipment” which included incontinence supplies,
other supplies, and equipment, was 14.9% of the total NPC increase. This grouping breaks
down as follows:
• The average allocation to incontinence supplies by Charitable Homes was 12.2% of
the total NPC increase.
• The average allocation to other supplies was 1.3% of the total NPC increase.
• Equipment purchases were allocated an average of 1.4% of the total NPC increase.
Other Expenditures
• Two Charitable Homes reported “Other” allocations of their NPC increase. One
facility allocated 63% of its increase to offset their costs in the NPC envelope. The
other facility spent 79% of its increase on utilization and wage increases.
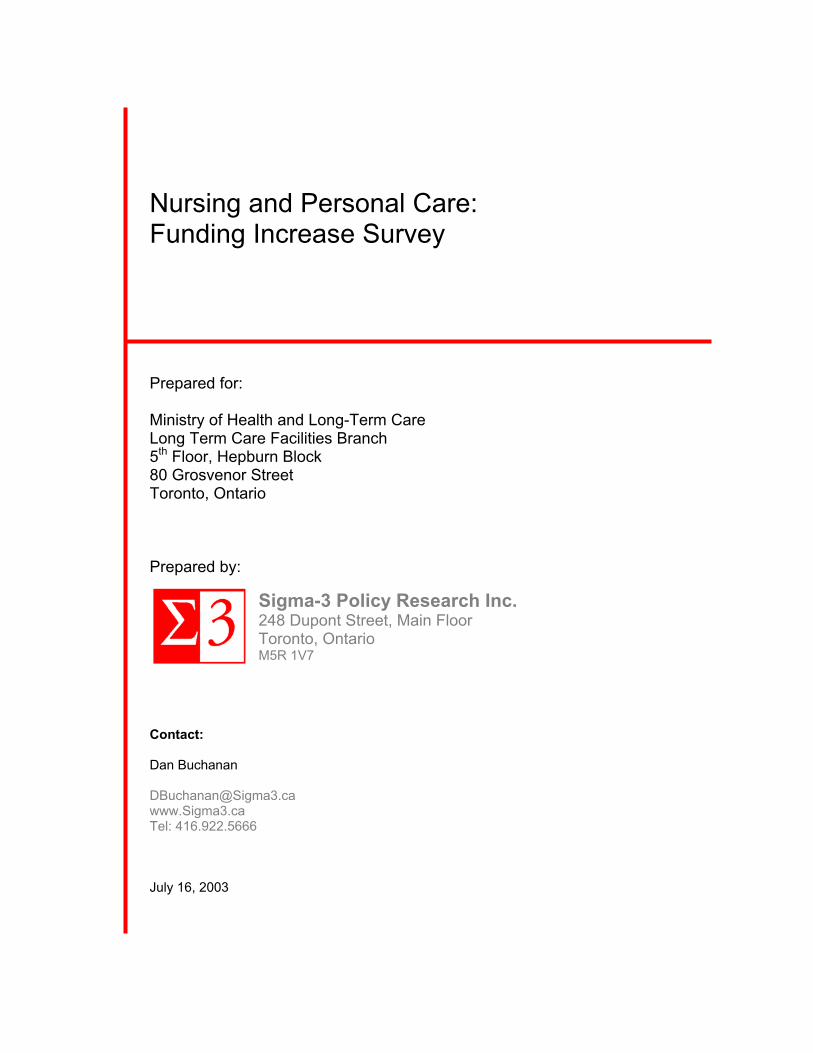
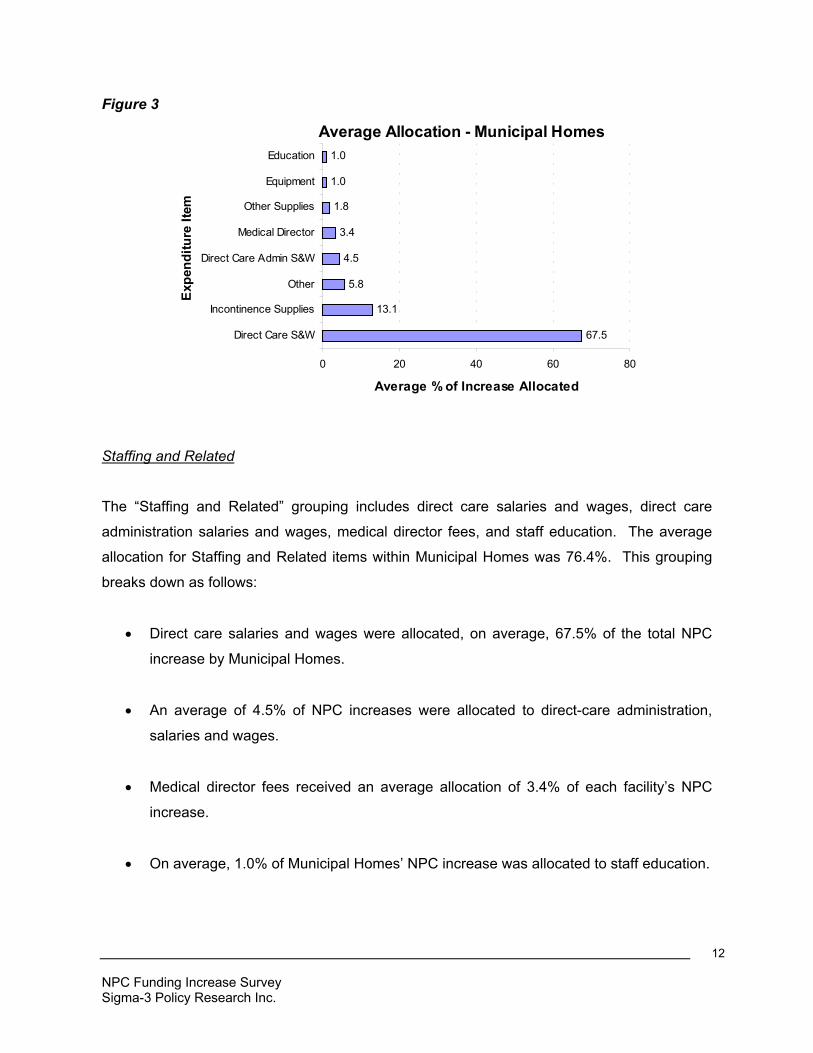
2.1.3 Distribution of Increase – Municipal HomesFigure 3, below, details the average allocation to each expenditure item for Municipal Homes
for the Aged.
NPC Funding Increase SurveySigma-3 Policy Research Inc.
12
Figure 3
Average Allocation - Municipal Homes
67.5
13.1
5.8
4.5
3.4
1.8
1.0
1.0
0 20 40 60 80
Direct Care S&W
Incontinence Supplies
Other
Direct Care Admin S&W
Medical Director
Other Supplies
Equipment
Education
Expe
nditu
re It
em
Average % of Increase Allocated
Staffing and Related
The “Staffing and Related” grouping includes direct care salaries and wages, direct care
administration salaries and wages, medical director fees, and staff education. The average
allocation for Staffing and Related items within Municipal Homes was 76.4%. This grouping
breaks down as follows:
• Direct care salaries and wages were allocated, on average, 67.5% of the total NPC
increase by Municipal Homes.
• An average of 4.5% of NPC increases were allocated to direct-care administration,
salaries and wages.
• Medical director fees received an average allocation of 3.4% of each facility’s NPC
increase.
• On average, 1.0% of Municipal Homes’ NPC increase was allocated to staff education.
NPC Funding Increase SurveySigma-3 Policy Research Inc.
13
Supplies and Equipment
The average allocation for “Supplies and Equipment” by Municipal Homes was 15.9% of the
total NPC increase. It breaks down as follows:
• The average allocation to incontinence supplies by Municipal Homes was 13.1% of the
total NPC increase.
• The average allocation to other supplies was 1.8% of the total NPC increase.
• Equipment purchases were allocated an average of 1.0% of the total NPC increase.
Other Expenditures
A number of Municipal Homes reported allocating some or all of their NPC increase to “Other”
expenditure items. Four facilities had spent between 23 and 100% of their increases to offset
costs in their NPC envelope, three noted undefined allocations (ranging between 42 and 70%)
intended to avoid layoffs, and three provided no detail on their ‘other’ allocation. The
remaining six facilities allocated some of their increase to a number of minor items that
accounted for 1 to 8% of the increase.
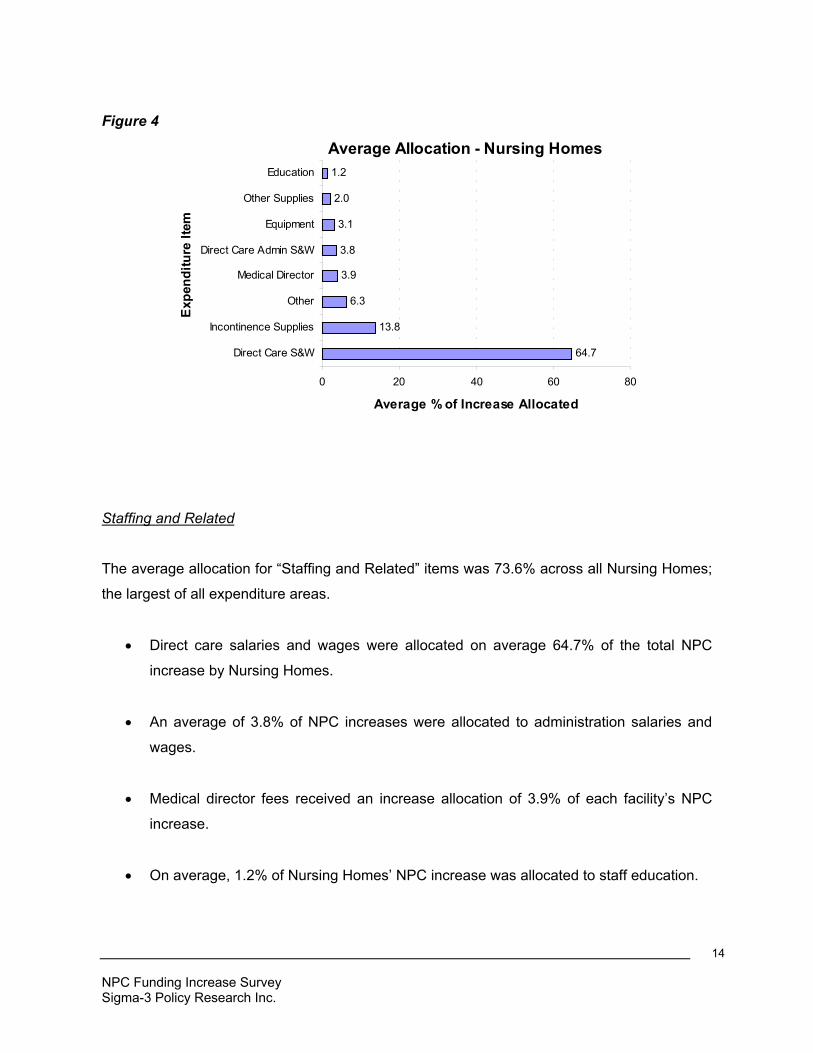
2.1.4 Distribution of Increase – Nursing Homes
Figure 4, below, details the average allocation to each expenditure item for Nursing Homes.
NPC Funding Increase SurveySigma-3 Policy Research Inc.
14
Figure 4
Average Allocation - Nursing Homes
64.7
13.8
6.3
3.9
3.8
3.1
2.0
1.2
0 20 40 60 80
Direct Care S&W
Incontinence Supplies
Other
Medical Director
Direct Care Admin S&W
Equipment
Other Supplies
EducationEx
pend
iture
Item
Average % of Increase Allocated
Staffing and Related
The average allocation for “Staffing and Related” items was 73.6% across all Nursing Homes;
the largest of all expenditure areas.
• Direct care salaries and wages were allocated on average 64.7% of the total NPC
increase by Nursing Homes.
• An average of 3.8% of NPC increases were allocated to administration salaries and
wages.
• Medical director fees received an increase allocation of 3.9% of each facility’s NPC
increase.
• On average, 1.2% of Nursing Homes’ NPC increase was allocated to staff education.
NPC Funding Increase SurveySigma-3 Policy Research Inc.
15
Supplies and Equipment
The average allocation for “Supplies and Equipment” by Nursing Homes was 18.9% of the
total NPC increase. It breaks down as follows:
• The average allocation to incontinence supplies by Nursing Homes was 13.8% of the
total NPC increase.
• The average allocation to other supplies was 2.0% of the total NPC increase.
• Equipment purchases were allocated an average allocation of 3.1% of the total NPC
increase.
Other Expenditures
A number of Nursing Homes also reported allocating some or all of their NPC increase to
“Other” expenditure items. Six facilities had spent between 16 and 100% of their increase to
offset costs in their NPC envelope, three noted undefined allocations (ranging between 13 and
78%) intended to avoid layoffs, and three provided no detail on their ‘other’ allocation.
2.1.5 Allocation of Increase – Observations
• On average, 65.8% of each facility’s increase was allocated to Direct Care S&W;
13.4% was allocated to Incontinence Supplies; and 5.7% to “other” expenditure items.
• Allocation patterns were basically the same across all three facility types. Direct Care
S&W accounted for the largest average allocation in all cases. The average allocation
by Charitable Homes was the largest (69.4%), followed by Municipal Homes (67.5%)
and Nursing Homes (64.7%).
• Incontinence supplies was also the second largest average allocation for all facility
types with Nursing Homes allocating the largest portion of their increase (23.8%)
followed by Municipal Homes (13.1%); and Charitable Homes (12.2%).
NPC Funding Increase SurveySigma-3 Policy Research Inc.
16
• Facility types differed somewhat in the third largest expenditure item. Municipal
Homes and Nursing Homes allocated, on average, 5.8% and 6.3% of their increase to
“Other” expenditure items, respectively. However, Charitable Homes’ third largest
allocation was directed to Administration Salaries and Wages. “Other” expenditure
items were allocated on average only 2.6% of their increase.
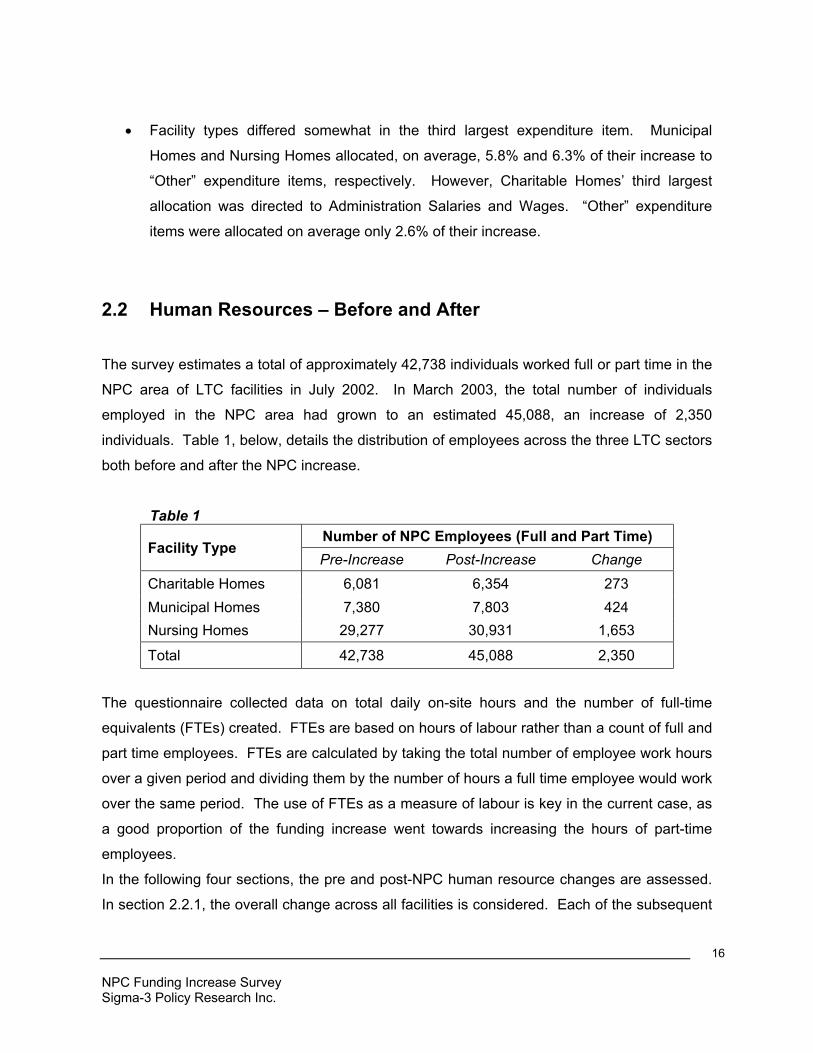
2.2 Human Resources – Before and After
The survey estimates a total of approximately 42,738 individuals worked full or part time in the
NPC area of LTC facilities in July 2002. In March 2003, the total number of individuals
employed in the NPC area had grown to an estimated 45,088, an increase of 2,350
individuals. Table 1, below, details the distribution of employees across the three LTC sectors
both before and after the NPC increase.
Table 1Number of NPC Employees (Full and Part Time)
Facility TypePre-Increase Post-Increase Change
Charitable Homes 6,081 6,354 273Municipal Homes 7,380 7,803 424Nursing Homes 29,277 30,931 1,653
Total 42,738 45,088 2,350
The questionnaire collected data on total daily on-site hours and the number of full-time
equivalents (FTEs) created. FTEs are based on hours of labour rather than a count of full and
part time employees. FTEs are calculated by taking the total number of employee work hours
over a given period and dividing them by the number of hours a full time employee would work
over the same period. The use of FTEs as a measure of labour is key in the current case, as
a good proportion of the funding increase went towards increasing the hours of part-time
employees.
In the following four sections, the pre and post-NPC human resource changes are assessed.
In section 2.2.1, the overall change across all facilities is considered. Each of the subsequent
NPC Funding Increase SurveySigma-3 Policy Research Inc.
17
sections then assesses the change within each of the three LTC facility types (i.e. Charitable
Homes, Municipal Homes and Nursing Homes).
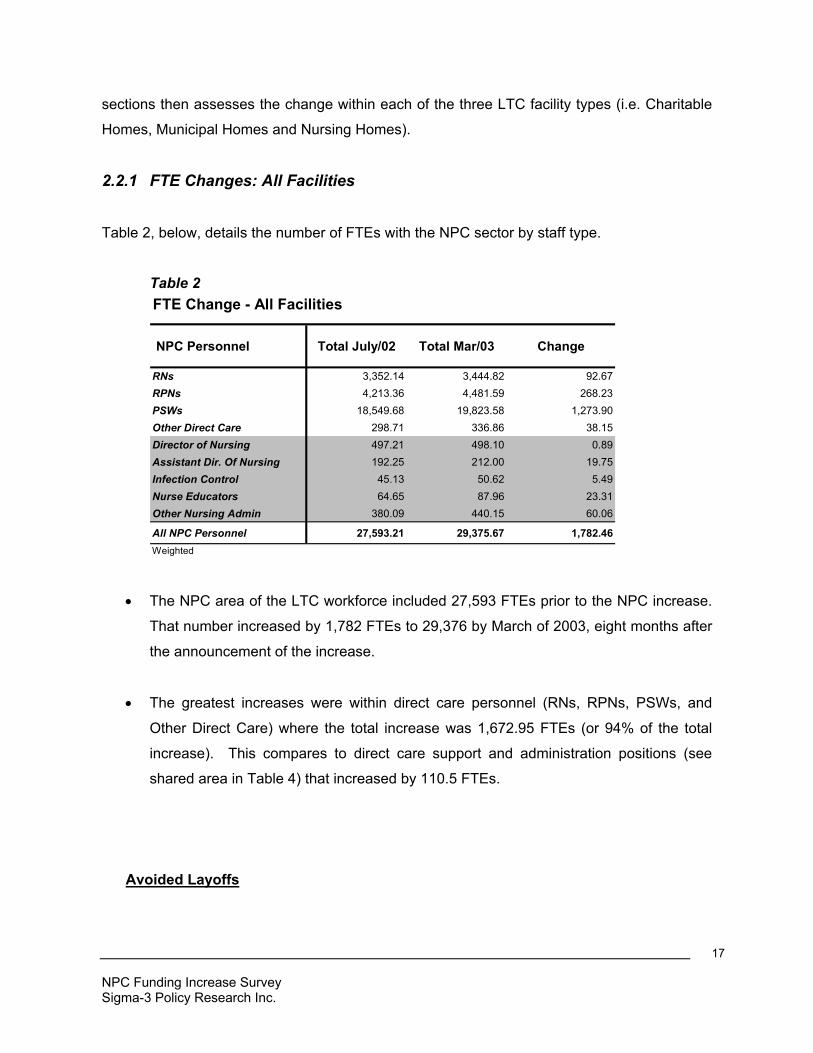
2.2.1 FTE Changes: All Facilities
Table 2, below, details the number of FTEs with the NPC sector by staff type.
Table 2FTE Change - All Facilities
NPC Personnel Total July/02 Total Mar/03 Change
RNs 3,352.14 3,444.82 92.67RPNs 4,213.36 4,481.59 268.23PSWs 18,549.68 19,823.58 1,273.90Other Direct Care 298.71 336.86 38.15Director of Nursing 497.21 498.10 0.89Assistant Dir. Of Nursing 192.25 212.00 19.75Infection Control 45.13 50.62 5.49Nurse Educators 64.65 87.96 23.31Other Nursing Admin 380.09 440.15 60.06
All NPC Personnel 27,593.21 29,375.67 1,782.46Weighted
• The NPC area of the LTC workforce included 27,593 FTEs prior to the NPC increase.
That number increased by 1,782 FTEs to 29,376 by March of 2003, eight months after
the announcement of the increase.
• The greatest increases were within direct care personnel (RNs, RPNs, PSWs, and
Other Direct Care) where the total increase was 1,672.95 FTEs (or 94% of the total
increase). This compares to direct care support and administration positions (see
shared area in Table 4) that increased by 110.5 FTEs.
Avoided Layoffs
NPC Funding Increase SurveySigma-3 Policy Research Inc.
18
Given that the CMI determines a facility’s NPC funding allocation from the Ministry,
facilities plan their NPC staffing needs based on this annual measure. Facilities may
increase or decrease staff according to their CMI. In cases where a facility receives a
lower CMI than the previous year, the facility may at its discretion consider laying off or
reducing hours of its NPC staff as its resident population has lighter care needs.
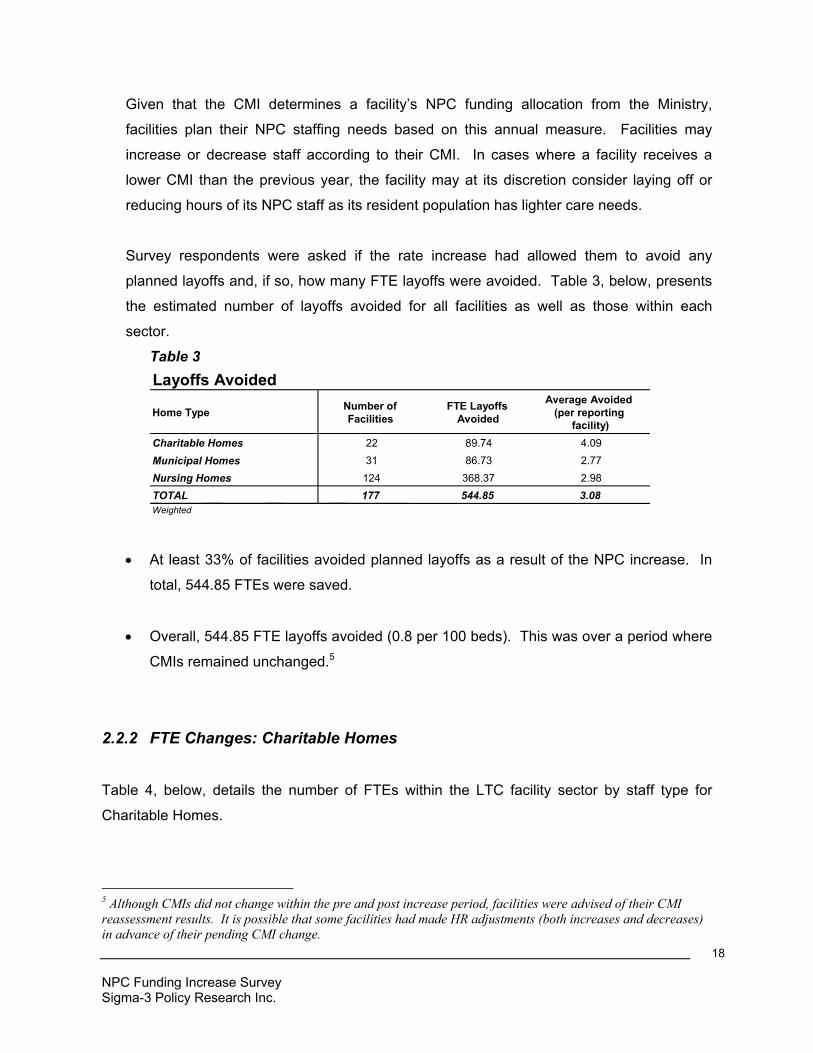
Survey respondents were asked if the rate increase had allowed them to avoid any
planned layoffs and, if so, how many FTE layoffs were avoided. Table 3, below, presents
the estimated number of layoffs avoided for all facilities as well as those within each
sector.
Table 3Layoffs Avoided
Home Type Number ofFacilities
FTE LayoffsAvoided
Average Avoided(per reporting
facility)Charitable Homes 22 89.74 4.09Municipal Homes 31 86.73 2.77Nursing Homes 124 368.37 2.98TOTAL 177 544.85 3.08Weighted
• At least 33% of facilities avoided planned layoffs as a result of the NPC increase. In
total, 544.85 FTEs were saved.
• Overall, 544.85 FTE layoffs avoided (0.8 per 100 beds). This was over a period where
CMIs remained unchanged.5
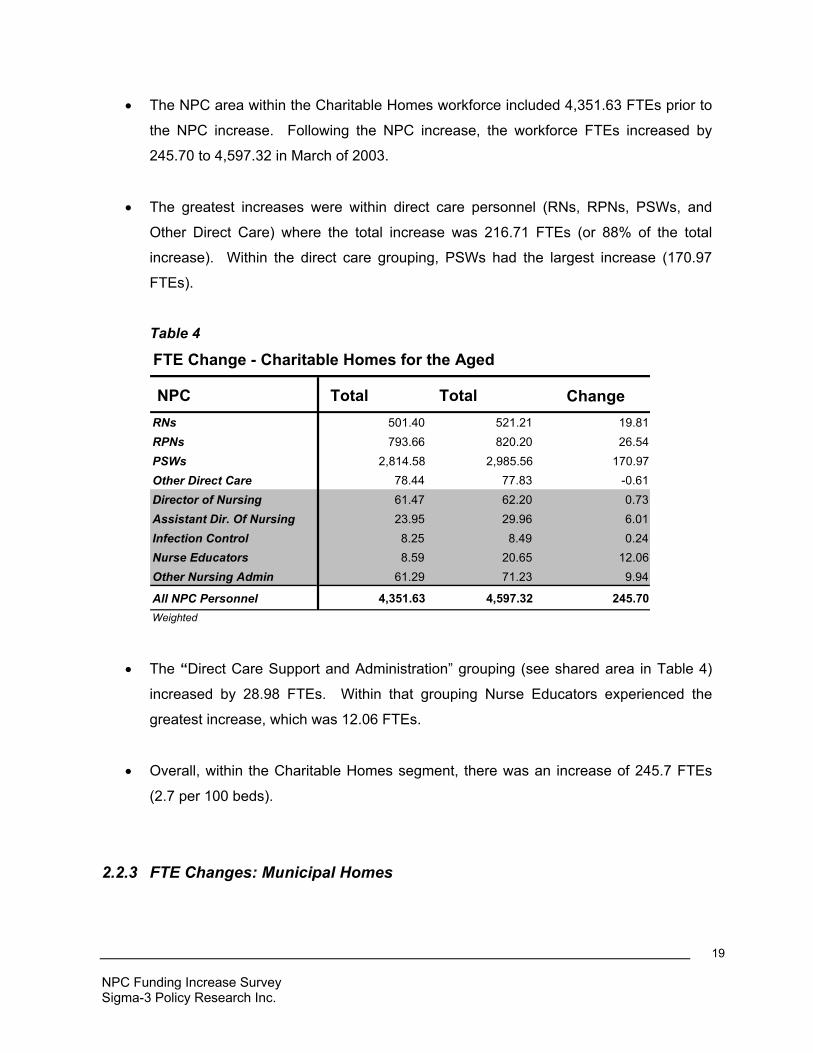
2.2.2 FTE Changes: Charitable Homes
Table 4, below, details the number of FTEs within the LTC facility sector by staff type for
Charitable Homes.
5 Although CMIs did not change within the pre and post increase period, facilities were advised of their CMIreassessment results. It is possible that some facilities had made HR adjustments (both increases and decreases)in advance of their pending CMI change.
NPC Funding Increase SurveySigma-3 Policy Research Inc.
19
• The NPC area within the Charitable Homes workforce included 4,351.63 FTEs prior to
the NPC increase. Following the NPC increase, the workforce FTEs increased by
245.70 to 4,597.32 in March of 2003.
• The greatest increases were within direct care personnel (RNs, RPNs, PSWs, and
Other Direct Care) where the total increase was 216.71 FTEs (or 88% of the total
increase). Within the direct care grouping, PSWs had the largest increase (170.97
FTEs).
Table 4
FTE Change - Charitable Homes for the Aged
NPC Total Total ChangeRNs 501.40 521.21 19.81RPNs 793.66 820.20 26.54PSWs 2,814.58 2,985.56 170.97Other Direct Care 78.44 77.83 -0.61Director of Nursing 61.47 62.20 0.73Assistant Dir. Of Nursing 23.95 29.96 6.01Infection Control 8.25 8.49 0.24Nurse Educators 8.59 20.65 12.06Other Nursing Admin 61.29 71.23 9.94
All NPC Personnel 4,351.63 4,597.32 245.70Weighted
• The “Direct Care Support and Administration” grouping (see shared area in Table 4)
increased by 28.98 FTEs. Within that grouping Nurse Educators experienced the
greatest increase, which was 12.06 FTEs.
• Overall, within the Charitable Homes segment, there was an increase of 245.7 FTEs
(2.7 per 100 beds).
2.2.3 FTE Changes: Municipal Homes
NPC Funding Increase SurveySigma-3 Policy Research Inc.
20
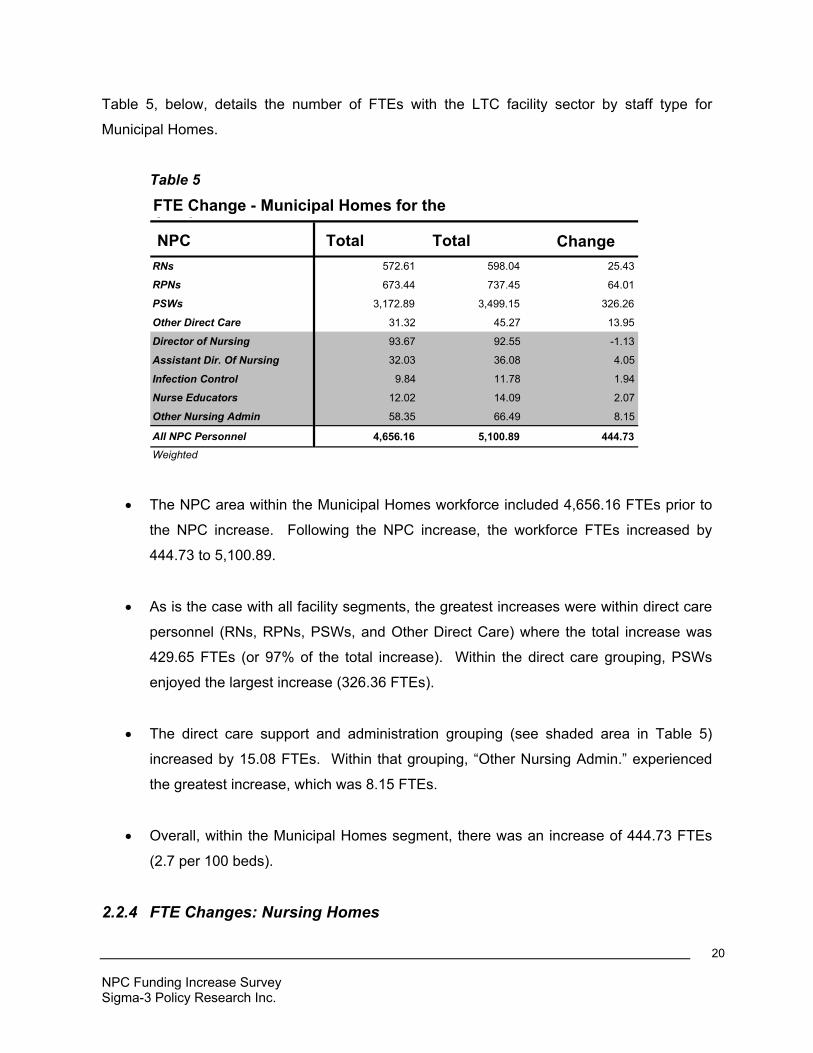
Table 5, below, details the number of FTEs with the LTC facility sector by staff type for
Municipal Homes.
Table 5
FTE Change - Municipal Homes for theA d NPC Total Total ChangeRNs 572.61 598.04 25.43
RPNs 673.44 737.45 64.01
PSWs 3,172.89 3,499.15 326.26
Other Direct Care 31.32 45.27 13.95
Director of Nursing 93.67 92.55 -1.13
Assistant Dir. Of Nursing 32.03 36.08 4.05
Infection Control 9.84 11.78 1.94
Nurse Educators 12.02 14.09 2.07
Other Nursing Admin 58.35 66.49 8.15
All NPC Personnel 4,656.16 5,100.89 444.73Weighted
• The NPC area within the Municipal Homes workforce included 4,656.16 FTEs prior to
the NPC increase. Following the NPC increase, the workforce FTEs increased by
444.73 to 5,100.89.
• As is the case with all facility segments, the greatest increases were within direct care
personnel (RNs, RPNs, PSWs, and Other Direct Care) where the total increase was
429.65 FTEs (or 97% of the total increase). Within the direct care grouping, PSWs
enjoyed the largest increase (326.36 FTEs).
• The direct care support and administration grouping (see shaded area in Table 5)
increased by 15.08 FTEs. Within that grouping, “Other Nursing Admin.” experienced
the greatest increase, which was 8.15 FTEs.
• Overall, within the Municipal Homes segment, there was an increase of 444.73 FTEs
(2.7 per 100 beds).
2.2.4 FTE Changes: Nursing Homes
NPC Funding Increase SurveySigma-3 Policy Research Inc.
21
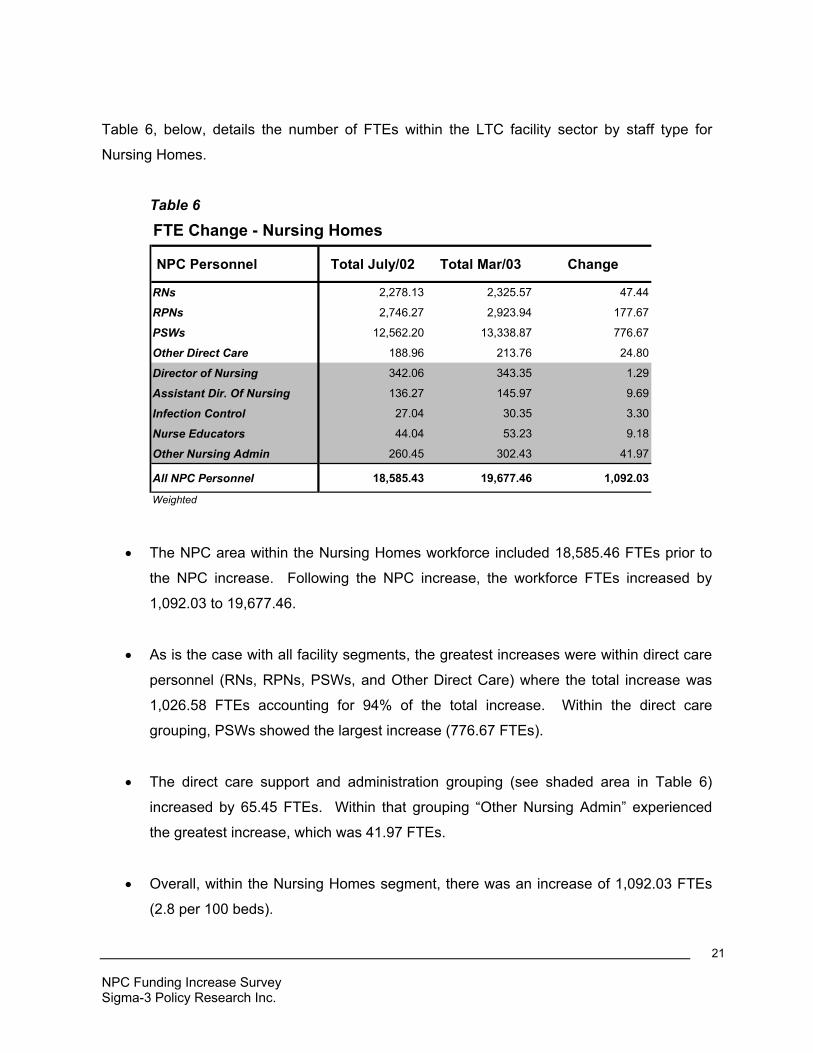
Table 6, below, details the number of FTEs within the LTC facility sector by staff type for
Nursing Homes.
Table 6
FTE Change - Nursing Homes
NPC Personnel Total July/02 Total Mar/03 Change
RNs 2,278.13 2,325.57 47.44
RPNs 2,746.27 2,923.94 177.67
PSWs 12,562.20 13,338.87 776.67
Other Direct Care 188.96 213.76 24.80
Director of Nursing 342.06 343.35 1.29
Assistant Dir. Of Nursing 136.27 145.97 9.69
Infection Control 27.04 30.35 3.30
Nurse Educators 44.04 53.23 9.18
Other Nursing Admin 260.45 302.43 41.97
All NPC Personnel 18,585.43 19,677.46 1,092.03
Weighted
• The NPC area within the Nursing Homes workforce included 18,585.46 FTEs prior to
the NPC increase. Following the NPC increase, the workforce FTEs increased by
1,092.03 to 19,677.46.
• As is the case with all facility segments, the greatest increases were within direct care
personnel (RNs, RPNs, PSWs, and Other Direct Care) where the total increase was
1,026.58 FTEs accounting for 94% of the total increase. Within the direct care
grouping, PSWs showed the largest increase (776.67 FTEs).
• The direct care support and administration grouping (see shaded area in Table 6)
increased by 65.45 FTEs. Within that grouping “Other Nursing Admin” experienced
the greatest increase, which was 41.97 FTEs.
• Overall, within the Nursing Homes segment, there was an increase of 1,092.03 FTEs
(2.8 per 100 beds).
NPC Funding Increase SurveySigma-3 Policy Research Inc.
22
2.2.5 FTE Changes – Observations
• There was an estimated total increase of 1,782.5 FTEs (2.8 FTE per 100 beds) in the
LTC NPC workforce following the NPC increase.
• The different facility types were similar in terms of FTE increases per 100 beds.
Nursing homes had the largest proportionate increase with 2.8 FTEs per 100 beds,
exclusive of avoided layoffs. Municipal and Charitable Homes each had an increase of
2.7 FTEs per hundred beds, exclusive of avoided layoffs.
• The largest proportion of FTE increases within direct care personnel (RNs, RPNs,
PSWs, and Other Direct Care) were found in Municipal Homes where direct care FTEs
accounted for 97% of the total increase. Nursing Homes dedicated 94% of their new
FTEs to direct care, and Charitable Homes dedicated 88% of their FTEs to direct care.
• Also, it is estimated that 544.9 (0.8 per 100 beds) layoffs were avoided as a result of
the increase. The Charitable and Nursing Homes sectors benefited the most In terms
of layoffs avoided, avoiding roughly 1.0 FTE layoff per 100 beds (1.0 and 0.9,
respectively), while only 0.5 FTE per 100 beds were avoided in the Municipal sector.
2.3 Improvements Benefiting Residents
Respondents were asked a qualitative question regarding how the NPC funding increase had
enabled improvements in the quality of care for facility residents.
Approximately 26% mentioned items discussed elsewhere in this report, that is, they noted
increases in staff, staff education, improvements to staff/resident ratios, and the purchase of
incontinence supplies.
Comments have been grouped into the seven categories found in Table 7 below.
NPC Funding Increase SurveySigma-3 Policy Research Inc.
23
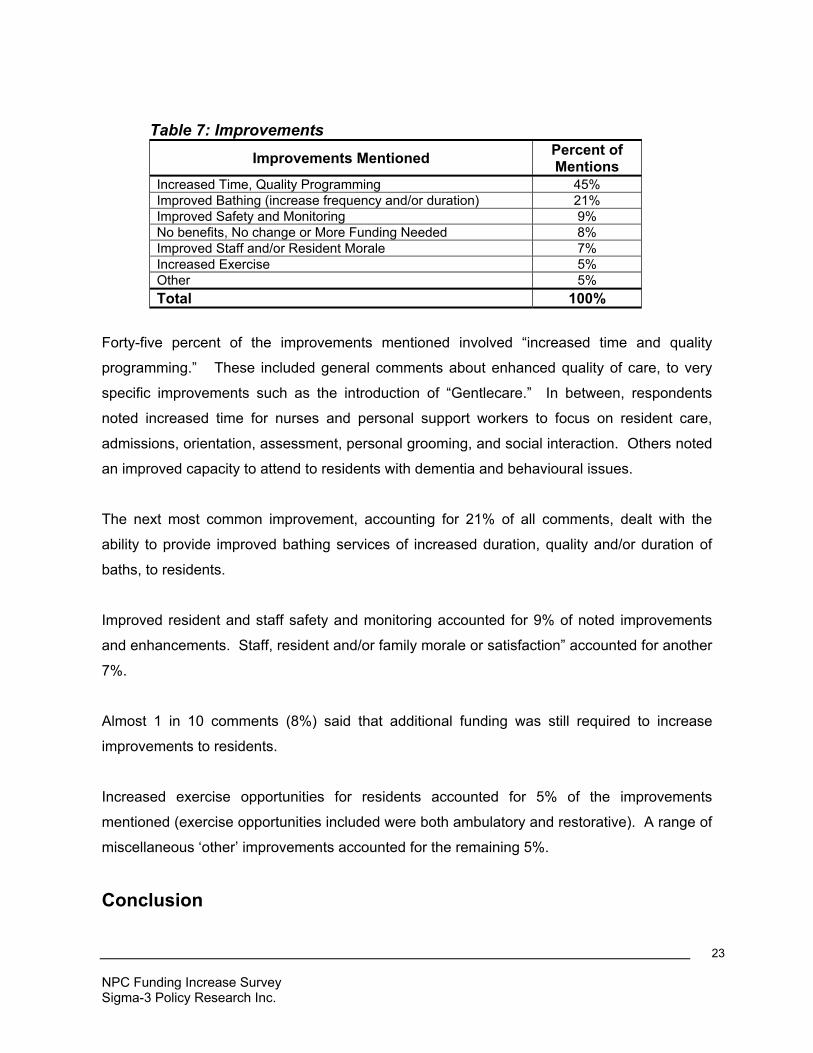
Table 7: ImprovementsImprovements Mentioned Percent of
MentionsIncreased Time, Quality Programming 45%Improved Bathing (increase frequency and/or duration) 21%Improved Safety and Monitoring 9%No benefits, No change or More Funding Needed 8%Improved Staff and/or Resident Morale 7%Increased Exercise 5%Other 5%Total 100%
Forty-five percent of the improvements mentioned involved “increased time and quality
programming.” These included general comments about enhanced quality of care, to very
specific improvements such as the introduction of “Gentlecare.” In between, respondents
noted increased time for nurses and personal support workers to focus on resident care,
admissions, orientation, assessment, personal grooming, and social interaction. Others noted
an improved capacity to attend to residents with dementia and behavioural issues.
The next most common improvement, accounting for 21% of all comments, dealt with the
ability to provide improved bathing services of increased duration, quality and/or duration of
baths, to residents.
Improved resident and staff safety and monitoring accounted for 9% of noted improvements
and enhancements. Staff, resident and/or family morale or satisfaction” accounted for another
7%.
Almost 1 in 10 comments (8%) said that additional funding was still required to increase
improvements to residents.
Increased exercise opportunities for residents accounted for 5% of the improvements
mentioned (exercise opportunities included were both ambulatory and restorative). A range of
miscellaneous ‘other’ improvements accounted for the remaining 5%.
Conclusion
NPC Funding Increase SurveySigma-3 Policy Research Inc.
24
A response rate of 76%, or 412 useable questionnaires, was obtained.
Allocation of Increase
On average, 65.8% of each facility’s increase was allocated to Direct Care salaries andwages; 13.4% was allocated to incontinence supplies; and 5.7% to “other” expenditure items.
HR Impact
The survey estimates a total of 42,738 full or part time individuals in the NPC area of the LTCfacilities workforce in July 2002. In March 2003, the total number of individuals employed inthe NPC area had grown to an estimated 45,088, an increase of 2,350 individuals.
In terms of full-time equivalents (FTE), this translates into an estimated total increase of1,782.5 FTEs in the NPC area of the LTC facilities workforce.
The survey findings indicate that 544.9 FTEs layoffs were avoided.
Improvements in Quality of Resident Care
Forty-five percent of the improvements mentioned involved “increased time and qualityprogramming.” Respondents noted increased time for nurses and personal support workersto focus on resident care, admissions, orientation, assessment, personal grooming, and socialinteraction. Others noted an improved capacity to attend to residents with dementia andbehavioural issues.

NPC Funding Increase SurveySigma-3 Policy Research Inc.
25
Appendix ACover Letter and Survey Questionnaire
NPC Funding Increase SurveySigma-3 Policy Research Inc.
26
NPC Funding Increase SurveySigma-3 Policy Research Inc.
27
Facility Name:
LTC Vendor ID:
July 2002 CMI - 2001
March 2003 CMI - 2002
As of July 2002: (per resident per day)
As of March 2003 (per resident per day)
Education: %
Supplies:
Incontinence %
Other supplies %
Equipment: %
Salaries and Benefits:
Direct Care %
Admin - Nursing Care*
Medical Director Fees: %
Other: % Specify 'other':
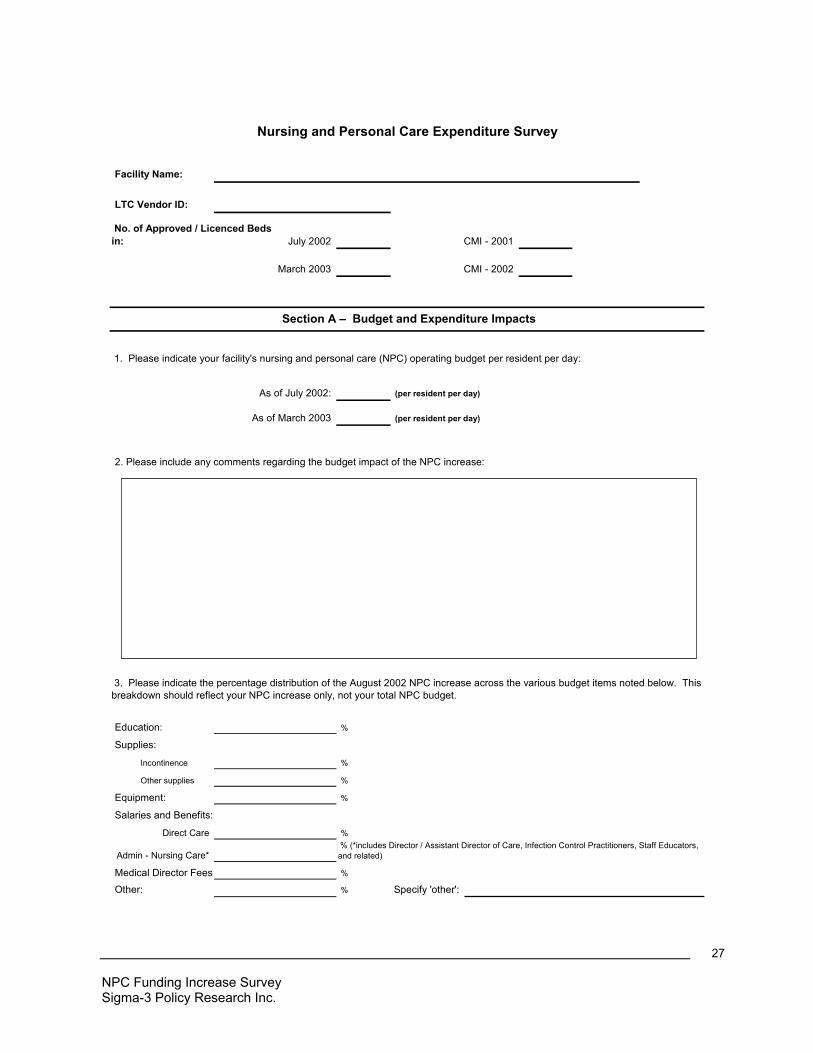
Section A – Budget and Expenditure Impacts
Nursing and Personal Care Expenditure Survey
No. of Approved / Licenced Beds in:
1. Please indicate your facility's nursing and personal care (NPC) operating budget per resident per day:
3. Please indicate the percentage distribution of the August 2002 NPC increase across the various budget items noted below. This breakdown should reflect your NPC increase only, not your total NPC budget.
2. Please include any comments regarding the budget impact of the NPC increase:
% (*includes Director / Assistant Director of Care, Infection Control Practitioners, Staff Educators, and related)
NPC Funding Increase SurveySigma-3 Policy Research Inc.
28
Number of Staff FTE's Total Daily On-site
Hours Number of
Staff FTE's Total Daily On-site Hours
RN
RPN
PSW / Health Care Aides
Other Direct Care
Director of Care / Nursing
Assist. Dir. Of Care / Nursing
Infection Control Practitioner
Staff Educator
Other Admin - Nursing Care
Specify Position:
Yes If Yes, how many FTE's lay-offs were avoided?No
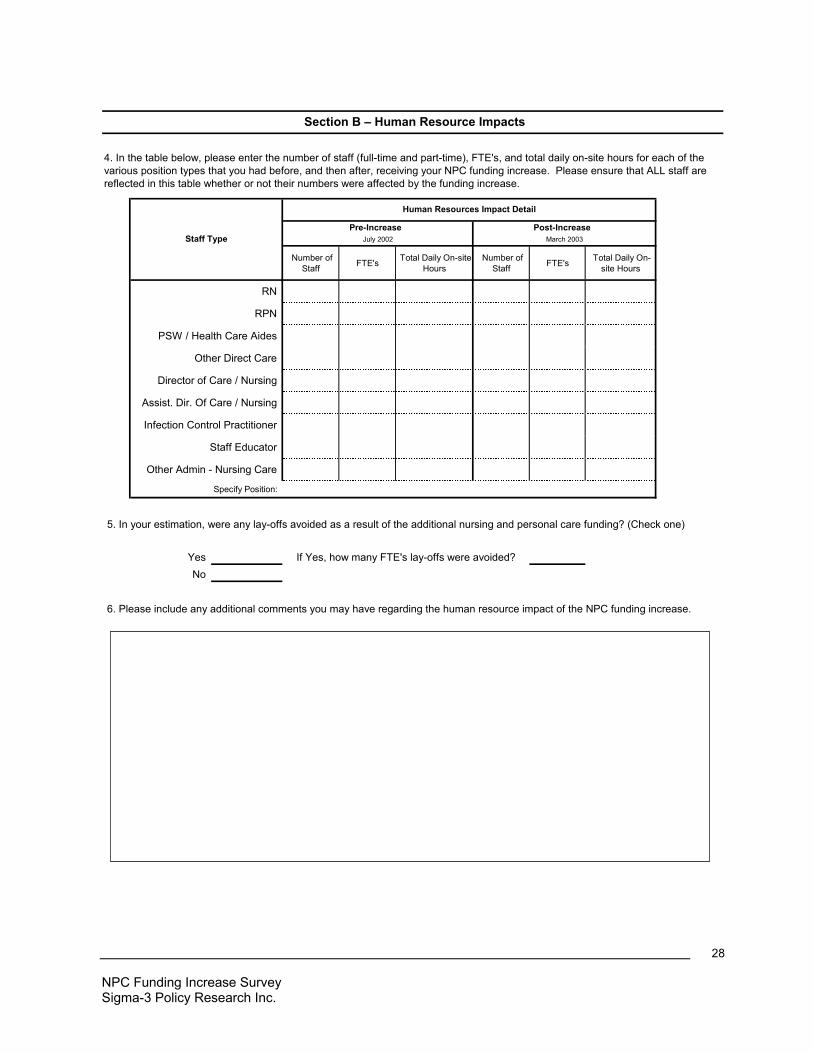
6. Please include any additional comments you may have regarding the human resource impact of the NPC funding increase.
Pre-Increase Post-Increase July 2002Staff Type
Human Resources Impact Detail
March 2003
5. In your estimation, were any lay-offs avoided as a result of the additional nursing and personal care funding? (Check one)
Section B – Human Resource Impacts
4. In the table below, please enter the number of staff (full-time and part-time), FTE's, and total daily on-site hours for each of the various position types that you had before, and then after, receiving your NPC funding increase. Please ensure that ALL staff are reflected in this table whether or not their numbers were affected by the funding increase.
����������������������������������������������
����������������������������������������������
������������������������������������������������������������
����������������������������������������������
��������������������������������������������
��������������������������������������������������������������������������������������������������������������������������������������������������������������������������������������������������������������������������������������������������
��������������������������������������������������������������������������������������������������������������������������������������������������������������������������������������������������������������������������������������������������
��������������������������������������������������������������������������������������������������������������������������������������������������������������������������������������������������������������������������������������������������
��������������������������������������������������������������������������������������������������������������������������������������������������������������������������������������������������������������������������������������������������
����������������������������������������������������������������������������������������������������������������
��������������������������������������������������������
��������������������������������������������������������
��������������������������������������������������������
NPC Funding Increase SurveySigma-3 Policy Research Inc.
29
Completed by:
Name:
Signature:
Position:
E-mail:
Date:
Mail / Paper Questionnaires
Web-based - online questionnaires
E-mail - electronic questionnaires
If you have Internet access please provide the appropriate e-mail address for us to direct future communications.
E-mail:
Sigma-3 Policy Research Inc.244 Dupont StreetToronto, OntarioM5R 1V7
Attn: Dan BuchananTel. (416) 922-5666
e-mail: [email protected]
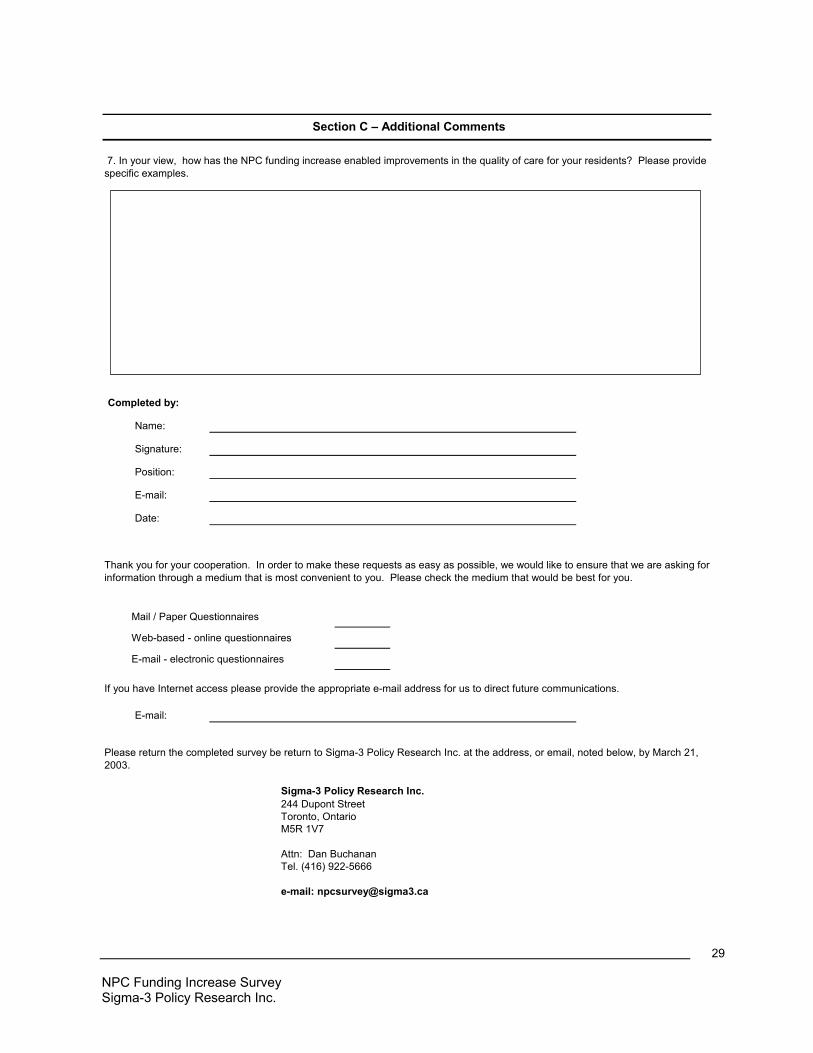
7. In your view, how has the NPC funding increase enabled improvements in the quality of care for your residents? Please provide specific examples.
Section C – Additional Comments
Thank you for your cooperation. In order to make these requests as easy as possible, we would like to ensure that we are asking for information through a medium that is most convenient to you. Please check the medium that would be best for you.
Please return the completed survey be return to Sigma-3 Policy Research Inc. at the address, or email, noted below, by March 21, 2003.

NPC Funding Increase SurveySigma-3 Policy Research Inc.
30
Appendix BTechnical Appendix
NPC Funding Increase SurveySigma-3 Policy Research Inc.
31
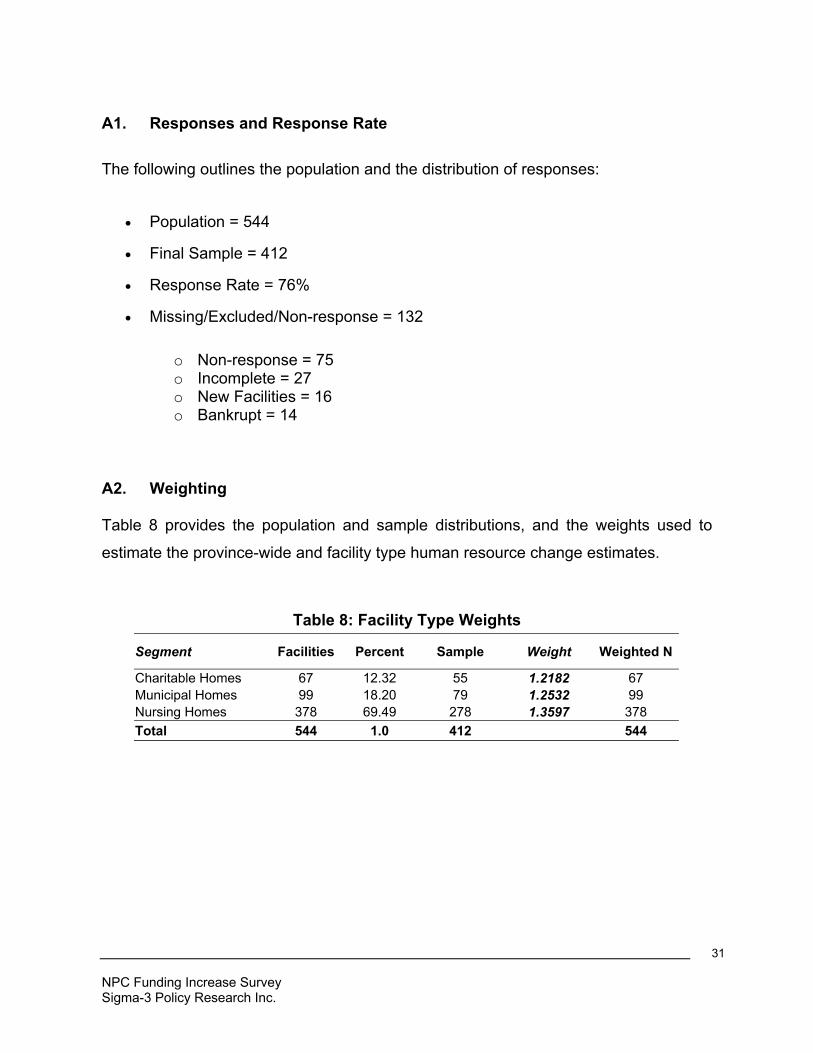
A1. Responses and Response Rate
The following outlines the population and the distribution of responses:
• Population = 544
• Final Sample = 412
• Response Rate = 76%
• Missing/Excluded/Non-response = 132
o Non-response = 75o Incomplete = 27o New Facilities = 16 o Bankrupt = 14
A2. Weighting
Table 8 provides the population and sample distributions, and the weights used to
estimate the province-wide and facility type human resource change estimates.
Table 8: Facility Type Weights
Segment Facilities Percent Sample Weight Weighted N
Charitable Homes 67 12.32 55 1.2182 67Municipal Homes 99 18.20 79 1.2532 99Nursing Homes 378 69.49 278 1.3597 378Total 544 1.0 412 544
NPC Funding Increase SurveySigma-3 Policy Research Inc.
32
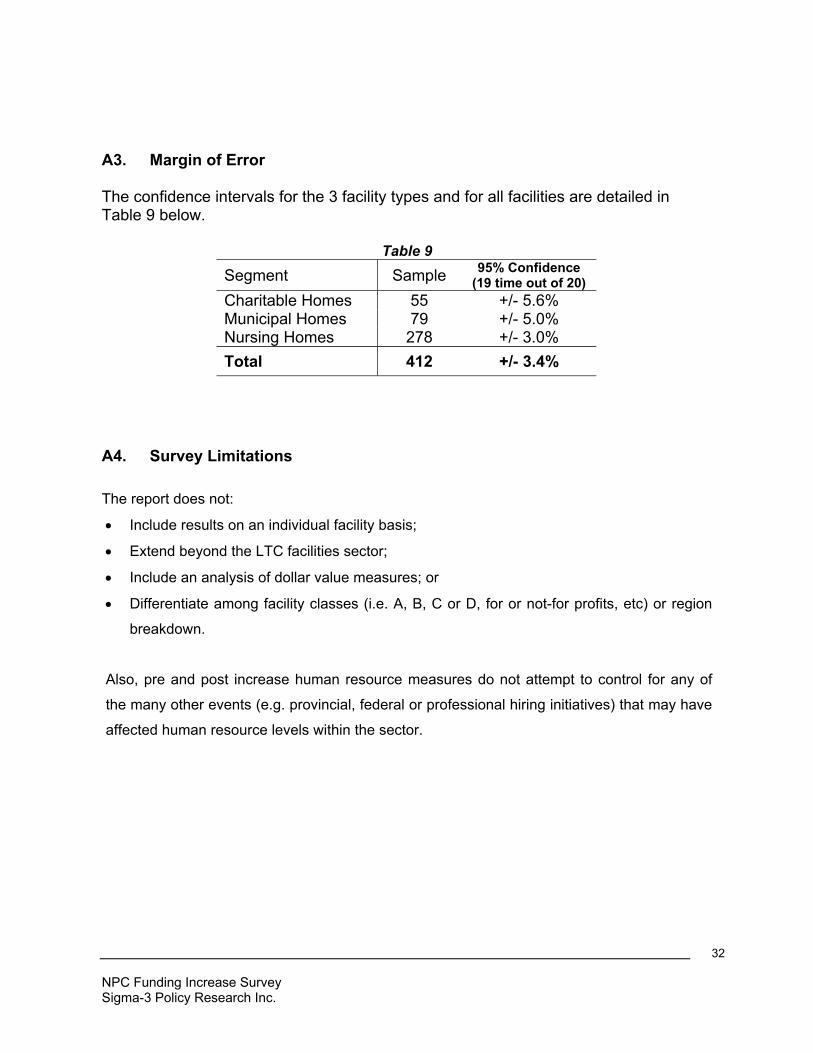
A3. Margin of Error
The confidence intervals for the 3 facility types and for all facilities are detailed inTable 9 below.
Table 9Segment Sample 95% Confidence
(19 time out of 20)Charitable Homes 55 +/- 5.6%Municipal Homes 79 +/- 5.0%Nursing Homes 278 +/- 3.0%Total 412 +/- 3.4%
A4. Survey Limitations
The report does not:
• Include results on an individual facility basis;
• Extend beyond the LTC facilities sector;
• Include an analysis of dollar value measures; or
• Differentiate among facility classes (i.e. A, B, C or D, for or not-for profits, etc) or region
breakdown.
Also, pre and post increase human resource measures do not attempt to control for any of
the many other events (e.g. provincial, federal or professional hiring initiatives) that may have
affected human resource levels within the sector.