Embed Size (px)
Citation preview
NUTRITION IN HAITI: AN ANALYSIS OF PROBLEMS AND SOLUTIONS
Team members:
Nancy MOCK, Dr.P.H. Marie-Christine BERTRAND
Imma PIAR) Claire SEGALA, M.D.
Daniel VERNA, M.D., M.P.H.
Nutrition Communication ProjectAcademy for Educational Development
1255 23rd Street, N.W. Washington, D.C. 20037
September 1%8
Carried out under contract number DAN-51 13-Z-00-7031-00 with funding fromUSAID/Haiti: PI/U No. 521-0000.3-70162. Nutrition Education and Social MarketingField Support Project (936-5113)
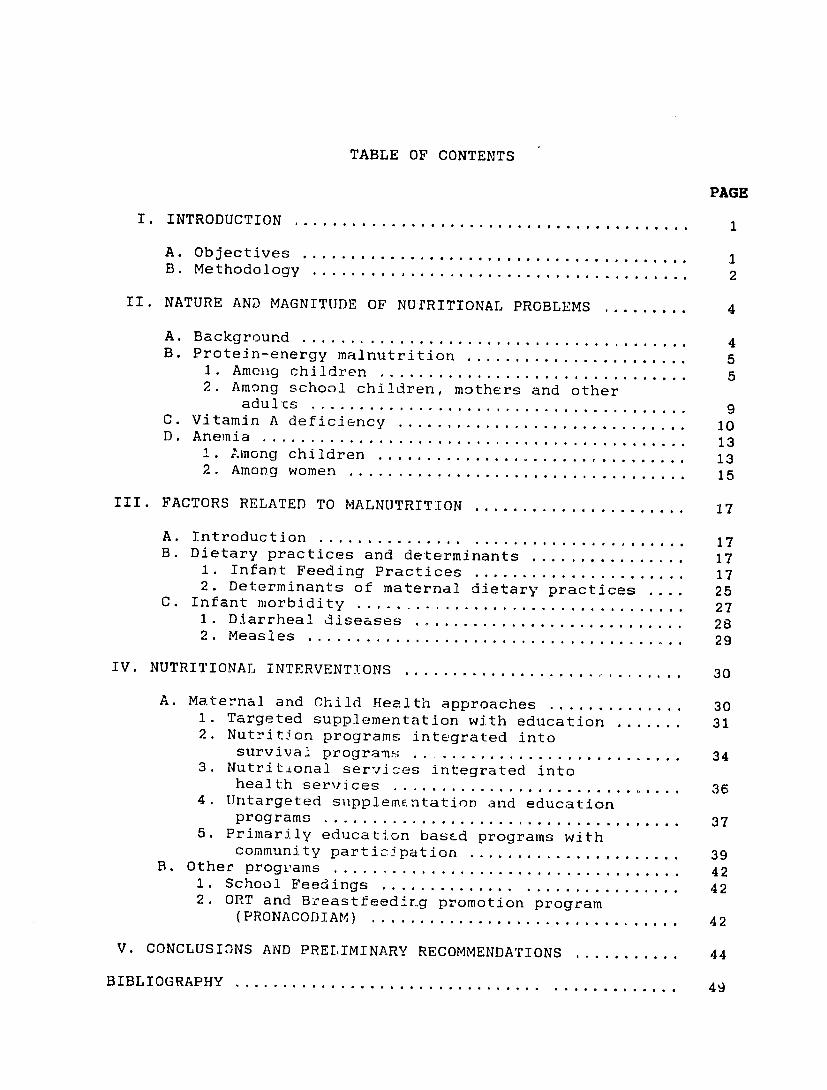
TABLE OF CONTENTS
PAGE
I. INTRODUCTION .......................................... 1
A . Objectives ........................................ 1 B. Methodology ..................................... 2
II. NATURE AND MAGNITUDE OF NUTRITIONAL PROBLEMS ......... 4
A . Background ........................................ 4 B. Protein-energy malnutrition ........................... 5
1. Among children ................................ 5 2. Among school children, mothers and other
9adults ....................... .. .............. C. Vitamin A deficiency .............................. 10 D . Anemia ............................................ 13
1. Among children ................................ 13 2. Among women ................................... 15
III. FACTORS RELATED TO MALNUTRITION .......................... 17
A . Introduction ............... ...................... 17 B. Dietary practices and determinants ................... 17
1. Infant Feeding Practices .......................... 17 2. Determinants of maternal dietary practices .... 25
C. Infant morbidity ....... .......................... 27 1. Diarrheal diseases ............................ 28 2 . Measles ... .................................... 29
IV. NUTRITIONAL INTERVENTIONS ............................. 30
A. Maternal and Child Health approaches ................. 30 1. Targeted supplementation with education ....... 31 2. Nutrition programs integrated into
survival programs ................................. 34 3. Nutritional services integrated into
health services .............................. 36 4. Untargeted supplementatioD and education
programs ..................................... 37 5. Primarily education bascd programs with
community participation .......................... 39 B. Other prog'ams .................................... 42
1. School Feedings .............. ................ 42 2. ORT and Breastfeedirg promotion program
(PRONACODIAM) ................................ 42
V. CONCLUSIONS AND PRELIMINARY RECOMMENDATIONS ............. 44
BIBLIOGRAPHY. ............................................ 49

ANNEXES
I. Instrument for Data Collection at the Level of Field Manager
II. Case Study Questionnaire
III. Schedule of Interviews and Visits
IV. Cz'-e Study Results
TABLES AND FIGURES

I. INTRODUCTION
The Academy for Educational Development's Nutrition Communication Project carried out a Nutrition Assessment between
August and September 1988 with funding from the USAID Mission.
A. OBJECTIVES
The major goal of the Nutrition Assessment was to provide a necessary description and analysis both of nutritional problems in Haiti and also of the intervention activities that have already been tried to facilitate effective programming in the nutrition sector, especially in the area of nutrition education programs. While the original scope of work stressed the assessment of nutritional problems and their causes, the USAID/Haiti Mission was particularly concerned with the analysis of lessons learned from several decades of highly diverse nutition program activities. The output of phase one is a document that assesses these issues and also provides a list of recommendations as to the types of nutrition sector activities that should be supported by USAID and other donors. More specifically, the document addresses the following objectives: 1) To describe the major nutritional deficiencies in Haiti and
to document the magnitude of these deficiencies; also, to identify subpopulations that are particularly at risk of
various problems.
2) To describe major factors torelated these nutritional
problems with specific focus on determinants that are
susceptible to educational interventions. 3) To assess related constraints to behavioral change: i.e.
socio-economic and attitudinal variables.
4) To describe the various types of nutrition and educational
intervention programs that have been undertaken in Haiti. 5) To develop a framework for assessing these programs. 6) To identify specific educational/growth monitoring/promotion
(GM/P) programs that should be studied as possible
rep]icable approaches.
7) To identify gaps or problems in intervention strategies that might feasibly be filled by USAID's future nutritional
sector activities. These gaps, again are focused theon
educational solutions.
B. METHODOLOGY
The methodology used was a combination of literature
review, interviews with key technical and program experts and
managers, and on-site qualitative assessment of selected project
activities. A list of individuals and organizations contacted is
included in the appendices. Other annexes provide methodologic
details and specific findings from the field studies. A standardized approach was developed for the managers' interviews
(please see Annex I) and also for the rapid assessment of ongoing
field activities (please see Annex II).
The consultant team consisted of Nancy Mock, team leader; Claire Segala, assistant leader; Daniel Verna (an MD, MPH nutrition doctoral student at Cornell); Imma Piard (a woman who
has worked quite extensively with NGO's in Haiti); and Marie-Christine Bertrand (a communication specialist who currently
works with INSHAC-Haitian Community Health Institute). The team !4as organized as follows: Mock was in charge of overall organization of the team as well as developing the methods and
framework and completing a preliminary review of studies and
programs. Segala continued Mock's work and was to focus more heavily on the epidemiologic aspects of the assignment. Verna
assisted Segala in a largely epidemiologic capacity. He helped
to gather and analyze relevant data as well as to draft certain
sections of the report. Bertrand and Piard were largely involved
in the assessment of programs. They assisted in the development
of the program assessment methodology and also completed several
program manager and on-site manager interviews. All team members
participated in several program manager interviews in order to approximnately standardize the approach to information collection.
2
The last part of this Assessment, consisting of site visits, manager interviews, observations, and some informal testing of personnel and mothers' nutrition knowledge is still ongoing.
Organization-of-the Report A few words about this report are in order. Due to time
constraints, in the first section only the three major
nutritional deficiencies in at-risk groups have been considered:
protein-energy malnutrition, vitamin A deficiency and nutritional
anemia. These are, by far, the most important nutritional
problems in Haiti both in terms of number of people affected and
seriousness of functional consequences. In the second section devoted to malnutrition determinants, emphasis has been given to
infant feeding practices (essentially breastfeeding and weaning) and their determinants. It is clear that more investigation is
needed of pre-schoolchildren and other groups. The section on morbidity focuses only on the major illnesses related to
nutritional status.
The third section makes an attempt to describe the five identified models of nutritional interventions directed towards
pre-school children which are currently operating in Haiti.
3

II. NATURE AND MAGNITUDE OF NUTRITIONAL PROBLEMS
A. BACKGROUND
Nutritional deficiencies are among Haiti's most serious
public health problems. In 1985, it was believed that 75 percent
of all deaths among children under age five were associated with
or caused by malnutrition (97). A few previous studies support
this. In Petit Goave, malnutrition was responsible for the deaths
of 33 percent of children one to four years of age in 1977 (138).
At Hospital Albert Schweitzer it was the principal cause of 31
percent of deaths recorded in 1979-80 and was the most frequent
primary diagnosis among children in the one to four year-old (71
percent) and the five to fourteen year-old (35 percent) age
groups (19) who died in the pediatric services of the hospital.
Protein Energy Malnutrition, Nutritional Anemia and Vitamin
A deficiency are the most important nutritional problems
(90,129). Other deficiencies have also been documented including
riboflavin (1!3) and iodine (121).
The level of protein energy malnutrition is among the
highest in the Americans. As elsewhere, however, the most
nutritionally vulnerable groups in the Haitian population are the
underprivileged pre-school children and pregnant and lactating
women (30 percent of the Haitian population live under the
threshold of absolute poverty). Based on the 1982 census, Table
1.1 shows the estimated numbers of pre-schoolers, and pregnant
and lactating women in Haiti:
TABLE 1.1.
Estimated Numbers of Children Less than 5 Years, and Pregnant and Lactating Women in Haiti
1988 1989 1990
pre-schoolers (< 5 years) 828,806 852,857 866,665 pregnant women 287,319 296,003 300,443 lactating women 132,609 136,617 138,666 total population 5,525,375 5,692,380 5,777,766
sources : IHS, DHFN
4

According to the 1982 census, children under five years represent 15 percent of the total population. Some 73.3 percent
of them live in rural areas and 11.1 percent in the metropolitan
region (148). The remainder live in other urban &reas.
B. PROTEIN ENERGY MALNUTRITION
1. AMONG CHILDREN
a. National overview
Data from nutrition surveys conducted between
1958 and 1976 indicated that between 24 and 52 percent of
children aged 0 to 6 years were malnourished at the second and
third degree, according to Gomez's index of weight for age (80).
The 1978 National Nutritional Survey (NNS), the only
national level nutritional assessment (37, 80), provided the most
detailed evidence of the severity of the problem. This survey
revealed that almost three-quarters of Haitian children under
five years were undernourished, with approximately 30 percent
suffering moderate or severe malnutrition (second and third
degree Gomez classification). Further, 6.0 percent of the 5353
children examined were wasted (weight for height value less than
80 percent of the NCHS/CDC reference median), and 26.6 percent
were stunted (height for age value less than 90% of the reference
median). Bilateral pedal oedema was found among almost three
percent of the children suggesting both protein and energy
deficiency.
Assuming that no major change has occurred since the survey,
a national overview of the malnutrition problem would be as
follows:
5
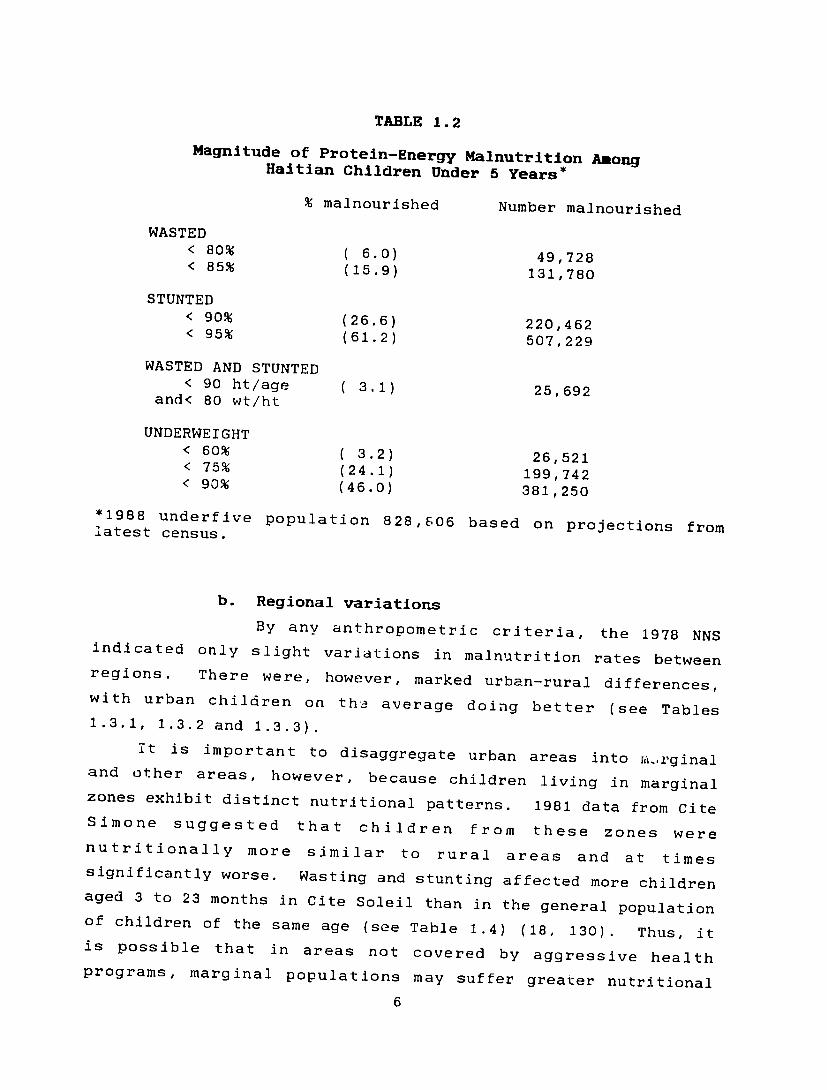
TABLE 1.2
Magnitude of Protein-Energy Malnutrition AnongHaitian Children Under 5 Years*
% malnourished Number malnourished
WASTED < 80% (6.0) 49,728< 85% (15.9) 131,780
STUNTED < 90% (26.6) 220,462< 95% (61.2) 507,229
WASTED AND STUNTED < 90 ht/age ( 3.1) 25,692
and< 80 wt/ht
UNDERWEIGHT < 60% ( 3.2) 26,521< 75% (24.1) 199,742< 90% (46.0) 381,250
*1988 underfive population 828,606 based on projections from latest census.
b. Regional variations
By any anthropometric criteria, the 1978 NNS indicated only slight variations in malnutrition rates between regions. There were, however, marked urban-rural differences, with urban children on averageth, doing better (see Tables 1.3.1, 1.3.2 and 1.3.3).
it is important to disaggregate urban areas into ii,.rginal and other areas, however, because children living in marginal zones exhibit distinct nutritional patterns. 1981 data from Cite Simone suggested that children from these zones were nutritionally more similar to rural areas and at times significantly worse. Wasting and stunting affected more children aged 3 to 23 months in Cite Soleil than in the general population of children of the same age (see Table 1.4) (18, 130). Thus, it is possible that in areas not covered by aggressive health programs, marginal populations may suffer greater nutritional
6
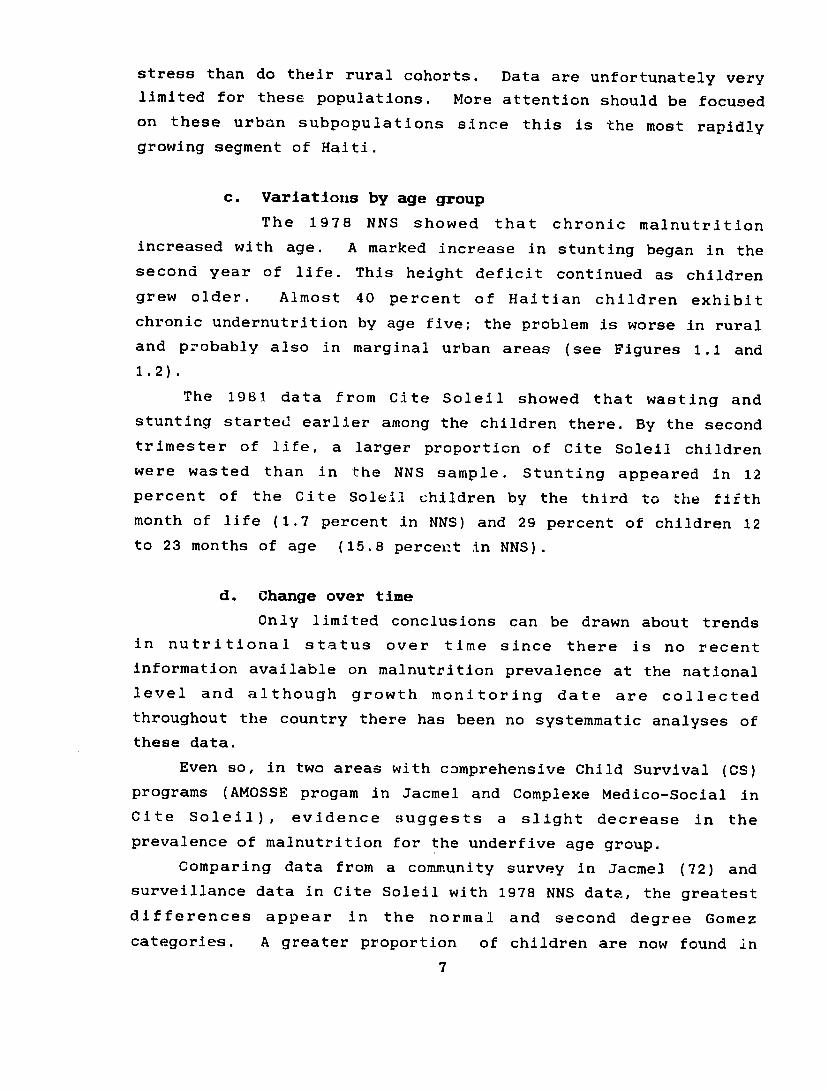
stress than do their rural cohorts. Data are unfortunately very limited for these populations. More attention should be focused on these urban subpopulations since this is the most rapidly
growing segment of Haiti.
c. Variations by age group
The 1978 NNS showed that chronic malnutrition
increased with age. A marked increase in stunting began in the second year of life. This height deficit continued as children
grew older. Almost 40 percent of Haitian children exhibit
chronic undernutrition by age five; the problem is worse in rural
and probably also in marginal urban areas (see Figures 1.1 and
1.2).
The 1981 data from Cite Soleil showed that wasting and stunting started earlier among the children there. By the second
trimester of life, a larger proportion of Cite Soleil children were wasted than in the NNS sample. Stunting appeared in 12 percent of the Cite Solell children by the third to the fifth
month of life (1.7 percent in NNS) and 29 percent of children 12
to 23 months of age (15.8 percent in NNS).
d. Change over time
Only limited conclusions can be drawn about trends
in nutritional status over time since there is no recent information available on malnutrition prevalence at the national level and although growth monitoring date are collected
throughout the country there has been no systemmatic analyses of
these data.
Even so, in two areas with comprehensive Child Survival (CS) programs (AMOSSE progam in Jacmel and Complexe Medico-Social in Cite Soleil), evidence suggests a slight decrease in the
prevalence of malnutrition for the underfive age group.
Comparing data from a community survey in Jacmel (72) and surveillance data in Cite Soleil with 1978 NNS data, the greatest
differences appear in the normal and second degree Gomez
categories. A greater proportion of children are now found in
7

the normal category and fewer in the second degree category. However, the proportion of children with severe malnutrition has
not significantly changed.
TABLE 1.5
Nutritional Status of Children under Five Years
(1978 NNS national and West region and 1987 community survey in Jacmel)
normal gomezl gomez2 gomez3
Haiti 1978 26.8 46.0 24.1 3.2 West 1978 26.8 47.2 23.4 2.7 Jacmel 1987 54.3 36.0 7.6 2.1
TAELE 1.6
Nutritional Status of Children Under Five Years in Cite Soleil 1984-1987
(Data are from nutrition surveillance activities; these figures represent weighings and not number of children)
1984 1985
normal 13841 (37%) 13841 (41.5%)gomezi 12248 (36.4%) 12248 (36.7%)gomez2 6452 (23.9%) 6452 (19.3%)gomez3 818 (2.7%) 818 (2.5%)
Total 20965 33359
1986 1987
normal 14629 (43.1%) 19268 (46.5%)gomezl 12427 (36.7%) 14240 (34.4%)gomez2 5974 (17.6%) 6331 (15.3%)gomez3 881 (2.6%) 1554 (3.8%)
Total 33911 41393
Regarding kwashiorkor, no recent systemmatic and comparable information is available; however, limited data and anecdotal information from several health professionals interviewed
suggests that the situation has been improving since 1958. In
1958, Jelliffe found that seven percent of the children in a
3
community survey to have kwashiorkor(90). The 1978 NNS found three percent. In 1981, Baer and Rhode found less than one percent oedema in rural northern Haiti(12). These surveys,
however, were undertaken at different times of the year. in addition, different sampling approaches and methods were used.
2) AMONG SCHOOLCHILDREN, MOTHERS AND OTHER ADULTS
The deleterious effect of malnutrition is clearly continuing through and beyond childhood but little information is actually available on the nutritional status of schoolchildren
and adults. The only study of major importance, conducted by Sebrell in 1958, showed that more than 50 percent of 3113 schoolchildren and adults were below 90 percent of the American or English reference (121). It found weight and height deficits
in youngsters indicative of past and current malnutrition effects (120). More recently (1985), using the Checchi weight dispersion measure (WDM) as an indicator of current nutritional status,
Gotten (52) found prevalence rates of wasting reaching 21.9 percent for schoolchildren participating in schoolfeedingI
programs and 26.6 percent for those not participating (see Table
1.7).
Examining skinfold thickness, the Sebrell study also found
that Haitian women, during their first two decades of life, followed the same pattern as the American reference population.
However, skinfold thickness decreased significantly thereafter (see Figure 1.3); this would suggest greater use of women's fat
reserve during their reproductive life and no replacement.
Maternal nutritional status was studied more recently in Cite Soleil. The average height and weight was found to be 5 feet
2 inches and 112 pounds. Teenagers in Cite Soleil reached 86 percent of HANES median weight/height; thereafter, there was a general decline so that, by the time they were thirty years of age, they were only at 75 percent of the reference median. In contrast to US women, who tend to have over 30 percent total body fat at every age over 30, women in Cite Soleil remained under 30 percent total body fat as they grew older (see Table 1.8).
9
Perhaps the low calorie intake combined with hard work, frequent
child-bearing and breastfeeding prevented them from adding body
fat and, as Sebrell data indicated, this situation may even add a
greater burden to their meager fat store.
The link between maternal nutritional status and low birth weight has not been clearly established in Haiti. Nevertheless,
low weight newborn babies (<2.5 kg) are seen frequently in
Haitian maternities. Data collected in the "University Hospital" in Port au Prince indicated a rate of 18 percent, and the rate
has remained stable in Cite Soleil since 1980 at around 12
percent (Dr. Boulos, personal communication).
C. VITAMIN A DEFICIENCY
Vitamin A deficiency is another important nutritional
problem in Haiti. It is thought to be the major cause of
childhood binocular blindness. Recent epidemiologic studies in
Asia have also shown a link between vitamin A deficiency and an
increase in mortality and morbidity among children.
The prevalence and geographical distribution of Xerophthalmia was studied in Haiti in 1975 (127). The nationwide
sample of 5589 children zero to six years of age indicated the extent of the problem. For conjunctival xerosis a prevalence rate
of 9.7/1000 was found while the rate for corneal scars(opacities)
was 2.5/1000.
Corneal lesions led to monocular blindness in 38 percent of
the cases and total blindness in 27 percent . The prevalence rate of corneal opacities was extremely high (8.1/1000) in the
northern part of the country (North, North-West, North-East,
Artibonite) while it was only 1.2/1000 in the southern part. A somewhat higher rate was to be expected since the north is the
poorest region of the country. This excessively high rate was, however, probably due in large part to a drought that struck that year during the agricultural season prior to the survey.
The specific age prevalence rate in the north was as follows:
10

TABLE 1.9
age no. of cases rate/l000
0 0 1 1 2.4 2 3 6.7 3 4 10.0 4 4 10.6 5 3 11.5 6 7 25.6
Based on these survey findings the authors of the survey predicted 345 surviving casesnew of corneal destruction including 94 cases of bilateral blindness per year among Haitian
children.
In response to the problem, a program to distribute vitamin A capsules (200,000 UI) to andill malnourished pre-school children and lactating mothers was initiated in 1976. A second ocular survey was conducted three years later (128) among a sample of 5680 children in the northern part of the country (12 clusters had been visited in 1975). This second study found a marked improvement: the prevalence rate for conjunctival xerosis
was 0.52/1000
While the distribution program probably had an impact it is difficult to assess to what extent it was actually responsible for the dramatic improvement. First, only children from 9.4 percent of the families interviewed reported receiving vitamin A capsules. Furthermore,in contrast to the drought conditions of 1975 when the first survey was effected, during the second survey in 1979 an above average rainfall was registered in the North. Another confounding factor was the distribution in the same area of powdered milk and milk substitutes fortified with vitamin A during this period. Thus, differences in werediet probably responsible in part for the different findings of these two
surveys.
Consumption surveys also have found an inadequacy in vitamin A intake and wide seasonal variations, with a peak in September
11
and a drop from October to March. It is also of interest to note that while vitamin A-rich foods are produced in many
coummunities, they are not consumed (37).
Vitamin A deficiency is associated with protein energy malnutrition. Brown (36) observed in a town near Grand Riviere du Nord, that only 5 percent of normal children had corneal lesions (no specific diagnosis was made) compared to 15 percent of children with third degree malnutrition. It is expected that Vitamin A deficiency is particularly exacerbated by protein deficiency because the demandsof high protein for its
metabolism.
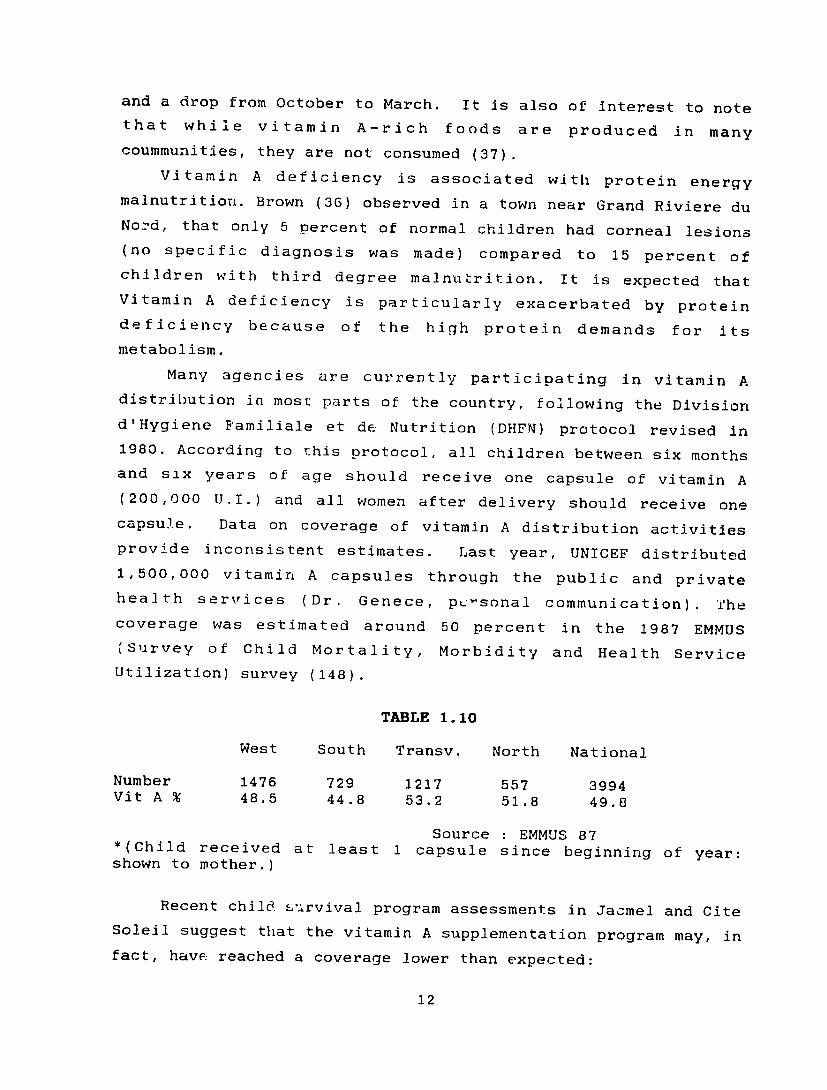
Many agencies are currently participating in vitamin A distribution in most parts of the country, following the Division d'Hygiene Bamiliale et de Nutrition (DHFN) protocol revised in 1980. According to this protocol, all children between six months and six years of age should receive one capsule of vitamin A (200,000 U.I.) and all women after delivery should receive one capsule. Data coverage ofon vitamin A distribution activities provide inconsistent estimates. Last year, UNICEF distributed
1,500,000 vitamin A capsules through the public and private health services (Dr. Genece, pc-sonal communication). The coverage was estimated around 50 percent in 1987the EMMUS (Survey of Child Mortality, Morbidity and Health Service
Utilization) survey (148).
TABLE 1.10
West South Transv. North National
Number 1476 1217 3994729 557 Vit A % 48.5 44.8 53.2 51.8 49.8
Source : EMMUS 87*(Child received at least 1 capsule since beginning of year: shown to mother.)
Recent child. survival program assessments in Jacmel and Cite Soleil suggest that the vitamin A supplementation program may, in fact, have reached a coverage lower than expected:
12
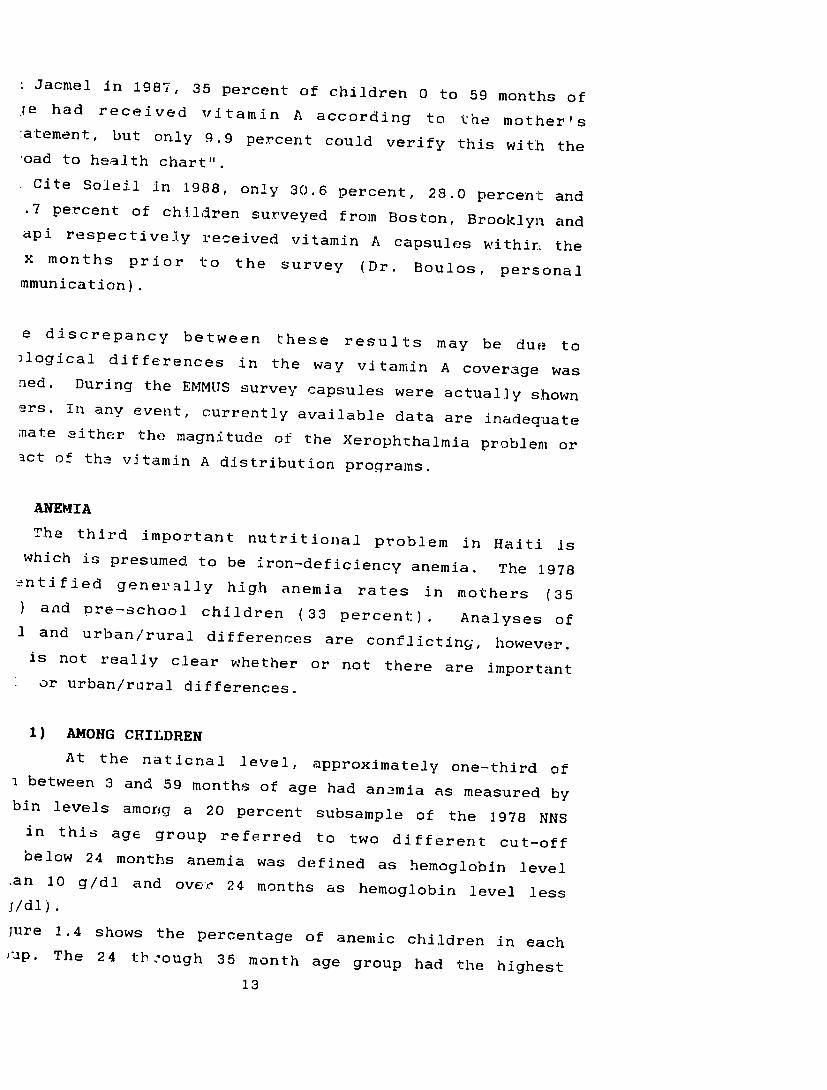
Jacmel in 1987, 35 percent of children 0 to 59 months of Je had received vitamin A according to the mother's :atement, but only 9.9 percent could verify this with the ,oad to health chart". Cite Soleil in 1988, only 30.6 percent, 28.0 percent and .7 percent of children surveyed from Boston, Brooklyn and api respectively received vitamin A capsules within, the x months prior to the survey (Dr. Boulos, personal mmunicaticn).
e discrepancy between these results may be due to )logical differences in the way vitamin A coverage was ned. During the EMMUS survey capsules were actually shown ers. In any event, currently available data are inadequate mate either the magnitude of the Xerophthalmia problem or act of the vitamin A distribution proqrams.
ANEMIA The third important nutritional problem in Haiti is which is presumed to be iron-deficiency anemia. The 1978 entified genernlly high anemia rates in mothers (35 ) and pre-school children (33 percent). Analyses of 1 and urban/rural differences are conflicting, however. is not really clear whether or not there are important or urban/rural differences.
1) AMONG CHILDREN At the naticnal level, approximately one-third of
i between 3 and 59 months of age had anemia as measured bybin levels among a 20 percent subsample of the 1978 NNS in this age group referred to two different cut-off below 24 months anemia was defined as hemoglobin level
.an 10 g/dl and over 24 months as hemoglobin level less I/dl). jure 1.4 shows the percentage of anemic children in each )up. The 24 tb:ough 35 month age group had the highest
13
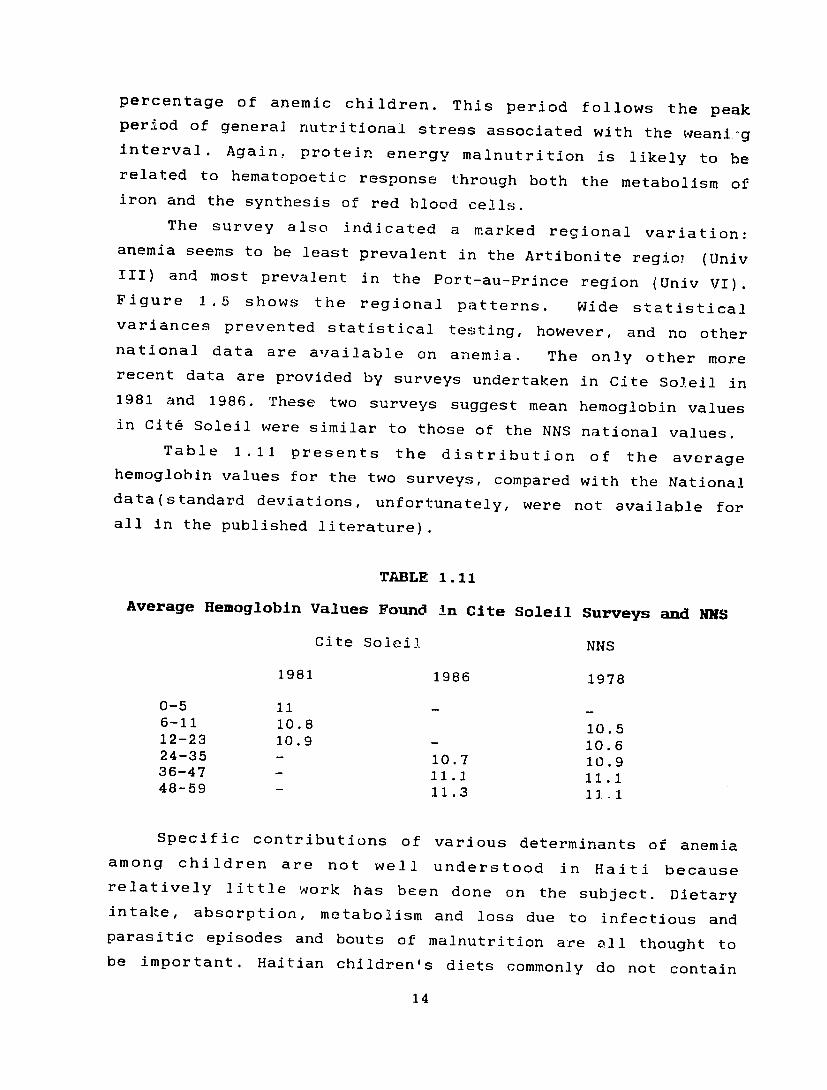
percentage of anemic children. This period follows the peak period of general nutritional stress associated with the weani-g interval. Again, protein energy malnutrition is likely to be related to hematopoetic response through both the metabolism of iron and the synthesis of red blood cells.
The survey also indicated a marked regional variation: anemia seems to be least prevalent in the Artibonite regioi (Univ III) and most prevalent in the Port-au-Prince region (Univ VI). Figure 1.5 shows the regional patterns. Wide statistical variances prevented statistical testing, however, and no other national data are available on anemia, The only other more recent data are provided by surveys undertaken in Cite Soleil in 1981 and 1986. These two surveys suggest mean hemoglobin values in Cit& Soleil were similar to those of the NNS national values.
Table 1.11 presents the distribution of the average hemoglobin values for the two surveys, compared with the National data(standard deviations, unfortunately, were not available for all in the published literature).
TABLE 1.11
Average Hemoglobin Values Found in Cite Soleil Surveys and NNS
Cite Solei2 NNS
1981 1986 1978
0-5 11 6-11 10.8 10.5 12-23 10.9 - 10.6 24-35 - 10.7 10.9 36-47 11.1 11.1 48-59 11.3 1J .1
Specific contributions of various determinants of anemia among children are not well understood in Haiti because relatively little work has been done on the subject. Dietary intake, absorption, metabolism and loss due to infectious and parasitic episodes and bouts of malnutrition are all thought to be important. Haitian children's diets commonly do not contain
14

adequate levels of iron(103). In addition, the presence of factors that interfere with absorption(such as phytic acid) has not been adequately assessed. Finally, the high morbidity loads experienced by Haitian children is likely to contribute substantially to the problem. Malaria and hookworm infection are both prevalent and highly associated with anemia.
2) AMONG WOMEN
More than 35 percent of women surveyed in the National Nutritional Survey were anemic (the sample was not representative of the general population of women since those women had at least one child under five years of age under their care). Pregnant women were considered anemic if their hemoglobin was less than 11 g/dl; for non-pregnant and lactating women, the
cut-off was 12 g/dl.
The 1978 NNS data exhibited wide variability that precluded significance testing for regional variations in the prevalence of anemia in women (see Figure 1.6). The average hemoglobin values for the three groups of women (pregnant, lactating and non-pregnant/non-lactating) were lowest in metropolitan Port au Prince, especially for pregnant women (see Figure 1.7).
The only other data available come from the marginal area of Cite Soleil. The 1981 survey found an average hemoglobin value of 11.65 g/dl among Haitian mothers.
In summary, the three nutritional deficiencies discussed are important problems but information on all three is sorely lacking. Three actions should be undertaken to rectify this situation. First, more emphasis should be placed on processing and collating data from routine reporting systems. Although there is a large constellation of health programs that collect growth monitoring and other data, very _ittle is summarized and reported in a coherent manner such that this data could be used for nutritional surveillance purposes. Second, there have been, in the last five years, several national and regional sample surveys carried out in the health sector (especially the national
15

surveys being carried out to evaluate DCC (Diarrheal Disease Control) efforts). Nutritional components should be added to these surveys. An advocacy role is sorely lacking. Finally, it is perhaps time to consider a comprehensive nutrition survey in
Haiti.
16
III. FACTORS RELATED TO MALNUTRITION
A. INTRODUCTION
All factors that determine malnutrition operate through two major pathways: dietary intake and nutrient utilization. Dietary practices and morbidity are the most proximate causes of malnutrition in children, however, and will be the focus of this
analysis.
A host of socio-economic and demographic factors were associated with nutritional status based on the NNS data. However, this discussion focuses on the more proximal determinants because of the obvious relevance to health, population, and nutrition (HPN) programming decisions. Socioeconomic factors are considered here as constraints to HPN program success. The following section begins with a discussion of feeding practices, which play a major role in determining the nutritional and health status of children in Haiti. It then addresses the determinants of maternal dietary practices. The final part of the section discusses the main morbidity problems associated with malnutrition.
B. DIETARY PRACTICES AND DETERMINANTS
1. INFANT FEEDING PRACTICES
Breastfeeding is still common in Haiti. A major problem in infant feeding practices, however, is early supplementation, in particular, the early introduction of bottlefeeding and weaning feeds that are nutritionally
inadequate.
a. Breastfeedlng
Overall, there appears to have been relatively little change in the duration of breastfeeding in rural areas over the past ten years. The 1987 EMMLJS survey found a median duration of 17.5 months for the country as a whole (14.5 urban, 18 rural, and 16 Port-au-Prince), while the 1978 NNS found a mean duration of 12 months in Port-au-Prince and of about 18 months in rural areas. Although there would appear to be an increase in duration in urban areas, this hypothesis deserves closer
17
examination. Methodologic differences in sampling or analysis may differences.explain the Particularly, computational differences can easily produce substantial differences. The techniques used were not available in the literature published.
Both surveys did, however, find that, while there were no significant differences between rural regions at that time, important differences existed between rural and urban areas (see Table 2.1). Both surveys found that in rural areas virtually all children were breastfed, but in Port-au-Prince more than nine percent had never been breastfed. The NNS survey found that only three to nine percent of rural childen had been completely weaned by age 12 months, while about 29 percent had already been weaned at that age in Port-au-Prince. The 1978 survey also found that in both the urban and rural areas younger (see Table 2.2) and low parity mothers (see Table 2.3) tended to wean their children earlier than did older mothers.
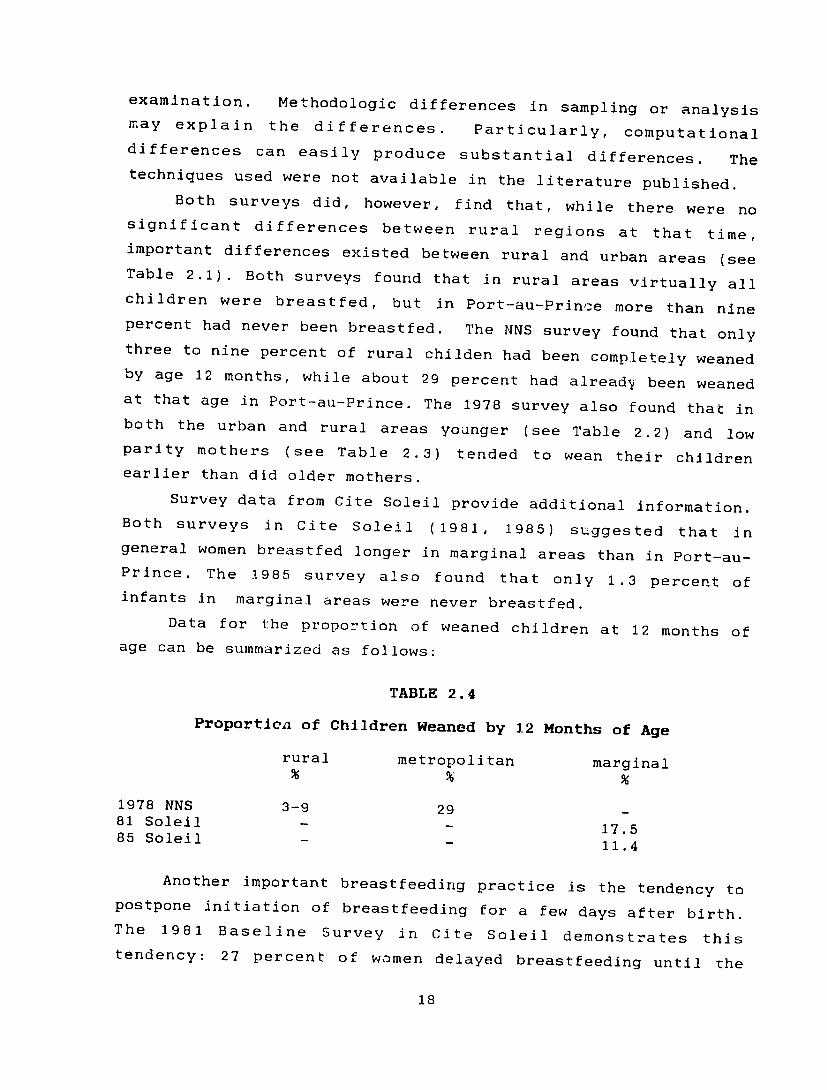
Survey data from Cite Soleil provide additional information. Both surveys in Cite Soleil (1981, 1985) suggested that in general women breastfed longer in marginal areas than in Port-au-Prince. The 1985 survey also found that only 1.3 percent of infants in marginal areas were never breastfed.
Data for the proportion of weaned children at 12 months of age can be summarized as follows:
TABLE 2.4
Proportien of Children Weaned by 12 Months of Age
rural metropolitan marginal
1978 NNS 3-9 29 81 Soleil - 17.585 Soleil
11.4
Another important breastfeeding practice is the tendency to postpone initiation of breastfeeding for a few days after birth. The 1981 Baseline Survey Citein Soleil demonstrates this tendency: 27 percent of women delayed breastfeeding until the
18
second day of life, 38 percent until the third day, and 5 percent until the fourth day. The 1985 survey gave the same pattern of results: over half the women delayed until the second or third
day after birth.
The practice stems from beliefs about colostrum, but it is not clear whether there is a singular strong belief set that underlies the practice. Based on a study conducted in the South, anthropologists (9) suggested that primary reasons for late
initiation included the perceived need to purge the infant's body before initiating breastfeeding and the belief that colostrum
("yellow milk") was unhealthy for the child.
b. Supplemental feeding practices
Two problems in weaning feeding practices have been identified for some time now in Haiti:
(1) lack of early exclusive breastfeeding,
including extensive use of the bottle;
(2) an inadequate weaning diet.
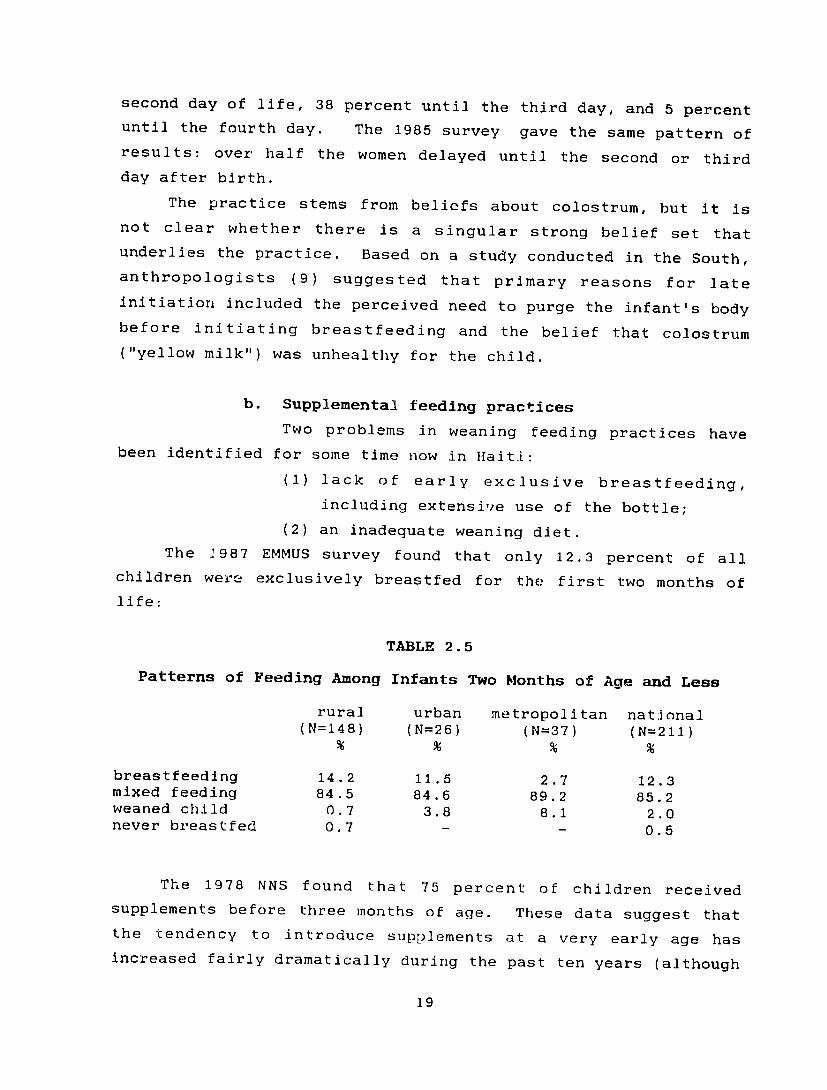
The J987 EMMUS survey found that only 12.3 percent of all children were exclusively breastfed for the first two months of
life:
TABLE 2.5
Patterns of Feeding Among Infants Two Months of Age and Less
rural urban metropolitan national (N=148) (N=26) (N=37) (N=211)
breastfeedlng 14.2 11.5 2.7 12.3 mixed feeding 84.5 84.6 89.2 85.2 weaned child 0.7 3.8 8.1 2.0 never breastfed 0.7 - 0.5
The 1978 NNS found that 75 percent of children received supplements before three months of age. These data suggest that the tendency to introduce supplements at a very early age has increased fairly dramatically during the past ten years (although
19
the indicators of feeding status are not comparable across the
surveys).
Anthropological studies suggest that mothers refuse to breastfeed exclusively for various reasons, including (8,9): - the belief that exclusive breastfeeding can be deleterious
to their (mothers') health; - lack of confidence in the quality and quantity of their
milk (they interpret a baby's crying as insufficient
feeding).
Other factors sometimes cause mothers to wean their babies early. These include "let gate" where the mother's milk is considered spoiled if it has not been sucked for three or more consecutive days, or if the mother gets upset or shocked by a
tragedy; and a new pregnancy.
i. Bottlefeeding
Bottlefeeding is becoming more and more widespread. In 1978 the N!3S reported that already 60.8 percent of rural mothers had fed milk to their children from a bottle, while 96.8 percent of mothers in Port-au-Prince had done so. Rural community surveys in the north (11,12) and in Les Cayes (150) suggest an use ofeven greater bottles. The Baer and Rhode survey found that 71 percent of children under five years had been bottle fed at some time, while the survey in Les Cayes found that 79 percent had been. The 1985 survey in Jacmel found that 81.7 percent of all infants had been bottle fed by the fourth
month of life.
Data from Cite Soleil indicate that bottlefeeding is highly
prevalent even among the underprivileged classes in Port-au-Prince. The 1981 Cite Soleil survey found that more than half (56.3 percent) of the infants had begun bottlefeeding by the first month and that by the fourth month more than 80 percent haO
done so.
The very early introduction of the bottle in the infant's diet leads to reduced breastfeeding production (because of less
20
frequent suckling) and epidemiologic data suggest that early bottlefeeding and supplementation have important consequences for both morbidity and mortality among young infants. They are particularly dangerous in the developing world where environmental sanitation and water quality are usually poor.
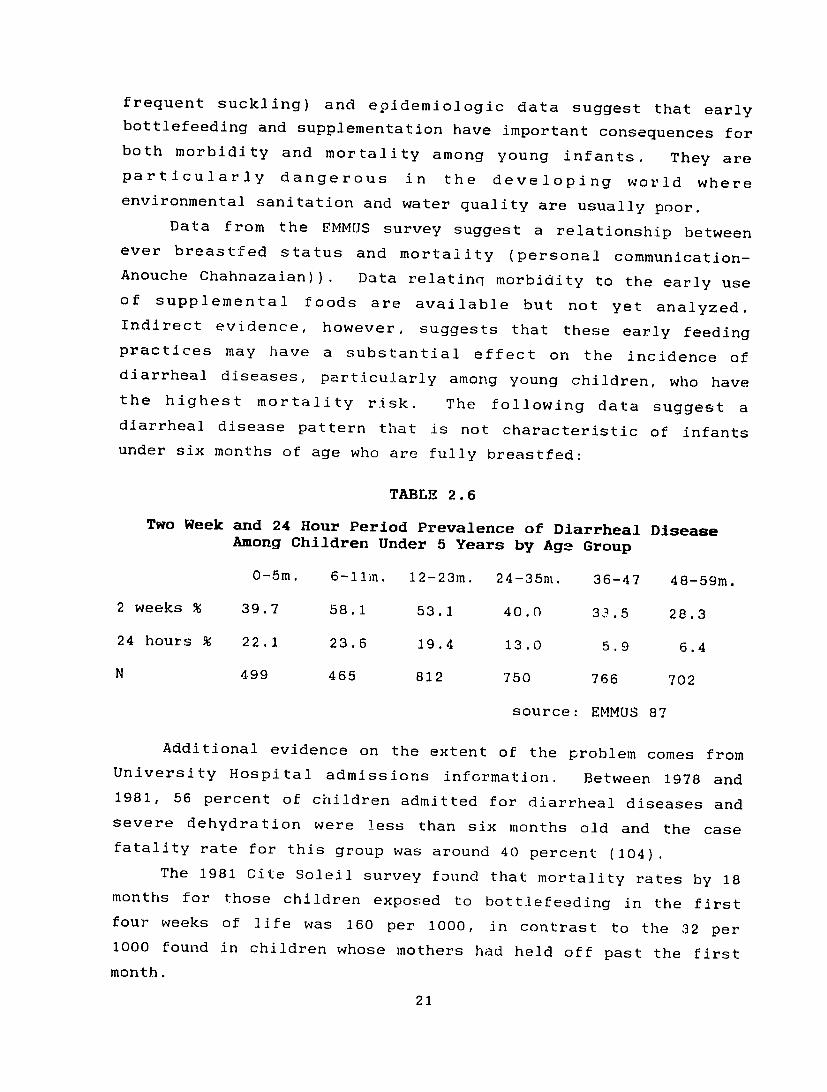
Data from the EMMUS survey suggest a relationship between ever breastfed status and mortality (personal communication-Anouche Chahnazaian)). Data relatinq morbidity to the early use of supplemental foods are available but not yet analyzed. Indirect evidence, however, suggests that these early feeding practices may have a substantial effect on the incidence of diarrheal diseases, particularly among young children, who have the highest mortality risk. The following data suggest a diarrheal disease pattern that is not characteristic of infants under six months of age who are fully breastfed:
TABLE 2.6
Two Week and 24 Hour Period Prevalence of Diarrheal Disease Among Children Under 5 Years by Age Group
0-Sm. 6-11in. 12-23m. 24-35m. 36-47 48-59m.
2 weeks % 39.7 58.1 53.1 40.0 33.5 28.3
24 hours % 22.1 23.6 19.4 13.0 5.9 6.4
N 499 465 812 750 766 702
source: EMMUS 87
Additional evidence on the extent of the problem comes from University Hospital admissions information. Between 1978 and 1981, 56 percent of children admitted for diarrheal diseases and severe dehydration were less than six months old and the case fatality rate for this group was around 40 percent (104).
The 1981 Cite Soleil survey found that mortality rates by 18 months for those children exposed to bottlefeeding in the first four weeks of life was 160 per 1000, in contrast to the 32 per 1000 found in children whose mothers had held off past the first
month.
21
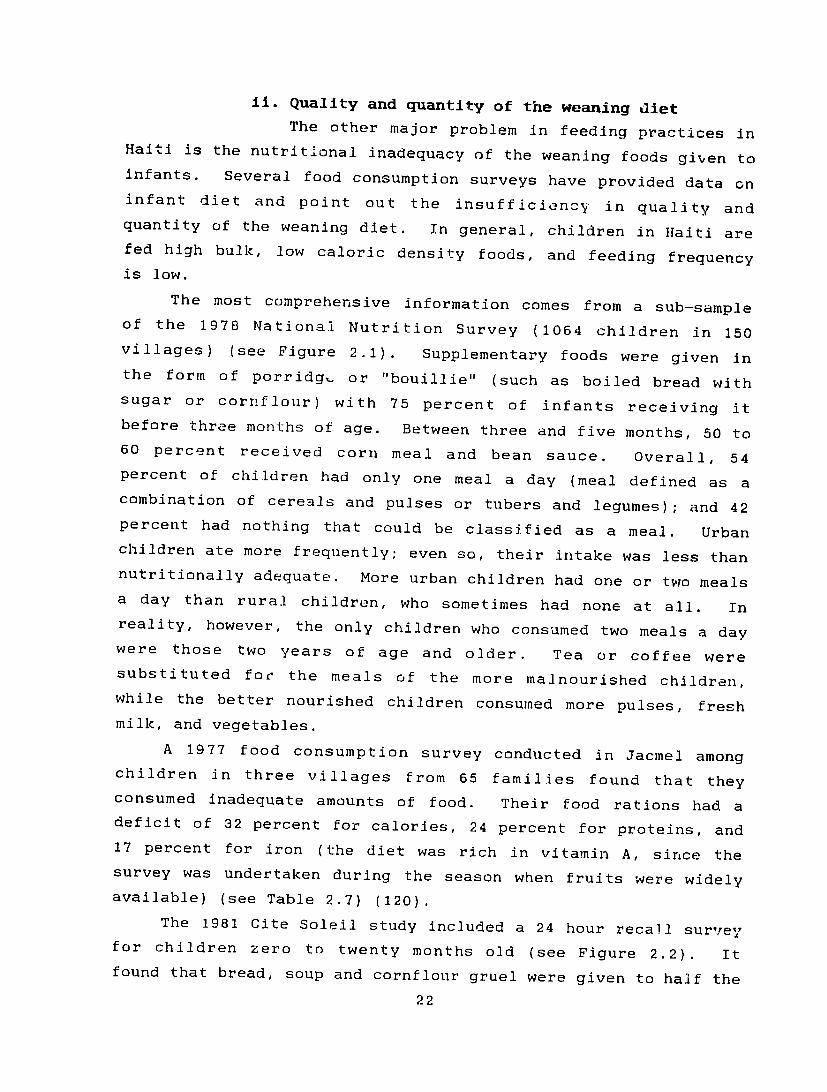
ii. Quality and quantity of the weaning diet The other major problem in feeding practices in
Haiti is the nutritional inadequacy of the weaning foods given to infants. Several food consumption surveys have provided data on infant diet and point out the insufficiency in quality and quantity of the weaning diet. In general, children in Haiti are fed high bulk, low caloric density foods, and feeding frequency
is low.
The most comprehensive information comes from a sub-sample of the 1978 National Nutrition Survey (1064 children in 150 villages) (see Figure 2.1). Supplementary foods were given in the form of porridg or "bouillie" (such as boiled bread with sugar or cornflour) with 75 percent of infants receiving it before three months of age. Between three and five months, 50 to 60 percent received corn meal and bean sauce. Overall, 54 percent of children had only one meal a day (meal defined as a combination of cereals and pulses or tubers and legumes); and 42 percent had nothing that could be classified as a meal. Urban children ate more frequently; even so, their intake was less than nutritionally adequate. More urban children had one or two meals a day than rural children, who sometimes had none at all. In reality, however, the only children who consumed two meals a day were those two years of age and older. Tea or coffee were substituted for the meals of the more malnourished children, while the better nourished children consumed more pulses, fresh
milk, and vegetables.
A 1977 food consumption survey conducted in Jacmel among children in three villages from 65 families found that they consumed inadequate amounts of food. Their food rations had a deficit of 32 percent for calories, 24 percent for proteins, and 17 percent for iron (the diet was rich in vitamin A, since the survey was undertaken during the season when fruits were widely available) (see Table 2.7) (120).
The 1981 Cite Soleil study included a 24 hour recall survey, for children zero to twenty months old (see Figure 2.2). It found that bread, soup and cornflour gruel were given to half the
22

children in first ofthe year life. In addition, half of the nine month old children received bean porridge, but only one in ten of them received meat or eggs. The study also documented a changeover from dairy products to a mainly cereal diet as children reached about three years of age.
A more recent consumption survey conducted in the Artibonite region in 1984 by UPAN (Ministere du Plan), found a diet inadequate in calories, protein and iron intake among pregnant women and pre--school children (see Table 2.8) (135).
Weaning research began in Haiti in the late Thefifties. Bureau de Nutrition developed a local weaning food prepared from cereals and legumes called AK-100 (akamil). This preparation was intended to provide a cheap and available source of calories and proteins for children aged eight months and older. It was first promoted through health professionals and the first study on it, conducted in rehabilitation centers, gave positive results
(93).
A project for industrial production. of AK-1000 was under way, but an initial feasibility study indicated that it was unlikely that a profitable market could be established for the product. The plant notis still opened. Even so, at the present time, most agencies involved in nutritional activities and the DHFN are reinforcing the promotion of AK-100 within families and hand mills are provided to groups and associations (mother clubs, AOPS, etc.). No new data are available on its acceptability, but there are some concerns about preparation time, the monotony of the food and, more importantly, the non-availability of beans and the lack of village mills.
iii. The weaning process
It appears that weaning is generally done in an abrupt fashion, and usually involves the mother physically removing herself from child.the Anthropologists have also described how mothers who stay at home apply a very bitter substance to the breast to assist in extinguishing the child's attraction to the breast (8, 9).
23
As far as infant feeding and weaning are concerned, anthropologists have observed a transitional pattern. Usually, from the first month to the fourth month the child received sweet foods - "manje dous"; then food prepared with salt - "manje sel" - was introduced; and progressively over one year the child participated in the family meal - "manje chodye". The ideal seems to be that by the time weaning comes, the child should be consuming 80 percent of his food from the family cooking pot and
20 percent only from the breast
c) Feeding ill children
Relatively little known aboutis feeding practices for ill children but what information has been gathered suggests that they probably aggravate the condition, at least in the case
of diarrhea.
A study (103) conducted among a group of 500 infants seen in the Rehydration unit of University Hospital between October 1980 and February 1981 found that only 35 percent of the infants received foods during diarrheal episodes. The majority of mothers considered food to be harmful to the child in the presence of diarrhea. Only 22 percent of the infantsbreastfed continued to receive breastmilk. When nourishment was provided it consisted of
carrot juice , kola or rice water.
Berggren (18) found the same behavior in Cite Soleil: mothers there also tended to deny foods or liquids to infants suffering from diarrhea both during the episode and during the recovery days, apparently with the idea that it was important to "rest" the stomach. Some people thought that mother's milk was actually responsible for the occurrence of diarrhea.
Alvarez and Heurtelou have even reported that (9) some people, as a way of treating diarrhea, give a child a purgative in an effort to make the child expel the causative agents of the
illness.
24

2. DETERMINANTS OF MATERNAL DIETARY PRACTICES
A variety of factors seem to be operating to influence these various dietary practices, but their importance
is incompletely understood.
a. Food availability
The diets used in weaning are, of course,
directly influenced by the food available. More information is therefore needed on food availability at the national, village and family levels, although food availability at national and
community levels is already known to be a major problem in Haiti.
Sorghum, rice and maize are the three most important staple crops followed by tubers, pulses and plantain. The recent
analysis of the food situatiutn by the Virginia Polytechnic
Institute (55) revealed that domestic food pruduction was stagnant, and tha4: a food gap ranging from 250 to 336 thousands M.T. per year in wheat equivalent terms currently exists (see
Table 2.9).
Significant regional differences and seasonal availability of many foods are believed to create serious nutritional
problems, but data on those are scarce. The UPAN in 1984 carried
out one of the few studies that has gathered data on food
availability per capita/per region (see Table 2.!0). It found that in rural communities, all the peasants produced the basic crops (cereals and beans or peas are present in patternthe food
of all the social classes in Haiti); however, most of them did
not live entirely off the products of their fields as they sold some of these products commercially. The same study indicated
that a large percentage of household income was used to buy food. It is clear that at the household level, food availability is
determined by the production of food and by accessibility to
food, i.e. the purchasing power of the family.
The role of food allocation within the family may be important but has not been studied sufficiently for comment.
Only one anthropologica] study was found, which reported that
very young children generally were the last to receive their
25
share of the family food. It described how, when a meal was cooked, food was distributed by dishing out individual plates.
Adult males received the largest quantities but always left some
for women and children. It is possible that the UPAN data could
be reanalyzed to examine the issue of food allocation within the
family.
Family food access and intrafamily food allocation are two important issues that must be understood in order to design
sensible and effective nutrition 'nterventions. Data from the National Expenditure and Consumption Survey should provide very
important information about household food availability (and its relationship to income), regional variation, and seasonal
variation. Although Haitian families already spend the vast
majority of their income on food (high income elasticity), it is interesting to note that mothers may already allocate out of this
substantial resources specifically for infant feeding(ie milk products). Perhaps there is a more optimal income allocation to child feeding. The incremental costs needed to provide adequate
weaning diets should be assessed in more depth.
b. Infant formula promotion
'ne role of infant formula promotion as a determinant of nutritional practices is unclear, but appearsit
to be problematic. Of particular importance is the fact that
Haiti has not yet adopted the WHO/UNICEF code of marketing for
breast milk substitutes.
Furthermore, bottlefeeding is still practiced in maternities and a 1983 KAP study of health professionals in three maternities
in Port au Prince showed that even health professionals believed early supplementation to be beneficial to infants. Posters of powdered milk and distribution of samples are still common. The
general perception that bottlefeeding is modern while breastfeeding is associated with poverty also contributes to the
problem (Dr. Genece, personal communication).
26
c. Maternal time cortraintsMaternal
be examined time allocation isas a constraint a factor that should nat to any interveitionappear efforts.to be a major It doesdeterminantconstraint, orhowever, an insurmountable even though many womeneconomic activities which take them away from the home.61 percent of
are involved in
rural mothers In 1978,were engagedpercent of in farming.rural and 55 percent Only 20ofthey were full-time in the home urban mothers reported that
introduce (urban mothers are morefoods earlier). likely toTable 2.11occupations of shows the distributionthe mothers. ofWhat isaway from not known ishome or the flexibility the time spent
to feed. the mother hasIt is unlikely that to return homemost mothers must spend extendedperiods of time outside the home, however(18).The study by P.A. Haggerty (83) in Cite Soleil showed that
length
works status and location of mother's work significantlyfor age in the second year affected months of life.the In the first sixtime women spent with their infantsgreater importance was of relativelyin establishingincome satisfactoryappeared growth,to whilebe a major factornutritional responsiblestatus for betterafter six months. It was notthrough what mechanisms growth was affected.
clear, however,
C. INFANT MORBIDITY Morbidity hasworldwide and
been linkedin Haiti to nutritional(see Table 2.12) statuschildren with weight for height more than
(37). Pre-school Haitian below the mean two standard deviationshave almost twicediarrhea the prevalenceor other illness of fever,
compareddeviation to thoseor one standard is known
less below the mean. This is not surprising since itthat malnourished individualshave area less vigorous more suscep tibleresponse and infections. to disease, andInfections particularyin malnourished to are more children severe. last longer andIn fact, there isphysiologic a vici ous cycle:and metabolic thechangesprocess induced by the infection(anorexia, increased nutritional needs,..) compromise the
27
host's nutritional integ'ity, and a host malnourished is more susceptible to infections.
Twc of the leading causes of death among Haitian children,
:i.arrheal diseases and bronchopneumnonia, are strongly associated with undernutrition. Thus, most studies to date have concentrated on diarrheal and measles infections, and respiratory infections. Parasitic diseases are also major concerns that have not been treated in this discussion.
1. DIARRHEAL DISEASES
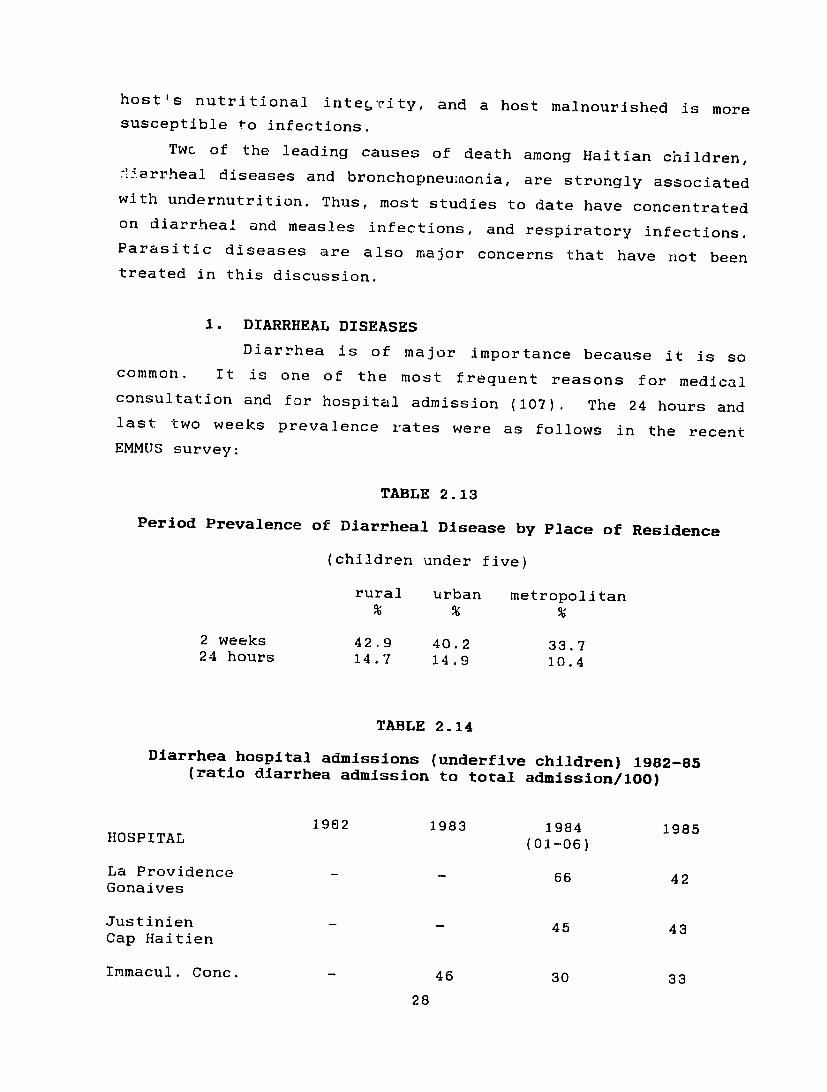
Diarrhea is of major importance because it is so common. It is one of the most frequent reasons for medical consultation and for hospital admission (107). The 24 hours and last two weeks prevalence rates were as follows in the recent
EMMUS survey:
TABLE 2.13
Period Prevalence of Diarrheal Disease by Place of Residence
(children under five)
rural urban metropolitan
2 weeks 42.9 40.2 33.7 24 hours 14.7 14.9 10.4
TABLE 2.14
Diarrhea hospital admissions (underfive children) 1982-85 (ratio diarrhea admission to total admission/lO)
1982 1983 1984 1985HOSPITAL (01-06)
La Providence - _ 66 42 Gonaives
Justinien 45 43 Cap Haitien
Immacul. Conc. 46 30 33
28
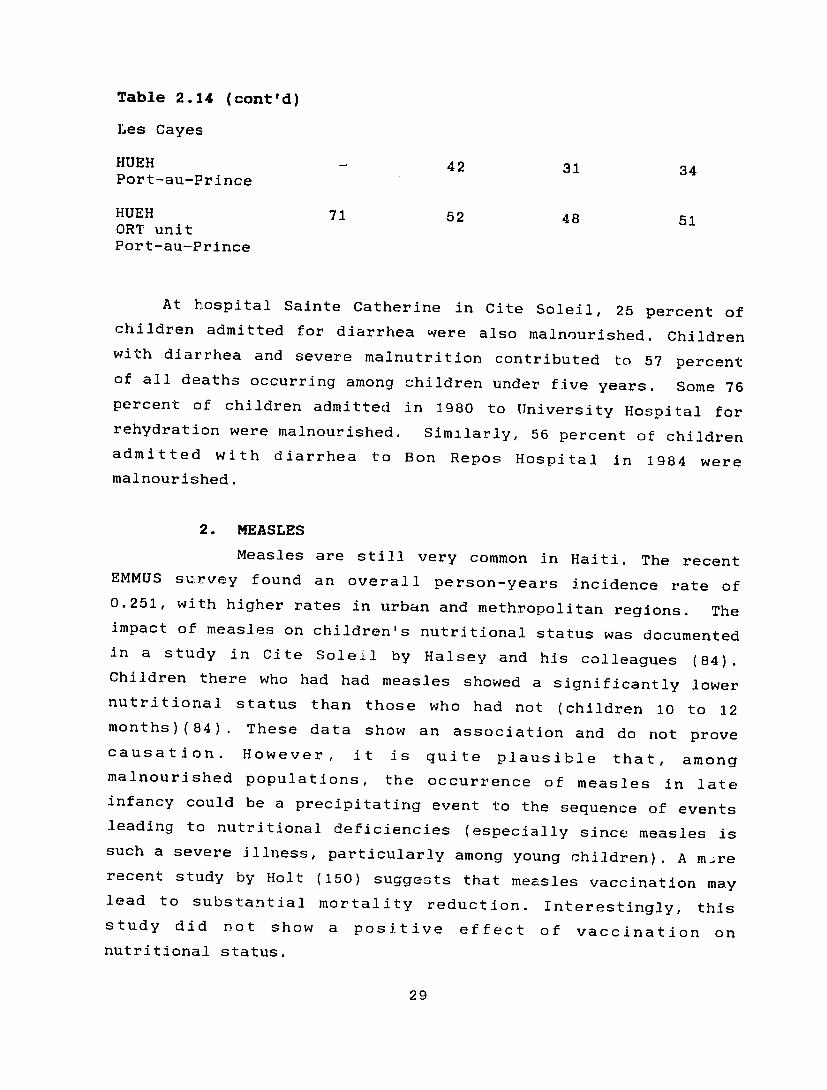
Table 2.14 (cont'd)
Les Cayes
HUEH 42 31 34 Port-au-Prince
HUEH 71 52 48 51 ORT unit Port-au-Prince
At hospital Sainte Catherine in Cite Soleil, 25 percent of children admitted for diarrhea were also malnourished. Children with diarrhea and severe malnutrition contributed to 57 percent of all deaths occurring among children under five years. Some 76 percent of children admitted in 1980 to University Hospital for rehydration were malnourished. Similarly, 56 percent of children admitted with diarrhea to Bon Repos Hospital in 1984 were
malnourished.
2. MEASLES
Measles are still very common in Haiti. The recent EMMUS survey found an overall person-years incidence rate of 0.251, with higher rates in urban and methropolitan regions. The impact of measles on children's nutritional status was documented in a study in Cite Soleil by Halsey and his colleagues (84). Children there who had had measles showed a significantly lower nutritional status than those who had not (children 10 to 12 months) (84) . These data show an association and do riot prove causation. However, it is quite plausible that, among malnourished populations, the occurrence of measles in late infancy could be a precipitating event to the sequence of events leading to nutritional deficiencies (especially since measles is such a severe illness, particularly among young children). A m.re recent study by Holt (150) suggests that measles vaccination may lead to substantial mortality reduction. Interestingly, this study did not show a positive effect of vaccination on nutritional status.
29

IV. NUTRITIONAL PROGRAMS
Haiti is one of the most experimented countries in the world
with respect to nutritional programs. A combination of missionary and other donor-financed programs have been operating
for more than 30 years and a wide variety of approaches have been
tried.
Food aid, to help meet the food needs of the country, is
provided by seven different major sources: USAID, the French, German, Japanese and Swiss aid programs, the European Economic
Community (EEC) aid program, and the World Food Program (WFP)
(the US and EEC providing 97 percent of the total). Table 3.1
presents a summary of the principal commodities provided during
the last 10 years.
Major categories of nutritional interventions include Food for Work, school feeding programs, maternal and child health
programs, and integrated development projects (see Figure 3.1)
A. MATERNAL AND CHILD HEALTH APPROACHES
These approaches are targeted to mothers and pre-school
children. Between the mid-1960s and the late 1970s, the principal strategy of the Bureau. de Nutrition to combat
malnutrition among children was the establishment of mothercraft
centers. This strategy tocused on rehabilitation of severely
malnourished children with the participation of the mothers.
Program impact was positive as measured by recuperated childen
and effects on siblings (21,92). The cost, however, was
considered too high for the coverage obtained.
This approach was later replaced by the Foyer de Demonstration strategy, where mothers and children of a village
attended an intensive education session every day during a twoweek period. Emphasis was given to participation and demonstration. The rationale was to promote healthy growth in
order to prevent malnutrition.
The current overall strategy of the public health sector
consists of integrating nutrition acrivities into the health
delivery system. Nutrition activities undertaken are growth
30

monitoring, nutrition demonstration and education, and targetedfood supplementation, when available. Despite established protocols, there are a large variety of mixed interventions, targeting approaches, and service delivery models being undertaken in Haiti.
Five distinct models have been identified among the numerous types of interventions. For each model we have identified the organizations that operate this type of system. In addition, we have provided a discriptive narrative that includes types of services provided and channels of service delivery; targetpopulation; personnel, management, training; supervision; participation; and specific technical aspects of the educational components. Finally, we have identified unique or useful features of the program for further consideration, as well as limitations of these programs.
A more complete overview of interventions conducted by the different agencies and/or supported by donors and the evaluation instrument which is presently used for the site visits (CaseStudy) are given in Annexes II and IV. The case studies analysiswill allow a more precise assef .ment of the process variables and will identify constraints for each type of model and/or agency intervention.
Before discussing the five approaches, it is important topoint out that national coverage of maternal and child health programs is not high. The EMMUS survey provides information on the number of underfive children who have a "road to health chart." Overall coverage is low, ranging from 14.5 percent in the transversal region to 18.2 percent in the West. Coverage is highest among children 12 to 23 months of age.
1. TARGETED SUPPLEMENTATION WITH EDUCATION: This type of program consists of supplementing the
normal diets of vulnerable, malnourished groups (preschoolers and pregnant and lactating women) with additional food that is intended to support the basic diet. Education is provided to mothers improve dietary practices.to
Either dry take-home
31
rations or on-site feedings are provided. Health services
provided are minimal.
ADRA (Seven Day Adventists) is the only major example of
this type of program which is currently operating. The ADRA
program consists of nutrition centers that are completely run by
the communities. Communities are self-selected into the program
based on a written application and a contract that specifies the
community's responsibility to provide facilities and protected
storage for supplies, as well as a village management committee.
ADRA provides supplies and technical assistance. Once a community
is selected, children are screened for program eligibility. The
least nourished 150 children are eligible for services. The least
nourished 50 children receive a substantial ration and nutrition
education while the other 100 receive only education. A small
ration is given to the mothers of these children for motivation.
Population: ADRA originally operated 77 such centers but
recently their program has been stressed by the inclusion of over
50 Church World Services (CWS) centers. There are currently
supervisory and operational problems resulting from the larger
program.
Personnel and Training: ADRA selects nutrition agents from
among applicants for the position and these agents provide the
services in each center. They are volunteers and receive food
for work. Initial training lasts four days, and further training
is provided twice a year for four days.
Supervision: Activities are supervised by five inspectors.
Each center is visited approximately every three months. There
are currently some problems with supervision, however, resulting
from the addition of the extra centers and also from the
political situation.
Activities: The mothers are directly involved in the
rehabilitation of their malnourished zhildren. Program enrollment
lasts eight months; during this period, besides receiving the
food supplementation, mothers are taught how to care for a
malnourished child and how to prevent malnutrition. Sessions
normally include 25 children. During each session, the following
32
activities are carried out : weighing (with recording on the "road to health chart"), individual counsellipg, and education for mothers (six main subjects are covered: vitamin A-rich foods, the three food groups, diarrhea and oral rehydration therapy, breastfeeding, immunization, and growth, which includes the "road to health chart"). The education material used is that developed by the DHFN. A few additional services are provided, including
ORT and vitamin distribution. After eight months, the children are discharged and a new screenino is operated in the same
village.
Participation: Rates are high. Among the 50 children in the supplementation program, 90 percent regularly attend. Among the
others, 80 percent regularly attend sessions.
Aspects ot the program worth investigating and program
strengths:
- the community mobilization and participation;
-- the motivational mechanisms : for the participants, if the children do not gain weight, they are excluded from the
program,
- ADRA program management: in particular, a well structured
supervisory reporting and information system.
Problems and limitations:
- insufficient use of information collected by the program
(supervisory forms, GM etc) for management and evaluation
purposes;
- inadequate staff train.ing, and possibly supervision
frequency;
- basic philosophy of a curative approach organization;
- food supply problems to ADRA.
Most agencies working in urban marginal areas, regardless of their general strategies and service delivery models operate this type of targeted supplementation due to the large demand on the system. Even CARE and CRS run take-home supplementary feedings
targeted to malnourished children and/or those of lowest socioeconomic status (please refer to Annex IV). It is important to note that in urban areas the populations have become quite
33

accustomed to food handouts. Several program managers stated that
motivation is difficult in the absence of food supplements.
2. NUTRITION COMPONENTS INTEGRATED INTO CHILD SURVIVAL
PROGRAMS
This type of program is characterized by the fact
that nutrition is but one component that is conceptually
integrated into a focused strategy to reduce child mortality.
Child Survival programs include a nutrition component (GM/P,
education and sometimes targeted supplementation) among other
Maternal and Child Health (MCH) activities such as immunization,
promotion of oral rehydration therapy, prenatal care, and family
planning. This type of program is the strategy used by most PVO's
receiving USAID Child Survival support monies. Technical support
for many of these programs is provided by the IHE (Institut
Haitien de l'Enfance), and training support is increasingly being
provided by INSHAC (Institut National Haitien de la Sant6 et de
l'Action Communitaire).
The AOPS (Association des Oeuvres Privdes de Santd) - an
association of 100 organizations throughout the country, both
private and public, that work in the health sector - has twenty
five members carrying out Child Survival programs. Four specific
AOPS organizations (AMOSSE in Jacmel, Foster Parent Plan in
Jacmel, Comite de Bienfaisance in Pignon, and the Salvation Army
in Lully) have been selected for further investigation because
they were judged to have particularly well-run or well-designed
nutritional interventions (please refer to Annex IV). While non-
AOPS organizations also provide these types of Child Survival
services, AOPS is used as an example here.
Most of the AOPS organizations have adapted the rally posts
approach, combining the village-based monthly gathering with a
health professional mobile team. Each AOPS organization has its
own management approach and personnel, training, supervision, and
other activities differ according to the individual organization.
AOPS staff do, however, in theory, supervise each site once a
month.
34
Population: The target population for each project is
supposed to be defined by a census. The population is divided
into equivalent-sized sectors ihich form the basis for service
delivery.
rallyActivities: The common nutritional activities at the
posts are weighing of children under five years using the "road
to health chart", individual counselling (focusing on mothers of
gain weight or are already malnourished), andchildren who do not
education following DHFN protocols. When available, targeted
Gomez scale) issupplementation (second and third degree on the
provided. Besides the MCH services, some institutions may also
organize other activities, including essential curative care
and/or community development programs (income-generating
activities, home-cardens, sanitation, agricultural projects
etc.).
Aspects of the program worth investigating and program
strengths:
- program outreach;
- an organization worth considering for GM/P and nutrition
education support and operations research;
- individual member organizations have specific managerial
approaches worth investigating.
Problems and limitations:
- Time allocation of personnel, training, supervision and
support are major constraints.
- Nutrition is clearly not a high priority overall (but is in
specific sites).
- Logistical problems and shortages are common.
- The information system of the program is both overly
well implemented (forms are incompletelysimplistic and not
filled out).
- Inforhation gathered is not usr A for management and
evaluation.
35
3. NUTRITIONAL SERVICES INTEGRATED INTO COMPREHENSIVE
HEALTH SERVICES
This type of nutrition program is included in a comprehensive population based health program run through a
hospital and community outreach health services. A complete
inventory of nutritional activities is offered to the population,
including growth monitoring and nutritional surveil ance (in
fixed facilities and at rally posts in rural areas), education
and demonstration, supplementation, and nutrition rehabilitation
centers for severely malnourished children. Besides the nutrition
activities, curative and preventive services are provided to the
same registered population.
Two programs essentially fit this description. One is the
Albert Schweitzer Hospital Community Health program in the
Artibonite area. The other, which is described below, is a
comprehensive health program run by Complexe Medico-Social of
Cite Soleil in this marginal urban area of Port-au-Prince. The
program operates through one hospital and three health centers.
Population: The program reaches 150,000 people and 22,000
children under five.
Personnel and training: Nutrition staff include a physician,
nurses, auxiliaries, monitors, and volunteer agents. They
receive training at INSHAC: Physicians, nurses and auxiliaries
receive five months of training and monitors and volunteers one
month.
Activities: All preventive activities are conducted in the
health centers, where children under three are assembled at regular intervals. Community outreach agents motivate the
community to participate. Activities include weighing (all
children every 2 months and malnourished every month) and
education in "foyer de demonstration," where 20 mothers of
malnourished children (first, second, and third degree) are
enrolled and come every day for one month. Dry rations are
provided for second and third degree malnourished children and
pregnant women. Weight gain is the criterion for continued
participation and a child that does not gain weight can be
36
excluded for three months. Otherwise, an enrolled child remains
in the program up to age three. There is also a rehabilitation
center for malnourished children. Mothers receive training from
professional staff. The program also includes a breastfeeding
promotion campaign that promotes exclusive breastfeeding during
the first two months of life and discourages the use of bottles.
Vitamin A and fer-folate are distributed according to the DHFN
protocols.
Additional activities inulude:
- income-generating activities for mothers of malnourished
children enrolled in the rehabilitation center;
- a cultural center that is a primary and secondary school
plus a documentation center for the teenagers;
- income-generating activities for the collaborators.
Participation: It reaches over 80 percent as a result of the
intensive community outreach motivational system.
Areas of the program woth investigating and program
strengths:
- This program is well organized with all the components of a
nutritional surveillance program (diagnosis, treatment, and
prevention). It would provide an interesting case study for
cost effectiveness analysis.
- Registered population.
- Well organAzed program of referral and progressive nutrition
intervention strategies.
- The INSHAC has developed a training protocol, materials and
programs which should be assessed by Parlatto with M-C.
Problems and limitations:
- Costs.
- Somewhat classical educational strategies.
4. UNTARGETED SUPPLEMENTATION AND EDUCATION PROGRAMS:
This program focuses on education and prevention of
malnutrition with an emphasis on the nutritional supplementation
component. Dry food rations are provided as an incentive for
37
participation. Aside from supplementation, GM, individual
counselling, and group education sessions are the major
activities.
The Catholic Relief Services (CRS) organization is the only
major organization currently operating this type of program on a
widespread basis, although many organizations have operated this
type of program in the past. Both public and private sector
health centers participate in the program. Institutions must
apply to receive CRS assistance and they must be willing to
commit resources to running the nutrition center. CRS provides
food, technical assistance (in terms of training, weighing and
monitoring materials,..), and supervision.
Population: CRS runs 21 centers serving approximately 8000
enrolled children.
Personnel and training: The management of field level
activities varies between centers. Often the field manager is a
physician or a nurse, but sometimes auxiliaries or trained
mothers run the program. Staff training is not standardized but
is rather carried out as in-service training. Small seminars and
staff meetings are also organized.
Supervision: This is performed once a quarter per site by
CRS supervisors.
Activities: Ideally, the children are supposed to be
enrolled before three months of age and normally for a duration
of one year. The dry food supplement is distributed every two
weeks in a fixed facility, while the growth surveillance is
undertaken for enrolled children only every month to monitor the
progress. CRS uses its own growth chart model which excludes
graphics. Growth monitoring is accompanied by individual
counselling and demonstrations of meal preparation using local
foods. Brief group sessions are held during the first 10 minutes
of each session. In theory, one message is presented from among
the following topical areas: ORT, Hygiene, EPI, VitA, fortified
milk, akamil, family planning, foods, breastfeeding promotion,
and growth monitoring. Attendance of more than 40 mothers per
session is common.
38
Additional activities: In some centers, after one year's
participation, motivated mothers can apply to participate in
income-generating activities (essentially loan funds). A few
additional services are provided, such as ORT and vitamin A
distribution. Other health services are provided according to
the health facility.
Participation: Rates are high. Approximately 90 percent of
the mothers attend every session.
Aspects of the program worth investigating and program
strengths:
- emphasis on nutritional component of service delivery
systems;
- high participation rates(probably due to food
supplementation incentive);
- standardized management approach by CRS, although
institutions are very different;
- it is one of the few remaining programs supporting public
services;
- experimental. growth chart;
- linkages between the nutritional and income generating
activities.
Problems and limitations:
- staff training seems weak and perhaps too unstructured;
- no use of data collected for monitoring and evaluation
purposes;
- fairly classical supplementary feeding program with
classical educational approaches.
5. PRIMARILY EDUCATION BASED PROGRAMS WITH COMMUNITY
PARTICIPATION:
This is an education-based approach that places
strong emphasis on community participation and socio-economic
development. In several selected localities, some PVOs carry out
community education programs and/or nutrition-oriented economic
development activities (food-producing and/or income generating),
39

to improve the income of families. On the nutrition side,
emphasis is placed on preventive strategies and supplementation
is not commonly used. Growth monitoring is more often taken
seriously as a communication strategy which necessitates full
participation and understanding by the mothers.
CARE runs the CINECO program in rural areas, integrated into
a well structured social organization program. This example is
discussed here. In addition, CECI (Canadian development NGO) has
intergrated this type of nutrition project into their development
program (pls refer to Annex IV).
Population: The population is identified by census in the
catchment area of a primary school. All mothers with children
under one year of age can participate in the program, on a
voluntary basis. Isolated communities are given priority. There are currently approximately 30 of these CINECO sites. CARE has
subiitted a proposal to extend and expand the program during the
next five years.
Personnel and training: Program management is fairly
decentralized, with responsibility primarily at the regional
level. Staff include a regional coordinator under whom are
monitors. These monitors supervise the activities carried out by
the health agents. These peripheral level staff are only
marginally literate. The health agents initially receive
training for 17 weeks and continuing education courses every 6
months.
Supervision: Supervisory visits to CINECO centers are made
weekly. The monitors supervise between 6 and 9 centers, and they
have a check-list for supervision visits.
Activities: There are as many as 80 mothers per session.
There are two major nutritional activities:
1) Both mothers and children are weighed and individual
counselling is provided to mothers according to a protocol.
A revised growth chart is used that highlights the sign of
weight change. No graphics are used.
2) A group nutritional education session: great emphasis is
placed on the promotion of local foods. CARE developed
40
their own educational materials. The methodologic approach
is participative with role playing, songs, and
demonstration. Women's groups are also encouraged to
undertake community nutritional education.
Other health activities include distribution of vitamin A
and fer-folate. Many activities are also aimed specifically at
increasing community organization. Various festivities are
planned to bring the community together and recognize program
participants.
Participation: On the average 80 percent: of eJigible women
in the program villages attend regularly. Apparen.:ly attendance
varies by village type. Larger villages and less isolated
villages have poorer participation rates.
Aspects of the program worth investigation and program
strengths:
- effective community motivation mechanisms (in the absence of
food handouts);
- increasing relevance of growth monitoring by monitoring
mother as well;
- strong administrative structure, including regionalization;
- good staff selection procedures;
- experimental growth chart;
- educational materials and methods.
Problems and limitations:
- Size of groups (80 mothers per session) is too large; CARE
wants to divide groups in half.
- Problems with generalization of this model. It seems to be
most effective in isolated rural communities. It is not
clear if community mobilization techniques would hold true
elsewhere.
Replicability problem due to high human resource costs of
training.
41

B. OTHER PROGRAMS
1. SCHOOL FEEDINGS
The school feeding programs reach the largest number
of beneficiaries and provide the largest amount of food aid (see
Table 4.6) of any program. The tonnage of food distributed almost
doubled ovcr tht: 1983-87 period, while the quantity of food per
person increased significantly from 25.4 to 39.3 kg per
schoolchild. A typical lunch includes bulgar or corn porridge
mixed with oil and a glass of milk (a third of the required daily
allowance). These programs, which are carried out in 70 percent
of the public schools and 35 percent of the private schools,
supply rations for more than 440,000 children. Four PVOs (CARE,
Catholic Relief Services, Church World Services and ADRA ) and
the World Food Program are involved in these activities. The ai.m
of the school feeding programs is to improve nutritional status,
school enrollment and attendance as well as performance. The
evaluation conducted in 1982 found that the Haitian school
feeding program had a positive impact on the nutritional well
being of its beneficiaries (i.e. it contributed to a decrease in
the rate of nutritional deterioration).
Inadequate targeting and management problems have been
identified as important: the school selection is on a first come
first served basis however, (no effort is made to seek the
neediest institutions and schoolchildren); ration dilution and
substitution occurs on a small scale; 17 percent of the
commodities are used for extra-program purposes. It is clear
also that this program does not reach the poorest children of
school-age who are not attending school, since the crude rate for
enrollment is 56 percent at primary level and 15.8 percent at the
secondary level (EMMUS).
2. ORT AND BREASTFEEDING PROMOTION PROGRAM
(PRONACODIAM)
PRONACODIAM is a national program which started in
1983 and is sponsored mainly by UNICEF/JNSP with contributions
from other donors. The program's goal is to improve diarrheal
42

disease management and to promote breastfeeding. It has the
following specific objectives:
- To ensure that 30 percent of the women in urban areas and 60
percent in rural ares breastfed their babies exclusively for
the first three months.
- To ensure that 60 percent of the urban women and 90 percent
of the rural women prolong breastfeeding for up to 12
months.
To ensure that 60 percent of mothers are informed about good
weaning practices.
The program also has several objectives aimed at improving
the management of diarrheal diseases.
A comprehensive program evaluation was conducted in 1985
suggesting mixed results of PRONACODIAM at that time (only tw
years into operation). At the time of the study, the activities
focused mainly on the control of diarrheal disease aspects, and
the promotion of breastfeeding was not yet a part of the program.
Overall, the ORT component was associated with high levels of
knowledge change among the urban population but substantially
lower rates in rural areas. Surveys monitoring ORT practices
have produced mixed results but suggest that utilization is
fairly low. Investigators havc at; ributed the shortcomings of
the program to inadequate development of educational strategies
and inadequate attention to ORT distribution systems. (In
several surveys approximately half the households did not have
access to ORS packets within a one hour distance.)
In 1987 the program began to develop the breastfeeding
component of the program. Program activities included meetings
and seminars for health professionals, development of educational
materials such as slide-sound sets, radio spots, development of a
breastfeeding promotion movie to be shown in certain health
facilities and communities, and the preparation and supply of
informational pamphlets and posters to health facilities.
Sixteen radio stations aired 15 minute spots on a regular basis.
43

V. CONCLUSIONS AND PRELIMINARY RECOMMENDATIONS
Based on the broad-based review that was done certain key
conclusions related to both nutritional problems and nutritional
programs can be drawn.
1. Early infant feeding practices in Haiti are very probably
important determinants of poor child health, nutritional
status, and survival. Therefore, great emphasis should be
placed on promoting exclusive breastfeeding for the first
two/three months of life. A successful campaign has the
potential to have a relatively high impact. A comprehensive
campaign shoulct include well developed social marketing
approaches, as well as strategies for the motivation of
health personnel. Attention should also be given to key
legislative interventions, such as enforcing paid maternity
leave and adopting the WHO/UNICEF code of marketing of
breast milk substitutes in Haiti. Since PRONACODIAM has
embraced this programmatic strategy in principle, great
effort should be placed on the lessons learned from
PRONACODIAM and on coordinating any educational strategy
with this program. In addition, the Cite Soleil health
program has included an aggressive anti-bottle campaign that
should be carefully examined. It is quite likely that AED
could provide key technical support for refining
PRONACODIAM's and Cite Soleil's educational and social
mar-:eting approaches. It appears as though more careful
exploration of maternal attitudes and constraints is
required to develop successful ORT and infant feeding
behavioral interventions (lack of adequate analysis surfaced
as one of the limitations of the PRONACODIAM program).
2. A related problem area is diet during illness. Educational
strategies must be carefully formulated to inform and
motivate mothers to manage ill children properly. There is
no information available on the recalcitrance of current
maternal beliefs with respect to dietary management of
44
illness; nor do we understand why some mothers are positive
deviants. These are important informational gaps that must
be addressed by any potential educational programs.
3. Weaning diets are inadequate in both composition and
quantity and feeding frequency is too low. It is clear that
income is a major constraint but it is also clear that
certain items such as wheat-flour based bread soups are
supplanting more traditional and nutritious corn and bean
based diets. AK-1000 was developed by the GOH as an
appropriate weaning food for children in later infancy and
early childhood. To date, use of AK-100 has been limited.
Two major difficulties have been cited: availability of the
ready-to-coik product and promotional strategies. AK-1000
ingredient, require substantial milling and they are not
elways available. In addition, the product has been used
frequently in rehabilitation centers, thus giving the food
the image of a food of the poor. Educational strategies to
improve weaning diets are very classical in orientation by
and large. They most frequently focus on food-group type
messages. Perhaps the nutritional component of the
PRONACODIAM program could be broadened in scope: instead of
just improved breastfeeding practices, it might also include
improved infant feeding practices. A complement of
educational messages for the weaning interval might be
considered.
More attention should also be given to the development of
weaning foods for infants four to eight months old. The
World Food Program is already in the testing phase of
development of a flour/milk mixture that could be marketed
pre-packaged.
4. The review identified several weaknesses in current
nutrition intervention strategies which should be addressed.
Nutritional education and GM/P efforts, on the whole, are
not being effectively designed or nanaged. In most cases
45

growth monituring is lax-yell, being used as a screening tool,
since organizational factors impede effective individual
counselling. By and large, group nutritional education
programs are poorly designed and are allocated very little
time. In addition, in most of the cases examined, health
agents and professionals were inadequately trained for an
educational function. One of the reasons for these
difficulties is the large spectrum of services provided by
many of the programs, nutrition being only one. Operations
research is needed to assess appropriate nutritional and
p-ogram management strategies within the various contexts
that nutrition interventions operate in.
Another reason for the poor performance is lack of technical
and training support for the nutritional components of these
programs. The BON (Bureau of Nutrition) used to provide
this support and at one time was extremely active in
supporting educational programs. During that period many
educational materials were developed that are still in
widespread use today. The BON was all but disbanded a few
years ago, however. Since then, no other organization has
served the advocacy and support function for nutrition
sector activities. It should be assessed in the
institutional assessment phase to what extent IHE and INSHAC
could serve as private sector analogues. This type of
support is particularly important for Child Survival
programs. Generally, these programs include, but do not
focus on, nutritional components of their service delivery
complement.
Most programs sorely need management expertise and training.
Reems of unused service statistics and health data was one
symptom of the problem. In addition, supervision was
commonly weak and training protocols developed several years
ago by the BON have neither been adapted nor updated by most
organizations.
46
5. The review also identified several modalities of nutrition
interventions being delivered in Haiti. It would be useful
to design cost-effectiveness studies to compare program
strategies(Non-AED). This type of study necessitates impact
data.
6. We are concerned about the general lack of nutrition-related
data in Haiti. Many critical KAP, economic, and nutritional
information gaps exist. Hopefully, some of these will be
filled by the Income and Expenditure Survey to be available
in late October of this year (Hellen Jensen, personal
communication). This study examined family consumption and
economic factors (but not individual level consumption).
Anthropometric measures were taken on the eldest child under
5 years of age in the household. Seasonal cor[sumption
patterns also were be addressed in the survey.
Although many health surveys have been conducted during the
past five years none has collected adequate information on
nutritional KAP and nutritional status. It is recommended
that more serious consideration be given to increasing the
attention paid to nutritional factors when planning these
surveys. It should be remembered that the marginal cost of
adding well formulated nutrition modules is not great.
7. Finally, before effective communications efforts on
breastfeeding, infant feeding or vitamin A can be launched,
specific research must be undertaken to understand the
causes of behaviors that are believed to be maladaptive.
Why do mothers introduce supplements so early? Is this
because of economic necessity or knowledge gaps? Are
weaning diets deficient because of kno"ledge and attitudinal
factors or economic destitution? What are the causes of the
failure of efforts to develop and diffuse appropriate local
weaning foods such as AK-100? Another important are of
research is thb appropriate mix of communications strategies
that should be used. The PRONACODIAM program experience
47

suggests that interpersonal channels should play an
important role.
48

BIBLIOGRAPHY
1. Ade, E. Apercus sur les problemes nutritionnels en Haiti. Cah. Nut. Diet. 1978; 13(1): 21-26.
2. ADRA/ Haiti. Child survival evaluation and implementation. Plan. 1986.
3. Allman, J. et al. Treatment of childhood diarrhea in rural and urban Haiti. Columbia University. Center for Population and Family Health, New York. 1986.
4. Allman, J. et al. Lessons learned in implementing and evaluating the national ORT program in Haiti. American Public Health Association, Washington, D.C. 1985.
5. Allman, J. et al. Women's status and family planning in Haiti. Unpublished document. 1982.
C. Amede-Gedeon, M. et al. Rapport d'evaluation des centres de nutrition situes dans l'aire de la Hacho. Bureau de Nutrition, Port-au-Prince, Haiti. 1978.
7. American Public Health Association. Growth Monitoring. American Public Health Association, Washington, D.C. 1981.
8. Alvarez, M.D. et al. Socialization for scarcity: child feeding belief and practice. Unpublished document. 1981.
9. Alvarez, M.D. et al. Nutrition messages, rural diets and groupman maternel: a model for nutrition intervention under conditions of ecological heterogeneity. Management Sciences for Health, Boston. 1982.
10. Augustin, A. et al. Mobilizing mothers for child survival. Unpublished document. Undated.
11. Baer, F.C. et al. Preliminary results of a survey of general morbidity and utilization of health services in northern region of Haiti. Unpublished document. 1981.
12. Baer, F. and Rhode, J. Health and nutrition survey of North region of Haiti: preliminary analysis of field data. Unpublished document. 1981.
13. Ballweg, J.A. Family characteristics and nutrition. Problem of pre-school children in Fond Parisien, Haiti. Environment Child Health 1972/September: 230-43.
49

14. Barkhus, A. et al. Syncrisis: the dynamics of health. An analytic series on the interactions of health and socioeconomic development: Haiti. US Department of Health Office. 1976.
15. Barry, M. et al. Haiti and hospital A. Scheitzer. Ann. Inter. Med. 1983 98(6): 1018-20.
16. Beaudry-Darisme, M. et al. Nutrition rehabilitation centers; an evaluation of their performance. J. of Trop. Pediatr. 1973 13(3): 299-332.
17. Beghin, I. et al. L'alimentation et la nutrition en Haiti. Presses Universitaires de France, Paris. 1970.
18. Berggren, W.L. Baseline survey of nutritional status and health of mothers and children in Cite Simone. Unpublished document (for USAID).1981.
19. Berggren, W.L. et al. Reduction of mortality in rural Haiti through a primary health care program. New England J. Med. 1981 304(22): 1324-30.
20. Berggren, G.G. Home prepared food supplements, mothercraft centers and nutrition in Haiti. Food and Nutrition Bull. 1981 3(4): 29-33.
21. Berggren, G.G. et al. Comparison of Haitian children in nutrition intervention program with children in the Haitian national nutrition survey. of WHO.Bull. 1985 63(6): 114150.
22. Berggren, G.G. The nutrition demonstration foyer. A model for combating malnutrition. Haiti. HOVIPRFP monographseries 2. Cambridge, Massachusetts. 1984.
23. Berggren, G.G. Hardest time of village life to meet the weaning ages crisis in Haiti. HOVIPREP. Cambridge, Massachusetts. 1982.
24. Berggren, W. et al. The impact of ondemonstration child death rates following nutrition education in rural Haiti.. Unpublished document. 1981.
25. Berggren, W.L. Mortality outcomes of nutritional rehabilitation programs. Unpublished document. Undated.
26. Berggren, G. et al. Traditional midwives, tetanus immunization and infant mortality rate in rural Haiti. Tropical Doctor 1980.
50
27. Berggren, et al. Growth pattern of preschool children asinstruments for the management of child health in an malnourished Haitian population. Unpublished document.
28. Bisego, S. Frivate Voluntary Organizations child surveys.JHE, Port-au-Prince, Haiti. Scientific report. 1986.
29. Bisego,G. Estimation of early childhood mortality in rural Haiti. Unpublished document. Undated.
30. Bordes, A. et al. Improvement on breastfeeding and pregnancy status of household contraceptive distribution inrural Haiti. Am. J. Public Health. 1982: '72(8): 835-38.
31. Bordes, A. Utilization of folk media in the education ofHaitian community in Family planning. UNESCO, Paris. Population Communication Tech. Doc. 8.
32. Bordes, A. et al. The impact on breastfeeding and pregnancystatus of household contraceptive distribution in rural Haiti. Am. J. Public Health. 72(8): 835-38.
33. Boulos, L.M. Dilemma for Haitian mothers: breast or bottlefeeding. Unpublished document. 3986.
34. Boulos, L.M. Allaitement maternel et lutte contre le biberon. Unpublished document. 1985.
35. Brown, H.B. et al. Malnutrition in mountains of northern Haiti. J. Trop. Pediat. 1978 4: 176-86.
36. Brown, P.J. Republic of Haiti, a cultural summary. Centers for Disease Control, Atlanta, Georgia.
37. Bureau de nutrition. Haiti national nutrition survey 1978. Bureau de Nutrition, Port-au-Prince, Haiti. 1979.
38. CARE. AID/W child survival. Annual report review 1987.
39. CARE. Care for the child I. Annual report 1986.
40. CARE. Project proposal RICHES 1988. CARE. 1988.
41. Cayemites, M. Increasing oral rehydration therapy in rural Haiti through community participation. PRICOR 1987.
42. CARE. CINECO project description 1986.
43. Child survival action program. IHE Port-au-Prince, Haiti. Haiti Country report. Editions de l'enfance.Port au Prince 1987.
51

44. Complexe Medico-Social Cite Simone. Evaluation proposal.1983. Unpublished document.
45. Complexe Medico--Social Cite Simone. Gonaives project. Unpublished document. 1986.
46. Complexe Medico-Social Cite Soleil. Challenging the bottle: proposal for a breastfeeding promotion campaign. Draft version. 1983. Unpublished document.
47. Complexe Medico-Social Cite Soleil. Resultats preliminaires: etude quantitative sur les pratiques de l'allaitement au sein et de 'utilisation du biberon dans I'alimentation des nourissons. Unpublished document.
48. Corbin Advertising Haiti SA. De nouvelles bases pour le serum oral. Corbin Advertising Haiti SA. Port-au-Prince, Haiti. 1986.
49. Coreil, J. Maternal-child supplementary feeding programs in Haiti. J. Trop. Pediatr. 1987 33(4): 203-07.
50. Coreil, J. An evaluation of maternal-chiLI supplementaryfood programs in Haiti. USAID/Washingron, D.C./Haiti. 1983.
51. Coreil, J. Allocation of family resources for health care in rural Haiti. Soc. Sci. Med. 1983 17(11): 709-19.
52. Cotten, J. Evaluation research on the PL 480 title II school feeding program. USAID/Washington, D.C./Haiti. 1985.
53. Daulaire, N. Analysis of the Bureau de Nutrition. USAID/ Washington, D.C./Haiti. 1981.
54. Daulaire, N. Evaluation of Haiti rural health delivery system project. USAID/Washington, D.C./Haiti.
55. Deaton, B.J.and Siaway, A.T. A food Aid strategy for Haiti: Maximizing Developmental Effectiveness. Report of the Technical Support Mission USAID/HAITI. 1987.
56. Departement de la Sante Publique et de la Population (DSPP).Enquete sur la nutrition et la Sante. DSPP, Port-au-Prince, Haiti. 1981.
57. Departement de la Sante Publique et de la Population (DSPP).Compilation de rapports semestriels et annuels d'activites. DSPP, Port-au-Prince, Haiti.
52

58. Departement de la Sante Publique de laet Population.Elements d'evaluation du programme de surveillance nutritionel du centre de sante de Thomonde. DSPP, Port-au-Prince, Haiti.
59. Departement de la Sante Publique et de la Populatiun.Resultats de l'enquete sur la morbidite/mortalite pardiarrhee. DSPP, Port-au-Prince, Haiti. 1981.
60. Departement de la Sante Publique et de la Population. Nouvelles orientations 1986-88: programme de lutte contre les maladies diarrheiques et la promotion de l'alaitement. DSPP, Port-au-Prince, Haiti. 1986.
61. Departement de la Sance Publique et de la Population. Programme de surveillance nutritionnelle. Region Sud. DSPP, Port-au-Prince, Haiti. 1982.
62. Departement de la Sante Publique et de la Population.Rapport final d'evaluation du programme national de controle de la diarrhee et de promotion de l'allaitement materneJ. DSPP, Port-au-Prince, Haiti. 1985.
63. Departement de la Sante Publique et de la Population. Plan d'action du PRONACODIAM. 1986-88. 2nd phase. DSPP, Port-au-Prince, Haiti. 1986.
64. Dieudonne, W. Allaitement maternel. Population et Developpement, juillet 1981.
65. DHFM. October 1982 survty of children and guardians participating in Arniquet, St Louis du Sud and Torbeck rallyposts. DSPP, Port-au-Prince, Haiti. 1983.
66. DIFPAN. Diagnostic preliminaire de la situation alimentaire et nutritionnelle de la population Haitienne. DIFPAN, Portau-Prince, Haiti. 1978.
67. Eustache, L. Organization of health education in Haiti. Unpublished document. 1980.
68. Eye Care. Haiti NOVA nutrition, ORT, VitA. Unpublished document. 1986.
69. Farwel , A. Child Survival Country Strategy. USAID/Washington, D.C./Haiti. 1987.
70. Fazzi, et al. Report on a visit to Haiti (PRONACODIAM). Unpublished document. 1986.
71. Fort, C.J. et al. Cost-effectiveness of mothercraft and other alternatives for Haiti. USAID/Washington, D.C. 1979.
53

72. Foster Parents Plan. Child survival program in Jacmel. Unpublished document.
73. Fougere, W. Commentaires sur l'evaluation des CERNs. Unpublished document. 1984.
74. Fougere, W. Les centres de recuperation nutritionnelle en Haiti. Unpublished document.
75. Genece, E. et al. Growth monitoring as entry point for primary health care. Indian J. Pediatr. (supp) 1988 55: S78-S83.
76. Genece, E. et al. Resultats preliminaires de l'enquete sur l'etat nutritionnel dans la region sanitaire du sud. Unpublished document. 1982.
77. Gerson de Cunha. Up's and down in Oral Rehydration Therapyand Breast feeding. Unpublished document. 1986.
78. Graitcer, P.L. et al. Anthropometric indicators of nutritional status and morbidity. J. Trop. Pediatr. 1981 27(6): 279-98.
79. Graitcer, P.L. et al. Current breast-feeding and weaningpractices in Haiti. J. Trop. Pediatr. 1984 10-16.30(1):
80. Graitcer, P.L. et al. Nutritional status survey Haiti 1978.
Bull. WHO 1980 58: 757
81. Grant, J.P. Haiti child survival programs.
82. Gustafson, M.B. Need for pretesting nutrition picturesbased on research among Haitian villages. Cajanus 1985 ]8(3): 169-75.
83. Haggerty, P.A. Women's work and child nutrition in Haiti. Dept. of Nutr. and Food Sciences. MIT 1981.
84. Halsey, et al. Response to measles vaccine in Haitian infants 6 to 12 months. New England Journal of Medicine 1985. 313: 544-549.
85. Hates, R.E. et al. Comparative acceptability and tolerance study of 2 blended foods in Haiti. Food and Nutrition 1983 5(3): 23-34.
86. Helen Keller International Incorporated. Child survival proposal 1986.
87. Hollant, E. Pictorial illiteracy in rural Haiti. Centre d'Hygiene Familial. DSPP, Port-au-Prince, Haiti. 1975.
54

88. Israel, R. et al. Maternal and infant nutrition reviews. Haiti, a guide to literature. INCS, Education Development Center 1982.
89. Jackson, T. Food aid versus the peasa.t farmers: the case of Haiti. Unpublished document. 1979.
90. Jelliffe, D.B. et al. Nutritional status of Haitian children. Acta Tropica 1961 18: 1-45.
91. JNSP (Joint Nutrition Support Program). Annual reports1983/1984/1985/1986. National for ofprogram control diarrhea and promotion of breastfeeding. PAHO-UNICEF, Haiti.
92. King, K.W. et al. Preventive and therapeutic benefits in relation to cost performance over 10 years of mothercraft centers in Haiti. Am. J. Olin. Nutr. 1978 31(4): 679-90.
93. King, K.W. et al. Un melange de proteines vegetales (AK1000) pour les enfants haitiens. Ann. Soc. Belge Med. Trop. 1966 46(6): 741-54.
94. King, K.W. et al. Cost in relation to benefits for mothercraft centers in Haiti, 1964-75. Paper prepared at Western Hemisphere Nutrition Congress IV. Florida 1974.
95. King, K.W. et al. Food patterns from dietary surveys in rural Haiti. J. Am. Diet. Assoc. 1968 53: 114-18.
96. Kulakov, A. Enquete socio-economique plaine des cailles 1976. Unpublished document.
97. Lerebours, G. Priority Health programs planning. The strategy for management of national primary health care programs. DSPP, Port-au-Prince, Haiti. 1985.
98. Long, R. =t al. Hopital Albert Scheitzer and the republicof Haiti. J. Commun. Health 1986 11(2): 77-91.
99. Mason, J.B. et al.. Identifying nutritional considerations in planning a rural development project in north Haiti. Ecology of Food and Nutrition.
100. Matheson, A. The grim facts of life in Haiti. UNICEF News 1975 85: 21-26.
101. Ministere du Plan. Considerations sur la situation agroalimentaire haitienne. Ministere du Plan, Port-au-Prince, Haiti. 1984.
102. Murray, G.F. and Alvarez, M.D. Childbearing, sickness and healing in a Haitian village. Unpublished document 1973.
55

103. Nicklass, T.A. Survey of nutritional status with emphasis on iron deficiency anemia of a sample population in Cite Soleil. Doctoral Dissertation 1987. Tulane University, New Orleans, Louisiana.
104. Pape, et al. Nutritional evaluation of infants with gastroenteritis. USAID/Haiti. 1981.
105. Patte, D.C. Assistance design of a rural health project in Haiti. Situation analysis and recommendations for EPI and diarrheal diseases components. Resources for Child Health Project. John Snow Inc.
106. Pechevis, M. Programme de lutte contre les maladies diarrheiques en Haiti. Enfants en Milieu Tropical 1985 158: 59-60.
107. Pierre Louis, J.N. Oral rehydratation indicators and diarrheal diseases rates. USAID 1982-85.
108. Pierre Louis, J.N. Oral rehydration program evaluation in rural Haiti. JNSP, PAHO-UNICEF, Haiti. 1987.
109. Pierre Louis, J.N. and Bernadel, M. Etude sur les attitudes et croyances en milieu rural haitien concernant la diarrhee. JNSP, PAHO-UNICEF, Haiti.
110. Plan International Jacmel Haiti (Foster Parents Plan)Annual report Child Survival Report. 1986.
111. Pfrommer, C. et al. Evaluation of the Haitian-American community help organization. Unpublished document.
112. PRITECH. Project evaluation: urban health and communitydevelopment, extended community health and family planningand community health outreach. USAID, Washington, D.C. 1986.
113. Protection materno-infantile. Rapport annuel. DSPP, Portau-Prince, Haiti. 1985.
114. Rawsaon, I.G. Family structure, child location and nutritional diseases in rural Haiti.
115. Roe, T.L. An economic evaluation of the haitian agricultural marketing system. USAID/Washington, D.C./Haiti. 1978.
116. Rosenfield, A. Treatment of childhood diarrhea in rural and urban Haiti. PAHO/Haiti.
117. Rhodes, J.E. Compilation of papers about Haiti 1985.
56

118. Ruel, M. et al. Aspects cliniques et biochimiques de l'ariboflavinose en Haiti. Ann. Nut. Met. 1983 27: 306-12.
119. Salvation Army World Service Office. Annual report for child survival. Salvation Army World Service Office, Haiti. 1986.
120. Saulniers, S.S. Diagnostic de la situation alimentaire et nutritionnelle de la population haitienne. UPAN, Secretair du Plan. Port-au-Prince, Haiti. 1980.
121. Sebrell, W.H.J. et al. Appraisal of nutrition in Haiti. Am. J. Clinical Nutrition. 1959.
122. JNSP Seminaire national de lutte contre la deshydratation diarrheique. JNSP, PAHO-UNICEF, Haiti. 1981.
123. Select Commitee on Hunger, US House of Representatives. Alleviating world hunger: literacy and school feeding programs. US Government printing Office. Washington, D.C. 1987.
124. Seiler, D.B. Annual report to USAID for child survival initiatives. Maissade child survival project. Save The Children Fund/USA.
125. Shorn, I.J. et al. Nutrition surveillance in Haiti: a practical approach. USAID/Washington, D.C./Haiti.
126. Smith, M.F. Changing perceptions of malnutrition: why nutrition education alone is not the answer to hunger. Unpublished document. 1986.
127. Smith, M.F. et al. Socio-economic education and health factors influencing growth of rural haitian children. Ecology of Food and Nutrition 1983 13(2): 99-108.
128. Toureau, S. et al. Evaluation of a program to prevent xerophthalmia in Haiti. Hellen Keller International. 1979.
129. Toureau, S. et al. Assessment of xerophthalmia in Haiti. Hellen Keller International. 1976.
130. USAID/Haiti. Baseline survey of nutritional status and health of mothers and children in Cite Simone. USAID/ Washington, D.C./Haiti 1981.
131. USAID. Changing maternal weaning diet practice. USAID, Washington, D.C.
132. USAID. Agriculture sector assessment. USAID, Washington, D.C. 1987.
57
133. UNICEF. Fait en Haiti, actions pour la survie et le
developement de l'enfant. UNICEF, New York.
134. UNICEF. Annual report. UNICEF, Haiti. 1985.
135. UPAN. Elements de base a l'introduction des considerations alimentaires et nutritionnelles. Ministere du Plan 1984.
136. Van Oyen, H.J. et al. Growth monitoring the pace maker of community health program. Management Sciences for Health. Boston. pl-17.
137. Wallace, C.E. et al. Retrospective review of maternal and child health services at A. Schweitzer hospital in rural Haiti. Bull. Pan Am. Health Org. 1982 16(i): 7-16.
138. Ward, W.B. Community participation in ORT in Petit Goave district. Unpublished document.
139. Waternaux, C. et al. Presentation of growth velocities of rural haitian children using smoothing spline technique. Growth 1987 51(1): 154-64.
140. Webb, R.E. et al. Combining nutrition education with agricultural training in Haiti. J. Nutr. Educ. 1982 14(4): 133-134.
141. Webb, R.E. et al. Indirect influences of training fathers on the food beliefs and practice of mothers. Cajanus 1985 18(2): 100-11.
142. Weise, H.J.C. Maternal nutrition traditional food behavior in Haiti. Human Organization 1976 35(2): 193-200.
143. Weniger, B. Enquete sur la medecine traditionnelle populaire dans la zone de Thomonde. Projet TRAMIL. Ministere de la Cooperation, Paris, France. 1984.
144. World Bank. Current economic position and prospects of Haiti. World Bank, Washington, D.C. 1976.
145. WFP. Aide alimentaire aux hopitaux, asiles et sanatoria. WFP, Haiti. 1987.
146. Zuvekas, C.J. Agricultural development in Haiti. USAID 1978.
58
Addendum
147. Amede-Gedeon, M. et al. Concept paper. World Bank, Washington, D.C. 1988.
148. Institut Haitien de l'Enfance. EMMUS ,reliminary results 1987. Unpublished document. 1988.
149. Johns Hopkins University. Jacmel child survival program evaluation. 1987.
150. Holt. E. Evaluation of the impact of measles vaccination on mortality and nutritional status in Haitian children. Doctoral dissertation. Tulane University, New Orleans, La. 1987.
59

TABLE 1.3.1
Percentage Distribution of Preschool Children by Gomez Classes and Geographic Area: Haiti 1978
De~ree of Malnutritio-'
Geograhic Are-3ob/
<60.0 20
60.0-74.9 10
75.0-39.9 Nor--al 90.0+ Total-/
I 3.0Z 22.3% 48.3% 7c. 4 100.0% (891)
II 5.7% 28.5Z 46.2% 19.6% 100.0% (892)
III 2.5Z 29.3: 45.4Z 23.7% 100.07% (389)
IV 2.7: 23.4% 47.2% 25.3% 100.0% (895)
V 3.% 25.9% 46.0- 24.5% 100.0% (393)
Reoresencative Rural Sample 3.5' 26.0% 46.4% 24.1" 100.0% (L-60)
VI 1.5A 13.1% 43.8% 41.7% 100.0% (893)
Representative National Sample 3.2% 24.1% 46.0% 26.8% 100.0% (5353)
Soecial Gcouo 0.5% 15.1- 8" CG0,. (720
-- Per-:enage of reference median ;eight fcr ace.
'I-Children identified as having pedal ede=. wera not autcmatically classiIfied as third dezree malnutrition.
-/All percentages are weighted by universe population proportions. The actual ntber cf persons sur-.-eved are given in parentheses.
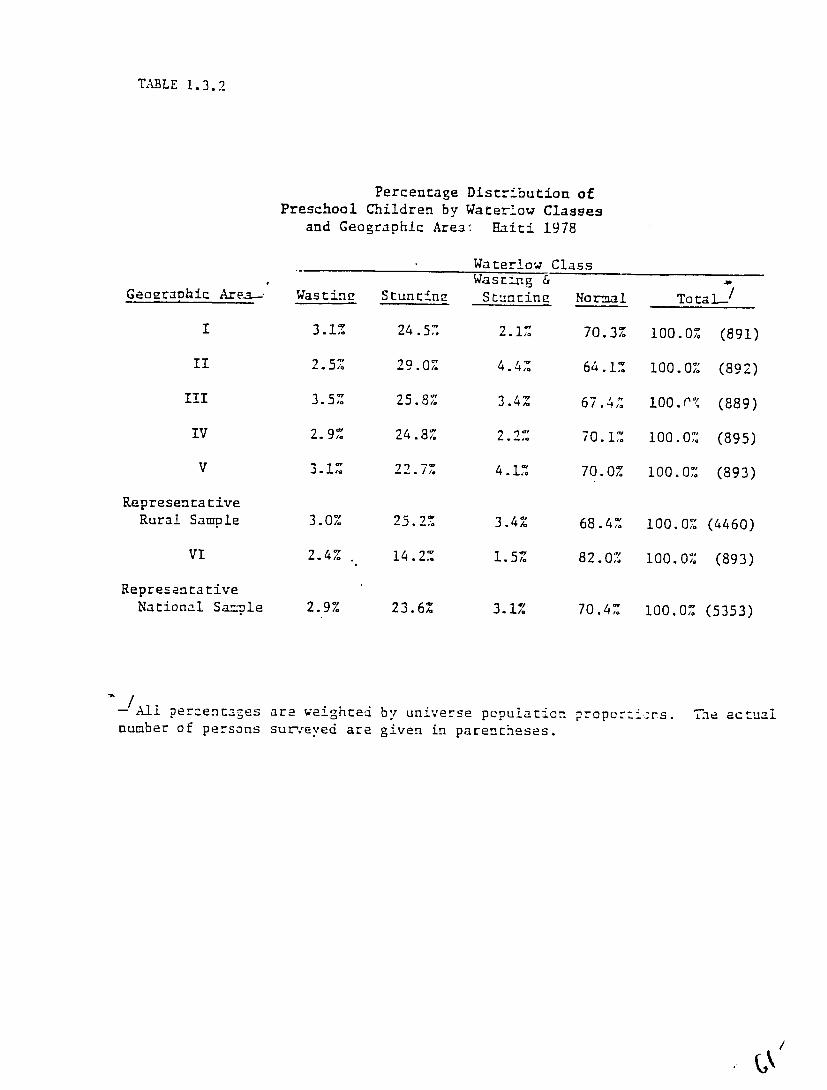
TABLE 1.3.2
Percentage Distribution of Preschool Children by Waterow Classes
and Geographic Area. Haiti 1978
Waterlow Class
Geographic Are-a- Wasting Stunt±nz Wasrtig & Stuntinz NormaI
-TotaL-/
I 3.1% 24.5% 2.1% 70.3% 100.0% (891)
II 2.5% 29.0% 4.4% 64.1% 100.0% (892)
II 3.5% 25.8% 3.4% 67.4%,. 100.r% (889)
IV 2.9% 24.8% 2.2% 70.1% 100.0% (895)
V 3.1% 22.7% 4.1% 70.0% 100.0% (893)
Representative Rural Sample 3.0% 25.2% 3.4% 68.4% 100.0% (4460)
"VI 2.4% 14.2.% 1.5% 82.0,% 100.0% (893)
Representative National Sazple 2.9% 23.6% 3.1% 70.4% 100.0% (5353)
A-Al percentages are weighted by universe population proporhins. The actual number of persons sur,.;eved are given in parentheses.
/

TABLE 1.3o3
Percentage Distribution of
Preschool Children by Weight for Height Classes
and Geographic Area: Haiti 1978
Per~entage of Refe-nce Median Over-
WeizhrWastinz Norma Totale<30.0 80.0-8".9 85.0-119.9 120+
84.6% 0.6% 100.0% (391)5.3% 9.5%
0.6% 100.0% (892)6.8% 10.3% 82.3%
11.6% 80.5% 1.0% 100.0%. (389)T 6.9%
85.1% 0.A% 100.01 (295)1 5.1% 9.3%
V 7.3% 10.8% 81.0% 1.0.% 100.0% (393)
Ra :resentative 100.0% (4460)82.5% 0.7%
.,urai Sample 6.4,2 10.4%
V: 3.8% 7.1% 87.0% 2.1% 100.0% (393)
RE2resencaZ:ive0 1.0-1. 100.0% (5353)6.0% 9.97% 83.!"National Smpe
5.1% 100.0% (730)93.6",0.1% 1.2%Special Group
universe popu.:':ion pro-portions.All per:.entage- are weighted by
gven in paren:1,eses.perscns sur-.Eved areThe actual number of
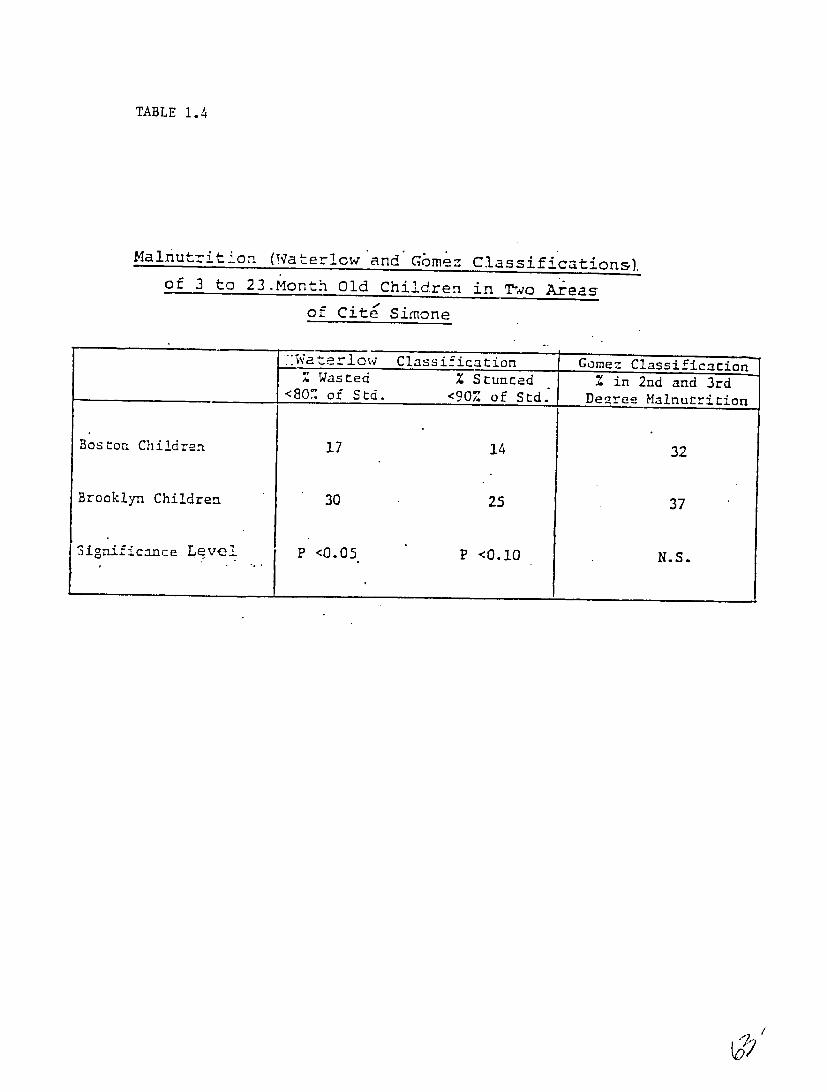
TABLE 1.4
Malnutrition (Waterlow'and'Gmez Classification&).
of 3 to 23.Month Old Children in To Areas
of Cite Simone
Wa erlw Class ifica ion jGoez Classificaion
<80% of Std. <90% of Std.Deree Malnutrition
Boston Children 17 14 32
Brooklyn Children 30 25 37
Significance Level P <0.05 P <0.10 N.S.
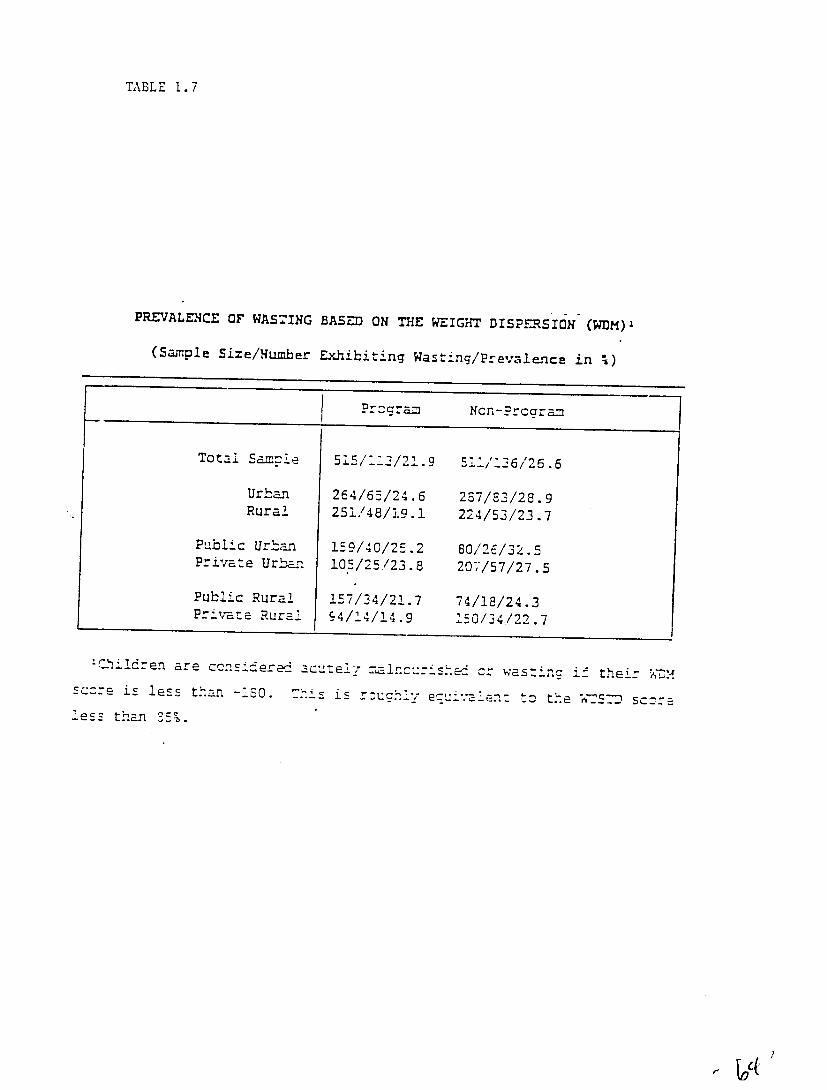
TABLE 1.7
PREVALENCE OF WASTING BASED ON THE WEIGHT DISPu-RSION (WDM)
(Sample Size/Number Exhibiting Wasting/Prevale-nce in %)
Prccram Ncn-Prcaram
Total Samie 515/7-1/21.9 51:/:26/25.6
Urban 264/6-5/24.6 237/8/28.9 Rural 251/48/19.1 224/53/23.7
Public Urban 159/40/25.2 80/26/32.5Private Urban 10-5/25/23.8 207/57/27.5
Public Rural 157/34/21.7 74/18/24.3Private Rural 94/14/14.9 150/34/22.7
.... ren are ccn... erei acutez ial.cu....c c: was:nc i their WDM-sc-reis le_.s than -150. Thi is r-ah '--.ene zis less . ..... is., h ~ to the rer-"7 sc--=
leS- than 35%.
'</
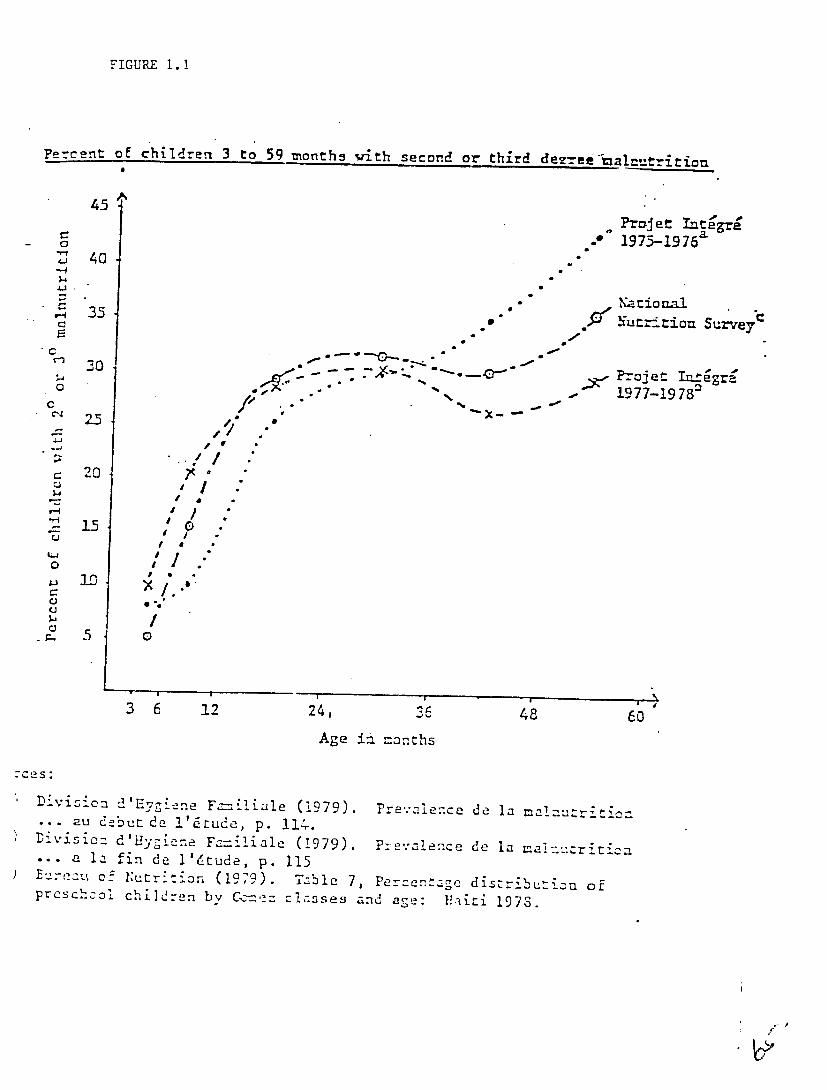
FIGURE 1.1
Percent of children 3 to 59 months with second or third dezu--alj11=trtion
4 5
P-rjet Integre
4J 40 -f-f
= - Narional
-Nutrition Survey
* G-
30 - * " o-
.
PN- -ojet Thtegr " *4o
- 1977-1978 °
C14 2-5
0 20 .15
ZU d 1 a f
0I I / °"
5
Ag a moth
.-.- 5 0
e 1
36 12 24, 36 48 6
Age in months
Division d'Evgiene F -- iniae (1979). Prev.°aence de la m:nutri. .. au debutde l'fiude, p. 114-.
Divisic: d'Uyg -ne F--_i 1 iale (1979). P:-=,'acence de la anuriticn • . a la fin de l'4tude, p. 115
Buau of N~utri:ion (1979). Table 7, Percentage distributinn ofpschcoo children by Cc'=z clzsses and 1!.iriage: 1978.
pros
1"
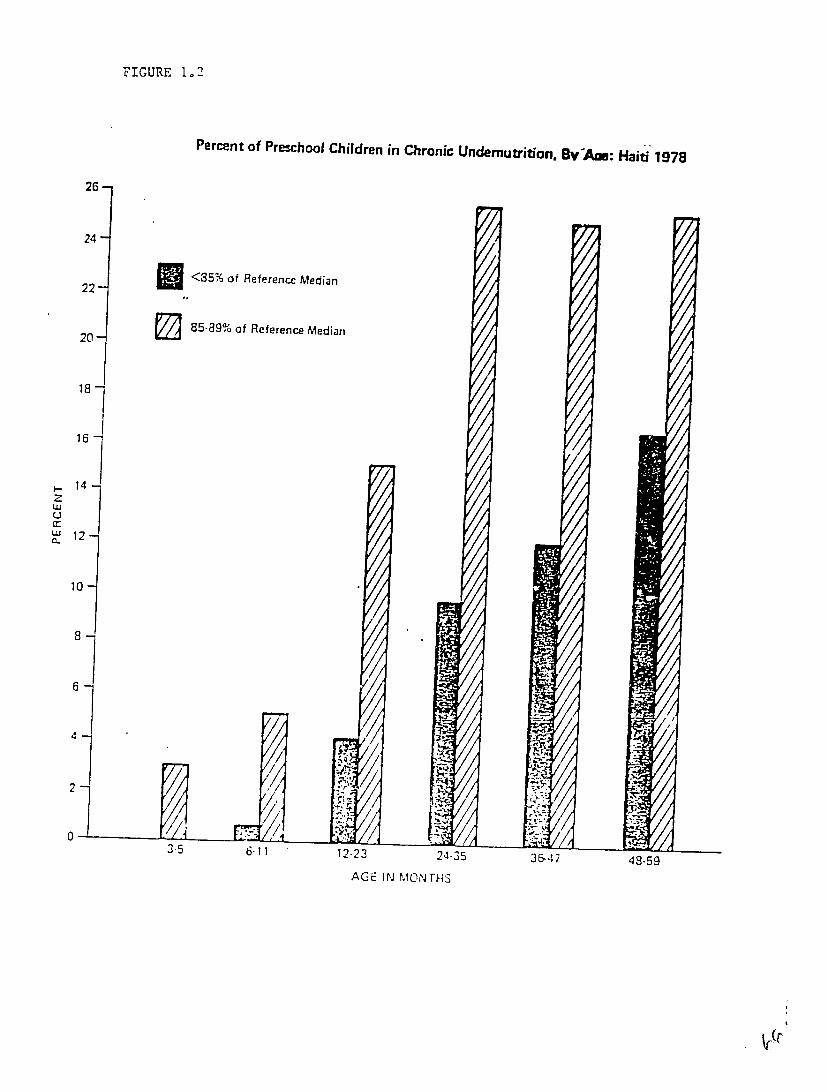
FIGURE 1.2
26
Percent of Preschool Children in Chronic Undemutrition, Bv-AM: Haiti 1978
24
22
20-
<35% of Reference Median
85-89% of Reference Median
18j
167
S14
w
W 120.
10
8
2
0 3.5 6-11 12-23 24-35 J&-47 49.59
AGE IN MONTHS
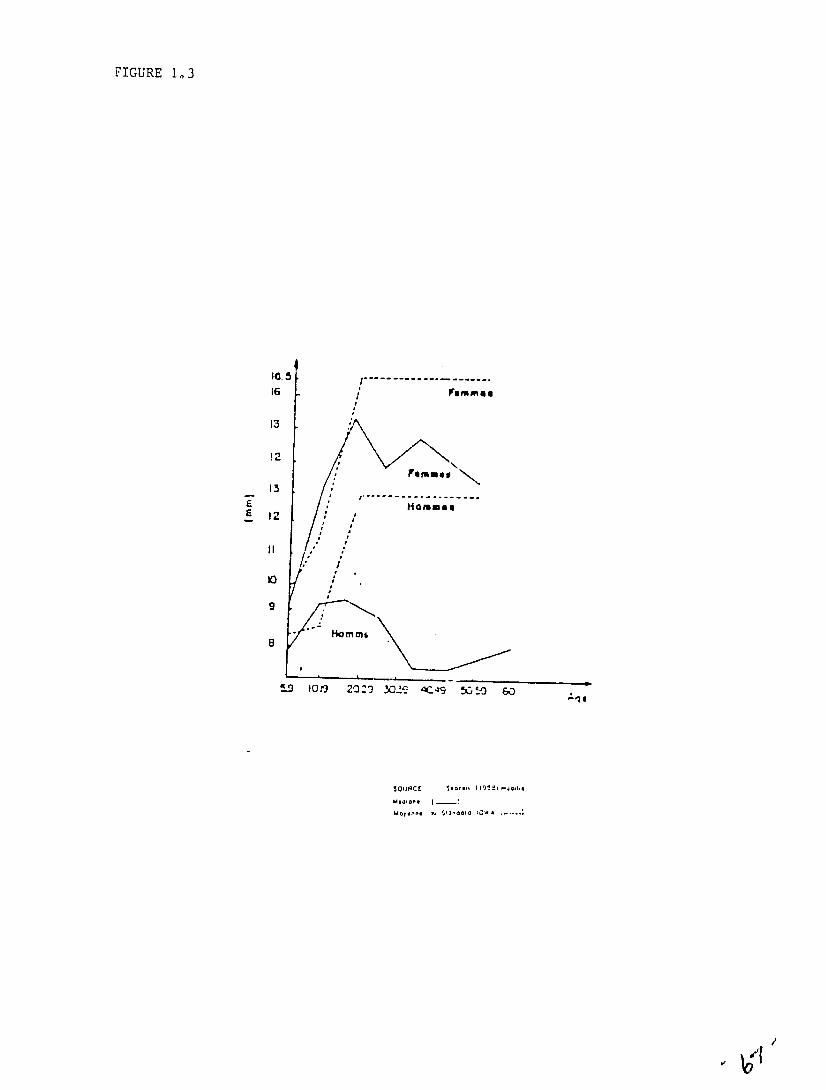
FIGURE 1,3
E
I1..5
16
13
12
13
12
11
:
#,
l-..
/
/
.. . ... . . .
rum mea
FrmIs u
"-
8
5 -D 10 9
o:
m
amm6
2 0 S2 30 £ C- 9 [i "9 0
MOM - Stancod IC-, A .

Median Measures of Maternal Nutritional Status by Age In Cite Simone, Haiti, 1981
% HIAHES Weight BoyFa
for Height
Age Nby Age Wt/11t 2 Moore Method Cohn etal.lethod
1.5-19 10 86 2.03 26.5 23.4
20-24 68 85 2.00 25.8 24.8
25-29 66 78 1.94 24.2 24.9
30-34 43 82 2.01 26.5 26.1
35-39 35 75 1.99 25.4 28.1
40-44 13 76 2.01 25.8 30.5
45-49 12 78 2 08 27.6 28.5 50-59 6 76 2.01 25.9 29.5

--
FIGUPE 1.4
Prevalence of Anemia' in Preschool Children, By Age: I{ailti 1978 50
45
40
•2... :"... ;.
35
30
25
20
15 -6,
10 -'.
::::
6-11 12-23 24-35 36-47 48-5 9 -' -
AGE IN MONTHS Anemiz detined as a hemoglobin vatue of <10 gns; I00 cc for ages <24 months and <11 gms/100 cc for ages '14months.

.Provaluncu of Aitenijai in Preschool Children by Geogruphic Area: Haiti 1978
ho'
-
30 -
1j:1I- .15
711
25
20 ::.- .: I; . : :
15
10
A.: :. .
: ..:i::
U1ulvui
)
nvUniv IIlIV V
GEOGRAPIC AREA :::;::
.:.: -:
Univ VI
Represeit ta tivo Ruial Sample
Represer1tailive National Sample
!:
1Anewia -1efined as a hemoglobin valu:e of <10 ginsI100 cc for agai <24 11wriths and <11I grns/100 cc for agps >?4 fronths.
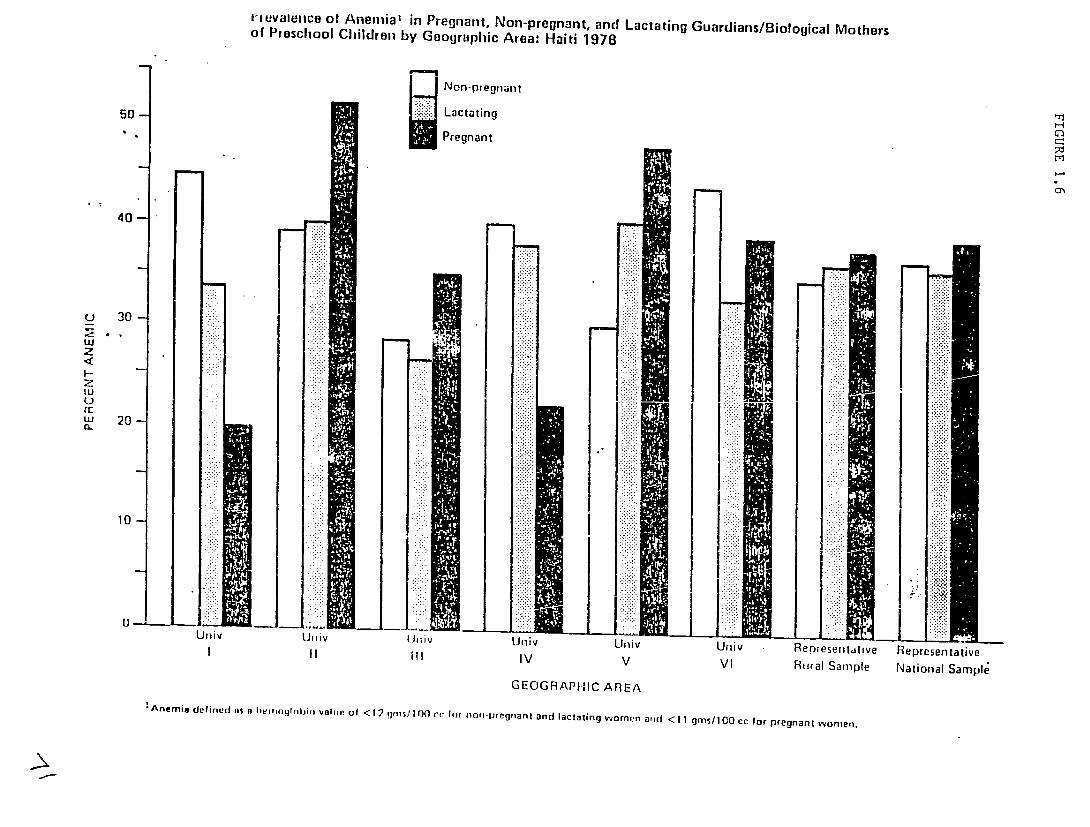
1-tevaleice of Anemia1 in Pregnant, Non-pregnant, and Lactating Guardians/Biological Mothersof Preschool Children by Geographic Area: Haiti 1978
Non-pregnant
50- Lactating
Pregnant
40-
U 30
z
z LUU" Lu 20!
CL
w .. 10I
U~lv ~ lv Iii -- UivLlivUniv Represellrftlve- Representative"III Ill IV V VI Rural Sample National Sample
GEOGRAPIIIC AREA !Anemia definertlA al$htrnglntjir, vahne of <12 O r'cforires/1 non-pregnant andJ lactating women arotI <11 gins/100 cc !or pregnant WOmen.
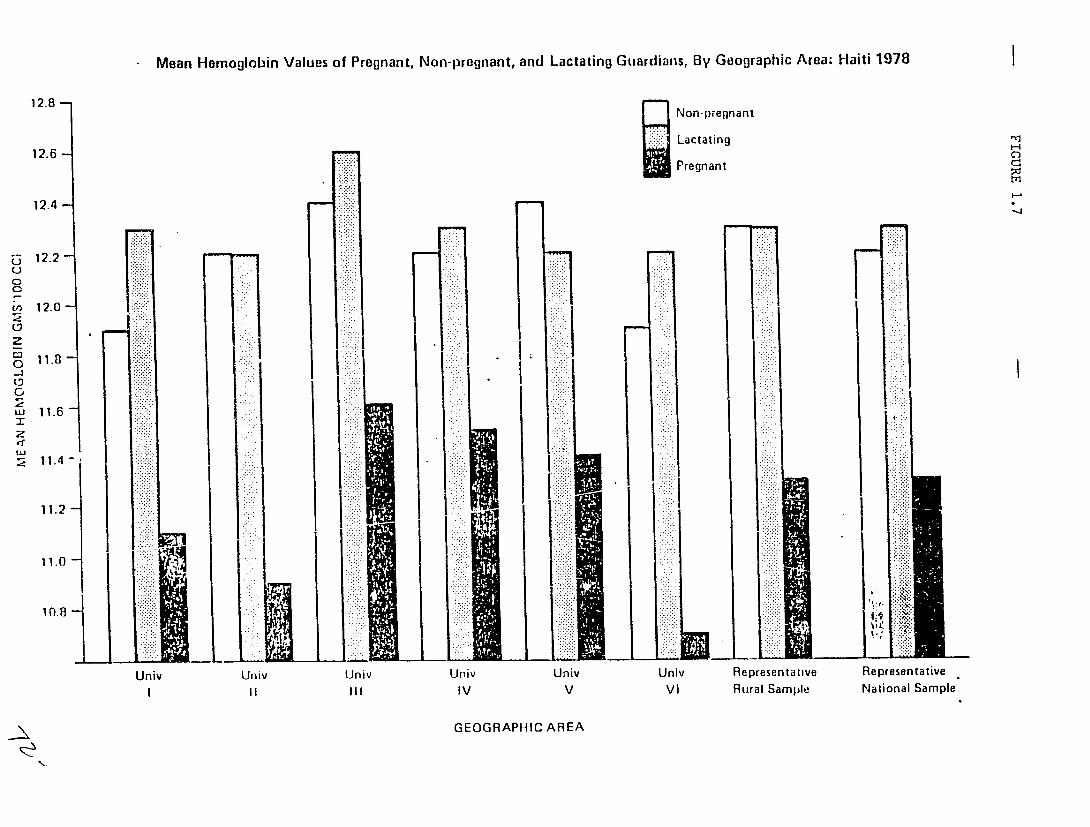
Mean Hemoglobin Values of Pregnant, Non-pregnant, and Lactating Guardians, By Geographic Area: Haiti 1978
12.8- L8- Non-pregnant
Lactating12.6 - Pregnant
12.4
12.2 ...... ....U
0
,,12.0
w 11.6
2:
11.4
112i~!:: ..Ii
11.0
Univ Univ Univ Unliv Univ Univ Representative Representative IV V VI Rural Sample National Sample
GEOGRAPHIC AREA

t-4
H
td
Percentage Distribution of Preschool Children being Breast-Fedat the Time of the Survey by Age of Childand Geographic Area: 1laitl 1978
"_____n__onthsIinMonths IGeographicIIII Area-/
IV 3-5 Vl100.0% (44)
V Total 1 /98.3% (60) 100.0% (55) 96.7% (60) 100.0%
6-11 (56) 90.2% (61)95.1% (103) 97.3% (336)97.3% (113) 96.3% (108) 90.9% (99) 94.1% (135)12-23 71.7% (113)59.7% (181) 91.0% (671)66.9% (175) 60.5% (195) 50.3% (177) 53.6% (237)24-35 28.9% (166)0.6% (157) 53.1% (1131)5.4% (184) 5.2% (153) 3.1% (162) 5.8% (121)36-59 3.1% (161)0.4% (275) 4.3% (938)- (262) 1.1% (265) 0.4% (275) 1.2% (249)Total- 1.6% (254)33.2% (760) 0.8% (1580)37.3% (794) 37.1% (776) 31.4% (773) 40.1% (798) 25.6% (755) 34.6% (4656)
-All percentages are weighted by universe population proportions.biological mothers were questioned about the breast-feeding The actual number of oreschool children'whosestatus of their children is given in parentheses.

Age of Hother in Years
<25
25-34
35+
Total
Age of Mother in Years-
<25
25-34
35-.
Toital
Percentage
< 12
!9.5%
10.4%
8.2%
10.9% (245)
<12
51.9%
.2
32.7%
43.7% (240)
Distribution of Survey Children's by Age of Mother: Haiti 1978
Representative Rural Sample
Age of Child at Weaning (in Honths)
12-17 111
42.8% 36.9%
36.8% 52.3%
26.9% 64.7%
34.4% (857) 54.4% (1361)
Urban Sample
Age of Child at Weaning (in Months)
12-17 111f-
20.7% 12.6%
28.2% 17.6%
34.5% 29.2%
27.i% (152) 18.8% (103)
Age at Weaning,
IIt!,ju r BIr f edrea: L
0.9%
0.5%
0.1%
0.4% (8)
Never Breast-fed
14.8%
10.0%
3.5%
9.8% (54)
To ta lS/
100.0% (295)
100.0% (1316)
100.0% (860)
100.0% (2471)
Totala/
100.0% (135)
100.0% (301)
100.0% (113)
.100.0% (549)
E/All percentages are t lted by univerne poptilation proportions and are bared on
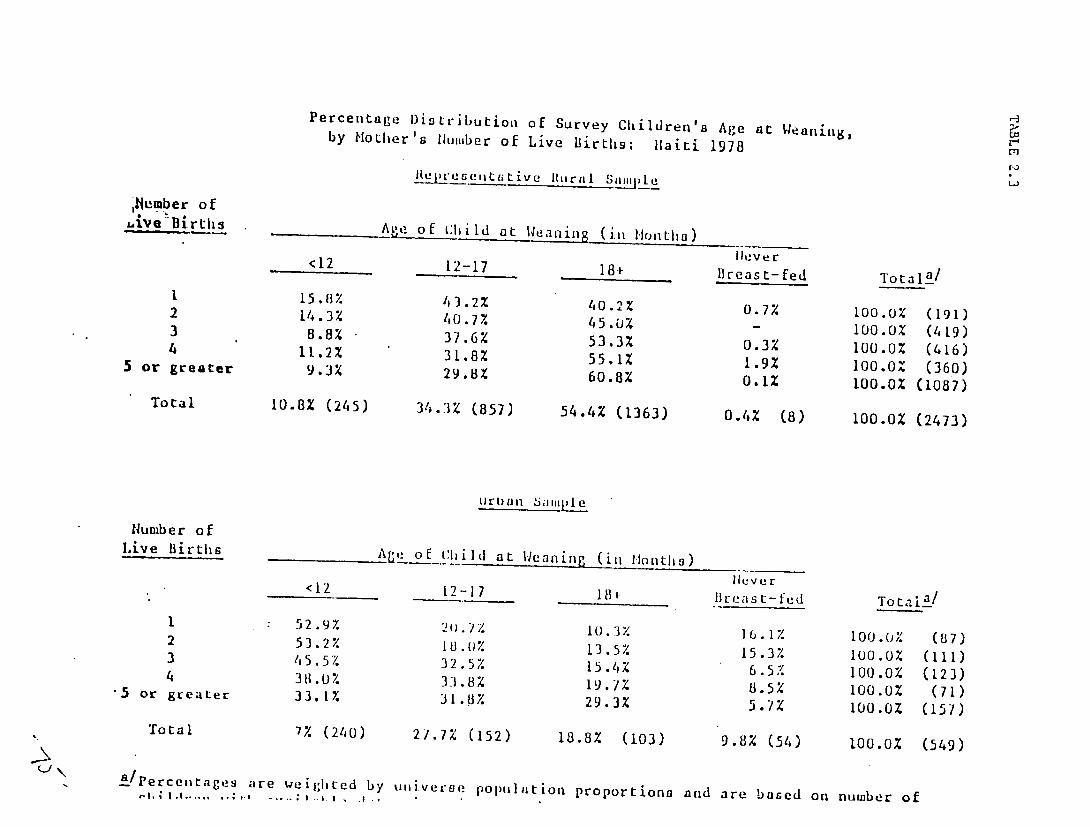
Mumber of ,uive BirtLhs
1 2 3 4
5 or greater
Total
Number of Live Births
1 2 3 4
-5 or greater
Total
Peae/tge ' -r... .. ,
Percentage Distribution of Survey Children's Age at Weaning,by Mother's Ilumber of Live Births: Haiti 1978
U{eree,,tekttive Itural Sample
Age of hlitd at Weaning (iln Months) Ileve c <12 12-17 181- Breast-fed Totala_/
15.8% 43.2% 40.2% 0.7% 100.0% (191)14.3% 40.7% 45.0% - 100.0% (419)8.8% 37.6% 53.3% 0.3% 100.0% (416)11.2% 31.8% 55.1% 1.9% 100.0% (360)9.3% 29.8X 60.8% 0.1% 100.0% (1087)
10.8% (245) 34.3% (857) 54.4% (1363) 0.4% (8) 100.0% (2473)
Age of_lild at Weaning (ii lonths) liever <12 12-17 184 lBrea st-fud To t al2_/
52.9% 10.3%20.% 16.1% 100.0% (87)53.2% 18.0% 13.5%45.5% 15.3% iuo.Oz (I11)32.5% 15.4% 6.5% 100.0% (123)38.0% 33.8% 19.7% 8.5% 100.0% (71)33.1% 31.8% 29.3% 5.7% 100.0Z (157)
7% (240) 21.7% (152) 18.8% (103) 9.8% (54) 100.0% (549)
are weighted by uiiveroe poptilation proportions and are based on number oflb -,,..... I .. I
r f
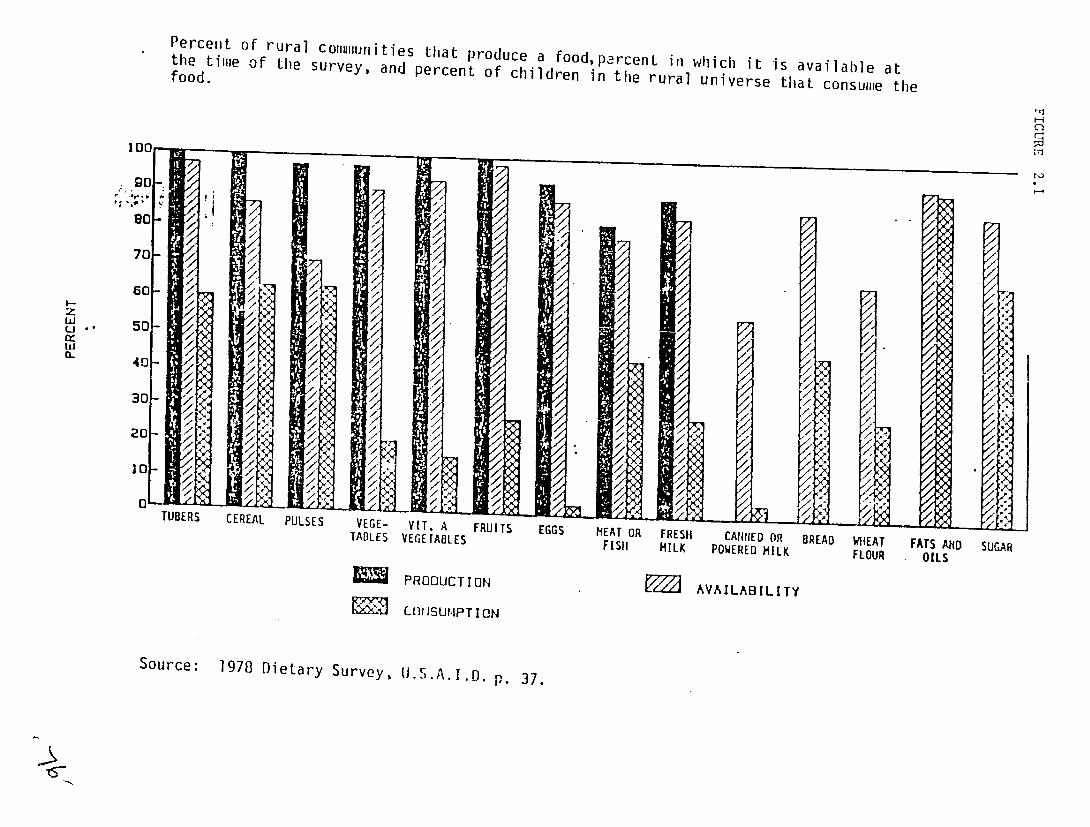
Percent of rural coulluInities that produce a food, percent ill which it is availahle at the time of the survey, and percent of children in the rural universe that consume thefood.
r1
100
7
..
CL
60-
70
50
50
40
7
//
7/
/
/
4
/
/
/ < /
7X
/ //,/
/
'
7
x,
"
"
X7
/
'(
<'
4
-
0 TUBERS CEREAL PULSES VEGE-lADLES
VIT. A VEGETABLES
FRUITS EGGS MEAT OR FIS11
FRESH MILK
CANNED OR POWERED MILK
BREAD WHEAT FLOUR
FATS AND OILS
SUGAR
PRODUCTION
COIRSU.IPT ION
AVAILABILITY
Source: 1978 Dietary Survey, )..A.I.D.p. 37.

TABLE 2.7
QUANTITE DE NUTRIMENTS CONSOMMES PAR ENFANT/JOUR
LEUR ADEQUATION PAR RAPPORT AUX QUANTITES RECOMMANDEES
UNAUTESCOMM AGE IOTEN CALCRIES PROTEINES VITAMIYE A
d'Ad4q. d'Addq. d'Ad~q. d'Ad sq.
Pond Droit 33 826 57,0 17.3 60,0 486 194,0 6.4 64,0
La Montagma 40 852 59,0 15.5 53,0 822 329,0 8.2 82,0
OrAngm rn 39 1.267 87,0 33.5 116,0 195 78,0 10.3 103,0
SOURCEs Bureau do Nutrition, 1977.
./
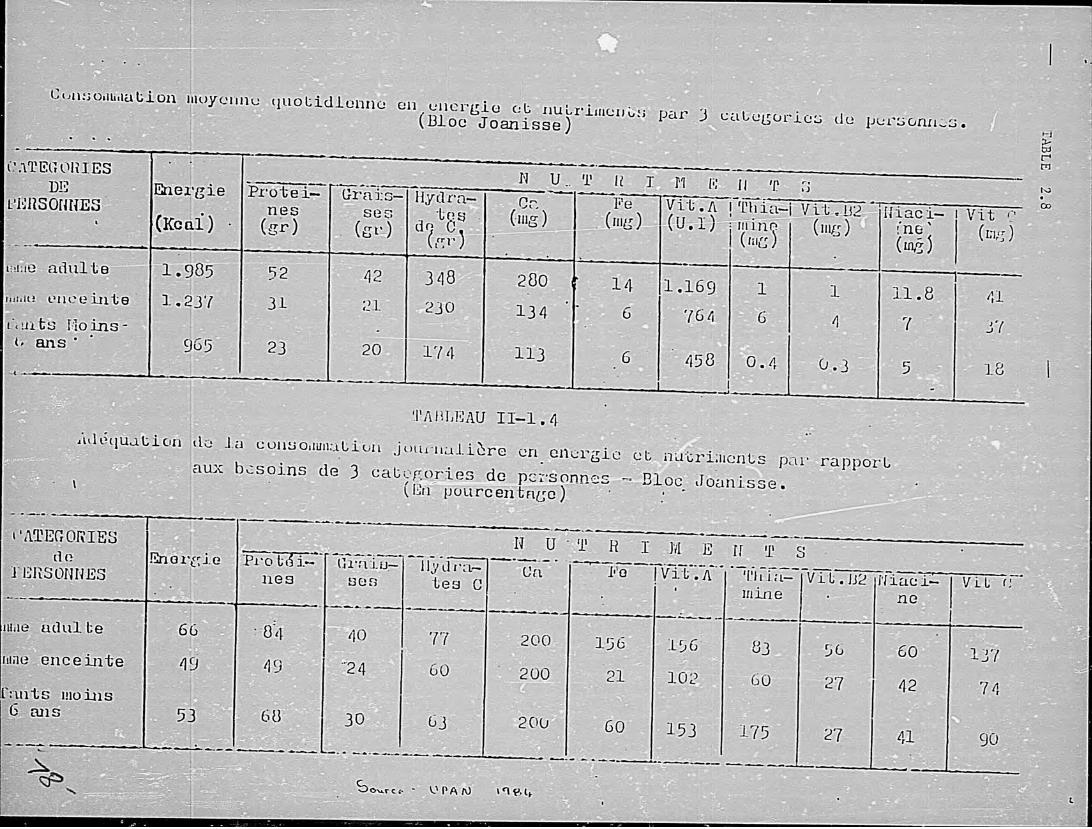
-C-
4.C
~ D
d
0 C
-C
CD
CD~
a
CD
C7
C. &
C
.+
zr,
P
~
r
-~r
C
\ L
-q~
T
~
CD
0 o ::!
H
O
L
-r
C=
C
'c
(7
I &
-S:C
)
01
-I
CD
C
0 O
tV
*1.o
H
~~
.c
Ig
,
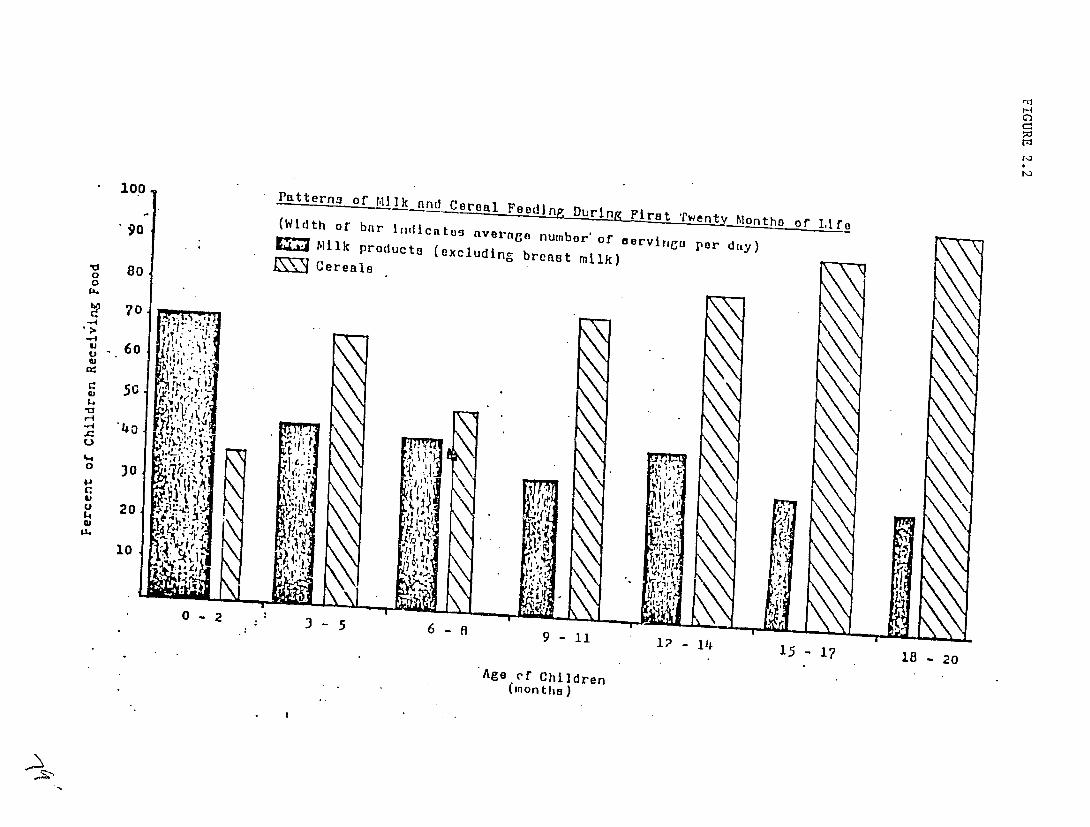
C--
V 0
-0
go
80
-00Patterns of MIlk and Cereal Feeding During Firt (Width of' bar indicates average numbor'of ervirV7. Milk products (excludin, breast milk)
1 Cereals
per
M
-4 70
CU
60 "- . ,
C 5G '
-4o
o 30 j" ,
10
20 r .0.
- t ZI
10 21 9 -9 11 i?-l
15 17 18 -20
Age rf Children (Inon tie )
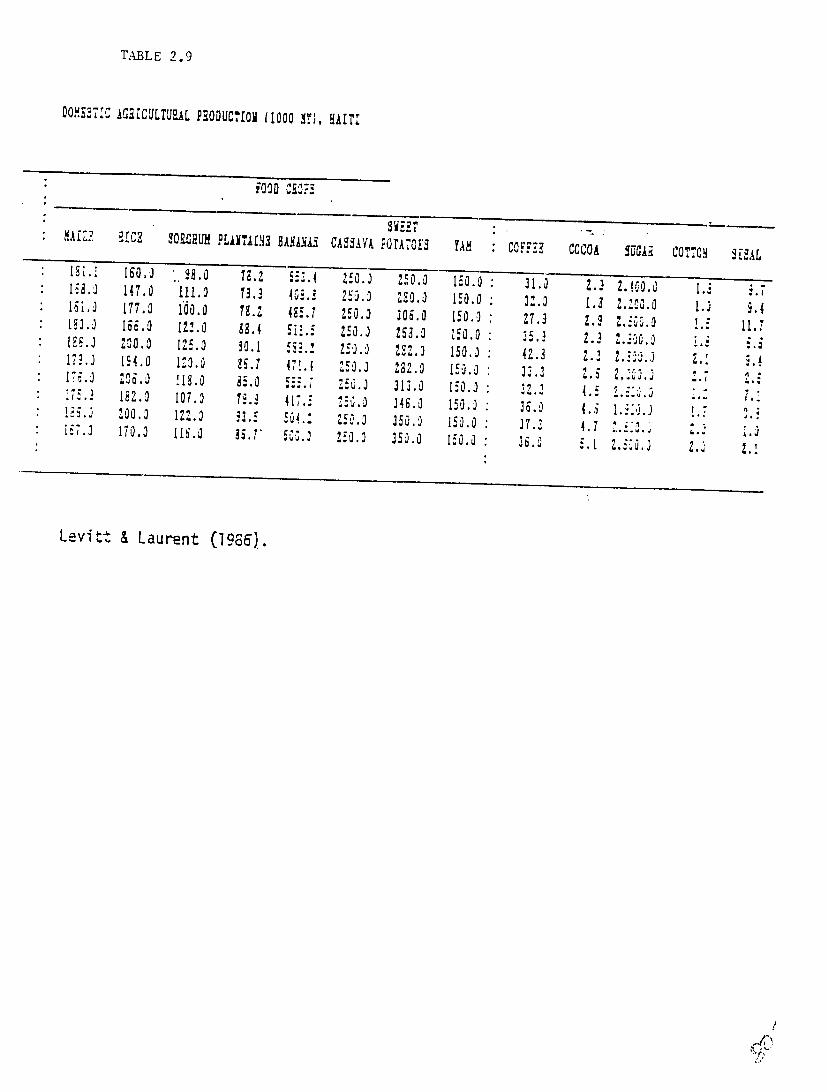
TABLE 2.9
DO'MS271Z AG21C ULTUEAL PRIODUCTiO (1000 .1), HAITr
FOOD Ci..
MAfZ.? a1CE SOURUH PL11T7,f13 HBAMLWACASSAVA POTAOE' TAX COFFEE 7 OA ,UGAR SISALCO,,CY 18.' 160.0 . i3.1 , 250. 250.0 150.0 '.31.7 .3 .. ;* 18.0 147.0 111.0 13.3 4,0., 2S0.0 20.3 150.0 3..* 18i.0 1.3 .i0.0 .J177.0 I'00.0 ?.,, 485.7 250.0 306.0 150.2 •* E 7.3 2.9 Z.5:C.o 1.5 11,7186. 18.0 13.0 89.4 5i1.5 150.01 83.0 150.0 35., 2.3 ..16.o* 188.2 2,00.0 125.0 30.1 i.3 8.85 .- 25. 232.2 150.] 4.3 .17..]* 14.0 MO.0 .:88.1 47.1 252. 282.2 150.0: 33.3 .. 2,'.* 178.0 208.0 118.0 35.0 5557 ZS.,
. 313.0 150.0 : 33.317i;'5.3 107.0 18.3 417.5 250.]
4.5 1:.182.0] 248.0 150.0 36.0 4.5 l..2 . ?"* 1.. 200.0 1.0 .3. Hi "50 . 1. 350.0 150.0 37.2187.'2 170.0 I16.0 88.7' 4.7 .. ,501 .2 250.0 350.0 150.0 3i.0 .1 2.5hi.2 2. 2.1
Levitt & Laurent (1986).
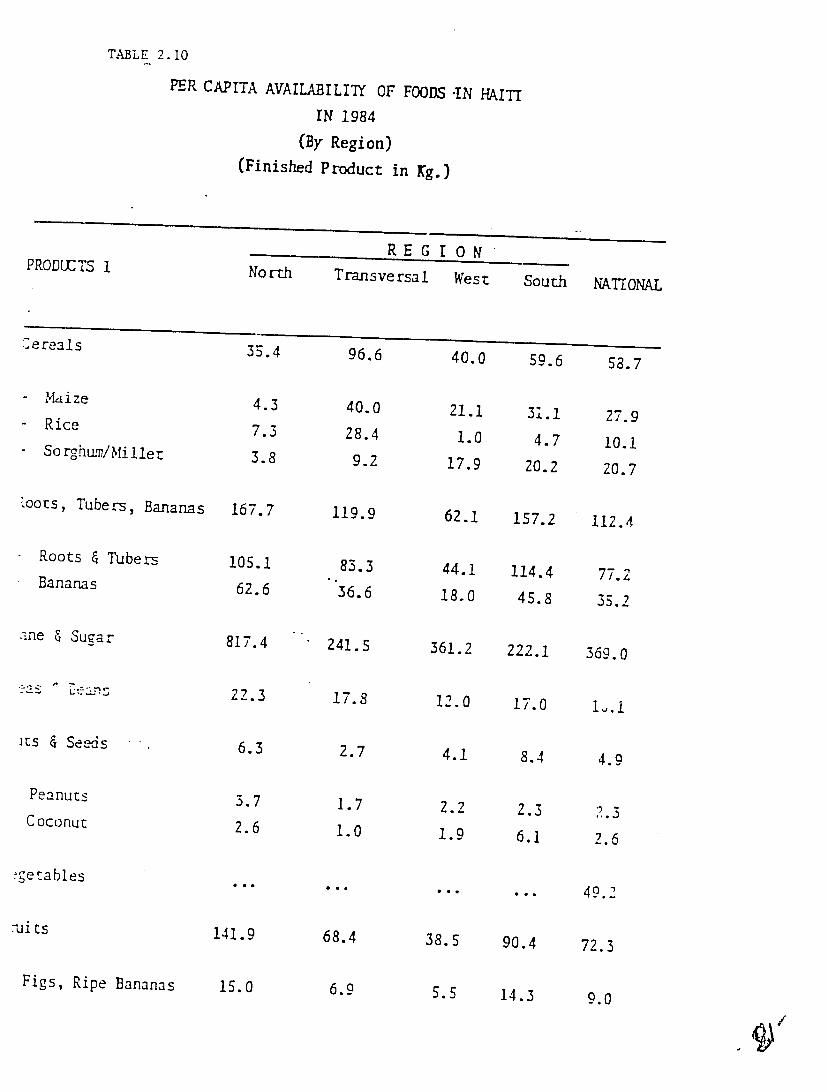
TABLE 2. 10
PER CAPITA AVAILABILIIY OF FOODS -IN HAITI
PRODUCTS 1
Cereals
- Maize
- Rice
Sorghur/Millet
toots, Tubers, Bananas
Roots & Tubers
Bananas
.me & Sugar
its & Seeds
Peanuts
Coconut:
:g-etables
-uits
Figs, Ripe Bananas
IN 1984
(By Region)
(Finished Product in Kg.)
RE G I ONNorth Transversal West
35.4 96.6 40.0
4.3 40.0 21.1 7.3 28.4 1.0 3.8 9.2 17.9
167.7 119.9 62.1
105.1 83.3 44.1 62.6 36.6 18.0
817.4 241.5 361.2
22.3 17.8 12.0
6.3 2.7 4.1
3.7 1.7 2.2 2.6 1.0 1.9
141.9 68.4 38.5
is.0 6.9 5.5
South NATIONAL
59.6 58.7
31.1 27.9
4.7 10.1
20.2 20.7
157.2 112.4
114.4 77.2
45.8 35.2
222.1 369.0
17.0 i..i
8.4 4.9
2.3 3
6.1 2.6
49.2
90.4 72.3
14.3 9.0
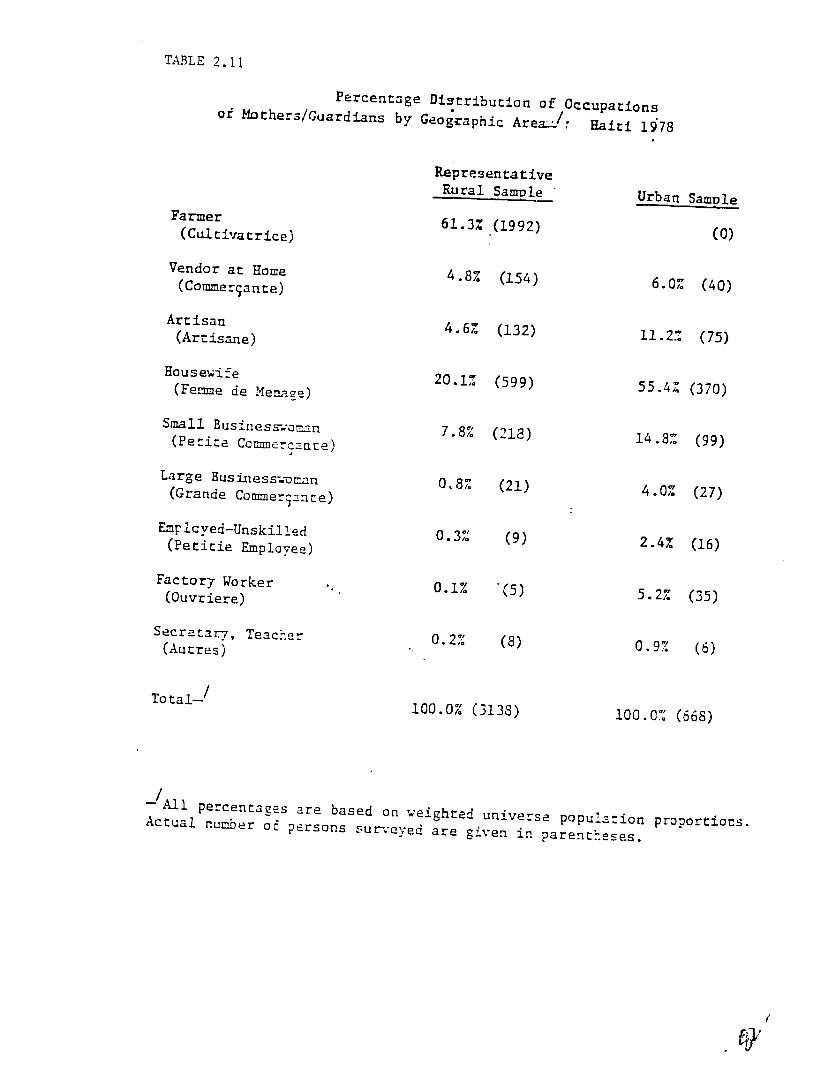
TABLE 2.11
Percentage Distribution of Occupationsof Mothers/Guardians by Geographic Area J/ Haiti 1"78
RepresentativeRural Sample Urban Samule
Farmer 61.3% (1992) (0)(Culrivatrice)
Vendor at Home
(Comrmerjante) 4.8% (154) 6.0% (40)
Artisan (Artisane) 4 6
4.6 1 2
(132) 11.2% (75)
Housewife
(Femme de Menage)Small Busines-,.-o.=.
20.1%
7.8%
(599)
(213)
55.4%
14.8%
(370)
(99) (Petite Ccmmerane)
Large Business.-man(Grande Commer~antce)4.% 0.8% (21) 4.0% (27)27
Empicyed-Unskiled
(Petitie Employee) 0.3% (9) 2.4% (16)
Factor 7 Worker
(Ouvriere) 0.1% (5) 5.2Z (35)
Secretar7, Teacher
(Autres) 0.2% (8) 0.9% (6)
Total--/ 100.0% (3133) 100.0% (668)
-All percentages are based on weighted universeActual number population proportiocs.o persons surveyed are given in parentheses.
A)/
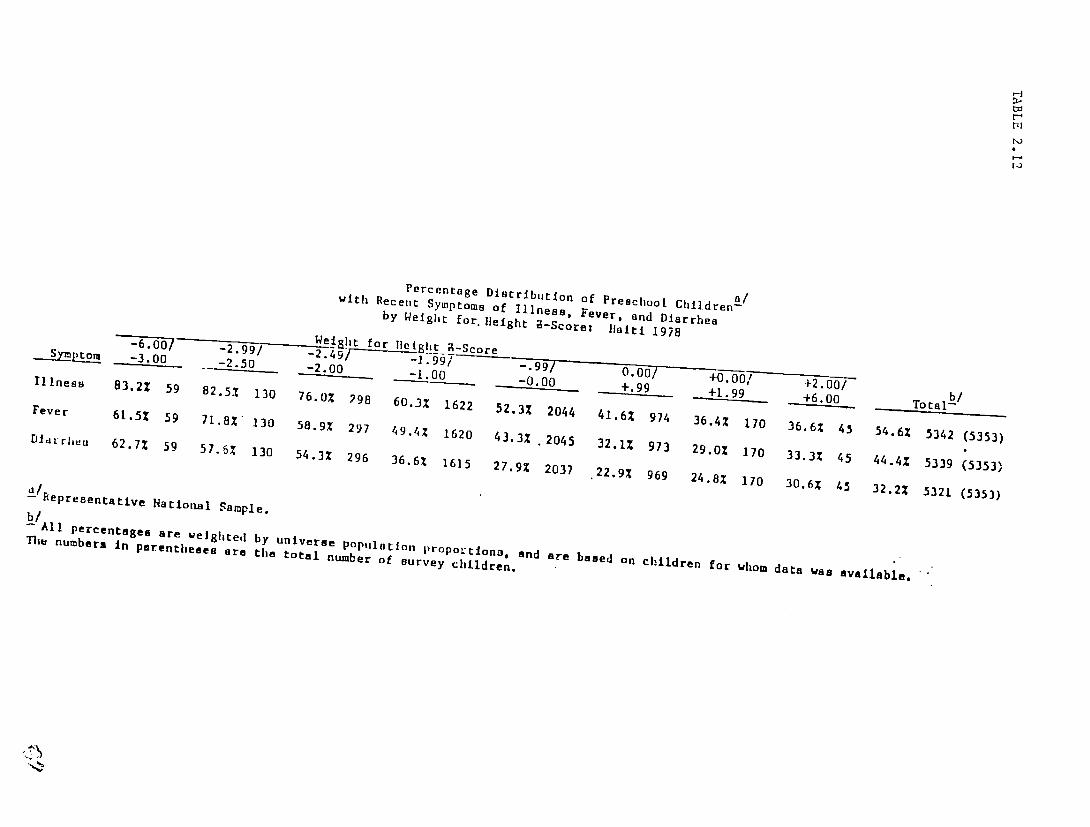
Percentage Distribution of Preschool Childrena /withbRecei Symptoms of Illness, Fever, and Diarrheaby Weight for.Height 9-Scorei 1laiti 1978--- 2-- Weight for-3.00 - 2.99 / lei It Score -.99AS/ /Illness __
83.2% 59 2. 099 -2.495 .9 9/82.5Z 130 76.0% 298 60.31 1622Fever -1.00s 52.3%61.5Z 59 - -900. -0.002044 +.90 +-- +6.41.6%71.8X" 130 974 36.4%58.9X 170297 49.4%130 6.0%?98 99 _9 36,6% 456.00Total-b1620 54.6%Diaurhea 43.3% .2045 5)42 (5353)62.7% 32.1% 97359 57.6% 29.0Z130 17054.3% 33.3Z296 36.6% 45 44.4 53391615 27.9% (5353)2037 .22.9% 969 24.8z 170 30.6% 32.2%45 5321 (535)
b/All percentages are weighted by universe Population propol-tIons,The numbers In parentheses are the total number of survey children. and are based on children for whom data was available,' .
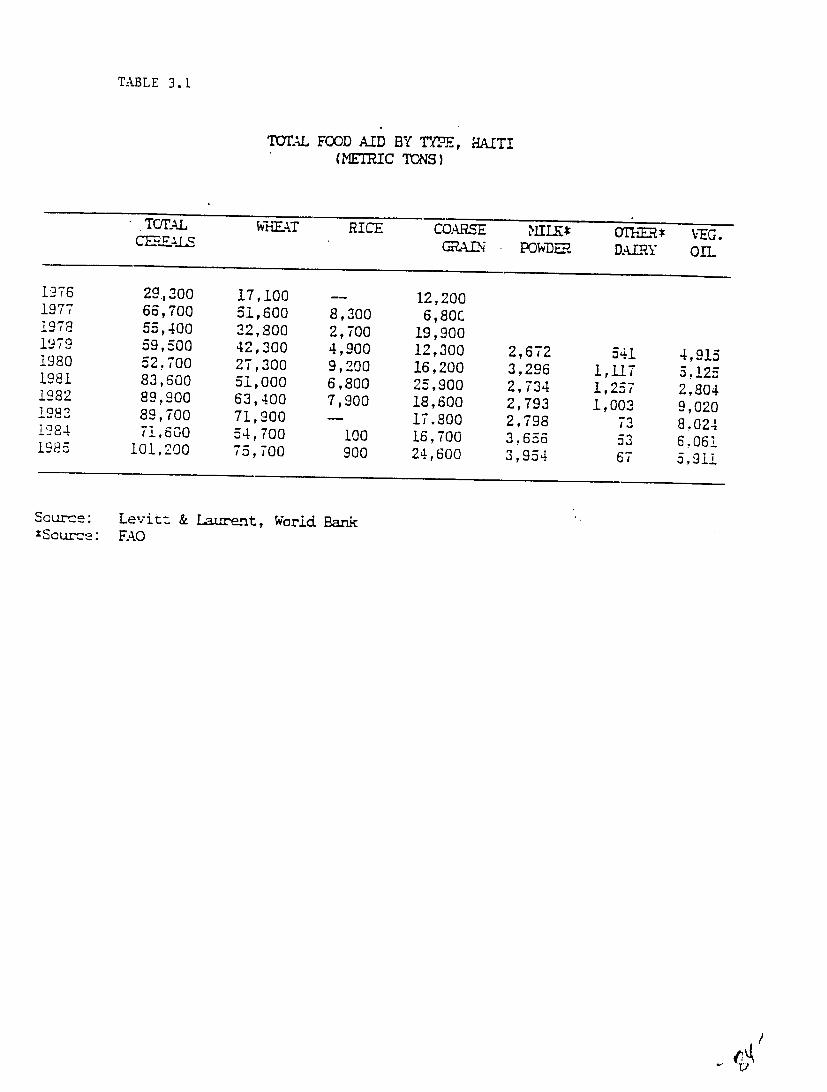
TABLE 3.1
T=TLAL FOOD AID BY TYPE., (METRIC TONS)
HAITI
1976 1977 1978 1979 1980 1981 1982 1982 1284 1985
TOTAL CMES
29,300 66,700 55,400 59,500 52,700 83,600 89,900 89,700 71,600
101,200
WHEAT
17,100 51,600 22,800 42,300 27,300 51,000 63,400 71,900 54,700 75,700
RICE
--8,300 2,700 4,900 9,200 6,800 7,900 -
100 900
COARSE N
12,200 6,80C
19,900 12,300 16,200 25,900 18,600 17.800 16,700 24,600
MLILK* POWD-.
2,672 3,296 2,734 2,793 2,798 3,656 3,954
X1iE DAIRY
541 1,117 1,257 1,003
73 53 67
VEG. OIL
4,915 5.125 2,804 9,020 8.024 6,061 5,911
Source: XScur-e:
Levitt & Lugrent, World Bank FAO

.......
.........
. ....
. !!:
'!i !
! i!
iii i
i::ii
!...........ii
i
q
- ....
.....
i~i
,- , ,,-
* "
"r " "
y. . ,
,!
'
. !
',x ,
' "
':
........
...
!: :
ii.
.. .
' 'L
,
iii.
: i i~
i
' :..
V ;
: "i
, i
ii1
!i,
4
Co
i.' ''
',
. ..
i-i
F .'.r 7
4
-TII
-TK
-
r'N
'
11
<1
. ~
.
....
.-7(
.I p

ANNEX I
Instrument for Data Collection at the Level of Field Manager
A. General information
Site Name
Organization Name
Interviewee: Name Position Length of time with
program
B. Target Population
1. Total population covered by program 2. Total 0-5/0-3 years 3. Total women 15-49 years 4. Was a ce:ntuis U'one
1. ye~ 2.no
C. Types of services provided to population
1. nutritional preventive curative a. supplementation 0-5 b. supplementation women
_c. GM/P J. VITA e. Iron f. Folic acid
_g. education
2. Child health 1. immunizat ion 2. ORT 3. malaria treatment 4. simp]e curative
_5. other( list)
3. Maternal health I. prenatal care(list services)
_2. family planning services _3. other, specify
4. Community developmenL -1. income generating activites(describe which, who participates and
mechanisms of' organization) 2. home gardens 3. water/sanil.ation 4. other(describe as above)
5. Agrictltural projects(describe)
Al- I

- - - - - - - - -- - - - - - - - ---
-----------
D. Through which channels are services delivered? -I. fixed facilities(#) _2. rally posts(#)_____ 3. household visi ts
E. flow are outreach services organized in terms of division into sectors and
population served
F. What is the staffing and function at each level of the system
Level Personnel types services provided
Fixed facilities
Rally posts
Community
G. Are all personnel salaried?
H. If not 1. which are not
I. What types of iniLial training was given to personnel at each level in the system(personiel who are involved in nutritional components):
Personnel length topics covered performance training evaluated
J. What are the types and frequency of refresher course given at cacti level
Personnel length of t:opics covered performance training eval.tia ted
K. Is training adequate as it is currently done?
L . If not, why not
M. Are any modif ications needed in the current training/refresher plan?
N. If so, which?
0. Are manuals given for training
Al-2

-------------- --------------- ---------- --------
Supervision
External: 1. How often is this program reviewed by central office staff?
2. When was the last visit?
3. Are supervisory visits standardized? (Do supervisors have check lists)
4. Do supervisors discuss performance with field staff?
5. What feedback is normally provided?
6. flow is supervision provided to each level of personnel internall-'?
Personnel Who supervises how how often feedback
Logistics and Supplies
1. What materials are used In nutritional programs
Item Where obtained frequency problems replenishments ruptures
food
- growth charts
manuals
posters
other teaching aids: list
forms and registers
Vita
Iron
Folate
2. Are there currently stocks of all materials ?
3. IF not, which are lacking and why?
4. Are there commonly ruptures de stock?
Al- 3

5. If yes, which items and why
6. What can he (lone to improve the supply system?
MIS
1. Which information is reported by the program fie]d sites and at what frequency?
Vita Iron Rehabilitation Supplementation GM/P
Nutrition education Diarrheal disease control
2. What percentage of programs/sites report regularly
3. What feedback is provided on reports
4. Are reports used to:
_ readjust program objectives
_ correct operational problems
5. Are reports automated?
For GM/P
I. Where is weighing performed and by whom
2. How often are children to be weighed
3. What linkages are made between weighing and actions?
_ supplementary feeding _ referral (where)
individual counselling
4. Is there a protocol for proviiing counselling to mothers?
5. Is individual counselling effective or not? Why or why not?
6. ,hat are the nma.jor difficulties experienced in implementing GM/P?
7. Does the manager believe that GM/P is effective in improving community nutrition? why or why not
Al- 4

8. Under what circumstances is GM/P effective?
9. How many children participate in GM/P
10. What percentage of the target population participates?
11. What percentage of the participants are weighed regularly?
0-25 25-50 50-75 75-100
12. Why is this so low or so high?
13. What modifications could be taken to improve participation?
Group Educational Sessions
1. What type of group sessions are held: -1. lecture type 2. discussions 3. demonstrations
_4. practice sessions
_5. other: specify
2. What topics are covered In the group sessions? S -1. breastfeeding
_2. weaning practices _3. feeding ill children _4. growth monitoring 5. vitamin A 6. Iron 7. ORT 8. Other: list:
3. During a typical session, how many topics are covered?
4. What criteria is used to determine which topics are covered?
5. How often are women supposed to attend these sessions?
6. Do personnel have written protocols for conducting sessions?
7. What types of aids are used by personnel? -1. posters _2. cards and pictographs _3. other, specify
8. What specific training have personnel received in the area of groip education?
Al- 5

9. What topics and techniques were covered?
10. On the average, how many mothers participate during each session?
11. What percentage of mothers come regularly to the sessions 1. 0-25% 2. 25-50% 3. 50-75% 4. 75-100%
12. Why is participation this high/low?
13. Do you believe the educational sessions are effective in changing maternal practices?
14. (If no)Why not?
15. What aspects of the educational component need to be improved?
Supplementation:
1. Which groups receive supplementation?
2. What criteria is used to determine who receives supplements?
3. How Is this information obtained? -1. community screening(outreach/census) _2. rally posts _3. fixed facility
4. How long aru t,:rticipants supposed to participate in the program?
5. What criteria are used to terminate participation?
6. Which rations are given, what quantity and what frequency?
target group rations quantity frequency
7. How many participants are currenty enrolled in the programs
8. What percentage of participants regularly attend the program 1. 0-25 2. 25-50 3. 50-75
4. 75-100
Al- 6

9. What percentage of participants complete the program successfully? 1. 0-25 2. 25-50 3. 50-75 4. 75-100
10. What are the major operational difficulties with the food supplementation component?
11. Do you believe that nutritional state of the child is improved by the program or not?
12. If not, why not
Vitamin A
1. Who receives vitamin A
2. What dose is given and with what frequency?
3. What percentage of those targetted receive the prescribed regime?
Children 1. 0-25 2. 25-50 3. 50-75 4. 75-100 Women -1. 0-25 2. 25-50 4. 50-75 5. 75-100
4. How many women received capsules last month?
5. How many children received capsules last month?
6. What are the major operational difficulties experienced with the Vitamin A component?
I ron
1. Who receives iron supplement?
2. Which supplement is given, in which quan ity, and with what frequency?
3. What percentage of those targetted receive the proscribed regime? 1. 0-25 2. 25-50 3.50-75 -4. 75-100
4. How many women received iron tablets last month?
Folic Acid
1. Who receives folic acid?
2. In what dose and frequency?
A- 7

General Questions
1. What nutritional activities are not operating as they were originally intended?
2. Why not?
3. What Improvements should be made in the areas of:
a. training b. logistics/supplies C. supervision d. information management
4. Which changes do you believe should be made in the actual typess nutrition activities provided by the program'?
5. What compliment of nutritional activiti(s do you believe are the most successful in improving community nutritional practices and status
A- 8

ANNEX II
ETUDES DE CAS (QUESTIONNAIRE)
Nom evaluateuteur Date de la vislte
Nom du projet Localite Commune Region
Organ i sie
Nom Nom
da de
chef de projet la personne rencontree (s- differente) eL dans ce cas
responsabilites dars le projet
Profession . .. ..
Date tie debut du projetDiagnostic de la situation nutritionnelle au debut du projet:
Objectifs du projet: (etaient-ils quantifies? pour quelle duree?)
All- 1
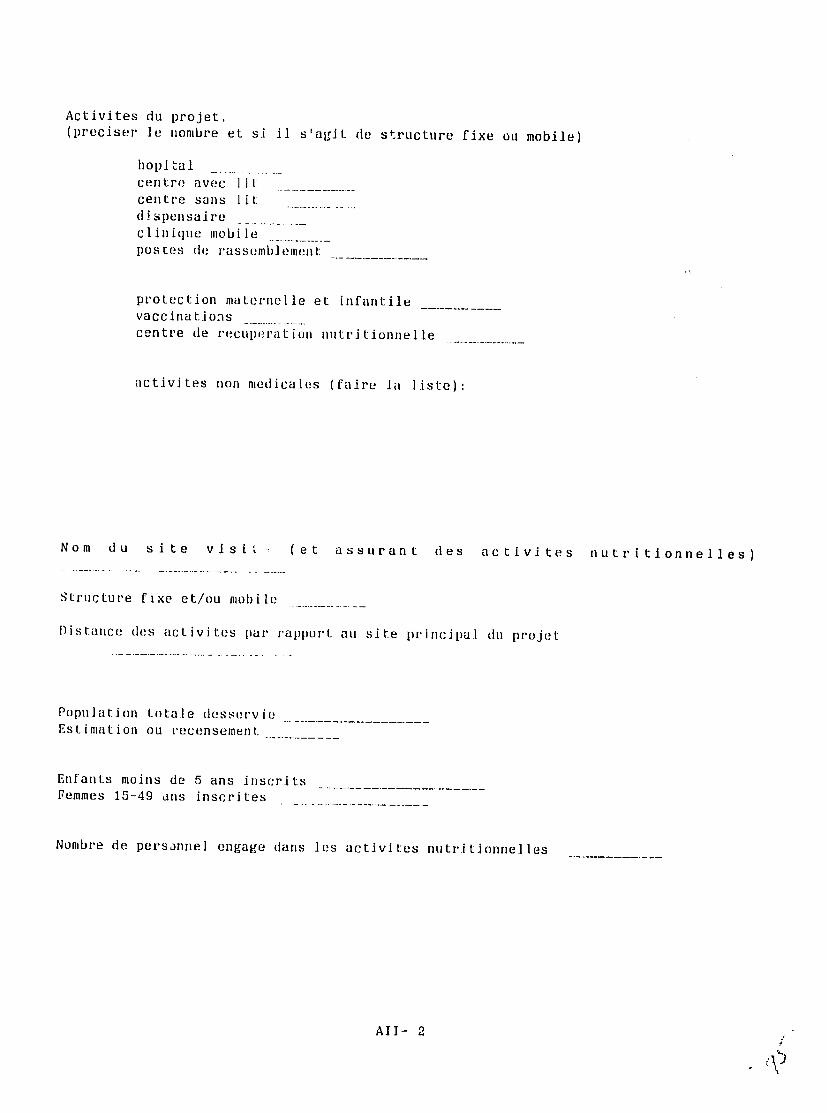
Activites du projet. (preciser Ae nombre et si iA slagit de structure fixe ou mobile)
hopl tal
centre avec lit
centre sans lit
dispensaire
clinique mobile pOtes(de rassembi llllt
protection maternelle et infantile
vaccinations
centre de recuperation nutritionnelle
activites non medicales (faire ia liste):
Nom du site vls 1 t (et assurant des activites nutritionnelles)
Structure fixe et/ou mobile
Distance des activites par rapport au site principal du projet
Population totale desservie Estimation ou recensement
Enfants moins de 5 ans inscrits Femmes 15-49 ans inscrites
Numbre de persannel engage dans les activites nutritionnelles
AII- 2
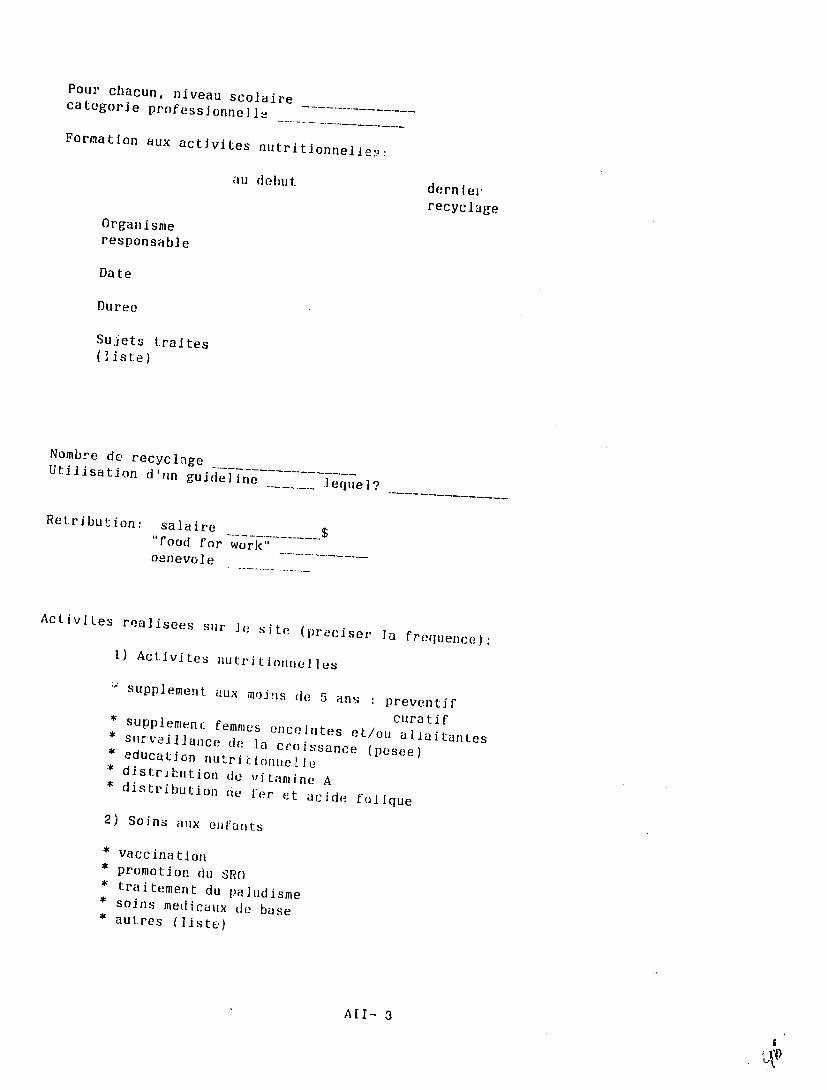
Pour chacun, niveau scolaire
categorle professj onne I . . Formation aux activites autritionnelle,2.
au debut derniel.
recyclage Organisme responsab] e
Date
Duree
Sujets t:raites (Iiste)
Nombre de recyclnge Utilisation d'un guideline
lequel?
Retribution: salaire $
"food for work" oenevole
ActiviLes realisees sur ]e site (preciser ]a frequence):
I) Activites nutritionnelles
Supplement aux m,)'js de 5 ans preventif supplemenc femmes curatifence intes et/ou alIaitantes
* surve.Illance d la croissance* education (pesee)nutriioinelle * distribution de vitanine A* distributio
n nio fer et acide folique
2) Soins aux eifants
* vaccination * promotion
1 du1SRO * traitement du paludisme* soins medicaux (c base * autres (liste)
AUl- 3
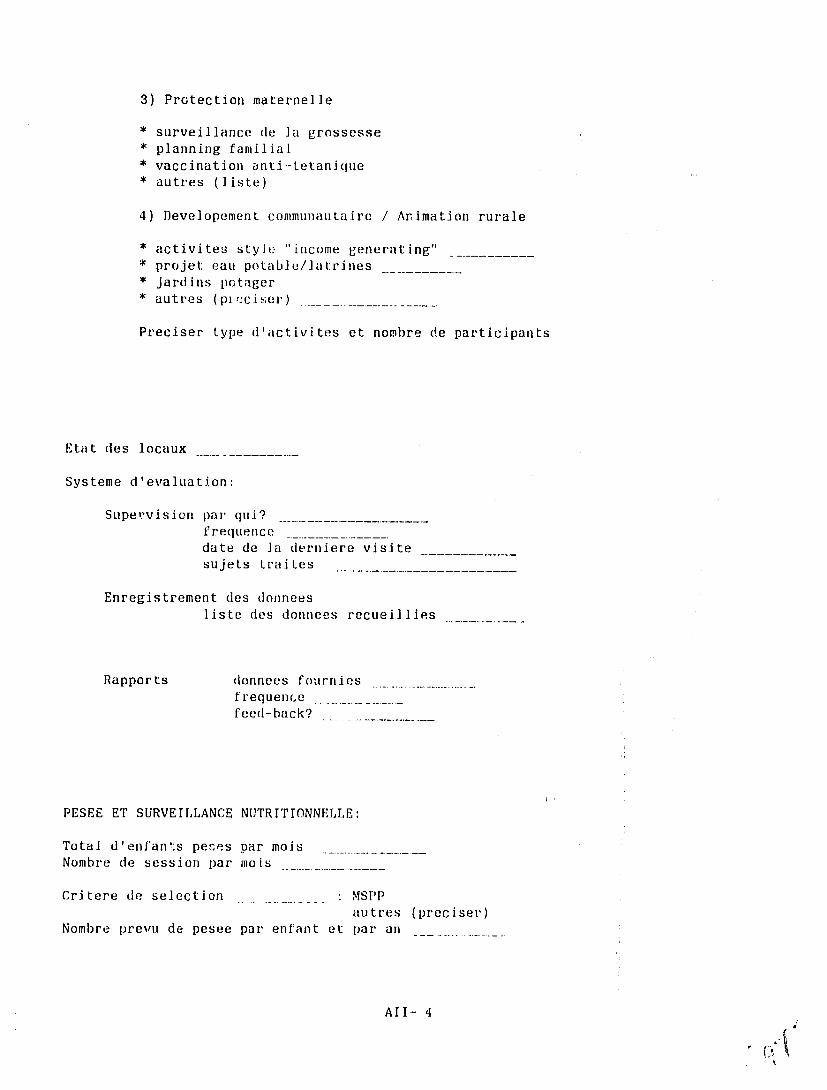
3) Protection maternelle
* surveillance de ]a grossesse * planning familial * vaccination anti--tetanique * autres (liste)
4) Developement communautairc / Animation rurale
* activites style "income generating" * projet eau potable/atr.ines * jardins potager * autres (pi".:ciser) _
Preciser type d'activites et nombre de participants
Etat des locaux
Systeme d'evaluation:
Supervision par qui? f requence
date de ]a derniere visite sujets traites
Enregistrement des donnees liste des donnees recueillies
Rapports donnees fournies
frequence--------feed-back?
PESEE ET SURVEILLANCE NUTRITIONNELLE:
Total d'enfan:s peces par mois Nombre de session par ino is
Critere de selection : MSPP autres (preciser)
Nombre prevu de pesee par enfant et par an
AII- 4
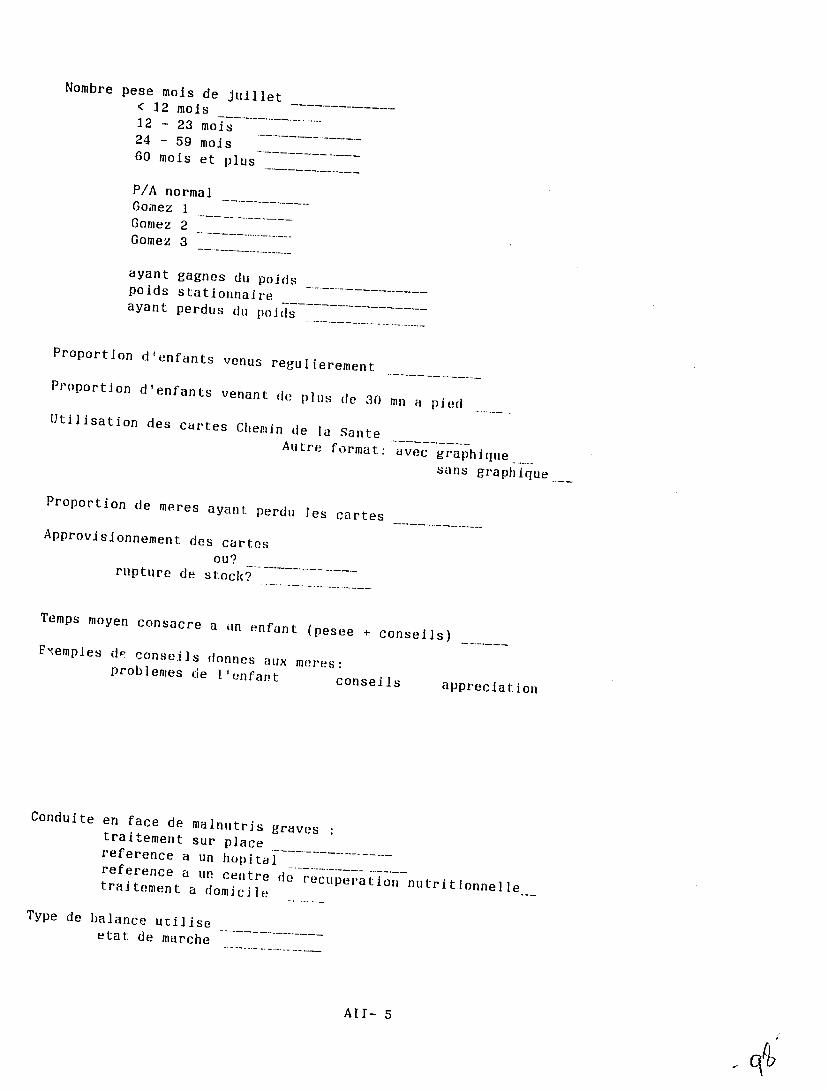
Nombre pese mois de juillet < 12 mols 12 - 23 mois 24 - 59 mojs 60 mois et plus
P/A normal Gomez 1 Gomez 2
Gomez 3
ayant gagnes d poidspoids stationnaire ayant perdus du poids
Proportion d'enfants venus regulierement
Proportion d'enfants venant de plus de 30 mn a piedUtllisation des cartes Chemin de la Sante Autre format: avec graphi! qe
sans graph ique ... Proportion de meres ayant perdu les cartes
Approvisionnement des cartes ou?rupture de stoc?
Temps moyen consacre a Ln enfant (pesee + conseils) F' emples de conseils donnes aux meres:problemes de l'enfant conseils appreciation
Conduite en face de malnutris gravestraitement sur placereference a un hopital .reference . . .a un centre de recuperation nutritionnelletraitement a domicile
Type de balance utilise
etat de marche
All- 5
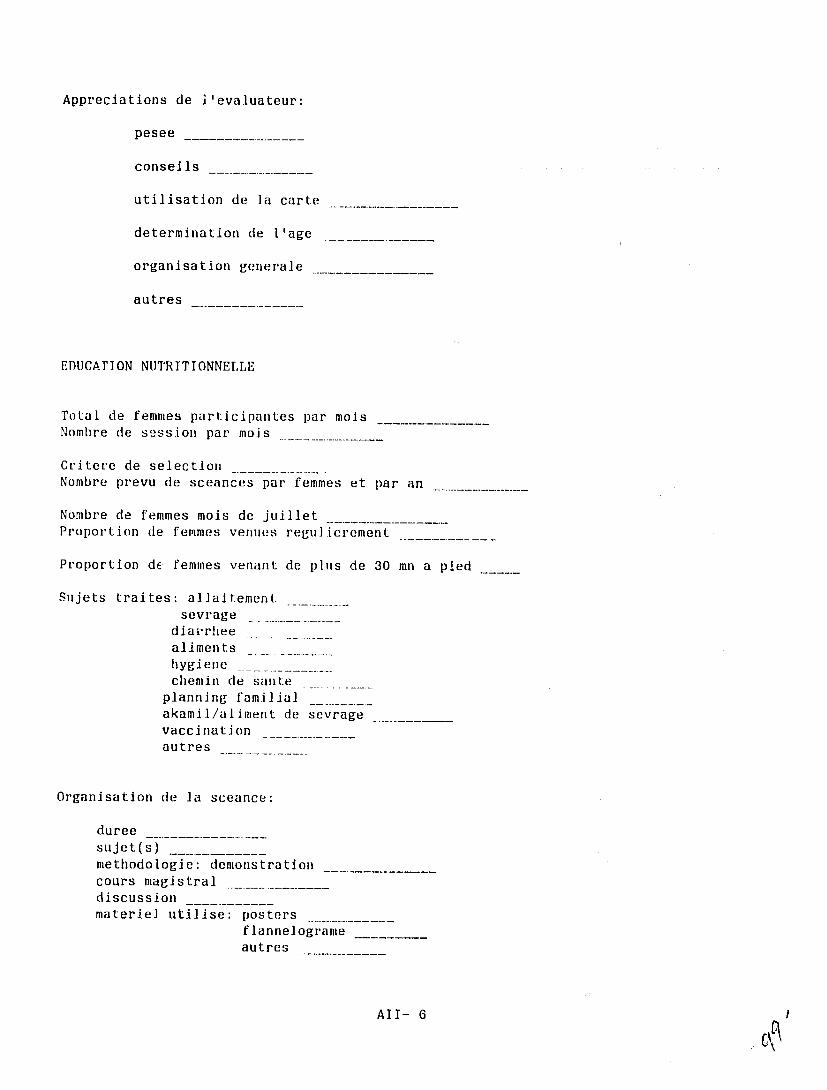
Appreciations de i'evaluateur:
pesee
conselils
utilisation de ]a carte
determination de lage
organisation generale
autres
EDUCATION NUTRITIONNELLE
Total de femmes participantes par mois Nombre de session par mois
Critere de selection Nombre prevu de sceances par femmes et par an
Nombre de femmes mois de juillet Proportion de femmes venues regulierement
Proportion dE t'emmes venant de plus de 30 mn a pied
Sujets traites: allaitement. sevrage .
diarrhee aliments hygiene chemin de saute
planning familial akamil/aliment de sevrage vaccination autres
Organisation de la sceance:
duree
sujet(s) methodologie: demonstration cours magistral discussion materiel utilise: posters
flannelograme . . . autres
All- 6
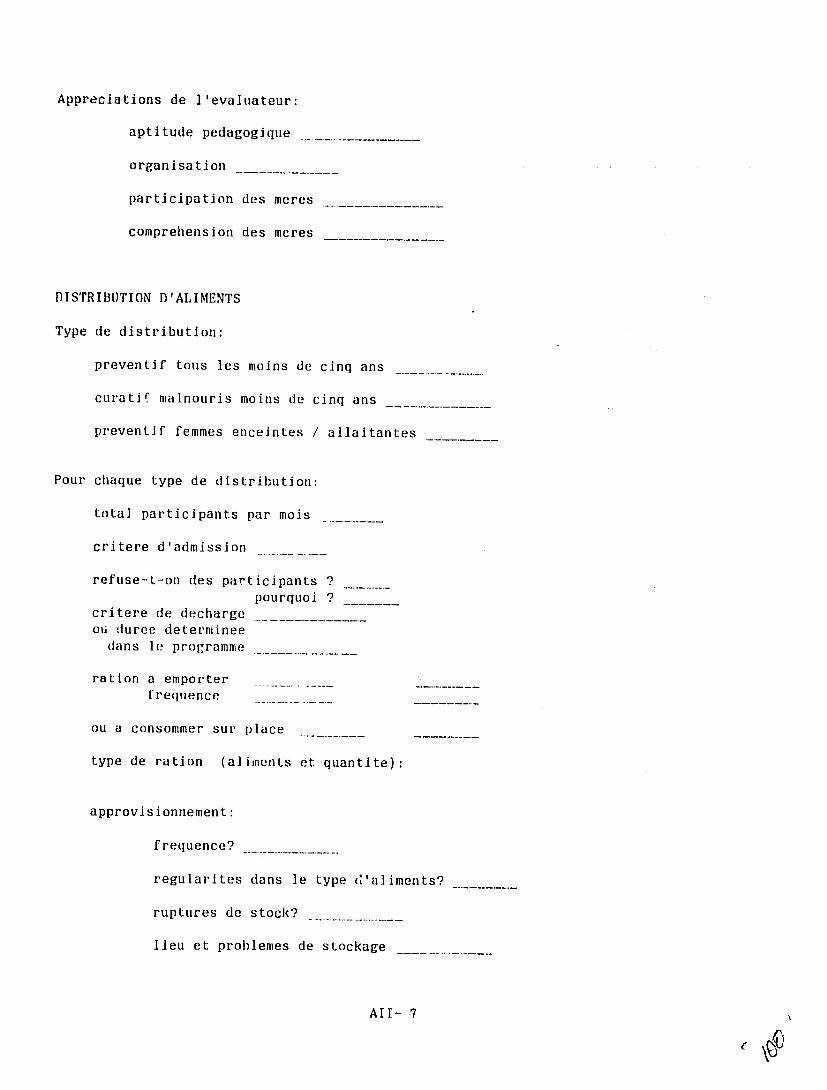
Appreciations de levaluateur:
aptitude pedagogique
organisation
participation des meres
comprehension des meres
DISTRIBUTION D'ALIMENTS
Type de distribution:
preventif tons les mains de cinq ans
curatif malnouris mains de cinq ans
preventif femmes enceintes / allaitantes
Pour chaque type de distribution:
total participants par mois
critere d'admission
refuse-t-on des participants ? pourquoi ?
critere de decharge ou duree determinee
dans le programme
ration a emporter frequence
ou a consommer sur place
type de ration (alijnents et quantite):
approvisionnement:
f requence?
regularites dans le type d'aliments?
ruptures de stock?
lieu et problemes de stockage
All- 7
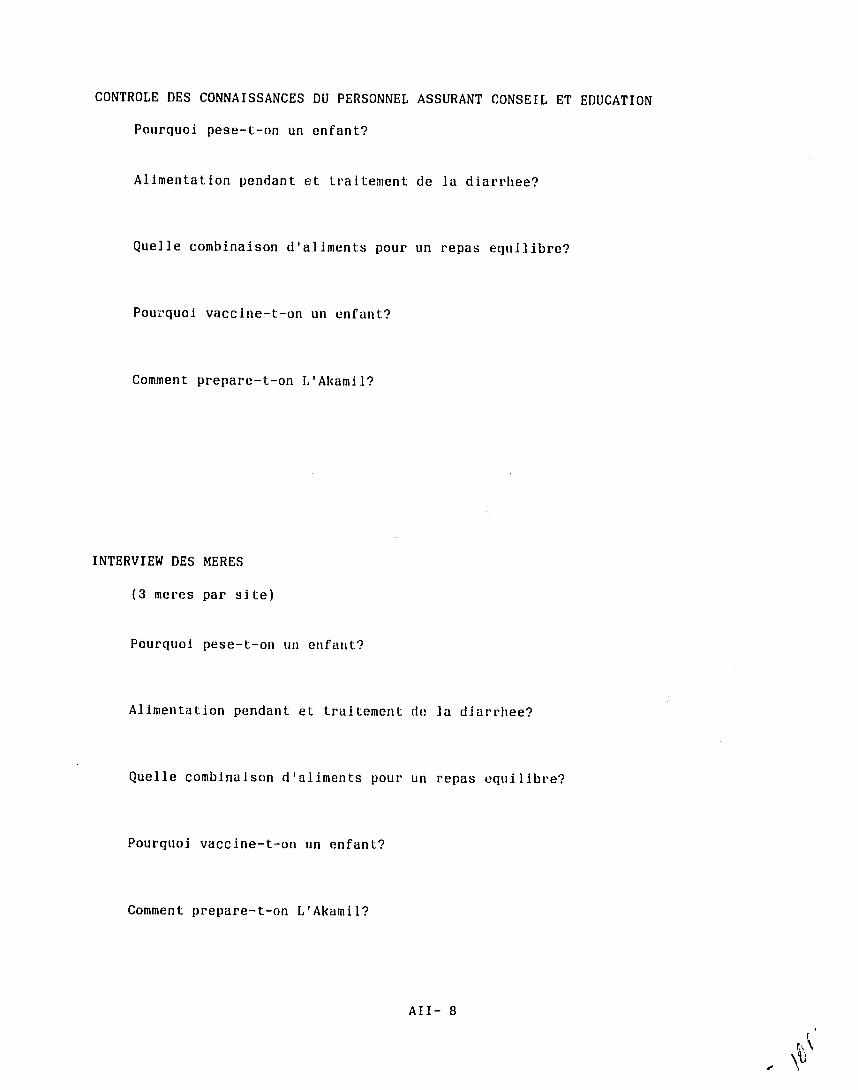
CONTROLE DES CONNAISSANCES DU PERSONNEL ASSURANT CONSEIL ET EDUCATION
Pourquoi pese-t-on un enfant?
Alimentation pendant et traitement de la diarrhee?
Quelle combinaison d'a]iments pour un repas equi]ibre?
Pourquoi vaccine-t-on un enfant?
Comment prepare-t-on L'AlkamiI?
INTERVIEW DES MERES
(3 meres par site)
Pourquoi pese-t-on un enfant?
Alimentation pendant et traitement de la diarrhee?
Quelie combinaison d'aliments pour un repas equilibre?
Pourquoi vaccine-t-on un enfant?
Comment prepare-t-on L'Akamil?
All- 8
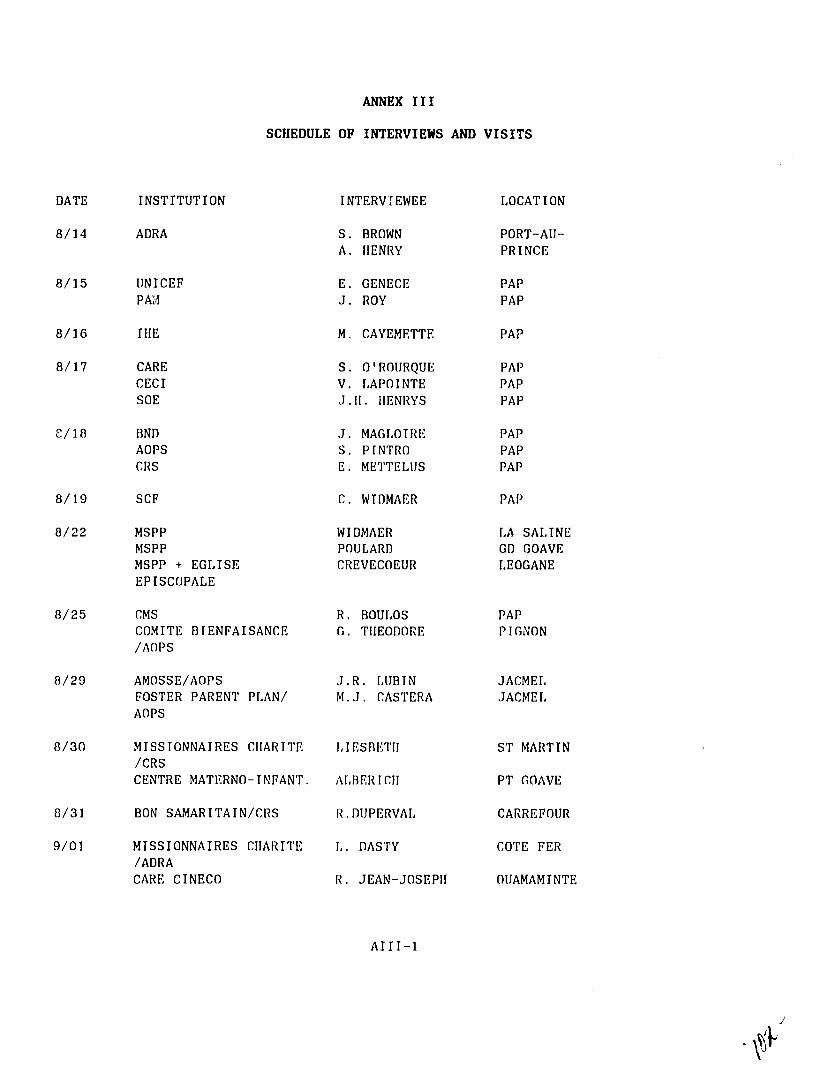
ANNEX III
SCHEDULE OF INTERVIEWS AND VISITS
DATE INSTITUTION INTERVIEWEE LOCATION
8/14 ADRA S. BROWN A. HENRY
PORT-AU-PRINCE
8/15 UNICEF PAM
E. GENECE J. ROY
PAP PAP
8/16 THE M. CAYEMETTE PAP
8/17 CARE CECI SOE
S. O'ROURQUE V. LAPOINTE J.TI. HENRYS
PAP PAP PAP
C/18 BND AOPS CRS
J. MAGLOIRE S. PINTRO E. METTELUS
PAP PAP PAP
8/19 SCF C. WIDMAER PAP
8/22 MSPP MSPP MSPP + EGLISE EPISCOPALE
WIDMAER POULARD CREVECOEUR
LA SALINE GD GOAVE LEOGANE
8/25 CMS COMITE BIENFAISANCE /AOPS
R. BOULOS G. THEODORE
PAP PIGNON
8/29 AMOSSE/AOPS FOSTER PARENT AOPS
PLAN/ J.R. LUBIN M.J. CASTERA
JACMEL JACMEL
8/30 MISSIONNAIRES CHARITE /CRS CENTRE MATERNO-INFANT.
LIESBETI
ALBERICH
ST MARTIN
PT GOAVE
8/31 BON SAMARITAIN/CRS R.DUPERVAL CARREFOUR
9/01 MISSIONNAIRES CHARITE /ADRA CARE CINECO
L. DASTY
R. JEAN-JOSEPH
COTE FER
OUAMAMINTE
AIII-1

ANNEX IV
BUREAU DE NUTRITION ET DEVELOPEMENT (BND)
General information: BND is a new PVO, created two and a half years ago; it does not yet have a PVO status and works under the COHAN (Holland) umbrella. This PVO was created to take over the food distribution programs of COHAN, which wanted to stop these kinds of activities.
Population: BND provides food to 157,000 beneficiaries in 170 different institutions. The distribution sites are diverse: hospitals, TB clinics, retirement homes, nutrition centers, and schools. The beneficiary institutions are essentially religious groups and small haitian PVOs.
Personnel and training: one director, one nutritionist, one accountant, and ten workers for the food stock.
Supervision: BND is just starting to organize the distribution and is introducing standard requisition forms. It has carried out some field visits inthe last few months and hired one inspector to do supervision. EEC and CARITAS have carried out some evaluation visits.
Activities: The distributed food is provided by the EEC and ordered through CARITAS Holland. The donations are veryirregular; for example, oats ordered in 1987 have just been received (a one year delay). Three kinds of food are now received: milk, oats, and peas. Earlier, wheat flour was also imported, but Haitian law now forbids this, to protectHaitian mill factories. Each institution receiving the food must make its iwn arrangements to transport the food from Port-au-Prince to its location. The food quantitiesdistributed have decreased, from 3524 tons in 1985 to 2040 tons in 1987.
Areas for improvement: - selection of beneficiaries; - supervision.
AIV-1

CENTRE D'ETUDES ET DE COOPERATION INTERNATIONALE (CECI)
General information: A Canadian PVO which has three communitydevelopment projects in Haiti (St Michel, Carice et MontOrganise, Chardonniere). In the first two projects, there are 3 areas of interest:
- health and nutrition - agriculture - rural "animation" (community motivation).
Description of St Michel l'Attalaye project: It is a program100 percent managed by CECI. In St Michel, otherhealth/nutrition activities exist in the area through thethree public dispensaries (2 are physician-run and curativeoriented) and through irregular church food distribution.
Population: 125,000 persons in the "commune".
Personnel and training: The personnel consist of one field manager, agricultural animators (paid), health/nutritionanimators (not health agents, paid) and the growth monitoringcollaborators (volunteers). They use their own trainingmaterials. The duration of training is based on the learning pace of each group.
Supervision: It is done daily by the field manager. Quarterlyreports are sent to the Port au Prince office. An evaluation/census has recently been done, but has not been compiled and analysed yet.
Activities: nutritional education and nutritionalrehabilitation in some particular circumstances. During thelast few months, CECI has organized growth monitoringactivities with collaborators chosen from the community. Theyuse the "road to health chart." Other maternal and childhealth services are provided: immunization, ORT and familyplanning.
Related activities: The health and nutrition activities arepart of a large, community-based program. Other componentsof the program include sanitation (hygiene, water, andlatrines) and agriculture, which focuses on food cropsregeneration to increase women's self--reliance.
Participation: the mothers come regularly, but lose the cards.
Areas of interest: - a broad-based approach, with agricultural and
community participation components.
Areas for improvement: - staff training.
AIV-2
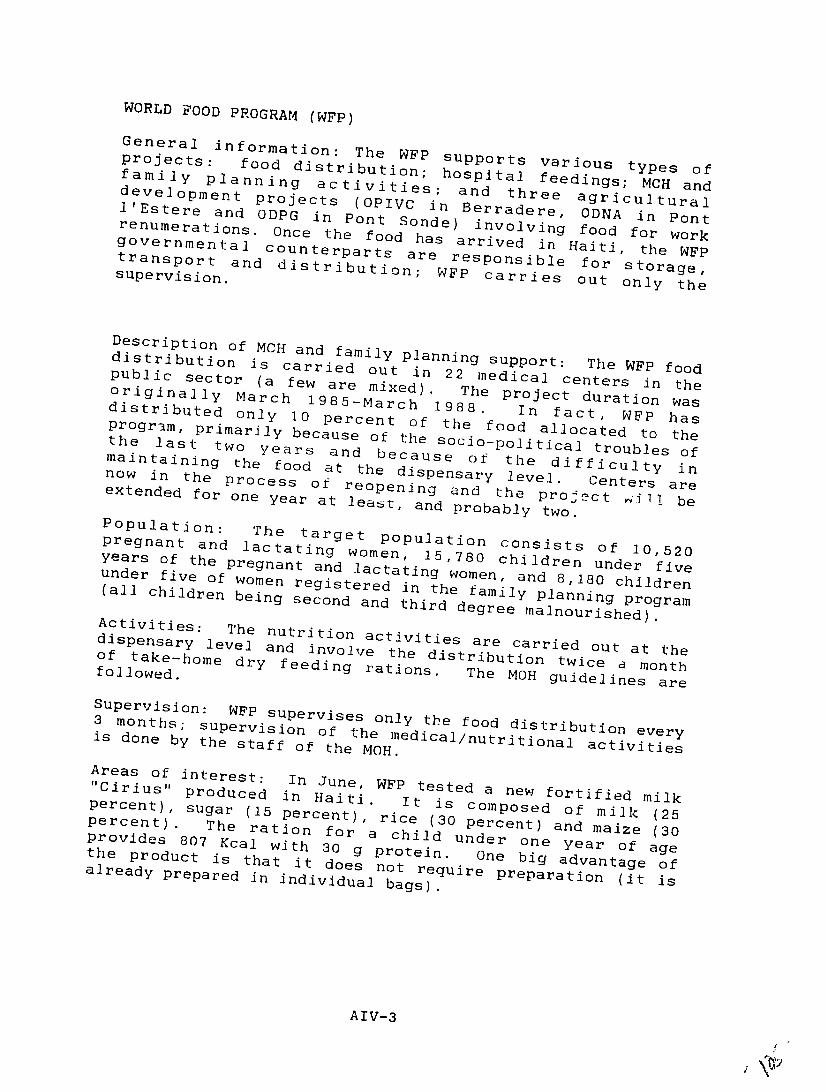
WORLD FOOD PROGRAM (WFP) General information:
The WFPprojects: supports variousfood distribution; typeshospitalfamily planning feedings;
of activities; MCH anddevelopment and threeprojects agricultural(OPIVCl'Estere in Berradere,and ODPG ODNAin Pont in Pontrenumerations. Sonde) involvingOnce foodthe food for workgovernmental has arrived
counterparts in Haiti, the WFPtransport are responsibleand distribution; for storage,WFP carries out only theSupervision.
Description of MCH anddistribution family planning support:is carried out The WFP foodpublic in 22 medicalsector (a centers originally few are mixed). The project
in the March 1 9 8 5-March duration wasdistributed 1988. only 10 In fact, WFPpercent hasof the food allocated to the
progr3m, primarily because of the socio-politicalthe last two years troubles ofand becausemaintaining ofthe food the difficulty now at the dispensary inin the level.process Centersof reopening and areextended for the project vijlone year at beleast, and probably two.
Population:pregnant The targetand lactating population consists years of
women, 15,780 of 10,520children underthe pregnant and lactating fiveunder five of women women, and 8,180 childrenregistered in the family planning program(all children being second and third degree malnourished).Activities: The dispensary
nutrition activitieslevel are carried out atand involve theof take-home dry
the distribution feeding twice a monthrations. The MOH guidelinesfollowed. are
Supervision: 3 months;
WFP supervises only the food distributionsupervision of everythe medical/nutritional activitiesis done by the staff of the MOH.
Areas of interest: In"Cirius" produced in June, WFP tested a new fortified milkHaiti.percent), It is composedsugar of(15 percent), milk (25percent). rice (30 percent) and maizeThe ration for a (30provides child under807 Kcal one yearwith
the product 30 g protein. One of age
is that it big advantage ofnotdoes require preparationalready prepared in (it isindividual bags).
AIV-3
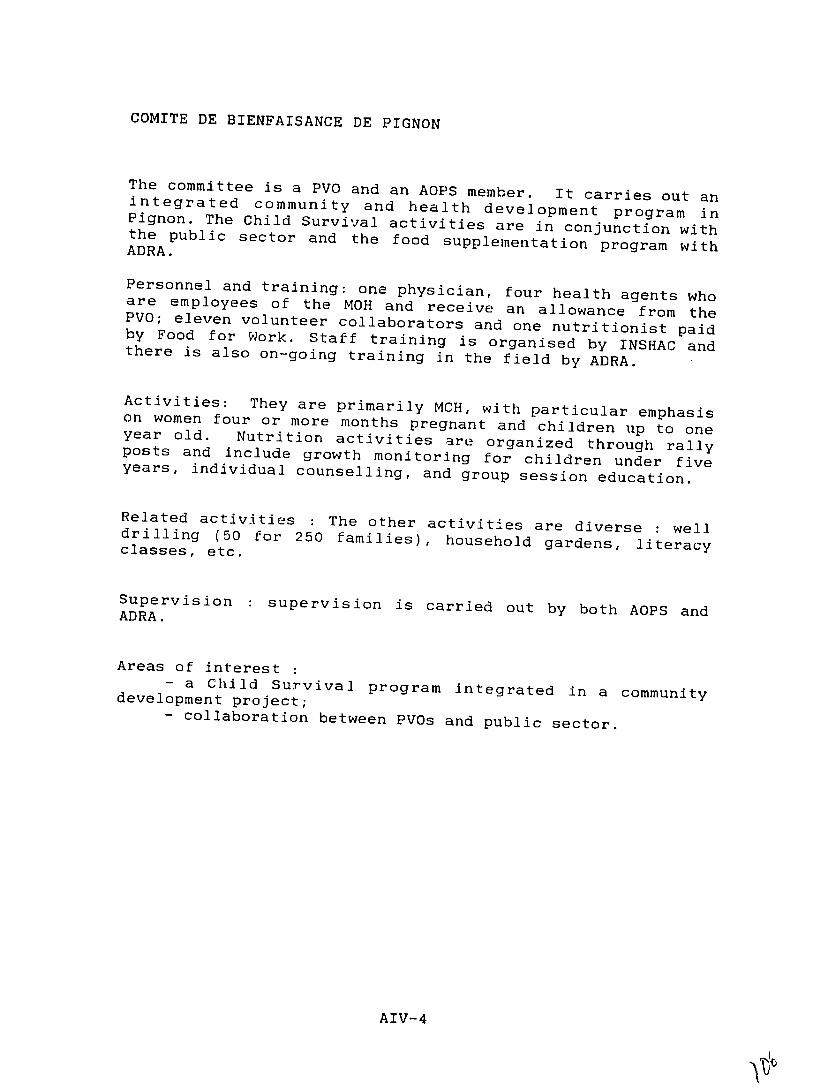
COMITE DE BIENFAISANCE DE PIGNON
The committee is a PVO and an AOPS member. It carries out anintegrated community and health development programPignon. The Child Survival activities are in
in conjunction withthe public sector and the food supplementation program with ADRA.
Personnel and training: one physician, four health agents whoare employees of PVO;
the MOH and receive an allowance from theeleven volunteer collaborators and one nutritionist paidby Food for Work. Staff training is organised by INSHAC andthere is also on-going training in the field by ADRA.
Activities: They are primarily MCH, with particular emphasison women four or more months pregnant and children up toyear old. oneNutrition activities are organized through rallyposts and include growth monitoring for children under fiveyears, individual counselling, and group session education.
Related activities : The other activities are diverse : welldrilling (50 for 250 families), household gardens, literacyclasses, etc.
Supervision : supervision is carried out by both AOPS and ADRA.
Areas of interest - a Child Survival program integrated in a community
development project; - collaboration between PVOs and public sector.
AIV-4

SAVE THE CHILDREN FUND (US)
General information: SCF is an AOPS member. The program is integrated into a community development program. SCF operates in a public dispensary and the program is trying to reinforce and rationalise the public health services in the area.
Population : 25,000 people in Maissade, divided into two zones and six sectors with 120 to 200 mothers per sector. Program participants are selected from 1986 census and include women 15 to 45 years of age and malnourished (first, second, and third degree on the Gomez scale) children under five years of age.
Personnel and training : one physician, nutritionists, auxiliaries, and one record keeper are SCF employees, while local health agents are paid by DSPP. The local collaboratcrs are volunteer, community members, with one per sector. The physician is responsible for management and on-going training of staff, with assistance from the health auxiliaries. The staff follow both AOPS and MOH guidelines.
Supervision: Supervision is done daily by the physician field manager; plus, there are monthly control visits by AOPS.
Activities: Maternal and child health activities include growth monitoring with individual counselling, group nutritional education, AK-100 promotion, vitamin A distribution, immunization, ORT, underfive clinics, prenatal care and, family planning. The community participation consists of a health committee formed by health agents and volunteers, mothers' clubs, and the mutual support of neighbors. The health committees have bi-monthly meetings, and each sector hold a general assembly once a quarter.
Related activities : agricultural activities have been started with the same population.
Participation: 80 to 90 percent of beneficiaries participate regularly.
Areas of interest: - reinforces public services; - structure at different level of community participation; - regular on-going training.
AIV-5
SERVICE OECUMENIQUE D'ENTRAIDE (SOE)
General information: Haitian PVO, set up in 1977. It has both local suppirt (CARITAS, the Methodist church,..), and European support (from Protestant churches, PVOs,and research institutes such as ORSTOM). It has three areas of activity: health, rural development and Haitian returnees. In general, it runs community development programs and has around 10 different sites.
Description of the Thomonde project: The project is centered around the public dispensary. This provides complete curative services (including emergency beds) and more preventive activities are also provided on an outreach basis.
Population: 30,000 persons in the 3985 census.
Personnel and training: The personnel are employed through both the public sector and SOE:
- 1 physician who heads the project (SOE) - I physician paid by the ministery (+SOE indemnity) - 3 auxilaries paid by the ministry (+SOE indemnity) - I TB assistant - 1 sweeper
- outreach staff with 7 health agents covering 12 rally posts and 77 birth attendants.
The agents' training lasts 3 months (MOH) and 3 to 4-day refresher courses are organized every 6 months. There is a close follow-up of activities and monthly meetings.
Supervision: This is done by one of the physicians. Monthly reports are required.
Activities: 1) Growth monitoring has been carried out since 1984,
("road to health charts" are used) at rally posts. At each of them, between 40 and 50 children under five years of age are registered, with priority given to those under three years. The health agents make home-visits to look for drop-out children and to follow-up the malnourished children. For all nutritional activities, they follow ministry of health (MOH) directives. If a child loses weight despite the program, than agent makes home-visits to provide further education and preparations of AK-100 and fortified milk. If necessary, the child is referred to the dispensary, where mother and child are kept for education and treatment for a two to three week period.
2) Group nutritional education consisting of lectures and demonstrations in which the mothers participate. Emphasis is put on fortified milk and AK-1000 preparation.
AIV-6

3) Other activities carried out in rally posts include: - prenatal care, - immunization (once a month), - ORT (MOH prctocols) - vitamin A distribution (for children 6 months to 6
years of age) - iron-folate distribution to pregnant women. - basic drugs distribution - AK-1000 mill distribution.
Related activities: Other programs centered around communitydevelopment are carried out, including agriculture, incomegeneration, and nutritional education of schoolchildren through the teachers.
Participation: 65 70to percent of registered children come regularly every month.
Areas of interest: - strong education component, - motivated staff, - referral system, - training and supervision, - strengthening of public health services.
Areas of improvement : - Development activities have a limited coverage and
have no impact on nutritional status. - SOE has to provide most of the logistics and supplies
since the MOH does not do so.
AIV-7

UNICEF
UNICEF supports two main programs : immunization (EPIstrategy) and the diarrheal control program (PRONACODIAM).
So far, it has spent about $31,000 on nutrition activities, which include:
- The distribution of vitamin A ( all children from 6 months -o 6 years, every 4 months; all women after delivery).1,500,000 caps are distributed per year.
- The distribution of fer-folate for pregnant women in the third trimester. 2,000,000 caps per year are provided.These drugs supply both the public and private health sectors.
The main concerns of UNICEF personnel regarding the on-goingnutritional activities are the institutional weakness of the public sector , the relative ignorance of what is going on,the lack of coordination between agencies, and the lack of standardized materials for education.
Nutrition has to be given the same types of inputs(resources, staff training, communication strategy,monitoring and evaluation system) that are now given to the two well establisihed priorities (EPI and ORT campaign).There is also a need to determine which type of intervention works.
Other UNICEF projects in the nutrition field are the breastfeeding component of the PRONACODIAM program and the strengthening of the nutrition component in the Child Survival strategy. Particular emphasis is placed on weaningfoods and breastfeeding promotion (through health professionals and through laws).
AIV-8