Embed Size (px)
Citation preview
NUTRITIONAL EVALUATION OF PLANT INGREDIENTS FOR DIETS OF TILAPIA
RENDALLI IN NKHATABAY, NORTHERN MALAŴI
MSc (Fisheries Science-Nutrition) Thesis
KUMBUKANI MZENGEREZA (BSc)
MZUZU UNIVERSITY
JULY 2015
NUTRITIONAL EVALUATION OF PLANT INGREDIENTS FOR DIETS OF TILAPIA
RENDALLI IN NKHATABAY, NORTHERN MALAŴI
KUMBUKANI MZENGEREZA (BSc)
A THESIS SUBMITTED TO THE FACULTY OF ENVIRONMENTAL SCIENCES,
DEPARTMENT OF FISHERIES SCIENCE, IN PARTIAL FULFILMENT OF THE
REQUIREMENTS FOR THE MASTER OF SCIENCE DEGREE IN FISHERIES
(FISH NUTRITION)
MZUZU UNIVERSITY
JULY 2015

i
DECLARATION
I, Kumbukani Mzengereza, declare that the work presented in this thesis is a result of my own
research effort and that to the best of my knowledge; it has not been previously submitted to Mzuzu
University or any other institution of higher learning for the award of any academic qualification.
Where other sources of information have been used, acknowledgement has been made accordingly by
means of references.
Signature: ______________________________________
Date: _________________________________ (day, month, year)
ii
CERTIFICATE OF APPROVAL
We, the undersigned, certify that this thesis is a result of the author’s own work, and that to the best
of our knowledge, it has not been submitted for any other academic qualification within Mzuzu
University or elsewhere. The thesis is acceptable in form and content, and that satisfactory knowledge
of the field covered by the thesis was demonstrated by the candidate through an oral examination held
on ________ [day, month and year]
Major Supervisor: Dr. Orton V. Msiska (Associate Professor)
Signature: _____________________________
Date: _____________________________
Supervisor: Dr. Fanuel Kapute (Associate Professor)
Signature: _____________________________
Date _____________________________
Supervisor: Professor Jeremiah Kang’ombe
Signature: _____________________________
Date: _____________________________

iii
DEDICATION
I dedicate this work to all fish farmers in Mpamba, NkhataBay District of northern Malawi.

iv
ACKNOWLEDGEMENTS
I am very grateful to Associate Professor O.V. Msiska (PhD), my major supervisor for his tireless
assistance and guidance throughout the entire research. I would also like to thank Professor J.
Kang’ombe (PhD) and Associate Professor F. Kapute (PhD) for their unending assistance in the
marking and critical analysis of this work.
Dr. W. Singini deserves my heartfelt appreciation for the conceptualization of the whole research
project idea and for all the technical advice that l have benefited through the research.
I thank the Regional Universities Forum for Capacity Building in Agriculture (RUFORUM) for the
financial support towards my entire master’s programme. I also thank staff of the Department of
Fisheries Science at Mzuzu University for housing this research.
Gratitude should go to Mr. Thomas Nyasulu, Mr. James Pelani, Mr. Thomas Mapanje and Mr. Elton
Nyali and the technical team at Lilongwe University of Agriculture and Natural Resources
(LUANAR) and also NkhataBay Fisheries Laboratory for all analytical laboratory assistance.
Thanks should also go to my fellow master student Ms. Alinafe Kamangira and a member of the
supervisory committee, Associate Professor Wilson. Jere (PhD) for reaching out throughout the
study.
v
ABSTRACT
Modern fish culture requires the reduction of the cost of feeds which can partly be achieved by
minimal use of dietary animal protein. This study assessed the nutritional potential of locally
available plant based feedstuffs from Mpamba EPA in NkhataBay district; northern Malawi. The
main objective was to isolate those that can be used as ingredients for formulation of affordable fish
diets to increase pond based fish production in Malawi. The following plants were used in the study:
cassava (Manihot esculenta) peels (CP) and leaves (CL), pawpaw (Carica papaya) leaves (PL), sweet
potato (Ipomea batatus) leaves (SPL), peels (SPP), and tubers (SPM), jackfruit (Artocarpus
heterophyllus) (JK), mexican fire plant (MFP) (Euphorbia heterophylla),cocoyam leaf meal (CYM)
black jack (BJ) (Bidens pilosa), banana (Musa balbisiana) leaves (BL), maize (Zea maize) bran
(MZB), and akee (Blighia sapid) leaves (AK). Proximate analysis was conducted to generate
information for selection of potential plant ingredients to be used in the formulation of four diets of
Tilapia rendalli. In addition, a digestibility experiment was also conducted on juvenile Tilapia
rendalli to evaluate four diets formulated from the selected plants at NkhataBay fisheries Laboratory
for 21 days. The four diets were designated as treatment 1 to 4. Treatment 1 comprised of
(CL,BJ,MZB,SPM,SPL,CF,CO), treatment 2 (CL,CYM,MZB,SPM,SPl,CF,CO) treatment 3( CL,
CYM,BJ,SPM,SPL,CF,CO) and treatment 4 (CL, CYM,BJ,MZB,SPL,CF,CO) .The experiment was
laid out in a Completely Randomized Design (CRD) using glass aquaria with each diet replicated
three times. Data for both proximate and digestibility experiments was analyzed using Analysis of
Variance (ANOVA) at P= 0.05 using SPSS and R-software’s respectively. Results showed that
cassava (Manihot esculenta) leaves, black jack (Bidens pilosa) and cocoyam (Caladium bicolor) had
the highest levels of crude protein recording 21.17±0.56%, 24.35±0.7 % and 24.28±0.11%,
respectively which were significantly different (P<0.05) from each other and other plant ingredients.
vi
Energy levels ranged from 8.78 kJ/g to 29.7 kJ/g for sweet potato leaves and cassava peels
respectively. In general all plant feedstuffs had low levels of crude fiber ranging from 3.78±0.20% to
16.84±0.26%. Digestibility experiment results showed that there was a significant difference
(P<0.05) in protein digestibility coefficients among different plant diets, however, diets 1 and diet 3
did not differ statistically (P>0.05) in digestibility coefficients. Apparent digestibility coefficients for
energy (21.2 kJ/g to 43.44 kJ/g) and fat (54.29%-67.78 %) were higher than those of crude protein
(24.15%-31.44). Depending on their availability and competition for other uses, most of the plant
ingredients analyzed demonstrated potential for use in Tilapia rendalli feed. Information on
nutritional and digestibility values of plant ingredients and diets will provide good nutritional
indicators for the development of a system for selecting ingredients for inclusion in Tilapia rendalli
diets.
vii
TABLE OF CONTENTS
DECLARATION .................................................................................................................................. i
CERTIFICATE OF APPROVAL ....................................................................................................... ii
DEDICATION ................................................................................................................................... iii
ACKNOWLEDGEMENTS ............................................................................................................... iv
TABLE OF CONTENTS .................................................................................................................. vii
LIST OF TABLES ............................................................................................................................. xi
LIST OF FIGURES ........................................................................................................................... xii
ACRONYMS AND ABBREVIATIONS ........................................................................................ xiii
CHAPTER ONE .................................................................................................................................. 1
GENERAL INTRODUCTION ........................................................................................................... 1
1.1. The Challenge Facing Feed Development in Aquaculture ...................................................... 1
1.2. Global perspective on food security and fish production ........................................................ 3
1.3. Overview of aquaculture feed development in Malawi ........................................................... 6
1.4. Potential of Tilapias in Malawi aquaculture ............................................................................ 7
1.5. Importance of digestibility in fish feed .................................................................................... 9
1.6. Objectives of the study .......................................................................................................... 11
1.6.1. Specific objectives .......................................................................................................... 11
1.7. Research hypotheses .............................................................................................................. 11
viii
1.8. Problem statement and Justification ...................................................................................... 11
CHAPTER TWO ............................................................................................................................... 15
LITERATURE REVIEW .................................................................................................................. 15
2.2. Current Challenges in Formulated Fish Feeds ....................................................................... 15
2.3. Use of plants as ingredients in Tilapia diets .......................................................................... 16
2.4. Limitations on use of Plant based Ingredient in fish Feeds ................................................... 17
2.4.1. Effect of Anti-nutritional factors on feed utilization ...................................................... 18
2.5. The growth performance of Tilapia rendalli in aquaculture systems .................................... 20
2.6. Feed digestibility studies-an important parameter for feed quality ....................................... 23
CHAPTER THREE ........................................................................................................................... 25
MATERIALS AND METHODS ...................................................................................................... 25
3.1. Location of the study area ...................................................................................................... 25
3.2. Collection of locally available plant feed ingredients ........................................................... 27
3.3. Processing of plant feed ingredients ...................................................................................... 28
3.4. Proximate Analysis of plant feed ingredients ........................................................................ 28
3.4.1. Determination of moisture (dry matter basis) ................................................................ 29
3.4.2 Determination of crude protein .......................................................................................... 29
3.4.3. Determination of Crude fat ............................................................................................. 30
3.4.4. Determination of Crude fibre ......................................................................................... 31
3.4.5. Determination of Ash ..................................................................................................... 31
ix
3.4.6. Determination of Gross energy ...................................................................................... 32
3.5. Digestibility Experiment ........................................................................................................ 33
3.5.1. Methods of determining Apparent Digestibility Coefficients (ADCs) .......................... 33
3.5.2. Digestibility Experiment Design and fish used .............................................................. 34
3.6.1 Experimental Design Layout ............................................................................................. 35
3.5.3.Plant ingredients and diet preparation for Digestibility Experiment ................................... 36
3.5.4. Digestibility trial procedure ............................................................................................ 37
3.5.5. Feacal collection during the digestibility trial ................................................................ 38
3.5.6. Biochemical analysis of fecal material ........................................................................... 39
3.6. Digestibility determination .................................................................................................... 40
3.7. Data Analysis ......................................................................................................................... 40
3.7.1 Statistical analysis of proximate composition of plant ingredients and Apparent
Digestibility Coefficients for the diets(ADCs) ............................................................................ 40
3.7.3. Statistical Model used in the experiment is as follows: ................................................. 41
CHAPTER FOUR ............................................................................................................................. 42
RESULTS .......................................................................................................................................... 42
4.1. Proximate Composition of plant ingredients ......................................................................... 42
4.1.1. Moisture Content ................................................................................................................ 43
4.1.2. Gross energy ................................................................................................................... 43
4.1.3. Crude Protein .................................................................................................................. 44
4.1.4. Crude fat ......................................................................................................................... 44
4.1.5. Crude fiber ...................................................................................................................... 44
x
4.1.6. Mineral composition ....................................................................................................... 45
4.2. Apparent Digestibility Coefficients (ADCs) ......................................................................... 47
4.2.1. Crude Protein Digestibility ............................................................................................. 47
4.2.2. Crude fat Digestibility .................................................................................................... 48
4.2.3. Ash Digestibility ............................................................................................................. 48
4.2.4. Crude fibre Digestibility ................................................................................................. 48
4.2.5. Gross Energy Digestibility ............................................................................................. 49
CHAPTER FIVE ............................................................................................................................... 50
DISCUSSION ................................................................................................................................... 50
CHAPTER SIX ................................................................................................................................. 62
CONCLUSIONS AND RECOMMENDATIONS ............................................................................ 62
REFERENCES .................................................................................................................................. 64
xi
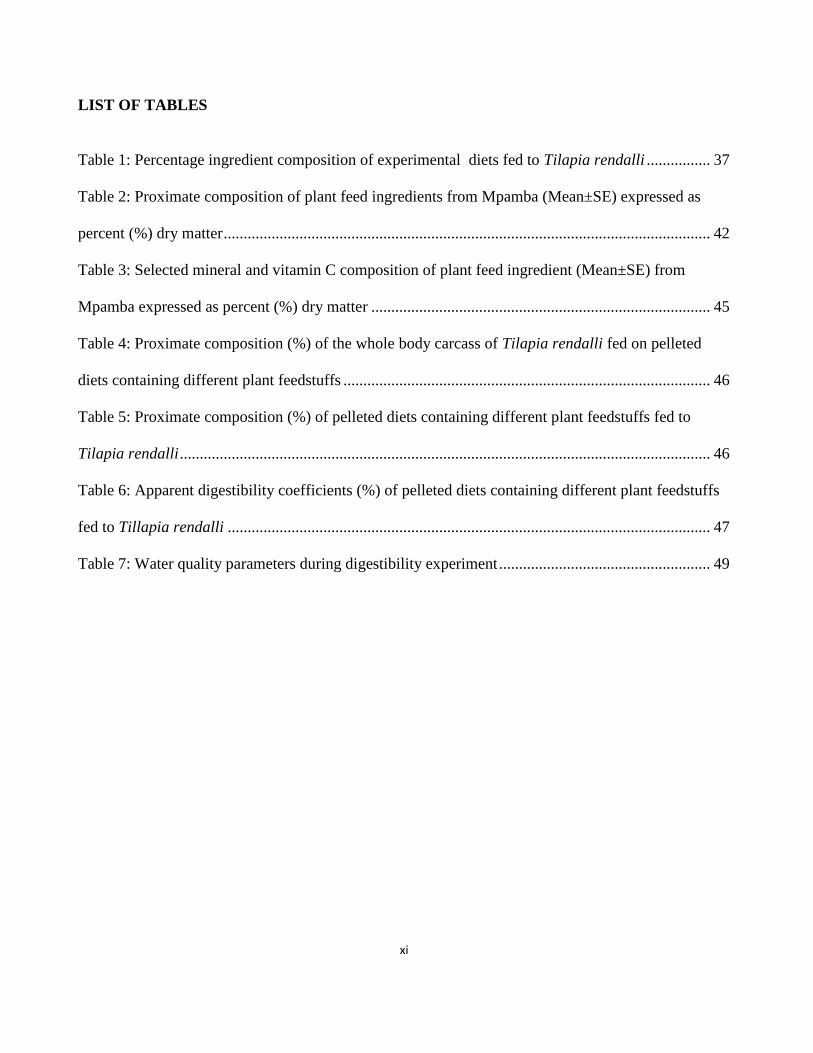
LIST OF TABLES
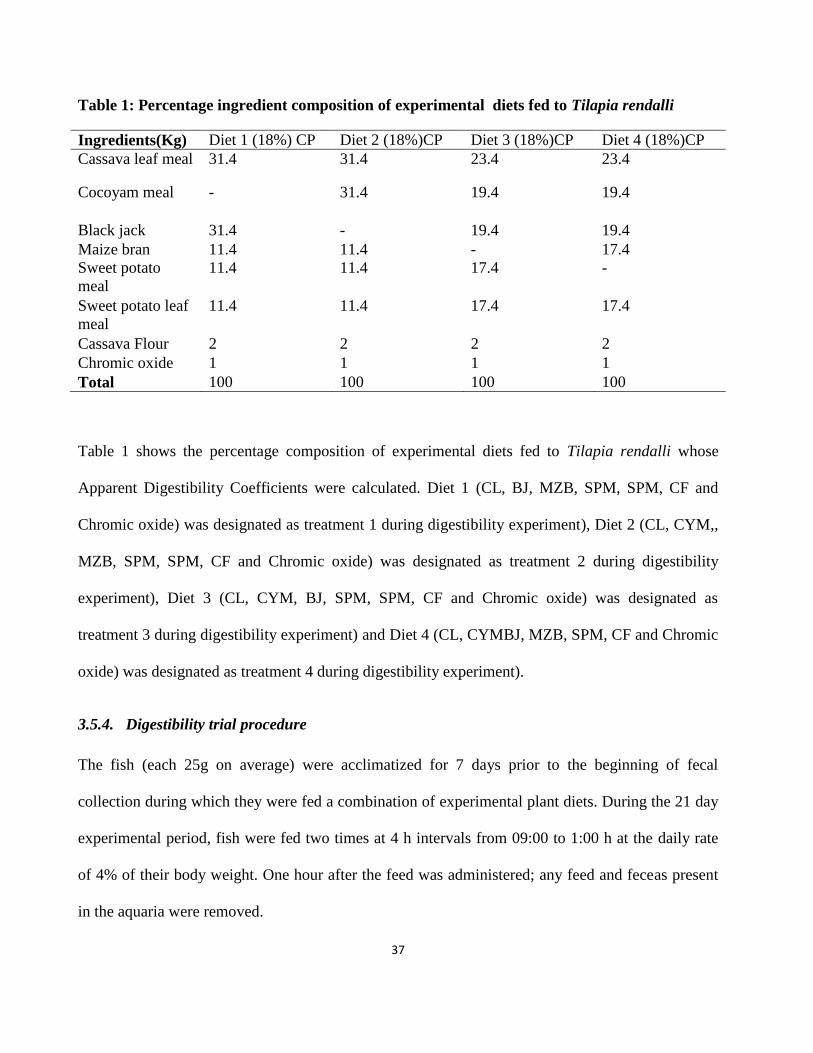
Table 1: Percentage ingredient composition of experimental diets fed to Tilapia rendalli ................ 37
Table 2: Proximate composition of plant feed ingredients from Mpamba (Mean±SE) expressed as
percent (%) dry matter .......................................................................................................................... 42
Table 3: Selected mineral and vitamin C composition of plant feed ingredient (Mean±SE) from
Mpamba expressed as percent (%) dry matter ..................................................................................... 45
Table 4: Proximate composition (%) of the whole body carcass of Tilapia rendalli fed on pelleted
diets containing different plant feedstuffs ............................................................................................ 46
Table 5: Proximate composition (%) of pelleted diets containing different plant feedstuffs fed to
Tilapia rendalli ..................................................................................................................................... 46
Table 6: Apparent digestibility coefficients (%) of pelleted diets containing different plant feedstuffs
fed to Tillapia rendalli ......................................................................................................................... 47
Table 7: Water quality parameters during digestibility experiment ..................................................... 49
xii
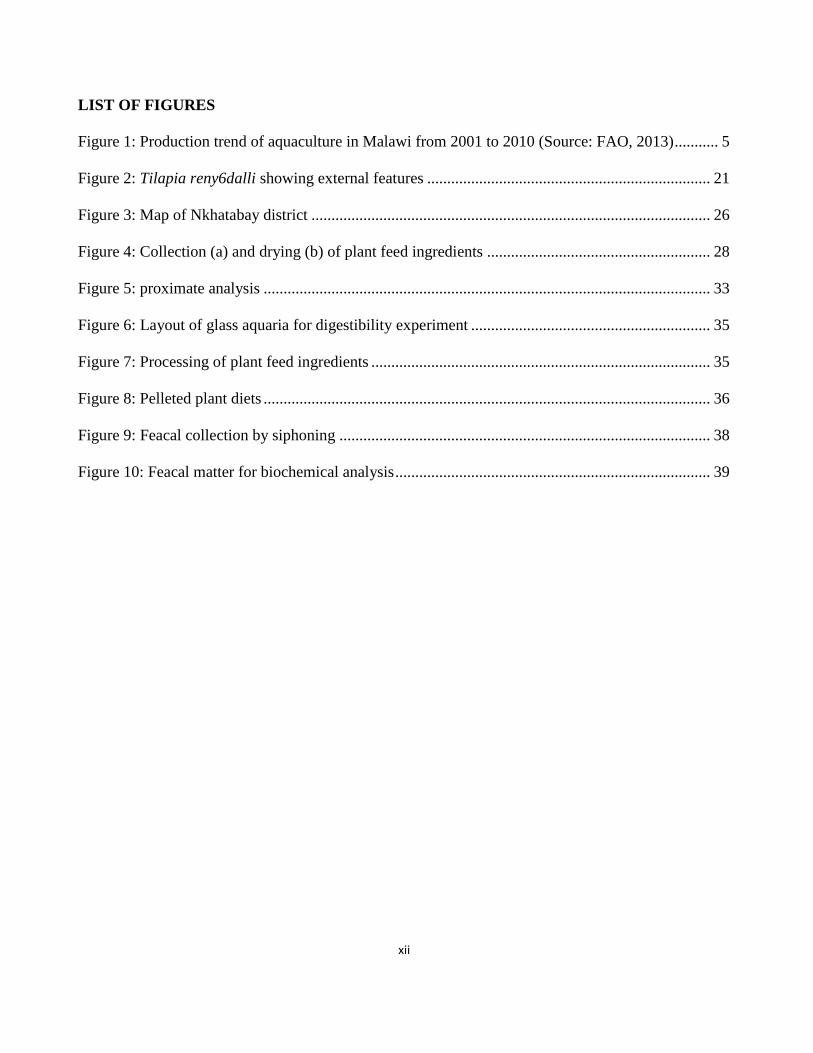
LIST OF FIGURES
Figure 1: Production trend of aquaculture in Malawi from 2001 to 2010 (Source: FAO, 2013) ........... 5
Figure 2: Tilapia reny6dalli showing external features ....................................................................... 21
Figure 3: Map of Nkhatabay district .................................................................................................... 26
Figure 4: Collection (a) and drying (b) of plant feed ingredients ........................................................ 28
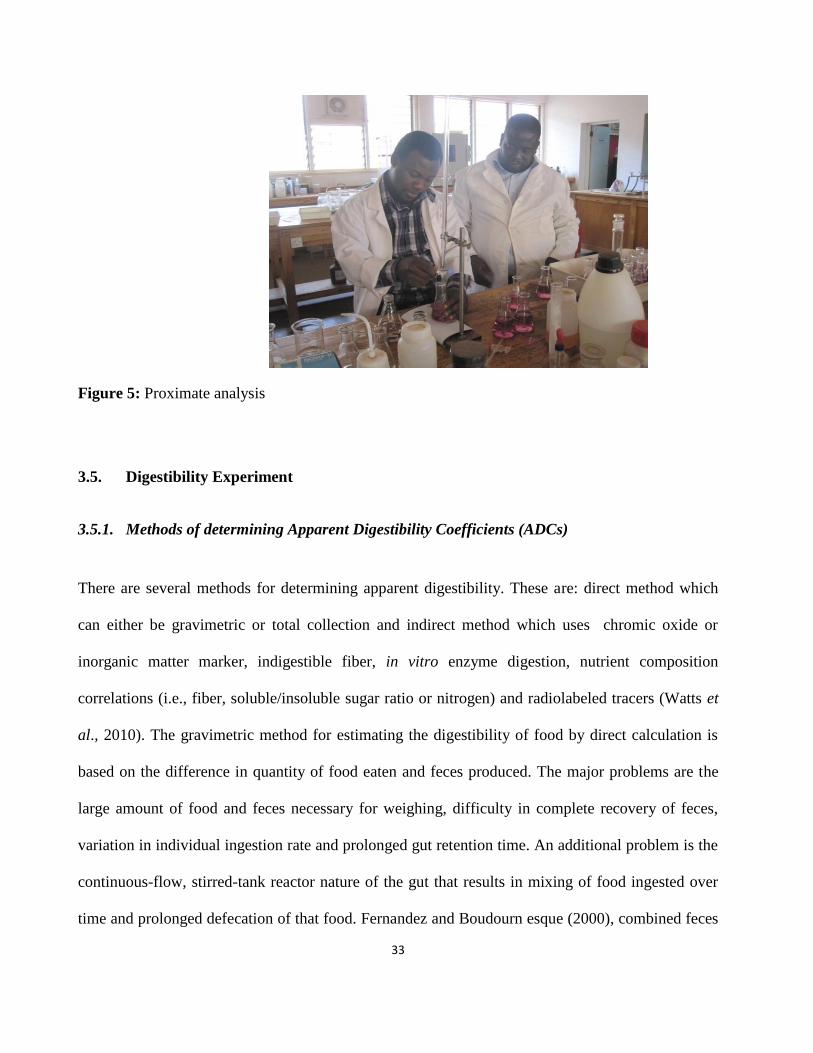
Figure 5: proximate analysis ................................................................................................................ 33
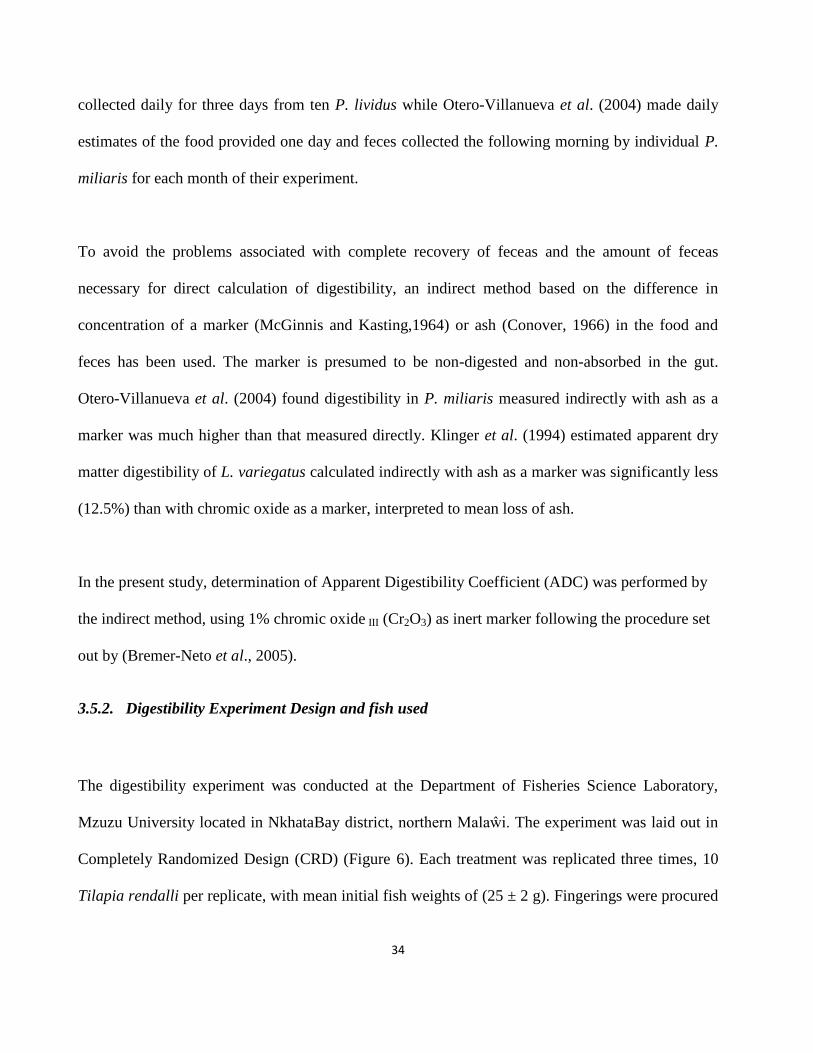
Figure 6: Layout of glass aquaria for digestibility experiment ............................................................ 35
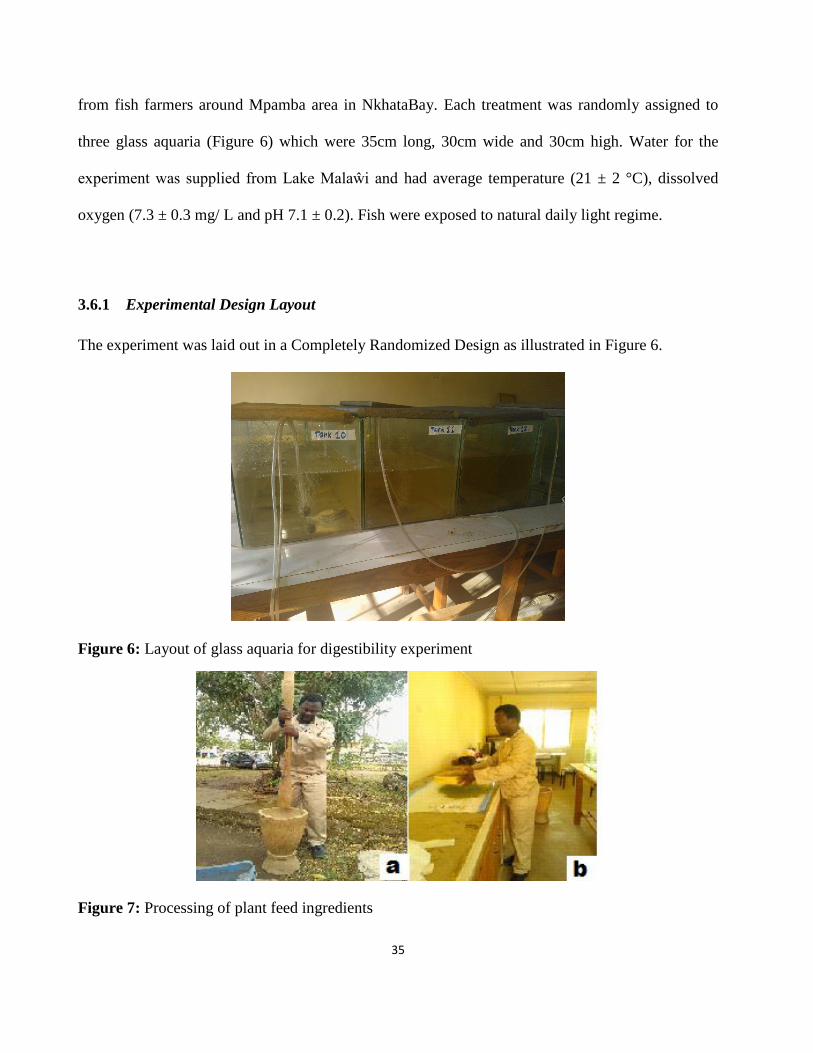
Figure 7: Processing of plant feed ingredients ..................................................................................... 35
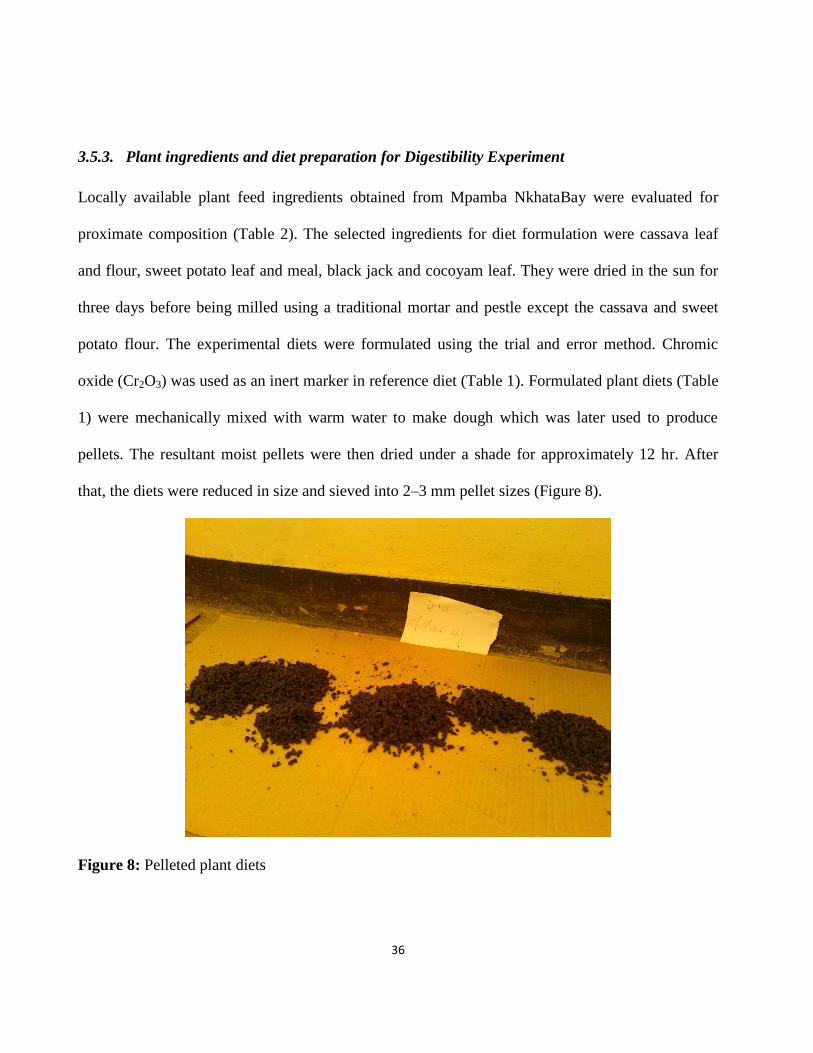
Figure 8: Pelleted plant diets ................................................................................................................ 36
Figure 9: Feacal collection by siphoning ............................................................................................. 38
Figure 10: Feacal matter for biochemical analysis ............................................................................... 39
xiii
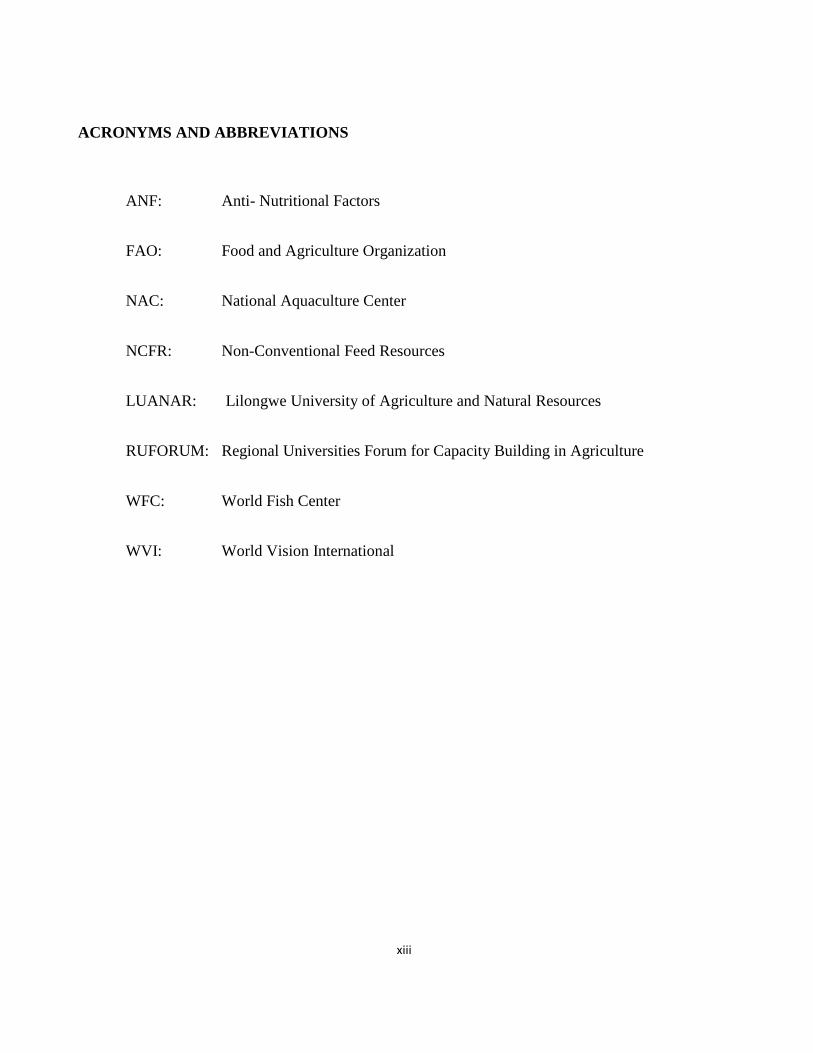
ACRONYMS AND ABBREVIATIONS
ANF: Anti- Nutritional Factors
FAO: Food and Agriculture Organization
NAC: National Aquaculture Center
NCFR: Non-Conventional Feed Resources
LUANAR: Lilongwe University of Agriculture and Natural Resources
RUFORUM: Regional Universities Forum for Capacity Building in Agriculture
WFC: World Fish Center
WVI: World Vision International
1
CHAPTER ONE
GENERAL INTRODUCTION
1.1. The Challenge Facing Feed Development in Aquaculture
Fish feed is the most expensive input during aquaculture operations. The high cost of feed arises
from extensive reliance on animal protein sources, such as fishmeal and shrimp meal (Omoregie,
2001). Shortage and high cost of pelleted feed severely constrains the development of low cost
aquaculture systems suitable especially for small-scale farmers. Therefore, there is a need to assess
the potential of non-conventional raw ingredients before use in fish diets. Good nutrition in animal
production systems is essential to economically produce a healthy and high quality product. Fish
nutrition has advanced dramatically in recent years Omoregie and Ogbemudia (1993) with the
development of new, balanced commercial diets that promote optimal fish growth and health.
However, as the cost of fish production continue to escalate due to soaring feed prices owing to
extensive use of expensive animal protein like fish meal, aquaculture production becomes a less or
non-profitable enterprise (El-Sayed, 2006). It is of primary importance for fish farmers to find
affordable and high quality fish feeds through the use of locally available plant ingredients.
Therefore, it is necessary to explore utilization of plant proteins in fish feeds as substitutes for
expensive animal protein materials (Omoregie and Ogbemudia, 1993).
Fish meal has become the most essential protein for commercial aquaculture feeds. It provides the
fish with high quality protein, an essential amino acid profile and has high palatability (Li et al.,
2
2006). However, fish meal is an expensive source of protein and is inaccessible to small scale fish
farmers in Southern Africa because of other valuable competing uses including human
consumption. Therefore, replacement of fish meal with cheaper ingredients of plant origin in fish
feed is necessary because of rising costs and uncertain availability of fish meal (Higgs et al., 1995).
Plant proteins are likely candidates because of local availability and low cost (Lim and Webster,
2006). However, substituting fishmeal with plant protein ingredients mostly results in reduction in
fish growth (Francis et al., 2001). The current study, therefore, aims at evaluating the nutritional
potential of plant ingredients despite its associated challenges.
The future development of small-scale aquaculture system depends on the use of available local
ingredients which will reduce feed cost (Edwards and Allan, 2004). However, for plant ingredients
to be incorporated into least cost-diets, an assessment of nutritional value is vital. It is imperative to
systematically characterize the biological value of plant raw materials (Olele, 2011). In Malawi, the
use of plant proteins in fish diets is sparingly practiced. Evidence exist that fish farmers are not
fully aware of the potential of using plant protein in fish diets. The current study seeks to explore
the nutritional potential of locally available plant and agriculture by products in Mpamba,
NkhataBay. Proximate composition of plant ingredients is assessed to isolate those that have high
protein and energy value. Secondly, a diet formulated from the nutritionally evaluated plant
ingredients is assessed for its digestibility on Tilapia rendalli. The digestibility of nutrients and the
feeds should be assessed to know the suitability of the feedstuffs in fish feeds. Digestibility trials
and nutrient balance studies have utilized direct methods, force feeding, metabolism chambers, and
various natural and artificial markers (Khan et al., 2003). Thus, digestibility, palatability of
3
ingredients and nutrient utilization are the most important parameters to enable the optimal
incorporation of particular ingredients in feed formulation (Glencross et al., 2007).
1.2. Global perspective on food security and fish production
World capture fisheries continue to steadily decline FAO, (2003) and as a result, fisheries scientists
are grappling with an alternative source of fish and fish products for the global population.
Aquaculture seems to be a readily available alternative to the provision of food fish eaten in the
world. Fish is widely accepted because it cuts across social, cultural and religious backgrounds
(Oresegun and Alegbeleye, 2001). Nutritionally, fish is one of the cheapest sources of protein and
micro nutrient for millions of people in Africa (Bene and Heck, 2005). However, with the world’s
ever increasing population coupled with inadequate wild fish production patterns, fish supplies
cannot sustain demand at 5 to 45 kg per person per/year (FAO, 2003). The United Nations predicted
a population increase of 1188 million in Africa by 2010 (Muir et al., 2005). Chronic hunger is
already prevalent in Africa where between two and four hundred million people in Sub-Saharan
Africa alone are reportedly undernourished. It is estimated that over 23 million African children are
malnourished (World Bank, 2006). Malawi has not been spared the scourge and there is need for
stringent measures to reduce malnutrition and hunger. This dire situation would normally demand
quick action and an aggressive approach tailored towards food production to feed the already high
human population in order to prevent inadequate food supplies and the consequential malnutrition.
Therefore, it is important to improve aquaculture feed production technologies to meet the high
demand for fish and fish products. The current study therefore, aims at improving the aquaculture
4
fish feed technology by developing an affordable and quality fish feed using local and available
ingredients.
Access to quality and affordable fish feed would enhance fish production in Malawi aquaculture.
As fish production increases, there would be an improvement in access to animal protein by the
population. Eventually, the nutrition and health of the people would also be improved. At present,
most fish famers in Malawi have a knowledge gap in feed formulation and therefore, the present
study aims at empowering fish farmers to be able to mathematically formulate fish feed by
combining different locally available plant ingredients into a mixed feed.
Fish provide a source of protein and sustainable income in many parts of Africa (FAO, 2003).
Thirty five million people in Africa depend wholly or partially on the fishery resources for their
livelihood (World Fish, 2005). In spite of aquaculture development and growth in Africa,
production has been low despite the vast aquatic resources abound on the continent. Low access to
affordable and quality fish feed is one of the significant challenges for the low fish production in
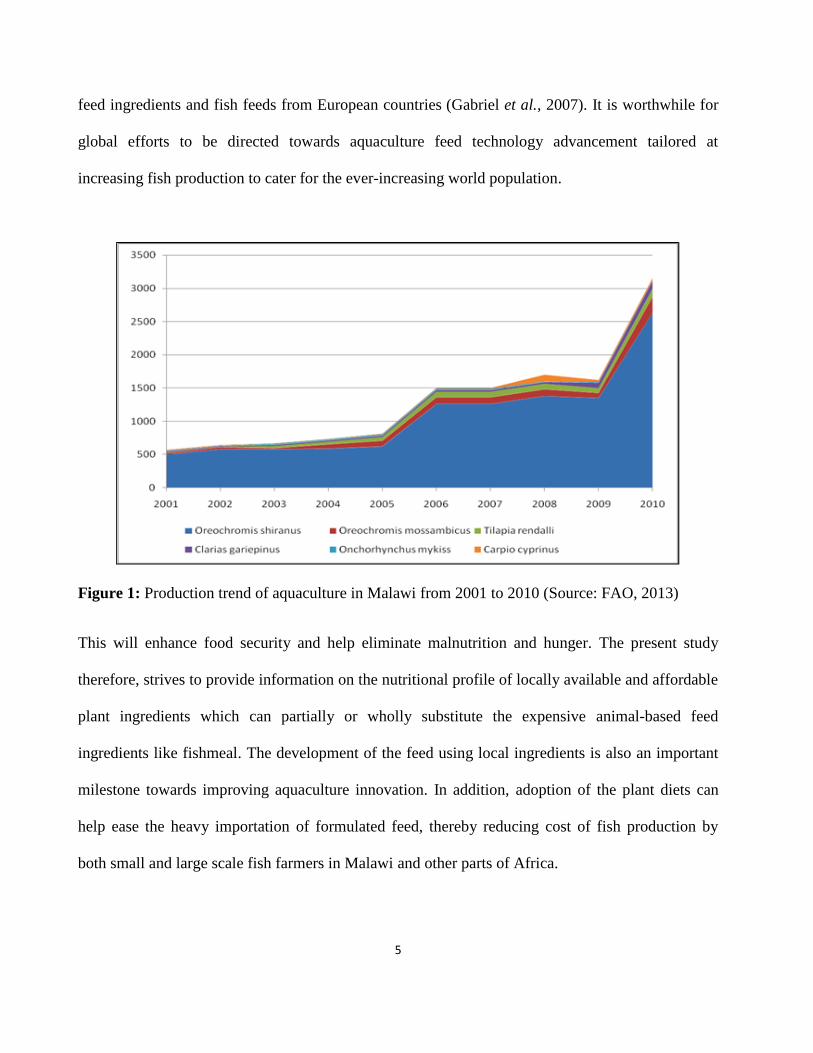
Malawi (Figure 1) and other parts of Africa. Other significant challenges of fish farming in Malawi
are; inherently slow growing fish species, poor aquaculture management and low credit facilities.
According to Hecht (2000), the entire continent of Africa contributed only 0.4% to the total world
aquaculture production for the period 1994 to 1995. In the year 2000, it contributed a mere 0.97%
of the total global aquaculture (FAO, 2003). Since the introduction of aquaculture to Africa, some
decades ago, there have been a lot of innovations, technological advancement and progress in the
areas of genetics, seed propagation, pond construction and farm management in general. Despite
breakthroughs recorded in these areas, most fish farmers in Africa still rely heavily on imported
5
feed ingredients and fish feeds from European countries (Gabriel et al., 2007). It is worthwhile for
global efforts to be directed towards aquaculture feed technology advancement tailored at
increasing fish production to cater for the ever-increasing world population.
Figure 1: Production trend of aquaculture in Malawi from 2001 to 2010 (Source: FAO, 2013)
This will enhance food security and help eliminate malnutrition and hunger. The present study
therefore, strives to provide information on the nutritional profile of locally available and affordable
plant ingredients which can partially or wholly substitute the expensive animal-based feed
ingredients like fishmeal. The development of the feed using local ingredients is also an important
milestone towards improving aquaculture innovation. In addition, adoption of the plant diets can
help ease the heavy importation of formulated feed, thereby reducing cost of fish production by
both small and large scale fish farmers in Malawi and other parts of Africa.
6
1.3. Overview of aquaculture feed development in Malawi
Fish is an important source of both food and income to many people in developing countries
(Gabriel et al., 2007). The fishing sector is important to both Malawi’s economy and its overall
food security, providing 300,000–450,000 jobs and 4% of GDP (FAO, 2008). Aquaculture is
growing exponentially in other parts of the world as an answer to the stagnating fishery production
against human population increase (Edwards and Allan, 2004). The aquaculture sector in Malawi
contributes 2 % to nation’s fish production with an average productivity of consumption (NAC,
2003) and per capita fish consumption has dropped from 12.9 Kg/year in 19702 to 7.3 Kg/ per in
recent years (GoM, 2011). Availability of affordable quality feed is one of the most important
problems that hamper aquaculture growth for both small scale as well as large scale aquaculture
operators in Malawi. Most small scale fish farmers in Malawi are not able to buy animal based fish
feeds, neither can they afford legumes like soybean as fish feed ingredients. This is because they are
expensive since they are used as feed for humans as reported by Andrews et al. (2003) and also
used as ingredients in livestock feed manufacturing. This has negatively affected production from
and profitability of fish farming in Malawi (Chirwa, 2008). Results of a study by Chikafumbwa
(1996), indicates that Tilapia rendalli seems to be a voracious and non-selective feeder on plants as
it consumes Cucurbita maxima, Tridax procumberns, Ipomea batatas, Bidens pilosa and Mucuna
pruriens. The study further showed that green grasses like leacuena could be presented whole into
fish ponds since chopping and grinding does not present significant advantages in terms of fish
growth and water quality. However, the study indicated that presentation of feed still required
further studies some of which are fish growth, digestibility and anti- nutritional factors of using
7
plant diets. Therefore, the present study contributes to the search for an affordable and quality feed
for fish in Malawian aquaculture in a quest to improve the fish production at national level.
1.4. Potential of Tilapias in Malawi aquaculture
Tilapia has been identified as one of the species with greatest potential to contribute to fish
production in Malawi. Previously, Tilapia was consumed mainly in Africa and Asia but nowadays it
has been regarded as the “new white fish” replacing the depleted ocean stocks, leading to an
increased worldwide demand (Yue and Zhou, 2008). In Malaŵi, Tilapia species are the most
farmed fishes due to high people’s preference to other species (Chirwa, 2008). Aquaculture fish
production in Malaŵi consists of 93% Tilapia (Oreochromis shiranus, Oreochromis karongae and
Tilapia rendalli), 5 percent catfish (Clarias gariepinus) and 2 percent exotic species such as
common carp (Cyprinus carpio) and trout (Onchorhychus mykiss) (NAC, 2003). According to El-
Sayed (2006) Tilapias generally display, under culture conditions, a 20% higher growth
performance than in nature. In a quest to promote tilapias production, several studies have been
conducted to enhance growth performance and health. Nutritional studies on species like
Oreochromis karongae, Oreochromis shiranus and Tilapia rendalli (Kang’ombe et al., 2006;
Kang’ombe et al., 2007) have been conducted in Malaŵi. Chikafumbwa (1996) reported on the
utilization of napier grass (Pennisetum perperium) and maize bran in the polyculture of Tilapia
rendalli and Oreochromis shiranus in ponds. The major determinant of a fish species to be used in
aquaculture is its growth rate (especially in captivity), its acceptance of artificial feeds immediately
after the yolk-sac absorption, resistance to handling stress, ease of reproduction, high fecundity and
consumer acceptance (Chikafumbwa, 1996). However, its culture is limited in Malaŵi and a few
8
neighboring countries since there other traditionally preferred fish species. Currently, Oreochromis
shiranus is the most widely cultured Tilapia species in Malawi, despite its relatively poor growth
rate (Hecht and Maluwa, 2003). However, its production has been low and this may be due to the
poor husbandry practices and lack of affordable high quality formulated diet among many fish
farmers in Malaŵi (Soko and Likongwe, 2002). Tilapia rendalli is a promising alternative
candidate for aquaculture because of its ability to utilize plant protein more efficiently making it
relatively cheap to raise (Chifamba, 1990).
The culturing of Tilapia rendalli in Malaŵi is often overlooked as an aquaculture candidate species
because most farmers do not have adequate knowledge about its potential in aquaculture (Hecht and
Maluwa, 2003). However, Tilapia rendalli can play an important role under extensive and semi-
intensive fish culture systems as it feeds mainly on readily available macrophytes (Chifamba,
1990). Tilapia rendalli has many attributes that make it a good candidate for aquaculture and these
include: feeding at low trophic levels as they feed largely on macrophytes, resistance to stress and
disease, tolerance to a wide range of environmental conditions such as unfavorable temperatures,
low dissolved oxygen levels, high ammonia levels and salinity, fairly fast growth and ability to
reproduce readily in captivity and does not incubate eggs in the mouth, which implies that females
do not stop feeding when breeding (El-Sayed, 2006). The paucity of information on the aquaculture
potential of Tilapia rendalli prompted the current study whose main focus was to evaluate the
nutritional potential of plant feed ingredients and the formulated diets fed to Tilapia rendalli. The
present study, envisages that information generated will help fish farmers in finding an affordable
and quality of diets of Tilapia rendalli.
9
1.5. Importance of digestibility in fish feed
Digestibility determination is one of the nutritional assessment tools that must be employed to
deduce the availability of nutrients levels in the plant diets that can be turned into fresh. Nutritive
value of feeds is determined by a number of factors, including composition, odor, texture and taste
(Khan et al., 2003). These factors are generally measurable in the case of the fish as digestibility
and intake. Digestibility is simply a measure of the availability of nutrients. One of the most
significant factors which determine the nutritive value of a feed is its digestibility (Khan et al.,
2003). Combination of feed intake data with digestibility data can make an accurate prediction of
overall nutritive value. However, intake is relatively more important than digestibility in
determining overall nutritive value because highly digestible feeds are of little value unless
consumed by the animal in question (Allan et al., 2000). Only that portion of the feed which is
soluble or is rendered soluble by hydrolysis or some other chemical or physical change can be taken
up into the circulation to assist in supplying the animal body with material for building and repair of
tissue or supplying the energy necessary for body functions (Glencross et al., 2007). In addition,
measures of digestibility are somewhat easier to obtain than measures of intake and thus,
considerable effort has been made by animal nutritionists to develop effective means of determining
digestibility. The present study investigated the digestibility of plant diets as the first step in
evaluating their potential for use in aquaculture production (Allan et al., 2000). The apparent
digestibility of nutrients like protein and energy generated from the current digestibility study are of
prime consideration for utilization in the fish feed formulation manufacturing industry (Khan et al.,
2003). Digestibility usually provides a fairly reliable index of nutritive value because more
10
digestible feeds are normally consumed to a greater extent than less digestible feeds. Eventually, the
generated digestibility index results from the current study will help farmers to have a better
selection criterion for plant ingredients to be included in the diet of Tilapia species in captivity.
In Malaŵi and other developing countries, animal protein sources like fish and bone meal are not
readily used in fish feeds manufacturing processes because they compete with human and livestock
consumption and are thus expensive (Gabriel et al., 2007). Therefore, non-conventional plant
ingredients like cassava leaf and peels could be used as an alternative to fish meal and other animal
ingredients. However, it is necessary to conduct nutritional assessments of plant ingredients,
agricultural-by products and plant diets. The evaluation of the digestible protein and energy value
of feed ingredients is critical to the cost-effective formulation of modern aquaculture diets and is
also an important part of the process in establishing their nutritional value (Glencross et al., 2007).
Therefore, the main objective of this study was to determine the nutritive value of different plant
ingredients found in NkhataBay and to determine digestibility of different plant diets made from the
plant ingredients fed to Tilapia rendalli in grass tanks. The current study therefore, determined
digestibilities of different plant diets formulated and fed to Tilapia rendalli. It is anticipated that the
generated information will be used for the formulation of affordable and quality feed by both large
scale commercial and small scale fish farmers in Malaŵi and the rest of the world.
11
1.6. Objectives of the study
The main objective of this study was to evaluate the potential locally available feed ingredients
from plant sources for the formulation of affordable diets for Tilapia rendalli, NkhataBay Northern
Malaŵi.
1.6.1. Specific objectives
1.6.1.1. To determine the proximate composition of locally available feedstuffs from plant
sources obtained from Mpamba, NkhataBay Northern, Malaŵi.
1.6.1.2. To determine the digestibility of diets formulated from locally available plant
sources fed to Tilapia rendalli.
1.7. Research hypotheses
1.7.1. There are variations in proximate composition of different ingredients from locally
available plant sources.
1.7.2. There is a variation in apparent digestibility of nutrients for different diets formulated
from locally available plant sources.
1.8. Problem statement and Justification
Access to nutritional inputs is identified as a key constraint by all fish farmers in Malaŵi (Andrews
et al., 2003). Over 90% of all fish farmers use primarily maize bran as fish feed. This feed
ingredient has been recommended by extension services since the 1940s, but it has low protein
12
content (5-12%) and a poor food-conversion ratio (FCR) of 12-20 (Hecht, 1999). While the
availability of maize bran is usually good, it can vary by region or season, and when there is a
general shortage of maize (the Malawian staple food), maize bran faces competing uses as it is a
major source of feed for livestock such as pigs and may also be consumed directly by poorer
families, hence may not be sustainable in production of fish feeds (Jamu and Costa-Pierce, 1993).
In Mpamba, NkhataBay district in northern part of Malawi, aquaculture production is low (0.2
tons/ha) Kamangira unpublished (2015) and this is attributed to many reasons such as in availability
of a high quality affordable feed, lack of information in formulated fish feed preparation,
inadequate extension services as well as inherently slow growth of fish species currently being
farmed in the area. Evidence exists that most fish farmers in Malawi are still not fully aware of the
benefits of using alternative inputs such as composted maize stover, cassava leaves, sweet potato
leaves, buffalo bean grass, antelope grass leaves, giant grass leaves, napier grass, mulberry leaves,
Leucanae leaves, banana leaves, pawpaw leaves, cabbage leaves, leftover homestead food such as
nsima (traditional maize porridge) (Hecht and Maluwa, 2003), and ash from kitchen fires (Jamu and
Costa-Pierce, 1993).
Proximate analysis of locally available plant based ingredients was conducted to holistically assess
the nutritional potential of the plant feed ingredients as feed for fish in Chingale area, Zomba
district Southern part of Malaŵi (Kang’ombe et al., 2009). It was noted from the analysis that plant
based ingredients such as black jack and banana leaves which recorded 21% and 18% crude protein
respectively can potentially be used in fish diets formulation. Additionally; Hecht (1999) reported
the success in northern Malaŵi of an innovation brought by the Border Zone Development Project
that promoted feeding cooked home-grown soybeans to fish. Hecht (1999) reported a food
13
conversion ratio (FCR) of 3 and found that profit margins from the sale of fish fed on soybeans was
34% higher than for fish fed on maize bran.
It is from the foregoing discussion that development of an affordable fish feed using locally
available a plant sources is imperative in Malawi. The present study focuses on utilization of
affordable and locally available plant sources to replace fish meal, without reducing the nutritional
quality of feed (EI-Sayed, 1999). This agrees favorably with observations by Hecht and Maluwa
(2003) and Kang’ombe et al. (2009) that use of available plant based feed would be sustainable in
Malaŵi fish industry. The present study, evaluated the nutritional potential of different plant
ingredients to be used as fish feed ingredients for Tilapia rendalli in Mpamba, NkhataBay district
northern Malawi.
Fish culture operations are being intensified and expensive conventional foodstuffs still in use,
therefore, the present study aimed at developing nutritionally balanced and affordable diet that has
good digestibility and provide the essential nutrients for optimal growth (Mokolensang et al., 2003).
To date, nutritionists and feed manufacturers have focused their trials on determining which of the
wide variety of foodstuffs available to the livestock and fish feed industry may be used to produce a
lower cost fish diet. Fish production sector provides not only animal protein and food security but
also improve service and profits for poverty elimination in many developing countries (Sheikh and
Sheikh, 2004). The current study further investigated the physical and chemical parameters of the
plant ingredients and diets instead of constraining the focus on affordability. Thus, the proximate
analysis and digestibility experiments were conducted to ascertain the nutritional value of the plant
raw materials. Information generated from the present study is important into the contribution of
14
knowledge on the bioavailability of nutrients and palatability of plant diets, parameters that affect
feed intake and growth.
Plant byproducts are a promising source of protein and energy for the formulation of economical
and nutritionally balanced fish feeds (Hardy, 2000). However, data on digestibility of most
potentially available plant ingredients for fish feeds are not available in Malaŵi. Therefore, the
present study was designed to determine the apparent nutrient digestibility of plant feed ingredients
locally available in Mpamba, NkhataBay. The digestibility information will be used in the
formulation of affordable feed for pond raised fish.
15
CHAPTER TWO
LITERATURE REVIEW
2.2. Current Challenges in Formulated Fish Feeds
Nutrition is central and a fundamental component in production of fish (Craig and Helfrich, 2002).
In spite of this, it is also the most costly item in fish production because of protein source. In
intensive aquaculture systems, feed is the most expensive item of all variable expenses irrespective
of the intensity of the culture operation (Lim and Webster, 2006). This calls for deliberate and
stringent measures to significantly reduce the fish feed costs. Therefore, different methodologies
and approaches must be tried to find an affordable feed while growth and health of the fish is not
significantly being compromised.
Fishmeal is the best protein source of fish feed globally (FAO, 2003). Among commonly used feed
ingredients, fishmeal is considered to be the best ingredient due to its compatibility with the protein
requirement of fish (Alam et al., 1996). Fishmeal is known to contain a complete essential amino
acid profile that is needed for fish species (Abowei and Ekubo, 2011). It provides the fish with high
quality protein, amino acid and has high palatability (Li et al., 2006). Amino acids are the determining
factor to meet the metabolic demands of a fish (Guimareas et al., 2010). In particular, essential or
indispensable amino acids (EAAs) like methionine and lysine cannot be synthesized by fish and are
often inadequate yet are needed for growth and tissue development (Fagbenro et al., 2000).
Despite being the main source of fish feed, fish meal is very expensive. As a result, most small-
scale fish farmers in Malaŵi cannot afford it. This development is partly responsible for the slow
16
growth of aquaculture in Malaŵi. Other limiting factors to aquaculture growth in Malawi are low
level of advocacy on emerging technologies emanating from inadequate extension services, low
capital to enable fish farmers embark on fish farming as a semi-commercial enterprise and slow
growing aquaculture candidates just to mention a few. Since fishmeal is expensive as a feed
ingredient, finding alternative protein sources to replace fishmeal in fish feed is important for
growth of the aquaculture industry (Francis et al., 2001; Tacon, 2003). The use of non-conventional
feedstuffs has been reported with good growth and better cost benefit values (Abowei and Ekubo,
2011). Non-conventional feed resources (NCFRs) are feeds that are not usually common in the
markets and are not the traditional ingredients used for commercial fish feed production (Madu et
al., 2003). NCFRs are noncompetitive in terms of human consumption, cheap to purchase;
byproducts or waste products from agriculture. These include all types of feedstuffs from plant and
animal by-products wastes.
2.3. Use of plants as ingredients in Tilapia diets
Literature indicates that several research studies have been conducted on the use of plants in fish
diets. Experiments done in intensive culture systems where feeding regimes (glass, plastic or fibre
glass tanks) are controlled have exhibited inconsistent results on use of plant diets by fish. Fish fed
Spirodela polyrhiza and Myriophyllum spicatum lost weight and produced negative Specific
Growth Rate (SGRs) of -1.75 and -1.71 and Feed Conversion Ratio (FCR) of -3.78 and -0.35
respectively (Setlikova and Adamek, 2004). However, Oreochromis niloticus exhibited slow growth
and even lost weight when fed exclusively on aquatic vegetation. Fish fed Potamogeton pectinatus
17
had a SGR of 3.18%/day whilst those fed Elodea canadensis had a slightly lower growth rate with
an SGR of 2.54%/day and an FCR of 0.34.
Experiments have been done with success in feeding Tilapia rendalli with napier grass (Pennisetum
purpureum). Tilapia rendalli fed on napier grass produced favorable growth rates (SGR,
1.29%/day) and was considered an effective low cost feed for African small holder farmers
(Chikafumbwa, 1996). Therefore, it was recommended as supplementary feed in fish ponds. In a
similar study, Adewulo (2008) reported that all the experimental plant diets were accepted by
Tilapia zilli fingerlings, indicating that the levels of incorporation of sweet potato leaf meal did not
affect the palatability of the diets. The study by Adewulo (2008) agrees favourably with Soko and
Kang’ombe (2010) who reported on plant protein based diets made from locally available and low
cost plant based ingredients formulated using least cost combinations. The plant diets were fed to
Tilapia rendalli in tank based grow-out culture system and improved growth of Tilapia rendalli.
This was evident by the good percentage increase in weight and acceptable feed utilization indices
(PER and FCR). These results are consistent with a study by Kang’ombe and Brown (2008) who
worked on low cost diets from plant sources administered to Tilapia rendalli reared in pond based
cage put in ponds for 90 days. Findings of that study showed that fish growth was higher in the
soybean meal-based diet, with final weight of 34.4 g, followed by sunflower cake, with final weight
of 23.3 g from initial stocking weight of 4.8g an 4.9g respectively. The specific growth rate for Tilapia
rendalli was 3.6%/day in Soybean meal based diet.
2.4. Limitations on use of Plant based Ingredient in fish Feeds
18
Non-conventional plant feed stuff (NCPF) are many and abundant, almost in every locality in
Africa (Francis et al., 2001). NCPF potential and utilization in aquaculture feed have been
extensively reviewed (Ugwumba, 2003). Their levels of inclusion in aquaculture feed varies and
largely depends on their availability, nutrient level, processing technique, species of fish and
cultural farming pattern prevalent in the locality (Oresegun and Alegbeleye, 2001). According to
Nandeesha et al. (1991), there are so many factors which limit higher level of incorporation of plant
ingredients diet. These include low protein content (Oresegun and Alegbeleye, 2001; Ibiyo and
Olowosegun, 2004), amino acid imbalance (Eyo, 2001) and presence of anti-nutritional factors
(Oresegun and Alegbeleye, 2001).
2.4.1. Effect of Anti-nutritional factors on feed utilization
When considering the nutrient content, some of the plant materials analyzed in various studies and
the present study have showed relatively high protein levels and energy levels and relative low fiber
content (Figure 2). However, it has been well known that most plant–derived nutrient sources
contain a wide variety of anti-nutritional factors (ANF) (Francis et al., 2011). Anti-nutritional
factors include cell wall constituents, high levels of saponins, phenolic and phytic acid. Saponins
are the main factors causing growth retardation when plant based protein sources are used
(Oresegun and Alegbeleye, 2001). These are found in potential plant-derived feed sources and are
considered to have a detrimental effect on fish. Anti-nutritional factors can adversely affect and
physiological processes such as digestion absorption, and respiration (Murry et al., 2010). The
limiting factor of using plant–derived proteins is the presence of anti-nutritional factors or toxicants
that may range from protease inhibitors, lectins, phytic acid, saponins, alkaloids, cyanogen’s,
19
tannins and gluccosinolates (Murray et al., 2010). These anti nutritional factors negates growth and
other physiological activities when they are in high levels in the plant diets (Oresegun and
Alegbeleye, 2001). On the other hand, as noted by Kays (1985), the sweet potato peel is devoid of
most of these agents as the sweet potato plant usually stores these chemicals in its tubers. In the
present study, the plant ingredients were first sundried primarily to rid them of anti-nutritional
factors.
Processes like soaking and sun-drying of the plant ingredients before formulating the diets may
reduce anti-nutritional factors and increase the growth performance of Tilapia rendalli. It has been
reported that common processing techniques such as different cooking methods, soaking, drying,
wet heating and adding feed supplements reduces the concentration of anti-nutritional factors in
plant feeds and improve the feed intake. These processing techniques for plant ingredients have
improved growth performance. Therefore, the quality of plant protein sources depends on the initial
processing method used. Afuang et al. (2003) reported that solvent extracted Moringa leaf meal
could replace up to 30% of fish meal in Oreochromis niloticus diets with no reduction in growth
when compared with the control. In another study, Wassef et al. (1988) reported that germinating
and defatting of soybean meal reduced the activity of protease inhibitors and consequently
improved growth performance.
A better feeding management is necessary in order to achieve an optimal use of the feedstuff by the
fish. In this context, mixing of different ingredients to make a diet ensure dilution of the different
anti- nutrients present in individual ingredients making up the diet. Eventually, the resulting mixed
diet could have beneficial effects on the nutrient utilization from the different feedstuffs available.
20
Thus, once the mixed plant feedstuffs are digested and the different anti-nutrients set free in the
digestive tract, they can interact with each other and this could lead to a relative reduction of their
individual detrimental effects (Dongmeza, 2009). A study by Olvera (2002), evaluated the effect of
substituting animal protein (fishmeal) with a mixture of soybean meal and alfalfa leaf meal in diets
of Nile tilapia (Oreochromis niloticus) fingerlings and results showed best growth performance
resulting from the mixed diet.
Furthermore, it was reported that differences in climate, environmental conditions including soils in
different geographical location, seasonal changes, growth conditions and agricultural practices as
well as variations between individual plants can affect nutrient composition of plant materials
(Harnly et al., 2009). Therefore, the present study was necessary to generate information that uses
the local plant ingredients to formulate a diet whose digestibility was measured on an endemic
species, the Tilapia rendalli.
It is evident from the foregoing discussion that, for the full nutritional potential of plant based
ingredients and diets to be realized, the current study subjected the plant ingredients to sun drying
and milling before use to rid them of anti-quality constituents such as cyanide, tannin and phytin.
Thus, the present study corroborates with Francis et al. (2001) who reported that numerous anti-
nutritional factors can be inactivated or reduced by heat treatment, de-hulling, germination and
other processing steps.
2.5. The growth performance of Tilapia rendalli in aquaculture systems
21
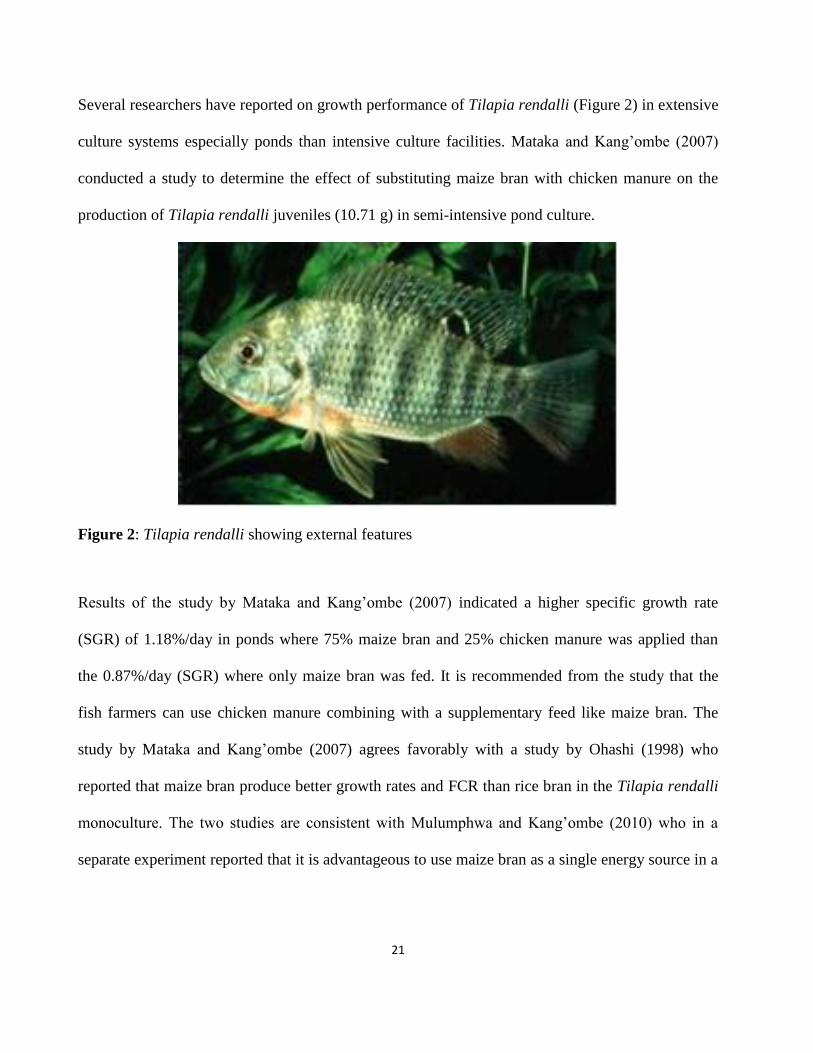
Several researchers have reported on growth performance of Tilapia rendalli (Figure 2) in extensive
culture systems especially ponds than intensive culture facilities. Mataka and Kang’ombe (2007)
conducted a study to determine the effect of substituting maize bran with chicken manure on the
production of Tilapia rendalli juveniles (10.71 g) in semi-intensive pond culture.
Figure 2: Tilapia rendalli showing external features
Results of the study by Mataka and Kang’ombe (2007) indicated a higher specific growth rate
(SGR) of 1.18%/day in ponds where 75% maize bran and 25% chicken manure was applied than
the 0.87%/day (SGR) where only maize bran was fed. It is recommended from the study that the
fish farmers can use chicken manure combining with a supplementary feed like maize bran. The
study by Mataka and Kang’ombe (2007) agrees favorably with a study by Ohashi (1998) who
reported that maize bran produce better growth rates and FCR than rice bran in the Tilapia rendalli
monoculture. The two studies are consistent with Mulumphwa and Kang’ombe (2010) who in a
separate experiment reported that it is advantageous to use maize bran as a single energy source in a
22
soybean-based diet than to use rice bran or a combination of rice bran and maize bran.
Supplementation of soybean-based diets in fertilized ponds significantly improves fish growth.
Soko and Likongwe (2002) reported a SGR of 0.87%/day in Tilapia rendalli fed maize bran in
ponds and that the addition of chicken manure increased the SGR to 1.18%/day. Soko and
Kang’ombe (2010), worked on another experiment that established a potential of using a
combination of local plant protein sources which was relatively cheap, readily available and easily
accessible to make least- cost feed for tilapia species in tank based grow out system. Juveniles of
Tillapia rendalli of average weight 9.5 ± SD 0.5g were stocked in outdoor concrete tanks and fed
on diets of different plant protein sources formulated at different crude protein (CP) levels. The
results of the study by Soko and Kang’ombe (2010) indicated that diets formulated from plant
protein ingredients had significant effect on growth and survival of Tilapia rendalli. Fish fed on
Diet 1 had an average final weight 25.64±0.79g, Diet 2 had final average weight of 23.31±0.71g,
Diet 3 had final average weight of 21.71 ±0.80g and Diet 4 had an average final weight of
23.00±1.12g and differed significantly among treatments. (Diets 1, 2 3).
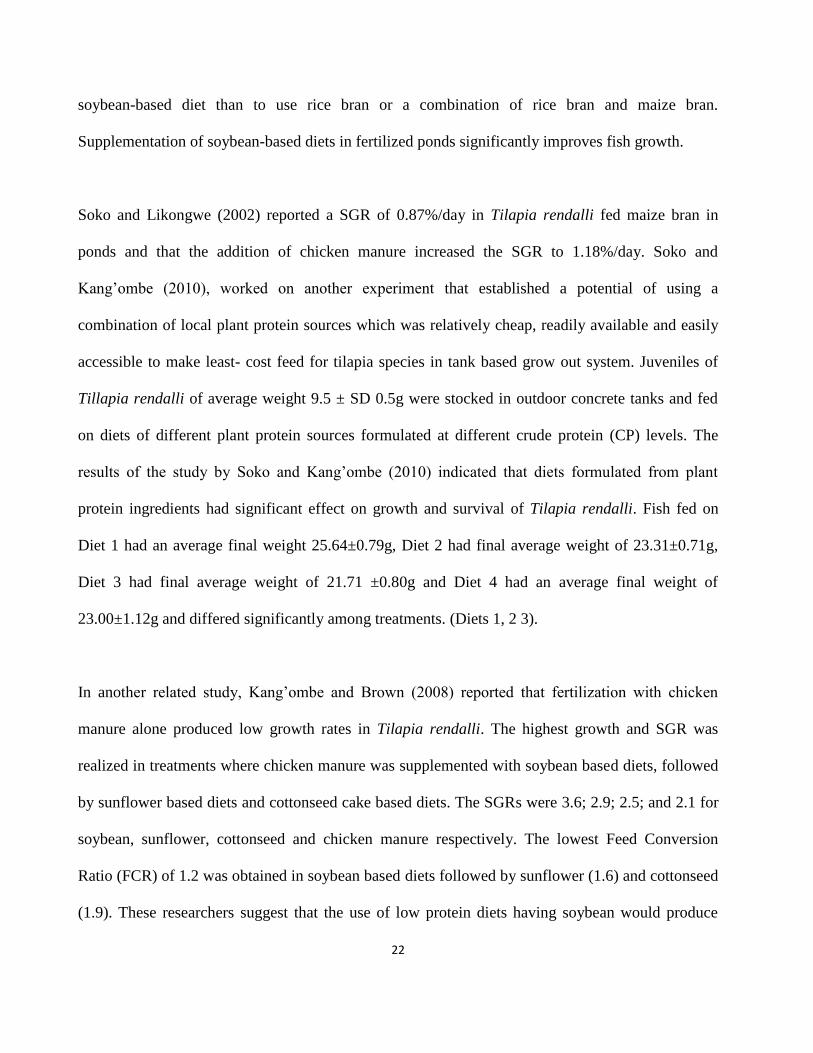
In another related study, Kang’ombe and Brown (2008) reported that fertilization with chicken
manure alone produced low growth rates in Tilapia rendalli. The highest growth and SGR was
realized in treatments where chicken manure was supplemented with soybean based diets, followed
by sunflower based diets and cottonseed cake based diets. The SGRs were 3.6; 2.9; 2.5; and 2.1 for
soybean, sunflower, cottonseed and chicken manure respectively. The lowest Feed Conversion
Ratio (FCR) of 1.2 was obtained in soybean based diets followed by sunflower (1.6) and cottonseed
(1.9). These researchers suggest that the use of low protein diets having soybean would produce
23
better results and increased yield of Tilapia rendalli when combined with fertilization of the
aquaculture system. The findings corroborates those by Chifamba (1990) whole indicated that
Tilapias including Tilapia rendalli grow 86% better in captivity than in nature. These studies point
out that Tilapia rendalli has a potential as an aquaculture candidate because it has the ability to
utilize plant diets. Therefore, the present study further explores the ability of Tilapia rendalli to use
other locally available plant diets like cassava leaf meal, sweet potato leaf meal and cocoyam,
which are locally available in Mpamba, NkhataBay because of the interest of farmers in fish
farming. In addition, it is also imperative to conduct further studies on the plant diets in various
aquaculture systems e.g. raceways, tanks and cages.
2.6. Feed digestibility studies-an important parameter for feed quality
Fish meal is known for its high digestibility due to high essential amino acids and fatty acid
contents, low carbohydrates and low anti-nutritional factors contents (Naylor et al., 2009).There is a
general consensus that as aquaculture production will increase to meet expected demand for
fisheries products in the next 7–10 years, and, annual fish meal supply will not meet increasing
demand (Allan et al., 2000). Therefore, the price of fish meal is going to increase steadily since
supply for fish meal will be lower than demand (Cheng et al., 2004). This calls for better knowledge
of the nutritional value of non-conventional ingredients that could replace fish meal particularly for
small-scale farmers in developing countries (Edwards and Allan, 2004; Naylor et al., 2009). In
recent years, research on the use of locally available feed resources, such as agricultural by-
products, industrial waste and animal by-products, in fish feed has increased (Allan et al., 2000;
Sklan et. al., 2004; Gatlin et al., 2007). The nutritional value of feed components depends on ability
24
of the animal to digest and absorb the nutrients (Falaye and Jauncey, 1999; Riche et al., 2001).
Therefore, determination of digestibility is an important first step in the evaluation process of an
ingredient for use in diets for different fish species.
Many studies have reported the digestibility of various plant feed ingredients for Atlantic salmon
(Salmo salar) (Storebakken et al., 2000; Glencross et al., 2004; Refstie et al., 2005; Aas et al.,
2006; Refstie et al., 2006; Denstadli et al., 2007; Kraugerud et al., 2007). Digestibility of plant
proteins was lower for the plant feed ingredients compared to fishmeal; except for bacterial protein
meal, extracted soybean meal, oat, and rapeseed and sunflower. There have been variable results
reported for soybean meal with some studies showing decreased protein digestibility compared to
fishmeal while other studies did not detect any change in protein digestibility (Refstie et al., 2005,
2006; Kraugerud et al., 2007). When the plant feed stuff was further chopped to make protein
concentrates, digestibility was unaffected (Glencross et. al., 2004; Denstadli et al., 2007).
The present study, conducted to generate information on digestibility of Tilapia rendalli fed plant
diets is an important step in provision of data for the formulation of affordable and quality diets that
uses locally available agriculture by products and plant ingredients.
25
CHAPTER THREE
MATERIALS AND METHODS
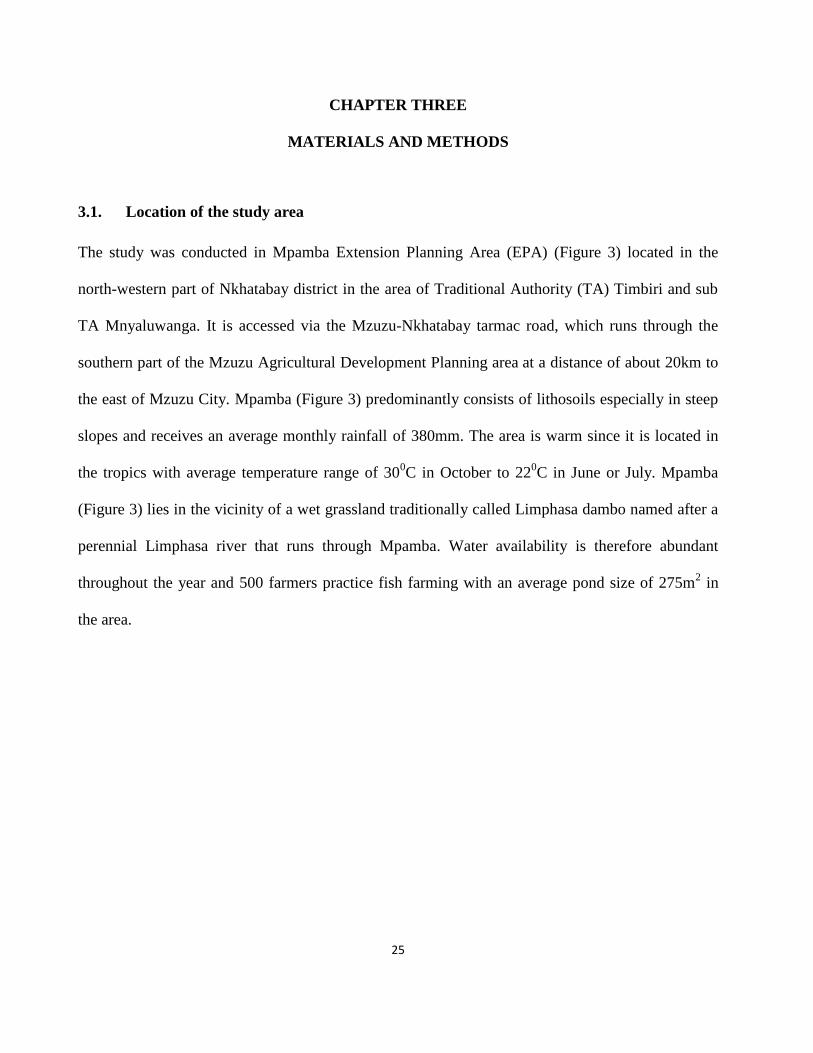
3.1. Location of the study area
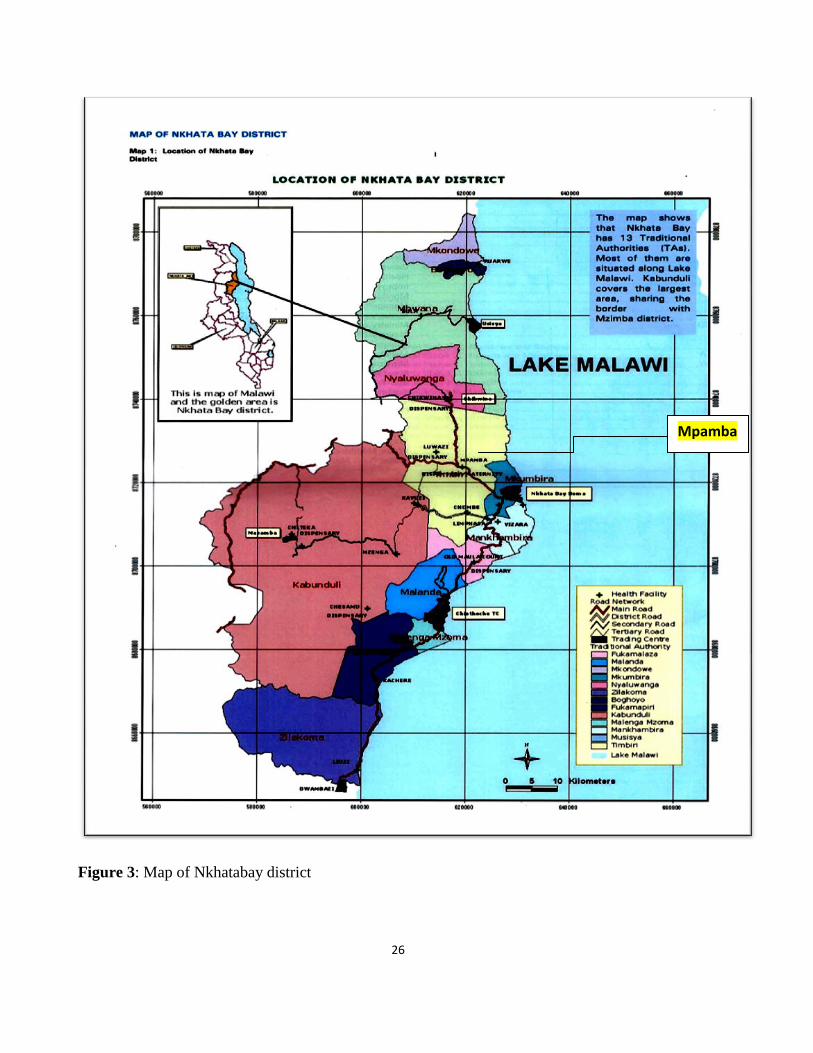
The study was conducted in Mpamba Extension Planning Area (EPA) (Figure 3) located in the
north-western part of Nkhatabay district in the area of Traditional Authority (TA) Timbiri and sub
TA Mnyaluwanga. It is accessed via the Mzuzu-Nkhatabay tarmac road, which runs through the
southern part of the Mzuzu Agricultural Development Planning area at a distance of about 20km to
the east of Mzuzu City. Mpamba (Figure 3) predominantly consists of lithosoils especially in steep
slopes and receives an average monthly rainfall of 380mm. The area is warm since it is located in
the tropics with average temperature range of 300C in October to 22
0C in June or July. Mpamba
(Figure 3) lies in the vicinity of a wet grassland traditionally called Limphasa dambo named after a
perennial Limphasa river that runs through Mpamba. Water availability is therefore abundant
throughout the year and 500 farmers practice fish farming with an average pond size of 275m2 in
the area.
26
Figure 3: Map of Nkhatabay district
Mpamba
27
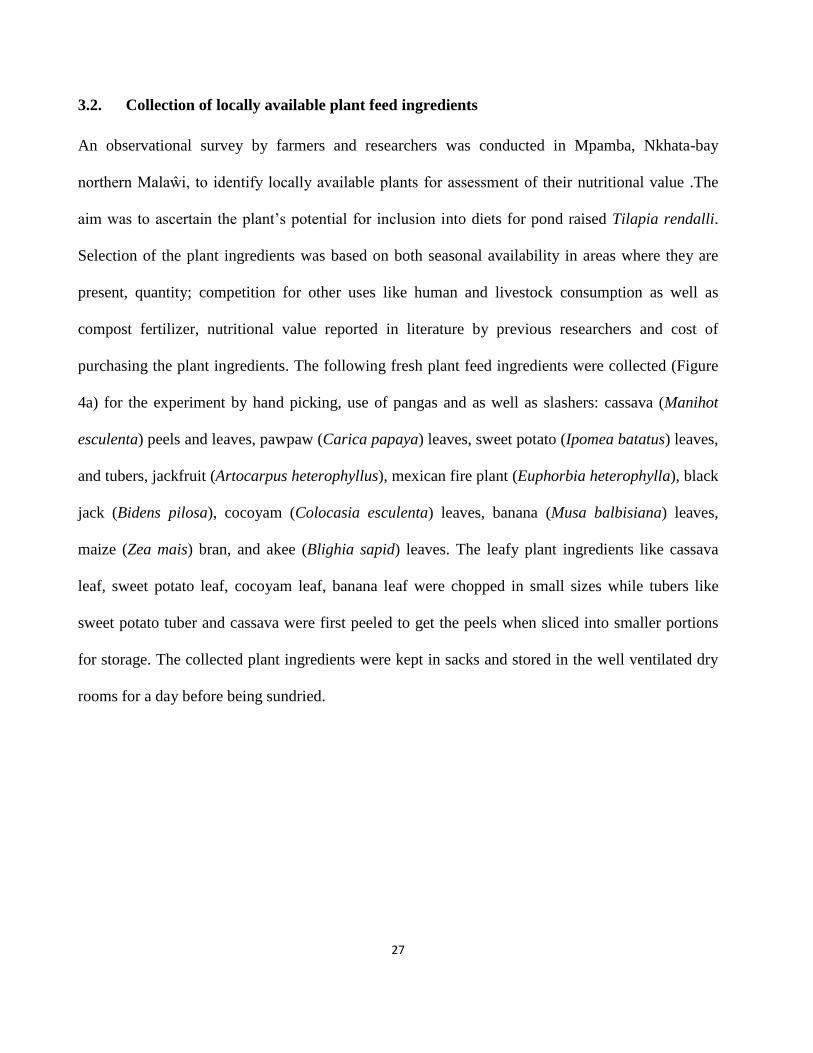
3.2. Collection of locally available plant feed ingredients
An observational survey by farmers and researchers was conducted in Mpamba, Nkhata-bay
northern Malaŵi, to identify locally available plants for assessment of their nutritional value .The
aim was to ascertain the plant’s potential for inclusion into diets for pond raised Tilapia rendalli.
Selection of the plant ingredients was based on both seasonal availability in areas where they are
present, quantity; competition for other uses like human and livestock consumption as well as
compost fertilizer, nutritional value reported in literature by previous researchers and cost of
purchasing the plant ingredients. The following fresh plant feed ingredients were collected (Figure
4a) for the experiment by hand picking, use of pangas and as well as slashers: cassava (Manihot
esculenta) peels and leaves, pawpaw (Carica papaya) leaves, sweet potato (Ipomea batatus) leaves,
and tubers, jackfruit (Artocarpus heterophyllus), mexican fire plant (Euphorbia heterophylla), black
jack (Bidens pilosa), cocoyam (Colocasia esculenta) leaves, banana (Musa balbisiana) leaves,
maize (Zea mais) bran, and akee (Blighia sapid) leaves. The leafy plant ingredients like cassava
leaf, sweet potato leaf, cocoyam leaf, banana leaf were chopped in small sizes while tubers like
sweet potato tuber and cassava were first peeled to get the peels when sliced into smaller portions
for storage. The collected plant ingredients were kept in sacks and stored in the well ventilated dry
rooms for a day before being sundried.
28
Figure 4: Collection (a) and drying (b) of plant feed ingredients
3.3. Processing of plant feed ingredients
All plant ingredients were dried (Figure 4b) in the sun for three days as recommended by Adewulo,
(2008). Drying (Figure 4b) of plant ingredients was done not only to reduce toxicity but also to
prepare them for milling into powder suitable for proximate analysis. Ingredients were milled using
a mortar and a pestle (Figure 7a). Finally, the milled plant samples were sieved using a wooden
framed 2mm mesh sized sieve to remove debris to remain with the powder (Figure 7b).
3.4. Proximate Analysis of plant feed ingredients
Proximate analysis (Figure 5) of the plant ingredients was done at Department of Aquaculture and
Fisheries Science laboratory Lilongwe University of Agriculture and Natural Resources
(LUANAR), Bunda Campus. The milled plant feed samples were analyzed for crude protein, crude
fiber, crude fat, ash, moisture content and gross energy in triplicate, following the procedure
outlined by the Association of Official Analytical Chemists AOAC (2003).
29
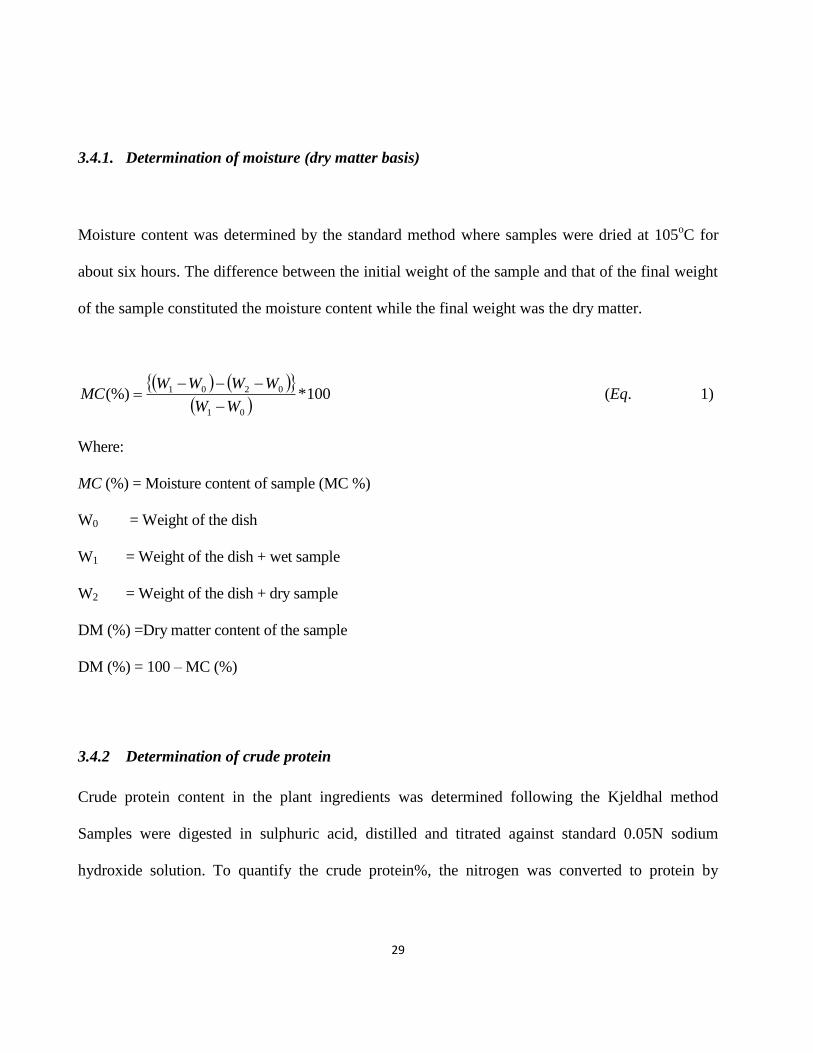
3.4.1. Determination of moisture (dry matter basis)
Moisture content was determined by the standard method where samples were dried at 105oC for
about six hours. The difference between the initial weight of the sample and that of the final weight
of the sample constituted the moisture content while the final weight was the dry matter.
100*(%)01
0201
WW
WWWWMC
(Eq. 1)
Where:
MC (%) = Moisture content of sample (MC %)
W0 = Weight of the dish
W1 = Weight of the dish + wet sample
W2 = Weight of the dish + dry sample
DM (%) =Dry matter content of the sample
DM (%) = 100 – MC (%)
3.4.2 Determination of crude protein
Crude protein content in the plant ingredients was determined following the Kjeldhal method
Samples were digested in sulphuric acid, distilled and titrated against standard 0.05N sodium
hydroxide solution. To quantify the crude protein%, the nitrogen was converted to protein by
30
multiplying with a conversion factor of 6.25. Protein contains 16% nitrogen hence 6.25 are obtained
from dividing 100 by 16.
100*(%) sr WtWtCP (Eq. 2)
Where:
CP (%) = % Crude Protein
Wtr =Weight of residue
Wts =Weight of sample
3.4.3. Determination of Crude fat
The lipid content was determined by Soxhlet Method. Ether extracts were analyzed using a sample
size of 2 g digested in a Soxhlet extractor with petroleum ether (boiling point 40–60 oC). Crude fat
(CF) was determined by boiling 1 g of sample in a standard solution of 3.13 % H2SO4 for 10
minutes. The remaining sample was rinsed with hot water followed by boiling in 3.13 % NaOH for
another 10 minutes. Thereafter, the remaining sample was rinsed repeatedly with hot water
followed by acetone. The residue was oven dried at 60oC for 4 hours, cooled in desiccators and
weighed. The lipid content was determined by the following formula:
100*(%)12
34
WW
WWLC
(Eq. 3)
Where:
LC (%) = Lipid content (%)
31
Weight of the filter paper = W1
Weight of the filter paper + sample = W2
Weight of the cup + boiling chips = W3
Weight of the cup + chips + lipid = W4
3.4.4. Determination of Crude fibre
Crude fibre was determined by acid-base digestion using 1.25% H2S04 (w/v) and 1.25% NaOH
(w/v) solution. A 5 g sample was boiled in weak acid of 0.1 M HCl and afterwards placed in weak
base, 0.313 M Sodium hydroxide. Samples were further subjected to heating at 550oC temperature
for 2 hours using a muffle furnace and then cooled. Crude fibre was then quantified by expressing
the loss in weight after ashing as a percentage of the original weight of the sample
100*(%)1
32
W
WWC f
(Eq. 4)
Cf (%) = Crude fibre in (%)
Sample weight = W1
Weight of the crucible + Dry residue = W2
Weight of the crucible + Ash = W3
3.4.5. Determination of Ash
Ash is the inorganic material that remains after a sample is burnt at 550oC . The ash was determined
by heating the sample in the muffle furnace at 550oC for 5 hours. The temperature was used to
32
prevent loss of certain volatile minerals. Ash (%) was calculated by dividing weight of ash (g) of
the sample and of dry matter (g) of the sample multiplied by 100.
100*(%)01
02
WW
WWAsh
(Eq. 5)
Where
Ash (%) =Ash Content of the Sample (%)
W0 =Weight of clean, dry crucible
W1 = Weight of clean, dry crucible + dry sample
W2 =Weight of clean, dry crucible + ash
3.4.6. Determination of Gross energy
Gross energy was determined by igniting the samples in a Gallenkamp Ballistic bomb calorimeter
CB-370 .Total heat of combustion of the sample was determined by completely oxidizing the
compound to carbon dioxide, water and other gases and measuring the heat released.
33
Figure 5: Proximate analysis
3.5. Digestibility Experiment
3.5.1. Methods of determining Apparent Digestibility Coefficients (ADCs)
There are several methods for determining apparent digestibility. These are: direct method which
can either be gravimetric or total collection and indirect method which uses chromic oxide or
inorganic matter marker, indigestible fiber, in vitro enzyme digestion, nutrient composition
correlations (i.e., fiber, soluble/insoluble sugar ratio or nitrogen) and radiolabeled tracers (Watts et
al., 2010). The gravimetric method for estimating the digestibility of food by direct calculation is
based on the difference in quantity of food eaten and feces produced. The major problems are the
large amount of food and feces necessary for weighing, difficulty in complete recovery of feces,
variation in individual ingestion rate and prolonged gut retention time. An additional problem is the
continuous-flow, stirred-tank reactor nature of the gut that results in mixing of food ingested over
time and prolonged defecation of that food. Fernandez and Boudourn esque (2000), combined feces
34
collected daily for three days from ten P. lividus while Otero-Villanueva et al. (2004) made daily
estimates of the food provided one day and feces collected the following morning by individual P.
miliaris for each month of their experiment.
To avoid the problems associated with complete recovery of feceas and the amount of feceas
necessary for direct calculation of digestibility, an indirect method based on the difference in
concentration of a marker (McGinnis and Kasting,1964) or ash (Conover, 1966) in the food and
feces has been used. The marker is presumed to be non-digested and non-absorbed in the gut.
Otero-Villanueva et al. (2004) found digestibility in P. miliaris measured indirectly with ash as a
marker was much higher than that measured directly. Klinger et al. (1994) estimated apparent dry
matter digestibility of L. variegatus calculated indirectly with ash as a marker was significantly less
(12.5%) than with chromic oxide as a marker, interpreted to mean loss of ash.
In the present study, determination of Apparent Digestibility Coefficient (ADC) was performed by
the indirect method, using 1% chromic oxide III (Cr2O3) as inert marker following the procedure set
out by (Bremer-Neto et al., 2005).
3.5.2. Digestibility Experiment Design and fish used
The digestibility experiment was conducted at the Department of Fisheries Science Laboratory,
Mzuzu University located in NkhataBay district, northern Malaŵi. The experiment was laid out in
Completely Randomized Design (CRD) (Figure 6). Each treatment was replicated three times, 10
Tilapia rendalli per replicate, with mean initial fish weights of (25 ± 2 g). Fingerings were procured
35
from fish farmers around Mpamba area in NkhataBay. Each treatment was randomly assigned to
three glass aquaria (Figure 6) which were 35cm long, 30cm wide and 30cm high. Water for the
experiment was supplied from Lake Malaŵi and had average temperature (21 ± 2 °C), dissolved
oxygen (7.3 ± 0.3 mg/ L and pH 7.1 ± 0.2). Fish were exposed to natural daily light regime.
3.6.1 Experimental Design Layout
The experiment was laid out in a Completely Randomized Design as illustrated in Figure 6.
Figure 6: Layout of glass aquaria for digestibility experiment
Figure 7: Processing of plant feed ingredients
36
3.5.3. Plant ingredients and diet preparation for Digestibility Experiment
Locally available plant feed ingredients obtained from Mpamba NkhataBay were evaluated for
proximate composition (Table 2). The selected ingredients for diet formulation were cassava leaf
and flour, sweet potato leaf and meal, black jack and cocoyam leaf. They were dried in the sun for
three days before being milled using a traditional mortar and pestle except the cassava and sweet
potato flour. The experimental diets were formulated using the trial and error method. Chromic
oxide (Cr2O3) was used as an inert marker in reference diet (Table 1). Formulated plant diets (Table
1) were mechanically mixed with warm water to make dough which was later used to produce
pellets. The resultant moist pellets were then dried under a shade for approximately 12 hr. After
that, the diets were reduced in size and sieved into 2–3 mm pellet sizes (Figure 8).
Figure 8: Pelleted plant diets
37
Table 1: Percentage ingredient composition of experimental diets fed to Tilapia rendalli
Ingredients(Kg) Diet 1 (18%) CP Diet 2 (18%)CP Diet 3 (18%)CP Diet 4 (18%)CP
Cassava leaf meal 31.4 31.4 23.4 23.4
Cocoyam meal - 31.4 19.4 19.4
Black jack 31.4 - 19.4 19.4
Maize bran 11.4 11.4 - 17.4
Sweet potato
meal
11.4 11.4 17.4 -
Sweet potato leaf
meal
11.4 11.4 17.4 17.4
Cassava Flour 2 2 2 2
Chromic oxide 1 1 1 1
Total 100 100 100 100
Table 1 shows the percentage composition of experimental diets fed to Tilapia rendalli whose
Apparent Digestibility Coefficients were calculated. Diet 1 (CL, BJ, MZB, SPM, SPM, CF and
Chromic oxide) was designated as treatment 1 during digestibility experiment), Diet 2 (CL, CYM,,
MZB, SPM, SPM, CF and Chromic oxide) was designated as treatment 2 during digestibility
experiment), Diet 3 (CL, CYM, BJ, SPM, SPM, CF and Chromic oxide) was designated as
treatment 3 during digestibility experiment) and Diet 4 (CL, CYMBJ, MZB, SPM, CF and Chromic
oxide) was designated as treatment 4 during digestibility experiment).
3.5.4. Digestibility trial procedure
The fish (each 25g on average) were acclimatized for 7 days prior to the beginning of fecal
collection during which they were fed a combination of experimental plant diets. During the 21 day
experimental period, fish were fed two times at 4 h intervals from 09:00 to 1:00 h at the daily rate
of 4% of their body weight. One hour after the feed was administered; any feed and feceas present
in the aquaria were removed.
38
3.5.5. Feacal collection during the digestibility trial
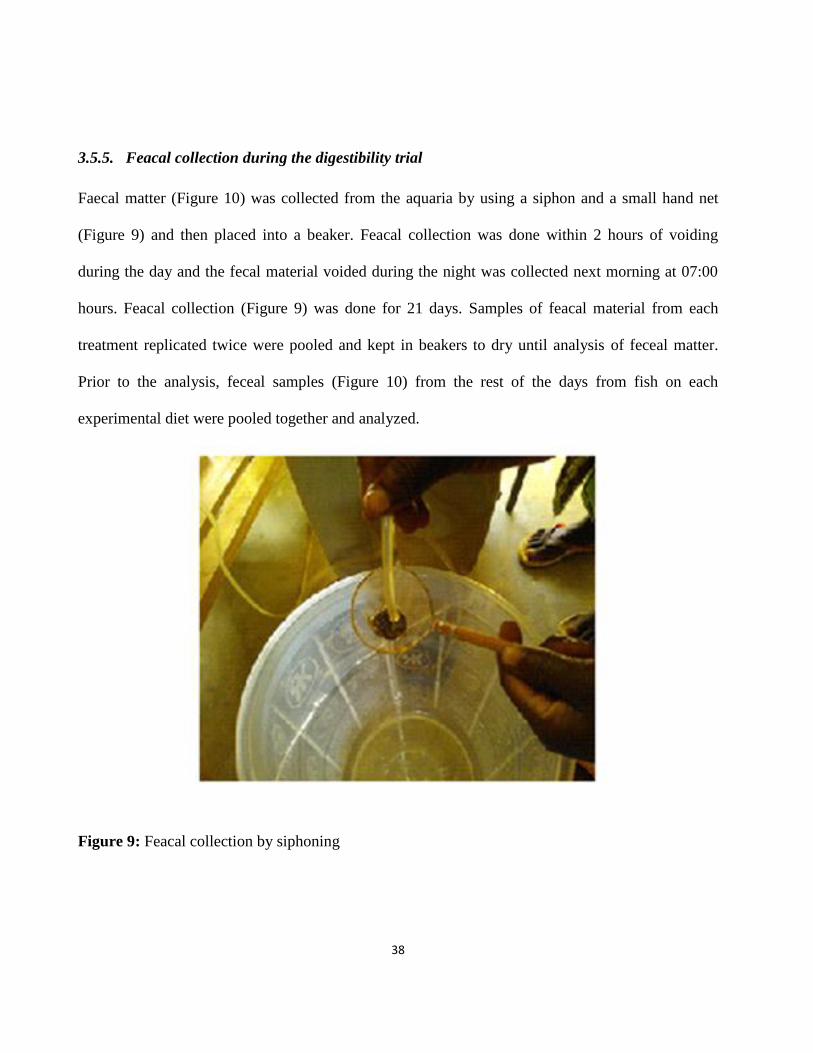
Faecal matter (Figure 10) was collected from the aquaria by using a siphon and a small hand net
(Figure 9) and then placed into a beaker. Feacal collection was done within 2 hours of voiding
during the day and the fecal material voided during the night was collected next morning at 07:00
hours. Feacal collection (Figure 9) was done for 21 days. Samples of feacal material from each
treatment replicated twice were pooled and kept in beakers to dry until analysis of feceal matter.
Prior to the analysis, feceal samples (Figure 10) from the rest of the days from fish on each
experimental diet were pooled together and analyzed.
Figure 9: Feacal collection by siphoning
39
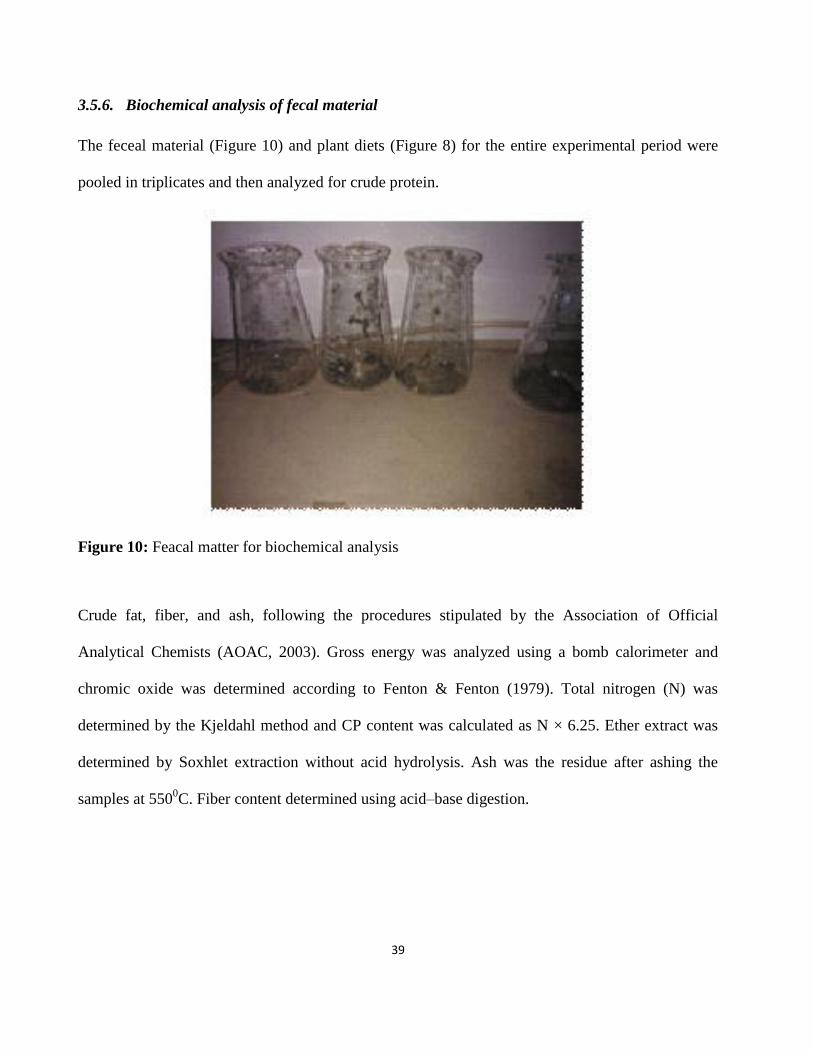
3.5.6. Biochemical analysis of fecal material
The feceal material (Figure 10) and plant diets (Figure 8) for the entire experimental period were
pooled in triplicates and then analyzed for crude protein.
Figure 10: Feacal matter for biochemical analysis
Crude fat, fiber, and ash, following the procedures stipulated by the Association of Official
Analytical Chemists (AOAC, 2003). Gross energy was analyzed using a bomb calorimeter and
chromic oxide was determined according to Fenton & Fenton (1979). Total nitrogen (N) was
determined by the Kjeldahl method and CP content was calculated as N × 6.25. Ether extract was
determined by Soxhlet extraction without acid hydrolysis. Ash was the residue after ashing the
samples at 5500C. Fiber content determined using acid–base digestion.
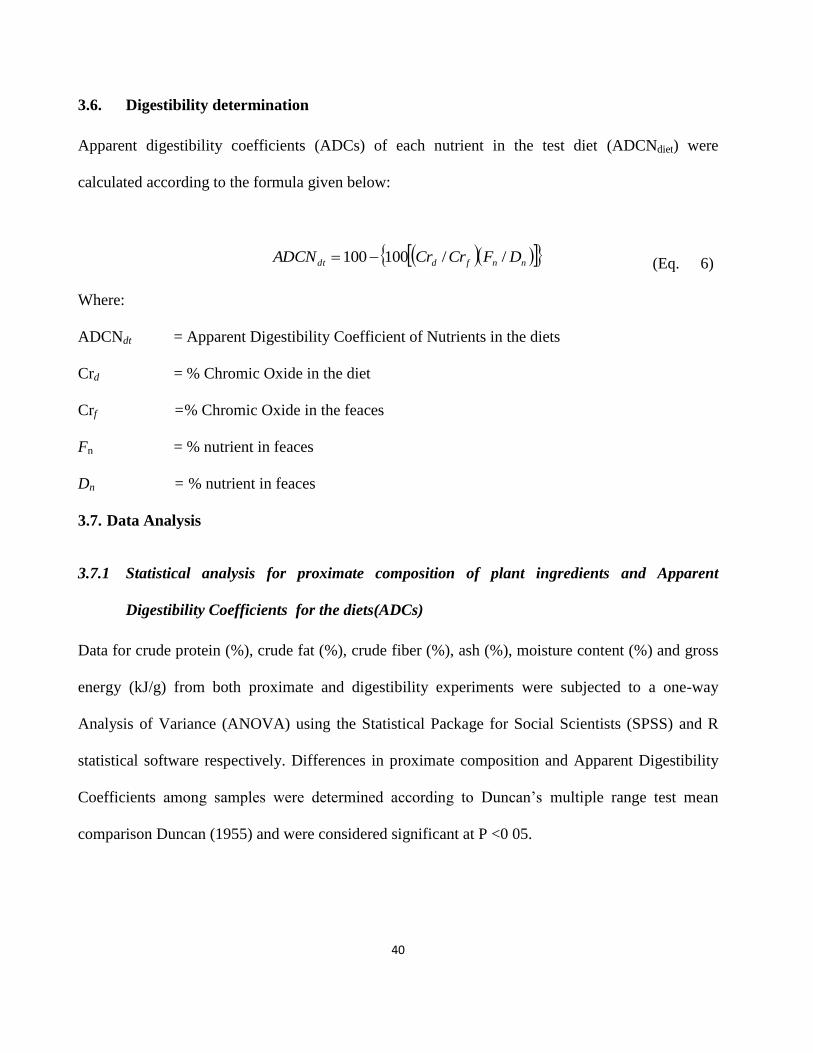
40
3.6. Digestibility determination
Apparent digestibility coefficients (ADCs) of each nutrient in the test diet (ADCNdiet) were
calculated according to the formula given below:
nnfddt DFCrCrADCN //100100 (Eq. 6)
Where:
ADCNdt = Apparent Digestibility Coefficient of Nutrients in the diets
Crd = % Chromic Oxide in the diet
Crf =% Chromic Oxide in the feaces
Fn = % nutrient in feaces
Dn = % nutrient in feaces
3.7. Data Analysis
3.7.1 Statistical analysis for proximate composition of plant ingredients and Apparent
Digestibility Coefficients for the diets(ADCs)
Data for crude protein (%), crude fat (%), crude fiber (%), ash (%), moisture content (%) and gross
energy (kJ/g) from both proximate and digestibility experiments were subjected to a one-way
Analysis of Variance (ANOVA) using the Statistical Package for Social Scientists (SPSS) and R
statistical software respectively. Differences in proximate composition and Apparent Digestibility
Coefficients among samples were determined according to Duncan’s multiple range test mean
comparison Duncan (1955) and were considered significant at P <0 05.
41
3.7.3. Statistical Model used in the experiment is as follows:
ijiijY (Eq. 7)
Where Yij= Percent nutrient digestibility
µ= Overall mean
τ= Treatment effect i = 1….4
Ԑij = Residual error
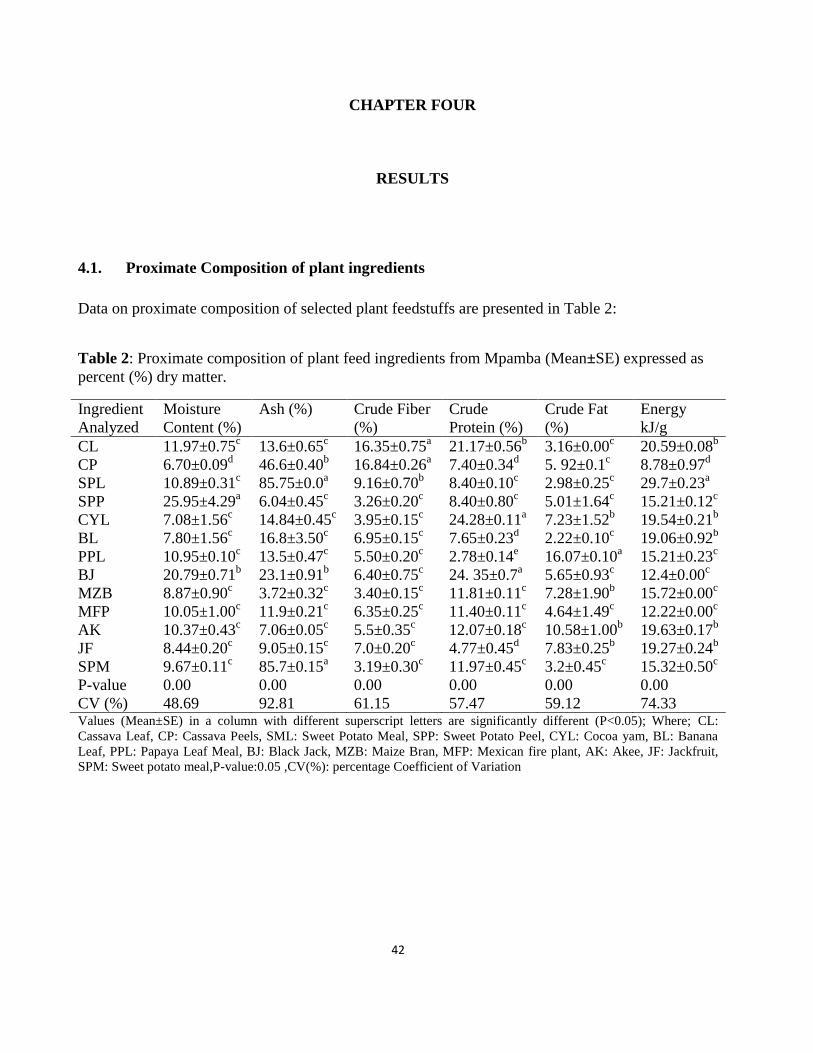
42
CHAPTER FOUR
RESULTS
4.1. Proximate Composition of plant ingredients
Data on proximate composition of selected plant feedstuffs are presented in Table 2:
Table 2: Proximate composition of plant feed ingredients from Mpamba (Mean±SE) expressed as
percent (%) dry matter.
Ingredient
Analyzed
Moisture
Content (%)
Ash (%) Crude Fiber
(%)
Crude
Protein (%)
Crude Fat
(%)
Energy
kJ/g
CL 11.97±0.75c 13.6±0.65
c 16.35±0.75
a 21.17±0.56
b 3.16±0.00
c 20.59±0.08
b
CP 6.70±0.09d 46.6±0.40
b 16.84±0.26
a 7.40±0.34
d 5. 92±0.1
c 8.78±0.97
d
SPL 10.89±0.31c 85.75±0.0
a 9.16±0.70
b 8.40±0.10
c 2.98±0.25
c 29.7±0.23
a
SPP 25.95±4.29a 6.04±0.45
c 3.26±0.20
c 8.40±0.80
c 5.01±1.64
c 15.21±0.12
c
CYL 7.08±1.56c 14.84±0.45
c 3.95±0.15
c 24.28±0.11
a 7.23±1.52
b 19.54±0.21
b
BL 7.80±1.56c 16.8±3.50
c 6.95±0.15
c 7.65±0.23
d 2.22±0.10
c 19.06±0.92
b
PPL 10.95±0.10c 13.5±0.47
c 5.50±0.20
c 2.78±0.14
e 16.07±0.10
a 15.21±0.23
c
BJ 20.79±0.71b 23.1±0.91
b 6.40±0.75
c 24. 35±0.7
a 5.65±0.93
c 12.4±0.00
c
MZB 8.87±0.90c 3.72±0.32
c 3.40±0.15
c 11.81±0.11
c 7.28±1.90
b 15.72±0.00
c
MFP 10.05±1.00c 11.9±0.21
c 6.35±0.25
c 11.40±0.11
c 4.64±1.49
c 12.22±0.00
c
AK 10.37±0.43c 7.06±0.05
c 5.5±0.35
c 12.07±0.18
c 10.58±1.00
b 19.63±0.17
b
JF 8.44±0.20c 9.05±0.15
c 7.0±0.20
c 4.77±0.45
d 7.83±0.25
b 19.27±0.24
b
SPM 9.67±0.11c 85.7±0.15
a 3.19±0.30
c 11.97±0.45
c 3.2±0.45
c 15.32±0.50
c
P-value 0.00 0.00 0.00 0.00 0.00 0.00
CV (%) 48.69 92.81 61.15 57.47 59.12 74.33 Values (Mean±SE) in a column with different superscript letters are significantly different (P<0.05); Where; CL:
Cassava Leaf, CP: Cassava Peels, SML: Sweet Potato Meal, SPP: Sweet Potato Peel, CYL: Cocoa yam, BL: Banana
Leaf, PPL: Papaya Leaf Meal, BJ: Black Jack, MZB: Maize Bran, MFP: Mexican fire plant, AK: Akee, JF: Jackfruit,
SPM: Sweet potato meal,P-value:0.05 ,CV(%): percentage Coefficient of Variation
43
4.1.1. Moisture Content
Moisture content differed significantly (P=0.00) among the plant ingredients (Table 2), with CL,
SPP, SPL, AK, MZB, AK, CYL, JF PPL, BL, BJ and SPM. Among the plant ingredients, sweet
potato (Ipomoea batatus) peels had the highest (25.95%) moisture content whilst cassava (Manihot
esculenta) peels had the lowest (6.70%). Multiple comparisons tests (Table 2) further shows that
CL, SPL, BL, PPL, MFP, AK, MZB and were not significant (share same superscript letters)
among themselves. Coefficient of variation (CV %) shows that 48.69% of the data on moisture
content has been dispersed. Ash contents were generally variable with the lowest being in maize
bran (Zea maize) recording 3.7% whist the highest was in sweet potato peels with 85%.
4.1.2. Gross energy
Energy levels were ranged from 8.7 kJ/g to 29.7 kJ/g (Table 2) in cassava peels (Manihot esculenta)
and sweet potato (Ipomoea batatus) peels respectively and an average of 17 kJ/g for all ingredients
analyzed. In that context, sweet potato (Ipomoea batatus) peels, maize (Zea maize) bran and papaya
(Carica papaya) leaves had the same amount of energy levels, i.e. almost 15 kJ/g on average.
Similarly, banana (Musa acuminata) leaves, leaves of akee (Blighia sapid), jackfriut (Artocarpus
heterophyllus), and cocoyam (Caladium bicolor) leaves gave almost a uniform amount of energy
level of average of 19 kJ/g. Energy levels of black jack (Bidens pilosa), and (Euphorbia
heterophylla), Mexican fire plant were lower at 12 kJ/g for both plant ingredients (Table 2).
44
4.1.3. Crude Protein
Analysis of variance (ANOVA) show that crude protein in the present study differed significantly
(P=0.00) among the plant ingredients (Table 2). Multiple comparisons tests (Table 2) further shows
that CYL and BJ were the highest (24.28% and 24.35%) and were not significantly different (share
same superscript) among themselves. On the other hand, PPL registered the lowest (2.78%) CP%
and the CV% show that the data on CP% was 57.47% spread.
4.1.4. Crude fat
Analysis of variance (ANOVA) show that crude fat differed significantly (P=0.00) among the plant
ingredients (Table 2). Multiple comparisons tests (Table 2) further shows PPL (16. 07 %) had the
highest whilst BL show the lowest (2.22%) crude fat (%) . Coefficient of variation show that 59.12
% of the data for Crude fat is distributed.
4.1.5. Crude fiber
ANOVA showed that cassava (Manihot esculenta) leaf meal and cassava (Manihot esculenta) peels
had 16.35% and 16.84 % respectively (Table 2) and were statistically different (P=0.00) from sweet
potato (Ipomoea batatus) leaf, sweet potato (Ipomoea batatus) peels, cocoyam (Caladium bicolor)
leaf meal and maize (Zea maize) bran had 3.19%, 3.26%, 3.96% and 3.4% respectively. On the
other hand, banana (Musa acuminate) leaf meal, mexican fire plant and black jack (Bidens pilosa)
had 6.95%, 6.35% and 6.45% crude fiber content respectively. Coefficient of variation shows that
61.57% of the data has been dispersed.
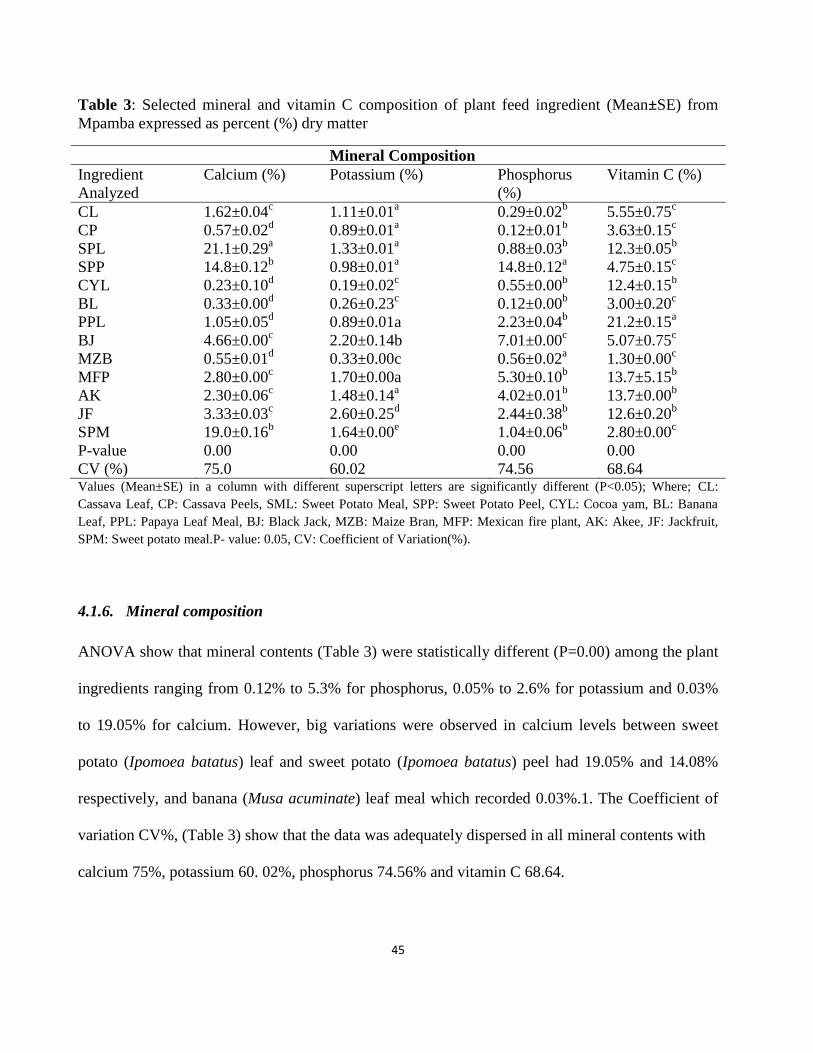
45
Table 3: Selected mineral and vitamin C composition of plant feed ingredient (Mean±SE) from
Mpamba expressed as percent (%) dry matter
Mineral Composition
Ingredient
Analyzed
Calcium (%) Potassium (%) Phosphorus
(%)
Vitamin C (%)
CL 1.62±0.04c 1.11±0.01
a 0.29±0.02
b 5.55±0.75
c
CP 0.57±0.02d 0.89±0.01
a 0.12±0.01
b 3.63±0.15
c
SPL 21.1±0.29a 1.33±0.01
a 0.88±0.03
b 12.3±0.05
b
SPP 14.8±0.12b 0.98±0.01
a 14.8±0.12
a 4.75±0.15
c
CYL 0.23±0.10d 0.19±0.02
c 0.55±0.00
b 12.4±0.15
b
BL 0.33±0.00d 0.26±0.23
c 0.12±0.00
b 3.00±0.20
c
PPL 1.05±0.05d 0.89±0.01a 2.23±0.04
b 21.2±0.15
a
BJ 4.66±0.00c 2.20±0.14b 7.01±0.00
c 5.07±0.75
c
MZB 0.55±0.01d 0.33±0.00c 0.56±0.02
a 1.30±0.00
c
MFP 2.80±0.00c 1.70±0.00a 5.30±0.10
b 13.7±5.15
b
AK 2.30±0.06c 1.48±0.14
a 4.02±0.01
b 13.7±0.00
b
JF 3.33±0.03c 2.60±0.25
d 2.44±0.38
b 12.6±0.20
b
SPM 19.0±0.16b 1.64±0.00
e 1.04±0.06
b 2.80±0.00
c
P-value 0.00 0.00 0.00 0.00
CV (%) 75.0 60.02 74.56 68.64 Values (Mean±SE) in a column with different superscript letters are significantly different (P<0.05); Where; CL:
Cassava Leaf, CP: Cassava Peels, SML: Sweet Potato Meal, SPP: Sweet Potato Peel, CYL: Cocoa yam, BL: Banana
Leaf, PPL: Papaya Leaf Meal, BJ: Black Jack, MZB: Maize Bran, MFP: Mexican fire plant, AK: Akee, JF: Jackfruit,
SPM: Sweet potato meal.P- value: 0.05, CV: Coefficient of Variation(%).
4.1.6. Mineral composition
ANOVA show that mineral contents (Table 3) were statistically different (P=0.00) among the plant
ingredients ranging from 0.12% to 5.3% for phosphorus, 0.05% to 2.6% for potassium and 0.03%
to 19.05% for calcium. However, big variations were observed in calcium levels between sweet
potato (Ipomoea batatus) leaf and sweet potato (Ipomoea batatus) peel had 19.05% and 14.08%
respectively, and banana (Musa acuminate) leaf meal which recorded 0.03%.1. The Coefficient of
variation CV%, (Table 3) show that the data was adequately dispersed in all mineral contents with
calcium 75%, potassium 60. 02%, phosphorus 74.56% and vitamin C 68.64.
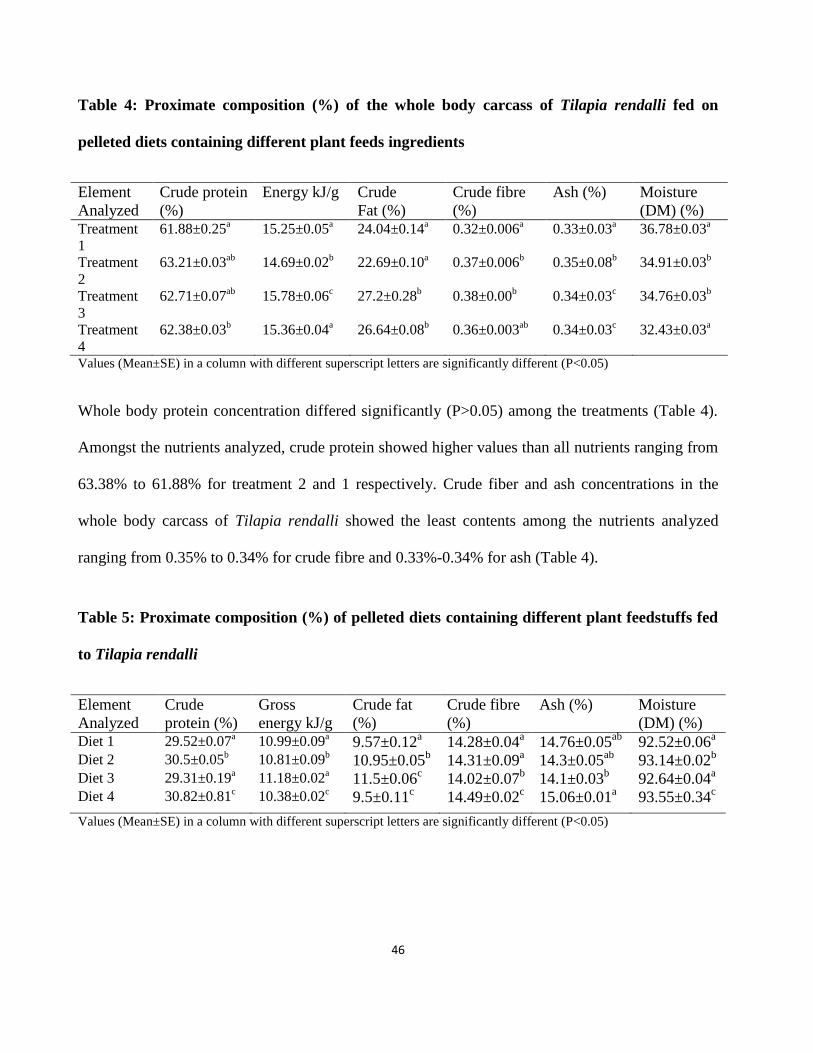
46
Table 4: Proximate composition (%) of the whole body carcass of Tilapia rendalli fed on
pelleted diets containing different plant feeds ingredients
Element
Analyzed
Crude protein
(%)
Energy kJ/g Crude
Fat (%)
Crude fibre
(%)
Ash (%) Moisture
(DM) (%) Treatment
1
61.88±0.25a 15.25±0.05
a 24.04±0.14
a 0.32±0.006
a 0.33±0.03
a 36.78±0.03
a
Treatment
2
63.21±0.03ab
14.69±0.02b 22.69±0.10
a 0.37±0.006
b 0.35±0.08
b 34.91±0.03
b
Treatment
3
62.71±0.07ab
15.78±0.06c 27.2±0.28
b 0.38±0.00
b 0.34±0.03
c 34.76±0.03
b
Treatment
4
62.38±0.03b 15.36±0.04
a 26.64±0.08
b 0.36±0.003
ab 0.34±0.03
c 32.43±0.03
a
Values (Mean±SE) in a column with different superscript letters are significantly different (P<0.05)
Whole body protein concentration differed significantly (P>0.05) among the treatments (Table 4).
Amongst the nutrients analyzed, crude protein showed higher values than all nutrients ranging from
63.38% to 61.88% for treatment 2 and 1 respectively. Crude fiber and ash concentrations in the
whole body carcass of Tilapia rendalli showed the least contents among the nutrients analyzed
ranging from 0.35% to 0.34% for crude fibre and 0.33%-0.34% for ash (Table 4).
Table 5: Proximate composition (%) of pelleted diets containing different plant feedstuffs fed
to Tilapia rendalli
Element
Analyzed
Crude
protein (%)
Gross
energy kJ/g
Crude fat
(%)
Crude fibre
(%)
Ash (%) Moisture
(DM) (%) Diet 1 29.52±0.07
a 10.99±0.09
a 9.57±0.12
a 14.28±0.04
a 14.76±0.05
ab 92.52±0.06
a
Diet 2 30.5±0.05b 10.81±0.09
b 10.95±0.05
b 14.31±0.09
a 14.3±0.05
ab 93.14±0.02
b
Diet 3 29.31±0.19a 11.18±0.02
a 11.5±0.06
c 14.02±0.07
b 14.1±0.03
b 92.64±0.04
a
Diet 4 30.82±0.81c 10.38±0.02
c 9.5±0.11
c 14.49±0.02
c 15.06±0.01
a 93.55±0.34
c
Values (Mean±SE) in a column with different superscript letters are significantly different (P<0.05)
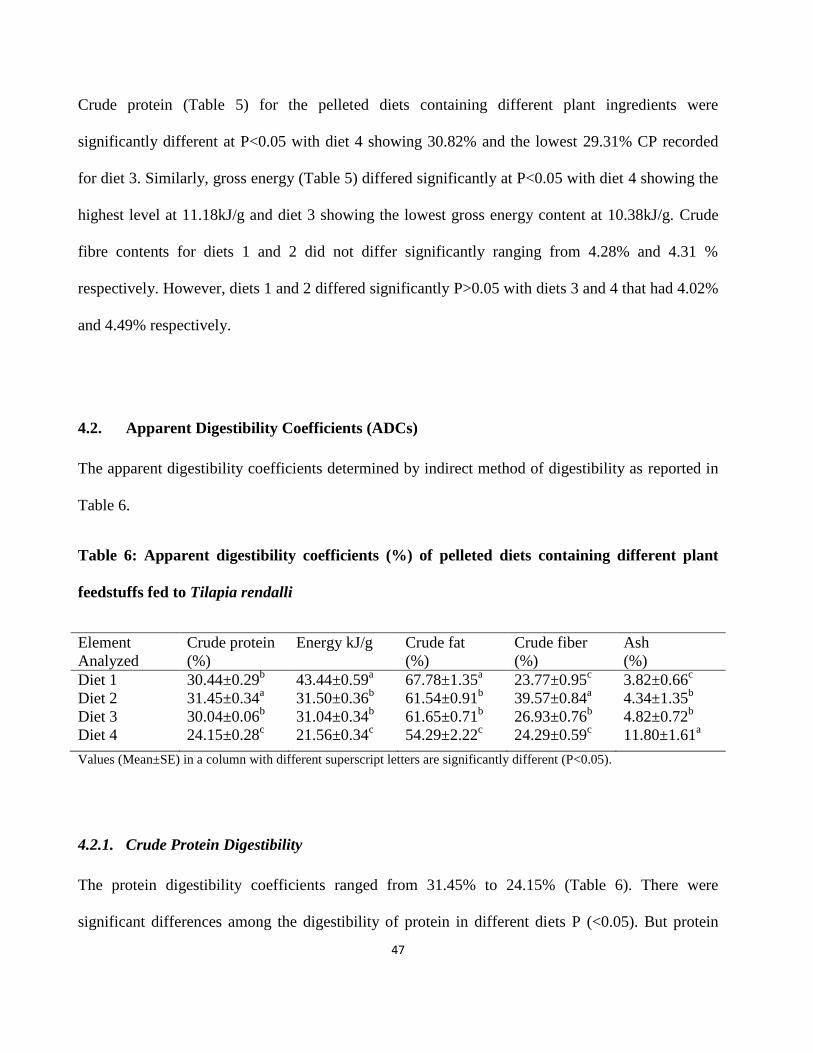
47
Crude protein (Table 5) for the pelleted diets containing different plant ingredients were
significantly different at P<0.05 with diet 4 showing 30.82% and the lowest 29.31% CP recorded
for diet 3. Similarly, gross energy (Table 5) differed significantly at P<0.05 with diet 4 showing the
highest level at 11.18kJ/g and diet 3 showing the lowest gross energy content at 10.38kJ/g. Crude
fibre contents for diets 1 and 2 did not differ significantly ranging from 4.28% and 4.31 %
respectively. However, diets 1 and 2 differed significantly P>0.05 with diets 3 and 4 that had 4.02%
and 4.49% respectively.
4.2. Apparent Digestibility Coefficients (ADCs)
The apparent digestibility coefficients determined by indirect method of digestibility as reported in
Table 6.
Table 6: Apparent digestibility coefficients (%) of pelleted diets containing different plant
feedstuffs fed to Tilapia rendalli
Element
Analyzed
Crude protein
(%)
Energy kJ/g Crude fat
(%)
Crude fiber
(%)
Ash
(%)
Diet 1 30.44±0.29b 43.44±0.59
a 67.78±1.35
a 23.77±0.95
c 3.82±0.66
c
Diet 2 31.45±0.34a 31.50±0.36
b 61.54±0.91
b 39.57±0.84
a 4.34±1.35
b
Diet 3 30.04±0.06b 31.04±0.34
b 61.65±0.71
b 26.93±0.76
b 4.82±0.72
b
Diet 4 24.15±0.28c 21.56±0.34
c 54.29±2.22
c 24.29±0.59
c 11.80±1.61
a
Values (Mean±SE) in a column with different superscript letters are significantly different (P<0.05).
4.2.1. Crude Protein Digestibility
The protein digestibility coefficients ranged from 31.45% to 24.15% (Table 6). There were
significant differences among the digestibility of protein in different diets P (<0.05). But protein
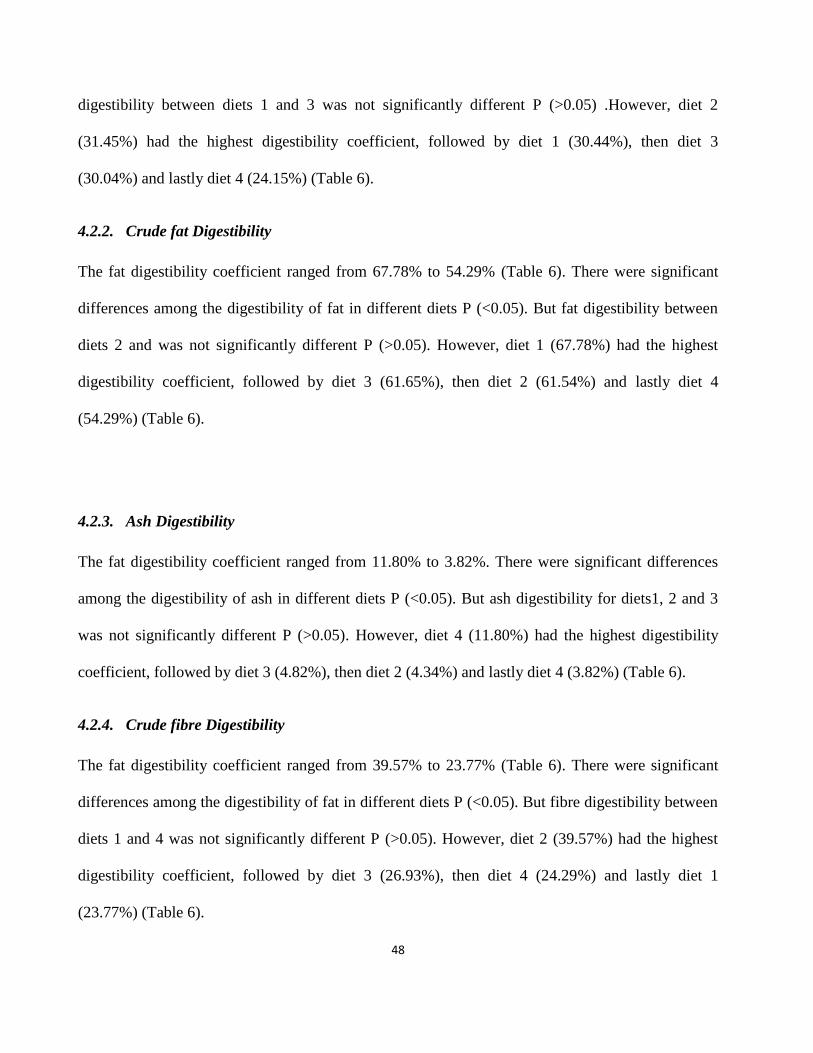
48
digestibility between diets 1 and 3 was not significantly different P (>0.05) .However, diet 2
(31.45%) had the highest digestibility coefficient, followed by diet 1 (30.44%), then diet 3
(30.04%) and lastly diet 4 (24.15%) (Table 6).
4.2.2. Crude fat Digestibility
The fat digestibility coefficient ranged from 67.78% to 54.29% (Table 6). There were significant
differences among the digestibility of fat in different diets P (<0.05). But fat digestibility between
diets 2 and was not significantly different P (>0.05). However, diet 1 (67.78%) had the highest
digestibility coefficient, followed by diet 3 (61.65%), then diet 2 (61.54%) and lastly diet 4
(54.29%) (Table 6).
4.2.3. Ash Digestibility
The fat digestibility coefficient ranged from 11.80% to 3.82%. There were significant differences
among the digestibility of ash in different diets P (<0.05). But ash digestibility for diets1, 2 and 3
was not significantly different P (>0.05). However, diet 4 (11.80%) had the highest digestibility
coefficient, followed by diet 3 (4.82%), then diet 2 (4.34%) and lastly diet 4 (3.82%) (Table 6).
4.2.4. Crude fibre Digestibility
The fat digestibility coefficient ranged from 39.57% to 23.77% (Table 6). There were significant
differences among the digestibility of fat in different diets P (<0.05). But fibre digestibility between
diets 1 and 4 was not significantly different P (>0.05). However, diet 2 (39.57%) had the highest
digestibility coefficient, followed by diet 3 (26.93%), then diet 4 (24.29%) and lastly diet 1
(23.77%) (Table 6).
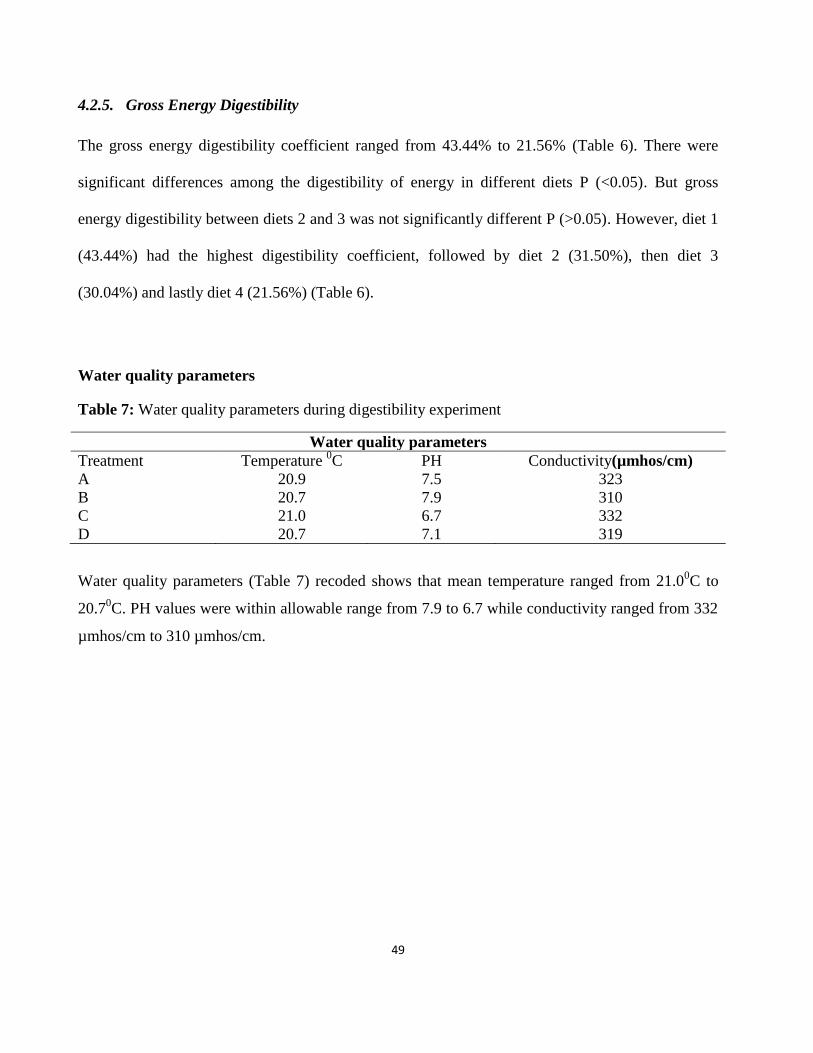
49
4.2.5. Gross Energy Digestibility
The gross energy digestibility coefficient ranged from 43.44% to 21.56% (Table 6). There were
significant differences among the digestibility of energy in different diets P (<0.05). But gross
energy digestibility between diets 2 and 3 was not significantly different P (>0.05). However, diet 1
(43.44%) had the highest digestibility coefficient, followed by diet 2 (31.50%), then diet 3
(30.04%) and lastly diet 4 (21.56%) (Table 6).
Water quality parameters
Table 7: Water quality parameters during digestibility experiment
Water quality parameters (Table 7) recoded shows that mean temperature ranged from 21.00C to
20.70C. PH values were within allowable range from 7.9 to 6.7 while conductivity ranged from 332
µmhos/cm to 310 µmhos/cm.
Water quality parameters
Treatment Temperature 0C PH Conductivity(µmhos/cm)
A 20.9 7.5 323
B 20.7 7.9 310
C 21.0 6.7 332
D 20.7 7.1 319

50
CHAPTER FIVE
DISCUSSION
Experimental proximate composition results (Table 2) of the present study show that cassava leaf
meal registered 21.17% crude protein which is comparable to complete fish diets that have been
reported to have a range of 18%-50% crude protein (Craig and Helfrich, 2002). This suggests that
cassava leaf meal can be used as a plant protein source by fish famers in Mpamba, NkhataBay.
Findings from previous studies indicate that all experimental diets in which cassava was an
ingredient were accepted by fish. For instance, cassava leaf meal in fish diets did not have adverse
effect on the palatability of experimental diets (Ekenam et al., 2010). These results (Table 2) are in
agreement with findings by Omoregie et al. (1991) who included cassava peelings and mango seeds
in the diet of Oreochromis niloticus. Furthermore, cassava has been successfully used to replace
maize bran in raising Clarias gariepinus fingerling and advanced fry (Abou et al., 2010). Therefore,
the use of cassava leaf meal by fish farmers in Mpamba NkhataBay would help ease the cost of fish
production and lead to an active and sustainable development of fish farming because it is the staple
food in the area and is found in abundance. Globally, cassava is one of the top foodstuffs with high
calorific content and is generally grown without fertilization of soils and can survive prolonged
water deficits. It tolerates acid soils, but the yields are generally limited by low soil phosphorus
content.
The nutritional limitations of cassava leaves were not assessed in the present study; however, they
include cyanide content, low digestible energy, bulkiness and the high tannin content. The
51
inherent cyanogenetic glycosides effects on animals may limit its use as fish feed. These parameters
were not measured in this study but their effects could be inferred from other studies (Abou et al.,
2010). The amount of cyanogenetic glycosides is influenced by the nutritional status, species and
age of the plant while cyanide content decreases with the maturity of the leaves. Therefore, use of
relatively mature cassava leaf meal can avoid running the risk of compromising growth and survival
of the fish. To counter the negative attributes of using cassava in fish and livestock feeds,
processing methods could reduce the cyanogenic effects. According to Francis et al. (2001) the two
most widely used processing methods are sun drying and ensiling. Sun drying must be done
thoroughly especially during the wet season because it may result in the production of low quality
product with severe Aspergillus and Aflatoaxin contamination if the moisture is high. Ensiling the
leaves entails chopping into small pieces (average of 2 cm), adding additives and common salt at
0.5% and storage in sealed air tight plastic bags for two months; this is reported to reduce cyanide
content of up to 90% of the original concentration. Although cassava leaf protein is deficient in
methionine, and has marginal tryptophan content, it is rich in lysine which is important in skeletal
and skin formation. Besides, it also improves the body immune system by inducing the production
of antibodies (Francis et al., 2001).
Sweet potato leaf meal and sweet potato peels registered 11.17% and 8.4% crude protein content
respectively (Table 2), these are lower than 23.57% CP reported by Adewulo (2008) and 14.59% by
Kang’ombe et al. (2009). However, sweet potato leaf meal has potential for use as a protein source
in Tilapia zilli diet substituting up to 15% level without compromising growth (Omoregie et al.,
2009). Expanded use of sweet potato as an animal feed appears to be promising both for agro-
biological and socio-economic reasons. Sweet potato is grown widely at diverse altitudes (up to
52
2,000 m above sea level) and tolerates wide temperature ranges. Under the conditions it is grown in
Malawi, sweet potato requires practically less cash inputs and minimal horticultural practices.
According to Ishida et al. (2000) the above-ground parts of sweet potato, such as leaves, stalks and
stems have a high nutritive value. In particular, leaves contain a large amount of protein with a high
amino acid score (Ishida et al., 2000). Both roots and vines are used as a protein and vitamin source
for fish and livestock (Ali et al., 1999). The energy levels for sweet potato leaf meal observed in
present study were 29.7 kJ/g and 15.21 kJ/g for sweet potato peel, respectively. Therefore, results
(Table 2) of the present study demonstrated that incorporating the sweet potato in diets of fish
would help to maintain a low protein energy ratio thereby allowing all dietary protein to be
channeled towards somatic growth. This will ensure that there is good growth performance and
high survival rate due to the protein sparing effect facilitated by high energy formulations.
Pawpaw recorded 2.23% (Table 2) crude protein, which is lower than that reported by other
workers. For instance, Onyimonyi and Ernest (2009) reported crude protein values of 30.12%
(PLM), while Esonu et al. (2002) showed 17.3% crude protein value, and Kang’ombe et al. (2009)
found 9.45% crude protein for pawpaw leaf meal. The disparity may be due to differences in
strains, soil types and age (Lola, 2009). Onyimonyi and Ernest (2009) reported that when pawpaw
leaves are incorporated at 2% level in the diets of Tilapias, growth performance improves, carcass
and organoleptic indices are favorable. In addition, the pawpaw plant is high in vitamins (A, B1,
B2, and C) and minerals (Ca, K, P, and Fe) content (Yadava et al., 1990). Furthermore, pawpaw
contains papain which aids digestion thereby releasing free amino acids which enhance growth
(Chaplin, 2005; Onyimonyi and Ernest 2009). The inclusion of pawpaw leaves in the fish diets by
fish farmers in NkhataBay might benefit the fish through several attributes other than protein.
53
Cocoyam registered 24.28 % and 19.54 kJ/g (Table 2) values for crude protein and energy levels in
the present study, respectively. Therefore, the high energy levels suggest that the use of cocoyam as
both protein and energy source in fish production in Mpamba is feasible. Cocoyam is non-
conventional feedstuff recognized as cheaper and easily digestible carbohydrate source than grains
or other tuber crops. In addition, it has high caloric yield per hectare, low production cost and
relatively low susceptibility to insect and pest attack (Abduralshid and Agwunob, 2012). It is almost
non-competitive with humans in most places of Malawi as it is eaten as food of last resort. In the
present study, palatability and digestibility were low (Table 6). However, 10% cocoyam inclusion
level is the best in terms of daily weight gain feed conversion ratio and cost effectiveness
(Abduralshid and Agwunob, 2012).
In the present study black jack (Bidens pilosa) had 24.3% crude protein, 12.4 kJ/g energy, 23.1 %
ash, 4.66% calcium, 2.20% phosphorus and 7.0% potassium. Comparative studies done elsewhere,
Alikwe et al. (2012) reported that black Jack (Bidens pilosa) leaf meal (BPLM) had crude protein
of 15.86%, ash 12.31% calcium 0.39%,0.31% and potassium 1.21%, methionine 0.54 % and, lysine
1.07% among others. The high protein (24.3%) level of black jack (Bidens pilosa) and the presence
of methionine and lysine amino acids reported in previous studies is an indication of the potential
for inclusion in animal diet as a protein source. Secondly, the high ash (23.1%) level is an
indication of a good mineral profile in black Jack (Bidens pilosa). The results of the present study,
therefore, suggest a moderate deposition of mineral elements in the leaves which could be made
available to the fish (Antia et al., 2006). Thus, black jack (Bidens pilosa) is a potential plant diet of
high protein (24.3%) and is a good mineral (4.66% calcium, 2.20% phosphorus) source. The use of
54
the black jack (Bidens pilosa) could contribute to the development of an affordable fish feed for fish
farmers in Mpamba who largely depend on non-protein household hold wastes and maize bran.
Cassava leaf meal and cassava peels registered 16.35% and 16.86% (Table 2) fiber respectively in
the current study. However, crude fiber content in sweet potato leaf meal was 3.19% which was
lower than those in the studies referred to earlier. Crude fiber content for papaya leaf meal was
5.6% (Onyimonyi and Ernest, 2009), 5.99% was reported by Kang’ombe et al. (2009) and both
results are in agreement with the current study which recorded 5.5%. On the other hand, crude fiber
level for cocoyam leaf meal reported by Kang’ombe et al. (2009) was 5.10% and that by
Onyimonyi and Ernest (2009) was 8.8%, both of which were higher than what was found in the
present study (3.96%). The crude fiber content for black jack in the current study was 6.45% (Table
2) which is very close to 6.84% that Kang’ombe et al. (2009) reported. Finally, crude fiber contents
for jackfruit (7%), mexican fire plant (6.35%) and akee (5.5%) are in any case considered moderate
for inclusion in fish diets. Low concentrations of dietary fibre (3–5%) may have a beneficial effect
on fish growth with respect to improving digestion. On the other hand, high dietary fibre (>8%),
may decrease dry matter digestibility of the diet and reduce the availability of other nutrients (Altan
and Korkut, 2011). High dietary carbohydrate contents reduce the activity of proteolitic enzyme in
fish. In addition, high crude fiber levels in fish diets do not only impede digestibility of diets but
also jeopardize the binding capacity of the feed. (Ekenam et al., 2010). According to the present
study, sweet potato leaf had crude fibre at 3.19%, mexican fire plant (6.35%), black jack at 6.45%
and akee (5.5%) are some of plant sources being advocated to fish farmers for inclusion in fish diets
on the basis of low crude fibre content (Table 2).
55
The amount of energy for most plant feedstuffs registered in the present study agreed favorably
with those reported by other scientists. Kang’ombe et al. (2009) reported the following energy
contents: cassava leaf meal (12.95 kJ/g), black jack (12.4 kJ/g), and banana leaf meal (19.4 Kj/g)
whilst cocoyam leaf meal and papaya leaf meal registered (15.21kJ/g). In other previous studies,
Onyimonyi and Enerst (2009) found energy contents for cassava leaf meal (14.3kJ/g), sweet potato
leaf meal (12.5kJ/g), pawpaw leaf (15.21 kJ/g) and cocoyam leaf (33.18kJ/g). This study (Table 2),
reported the following energy contents: cassava leaf meal (20.59 kJ/g), sweet potato leaf (15.34
kJ/g), pawpaw leaf (15.21 kJ/g), banana leaf meal (12.4 kJ/g), maize bran (10 kJ/g) and cocoyam
leaf meal (19.54 kJ/g) among others plant ingredients. Energy is the second limiting nutrient in fish
diets and the deficiency of energy hence protein is used for provision of energy. As a result, growth
is minimal or slow since the protein is not used in somatic cells. The energy levels registered in the
present study would suggest that incorporating these plant feedstuffs in fish diet would have a
protein sparing effect where the fish would not need to convert some of the protein into energy.
In the present study, ash content (Table 2) showed substantial variation amongst ingredients from a
high 85.75% to a low 3.72% for sweet potato leaf meal and maize bran respectively. In a study by
Kang’ombe et al. (2009), the ash contents were 6.64% for cassava leaf meal, 6.48% for sweet
potato leaf meal, 6.49% for cocoyam leaf meal, 7.27% for banana leaf meal and 5.54 % and 6.59%
for pawpaw leaf meal and black jack meal respectively. It has been found that the concentration of
minerals was proportional to the ash content in plant materials from aquatic weeds, sweet potato
and cassava leaves, guinea and napier grasses (Dongmeza, 2009). Therefore, the intake of these
plant feed ingredients could contribute to a large proportion of calcium, phosphorus and iron
requirement of fish when they are used as supplementary feed in the fish ponds as well as in low
56
cost formulated feed in semi-intensive aquaculture systems like ponds (Dongmeza, 2009). In
addition, where vitamin and mineral premixes are not incorporated especially in rural communities
like Mpamba, the use of plant feedstuffs would assist in formulation of feeds with high nutritive
value and also affordable.
Moisture content of pawpaw leaf meal in the present study was 10.95% (Table 2) and this
corresponds to those reported by Onyimonyi and Ernest (2009) who found 10.20% whilst
Kang’ombe et al. (2009) reported 48% moisture content for pawpaw leaf meal. The disparity
between the moisture contents in the present study and that of Kang’ombe et al. (2009) could be
attributed to the different processing techniques used. In the present study, plant ingredients were
sundried to rid them of anti- nutritional factors whilst in the study by Kang’ombe et al., (2009)
plant ingredients were air dried on the shade to avoid loss of nutrition value.
The crude fat levels ranged from 2.22% to 16.07% (Table 2) in the present study. Kang’ombe et al.
(2009) reported 2.56% crude fat level for cocoyam, 0.01% for PPM, 0.12% and 1.0% for cassava
leaf meal and black jack respectively. A study by Abowei and Ekubo (2011) show that the crude fat
contents reported were 1.0% for cassava leaf meal, 3% for sweet potato leaf meal which is also
similar to that reported by Adewulo (2008) and 0.8% for pawpaw leaf meal. It is evident from the
results that fat content for most ingredients in this study were higher than those observed in other
studies. Commercial Tilapia feeds for grow out operations usually contain 5 to 6% total lipid, but
high lipid levels of 10 to 12% are used in diets containing higher protein (Lim et al., 2009).
Therefore, the crude fat contents of ingredients analyzed in this study are within the allowable range
57
and can easily be used in Tilapia rendalli diets. Fat is important in provision of energy and helps in
protein sparing thereby allowing protein deposition for somatic growth.
The differences in the proximate compositions (Table 2) could be attributed to different processing
techniques, variations in climate, strain of the plant species and soil chemistry, corroborating with
study findings of Lola (2009). In the same perspective, Onyimonyi and Ernest (2009) reported that
disparity in nutritive value of plants may be attributed to differences in environmental conditions,
such as soil chemistry, harvesting method, ingredients varieties and temperature. In the present
study (Table 2) however, the differences in nutrient with previous studies could be attributed to
varying soil types, strain types and climate.
Fish use around 80% of Apparent Nutrient Digestibility of dietary dry matter (ADCDM ) which
describes how efficiently the feeds or feed ingredients are digested, and how much of their nutrient
contents can be made available to fish for maintenance and growth (Altan and Korkut, 2011). In
addition, (ADCDM) generally provides a better estimate of the quantity of indigestible materials in
the feeds or feed ingredients, rather than that of the individual nutrient (Eusebio et al., 2004).
Nutritional values of proteins and protein sources vary as a function of amino acids profile and
digestibility (Altan and Korkut, 2011). The proportion (%) of crude protein, (i.e. nitrogen) in a feed
ingredient can either originate from protein or non protein nitrogen. Therefore, ingredients with
high CP from non-protein nitrogen will not contribute adequate amino acids in tandem with the
nutritional requirements of fish. Thus, such ingredients will on the other hand, lead to increased
58
production ammonia and other nitrogenous wastes by the fish thereby lowering productivity and
water quality of production systems (Cho, 1990; Altan, 2002; Koprucu and Ozdemir, 2005).
The digestibility coefficients (Table 6) in the present study (24.15%-31.44% crude protein, 21.26
kJ/g to 43.44 kJ/g energy, 54.29%-67.78% fat, 23.77%-39.57% and ash 3.82-11.80%) were
generally lower compared with previous research on plant diets. For example, protein digestibility
values for sunflower cakes are 86–89% and wheat bran 75% (Maina et al., 2002). This is in
agreement with the findings of Fontainhas-Fernandes et al. (1999), who reported defatted soybean
meal 94.4%, full-fat soybean meal 90% and micronized wheat 88.6%. In corroboration ,
Mbahinzireki et al. (2001) reported values that ranged from 70 to 89% in tilapia for cottonseed
meal and corn gluten meal 89% (Koprucu¨and Ozdemir, 2005), corn meal 83–84% (Hanley, 1987),
and cottonseed meal 81.8% (Guimaraes et al., 2008) for Nile tilapia, Oreochromis niloticus.
Water quality parameters have a profound effect on the performance of fish in aquaculture and may
affect feed intake as well as digestion (Cho, 1990). In the present study, water temperature records
ranged from 20-21% (Table 7) which is absolutely low as the optimum temperature range for
Tilapia is 20 -300C with better results being recorded at 26-30
0C (Cho, 1990). Thus, the water
temperatures recorded in the present study (Table 7) may have contributed to low protein
digestibility due to low metabolic and slow enzymatic activity. PH and conductivity (Table 7)
readings reported in this study were within allowable range and thus could not have influenced the
feeding or digestibility trial results.
59
Earlier studies have shown that Tilapias have the capacity to utilize large number of alternative
plant and animal protein sources (Ogunji, 2004). Tilapia has a digestive tract that is relatively long,
just as other herbivorous fish, and shows morphological and physiological adaptations for the
utilization of diets high in fibre (Maina et al., 2002; Stone, 2003). This is consistent with previous
work that has shown that Tilapias are capable of digesting and absorbing relative large amounts of
carbohydrates (Stone, 2003). Although Tilapias have an adaptation to digest plants diet, individual
proximate composition of various nutrients of the diet influences digestibility. The source of the
ingredients making up a diet can either be animal or plant based and has an effect on digestibility
due to varying nutrient make up. Most plant based sources have high fibre contents especially the
leafy parts (Altan and Korkut, 2011). In the present study, the diets (Table 1) were exclusively
formulated from plant sources and these may be responsible for the low crude protein digestibility
coefficients (23.7%-39.57%) (Table 6). Dietary plant ingredients can affect gastrointestinal transit
time of feed as a result of the presence of fibres and complex sugars, and alter the digestibility of
nutrients ingested by the fish (Eusebio et al., 2004; Zhou et al., 2004). According to Eusebio et al.
(2004), dietary fibre is part of the carbohydrate component of plant ingredients, and most fish
cannot utilize it. However, low dietary concentrations of dietary fibre (3–5%) may have a beneficial
effect on fish growth. On the other hand, high dietary fibre (>8%), may decrease dry matter
digestibility of the diet and reduce the availability of other nutrients (Altan and Korkut, 2011). The
present study however, reported crude fibre (Table 5) for plant diets ranging from 14.02%-14.78%
which in outside threshold range. In addition, selected individual plant ingredients used in the diet
like CL, SPL and BJ had crude fibre contents of 16.35%, 9.16% and 6.40% (Table 2) respectively,
which could have significantly contributed to low digestibility levels in the plant diets fed to Tilapia
60
rendalli .by among other ways reducing the activity of proteolitic enzyme (Altan and Korkut,
2011).
Dietary energy is the second most important factor after protein affecting the utilization of feeds by
fish. Fish are known to feed to satisfy their energy requirements, and if the diet does not contain
sufficient energy levels, protein is used for energy rather than for growth (Cowey and Sargent,
1979). Protein is the most expensive component in fish feeds and plays an important role in growth
of fish (NRC, 1993). Previous studies demonstrated that providing properly balanced ratios of
protein to non-protein energy in diets can spare dietary protein from energy metabolism and then
increase its utilization for fish growth (Nankervis et al. 2000; Morais et al. 2001; Wang et al. 2006;
Schulz et al. 2008; Ahmadr, 2008). In the current study, the Apparently Digestibility Coefficient of
gross energy (ADCGE) range from 43.44% to 21.56% (Table 6); which are slightly higher than the
Apparent Digestibility Coefficient (ADCCP) range for crude protein (31.45%-24.15%). Inadequate
dietary protein dietary protein to energy ratio may result in lower growth as well as low protein and
energy utilization in fish (Ali et al., 2008). In diets with low protein to energy ratio, the use of
dietary protein for growth and maintenance of body protein is maximized, while in diets with high
protein to energy ratio, more protein is used for energy or stored as fat (Ali et al., 2008). The
protein sparing effect of energy occurs only if the minimum protein requirements are met, including
adequate amounts of amino acids. In the present study, Apparently Digestibility Coefficient of
gross energy (ADCGE) range from 43.44% to 21.56% (Table 6) and the Apparent Digestibility
Coefficient for crude fat (ADCF) range from 67.78%-54.29 % ( Table 6) both higher than the
Apparent Digestibility Coefficients for crude protein (ADCCP) that ranged from31.45%-24.15%
(Table 6). Providing adequate energy from dietary lipid can minimize the use of protein as an
61
energy source (Takeuchi et al., 1992). Therefore, the presented study (Table 6) demonstrates that
there was protein sparing effect in plant diets. Therefore, the formulated plant diets (Table 1) could
lead to maximum use of crude protein for somatic cells and subsequent growth of fish since the
minimum energy requirements would be met by non-protein sources.
62
CHAPTER SIX
CONCLUSIONS AND RECOMMENDATIONS
The potential of plant feedstuffs such as leaf meal in fish diets was evaluated on the basis of its
proximate chemical composition, comprising the moisture content, crude protein, crude fiber, crude
lipid, total ash and gross energy. Results of the present study show that the nutritional value of
different plant ingredients were significantly different thereby accepting the first hypothesis.
Similarly, the study has also showed that there were variations in the Apparent Digestibility
Coefficients (ADCs) for different plant diets thereby accepting the second hypothesis. Crude
protein content of cocoyam, cassava leaf and black jack were higher than all other plant ingredients
analyzed. Apparent Digestibility Coefficients indicate diets exclusively formulated from plant
sources tested on Tilapia rendalli have a low digestibility potential and subsequently less nutrient
available for growth and energy. Therefore, knowledge of the nutritional values of plant feed
ingredients and the diets generated in the current study would help the farmer to deduce whether or
not feed is meeting the optimum requirements of fish.
Based on proximate composition of the ingredients and the Apparent Digestibility Coefficients
(ADCs) of different diets fed to Tilapia rendalli, the current study suggests that inclusion of plant
feedstuffs in Tilapia diets would improve the quality and affordability fish diets for small scale fish
farmers in Malawi. The study further advocates application of heat through boiling, drying or
roasting as some of the methods before using the ingredients. To this effect, fish farmers are
advised to include the plant ingredients with high crude protein (cassava leaf meal, black jack and
63
cocoyam leaf meal) and energy levels since they are the limiting nutritional elements of fish diets.
Secondly, the study recommends that further studies must be tailored at comparing the use of a diet
comprising of mixture of plant ingredients and use of individual plant ingredients. Furthermore,
studies on quantifying levels of antinutitional factors the plant feed ingredients should be the next
step after the current study. In addition, efforts should be made to teach farmers how to formulate
feeds based on the present study findings.
64
REFERENCES
Aas, T.S., Grisdale-Helland, B., Terjesen, B.F. and Helland, S.J. (2006). Improved growth and
nutrient utilisation in Atlantic salmon(Salmo salar)fed diets containing a bacterial protein meal.
Aquaculture 259, 365–376.
Abdul Rashid, M. and Agwunobi, L.N. (2012). Tannia (Xanthosoma sagittifolium). Cocoyam as
Dietary Substitute for Maize in Broiler Chicken. Greener Journal of Agricultural Sciences,
2 (5):167-171.
Abuo, O.M.G., Gabriel and Akinrotimi, O. A. (2010). Performance and survival of hybrid catfish
(Hetero X Clarias) fed with whole cassava root meal as a replacement for maize” Journal of
Tropical Agriculture Environment and Extension, 9: 176 -183.
Abowei, J.F.N. and Ekubo, A.T. (2011). A Review of Conventional and Unconventional Feeds in
Fish Nutrition, British Journal of Pharmacology and Toxicology 2(4): 179-191.
Adewolu, M.A. (2008). Potentials of Sweet Potato (Ipomoea batatas) Leaf Meal as Dietary
Ingredient for Tilapia zilli fingerlings, Pakistan Journal of Nutrition, 7(3): 444-449.
Afuang, W., Siddhuraju, P. and Becker, K. (2003). Comparative nutritional evaluation of raw,
methanol extracted residues and methanol extracts of Moringa (Moringa oleifera Lam.)
leaves on growth performance and feed utilization in Nile tilapia (Oreochromis niloticus L.).
Aquaculture Research, 34(13): 1147-1159
Ahmadr, M.H. (2008). Response of African Catfish, Clarias gariepinus, to different dietary protein
and lipid levels in practical diets. Journal of World Aquaculture Society. 39(4):541–548
Allan, G.L., Parkinson, S., Booth, M.A., Stone, D.A.J., Rowland, S.J., Frances, J. & Warner-Smith,
R. (2000) Replacement of fish meal in diets for Australian silver perch,: Digestibility of
alternative ingredients. Aquaculture, 186, 293–310.
65
Ali, M.A., Tageldin, T.H. and Solaiman, E.M. (1999). Effect of sweet potato tops or roots in
growing rabbit diets on growth performance, digestibility, carcass traits and economic
efficiency. Egyptian Journal of Rabbit Sciences (9): 13-23.
Ali, A., Al-OgaIly, S.M., Al-Asgah, N.A., Gddard, J.S. and Ahmed, S.I. (2008). Effect of feeding
different protein to energy (P/E) ratios on the growth performance and body composition of
Oreochromis niloticus fingerlings. Journal of Applied Ichthyology. 24: 31-37.
Alikwe, P.C.N., Elijah, I.O. and Soladoye, M.O. (2012). Evaluation of the Proximate, Mineral,
Phytochemical and Amino Acid Composition of Bidens Pilosa as Potential Feed/Feed
Additive for Non-Ruminant Livestock. Animal and Veterinary Sciences, 2(2): 18-21.
Alam, A. K., Maughan E., and W. J. Matter, (1996). Growth response of indigenous and exotic carp
species to different protein sources in pelleted feeds. Aquaculture Research, 27(9): 673-
679.
Altan. Ö, and Korkut, A.Y. (2011). Apparent Digestibility of Plant Protein Based Diets by
European Sea Bass (Dicentrarchus labrax L., 1758).Turkish Journal of Fisheries and
Aquatic Science. 11: 87-92
Altan, O. (2002). Investigations on appearent digestibility of nutrients in sea bass (Dicentrarchus
labrax L., 1758). PhD thesis, Izmir: Ege University, Graduate School of Natural and
Applied Sciences
A.O.A.C (2003). Official Methods of Analysis.15th
Edition Association of Official Analytical
Chemists. Washington, DC, USA.
Andrews, T.G., Weyl, O.L.F. and Andrew, M. (2003). Aquaculture master plan development in
Malawi. Socio economic survey report.
66
Antia, B.S., Akpan, E.J., Okon, P.A. and Umoren, I.U. (2006). Comparison of the nutritive value
and biological activities of the acetone, methanol and water extract of the leaves of Bidens
pilosa and chenopodiumm album. Pakistan Journal of Nutrition, 5: 166-178
Bene, C. and Heck, S. (2005). Fish and Food Security in Africa’, NAGA, WorldFish Center 28:8-
13
Bremer-Neto, H., Graner, C.A.F., Pezzato, L.E. and Padovani, C.R. (2005). The spectrophotometric
method on the routine of 1, 5- diphenylcarbazide was adjusted on chromium determination
in feces, after utilization as a biological marker as chromium (III) oxide. Cieˆncia Rural, 35,
691–697.
Chaplin, M. (2005). Application of proteases in the food industry. Faculty of Engineering Science
and the build environment, South bank University Press. London. UK.
Cheng, Z.J., Ardi, R.W. and Huige, N.J. (2004). Apparent digestibility coefficients of nutrients in
brewer have and rendered animal byproducts for rainbow trout (Oncorhynchus mykiss
Walbaum). Aquaculture Research. 35: 1–9.
Chifamba, P.C. (1990). Preference of Tilapia rendalli (Boulenger) for some species of aquatic
plants. Journal of Fish Biology 36: 701-705
Chikafumbwa, F.J.K. (1996). Use of terrestrial plants in aquaculture in Malawi, p.175-182. In
R.S.V. Pullin, J. Lazard. M. Legendre, J.B. Amon-Kothias and D. Pauly (eds.) the Third
International Symposium on Tilapia in Aquaculture Conference Proceedings 41, 575p.
Chirwa, B.B. (2008). Feasibility Study of Proposed Fish Farming Scheme At Nyoka Village in
Mchinji District-Malawi. Ministry of Agriculture and Food Security. National Aquaculture
Centre. Domasi
67
Conover, R.J. (1966). Assimilation of organic matter by zooplankton. Limnos. Oceanography. 11,
338–345.
Cho, C.Y. (1990). Fish nutrition, feeds, and feeding: with special emphasis on salmonid
aquaculture. Food Rev. Int., 63: 333–357.
Craif, S. and Helfrich, L. A. (2002). Understanding Fish Nutrition, Feeds and Feeding, Cooperative
Extension Service, Virginia State University, USA 420–256.
Cowey, C.B. and Sargent, J.R. (1979). Nutrition. In: Fish Physiology. (Eds.) Hoar, W.S., Randall,
D.J. and Brett, J.R. Academic Press, London, 1-69 p
Denstadli, V., Storebakken, T., Svihus, B. and Skrede, A. (2007). A comparison of online phytase
pre-treatment of vegetable feed ingredients and phytase coating in diets for Atlantic salmon
(Salmo salar.)
Dongmeza, E., Steinbronn, S., Francis, G., Focken, U. and Becker, K. (2009). Investigations on the
nutrient and ant nutrients content of typical plants used as fish feed in small scale
aquaculture in the mountainous regions of Northern Vietnam. Animal Feed Science and
Technology, 149:162-178.
Duncan, D.B. (1955). Multiple range and multiple F-tests. Biometrics. 11: 1-42
Edwards, P. and Allan, G.L. (2004), Feed and Feeding for inland aquaculture in Mekong region
countries. ICIAR Technical Report. 56, 1-37.
El-Sayed, A.F.M. (2006). Tilapia Culture. CABI Publishers, Oxfordshire, UK, 277 pp.reared in
cold water. Aquaculture, 269, 414-426
EI-Sayed, A F M. (1999). Alternative dietary protein sources for formed tilapia, Oreochromis Spp.
Aquaculture 179 (1/4): 149-168 feeding of rainbow trout with non-fish meal diets. Fisheries
Science. 63, 258-266.
68
Ekanem, A.P., Eyo, V.O. and Ndome, C.B. (2010). The Effect of diet with different inclusion level
of Cassava leaf meal (CLM) Mahinot utilization on the growth performance of Heteroclarias
fingerings, Journal of Sciences and Multidisciplinary Research, 2: 58-67.
Esonu, B.O., Iheukwumere, F.C., Emenalom, O.O., Uchegbu, M.C. and Etuk, E.B. (2002).
Performance, nutrient utilization and organ characteristics of broilers fed Microdesmis
puberula leaf meal. Livestock for rural development, 14: 6-10
Eusebio, P.S., Coloso, R.M. and R.E. Mamauag, (2004). Apparent digestibility of selected
ingredients in diets for juvenile grouper, Epinephelus coioides (Hamilton). Aquaculture
Research, 35: 1261-1269. Performance, nutrient utilization and organ characteristics of
broilers fed Microdesmis puberula leaf meal. Livestock for rural development, 14: 6-10
Eyo, A.A. (2001). Chemical composition and amino acid content of commonly available feedstuffs
used in fish feeds in Nigeria. Fish Nutrition and Fish feed Technology, Fison, 14 – 25
Falaye, A. and Jauncey, K. (1999). Acceptability and digestibility by tilapia Oreochromis niloticus
of feeds containing cocoa husk. Aquaculture Nutrition 5:157-161
Fagbenro, A.O., Adedire, C.O., Ayotunde, E.E.O. and Faminu, E.O. (2000). Haematologicalprofile,
foodcompositionand digestive enzyme assaying the gut ofAfrican bonytongue fish,
Heterotis niloticus (Cuvier 1829) (Osteoglossidae). Tropical Zoology, 13:1 -9.
FAO, (2008). State of the World Fisheries and Aquaculture. Electronic Publishing Policy and
Support Branch, Food and Agriculture Organization of the United Nations, Viale delle
Terme di, Caracalla 00153, Italy, 58
FAO, (2003). Fisheries statistics http://www.fao.org.
69
Fenton, T.W. and Fenton, M. (1979). An improved procedure for the determination of chromic
oxide in feed and faces for growing pigs. Canadian Journal of Animal Science. 59, 631–
634.
Fernandez, C. and Boudouresque, C.F. (2000). Nutrition of the sea urchin Paracentrotus lividus
(Echinodermata: Echinoidea) fed different artificial food. Marine Ecology Programme
Service. 204:131–241.
Fontainhas-Fernandes, A., Gomes, E., Reis–Henriques, M.A. and Coimbra, J. (1999). Replacement
of fish meal by plant proteins in the diet of Nile tilapia: digestibility and growth
performance. Aquaculture. 7:57–67.
Francis, G., Makkah, H.P.S. and Becker, K. (2001). Anti-nutritional factors present in plant-derived
alternate fish feed ingredients and their effects in fish. Aquaculture, 199: 197-227.
Gabriel, U.U, Inko Tariah, M.B., Keremah, R.I. and Davies O.A. (2007). The role of dietary
phytase in formulation of least cost and less polluting fish feed for sustainable aquaculture
development in Nigeria. African Journal of Agricultural Research, 2 (7):279-286.
Gatlin, D.M., Barrows, F.T., Brown, P. (2007). Expanding the utilization of sustainable plant
products in aqua feeds: a review. Aquaculture Research, 38, 551–579.
Glencross, B., Ewans, D., Hawkins, W. and Jones, B. (2004). Evaluation of dietary inclusion of
yellow lupin (Lupinus luteus) kernel meal on the growth, feed utilisation and tissuehistology
in rainbow trout (Oncorhynchus mykiss). Aquaculture 235, 411-422.
Glencross, B., Ewans, D., Hawkins, W. and Jones, B. (2007). Evaluation of dietary inclusion of
yellow lupin (Lupinus luteus) kernel meal on the growth, feed utilization and tissue
histology in rainbow trout (Oncorhynchus mykiss). Aquaculture 235, 411-422.
70
Government of Malawi (GoM) (2011) Annual Economic Report. Draft report. Ministry of
Development Planning and Cooperation. Lilongwe, Malawi
Guimaraes, I.G., Pezzato, L.E. and Barros, M.M. (2008). Amino acid availability and protein
digestibility of several protein sources for Nile tilapia, (Oreochromis niloticu) Aquaculture.
Nutrition, 14, 396–404.
Guimaraes, R., Goncalves, L. C., Jayme, D. G., Pires, D. A., Rodrigues, J. A. S. and Tomich, T. R.
(2010). In situ degradabilities of pearl millet silages in sheep. Ci. Anim. Bras., Goiânia, 11
(2): 334-343
Hardy, R.W. (2000). New developments in aquatic feed ingredi-ents, and potential of enzyme
supplements. Pp. 216ñ226. In Cruz-Su·rez L.E, Ricque-Marie D., Tapia-Salazar M., Ol-
vera-Novoa M.A., Civera-Cerecedo R. (eds.) Avances ennutriciÛn acuÌcola. V. Simposium
Internacional de NutriciÛnAcuÌcola, 19ñ22 Noviembre 2000. MÈrida, Yucat·n, Me-xico.
Harnly, J.M., M.A., Pastor-Coralles. and Luthra, D.L. (2009). Variance in the chemical composition
of dry beans determined from UV spectral fingerprints. Journal of Agriculture Food
Chemistry.57: 8705-8710.
Hanley, F. (1987). The digestibility of foodstuffs and the effects of feeding selectivity on
digestibility determinations in tilapia, Oreochromis niloticus (L.). Aquaculture, 66, 163–
179.
Hecht, T. and Maluwa, A. (2003). Situation analysis of aquaculture in Malawi. Envirofish Africa
(Pty) Ltd, Grahamstown, South Africa, and National Aquaculture Centre, Domasi, Malawi.
Hecht, T. (2000). Consideration on African Aquaculture. Journal of World Aquaculture, 32: 12-19
71
Hecht, T. (1999). Border Zone Aquaculture Development Project and NARMAP Fisheries
Management Project, backstopping report 1 for 1999. Department Ichthyology and Fisheries
Science, Rhodes University, Grahamstown, South Africa.
Higgs, D.A., Dosanji, B.S., Prendergast, A.F., Beams, R.M., Hardy, R.W., Riley, W. and Deacon,
G. (1995.) Nutrition and Utilization Technology in Aquaculture. Chapman and Hall
Company. New York. USA, 130-156
Ishida, H., Suzuno, H., Sugiyama, N., Innami, S., Tadokoro, T. and Meakawa, A. (2000). Nutritive
value on chemical components of leaves stalks and stems of sweet potato (Ipomoea batatas
Poir). Food Chemistry, 68: 359-367.
Ibiyo, L.M.O. and Olowosegun, T. (2004). The potential for improving profitability in Aquaculture
pp.45-53. In: PA Araoye (ed). Proceedings of the 19th Annual Conference of the Fisheries
Society of Nigeria (Fison) llorlnN .896.
Jamu, D. and Costa-Pierce, B.A. (1993). Use of firewood ash in small scale aquaculture. Journal of
Aquaculture in the Tropic,s 8: 167-175
Kamangira, A. (2015). Assessment of economic viability of fish farming at Mpamba in Nkhatabay,
Malawi. Mzuzu University, P/Bag 201, Mzuzu, Malawi, Unpublished Master’s Thesis.
Kan’gombe, J., Brown, J.A. and Halfyard, L.C. (2007). Effect of feeding single ingredient
supplemental diet on growth, feed utilization, plankton abundance and survival tilapia
Tilapia rendalli. (Boulenger 1876), Journal of Applied Aquaculture, 19: 29-53.
Kang’ombe, J., Brown, J.A. and Halfyard, L.C. (2006). Effect of using different types of organic
animal manure on plankton abundance, and on growth and survival of Tilapia rendalli
(Boulenger), in ponds. Aquaculture Research 37: 1360-1370.
72
Kang’ombe, J. and Brown, J.A. (2008). Effect of using low-protein diets in semi-intensive pond
cage culture of tilapia, Tilapia rendalli (Boulenger). Journal of Applied Aquaculture 20:
243-255.
Kang’ombe, J., Kapute, F. and Ntenjera, G. (2009). Nutrient analysis of locally available plant
based feed ingredients used by Chingale farmers and their potential for fish feed
development in pond raised improved strain of Oreochromis shiranus. ARDEP
Dissemination Seminar 2009. 27-28 August 2009, Capital Hotel, Lilongwe, Malawi, 1: 15-
18.
Kays, S.J. (1985). The physiology of yield in the sweet potato. In: JC Bouwkamp (Ed.) Sweet
Potato Products - A Natural Resource for the Tropics, CRC Press, Florida, USA
Klinger, T.S., Lawrence, J.M. and Lawrence, A.L. (1994.) Digestive characteristics of the sea-
urchin Lytechinus variegatus (Lamarck) (Echinodermata: Echinoidea) fed prepared feeds.
Journal of World Aquaculture Society. 25, 489–496
Kraugerud, O.F., Penn, M., Storebakken, T., Refstie, S., Krogdahl, Å. and Svihus, B. (2007).
Nutrient digestibilities and gut function in Atlantic salmon (Salmo salar) fed diets with
cellulose or non-starch polysaccharides from soy. Aquaculture, 273:96–10.
Khan, M.A. Jmal., Mahr-un-n Isa. and .Sawar, M. (2003). Review Techniques Measuring
Digestibility for the Nutritional Evaluation of Feeds. International Journal of Agriculture
and Biology, 5(1).
Koprucu, K. and Ozdemir, Y. (2005). Apparent digestibility of selected feed ingredients for Nile
Tilapia (Oreochromis niloticus). Aquaculture, 250: 308–316
Li, M.H., Peterson. B.C., Jones, C.L. and Robinson, E.H. (2006). Comparison on diet containing
various fish meal levels on growth performance, body composition and Insulin-like growth
73
factor -I of Juvenile channel catfish, (Icturulus panctatus) of different strains. Aquaculture,
253.628-635.
Lim, C. E. and Webster, C. D. (2006). Nutrient requirements. In: Lim, C.E. and Webster, C.D.
(Eds), Tilapia: Biology, Culture and Nutrition. Food Products Press, New York, USA, pp.
469-501.
Lola, A. (2009). The Effect of Boiling on the Nutrients and Anti-Nutrients in Two non-
Conventional Vegetables, Pakistan Journal of Nutrition, 8(9): 1430-1433.
Madu, C.T., Sogbesan O.A. and Ibiyo, L.M.O. (2003). Some Nonconventional Fish Feed Resources
in Nigeria. In: Eyo, A.A., (Ed.), Proceeding of the Joint Fisheries Society of
Nigeria/National Institute For Freshwater Fisheries Research/FAO National Special
Programme For Food Security National Workshop on Fish Feed Development and Feeding
Practices in Aquaculture Held at National Institute for Freshwater Fisheries Research, 15th-
19th Sept, New Bussa, pp: 7382.
Maina, J.G., Beames, R.M., Higgs, D., Mbugua, P.N., Iwama, G. and. Kisia, S.M. (2002).
Digestibility and value of same feed ingredients fed to tilapia Oreochromis niloticus (L).
Aquaculture Research, 33; 853 862.
Mataka, L. and Kang’ombe, J. (2007). Effect of substitution of maize bran with chicken manure in
semi-intensive pond culture of Tilapia rendalli (Boulenger). Aquaculture Research 38: 940-
946.
Mbahinzireki, G. B., Dabrowski, K.; Lee, K. J.; El-Saidy, D. and Wisner, E. R. (2001). Growth,
feed utilization, and body composition of tilapia (Oreochromis species.) fed with cottonseed
meal. Aquaculture Nutrition, 7 (3): 189–200.
74
Muir, J.F., Gitonga, N., Omar, I., Pouomogre, V. and Radwan, I. (2005). Hidden harvest unlocking
the potential of aquaculture in Africa. NEPAD Fish for all Summit 22-25 Abuja Nigeria.
Technical Review Paper-Aquaculture: 56
Mulumphwa, M. and Kang’ombe, J. (2010). Effect of feeding soybean-based diets on the survival,
growth and feed utilization of Tilapia rendalli in a semi-intensive pond culture system
Aquaculture Research, 40:1099-1101
McGinnis, A.J. and Kasting, R. (1964). Colorimetric analysis of chromic oxide used to study food
utilization in byphytophagus insects. Agricultural and Food Chemistry, 12: 259 -262
Mokolensang, J. F., Yamasaki, S. and Onoue, Y. (2003). Utilization of Shochu distillery by-
products for culturing the common carp (Cyprinus carpio). Journal of Biological Science,
3(5):502-507.
Morais, S, Bell, J.G., Robertson, D.A, Roy, W.J. and Morris, P.C. (2001). Protein/lipid ratios in
extruded diets for Atlantic cod (Gadus morhua L.): effects on growth, feed utilization,
muscle composition and liver histology. Aquaculture .203:101–119
Muir, J F, Gitonga, N., Oma, I., Pouomogre, V. and Radwan, I. (2005). Hidden harvest unlocking
the potential of aquaculture in Africa. NEPAD Fish for all Summit 22-25 Abuja Nigeria.
Technical Review Paper. Aquaculture. 56 .
Murray, H.M., Lall, S.P., Rajaselvam, R., Boutilier, L.A., Blanchard, B., Flight, R.M., Colombo, S.,
Mohindr, V. and Douglas, S.E. (2010). A nutrigenomic analysis of intestinal response to
partial soybean meal replacement in diets for juvenile Atlantic halibut, (Hippoglossus
hippoglossus L). Aquaculture. 298:282-293.
Nandeesha, M.C., Srikanth, G.K., Keshavanath, P. and Das, S.K. (1991). Protein and fat
digestibility of five feed ingredients by an Indian major carp, Catla catla (Hamilton). In:
75
Fish Nutrition Research in Asia: Proceedings of the Fourth Asian Fish Nutrition Workshop
(De Silva, S.S. ed.), pp. 75–81. Asian Fisheries Society, Manila, Philippines.
NAC, (2003) National Aquaculture Centre Annual Report 2002/2003. Malawi Department of
Fisheries. National Aquaculture Centre, Domasi, Malawi
National Research Council (NRC) (1993). Nutrient requirements of warm water fishes and
shellfishes. National Academy Press, Washington, DC.
Nankervis, L., Matthews, S.J. and Appleford, P. (2000). Effect of dietary non-protein energy source
on growth, nutrient retention and circulating insulin-like growth factor I and
triiodothyronine levels in juvenile barramundi, Lates calcarifer. Aquaculture 191:323–335.
Naylor, R.L., Hardy, R.W. and Bureau, D.P. (2009). Feeding aquaculture in an era of finite
resources. PNAS, 106, 15103–15110.
Ogunji, J.O. (2004). Alternative protein sources in diets for farmed tilapia. Animalscience.com
Reviews, 2004, No.13; Nutrition Abstracts and Reviews, 74(8): 23– 32
Ohashi, M. (1998). The research project for small-scale aquaculture of Malawian indigenous
species. In: Proceedings of the First Regional Workshop on Aquaculture, 17-19 November,
1997 (ed. by J.S. Likongwe & E. Kaunda), pp. 22-28. Bunda College of Agriculture,
Lilongwe, Malawi.
Olele, N.F. (2001). Comparative study on the use natural and artificial based diet on Clarias
gariepinus fingerings. Journal of Agriculture and Biological, Science.6 9-13
Olvera-Novoa, M.A., Olvera-Castillo, L. and Martinez-Paracios, C.A. (2002). Sunflower seed meal
as protein source in diets for Tilapia rendalli (Boulanger, 1896) fingerlings. Aquaculture
Research 33: 223-229.
76
Omoregie, E., Igoche, L., Ojobe, T.O., Absalom K.V and Onusiriuka, B.C. (2009). Effect of
varying Levels of Sweet potato (Ipomea batatas) Peels of Sweet Potato on, Feed utilization
and some Biochemical Responses of cichlid (Oreochromis niloticus). African Journal of
Food Agriculture Nutrition and Development, 9(2): 700-712.
Omoregie, E. (2001). Utilization and nutrient digestibility of mango seeds and palm kernel meal by
juvenile Labeo senegalensis (Antheriniformes: Cyprinidae). Aquaculture. Research; 32: 681
– 687.
Omoregie, E. (1999). Effects of Kidney bean, phaseolus vulgaris meal on the growth performance,
feed utilization and protein digestibility of the Nile tilapia. Journal of Aquatic Sciences, 14:
55-59.
Omoregie, E. and Ogbemudia, F.I. (1993). Effect of substituting fishmeal with palm kernel on
growth and food utilization of the Nile Tilapia, (Oreochromis niloticus). Israeli J. Aquacult.;
43: 113 – 119.
Onyimonyi, A.E. and Ernest, O. (2009). An assessment of pawpaw leaf meal as protein ingredient
for Finishing Broiler. International Journal of Poultry Science, 8(10): 995
Oresegun, A. and Alegbeleye, W.O. (2001). Growth response and nutrient utilization of tilapia
Oreochromis niloticus fed varying dietary levels of cassava peels based on rations
supplemented with di-methionine Fish Nutrition and Fish Feed Technology in Nigeria.
Pp.8-13. In: A.A. Eyo (Ed) Proceedings of the first National Symposium on Fish Nutrition
and Fish Feed Technology Lagos NIOMR.
Otero-Villanueva, M.M., Kelly, M.S. and Burnell, G. (2004). How diet influences energy
partitioning in the regular echinoid (Psammechinus miliaris) constructing an energy budget.
J. Exp. Mar. Biol. Ecol. 304, 159–181.
77
Refstie, S., Sahlstro, M, S., Brathen, E., Baeverfjord, G. and Krogedal, P. (2005). Lactic acid
fermentation eliminates indigestible carbohydrates and anti-nutritional factors in soybean
meal for Atlantic salmon (Salmo salar). Aquaculture, 246, 331–345
Refstie, S., Landsverk, T., Ringø, E., Sundby, A., Shearer, K.D. and Kroghdahl, Å. (2006).
Digestive responses of 1- and 2-year-old Atlantic cod (Gadus morhua) fed standard or
bioprocessed soybean meal. Aquaculture 261, 269-284
Riche, M., Trottier, N.L., Ku, P.K. and Garling, D.L. (2001). Apparent digestibility of crude protein
and apparent availability of individual amino acids in tilapia (Oreochromis niloticus) fed
phytase pretreated soybean meal diets. Fish Physiology and Biochemistry, 25: 181-194.
Stone, D.A.J. (2003). Dietary carbohydrate utilization by fish Review. Fisheries Science. 11, 337–
369.
Sklan, D., Prig, T. and Lupatsch, I. (2004). Apparent digestibility coefficients of feed ingredients
and their prediction in diets for tilapia (Oreochromis niloticus x Oreochromis aureus)
(Teleostei Cichlidae). Aquaculture Research. 35, 358–364.
Setlivova, I. and Adamek, Z. (2004). Feeding selectivity and growth of the Nile tilapia
(Oreochromis niloticus L.) fed on temperate-zone aquatic macrophytes. Czech Journal of
Animal Science 49: 271-278.
Soko, T. and Kang’ombe, J. (2010). Development of least cost formulated feed for Tilapia rendalli
in tank based grow- out culture system, Second RUFORUM Biennial Meeting 20 - 24
September, Entebbe, Uganda.
Soko, C.K. and Lilongwe, J.S. (2002). Effects of fertilization and feeding on the growth of Tilapia
rendalli reared in concrete ponds. Aqua-Fish Technical Report 1: 29-31
78
Storebakken, T., Refits, S. and Rutter, B. (2000). Soy products as fat and protein sources in fish
feed for intensive aquaculture. In: Dra, J.K. (Ed) Soy in Animal Nutrition. Federation of
Animal Science Societies, Savoy, IL, USA, 127-170.
Sheikh, B.A. and Sheikh S.A. (2004). Aquaculture and integrated farming system. Pakistan Journal
of Agriculture Engeering and Vetenary Science, 20(2):52-58.
Schulz, C., Huber, M. and Ofunji, J. (2008). Effects of varying dietary protein to lipid ratios on
growth performance and body composition of juvenile pike perch (Sander lucioperca).
Aquaculture Nutrition 14:166–173.
Takeuchi, T., Shiina, Y., Watanabe, T., Sekiya, S. and Imaizumi, K. (1992). Suitable protein and
lipid levels in diet for fingerlings of yellowtail. (Nippon Suisan) Gakkaishi, 58: 1333-1339.
Tacon, A.G J. (2003). Global trends in aquaculture and global aquafeed production. International
Aquafeed--Directory and Buyers'Guide; pp. 4-25. Turret West Ltd, BarthamPress, Luton,
UK.
Ugwamba, A. A. and Ugwamba, A. A.O. (2003). Aquaculture options and the future of fish supply
in Nigeria. The Zoologist, 2 (1):96-122.
Watts, S.A., Hofer, S.C., Desmond, R.A., (2010). The effect of temperature on feeding and growth
characteristics of the sea urchin Lytechinus variegatus fed a formulated feed. Journal of
Experimental Biology and Ecology. 397, 188–195.
Wang, Y, Guo, J.L, and Li, K. (2006). Effects of dietary protein and energy levels on growth, feed
utilizationand body composition of cuneate drum (Nibea miichthioides). Aquaculture
252:421–428.
World Bank, (2006). Reducing poverty and hunger. The World Bank, Washington D.C. USA.
79
World fish, (2005). African Fish for all Summit. http://www.fishforall.org/ffasummit/ accessed 18
April, 2010.
Wassef, E.A., Plammer, G. and Paxton, M. (1988). Protease digestion of the meals of UN
germinated and germinated soybeans. Journal of Food Science and Agriculture. 44: 201-
214.
Yadava, U.L., Janice, A., Burris and McGary, D. (1990). Papaya: A Potential annual crop under
middle Georgia conditions. In: J. Janick and J.E. Simons (Eds.), Advances in New Crops.
Timber Press, Portland, 364-366.
Yue, Y.R. and Zhou, Q.C. (2008). Effect of replacing soybean meal with cottonseed meal on
growth, feed utilization and hematological indexes for juvenile hybrid tilapia, Oreochromis
niloticus × O. aureus. Aquaculture, 284,185-189.
Zhou, Q.C., Tan, B.P., Mai, K.S. and Liu, Y.J. (2004). Apparent digestibility of selected feed
ingredients for juvenile cobia (Rachycentron canadum). Aquaculture, 241: 441–451.