Embed Size (px)
Citation preview
NWPP
After-the-Factandand
System Schedulers Meetings
October 21-22, 2014 –Portland, OR

N M iN M iNext Meeting…Next Meeting…
October October 2020--21, 201521, 2015–– Portland, Portland, OROR
Stay Tuned:Stay Tuned:Stay Tuned: Stay Tuned: httphttp://www.nwpp.org/calendar/After://www.nwpp.org/calendar/After--thethe--FactFact--andand--SystemSystem--
SchedulersSchedulers--MeetingMeeting--2015.10.202015.10.20
If i t t d i ti i ti thIf i t t d i ti i ti thIf you are interested in participating on the If you are interested in participating on the Agenda Committee Agenda Committee please contact:please contact:
[email protected]@nwpp.orgor or
(503) (503) 445445--10791079
AFTER THE FACT & SYSTEM SCHEDULERS MEETING October 21-22, 2014
DoubleTree by Hilton – Portland 1000 NE Multnomah Portland, OR 97232
Proposed Agenda
Oct. 21, 2014
1. Welcome and Arrangements ChaRee DiFabio, NWPP 2. WECC ATF Dispute Report Paul Rice, WECC 3. BAL-002-WECC-2 Jerry Rust, NWPP
IInnttrroodduuccttiioonnss && BBrreeaakk 4. SCE’s Decommissioning of San Onofre Nuclear Generating Station (SONGS) Tom Botello, SCE 5. EIM Update
CAISO/PacifiCorp John Schaffroth PAC; John Apperson, PAC; Don Tretheway CAISO
NWPP MC Initiative Dan Williams, PGE o Security Constrained Economic Dispatch (SCED)
6. Interactive Activity All EEvveenniinngg RReecceeppttiioonn -- 55::0000 pp..mm.. ttoo 88::0000 pp..mm.. -- MMuullttnnoommaahh GGrriillllee Oct. 22, 2014
1. Welcome Back ChaRee DiFabio, NWPP 2. WECC ISAS Update Andy Meyer, BPA – WECC ISAS Chair 3. PGE Solar Power Scott Russell, PGE 4. WECC - Peak Reliability Update Michelle Mizumori, Peak RC BBrreeaakk 5. BPA’s Improvement /upgrade project to DC Intertie Karl Mitsch, BPA
How will it enhance Scheduling?
6. 15 Minute Scheduling – Panel Discussion Demetrious Fotiou, PWX; Lou Miranda, BPA; and Matt Richard, PGE
How is this new process working? CClloossiinngg && DDoooorr PPrriizzeess
Presenter Biographies –
After-the-Fact Meetings & System Schedulers
October 21-22, 2014 – Portland, OR
WECC ATF Disputes Report
Paul W. Rice is the Assistant Director of Operations for Western Electricity Coordinating Council. In this capacity he is responsible for coordination and participation on all NERC/WECC RC, BA and TOP certifications. He is also responsible for the NERC Event Analysis program for WECC. He collects, reviews, and posts all Event Reports to both NERC and WECC websites. Paul joined WECC’s predecessor, the WSCC, in 2002 as an electronic scheduling specialist. Paul is a 43-year veteran of the electric utility industry having held positions at PacifiCorp and Nevada Power working in transmission (pre-scheduling and e-Tagging) and sub-transmission and in AGC. In addition, he worked on the implementation of the OASIS program at PacifiCorp. Paul began his career with Pacific Power & Light as a meter reader in 1971 and held various positions within the organization, including journeyman lineman and serviceman positions in Rock Springs, Wyoming and in dispatch at the company’s Jim Bridger Plant in Wyoming. He has been in Operations, holding many managerial positions since. Paul retired from Nevada Power Company in 1996 after 15 years and from PacifiCorp in 2002 after 15 years, both in Operations. Paul graduated BS Social Sciences (Double Major in Psychology and Sociology) August 1971.
WECC Standard BAL-002-WECC-2
Jerry D. Rust joined the Northwest Power Pool January 1, 2001 as President. For the majority of 2000, Jerry consulted on power issues for several software companies. Prior to that, he worked at PacifiCorp for 23 years, where he served as managing director of PacifiCorp’s revenue organization and managing director of the transmission systems group. Jerry joined PacifiCorp in 1977 as an engineer and held positions in power resources, financial analysis, field operations, customer service, sales support and national sales. Mr. Rust was graduated from the University of Wyoming with a degree in electrical engineering. He has furthered his education with numerous courses from various schools (University of Washington, Washington State University, Colorado School of Mines, and others). Jerry is one of the Western Electricity Coordinating Council’s North American Electric Reliability Council Operating Committee Representatives. SCE’s Decommissioning of San Onofre Nuclear Generating Station (SONGS)
Thomas J. Botello is a principal manager with SCE responsible for an organization that directs electric system grid operations and engineering by monitoring, planning, analyzing and directing 24/7 operations of the grid, and ensuring compliance with mandatory reliability standards. He has a staff of 40, and has been in with SCE for 32 years holding numerous management positions with increasing responsibility. He is the current SCE member representative with Peak Reliability and the Operating Committee representative with WECC. He has served in numerous capacities in the electric industry including; WECC Operating Committee Chair; Operating Issues Work Group Chair; PacifiCorp Disturbance Investigation Team Chair; Operating Practices Subcommittee Member; Reliability Issues Task Force Member, Reliability Coordination Task Force Member; WECC Reliability Coordinator NERC Review Certification Team Member, and 2003 Northeast Blackout Readiness Review Teams. He
has completed executive training courses at Pepperdine Graziadio School of Business and the University of Idaho.
EIM Update - CAISO/PacifiCorp
John Schaffroth has been at PacifiCorp for 12 years. He started on the Balance & Interchange Desk where he worked for about five years, moved to the Transmission Preschedule group for two years, supervised the B&I desk for about three years, and is currently assigned to the EIM Implementation team. He has a wife and two kids and currently resides in Vancouver, WA. EIM Update - CAISO/PacifiCorp
John Apperson has been the trading director at PacifiCorp located in Portland, Oregon, since 2000 and is responsible for real-time, short-term and long-term trading, scheduling and operations for electricity and natural gas. Mr. Apperson has experience in many aspects of the utility industry from transmission planning to wholesale marketing. He has been actively involved in the design and implementation of the California ISO energy imbalance market. EIM Update - CAISO/PacifiCorp
Don Tretheway is the Lead Market Design and Regulatory Policy Specialist at the California ISO. He led the stakeholder initiative at the ISO to design the Energy Imbalance Market which leverages the ISO’s real-time market. He was also responsible for the ISO’s FERC Order No. 764 compliance and associated real-time market design changes including the introduction of the fifteen minute market and advanced scheduling and bidding for variable energy resources. He will also be leading the Flexible Ramping Product stakeholder initiative which will be recommencing the end of May. EIM Update – NWPP MC Initiative
Dan Williams, NWPP MC Initiative Lead – Power Operations, Portland General Electric: Dan joined PGE’s Power Supply Operations group in late 2012, where his diverse background in real-time trading (PSE and Tri-State Energy), back-office (PPM/Iberdrola), and FERC policy and compliance (PSE) has been put to use on a number of projects. He currently leads PGE’s internal and external participation in the NWPP MC Initiative, and is the Chair of the NWPP MC Initiative Leadership Committee for 2014. WECC ISAS – Status Update & WIAB Training and Test Plan
Andy Meyer is a native Oregonian and has been at the Bonneville Power Administration since fall of 2000 when he started as a student intern. He currently supervises the Power Services Preschedule group and is the WECC ISAS Chair. PGE Solar Power
Scott Russell is an Originator for the Portland General Electric Power Operations and Resource Strategy group. Scott specializes in structured transactions, asset acquisitions, and long-term strategic planning for the wholesale power portfolio. Prior to joining PGE, Scott worked for TransCanada in the US Pipelines West division as a financial analyst in the pricing and regulatory affairs departments. He is a native Oregonian and Oregon State University alumnus.

Peak RC
Michelle Mizumori serves as the Director, Operations for Peak Reliability, the Western Interconnection’s new Reliability Coordinator company. She oversees the the Real-Time Operations group. Michelle joined the Western Electricity Coordinating Council (WECC) in 2008 as Market Interface Manager.
Prior to joining WECC, Michelle spent three years at Madison Gas and Electric (MGE) Company. There she worked with MGE’s Balancing Authority operations group and was responsible for MGE’s participation in the Midwest ISO, the Midwest Contingency Reserve Sharing Group, purchased power agreements, and operator training. Michelle has a Doctorate from Johns Hopkins University, Baltimore, Maryland and a Bachelors of Science from Swarthmore College, Swarthmore, Penn BPA’s Improvement/upgrade project to DC Intertie
Karl A. Mitsch is the Program Manager for FACTS (Flexible AC Transmission Systems) and HVDC (High Voltage Direct Current) Systems at the Bonneville Power Administration in Vancouver, WA. Mr. Mitsch is also the lead Project Manager for the Pacific DC Intertie Upgrade Project which BPA is executing on its portion of the intertie. Mr Mitsch has been with the BPA for 13 years where he has worked mainly in the area of reactive compensation, HVDC and FACTS as an application engineer and project manager. An electrical power system engineer with over 25 years in the electric utility business, Mr. Mitsch has also worked for General Electric and Consolidated Edison. Mr Mitsch has an MSEE and BSEE from Clarkson University and a BS in Mathematics from SUNY Oneonta. 15 Minute Scheduling Panel
Lou Miranda has been with BPA for over 20 years and has worked in both Power and Transmission Scheduling for over a decade. A graduate of Portland State University, Lou is a native of the Pacific Northwest. 15 Minute Scheduling Panel
Demetrios Fotiou was born, raised and has always lived in Vancouver. Demetrios has a Bachelor Degree in Civil Engineering and a Masters Degree in Hydrology/Environmental Engineering from the University of British Columbia in Vancouver. Demetrios has been in the industry for almost 25 years, of which 17 years have been with Powerex, in Vancouver. Part of Demetrios’ role at Powerex is management of the Realtime Trading desk, a role that he has held since the inception of the Realtime Trading group at Powerex. Demetrios has been heavily involved in the industry in the past 17 years, including being a member of many WECC workgroups and Committees historically and/or currently, including MIC, OC, ISAS, RTSWG, ISWG, EIWG and MIS. Demetrios spends much of his spare time coaching his children’s sports, trying to remember to praise his wife, and working on old classic cars.
15 Minute Scheduling Panel
Matt Richard is the OASIS and Scheduling Systems Analyst for the Portland General Electric Transmission and Reliability Services group. Matt has been with PGE for nearly 34 years serving initially in Trojan Nuclear Power Plant operations for 12 years, Power Operations as a real-time scheduler for 6 years, before his current roles in PGE Transmission where he began as a transmission prescheduler and now specializes in scheduling and e-tagging systems support and policy. Matt is a 6 year US Navy veteran where he served in its nuclear power program.

NWPP Meeting MC
ChaRee DiFabio joined the joined the Northwest Power Pool in July 2000. She is currently the Reserve Sharing Group Committee Manager and oversees all related activities as well as the program. Also, she provides support to the NWPP Operating Committee (OC), NWPP Training, various subcommittees and work groups through coordination, meeting facilitation, and informational reporting on behalf of the membership to the internal companies and other organizations such as WECC and NERC. Prior to working for the NWPP she worked for Idaho Power Company for 5 years at the Boise Bench Substation where she worked with the System Dispatch, After-the-Fact, and the System Scheduling groups.
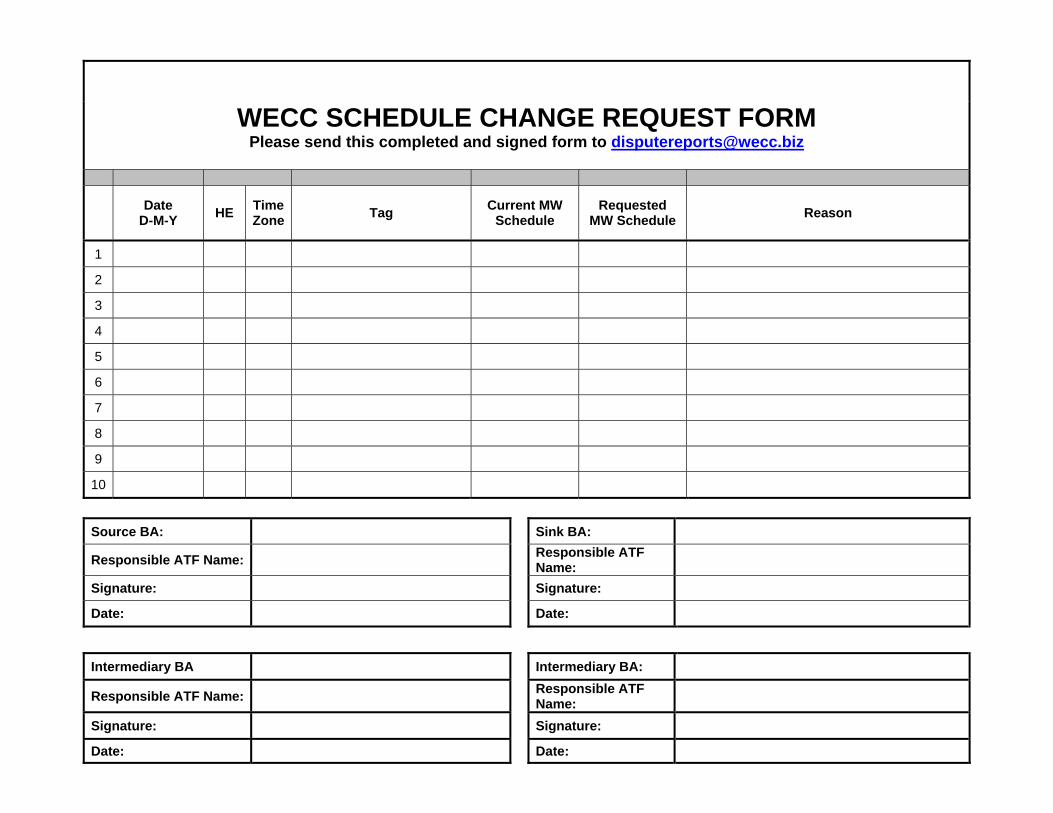
WECC SCHEDULE CHANGE REQUEST FORM
Please send this completed and signed form to [email protected]
Date
D-M-Y HE Time Zone Tag Current MW
Schedule Requested
MW Schedule Reason
1
2
3
4
5
6
7
8
9
10
Source BA: Sink BA:
Responsible ATF Name:
Responsible ATF Name:
Signature: Signature:
Date: Date:
Intermediary BA Intermediary BA:
Responsible ATF Name:
Responsible ATF Name:
Signature: Signature:
Date: Date:
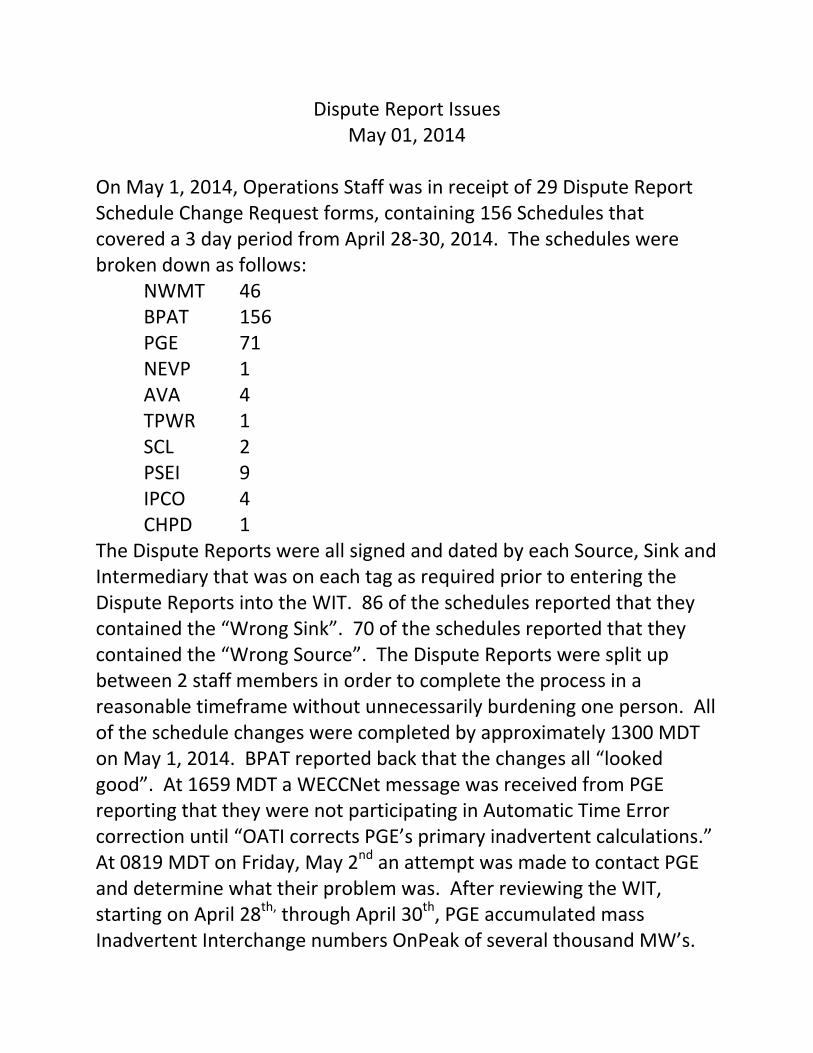
Dispute Report Issues May 01, 2014
On May 1, 2014, Operations Staff was in receipt of 29 Dispute Report Schedule Change Request forms, containing 156 Schedules that covered a 3 day period from April 28‐30, 2014. The schedules were broken down as follows: NWMT 46 BPAT 156 PGE 71 NEVP 1 AVA 4 TPWR 1 SCL 2 PSEI 9 IPCO 4 CHPD 1 The Dispute Reports were all signed and dated by each Source, Sink and Intermediary that was on each tag as required prior to entering the Dispute Reports into the WIT. 86 of the schedules reported that they contained the “Wrong Sink”. 70 of the schedules reported that they contained the “Wrong Source”. The Dispute Reports were split up between 2 staff members in order to complete the process in a reasonable timeframe without unnecessarily burdening one person. All of the schedule changes were completed by approximately 1300 MDT on May 1, 2014. BPAT reported back that the changes all “looked good”. At 1659 MDT a WECCNet message was received from PGE reporting that they were not participating in Automatic Time Error correction until “OATI corrects PGE’s primary inadvertent calculations.” At 0819 MDT on Friday, May 2nd an attempt was made to contact PGE and determine what their problem was. After reviewing the WIT, starting on April 28th, through April 30th, PGE accumulated mass Inadvertent Interchange numbers OnPeak of several thousand MW’s.
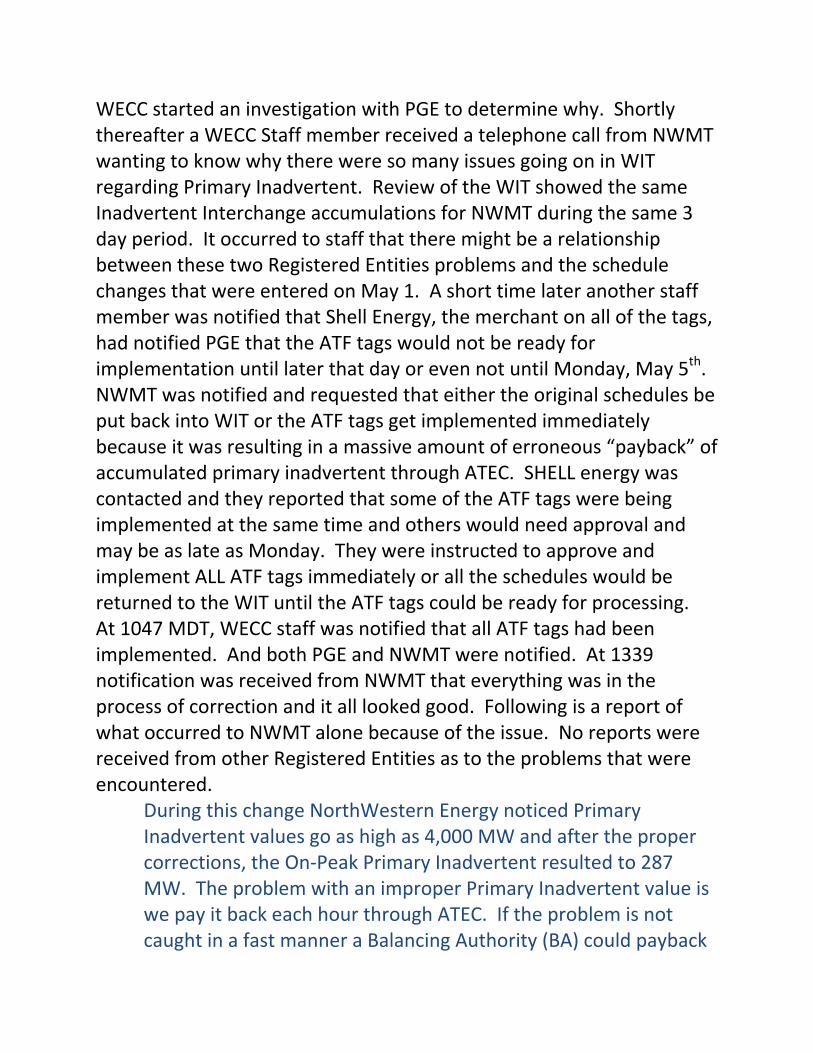
WECC started an investigation with PGE to determine why. Shortly thereafter a WECC Staff member received a telephone call from NWMT wanting to know why there were so many issues going on in WIT regarding Primary Inadvertent. Review of the WIT showed the same Inadvertent Interchange accumulations for NWMT during the same 3 day period. It occurred to staff that there might be a relationship between these two Registered Entities problems and the schedule changes that were entered on May 1. A short time later another staff member was notified that Shell Energy, the merchant on all of the tags, had notified PGE that the ATF tags would not be ready for implementation until later that day or even not until Monday, May 5th. NWMT was notified and requested that either the original schedules be put back into WIT or the ATF tags get implemented immediately because it was resulting in a massive amount of erroneous “payback” of accumulated primary inadvertent through ATEC. SHELL energy was contacted and they reported that some of the ATF tags were being implemented at the same time and others would need approval and may be as late as Monday. They were instructed to approve and implement ALL ATF tags immediately or all the schedules would be returned to the WIT until the ATF tags could be ready for processing. At 1047 MDT, WECC staff was notified that all ATF tags had been implemented. And both PGE and NWMT were notified. At 1339 notification was received from NWMT that everything was in the process of correction and it all looked good. Following is a report of what occurred to NWMT alone because of the issue. No reports were received from other Registered Entities as to the problems that were encountered.
During this change NorthWestern Energy noticed Primary Inadvertent values go as high as 4,000 MW and after the proper corrections, the On‐Peak Primary Inadvertent resulted to 287 MW. The problem with an improper Primary Inadvertent value is we pay it back each hour through ATEC. If the problem is not caught in a fast manner a Balancing Authority (BA) could payback
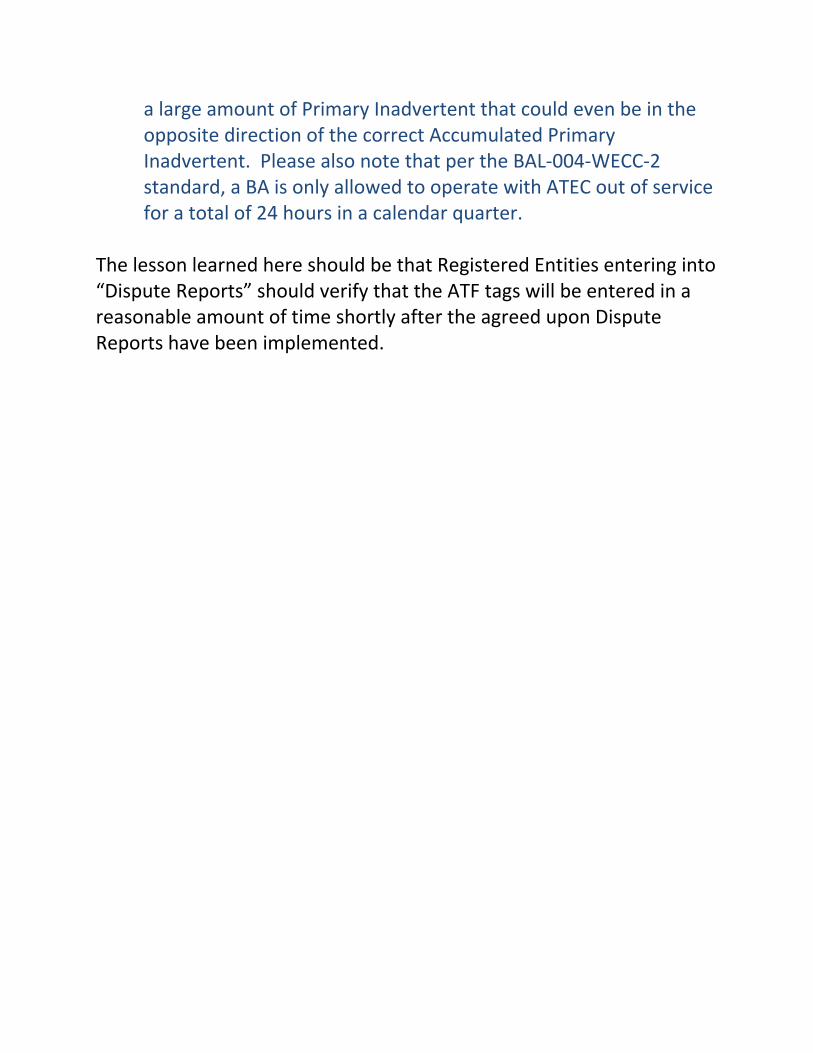
a large amount of Primary Inadvertent that could even be in the opposite direction of the correct Accumulated Primary Inadvertent. Please also note that per the BAL‐004‐WECC‐2 standard, a BA is only allowed to operate with ATEC out of service for a total of 24 hours in a calendar quarter.
The lesson learned here should be that Registered Entities entering into “Dispute Reports” should verify that the ATF tags will be entered in a reasonable amount of time shortly after the agreed upon Dispute Reports have been implemented.
NORTHWEST POWER POOL
Reliability through Cooperation
2014 Update2014 Update
Presentation Outline• History of Northwest Power Pool
• BAL-002-WECC-2
What is out
Major impact to NWPP RSGj p
New Standard
Impact at cross over (Pre CRO 3 156 MW Post CRO 2 948 MW) Impact at cross-over (Pre CRO- 3,156 MW Post CRO- 2,948 MW)
Impact on System Operators
• NERC BAL-003
Timing
2
• Questions
BAL-002-WECC-2
What is outWhat is out
Load responsibility term
Interruptible
The sum of 5% of the load responsibility served by hydro generation and 7% of the load responsibility served by thermal generation
Additi l f i t tibl i t Additional reserve for interruptible imports
Additional reserve for on-demand obligations
3
BAL-002-WECC-2
Major impact to NWPP RSG
Reallocation of the Contingency Reserve Obligation (CRO). Some Participating Balancing Authority’s CRO increased while others decreased
4
BAL-002-WECC-2Requirements and MeasuresR1. Each Balancing Authority and each Reserve Sharing Group shall
maintain a minimum amount of Contingency Reserve, except within the g y , pfirst sixty minutes following an event requiring the activation of Contingency Reserve, that is: [Violation Risk Factor: High] [Time Horizon: Real-time operations]
R1.1 The greater of either: • The amount of Contingency Reserve equal to the loss of the most severeThe amount of Contingency Reserve equal to the loss of the most severe
single contingency;
• The amount of Contingency Reserve equal to the sum of three percent of hourly integrated Load plus three percent of hourly integrated generation.
5
BAL-002-WECC-2R1.2 Comprised of any combination of the reserve types specified below:
• Operating Reserve – Spinning
• Operating Reserve - Supplemental
• Interchange Transactions designated by the Source Balancing Authority as Operating Reserve – Supplemental
• Reserve held by other entities by agreement that is deliverable on Firm T i i S iTransmission Service
• A resource, other than generation or load, that can provide energy or reduce energy consumption
• Load including demand response resources Demand Side Management• Load, including demand response resources, Demand-Side Management resources, Direct Control Load Management, Interruptible Load or Interruptible Demand, or any other Load made available for curtailment by the Balancing Authority or the Reserve Sharing Group via contract or agreement.
• All other load, not identified above, once the Reliability Coordinator has declared an energy emergency alert signifying that firm load interruption is i i t i
6
imminent or in progress..
BAL-002-WECC-2R1 3 B d l ti h l l d d ti lR1.3 Based on real-time hourly load and generating energy values
averaged over each Clock Hour (excluding Qualifying Facilities covered in 18 C.F.R.§ 292.101, as addressed in FERC Order 464).
R1.4 An amount of capacity from a resource that is deployable within ten minutes.
M1. Each Balancing Authority and each Reserve Sharing Group will have g y g pdocumentation demonstrating its Contingency Reserve was maintained, except within the first sixty minutes following an event requiring the activation of Contingency Reserve.
7
BAL-002-WECC-2R2. Each Balancing Authority and each Reserve Sharing Group shall
maintain at least half of its minimum amount of Contingency Reserve identified in Requirement R1, as Operating Reserve – Spinning that meets both of the following reserve characteristics. [Violation Risk Factor: High] [Time Horizon: Real-time operations]
R2 1 R h i i di l d i ll i fR2.1 Reserve that is immediately and automatically responsive to frequency deviations through the action of a governor or other control system;
R2.2 Reserve that is capable of fully responding within ten minutesR2.2 Reserve that is capable of fully responding within ten minutes.
M2. Each Balancing Authority and each Reserve Sharing Group will have dated documentation that demonstrates it maintained at least half of the Contingency Reserve identified in Requirement R1 as Operating Reserve –Spinning, averaged over each Clock Hour, that met both of the reserve characteristics identified in Requirement R2, Part 2.1 and Requirement R2,
8
Part 2.2.
BAL-002-WECC-2R3 Each Sink Balancing Authority and each sink Reserve Sharing GroupR3. Each Sink Balancing Authority and each sink Reserve Sharing Group
shall maintain an amount of Operating Reserve, in addition to the minimum Contingency Reserve in Requirement R1, equal to the amount of Operating Reserve–Supplemental for any Interchangeamount of Operating Reserve Supplemental for any Interchange Transaction designated as part of the Source Balancing Authority’s Operating Reserve–Supplemental or source Reserve Sharing Group’s Operating Reserve–Supplemental, except within the first sixty minutes following an event requiring the activation of Contingency Reserve. [Violation Risk Factor: High] [Time Horizon: Real-time operations]
M3. Each Sink Balancing Authority and each sink Reserve Sharing Group willM3. Each Sink Balancing Authority and each sink Reserve Sharing Group will have dated documentation demonstrating it maintained an amount of Operating Reserve, in addition to the Contingency Reserve identified in Requirement R1, equal to the amount of Operating Reserve–Supplemental q , q p g ppfor any Interchange Transaction designated as part of the Source Balancing Authority’s Operating Reserve–Supplemental or source Reserve Sharing Group’s Operating Reserve–Supplemental, for the entire period of
9
the transaction, except within the first sixty minutes following an event requiring the activation of Contingency Reserves, in accordance with Requirement 3.
BAL-002-WECC-2R4. Each Source Balancing Authority and each source Reserve Sharing
Group shall maintain an amount of Operating Reserve, in addition to the minimum Contingency Reserve amounts identified in Requirement R1, equal to the amount and type of Operating Reserves for any Operating Reserve transactions for which it is the Source Balancing Authority or source Reserve Sharing Group. [Violation
i k i h i i l i iRisk Factor: High] [Time Horizon: Real-time operations]
M4. Each Source Balancing Authority and each source Reserve Sharing Group will have dated documentation that demonstrates it maintained anGroup will have dated documentation that demonstrates it maintained an amount of additional Operating Reserves identified in Requirement R1, greater than or equal to the amount and type of that identified in Requirement 4, for the entire period of the transaction. q , p
10
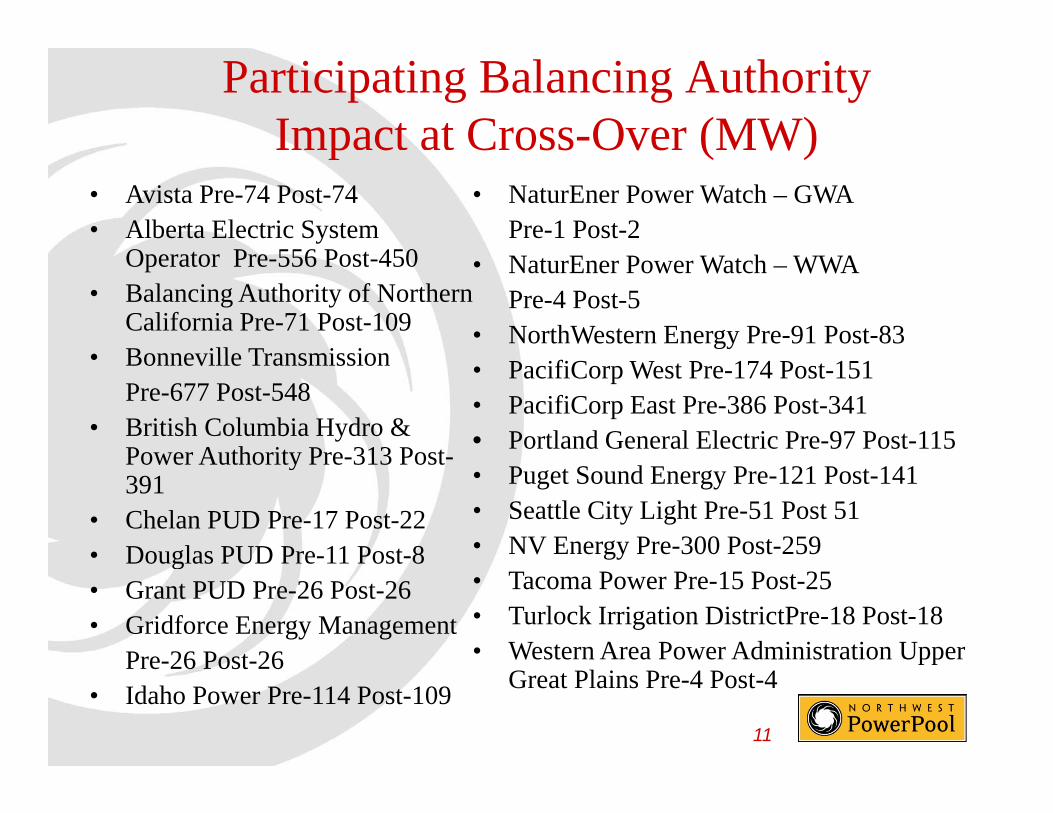
Participating Balancing Authority Impact at Cross-Over (MW)p c C oss Ove ( W)
• NaturEner Power Watch – GWA Pre-1 Post-2
• Avista Pre-74 Post-74• Alberta Electric System
O t P 556 P t 450 • NaturEner Power Watch – WWA Pre-4 Post-5
• NorthWestern Energy Pre-91 Post-83
Operator Pre-556 Post-450• Balancing Authority of Northern
California Pre-71 Post-109• Bonneville Transmission • PacifiCorp West Pre-174 Post-151
• PacifiCorp East Pre-386 Post-341• Portland General Electric Pre-97 Post-115
• Bonneville Transmission Pre-677 Post-548
• British Columbia Hydro & Power Authority Pre-313 Post-
• Puget Sound Energy Pre-121 Post-141• Seattle City Light Pre-51 Post 51• NV Energy Pre-300 Post-259
Power Authority Pre-313 Post-391
• Chelan PUD Pre-17 Post-22• Douglas PUD Pre-11 Post-8
• Tacoma Power Pre-15 Post-25• Turlock Irrigation DistrictPre-18 Post-18• Western Area Power Administration Upper
Douglas PUD Pre 11 Post 8• Grant PUD Pre-26 Post-26• Gridforce Energy Management
Pre-26 Post-26
11
ppGreat Plains Pre-4 Post-4
Pre-26 Post-26• Idaho Power Pre-114 Post-109
BAL-002-WECC-2Impact On system OperatorsImpact On system Operators
The new WECC Standard has no impact on the implementation of requesting or delivery of Assistance Reserve; therefore, no impact on System Operators.
12
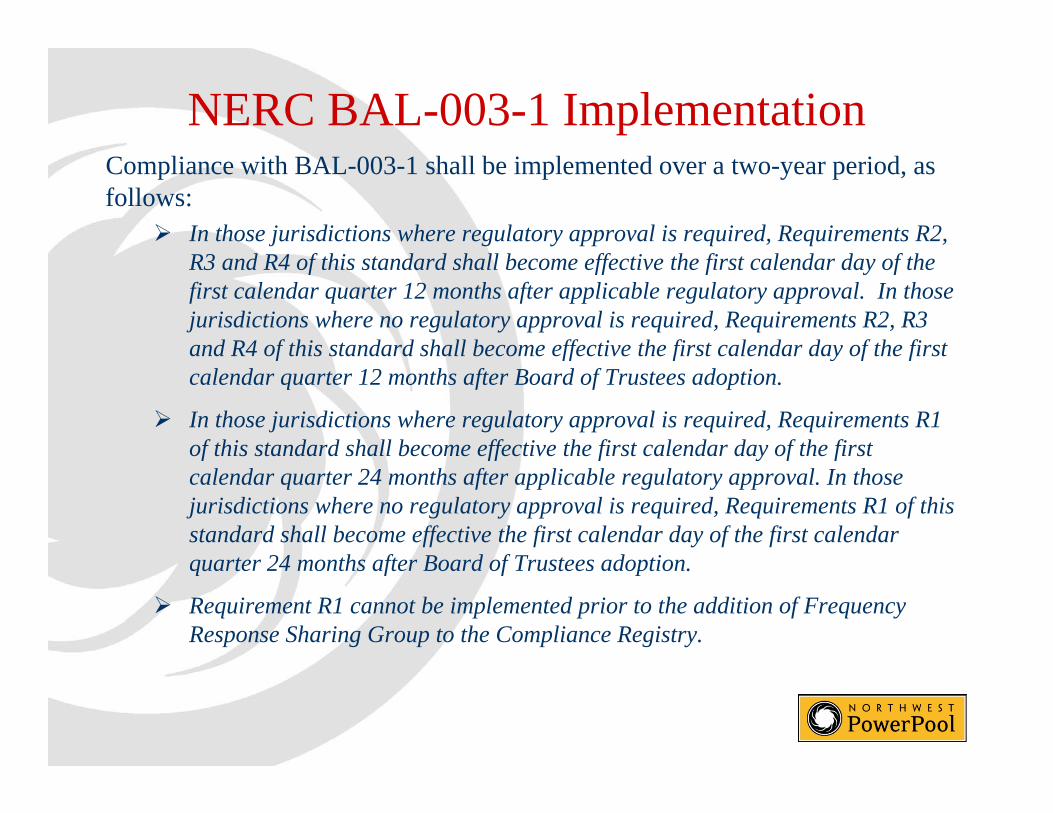
NERC BAL-003-1 ImplementationCompliance with BAL-003-1 shall be implemented over a two-year period, as follows:
In those jurisdictions where regulatory approval is required, Requirements R2, R3 and R4 of this standard shall become effective the first calendar day of the first calendar quarter 12 months after applicable regulatory approval. In those jurisdictions where no regulatory approval is required, Requirements R2, R3 and R4 of this standard shall become effective the first calendar day of the firstand R4 of this standard shall become effective the first calendar day of the first calendar quarter 12 months after Board of Trustees adoption.
In those jurisdictions where regulatory approval is required, Requirements R1 of this standard shall become effective the first calendar day of the first f ff f y f fcalendar quarter 24 months after applicable regulatory approval. In those jurisdictions where no regulatory approval is required, Requirements R1 of this standard shall become effective the first calendar day of the first calendar quarter 24 months after Board of Trustees adoptionquarter 24 months after Board of Trustees adoption.
Requirement R1 cannot be implemented prior to the addition of Frequency Response Sharing Group to the Compliance Registry.
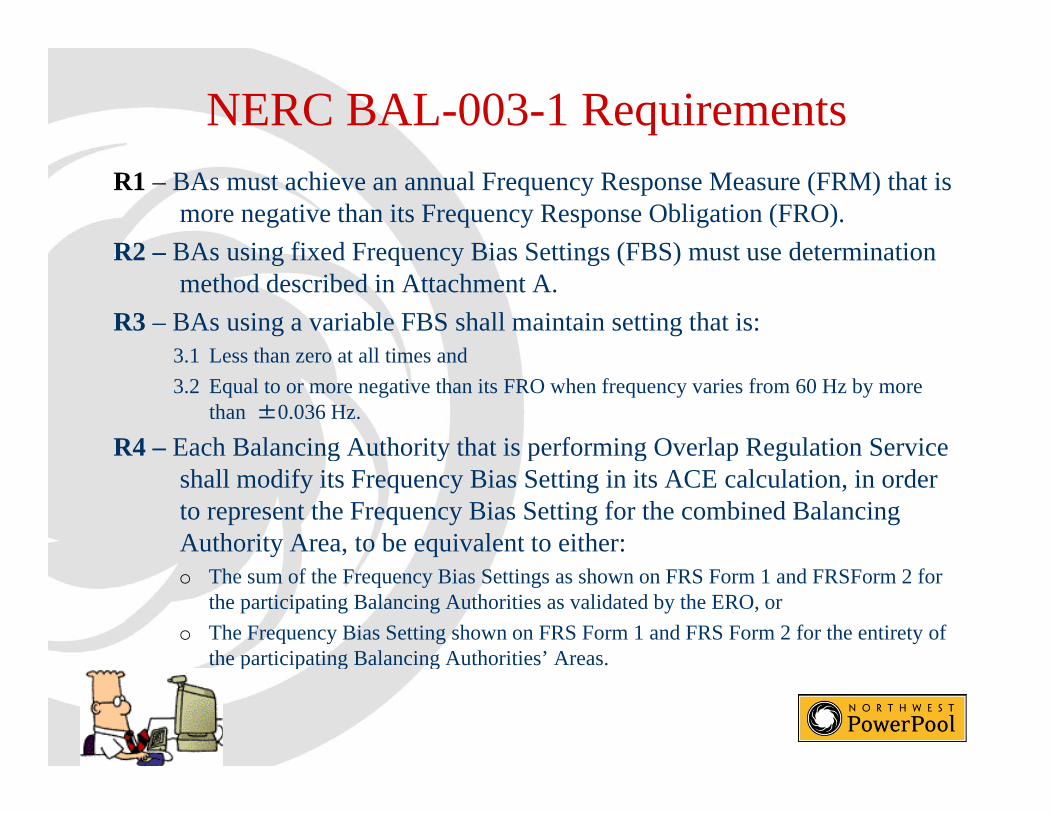
NERC BAL-003-1 RequirementsR1 – BAs must achieve an annual Frequency Response Measure (FRM) that is
more negative than its Frequency Response Obligation (FRO).
R2 BAs using fixed Frequency Bias Settings (FBS) must use determinationR2 – BAs using fixed Frequency Bias Settings (FBS) must use determination method described in Attachment A.
R3 – BAs using a variable FBS shall maintain setting that is: 3 1 Less than zero at all times and3.1 Less than zero at all times and
3.2 Equal to or more negative than its FRO when frequency varies from 60 Hz by more than ±0.036 Hz.
R4 – Each Balancing Authority that is performing Overlap Regulation Service g y p g p gshall modify its Frequency Bias Setting in its ACE calculation, in order to represent the Frequency Bias Setting for the combined Balancing Authority Area, to be equivalent to either: o The sum of the Frequency Bias Settings as shown on FRS Form 1 and FRSForm 2 for
the participating Balancing Authorities as validated by the ERO, or
o The Frequency Bias Setting shown on FRS Form 1 and FRS Form 2 for the entirety of the participating Balancing Authorities’ Areas.the participating Balancing Authorities Areas.
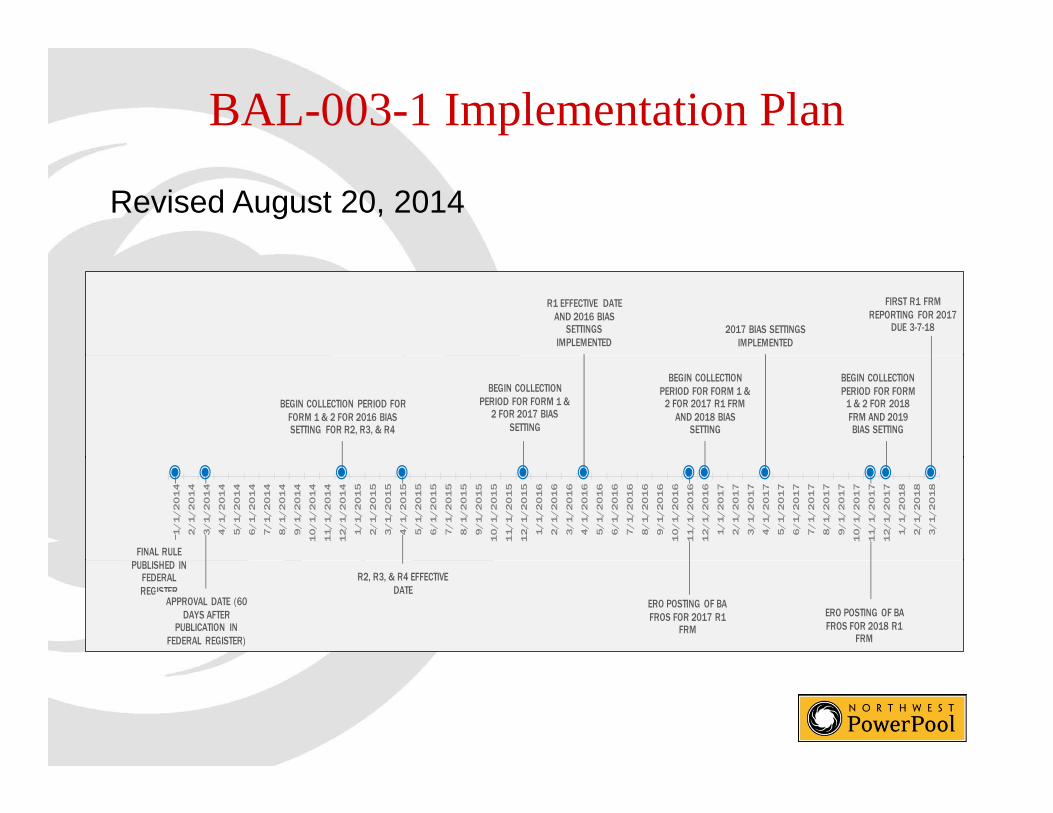
BAL-003-1 Implementation Plan
Revised August 20, 2014
R1 EFFECTIVE DATE AND 2016 BIAS
SETTINGS IMPLEMENTED
2017 BIAS SETTINGS IMPLEMENTED
FIRST R1 FRM REPORTING FOR 2017
DUE 3-7-18
BEGIN COLLECTION PERIOD FOR FORM 1 & 2 FOR 2016 BIAS SETTING FOR R2, R3, & R4
BEGIN COLLECTION PERIOD FOR FORM 1 &
2 FOR 2017 BIAS SETTING
BEGIN COLLECTION PERIOD FOR FORM 1 &
2 FOR 2017 R1 FRM AND 2018 BIAS
SETTING
BEGIN COLLECTION PERIOD FOR FORM
1 & 2 FOR 2018 FRM AND 2019 BIAS SETTING
FINAL RULE
1/
1/
20
14
2/
1/
20
14
3/
1/
20
14
4/
1/
20
14
5/
1/
20
14
6/
1/
20
14
7/
1/
20
14
8/
1/
20
14
9/
1/
20
14
10
/1
/2
01
4
11
/1
/2
01
4
12
/1
/2
01
4
1/
1/
20
15
2/
1/
20
15
3/
1/
20
15
4/
1/
20
15
5/
1/
20
15
6/
1/
20
15
7/
1/
20
15
8/
1/
20
15
9/
1/
20
15
10
/1
/2
01
5
11
/1
/2
01
5
12
/1
/2
01
5
1/
1/
20
16
2/
1/
20
16
3/
1/
20
16
4/
1/
20
16
5/
1/
20
16
6/
1/
20
16
7/
1/
20
16
8/
1/
20
16
9/
1/
20
16
10
/1
/2
01
6
11
/1
/2
01
6
12
/1
/2
01
6
1/
1/
20
17
2/
1/
20
17
3/
1/
20
17
4/
1/
20
17
5/
1/
20
17
6/
1/
20
17
7/
1/
20
17
8/
1/
20
17
9/
1/
20
17
10
/1
/2
01
7
11
/1
/2
01
7
12
/1
/2
01
7
1/
1/
20
18
2/
1/
20
18
3/
1/
20
18
PUBLISHED IN FEDERAL REGISTER
APPROVAL DATE (60 DAYS AFTER
PUBLICATION IN FEDERAL REGISTER)
R2, R3, & R4 EFFECTIVE DATE
ERO POSTING OF BA FROS FOR 2017 R1
FRM
ERO POSTING OF BA FROS FOR 2018 R1
FRM

QUESTIONS?QUESTIONS?

CAISO‐PacifiCorp EIM Update NWPP ATF System Schedulers Meeting
October 2014
NWPP ATF‐System Schedulers Meeting
AgendaAgendaAgendaAgenda
• Why EIM and Why CAISOWhy EIM and Why CAISO
– Benefits
• Project implementation statusj p
• How the EIM works
• CAISO Advanced Real‐Time MarketCAISO Advanced Real Time Market
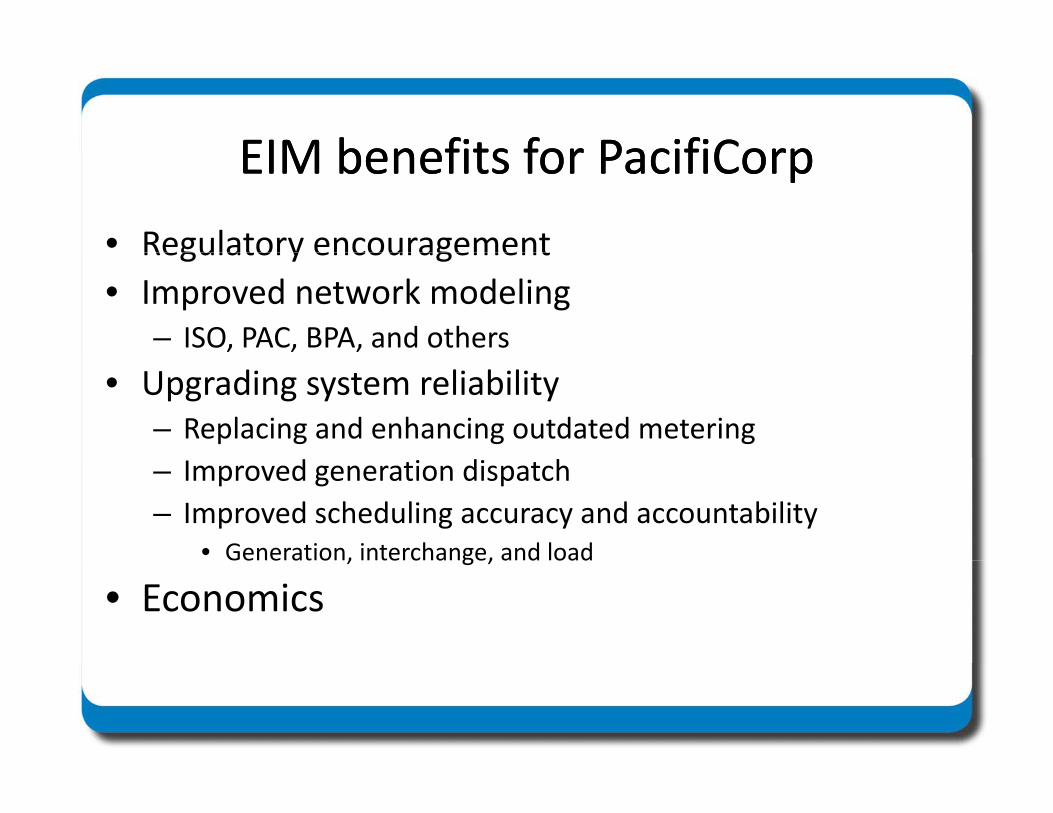
EIM benefits for PacifiCorpEIM benefits for PacifiCorpEIM benefits for PacifiCorpEIM benefits for PacifiCorp
• Regulatory encouragementRegulatory encouragement
• Improved network modeling– ISO, PAC, BPA, and others
• Upgrading system reliability– Replacing and enhancing outdated metering
– Improved generation dispatch
– Improved scheduling accuracy and accountability• Generation, interchange, and loade e a o , e c a ge, a d oad
• Economics
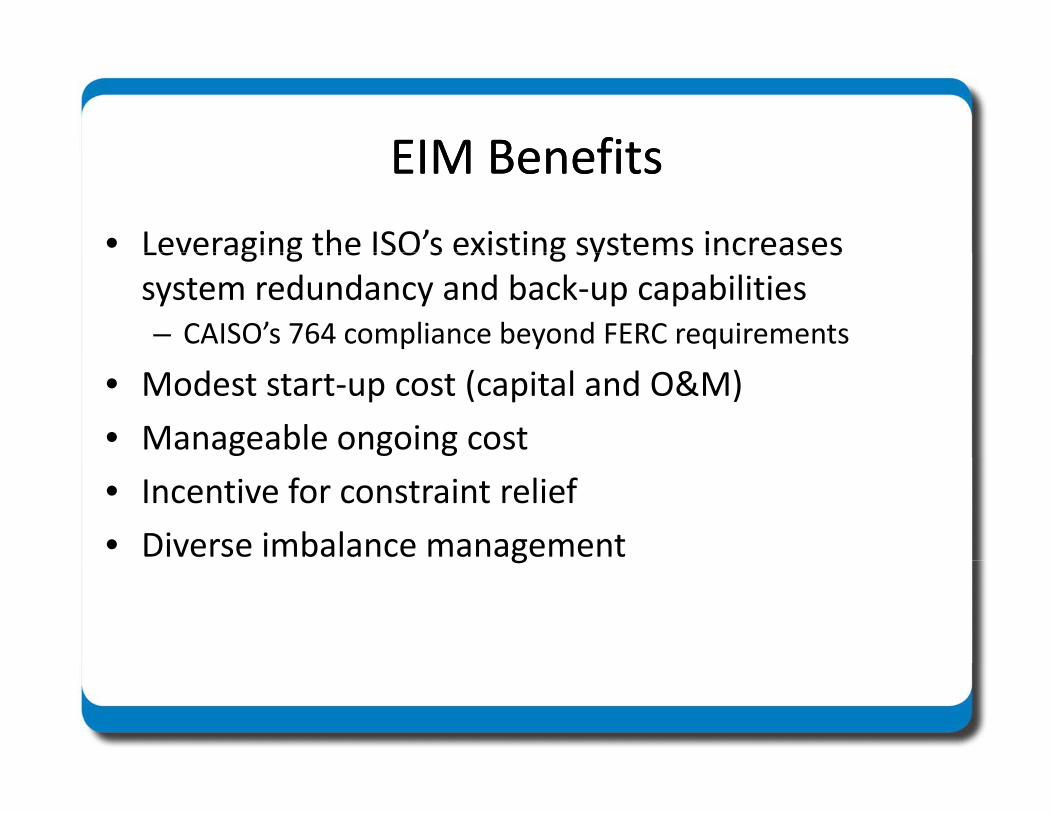
EIM BenefitsEIM BenefitsEIM BenefitsEIM Benefits
• Leveraging the ISO’s existing systems increasesLeveraging the ISO s existing systems increases system redundancy and back‐up capabilities– CAISO’s 764 compliance beyond FERC requirements
• Modest start‐up cost (capital and O&M)
• Manageable ongoing cost
• Incentive for constraint relief
• Diverse imbalance managementg
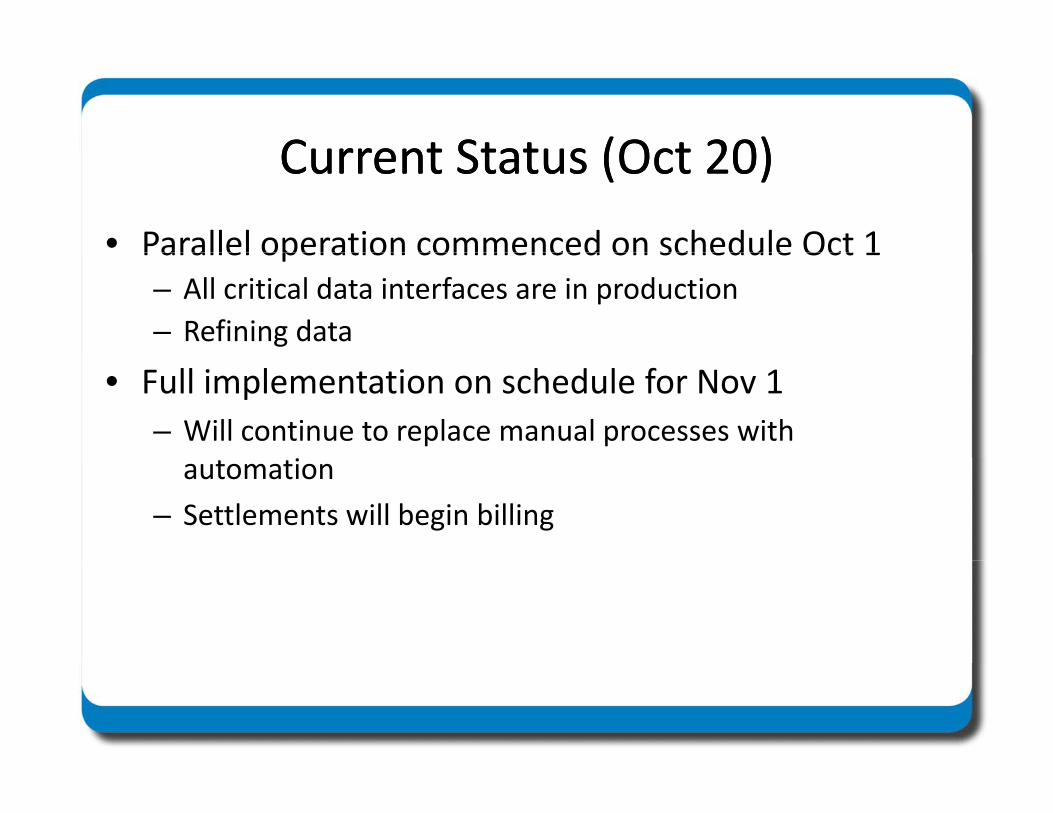
Current Status (Oct 20)Current Status (Oct 20)Current Status (Oct 20)Current Status (Oct 20)
• Parallel operation commenced on schedule Oct 1Parallel operation commenced on schedule Oct 1– All critical data interfaces are in production
– Refining data
• Full implementation on schedule for Nov 1
– Will continue to replace manual processes with automation
– Settlements will begin billing
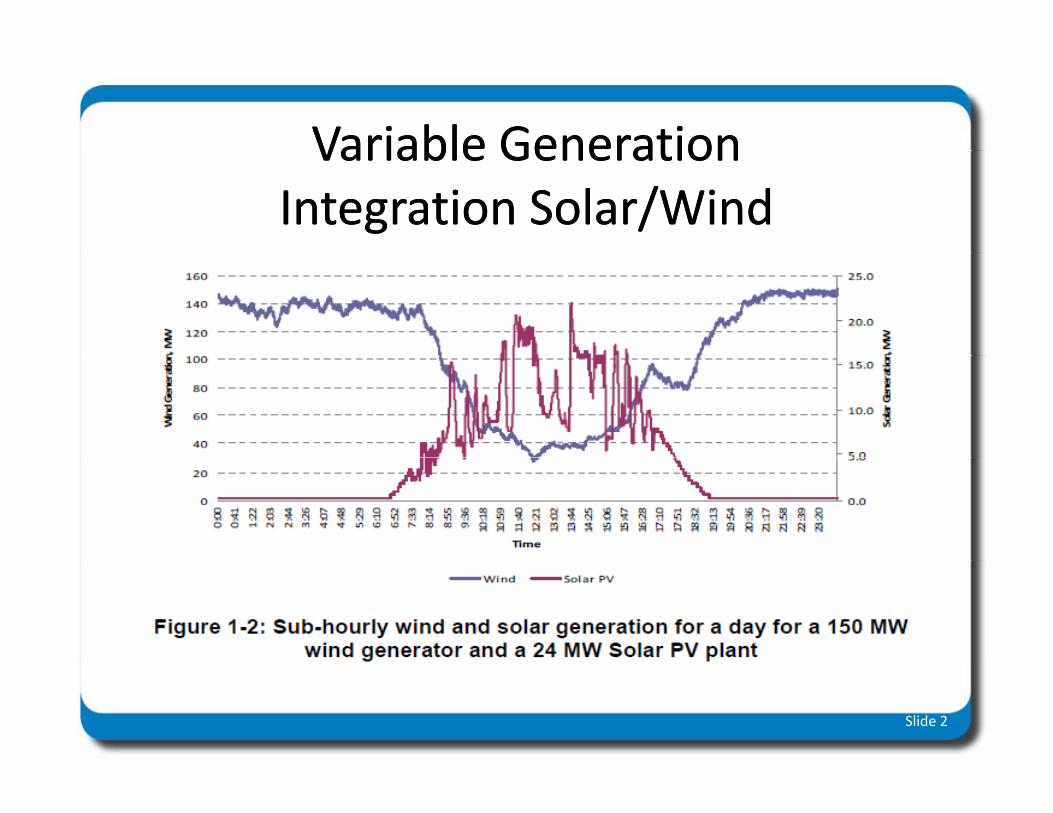
Variable GenerationVariable GenerationVariable GenerationVariable GenerationIntegration Solar/WindIntegration Solar/Wind
Slide 2
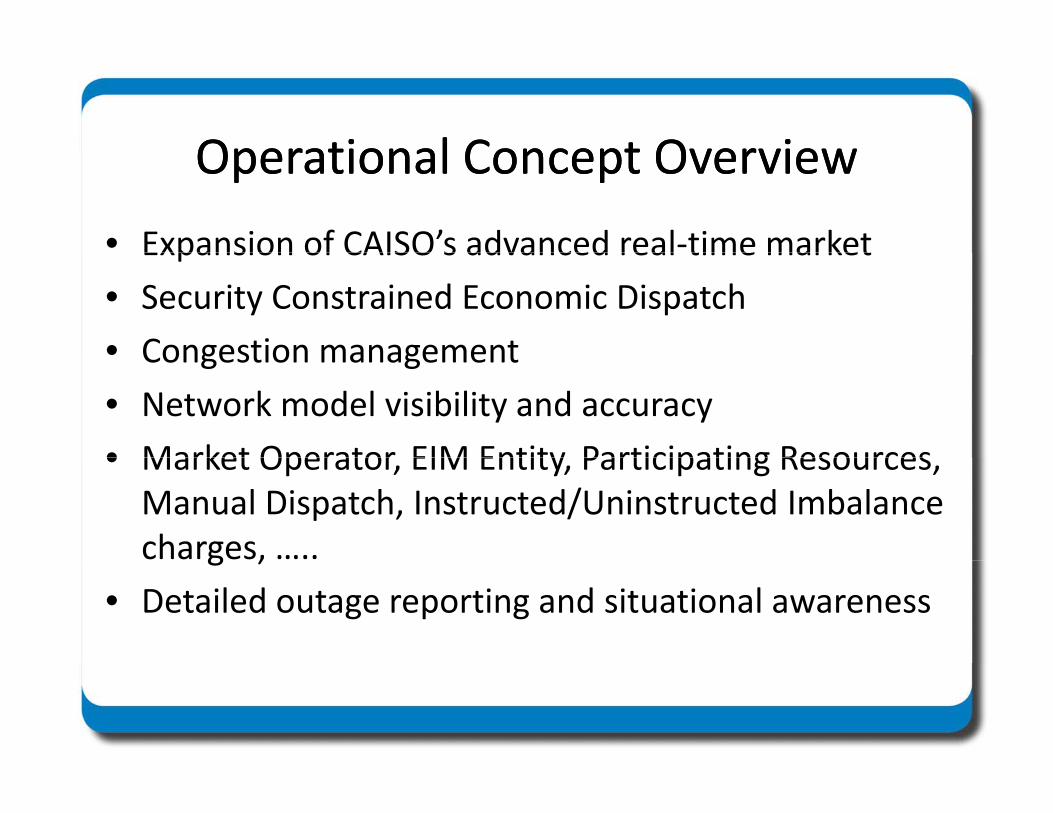
Operational Concept OverviewOperational Concept OverviewOperational Concept OverviewOperational Concept Overview
• Expansion of CAISO’s advanced real‐time marketExpansion of CAISO s advanced real time market
• Security Constrained Economic Dispatch
• Congestion managementCongestion management
• Network model visibility and accuracy
• Market Operator EIM Entity Participating Resources• Market Operator, EIM Entity, Participating Resources, Manual Dispatch, Instructed/Uninstructed Imbalance charges, …..g ,
• Detailed outage reporting and situational awareness
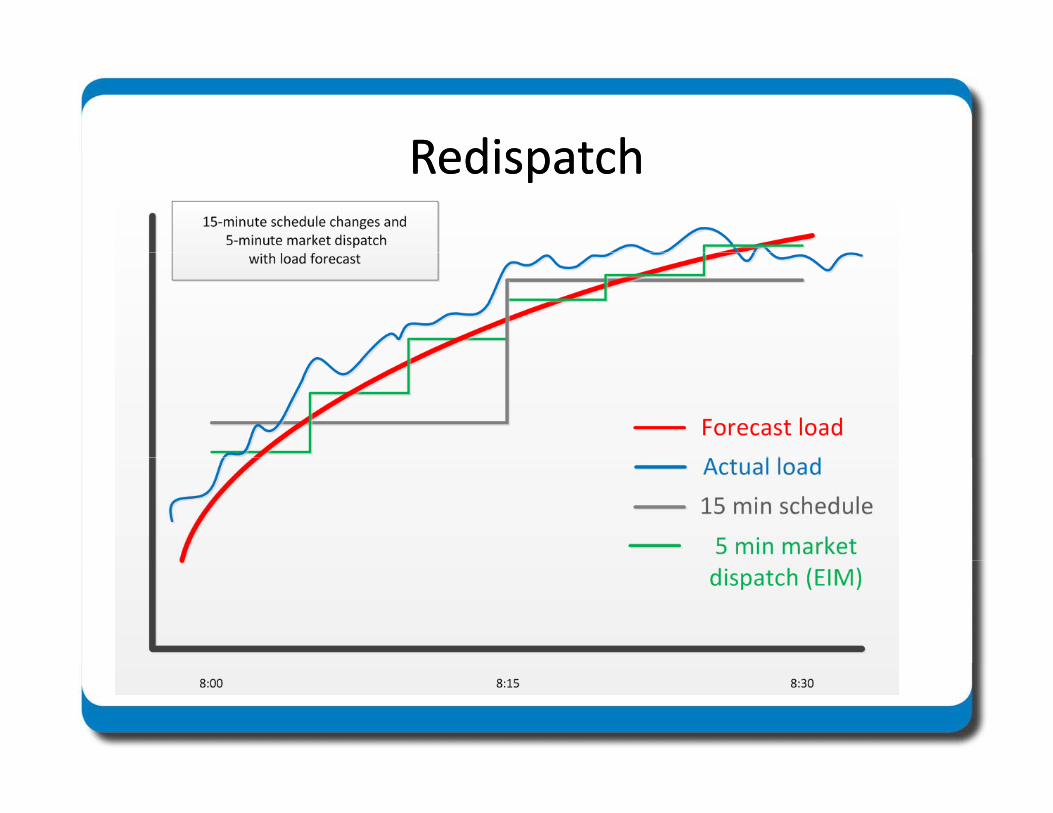
RedispatchRedispatchRedispatchRedispatch
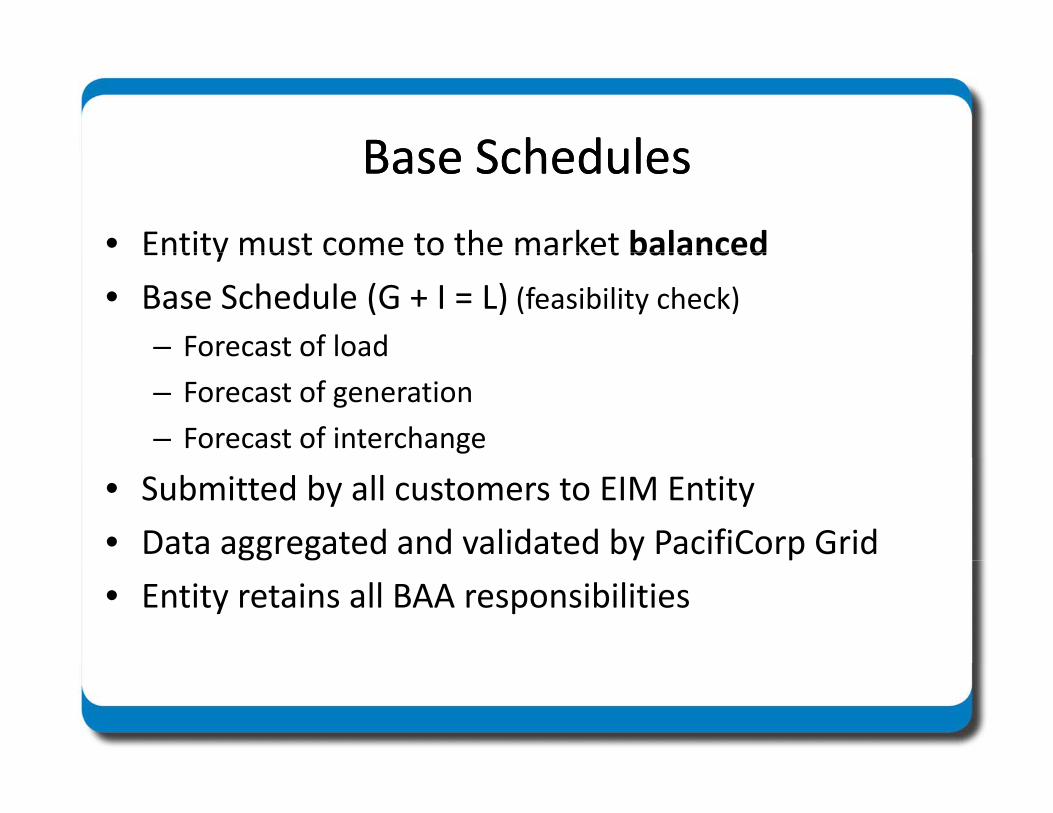
Base SchedulesBase SchedulesBase SchedulesBase Schedules
• Entity must come to the market balancedEntity must come to the market balanced• Base Schedule (G + I = L) (feasibility check)
– Forecast of loadForecast of load
– Forecast of generation
– Forecast of interchange
• Submitted by all customers to EIM Entity
• Data aggregated and validated by PacifiCorp Grid
• Entity retains all BAA responsibilities
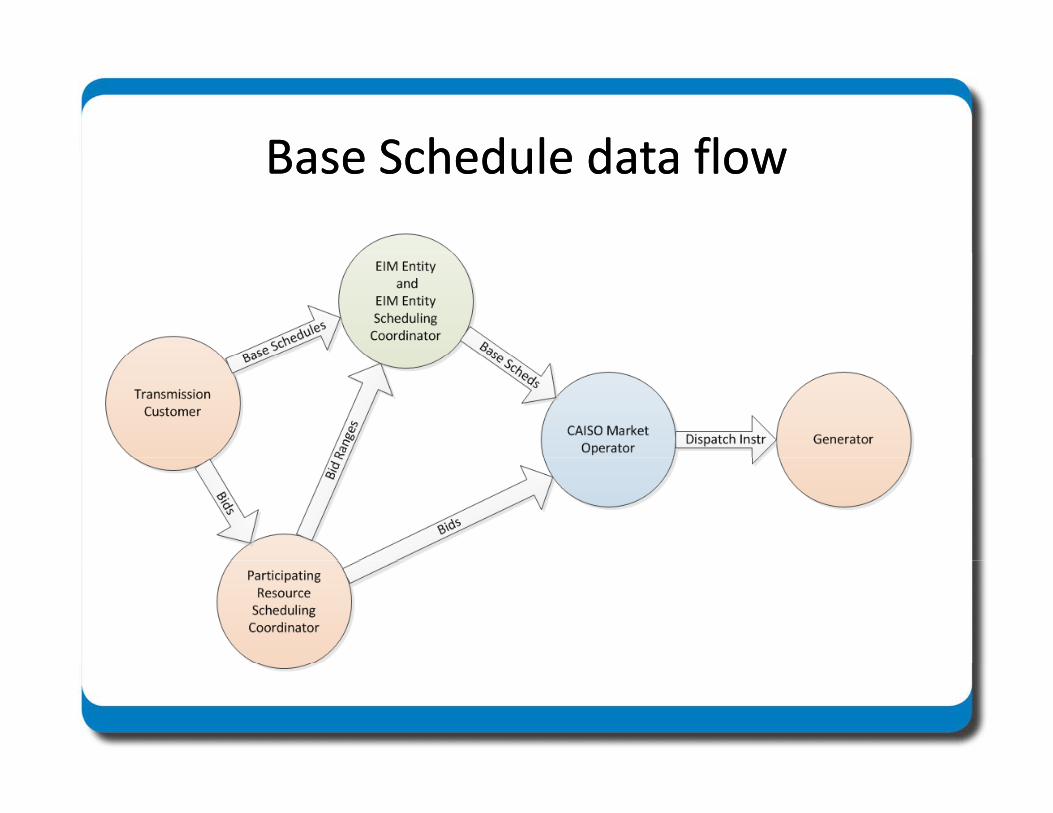
Base Schedule data flowBase Schedule data flowBase Schedule data flowBase Schedule data flow
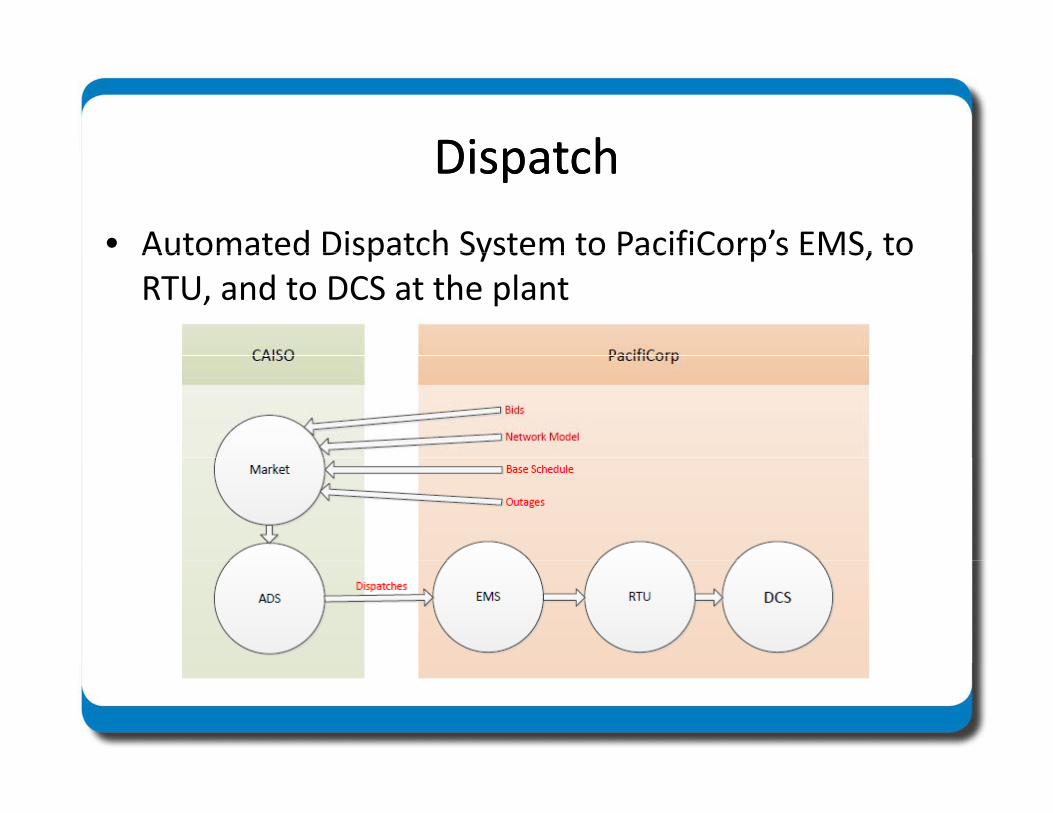
DispatchDispatchDispatchDispatch
• Automated Dispatch System to PacifiCorp’s EMS, toAutomated Dispatch System to PacifiCorp s EMS, to RTU, and to DCS at the plant
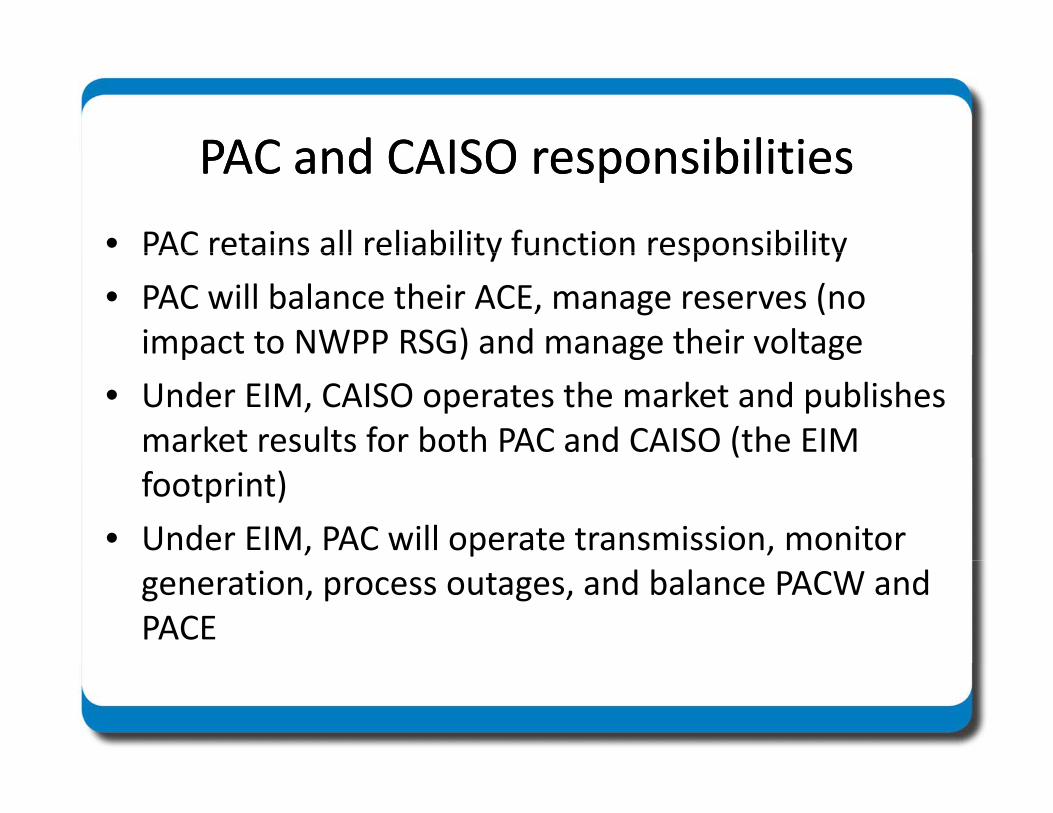
PAC and CAISO responsibilitiesPAC and CAISO responsibilitiesPAC and CAISO responsibilitiesPAC and CAISO responsibilities
• PAC retains all reliability function responsibilityPAC retains all reliability function responsibility
• PAC will balance their ACE, manage reserves (no impact to NWPP RSG) and manage their voltage p ) g g
• Under EIM, CAISO operates the market and publishes market results for both PAC and CAISO (the EIM footprint)
• Under EIM, PAC will operate transmission, monitor generation, process outages, and balance PACW and PACE
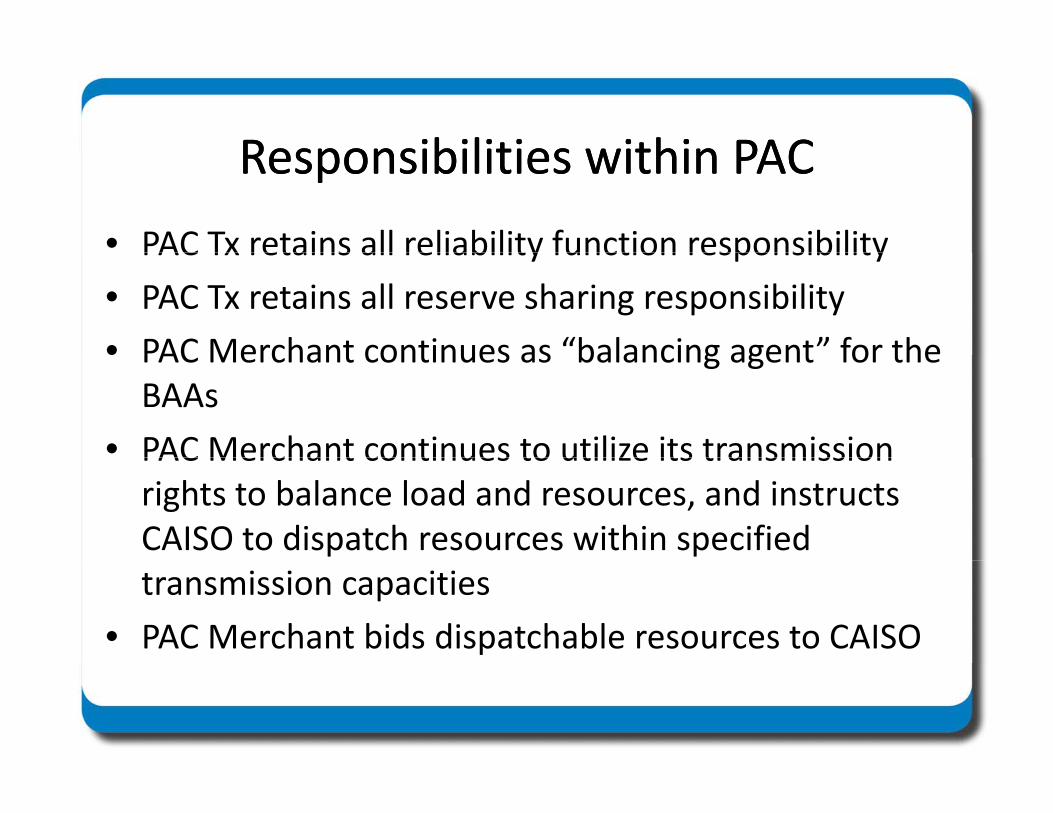
Responsibilities within PACResponsibilities within PACResponsibilities within PACResponsibilities within PAC
• PAC Tx retains all reliability function responsibilityPAC Tx retains all reliability function responsibility
• PAC Tx retains all reserve sharing responsibility
• PAC Merchant continues as “balancing agent” for thePAC Merchant continues as balancing agent for the BAAs
• PAC Merchant continues to utilize its transmissionPAC Merchant continues to utilize its transmission rights to balance load and resources, and instructs CAISO to dispatch resources within specified transmission capacities
• PAC Merchant bids dispatchable resources to CAISO
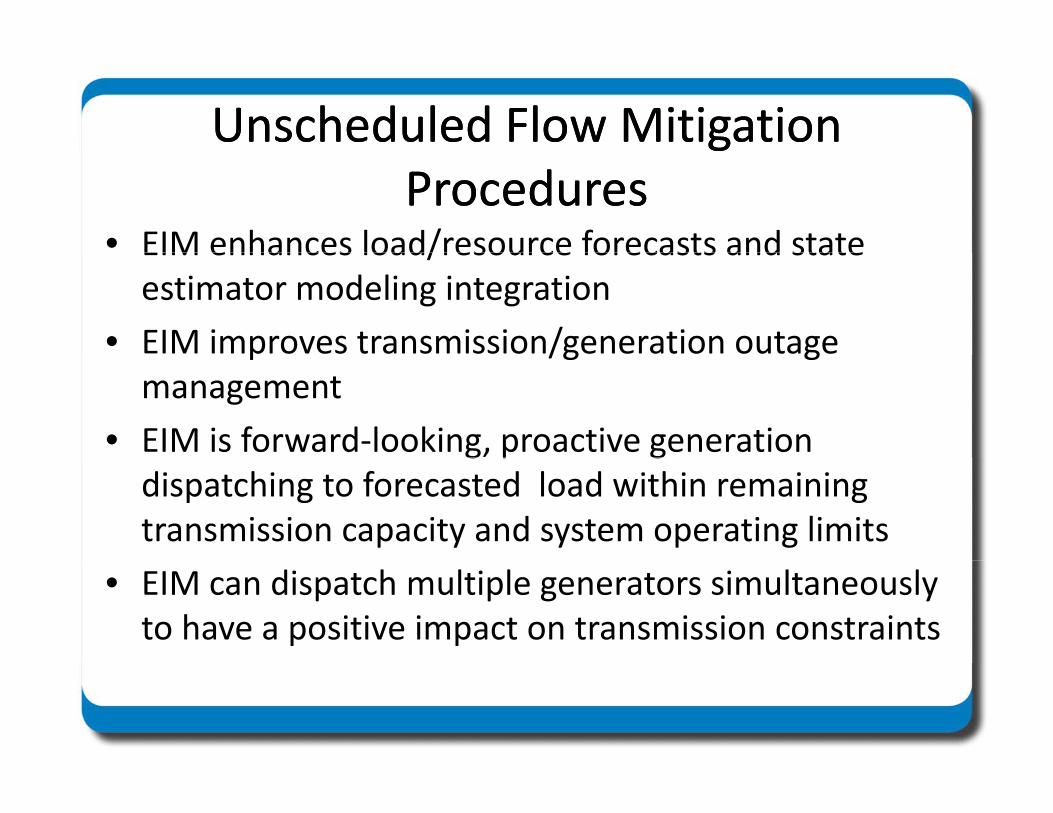
Unscheduled Flow Mitigation Unscheduled Flow Mitigation ggProceduresProcedures
• EIM enhances load/resource forecasts and stateEIM enhances load/resource forecasts and state estimator modeling integration
• EIM improves transmission/generation outage p /g gmanagement
• EIM is forward‐looking, proactive generation g p gdispatching to forecasted load within remaining transmission capacity and system operating limits
• EIM can dispatch multiple generators simultaneously to have a positive impact on transmission constraints
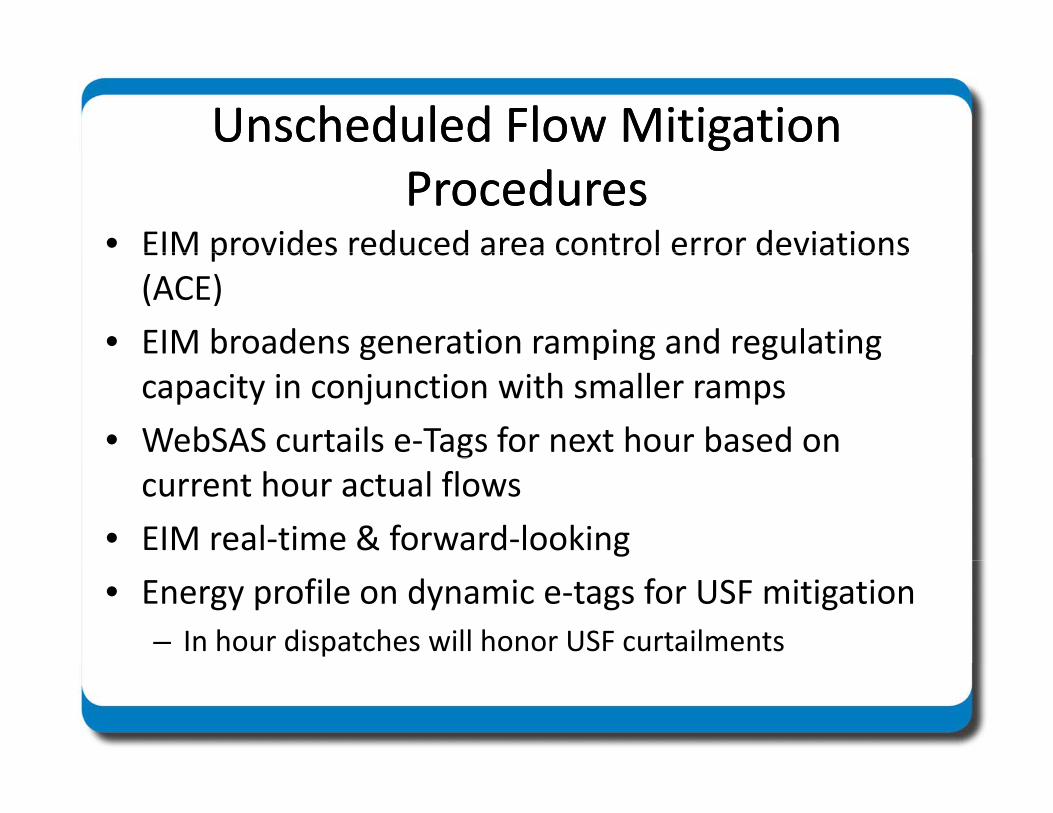
Unscheduled Flow Mitigation Unscheduled Flow Mitigation ggProceduresProcedures
• EIM provides reduced area control error deviationsEIM provides reduced area control error deviations (ACE)
• EIM broadens generation ramping and regulating g p g g gcapacity in conjunction with smaller ramps
• WebSAS curtails e‐Tags for next hour based on gcurrent hour actual flows
• EIM real‐time & forward‐looking
• Energy profile on dynamic e‐tags for USF mitigation
– In hour dispatches will honor USF curtailments
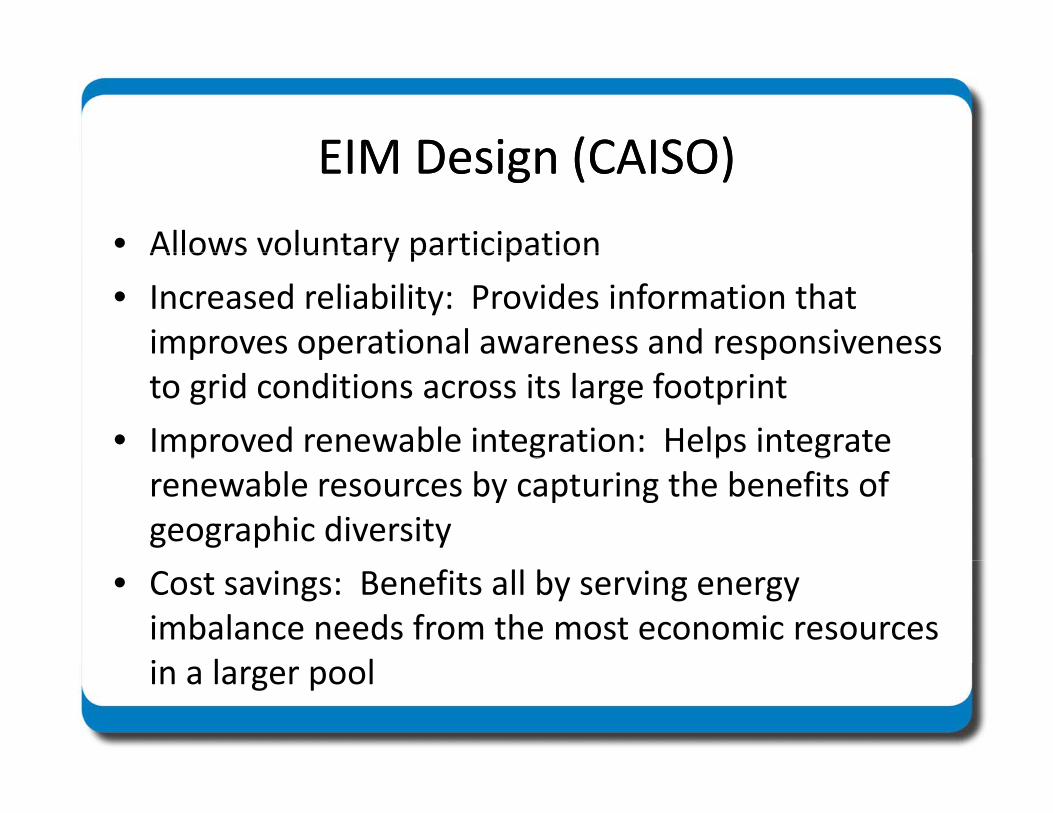
EIM Design (CAISO)EIM Design (CAISO)EIM Design (CAISO)EIM Design (CAISO)
• Allows voluntary participationAllows voluntary participation
• Increased reliability: Provides information that improves operational awareness and responsiveness p p pto grid conditions across its large footprint
• Improved renewable integration: Helps integrate p g p grenewable resources by capturing the benefits of geographic diversity
• Cost savings: Benefits all by serving energy imbalance needs from the most economic resources i l lin a larger pool
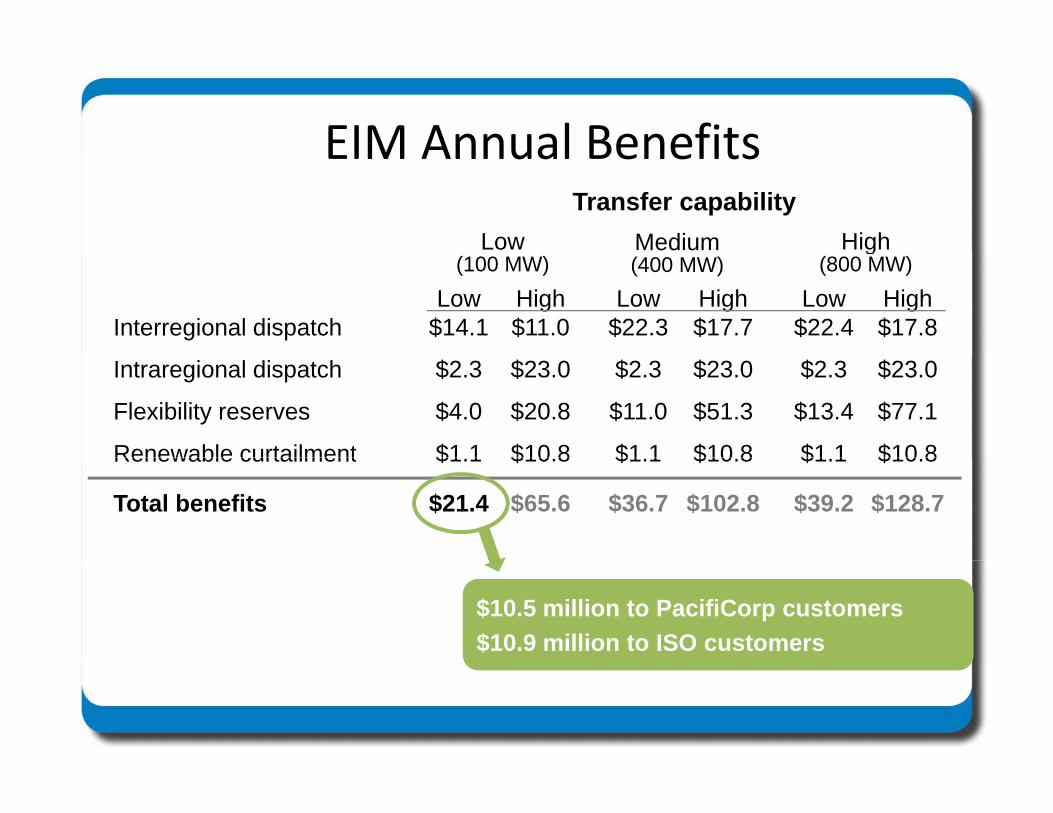
EIM Annual BenefitsEIM Annual BenefitsTransfer capability
Low Medium High
Low$14.1
High$11.0
Low$22.3
High$17.7
Low$22.4
High$17.8
(100 MW) (400 MW)
Interregional dispatch
g(800 MW)
$2.3
$4.0
$1 1
$23.0
$20.8
$10 8
$2.3
$11.0
$1 1
$23.0
$51.3
$10 8
$2.3
$13.4
$1 1
$23.0
$77.1
$10 8
Intraregional dispatch
Flexibility reserves
Renewable curtailment $1.1
$21.4
$10.8
$65.6
$1.1
$36.7
$10.8
$102.8
$1.1
$39.2
$10.8
$128.7
Renewable curtailment
Total benefits
$10.5 million to PacifiCorp customers $10.9 million to ISO customers
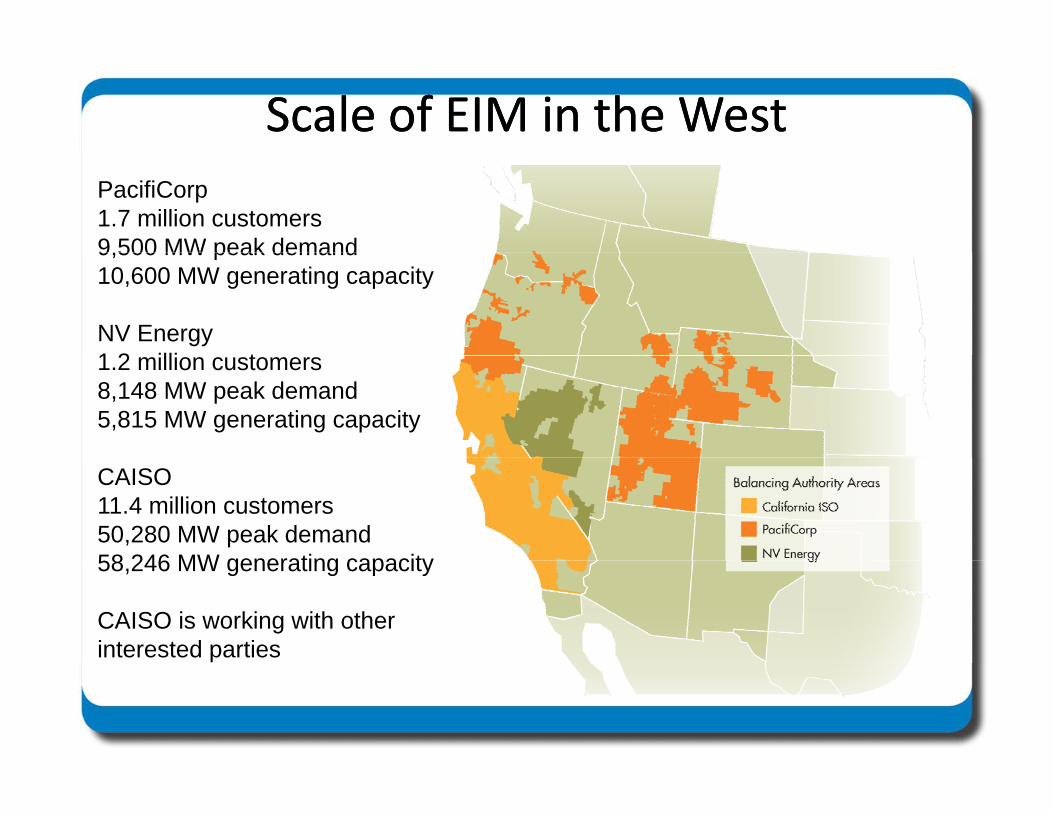
Scale of EIM in the WestScale of EIM in the WestPacifiCorp1.7 million customers 9,500 MW peak demand9,500 MW peak demand10,600 MW generating capacity
NV Energy1 2 illi t1.2 million customers8,148 MW peak demand5,815 MW generating capacity
CAISO11.4 million customers50,280 MW peak demand58 246 MW generating capacity58,246 MW generating capacity
CAISO is working with other interested parties
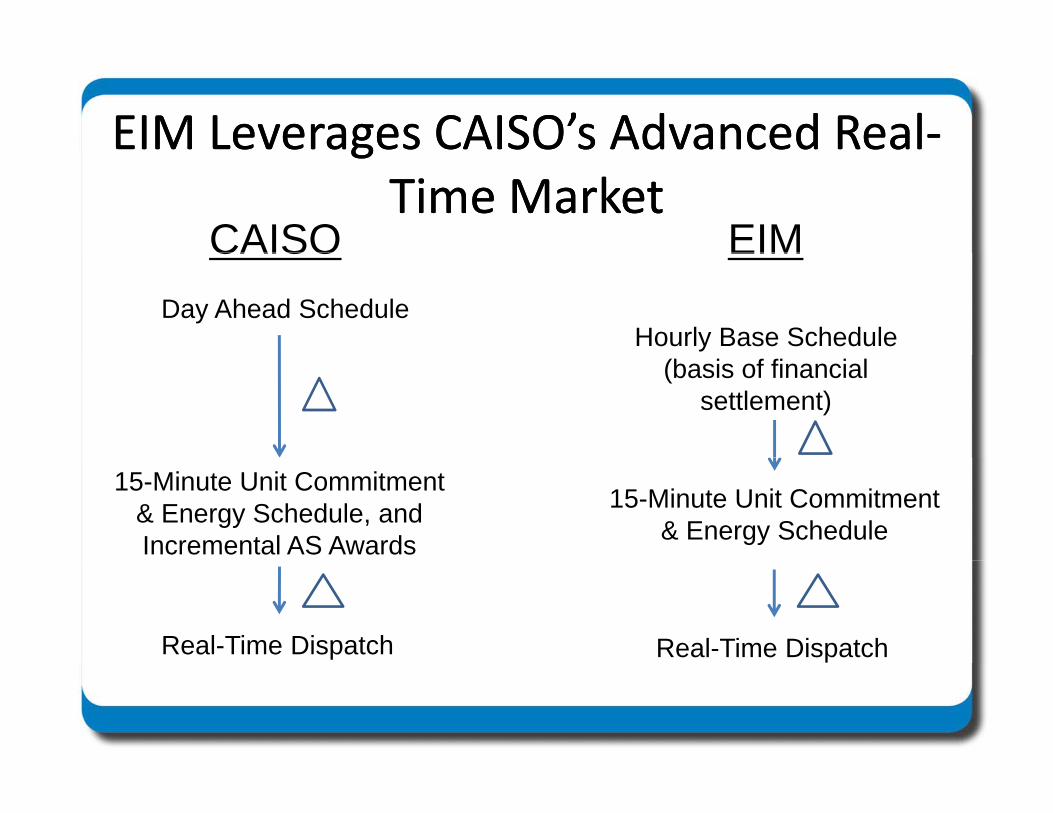
EIM Leverages CAISO’s Advanced RealEIM Leverages CAISO’s Advanced Real‐‐ggTime MarketTime Market
CAISO EIMCAISO EIM
Day Ahead Schedule Hourly Base Schedule
(basis of financialsettlement)
15-Minute Unit Commitment & Energy Schedule, and Incremental AS Awards
15-Minute Unit Commitment & Energy Schedule
Real-Time Dispatch Real-Time Dispatch
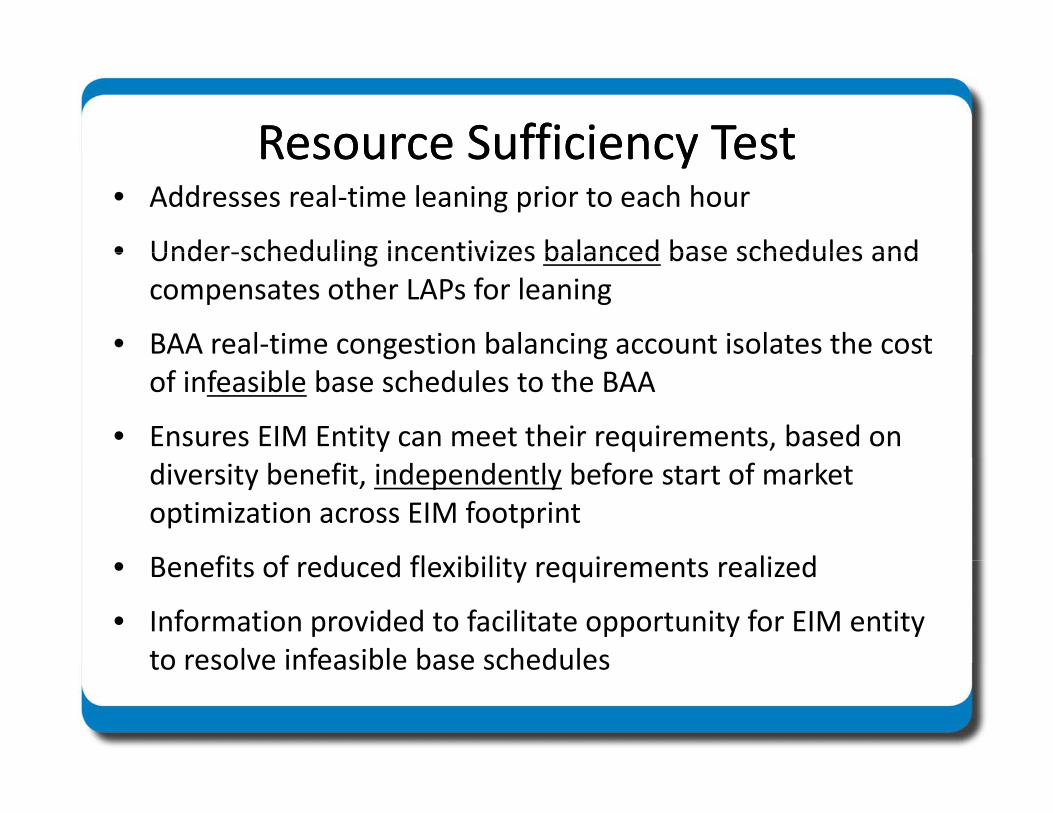
ResourceResource SSufficiency Testufficiency TestResource Resource SSufficiency Testufficiency Test• Addresses real‐time leaning prior to each hour
• Under‐scheduling incentivizes balanced base schedules and• Under‐scheduling incentivizes balanced base schedules and compensates other LAPs for leaning
• BAA real‐time congestion balancing account isolates the cost g gof infeasible base schedules to the BAA
• Ensures EIM Entity can meet their requirements, based on diversity benefit, independently before start of market optimization across EIM footprint
B fit f d d fl ibilit i t li d• Benefits of reduced flexibility requirements realized
• Information provided to facilitate opportunity for EIM entity to resolve infeasible base schedulesto resolve infeasible base schedules
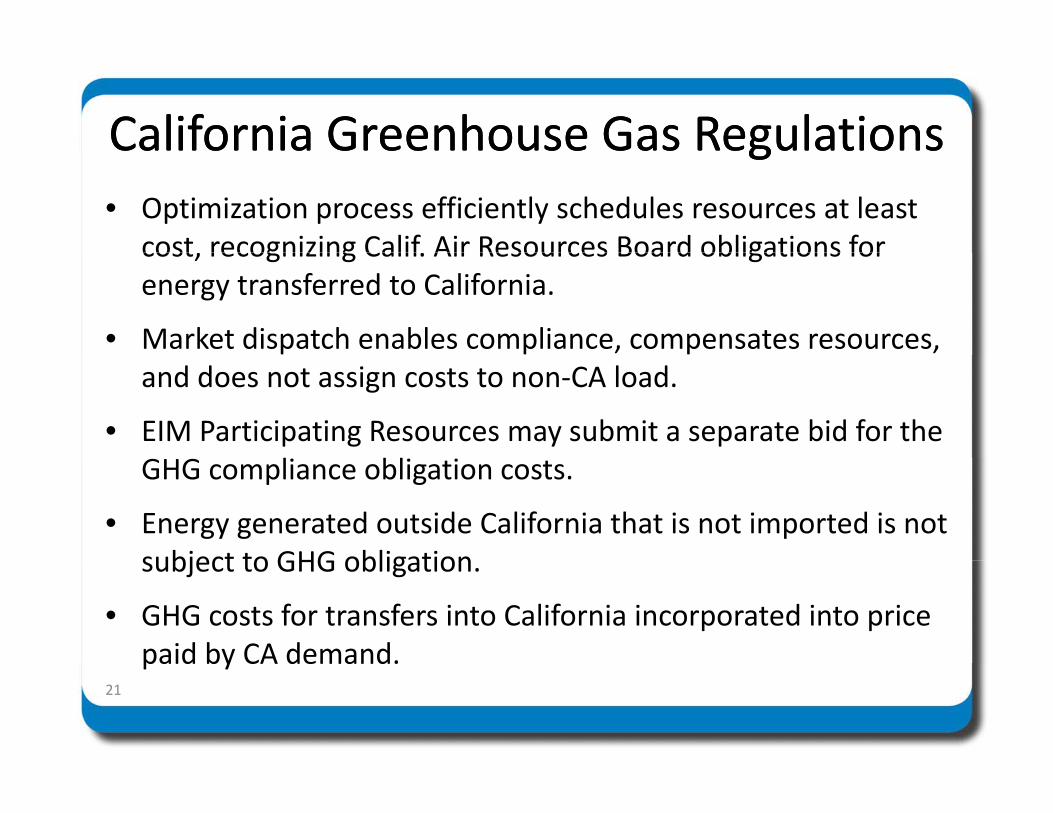
California California GGreenhouse reenhouse GGas as RRegulationsegulationsCaliforniaCalifornia GGreenhousereenhouse GGasas RRegulationsegulations
• Optimization process efficiently schedules resources at least cost recognizing Calif Air Resources Board obligations forcost, recognizing Calif. Air Resources Board obligations for energy transferred to California.
• Market dispatch enables compliance, compensates resources, and does not assign costs to non‐CA load.
• EIM Participating Resources may submit a separate bid for the l blGHG compliance obligation costs.
• Energy generated outside California that is not imported is not subject to GHG obligationsubject to GHG obligation.
• GHG costs for transfers into California incorporated into price paid by CA demand.paid by CA demand.
21
Energy Imbalance Market SummaryEnergy Imbalance Market Summarygy ygy y
• EIM provides reliability and financial benefits to p yCalifornia, EIM participants, and the West
• CAISO implementation is based on its existing• CAISO implementation is based on its existing platform to provide a flexible and scalable approach, at low cost, to other balancing authoritiesat o cost, to ot e ba a c g aut o t es
• EIM implementation helps facilitate renewable i t ti th W tintegration across the West
22
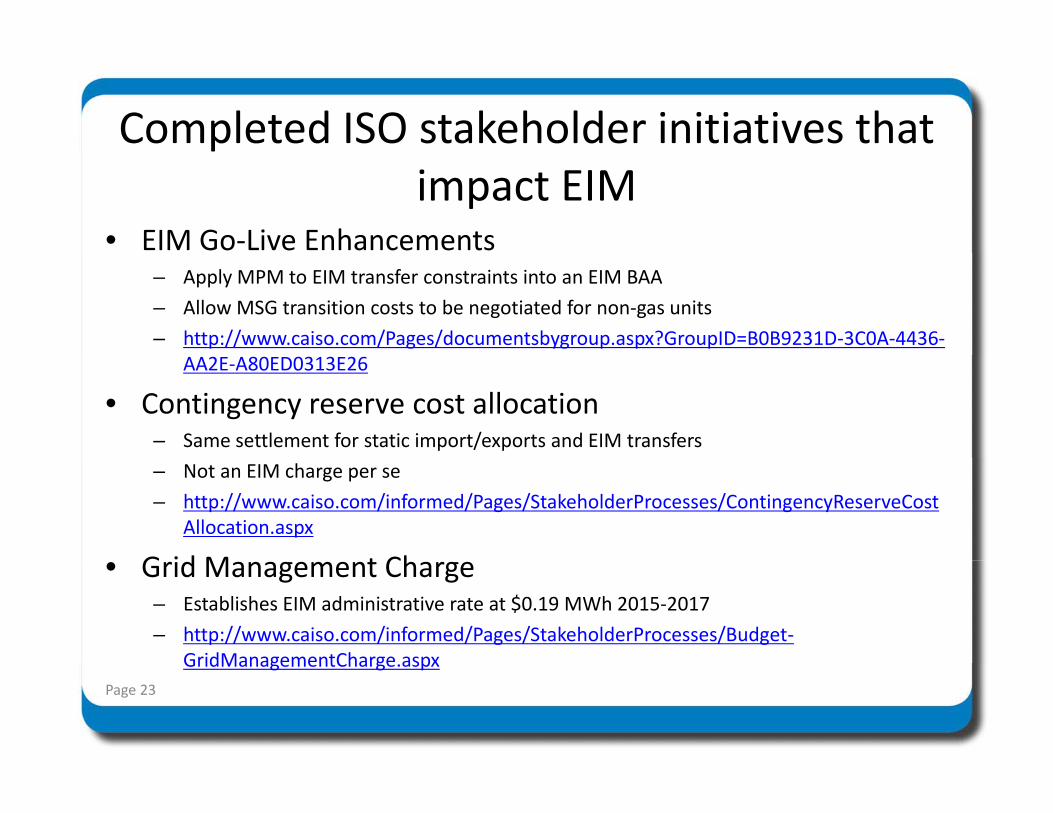
Completed ISO stakeholder initiatives that pimpact EIM
• EIM Go‐Live Enhancements– Apply MPM to EIM transfer constraints into an EIM BAA
– Allow MSG transition costs to be negotiated for non‐gas units
– http://www.caiso.com/Pages/documentsbygroup.aspx?GroupID=B0B9231D‐3C0A‐4436‐AA2E‐A80ED0313E26
• Contingency reserve cost allocation– Same settlement for static import/exports and EIM transfers
– Not an EIM charge per se
– http://www.caiso.com/informed/Pages/StakeholderProcesses/ContingencyReserveCostAllocation.aspx
G id M t Ch• Grid Management Charge– Establishes EIM administrative rate at $0.19 MWh 2015‐2017
– http://www.caiso.com/informed/Pages/StakeholderProcesses/Budget‐GridManagementCharge aspxGridManagementCharge.aspx
Page 23
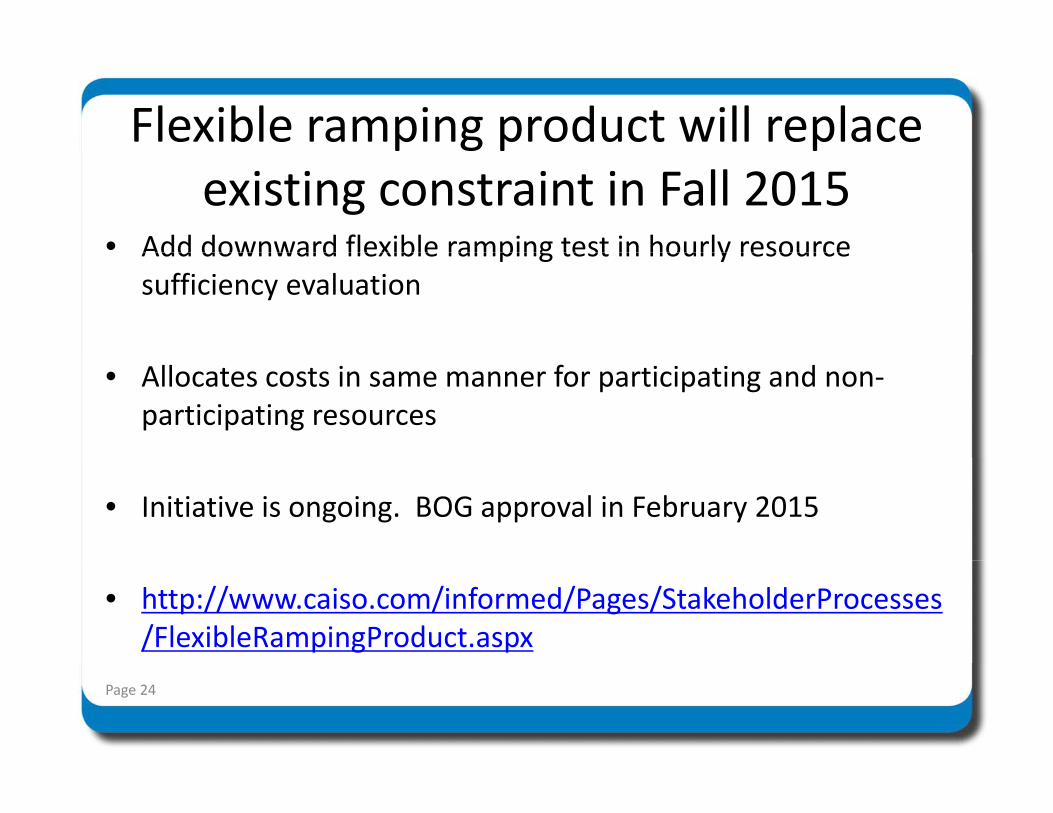
Flexible ramping product will replace p g p pexisting constraint in Fall 2015
• Add downward flexible ramping test in hourly resourceAdd downward flexible ramping test in hourly resource sufficiency evaluation
• Allocates costs in same manner for participating and non‐participating resources
• Initiative is ongoing. BOG approval in February 2015
• http://www.caiso.com/informed/Pages/StakeholderProcesses/FlexibleRampingProduct.aspx
Page 24
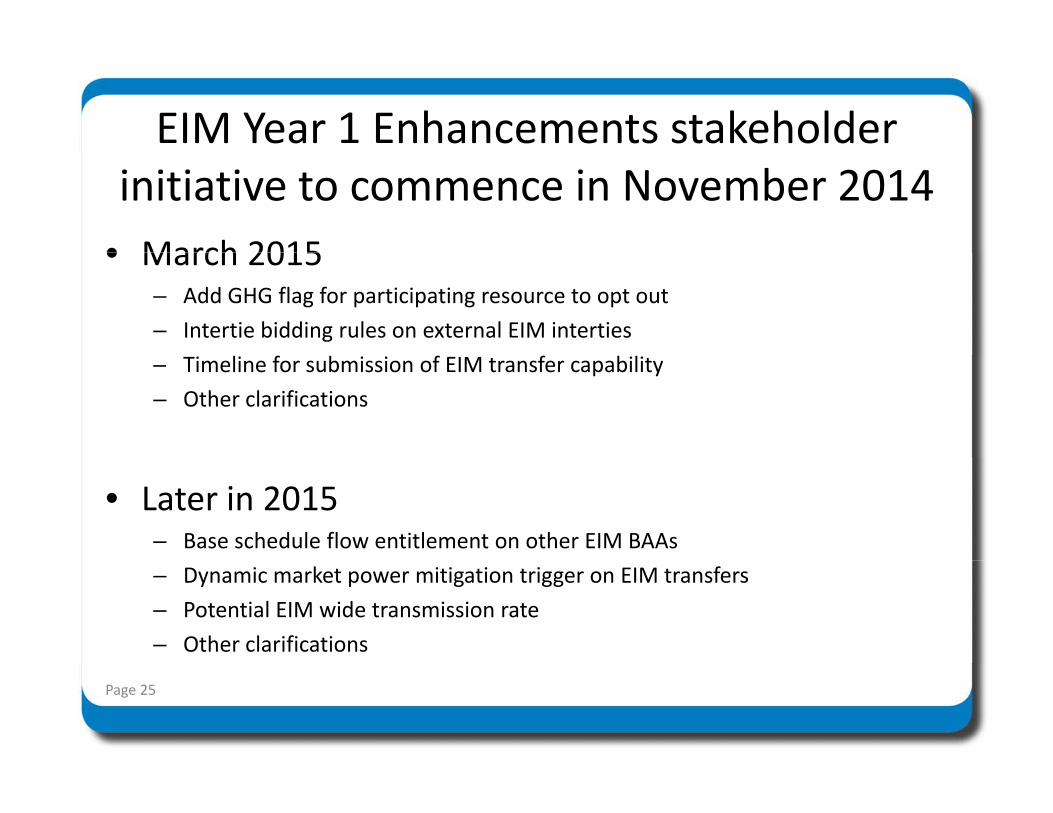
EIM Year 1 Enhancements stakeholder initiative to commence in November 2014
• March 2015• March 2015– Add GHG flag for participating resource to opt out
– Intertie bidding rules on external EIM interties
– Timeline for submission of EIM transfer capability
– Other clarifications
• Later in 2015– Base schedule flow entitlement on other EIM BAAs
– Dynamic market power mitigation trigger on EIM transfers
– Potential EIM wide transmission rate
– Other clarifications
Page 25
QuestionsQuestionsQuestionsQuestions
NWPP Members’ Market Assessment and Coordination
Initiative
NWPP ATF – System Schedulers Meeting October 21st, 2014
Dan Williams
NWPP MC Leadership Committee Chair Portland General Electric
Agenda
• Introductions and Opening Remarks
• Schedule Overview
• Technology Update
• SCED RFP Approach
• SCED Summary
• Next Steps for the NWPP MC Initiative
2
Key Takeaways Today • Significant progress being made toward decision on whether
to install a within-hour energy market in the NWPP footprint – Members’ knowledge of core issues and opportunities has advanced
significantly through Phase 3 activity
– RFP for Market Operator being issued in October 2014
– Critical regulatory (local and Federal) engagement underway
– High level of Executive and Stakeholder buy-in to project
• Near-term market and reliability benefits coming through Phase 3 technical tools development and advanced data-sharing
3
Agenda
• Introductions and Opening Remarks
• NWPP MC Overview
• Technology Update
• SCED RFP Approach
• SCED Summary
• Next Steps for the NWPP MC Initiative
4
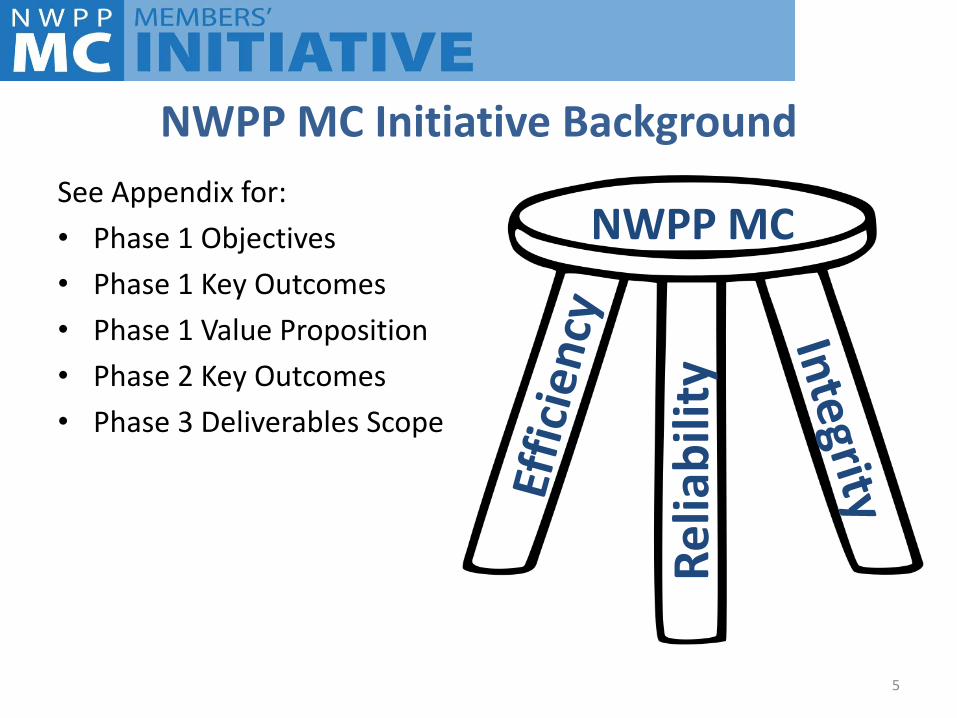
NWPP MC Initiative Background
See Appendix for:
• Phase 1 Objectives
• Phase 1 Key Outcomes
• Phase 1 Value Proposition
• Phase 2 Key Outcomes
• Phase 3 Deliverables Scope
5
NWPP MC
Re
liab
ility
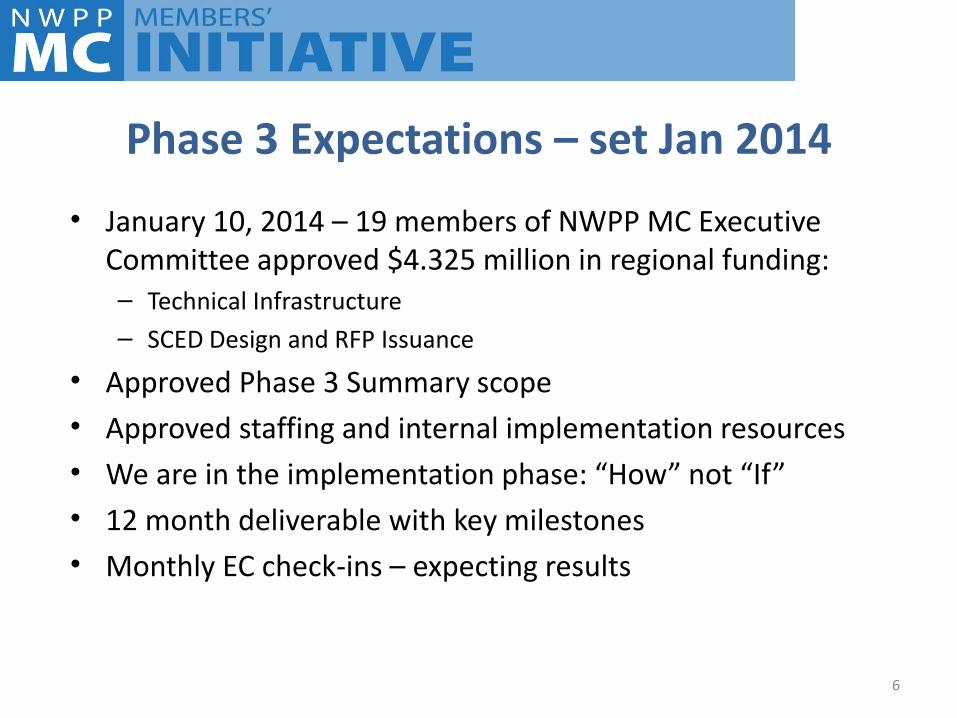
Phase 3 Expectations – set Jan 2014
• January 10, 2014 – 19 members of NWPP MC Executive Committee approved $4.325 million in regional funding: – Technical Infrastructure
– SCED Design and RFP Issuance
• Approved Phase 3 Summary scope
• Approved staffing and internal implementation resources
• We are in the implementation phase: “How” not “If”
• 12 month deliverable with key milestones
• Monthly EC check-ins – expecting results
6
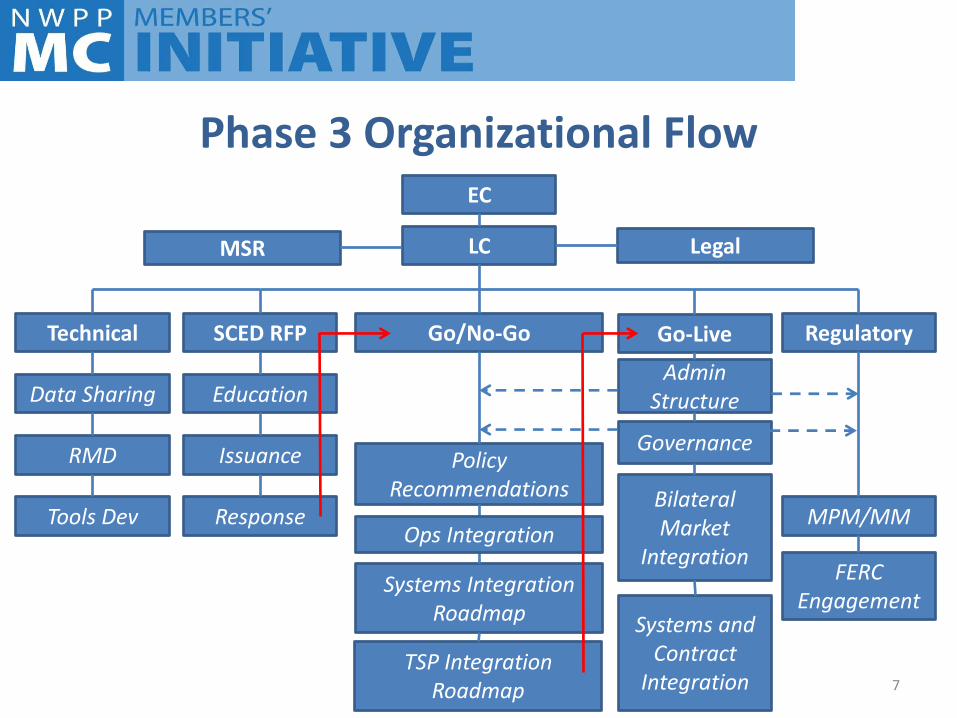
Phase 3 Organizational Flow EC
LC Legal
Go/No-Go SCED RFP Technical Go-Live Regulatory
Issuance
Education
Response
Data Sharing
RMD
Tools Dev
Policy Recommendations
Systems Integration Roadmap
TSP Integration Roadmap
FERC Engagement
MPM/MM
Admin Structure
Governance
Bilateral Market
Integration
Systems and Contract
Integration
Ops Integration
MSR
7
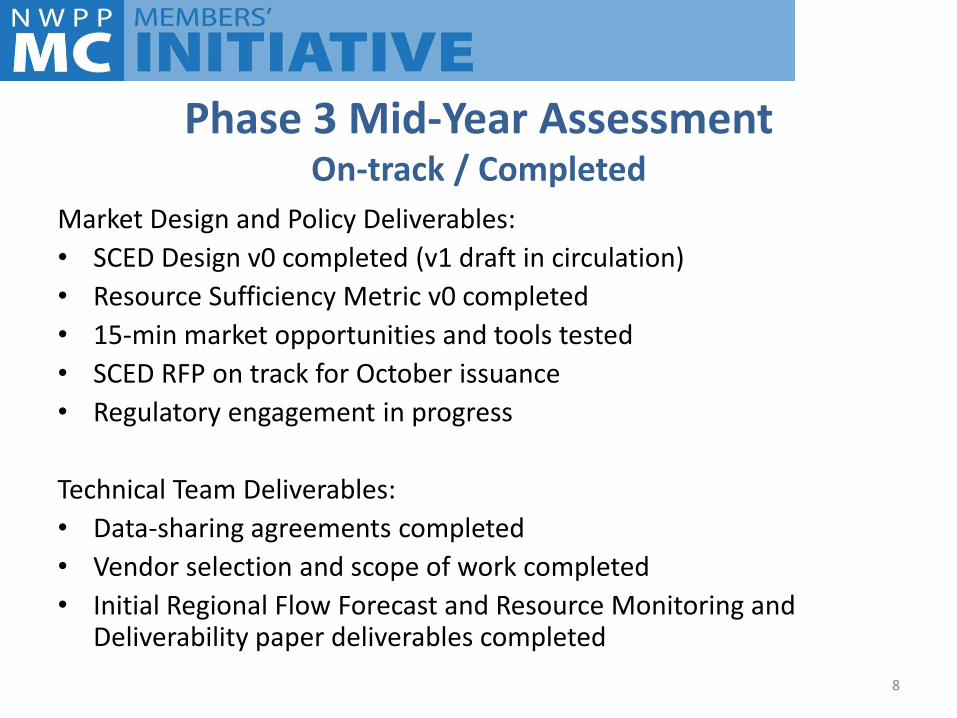
Phase 3 Mid-Year Assessment On-track / Completed
8
Market Design and Policy Deliverables:
• SCED Design v0 completed (v1 draft in circulation)
• Resource Sufficiency Metric v0 completed
• 15-min market opportunities and tools tested
• SCED RFP on track for October issuance
• Regulatory engagement in progress
Technical Team Deliverables:
• Data-sharing agreements completed
• Vendor selection and scope of work completed
• Initial Regional Flow Forecast and Resource Monitoring and Deliverability paper deliverables completed
Agenda
• Introductions and Opening Remarks
• Schedule Overview
• Technology Update
• SCED RFP Approach
• SCED Summary
• Next Steps for the NWPP MC Initiative
9
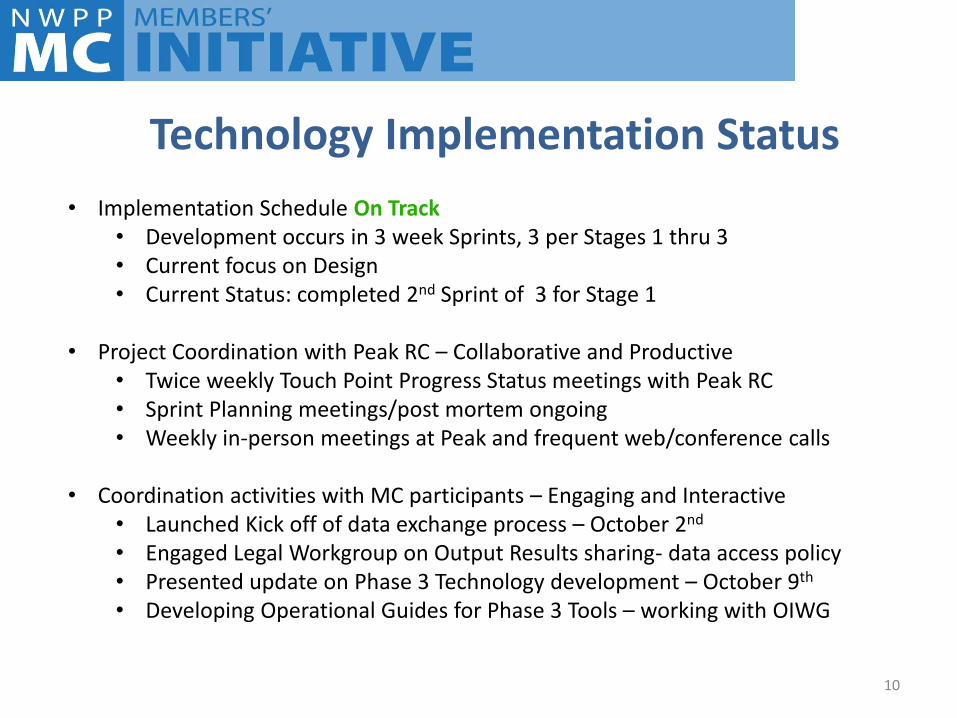
• Implementation Schedule On Track • Development occurs in 3 week Sprints, 3 per Stages 1 thru 3 • Current focus on Design • Current Status: completed 2nd Sprint of 3 for Stage 1
• Project Coordination with Peak RC – Collaborative and Productive • Twice weekly Touch Point Progress Status meetings with Peak RC • Sprint Planning meetings/post mortem ongoing • Weekly in-person meetings at Peak and frequent web/conference calls
• Coordination activities with MC participants – Engaging and Interactive • Launched Kick off of data exchange process – October 2nd • Engaged Legal Workgroup on Output Results sharing- data access policy • Presented update on Phase 3 Technology development – October 9th • Developing Operational Guides for Phase 3 Tools – working with OIWG
Technology Implementation Status
10
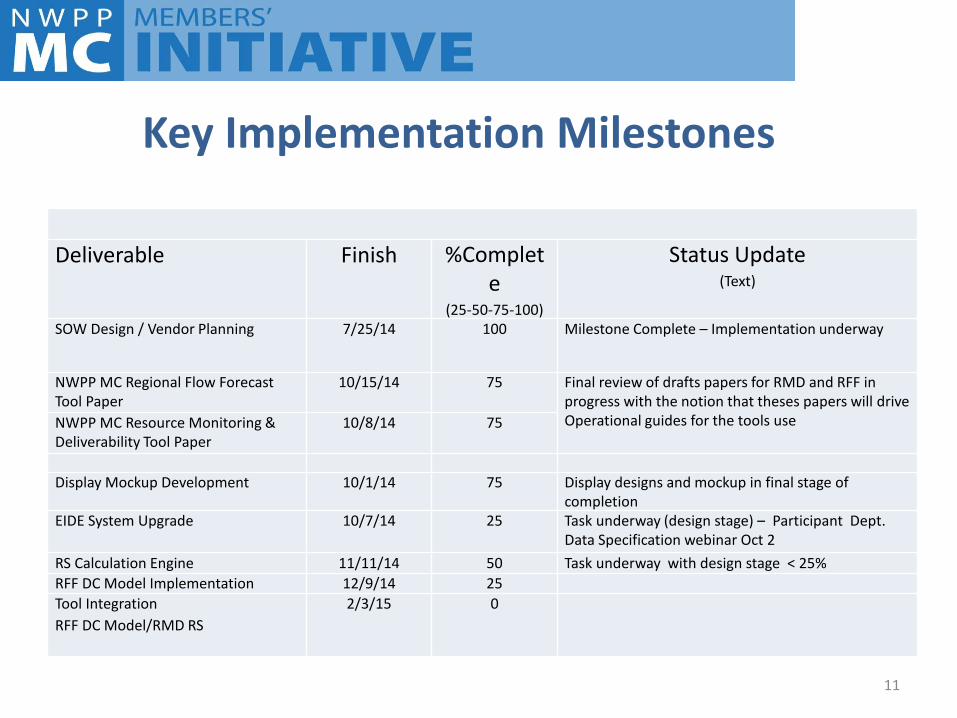
Key Implementation Milestones
Deliverable Finish %Complet
e (25-50-75-100)
Status Update (Text)
SOW Design / Vendor Planning 7/25/14 100 Milestone Complete – Implementation underway
NWPP MC Regional Flow Forecast Tool Paper
10/15/14 75 Final review of drafts papers for RMD and RFF in progress with the notion that theses papers will drive Operational guides for the tools use NWPP MC Resource Monitoring &
Deliverability Tool Paper 10/8/14 75
Display Mockup Development 10/1/14 75 Display designs and mockup in final stage of completion
EIDE System Upgrade 10/7/14 25 Task underway (design stage) – Participant Dept. Data Specification webinar Oct 2
RS Calculation Engine 11/11/14 50 Task underway with design stage < 25%
RFF DC Model Implementation 12/9/14 25
Tool Integration
RFF DC Model/RMD RS
2/3/15 0
11
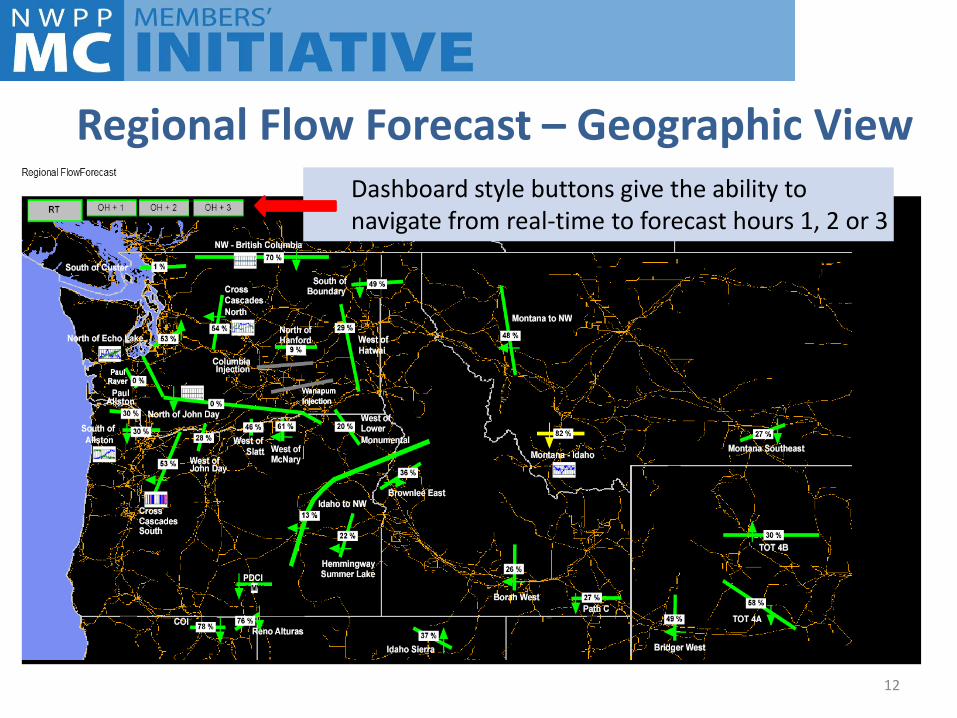
Regional Flow Forecast – Geographic View
12
Dashboard style buttons give the ability to navigate from real-time to forecast hours 1, 2 or 3
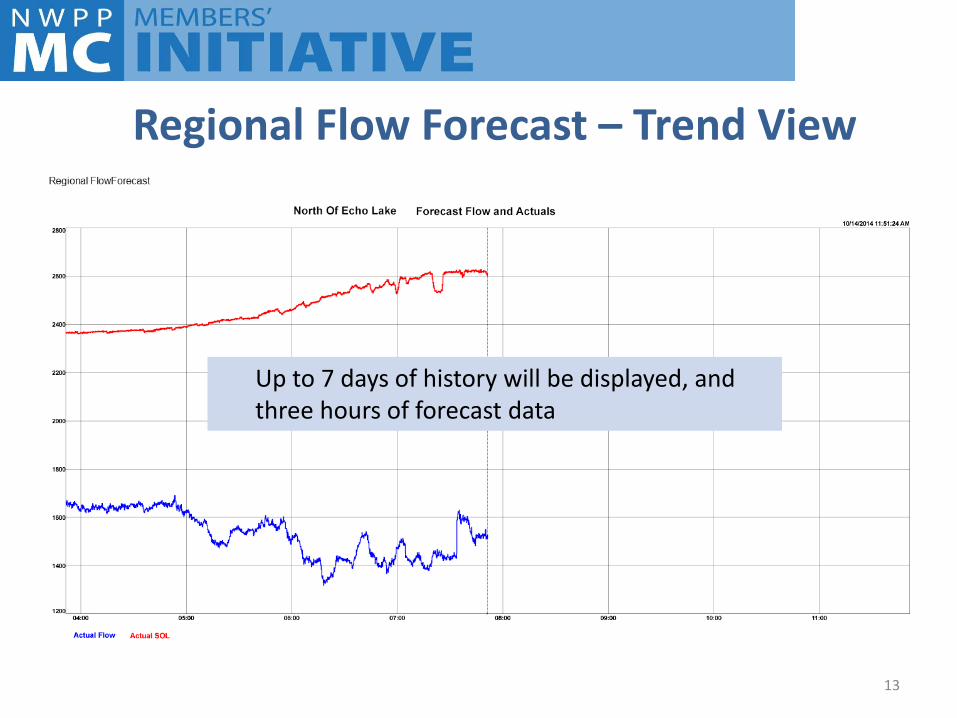
Regional Flow Forecast – Trend View
13
Up to 7 days of history will be displayed, and three hours of forecast data
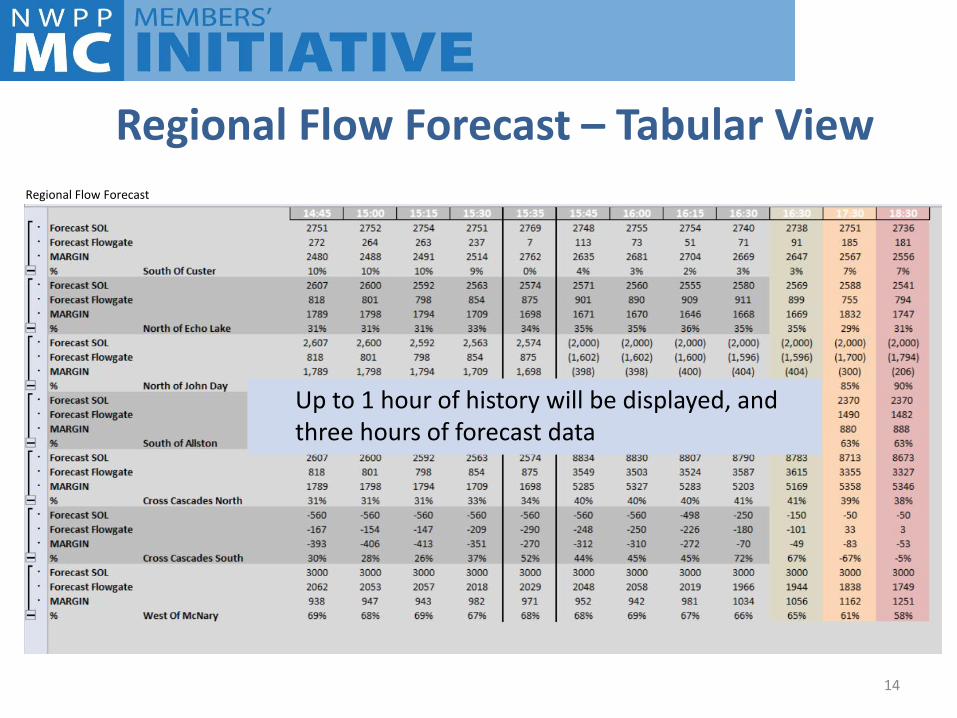
14
Regional Flow Forecast – Tabular View
Up to 1 hour of history will be displayed, and three hours of forecast data
Regional Flow Forecast
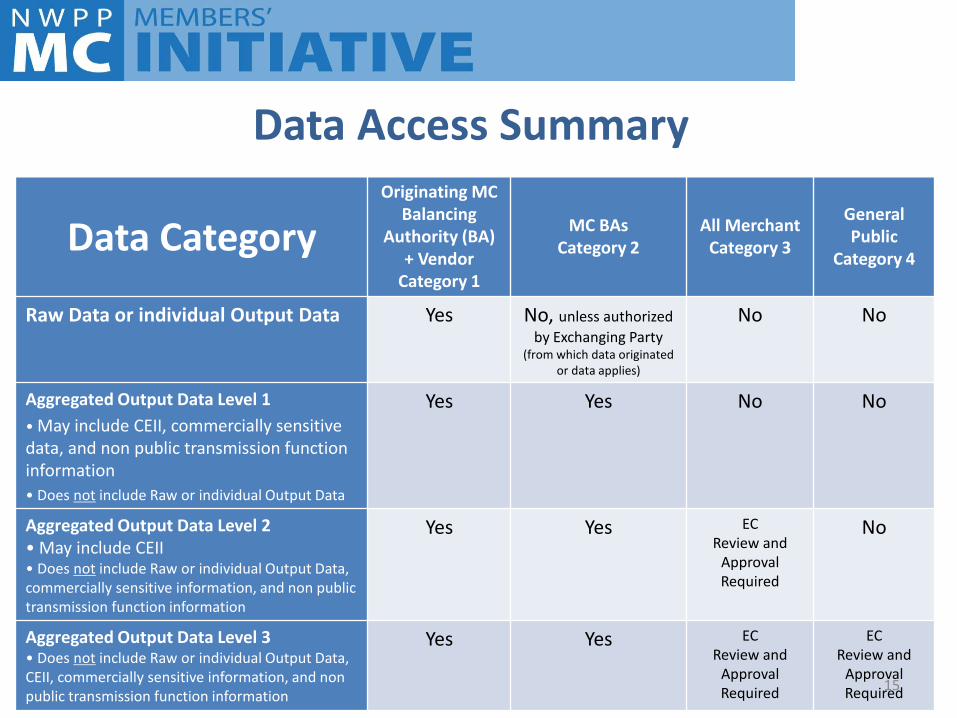
Data Category Originating MC
Balancing Authority (BA)
+ Vendor Category 1
MC BAs Category 2
All Merchant Category 3
General Public
Category 4
Raw Data or individual Output Data Yes No, unless authorized
by Exchanging Party (from which data originated
or data applies)
No No
Aggregated Output Data Level 1
• May include CEII, commercially sensitive data, and non public transmission function information
• Does not include Raw or individual Output Data
Yes Yes No No
Aggregated Output Data Level 2 • May include CEII • Does not include Raw or individual Output Data, commercially sensitive information, and non public transmission function information
Yes Yes EC Review and
Approval Required
No
Aggregated Output Data Level 3 • Does not include Raw or individual Output Data, CEII, commercially sensitive information, and non public transmission function information
Yes Yes EC Review and
Approval Required
EC Review and
Approval Required 15
Data Access Summary
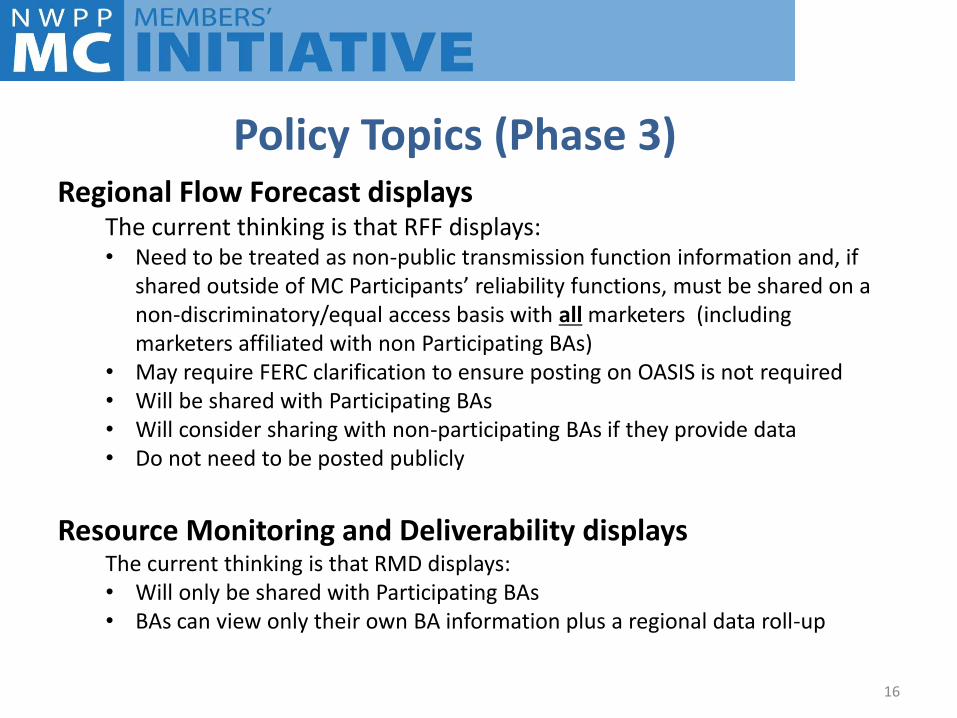
Policy Topics (Phase 3) Regional Flow Forecast displays
The current thinking is that RFF displays: • Need to be treated as non-public transmission function information and, if
shared outside of MC Participants’ reliability functions, must be shared on a non-discriminatory/equal access basis with all marketers (including marketers affiliated with non Participating BAs)
• May require FERC clarification to ensure posting on OASIS is not required • Will be shared with Participating BAs • Will consider sharing with non-participating BAs if they provide data • Do not need to be posted publicly
Resource Monitoring and Deliverability displays
The current thinking is that RMD displays: • Will only be shared with Participating BAs • BAs can view only their own BA information plus a regional data roll-up
16
Agenda
• Introductions and Opening Remarks
• Schedule Overview
• Technology Update
• SCED Summary
• SCED RFP Approach
• Next Steps for the NWPP MC Initiative
17
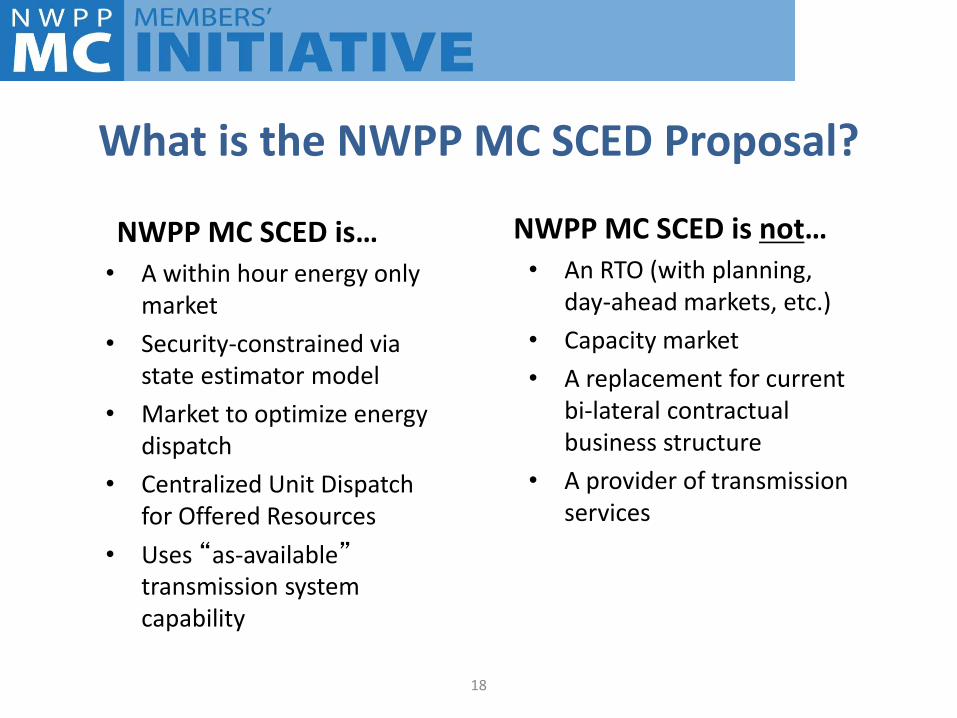
What is the NWPP MC SCED Proposal?
18
NWPP MC SCED is… • A within hour energy only
market
• Security-constrained via state estimator model
• Market to optimize energy dispatch
• Centralized Unit Dispatch for Offered Resources
• Uses “as-available” transmission system capability
NWPP MC SCED is not… • An RTO (with planning,
day-ahead markets, etc.)
• Capacity market
• A replacement for current bi-lateral contractual business structure
• A provider of transmission services
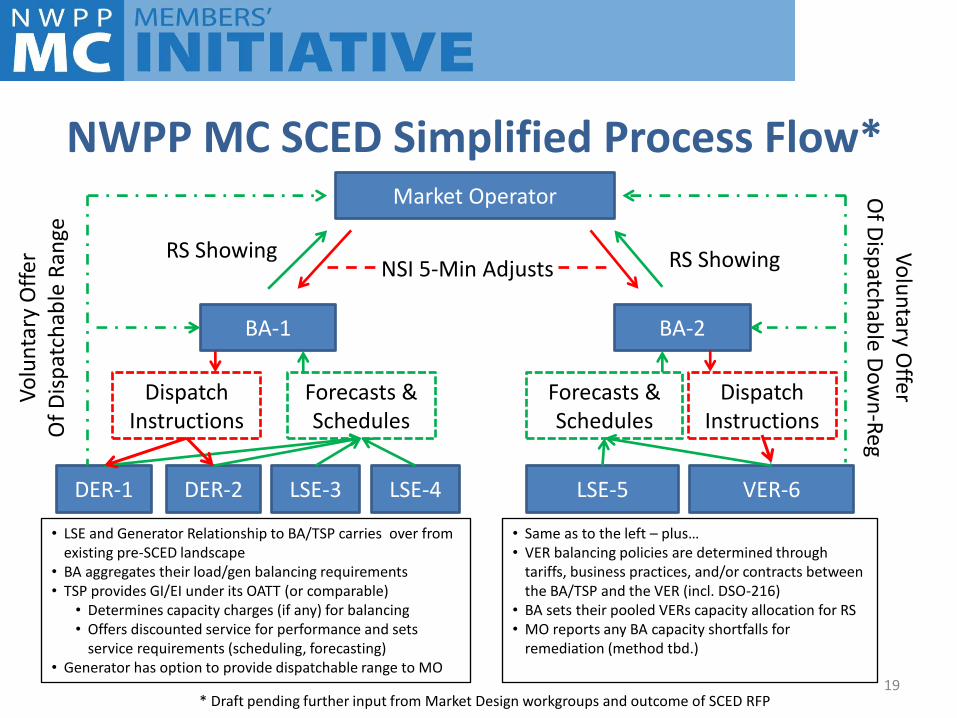
NWPP MC SCED Simplified Process Flow*
19
• LSE and Generator Relationship to BA/TSP carries over from existing pre-SCED landscape
• BA aggregates their load/gen balancing requirements • TSP provides GI/EI under its OATT (or comparable)
• Determines capacity charges (if any) for balancing • Offers discounted service for performance and sets
service requirements (scheduling, forecasting) • Generator has option to provide dispatchable range to MO
• Same as to the left – plus… • VER balancing policies are determined through
tariffs, business practices, and/or contracts between the BA/TSP and the VER (incl. DSO-216)
• BA sets their pooled VERs capacity allocation for RS • MO reports any BA capacity shortfalls for
remediation (method tbd.)
Market Operator
BA-1
NSI 5-Min Adjusts RS Showing
BA-2
RS Showing
DER-1 DER-2 LSE-3
Forecasts & Schedules
LSE-4
Vo
lun
tary
Off
er
Of
Dis
pat
chab
le R
ange
Forecasts & Schedules
LSE-5 VER-6
Vo
lun
tary Offer
Of D
ispatch
able D
ow
n-R
eg
Dispatch Instructions
Dispatch Instructions
* Draft pending further input from Market Design workgroups and outcome of SCED RFP
20
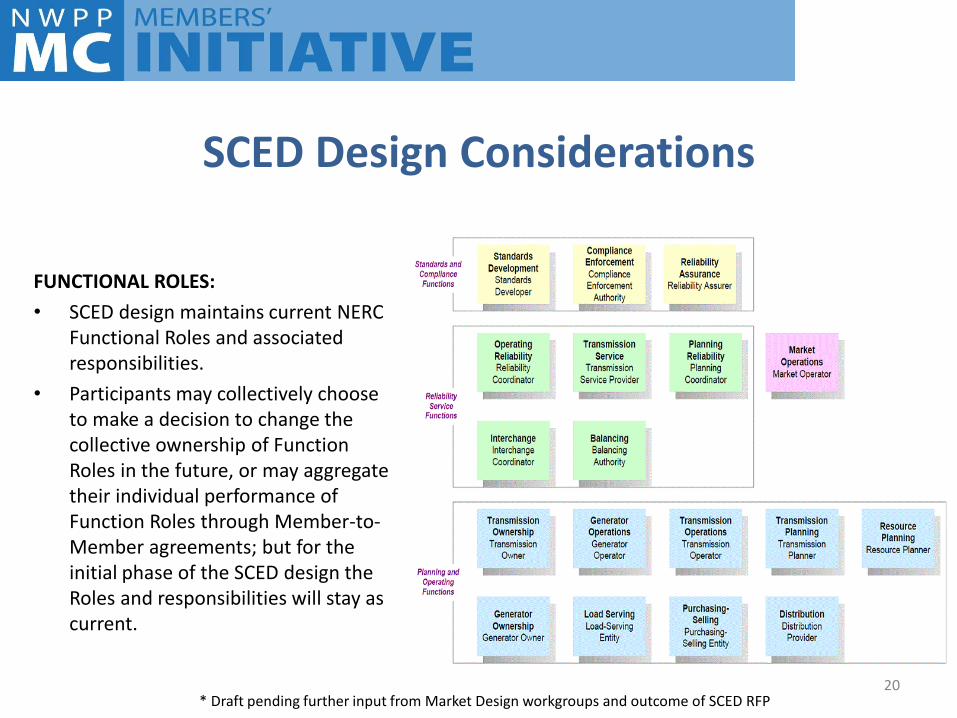
FUNCTIONAL ROLES:
• SCED design maintains current NERC Functional Roles and associated responsibilities.
• Participants may collectively choose to make a decision to change the collective ownership of Function Roles in the future, or may aggregate their individual performance of Function Roles through Member-to-Member agreements; but for the initial phase of the SCED design the Roles and responsibilities will stay as current.
SCED Design Considerations
* Draft pending further input from Market Design workgroups and outcome of SCED RFP
SCED Design Considerations • A Resource Sufficiency (RS) test is a critical pre-condition in a SCED
in order to ensure reliable and equitable market outcomes for all participating entities (no leaning - economics/reliability)
• In the NWPP MC’s draft Market Design, the Balancing Authority (BA) is responsible for assuring RS.
– Check for resource sufficiency is done at the BA level
– Any insufficiency is addressed at the BA level
– Assurance to maintain system balance is a BA responsibility
• The BA will determine how best to gather the necessary data from LSEs and GOPs within their Balancing Authority Area.
• Market Participants, LSEs and GOPs are not required to demonstrate RS to the Market Operator. They will have an obligation to meet the requirements established by their BA, which may include meeting the rates, terms, and conditions of their Transmission Service Provider.
21 * Draft pending further input from Market Design workgroups and outcome of SCED RFP
Agenda
• Introductions and Opening Remarks
• Schedule Overview
• Technology Update
• SCED Summary
• SCED RFP Approach
• Next Steps for the NWPP MC Initiative
22
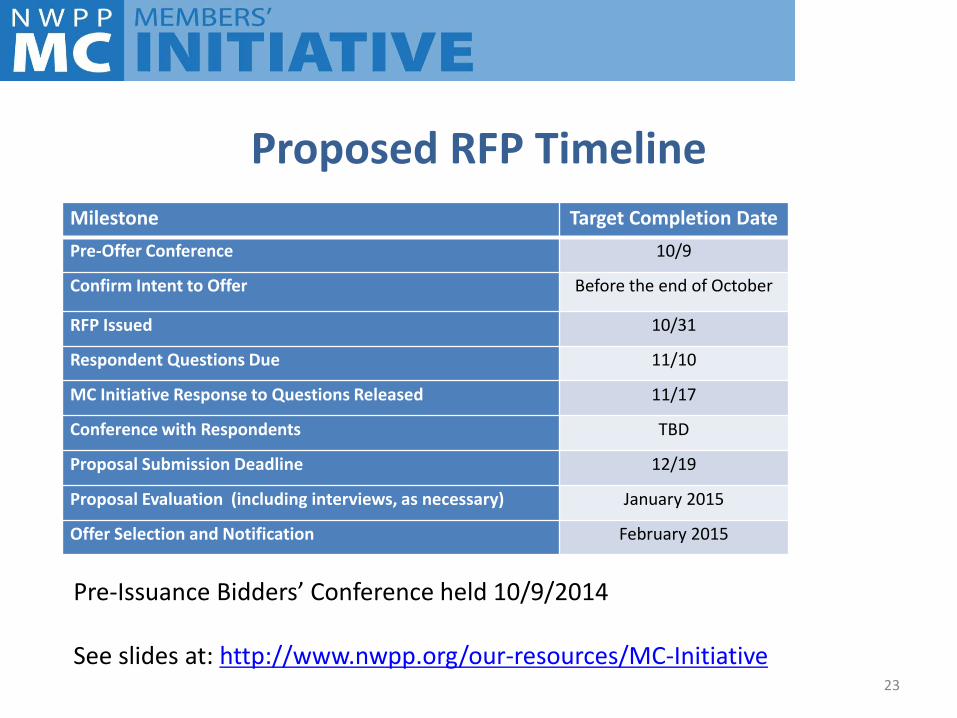
Proposed RFP Timeline
Milestone Target Completion Date
Pre-Offer Conference 10/9
Confirm Intent to Offer Before the end of October
RFP Issued 10/31
Respondent Questions Due 11/10
MC Initiative Response to Questions Released 11/17
Conference with Respondents TBD
Proposal Submission Deadline 12/19
Proposal Evaluation (including interviews, as necessary) January 2015
Offer Selection and Notification February 2015
23
Pre-Issuance Bidders’ Conference held 10/9/2014 See slides at: http://www.nwpp.org/our-resources/MC-Initiative
Agenda
• Introductions and Opening Remarks
• Schedule Overview
• Technology Update
• SCED Summary
• SCED RFP Approach
• Next Steps for the NWPP MC Initiative
24
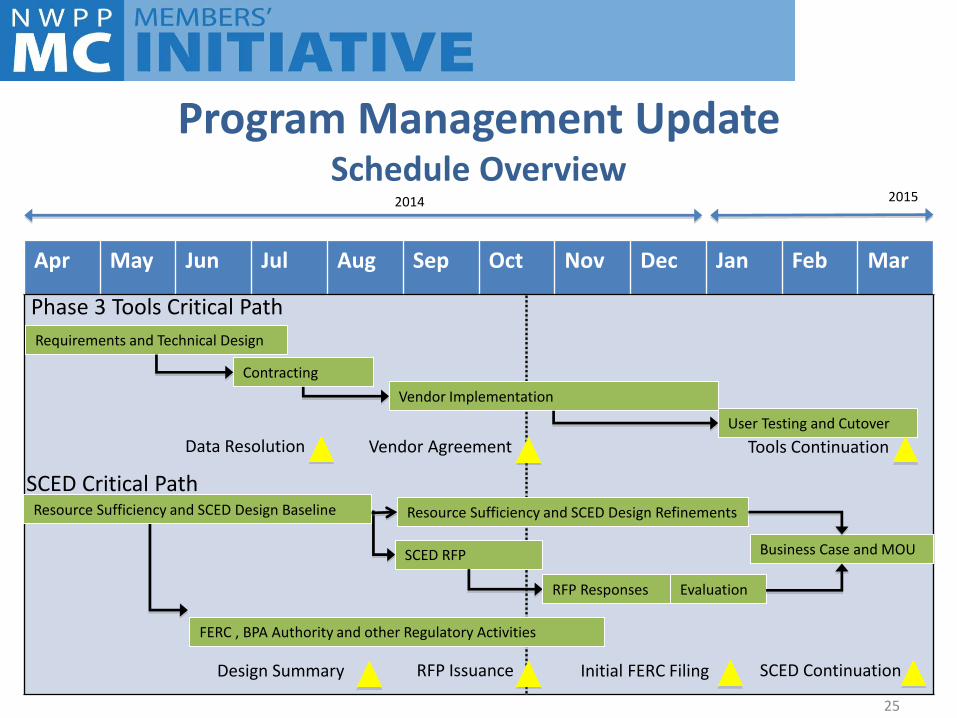
Apr May Jun Jul Aug Sep Oct Nov Dec Jan Feb Mar
Requirements and Technical Design
Contracting
Vendor Implementation
User Testing and Cutover
SCED RFP
2014 2015
Data Resolution
SCED Continuation RFP Issuance
Program Management Update Schedule Overview
SCED Critical Path
FERC , BPA Authority and other Regulatory Activities
Resource Sufficiency and SCED Design Baseline Resource Sufficiency and SCED Design Refinements
Phase 3 Tools Critical Path
Evaluation
Initial FERC Filing
RFP Responses
Vendor Agreement Tools Continuation
Design Summary
Business Case and MOU
25
26
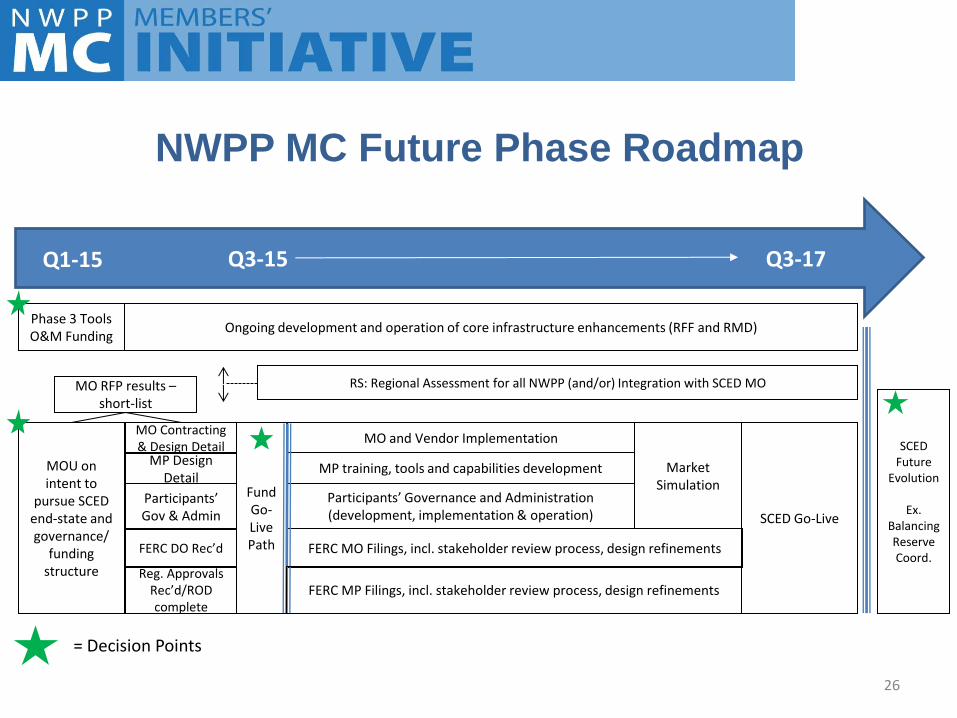
NWPP MC Future Phase Roadmap
Q1-15 Q3-17
MOU on intent to
pursue SCED end-state and governance/
funding structure
MO Contracting & Design Detail
MO and Vendor Implementation
FERC MO Filings, incl. stakeholder review process, design refinements
Market Simulation
SCED Go-Live
FERC DO Rec’d
Ongoing development and operation of core infrastructure enhancements (RFF and RMD)
MO RFP results – short-list
MP training, tools and capabilities development
Phase 3 Tools O&M Funding
Participants’ Governance and Administration (development, implementation & operation)
Reg. Approvals Rec’d/ROD complete
RS: Regional Assessment for all NWPP (and/or) Integration with SCED MO
SCED Future
Evolution
Ex. Balancing Reserve Coord.
Fund Go-Live Path
= Decision Points
MP Design Detail
Participants’ Gov & Admin
FERC MP Filings, incl. stakeholder review process, design refinements
Q3-15
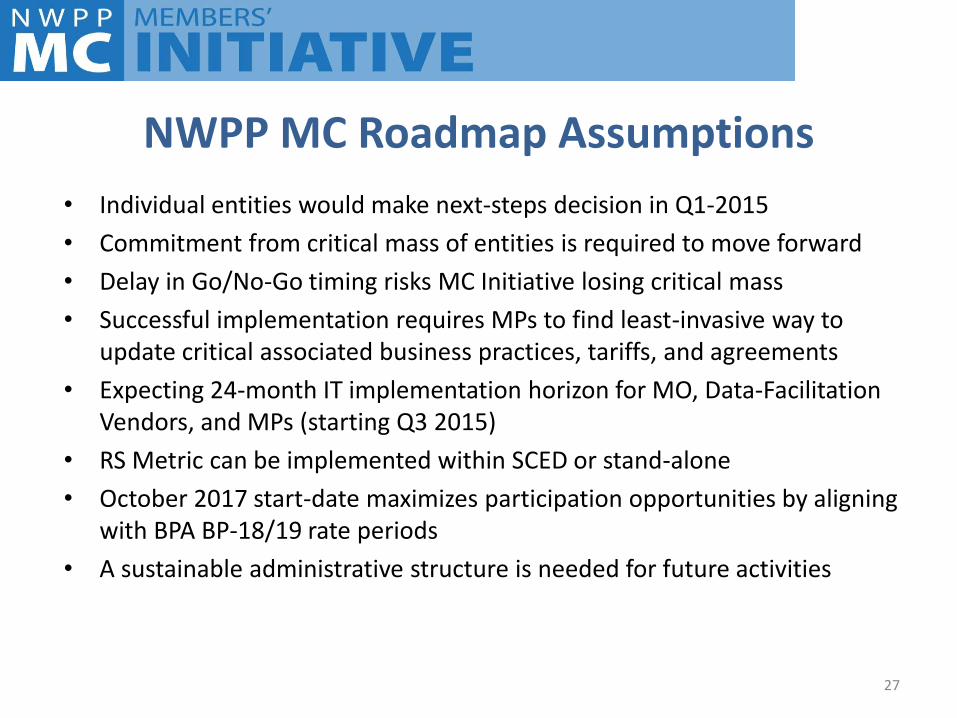
NWPP MC Roadmap Assumptions
27
• Individual entities would make next-steps decision in Q1-2015
• Commitment from critical mass of entities is required to move forward
• Delay in Go/No-Go timing risks MC Initiative losing critical mass
• Successful implementation requires MPs to find least-invasive way to update critical associated business practices, tariffs, and agreements
• Expecting 24-month IT implementation horizon for MO, Data-Facilitation Vendors, and MPs (starting Q3 2015)
• RS Metric can be implemented within SCED or stand-alone
• October 2017 start-date maximizes participation opportunities by aligning with BPA BP-18/19 rate periods
• A sustainable administrative structure is needed for future activities
Questions
28
Please send any questions or information requests to the NWPP MC at:
Public Meeting
Nov 19th – 1-3p at Sea-Tac
(webinar available)
Appendix
29
Phase 1 Objectives
In Phase 1 the group defined a “problem statement” aimed at delivering a comprehensive Northwest solution to:
• Manage Variable Energy Resource Operational Impacts
• Share Regional Balancing Diversity and Capabilities
• Enhance Reliability of Transmission Constraint Management
• Mitigate Compliance Exposure and Costs
• Leverage Existing Tools Where Expedient
• Preserve Existing Reserve Sharing Group Benefits
• Respect Local Control and Self-Determination Priorities
30
Phase 1 Key Outcomes
• No single solution addresses entire problem statement – 15-min intra-hour energy-only transactions are not sufficient
– FRAP has promise, but likely more complicated than EIM solution
– Diversity benefits are real, but ability to access is constrained by existing transmission, coordination, and economic environment
• Region needs a comprehensive operations and commercial framework – Built on foundation of reliability and local control
– Addresses capacity sufficiency
– Captures cost savings through diversity and economic dispatch of resources
31
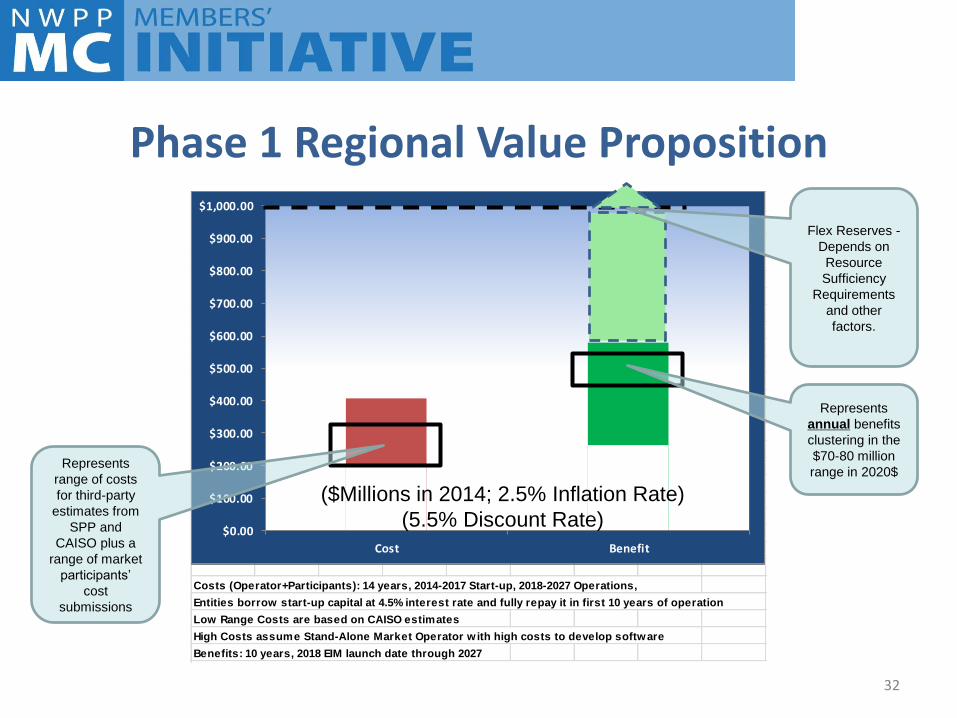
Costs (Operator+Participants): 14 years, 2014-2017 Start-up, 2018-2027 Operations,
Entities borrow start-up capital at 4.5% interest rate and fully repay it in first 10 years of operation
Low Range Costs are based on CAISO estimates
High Costs assume Stand-Alone Market Operator w ith high costs to develop software
Benefits: 10 years, 2018 EIM launch date through 2027
Inflation Rate = 2.5% ; Discount Rate = 5.5% based on Participant feedback for capitalization example purposes
$0.00
$100.00
$200.00
$300.00
$400.00
$500.00
$600.00
$700.00
$800.00
$900.00
$1,000.00
Cost Benefit
Represents
annual benefits
clustering in the
$70-80 million
range in 2020$
Flex Reserves -
Depends on
Resource
Sufficiency
Requirements
and other
factors.
Represents
range of costs
for third-party
estimates from
SPP and
CAISO plus a
range of market
participants’
cost
submissions
($Millions in 2014; 2.5% Inflation Rate)
(5.5% Discount Rate)
Phase 1 Regional Value Proposition
32
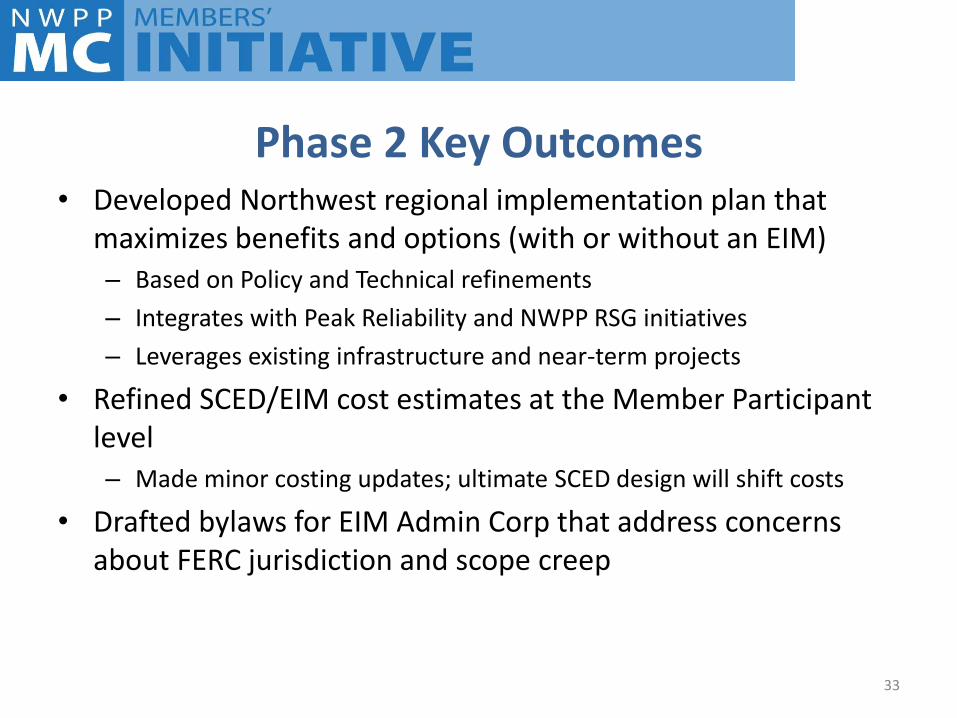
Phase 2 Key Outcomes • Developed Northwest regional implementation plan that
maximizes benefits and options (with or without an EIM) – Based on Policy and Technical refinements
– Integrates with Peak Reliability and NWPP RSG initiatives
– Leverages existing infrastructure and near-term projects
• Refined SCED/EIM cost estimates at the Member Participant level – Made minor costing updates; ultimate SCED design will shift costs
• Drafted bylaws for EIM Admin Corp that address concerns about FERC jurisdiction and scope creep
33
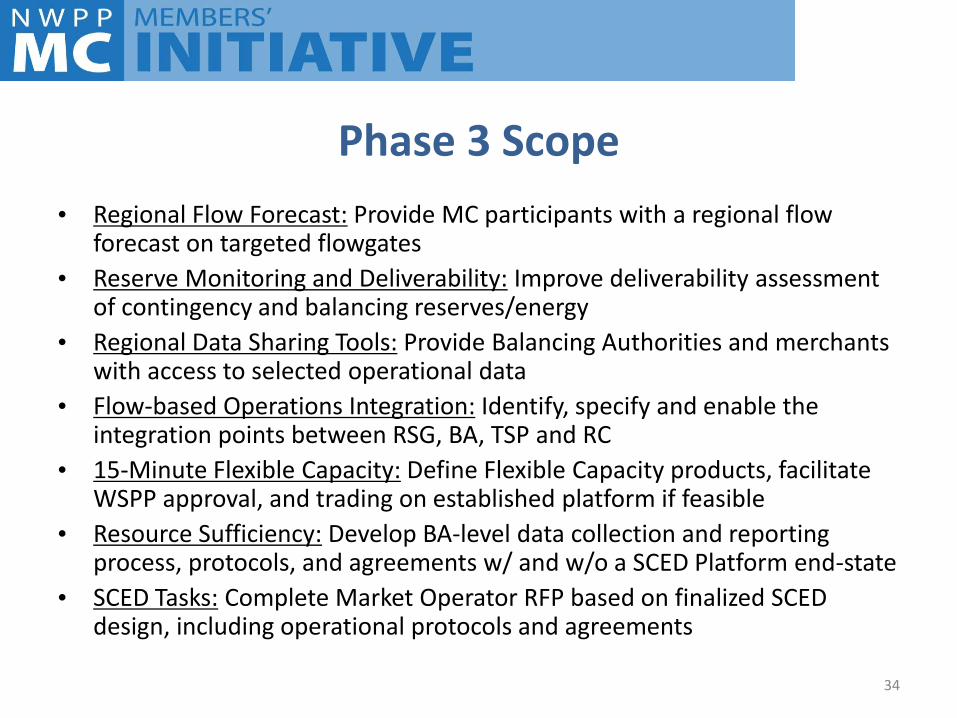
Phase 3 Scope
• Regional Flow Forecast: Provide MC participants with a regional flow forecast on targeted flowgates
• Reserve Monitoring and Deliverability: Improve deliverability assessment of contingency and balancing reserves/energy
• Regional Data Sharing Tools: Provide Balancing Authorities and merchants with access to selected operational data
• Flow-based Operations Integration: Identify, specify and enable the integration points between RSG, BA, TSP and RC
• 15-Minute Flexible Capacity: Define Flexible Capacity products, facilitate WSPP approval, and trading on established platform if feasible
• Resource Sufficiency: Develop BA-level data collection and reporting process, protocols, and agreements w/ and w/o a SCED Platform end-state
• SCED Tasks: Complete Market Operator RFP based on finalized SCED design, including operational protocols and agreements
34

NORTHWEST POWER POOLNORTHWEST POWER POOL
Interactive Memory QuizInteractive Memory Quiz

Quick picture flash…Quick picture flash…Quick picture flash…Quick picture flash…… then you have 5 minutes… then you have 5 minutes
2

3
What did you see?What did you see?1. Transformer
2. Solar Panel
11. Flashdrive
12. Mouse
3. Laptop
4. Sine wave
5 iP d
13. Wind Turbine
14. MW
15 C l P Pl t5. iPad
6. NWPP Logo
7 Coffee Mug
15. Coal Power Plant
16. Light Bulb
17 Nuclear Symbol7. Coffee Mug
8. Hydro Power Plant
9. Transmission Line
17. Nuclear Symbol
18. Substation/Power Circuit Breaker
19. NERC Logo
10. Cell Phone
g
20. $
4
ISAS UpdateAndy Meyersy y
Interchange Scheduling & Accounting Subcommittee Chair
NWPP After‐the‐Fact Scheduler’s Meeting 22 October 2014
Portland, ORW E S T E R N E L E C T R I C I T Y C O O R D I N A T I N G C O U N C I L
Agenda
2
Agenda
• Interchange Work Group (IWG)Interchange Work Group (IWG)
• Electronic Scheduling Work Group (ESWG)
• After the Fact Work Group (ATFWG)• After-the-Fact Work Group (ATFWG)
• Recent WECC happeningsUFAS D M th d l– UFAS Dues Methodology
– Dynamic/Psuedo Tie Work Shop
– WIT ownershipo e s p
– Updated WECC Website
• 2015 ISAS Meetings
W E S T E R N E L E C T R I C I T Y C O O R D I N A T I N G C O U N C I L
Interchange Work Group (IWG)
3
Interchange Work Group (IWG)
• IWG Chaired by Danielle JohnsonIWG Chaired by Danielle Johnson
• IWG recently completed consolidation of the Real Time Scheduling Work Group (RTSWG) &Real Time Scheduling Work Group (RTSWG) & eTag Issues Work Group (EIWG)
T k h d b i ti– Two work groups had been inactive
– Charter has been updated
k b h b b b d– Work group members have been absorbed into IWG
W E S T E R N E L E C T R I C I T Y C O O R D I N A T I N G C O U N C I L
Interchange Work Group (IWG)
4
Interchange Work Group (IWG)
• WIT Authority Back Up (WIAB) TestWIT Authority Back Up (WIAB) Test
– INT‐020‐WECC‐CRT‐1.1
• WIT Back up procedureWIT Back up procedure
– Only 1 WECC member has volunteered to participate in 2014 WIAB test (WAPA Rockyparticipate in 2014 WIAB test (WAPA Rocky Mountain Power)
– IWG chair concerned that there will be insufficient participation to have the table top test
– Looking at delaying WIAB test until early 2015
W E S T E R N E L E C T R I C I T Y C O O R D I N A T I N G C O U N C I L
Interchange Work Group (IWG)
5
Interchange Work Group (IWG)
• IWG had submitted a SAR request regarding q g gWECC Regional Criteria INT‐011 (Ten Minute Recallable)
IWG has asked for WR 1 3 & WR 1 4 to be removed as– IWG has asked for WR 1.3 & WR 1.4 to be removed as a result of BAL‐002 implementation
• WR 1.3 ‐‐ Reserve obligation multiplier option set to “100%”; andand
• WR 1.4 ‐‐ Reserve responsible entity set to either of the following options in order to identify the entity accepting the energygy
– Sink Balancing Authority (or) – Reserve Sharing Group member that is located inside the Sink Balancing Authority
W E S T E R N E L E C T R I C I T Y C O O R D I N A T I N G C O U N C I L
Interchange Work Group (IWG)
6
Interchange Work Group (IWG)
• Drafting team (WECC‐0110) has been convened g ( )but it will take some time to clean up the regional criteria.
• IWG has contacted Shannon Black regarding• IWG has contacted Shannon Black regarding language in WECC Regional Criteria INT‐009 (Capacity Tag Functionality)– INT‐009 utilizes terms of “On Demand Spinning” & “On Demand Non‐Spinning”
– Would need to be replace with BAL‐002 terminologyWould need to be replace with BAL 002 terminology of “Operating Reserves – Spinning” & “Operating Reserves – Supplemental”
W E S T E R N E L E C T R I C I T Y C O O R D I N A T I N G C O U N C I L
Electronic Scheduling Work Group (ESWG)
7
Electronic Scheduling Work Group (ESWG)
• Chaired by Raymond Vojdani (WAPA)y y j ( )
• ESWG held a webinar on 7/20 and an in person meeting on 8/20– Have continued to discuss checkout using WIT
• ESWG submitted a SAR on July 25th to modify WECC Regional Criteria INT‐021 (WIT Checkout Confirmation)Regional Criteria INT 021 (WIT Checkout Confirmation)– ESWG requested modification of WR 3
• Each Balancing Authority shall use the electronic confirmation process provided by the Reliability Assurer (WECC) as the primaryprocess provided by the Reliability Assurer (WECC) as the primary means to acknowledge agreement of NAI for past hour checkout in the current day and past day checkout.
W E S T E R N E L E C T R I C I T Y C O O R D I N A T I N G C O U N C I L
Electronic Scheduling Work Group (ESWG)
8
Electronic Scheduling Work Group (ESWG)
– Drafting team has been convened (WECC‐0108)Drafting team has been convened (WECC 0108)
• DT still seeking additional members
– DT looking at striking WR3, revising WR 2, adding g g , g , gadditional requirements
– Clean & Redline versions of the Criteria are posted pon DT website
– Next meeting is Monday 10/20 (10‐12 Mountain
W E S T E R N E L E C T R I C I T Y C O O R D I N A T I N G C O U N C I L
After-the-Fact Work Group (ATFWG)
9
After the Fact Work Group (ATFWG)
• ATFWG met prior to August ISAS meetingATFWG met prior to August ISAS meeting
– April/May eTagging issue provides a good opportunity for member educationopportunity for member education
– Annual Webinar training on use of ATF etags?
– ATFWG is examining the After‐the‐fact tagging g gg gguideline in order to recommend changes
– Any changes will be posted for 30 day comment period
W E S T E R N E L E C T R I C I T Y C O O R D I N A T I N G C O U N C I L
Other WECC Happenings
10
Other WECC Happenings
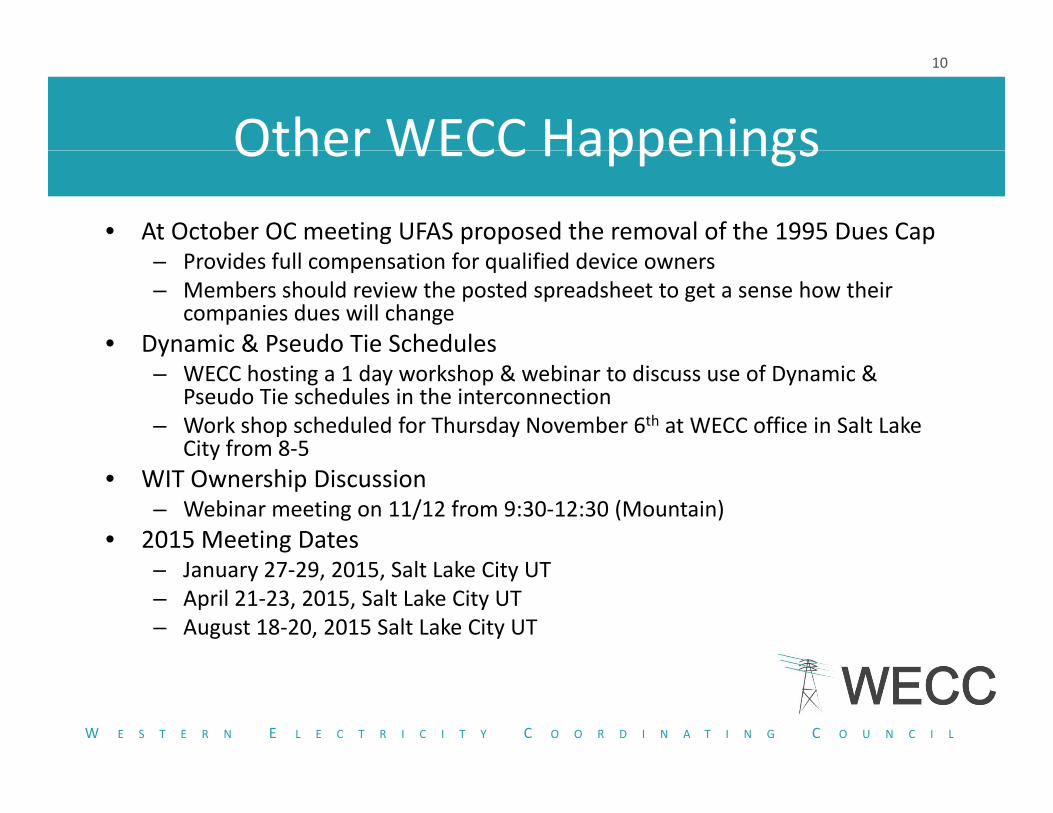
• At October OC meeting UFAS proposed the removal of the 1995 Dues Capd f ll f l f d d– Provides full compensation for qualified device owners
– Members should review the posted spreadsheet to get a sense how their companies dues will change
• Dynamic & Pseudo Tie Schedulesy– WECC hosting a 1 day workshop & webinar to discuss use of Dynamic &
Pseudo Tie schedules in the interconnection– Work shop scheduled for Thursday November 6th at WECC office in Salt Lake
City from 8‐5y
• WIT Ownership Discussion– Webinar meeting on 11/12 from 9:30‐12:30 (Mountain)
• 2015 Meeting Dates– January 27‐29, 2015, Salt Lake City UT– April 21‐23, 2015, Salt Lake City UT– August 18‐20, 2015 Salt Lake City UT
W E S T E R N E L E C T R I C I T Y C O O R D I N A T I N G C O U N C I L
Questions
11
Questions
Andy Meyers – Bonneville Power AdministrationAndy Meyers Bonneville Power Administration
W E S T E R N E L E C T R I C I T Y C O O R D I N A T I N G C O U N C I L
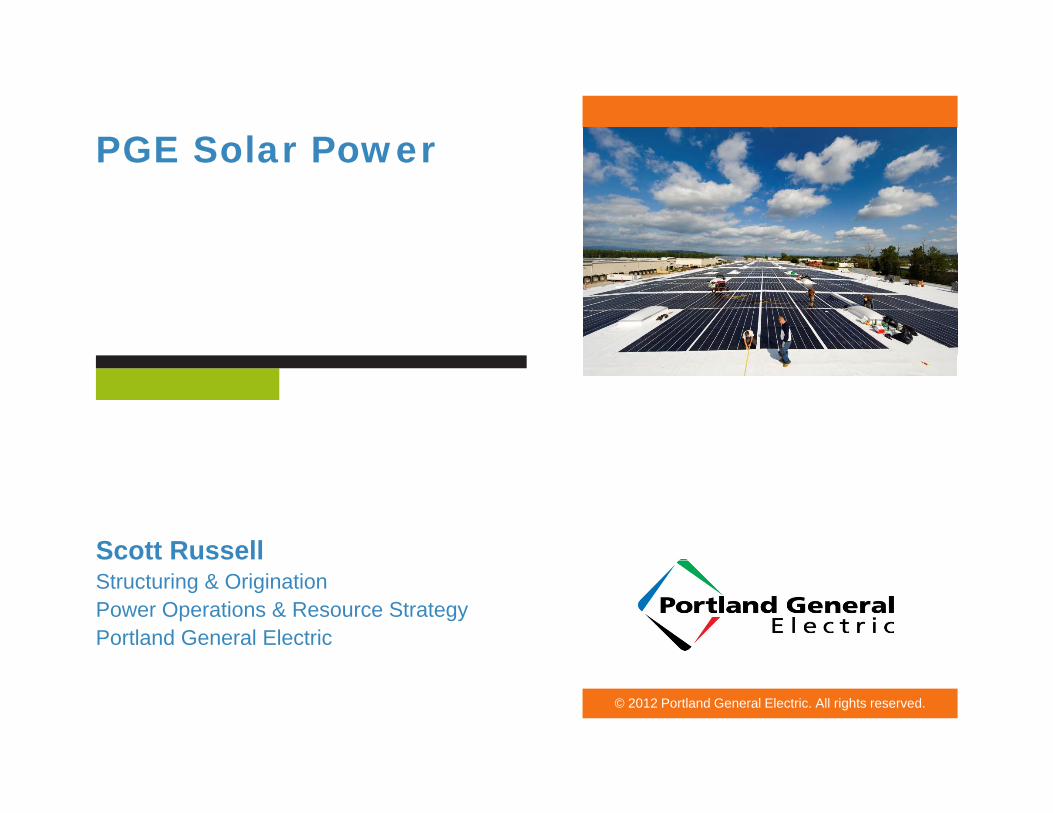
PGE Solar PowerPGE Solar Power
Scott RussellStructuring & OriginationPower Operations & Resource StrategyPortland General Electric
© 2012 Portland General Electric. All rights reserved.
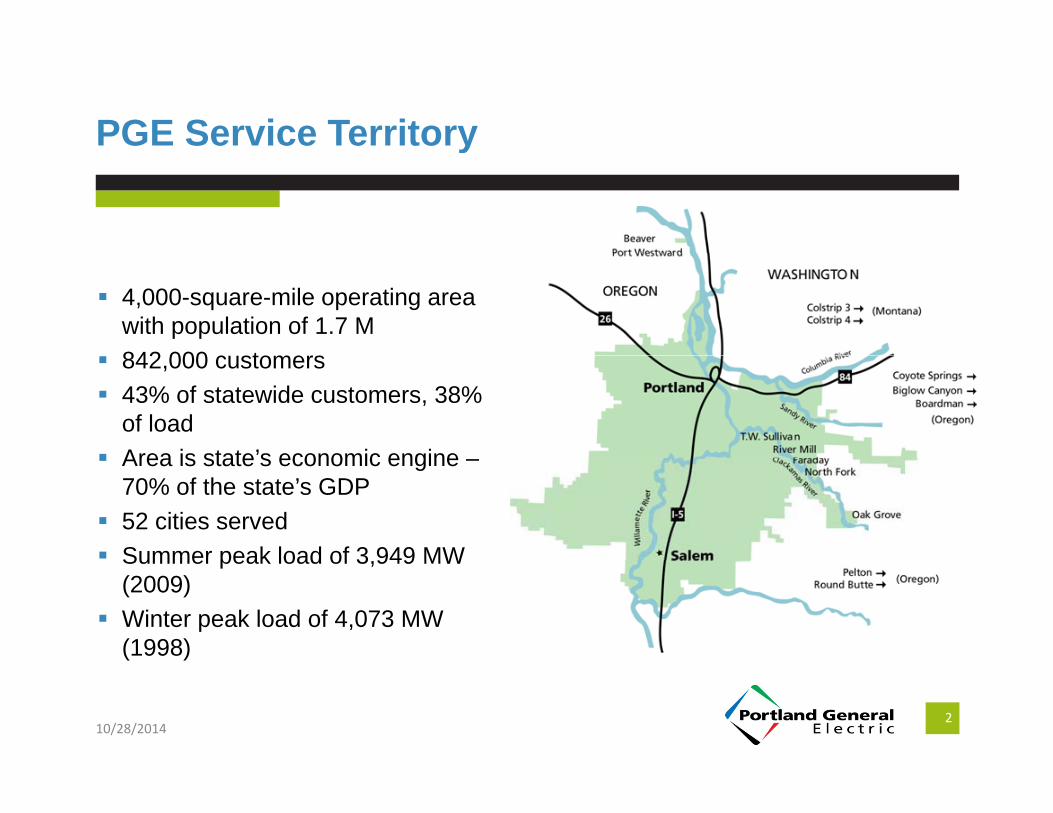
PGE Service Territory y
4,000-square-mile operating area with population of 1.7 M
842 000 t 842,000 customers
43% of statewide customers, 38% of load
Area is state’s economic engine Area is state s economic engine –70% of the state’s GDP
52 cities served
Summer peak load of 3 949 MWSummer peak load of 3,949 MW (2009)
Winter peak load of 4,073 MW (1998)
210/28/2014
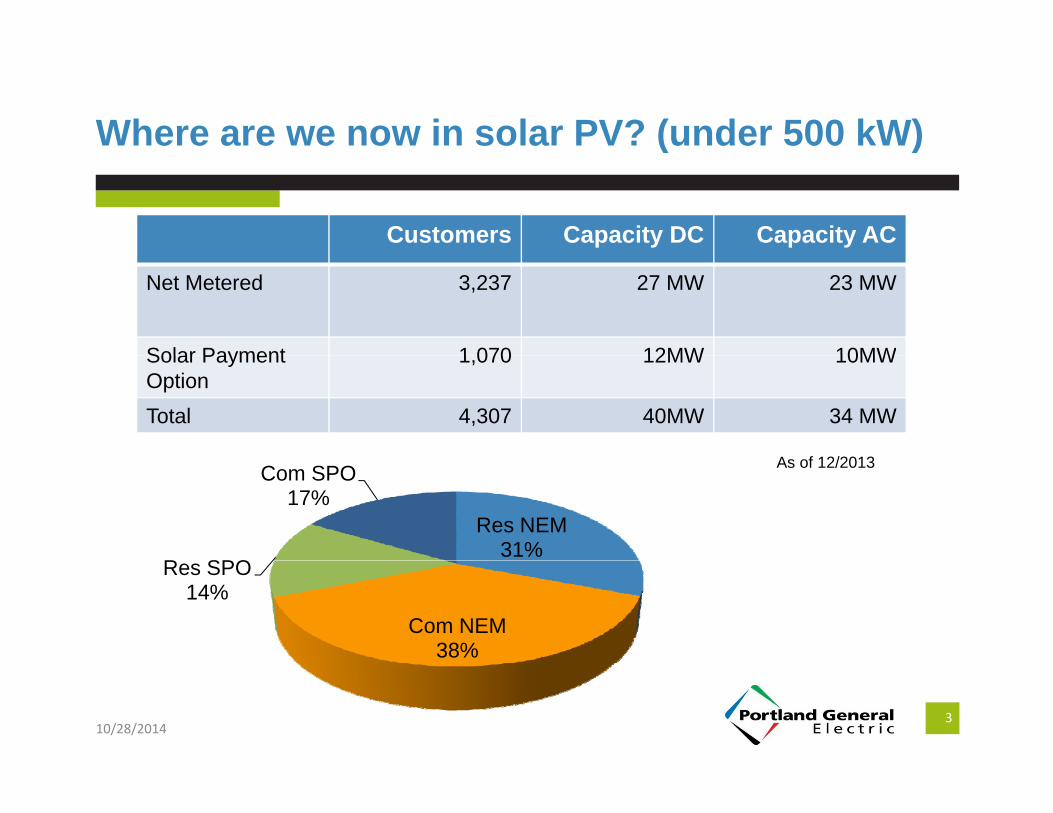
Where are we now in solar PV? (under 500 kW)( )
Customers Capacity DC Capacity AC
Net Metered 3,237 27 MW 23 MW
Solar Payment 1 070 12MW 10MWSolar Payment Option
1,070 12MW 10MW
Total 4,307 40MW 34 MW
A f 12/2013
Res NEM31%
R SPO
Com SPO17%
As of 12/2013
Com NEM38%
Res SPO14%
310/28/2014

Residential solar customer profilep
• Affluent and highly educatedG d t d• Graduate degree
• Professional occupation• High dual-income• Married
• Value comfort and “green” products
• High consumers of information• High consumers of information
• Long established customers• PGE account older than 6 years• Registered on PGE website• Pay electronically • Buy renewable power
410/28/2014
• Single family homes that they own• Value over $300,000
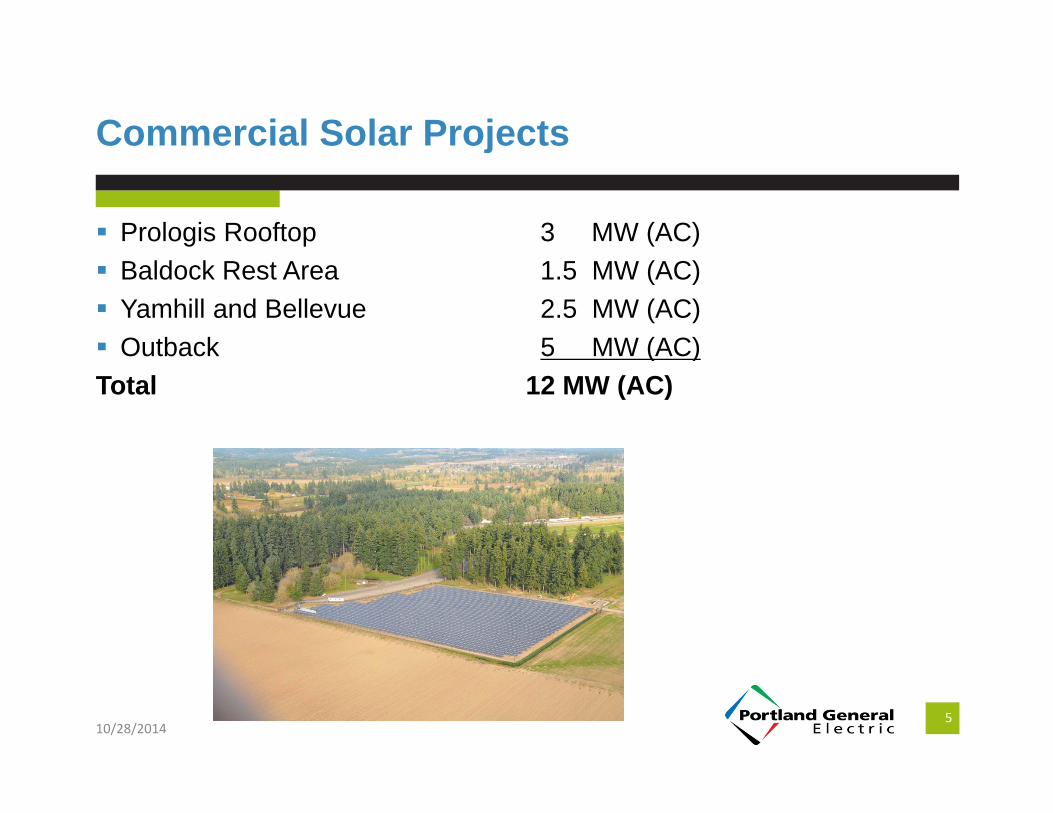
Commercial Solar Projects
Prologis Rooftop 3 MW (AC)
j
Baldock Rest Area 1.5 MW (AC)
Yamhill and Bellevue 2.5 MW (AC)
Outback 5 MW (AC)Outback 5 MW (AC)
Total 12 MW (AC)
510/28/2014
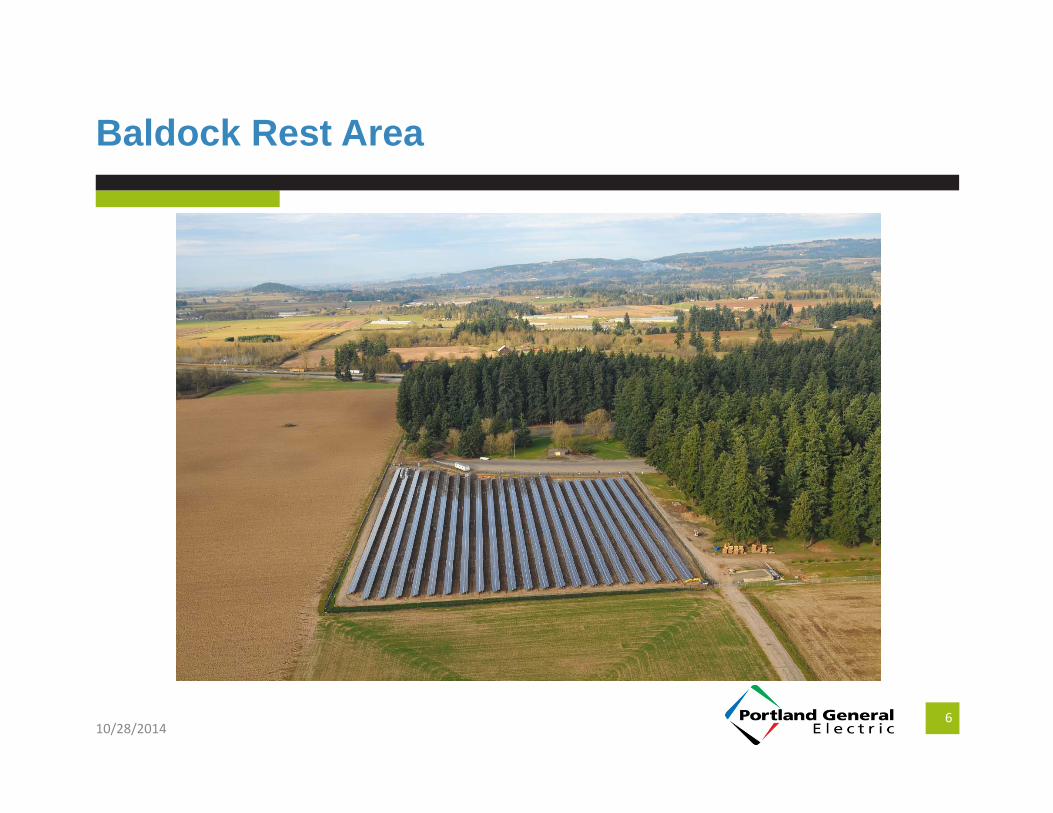
Baldock Rest Area
610/28/2014
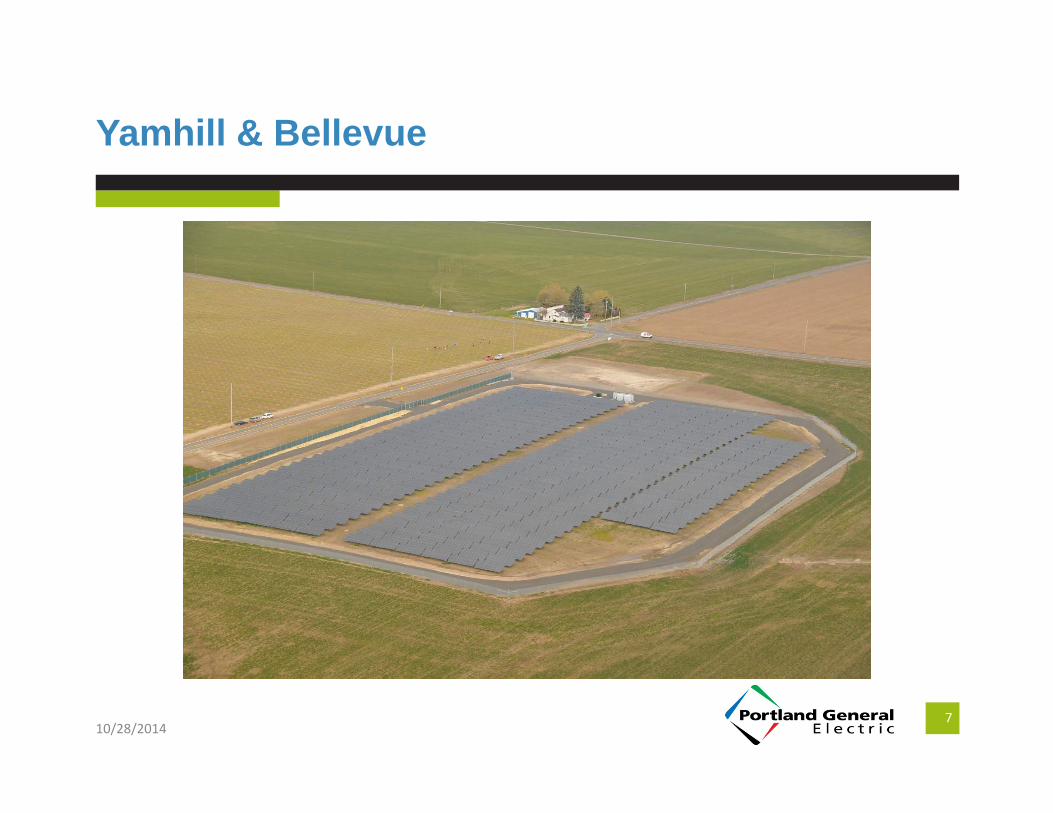
Yamhill & Bellevue
710/28/2014

Prologis Rooftop Projectsg p j
810/28/2014

Outback Solar
Photo Credit - Constellation
910/28/2014
Utility role in solar development
More than convener or facilitator
y p
Policy development role – FIT, PV Capacity Standard, OPUC dockets
System Development role – Utility scale solar facilities
Customer facing role – Powering our customers’ potential as theCustomer facing role Powering our customers potential as the region’s trusted energy partner
Planning role – Within the Integrated Resource Planning process Planning role – Within the Integrated Resource Planning process
Safety role – Our 125 year history gives us a unique appreciation for the nuts and bolts challenges of meeting the needs of our 836 000
1010/28/2014
the nuts and bolts challenges of meeting the needs of our 836,000 customers all day, every day, no matter what
Solar Opportunities in Oregonpp g
Opportunities
PGE has the #1 ranked voluntary renewable program in the US
PGE Customers value solar beyond the $/kWh
Solar is becoming more cost competitive every year
Challenges
Variable Energy Resources (VERs) provide energy when the “sun shines” or when the “winds blows”
Wind is currently the least cost option for RPS compliance Wind is currently the least-cost option for RPS compliance
Abundance of natural gas reserves
Uncertainty around tax credits creates uncertainty in the marketplace
1110/28/2014
Uncertainty around tax credits creates uncertainty in the marketplace
Thank-you!y
1210/28/2014

Schedulers’ MeetingOctober 22, 2014 Portland, Oregon
Peak UpdateMichelle Mizumori
Director of Operations
2
• Five-year Strategic Plan
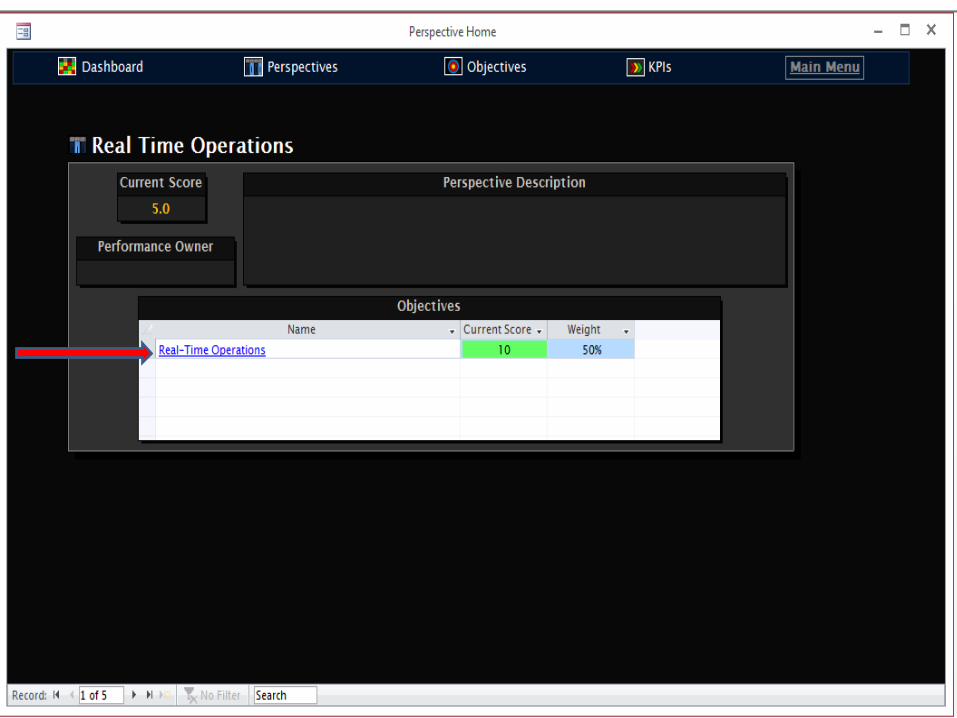
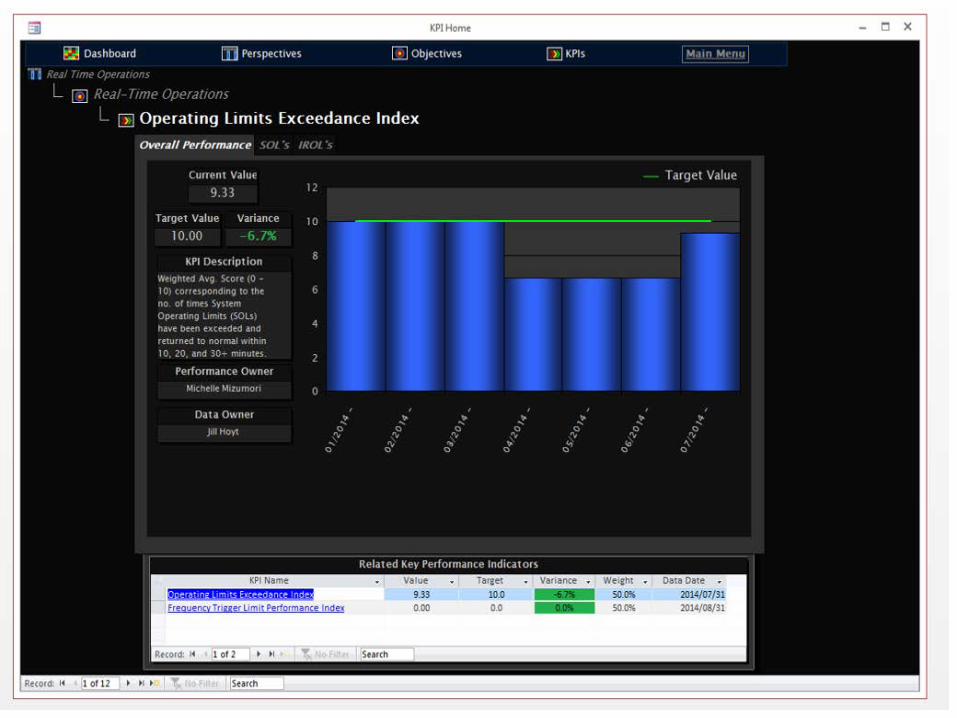
• Performance Dashboard
• 2014 Customer Survey
• US DOE Grant
• BC Hydro
• RMT
• webSAS
• Enhanced Curtailment Calculator (ECC)
• Hosted Advance Applications
Discussion Topics
3
• Performance monitored through key metrics
• Underpinned by Four Pillars:1. Interconnection-wide operational excellence
2. Stakeholder value
3. Employee engagement
4. Financial stability
• Transparent and public process
Five-year Strategic Plan
4
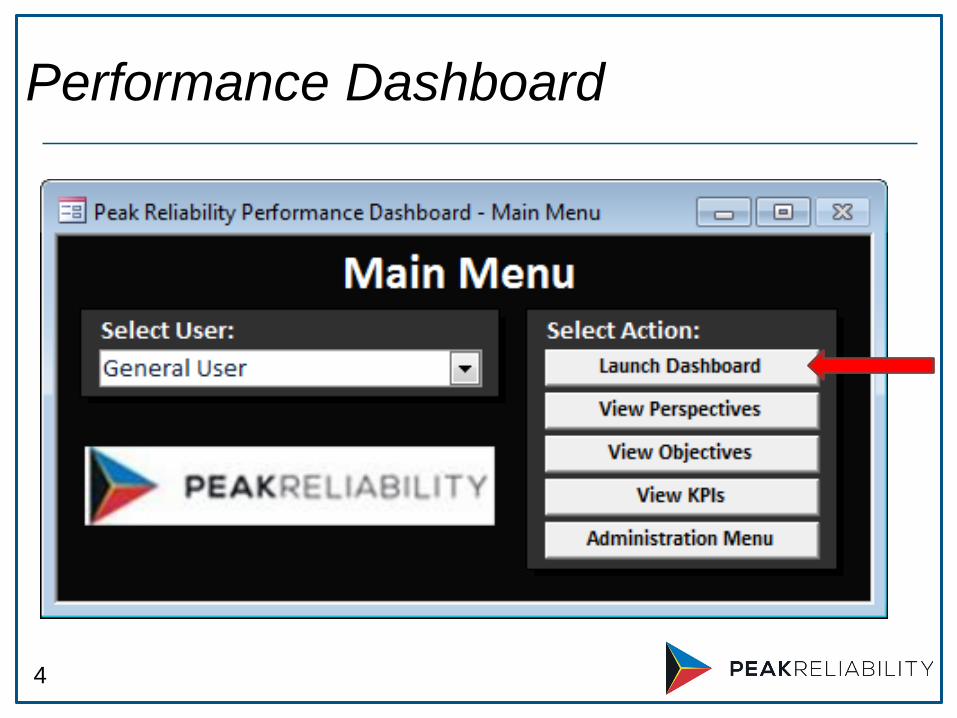
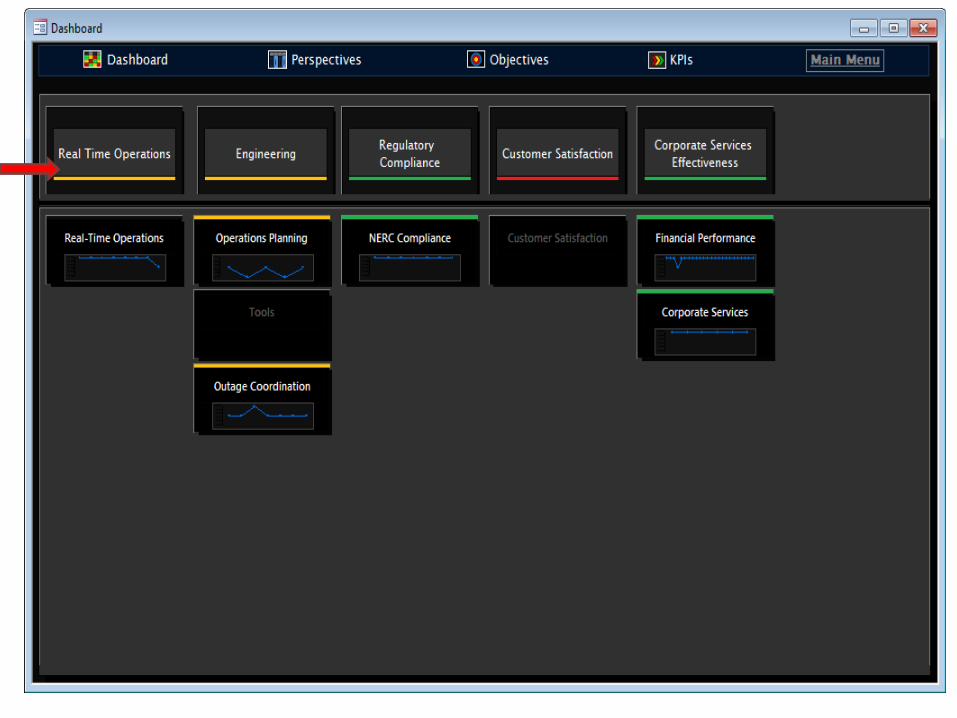
Performance Dashboard

9
• 2014 Baseline Customer Satisfaction Interviews – October 2014o Twenty in-depth interviews with senior
executives from a selection of BAs and TOPs
o Online survey to all Peak members and non-member BAs and TOPs
2014 Customer Satisfaction Survey
10
• Peak awarded $6.2 million DOE match for a total program of $12.4 million
• Facilitates the operationalization of the infrastructure created under WISP
• Reliability benefits include: 1. Avoiding of cascading electrical failure
2. Making full utilization of available transmission capacity
3. Improving data delivery system efficiency
US DOE Grant
11
• BC Hydro’s Balancing Authority Area will remain part of the Peak RC Area
• Positive outcome for reliability and financially
• BC Hydro will pay full assessment from 2015 onwards
British Columbia (BC) Hydro
12
• Development through end of 2014
• 2015 Q1 internal testing
• March 2015 beta test
• Mid-May 2015 begin parallel operations
Reliability Messaging Tool
13
• Changing curtailment calculationo 16 buckets
o Transmission priority and On-/Off-Path
• November 3-7, 2014 - Testing
webSAS
14
• ECC Functional Spec for phase I (RC situational awareness) complete
• Working on contract language with vendor
• Roadmapo Phase I delivery to Peak Q2 2015
o Curtailment methodology discussions to start soon with ECCTF and industry support
o Phase II functional spec complete end of Q2 2015
Enhanced Curtailment Calculator
15
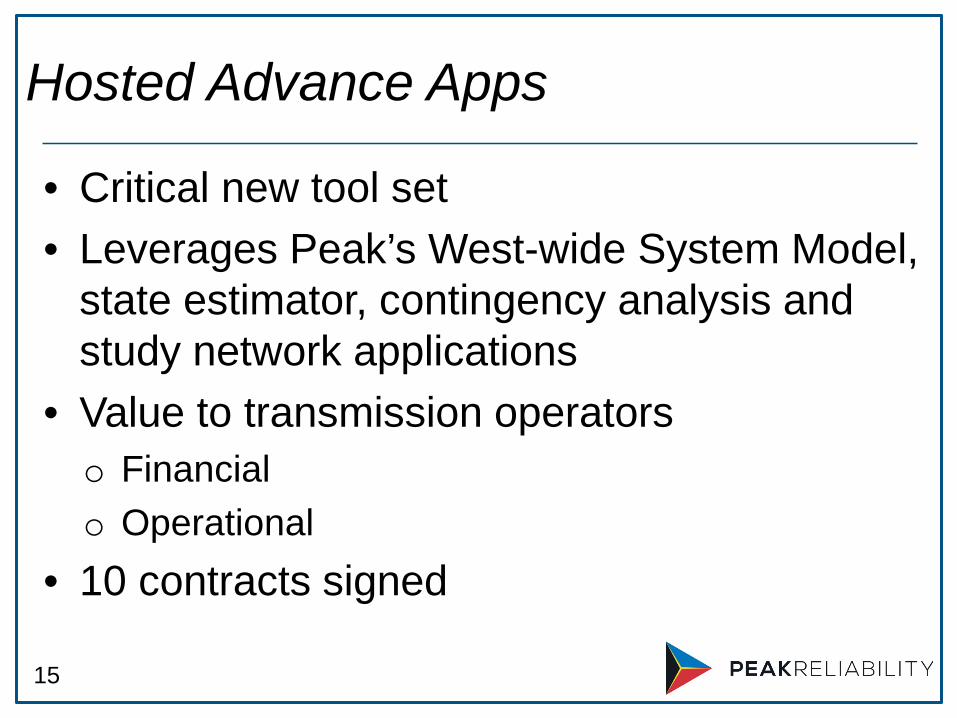
• Critical new tool set
• Leverages Peak’s West-wide System Model, state estimator, contingency analysis and study network applications
• Value to transmission operatorso Financial
o Operational
• 10 contracts signed
Hosted Advance Apps
B O N N E V I L L E P O W E R A D M I N I S T R A T I O N
Pacific DC Intertie UpgradePacific DC Intertie UpgradeProject Update
BY KARL MITSCHBPA TRANSMISSION SERVICES
NWPP SCHEDULERS MEETING OCT 21‐22, 2014
DOUBLETREE BY HILTON – LLOYD DISTRICT1000 NE MULTNOMAH PORTLAND OR 972321000 NE MULTNOMAH, PORTLAND, OR 97232
Slide 1 1
B O N N E V I L L E P O W E R A D M I N I S T R A T I O N
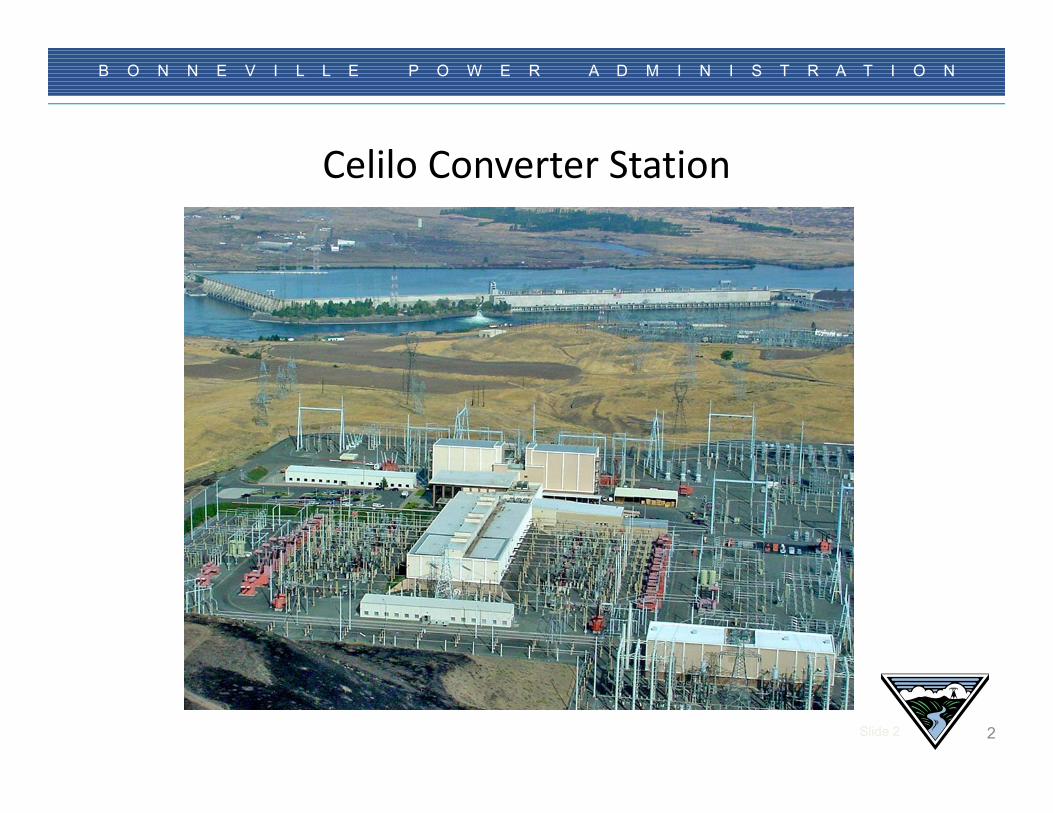
lil iCelilo Converter Station
Slide 2 2
B O N N E V I L L E P O W E R A D M I N I S T R A T I O N
dPresent Condition
• Aging control systems becoming unmaintainable• Aging control systems becoming unmaintainable and degrading reliability.
• Original GE transformers over 40 years old andOriginal GE transformers over 40 years old and gassing.
• Expansion transformer and smoothing reactorExpansion transformer and smoothing reactor design defect.
• Siemens valve grading electrode problem.g g p
• Celilo‐NOB dc transmission line vibration dampers and compression fittings nearing end of life.
Slide 3
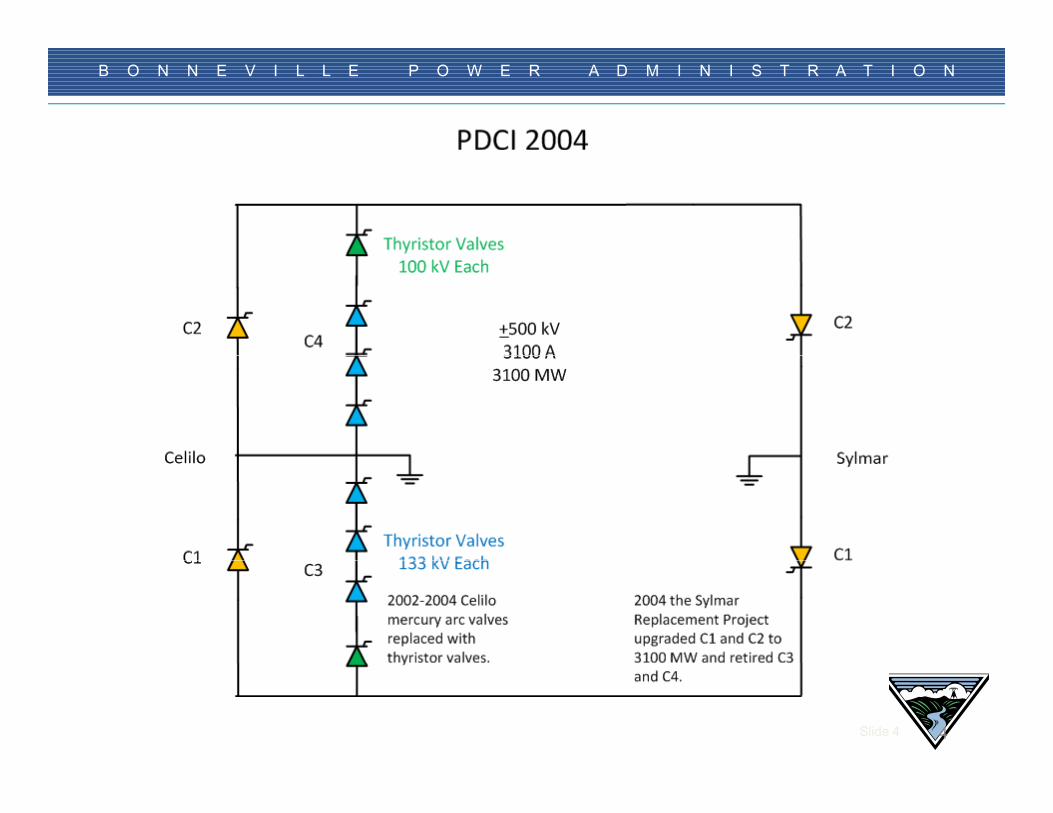
• Multi – converter complexity3
B O N N E V I L L E P O W E R A D M I N I S T R A T I O N
Slide 4 4
B O N N E V I L L E P O W E R A D M I N I S T R A T I O N
PDCI Upgrade ProjectPDCI Upgrade Project
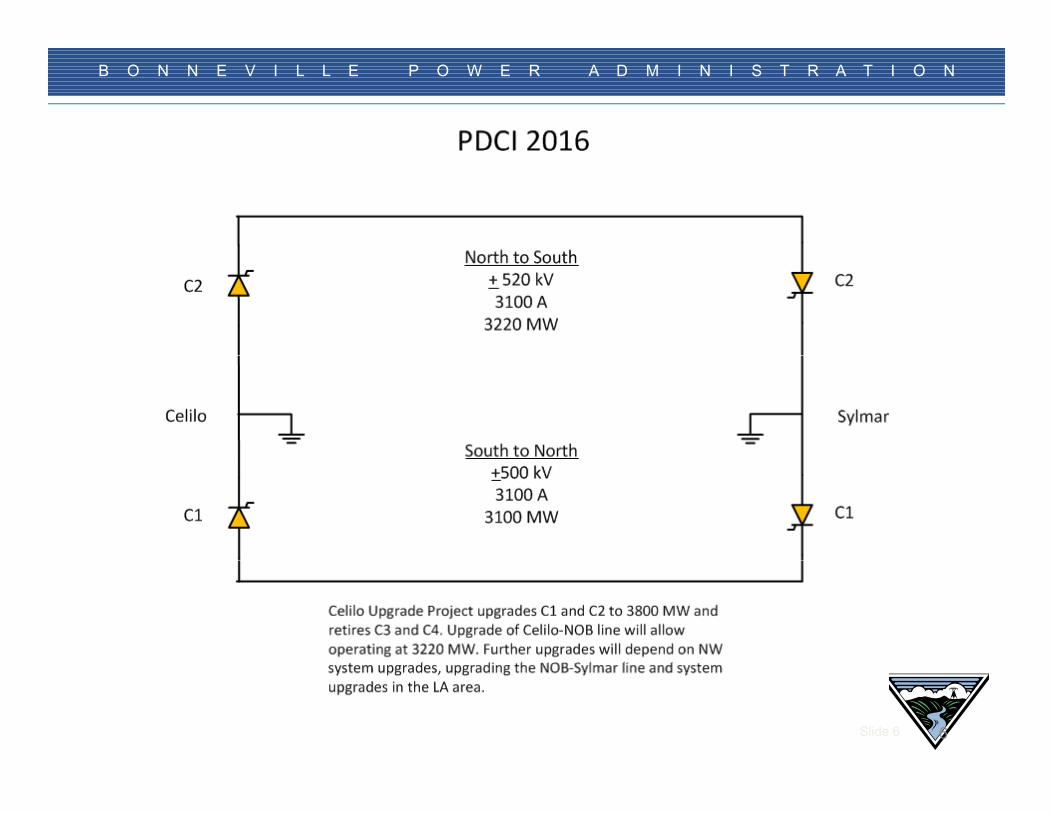
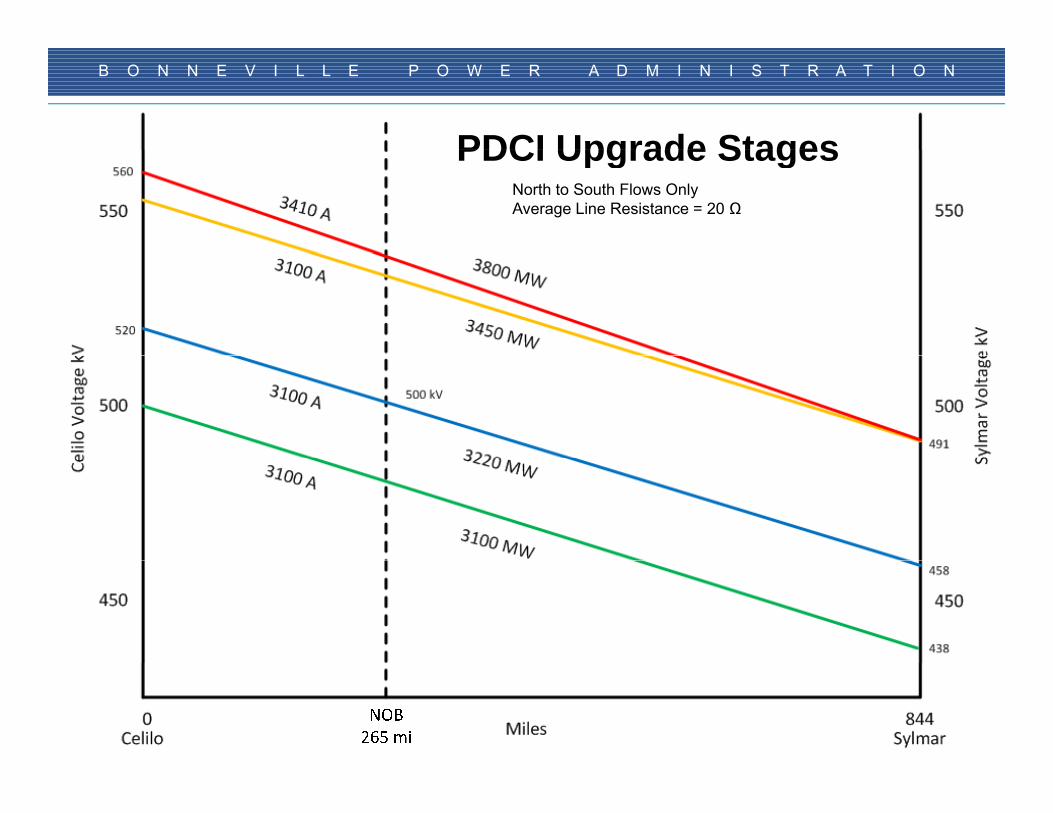
• Replace aging Celilo 4 converter terminal with a new p g g2 converter terminal rated ±560kV and 3410A and upgrade Celilo‐NOB transmission line insulators.
• Reliability driven project – must replace older unsupported technologies to maintain reliability.
• Initial upgrade to 3220MW with future opportunity to increase PDCI to 3800MW N‐Sto increase PDCI to 3800MW N‐S.
Slide 55
B O N N E V I L L E P O W E R A D M I N I S T R A T I O N
Slide 6 6
B O N N E V I L L E P O W E R A D M I N I S T R A T I O N
Upgrade BenefitsUpgrade Benefits
• Less frequent forced and maintenance outages
• One manufacturer technology and less equipment improves reliability, availability and maintainability.
• Simpler configuration could facilitate remote operation andSimpler configuration could facilitate remote operation and dynamic scheduling.
• Substantial reduction in spare parts inventory
• Power order via SCADA signal
• Lower transmission losses / Increase capacity N‐to‐S
• Reduce future O&M costs• Reduce future O&M costs
• Round power / back to back modes
Slide 77
B O N N E V I L L E P O W E R A D M I N I S T R A T I O N
PDCI Upgrade StagesPDCI Upgrade StagesNorth to South Flows OnlyAverage Line Resistance = 20 Ω
Slide 8 8
B O N N E V I L L E P O W E R A D M I N I S T R A T I O N
General Project ScheduleGeneral Project Schedule
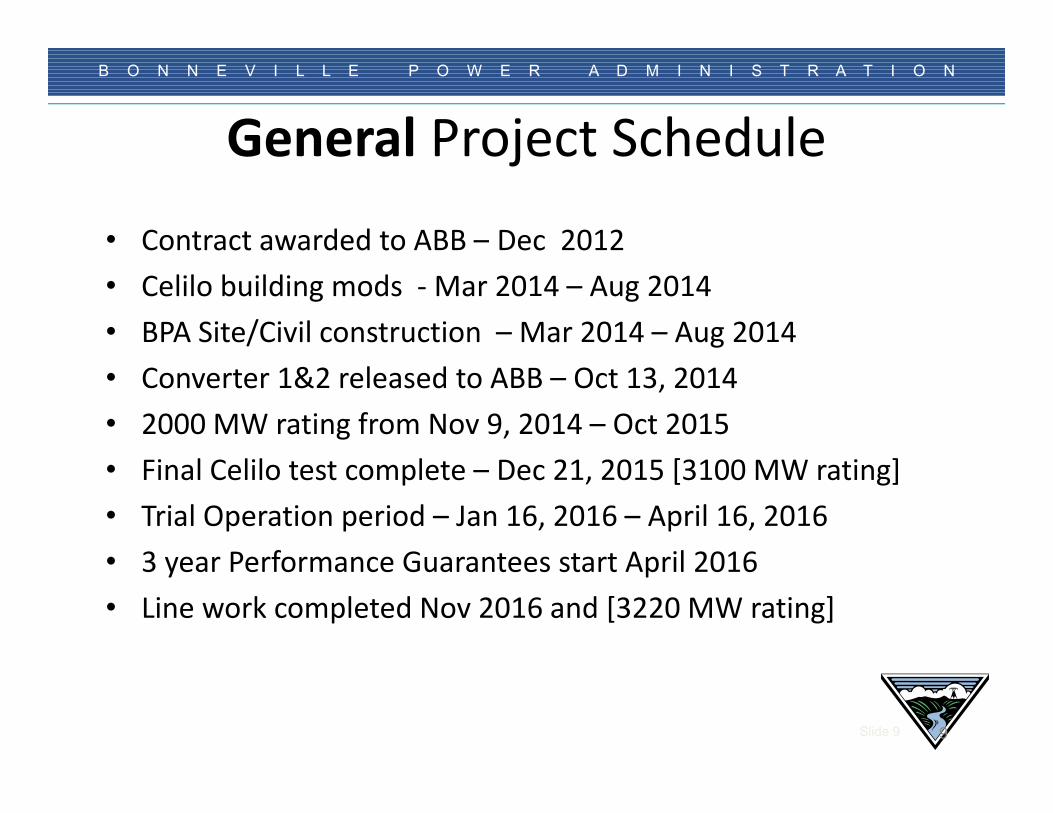
• Contract awarded to ABB – Dec 2012
• Celilo building mods ‐Mar 2014 – Aug 2014
• BPA Site/Civil construction – Mar 2014 – Aug 2014
• Converter 1&2 released to ABB – Oct 13, 2014
• 2000 MW rating from Nov 9, 2014 – Oct 2015
• Final Celilo test complete – Dec 21, 2015 [3100 MW rating]
• Trial Operation period – Jan 16, 2016 – April 16, 2016
• 3 year Performance Guarantees start April 2016• 3 year Performance Guarantees start April 2016
• Line work completed Nov 2016 and [3220 MW rating]
Slide 9 9
B O N N E V I L L E P O W E R A D M I N I S T R A T I O N
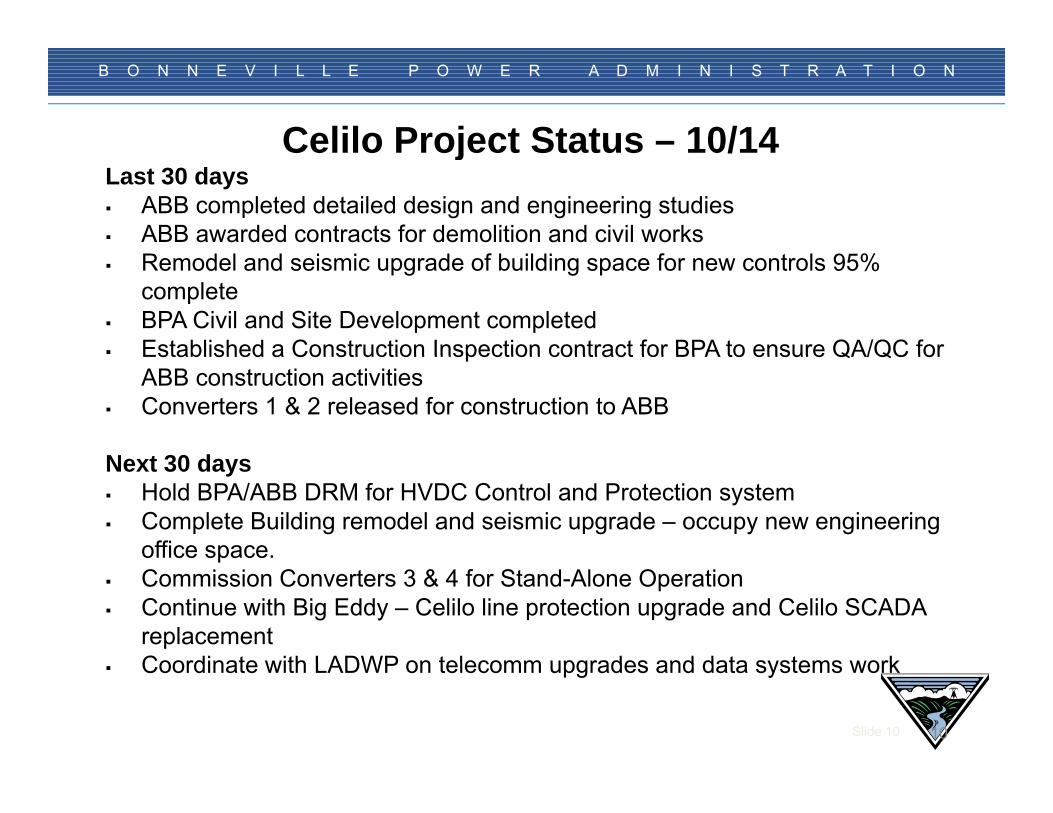
Celilo Project Status – 10/14Celilo Project Status 10/14Last 30 days ABB completed detailed design and engineering studies ABB awarded contracts for demolition and civil works Remodel and seismic upgrade of building space for new controls 95%
complete BPA Civil and Site Development completed Established a Construction Inspection contract for BPA to ensure QA/QC forEstablished a Construction Inspection contract for BPA to ensure QA/QC for
ABB construction activities Converters 1 & 2 released for construction to ABB
N t 30 dNext 30 days Hold BPA/ABB DRM for HVDC Control and Protection system Complete Building remodel and seismic upgrade – occupy new engineering
office space.p Commission Converters 3 & 4 for Stand-Alone Operation Continue with Big Eddy – Celilo line protection upgrade and Celilo SCADA
replacementCoordinate with LADWP on telecomm upgrades and data systems work
Slide 10 10
Coordinate with LADWP on telecomm upgrades and data systems work
B O N N E V I L L E P O W E R A D M I N I S T R A T I O N
Questions?
Slide 11 11

NWPP Schedulers ConferencePortland Oregong
October 21/22, 2014
Marketing Perspective 15 Minute Scheduling
Demetrios Fotiou
DISCLAIMERDISCLAIMER
• The views expressed in this presentation are those of the presenter and do not necessarily reflect the views of Powerex Corp., its employees or directors. It is a presentation for the purpose of discussion, to express p p p , pobservations and to provoke discussion. Some of the information was submitted to me, I did not check its accuracy Take this presentation for what it is worth aaccuracy. Take this presentation for what it is worth, a bunch of slides, a bunch of information, and some interpretations of that information.
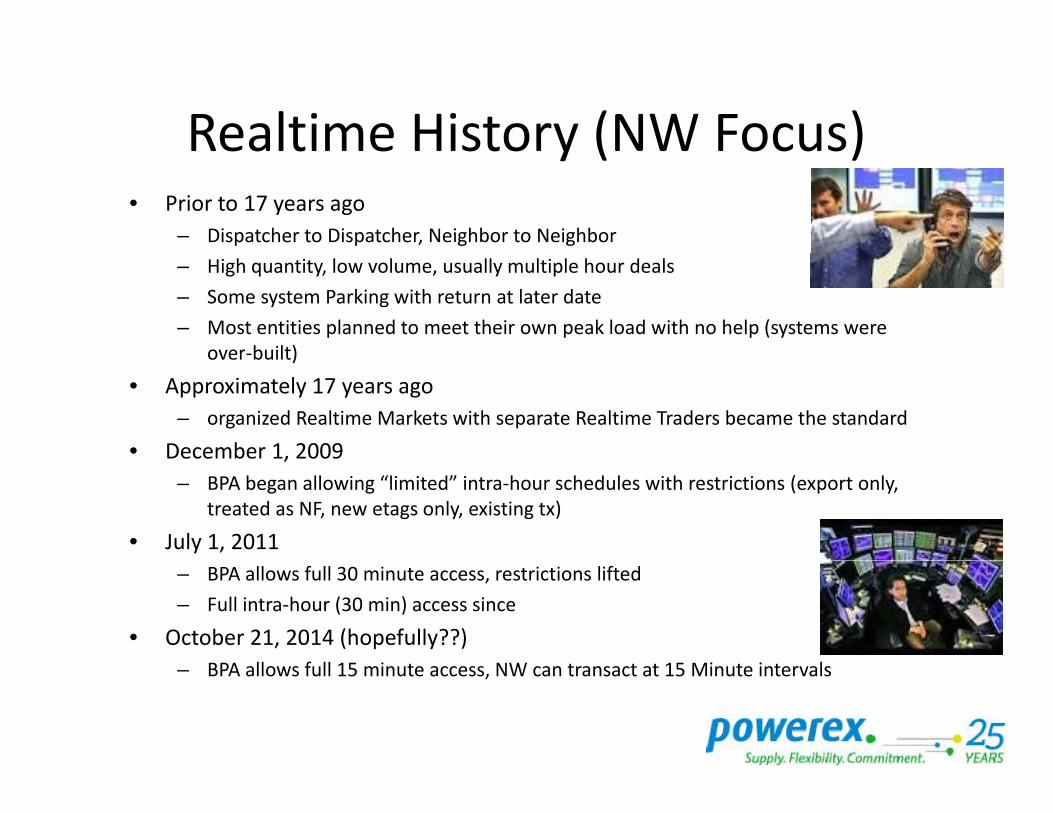
Realtime History (NW Focus)Realtime History (NW Focus)• Prior to 17 years ago
– Dispatcher to Dispatcher, Neighbor to Neighbor
– High quantity, low volume, usually multiple hour deals
– Some system Parking with return at later date
– Most entities planned to meet their own peak load with no help (systems were over‐built)over built)
• Approximately 17 years ago
– organized Realtime Markets with separate Realtime Traders became the standard
• December 1, 2009December 1, 2009
– BPA began allowing “limited” intra‐hour schedules with restrictions (export only, treated as NF, new etags only, existing tx)
• July 1, 2011
– BPA allows full 30 minute access, restrictions lifted
– Full intra‐hour (30 min) access since
• October 21, 2014 (hopefully??)
BPA ll f ll 15 i NW 15 Mi i l– BPA allows full 15 minute access, NW can transact at 15 Minute intervals
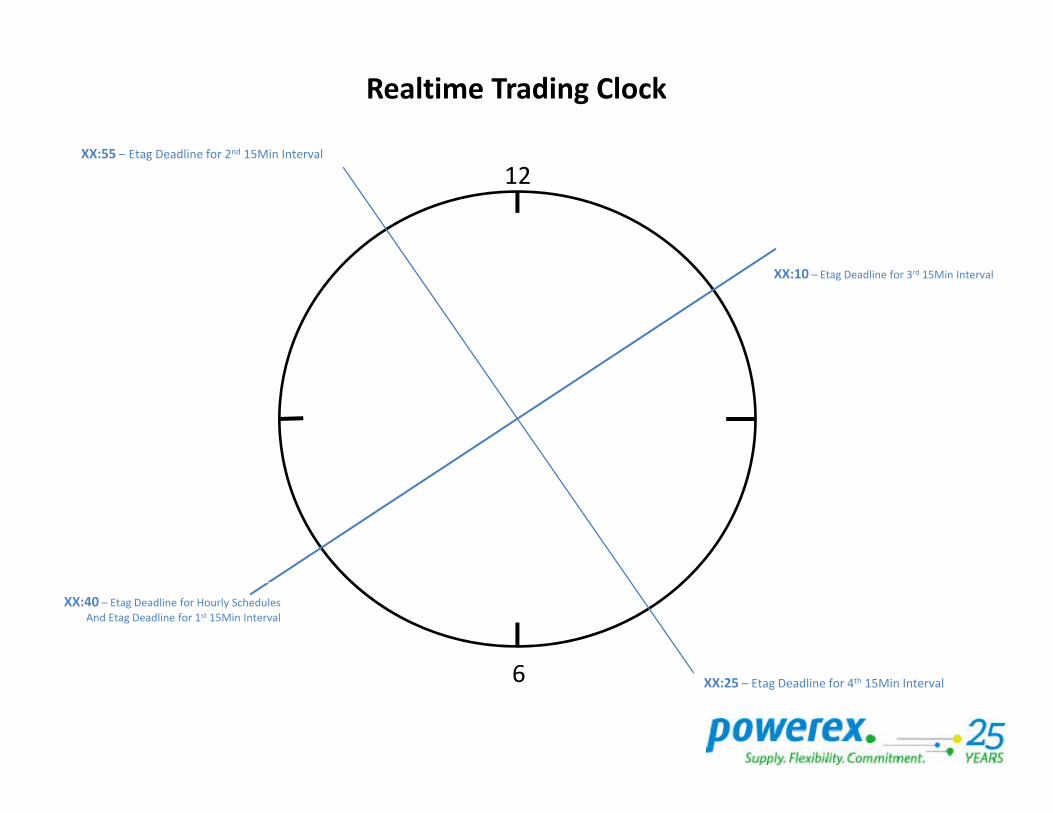
XX 55 E D dli f 2nd 15Mi I l
Realtime Trading Clock
XX:55 – Etag Deadline for 2nd 15Min Interval
12
XX:10 – Etag Deadline for 3rd 15Min Interval
XX:40 – Etag Deadline for Hourly Schedules
And Etag Deadline for 1st 15Min Interval
XX:25 – Etag Deadline for 4th 15Min Interval6
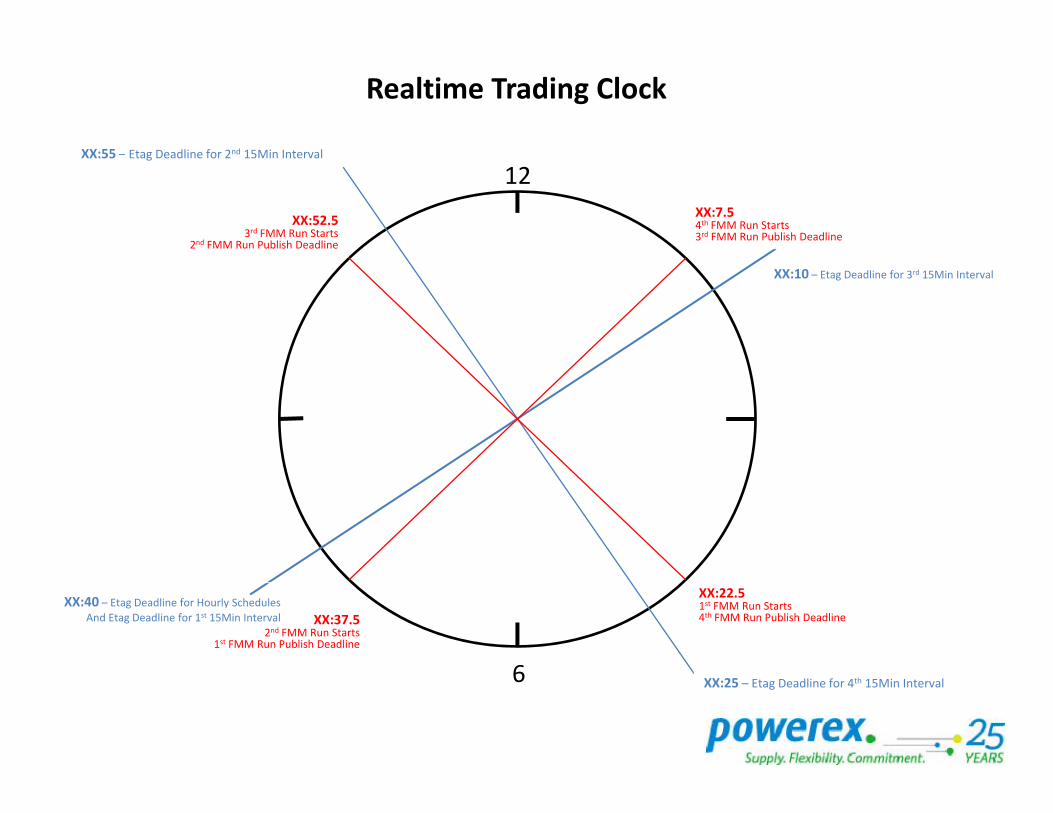
XX 55 E D dli f 2nd 15Mi I l
Realtime Trading Clock
XX:55 – Etag Deadline for 2nd 15Min Interval
XX:7.54th FMM Run Starts3rd FMM Run Publish Deadline
XX:52.53rd FMM Run Starts
2nd FMM Run Publish Deadline
12
XX:10 – Etag Deadline for 3rd 15Min Interval
XX:40 – Etag Deadline for Hourly Schedules
And Etag Deadline for 1st 15Min Interval
XX:22.51st FMM Run Starts4th FMM Run Publish DeadlineXX:37.5
2nd FMM Run Starts1st FMM Run Publish Deadline
XX:25 – Etag Deadline for 4th 15Min Interval6
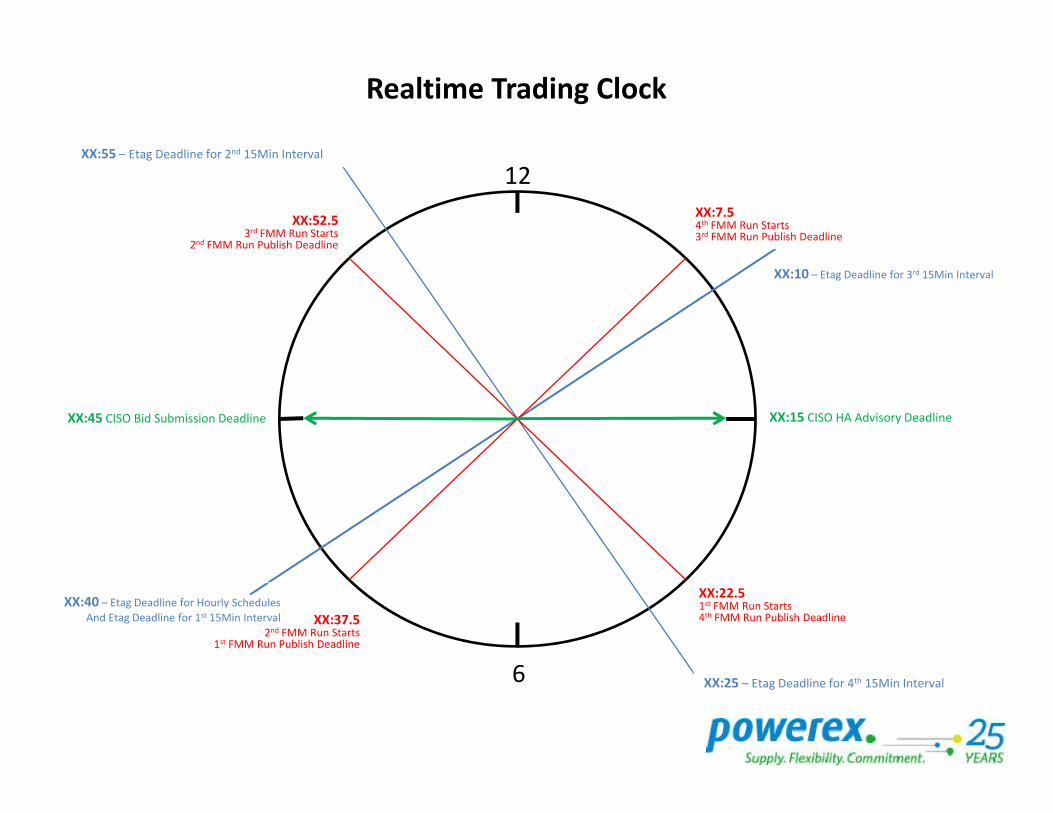
XX 55 E D dli f 2nd 15Mi I l
Realtime Trading Clock
XX:55 – Etag Deadline for 2nd 15Min Interval
XX:7.54th FMM Run Starts3rd FMM Run Publish Deadline
XX:52.53rd FMM Run Starts
2nd FMM Run Publish Deadline
12
XX:10 – Etag Deadline for 3rd 15Min Interval
XX:45 CISO Bid Submission Deadline XX:15 CISO HA Advisory Deadline
XX:40 – Etag Deadline for Hourly Schedules
And Etag Deadline for 1st 15Min Interval
XX:22.51st FMM Run Starts4th FMM Run Publish DeadlineXX:37.5
2nd FMM Run Starts1st FMM Run Publish Deadline
XX:25 – Etag Deadline for 4th 15Min Interval6
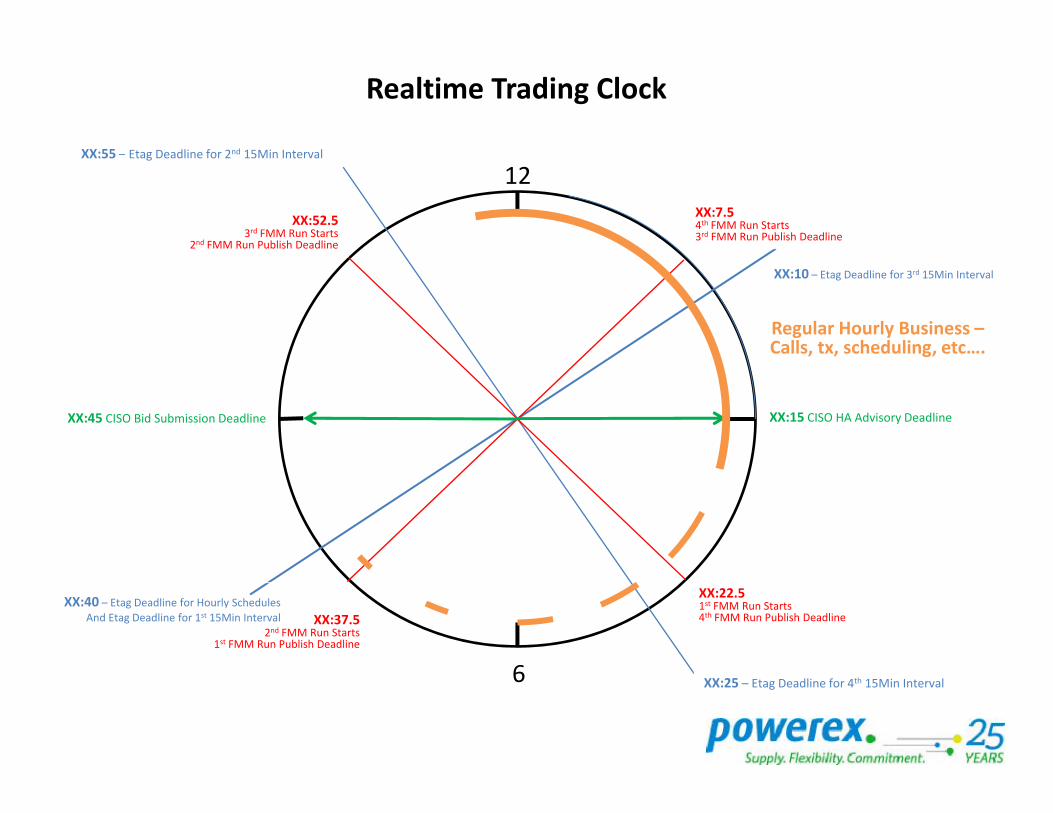
XX 55 E D dli f 2nd 15Mi I l
Realtime Trading Clock
XX:55 – Etag Deadline for 2nd 15Min Interval
XX:7.54th FMM Run Starts3rd FMM Run Publish Deadline
XX:52.53rd FMM Run Starts
2nd FMM Run Publish Deadline
12
XX:10 – Etag Deadline for 3rd 15Min Interval
Regular Hourly Business –Calls, tx, scheduling, etc….
XX:45 CISO Bid Submission Deadline XX:15 CISO HA Advisory Deadline
, , g,
XX:40 – Etag Deadline for Hourly Schedules
And Etag Deadline for 1st 15Min Interval
XX:22.51st FMM Run Starts4th FMM Run Publish DeadlineXX:37.5
2nd FMM Run Starts1st FMM Run Publish Deadline
XX:25 – Etag Deadline for 4th 15Min Interval6
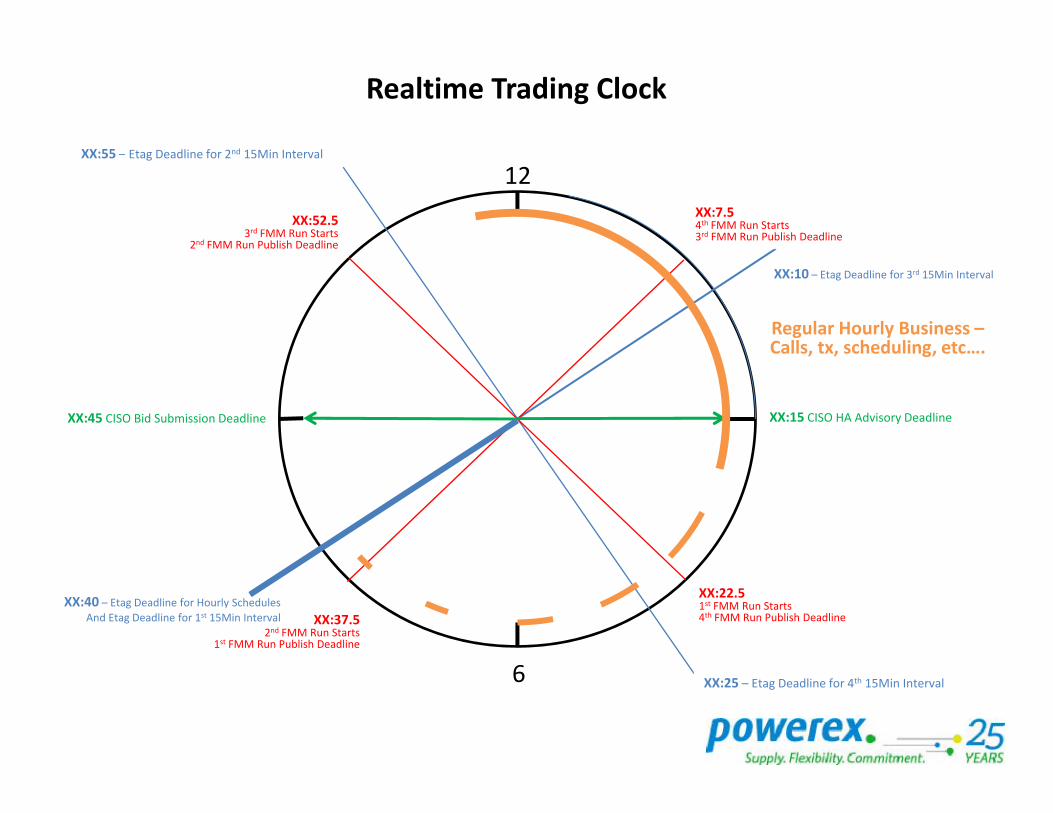
XX 55 E D dli f 2nd 15Mi I l
Realtime Trading Clock
XX:55 – Etag Deadline for 2nd 15Min Interval
XX:7.54th FMM Run Starts3rd FMM Run Publish Deadline
XX:52.53rd FMM Run Starts
2nd FMM Run Publish Deadline
12
XX:10 – Etag Deadline for 3rd 15Min Interval
Regular Hourly Business –Calls, tx, scheduling, etc….
XX:45 CISO Bid Submission Deadline XX:15 CISO HA Advisory Deadline
, , g,
XX:40 – Etag Deadline for Hourly Schedules
And Etag Deadline for 1st 15Min Interval
XX:22.51st FMM Run Starts4th FMM Run Publish DeadlineXX:37.5
2nd FMM Run Starts1st FMM Run Publish Deadline
XX:25 – Etag Deadline for 4th 15Min Interval6
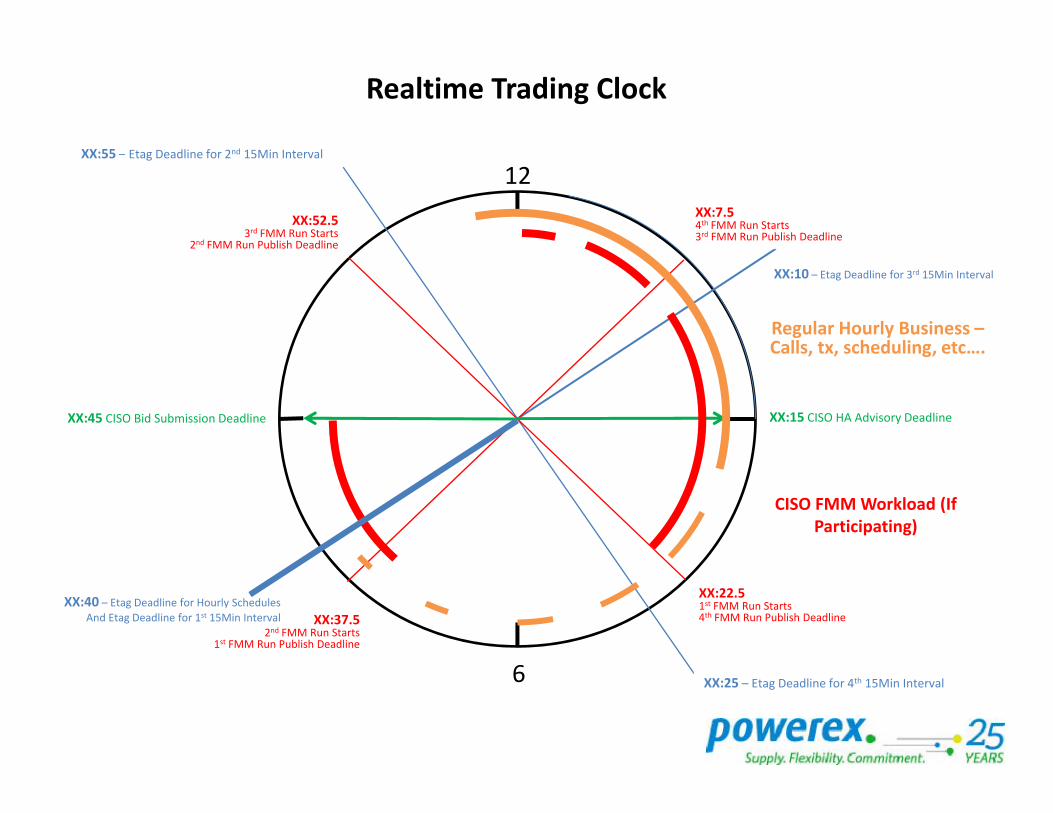
XX 55 E D dli f 2nd 15Mi I l
Realtime Trading Clock
XX:55 – Etag Deadline for 2nd 15Min Interval
XX:7.54th FMM Run Starts3rd FMM Run Publish Deadline
XX:52.53rd FMM Run Starts
2nd FMM Run Publish Deadline
12
XX:10 – Etag Deadline for 3rd 15Min Interval
Regular Hourly Business –Calls, tx, scheduling, etc….
XX:45 CISO Bid Submission Deadline XX:15 CISO HA Advisory Deadline
, , g,
CISO FMM Workload (If Participating)
XX:40 – Etag Deadline for Hourly Schedules
And Etag Deadline for 1st 15Min Interval
XX:22.51st FMM Run Starts4th FMM Run Publish DeadlineXX:37.5
2nd FMM Run Starts1st FMM Run Publish Deadline
XX:25 – Etag Deadline for 4th 15Min Interval6
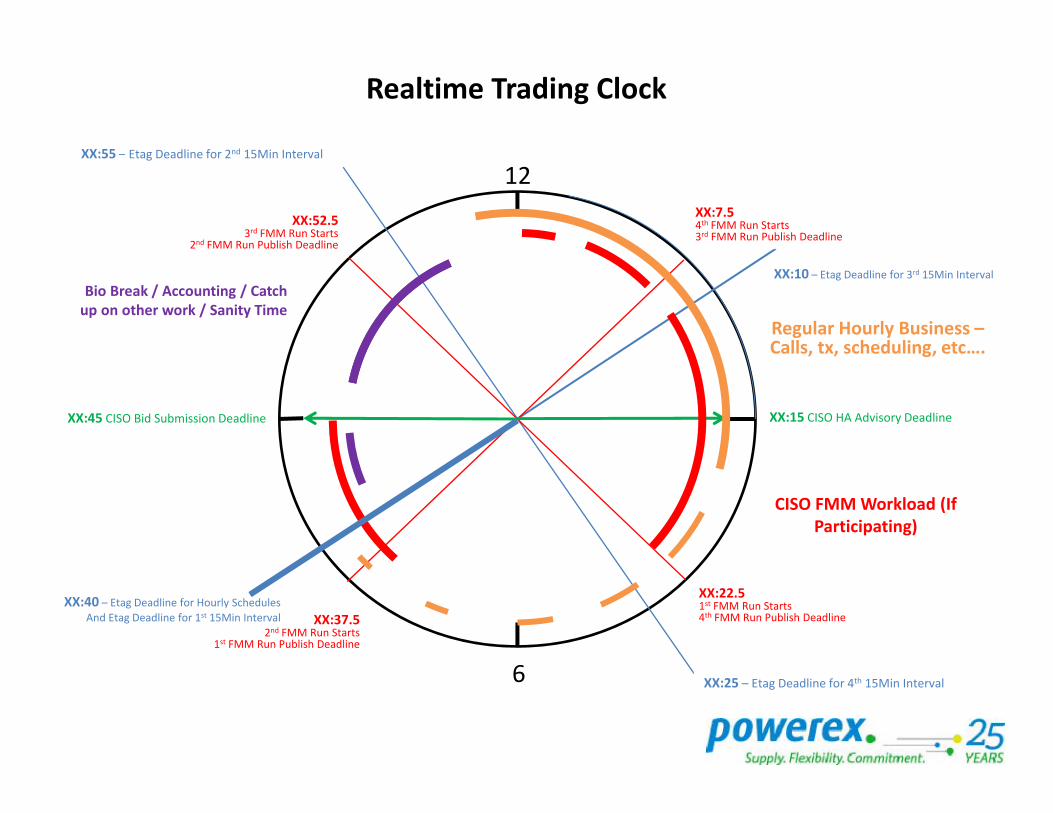
XX 55 E D dli f 2nd 15Mi I l
Realtime Trading Clock
XX:55 – Etag Deadline for 2nd 15Min Interval
XX:7.54th FMM Run Starts3rd FMM Run Publish Deadline
XX:52.53rd FMM Run Starts
2nd FMM Run Publish Deadline
12
XX:10 – Etag Deadline for 3rd 15Min Interval
Regular Hourly Business –Calls, tx, scheduling, etc….
Bio Break / Accounting / Catch up on other work / Sanity Time
XX:45 CISO Bid Submission Deadline XX:15 CISO HA Advisory Deadline
, , g,
CISO FMM Workload (If Participating)
XX:40 – Etag Deadline for Hourly Schedules
And Etag Deadline for 1st 15Min Interval
XX:22.51st FMM Run Starts4th FMM Run Publish DeadlineXX:37.5
2nd FMM Run Starts1st FMM Run Publish Deadline
XX:25 – Etag Deadline for 4th 15Min Interval6
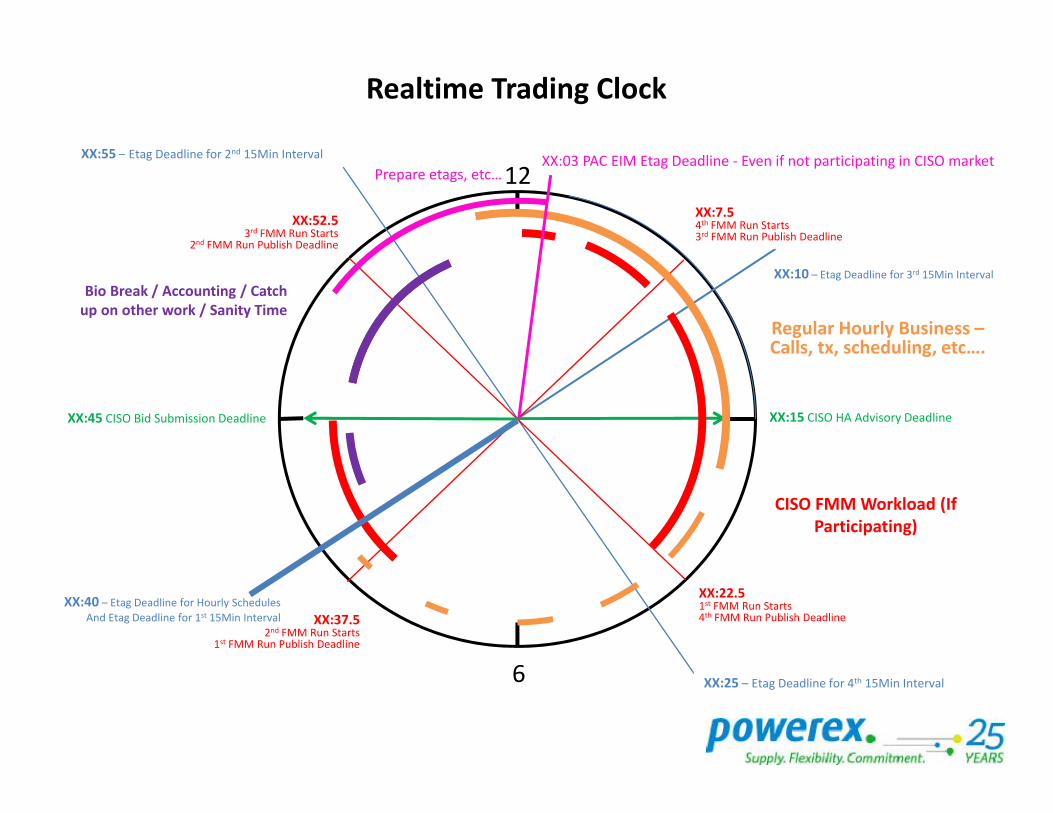
XX 55 E D dli f 2nd 15Mi I l
Realtime Trading Clock
XX:55 – Etag Deadline for 2nd 15Min Interval
XX:7.54th FMM Run Starts3rd FMM Run Publish Deadline
XX:52.53rd FMM Run Starts
2nd FMM Run Publish Deadline
12XX:03 PAC EIM Etag Deadline ‐ Even if not participating in CISO market
Prepare etags, etc…
XX:10 – Etag Deadline for 3rd 15Min Interval
Regular Hourly Business –Calls, tx, scheduling, etc….
Bio Break / Accounting / Catch up on other work / Sanity Time
XX:45 CISO Bid Submission Deadline XX:15 CISO HA Advisory Deadline
, , g,
CISO FMM Workload (If Participating)
XX:40 – Etag Deadline for Hourly Schedules
And Etag Deadline for 1st 15Min Interval
XX:22.51st FMM Run Starts4th FMM Run Publish DeadlineXX:37.5
2nd FMM Run Starts1st FMM Run Publish Deadline
XX:25 – Etag Deadline for 4th 15Min Interval6
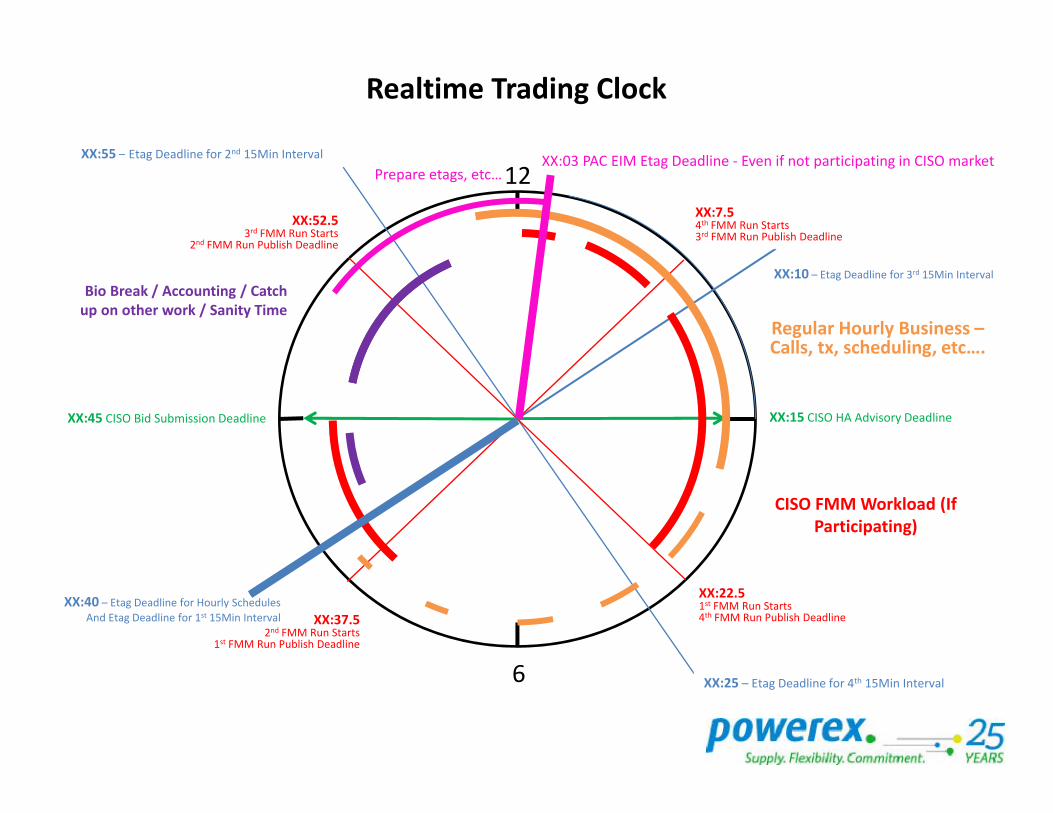
XX 55 E D dli f 2nd 15Mi I l
Realtime Trading Clock
XX:55 – Etag Deadline for 2nd 15Min Interval
XX:7.54th FMM Run Starts3rd FMM Run Publish Deadline
XX:52.53rd FMM Run Starts
2nd FMM Run Publish Deadline
12XX:03 PAC EIM Etag Deadline ‐ Even if not participating in CISO market
Prepare etags, etc…
XX:10 – Etag Deadline for 3rd 15Min Interval
Regular Hourly Business –Calls, tx, scheduling, etc….
Bio Break / Accounting / Catch up on other work / Sanity Time
XX:45 CISO Bid Submission Deadline XX:15 CISO HA Advisory Deadline
, , g,
CISO FMM Workload (If Participating)
XX:40 – Etag Deadline for Hourly Schedules
And Etag Deadline for 1st 15Min Interval
XX:22.51st FMM Run Starts4th FMM Run Publish DeadlineXX:37.5
2nd FMM Run Starts1st FMM Run Publish Deadline
XX:25 – Etag Deadline for 4th 15Min Interval6
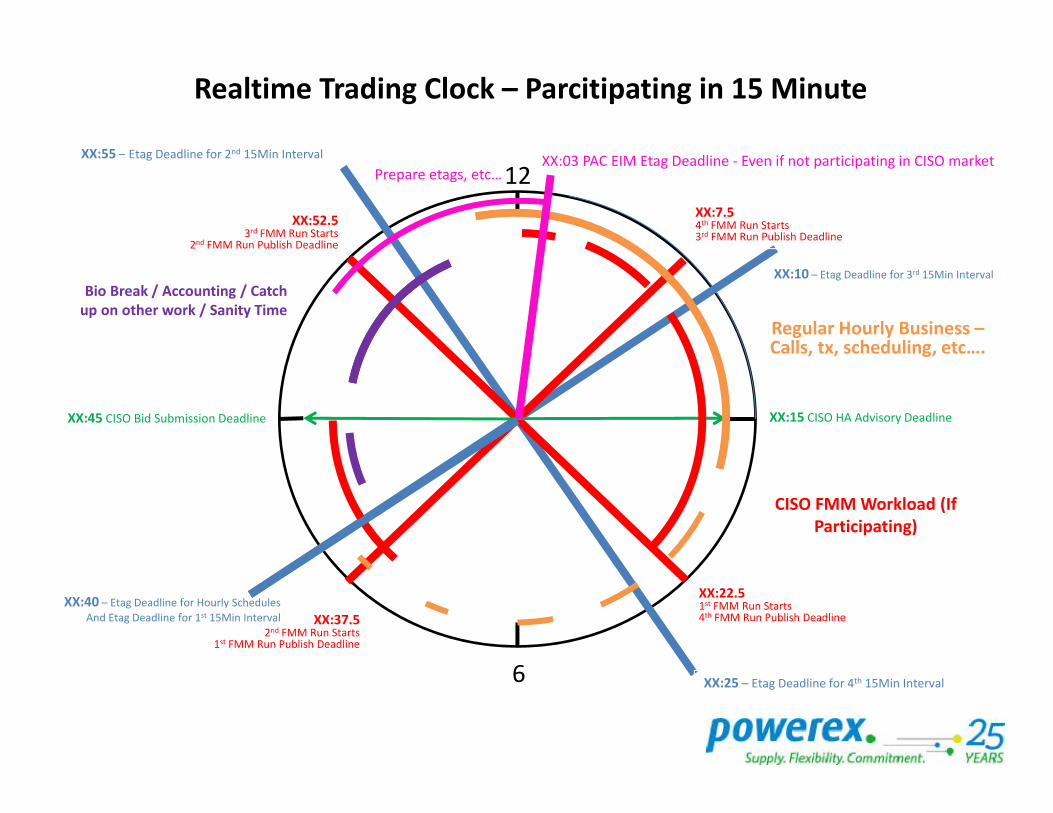
XX 55 E D dli f 2nd 15Mi I l
Realtime Trading Clock – Parcitipating in 15 Minute
XX:55 – Etag Deadline for 2nd 15Min Interval
XX:7.54th FMM Run Starts3rd FMM Run Publish Deadline
XX:52.53rd FMM Run Starts
2nd FMM Run Publish Deadline
12XX:03 PAC EIM Etag Deadline ‐ Even if not participating in CISO market
Prepare etags, etc…
XX:10 – Etag Deadline for 3rd 15Min Interval
Regular Hourly Business –Calls, tx, scheduling, etc….
Bio Break / Accounting / Catch up on other work / Sanity Time
XX:45 CISO Bid Submission Deadline XX:15 CISO HA Advisory Deadline
, , g,
CISO FMM Workload (If Participating)
XX:40 – Etag Deadline for Hourly Schedules
And Etag Deadline for 1st 15Min Interval
XX:22.51st FMM Run Starts4th FMM Run Publish DeadlineXX:37.5
2nd FMM Run Starts1st FMM Run Publish Deadline
XX:25 – Etag Deadline for 4th 15Min Interval6
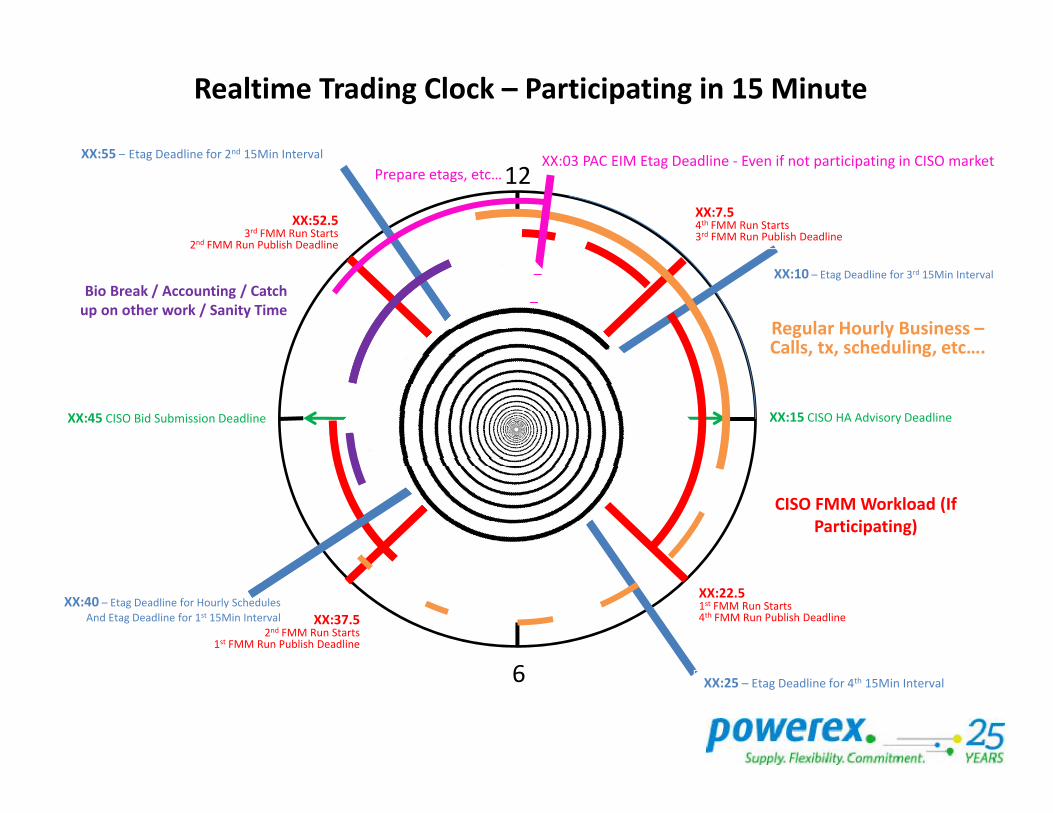
XX 55 E D dli f 2nd 15Mi I l
Realtime Trading Clock – Participating in 15 Minute
XX:55 – Etag Deadline for 2nd 15Min Interval
XX:7.54th FMM Run Starts3rd FMM Run Publish Deadline
XX:52.53rd FMM Run Starts
2nd FMM Run Publish Deadline
12XX:03 PAC EIM Etag Deadline ‐ Even if not participating in CISO market
Prepare etags, etc…
XX:10 – Etag Deadline for 3rd 15Min Interval
Regular Hourly Business –Calls, tx, scheduling, etc….
Bio Break / Accounting / Catch up on other work / Sanity Time
XX:45 CISO Bid Submission Deadline XX:15 CISO HA Advisory Deadline
, , g,
CISO FMM Workload (If Participating)
XX:40 – Etag Deadline for Hourly Schedules
And Etag Deadline for 1st 15Min Interval
XX:22.51st FMM Run Starts4th FMM Run Publish DeadlineXX:37.5
2nd FMM Run Starts1st FMM Run Publish Deadline
XX:25 – Etag Deadline for 4th 15Min Interval6
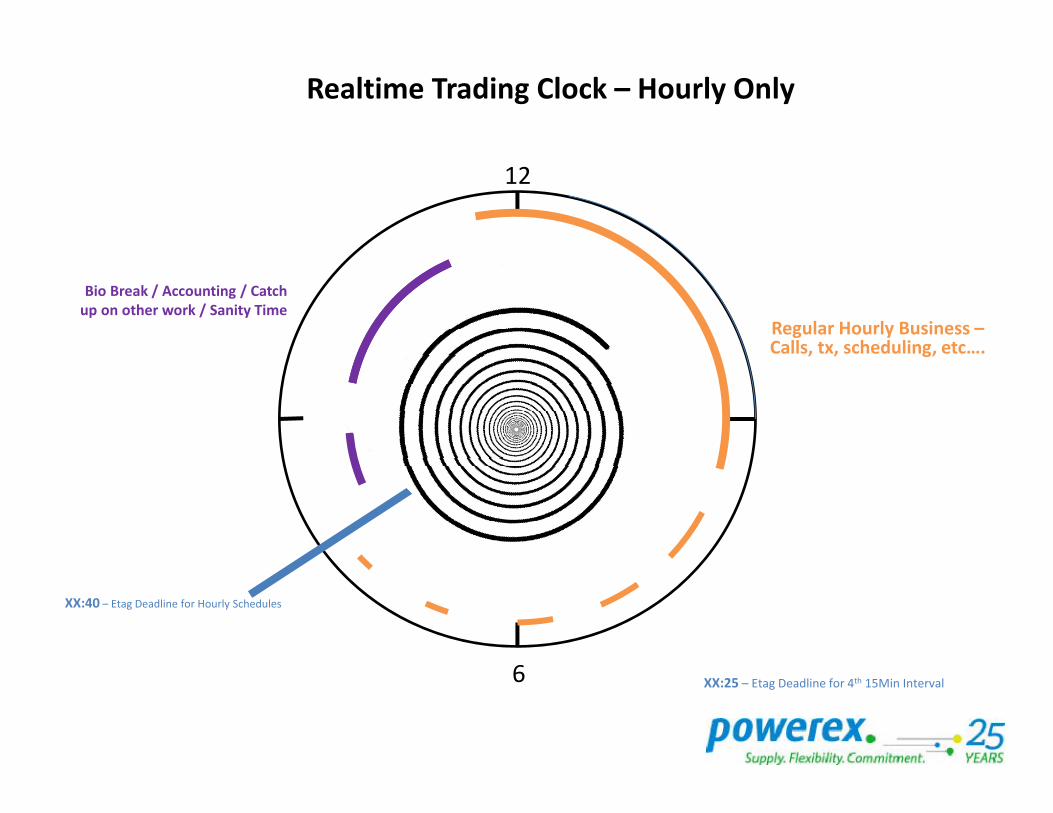
Realtime Trading Clock – Hourly Only
12
Regular Hourly Business –Calls, tx, scheduling, etc….
Bio Break / Accounting / Catch up on other work / Sanity Time
, , g,
XX:40 – Etag Deadline for Hourly Schedules
XX:25 – Etag Deadline for 4th 15Min Interval6

Lets Talk About RampsLets Talk About Ramps
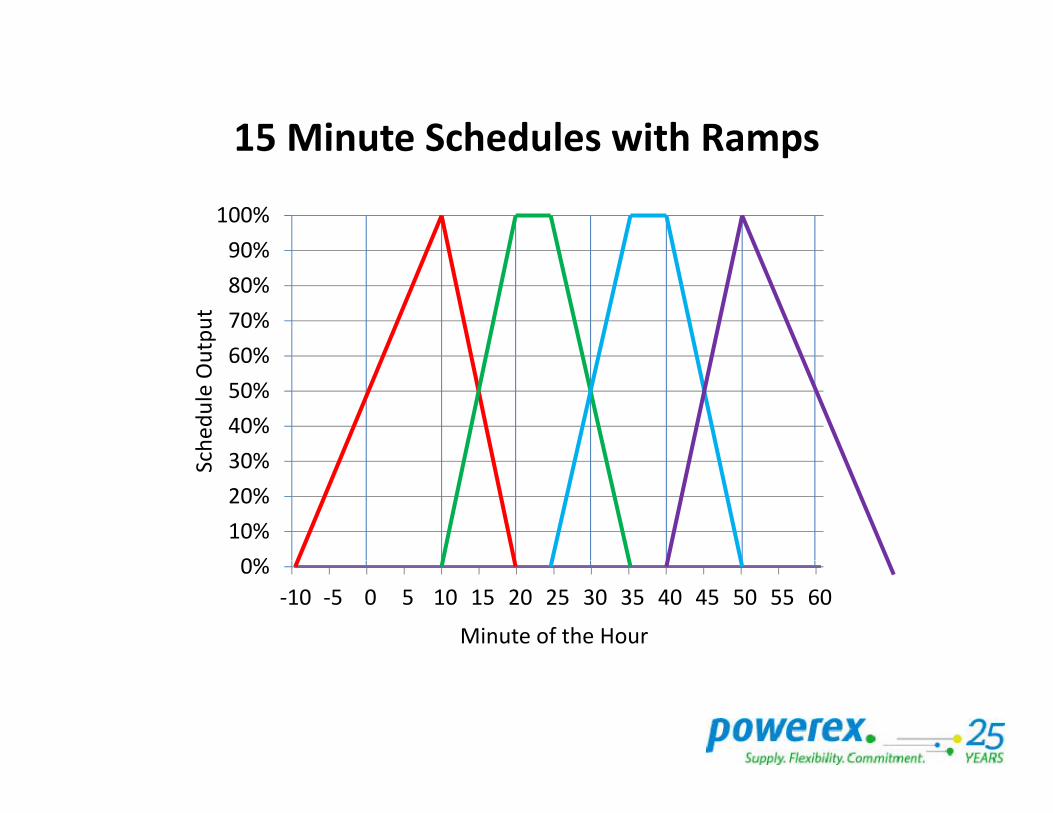
15 Minute Schedules with Ramps
90%
100%
15 Minute Schedules with Ramps
60%
70%
80%
90%
utput
30%
40%
50%
60%
ched
ule Ou
0%
10%
20%
30%Sc
0%
‐10 ‐5 0 5 10 15 20 25 30 35 40 45 50 55 60
Minute of the Hour
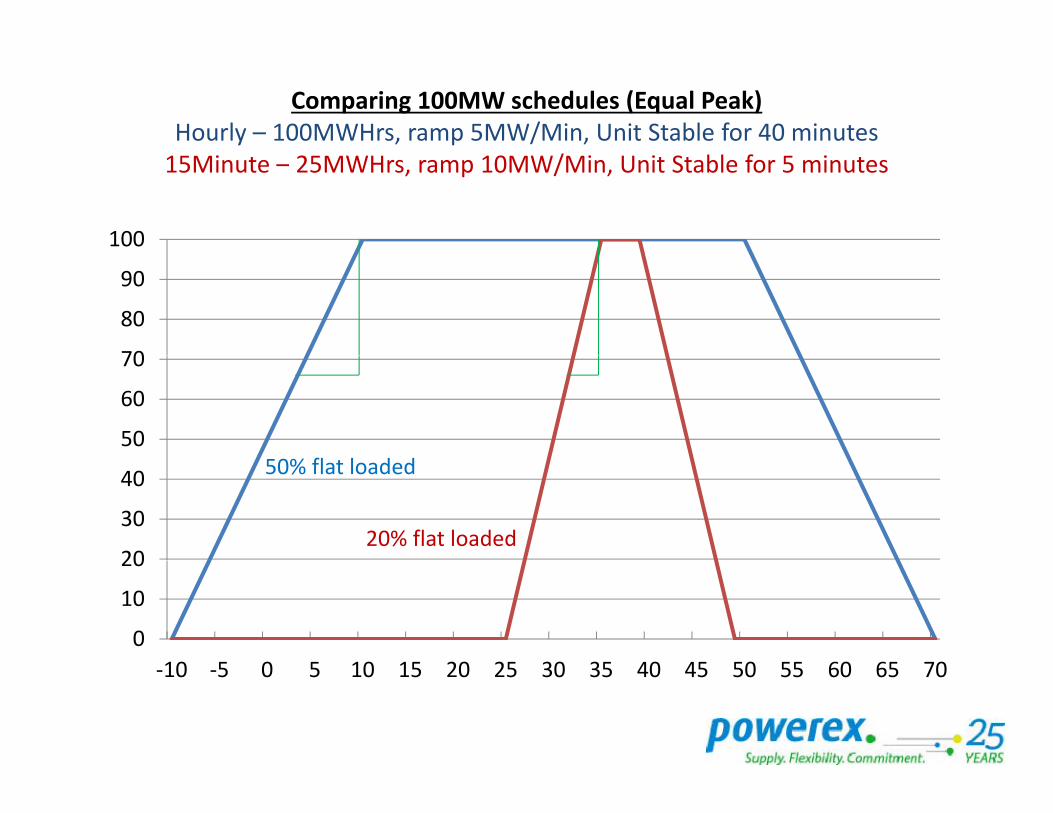
Comparing 100MW schedules (Equal Peak)Hourly – 100MWHrs, ramp 5MW/Min, Unit Stable for 40 minutes15Minute – 25MWHrs, ramp 10MW/Min, Unit Stable for 5 minutes
100
70
80
90
50
60
70
fl l d d
20
30
40 50% flat loaded
20% flat loaded
0
10
20
10 5 0 5 10 15 20 25 30 35 40 45 50 55 60 65 70‐10 ‐5 0 5 10 15 20 25 30 35 40 45 50 55 60 65 70
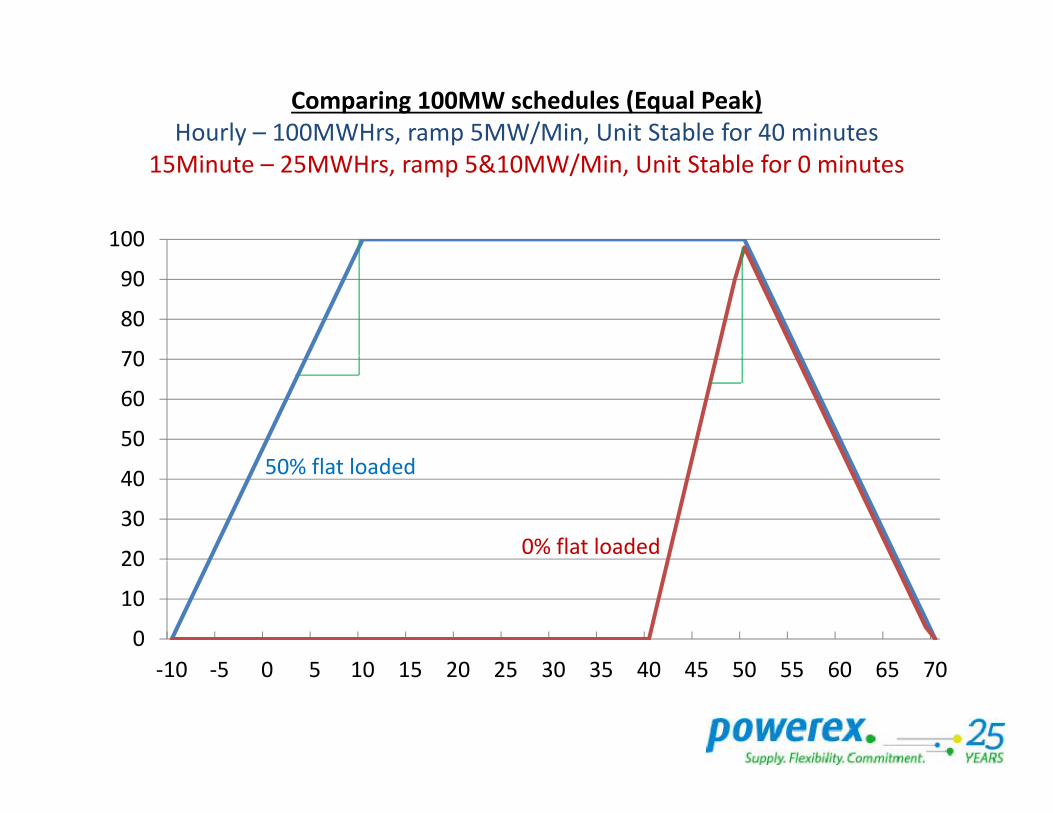
Comparing 100MW schedules (Equal Peak)Hourly – 100MWHrs, ramp 5MW/Min, Unit Stable for 40 minutes
15Minute – 25MWHrs, ramp 5&10MW/Min, Unit Stable for 0 minutes
100
70
80
90
50
60
70
fl l d d
20
30
40 50% flat loaded
0% flat loaded
0
10
20
10 5 0 5 10 15 20 25 30 35 40 45 50 55 60 65 70‐10 ‐5 0 5 10 15 20 25 30 35 40 45 50 55 60 65 70
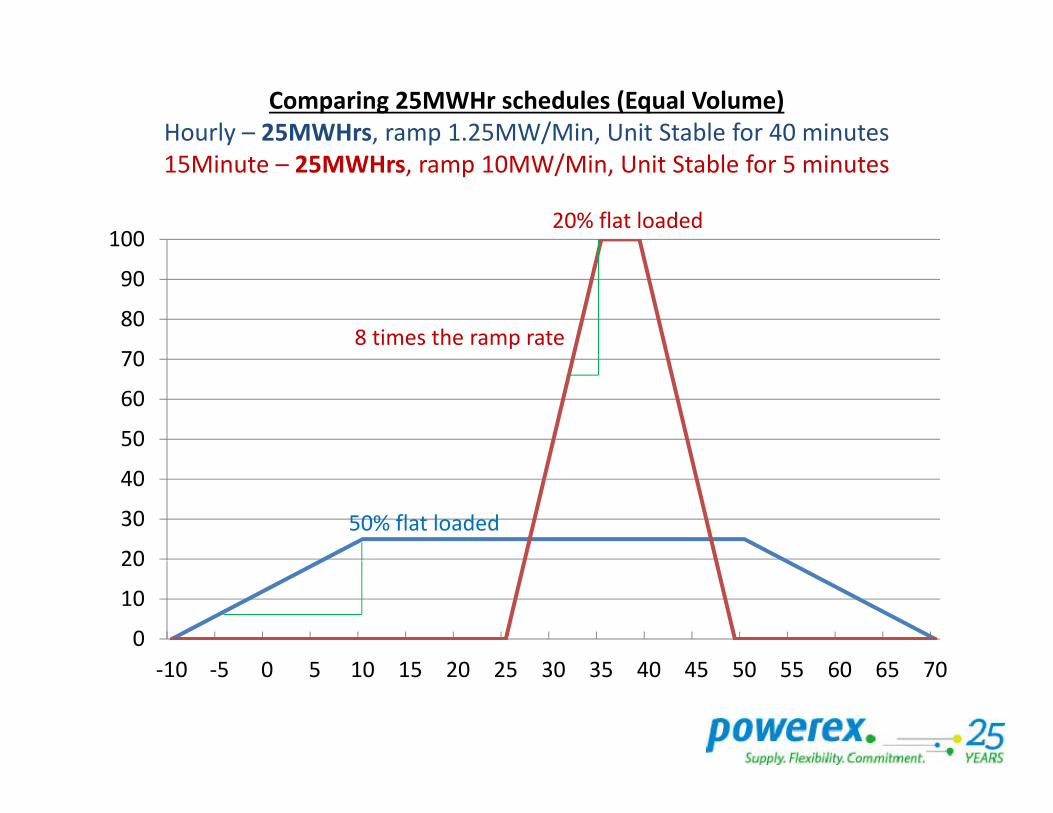
Comparing 25MWHr schedules (Equal Volume)Hourly – 25MWHrs, ramp 1.25MW/Min, Unit Stable for 40 minutes15Minute – 25MWHrs, ramp 10MW/Min, Unit Stable for 5 minutes
10020% flat loaded
70
80
90
8 times the ramp rate
50
60
70
20
30
40
50% flat loaded
0
10
20
10 5 0 5 10 15 20 25 30 35 40 45 50 55 60 65 70‐10 ‐5 0 5 10 15 20 25 30 35 40 45 50 55 60 65 70

Costs and ImpactsCosts and Impacts
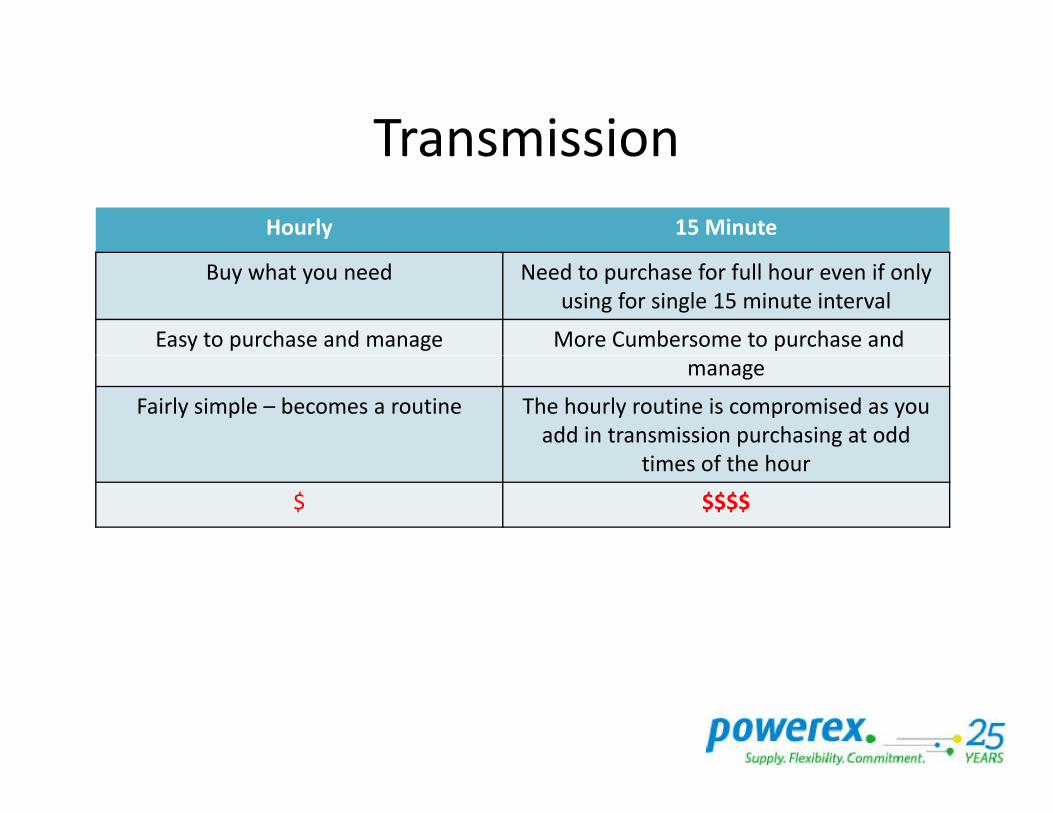
TransmissionTransmission
Hourly 15 Minute
Buy what you need Need to purchase for full hour even if only using for single 15 minute interval
Easy to purchase and manage More Cumbersome to purchase and manage
Fairly simple – becomes a routine The hourly routine is compromised as you add in transmission purchasing at odd
ti f th htimes of the hour
$ $$$$
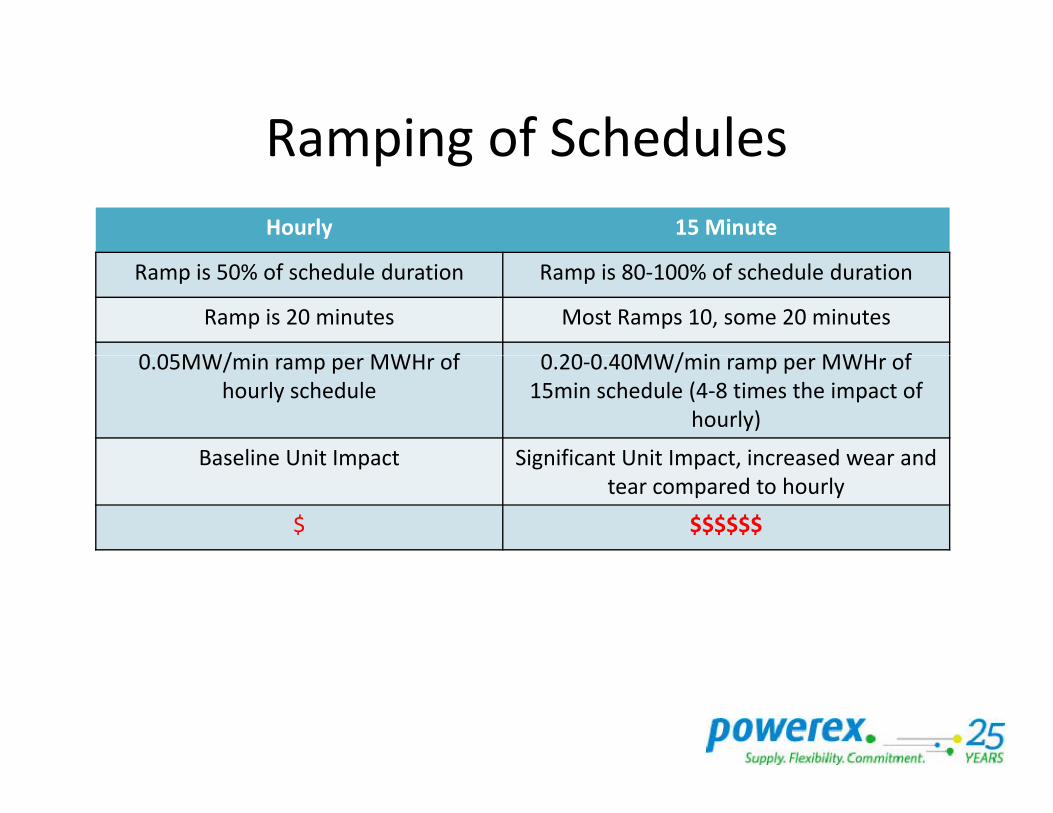
Ramping of SchedulesRamping of Schedules
Hourly 15 Minute
Ramp is 50% of schedule duration Ramp is 80‐100% of schedule duration
Ramp is 20 minutes Most Ramps 10, some 20 minutes
0 05MW/ i MWH f 0 20 0 40MW/ i MWH f0.05MW/min ramp per MWHr of hourly schedule
0.20‐0.40MW/min ramp per MWHr of 15min schedule (4‐8 times the impact of
hourly)
Baseline Unit Impact Significant Unit Impact increased wear andBaseline Unit Impact Significant Unit Impact, increased wear and tear compared to hourly
$ $$$$$$
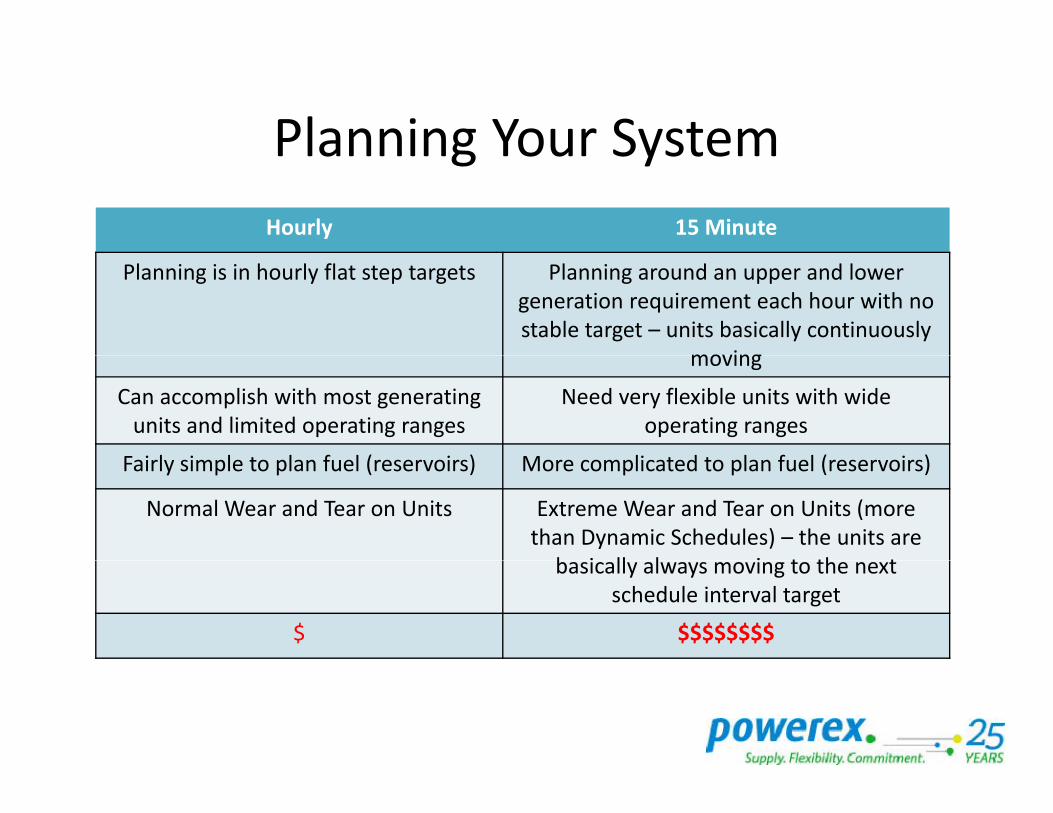
Planning Your SystemPlanning Your System
Hourly 15 Minute
Planning is in hourly flat step targets Planning around an upper and lower generation requirement each hour with no stable target – units basically continuously
movingmoving
Can accomplish with most generating units and limited operating ranges
Need very flexible units with wide operating ranges
F i l i l t l f l ( i ) M li t d t l f l ( i )Fairly simple to plan fuel (reservoirs) More complicated to plan fuel (reservoirs)
Normal Wear and Tear on Units Extreme Wear and Tear on Units (more than Dynamic Schedules) – the units are
b i ll l i t th tbasically always moving to the next schedule interval target
$ $$$$$$$$
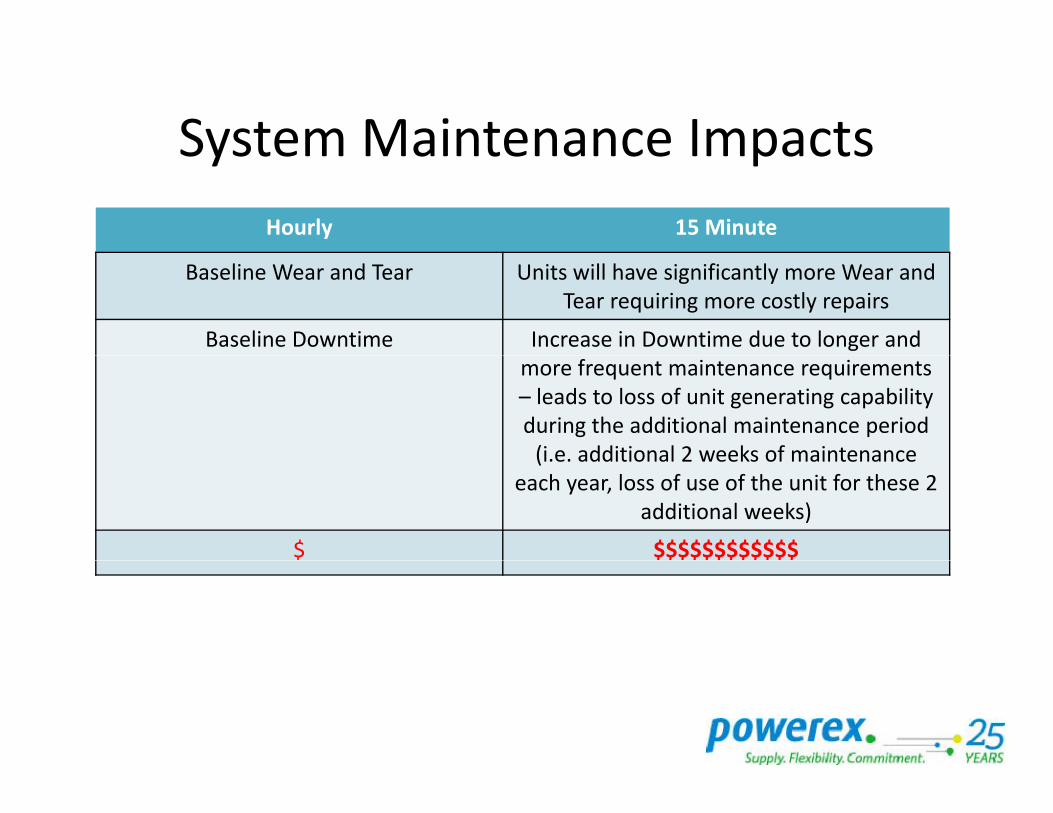
System Maintenance ImpactsSystem Maintenance Impacts
Hourly 15 Minute
Baseline Wear and Tear Units will have significantly more Wear and Tear requiring more costly repairs
Baseline Downtime Increase in Downtime due to longer and more frequent maintenance requirements – leads to loss of unit generating capability during the additional maintenance period(i e additional 2 weeks of maintenance(i.e. additional 2 weeks of maintenance
each year, loss of use of the unit for these 2 additional weeks)
$ $$$$$$$$$$$$
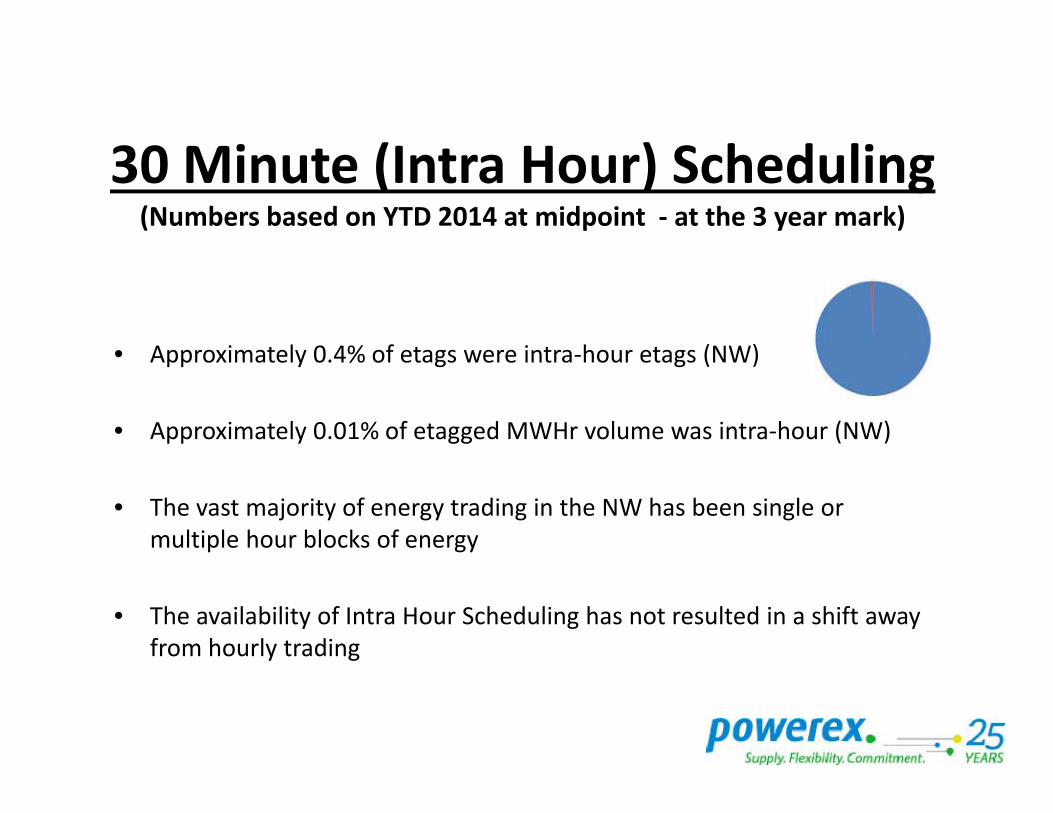
30 Mi t (I t H ) S h d li30 Minute (Intra Hour) Scheduling(Numbers based on YTD 2014 at midpoint ‐ at the 3 year mark)
• Approximately 0 4% of etags were intra‐hour etags (NW)• Approximately 0.4% of etags were intra‐hour etags (NW)
• Approximately 0.01% of etagged MWHr volume was intra‐hour (NW)
• The vast majority of energy trading in the NW has been single or multiple hour blocks of energy
• The availability of Intra Hour Scheduling has not resulted in a shift away from hourly trading
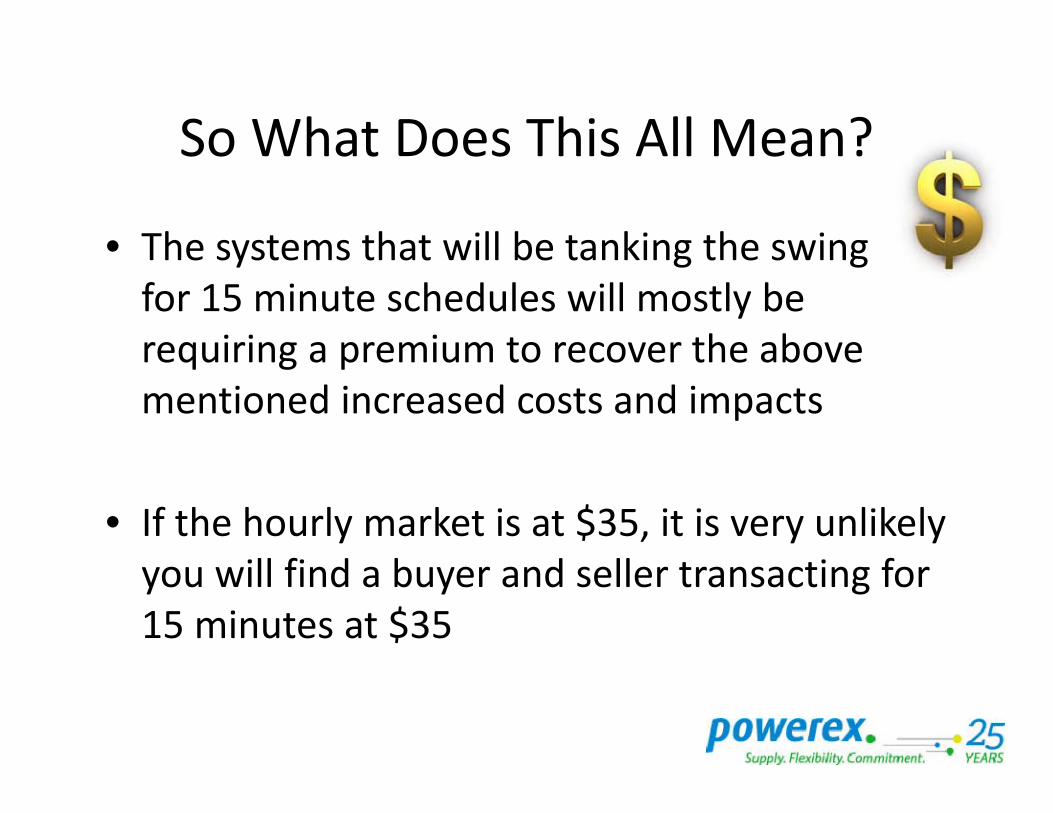
So What Does This All Mean?So What Does This All Mean?
• The systems that will be tanking the swingThe systems that will be tanking the swing for 15 minute schedules will mostly be requiring a premium to recover the aboverequiring a premium to recover the above mentioned increased costs and impacts
• If the hourly market is at $35, it is very unlikely ill fi d b d ll i fyou will find a buyer and seller transacting for
15 minutes at $35
It Never Hurts To Call And AskIt Never Hurts To Call And Ask
• Depending on other business how busy youDepending on other business, how busy you are, how your system is set up, you still may be able to accommodate 15 minutebe able to accommodate 15 minute scheduling at more moderate prices, so……..
• IT NEVER HURTS TO CALL AND ASK!
BY LOU MIRANDABONNEVILLE POWER ADMINISTRATIONBONNEVILLE POWER ADMINISTRATION
TRANSMISSION SERVICES
NWPP SCHEDULERS MEETINGOCT 21-22, 2014
DOUBLETREE BY HILTON – LLOYD DISTRICT1000 NE MULTNOMAH, PORTLAND, OR 97232
1
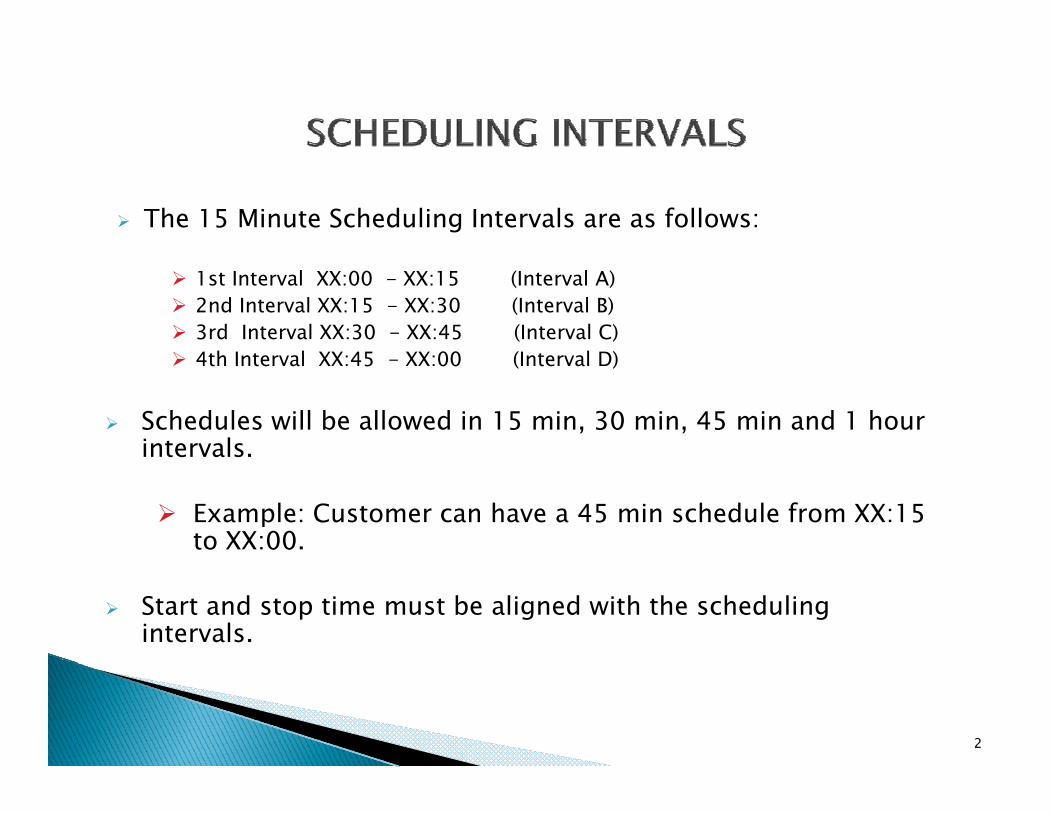
The 15 Minute Scheduling Intervals are as follows:
1st Interval XX:00 - XX:15 (Interval A) 2nd Interval XX:15 - XX:30 (Interval B) 3rd Interval XX:30 - XX:45 (Interval C) 4th Interval XX:45 XX:00 (Interval D) 4th Interval XX:45 - XX:00 (Interval D)
Schedules will be allowed in 15 min, 30 min, 45 min and 1 hour intervals.
Example: Customer can have a 45 min schedule from XX:15 to XX:00.
Start and stop time must be aligned with the scheduling intervals.
2
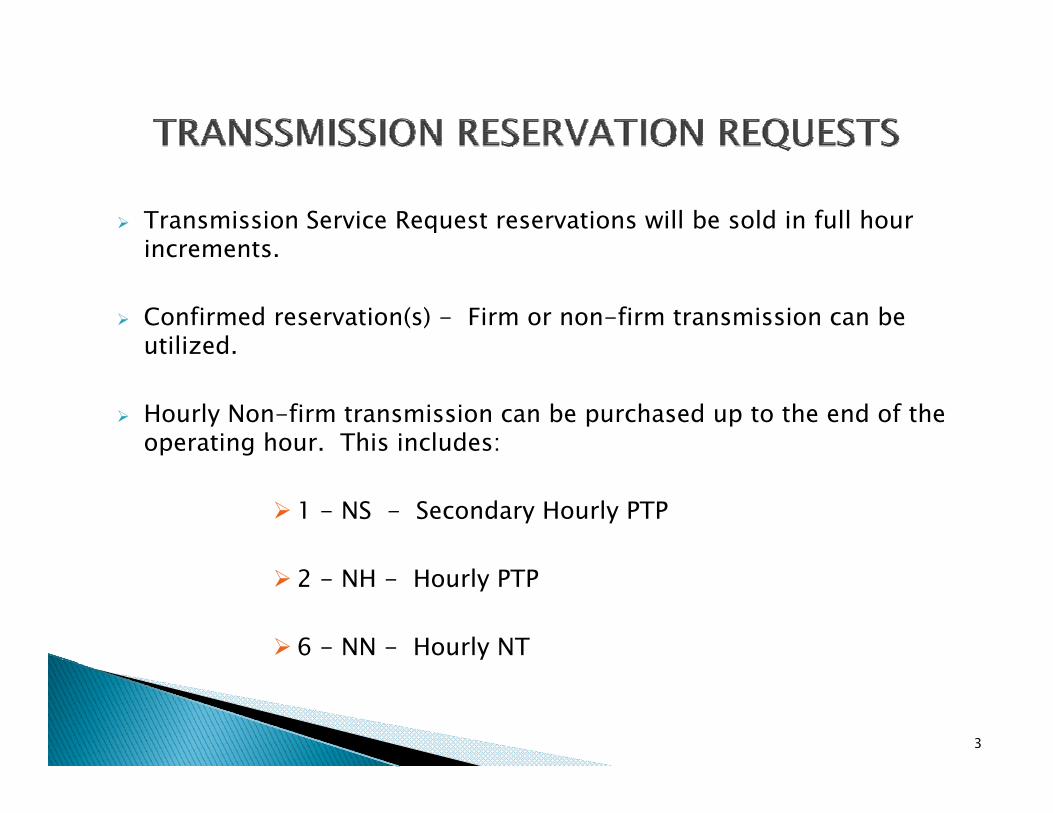
Transmission Service Request reservations will be sold in full hour incrementsincrements.
Confirmed reservation(s) - Firm or non-firm transmission can be utilized.
Hourly Non-firm transmission can be purchased up to the end of the operating hour. This includes:
1 - NS - Secondary Hourly PTP
2 - NH - Hourly PTP
6 - NN - Hourly NT
3
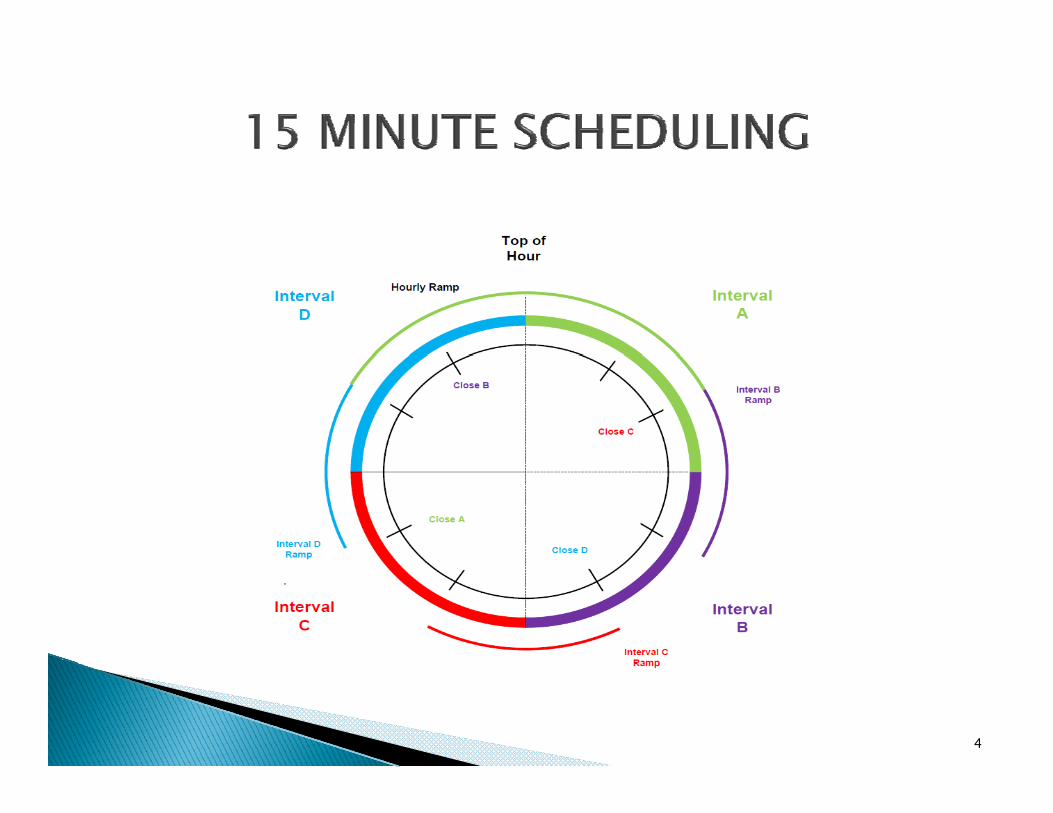
4
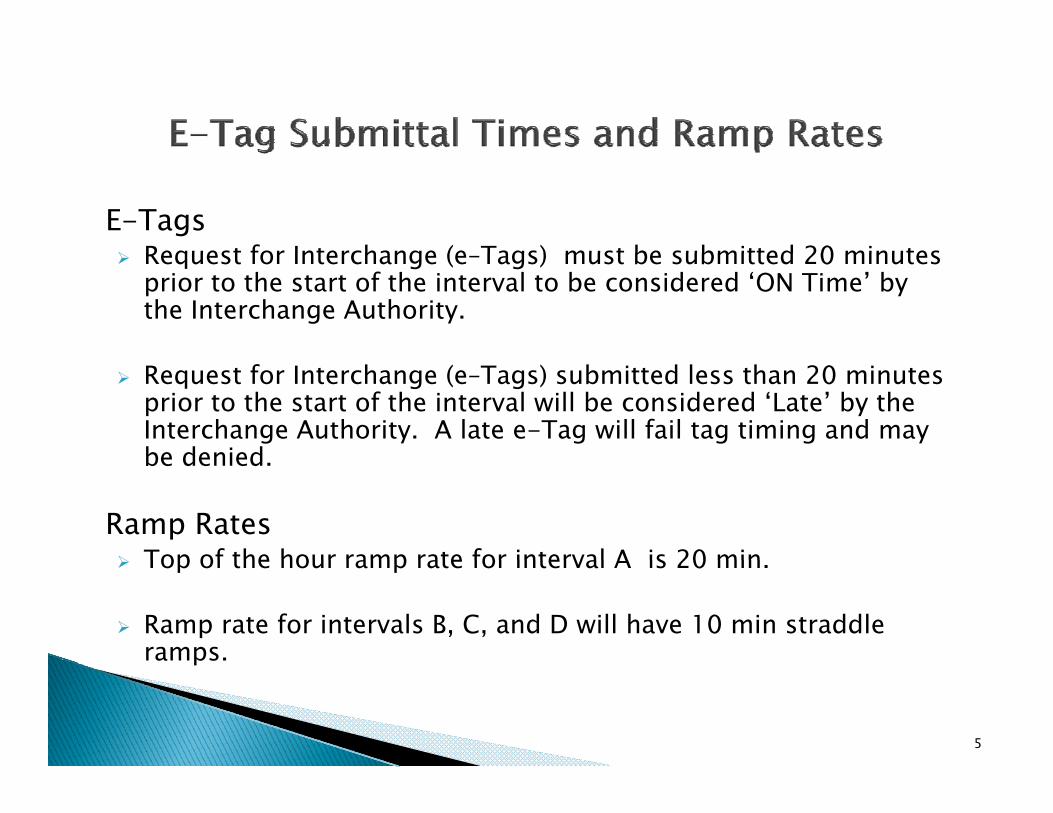
E-Tags Request for Interchange (e Tags) must be submitted 20 minutes Request for Interchange (e–Tags) must be submitted 20 minutes
prior to the start of the interval to be considered ‘ON Time’ by the Interchange Authority.
Request for Interchange (e–Tags) submitted less than 20 minutes prior to the start of the interval will be considered ‘Late’ by the Interchange Authority. A late e-Tag will fail tag timing and may be deniedbe denied.
Ramp Rates Top of the hour ramp rate for interval A is 20 min Top of the hour ramp rate for interval A is 20 min.
Ramp rate for intervals B, C, and D will have 10 min straddle ramps.p
5
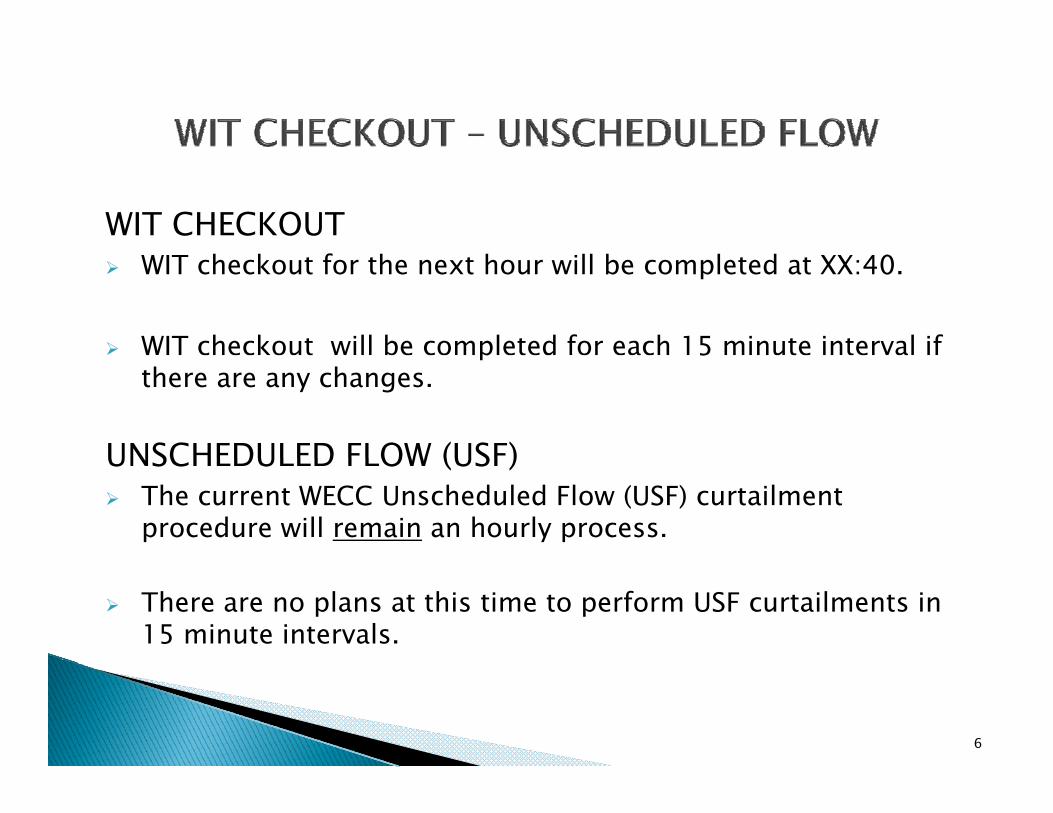
WIT CHECKOUT WIT checkout for the next hour will be completed at XX:40.
WIT checkout will be completed for each 15 minute interval if p 5there are any changes.
UNSCHEDULED FLOW (USF)UNSCHEDULED FLOW (USF) The current WECC Unscheduled Flow (USF) curtailment
procedure will remain an hourly process.
There are no plans at this time to perform USF curtailments in 15 minute intervals.
6
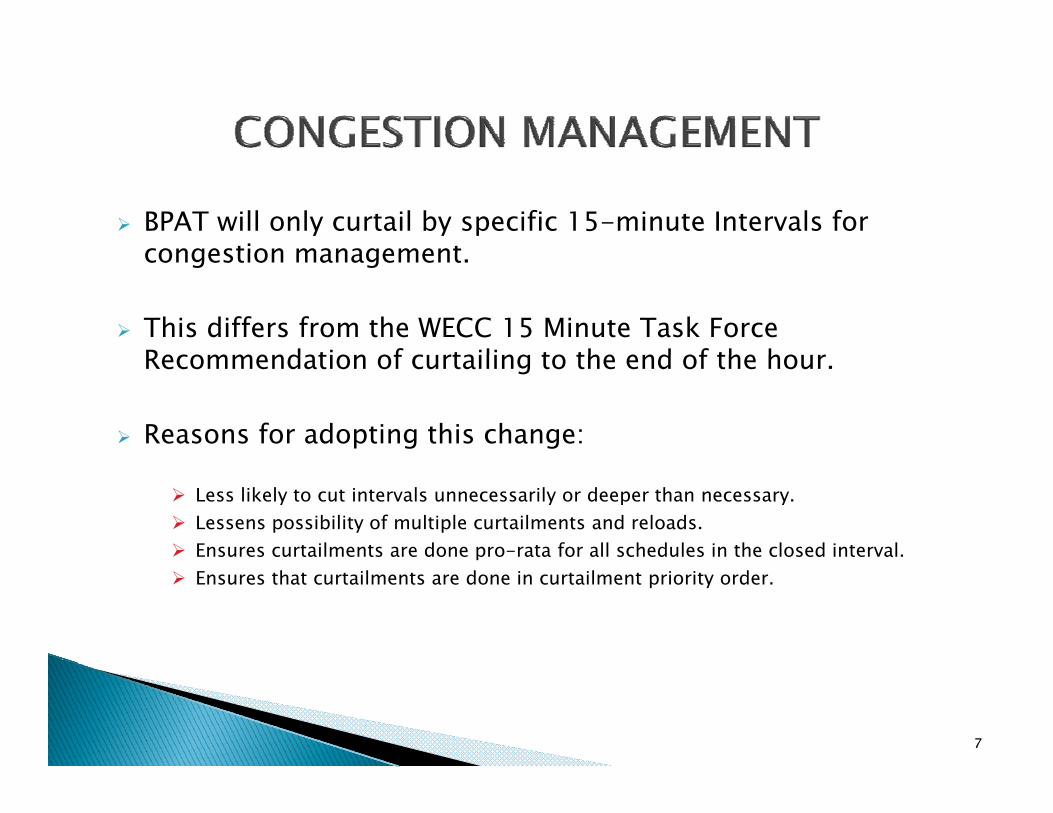
BPAT will only curtail by specific 15-minute Intervals for congestion managementcongestion management.
This differs from the WECC 15 Minute Task Force Recommendation of curtailing to the end of the hourRecommendation of curtailing to the end of the hour.
Reasons for adopting this change:
Less likely to cut intervals unnecessarily or deeper than necessary. Lessens possibility of multiple curtailments and reloads. Ensures curtailments are done pro-rata for all schedules in the closed interval. Ensures that curtailments are done in curtailment priority order.
7
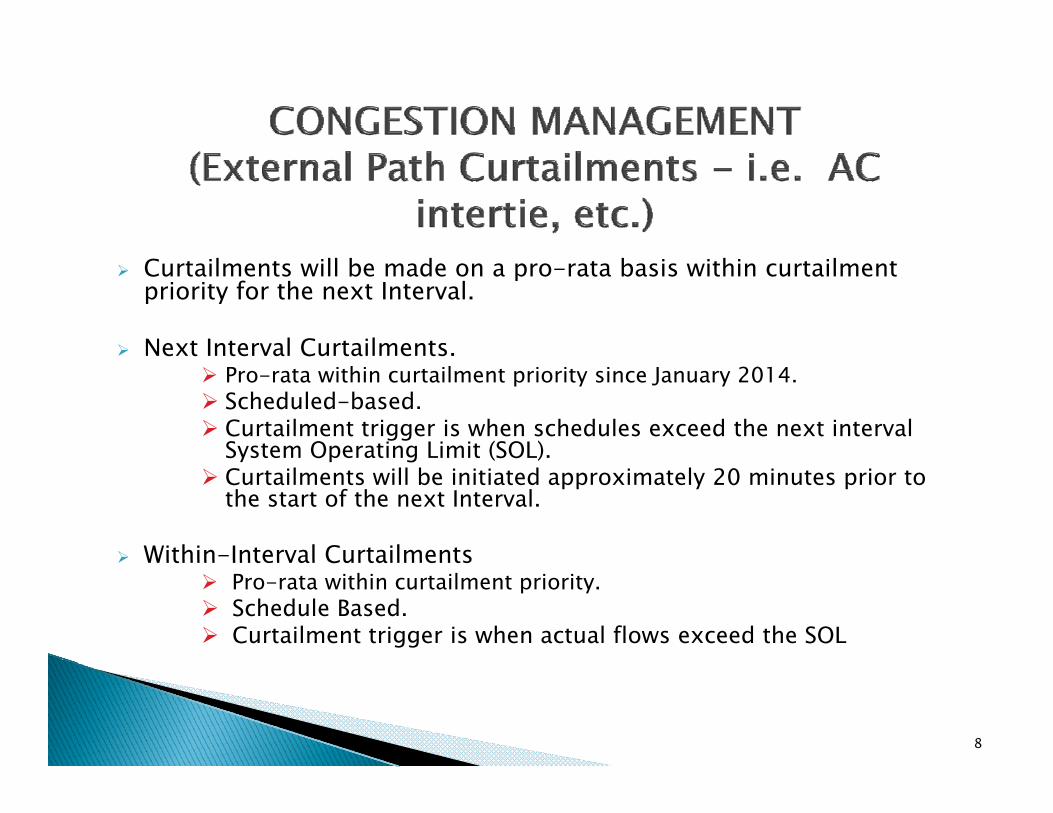
Curtailments will be made on a pro-rata basis within curtailment priority for the next Interval.
Next Interval Curtailments. Next Interval Curtailments. Pro-rata within curtailment priority since January 2014. Scheduled-based. Curtailment trigger is when schedules exceed the next interval
System Operating Limit (SOL).Syste Ope at g t (SO ) Curtailments will be initiated approximately 20 minutes prior to
the start of the next Interval.
Within-Interval Curtailments Within Interval Curtailments Pro-rata within curtailment priority. Schedule Based. Curtailment trigger is when actual flows exceed the SOL
8
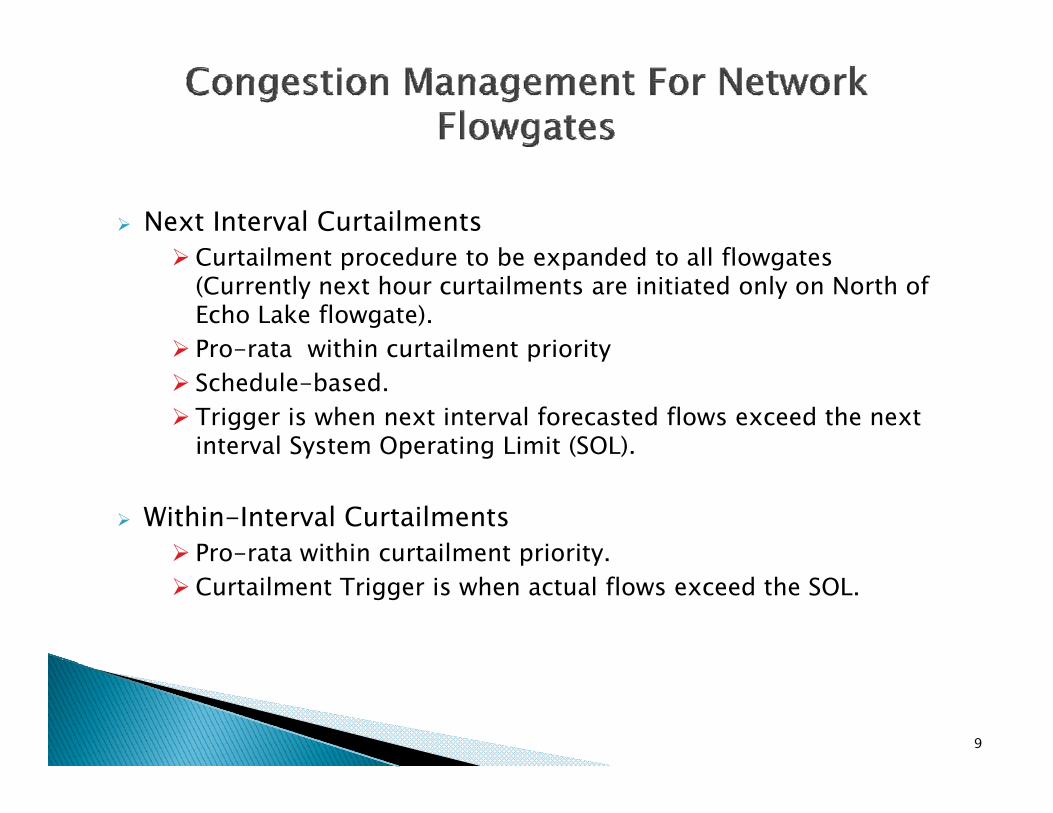
Next Interval CurtailmentsCurtailment procedure to be expanded to all flowgatesCurtailment procedure to be expanded to all flowgates
(Currently next hour curtailments are initiated only on North of Echo Lake flowgate).
Pro-rata within curtailment priority Pro rata within curtailment priority Schedule-based. Trigger is when next interval forecasted flows exceed the next
interval System Operating Limit (SOL).y p g
Within-Interval Curtailments Pro-rata within curtailment priority. Pro rata within curtailment priority.Curtailment Trigger is when actual flows exceed the SOL.
9
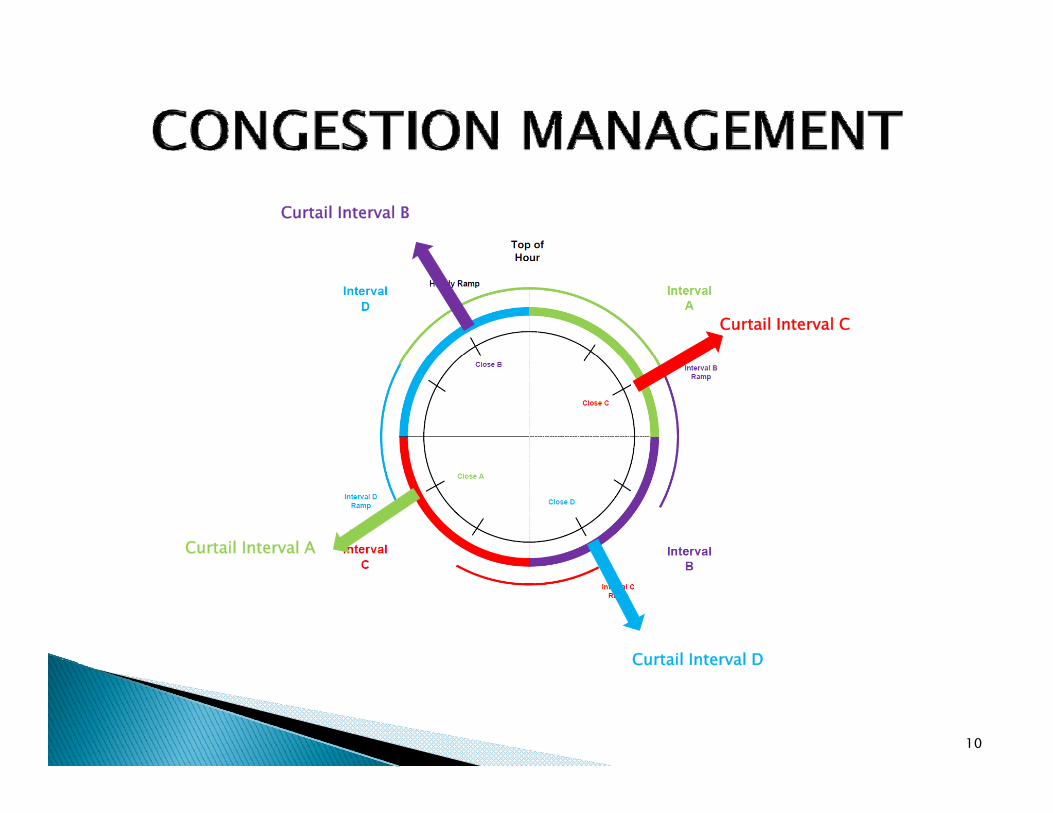
Curtail Interval B
Curtail Interval C
Curtail Interval A
Curtail Interval DCurtail Interval D
10

11