Embed Size (px)
Citation preview
P15R.5 NWS OPERATIONAL PERSPECTIVES OF THE 21 JUNE 2004 AMARILLO HAILSTORM
Matthew R. Kramar and Jason K. Jordan
National Weather Service WFO Amarillo, Texas
1. Introduction A supercell thunderstorm battered the city of Amarillo on 21 June 2004, producing hail larger than softball size and eight tornadoes (total damage to Amarillo was over $300 million) during its several hour lifetime. The slow movement and close proximity of the storm to both the National Weather Service Forecast Office and the Amarillo WSR-88D (KAMA) afforded somewhat unusual warning opportunities, since the warning meteorologists were able to compare the radar display in near real-time to
visual structure of the storm. The storm's proximity also facilitated an unusual ability to diagnose storm-scale processes from radar signatures that might otherwise have gone undetected on more distant storms owing to sampling elevation issues. Of additional interest is the evolution of a second intense supercell that developed on the higher terrain of eastern New Mexico and moved east-southeast, again bearing down on Amarillo after dark. The second storm, generally overlooked by comparison, also produced a hook echo with a very strong mesocyclonic circulation that prompted two tornado
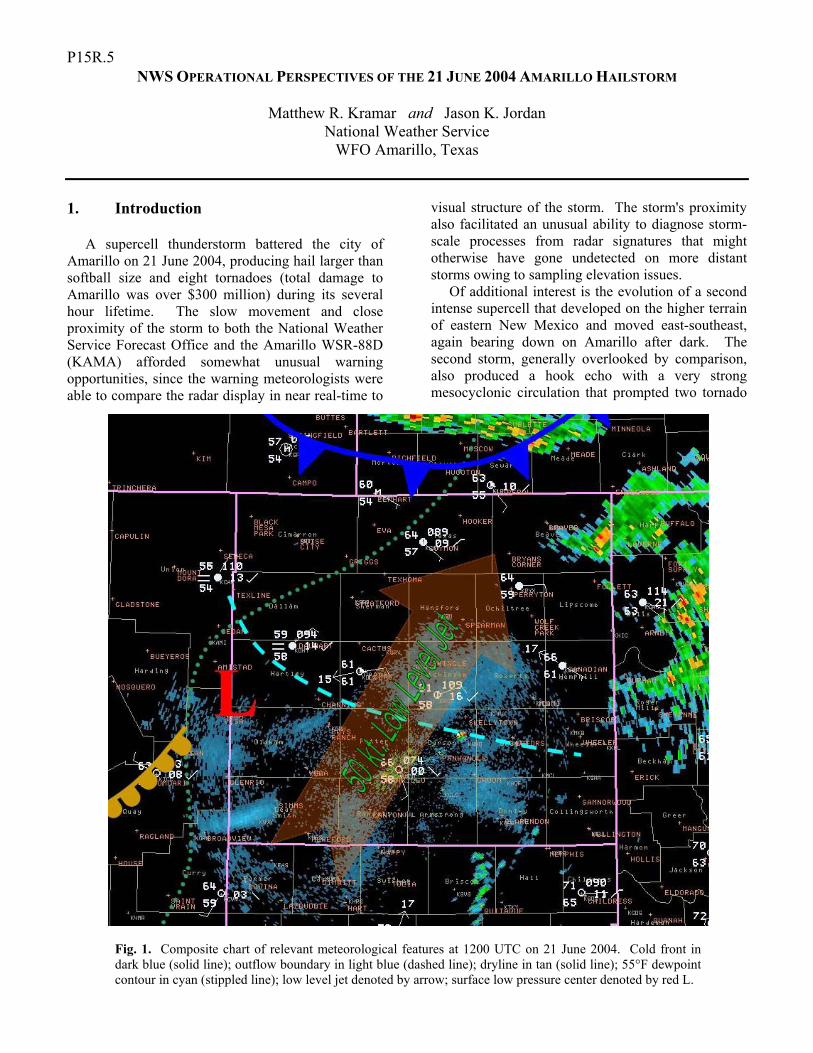
Fig. 1. Composite chart of relevant meteorological features at 1200 UTC on 21 June 2004. Cold front in dark blue (solid line); outflow boundary in light blue (dashed line); dryline in tan (solid line); 55°F dewpoint contour in cyan (stippled line); low level jet denoted by arrow; surface low pressure center denoted by red L.
warnings as it approached Amarillo, but had no documented tornadoes in the Texas Panhandle. The synoptic and mesoscale environments that gave rise to the 21 June event will first be described, as well as the forecast process and daytime evolution. Then operations and warning decisions will be examined from both radar and observational perspectives. 2. Forecast Background a. Synoptic and Mesoscale Setup On the morning of 21 June 2004 (1200 UTC), a broad synoptic scale trough was present over the north central United States, bringing westerly to northwesterly flow at 500mb across the Southern High Plains. Shortwave troughs embedded in the midlevel flow, coupled with ample deep layer shear
and moisture, had allowed for the development of severe convective storms almost daily since 16 June 2004. But, despite the atmosphere having been worked over, several days of southeasterly surface flow, along with nightly appearances of the low level jet (roughly 25 m s-1 at 850mb over the Texas Panhandle on 21 June 2004), had allowed for the re-establishment of a moist and unstable airmass over the region. A synoptic scale surface low pressure system was present over the west-central Texas Panhandle into eastern New Mexico, with dewpoints exceeding 55˚F covering all but northwestern portions of the Texas and Oklahoma Panhandles . A dryline extended south from the surface low, well to the west of the Texas Panhandle, while a cold front was draped from Colorado Springs to Springfield to Dodge City. In addition, persistent overnight convective storms had deposited a cold pool over the northern half of the
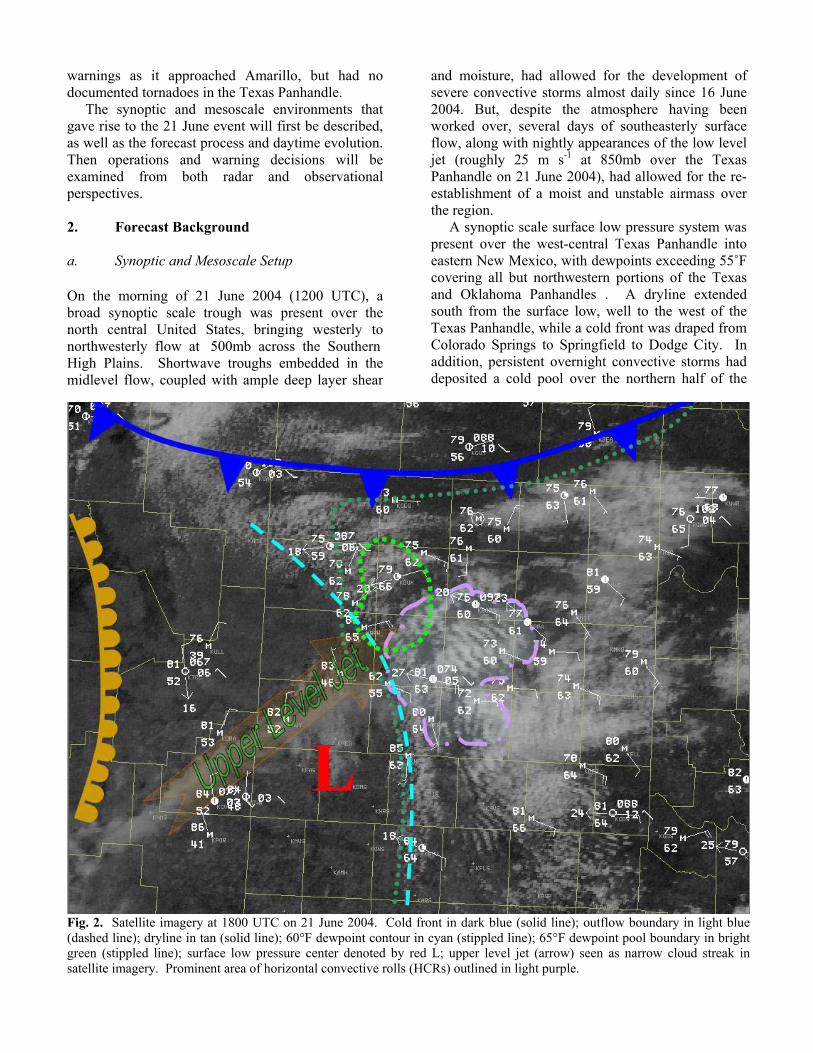
Fig. 2. Satellite imagery at 1800 UTC on 21 June 2004. Cold front in dark blue (solid line); outflow boundary in light blue (dashed line); dryline in tan (solid line); 60°F dewpoint contour in cyan (stippled line); 65°F dewpoint pool boundary in bright green (stippled line); surface low pressure center denoted by red L; upper level jet (arrow) seen as narrow cloud streak in satellite imagery. Prominent area of horizontal convective rolls (HCRs) outlined in light purple.
Texas Panhandle, which was seen (per KAMA WSR-88D) to be spreading southwest (composite map, Fig. 1) b. Forecast Conditions
The 0600 UTC model runs available to the morning forecasters (MesoEta, GFS, RUC) all depicted a shortwave trough embedded in the westerly flow aloft, that would move into the Southern High Plains by late afternoon. As a result of its approach, the models forecasted a southerly development and strengthening of the surface low and a consequent southward movement of the cold front into the Panhandles, where it would stall by early afternoon. Backing surface winds (becoming almost easterly) as a result of the deepening surface low would help to restore more moisture-rich air
(dewpoints exceeding 60˚F) during the day, but would also induce a more unidirectional low-level wind profile by late afternoon. The MesoEta model also forecasted the passage overhead of a diffluent 250mb jet, that could provide additional lift over the central Texas Panhandle by 1700-1800 UTC. Steep 700-500 mb lapse rates of 8.0-8.5˚C km-1 were expected by the 0600 UTC MesoEta to spread over the Panhandles. Forecasted wide profiles of convective available potential energy (CAPE) were common, especially in the -10˚C to -30˚C range, which is routinely employed operationally as a delineator for the potential for large hail growth. A cap was still present in the 1800 UTC point forecast sounding for Amarillo; however, sufficient lift (both from dynamic features aloft and boundaries at the surface) was expected to erode the cap by 2100-2200 UTC.
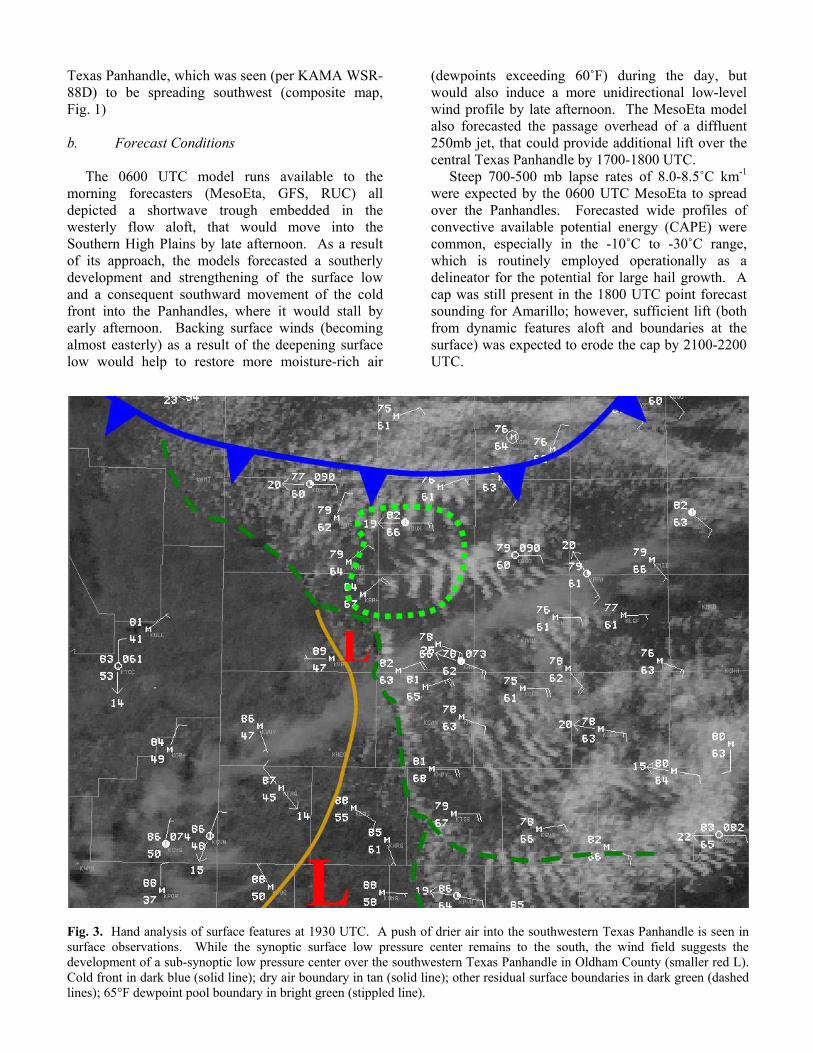
Fig. 3. Hand analysis of surface features at 1930 UTC. A push of drier air into the southwestern Texas Panhandle is seen in surface observations. While the synoptic surface low pressure center remains to the south, the wind field suggests the development of a sub-synoptic low pressure center over the southwestern Texas Panhandle in Oldham County (smaller red L). Cold front in dark blue (solid line); dry air boundary in tan (solid line); other residual surface boundaries in dark green (dashed lines); 65°F dewpoint pool boundary in bright green (stippled line).
Early morning guidance from the Storm Prediction Center supported local reasoning, that supercells capable of very large hail and damaging winds would be possible by afternoon, with only a marginal threat of tornadoes (2%), given anticipated unfavorable low-level wind profiles. Applying the Bunkers (2000) algorithm to forecast hodographs, storms would initially be expected to move east-northeast, with the potential for right-moving updrafts to acquire an east-southeasterly motion. c. Meteorological Evolution By 1800 UTC (Fig. 2), the cold front had stalled in the northern Texas Panhandle, while the dryline remained in eastern New Mexico, and would not play a role in Texas events. As forecasted, the surface low pressure system had developed southward and was centered over the southwestern Texas Panhandle. South of the front, surface flow had strengthened out of the east, spreading dewpoints exceeding 60˚F over almost the entire Texas Panhandle. Towering cumulus were also apparent in visible satellite imagery along a line from Clayton, New Mexico to Hereford, Texas, demarcating the residual outflow boundary. Two additional features were of vital importance to note at this time. A narrow band of cirrus had begun streaming across the southern part of the WFO Amarillo forecast area, and served as a visible manifestation of the upper jet that had been forecast by the MesoEta. In addition, horizontal convective rolls (HCRs) (Weckwerth et al. 1997) were becoming apparent in both visible satellite data (Fig. 2) and radar imagery. The intersections of HCRs with mesoscale boundaries have been noted as preferred locations for convective initiation (e.g. Wilson and Schreiber 1986; Wilson et al. 1992; Atkins et al. 1995; Weckwerth 2000). A surprising evolution took place over the subsequent two hours. Although the surface low maintained its southerly position over the southwestern Texas Panhandle, a prominent bulge in the outflow boundary developed by 1930 UTC (Fig. 3), suggesting a subsynoptic low or lobe on the northern side of the synoptic surface low had developed over southwestern portions of the WFO Amarillo forecast area, advecting slightly drier air into the southwestern Texas Panhandle (though below strict definitions of a West Texas dryline). Dryline bulges (here, more of a drier air bulge) are commonly thought to be preferred locations for severe storm initiation owing to increased surface mass convergence near the protrusion. Also noted by
1930 UTC was the appearance of a small moisture pool with dewpoints exceeding 65˚F over the central Texas Panhandle (Fig. 3), coincident with the most prominent HCRs and just ahead of the bulge in the outflow boundary. Several fine lines apparent on radar coincided with the positions in hand analysis of deeper moisture contours (notably the contours of 55˚F and 60˚F surface dewpoint). In addition, enhanced reflectivity values (greater than 20 dBZ) were observed along portions of the HCRs coincident with the 65˚F surface dewpoint contour. 3. Convective Initiation The first updraft (hereafter Storm A1) broke the cap between 2015 and 2030 UTC, as noted by the presence of higher tilt echoes on KAMA radar. The updraft initiated on the bulge of the drier air protrusion along the Oldham and Potter County line, where a prominent HCR intersected the boundary. Meanwhile, the upper shortwave trough contributed to the development of isolated to scattered convection across south central Colorado and northern New Mexico, on the higher terrain and along the frontal boundary. By 2115 UTC, Storm A1 still appeared to have difficulty sustaining a strong elevated core, as noted by the lack of high reflectivity values aloft―perhaps a result of the highly sheared (though crisp) updraft apparent on visible satellite despite steering flow of only about 15 m s-1. The storm moved slowly northeast, and subsequently tapped the pool of higher dewpoints, the result of which was an intensification of the updraft and first algorithmic detection of small hail. In addition, a broad midlevel mesocyclone was noted at this time by computer algorithms, that would continue for several hours. One HCR was noted on radar feeding directly into the updraft region of the storm. The WSR-88D hail algorithm first detected severe hail in Storm A1 (0.75 in.) at 2156 UTC. The value rapidly increased in size to 1.25 in. thereafter, coincident with the development of a more organized core aloft. But at 2200 UTC, a second storm (hereafter Storm A2) began to form at the initiation point of the original storm. The two storms coexisted for roughly 30 min. before the first trained spotter report of penny size hail (0.75 in.) was relayed at 2227 UTC, prompting a Severe Thunderstorm Warning for Storm A1 (Fig. 4a). But attention was shifting to Storm A2, which was intensifying rapidly and soon absorbed Storm A1.
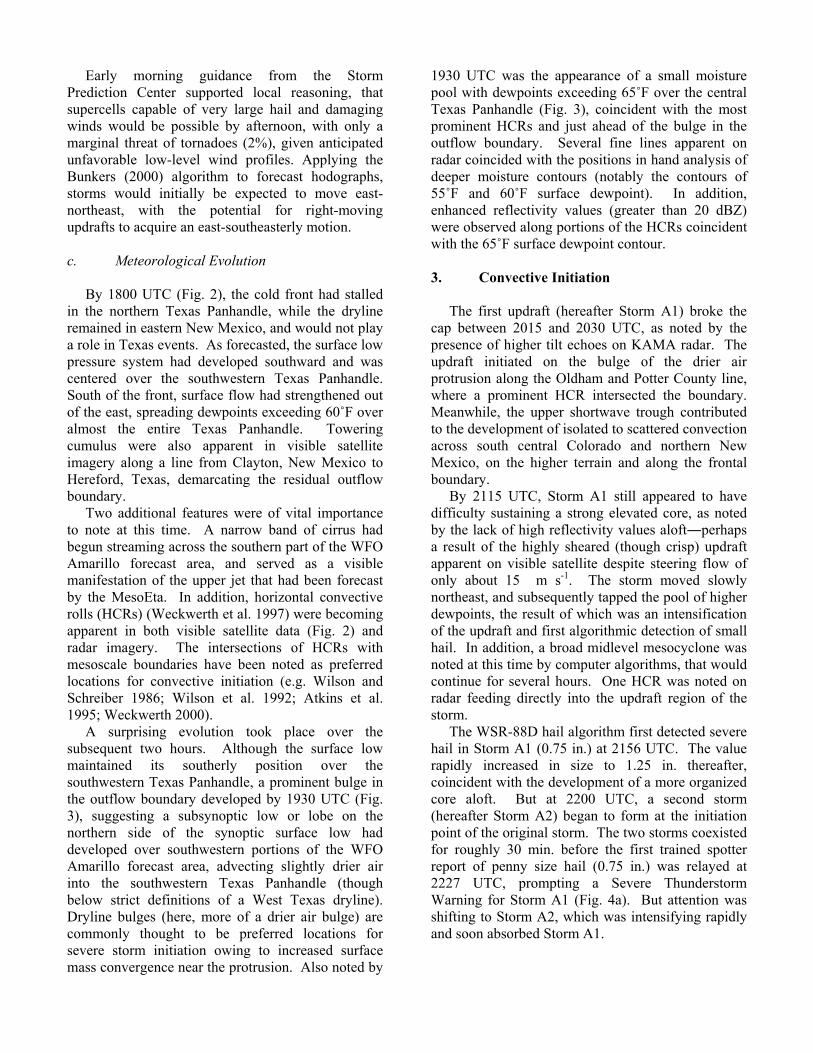
4. The Amarillo Hailstorm Radar indications of distinct vertically integrated liquid (VIL) density areas in Storm A2 suggested the possible development of a splitting updraft, and an Owl Horn Signature (Kramar et al. 2005) at 2234 UTC affirmed this suggestion as the split occurred at 2243 UTC. Algorithm estimates of hail size in Storm A2 quickly increased to golf ball size (1.75 in.) as the storm underwent a series of splits, with increasingly pronounced Owl Horn Signatures (e.g. Fig. 4b). Hail estimates reached larger than baseball size (3.00 in) as KAMA radar depicted a clear fine line along the southern edge of higher reflectivities, denoting the southern extent of storm outflow. The updraft strength was noted by a persistent kink in the boundary in the vicinity of the updraft (Fig. 4b), identifying a region of enhanced inflow. Despite the persistent storm splitting and now highly deviant south-southeasterly motion (toward 160˚), only minimal low-level rotation was detected (Fig. 4c) on Storm Relative Motion (SRM) WSR-88D products (see Sections 5 and 6). However, the storm’s proximity to WFO Amarillo facilitated uncommon ability to observe storm structure in near-realtime, and observation painted a very different picture than that suggested by the radar products: in addition to the very crisp updraft already noted, a rain-free base exhibiting a large, rotating wall cloud was moving toward the city of Amarillo (Fig. 5), producing occasional funnel clouds. And so, despite a lack of strong gate-to-gate radar-detected low-level rotation, a Tornado Warning was issued for Potter County at 2330 UTC. The first tornado was reported at 22/0015 UTC along Interstate 40, west of Amarillo. Interestingly, the first tornadic vortex signature (TVS) was not detected until 22/0030 UTC, coincident with the second reported tornado. Owing to the proximity of Storm A2 to the KAMA radar, data resolution and increased elevation plane sampling density provided an impressive depiction of the internal flow of the storm as it approached and moved through Amarillo. The radar detected a swath of extreme outbound velocities in the Storm Relative Motion imagery (SRM) at only 1000-1500 ft. above ground level (AGL), likely a
Fig. 4. (a) Radar reflectivity at 2217 UTC as Storm A1 drops 0.75 in. hail; (b) Storm A2 exhibiting an Owl Horn signature and a very strong updraft, as evidenced by the kink in the outflow fine line on the south side of the storm; (c) Storm Relative Motion data at 22/0005 UTC, ten minutes before the first tornado report. Minimal low-level rotation is noted.
combination of strong surface inflow of 15 to 30 m s-1 and the rear flank downdraft wrapping into the low-level mesocyclone. At 1500 ft. AGL, storm-relative winds of 51 m s-1 were detected over a highly populated residential area of southern Amarillo, coincident with continued reports of funnel clouds over the city. Additional surface wind reports of over 53 m s-1, though later determined to be overestimates made on a hand-held anemometer, were relayed by the public. The radar-detected TVS progressed generally uninterrupted for the subsequent two hours, during which time a cyclic hook-echo was noted as the storm traversed central and southern Randall County and dropped a swath of softball size hail (4.25 in.) across western Amarillo. Tornado warnings and reported tornadoes (eight in total) continued through 0230 UTC. The storm then exited the WFO Amarillo CWA, leaving behind a path of damage ultimately totaling over $300 million. More complete radar imagery sequences will be shown in the poster. 5. The Amarillo Windstorm A second supercell (hereafter Storm B) formed in Union County, New Mexico, behind the cold front stationed across northeast New Mexico. After crossing the front, the storm intensified rapidly, producing a reported weak tornado near Amistad, New Mexico. The storm then followed a very similar evolution to Storm A2, with algorithm-estimated 4.00 in. hail, a prominent hook-echo, a low-level SRM velocity couplet, and a TVS that persisted for over 40 min. as it raced east-southeast toward Amarillo. It prompted two tornado warnings (one again including
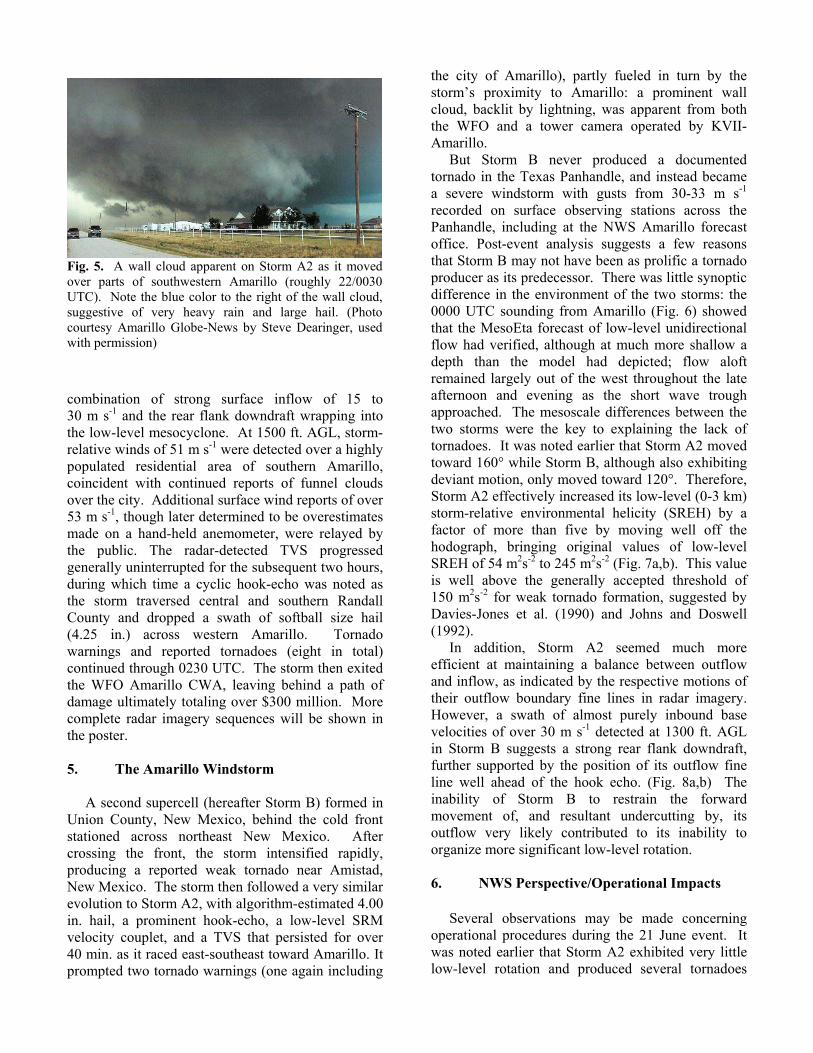
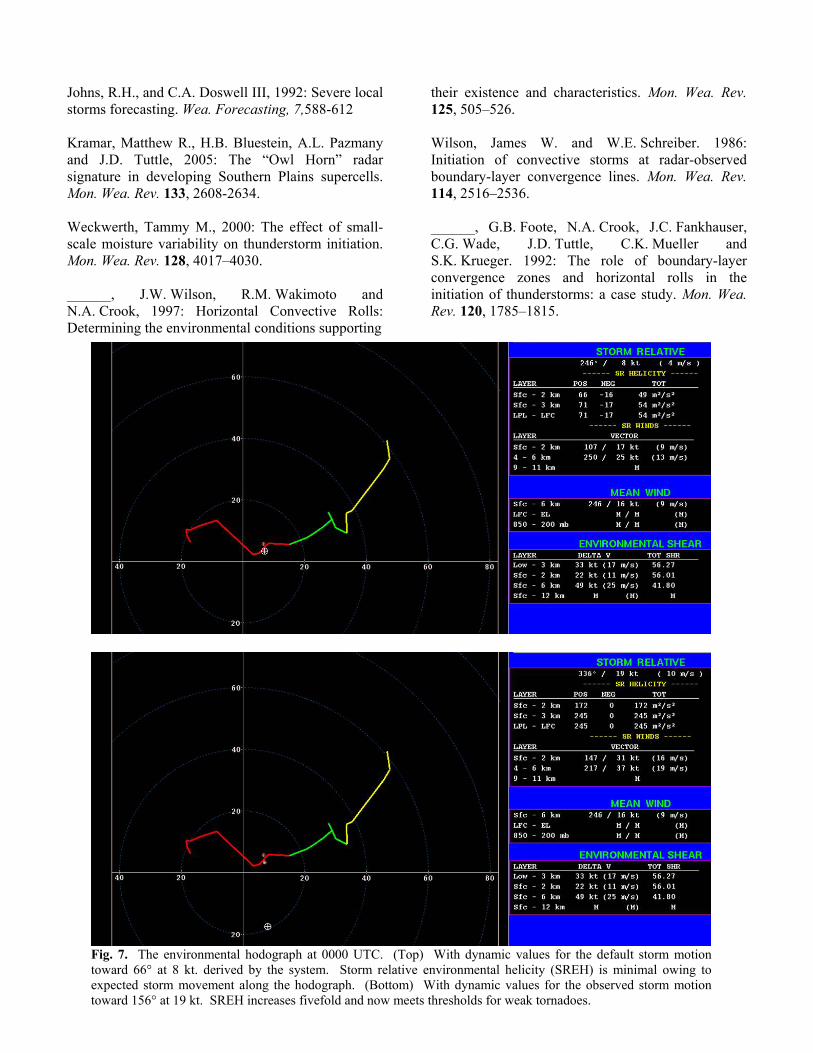
the city of Amarillo), partly fueled in turn by the storm’s proximity to Amarillo: a prominent wall cloud, backlit by lightning, was apparent from both the WFO and a tower camera operated by KVII-Amarillo. But Storm B never produced a documented tornado in the Texas Panhandle, and instead became a severe windstorm with gusts from 30-33 m s-1 recorded on surface observing stations across the Panhandle, including at the NWS Amarillo forecast office. Post-event analysis suggests a few reasons that Storm B may not have been as prolific a tornado producer as its predecessor. There was little synoptic difference in the environment of the two storms: the 0000 UTC sounding from Amarillo (Fig. 6) showed that the MesoEta forecast of low-level unidirectional flow had verified, although at much more shallow a depth than the model had depicted; flow aloft remained largely out of the west throughout the late afternoon and evening as the short wave trough approached. The mesoscale differences between the two storms were the key to explaining the lack of tornadoes. It was noted earlier that Storm A2 moved toward 160° while Storm B, although also exhibiting deviant motion, only moved toward 120°. Therefore, Storm A2 effectively increased its low-level (0-3 km) storm-relative environmental helicity (SREH) by a factor of more than five by moving well off the hodograph, bringing original values of low-level SREH of 54 m2s-2 to 245 m2s-2 (Fig. 7a,b). This value is well above the generally accepted threshold of 150 m2s-2 for weak tornado formation, suggested by Davies-Jones et al. (1990) and Johns and Doswell (1992). In addition, Storm A2 seemed much more efficient at maintaining a balance between outflow and inflow, as indicated by the respective motions of their outflow boundary fine lines in radar imagery. However, a swath of almost purely inbound base velocities of over 30 m s-1 detected at 1300 ft. AGL in Storm B suggests a strong rear flank downdraft, further supported by the position of its outflow fine line well ahead of the hook echo. (Fig. 8a,b) The inability of Storm B to restrain the forward movement of, and resultant undercutting by, its outflow very likely contributed to its inability to organize more significant low-level rotation. 6. NWS Perspective/Operational Impacts Several observations may be made concerning operational procedures during the 21 June event. It was noted earlier that Storm A2 exhibited very little low-level rotation and produced several tornadoes
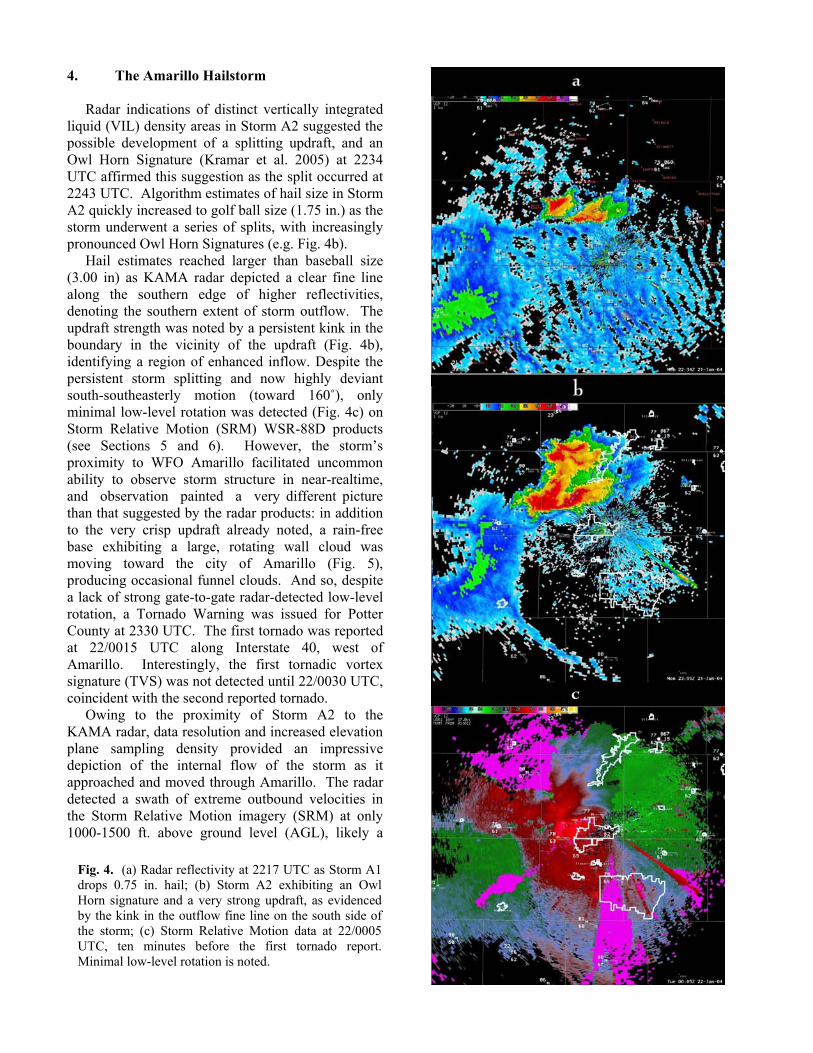
Fig. 5. A wall cloud apparent on Storm A2 as it moved over parts of southwestern Amarillo (roughly 22/0030 UTC). Note the blue color to the right of the wall cloud, suggestive of very heavy rain and large hail. (Photo courtesy Amarillo Globe-News by Steve Dearinger, used with permission)
while Storm B exhibited strong low-level rotation and produced no tornadoes in the AMA forecast area. But it was later discovered that the storm motion used by the Radar Product Generator (RPG) was not representative of the storm motion observed on Storm B. When the correct storm motion toward 120° is used to calculate storm-relative velocity data, the strong low-level couplet detected in SRM products is much weaker, and a strong swath of inbound velocities greater than 60 kt becomes apparent at 1300 ft. AGL (Fig. 9a,b). This event stresses the operational importance of ensuring the correct storm motion in the RPG algorithms. The importance of ground truth is also stressed, given the initial lack of clear radar-detected low-level rotation on Storm A2 even during tornadogenesis. Where operations were concerned, WFO Amarillo recognized the impending two-phased nature of the event and sectorized warning operations accordingly once storms moved into the Texas Panhandle from New Mexico. Staff members were also retained to aid in the operation of HAM radio during the more pressing portions of the evening. Typically, managing office telephone traffic becomes a challenge when a storm affects the city of Amarillo, and 21 June was no exception despite the presence of 13 staff members. Overwhelming quantities of phone calls, forecaster concern for families and friends, and widespread severe weather (including a decaying
mesocyclone passing over WFO Amarillo after dark) all could have contributed to a degradation of concentration and quality of service. But despite these issues and significant damage to property, no lives were lost in Amarillo as a result of the storms. 7. Summary A supercell thunderstorm that produced eight tornadoes and hail larger than softball size formed very close to the WFO Amarillo office and KAMA radar on 21 June 2004, affording unusual opportunities to compare radar observations with visual observations of the storm. Visual comparison proved extremely beneficial in this case, since radar did not detect significant low-level rotation despite the presence of a large, rotating wall cloud seen from the WFO. In addition, the storm’s proximity enabled the radar detection of several mesoscale features that allowed the strength and tornadic potential of the storm to be better resolved. As a result, WFO Amarillo was able to issue a Tornado Warning with 45 minutes lead time. The approach of a second supercell thunderstorm revealed some of the difficulties encountered in warning operations. Though the second storm exhibited several of the same structures and signatures as its predecessor, it never produced a tornado in the Texas Panhandle. Some possible reasons for the lack of tornadoes were discussed, and operational procedures that could better ensure accurate data and proper radar interpretation were illuminated. 8. Acknowledgements The authors are grateful to Richard Wynne, SOO at WFO Amarillo, for his assistance and support in the preparation of this project. Amarillo forecaster David Hennig, who was part of the warning team on 21 June was also extremely helpful in his subsequent discussions of the event with the authors. 9. References Atkins, Nolan T., R.M. Wakimoto and T.M. Weckwerth. 1995: Observations of the Sea-Breeze Front during CaPE. Part II: Dual-Doppler and aircraft analysis. Mon. Wea. Rev. 123, 944–969. Davies-Jones, R., D. Burgess and M. Foster, 1990: Test of helicity as a tornado forecast parameter. 16th AMS Conf. on Severe Local Storms, Kananaskis Park, Alberta, Amer. Meteor. Soc., 588-592.
Fig. 6. The 0000 UTC sounding launched at WFO Amarillo. Although the flight terminated early, moderate CAPE is apparent, and a shallow easterly wind profile that quickly changes to southwesterly flow aloft.
Johns, R.H., and C.A. Doswell III, 1992: Severe local storms forecasting. Wea. Forecasting, 7,588-612 Kramar, Matthew R., H.B. Bluestein, A.L. Pazmany and J.D. Tuttle, 2005: The “Owl Horn” radar signature in developing Southern Plains supercells. Mon. Wea. Rev. 133, 2608-2634. Weckwerth, Tammy M., 2000: The effect of small-scale moisture variability on thunderstorm initiation. Mon. Wea. Rev. 128, 4017–4030. ______, J.W. Wilson, R.M. Wakimoto and N.A. Crook, 1997: Horizontal Convective Rolls: Determining the environmental conditions supporting
their existence and characteristics. Mon. Wea. Rev. 125, 505–526. Wilson, James W. and W.E. Schreiber. 1986: Initiation of convective storms at radar-observed boundary-layer convergence lines. Mon. Wea. Rev. 114, 2516–2536. ______, G.B. Foote, N.A. Crook, J.C. Fankhauser, C.G. Wade, J.D. Tuttle, C.K. Mueller and S.K. Krueger. 1992: The role of boundary-layer convergence zones and horizontal rolls in the initiation of thunderstorms: a case study. Mon. Wea. Rev. 120, 1785–1815.
Fig. 7. The environmental hodograph at 0000 UTC. (Top) With dynamic values for the default storm motion toward 66° at 8 kt. derived by the system. Storm relative environmental helicity (SREH) is minimal owing to expected storm movement along the hodograph. (Bottom) With dynamic values for the observed storm motion toward 156° at 19 kt. SREH increases fivefold and now meets thresholds for weak tornadoes.
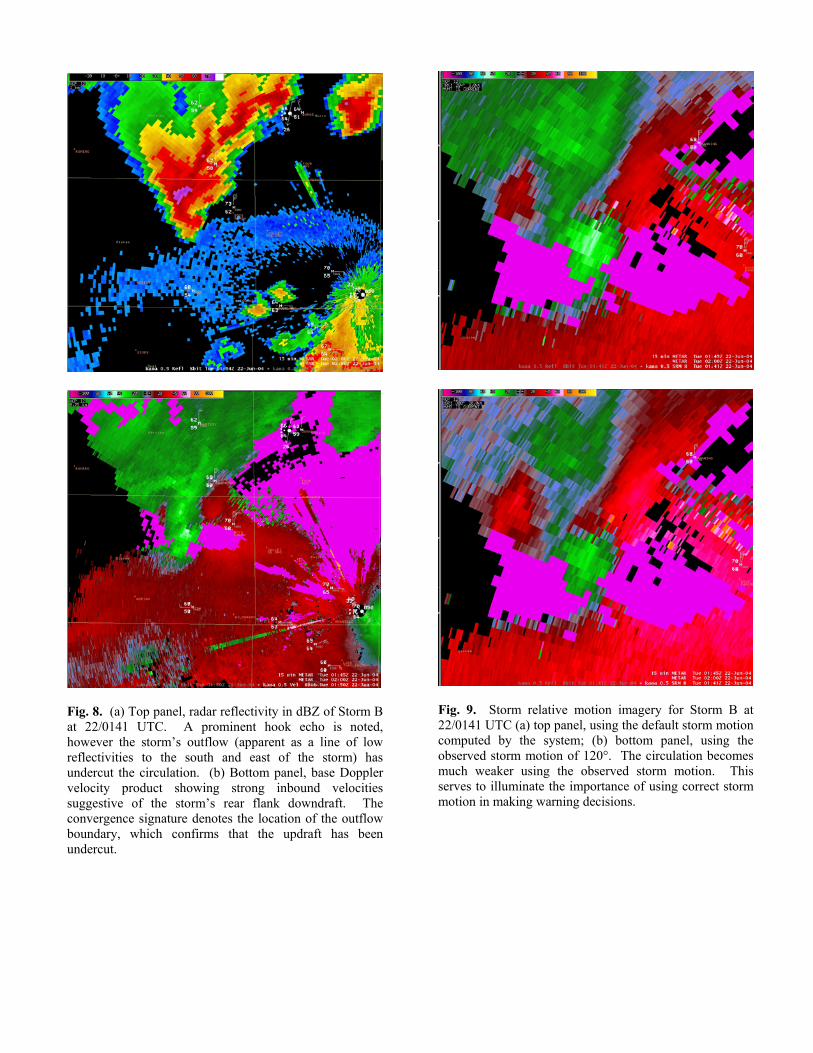
Fig. 8. (a) Top panel, radar reflectivity in dBZ of Storm B at 22/0141 UTC. A prominent hook echo is noted, however the storm’s outflow (apparent as a line of low reflectivities to the south and east of the storm) has undercut the circulation. (b) Bottom panel, base Doppler velocity product showing strong inbound velocities suggestive of the storm’s rear flank downdraft. The convergence signature denotes the location of the outflow boundary, which confirms that the updraft has been undercut.
Fig. 9. Storm relative motion imagery for Storm B at 22/0141 UTC (a) top panel, using the default storm motion computed by the system; (b) bottom panel, using the observed storm motion of 120°. The circulation becomes much weaker using the observed storm motion. This serves to illuminate the importance of using correct storm motion in making warning decisions.