Embed Size (px)
DESCRIPTION
NY’s Growth and Differentiated Accountability Proposals. Ira Schwartz Coordinator, Accountability, Policy, & Administration. Purpose of No Child Left Behind. - PowerPoint PPT Presentation
Citation preview
NY’s Growth and Differentiated Accountability Proposals
Ira Schwartz
Coordinator, Accountability, Policy, & Administration
Draft: September 26, 2008
2
“…to ensure that all children have a fair, equal, and significant opportunity to obtain
a high-quality education and reach, at a minimum, proficiency on challenging state academic achievement standards and state
academic assessments.”
Purpose of No Child Left Behind
Draft: September 26, 2008
3
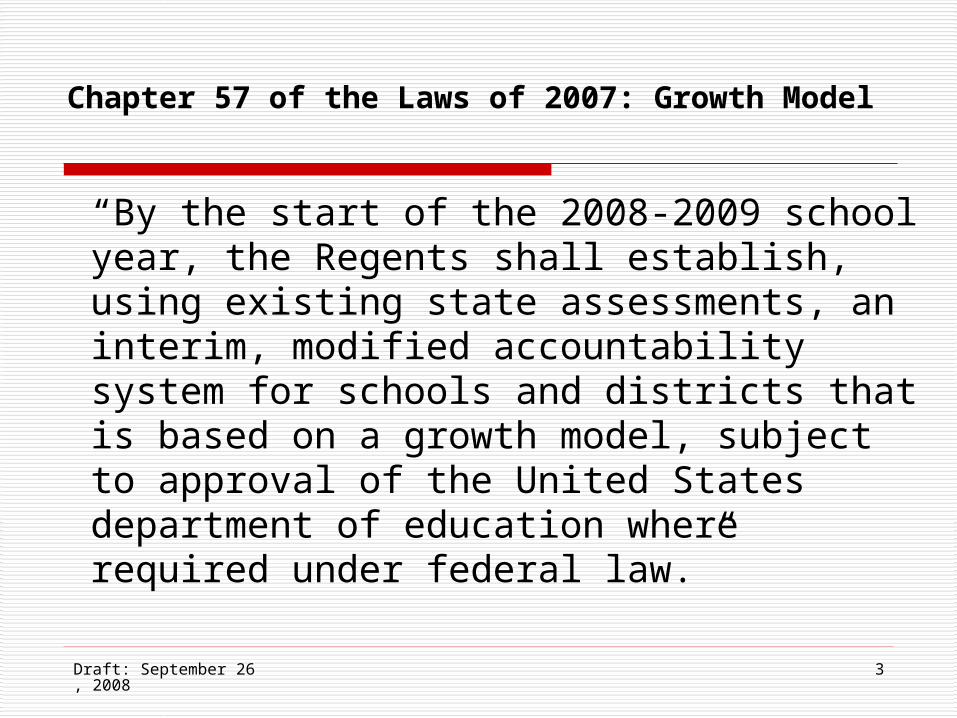
Chapter 57 of the Laws of 2007: Growth Model
“By the start of the 2008-2009 school year, the Regents shall establish, using existing state assessments, an interim, modified accountability system for schools and districts that is based on a growth model, subject to approval of the United States department of education where required under federal law.”
Draft: September 26, 2008
4
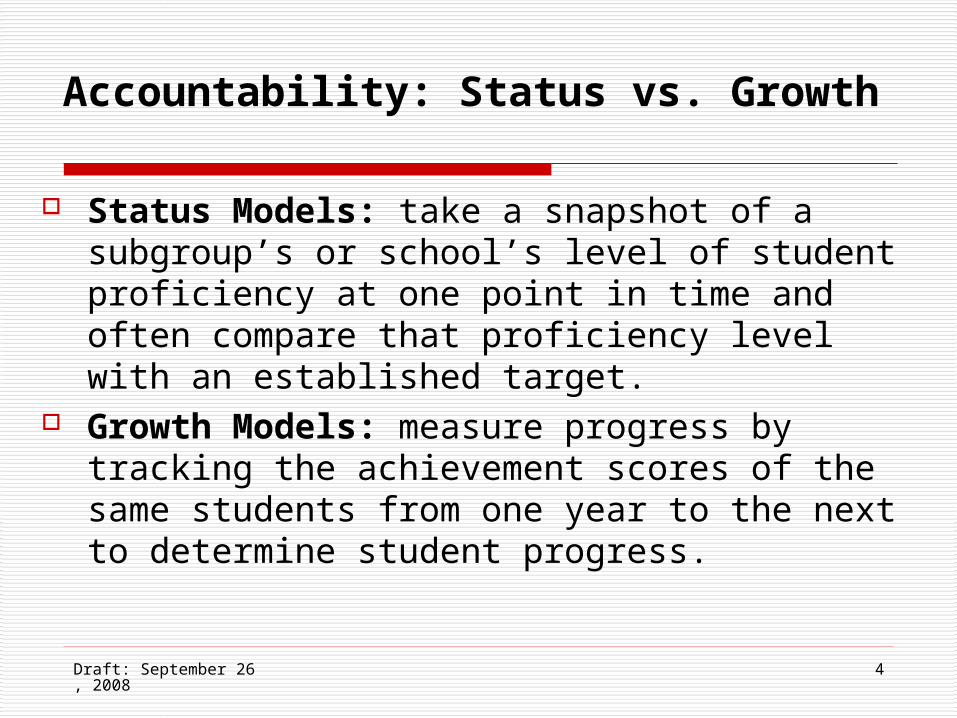
Accountability: Status vs. Growth
Status Models: take a snapshot of a subgroup’s or school’s level of student proficiency at one point in time and often compare that proficiency level with an established target.
Growth Models: measure progress by tracking the achievement scores of the same students from one year to the next to determine student progress.
Draft: September 26, 2008
5
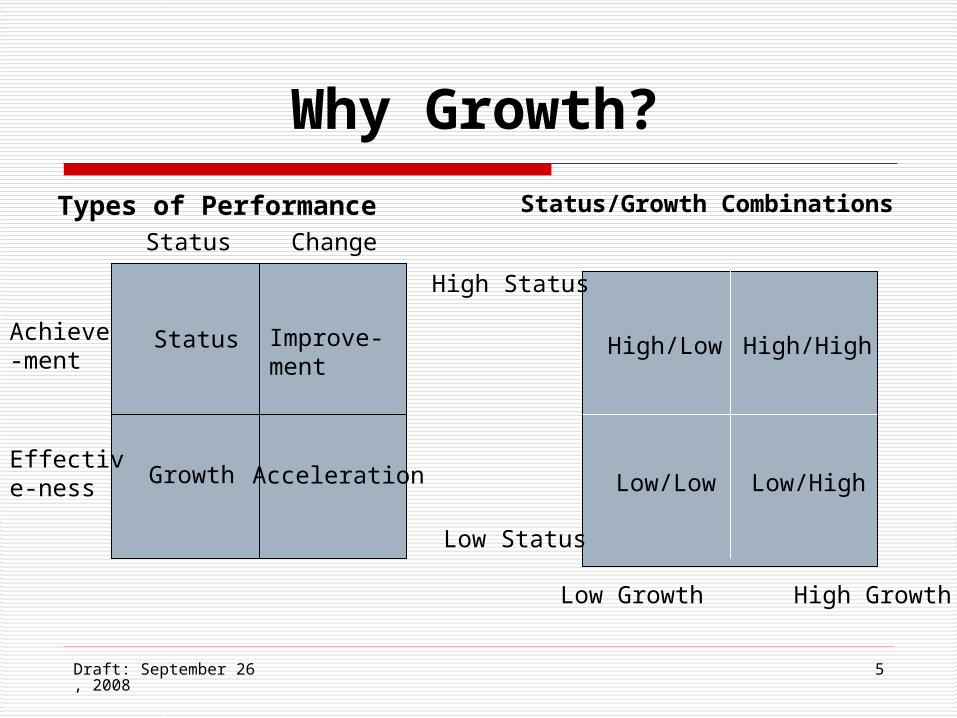
Why Growth?
Types of Performance
Improve-ment
Status
Low Growth High Growth
Low Status
High Status
Growth AccelerationEffective-ness
Achieve-ment
Status Change
Low/Low Low/High
High/Low High/High
Status/Growth Combinations
Draft: September 26, 2008
6
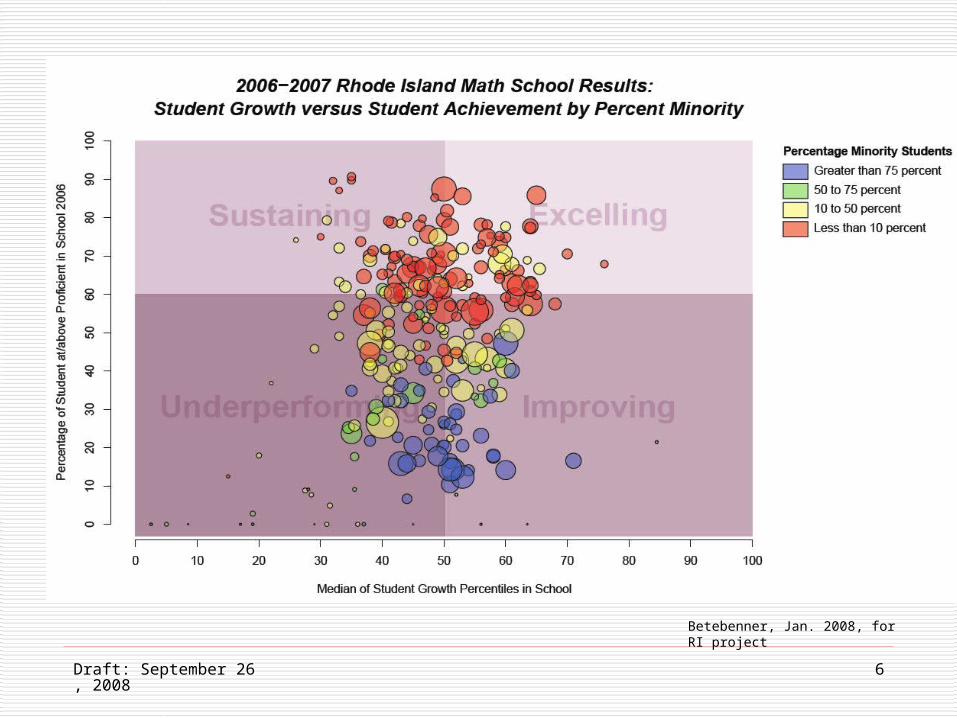
Betebenner, Jan. 2008, for RI project
Draft: September 26, 2008
7
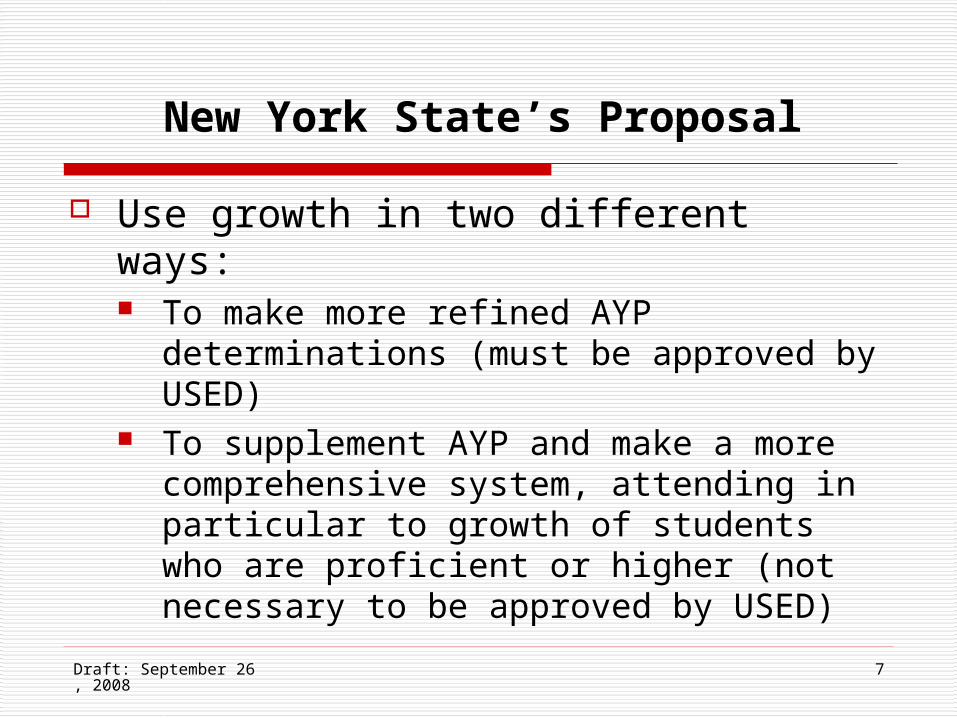
New York State’s Proposal
Use growth in two different ways: To make more refined AYP
determinations (must be approved by USED)
To supplement AYP and make a more comprehensive system, attending in particular to growth of students who are proficient or higher (not necessary to be approved by USED)
Draft: September 26, 2008
8
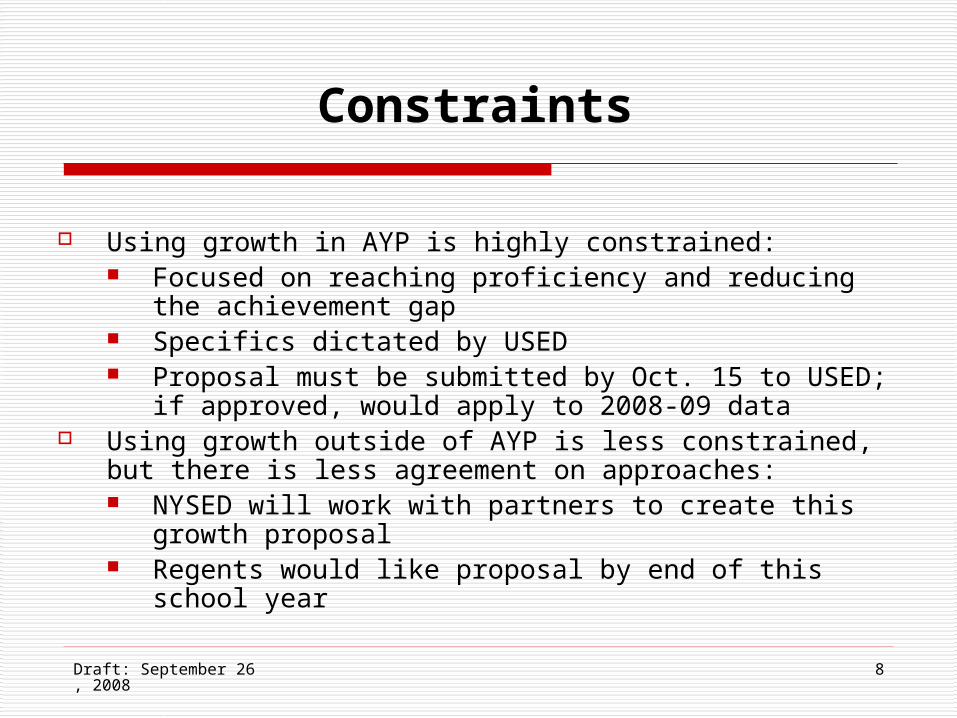
Constraints
Using growth in AYP is highly constrained: Focused on reaching proficiency and reducing the
achievement gap Specifics dictated by USED Proposal must be submitted by Oct. 15 to USED; if
approved, would apply to 2008-09 data Using growth outside of AYP is less constrained, but there
is less agreement on approaches: NYSED will work with partners to create this growth
proposal Regents would like proposal by end of this school year
Draft: September 26, 2008
9
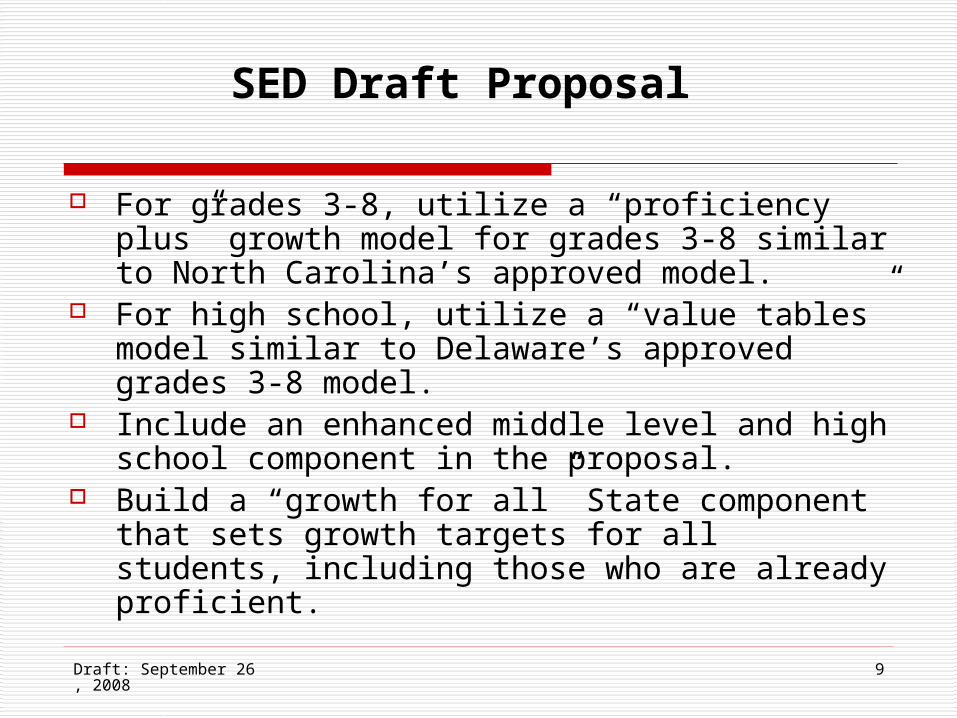
SED Draft Proposal
For grades 3-8, utilize a “proficiency plus” growth model for grades 3-8 similar to North Carolina’s approved model.
For high school, utilize a “value tables” model similar to Delaware’s approved grades 3-8 model.
Include an enhanced middle level and high school component in the proposal.
Build a “growth for all” State component that sets growth targets for all students, including those who are already proficient.
Draft: September 26, 2008
10
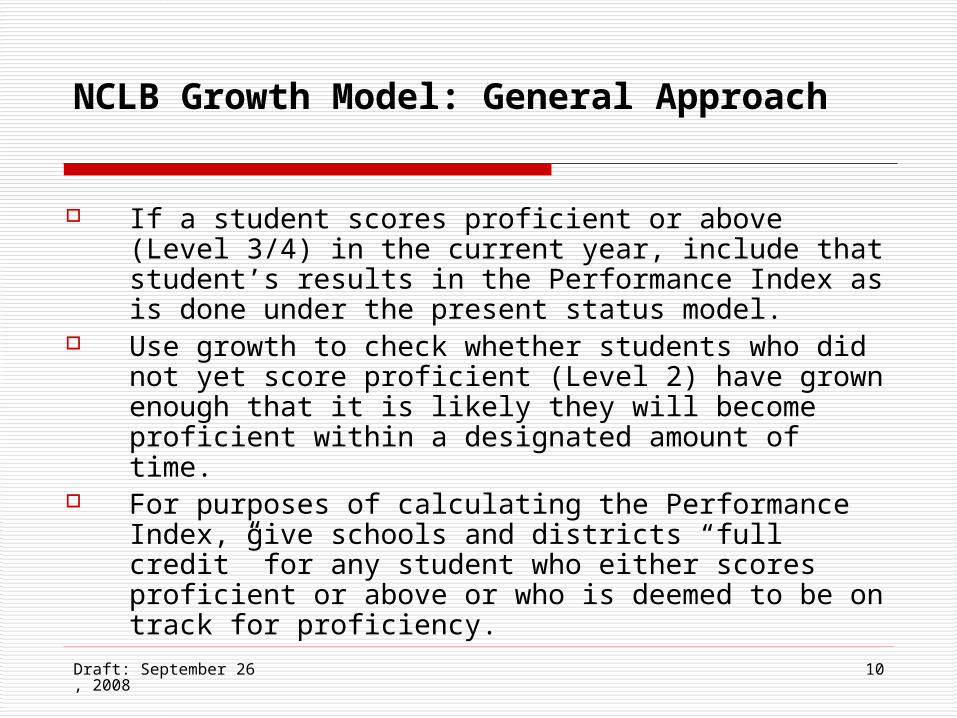
NCLB Growth Model: General Approach
If a student scores proficient or above (Level 3/4) in the current year, include that student’s results in the Performance Index as is done under the present status model.
Use growth to check whether students who did not yet score proficient (Level 2) have grown enough that it is likely they will become proficient within a designated amount of time.
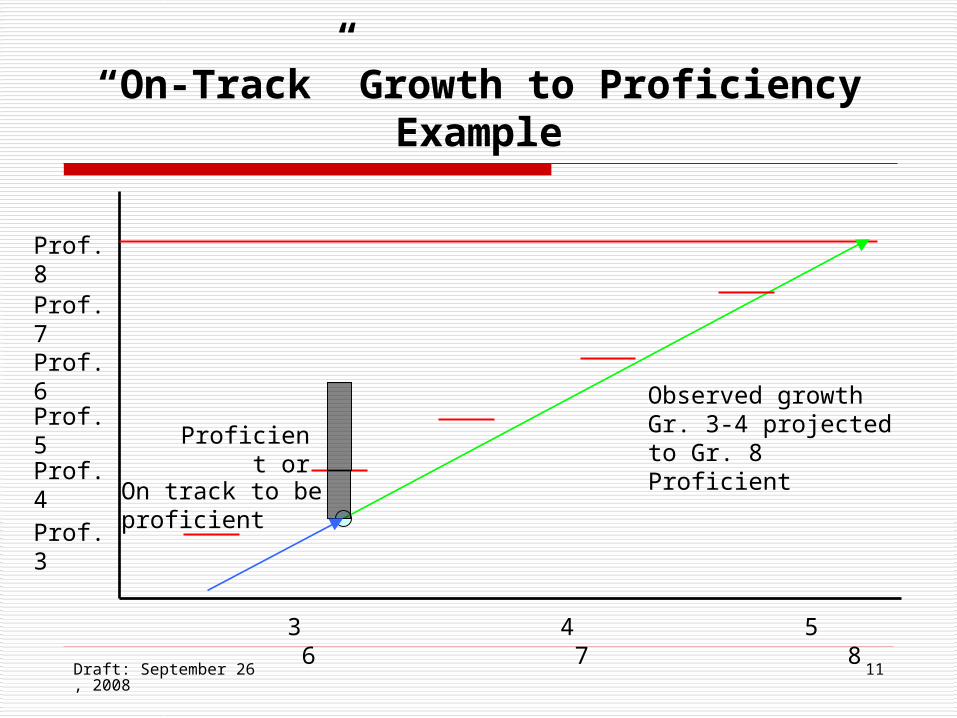
For purposes of calculating the Performance Index, give schools and districts “full credit” for any student who either scores proficient or above or who is deemed to be on track for proficiency.
Draft: September 26, 2008
11
“On-Track” Growth to ProficiencyExample
3 4 5 6 7 8
Prof. 6
Prof. 5
Prof. 4
Prof. 3
Observed growth Gr. 3-4 projected to Gr. 8 Proficient
On track to be proficient
Proficient or
Prof. 8
Prof. 7
Draft: September 26, 2008
12
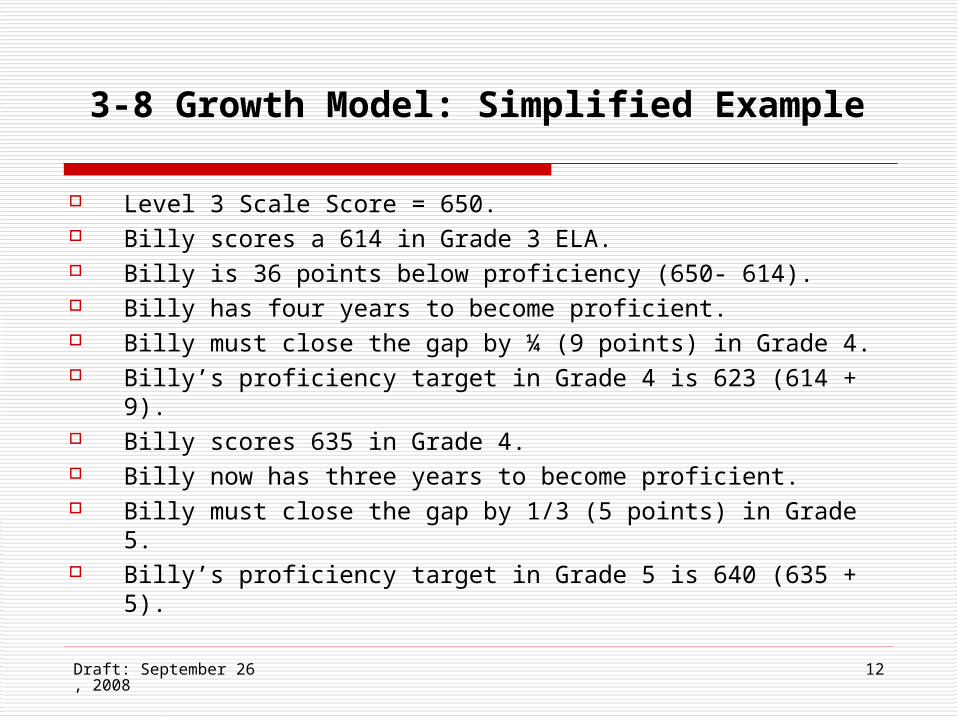
3-8 Growth Model: Simplified Example
Level 3 Scale Score = 650. Billy scores a 614 in Grade 3 ELA. Billy is 36 points below proficiency (650- 614). Billy has four years to become proficient. Billy must close the gap by ¼ (9 points) in Grade 4. Billy’s proficiency target in Grade 4 is 623 (614 + 9). Billy scores 635 in Grade 4. Billy now has three years to become proficient. Billy must close the gap by 1/3 (5 points) in Grade 5. Billy’s proficiency target in Grade 5 is 640 (635 + 5).
Draft: September 26, 2008
13
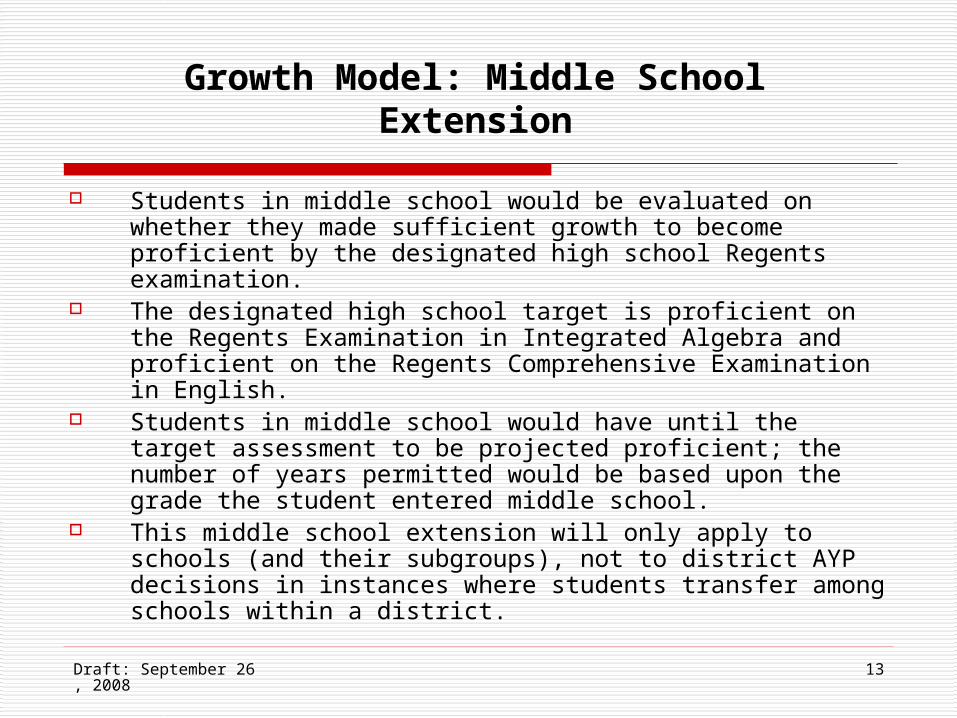
Growth Model: Middle School Extension
Students in middle school would be evaluated on whether they made sufficient growth to become proficient by the designated high school Regents examination.
The designated high school target is proficient on the Regents Examination in Integrated Algebra and proficient on the Regents Comprehensive Examination in English.
Students in middle school would have until the target assessment to be projected proficient; the number of years permitted would be based upon the grade the student entered middle school.
This middle school extension will only apply to schools (and their subgroups), not to district AYP decisions in instances where students transfer among schools within a district.
Draft: September 26, 2008
14
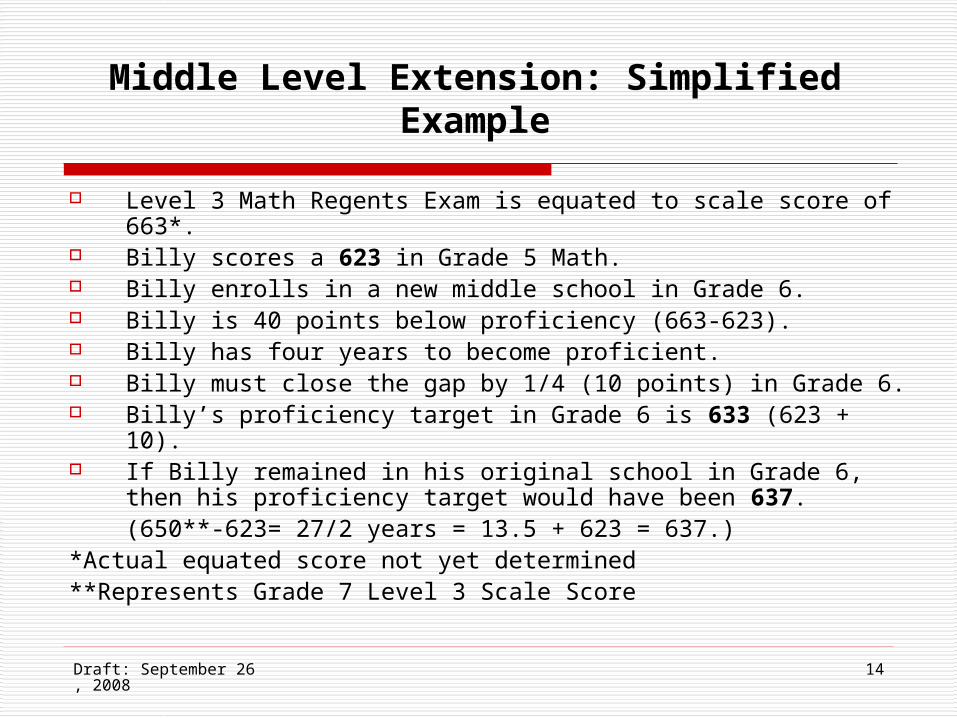
Middle Level Extension: Simplified Example
Level 3 Math Regents Exam is equated to scale score of 663*.
Billy scores a 623 in Grade 5 Math. Billy enrolls in a new middle school in Grade 6. Billy is 40 points below proficiency (663-623). Billy has four years to become proficient. Billy must close the gap by 1/4 (10 points) in Grade 6. Billy’s proficiency target in Grade 6 is 633 (623 + 10). If Billy remained in his original school in Grade 6, then his
proficiency target would have been 637. (650**-623= 27/2 years = 13.5 + 623 = 637.)
*Actual equated score not yet determined**Represents Grade 7 Level 3 Scale Score
Draft: September 26, 2008
15
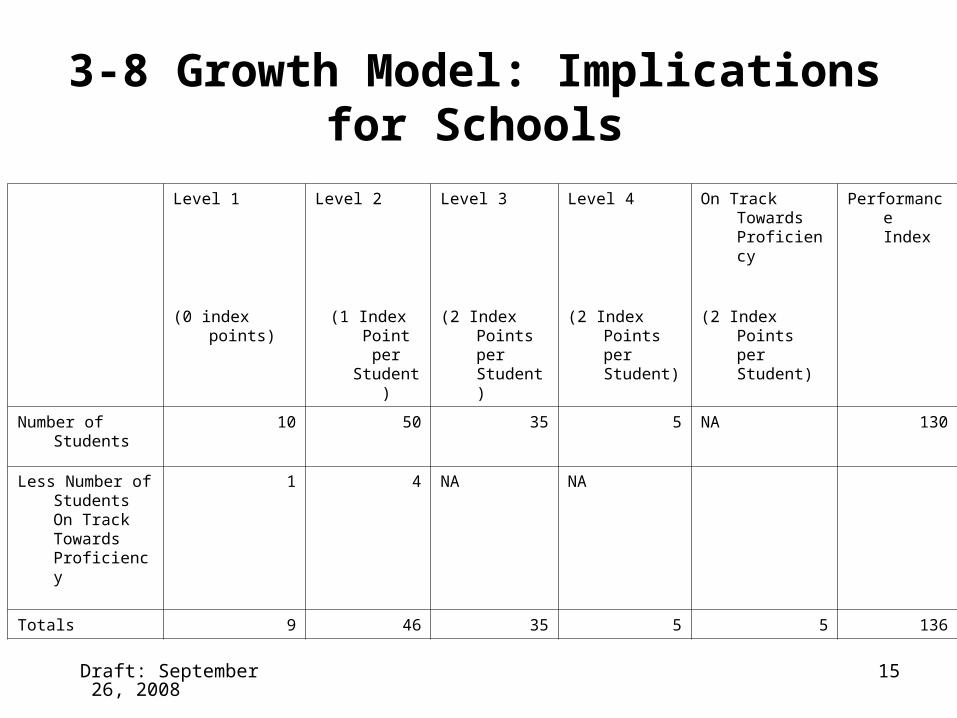
3-8 Growth Model: Implications for Schools
Level 1 Level 2 Level 3 Level 4 On Track Towards Proficiency
Performance Index
(0 index points) (1 Index Point per
Student)
(2 Index Points per Student)
(2 Index Points per Student)
(2 Index Points per Student)
Number of Students
10 50 35 5 NA 130
Less Number of Students On Track Towards Proficiency
1 4 NA NA
Totals 9 46 35 5 5 136
Draft: September 26, 2008
16
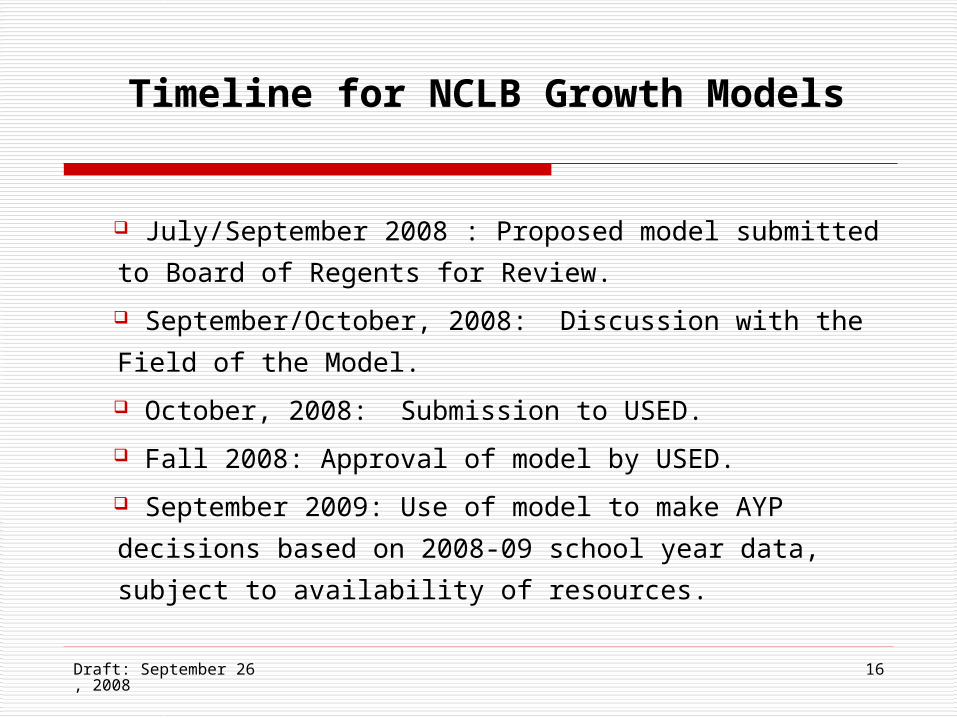
Timeline for NCLB Growth Models
July/September 2008 : Proposed model submitted to
Board of Regents for Review.
September/October, 2008: Discussion with the Field of
the Model.
October, 2008: Submission to USED.
Fall 2008: Approval of model by USED.
September 2009: Use of model to make AYP decisions
based on 2008-09 school year data, subject to availability
of resources.
Draft: September 26, 2008
17
Building a “Growth for All” Model
Regents have directed SED to provide recommendations
for how to hold schools and districts accountable for
growth of students beyond proficiency as part of the
process of moving towards creation of a value-added
accountability model.
This “growth for all” model can be separate from NY’s
NCLB accountability system and need not be constrained
by NCLB growth model rules.
The Regents will need to decide what rewards and/or
consequences should be based upon a “growth for all”
model.
Draft: September 26, 2008
18
Building a “Growth for All” Model
One possibility would be to modify the current
process for designation of High Performing and
Rapidly Improving schools to include a “growth for
all” component: other possibilities include rewards,
regulatory relief, and differentiated consequences.
Draft: September 26, 2008
19
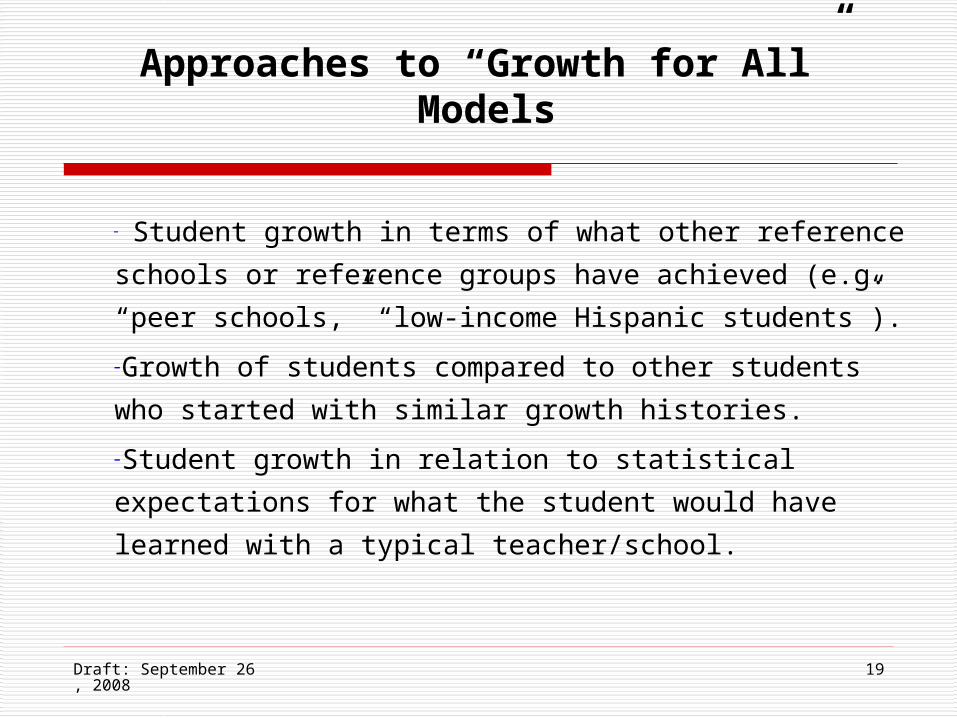
Approaches to “Growth for All” Models
- Student growth in terms of what other reference
schools or reference groups have achieved (e.g.
“peer schools,” “low-income Hispanic students”).
-Growth of students compared to other students who
started with similar growth histories.
-Student growth in relation to statistical expectations
for what the student would have learned with a
typical teacher/school.
Draft: September 26, 2008
20
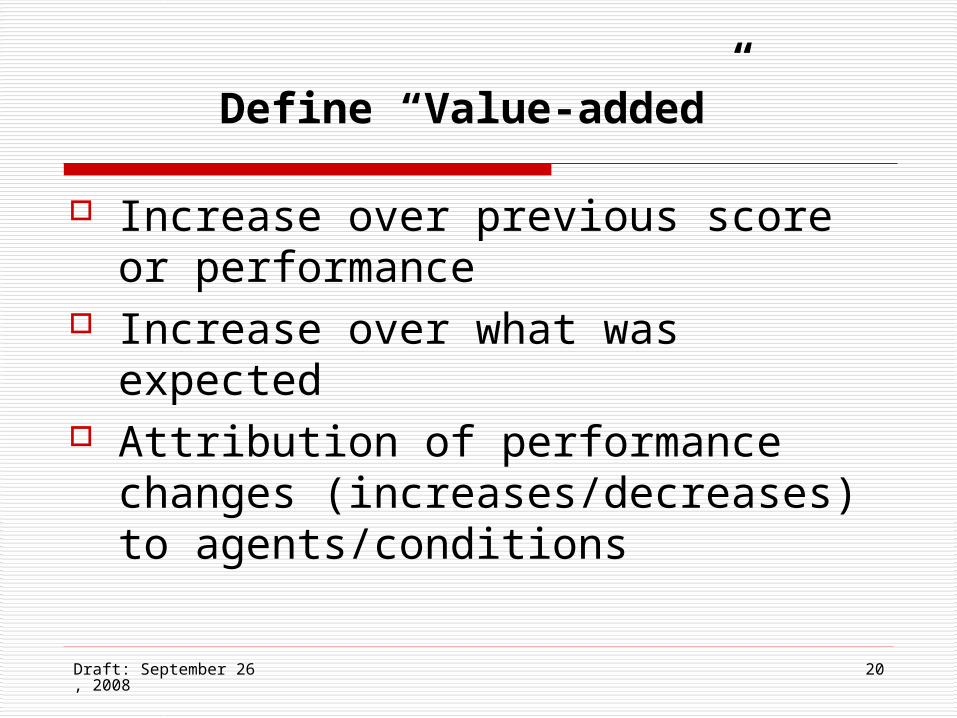
Define “Value-added”
Increase over previous score or performance
Increase over what was expected Attribution of performance changes
(increases/decreases) to agents/conditions
Draft: September 26, 2008
21
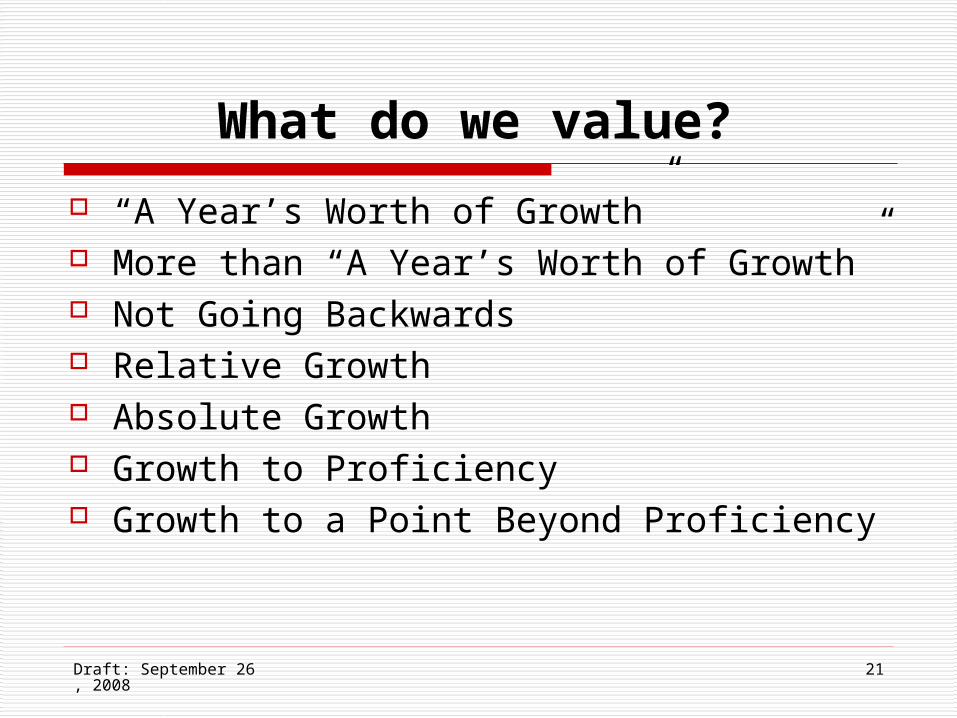
What do we value?
“A Year’s Worth of Growth” More than “A Year’s Worth of Growth” Not Going Backwards Relative Growth Absolute Growth Growth to Proficiency Growth to a Point Beyond Proficiency
Draft: September 26, 2008
22
Differentiated Accountability Proposal
Draft: September 26, 2008
23Draft: September 24, 2008
23
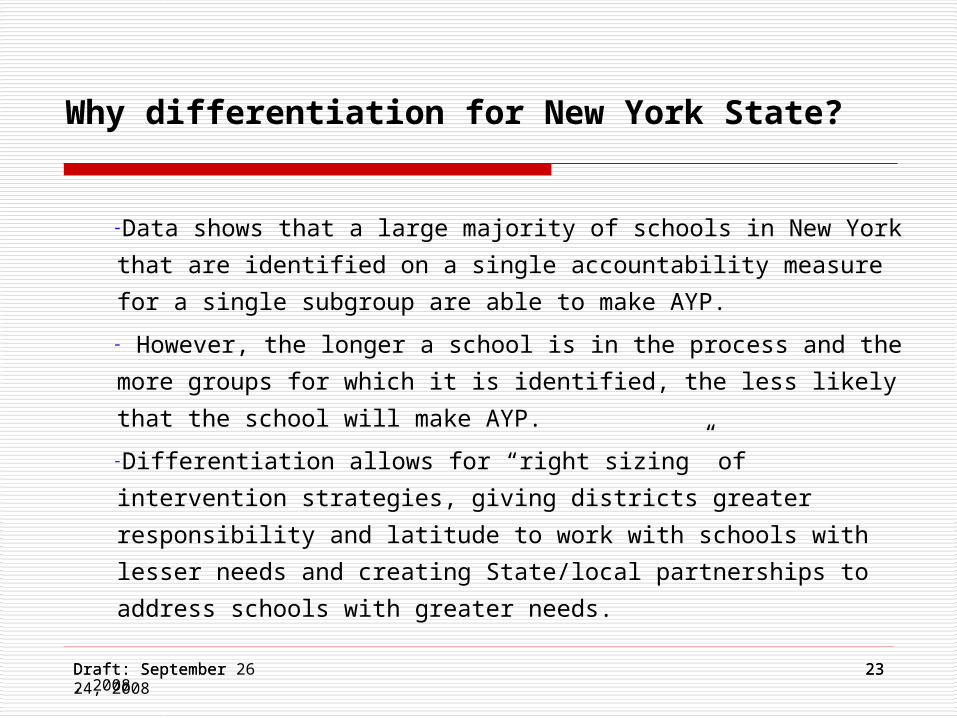
Why differentiation for New York State?
-Data shows that a large majority of schools in New York that are
identified on a single accountability measure for a single
subgroup are able to make AYP.
- However, the longer a school is in the process and the more
groups for which it is identified, the less likely that the school will
make AYP.
-Differentiation allows for “right sizing” of intervention strategies,
giving districts greater responsibility and latitude to work with
schools with lesser needs and creating State/local partnerships to
address schools with greater needs.
Draft: September 26, 2008
24Draft: September 24, 2008
24
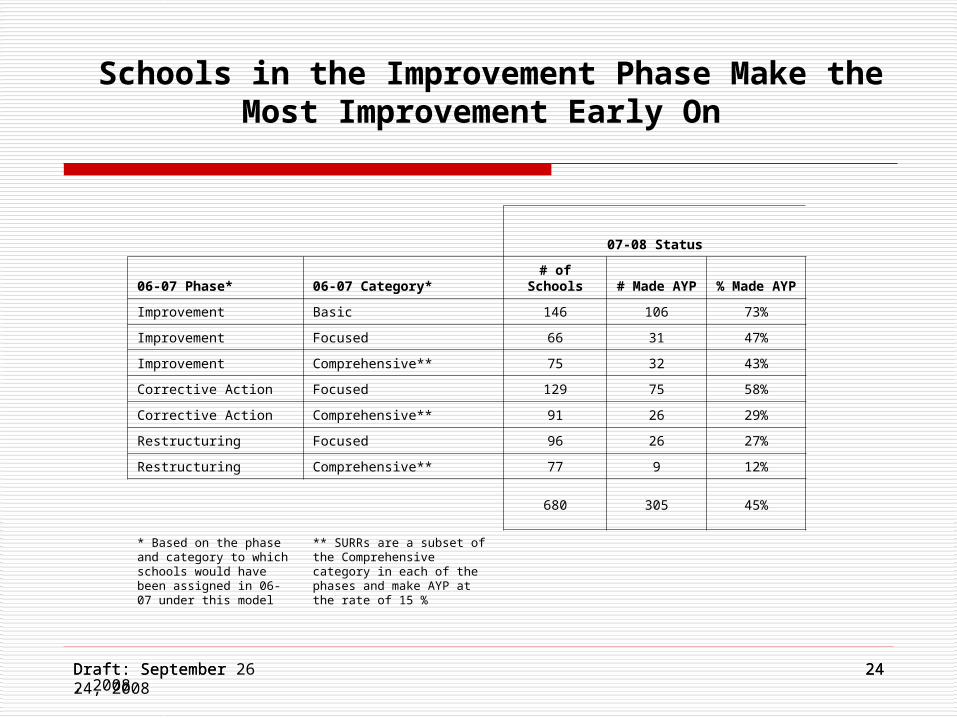
Schools in the Improvement Phase Make the Most Improvement Early On
07-08 Status
06-07 Phase* 06-07 Category* # of Schools # Made AYP % Made AYP
Improvement Basic 146 106 73%
Improvement Focused 66 31 47%
Improvement Comprehensive** 75 32 43%
Corrective Action Focused 129 75 58%
Corrective Action Comprehensive** 91 26 29%
Restructuring Focused 96 26 27%
Restructuring Comprehensive** 77 9 12%
680 305 45%
* Based on the phase and category to which schools would have been assigned in 06-07 under this model
** SURRs are a subset of the Comprehensive category in each of the phases and make AYP at the rate of 15 %
Draft: September 26, 2008
25Draft: September 24, 2008
25
How it Works
Accountability designations based on both the number and type of student groups failing to make AYP and the length of time such failure has persisted.
Three distinct, two-year, phases of intervention: Improvement, Corrective Action and Restructuring.
Three distinct categories within phases: Basic, Focused and Comprehensive.
Draft: September 26, 2008
26Draft: September 24, 2008
26
Criteria for Placement in Categories
Basic (Improvement Phase Only): Identified for the performance of a single student group on a single accountability measure.Focused: Not identified for the performance of an “all student” group. Comprehensive: Identified for the performance of an “all student” group.
Draft: September 26, 2008
27Draft: September 24, 2008
27
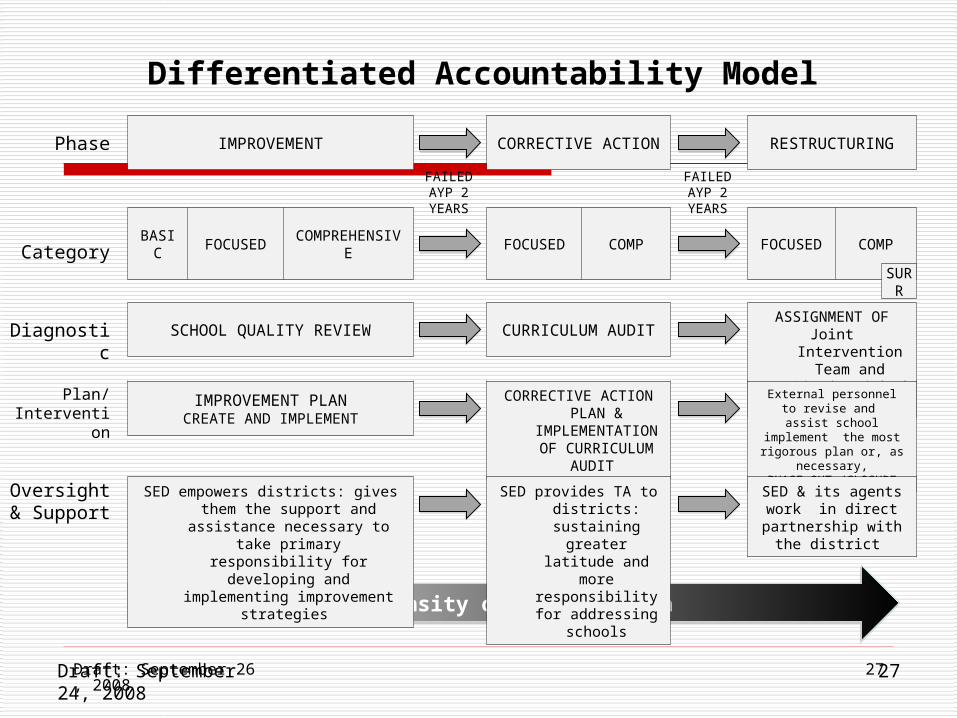
Phase
Diagnostic
Differentiated Accountability Model
Category
CORRECTIVE ACTIONIMPROVEMENT RESTRUCTURING
CURRICULUM AUDITSCHOOL QUALITY REVIEWASSIGNMENT OF
Joint Intervention Team and Distinguished
Educator
FOCUSED COMPBASIC FOCUSED COMPREHENSIVE FOCUSED COMP
SURR
Intensity of Intervention
FAILED AYP 2 YEARS
FAILED AYP 2 YEARS
Plan/Intervention CORRECTIVE ACTION PLAN & IMPLEMENTATION
OF CURRICULUM AUDIT
IMPROVEMENT PLANCREATE AND IMPLEMENT
External personnel to revise and assist school implement the most
rigorous plan or, as necessary,PHASE-OUT /CLOSURE
Oversight& Support
SED provides TA to districts: sustaining greater latitude and more responsibility for
addressing schools
SED empowers districts: gives them the support and assistance necessary to take primary
responsibility for developing and implementing improvement strategies
SED & its agents work in direct partnership with the
district

Draft: September 26, 2008
28Draft: September 24, 2008
28
Improvement Phase
School Quality Review: Completion of Quality Indicators Document. District/External review by SQR team of
documentation for Basic Schools. On-site external review by SQR team for Focused
and Comprehensive Schools. School Improvement Plan:
Basic and Focused Schools: More latitude than current law.
Comprehensive: Same as Current Law. SES instead of Choice. Districts have primary oversight responsibility. Reasonable and necessary costs of SQR team are
a district expense, per Chapter 57.

Draft: September 26, 2008
29Draft: September 24, 2008
29
Corrective Action Phase
Curriculum Audit: external review of curriculum as written and taught, with focus on alignment with State standards.
Corrective Action Plan to Implement Curriculum Audit.
One additional, appropriate corrective action. SED supports districts, which have greater latitude
and more responsibility for addressing school needs. Reasonable and necessary costs of SQR team and
Distinguished Educator, if assigned, are a district expense, per Chapter 57.

Draft: September 26, 2008
30Draft: September 24, 2008
30
Restructuring Phase
Assignment of Joint Intervention Teams and Distinguished Educators.
Development of restructuring or phase out/closure plan.
SED and its agents work in direct partnership with the district.
Reasonable and necessary costs of JIT and DE are a district expense, per Chapter 57.

Draft: September 26, 2008
31Draft: September 24, 2008
31
Public School Choice (PSC) and Supplemental Educational Services (SES) for Title I Schools
Phase Category Choice SES
Improvement Basic No – Year 1Yes – Year 2
Low-income, non-proficient
Improvement Focused No – Year 1Yes – Year 2
Low-income, non-proficient
Improvement Comprehensive No – Year 1Yes – Year 2
Low-income, with priority to non-proficient
Corrective Action
Focused All Students Low-income, non-proficient
Corrective Action
Comprehensive All Students Low-income, with priority to non-proficient
Restructuring Focused All Students Low-income, with priority to non-proficient
Restructuring Comprehensive All Students Low-income, with priority to non-proficient
SURR As per NCLB status

Draft: September 26, 2008
32Draft: September 24, 2008
32
Transition Rules for 2009-2010
1. Schools that have made AYP or are entering the second year of a phase continue to implement their previous plans, with modifications if necessary.
2. Newly identified improvement schools and schools new to corrective action and restructuring follow new process.

Draft: September 26, 2008
33Draft: September 24, 2008
33
Transition Rules: Examples
1. School A in 2008-2009 is a SINI 1 for Grade 3-8 ELA for SWDs. In 2008-2009, School A fails to make AYP in Grade 3-8 ELA for SWDs and LEPs. The school in 2009-2010 will be in Year 2 of the Improvement Phase. The school will modify its CEP to address both SWDs and LEPs.
2. School B in 2008-2009 is a SINI 2 for Grade 3-8 Math for low-income students. The school in 2008-2009 again fails to make AYP For Grade 3-8 Math for low-income students. The school will enter the Corrective Action Phase in 2009-2010 and conduct a curriculum audit.
3. School C in 2008-2009 is a Corrective Action school for HS math for Black students. The school in 2008-09 makes AYP on all accountability measures. The school will remain in Corrective Action and will continue to implement its approved Corrective Action plan.

Draft: September 26, 2008
34Draft: September 24, 2008
34
Linkage to Chapter 57
• SQR teams assigned to Improvement Schools and Corrective Action Schools.
• Curriculum Audits conducted in Corrective Action Schools.
• Joint Intervention Teams and Distinguished Educators Assigned to Restructuring Schools.

Draft: September 26, 2008
35Draft: September 24, 2008
35
Linkage to Growth Model
• Schools that would have been in the Focused or Comprehensive categories without the growth model may be assigned to the Basic or Focused categories instead.
• Plans will not need to address groups of students with low status but good growth.
• SED could, with Regents and USED approval, at a later date revise the definition of categories to more explicitly incorporate growth or value-added components.

Draft: September 26, 2008
36Draft: September 24, 2008
36
2007- 08 Accountability Status School CountsTotal: 733
Restructuring 1, 7%
Restructuring 2, 6%
Restructuring 3, 8%
Restructuring 4, 6%
SRAP 1, 4%
SRAP 2, 5%SRAP 3, 3%
SRAP 5, 5%SRAP 4, 3%
Planning for Restructuring, 8%
SINI 1, 22%
SINI 2, 11%
CA, 10%
SRAP 6, 1%
SRAP 7, 1%
Current System

Draft: September 26, 2008
37Draft: September 24, 2008
37
Projected Differentiated Accountability Group School Counts 2009-10Total: 733
Improvement-Basic, 194
Improvement-Focused, 55
Improvement-Comprehensive, 54
Corrective Action-Focused, 125
Corrective Action-Comprehensive, 34
Restructuring-Focused, 127
Restructuring-Comprehensive, 81
SURR, 63
Phases and Categories Allow Further Differentiation

Draft: September 26, 2008
38Draft: September 24, 2008
38
Timeline
• Preliminary Draft Plan submitted to USED on September 17.
• Discussions with key groups occurring during September and October.
• Peer review conference to be held in November.• Revised Plan to be submitted to Regents at October
Regents meeting.• With Regents approval, final plan submitted to USED.• If approved by USED, implementation begins in 2009-
2010 using 2008-2009 test results.

Draft: September 26, 2008
39Draft: September 24, 2008
39
More Information
Ira Schwartz, CoordinatorAccountability, Policy, and AdministrationNew York State Education DepartmentOffice of School Improvement and
Community [email protected]