Embed Size (px)
Citation preview
Obesity is Not aboutCarbohydrates:
The POUNDS LOST TrialKathy McManus, M.S.,R.D.
Director
Department of Nutrition
Brigham and Women’s Hospital
A Harvard teaching hospital affiliate
Outline
Overview of weight loss diet trials
Pounds Lost Trial
Pasta as part of healthy meals

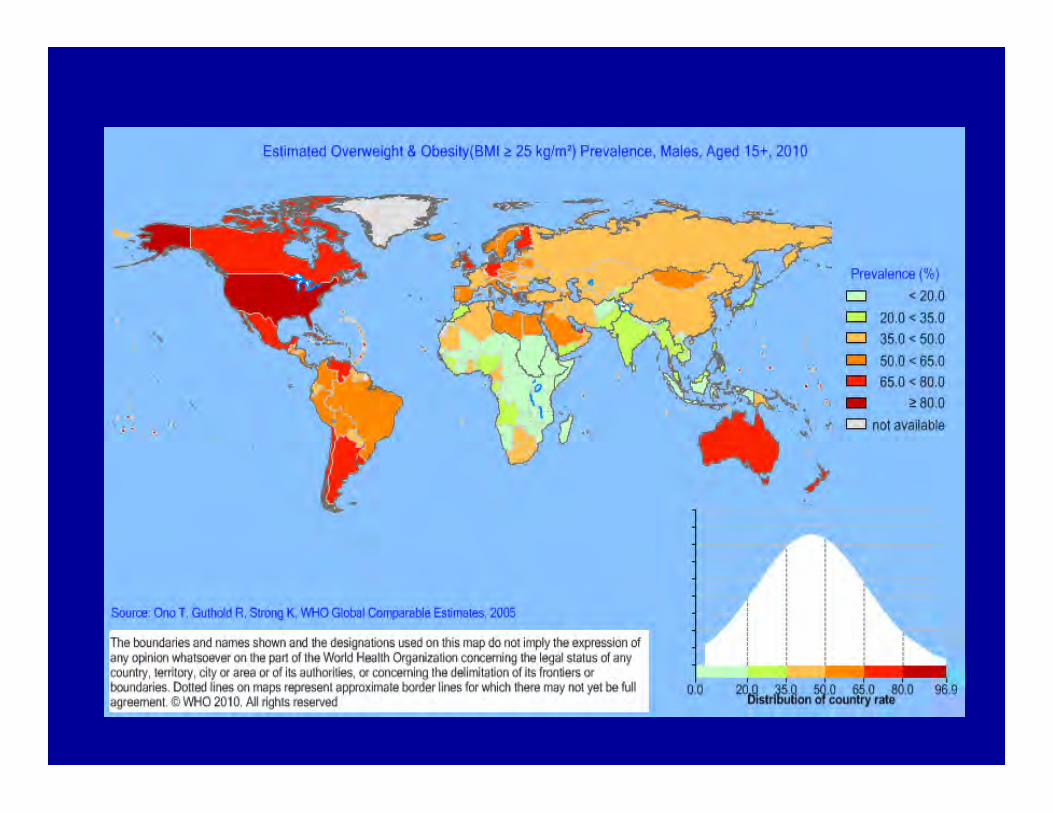
Obesity Trends* Among U.S. AdultsBRFSS, 1990
(*BMI ≥30, or ~ 30 lbs. overweight for 5’ 4” person)
No Data <10% 10%–14%

Obesity Trends* Among U.S. AdultsBRFSS, 1995
*BMI ≥30, or ~ 30 lbs. overweight for 5’ 4” person
No Data <10% 10%–14% 15%–19%
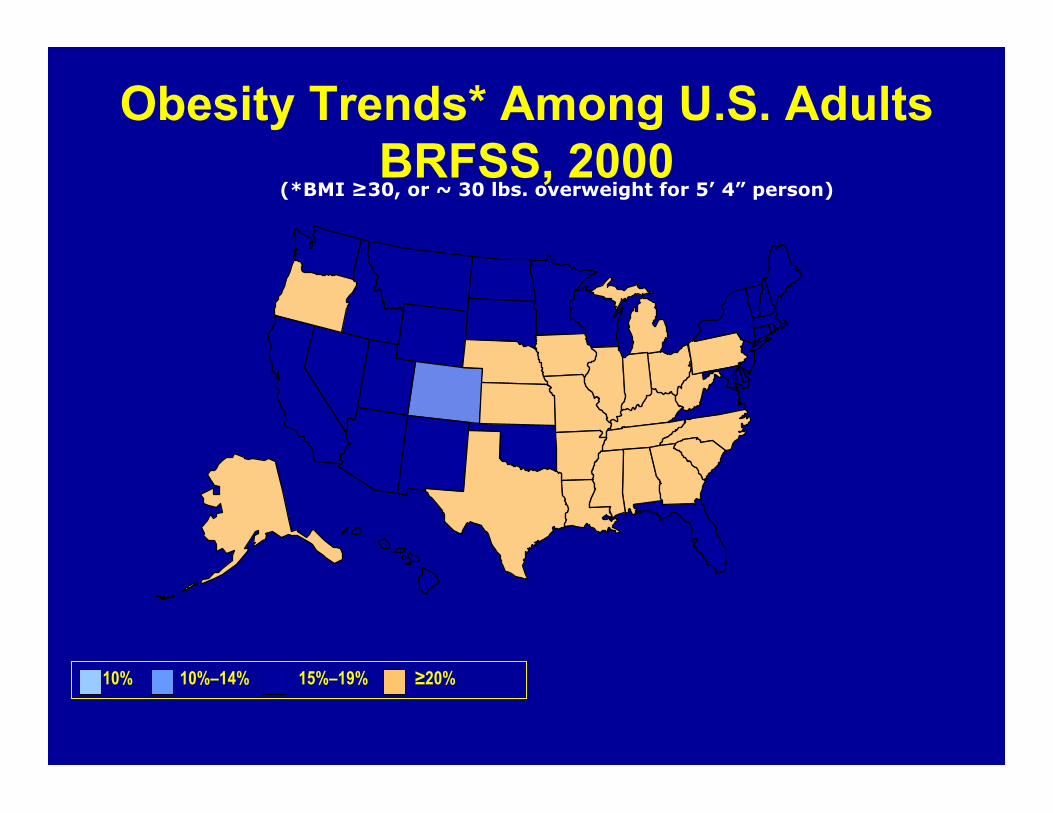
Obesity Trends* Among U.S. AdultsBRFSS, 2000
(*BMI ≥30, or ~ 30 lbs. overweight for 5’ 4” person)
<10% 10%–14% 15%–19% ≥20%

Obesity Trends* Among U.S. AdultsBRFSS, 2005
(*BMI ≥30, or ~ 30 lbs. overweight for 5’ 4” person)
<10% 10%–14% 15%–19% 20%–24% 25%–29% ≥30%
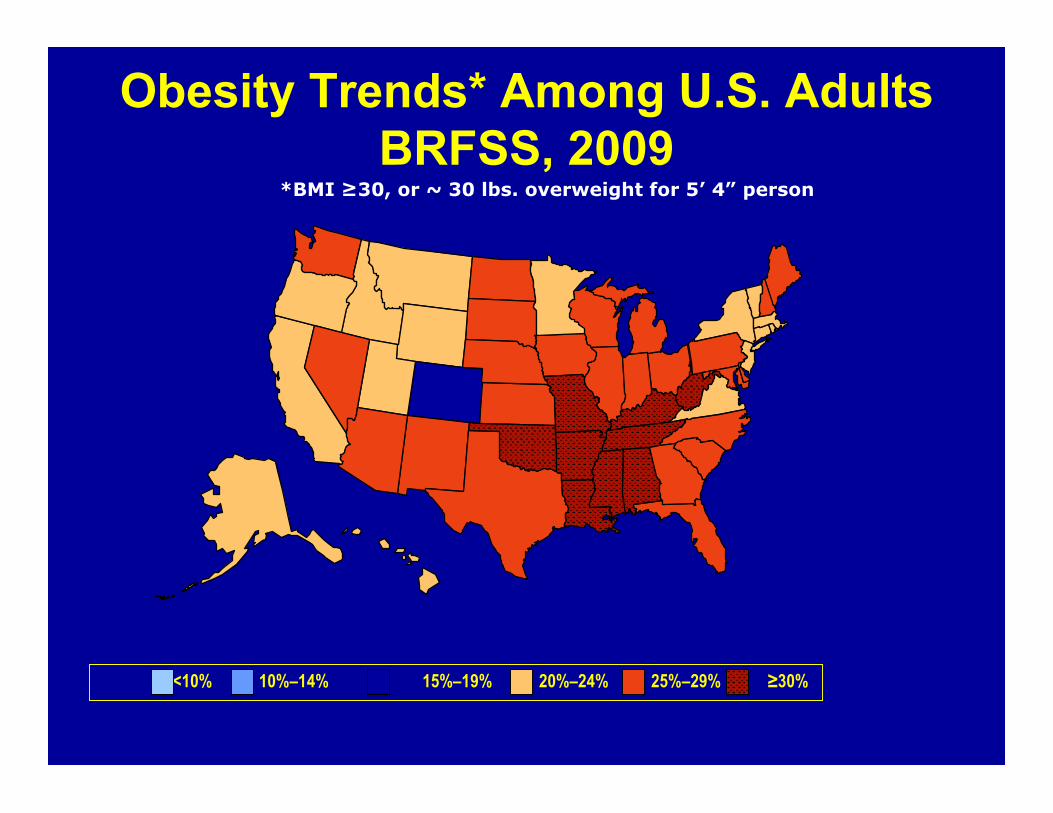
Obesity Trends* Among U.S. AdultsBRFSS, 2009
*BMI ≥30, or ~ 30 lbs. overweight for 5’ 4” person
<10% 10%–14% 15%–19% 20%–24% 25%–29% ≥30%

Fad orFad or Real?? Real??
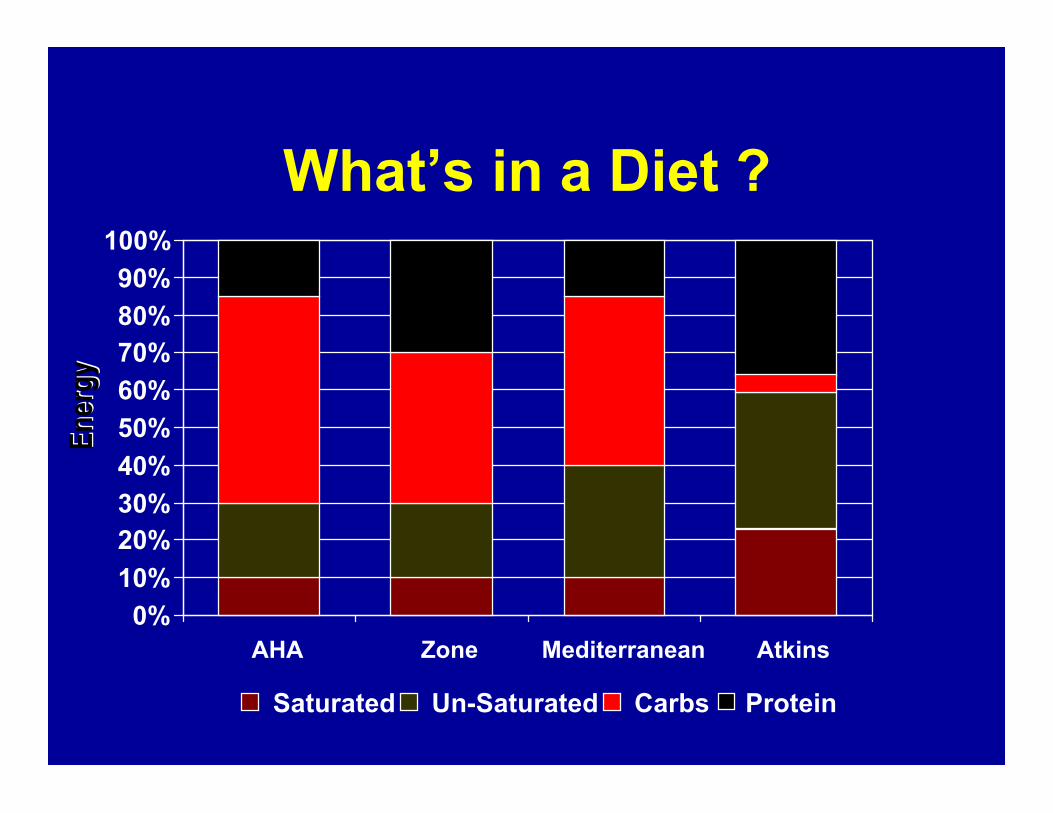
What’s in a Diet ?
0%
10%
20%30%
40%
50%
60%
70%80%
90%
100%
AHA Zone Mediterranean Atkins
Saturated Un-Saturated Carbs Protein
Ener
gyEn
ergy
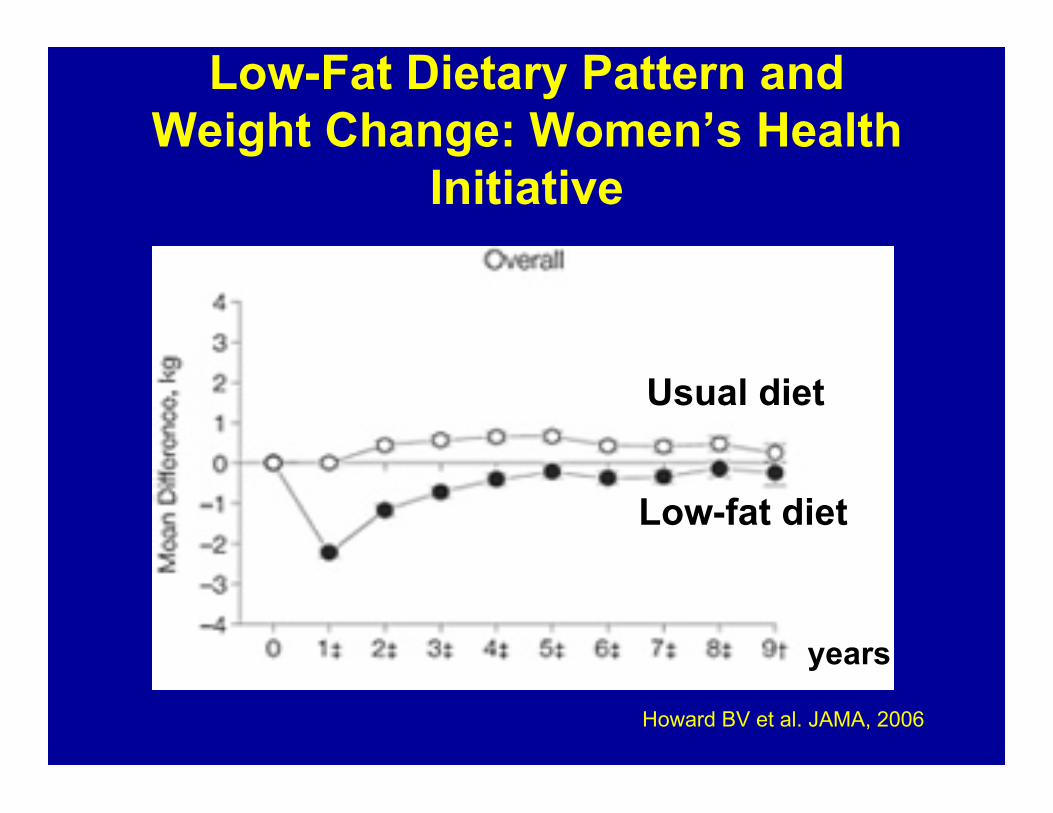
Low-Fat Dietary Pattern andWeight Change: Women’s Health
Initiative
years
Howard BV et al. JAMA, 2006
Usual diet
Low-fat diet

Superiority of Very Low Fat Vegan DietCompared to Standard Low-fat in 2 yr:
Effect of diet type and behavioral support
• Vegan (n = 17)– With support after 3 months: - 5.3 kg
– Without support: - 0.4 kg
• Standard low-fat (n = 14)– With support: - 2.7 kg
– Without support: - 0.5 kg
P<0.05 for diet type and support
Turner-McGrievy G, Barnard N, Scialli A. Obesity 2007
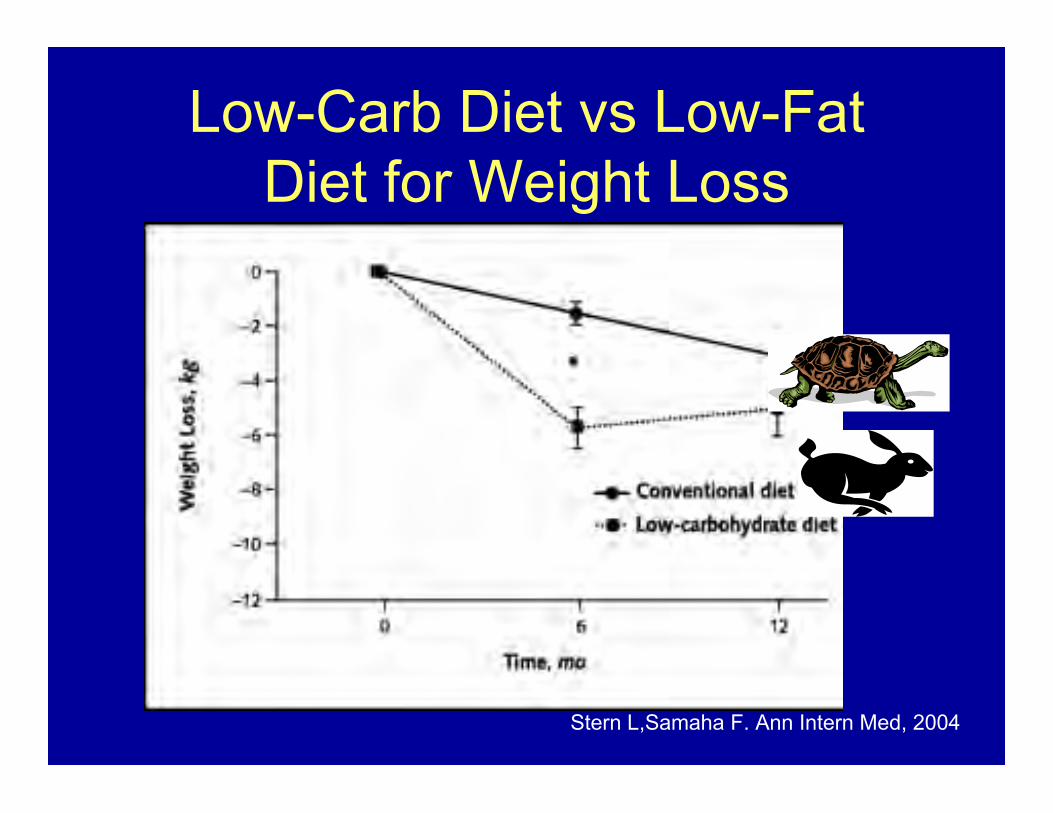
Low-Carb Diet vs Low-FatDiet for Weight Loss
Stern L,Samaha F. Ann Intern Med, 2004
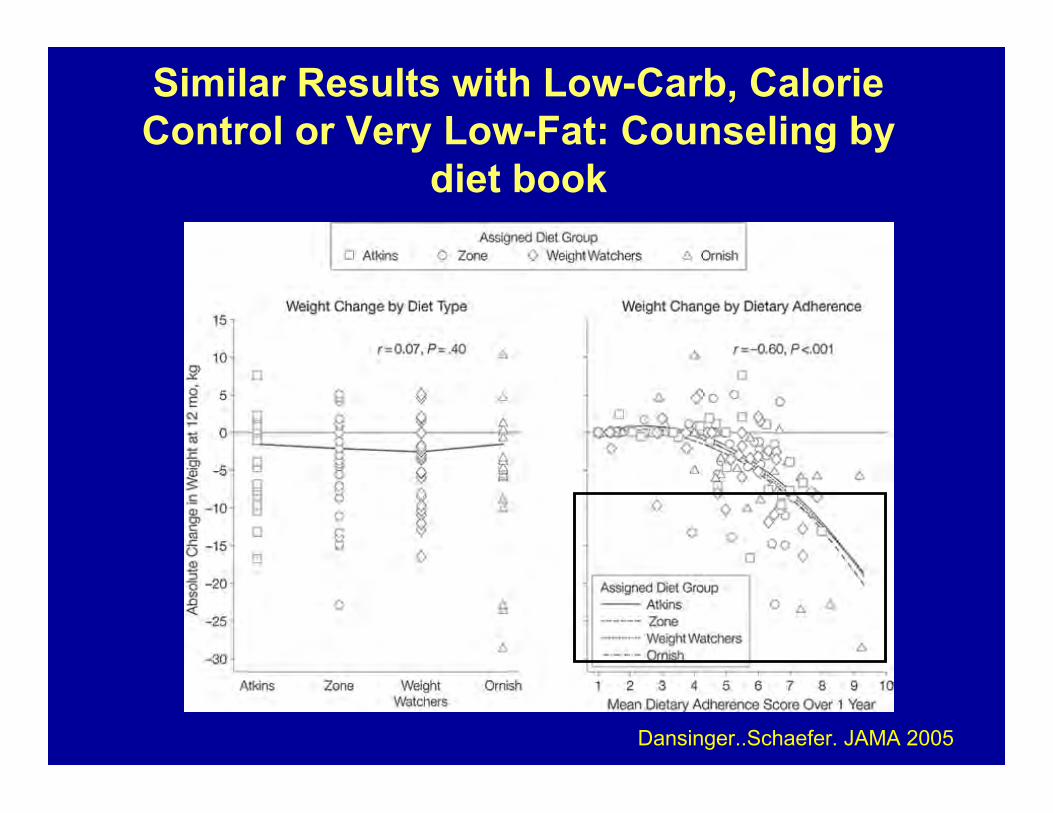
Similar Results with Low-Carb, CalorieControl or Very Low-Fat: Counseling by
diet book
Dansinger..Schaefer. JAMA 2005
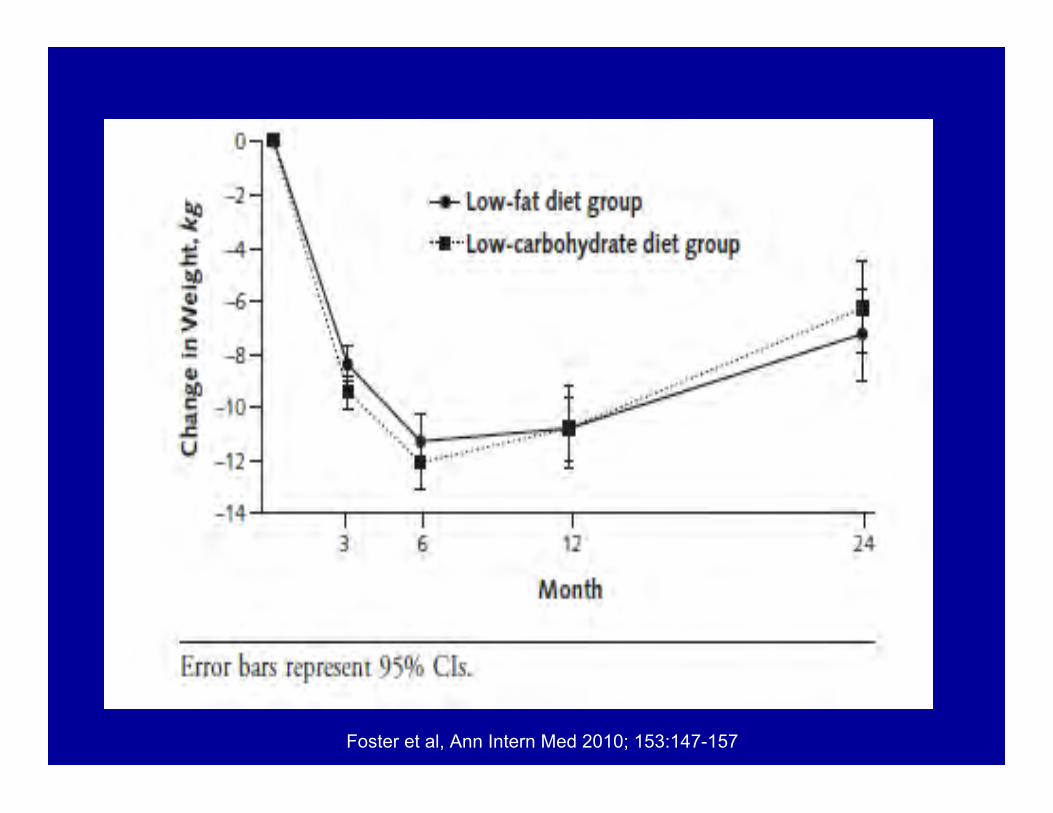
Foster et al, Ann Intern Med 2010; 153:147-157
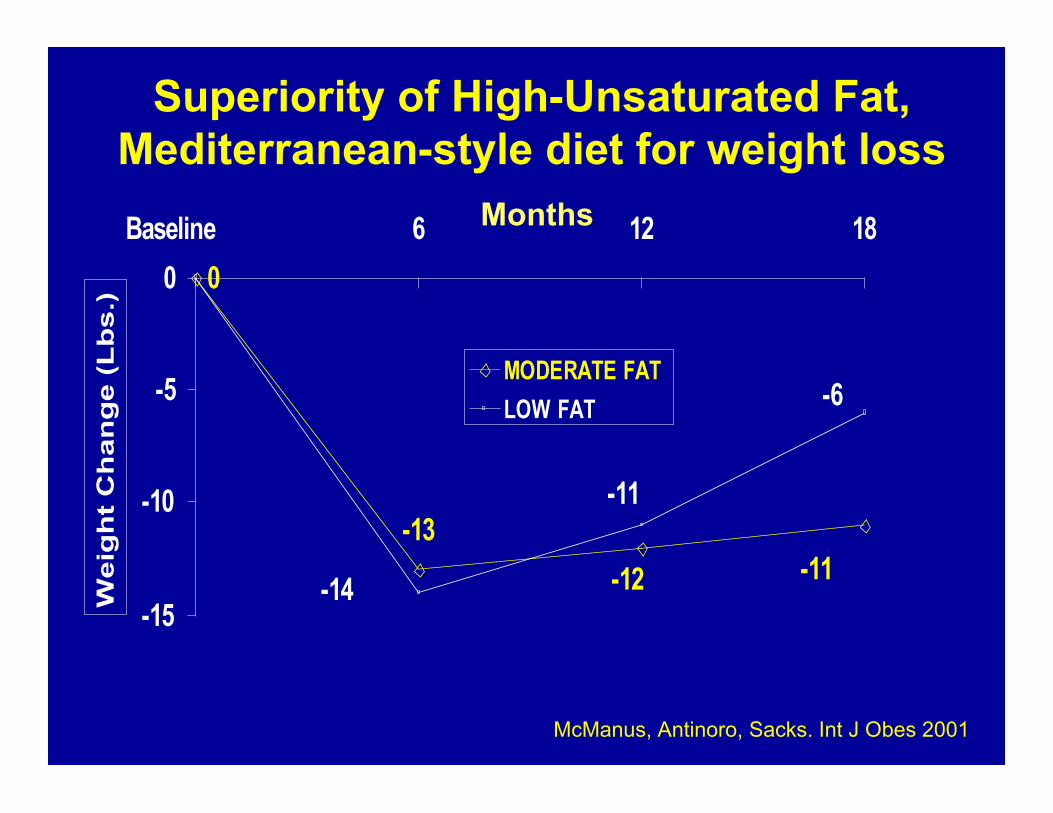
Superiority of High-Unsaturated Fat,Mediterranean-style diet for weight loss
0
-13
-12 -11
-6
-11
-14-15
-10
-5
0
Baseline 6 12 18
Weig
ht
Ch
an
ge (
Lb
s.)
MODERATE FAT
LOW FAT
Months
McManus, Antinoro, Sacks. Int J Obes 2001
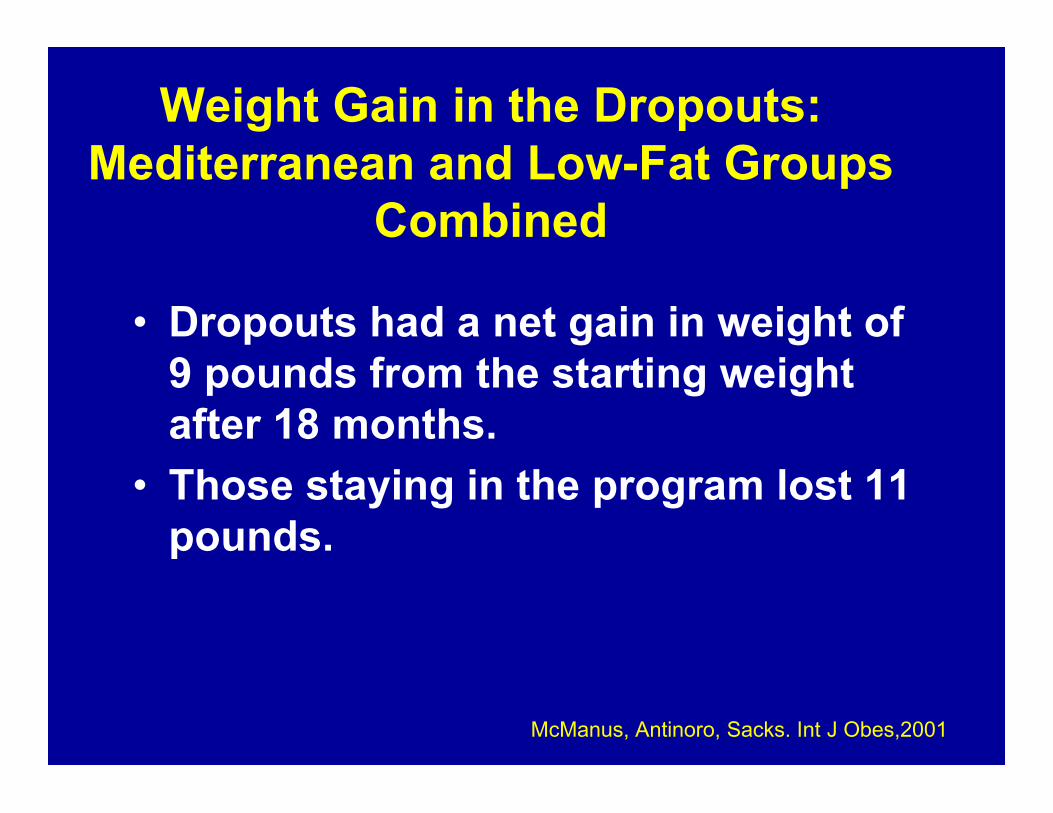
Weight Gain in the Dropouts:Mediterranean and Low-Fat Groups
Combined
• Dropouts had a net gain in weight of9 pounds from the starting weightafter 18 months.
• Those staying in the program lost 11pounds.
McManus, Antinoro, Sacks. Int J Obes,2001
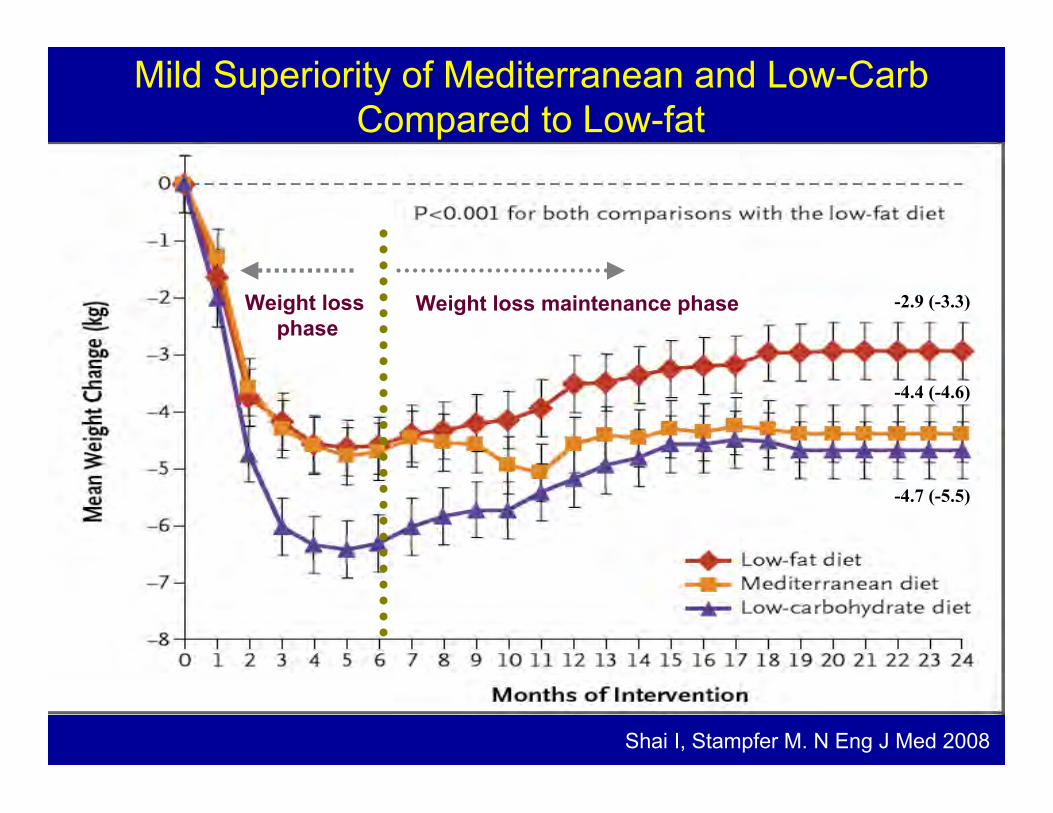
Mild Superiority of Mediterranean and Low-CarbCompared to Low-fat
Weight loss phase
Weight loss maintenance phase
-4.7 (-5.5)
-4.4 (-4.6)
-2.9 (-3.3)
Shai I, Stampfer M. N Eng J Med 2008
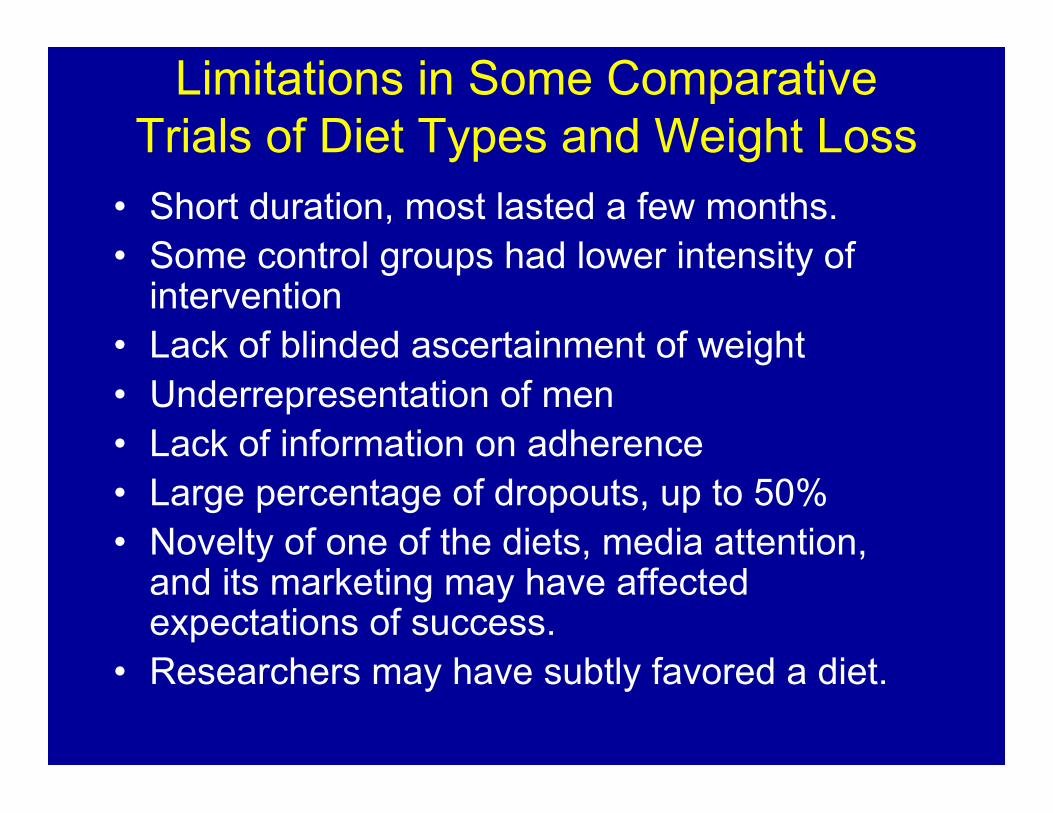
Limitations in Some ComparativeTrials of Diet Types and Weight Loss
• Short duration, most lasted a few months.• Some control groups had lower intensity of
intervention• Lack of blinded ascertainment of weight• Underrepresentation of men• Lack of information on adherence• Large percentage of dropouts, up to 50%• Novelty of one of the diets, media attention,
and its marketing may have affectedexpectations of success.
• Researchers may have subtly favored a diet.
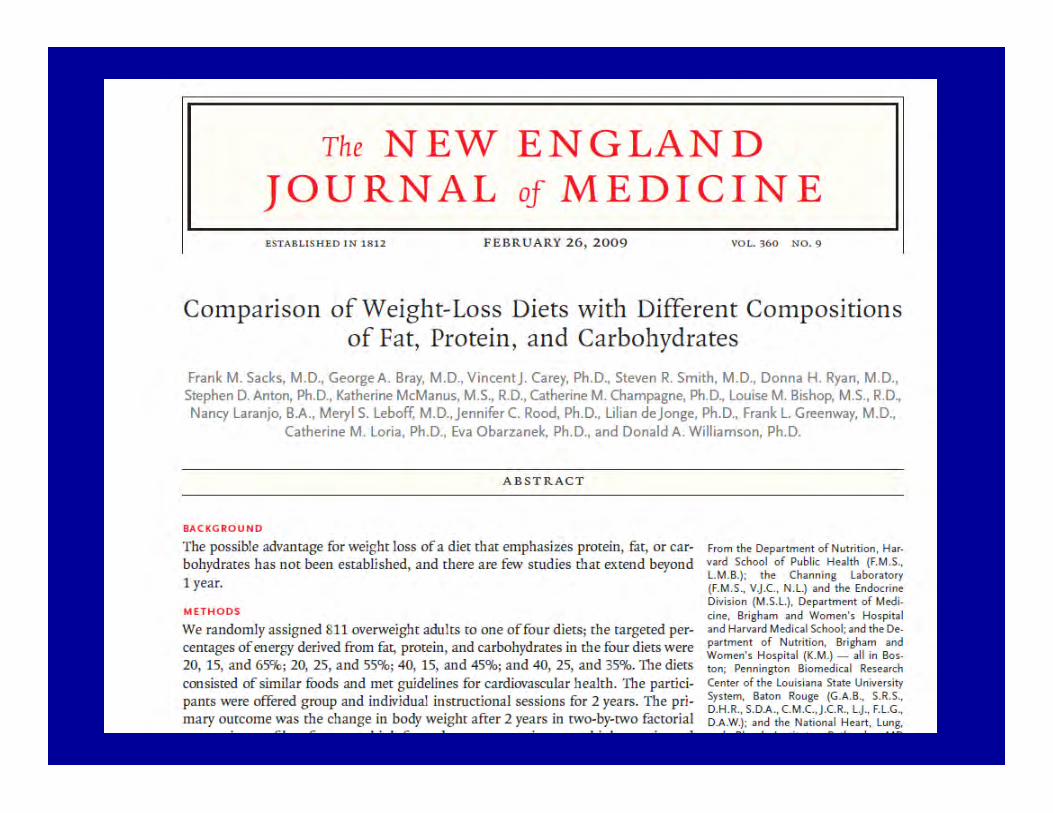
Pounds Lost Trial: Aims
• To determine whether fat, protein orcarbohydrate contents affect weight-loss and itsmaintenance for 2 years.
• To determine the optimal proportions of fat,protein, and carbohydrate, if any, for weightloss and maintenance.
Sacks FM et al. N Eng J Med, 2009
Pounds Lost Trial Organization:Study Sites, Researchers, Funding
• Harvard School of Public Health and Brigham & Women’s Hospital,Boston; F. Sacks, PI, Study Chairperson; Kathy McManus, Meryl LeBoff,Louise Bishop, Trisha Copeland, Jeremy Furtado, Jake Humpfreys,Cassandra Carrington, Jackie Gallagher, Audrey Shweky, DawnQuintino, Marit Pywell, Mary Dinehart
• Pennington Biomedical Research Center, Louisiana State UniversitySystem, Baton Rouge, G. Bray PI; Donna Ryan, Steven Smith, StevenAnton, Don Williamson, Cathy Champagne, Jennifer Rood
• Coordinating Center: Channing Laboratory, Brigham & Women’sHospital, V Carey Director; N Laranjo; BJ Harshfield, Melissa McEnery-Stonelake
• National Heart Lung and Blood Institute, NIH; Cay Loria, Eva Obarzanek,Project Officers
• Investigator Initiated proposal to NHLBI funded by cooperativeagreement grant to Harvard School of Public Heath.
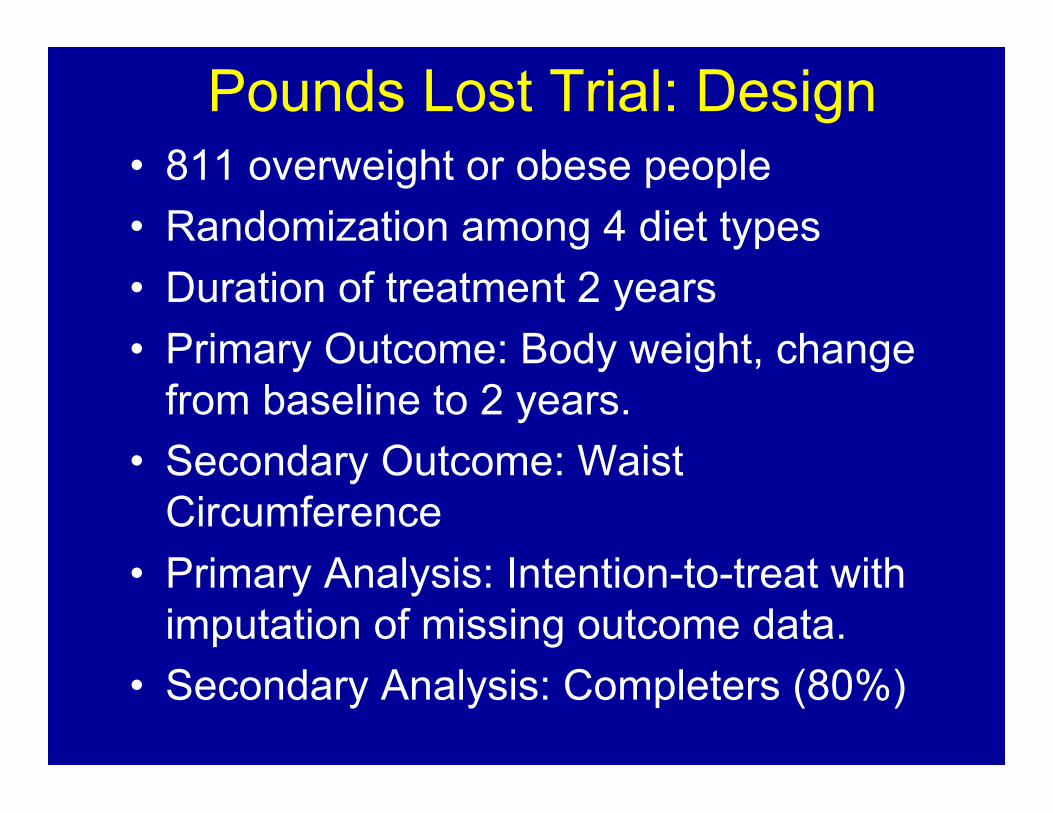
Pounds Lost Trial: Design• 811 overweight or obese people
• Randomization among 4 diet types
• Duration of treatment 2 years
• Primary Outcome: Body weight, changefrom baseline to 2 years.
• Secondary Outcome: WaistCircumference
• Primary Analysis: Intention-to-treat withimputation of missing outcome data.
• Secondary Analysis: Completers (80%)
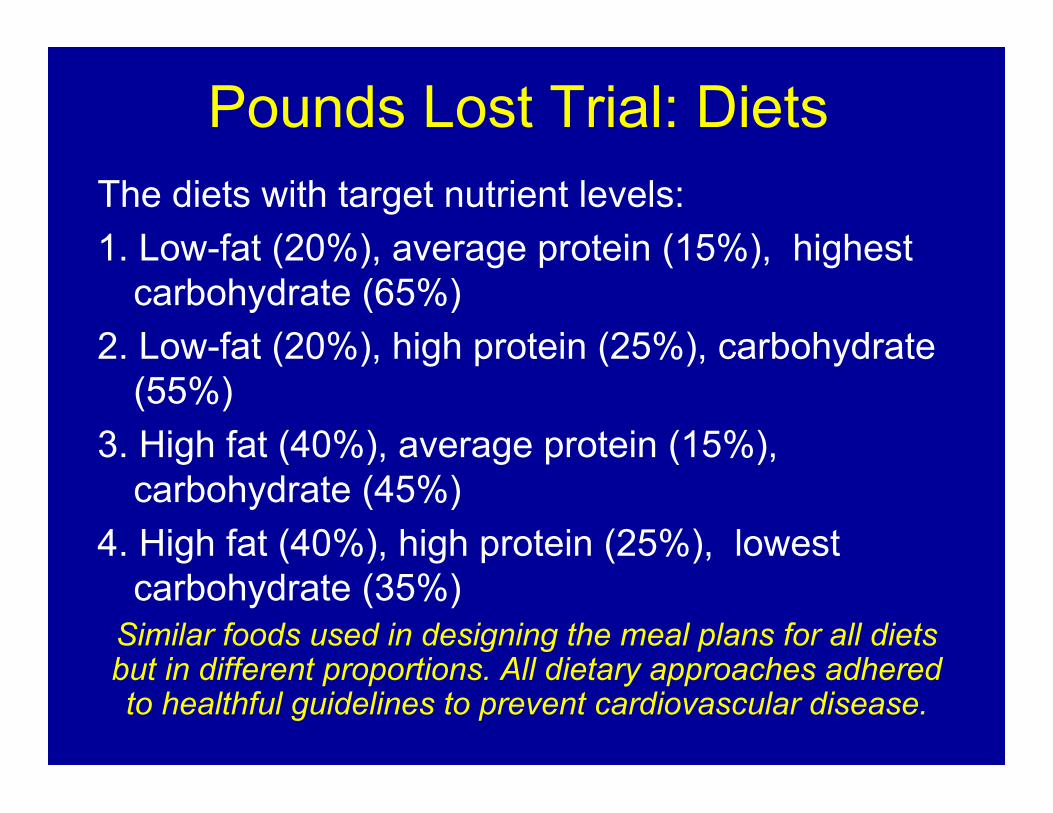
Pounds Lost Trial: DietsThe diets with target nutrient levels:
1. Low-fat (20%), average protein (15%), highestcarbohydrate (65%)
2. Low-fat (20%), high protein (25%), carbohydrate(55%)
3. High fat (40%), average protein (15%),carbohydrate (45%)
4. High fat (40%), high protein (25%), lowestcarbohydrate (35%)
Similar foods used in designing the meal plans for all dietsbut in different proportions. All dietary approaches adheredto healthful guidelines to prevent cardiovascular disease.

Dietary Program for Weight Loss
• Macronutrient targets were the mainteaching objective.
• Specified menus for 2 week cycles foreach group
• Participants taught to follow meal plansexactly
• Energy reduction goal was 750 Kcal daily• Physical activity goal was 90 minutes per
week• Same technique and intensity for all
groups
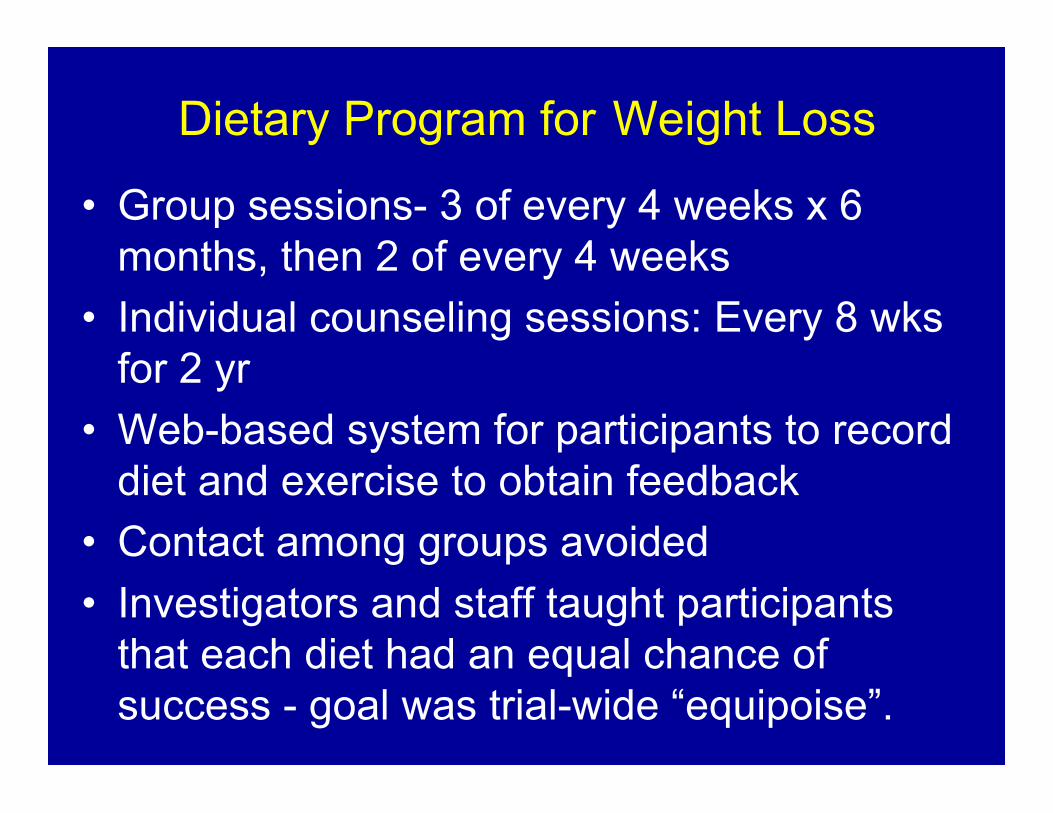
Dietary Program for Weight Loss
• Group sessions- 3 of every 4 weeks x 6months, then 2 of every 4 weeks
• Individual counseling sessions: Every 8 wksfor 2 yr
• Web-based system for participants to recorddiet and exercise to obtain feedback
• Contact among groups avoided
• Investigators and staff taught participantsthat each diet had an equal chance ofsuccess - goal was trial-wide “equipoise”.

Baseline Characteristics
• Number 811 645 (80%)
• Age 51 52
• Women 64% 62%
• White race 79% 81%
• BMI, kg (mean) 33 33
• BMI 25-30 27% 28%
• BMI >30 73% 72%
• Waist circumference 103 cm 104 cm
• Completed college 68% 69%
• Attended college 22% 20%
• Married 70% 69%
All Completers
Protein Fat Carb
-5
-4.5
-4
-3.5
-3
-2.5
-2
-1.5
-1
-0.5
0
Change in b
ody w
eig
ht fr
om
baselin
e to 2
years
, kg
High
Low or
average
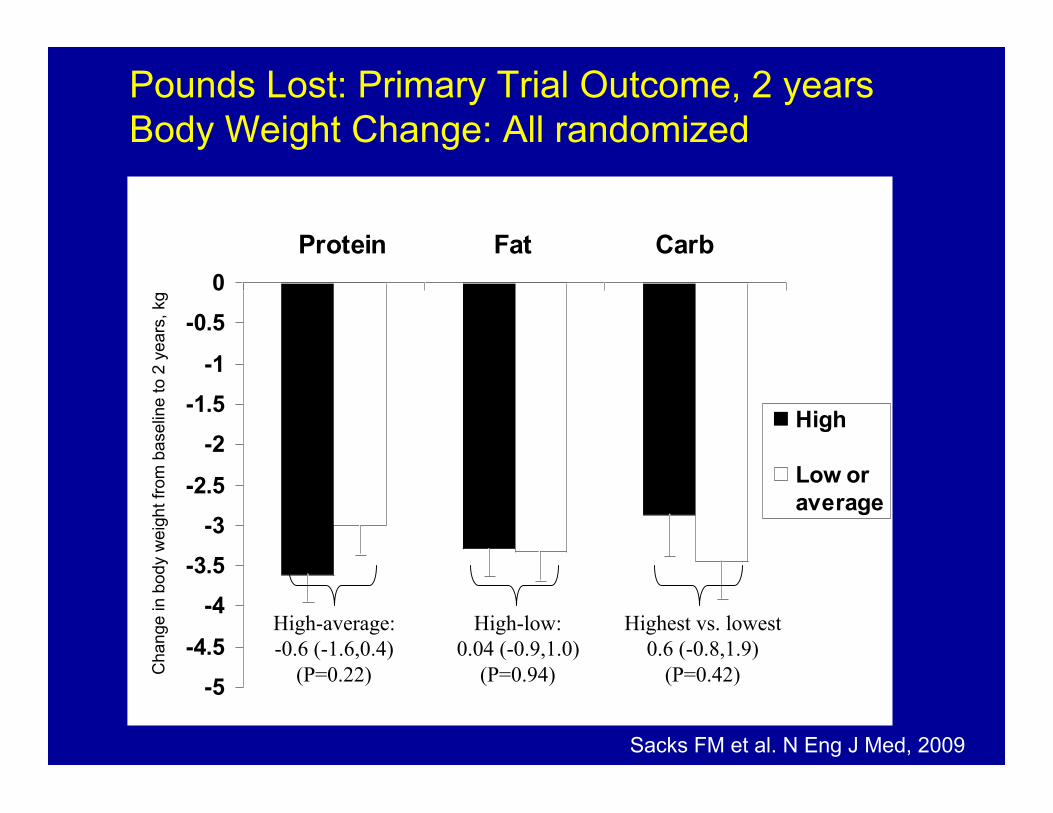
High-average:-0.6 (-1.6,0.4)
(P=0.22)
High-low:0.04 (-0.9,1.0)
(P=0.94)
Highest vs. lowest0.6 (-0.8,1.9)
(P=0.42)
Pounds Lost: Primary Trial Outcome, 2 yearsBody Weight Change: All randomized
Sacks FM et al. N Eng J Med, 2009
Protein Fat Carb
-5
-4.5
-4
-3.5
-3
-2.5
-2
-1.5
-1
-0.5
0
Ch
an
ge
in
bo
dy w
eig
ht
fro
m b
ase
line
to
2 y
ea
rs,
kg
High
Low or
average
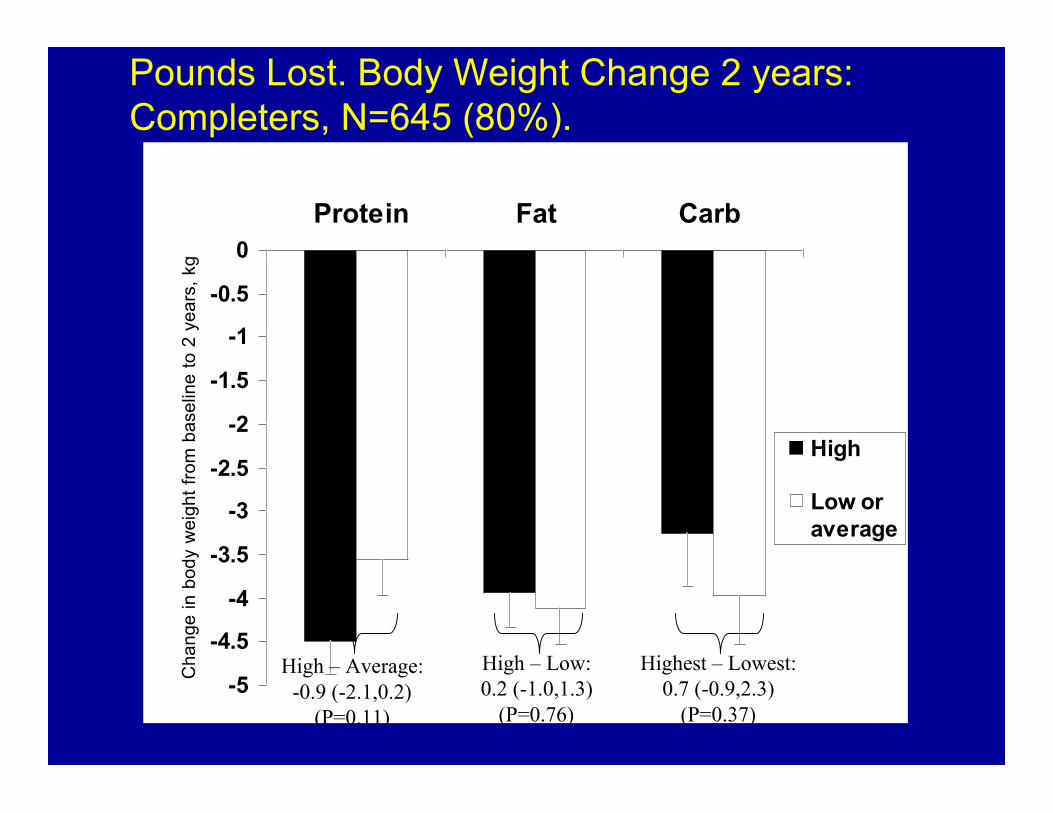
High – Low:0.2 (-1.0,1.3)
(P=0.76)
High – Average:-0.9 (-2.1,0.2)
(P=0.11)
Pounds Lost. Body Weight Change 2 years:Completers, N=645 (80%).
Highest – Lowest:0.7 (-0.9,2.3)
(P=0.37)

Ch
ang
e in
Wai
st C
ircu
mfe
ren
ceF
rom
Bas
elin
e (c
m)
POUNDS LOST WaistCircumference in Completers
-9
-8
-7
-6
-5
-4
-3
-2
-1
0
0 6 12 18 24
65/15/20
55/25/20
45/15/40
35/25/40
Months
Carbohydrate/Protein/Fat(% energy)
Diet Composition
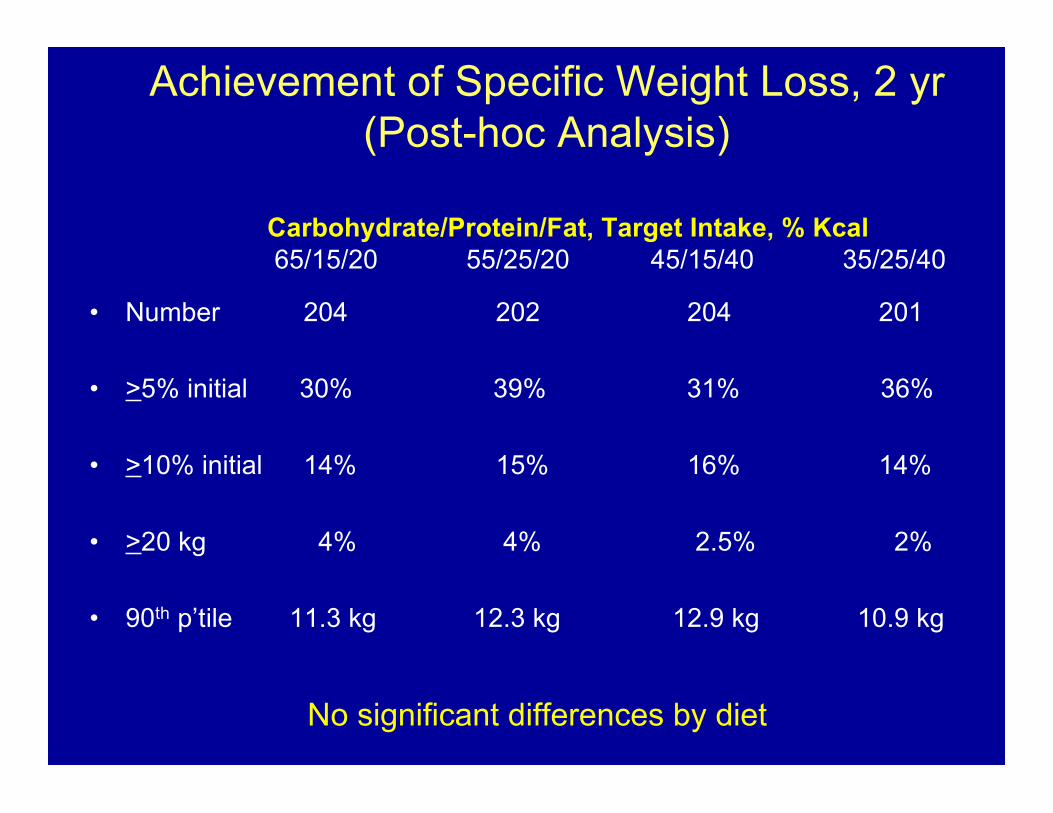
Achievement of Specific Weight Loss, 2 yr(Post-hoc Analysis)
• Number 204 202 204 201
• >5% initial 30% 39% 31% 36%
• >10% initial 14% 15% 16% 14%
• >20 kg 4% 4% 2.5% 2%
• 90th p’tile 11.3 kg 12.3 kg 12.9 kg 10.9 kg
Carbohydrate/Protein/Fat, Target Intake, % Kcal 65/15/20 55/25/20 45/15/40 35/25/40
No significant differences by diet

Continued Weight Loss: from 6months to 2 years
• 23% lost weight after 6 months
• Mean additional weight loss = 3.6 kg
• Total weight loss = 9.3 kg
No significant differences by diet group

Satiety, Diet Satisfaction:Participants’ reports at 6 months and
2 years
• Satiety by visual analogue scales
• Diet Satisfaction (Urban 1992)
• Food Craving: fats, sweets, carbohydrates,fast food fats, fruits & vegetables (FCI-II)
• Dietary restraint, dis-inhibition, hunger (ThreeFactor Eating Questionnaire, White M 2002)
• Quality of Life (SF-36)
No significant differences by diet group
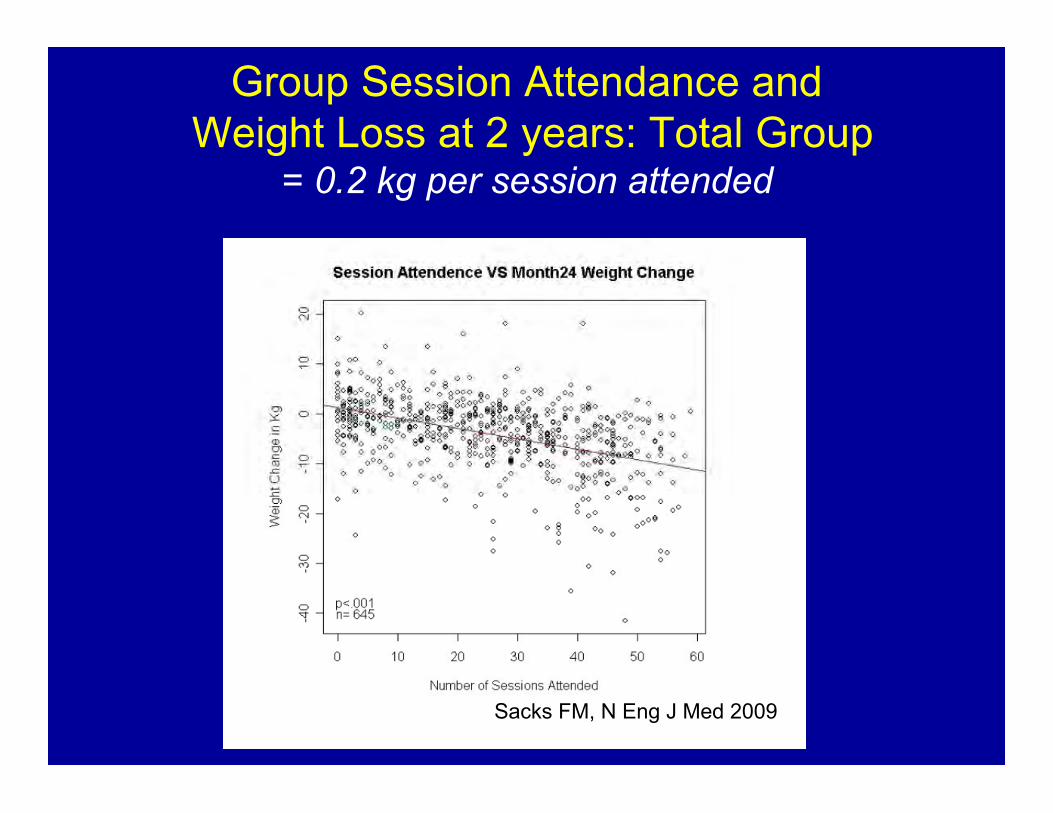
Group Session Attendance and Weight Loss at 2 years: Total Group
= 0.2 kg per session attended
Sacks FM, N Eng J Med 2009
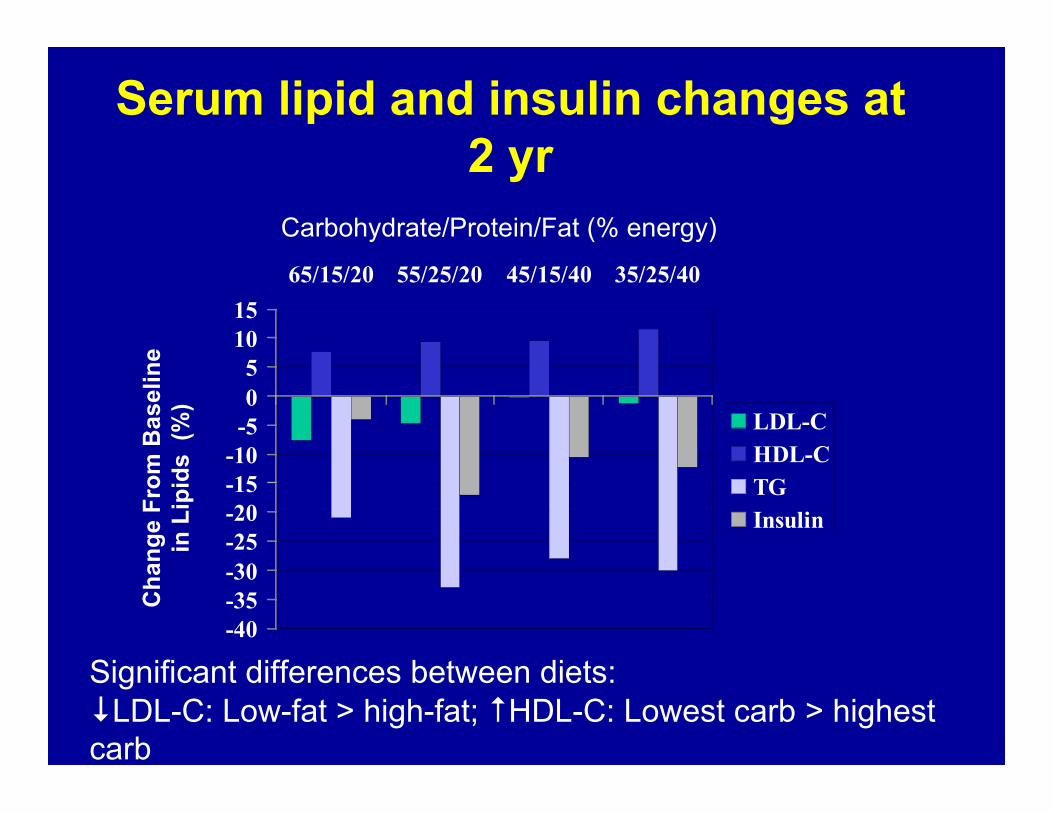
Serum lipid and insulin changes at2 yr
-40
-35
-30
-25
-20
-15
-10
-5
0
5
10
15
65/15/20 55/25/20 45/15/40 35/25/40
LDL-C
HDL-C
TG
Insulin
Ch
ang
e F
rom
Bas
elin
ein
Lip
ids
(%
)
Carbohydrate/Protein/Fat (% energy)
Significant differences between diets:↓LDL-C: Low-fat > high-fat; ↑HDL-C: Lowest carb > highestcarb
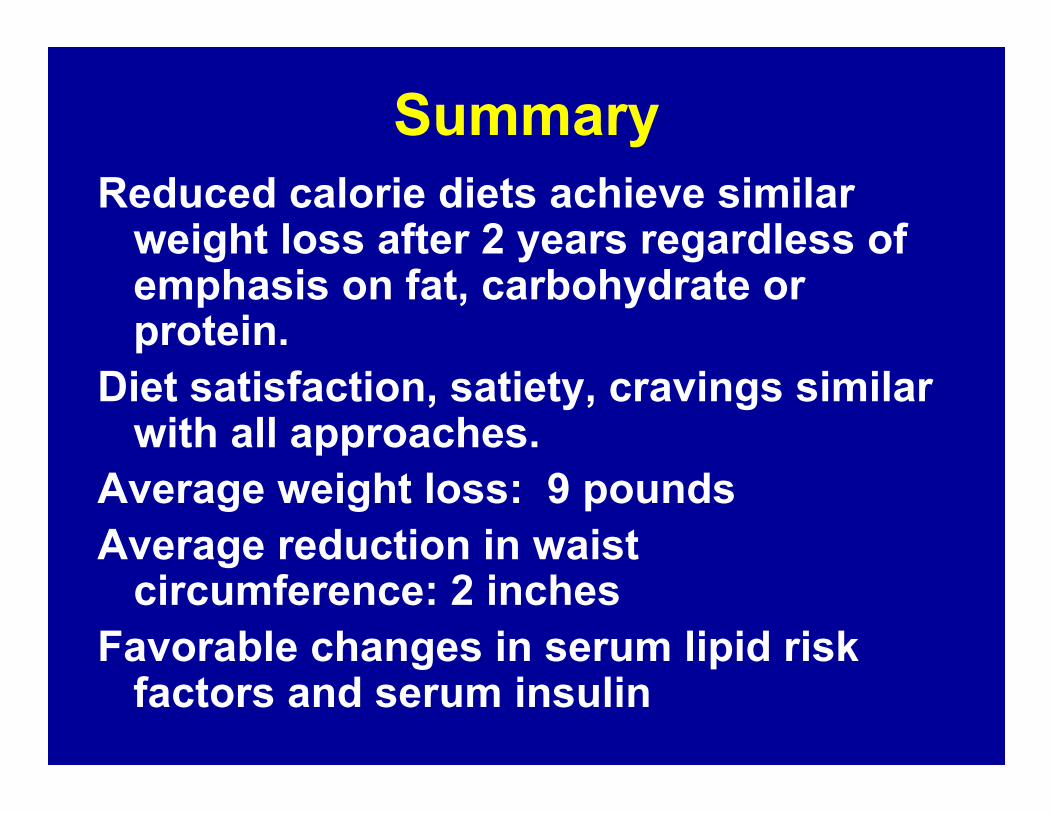
SummaryReduced calorie diets achieve similar
weight loss after 2 years regardless ofemphasis on fat, carbohydrate orprotein.
Diet satisfaction, satiety, cravings similarwith all approaches.
Average weight loss: 9 poundsAverage reduction in waist
circumference: 2 inchesFavorable changes in serum lipid risk
factors and serum insulin
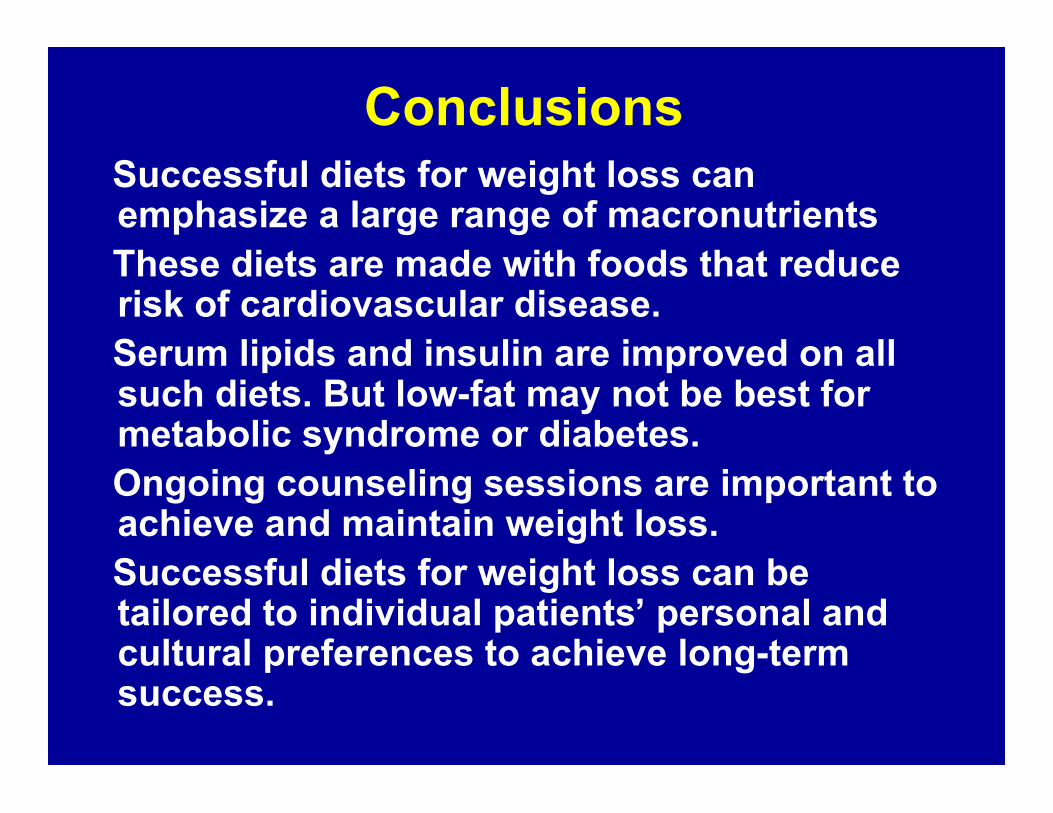
Conclusions Successful diets for weight loss can
emphasize a large range of macronutrients These diets are made with foods that reduce
risk of cardiovascular disease. Serum lipids and insulin are improved on all
such diets. But low-fat may not be best formetabolic syndrome or diabetes.
Ongoing counseling sessions are important toachieve and maintain weight loss.
Successful diets for weight loss can betailored to individual patients’ personal andcultural preferences to achieve long-termsuccess.
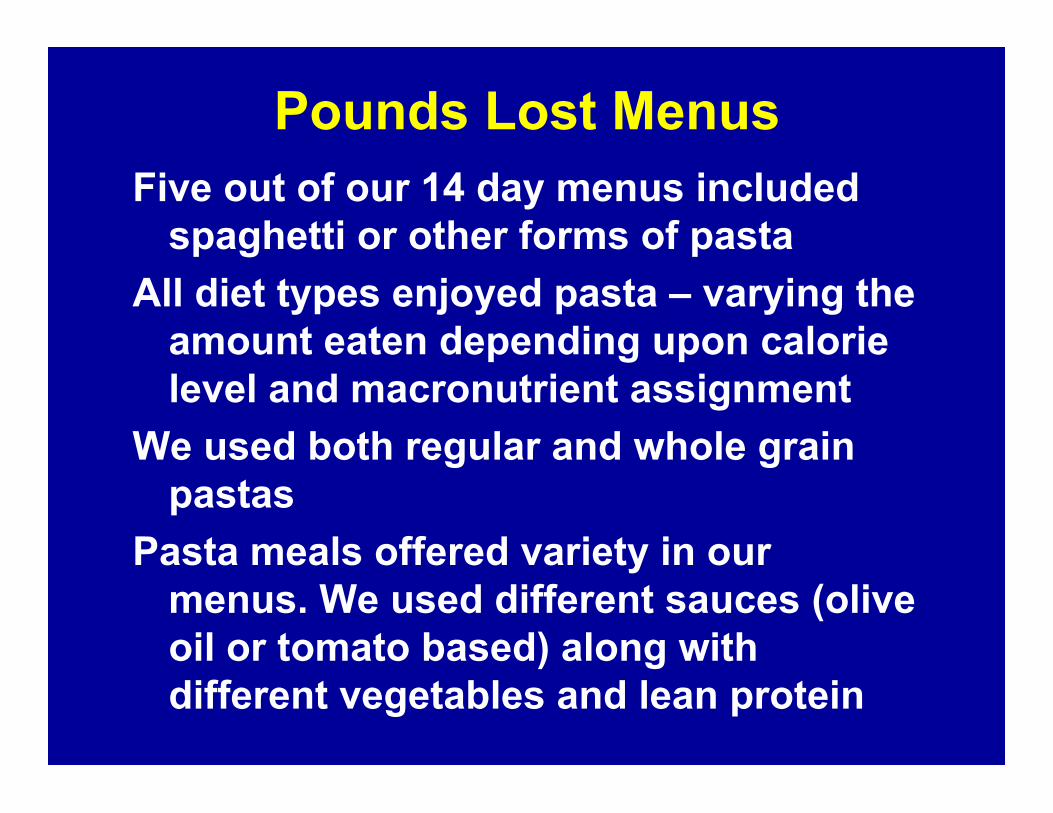
Pounds Lost MenusFive out of our 14 day menus included
spaghetti or other forms of pasta
All diet types enjoyed pasta – varying theamount eaten depending upon calorielevel and macronutrient assignment
We used both regular and whole grainpastas
Pasta meals offered variety in ourmenus. We used different sauces (oliveoil or tomato based) along withdifferent vegetables and lean protein

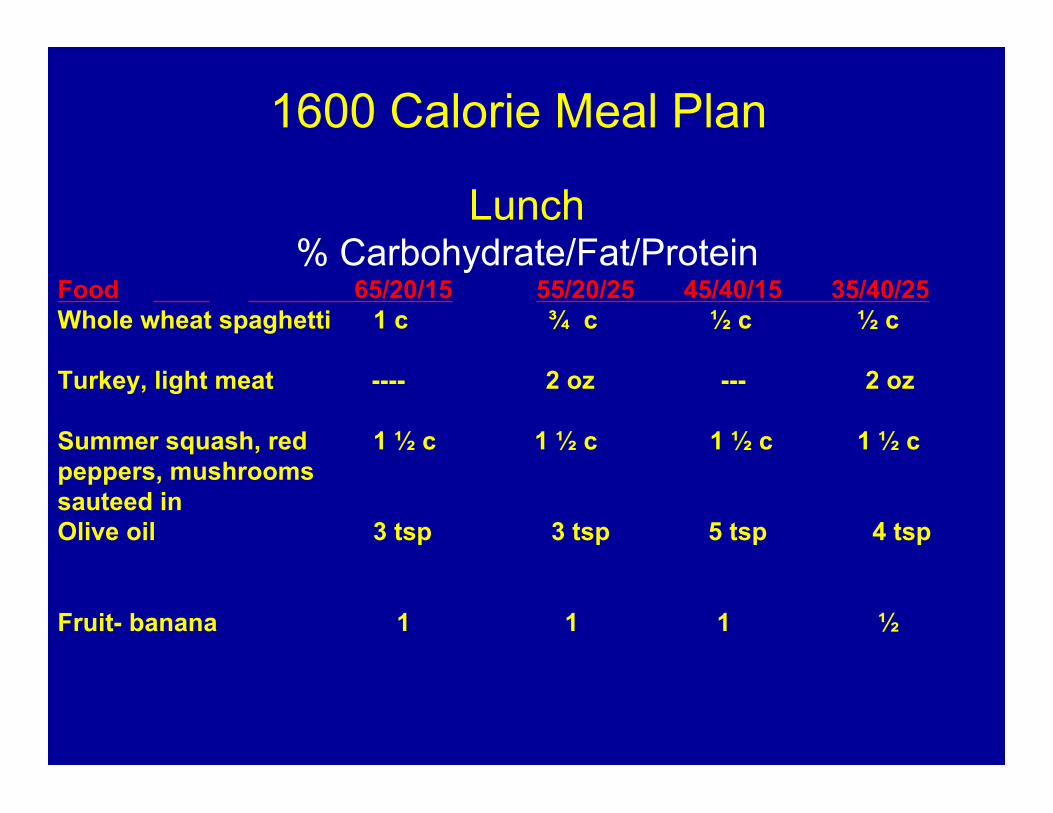
1600 Calorie Meal Plan
Lunch% Carbohydrate/Fat/Protein
Food 65/20/15 55/20/25 45/40/15 35/40/25Whole wheat spaghetti 1 c ¾ c ½ c ½ c
Turkey, light meat ---- 2 oz --- 2 oz
Summer squash, red 1 ½ c 1 ½ c 1 ½ c 1 ½ cpeppers, mushroomssauteed inOlive oil 3 tsp 3 tsp 5 tsp 4 tsp
Fruit- banana 1 1 1 ½


1600 Calorie Meal Plan
Dinner% Carbohydrate/Fat/Protein
Food 65/20/15 55/20/25 45/40/15 35/40/25
Salad Greens 2 c 2 c 2 c 1 c
Olive oil 1 Tbsp 1 Tbsp 5 tsp 2 Tbsp
Chicken breast- ---- 4 ½ oz ---- 6 oz
Pasta 1 c ¾ c ½ c ½ c
Spaghetti sauce w/ 1 c 1 c ½ c ¼ c
Mushroom & garlic ½ c ½ c ¼ c ¼ c
Spinach 1 ½ c 1 c ½ c ½ c
Milk, skim 1 c ¾ c ¾ c ½ c


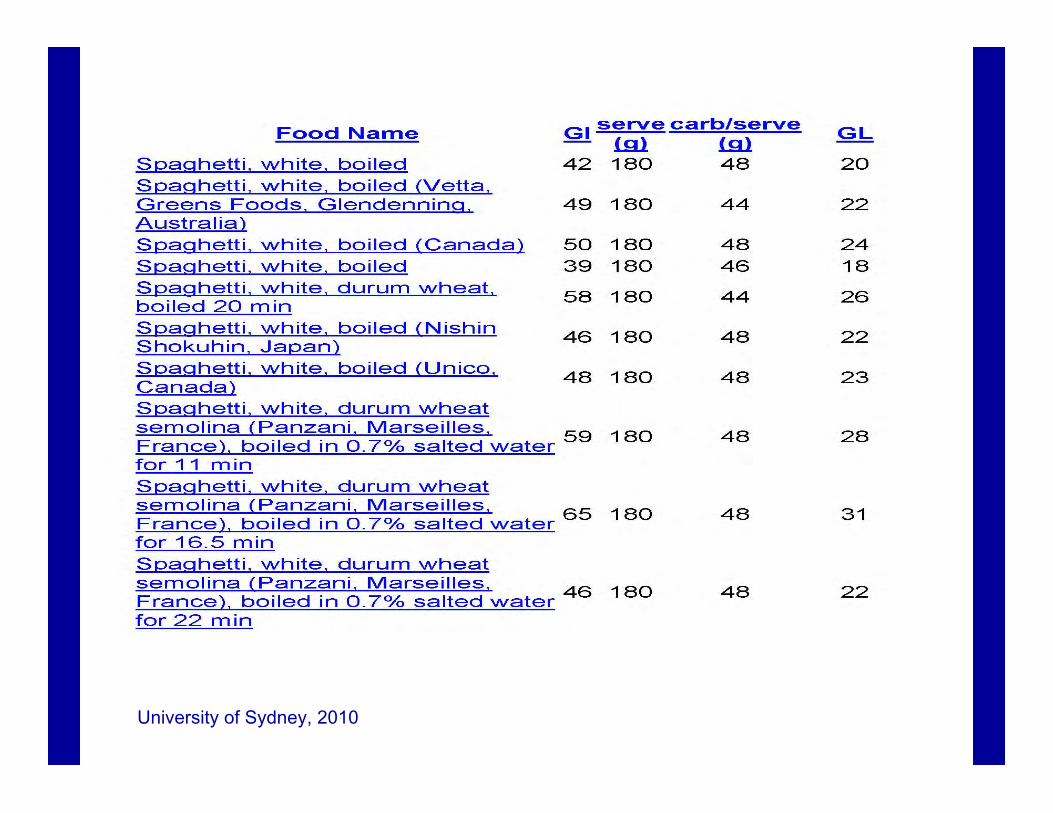
University of Sydney, 2010

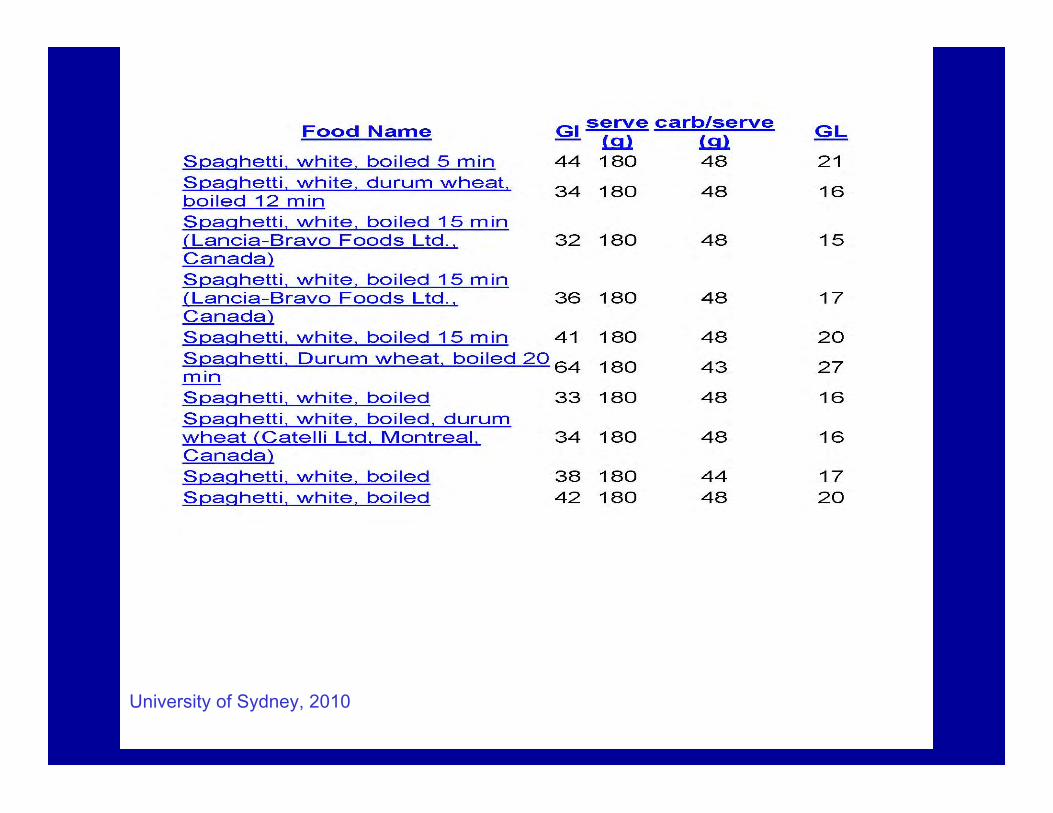
University of Sydney, 2010
University of Sydney, 2010
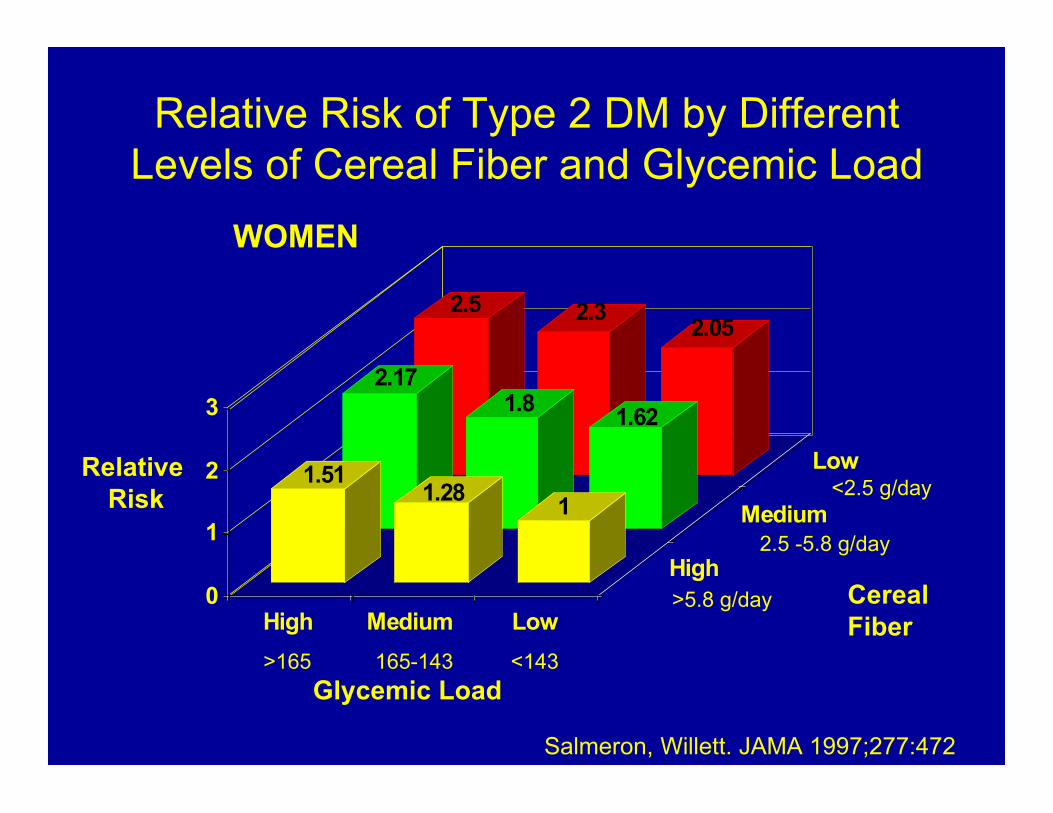
Relative Risk of Type 2 DM by DifferentLevels of Cereal Fiber and Glycemic Load
2.5 2.32.05
2.171.8
1.62
1.511.28
1
0
1
2
3
High Medium Low
High
Medium
LowRelative Risk
>165 165-143 <143
Glycemic Load
>5.8 g/day
2.5 -5.8 g/day
<2.5 g/day
Salmeron, Willett. JAMA 1997;277:472
(ref)
WOMEN
CerealFiber