Embed Size (px)
Citation preview

Observations of gas flows inside a protoplanetarygapSimon Casassus1, Gerrit van der Plas1, Sebastian Perez M.1, William R.F.Dent2,3, EdFomalont4, Janis Hagelberg5, Antonio Hales2,4, Andres Jordan6, Dimitri Mawet3, FrancoisMenard7,8, Al Wootten4, David Wilner9, A. Meredith Hughes 10, Matthias R. Schreiber11,Julien H. Girard3, Barbara Ercolano12 Hector Canovas11, Pablo E. Roman13, Vachail Salinas1
1. Departamento de Astronomıa, Universidad de Chile, Casilla 36-D, Santiago, Chile
2. Joint ALMA Observatory, Alonso de Cordova 3107, Vitacura 763-0355, Santiago -Chile
3. European Southern Observatory (ESO), Casilla 19001, Vitacura, Santiago, Chile
4. National Radio Astronomy Observatory, 520 Edgemont Road, Charlottesville, VA22903-2475, USA
5. Observatoire de Geneve, Universite de Geneve, 51 ch. des Maillettes, 1290, Versoix,Switzerland
6. Departamento de Astronomıa y Astrofısica, Pontificia Universidad Catolica de Chile,Santiago, Chile
7. UMI-FCA, CNRS / INSU France (UMI 3386) , and Departamento de Astronomıa,Universidad de Chile, Santiago, Chile.
8. CNRS / UJF Grenoble 1, UMR 5274, Institut de Planetologie et dAstrophysique deGrenoble (IPAG), France
9. Harvard-Smithsonian Center for Astrophysics, 60 Garden Street, Cambridge, MA02138 USA
10. Department of Astronomy, U. C. Berkeley, 601 Campbell Hall, Berkeley, CA 94720
11. Departamento de Fısica y Astronomıa, Universidad Valparaiso, Av. Gran Bretana111, Valparaiso, Chile.
12. University Observatory, Ludwig-Maximillians University, Munich.
1
arX
iv:1
305.
6062
v1 [
astr
o-ph
.GA
] 2
6 M
ay 2
013

13. Center of Mathematical Modeling, University of Chile, Av. Blanco Encalada 2120Piso 7, Santiago, Chile.
Gaseous giant planet formation is thought to occur in the first few million years fol-lowing stellar birth. Models? predict that the process carves a deep gap in the dustcomponent (shallower in the gas?, ?, ?). Infrared observations of the disk around theyoung star HD 142527, at ∼140 pc, found an inner disk ∼10 AU in radius?, sur-rounded by a particularly large gap?, with a disrupted? outer disk beyond 140 AU, in-dicative of a perturbing planetary-mass body at ∼90 AU. From radio observations?, ?
the bulk mass is molecular and lies in the outer disk, whose continuum emission hasa horseshoe morphology?. The vigorous stellar accretion rate? would deplete the in-ner disk? in less than a year, so in order to sustain the observed accretion, mattermust flow from the outer-disk into the cavity and cross the gap. In dynamical mod-els, the putative protoplanets channel outer-disk material into gap-crossing bridgesthat feed stellar accretion through the inner disk?. Here we report observations withthe Atacama Large Millimetre Array (ALMA) that reveal diffuse CO gas inside thegap, with denser HCO+ gas along gap-crossing filaments, and that confirm the horse-shoe morphology of the outer disk. The estimated flow rate of the gas is in the range7 10−9 to 2 10−7 M� yr−1, which is sufficient to maintain accretion onto the star atthe present rate.
The HD 142527 system offers an unhindered view of its large central cavity, andis a promising laboratory to observe on-going gaseous giant planet formation. There isgood understanding of the orientation of the disk. Multi-wavelength data are consistentwith an inclination of ∼20◦, so almost face-on?. The disk position angle is ∼ −20 degeast of north and the eastern side is the far side of the disk, as suggested by a clear viewof the outer disk’s inner rim in the mid-IR?, ? and by a clock-wise rotation suggested by aprobably trailing spiral arm to the west?.
We find that the CO(3-2)-emitting gas peaks inside the cavity. Other disks havebeen observed to exhibit a CO decrement within dust cavities?, ?, and may represent laterevolutionary stages or different gap clearing mechanisms. Gas inside dust cavities has pre-viously been directly observed very close to the central star (inside the dust evaporationradius) using near-IR interferometry?, ?, ?. Other indirect observations of gas inside?, ?, ?, ?, ?
dust gaps at larger distances from the central star have interpreted spectroscopically re-solved gas tracers, such as ro-vibrational CO 4.67µm and [O I] 6300A, under the assump-tion of azimuthal symmetry and Keplerian rotation. Spectro-astrometry in combinationwith Keplerian disk models and azimuthal symmetry has also been used to infer the pres-ence of CO gas inside disk gaps?, ?, ?. Our new data provide a well-resolved observation of
2
gas at sub-mm wavelengths inside a dust cavity.
The dust gap that we see in radio continuum (Fig. 1 a) indicates a drop by a factorof at least 300 in surface density of mm-sized grains, from the contrast ratio between thepeak on the horseshoe-shaped outer disk (the northern peak at 360 mJy beam−1), and thefaintest detected signal inside the gap (namely the western filament at 1 mJy beam−1, seebelow). Yet there is no counterpart in the CO(3-2) map (Fig. 1 b) of the arc that we seein continuum. CO(3-2) is likely optically thick, as reflected by its diffuse morphology,so it traces the temperature profile rather than the underlying density field. Exhaustivemodelling of optically thin isotopologue data is required to accurately constraint the depthof the gaseous gap. To study the distribution of dense gas inside the cavity we use the highdensity gas tracer HCO+.
The second result from our observations is that the HCO+(4-3)-emitting gas, ex-pected in the denser regions (nH2 ∼ 106 cm−3) exposed to UV radiation, is indeed foundin the exposed rim of the dense outer disk, but also along gap-crossing filaments. Themost conspicuous filament extends eastwards from the star, while a fainter filament ex-tends westwards. Both filaments subtend an angle of ∼ 140 ± 10 deg with the star at itsvertex. The central regions of these filaments correspond to the brightest features in theHCO+ line intensity maps (Fig 1 c), although the outer disk is brighter in peak specificintensity (SI, Fig S7). Thus line velocity profiles are broader in the stellar side of thefilaments than in the outer disk, where they merge with the outer disk Keplerian rotationpattern. These narrow and systemic velocity HCO+ filaments are best seen in intensitymaps integrated over the filament velocities (inset to Fig. 1 d). No central peak is seen inthe channel maps (SI, Fig. S2), so that a beam-elongation effect can be ruled out. Theeastern filament also stands out in peak HCO+ specific intensity (SI, Fig. S7 e). For easeof visualization we show deconvolved models of the HCO+ intensity images in the insetto Fig. 1 d. A related feature is seen in CO(3-2), whose intensity peaks in the more dif-fuse regions surrounding the eastern HCO+ filament. Interestingly we note from the insetto Fig. 1 a that the continuum also shows features under the HCO+ filament, faint andgrowing away from the walls of the horseshoe-shaped outer-disk. Estimates of physicalconditions are given in SI.
The molecular and filamentary flows near the star are non-Keplerian. Blue-shiftedemission extends to the east from the central intensity peak (Fig. 1 c). This velocity com-ponent is broad near the star, with emission ranging from -3.4 to +11 km s−1 (SI, Fig. S2),and is marginally resolved (the central HCO+ peak extends over ∼ 0.65 × 0.38 arcsec).
3

In the deconvolved images of the inset to Fig. 1 d the peak intensity in the blue and redare separated by ∼0.2 arcsec, i.e. by a diameter of the inner disk, and at a position an-gle (PA) orthogonal to that expected from close-in high-velocity material in Keplerianrotation. Very blue-shifted emission could reach out to 0.2 arcsec from the star (SI, chan-nel at –2.4 km s−1 in Fig. S2, taking into account the beam). A blue-shifted CO(3-2)high-velocity component can also be seen at the root of this feature, near the star (SI, at–2.1 km s−1 in Fig. S5).
The non-Keplerian HCO+ is probably not consistent with a central outflow. Stellaroutflows are not observed? in disks with inner cavities and no molecular envelopes (i.e.transition disks). For an outflow orientation, the low velocities measured by the linesimply that the filaments in HD 142527 would stand still and hover above the star (SI,Sec. 3). Even the blue-shifted emission is slow by comparison to escape velocity. A slowdisk wind (e.g. photoevaporative or magnetic driven) can also be excluded on the basisof the high collimation shown by the HCO+ emission. Indeed the CO 4.67 µm seen inthe inner disk? is purely Keplerian, it does not bear the signature of the disk winds seen inother systems, and its orientation is common to the outer disk. An orthogonal inner diskcan be also be discarded on dynamical grounds (SI, Sec. 3).
It is natural to interpret the filaments as planet-induced gap-crossing accretion flows,or ‘bridges’. Since the eastern side is the far side, the blue-shifted part of the eastern bridgeis directed towards the star, and is a high-velocity termination of the accretion flow ontothe inner-disk. These bridges are predicted by hydrodynamical simulations when appliedto planet-formation feedback in HD 142527?. In these simulations the bridges straddlethe protoplanets responsible for the dynamical clearing of the large gap in HD 142527.They are close to Keplerian rotation in azimuth, but do have radial velocity componentsat & 1/10 of the azimuthal components. In our data we see that as the bridges land ontothe inner disk they also coincide with higher velocity material, at (2-D) radial velocitiesinferior to their azimuthal velocities in the plane of the sky.
An interesting comparison object is GG Tau. A sub-mm continuum accretion stream?
is seen to cross the gap in this circum-binary disk, with indications of shocked IR molecu-lar gas in the inner disk?. The angular radii of the rings in GG Tau and in HD 142527 arevery similar, as are the morphologies of the GG Tau streamer and the eastern filament (al-though it is fainter relative to the outer disk in HD 142527). However, the GG Tau binaryhas a mass ratio ∼1 with a separation of 0.25 arcsec, and is aligned along the streamer,while in HD 142527 no stellar companion has been detected (see SI for limits, mass ra-
4

tios are > 10 at 0.088 arcsec). The putative companions responsible for the streams inHD 142527 are much lower mass than in GG Tau.
We performed high-contrast IR imaging to attempt the detection of the possible ac-creting protoplanets that would be expected if the gap crossing bridges observed in HCO+
are indeed planet-induced gap-crossing accretion flows. Neglecting extinction, we couldvirtually rule out any companion more massive than ∼ 4 Mjup at separations from 0.3 to2.5 arcsec (SI, Sec. 4 and Fig. S13, also on the lack of close stellar companions). How-ever, according to the hydrodynamical simulations the channeling protoplanets should belocated inside the gap-crossing bridges. Our estimates for NH along the bridges corre-spond to a broad range of high extinction values 5 . AV . 50, for standard dust abun-dances. Any protoplanets embedded inside the bridges, and certainly those embedded inthe dense horseshoe structure, will be obscured, and our mass limits will be correspond-ingly increased.
A third feature of our observations is the horseshoe shape of the continuum, seenpreviously by the Sub-Millimetre Array? at coarser resolutions, but whose origin is stillunclear. The mm continuum traces the total dust mass, so the north-south specific intensityratio of 28 ± 0.5 reflects the underlying dust mass asymmetry. At its peak the continuummay even be optically thick, as it coincides with a decrease in the HCO+ emission. For aconstant gas-to-dust mass ratio, such horseshoe-shaped mass asymmetries arise in modelsof planet-induced dynamical clearing. In general these horseshoes can be produced byRossby wave instabilities, which are seen in high-resolution 3D simulations at the edge ofsharp density gradients (Varniere private communication). However, horseshoes have alsobeen modelled in the context of large-scale vortices induced by sharp viscosity gradients?.
Another interpretation for the horseshoe continuum is varying dust-to-gas ratio andazimuthal grain-size segregation. By contrast to the continuum, the outer disk is seenas a whole ring in HCO+ (Fig. S7), which is a tracer of dense gas, and is probably op-tically thick along the ring. A rarefaction of mm-sized dust grains to the south couldperhaps explain the lack of 345 GHz signal. Only small dust grains would be found inthe south. These small grains efficiently scatter the near-IR light seen in Fig. 1 c, fillingthe opening of the horseshoe. However, azimuthal dust segregation has been predicted forcentimetre-sized grains at co-rotation in two-fluid simulations of cavity clearing by giantplanet formation?, while mm-sized grains remain relatively unaffected. We explain in SIwhy differential stellar heating cannot account for the observed north-south contrast.
5

The filamentary flows and the residual gas inside the cavity are in qualitative agree-ment with planet formation feedback on the parent disk, that carves a gap in the dustdistribution while still feeding stellar accretion through gap-crossing accretion streams.As detailed in SI, the observed inflow velocity, together with the critical density of themolecular tracer and the section of the filaments, provide a lower bound to the mass inflowrate of 7 10−9 M� yr−1. An upper bound of 2 10−7 M� yr−1 can be estimated from thecontinuum mass in the filaments and their kinematic timescale. These estimates for themass inflow rate are close to the observed stellar accretion rate? of 7 × 10⁻⁸ M� yr −1,bringing quantitative support to our suggestion that the HCO+ filaments are inflows.
6

Figure 1 ALMA observations of HD 142527, with a horseshoe dust continuum sur-rounding a cavity that still contains gas. We see diffuse CO gas in Keplerian rotation(coded in doppler-shifted colours), and filamentary emission in HCO+, with non-Keplerian flows near the star (comparison models illustrative of Keplerian rotationare shown in SI). The near-IR emission abuts onto the inner rim of the horseshoe-
7

shaped outer disk. The star is at the origin of coordinates and axis labels arein arcsec; North is up, East is to the left. a: The image labelled ‘continuum’ isa CLEANed image of the continuum at 345 GHz, with specific intensity units inJy beam−1. It is shown in exponential scale. A beam ellipse is shown in the bot-tom right, and contour levels are taken at 0.01, 0.1, 0.3, 0.5, 3/4, 0.9 times thepeak value. The noise level is 1 σ =0.5 mJy beam−1. b: The image labelled ’CO’is CO(3-2) line intensity in white contours at fractions of 0.3, 0.5, 0.75 and 0.95 ofthe peak intensity value 2.325 10−20 W beam−1. The underlying RGB image alsoshows CO(3-2) line intensity but integrated in three different velocity bands, whosevelocity limits are indicated in the spectra of Fig. S8. c: The image labelled ’2 µm’is a near-IR image from Gemini that traces reflected stellar light, shown in linearscale. We applied an circular intensity mask to the stellar glare, some of whichimmediatelly surrounds the mask. See Fig. S1 in SI for an overlay with the con-tinuum. d: The image labelled ’HCO+’ shows HCO+(4-3) line intensity in whitecontours at fractions of 0.1, 0.3, 0.5, 0.75 and 0.95 of the peak intensity value0.40 10−20 W beam−1, overlaid on an RGB image of HCO+ intensity summed inthree different colour bands, with definitions in Fig. S8. Insets: Zoom on the cen-tral features that cross the dust gap. The cross indicates the star at the origin,with a 0.05 arcsec accuracy, and the arrows point at the filaments. Fig. 1 a inset:same as Fig. 1 a, with a narrow exponential scale highlighting the gap-crossingfilaments. Note how these features appear to grow from the eastern and westernsides of the horseshoe. Contours are at at 0.0015 and 0.005 Jy beam−1. Fig. 1 dinset: deconvolved models (see SI) of the HCO+ emission at velocities where thegap-crossing filaments are seen, i.e. from 3.2 to 4.3 km s−1, in green. Intensitymaps for the blue and red velocity ranges (see Fig. S8 for definitions) are shownin contours, with levels at 0.5 and 0.95 of the peak values. These red and bluecontours are an alternative way to present the intensity field shown in Fig. 1 d, butdeconvolved for ease of visualization.
Supplementary Information additional figures, information on instrumental setups and physi-cal condition estimates.
Acknowledgements This paper makes use of the following ALMA data:ADS/JAO.ALMA#2011.0.00465.S. ALMA is a partnership of ESO, NSF, NINS, NRC, NSC,ASIAA. The Joint ALMA Observatory is operated by ESO, AUI/NRAO and NAOJ. Also basedon observations obtained at the Gemini Observatory. Financial support was provided by Mile-nium Nucleus P10-022-F (Chilean Ministry of Economy), and additionally by grants FONDECYT1100221 and Grant 284405 from the European Union FP7 Programme.
8

Contributions General design of ALMA project, data analysis and write-up: SC. Discussion ofIR observations of gas in cavities: GvdP. Hydrodynamical modeling: SP. ALMA data reduction:AH, EF. ADI processing: DM, JH, JG. Contributions to ALMA Cycle 0 proposal: AJ, FM, DW,MH. Design of ALMA observations: AW, AH, SC. Authors WD to AW contributed equally. Allauthors discussed the results and commented on the manuscript.
Competing Interests The authors declare that they have no competing financial interests.
Correspondence Correspondence and requests for materials should be addressed to S.C. (email:[email protected]).
9

Supplementary Information
1 ALMA Observations
Instrumental setup and data reduction
ALMA setup. ALMA Band 7 observations of HD142527 were carried out in the nightof June 2 2012. The precipitable water vapor in the atmosphere was stable between 1.4and 1.8 mm, with clear sky conditions. The ALMA correlator was configured in the Fre-quency Division Mode (FDM) to provide 468.750 MHz bandwidth in four different spec-tral windows at 122.07 kHz resolution ( 0.1 km/s) per channel. Each spectral windowwas positioned in order to target the CO(3-2) transition at 345.7959 GHz, HCO+ as wellas CS(7-6) and HCN(4-3). The measured system temperatures ranged from 207 to 285K in the different spectral windows. The number of 12 m antennas available at the timeof the observation was 19, although two antennas reported very large system tempera-tures (DA41 and DV12) and were flagged during data reduction. Excluding calibrationoverheads, a total time on source of 52 minutes was spent yielding an RMS of 15 mJy in0.1 km s−1 channels. The primary flux calibrator was Titan, which provided a mean trans-ferred flux of 14.2 Jy for 3c279, the bandpass calibrator, and 0.55 Jy for J1604-446, thephase calibrator. Amplitude calibration used the CASA Butler-JPL-Horizons 2010 modelfor Titan, which gives an estimated systematic flux uncertainty of ∼10%. All the line datawere processed with continuum subtraction in the visibility domain.
Image synthesis. Image synthesis was performed using two different techniques, de-pending on the application. For a traditional way to present the visibility dataset we useCotton-Schwab CLEAN in the CASA package. This technique represents the consensusin image synthesis. We use Briggs weighting with robustness parameter of zero. Fordeconvolved models we use a non-parametric least-squares modeling technique? with aregularizing entropy term (i.e. as in the family of maximum entropy methods, MEM hereand elsewhere). MEM model images are restored by convolving with the clean beam andby adding the residuals calculated using the difmap package?. For the residuals we useweights comparable to our choice in CASA, a mixture of natural and uniform weights. Adetailed example of this MEM algorithm is shown in the HCO+ channel maps, Fig. S4.
1

Registration of ALMA images. A ∼0.1 arcsec astrometric uncertainty could affect theALMA data. However, we checked the astrometry by confirming that the centroid of theKeplerian velocity field (seen in the RGB image for CO(3-2) in Fig. 1) lies indeed at the po-sition of HD 142527 in J2000 at the June 2012 epoch (J2000 15:56:41.878 -42:19:23.568).The near-IR scattered light images?, which are centred on the stellar position, are matchedby the inner boundary of the sub-mm thermal continuum, as expected. This match is illus-trated in Fig. S1. Overall, we estimate that any astrometric error is less than ∼0.05 arcsec.
Self-calibration of continuum maps. A continuum image visibility dataset was con-structed from the nominal calibration of the source data, covering all ALMA spectral win-dows but excluding line channels. The restored continuum image peaked at 0.38 Jy beam−1,with a noise level (including artifacts from negative sidelobes) of 6 10−3 Jy beam−1, giv-ing a dynamic range of 63. The image was clearly limited by phase errors. We thereforeapplied self-calibration. Using the nominal calibration image as a model of the source,we used the self-calibration algorithm to determine improved antenna-based phases thatwere consistent with the image. The solution interval chosen was 5 min, long enoughto give over 30:1 signal to noise (2 deg accuracy) per antenna solution. The measuredresidual phases varied smoothly over the experiment, with a typical value of 5 to 10 deg.After applying these small phase corrections, the rms noise on the new image was 20%of the original rms, and the weak southern part of the outer disk became clearly visible.With this improved model, the next self-calibration iteration also included the antenna gainvariations which were typically five percent or less. This second round of self-calibrationdecreased the rms a further 50%. The final image has a peak of 0.38 Jy beam−1 and an rmsof 5.2 10−4 Jy beam−1, so of the order of the theoretical noise level, which is 10% of theoriginal rms. Since the dynamic range of the nominal calibration was 63, even the stongestline emission in 1 km s−1 channels, after subtraction of the continuum emission, was re-ceiver noise limited rather than dynamic range limited. Hence, self-calibration correctionto the line channels were not needed.
Presentation of the ALMA data
Channel maps. The HCO+ channel maps in Fig. S2 illustrate the off-center high-velocityflows, and the gap-crossing filaments at a velocity close to that of the star (the systemicvelocity). These filaments are seen more clearly in the deconvolved channel maps shownin Fig. S4. The CO(3-2) channel maps shown in Fig. S5 also highlight the blue-shiftedpart of the high-velocity flows seen in HCO+.
2

HCO+ peak and intensity maps. We use the same set of CLEANed HCO+ imagesfrom 5-channel averages as in the channel maps to summarize the basic features of theHCO+ emission through moment maps. Fig. S7a exposes in more detail the total intensitymap shown in Fig. 1. The peak intensity map in Fig S7c illustrates that the outer disk is awhole ring in HCO+.
Line spectra. The first column in Fig. S8 shows spectra extracted from CLEAN recon-structions, using the same aperture as show on Fig. 1. The right column shows the corre-sponding MEM spectra. The spectrum labelled ‘streamer’, in bottom right, corresponds tothe inset of Fig. 1 d.
2 Comparison disk models
To illustrate the expected kinematics in Keplerian rotation we have calculated a disk modelusing the LIME? package. This model is inclined at 20 deg, with a PA of −20 deg eastof north, and is placed at a distance of 140 pc with a 2.7 M� central star. The distance of140 pc is supported by a probable association to Sco OB2.
For CO we assumed an abundance of 10−4 relative to H2 and the following numberdensity distribution of H2 molecules:
nH2(r, z) = 1.5 1014( r
100 AU
)−1.5
exp
[−1
2
( z
0.1 r
)2]m−3,
from 140 to 300 AU, and
nH2(r, z) = ζ 1.5 1014 exp
[−1
2
( z
0.1 r
)2]m−3,
from 10 to 140 AU, and zero elsewhere. ζ = 1/10 is a fiducial well-depth. The total massin this disk model is 0.1 M�. The temperature profile is T (r) = 50 [r/(50 AU]−1/2 K, asinspired from the observed CO(3-2) peak with a radiation temperature of 50 K.
For HCO+ we assumed a relative abundance of 10−7, a mass distribution as for CObut without material inside the gap, and the same temperature profile.
We filtered the LIME predictions to match the uv-coverage of the data, and we
3

reconstructed the resulting visibility in the same way as the observations. Resuts for CO(3-2) are shown in Fig. S10 and Fig. S5. In the case of HCO+ the line is weaker so wesubtracted the continuum. We also added a central elongated source to assess the effectsof beam elongation, see Fig. S2. We conclude that beam elongation effects cannot mimickthe HCO+ filaments.
3 Physical conditions
Conditions along the filaments An estimate of physical conditions in the filaments canbe obtained by assuming that the CO(3-2) emission is optically thick. If so the peakCO(3-2) specific intensity of 0.9 Jy beam−1 in a 0.55 × 0.33 arcsec2 beam correspondsto a kinetic temperature of 50 K. The peak HCO+ specific intensity is 0.1 Jy beam−1 or∼5.7 K in radiation temperature. This implies HCO+ columns of NHCO+ ∼ 5 1014 cm−2.Densities in excess of nH2 ∼ 105 cm−3 are required to excite HCO+(4-3) and if the stream-ers are as deep as they are wide (∼ 5 1014 cm corresponding to 0.25 arcsec), we expectH-nucleus columns NH > 1020cm−2. We thus have an upper bound on the HCO+ abun-dance of NHCO+/NH < 5 10−6. A lower bound is placed by the observed (cosmic-rayinduced) ionization fraction in cold cores? of ∼ 10−8. In summary, from HCO+ we have5 1022 & NH/cm−2 & 1020. The observed continuum under the filaments ranges from0.4 mJy beam−1 to 5.6 mJy beam−1 before beeing confused with the wall, and the cor-responding columns are 1.3 1023 & NH/cm−2 & 8.5 1021. Extinction values can beestimated using a standard formula?, NH/cm−2 = 1.87 1021AV .
Physicality of central outflows On first impression, star formation experts would inter-pret the non-Keplerian HCO+ as a stellar outflow. The orientation of the eastern filamentis indeed roughly orthogonal to the disk PA, and outflows are expected in the context ofstellar accretion. However, planet-induced accretion may not require outflows to dissipateangular momentum (whose bulk has been dissipated earlier by powerful stellar outflowsduring the general protostellar accretion). Outflows have optical/IR counterparts, but noextended emission is seen in our Brγ imaging from Gemini (SI). In general outflows arenot seen in transition disks? (class II young stars with disks and an inner cavity). Here weconsider the plausibility of a ballistic outflow interpretation for the filaments. Given aninclination of 20 deg, the most conspicuous part of the filaments, i.e. the central HCO+
unresolved intensity peak, would lie < 80 AU above the star (from the maximum possibleangular distance to the star of the blue-shifted and off-center component), at velocities< 7.2 km s−1 relative to the star. The bulk of the material flows at lower velocities, in fact
4

the peak is at systemic velocities (Fig. S9). Yet the line-of-sight velocity spread of HCO+
emission from the outer disk, of 4 km s−1 at 1.0 arcsec, corresponds to rotation velocitiesof 5.9 km s−1 at 140 AU in the plane of the disk. The corresponding escape velocity at80 AU is 8.6 km s−1. So the bulk of this outflow cannot be ballistic (in particular thesystemic-velocity filament, which extend from the star and into the outer disk). There-fore an ambient medium would be required to decelerate this hypothetical outflow. In thisscheme a jet would entrain ambient molecular gas and produce the observe HCO+ flows.However, no optical/IR jet is seen. A Brγ line is conspicuous in the stellar spectrum, butit is unresolved (see Fig. S12), so contained well within the inner 5 AU. Additionally,this molecular medium would need to be pressure-supported, as in a class I envelope, andextend vertically above the disk to ∼100 AU. Yet the observed SED? shows very little ex-tinction (AV . 0.6), consistent with interstellar values rather than intranebular extinction.
Physicality of an orthogonal inner disk The high-velocity central flows could be thoughtto stem from Keplerian rotation orthogonal to the plane of the outer disk, so with an incli-nation of ∼90 deg (high inclinations are required to account for aspect ratio). However,given the outer-disk Keplerian velocities, an inner disk extending out to 0.1 arcsec but or-thogonal to the plane of the outer disk should show a double-peaked spectrum with lineof sight velocities ∼ 26 km s−1, while the observed peak is at 7.2 km s−1. In addition tothese dynamical arguments, an orthogonal inner disk is also inconsistent with the observedCO 4.67 µm emission. This fundamental ro-vibrational transition is seen to originate froman inner disk that is aligned with the outer disk?.
Estimates of mass inflow rates Under the hypothesis that the observed filaments areaccretion streams, we can estimate a mass inflow rate onto the inner disk. A lowerlimit comes from the HCO+(4-3) observation. This line stems from gas close to thecritical density, so close to nH2 ∼ 106 cm−3. The average density along the filamentsis probably higher. With an inflow velocity of 5 km s−1, and a filament section of ∼0.25×0.25 arcsec2, we obtain a mass inflow rate of dMi/dt > 7 10−9 M� yr−1. The massseen in the dust continuum provides another limit. The fraction of flux in the filaments is1/1000, so the filaments carry∼ 10−4M� for a uniform and standard dust to gas ratio. Fora characteristic radial velocity < 1km s−1 (we do not detect the radial velocity of the fila-ments - only their roots are infalling), and for a liner size of 100 AU, the dynamical age ofthe filaments is> 474 yr. The corresponding mass infall rate is dMi/dt < 2 10−7 M� yr−1.We see that the observed stellar accretion rate?, of 7× 10⁻⁸ M� yr −1, is bracketed within
5

one order of magnitude by the above limits on the filament mass inflow rate.
North-south asymmetry in the continuum. The most striking feature of the continuumis its horseshoe shape. Differential stellar heating, on its own, cannot account for theobserved north-south contrast of 28 ± 0.5. The continuous HCO+ ring supports that thering has a clear view of the star, so that there is little UV opacity. In this case radiativethermal equilibrium predicts a T ∝ 1/
√r radius-temperature relationship. The ratio in
radius to the inner edge of the disk, as traced by the near-IR image, is at most 1.4 inthe north-south direction. Since thermal submm specific intensities are in the Rayleigh-Jeans regime and so proportional to the dust temperature, for differential stellar heatingwe would expect a meek modulation in continuum intensities of not more than
√1.4.
4 Near-IR ADI processing and search for protoplanets
HD 142527 was imaged by the Near-Infrared Coronagraphic Imager (NICI) at the GeminiSouth telescope in the two filters, CH4-K5%L G0748 (2.241 µm with 107 nm bandwidth,CH4L hereafter) and CH4-K5%S G0746 (2.080 µm with 105 nm bandwidth, CH4S here-after), using a 0.22 arcsec semi-transparent coronagraphic mask (with 95% Lyot stop) andin pupil tracking mode (the rotator is disabled to let the field rotate and to stabilize thepupil). The total PA rotation was ∼40 deg. We also obtained unsaturated Brγ data, with a∼20 deg rotation. Seeing and transparency conditions were good.
We reduced both CH4 channels using a set of pipelines run independently and inparallel. Each pipeline was sequentially optimized to retrieve either the disk extendedemission and/or point sources.
First of all, it must be noted that face-on disks are particularly difficult to recoverusing ADI techniques?, which is the case of HD 142527. Furthermore the complex diskstructure makes ADI processing even more prone to artifacts. In order to obtain a confidentview of the disk, we decided to perform statistical PSF averaging instead of PSF subtrac-tion (Fig. 1 c), using the Geneva PADIP pipeline. Apart from PSF subtraction we kept allthe other reduction steps, namely flat fielding, bad pixel removal, high-pass filtering, strehlbased frame selection, Fourier based recentring and derotation. This way, by skipping thePSF subtraction step we get rid of most artifacts common to all ADI algorithms due to diskself-subtraction, but at the cost of a lower contrast and an increased inner working angle at
6

0.7 arcsec. The resulting image is a median of the best frames, corrected for field rotation.
In order to extract further details from the disk image with statistical PSF averagingwe subtracted a Moffat profile fit to the stellar PSF over distinct regions in azimuth. Theresult is shown on Fig. S11. The final result of this conservative reduction is the mostdetailed view of the HD 142527 complex disk structure ever obtained (the near-IR imageshave finer resolution than Cycle 0 ALMA data). We caution that the arc-like structuresinside 0.7 arcsec are probably artifacts. As they rotate in parallactic angle, the strongeststatic speckles can bias the median disk image into such arc-like features.
To optimize the search for point sources around the star within the disk gap we thenran pipelines in conventional ADI mode with sophisticated PSF subtraction algorithms.PSF subtraction had to be used in order to have access to the inner region of the disk inside0.7 arcsec. This was achieved by running three different pipelines. The PSF reconstructionwas implemented by a set of methods based respectively on the well-known ADI? PSFsubtraction technique (PADIP), the locally optimized combination of images (LOCI?),and the new principal component analysis (PCA?). The task is particulary complex dueto the disk structure in the outer regions, and to the presence of strong persistent specklesclose to the star as can be seen on Fig. S12 b–f. It should be noted that artifacts causedby the ADI observing strategy do not propagate radially when reduced with all methodsexcept for LOCI, which means that the outer disk structures will not induce artifacts in theinner cavity for all methods except LOCI.
PADIP (Fig. S12 d,g) performs parallelised frame operations in the Fourier space,with high-pass pre-filtering, subtracting optimized PSFs for each single frame, and settingpriority on flux conservation. It was initially conceived to find point sources, but a newmode optimized for disk reductions, which reduces the ADI induced artifacts by usingsmeared PSF references, has been implemented for these observations.
The second method we used, LOCI (Fig. S12 e, h), finds the optimal linear com-bination of reference frames to minimize the noise in a given zone of the target image.The process is repeated until the area of interest in the target image is completely reduced.LOCI has a known tendency to generate artifacts in extended sources such as circumstellardisks. However, this defect of the generic LOCI algorithm is brought under control in amodified version. The d-LOCI algorithm?, ? (Fig. S12 b) incorporates a fine tuning of thegeometrical parameters in LOCI (such as the size of the optimization zone, the number ofreference frames used in the correlation matrix, as well as the introduction of a damping
7

parameter through a Lagrange multiplier) to balance flux conservation with noise attenua-tion.
The third PSF subtraction method, based on PCA (Fig. S12 f,j)), proceeds as follows:assuming a library of reference PSFs, a Karhunen-Loeve transform of these references isused to create an orthogonal basis of eigenimages, on which the science target is projectedto create the reference PSF. A PSF constructed in this fashion minimizes the expected valueof the least-squares distance between the ensemble of reference images and the randomrealization of the telescope response contained in the science image.
Small inner working angles are difficult to obtain with ADI techniques because thePA variation needed close in is too constraining. We also obtained unsaturated Brγ datasets with NICI. This data set, although taken in pupil tracking mode (PA modulation of' 20 deg), was also accompanied by a standard star, that was used to construct a referencePSF using the PCA method for reference star differential imaging (RDI). The correspond-ing image is shown in Fig. S12 k.
No obvious point sources could be detected by either methods. Several hot spots arenevertheless identified, but additional follow-up to further characterize them is required.At this point it is not clear if these hot spots are related to the disk, bridges, or putativecompanions currently forming within the disk. Based on these reductions, we derivedconservative upper limits, summarized in Fig. S13, which also give new upper limit closestellar companions within 0.1 arcsec (such as HD 142527B tentatively reported from op-tical interferometry, see Sec 5 below).
5 Physical considerations on close stellar companions
A non-zero closure phase from sparse-aperture-masking (SAM) near-IR data has recently?
been interpreted in the context of binary models, which are optimal for a 0.1–0.4 M�companion at ∼13 AU (88 marcsec). Our RDI data limit such a companion to less than0.3 M�. The reality of this stellar companion is debatable, as the binary model for thevisibility data ignores the inner disk, which accounts for the largest fraction of the near-IRflux?. We tested the binary model by simulating SAM observations at 2 µm on a radiativetransfer prediction obtained with the MCFOST? package, for an azimuthally symmetricmodel inner disk that is consistent with the spectral energy distribution (SED). We find thateven after Fourier-filtering, the visibilities from the disk in the SAM u, v coverage reach
8

∼2 Jy (for comparison values we refer the reader to radiative transfer modeling of theobserved SED?), while the flux density from a hypothetical HD 142527B would be downat ∼0.065 Jy (in K, for a magnitude difference of 4.8 and a total magnitude of 5.0). Thusdeviations from axial symmetry amounting to a mere 3.25% of the total inner disk fluxcould account for the phase closures that have been interpreted in a binary model. The dustscattering phase function is inherently asymmetric, so that radiative transfer effects alonecan reproduce the observed closure phases, even based on axysymmetric disk models. Inany event, at such short separations this putative stellar companion would lead to a verydifferent disk morphology. The cavity would be much smaller?, and be entirely devoid ofgas.
ADDITIONAL REFERENCES
9
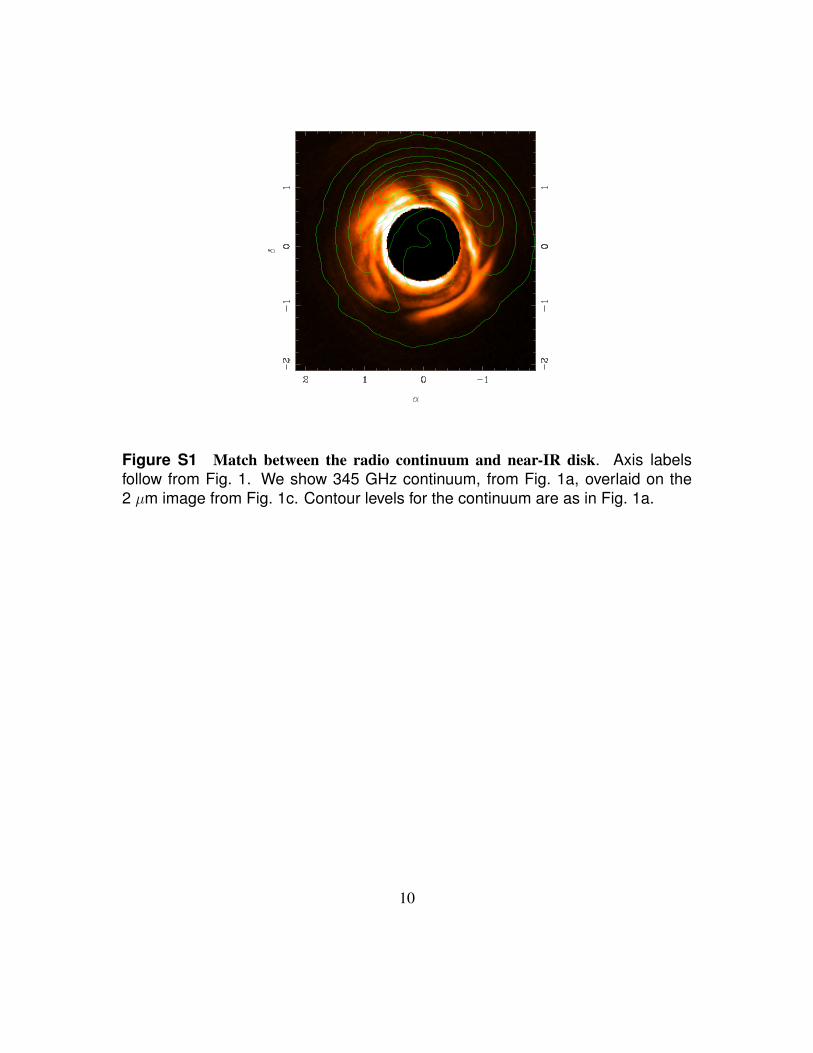
Figure S1 Match between the radio continuum and near-IR disk. Axis labelsfollow from Fig. 1. We show 345 GHz continuum, from Fig. 1a, overlaid on the2 µm image from Fig. 1c. Contour levels for the continuum are as in Fig. 1a.
10

Figure S2 Channel maps in HCO+(4-3) highlight the high-velocity streams below0.7 km s−1 and above 6.8 km s−1 and the gap-crossing filaments at 3.8 km s−1 (sys-temic velocity). a) Left column: we show specific intensity maps from CLEANreconstructions in exponential grey scale for velocity bins corresponding to 5-channel averages, a thin yellow contour at 4 σ and a thin blue contour at -4 σ,where 1 σ = 12 mJy beam−1 is the noise level. The LSR velocity is indicated atthe bottom left of each image, in km s−1, while the peak specific intensity is in-dicated at bottom right, in Jy beam−1, with a beam of 0.51 × 0.33 arcsec−2 (as inFig. 1). Axis labels for images are in arcsec; North is up, East is to the left. Thecross-hairs indicate the origin. b) Right column: Channel maps in HCO+(4-3) fromthe fiducial model. Same as a) but for a comparison model disk calculated withthe LIME package, filtered in (u, v) coverage and reconstructed with CLEAN in thesame way as for the ALMA observations. We have added a central Gaussian tothe LIME model, which is intended to illustrate that beam elongation effects cannotjoin this central component with the outer disk. Continues in Fig. S3
11

Figure S3 continues from Fig. S2
12

Figure S4 Channel maps in HCO+(4-3) from deconvolved models. Same as Fig. S2but for a deconvolved MEM model of the data rather than the restored CLEAN im-ages. Peak intensity values are indicated in 104MJy sr−1. Notice the gap-crossingfilaments seen in systemic velocity, at 3.8 km s−1. We use a reference 1 σ valueof 3090 MJy sr−1. To convert into specific intensity units used for the restoredimaged (convolved with the CLEAN beam), these MJy sr−1 must be multiplied by4.48 10−6.
13

Figure S5 Channel maps in CO(3-2). Labels follow from Fig. S2. a) Left column:we show specific intensity maps in grey scale for 28 velocity bins correspondingto 5-channel averages, with a yellow contour at 5 σ and a blue contour at -5 σ,where 1 σ=0.011 Jy beam−1. The LSR velocity is indicated at the bottom left ofeach image, in km s−1, while the peak specific intensity is indicated at bottomright, in Jy beam−1, with a beam of 0.51× 0.33 arcsec−2 (as in Fig. 1). Axis labelsfor images are in arcsec; North is up, East is to the left. The cross-hairs indicatethe origin. b) Right column: same as Fig. S5 but for a comparison model diskcalculated with the LIME package, filtered in (u, v) coverage and reconstructedwith CLEAN in the same way as for the ALMA observations in a). Continues inFig. S6
14

Figure S6 continues from Fig. S5
15
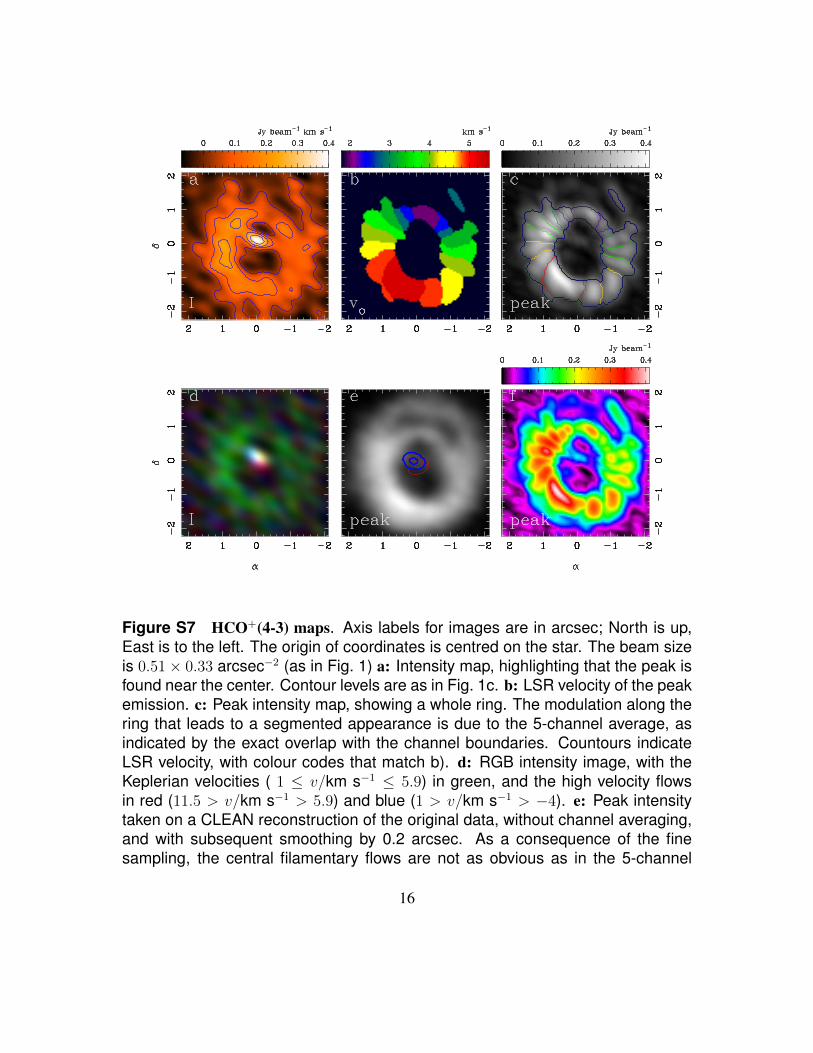
Figure S7 HCO+(4-3) maps. Axis labels for images are in arcsec; North is up,East is to the left. The origin of coordinates is centred on the star. The beam sizeis 0.51× 0.33 arcsec−2 (as in Fig. 1) a: Intensity map, highlighting that the peak isfound near the center. Contour levels are as in Fig. 1c. b: LSR velocity of the peakemission. c: Peak intensity map, showing a whole ring. The modulation along thering that leads to a segmented appearance is due to the 5-channel average, asindicated by the exact overlap with the channel boundaries. Countours indicateLSR velocity, with colour codes that match b). d: RGB intensity image, with theKeplerian velocities ( 1 ≤ v/km s−1 ≤ 5.9) in green, and the high velocity flowsin red (11.5 > v/km s−1 > 5.9) and blue (1 > v/km s−1 > −4). e: Peak intensitytaken on a CLEAN reconstruction of the original data, without channel averaging,and with subsequent smoothing by 0.2 arcsec. As a consequence of the finesampling, the central filamentary flows are not as obvious as in the 5-channel
16

average, but the outer ring is less segmented. Contours correspond to blue (-4.5to +1.3 km s−1) and red (+5.6 to +10 km s−1) intensity, and are taken at fractionsof 0.5 and 0.9 of each peak. f: peak intensity, as in c), but highlighting the centraleastern bridge in false colour and exponential scale. The segmented appearanceis due to the 5-channel average.
17

Figure S8 Spectra extracted from the RGB images shown in Fig. 1. These spec-tra are meant to inform the definition of the RGB velocity codes, and are ex-tracted over apertures defined by the field of view of the comparison RGB images.These spectra do not represent accurate measures of the total integrated spec-trum. Comparison with previous work? at coarser resolutions shows that theseextractions are modulated by flux loss and CLEAN artifacts. Left column showsCLEAN reconstructions, while right column shows MEM reconstructions. Labelsindicate flux density in y−axis, in Jy, and vLSR in x−axis, in km s−1. Notice theirregular blue peak in CO(3-2), which is modulated by CLEAN artefacts (extendednegatives to the north). Our MEM recovers more flux but is noisier in individualchannels of this dataset. Note also that the comparison model CO(3-2) spectrumis sensitive on the adopted temperature profile, so is shown here only as a refer-ence Keplerian rotation model. The spectrum labels correspond to the followingfigures: ‘model CO(3-2)’, Fig. S10; ‘CO(3-2)’, Fig. 1 b; ‘HCO+’, Fig. 1 d; ‘filaments’,inset to Fig. 1 d.
Figure S9 HCO+ spectrum extracted from the central intensity peak. The aper-ture size is 0.5× 0.6 arcsec.
18

Figure S10 Prediction for CO(3-2) from a fiducial disk model for comparison withthe velocity field coded in RGB in Fig. 1. This prediction has been filtered by theALMA uv-coverage and reconstructed with CLEAN, in the same way as the ob-servations. Axis labels and color codes follow from Fig. 1b.
19

Figure S11 Gemini NICI image of the disk with approximate PSF-subtraction.This image shows the CH4S filter, with PSF averaging and derotation. It showsthe least biased disk image, as Fig. 1 c, but with approximate PSF subtractionusing an azimuthally-varying Moffat profile fit to the PSF halo. The spiral structureseen inside the cavity (immediately surrounding the intensity mask) is probablythe result of strong static speckles in these ADI data.
Figure S12 Gemini NICI images after various PSF-subtraction methods. All pan-els show the CH4S filter (an analogous set of images is available in CH4L), except
20

for j). a: PADIP pipeline image of the disk. b: Damped-LOCI image of the disk. c:PCA image of the disk.d: Aggressive PADIP image for faint companion search. e:Aggressive LOCI image. f: Aggressive PCA image. g: Aggressive PADIP zoom.h: Aggressive LOCI zoom. i: Aggressive PCA zoom. j: Brγ RDI limits close-instellar companions - this last image was reduced with PCA, its IWA is only 50 mas,as opposed to 220 mas in CH4S.
0.1 1
2
4
6
8
10
12
14
16
18
20
Angular separation (")
5−σ
dete
ctio
n lim
it (M
K)
CH4K 5%S −ADI/CORO− PADIP
CH4K5%S −ADI/CORO− PCA
CH4K 5%S −ADI/CORO− LOCI
Br γ −RDI/PSF− PCA
0.1 MS
0.2 MS
0.4 MS
10 MJ
4 MJ
2 MJ
Figure S13 Limits on companion mass from NICI CH4 ADI, and NICI Brγ refer-ence star differential imaging (RDI)). For NICI CH4 ADI, we report contrast curvesin three different techniques (PADIP, LOCI and PCA, see text for details). Theselimits are not corrected for extinction. As a comparison point we refer to theCOND03? tracks at 2 Myr of age, which lead to the mass upper limits indicate on
21

the plots. The vertical dashed black line indicates the effective inner working an-gle, set here by the extent (0.22 arcsec) of the semi-transparent Lyot coronagraphused in the NICI CH4 ADI data set. The NICI Brγ detection limits obtained withRDI are also indicated along with 2 Myr stellar tracks using the BCAH98 model?.
22