Embed Size (px)
Citation preview
60
Observations tiom Tests on a Segmental Bridge
RICHARD M. McCLURE, HARRY H. WEST, and P.C. HOFFMAN
ABSTRACT
The Pennsylvania Departnent of Transporta-tion designed and constructeil a postten-sionedl segtnental concrete box-girÇer bridgeat the Pennsylvania Transportation ResearchFacillty (Têst Track) locate¿l at Pennsyl-vaniâ State UniversiÈy. The bridge consistsof tno independent eurved girders with astnply supportëd spän lènEth ôf 121 fr. (36.9¡¡). The cross section of each girder con-sists of a box section with side cantile-vers. The main objectives of the researchprogram for the segrnental bridge grere tonake field ¡neasurements on the full-scalebridge, to study the behavior of the bridgeunder normal truck loadings, and to studythe overload behavior to establish actualsafety factors. The acconpLish¡nent of theseobjectives requíred temperature stu¿lies,stat.ic loail testing of the bridge, overloadtestíng of the brldge, Iaboratory testing ofinclividual seg¡nents, andl theoretical stuil-ies. Thls research resulted ln nany obser-vations for the design of segmental bridgesconcerning temperature, longitudinal bend-ing, and transverse bending.
The United States is faced with the severe proble¡nof briclge deterioration. It has been reported that105,000 of the 564,000 bridges in the United Statesare in critlcal neeil of repair or replacernent (Ð.There is no simple answer to solving the problem ofreplacing and repairing these deteriorated bridges.The task of correcting the structures will un-doubtedly require many different technologies anclmetho¿ls.
One of the ansvrers to this problen ls the use ofprecasË, prestressed-concrete segmental constructionin ¡vhich the benefits of both precasting and post-tensioning cân be co¡nbined aclvantageously. Thiscombined nethod has been shown to be an efficlentand econonical ¡nethodl of construction (2).
Segnental briilge construction originatecl in theUnited States about threê ilecades ago. In 1952 theFreyssinêt Conpany deslgned a seg¡nental I-girderbriclge in New York Statet however, the technique ofsegtnental construction s¡as not coÍìrnercially appliedon a large scale until 1962, when the Choisy-le-RoiBridge was built over the seine River in paris (3).Since then segrnental construction has spreadthroughout Europe, and the technique has been con-tinuously reflned (3). Segmental construction isnow gaining worldwide acceptance, with ¡nuch use inthe Unite¿l States.
Engineers concerned with the problems of briilgerepalr or replacenent are constantly looking forinnovations and inprovenents in bridge quality andeconony. To this end, an experimental aegmentalbrialge was designed and constructed by the Pennsyl- curb ond
vania Department of Transportarion !!). (5.i:jj;A letter survey was also conducted as part of the
project. The purpose of the letter survey lras togather infornation on current designs anil construc-tion problerns as well as to assess the state of theart concerning segnental concrete box-girder bridgesin the United States. The results of this surveypointed out the need for the establishrnent of na-
tional desígn and construction criteria Þ). Sincethis survey, two reports on the subject have beenpublished by the Prestressed concrete fnstitute(PCr) (6,7)
The nain objectives of the research program forthe experirnental segrnentat bridge were to make fieldmeasurements on the fulL-scale briilge, to study thebehâvíor of the briilge uncler normal truck loadingsrand to study the overload behavior to establishactual safety factors. The aceompfishment'of-theseobjectives required temperature studies, static loadtesting of the bridge, overÌoad testing of thebriilge¡ laboratory testing of inctiviilual segments,as well as theoretical stuilies.
TEST BRIDGE
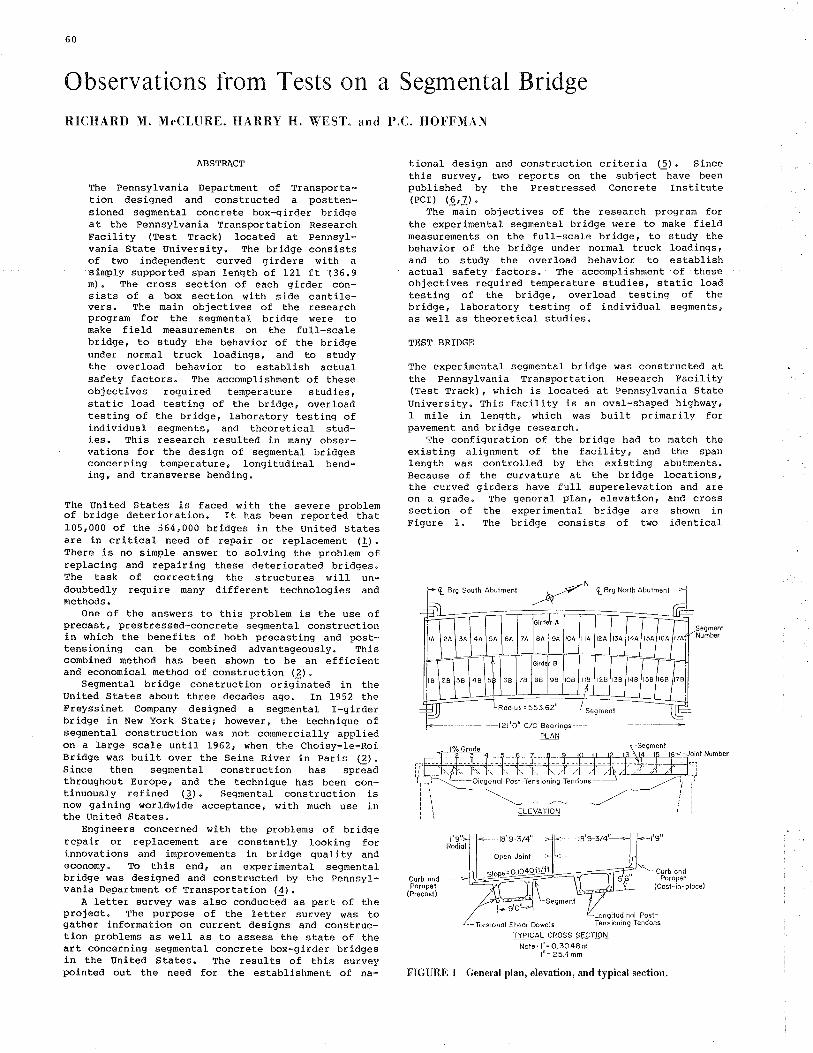
The experinental segrnental brialge wâs construcÈêd atthe Pennsylvania Transportation Reseârch Facility(Test Track) ' which is located at Pennsylvania StateUniversity. thís facility is an oval-shaped highwayr1 ¡nile in length, which was built primarily forpavernent and bridge research.
The configuration of the bridge had to match theexisting alignment of the facility' and the spanlength was controlled by the existing abutrnents.Because of the curvature at the bridge locations,the curved girders have full superelevation and areon a gra¿le. The general planr elevation, anil crosssection of the experirnental bridge are shown inFigure I. The bridge consists of tvro identical
'Àtf'-
ELEVATION
TYPICAL CROSS SECTION
Note' l'= O.3O48 ml"= 25.4 mm
FIGURE I General plan, elevation, and typical section,
Brg Soulh Abútmenl , ,-7 q Brg Ì'¡orlh Abutmenl
l,^ 2A 3A 4A 5A €A
;lid
8A 9A OA
I 2B 3B 4B
+6a 7e
Gnd
AB
I
9B o9
C/C B(2t' ôt¡nos
Segmenl
PLAN

Mcclure et al.
sinply supported gírders with segments and jointsnurnbered as shown. I! shoul¿l be noted' however,that most segmental bridges have continuol¡s spans.Each inilependent girder consists of 17 segments thatare tieil together with longitudinal bar or strandposttensioning tendons plus diagonal bar postten-sioning tendons. Steet shear ¿lowels were used toachieve alignnent during construction and to trans-fer torsional rnorient after the girders v¡ere built.Epoxy eras used as the main joínting rnaterial bet$¡eenthe segnents. An open longitudinal joint bete¡eenthe girders was selecteil to allow an independentcomparison of the two girilers.
The design specificatíons for the experirnentalbriilge were from the standard specifications forHighway Briilges of ÀASEro (!). These gtere supple-nented by the Pennsylvania Departrnent of Transporta-tionrs Design Manual (9).
The curve¿l box girder was designed for longituili-nal tnonent by using straight beâm theory for thedêad load' A.ASHîO HS20-44 live loading' and Pre-stress. The ilesign was maale by using allowablestresses and was checked for ultimate strength. Fortransverse noment, the segrnents were deslgned elas-tically as a box fra¡ne with side cantilever flanges.At the bottom of the webs the frame was assuned tobe simply supported.
each girder was analyze¿l for torsion as a hori-zontally curved bea¡n with eccentric loads- Torsionaldesign was ba'secl on a netho¿l presented by zia andl,tccee (10). The cross section of the segments was
approxinated as a box section with'the flanges ne-glected.
The abíIity of the joints to provide friction wasconsiderecl only for ulti¡nate strength conditions.Accommodations for flexural shear were provided bythe posttensioned diagonal bar tendonsr and thesteel shear ilowels were clesignecl to resist torsionalshear between segnents. These joint ¿letaifs are notnecessarily representative of current practice.
End diaphragms were introduced in the enil seg-nentsr which were ample in size to take the substan-tial reaction forces fro¡n the neoprene bearings padsand torsional anchorages and to provide roorn for theposttensioning end anchorage plates. In additionr anopeníng was nacle to allow easy access by researchersto the insíde of the box section.
The segments for the experimental bridge werecast individualty at a fabrication plant by theshort-line methoil in one steel form with provisionsfor adjustments. They were then hauled about 100¡niles (16I krn) to the facility' where they wereerected on steel scaffolding-type falsework.
TN¡IPERÂTURE STI'DY
The main purPoses of this stucty were to ¿leterninethe dimensional leve1 that neeils to be considereil inthe heat flow problem for a bri¿lge structurei toobserve the tenperature distributions that occurr¿ithin a cross section over a l-year periodf as r'¡ellas to ldentify the rneteorological conditions as-sociated Ì¡ith extreme temperature ilistributionsi ancl
to neasure bridge novements un¿ler the ¿lifferentobservedl tenperature distributions.
fnstrunentation
The instru¡nentation for ¡neasuring temperatures con-sisted of an Estherline Angus-Model E It24 E nulti-point recorder and 24 coPper versus constantan ther-tnocouples that were located aÈ various positions on
Èhe cross section (1Ir12). The thernocouple place-ment was perforneil after bridge erection by drillingandl filling the void ¡tith an epoxy that was speci-
61
fied by the nanufacturer as ther¡na11y conpatiblewith the concrete (11).
The average vertical ileflections at rnidspan were¡neasured by using six dial gaugesr v¡ith th¡o placeilat each end and two placedl at miilspan. The dialgauges were ¡nounteil to produce vertical deflectionsthat vrere perpenilicular to Èhe bottom of the giriler(u).tong itud inal Var iation
The initial portion of the thermal study consideredthe possibilíty of a longitu¿tinal temperature varia-tion. This investigation co¡npared 10 thermocouplereadings at hourly intervals for 3 different dailycycles between segments 2A and 5Ar and segments 2A
and 9À (see Figure 1).The collected ortlered pairs of readings for like
thernocouple posítions were then analyzed by simpleIinear regression. From the regression analysis itwas conclucled that there Ì¡as no significant longi-tudinal tenperature variation GU. fne longitu¿linalstudy reilucecl the heat-flolr problen from a three-ilimensional analysis to one with no nore cotnplexitythan two dimensions.
Transverse Variation
The second portion of the study observed the trans-verse te¡nPerature distributions of the bridge for I8daily cycles during the period starting on October25, ]g78' anil ending on october 16, 1979. The setof 18 daily observations was ilesigned to indicatêseasonal extre¡nes as best as could be Predicted bythe researchers before the measure¡nents- Each trans-verse te¡nperature distributon was cornpileil hourlyfro¡n the 24 therrnocouple reailings (LI).
It was foun¿l that there r'eas 1ittle transversetenperature variation in the horizontal direction.Therèforer the heat-flow problen could be furtherreduce¿t from a two-di¡nensional to a one-tlirnensionaLstate with the vertical ternperature variations re-sulting in vertical deflections only (È) .
vertical Deflection and vertical TemperatureDistr ibution
The effect of the seasonal variation on verticaldeflection has been reported previously (llrI¿).The observâtions indicaÈed that the maximun upgtar¿l
deflection was 0.72 in. (18.29 mn)t it occurred onJuly ?, 19?9. Also, the naximurn downward deflectionwas 0.fI in. (2.79 ¡nm)i it occurred on January 4¡L979. The therrnal conditions on the two dates werecornpletely opposite (11) .
The therrnocouple readings on July 71 1979r thatcorrespondeil to the naxi¡nun upr'raril deflection of0.72 in. in¿licated a rnaxi¡num surface temperaturedifferential of 51oF (28.3oC) between the top an¿l
rnldheiqht to the girder.
Specifications
Currently, U.S. design codes do not specify theconsíderation of a vertical temperature distribu-tion. Hosrever, the New zealand specification re-quires the consideration of a fifth-Pov¡er tempera-ture distríbution for webs anil cantilever flanges,as shogrn in Figure 24. Alsor the deck slab abovethe cells and the soffit are subjected to a lineartenperaÈure distrlbutionr as shown in Figure 2a'The PCI and the Post-Tensioning Instftute (PTI)reco¡n¡nended as simplier vertical thermal distribu-tionr as shown in Figure 2b, where the flange isunifornly etarmer than the renaining cross section(12).

62
Lh.6 ln D.cl AboÈ Eæbæd Cãll
l(y). r(y,/l2oo)õ For Wrà!
r(y). r-O.O5(d) Fq D!ck! AbqvoEncl@d C.lls Whsro d i6Moosuisd Frm DlcÌ Top
Not.' I h.'2á4 nm
t.5"c (2.rF) (a) New Zeelend Spêcllicat¡on
(b) The PE!tß!8ed Concrete lnatlluto lndPoal-Tonslonlng hrlltute TomporatuÞ DlElrlbutlon
FIGURE 2 Thermal distribution assumptions fordesign.
Comparisons
À comparison of the temperature distributions wíththe Nêw Zealand specification indicates satisfactoryagreenent. The observed rnaxinun surf.ace temperatureclífferential of 51oF is reasonably close to the Newzealand recommendation of 57.6oF (32oC). Also, thefielcl observations for the webs indicate that thecritical tenperature distribution that causes naxi-mun upward bowing can be approxinated by a fifth-order polynomial. In ad¿lition, the slab above thebox cell showed a linear temperature clistribution(11).
The observed curvaturer which was calculated fro¡n¡neasured vertical ileflections, was compared withtheoretical curvaÈures, which were calculated fro¡nboth the rnodified Nelr zealand specification and themodified PCI-PTf temperature distribution. In themodified New zealand specification the verticaltemperature distribution varíed as a fifth-orderpolynonial fron 51oF at the top surface to 0oF(-17.8oC) at a depth of. 47.24 in. (1200 mm). In the¡nodified PCI-PTI nethod the te¡nperature was assu¡nedto be 35.8oF (19.9oC) in thê 8-in. (203-mm) flange,which is approximately teice the reconmended value,and 0oF elsewhere. The observed curvature for a0.72-Ín. (18.3-nn) midspan deflection agreed closelyr.rith curvatures calculatedl from the moilified Nehtzealand and PCI-PTI distributions (12). Horvever,residual temperature stresses calculated from thetwo vertical temperature distributions differednarkedly (I2).
STATIC LOAD TESTING
The nain purposê of the static load testing of thefulL-scale experimental bridge was to study theelastic longitudlinal bending behavior of girder Aunder actual live-load conditions. The tests focusedmainly on the deternination of experinental deflec-tions and strains from which stresses were deter-¡nined. The test results grere compared with resultsfron a fÍnite-ele¡nent analysis and fro¡n a conven-tional analysis. Numerous conparisons were nadebetrùeen observed and calculated quantities, but onlytwo are reported here. More comparisons.are avail-able in a report by Mcclure and west (13).
Transportation Research Record 950
Testing and Instrunentation
The tesb vehicle for these tests was Ioâde¿l to con-form as closely as possible to AAsHl¡o lrs20-44 liveloailing plus additional loadíng to account for thêeffects of Írnpact (8). The loading arrangement forthe vehicle is shown in Figure 3. The test vehicletraveled from north to south and occupied threefateral positions on girder A during the static. loadtests. First, the center of the vehicle was 5 ft(L.52 ¡n) to the left of the girder centerline $¡hilethe vehicle crossed. On the next two passes thecenter of the vehicle was centered and 4 ft (1.22 ¡n)
to the right of girder centerlíne, respectively (13).
FIGURE 3 Test vehicle for static load tests.
During the tests ¡neasurenents were nade to deter-nine live-l"oad deflections by using tlial gauges, andlive-load strains were deternined by using electri-cal resistance strain gauges. The readings for thedeflections when using clial gauges erere taken manu-ally, which required the test vehícle to be stoppedwhen the front axle v¡as at odd-numbered joints sothat thê readings could be taken. The readings forstrains were recorded continuously by using a Honey-well Accudata System with a half-bridge hookup fortenperature conpensatibn âs the test vehicletraveleal at approxirnately L.0 mph (1.6 kn,/h). There-fore, tr.ro separate runs rvere needed to obtain aconplete set of readings (13).
The live-1oad deflections for various positionsof the test vehicle were measured by usíng six dialgauges that srere located on the bottom of girder A.At. each end, two dial gauges \dere located at thelower corners of the box approxinately I.5 in. (38nm) frorn the abutnent pedestal. Two dial gaugesvrere sinilarly located at midspan. The clesirecltleflection was taken as the average value at thecenter of the span with respect to the averâgevalues at the enil gauge locations. All measurementswere perpendicular to the bottorn of the glrder,which resulted in deflections that were also per-pendicular to the bottorn (13).
Measurenents to determine live-1oadl strain foratl posid,ions of Èhe test vehicle were made by usingelectrical resistance straín gauges located at the¡niddle of segnent 9À, which is at rnialspan. This seg-ment was chosen because of the high live-loaal bend-ing noment at that location (13). The locatíons ofthe metal foíl electrical resistance strain gaugesare shown in Figure 4.
Deflections
Both experinental and theoretical values of verticaldeflection are plotted in Figure 5 accortling to the
I''ï'
L
I

McCIure et al.
*"'iL:?l1H
FIGURE 4 Locations of electrical resistancestrain gauges on segment 9A for static loadtests.
JOINT LOCâTION OF LEADING AXLE
FIGURE 5 Midspan centerline vertical dellections for static loadtests.
position of the leading axle of the truck loadíng.The nain theoretical values ltere deterrnined by usingan elastic finite-elenenÈ analysis for prestressed-concrete structures rùith the use of SAP Iv. Thestructural analysís progra¡n (SAP) is a general pur-pose finite-element prograrn that was developed atthe University of California at Berke1ey. The sAPrV version' first released ín June 1973 and reviseclin April 1974. was used in this stuily (1¿!).
The varíation in midspan deftettion as a functionof load position is theoretically conposed ofsÈraight-J.ine segnents when a11 three axles arêeither to the left or the right of nidspan. Dlscon-tinuities occur in the straight-line segnents whenan axle enters or leaves the span. Howeverr thevariation is curved in those regions where there areaxle loads on both sides of midspan (f3). rne curvesshown in Figure 5 are drawn through the data pointsto reflect these conditions.
An exanination of the data in Figure 5 indicatêsthat the experimental results are consistently lowerin value than the finite-element results, with amaximun discrepancy of about 15 percent. This ten-dency for the actual bridge to be stiffer than the
63
finite-element mo¿teI nas reflected throughout thestudy (I3).
ÀIso displayed in Figure 5, for the truck-cen-tered caser is the nridspan deflection assocíatetlwith the leading axle .at joint 5 based on the con-ventional bearn theory approach. This deflection of0.455 in. (11.56 nm) is about 14 percent grêaterthan the corresponding finite-element valuer whichindicates that the conventional approach used in thedesign enploys a ¡nodel that ls even less stiff thanthe fínite-elenent model (13).
Longltudinal stresses
If the bridge is treateil approxirnately as a straightrnember, and if it is assu¡ned to be loaded and torespond in the-vertical plañe, then the rnaxlmt¡nmidspan rnomenè hriIl vary piecewise llnearly as thetruck ¡noves across the span. Dlscontinuitles occuras an axle enters the span, crosses over nidspan, orleaves the span (!1). A standard influence lineapproach gives a maxi¡nurn nidspan no-Bent of 2 1229ft-kips (3021 kN.n) when the leading truck axle isat joint 7. Thís monenÈ reduces slightly to 21133ft-kips 12892 kN.n) ythen the leading axle is atjoint 5. Because longltudinal flexural stress ls adirect function of bendlng no¡nent, this stress willhave the sarne piecewise-IÍnear variation as. does themonent when the truck Passes over the bridge (f!.
The longitudinal stresses on the bottotn center-Iine surface of the box section for segmênt 9À areconparedl in Figure 6. The varlation Patterns instress as the truck passes over the span shott excel-lent correlation betneen the experinental and fí-nite-elenent results. Alsor the trend observedearlier in lhe displacement conparisons is sub-stained here¡ that is, the experimental results areapproxi¡nately 15 percent Ieãs than the finite-ele-rnent results (!f .
tlotc: I k!¡ ' 6.895 N/m2I ft = O.3O48 m
Trúck Før Fæl Righl
JOINT LOCATION OF LEADIT{G AXL€
FIGURE 6 Bottom flange longitudinal stresees for middle ofsegment 9A for static load tests.
Based on standaral flexural stress calculations,and by using the ¡naxinun ¡nidlEpan moment of. 21228ft-kips for the slnplifÍed Etraight beam anal thesection ¡nodulus fron the design co¡¡lputations, the¡naxi¡num flexural stress is 0.468 ksl (3.23 Nr/m¡n'z)(13). This stress ls shown in Figure 6 for thetruck-centerecl case vrith the leading axle at jolnt7, and it is seen to bê largêr than both the finite-eletnent and experirnental values.
:i-I r I
F-.....1.-...rl+M¡ddlo (
Io=tszU
=U
JdIôJ
trÉU
6UÉF
J
1oÞEozY
ol Sogmt

64
OVERIOAD TESTING
The naín purpose of the overload testing was tostudy the Ínelastic longitudinal bendíng behavior ofgirder B under overload conditions. The tests fo-cused nainly on the deternination of experínentaldeflections and strains fro¡n which stresaes weredeternined. The test results Írere conpared with theresults from a finite-element analysís and fron aconventional analysis. Nunerous comparisons \reremade between observed anil calculated quantities, butonly a few wíI} be reported here. More cornparisonsare available in a report by Mcclure et al. [!).Testing and Instrunentation
Girder B was tested nlth statlc loacllng by uslng theloadfng frames shown in Figure 7. The loading framesinclude four hydrâulíc tension jacks. Four openings
FIGURE 7 Loading frame for overload tests.
for the jacks were cut through the concrete bridgedeck directly above the jacks. The jacks were hinge-connected to the steel loading beans at their topenda and attached to the anchor assembly of the rockanchors at their lower ends. The rock anchors weredrilleil andl grouted approximately 75 ft (23 m) belo¡rthe ground levelr 20 ft (6 n) of which were in soun¿lbedrock. Each rock anchor eras capable of developinga load of 500 Rj-ps (2225 kN), which was equal to thecâpacity of the loading beans used for Èhe testing.Each loâiling beam consísted of two 27 x IL4 wiileflange beans placed on a roller support at one endand a hinged Êupport at the other. The beams de-livered the loads through 2-in.-thick (50.8-mm)steel plates to concrete pedestals locatêd over ther{ebs to give a longitudínal bending type failure.The load schedule called for an initial load of 186kips (887.4 kN) r rùith daily increments of I00 kips(444.8 kN) untll failure occurred. The loads vreremonítored by separate pressúre gauges for each jackanil verified from strain readings on each ran QÞ).
Deflections for all load íncrements were measuredby using dial gauges. Three gauge lines located atthe bottom of the girder yrere used as was previouslydescribed for the static load tests. ÀIf ¿lial gaugesdeterrnined the dísplacenents in a dlrection perpen-dlicular to the bottotn surface of the giraler. Àfterthe girder started yielding, the dleflections wereneasured with an engineerrs leveI, whfch was set upaÈ a dlstance fro¡n the girderr and two level rodstwhLch were pêr¡nanently nounted at the nidspan of thegirder (15).
Strains at the middle of segment 98 nere measureilat each loadl increment by using metâl foll electri-
Transportation Research Record 950
cal resistance strain gauges. This segrnent, whlchis at nldspan, was chosen because of the large bend-ing nonent at that locaÈion. These longitudinalstrain gauges were placed as shov¡n in Figure 8.Only longitudinâl gauges were used because bentlingwas of prinary interest. AlI strains were read witha Model P-350 Budd Strain Indicator, which used ahalf-bridge circult wlth tenperature compensationgauges Q!).
, 64.0"
, "54.O" >F 54.O' i itoic: I in = 25.4'm
FIGURE B Location of electrical resistance strain gauges onsegment 98 for overload tests.
Deflections
To obtain the total experimental deflection at mid-span for any load, the pernanent set was added tothe measure¿l deflection. This was necessary so thatall experimental deflections were measured fro¡n thesane origin. The experirnental and theoretical nid-span ¿leflections are shown in Figure 9. The data in
Â
G
ôI
,-E - -4---â-â¿,y#w; E1-
# +Erprr¡mddql
-+--+-Fin¡b ElqËt
++Slondord TlwylrF- rrt Crqd(
V l¡oto: I in.I kip
25.4 mm.4.44{t tN.
lrlDSmN DEFLECloil (inchê)
FIGURE 9 Load deflection diagrams for girder B for overloadtests.
the figure indicate satisfactory agreement bethreenfinite-elenent and observêd deflêctions at a1I loadlevels, with the finite-ele¡nent model once againindicating less stiffness than the real structure.The finite-elenent analysis was once again perfornedlby using SAP IV, which was exteniled beyond ylelclingby using the inelàstic properties of the naterials(I1). Figure 9 also shoers the results of a conven-tional prestressed-concrete bean analysis by usingstrain compatibility (fq), shích indícateg satis-factory agree¡nent nith experimental values up tofirst yieliling.
T
rbli"l slsl Itl

l'lcclure et aI.
Longitudinal Stress
The pernanent set straíns shouldl be adiled Èo the¡neasureil strains to obtain the absolute surfacestrains that should be with the theoretical strains.Hovrever' pernanent set strains vrere not rneasured.Conparison of ¡neasured and finite-e1e¡nent strainsdid indicaÈe fair agreenent up to first yieldingrwhere permanent set strains were s¡nall- but diil re-veal a devíation of results above first yieldingr¡here the permanent set strains v¡ere relativelylarge (15). Figure t0 shows the comparison of ob-served and finite-elenent strains at the niddle ofsegnent 9B for a load of 376 kiPs (1672 kN) ' whichis below first yielding.
FIGURE l0 Longitudinal surface strains at middle of segment 98for a load of 376 kips (1672 kN) for overload tests.
Cracking and Failure
ln the first and second days of testing, up to loadP = 276 kips (1228 kN) ' there s¡as no visible crack-ing on the bottom surface of the bridge. In thethird day of testing' at loa¿l P = 376 kips (16'12kN), the first visible cracking was observed at thebotto¡n surface betrdeen the points of loading. Asthe l-oad was increaseil, cracks increased in nunbertand those between the points of Loading wiclenecl andextended toward the cotnpressíon zone. Nothing un-usual was noticed until the eighth day of testing ata loäd of 876 kips (3896 kN), h'hen two loud soundswere heard at different times anil the pressure gaugereadings for the jacks dropped down sIiqhtly. Itsounded like a strand or bar tendon had broken eachti¡ne. AÈ this load the cracks at joints I and 9
openeil widely and extended upward toward the tops l-ab.
In the last day of testing, at loa¿l P = 945 kips(4203 kN), t}¡o events occurred: first, a noise r.tas
heard and the deflection íncreased suddenly by 0.25in. (6.35 mm); second¡ two strong sounds, similar tothose that occurred at P = 876 kips were heard, andagain, deflection increased suddenly by another 0.25in. Pressure readlngs started to faIl offr but thenreached a constant value. As the load was slightlyincreased to a load of 955 kips (4248 kN), the crackat joint I opened widely and the concrete in thecompression zone crushed and spalled on t.he surface.The rnode of failure of the bridge is shown in FiguretI. on inspection of joint I' it was found tha! allthe longituclinal stran¿ls were broken and only thebar tendons were holding the bridge in place.
The finite-element load at first cracking Yras
estirnated at P = 420 kips (1858 kN) r which is 12percent larger than the observe¿l value. The crackingLoad calculated from conventional theory was P = 439kr.ps (1953 kN) r ¡¿hich is 5 percent larger than the
FIGURE 1l Mode of failure of girder B'
corresponding finite-element value. Also, the fi-nite-elenent load at failure was estí¡nated at P =920 kips (4092 kN), which is 4 percent s¡naller thanthe observed value. The failure load calculatedfron conventional theory by using strain compatibil-ity was P = 901 kips (4000 kN), which is 2 percentsmaller than the corresponding finite-element vaLue(1s).
LABORATORY TESTING
The main purpose of the testing of incliviilual seg-ments was to establish transverse bending behaviorto augnent the data obtained fron fieldl testing theexperinental bridge. The indiviilual segments weretested under si¡nulated field conclitions to determlnefailure no¿les. Experirnental results were conpareilwith the results from a conventional approach thâtused a frane analysis in the eLastic range andyiêId-line theory to predict ulti¡nate behavior ofthe sLab. NuÍìerous cornparisons were rnade betv¡eenobserved and calculated guantitiesr but only a feltwill be reported here. More comparisons are avaiL-able in a report by !4cClure et al. (17).
Testing and Instrumentation
Four inilivídual segments Ì¡ere tested undèr simulatedfielcl conditions in the strucÈures laboratory atPennsylvania State University. Each concrete segmentwas supported between tvro steel end frames approxi-rnateiy the shape of the segnent, as shown ln Flgure12. The en¿l franes had provisions for torsionalshear dowels, diagonal tendonsr and longitu¿linalposttensioning bars that coul¿l be tensioned to in-duce the desired longitudinal stress condítions. Thêfour segnents \rere tested statically for severalloading positions. In the tests the loads v¡erepositioned along the middle of the segment to simu-Iate wheel loads fro¡n a standarcl truck.
Measurenents were taken v¡ith dial gauges to de-ternine transverse deflections at the middle of thesegnent. Irleasurenents \rere also taken with wireelectrical resistance strain gauges to determlnestrains at the niddle of the segment. À1I strainswere read with a Mo¿lel P-350 Budd Strain Indicator,which used a half-bridge eircuiÈ \dith temperaturecompensation gauges (17).
65
I
obmd slro¡n8 (rl-¿inl¡n)
- Fin¡to Elemñt Stioins (rt¿ ¡nlin)
66
FIGURE 12 Test setup for testing of segments: front view (top),and side view (bottom).
Deflections
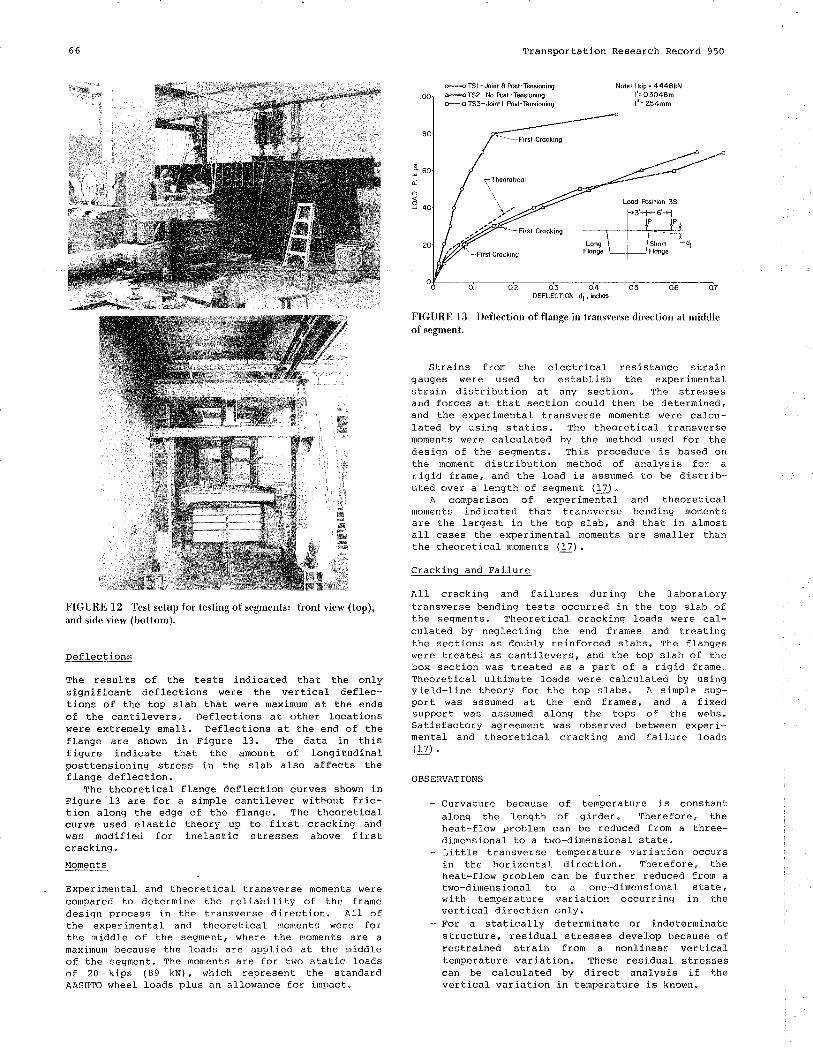
The results of the tests indicated that the onLysignificant deflections vrere the vertical deflec-tions of the top slab that were maximurn at the endsof the cantilevers. Deflections at other locationswere extremely sna1l. Deflections aÈ. the en¿l of theflange are shown in Figure 13. The data in thísfigure indicate that the amount of longitudinalposttensioning stress in the slab also affects thefl-ange deflection.
The theoretical flange deflection curves shown inFigure 13 are for a sirnple cantilever without fric-tion along the edge of the flange. The theoreticalcurve used elastic theory up to first cracking andwas ¡nodified for inelastic stresses above firstcracking.Ivloments
Experimental an¿ ttreoretical transverse monents r.rerecompared to deternine the reliability of the framedesign process in the transverse direction. ell ofthe experimental anil theoretical nonents were forthe middle of the segnent, where the moments are a¡naximum because the loads are applied at the middleof the segment. The moments are for two static loaalsof 2O kips (89 kN) ' which represent the standardAASHTo wheel loads plus ån allowance for impact.
TransporÈation Research Record 950
DEFLECTIoi¡ dt, ¡ElÊ
FIGURE 13 Deflection of flange in transverse direction at middleof segment,
Strains from the electrical resistance straingauges were used to eståbLish the experimentalstrain distribution at any section. The stressesand forces at that section could then be deternined,and the experimental transverse noments were calcu-lated by using statics. Thè theoretical transversenoments were calculated by the method used for thedesign of the segments. This procedure is based onthe moment distribution method of analysis for arigid frame, and the load is assumed to be distríb-uted over a length of segment (I7).
A conparison of experimental and theoretícalnoments indicated that transverse bending ¡nomentsare the largest in the top slab, and that in al¡nostall cases the experimental móments are smaller thanthe theoretical ¡noments (17).
Cracking and Failure
A1l cracking and failures during the laboratorytransverse bending tests occurred in the top slab ofthe segnents. Thêoretical cracking loads were cal-culated by neglecting the end frames and treatingthe sections as doubly reinforced sLabs. The flangeswere treated as cantilevers, and the top slab of thebox section was treated as a part of a rigid frane.Theoretical ultimate loads were cal-culated by usingyield*line theory for the top slabs. A simple sup-port was assumed at the end frarnes, ancl a fixe<lsupport was assumed along the tops of the r,rebs.Satisfåctory agreenent was observed between experi-mental and theoretical cracking and failure loads(!z).
OBSERVATIONS
- curvature because of temþerature is constantalong the length of gircler. Therefore, theheat-flÕr.r problem can be reduced fron a threê-dinensional to a two-dirnensional state.
- Little transverse temperature variation occursin thè horizontal direction. Therefore' theheat-flow problem can be further reduced from atwo-dimensional to a one-dimensional state,with temperature variation occurring in thevertical direction only.
- For a staticalJ.y determinate or Índeterminatestructure, residual stresses develop because ofrestrained strain from a nonlinear verticaltemperature variation. These residual stressescan be calculated by direct analysis if thevertíca1 variation in tenperature is known.
to:Õ
éJ
H TSI-Jo¡nt I tuôt-T$sirhingæTS2-tlo tuGt-Tft¡m¡ngHTS3-Jdnl I b-lônsionino
Nole,l k¡p' 4448kNl'= O3O48mt"' 25'4mm

l,lcclure et al.
- For a statically in¿leterninate structurer thecurvature from vertical te¡nperature variâtionis also inportant in the tlesign. Either a
fifth-order vertical ternPerature clistributionacross the entire cross section (New zealandgradient) or a uniform vertical tenperaturedistribution in the top slab (PCI-PTI graclient)can be used to predlct the curvature.
- Reinforcing steel nust be provided to carry thetotal tensile force if the temPerature stressescause¿l by the nonlinear vertical tenperaturedistribution or continuity-induced stressesexceed the ultinate tensile stress of theconcrete.
- Elastic deflections and stresses fron longltu-dlnal bending can be adequately predictêd byusing the finite-ele¡nent rnethod' with thefinite-ele¡nent values about 15 percent largerthan the actual values. A conventional tleslgncan also be used to conservatively predlict thevalues, with the conventional values con-sistentty larger than the finite-elenent val-ues. sone econotny in design night be achievedby using the finite-eletnent nethod of analysisín the desígn.
- Inelastic deflections and stresses from longi-tudinal bending can be adequately predictedl byusing the finite-element nethod. The conven-tionaL design approach of using strain compatí-bility can be used to conservatively predictthe failure loa¿l' but it shoulil not be used topredict inelastic deflections.
- The only significant transverse deflections ina segrnent are in the toP slab. These deflec-tions occur under the wheel l-oails and are¡naximun at the end of the cantilever flanges.The elastic transverse cleflections can bepredicted by treaÈing the cross sectíon as arigid frame.
- Transverse moments have a maxi¡nu¡n value at a
cross section under the wheel loails. Elastictransverse rnoments can be conservatively pre-dicted by using a frame analysisr where thefra¡ne consists of a box section with sídlecantilevers.
- Transverse bencling failures of the top slabwere the prirnary node of failure, rtith theflanges being the weakêst part of the segment.Theoretical transverse cracking loads can bêpredicted by treâting the cross section as a
rigiit frarne. Theoretical transverse failureloads can be predicted by using yield-J-inetheory for the slab, with a sinple supportassumed at the edge of segment and a fixedsupport assumed along the top of webs.
ACKNO$¡LEDGMENT
A portíon of a rnajor 6-year investigation on ânexperinental segmental bridge that was conducte¿l atthe Pennsylvania Transportation fnstitute, locatealat the Pennsylvania State University, was presente¿lin this paper. The stu¿ly etas sponsoreil and fundedby the Pennsylvania Departnent of Transportation andF¡TWÀ.
REFERENCES
1. one in Síx U.S. Híghway Bridges is Deficient.Engineering News Recordr March 10, 1977, pp.18-2r.
2. J. Muller. Ten Years of Experience in PrecastSegmental Construction. Prestressed ConcreteInstitute Journal, vol. 20, No. I. Jan.-Feb.1975, pp. 28-61.
67
3. C.A. Batlinger, w. Podolny' Jr.r and M.J. Abra-hams. À Report on the Design and constructionof segrflental Prestressêd concrete Brldges 1nWesterá EuroPe--Ig?7. FIIWA' U.S. Department oflransportatlon' JUIY 1978.
4. H.P. Koretzky anal A.T. Tscherneff. FinalReport--Rêsearch Project No. 72-9 on the Designof an ExPerimental Posttensioned Segmentalconcrete Box Girder Bridge. Publication I18.Pennsylvania Department of Transportation,Harrisburg, Sept. 1974.
5. H.P. Koretzky and P.H. Fuo. Letter survey on
'State of the Àrt In the U.S.A. of Segnentalconcrete Box Gir¿ler Brldges.¡ Publicatlon 114.Pennsylvania DePartment of Transportation,Harrisburg' JuJ-Y 1974.
6. Prestressed Concrete Instltuter Joint PCf-PTfConunittee on Segmental construction. Recorn-
neniled Practice for Precast PosttensLoneal Seg-mental Construction. Prestresseil Concretefnstitute ilournalr vol. 27, No. Ir Jan.-Fêb.1982' pP. 14-61.
7. Prestressed Concrete Instituter aritlge CoÍunlt-têe. Tentative Design anat construction Speci-fications for Precast segrnental Box GirderBridges. Prestressed Concrete Institute Jour-nal, Vol. 20' No. 4' July-Aug. L975. PP. 34-42.
8. stanilaril specifications for Highway Brldlges'Ilth ed. AASHTo' washington' D.c., 1973.
9. Design Manual. Publlcation 15. PennsylvaniaDepartnent of Transportation, Harrisburgr 1973,Part 4: structures.
I0. P. Zia and W.D. It{ccee. Torsion Design of Pre-stresseil Concrete. Prestresseal Concrete Insti-tute Journal' vol. 19' No. 2, üarch-Àpr1l 1974'pp. 46-64.
11. P.C. ¡loffman, R.M. Mcclure' and I¡.H. l{est. Tem-perature Studies for an Experinental SegrnentalBridge. Interim Report. Pennsylvania Transpor-tation Instituter Pennsylvania State Univer-sity, University Park' June 1980.
12. P.C. Hoffrnanr R.!¡1. Mcclure, and H.H. $lest' Tem-perature Study of an ExperÍ¡nenËaI Segnentalconcrete Briilge. Prestressed Concrete fnstituteJournal, VoI.28, No.2' r¡târch-April 1983r pp.78-97.
13. R.l'l. It{cclure and H.H. I{est. Field Testing onan Experinental Segmental Bridge. Interin Re-port. Pennsylvania TransPortation InstitutetPennsylvania State University, University Park,June 1980.
14. H.H. West and R.M. l4cc1ure. FuIl scale Testingof a Prestresseil Concrete Segrnental Bridge'Proc.r Internatíonal conference on short- anal
Medlun-Span Bridgesr Torontor Ontario, Canada,4u9.1982.
15. R.M. ucclure, H.H. west, and M. Abdel-Halirn.overloail Testing of an Experinental seg¡nentalBridge. Interin Report. Pennsylvania Trans-portation fnstitute, Pennsylvania State Univer-sity, university Park, JuIY 1982.
16. À.H. Nilson. Design of Prestressed Concrete'Wileyr New York, 1978.
L7. R.M. McCIurer D.B. An¿lersonr and T.E. l¡lcDevitt'Laboratory TesÈing of Segnents for an Experi-¡nental Bridge. rnterim Report. PennsylvaniaTransportation Instituter Pennsylvania StateUniversity, University Park' Feb. 1980.
Pubticøtion of this papet sponsored by Committee on Concrete Bridges.
Notice: The contents oÍ this pdper reflect the views of the authors, who arcresponsible for the facß ønd the accuracy olthe dnta, The contents do notnecessarily reflect the official víews or policíes of the sponsors'