Embed Size (px)
Citation preview
ENDANGERED SPECIES RESEARCHEndang Species Res
Vol. 34: 449–462, 2017https://doi.org/10.3354/esr00859
Published December 21
INTRODUCTION
The maned wolf Chrysocyon brachyurus is a Neo -tropical canid that is restricted to open areas in theCerrado, Chaco and Pampas regions of Argentina,
Bolivia, Brazil, Paraguay, Peru and Uruguay (Dietz1985, Queirolo et al. 2011). It is classified as NearThreatened on the IUCN Red List, with ~17 000mature individuals estimated in the current globalpopulation (Paula & DeMatteo 2016). The major
© N.M., M.C., S.G., L.H.E., J.M.B.D., M.D.B., and outside the USA,the US Government 2017. Open Access under Creative Commonsby Attribution Licence. Use, distribution and reproduction areunrestricted. Authors and original publication must be credited.
Publisher: Inter-Research · www.int-res.com
*Corresponding author: [email protected]
Maned wolves retain moderate levels of geneticdiversity and gene flow despite drastic habitat
fragmentation
Natalia Mannise1,*, Mariana Cosse1, Susana González1,2, Louise H. Emmons3, José Mauricio Barbanti Duarte4, Marcelo D. Beccaceci5, Jesús E. Maldonado6
1Genética de la Conservación, Departamento de Biodiversidad y Genética, Instituto de Investigaciones Biológicas Clemente Estable (IIBCE), Montevideo 11600, Uruguay
2Sección Genética Evolutiva, Facultad de Ciencias, Universidad de la República (UdelaR), Montevideo 11400, Uruguay3Department of Vertebrate Zoology, National Museum of Natural History, Smithsonian Institution, Washington, DC 20013, USA4Núcleo de Pesquisa e Conservação de Cervídeos, Departamento de Zootecnia, Universidade Estadual Paulista, Jaboticabal,
14884-900 SP, Brazil5Ministerio de Ambiente y Desarrollo Sustentable, Buenos Aires 1004, Argentina
6Center for Conservation Genomics, Smithsonian Conservation Biology Institute, National Zoological Park, Washington, DC 20008, USA
ABSTRACT: The maned wolf Chrysocyon brachyurus is the largest South American canid andcategorized as Near Threatened on the IUCN Red List. The major threat to conservation efforts isthe drastic reduction of suitable habitat for the species. A large portion of its range has been con-verted into farm and ranch lands as well as urban areas. To better understand the impact thatthese anthropogenic activities are having over the remaining populations across their current dis-tribution range, we evaluated patterns of genetic variability and differentiation between them. Wealso compared these results with those obtained from captive maned wolves in order to makeproper ex situ recommendations. We cross-amplified 12 microsatellite loci in maned wolf samplescollected throughout their range (from Argentina, Brazil, Uruguay and Bolivia) and from captivestocks (from captive breeding centers and zoos in Brazil, Argentina and the USA). We found thatwild populations retain moderate levels of genetic variability compared with other microsatellitestudies on wild canids, and our structure analysis revealed 2 genetic clusters in wild samples, oneof which included samples exclusively from Bolivia. This cluster could represent a different man-agement unit with conservation priority. The captive stock population showed higher levels ofgenetic variability, with the ones from Brazil being the most genetically diverse stock. The USAstock showed strong genetic differences with all other groups. This is the first study to examinethe patterns of genetic diversity of both wild and captive populations of maned wolves. Theseresults should be incorporated into further population viability assessments and in the ManedWolf Species Survival Plan.
KEY WORDS: Canids · Population genetics · Microsatellite loci · Noninvasive genetic analysis
OPENPEN ACCESSCCESS
Endang Species Res 34: 449–462, 2017
threat to its conservation is the loss of suitable habitatbecause a large portion of its distribution has beenconverted into farm and ranch lands (De Paula et al.2008). Currently, anthropogenic changes have affectedmaned wolf distribution patterns and re sulted indemographic contractions and expansions (De Paula &DeMatteo 2016). Due to their large home ranges andtheir mainly solitary behavior, maned wolves are gen-erally found in low densities throughout their range(Rodden et al. 2004). Other human-related threatsinclude urbanization and mortality from road killsand diseases transmitted by domestic dogs (Roddenet al. 2004, Deem & Emmons 2005, De Paula et al.2008, De Paula & DeMatteo 2016). Together, thesefactors are influencing the decline and reduction ofthe current global population, with subsequent demo -graphic and genetic instability resulting in local pop-ulation extinction (De Paula et al. 2008).
Analysis of genetic variation can provide essentialinformation about population history and demogra-phy, which is relevant for endangered species man-agement (Bos et al. 2008). The first genetic studies onmaned wolves were conducted mostly on Brazilianpopulations, reporting levels of heterozygosity around0.7 and no genetic signatures of geographic structure(Rodrigues et al. 2006, Salim et al. 2007, Fontoura-Rodrigues et al. 2008, Prates 2008, Do Passo Ramalho2011, Lion et al. 2011, Do Passo Ramalho et al. 2014).
Those studies were done on a local scale, but toproperly assess the impact of more recent anthropo -genic pressure, evaluate genetic structure, and com-pare genetic diversity among different maned wolfpopulations, a broad-scale sampling across the spe-cies’ range is required (Fontoura-Rodrigues & Eizirik2014). A recent study looking at maned wolf phylo-geographic patterns based solely on mtDNA (Gonzá -lez et al. 2015a) found moderate levels of haplotypeand nu cleotide diversity, and genetic structure waspartitioned into 4 groups. This suggested that manedwolves underwent demographic fluctuations due tochanges in climate and habitat during the Pleistoceneglaciation period approximately 24 000 yr beforepresent (BP) (González et al. 2015a). However, theauthors were unable to make definitive conservationmanagement recommendations because they lackedevidence from nuclear markers, and they recom-mended that future genetic studies should focus onincreasing the number of individuals and popula-tions sampled with additional variable nuclear mark-ers. Because González et al. (2015a) based theirstudy on single-locus evidence from maternally in -herited mtDNA, it was not possible to assess whethermembers of the different mitochondrial genetic line-
ages interbreed with each other. Microsatellite mark-ers are among the markers of choice to study fine-scale variation in endangered species populations.They are commonly used to assess population geneticstructure and they can also provide valuable infor-mation to define management units for short-termmanagement of populations (Moritz 1994, 1995, 1999,Hedrick 2001, Wayne & Morin 2004, Palsbøll et al.2007). In the present study, we aimed to evaluate thecurrent patterns of genetic structure in maned wolfwild populations by including samples from wild ani-mals throughout the species range with a suite of 12polymorphic microsatellite loci. We compared ourresults with those obtained in a previous study basedon mtDNA (González et al. 2015a). We also analyzedsamples from captive maned wolves to comparethem to the wild population. Our results are pertinentfor design guidelines for the genetic management ofboth wild and captive maned wolves.
MATERIALS AND METHODS
Sampling
We collected 61 samples from wild Chrysocyonbrachyurus from Argentina, Brazil, Bolivia and Uru -guay (Table 1, see Fig. 1A). In Brazil, samples werecollected from captive animals that were taken fromthe wild from known capture localities (Table 1). Weincluded 2 Uruguayan tissue samples from animalsthat were killed by poachers (specimens depositedin the National Museum of Natural History, Monte -video). One was from an individual killed in 1989 inRío Negro Department, and the other was from CerroLargo Department in 2006. A few days after thepoaching episode in the Department of Cerro Largo,a scat was collected in the same locality (Mannise etal. 2012). Most samples from Argentina were tissuesfrom freshly road-killed animals, and samples fromBolivia were either blood from animals captured inthe wild or fecal samples collected over several sam-pling surveys (Emmons 2012); all Bolivian sampleswere from the same small population of a few familygroups (Table 1).
A total of 27 samples from captive maned wolveswere collected from hair (n = 16) and blood (n = 11) ofanimals kept in different zoos and captive breedingcenters. Based on the sample number and exchangeof breeding stock between different zoos within acountry or region, we defined 3 captive stocks: Ar -gen tina (La Plata and Buenos Aires zoos, n = 10),Brazil (Riberao Preto and Belo Horizonte zoos, n = 11)
450
Mannise et al.: Moderate genetic diversity of maned wolves
and USA (National Zoological Park [NZP], Smithson-ian Institution, Front Royal, VA, n = 6). The NZP sam-ples were from a family group composed of both par-ents (descendants of animals captured in Brazil) and4 offspring (N. Songsasen, pers. comm.). Most of theBrazilian stock originated from the central and south-eastern areas of the country (Vanstreels & Pessutti2010).
DNA extractions and genotyping
DNA was extracted from hair, blood and tissuesamples following the protocol of González et al.(2015b) or using a DNeasy kit (Qiagen). Fecal DNAextractions were performed using a QIAamp DNAStool Mini Kit (Qiagen) with sterile materials and fil-tered pipette tips in a room dedicated for DNA ex -traction from low-quality samples and separate fromPCR product contamination. Extraction negative con-trols and no-template PCR controls were used ineach reaction.
Twelve microsatellite loci, originally designed fordomestic dog, were selected on the basis of polymor-phism level, reliable amplification and easy scorabil-ity in several canid species (Franco Berriel 2004, Smithet al. 2006, Salim et al. 2007, Fontoura-Rodrigues etal. 2008, Lion et al. 2011, Do Passo Ramalho et al.2014). Based on annealing temperature, fragmentsize and fluorochrome label, we designed 4 PCR mul-tiplexes. Each reaction consisted of a total volume of20 µl; PCR reactions contained 2× ImmoMix (Bioline),0.75 µM of each primer and 80 ng of genomic DNA(McKelvey 2008). The thermal profile included an
initial denaturation step of 95°C for 10 min, followedby 35 cycles of 95°C for 30 s, annealing temperaturefor 1 min, 72°C for 1 min, and finally an extensionstep of 72°C for 15 min. Amplified products were runwith a LIZ 500 size standard on an ABI PRISM 3100automated sequencer. Migration was performed in a22 cm capillary array using POP4 polymer (AppliedBiosystems) with the following parameters: 100 A,15 kV, and 60°C for 35 min.
Fragment size was examined using GENESCANANALYSIS® (Applied Biosystems) software at theCenter for Conservation Genomics, SmithsonianConservation Biology Institute, NZP. Genotypingwas conducted using GENOTYPER (Applied Biosys-tems) and GENEMARKER v.1.75 (SoftGenetics).
For noninvasive samples, we conducted multiplereplicates for each sample and locus following amulti-tube approach to identify and minimize geno-typing errors such as allelic dropout and false alleles(Navidi et al. 1992, Taberlet et al. 1996, 1999). Weused duplicated genotypes for heterozygotes andtriplicated for homozygotes.
Genetic analyses
Genotyping errors caused by the presence of nullalleles, allelic dropout or stutter were screened usingMICRO-CHECKER software (Van Oosterhout et al.2004) following Brookfield’s (1996) estimation. Stan-dard genetic parameters were estimated for the captive and wild sample datasets independently. Weas sessed allele and genotype frequencies usingGEN E POP (Raymond & Rousset 1995). Polymorphic
451
Country Locality Geographic coordinates Sample type (n) Hair Blood Tissue Feces
Argentina Chaco 26° 12’ to 26° 47’ S, 59° 43’ to 60° 47’ W 2 6 Santa Fe 30° 14’ S, 60° 47’ W 1 Santiago del Estero 27° 49’ S, 63° 08’ W 1 Formosa 25° 09’ S, 59° 35’ W 2
Bolivia Los Fierros camp, 14° 33’ S, 60° 55’ W 5 23 Noel Kempff Mercado National Park Mangabalito 13° 47’ S, 60° 32’ W 1 El Refugio 14° 47’ S, 61° 02’ W 8
Brazil Franca 20° 32’ S, 47° 21’ W 1 3 Chapada Do Sul 18° 27’ S, 52° 36’ W 1 Yatai 17° 05’ S, 51° 26’ W 1 Gaia 20° 11’ S, 47° 25’ W 3
Uruguay Río Negro Department 32° 35’ 45’’ S, 58° 08’ 46’’ W 1 Cerro Largo Department 32° 14’ 43’’ S, 54° 03’ 30’’ W 1 1
Table 1. Samples obtained from wild populations of Chrysocyon brachyurus from Argentina, Bolivia, Brazil and Uruguay. n = number of samples
Endang Species Res 34: 449–462, 2017
information content (PIC), non-exclusion probabilityfor parent pairs (NE-PP) and for the identity (NE-I)and sibling identity (NE-SI), were calculated byCERVUS v.3.0 (Marshall et al. 1998). Allelic richness(AR) was computed by the rarefaction method withHP-RARE software (Kalinowski 2005). This method isrecommended for standardizing the AR for compar-ing populations of unequal sample sizes (Kalinowski2005). In order to compare the genetic variability indifferent populations, a t-test for unpaired popula-tions was calculated using AR and observed hete -rozygosity (Ho) values in Gnumeric Spreadsheetv.1.10.16 (www.gnumeric.org). We conducted testsfor Hardy-Weinberg equilibrium (HWE) and linkagedisequilibrium (LD) using GENEPOP (Raymond &Rousset 1995). Genotypic disequilibrium was testedusing Bonferroni corrections (Rice 1989).
Genetic structure and differentiation
Wild populations
We explored the pattern of genetic structure usingthe Bayesian clustering method implemented inSTRUCTURE software (Pritchard et al. 2000). Thiswidely used approach assigns individuals into K clus-ters in a way that minimizes deviations from HWEand LD within each cluster. The program uses aMarkov chain Monte Carlo (MCMC) procedure toestimate the posterior probability that the data fit thehypothesis of K clusters. The program also calculatesthe fractional membership of each individual in eachcluster (q). We tested K ranging from 1 to 10 with 5replicates using the admixture model, a burn-inperiod of 10 000 and 200 000 iterations for MCMCruns. We conducted the STRUCTURE analysis with 2datasets: one included all individuals from Bolivia,and the other excluded individuals from Bolivia thatshowed relatedness coefficients (r) higher than 0.25between each other. The relatedness coefficients werecalculated with ML-Relate software (Kalinowski et al.2006). The most likely number of clusters was selectedusing the posterior probability of the data (lnP(K))and the second-order rate of change of log probabil-ity (Delta K) (Evanno et al. 2005) in the programSTRUCTURE HARVESTER v.0.6.8 (Earl & vonHoldt2012). The differentiation between clusters was eval-uated with FST and its statistical significance by FSTATv.2.9.3 (Goudet 1995). We estimated the ef fectivenumber of migrants between clusters according toSlatkin (1985) by the private allele method usingGENEPOP v.4.0.10 (Raymond & Rousset 1995) and
also indirectly calculated it with Wright’s FST estima-tor (Wright 1943, Cegelski et al. 2003). To visualizethe direction of gene flow, we used the probabilitiesof each individual belonging to one cluster or anotherfrom STRUCTURE and used them to construct a piechart per individual and plotted them on a map withgeographic coordinates using QGis v.1.8.0 software(www.qgis.org).
Shared allele distances (Chakraborty & Jin 1993,Jin & Chakraborty 1994) were computed between in -dividuals and were used to build a neighbor-joining(NJ) tree using the software POPULATIONS v.1.2.32(Langella 2002), with 1000 bootstrap replications. Thismethod has been used to identify subpopulations andlocate unknown individuals to their subpopulation oforigin in other carnivore species (Manel et al. 2004).
To evaluate the correlation between geographicand genetic distances, we applied a Mantel (1967)test. We used GENEALEX6 to compute both distancematrices and a Mantel test to assess the correlationbetween the 2 matrices (Peakall & Smouse 2006).
Within clusters, we analyzed the inbreeding indexFIS and diversity within individuals (1 − Qintra) andamong individuals within samples (1 − Qinter) usingGENEPOP (Raymond & Rousset 1995).
Bolivian samples
We used GENECAP (Wilberg & Dreher 2004) toidentify capture histories and to determine the num-ber of maned wolves that may have been resampledfrom multiple scats. The samples collected in Boliviawere mostly from feces (81%), and it is possible thatthe same individual may be recaptured. Therefore,the software detects matching genotypes with amatch probability of 0.01 and assuming that individ-uals could be siblings (Wilberg & Dreher 2004). Thesibling probability of identity and the Hardy-Wein-berg probability of identity were assessed. Siblingprobability values <0.05 are considered acceptable(Woods et al. 1999).
Captive stocks
FST among captive stocks and its statistical signifi-cance were estimated with ARLEQUIN v.3.11 (Ex cof -fier & Lischer 2010). The inbreeding coefficients foreach stock and the overall FIS and FIT respectivelywere estimated using GENEPOP (Raymond & Rous-set 1995). The contribution of each stock to the globalgenetic diversity was assessed by the methods de -
452
Mannise et al.: Moderate genetic diversity of maned wolves
scribed by Caballero & Toro (2002) and Petit et al.(1998). The method implemented in Caballero & Toro(2002) relies on maintaining the maximum globalgene diversity, minimizing the average global molec-ular co-ancestry, whereas the method in Petit et al.(1998) evaluates the AR contribution of each stock tothe overall dataset. Both contributions were com-puted using MOLKIN 3.0 (Gutiérrez et al. 2005).
Relatedness coefficients and pedigree relationshipsbetween animals as well as mean relatedness coeffi-cients per stock and their standard deviations werecalculated using the software ML-RELATE (Kalinow -ski et al. 2006).
We assessed the assignment of captive samplesinto wild populations with STRUCTURE (Pritchard etal. 2000). This analysis was conducted for the locithat successfully amplified and that were under link-age equilibrium for both datasets. The number of Kranged from 1 to 7 with 5 replicates, 10 000 burn-inperiod and 200 000 iterations for MCMC. The mostlikely number of clusters was selected using themethodology described above for wild populations.
RESULTS
Genetic analysis of Bolivian samples
A total of 23 individuals were identified out of the31 scat and 6 blood samples collected in Bolivia. Bothsample types were included in the analysis becausewe also wanted to verify that the scats included in thegenetic analysis were from different individuals andto eliminate those that could belong to a previouslycaptured maned wolf. The sibling probability ofidentity and the Hardy-Weinberg probability of iden-tity were P(ID)SIBS = 3.1 × 10⁻⁴ and P(ID) = 1.14 × 10⁻⁹
re spectively. For the remaining analysis, we only usedthe 23 samples identified as different individuals.
Genetic diversity and differentiation in the wild population
Of the 12 microsatellite loci screened, 1 locus(FH2328) showed lower amplification success in fecalDNA samples and was excluded from further analy-sis, leaving 11 polymorphic microsatellite loci for theremaining analyses of the wild population. The al -lelic diversity and PIC values for each locus on bothclusters are shown in Table 2. The mean diversity inthe 11 analyzed loci was 11.82 (SD = 6.997). Theglobal PIC value was 0.741 (SD = 0.178) and overall
453
Loc
us
R
ed c
lust
er
G
reen
clu
ster
k
PIC
Ho
H
e
A
R
F
IS
N
E-I
NE
-SI
NE
-PP
k
P
IC
H
o
H
e
A
R
F
IS
NE
-I
N
E-S
I
NE
-PP
FH
2140
6
0
.707
0.
5
0.
762
5.
355
0.
349
0
.103
0.
403
0.
288
1
2
0.84
0.86
4
0.87
5
9.35
8
0.01
4a
0.
036
0.33
1
0
.116
FH
2137
8
0
.782
0.
583
0.
841
7.
746
0.
316a
0.
061
0.
363
0.
186
1
7
0.89
6
0.78
3
0.92
4 1
1.76
9
0.15
6a
0.
017
0.30
2
0
.06
F
H25
35
8
0.6
28
0.45
0.69
2
6.06
1
0.35
6
0.1
52
0.45
1
0.36
6
9
0.6
81
0.55
6
0.73
7
5.68
9
0.25
a
0
.119
0.41
8
0
.321
RE
N10
5
3
0
.505
0.
563
0.
603
2.
994
0.
069a
0.
252
0.
521
0.
555
6
0
.706
0.
538
0.
763
5.
138
0.
299
0.1
06
0.
402
0.3
01P
EZ
19
3
0.2
27
0.13
3
0.24
8
2.87
1
0.47
2a
0.59
1
0.77
8
0.78
1
6
0.6
9
0.3
53
0.75
6
5.28
1
0.54
1
0
.115
0.41
2
0
.315
FH
2054
5
0
.608
0.
471
0.
686
4.
728
0.
321a
0.
17
0.
459
0.
411
5
0
.625
0.
647
0.
706
4.
294
0.
086a
0.16
0.
447
0.4
13R
EN
169
3
0.1
49
0.05
6
0.16
2.46
8
0.66
a
0.7
19
0.85
2
0.85
5
2
0.1
28
0
0.14
1.88
6
1
0
.754
0.87
0
.884
FH
2848
7
0
.743
0.
467
0.
802
6.
397
0.
427
0
.083
0.
383
0.
241
7
0
.777
0.
556
0.
821
5.
788
0.
328
0.0
67
0.
364
0.2
1
FH
2561
9
0
.793
0.
455
0.
853
9
0.
479
0
.056
0.
357
0.
17
2
4
0.93
5
0.70
4
0.95
6 1
4.94
3
0.26
8a
0.
007
0.28
3
0
.026
FH
2226
5
0
.57
0
.333
0.
646
4.
464
0.
493
0
.196
0.
487
0.
451
1
2
0.76
5
0.79
2
0.79
9
8.68
4
0.00
9a
0.
064
0.37
5
0
.179
AH
TK
253
5
0
.414
0.
176
0.
451
4.
401
0.
616
0
.34
0
.616
0.
576
8
0
.367
0.
25
0.
382
4.
964
0.
35a
0
.399
0.66
2
0
.603
Ove
rall
5.6
4
0.55
7
0.38
1
0.61
3
5.14
0.29
7 5
.4 ×
10−
9 4
.3 ×
10−
4 3
.2 ×
10−
5
9.8
2 0
.674
0.
549
0.
714
7
.07
0
.142
1.2
7 ×
10−
12 6
.89
× 1
0−5
4 ×
10−
8
1 −
Qin
tra
0.3
46
0.7
211
− Q
inte
r
0
.492
0
.841
a Loc
i u
nd
er H
ard
y-W
ein
ber
g e
qu
ilib
riu
m
Tab
le 2
. Gen
etic
div
ersi
ty o
f th
e 11
mic
rosa
tell
ite
loci
for
the
2 C
hry
socy
on b
rach
yuru
sg
enet
ic c
lust
ers
det
ecte
d. T
he
red
clu
ster
incl
ud
ed 1
7 sa
mp
les
and
the
gre
en c
lus-
ter
30 s
amp
les.
k=
nu
mb
er o
f all
eles
, PIC
= p
olym
orp
hic
info
rmat
ion
con
ten
t, H
o=
ob
serv
ed h
eter
ozyg
osit
y, H
e=
exp
ecte
d h
eter
ozyg
osit
y, A
R =
all
elic
ric
hn
ess,
FIS
= in
-b
reed
ing
in
dex
, N
E-I
= n
on-e
xclu
sion
pro
bab
ilit
y fo
r th
e id
enti
ty,
NE
-SI
= n
on-e
xclu
sion
pro
bab
ilit
y fo
r si
bli
ng
id
enti
ty,
NE
-PP
= n
on-e
xclu
sion
pro
bab
ilit
y fo
r p
aren
t p
air,
1 −
Qin
tra
= d
iver
sity
wit
hin
ind
ivid
ual
s, 1
− Q
inte
r =
div
ersi
ty a
mon
g in
div
idu
als
wit
hin
sam
ple
s
Endang Species Res 34: 449–462, 2017454
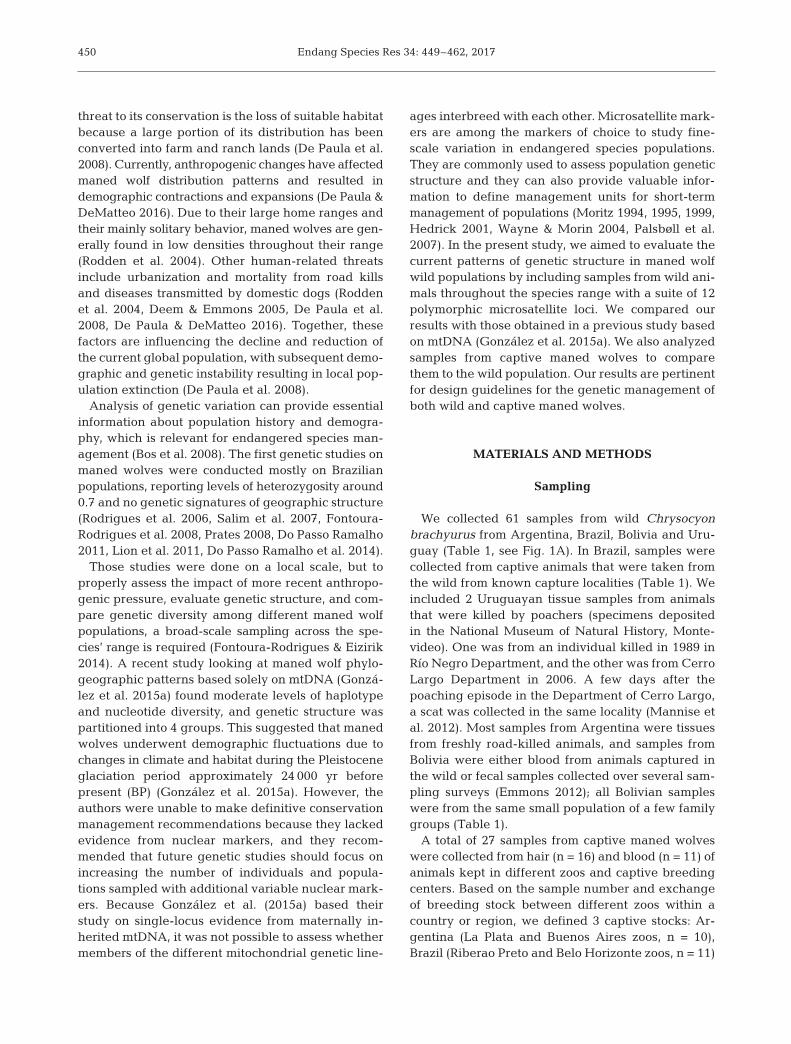
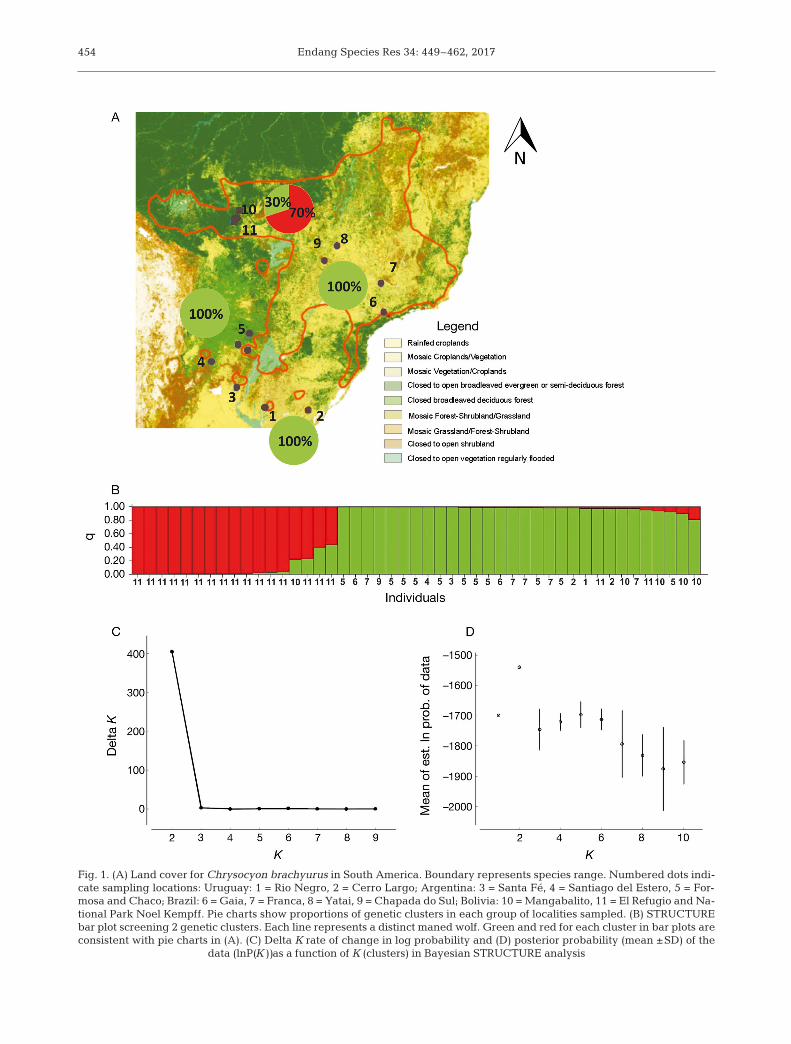
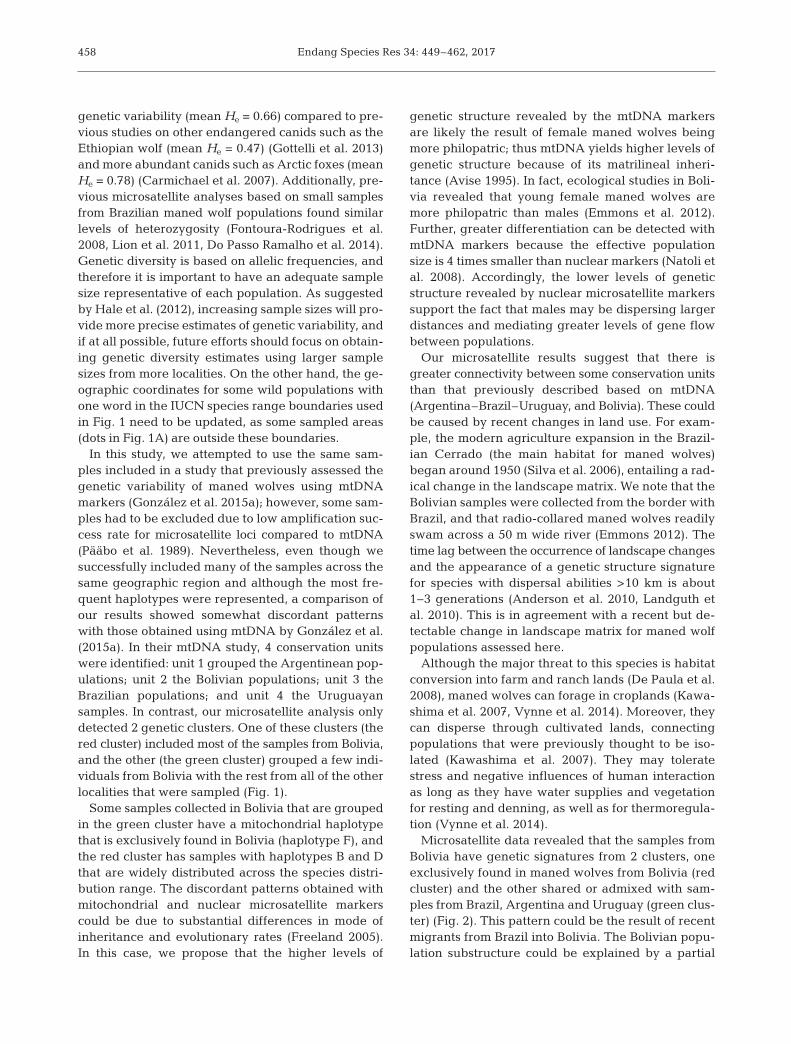
Fig. 1. (A) Land cover for Chrysocyon brachyurus in South America. Boundary represents species range. Numbered dots indi-cate sampling locations: Uruguay: 1 = Rio Negro, 2 = Cerro Largo; Argentina: 3 = Santa Fé, 4 = Santiago del Estero, 5 = For-mosa and Chaco; Brazil: 6 = Gaia, 7 = Franca, 8 = Yatai, 9 = Chapada do Sul; Bolivia: 10 = Mangabalito, 11 = El Refugio and Na-tional Park Noel Kempff. Pie charts show proportions of genetic clusters in each group of localities sampled. (B) STRUCTUREbar plot screening 2 genetic clusters. Each line represents a distinct maned wolf. Green and red for each cluster in bar plots areconsistent with pie charts in (A). (C) Delta K rate of change in log probability and (D) posterior probability (mean ±SD) of the
data (lnP(K))as a function of K (clusters) in Bayesian STRUCTURE analysis
Mannise et al.: Moderate genetic diversity of maned wolves
ex pected heterozygosity (He) was 0.699 (SD = 0.160).Most of the loci showed departures from HWE, andsome comparisons in the LD test presented slightdeviations after Bonferroni corrections. These de -partures were likely due to the Wahlund effect(Allendorf & Lui kart 2007). Therefore, we subse-quently analyzed each of the 2 genetic clusters thatwere identified in the STRUCTURE analysis sepa-rately (see next paragraph and Table 2).
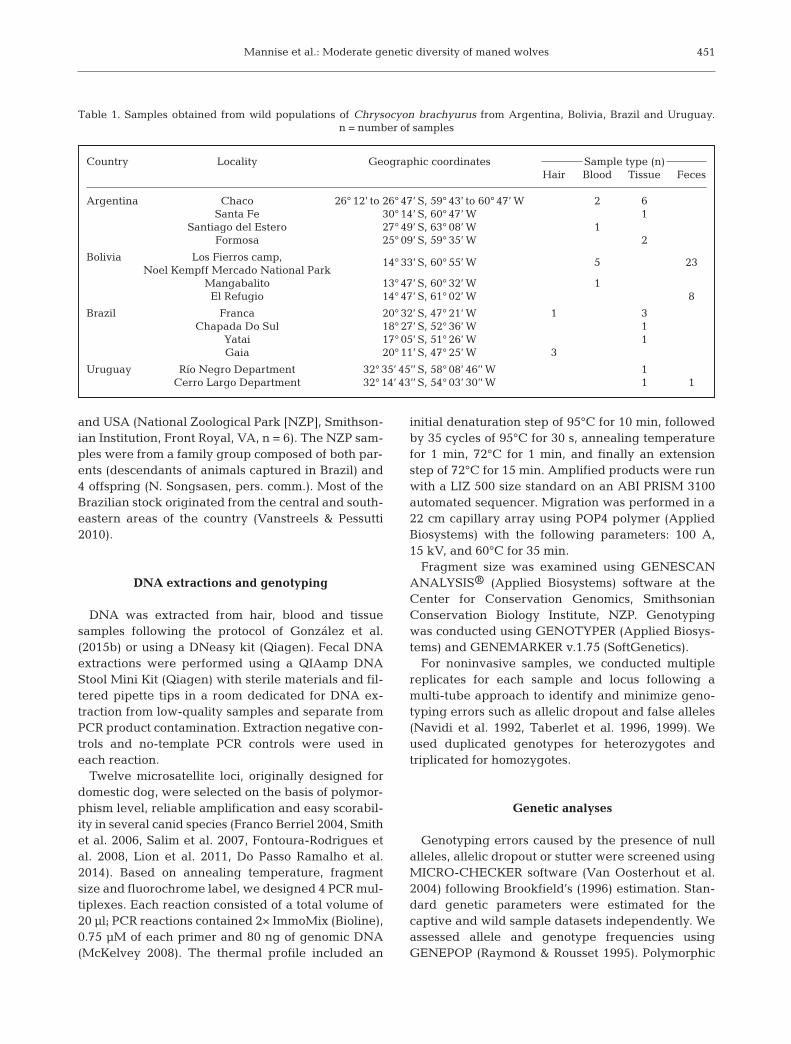
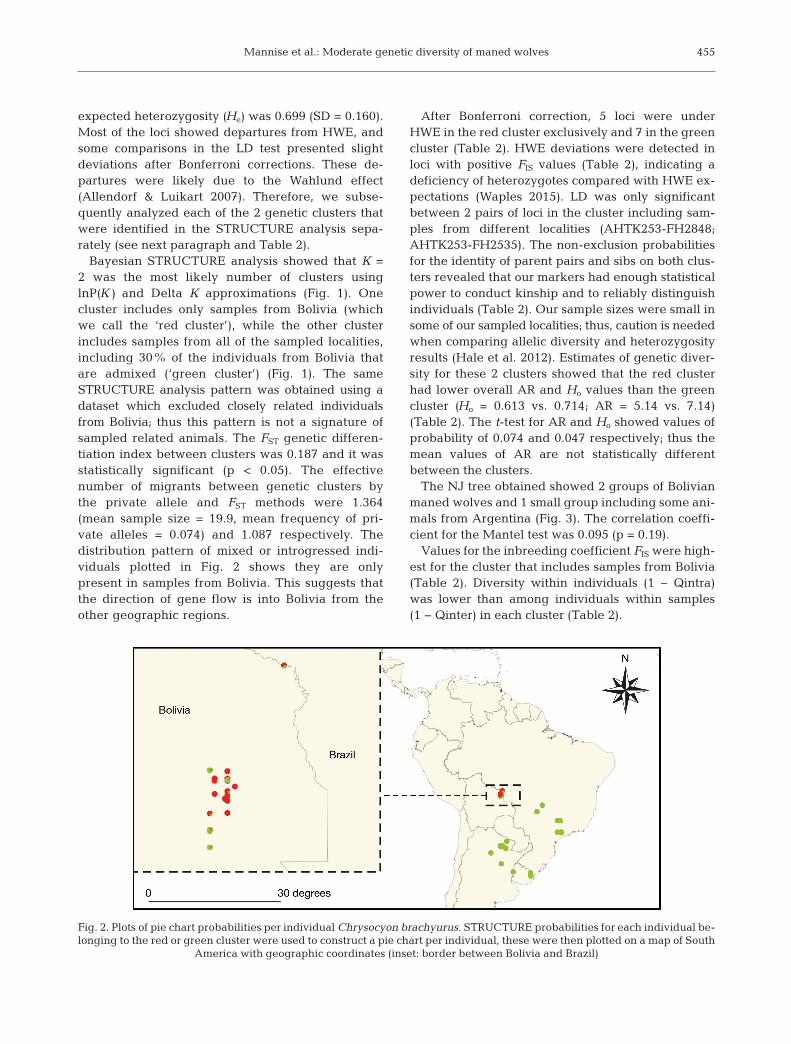
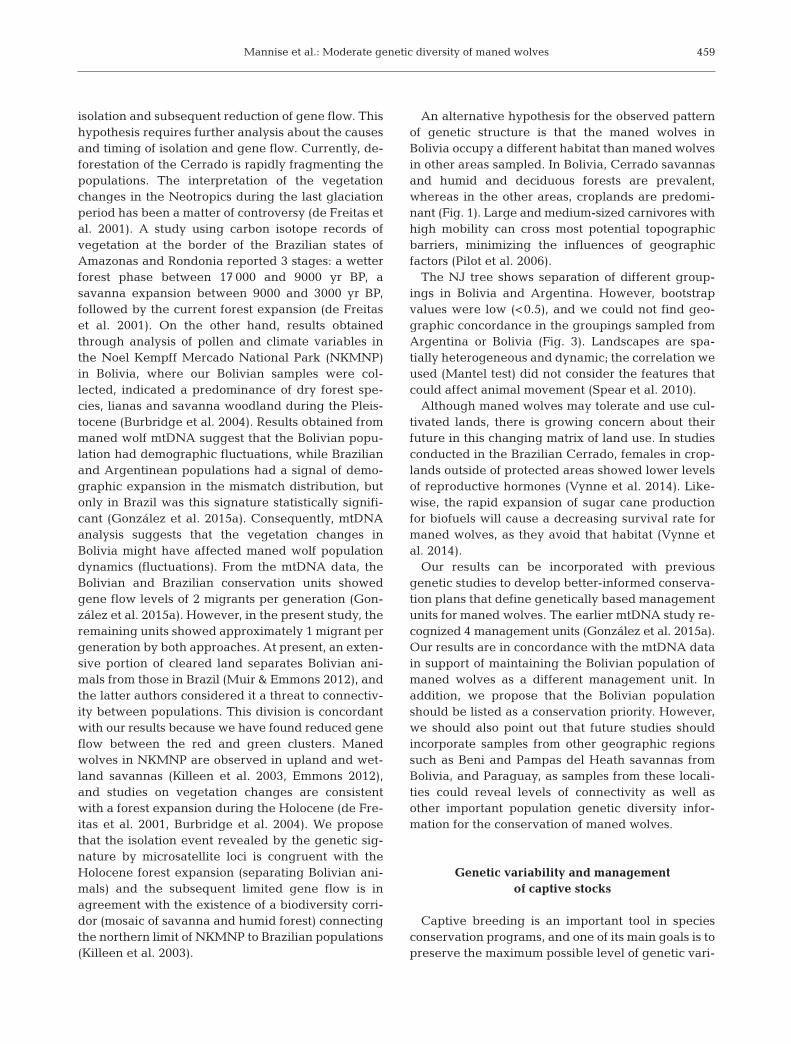
Bayesian STRUCTURE analysis showed that K =2 was the most likely number of clusters usinglnP(K) and Delta K ap proximations (Fig. 1). Onecluster includes only samples from Bolivia (whichwe call the ‘red cluster’), while the other clusterincludes samples from all of the sampled localities,including 30% of the individuals from Bolivia thatare admixed (‘green cluster’) (Fig. 1). The sameSTRUCTURE analysis pattern was obtained using adataset which excluded closely related individualsfrom Bolivia; thus this pattern is not a signature ofsampled related animals. The FST genetic differen-tiation index be tween clusters was 0.187 and it wasstatistically significant (p < 0.05). The effectivenumber of migrants between gen etic clusters bythe private allele and FST methods were 1.364(mean sample size = 19.9, mean frequency of pri-vate alleles = 0.074) and 1.087 re spectively. Thedistribution pattern of mixed or introgressed indi-viduals plotted in Fig. 2 shows they are onlypresent in samples from Bolivia. This suggests thatthe direction of gene flow is into Bolivia from theother geographic regions.
After Bonferroni correction, 5 loci were underHWE in the red cluster exclusively and 7 in the greencluster (Table 2). HWE deviations were de tected inloci with positive FIS values (Table 2), in dicating adeficiency of he terozygotes compared with HWE ex -pectations (Waples 2015). LD was only significantbetween 2 pairs of loci in the cluster including sam-ples from different localities (AHTK253-FH2848;AHTK253-FH2535). The non-exclusion probabilitiesfor the identity of parent pairs and sibs on both clus-ters revealed that our markers had enough statisticalpower to conduct kinship and to reliably distinguishindividuals (Table 2). Our sample sizes were small insome of our sampled localities; thus, caution is neededwhen comparing allelic diversity and heterozygosityre sults (Hale et al. 2012). Estimates of genetic diver-sity for these 2 clusters showed that the red clusterhad lower overall AR and Ho values than the greencluster (Ho = 0.613 vs. 0.714; AR = 5.14 vs. 7.14)(Table 2). The t-test for AR and Ho showed values ofprobability of 0.074 and 0.047 respectively; thus themean values of AR are not statistically differentbetween the clusters.
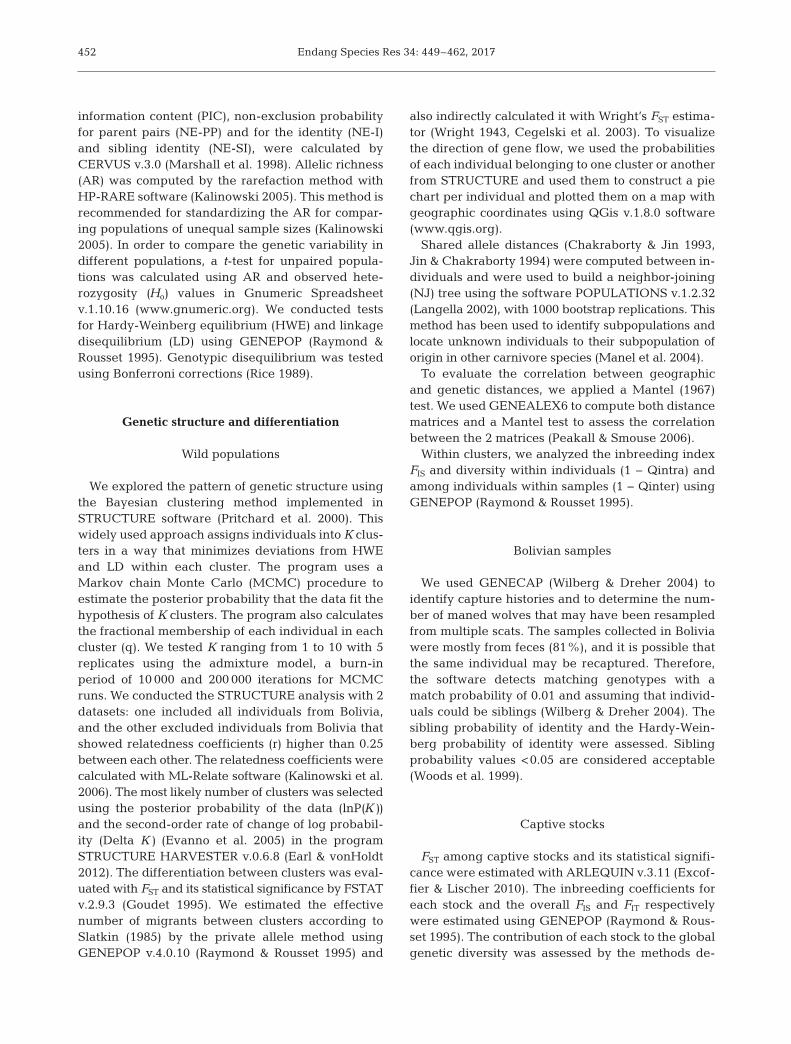
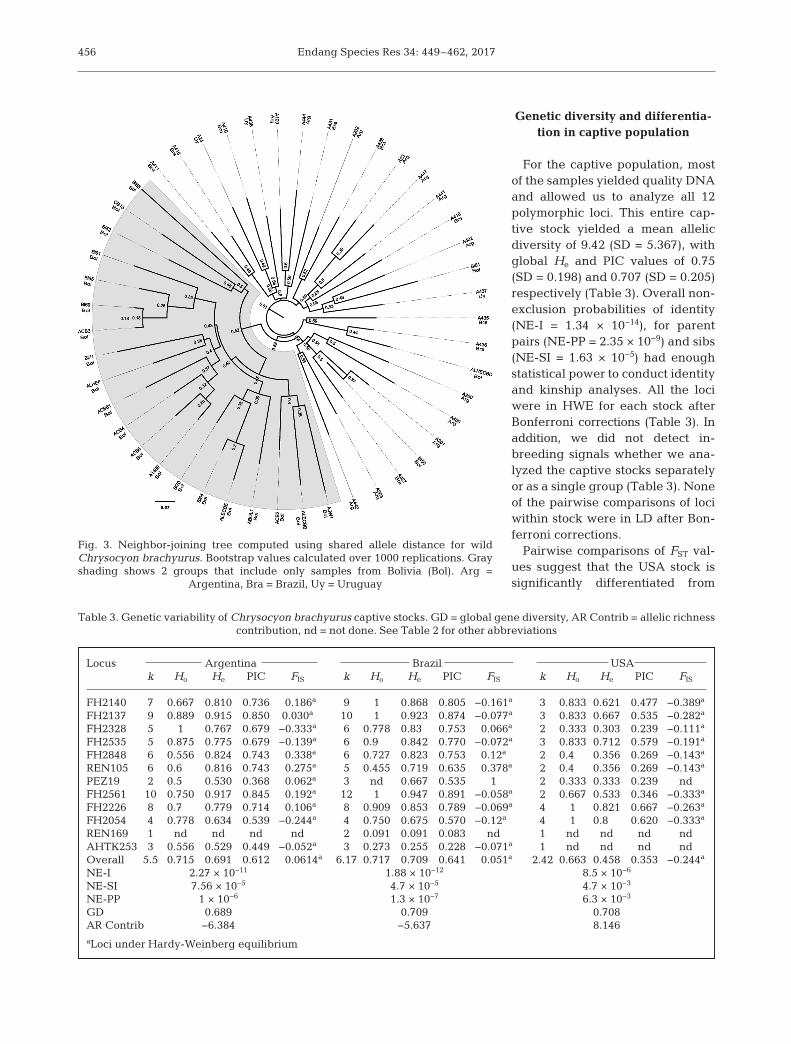
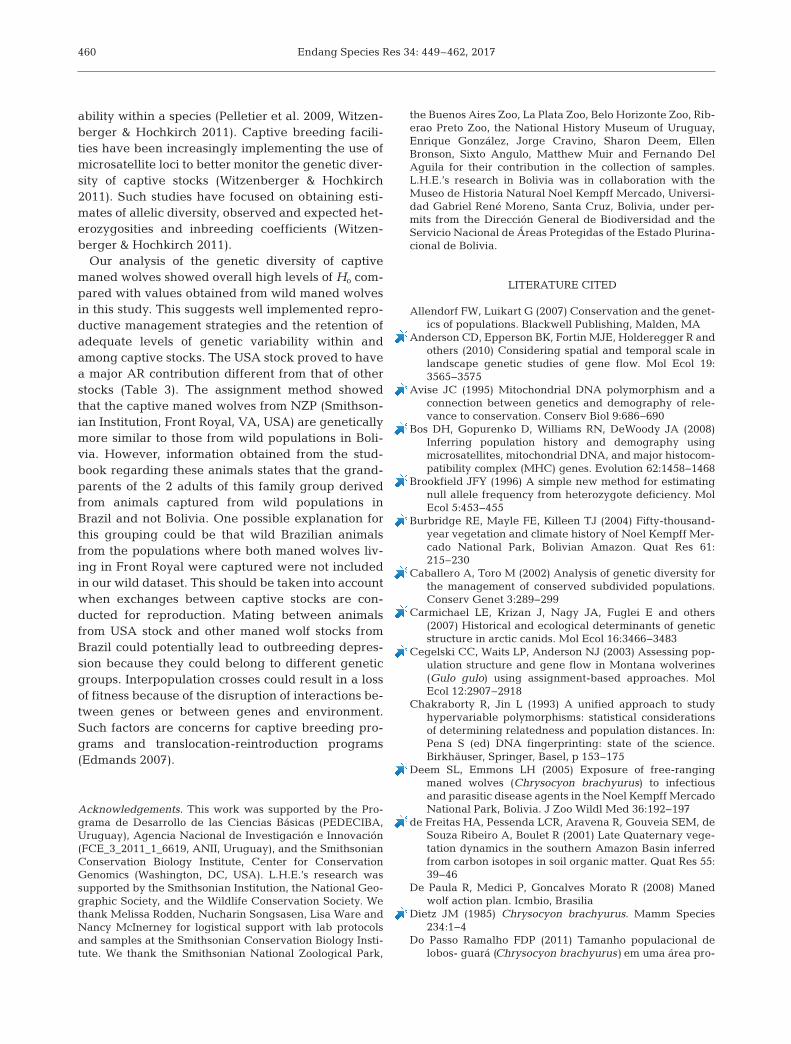
The NJ tree obtained showed 2 groups of Bolivianmaned wolves and 1 small group including some ani-mals from Argentina (Fig. 3). The correlation coeffi-cient for the Mantel test was 0.095 (p = 0.19).
Values for the inbreeding coefficient FIS were high-est for the cluster that in cludes samples from Bolivia(Table 2). Diversity within individuals (1 − Qintra)was lower than among individuals within samples(1 − Qinter) in each cluster (Table 2).
455
Fig. 2. Plots of pie chart probabilities per individual Chrysocyon brachyurus. STRUCTURE probabilities for each individual be-longing to the red or green cluster were used to construct a pie chart per individual, these were then plotted on a map of South
America with geographic coordinates (inset: border between Bolivia and Brazil)
Endang Species Res 34: 449–462, 2017
Genetic diversity and differentia-tion in captive population
For the captive population, mostof the samples yielded quality DNAand allowed us to analyze all 12polymorphic loci. This entire cap-tive stock yielded a mean allelicdiversity of 9.42 (SD = 5.367), withglobal He and PIC values of 0.75(SD = 0.198) and 0.707 (SD = 0.205)respectively (Table 3). Overall non-exclusion probabilities of identity(NE-I = 1.34 × 10⁻¹⁴), for parentpairs (NE-PP = 2.35 × 10⁻⁹) and sibs(NE-SI = 1.63 × 10⁻⁵) had enoughstatistical power to conduct identityand kinship analyses. All the lociwere in HWE for each stock afterBonferroni corrections (Table 3). Inaddition, we did not detect in -breeding signals whether we ana-lyzed the captive stocks separatelyor as a single group (Table 3). Noneof the pairwise comparisons of lociwithin stock were in LD after Bon-ferroni corrections.
Pairwise comparisons of FST val-ues suggest that the USA stock issignificantly differentiated from
456
Locus Argentina Brazil USA k Ho He PIC FIS k Ho He PIC FIS k Ho He PIC FIS
FH2140 7 0.667 0.810 0.736 0.186a 9 1 0.868 0.805 −0.161a 3 0.833 0.621 0.477 −0.389a
FH2137 9 0.889 0.915 0.850 0.030a 10 1 0.923 0.874 −0.077a 3 0.833 0.667 0.535 −0.282a
FH2328 5 1 0.767 0.679 −0.333a 6 0.778 0.83 0.753 0.066a 2 0.333 0.303 0.239 −0.111a
FH2535 5 0.875 0.775 0.679 −0.139a 6 0.9 0.842 0.770 −0.072a 3 0.833 0.712 0.579 −0.191a
FH2848 6 0.556 0.824 0.743 0.338a 6 0.727 0.823 0.753 0.12a 2 0.4 0.356 0.269 −0.143a
REN105 6 0.6 0.816 0.743 0.275a 5 0.455 0.719 0.635 0.378a 2 0.4 0.356 0.269 −0.143a
PEZ19 2 0.5 0.530 0.368 0.062a 3 nd 0.667 0.535 1 2 0.333 0.333 0.239 ndFH2561 10 0.750 0.917 0.845 0.192a 12 1 0.947 0.891 −0.058a 2 0.667 0.533 0.346 −0.333a
FH2226 8 0.7 0.779 0.714 0.106a 8 0.909 0.853 0.789 −0.069a 4 1 0.821 0.667 −0.263a
FH2054 4 0.778 0.634 0.539 −0.244a 4 0.750 0.675 0.570 −0.12a 4 1 0.8 0.620 −0.333a
REN169 1 nd nd nd nd 2 0.091 0.091 0.083 nd 1 nd nd nd ndAHTK253 3 0.556 0.529 0.449 −0.052a 3 0.273 0.255 0.228 −0.071a 1 nd nd nd ndOverall 5.5 0.715 0.691 0.612 0.0614a 6.17 0.717 0.709 0.641 0.051a 2.42 0.663 0.458 0.353 −0.244a
NE-I 2.27 × 10⁻¹¹ 1.88 × 10⁻¹² 8.5 × 10⁻⁶
NE-SI 7.56 × 10⁻⁵ 4.7 × 10⁻⁵ 4.7 × 10⁻³
NE-PP 1 × 10⁻⁶ 1.3 × 10⁻⁷ 6.3 × 10⁻³
GD 0.689 0.709 0.708AR Contrib −6.384 −5.637 8.146aLoci under Hardy-Weinberg equilibrium
Table 3. Genetic variability of Chrysocyon brachyurus captive stocks. GD = global gene diversity, AR Contrib = allelic richness contribution, nd = not done. See Table 2 for other abbreviations
Fig. 3. Neighbor-joining tree computed using shared allele distance for wildChrysocyon brachyurus. Bootstrap values calculated over 1000 replications. Grayshading shows 2 groups that include only samples from Bolivia (Bol). Arg =
Argentina, Bra = Brazil, Uy = Uruguay
Mannise et al.: Moderate genetic diversity of maned wolves
the others (mean FST = 0.631, SD = 0.117; p < 0.05).Pairwise comparisons between the Argentinean andBrazilian stocks revealed a significant FST value(FST = 0.057; p < 0.05). The USA stock yielded a posi-tive contribution to the global AR; meanwhile, eachstock had positive values (0.69− 0.71) in gene diver-sity. The total number of individuals in captivity in -cluded in this analysis also showed values of globalgenetic diversity of 0.734 (Table 3).
The mean relatedness coefficients for the Argen-tinean and Brazilian captive animals were low andranged between 0.040 (SD = 0.081) and 0.097 (SD =0.136) respectively, whereas for the USA captive ani-mals it was 0.557 (SD = 0.152). We were also able todetermine the kinship relationships of animals ineach stock. The Argentinean captive stock had 4pairs of animals that were related at the half-sib (HS)level and in the Brazilian stock 14 pairs were relatedat the HS level. Furthermore, the Brazilian stock hada pair of animals related at the parent-offspring leveland another pair of animals related at the full-siblevel. The USA stock correctly yielded the ex pected
levels of relationship between them, given that wewere aware that these animals constituted a familygroup made up of 4 full-sibs and the 2 breeding par-ents. We used this family group as a control for test-ing the power of our microsatellite loci panel to con-duct kinship analysis.
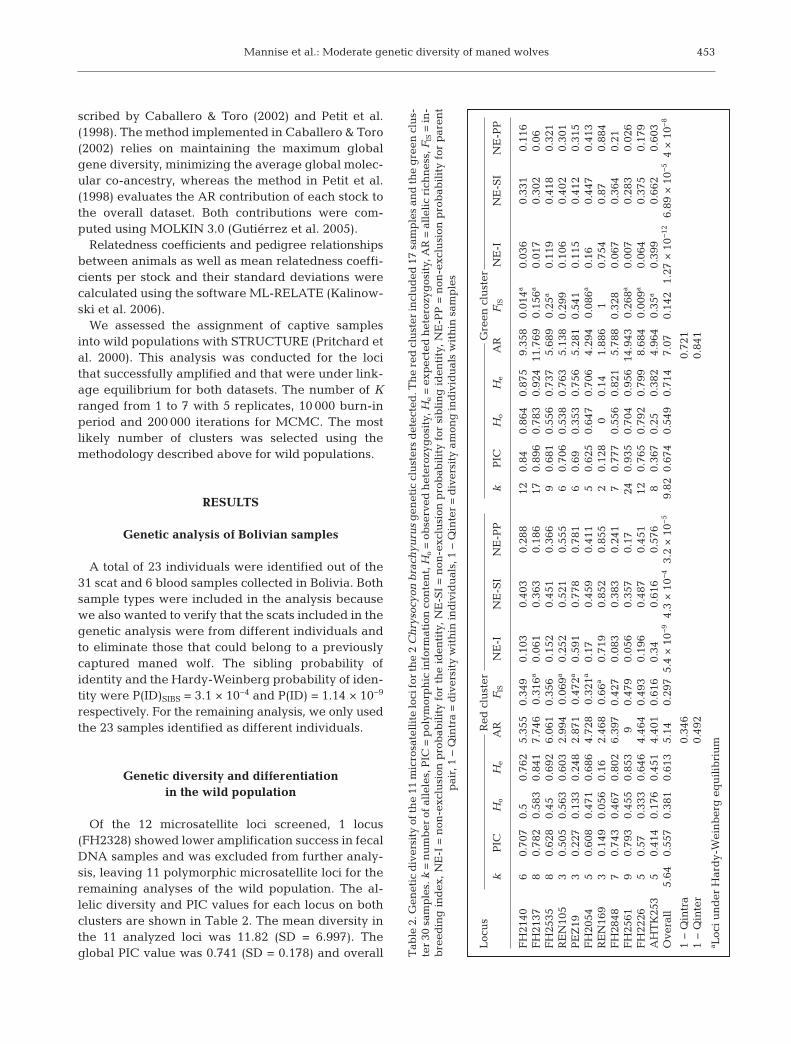
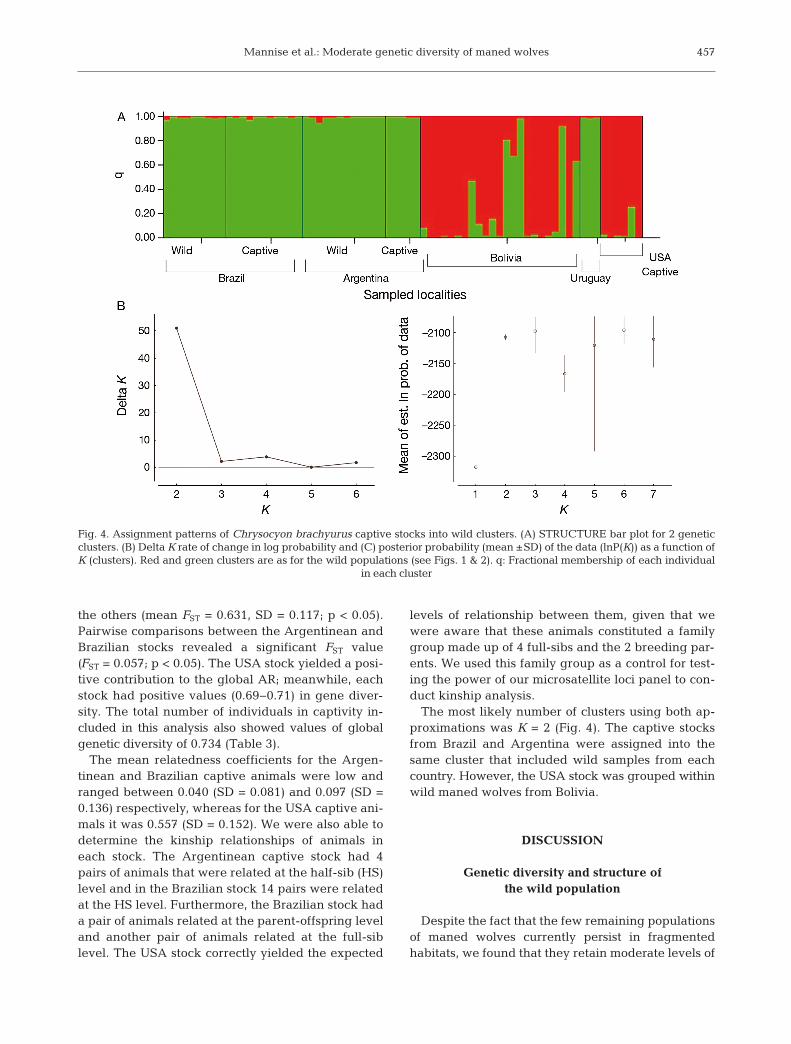
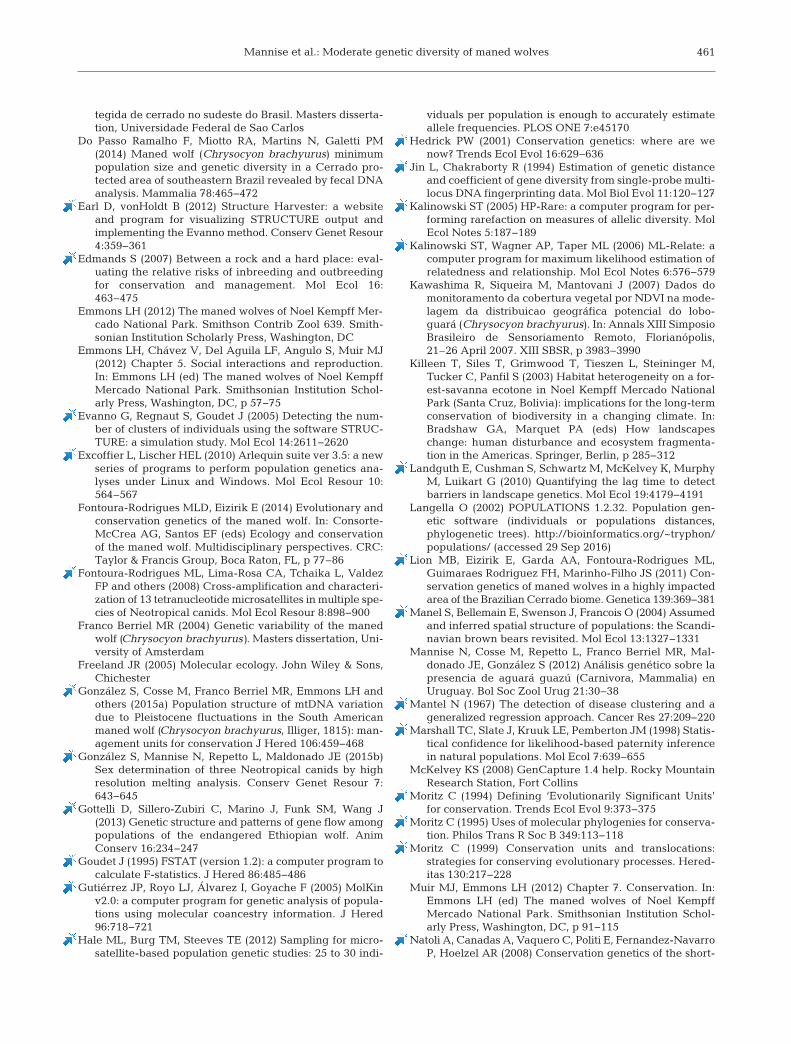
The most likely number of clusters using both ap -proximations was K = 2 (Fig. 4). The captive stocksfrom Brazil and Argentina were assigned into thesame cluster that included wild samples from eachcountry. However, the USA stock was grouped withinwild maned wolves from Bolivia.
DISCUSSION
Genetic diversity and structure of the wild population
Despite the fact that the few remaining populationsof maned wolves currently persist in fragmentedhabitats, we found that they retain moderate levels of
457
Fig. 4. Assignment patterns of Chrysocyon brachyurus captive stocks into wild clusters. (A) STRUCTURE bar plot for 2 geneticclusters. (B) Delta K rate of change in log probability and (C) posterior probability (mean ±SD) of the data (lnP(K)) as a function ofK (clusters). Red and green clusters are as for the wild populations (see Figs. 1 & 2). q: Fractional membership of each individual
in each cluster
Endang Species Res 34: 449–462, 2017
genetic variability (mean He = 0.66) compared to pre-vious studies on other endangered canids such as theEthiopian wolf (mean He = 0.47) (Gottelli et al. 2013)and more abundant canids such as Arctic foxes (meanHe = 0.78) (Carmichael et al. 2007). Additionally, pre-vious microsatellite analyses based on small samplesfrom Brazilian maned wolf populations found similarlevels of heterozygosity (Fontoura-Rodrigues et al.2008, Lion et al. 2011, Do Passo Ramalho et al. 2014).Genetic diversity is based on allelic frequencies, andtherefore it is important to have an adequate samplesize representative of each population. As suggestedby Hale et al. (2012), increasing sample sizes will pro-vide more precise estimates of genetic variability, andif at all possible, future efforts should focus on obtain-ing genetic diversity estimates using larger samplesizes from more localities. On the other hand, the ge-ographic coordinates for some wild populations withone word in the IUCN species range boundaries usedin Fig. 1 need to be updated, as some sampled areas(dots in Fig. 1A) are outside these boundaries.
In this study, we attempted to use the same sam-ples included in a study that previously assessed thegenetic variability of maned wolves using mtDNAmarkers (González et al. 2015a); however, some sam-ples had to be excluded due to low amplification suc-cess rate for microsatellite loci compared to mtDNA(Pääbo et al. 1989). Nevertheless, even though wesuccessfully included many of the samples across thesame geographic region and although the most fre-quent haplotypes were represented, a comparison ofour results showed somewhat discordant patternswith those obtained using mtDNA by González et al.(2015a). In their mtDNA study, 4 conservation unitswere identified: unit 1 grouped the Argentinean pop-ulations; unit 2 the Bolivian populations; unit 3 theBrazilian populations; and unit 4 the Uruguayansamples. In contrast, our microsatellite analysis onlydetected 2 genetic clusters. One of these clusters (thered cluster) included most of the samples from Bolivia,and the other (the green cluster) grouped a few indi-viduals from Bolivia with the rest from all of the otherlocalities that were sampled (Fig. 1).
Some samples collected in Bolivia that are groupedin the green cluster have a mitochondrial haplotypethat is exclusively found in Bolivia (haplotype F), andthe red cluster has samples with haplotypes B and Dthat are widely distributed across the species distri-bution range. The discordant patterns obtained withmitochondrial and nuclear microsatellite markerscould be due to substantial differences in mode ofinheritance and evolutionary rates (Freeland 2005).In this case, we propose that the higher levels of
genetic structure revealed by the mtDNA markersare likely the result of female maned wolves beingmore philopatric; thus mtDNA yields higher levels ofgenetic structure because of its matrilineal inheri-tance (Avise 1995). In fact, ecological studies in Bo li -via revealed that young female maned wolves aremore philopatric than males (Emmons et al. 2012).Further, greater differentiation can be detected withmtDNA markers because the effective populationsize is 4 times smaller than nuclear markers (Natoli etal. 2008). Accordingly, the lower levels of geneticstructure revealed by nuclear microsatellite markerssupport the fact that males may be dispersing largerdistances and mediating greater levels of gene flowbetween populations.
Our microsatellite results suggest that there isgreater connectivity between some conservation unitsthan that previously described based on mtDNA(Argentina–Brazil–Uruguay, and Bolivia). These couldbe caused by recent changes in land use. For exam-ple, the modern agriculture expansion in the Brazil-ian Cerrado (the main habitat for maned wolves)began around 1950 (Silva et al. 2006), entailing a rad-ical change in the landscape matrix. We note that theBolivian samples were collected from the border withBrazil, and that radio-collared maned wolves readilyswam across a 50 m wide river (Emmons 2012). Thetime lag between the occurrence of landscape changesand the appearance of a genetic structure signaturefor species with dispersal abilities >10 km is about1−3 generations (Anderson et al. 2010, Landguth etal. 2010). This is in agreement with a recent but de -tectable change in landscape matrix for maned wolfpopulations assessed here.
Although the major threat to this species is habitatconversion into farm and ranch lands (De Paula et al.2008), maned wolves can forage in croplands (Ka wa -shima et al. 2007, Vynne et al. 2014). Moreover, theycan disperse through cultivated lands, connectingpopulations that were previously thought to be iso-lated (Kawashima et al. 2007). They may toleratestress and negative influences of human interactionas long as they have water supplies and vegetationfor resting and denning, as well as for thermoregula-tion (Vynne et al. 2014).
Microsatellite data revealed that the samples fromBolivia have genetic signatures from 2 clusters, oneexclusively found in maned wolves from Bolivia (redcluster) and the other shared or admixed with sam-ples from Brazil, Argentina and Uruguay (green clus-ter) (Fig. 2). This pattern could be the result of recentmigrants from Brazil into Bolivia. The Bolivian popu-lation substructure could be explained by a partial
458
Mannise et al.: Moderate genetic diversity of maned wolves
isolation and subsequent reduction of gene flow. Thishypothesis requires further analysis about the causesand timing of isolation and gene flow. Currently, de -forestation of the Cerrado is rapidly fragmenting thepopulations. The interpretation of the vegetationchanges in the Neotropics during the last glaciationperiod has been a matter of controversy (de Freitas etal. 2001). A study using carbon isotope records ofvegetation at the border of the Brazilian states ofAmazonas and Rondonia reported 3 stages: a wetterforest phase between 17 000 and 9000 yr BP, asavanna expansion between 9000 and 3000 yr BP,followed by the current forest expansion (de Freitaset al. 2001). On the other hand, results obtainedthrough analysis of pollen and climate variables inthe Noel Kempff Mercado National Park (NKMNP)in Bolivia, where our Bolivian samples were col-lected, indicated a predominance of dry forest spe-cies, lianas and savanna woodland during the Pleis-tocene (Burbridge et al. 2004). Results obtained frommaned wolf mtDNA suggest that the Bolivian popu-lation had demographic fluctuations, while Brazilianand Argentinean populations had a signal of demo-graphic expansion in the mismatch distribution, butonly in Brazil was this signature statistically signifi-cant (González et al. 2015a). Consequently, mtDNAanalysis suggests that the vegetation changes inBolivia might have affected maned wolf populationdynamics (fluctuations). From the mtDNA data, theBolivian and Brazilian conservation units showedgene flow levels of 2 migrants per generation (Gon -zález et al. 2015a). However, in the present study, there maining units showed approximately 1 migrant pergeneration by both approaches. At present, an exten-sive portion of cleared land separates Bolivian ani-mals from those in Brazil (Muir & Emmons 2012), andthe latter authors considered it a threat to connectiv-ity be tween populations. This division is concordantwith our results because we have found reduced geneflow between the red and green clusters. Manedwolves in NKMNP are observed in upland and wet-land savannas (Killeen et al. 2003, Emmons 2012),and studies on vegetation changes are consistentwith a forest expansion during the Holocene (de Fre-itas et al. 2001, Burbridge et al. 2004). We proposethat the isolation event revealed by the genetic sig-nature by microsatellite loci is congruent with theHolocene forest expansion (separating Bolivian ani-mals) and the subsequent limited gene flow is inagreement with the existence of a biodiversity corri-dor (mosaic of savanna and humid forest) connectingthe northern limit of NKMNP to Brazilian populations(Killeen et al. 2003).
An alternative hypothesis for the observed patternof genetic structure is that the maned wolves inBolivia occupy a different habitat than maned wolvesin other areas sampled. In Bolivia, Cerrado savannasand humid and deciduous forests are prevalent,whereas in the other areas, croplands are predomi-nant (Fig. 1). Large and medium-sized carnivores withhigh mobility can cross most potential topographicbarriers, minimizing the influences of geographicfactors (Pilot et al. 2006).
The NJ tree shows separation of different group-ings in Bolivia and Argentina. However, bootstrapvalues were low (<0.5), and we could not find geo-graphic concordance in the groupings sampled fromArgentina or Bolivia (Fig. 3). Landscapes are spa-tially heterogeneous and dynamic; the correlation weused (Mantel test) did not consider the features thatcould affect animal movement (Spear et al. 2010).
Although maned wolves may tolerate and use cul-tivated lands, there is growing concern about theirfuture in this changing matrix of land use. In studiesconducted in the Brazilian Cerrado, females in crop-lands outside of protected areas showed lower levelsof reproductive hormones (Vynne et al. 2014). Like-wise, the rapid expansion of sugar cane productionfor biofuels will cause a decreasing survival rate formaned wolves, as they avoid that habitat (Vynne etal. 2014).
Our results can be incorporated with previousgenetic studies to develop better-informed conserva-tion plans that define genetically based managementunits for maned wolves. The earlier mtDNA study re -cognized 4 management units (González et al. 2015a).Our results are in concordance with the mtDNA datain support of maintaining the Bolivian population ofmaned wolves as a different management unit. Inaddition, we propose that the Bolivian populationshould be listed as a conservation priority. However,we should also point out that future studies shouldincorporate samples from other geographic regionssuch as Beni and Pampas del Heath savannas fromBoli via, and Paraguay, as samples from these locali-ties could reveal levels of connectivity as well asother important population genetic diversity infor-mation for the conservation of maned wolves.
Genetic variability and management of captive stocks
Captive breeding is an important tool in speciesconservation programs, and one of its main goals is topreserve the maximum possible level of genetic vari-
459
Endang Species Res 34: 449–462, 2017
ability within a species (Pelletier et al. 2009, Witzen-berger & Hochkirch 2011). Captive breeding facili-ties have been increasingly implementing the use ofmicrosatellite loci to better monitor the genetic diver-sity of captive stocks (Witzenberger & Hochkirch2011). Such studies have focused on obtaining esti-mates of allelic diversity, observed and expected het-erozygosities and inbreeding coefficients (Witzen-berger & Hochkirch 2011).
Our analysis of the genetic diversity of captivemaned wolves showed overall high levels of Ho com-pared with values obtained from wild maned wolvesin this study. This suggests well implemented repro-ductive management strategies and the retention ofadequate levels of genetic variability within andamong captive stocks. The USA stock proved to havea major AR contribution different from that of otherstocks (Table 3). The assignment method showedthat the captive maned wolves from NZP (Smithson-ian Institution, Front Royal, VA, USA) are geneticallymore similar to those from wild populations in Boli -via. However, information obtained from the stud-book regarding these animals states that the grand-parents of the 2 adults of this family group derivedfrom animals captured from wild populations inBrazil and not Bolivia. One possible explanation forthis grouping could be that wild Brazilian animalsfrom the populations where both maned wolves liv-ing in Front Royal were captured were not includedin our wild dataset. This should be taken into accountwhen exchanges between captive stocks are con-ducted for reproduction. Mating between animalsfrom USA stock and other maned wolf stocks fromBrazil could potentially lead to outbreeding depres-sion because they could belong to different geneticgroups. Interpopulation crosses could result in a lossof fitness because of the disruption of interactions be -tween genes or between genes and environment.Such factors are concerns for captive breeding pro-grams and translocation-reintroduction programs(Edmands 2007).
Acknowledgements. This work was supported by the Pro-grama de Desarrollo de las Ciencias Básicas (PEDECIBA,Uruguay), Agencia Nacional de Investigación e Innovación(FCE_3_2011_1_6619, ANII, Uruguay), and the SmithsonianConservation Biology Institute, Center for ConservationGenomics (Washington, DC, USA). L.H.E.’s research wassupported by the Smithsonian Institution, the National Geo-graphic Society, and the Wildlife Conservation Society. Wethank Melissa Rodden, Nucharin Songsasen, Lisa Ware andNancy McInerney for logistical support with lab protocolsand samples at the Smithsonian Conservation Biology Insti-tute. We thank the Smithsonian National Zoological Park,
the Buenos Aires Zoo, La Plata Zoo, Belo Horizonte Zoo, Rib-erao Preto Zoo, the National History Museum of Uruguay,Enrique González, Jorge Cravino, Sharon Deem, EllenBronson, Sixto Angulo, Matthew Muir and Fernando DelAguila for their contribution in the collection of samples.L.H.E.’s research in Bolivia was in collaboration with theMuseo de Historia Natural Noel Kempff Mercado, Universi-dad Gabriel René Moreno, Santa Cruz, Bolivia, under per-mits from the Dirección General de Biodiversidad and theServicio Nacional de Áreas Protegidas of the Estado Plurina-cional de Bolivia.
LITERATURE CITED
Allendorf FW, Luikart G (2007) Conservation and the genet-ics of populations. Blackwell Publishing, Malden, MA
Anderson CD, Epperson BK, Fortin MJE, Holderegger R andothers (2010) Considering spatial and temporal scale inlandscape genetic studies of gene flow. Mol Ecol 19: 3565−3575
Avise JC (1995) Mitochondrial DNA polymorphism and aconnection between genetics and demography of rele-vance to conservation. Conserv Biol 9: 686−690
Bos DH, Gopurenko D, Williams RN, DeWoody JA (2008)Inferring population history and demography usingmicrosatellites, mitochondrial DNA, and major histocom-patibility complex (MHC) genes. Evolution 62: 1458−1468
Brookfield JFY (1996) A simple new method for estimatingnull allele frequency from heterozygote deficiency. MolEcol 5: 453−455
Burbridge RE, Mayle FE, Killeen TJ (2004) Fifty-thousand-year vegetation and climate history of Noel Kempff Mer-cado National Park, Bolivian Amazon. Quat Res 61: 215−230
Caballero A, Toro M (2002) Analysis of genetic diversity forthe management of conserved subdivided populations.Conserv Genet 3: 289−299
Carmichael LE, Krizan J, Nagy JA, Fuglei E and others(2007) Historical and ecological determinants of geneticstructure in arctic canids. Mol Ecol 16: 3466−3483
Cegelski CC, Waits LP, Anderson NJ (2003) Assessing pop-ulation structure and gene flow in Montana wolverines(Gulo gulo) using assignment-based approaches. MolEcol 12: 2907−2918
Chakraborty R, Jin L (1993) A unified approach to studyhypervariable polymorphisms: statistical considerationsof determining relatedness and population distances. In: Pena S (ed) DNA fingerprinting: state of the science.Birkhäuser, Springer, Basel, p 153−175
Deem SL, Emmons LH (2005) Exposure of free-rangingmaned wolves (Chrysocyon brachyurus) to infectiousand parasitic disease agents in the Noel Kempff MercadoNational Park, Bolivia. J Zoo Wildl Med 36: 192−197
de Freitas HA, Pessenda LCR, Aravena R, Gouveia SEM, deSouza Ribeiro A, Boulet R (2001) Late Quaternary vege-tation dynamics in the southern Amazon Basin inferredfrom carbon isotopes in soil organic matter. Quat Res 55: 39−46
De Paula R, Medici P, Goncalves Morato R (2008) Manedwolf action plan. Icmbio, Brasilia
Dietz JM (1985) Chrysocyon brachyurus. Mamm Species234: 1−4
Do Passo Ramalho FDP (2011) Tamanho populacional delobos- guará (Chrysocyon brachyurus) em uma área pro-
460
Mannise et al.: Moderate genetic diversity of maned wolves
tegida de cerrado no sudeste do Brasil. Masters disserta-tion, Universidade Federal de Sao Carlos
Do Passo Ramalho F, Miotto RA, Martins N, Galetti PM(2014) Maned wolf (Chrysocyon brachyurus) minimumpopulation size and genetic diversity in a Cerrado pro-tected area of southeastern Brazil revealed by fecal DNAanalysis. Mammalia 78: 465−472
Earl D, vonHoldt B (2012) Structure Harvester: a websiteand program for visualizing STRUCTURE output andimplementing the Evanno method. Conserv Genet Resour4: 359−361
Edmands S (2007) Between a rock and a hard place: eval-uating the relative risks of inbreeding and outbreedingfor conservation and management. Mol Ecol 16: 463−475
Emmons LH (2012) The maned wolves of Noel Kempff Mer-cado National Park. Smithson Contrib Zool 639. Smith-sonian Institution Scholarly Press, Washington, DC
Emmons LH, Chávez V, Del Aguila LF, Angulo S, Muir MJ(2012) Chapter 5. Social interactions and reproduction.In: Emmons LH (ed) The maned wolves of Noel KempffMercado National Park. Smithsonian Institution Schol-arly Press, Washington, DC, p 57−75
Evanno G, Regnaut S, Goudet J (2005) Detecting the num-ber of clusters of individuals using the software STRUC-TURE: a simulation study. Mol Ecol 14: 2611−2620
Excoffier L, Lischer HEL (2010) Arlequin suite ver 3.5: a newseries of programs to perform population genetics ana -lyses under Linux and Windows. Mol Ecol Resour 10: 564−567
Fontoura-Rodrigues MLD, Eizirik E (2014) Evolutionary andconservation genetics of the maned wolf. In: Consorte-McCrea AG, Santos EF (eds) Ecology and conservationof the maned wolf. Multidisciplinary perspectives. CRC: Taylor & Francis Group, Boca Raton, FL, p 77−86
Fontoura-Rodrigues ML, Lima-Rosa CA, Tchaika L, ValdezFP and others (2008) Cross-amplification and characteri-zation of 13 tetranucleotide microsatellites in multiple spe-cies of Neotropical canids. Mol Ecol Resour 8: 898−900
Franco Berriel MR (2004) Genetic variability of the manedwolf (Chrysocyon brachyurus). Masters dissertation, Uni-versity of Amsterdam
Freeland JR (2005) Molecular ecology. John Wiley & Sons,Chichester
González S, Cosse M, Franco Berriel MR, Emmons LH andothers (2015a) Population structure of mtDNA variationdue to Pleistocene fluctuations in the South Americanmaned wolf (Chrysocyon brachyurus, Illiger, 1815): man-agement units for conservation J Hered 106: 459−468
González S, Mannise N, Repetto L, Maldonado JE (2015b)Sex determination of three Neotropical canids by highresolution melting analysis. Conserv Genet Resour 7: 643−645
Gottelli D, Sillero-Zubiri C, Marino J, Funk SM, Wang J(2013) Genetic structure and patterns of gene flow amongpopulations of the endangered Ethiopian wolf. AnimConserv 16: 234−247
Goudet J (1995) FSTAT (version 1.2): a computer program tocalculate F-statistics. J Hered 86: 485−486
Gutiérrez JP, Royo LJ, Álvarez I, Goyache F (2005) MolKinv2.0: a computer program for genetic analysis of popula-tions using molecular coancestry information. J Hered96: 718−721
Hale ML, Burg TM, Steeves TE (2012) Sampling for micro-satellite-based population genetic studies: 25 to 30 indi-
viduals per population is enough to accurately estimateallele frequencies. PLOS ONE 7: e45170
Hedrick PW (2001) Conservation genetics: where are wenow? Trends Ecol Evol 16: 629−636
Jin L, Chakraborty R (1994) Estimation of genetic distanceand coefficient of gene diversity from single-probe multi-locus DNA fingerprinting data. Mol Biol Evol 11: 120−127
Kalinowski ST (2005) HP-Rare: a computer program for per-forming rarefaction on measures of allelic diversity. MolEcol Notes 5: 187−189
Kalinowski ST, Wagner AP, Taper ML (2006) ML-Relate: acomputer program for maximum likelihood estimation ofrelatedness and relationship. Mol Ecol Notes 6: 576−579
Kawashima R, Siqueira M, Mantovani J (2007) Dados domonitoramento da cobertura vegetal por NDVI na mode-lagem da distribuicao geográfica potencial do lobo-guará (Chrysocyon brachyurus). In: Annals XIII SimposioBrasileiro de Sensoriamento Remoto, Florianópolis,21–26 April 2007. XIII SBSR, p 3983−3990
Killeen T, Siles T, Grimwood T, Tieszen L, Steininger M,Tucker C, Panfil S (2003) Habitat heterogeneity on a for-est-savanna ecotone in Noel Kempff Mercado NationalPark (Santa Cruz, Bolivia): implications for the long-termconservation of biodiversity in a changing climate. In: Bradshaw GA, Marquet PA (eds) How landscapeschange: human disturbance and ecosystem fragmenta-tion in the Americas. Springer, Berlin, p 285−312
Landguth E, Cushman S, Schwartz M, McKelvey K, MurphyM, Luikart G (2010) Quantifying the lag time to detectbarriers in landscape genetics. Mol Ecol 19: 4179−4191
Langella O (2002) POPULATIONS 1.2.32. Population gen -etic software (individuals or populations distances,phylo gen etic trees). http: //bioinformatics.org/ ~tryphon/populations/ (accessed 29 Sep 2016)
Lion MB, Eizirik E, Garda AA, Fontoura-Rodrigues ML,Guimaraes Rodriguez FH, Marinho-Filho JS (2011) Con-servation genetics of maned wolves in a highly impactedarea of the Brazilian Cerrado biome. Genetica 139: 369−381
Manel S, Bellemain E, Swenson J, Francois O (2004) Assumedand inferred spatial structure of populations: the Scandi-navian brown bears revisited. Mol Ecol 13: 1327−1331
Mannise N, Cosse M, Repetto L, Franco Berriel MR, Mal-donado JE, González S (2012) Análisis genético sobre lapresencia de aguará guazú (Carnivora, Mammalia) enUruguay. Bol Soc Zool Urug 21: 30−38
Mantel N (1967) The detection of disease clustering and ageneralized regression approach. Cancer Res 27: 209−220
Marshall TC, Slate J, Kruuk LE, Pemberton JM (1998) Statis-tical confidence for likelihood-based paternity inferencein natural populations. Mol Ecol 7: 639−655
McKelvey KS (2008) GenCapture 1.4 help. Rocky MountainResearch Station, Fort Collins
Moritz C (1994) Defining ‘Evolutionarily Significant Units’for conservation. Trends Ecol Evol 9: 373−375
Moritz C (1995) Uses of molecular phylogenies for conserva-tion. Philos Trans R Soc B 349: 113−118
Moritz C (1999) Conservation units and translocations: strategies for conserving evolutionary processes. Hered-itas 130: 217−228
Muir MJ, Emmons LH (2012) Chapter 7. Conservation. In: Emmons LH (ed) The maned wolves of Noel KempffMercado National Park. Smithsonian Institution Schol-arly Press, Washington, DC, p 91−115
Natoli A, Canadas A, Vaquero C, Politi E, Fernandez-NavarroP, Hoelzel AR (2008) Conservation genetics of the short-
461
Endang Species Res 34: 449–462, 2017
beaked common dolphin (Delphinus delphis) in theMediterranean Sea and in the eastern North AtlanticOcean. Conserv Genet 9: 1479−1487
Navidi W, Arnheim N, Waterman M (1992) A multiple-tubesapproach for accurate genotyping of very small DNAsamples by using PCR: statistical considerations. Am JHum Genet 50: 347−359
Pääbo S, Higuchi R, Wilson AC (1989) Ancient DNA and thepolymerase chain reaction. The emerging field of molec-ular archaeology. J Biol Chem 264: 9709−9712
Palsbøll PJ, Bérubé M, Allendorf FW (2007) Identification ofmanagement units using population genetic data. TrendsEcol Evol 22: 11−16
Paula RC, DeMatteo K (2016) Chrysocyon brachyurus. In: The IUCN Red List of Threatened Species, 2015: e. T 4819A82316878 (accessed 12 Apr 2016)
Peakall ROD, Smouse PE (2006) Genalex 6: genetic analysisin Excel. Population genetic software for teaching andresearch. Mol Ecol Notes 6: 288−295
Pelletier F, Reale D, Watters J, Boakes EH, Garant D (2009)Value of captive populations for quantitative geneticsresearch. Trends Ecol Evol 24: 263−270
Petit RJ, El Mousadik A, Pons O (1998) Identifying popula-tions for conservation on the basis of genetic markers.Conserv Biol 12: 844−855
Pilot M, Jedrzejewski W, Branicki W, Sidorovich VE,Jedrzejewska B, Stachura K, Funk SM (2006) Ecologicalfactors influence population genetic structure of Euro-pean grey wolves. Mol Ecol 15: 4533−4553
Prates JPHdS (2008) Diversidade genética e historia evolu-tiva do lobo guará. PhD dissertation, Pontifícia Universi-dade Católica do Rio Grande do Sul, Porto Alegre
Pritchard JK, Stephens M, Donnelly P (2000) Inference ofpopulation structure using multilocus genotype data.Genetics 155: 945−959
Queirolo D, Moreira JR, Soler L, Emmons LH and others (2011)Historical and current range of the Near Threatenedmaned wolf Chrysocyon brachyurus in South America.Oryx 45: 296−303
Raymond M, Rousset F (1995) GENEPOP (version 1.2): pop-ulation genetics software for exact tests and ecumeni-cism. J Hered 86: 248−249
Rice WR (1989) Analysing tables of statistical tests. Evolu-tion 43: 223−225
Rodden M, Rodrigues F, Bestelmeyer S (2004) Maned wolfChrysocyon brachyurus (Illiger, 1815). In: Sillero-ZubiriC, Hoffmann M, Macdonald DW (eds) Canids: foxes,wolves, jackals and dogs: status survey and conservationaction plan. IUCN/Species Survival Commission CanidSpecialist Group, Gland, p 38−43
Rodrigues FM, Telles MP, Resende LV, Soares TN, Diniz-Filho JA, Jacomo AT, Silveira L (2006) Transferability ofshort tandem repeat markers for two wild canid species
inhabiting the Brazilian Cerrado. Genet Mol Res 5: 846−850
Salim DC, Akimoto AA, Carvalho CB, Oliveira SF, GrisoliaCK, Moreira JR, Klautau-Guimaraes MN (2007) Geneticvariability in maned wolf based on heterologous short-tandem repeat markers from domestic dog. Genet MolRes 6: 348−357
Silva J, Fariñas M, Felfili J, Klink C (2006) Spatial hetero-geneity, land use and conservation in the cerrado regionof Brazil. J Biogeogr 33: 536−548
Slatkin M (1985) Gene flow in natural populations. AnnuRev Ecol Syst 16: 393−430
Smith DA, Ralls K, Hurt A, Adams B, Parker M, MaldonadoJE (2006) Assessing reliability of microsatellite geno-types from kit fox faecal samples using genetic and GISanalyses. Mol Ecol 15: 387−406
Spear SF, Balkenhol N, Fortin MJE, McRae BH, Scribner K(2010) Use of resistance surfaces for landscape geneticstudies: considerations for parameterization and analy-sis. Mol Ecol 19: 3576−3591
Taberlet P, Griffin S, Goossens B, Questiau S and others(1996) Reliable genotyping of samples with very low DNAquantities using PCR. Nucleic Acids Res 24: 3189−3194
Taberlet P, Waits LP, Luikart G (1999) Noninvasive geneticsampling: look before you leap. Trends Ecol Evol 14: 323−327
Van Oosterhout C, Hutchinson W, Wills DPM, Shipley P(2004) Micro-checker: software for identifying and cor-recting genotyping errors in microsatellite data. Mol EcolNotes 4: 535−538
Vanstreels R, Pessutti C (2010) Analysis and discussion ofManed wolf Chrysocyon brachyurus population trends inBrazilian institutions: lessons from the Brazilian stud-book, 1969-2006. Int Zoo Yearb 44: 121−135
Vynne C, Booth RK, Wasser SK (2014) Physiological implica-tions of landscape use by free-ranging maned wolves(Chrysocyon brachyurus) in Brazil. J Mammal 95: 696−706
Waples RS (2015) Testing for Hardy-Weinberg proportions: Have we lost the plot? J Hered 106: 1−19
Wayne RK, Morin PA (2004) Conservation genetics in thenew molecular age. Front Ecol Environ 2: 89−97
Wilberg MJ, Dreher BP (2004) Genecap: a program foranalysis of multilocus genotype data for non-invasivesampling and capture-recapture population estimation.Mol Ecol Notes 4: 783−785
Witzenberger K, Hochkirch A (2011) Ex situ conservationgenetics: a review of molecular studies on the geneticconsequences of captive breeding programmes for endan-gered animal species. Biodivers Conserv 20: 1843−1861
Woods JG, Paetkau D, Lewis D, McLellan BN, Proctor M,Strobeck C (1999) Genetic tagging of free-ranging lackand brown bears. Wildl Soc Bull 27: 616−627
Wright S (1943) Isolation by distance. Genetics 28: 114−138
462
Editorial responsibility: Mike Bruford, Cardiff, UK
Submitted: October 13, 2016; Accepted: September 5, 2017Proofs received from author(s): October 31, 2017