Embed Size (px)
Citation preview
43
Oceanography Lab 5—Atmospheric and Oceanic Circulation
We will be referring to web activities at www.wcc.hawaii.edu/facstaff/miliefsky-m/ ocean lab 5 folder to view color images for the following assignment.
Background:
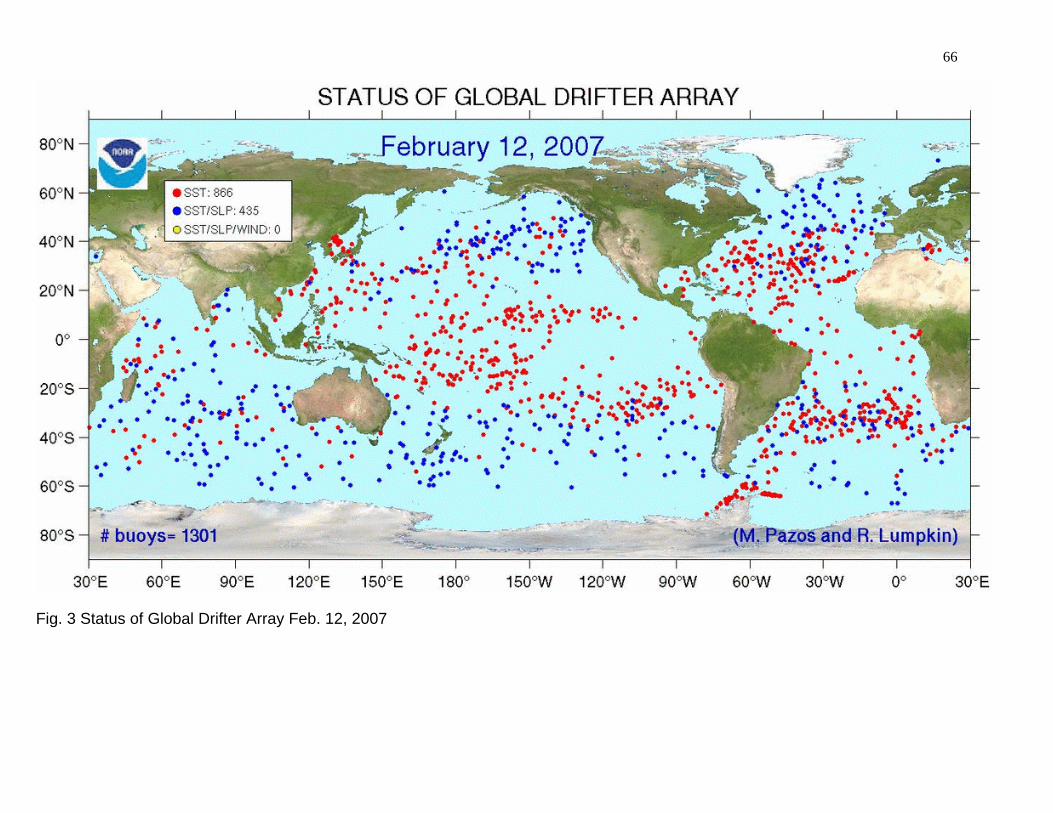
Plotting ocean buoy data to show surface currents
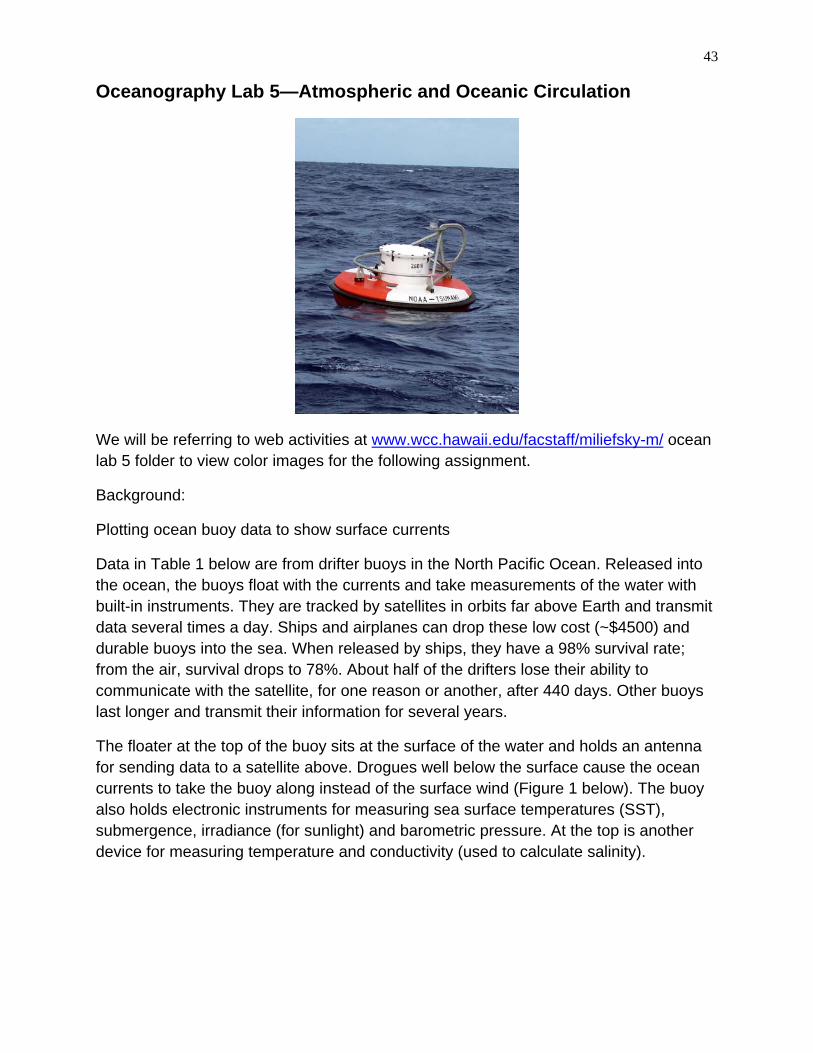
Data in Table 1 below are from drifter buoys in the North Pacific Ocean. Released into the ocean, the buoys float with the currents and take measurements of the water with built-in instruments. They are tracked by satellites in orbits far above Earth and transmit data several times a day. Ships and airplanes can drop these low cost (~$4500) and durable buoys into the sea. When released by ships, they have a 98% survival rate; from the air, survival drops to 78%. About half of the drifters lose their ability to communicate with the satellite, for one reason or another, after 440 days. Other buoys last longer and transmit their information for several years.
The floater at the top of the buoy sits at the surface of the water and holds an antenna for sending data to a satellite above. Drogues well below the surface cause the ocean currents to take the buoy along instead of the surface wind (Figure 1 below). The buoy also holds electronic instruments for measuring sea surface temperatures (SST), submergence, irradiance (for sunlight) and barometric pressure. At the top is another device for measuring temperature and conductivity (used to calculate salinity).
44
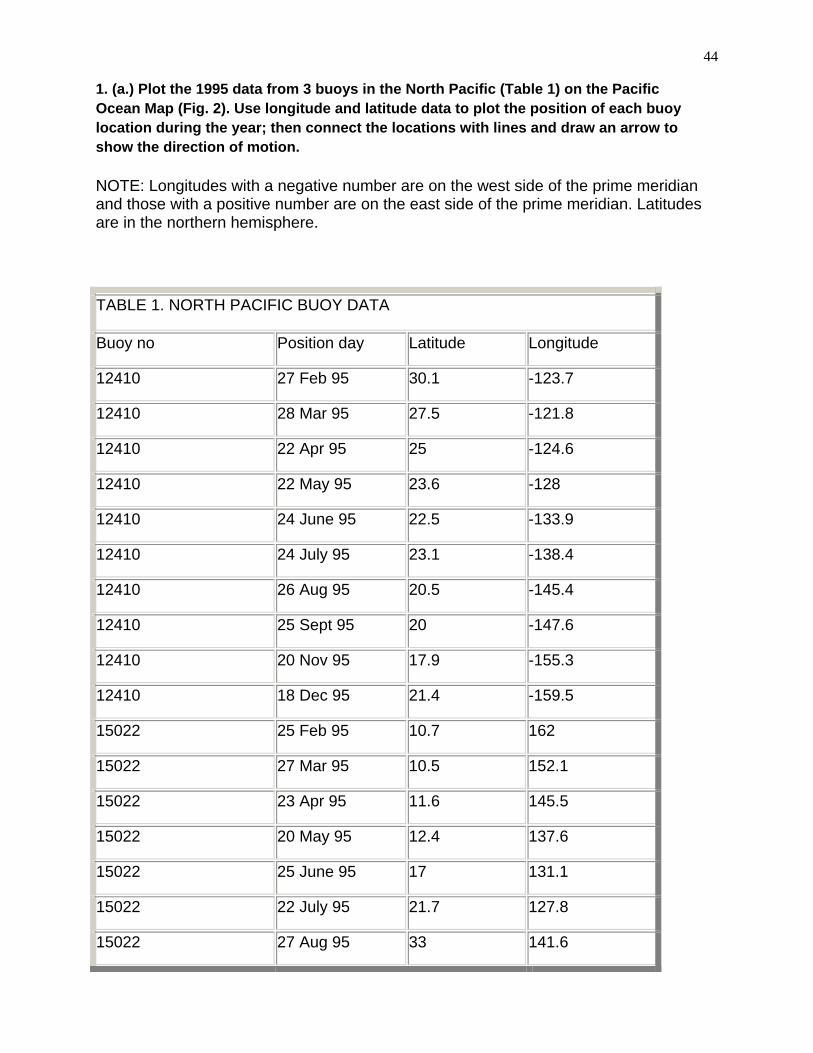
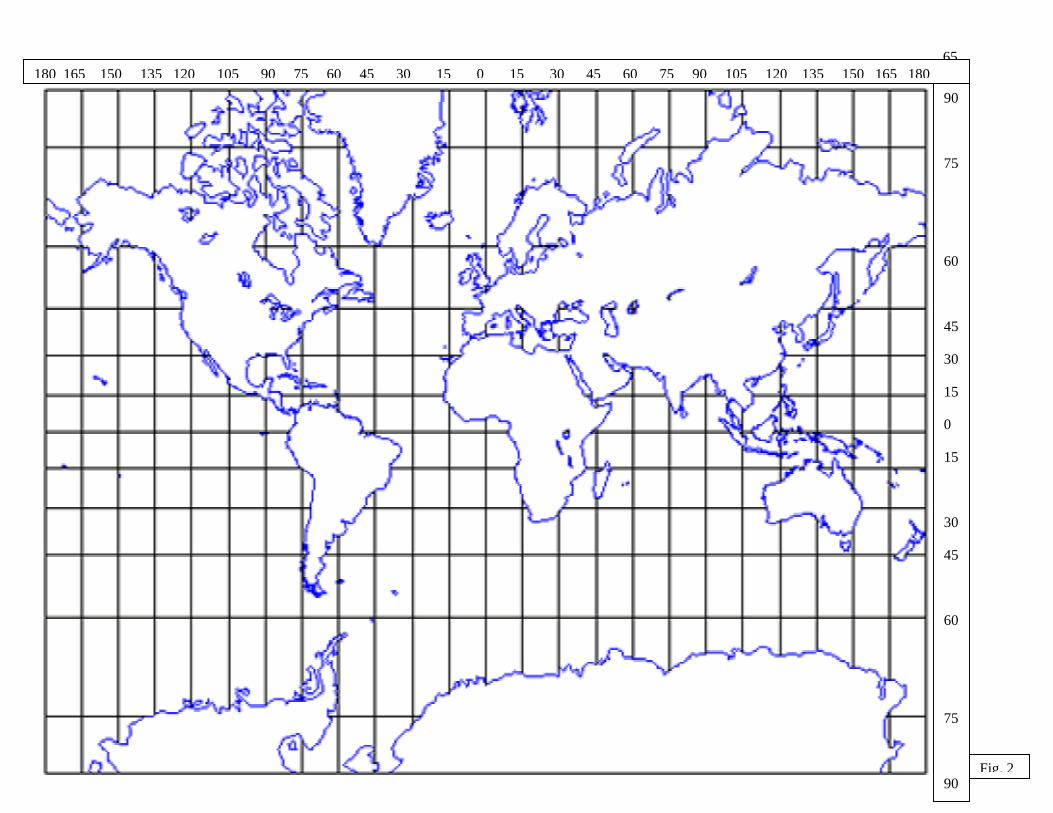
1. (a.) Plot the 1995 data from 3 buoys in the North Pacific (Table 1) on the Pacific Ocean Map (Fig. 2). Use longitude and latitude data to plot the position of each buoy location during the year; then connect the locations with lines and draw an arrow to show the direction of motion.
NOTE: Longitudes with a negative number are on the west side of the prime meridian and those with a positive number are on the east side of the prime meridian. Latitudes are in the northern hemisphere.
TABLE 1. NORTH PACIFIC BUOY DATA
Buoy no Position day Latitude Longitude
12410 27 Feb 95 30.1 -123.7
12410 28 Mar 95 27.5 -121.8
12410 22 Apr 95 25 -124.6
12410 22 May 95 23.6 -128
12410 24 June 95 22.5 -133.9
12410 24 July 95 23.1 -138.4
12410 26 Aug 95 20.5 -145.4
12410 25 Sept 95 20 -147.6
12410 20 Nov 95 17.9 -155.3
12410 18 Dec 95 21.4 -159.5
15022 25 Feb 95 10.7 162
15022 27 Mar 95 10.5 152.1
15022 23 Apr 95 11.6 145.5
15022 20 May 95 12.4 137.6
15022 25 June 95 17 131.1
15022 22 July 95 21.7 127.8
15022 27 Aug 95 33 141.6
45
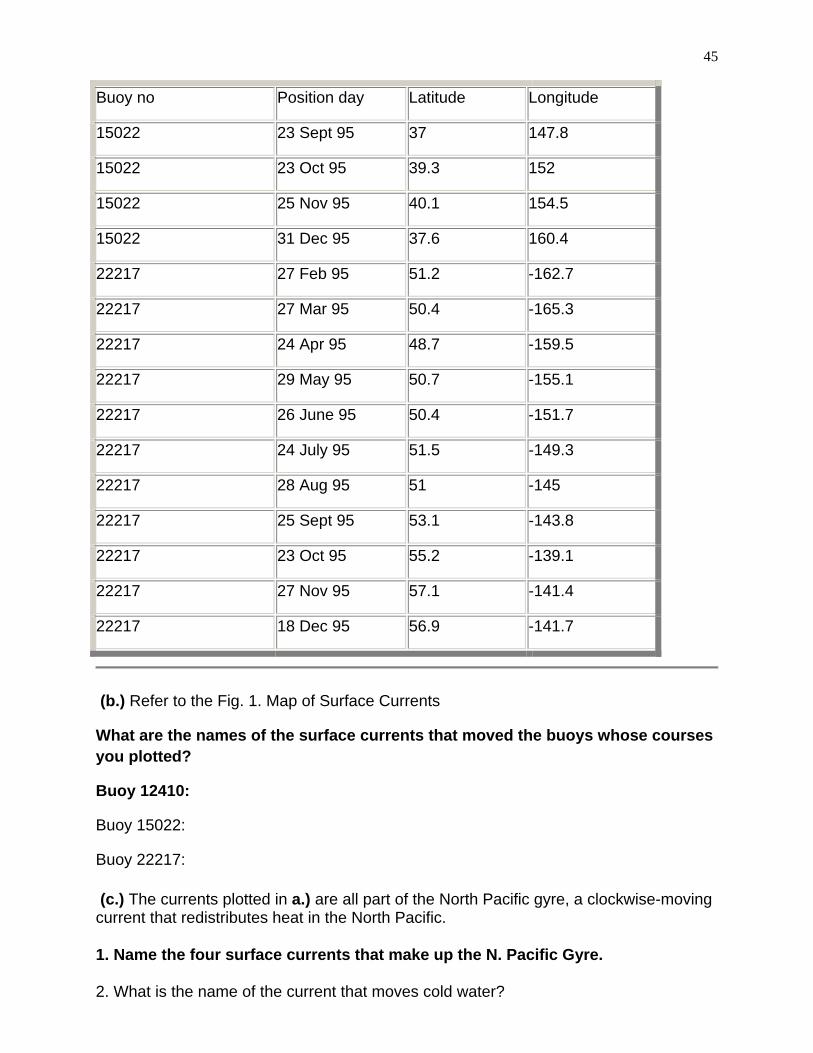
Buoy no Position day Latitude Longitude
15022 23 Sept 95 37 147.8
15022 23 Oct 95 39.3 152
15022 25 Nov 95 40.1 154.5
15022 31 Dec 95 37.6 160.4
22217 27 Feb 95 51.2 -162.7
22217 27 Mar 95 50.4 -165.3
22217 24 Apr 95 48.7 -159.5
22217 29 May 95 50.7 -155.1
22217 26 June 95 50.4 -151.7
22217 24 July 95 51.5 -149.3
22217 28 Aug 95 51 -145
22217 25 Sept 95 53.1 -143.8
22217 23 Oct 95 55.2 -139.1
22217 27 Nov 95 57.1 -141.4
22217 18 Dec 95 56.9 -141.7
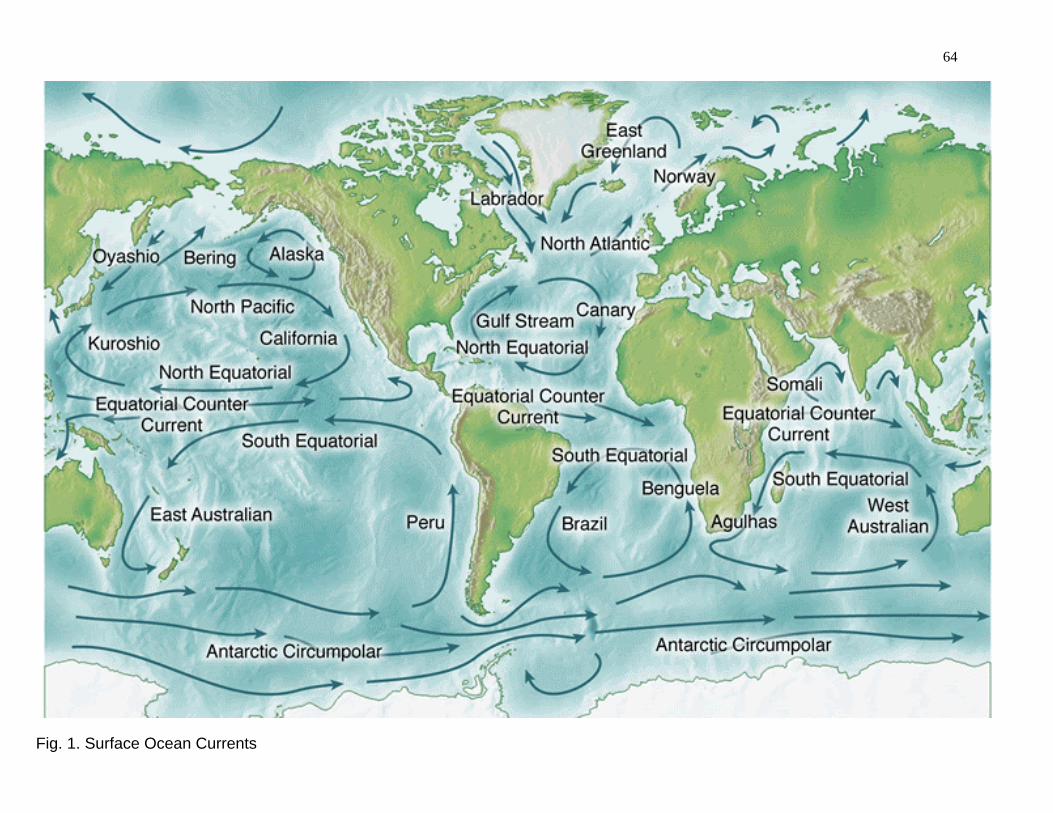
(b.) Refer to the Fig. 1. Map of Surface Currents
What are the names of the surface currents that moved the buoys whose courses you plotted?
Buoy 12410:
Buoy 15022:
Buoy 22217:
(c.) The currents plotted in a.) are all part of the North Pacific gyre, a clockwise-moving current that redistributes heat in the North Pacific.
1. Name the four surface currents that make up the N. Pacific Gyre.
2. What is the name of the current that moves cold water?
2. The satellite images below show the amount of water vapor in the atmosphere, which is heated indirectly. First, the sun heats ocean water, some of which evaporates and rises. As the air rises, it cools and condenses, thus releasing heat into the atmosphere. This process is called latent heat. The TOPEX/POSEIDON satellite is able to measure the amount of water vapor in the air, an indication of where and how much air is rising. Understanding the transfer of heat by this process is important to understanding the overall heat balance of Earth.
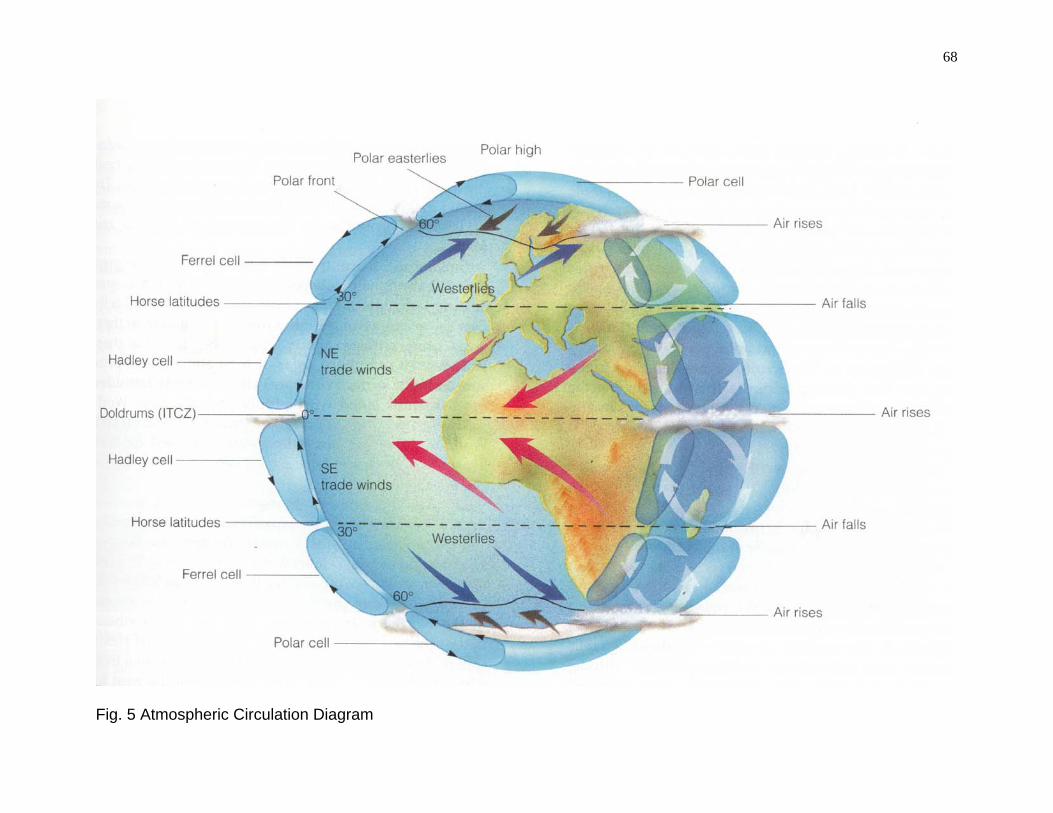
The Atmospheric Circulation diagram (Fig. 5) shows generalized wind patterns on Earth's surface. It does not account for the influence of continents. A persistent low pressure zone is created over the equator (ITCZ), where massive amounts of evaporation cause air to rise. The solid lines and arrows show generalized wind patterns on Earth's surface. The dotted lines and arrows show how the lower atmosphere circulates (above Earth's surface). For example, air is shown rising over the ITCZ (low pressure zone) and falling over the subtropical high pressure zone (around 30 degree N and S latitude).
46
PART 2A :
Investigating atmospheric circulation and surface currents---the Topex/Poseidon mission
A joint effort between NASA and the French space agency to study Earth's oceans, the TOPEX/POSEIDON mission will observe the global ocean circulation for 3-5 years. The oceans play a fundamental role in maintaining the habitable climate we experience on Earth by transporting an enormous amount of heat through large-scale circulation systems. Understanding the dynamics of ocean circulation and the role this circulation plays in climate change is the main goal of the TOPEX/POSEIDON mission. The satellite travels in an orbit that allows coverage of 95% of the ice-free oceans every 10 days. The satellite measures sea levels, current variations, effects of currents on global climate change, and provides information about tides, waves, and wind. The images are "false color" images. That is, different measured values have been assigned different colors to make them easier to see. Note that when images are labeled winter or summer, this refers to the Northern Hemisphere perspective.
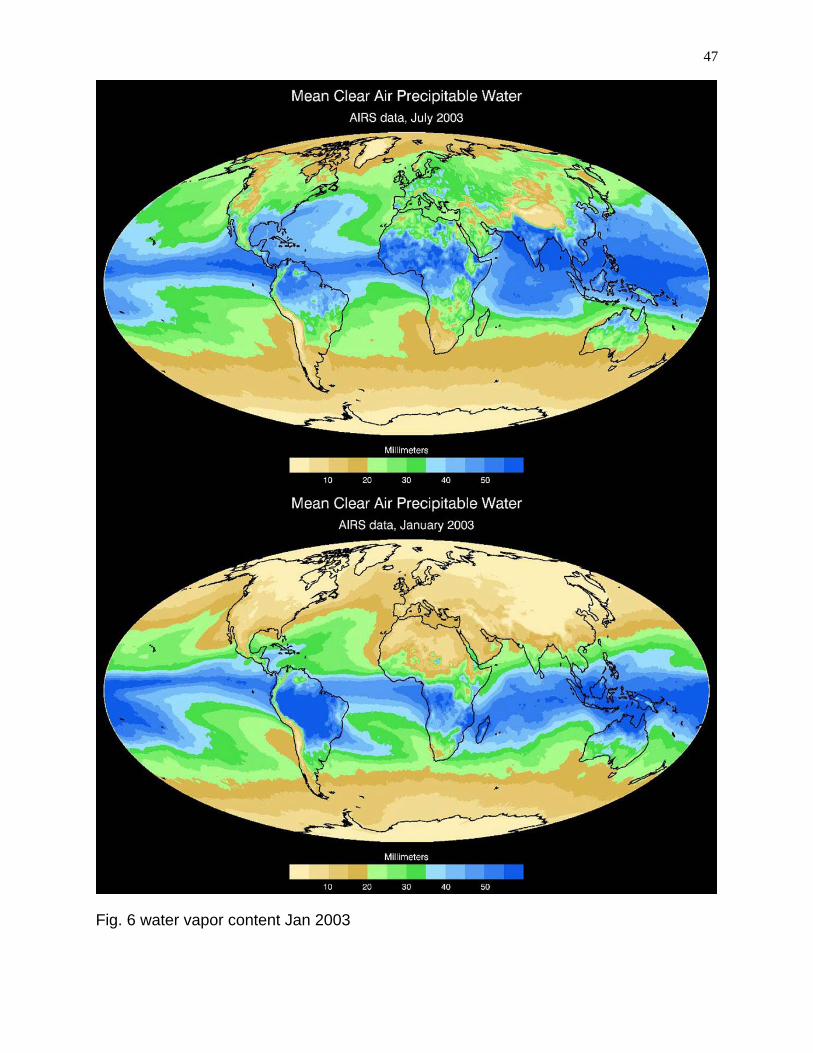
Fig. 6 water vapor content Jan 2003
47
48
(a.) Where are the areas of highest water vapor content in the atmosphere (Fig. 6) and how do these areas correlate to the climate belts shown in the Atmospheric Circulation Diagram (Fig. 5)?
(b.) Where are the areas of lowest water vapor content and how do these areas correlate to the climate belts shown in the Atmospheric Circulation Diagram (Fig. 5)?
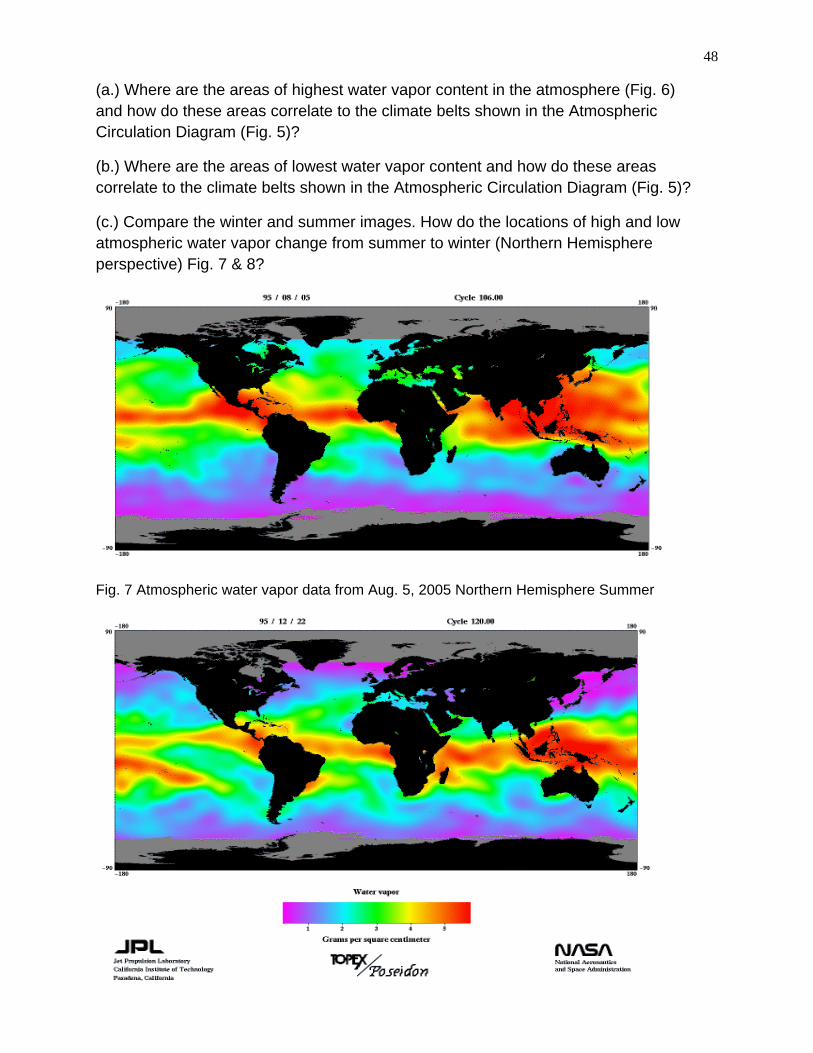
(c.) Compare the winter and summer images. How do the locations of high and low atmospheric water vapor change from summer to winter (Northern Hemisphere perspective) Fig. 7 & 8?
Fig. 7 Atmospheric water vapor data from Aug. 5, 2005 Northern Hemisphere Summer
49
Fig. 8 Atmospheric water vapor data from Dec. 22, 2005 Northern Hemisphere Winter
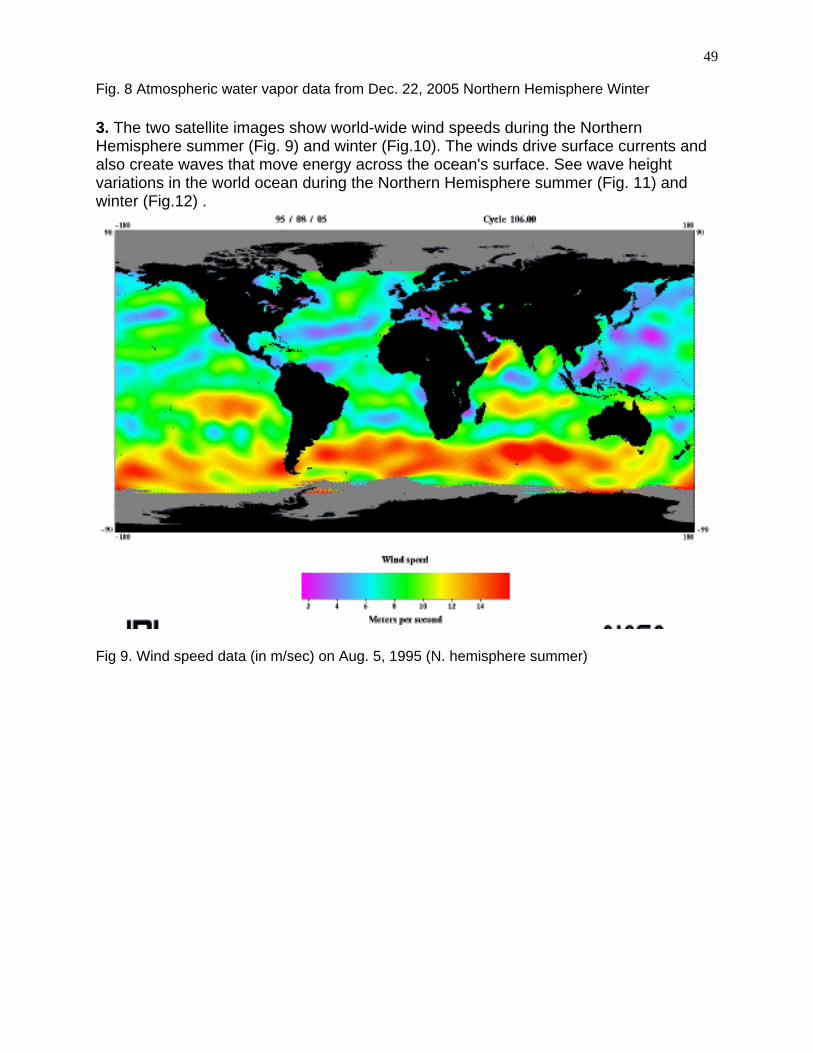
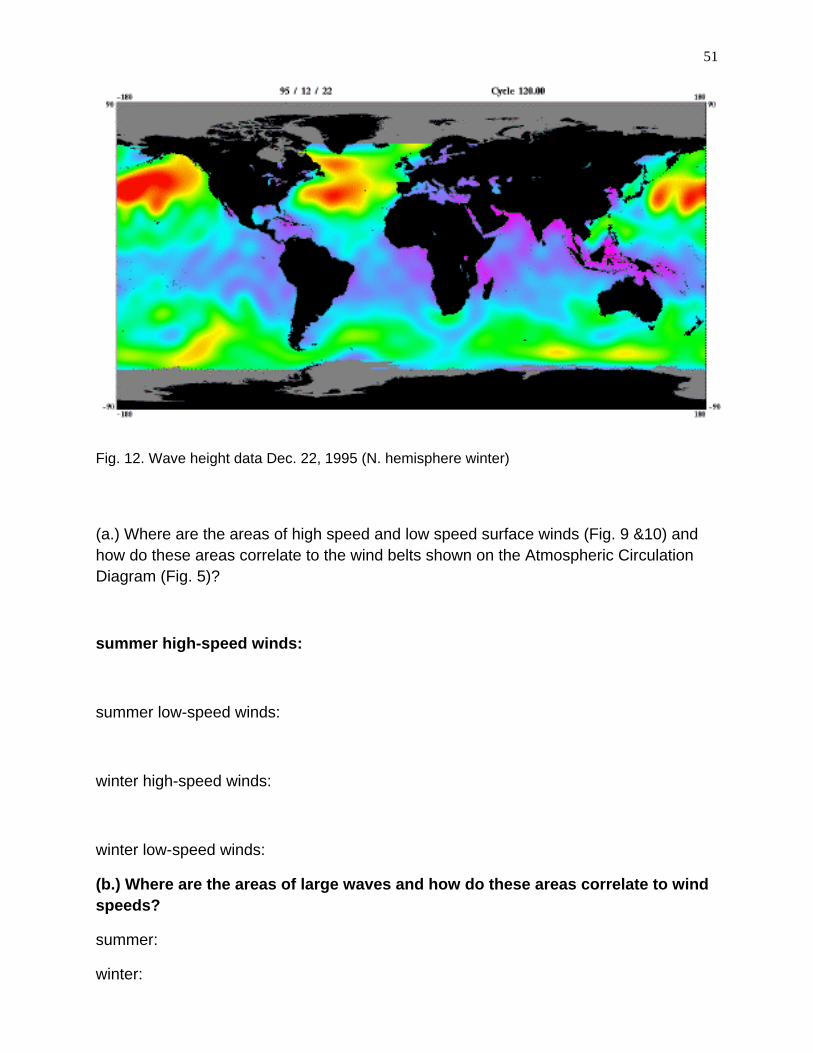
3. The two satellite images show world-wide wind speeds during the Northern Hemisphere summer (Fig. 9) and winter (Fig.10). The winds drive surface currents and also create waves that move energy across the ocean's surface. See wave height variations in the world ocean during the Northern Hemisphere summer (Fig. 11) and winter (Fig.12) .
Fig 9. Wind speed data (in m/sec) on Aug. 5, 1995 (N. hemisphere summer)
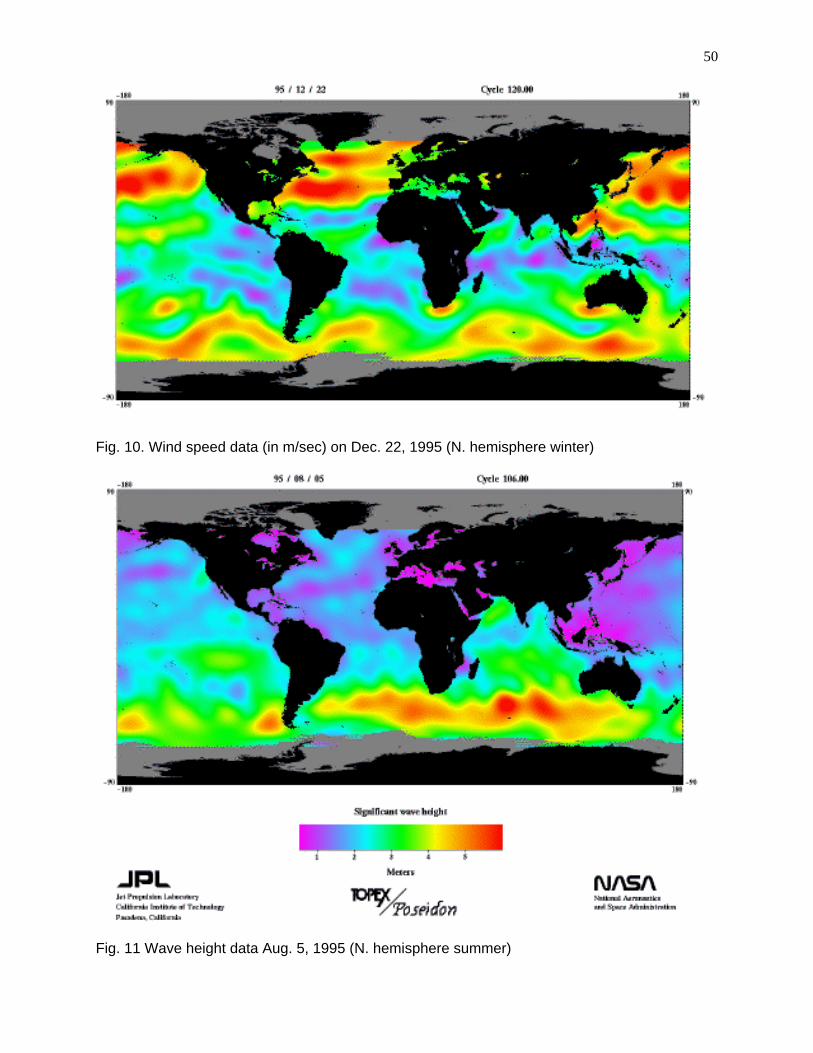
Fig. 11 Wave height data Aug. 5, 1995 (N. hemisphere summer)
Fig. 10. Wind speed data (in m/sec) on Dec. 22, 1995 (N. hemisphere winter)
50
urface winds (Fig. 9 &10) and belts shown on the Atmospheric Circulation
do these areas correlate to wind
winter:
Fig. 12. Wave height data Dec. 22, 1995 (N. hemisphere winter)
(a.) Where are the areas of high speed and low speed show do these areas correlate to the wind Diagram (Fig. 5)?
summer high-speed winds:
summer low-speed winds:
winter high-speed winds:
winter low-speed winds:
(b.) Where are the areas of large waves and howspeeds?
summer:
51
52
PART 2B:
Investigating atmospheric circulation and surface currents---other satellite imagery
Sea-surface temperatures (SSTs) are easily measured by satellites and can show the locations of currents that move across the ocean's surface. The following images show examples of Earth's major currents, delineated by measured differences in sea-surface temperatures.
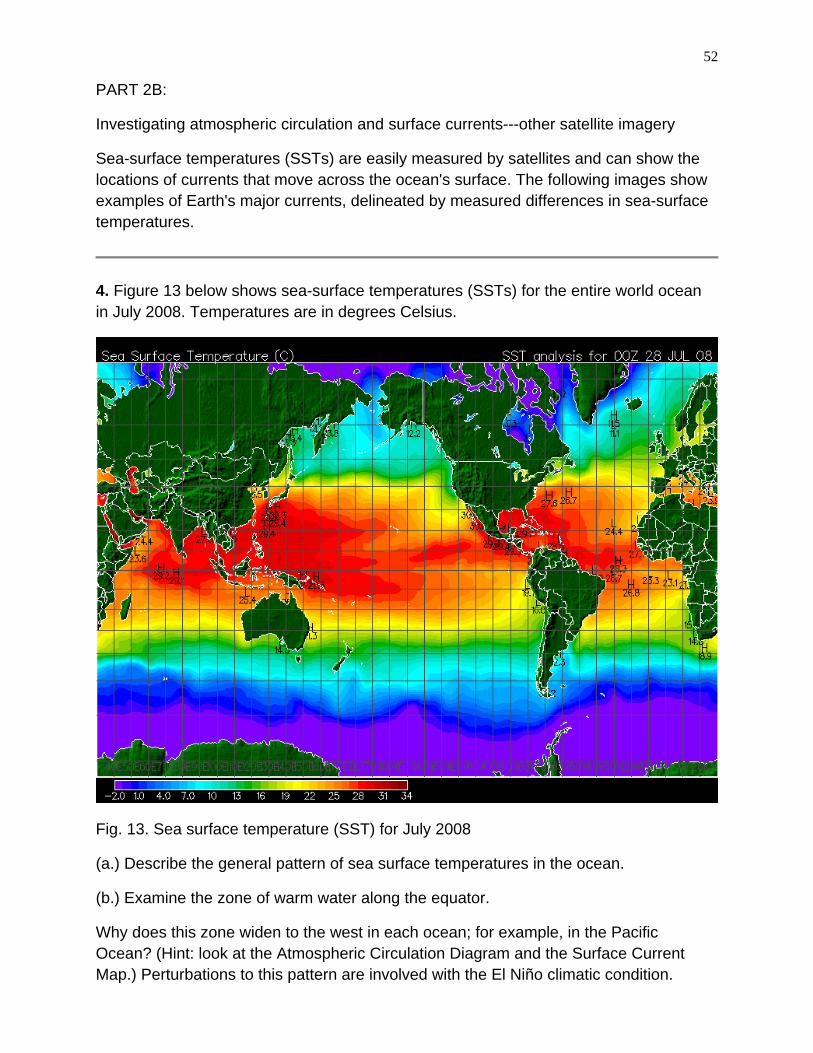
4. Figure 13 below shows sea-surface temperatures (SSTs) for the entire world ocean in July 2008. Temperatures are in degrees Celsius.
perature (SST) for July 2008
ea surface temperatures in the ocean.
each ocean; for example, in the Pacific culation Diagram and the Surface Current
Fig. 13. Sea surface tem
(a.) Describe the general pattern of s
(b.) Examine the zone of warm water along the equator.
Why does this zone widen to the west in Ocean? (Hint: look at the Atmospheric CirMap.) Perturbations to this pattern are involved with the El Niño climatic condition.
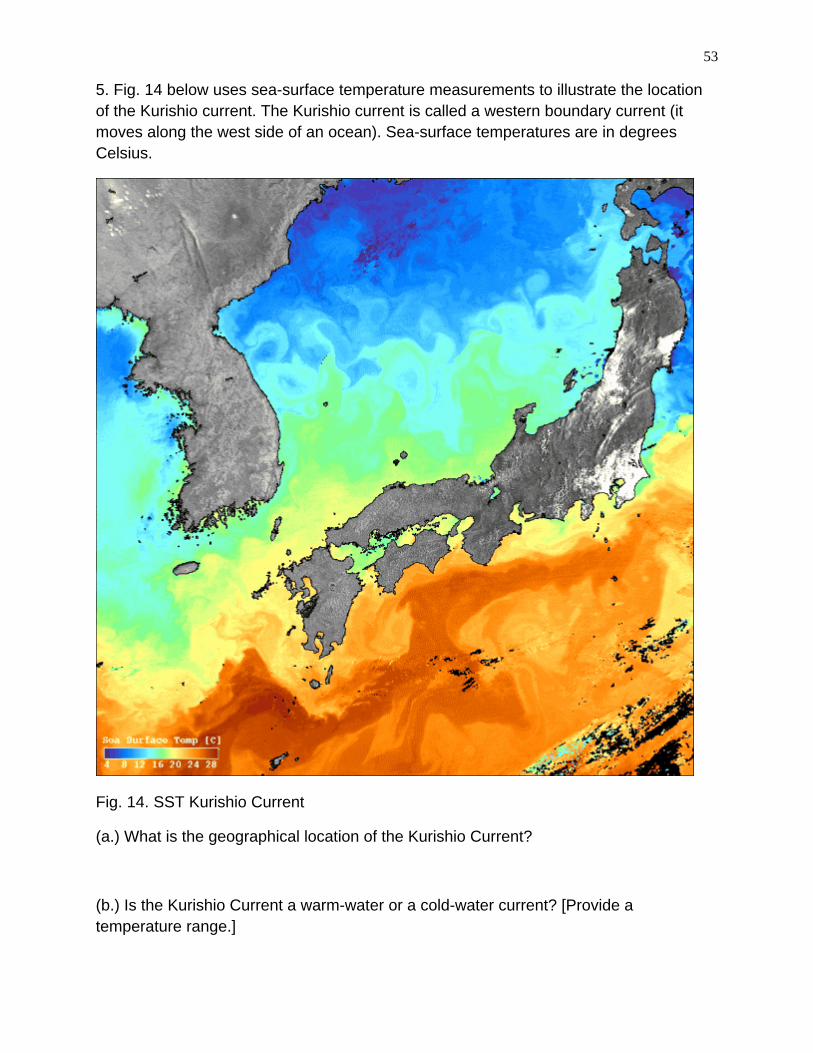
Fig. 14. SST Kurishio Current
(a.) What is the geographical location of the Kurishio Current?
(b.) Is the Kurishio Current a warm-water or a cold-water current? [Provide a
temperature range.]
53
5. Fig. 14 below uses sea-surface temperature measurements to illustrate the location of the Kurishio current. The Kurishio current is called a western boundary current (it moves along the west side of an ocean). Sea-surface temperatures are in degrees Celsius.
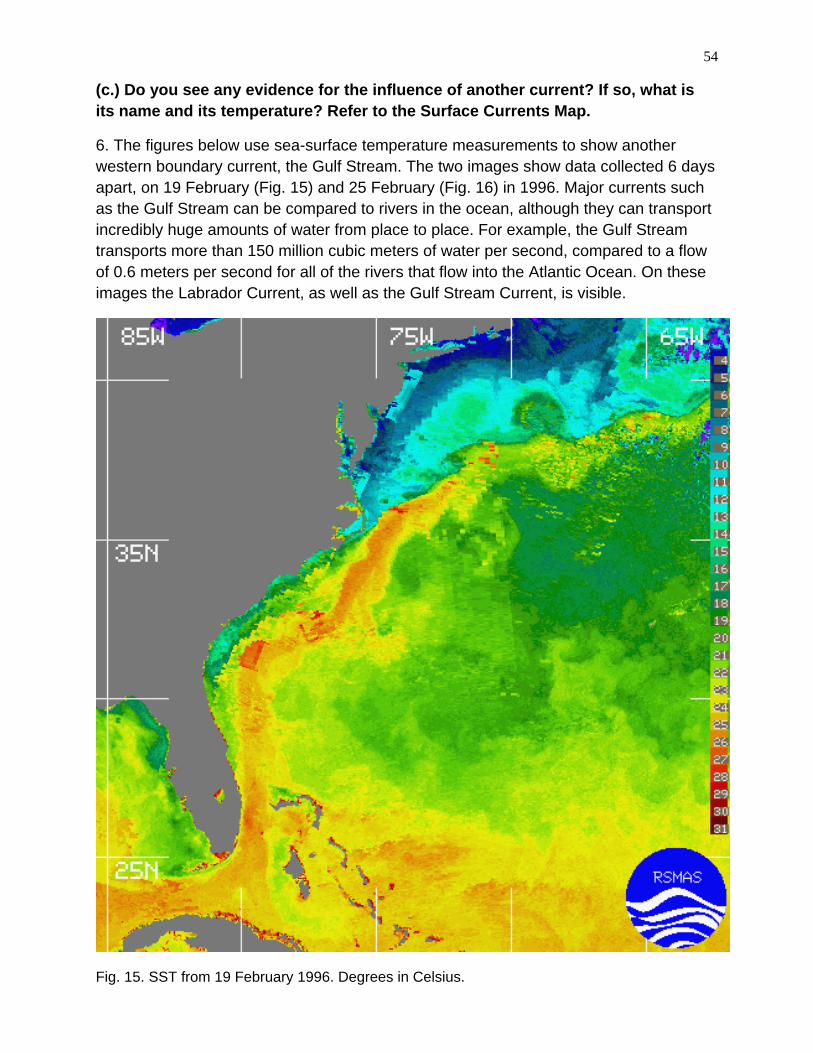
Fig. 15. SST from 19 February 1996. Degrees in Celsius.
54
(c.) Do you see any evidence for the influence of another current? If so, what is its name and its temperature? Refer to the Surface Currents Map.
6. The figures below use sea-surface temperature measurements to show another western boundary current, the Gulf Stream. The two images show data collected 6 days apart, on 19 February (Fig. 15) and 25 February (Fig. 16) in 1996. Major currents such as the Gulf Stream can be compared to rivers in the ocean, although they can transport incredibly huge amounts of water from place to place. For example, the Gulf Stream transports more than 150 million cubic meters of water per second, compared to a flow of 0.6 meters per second for all of the rivers that flow into the Atlantic Ocean. On these images the Labrador Current, as well as the Gulf Stream Current, is visible.
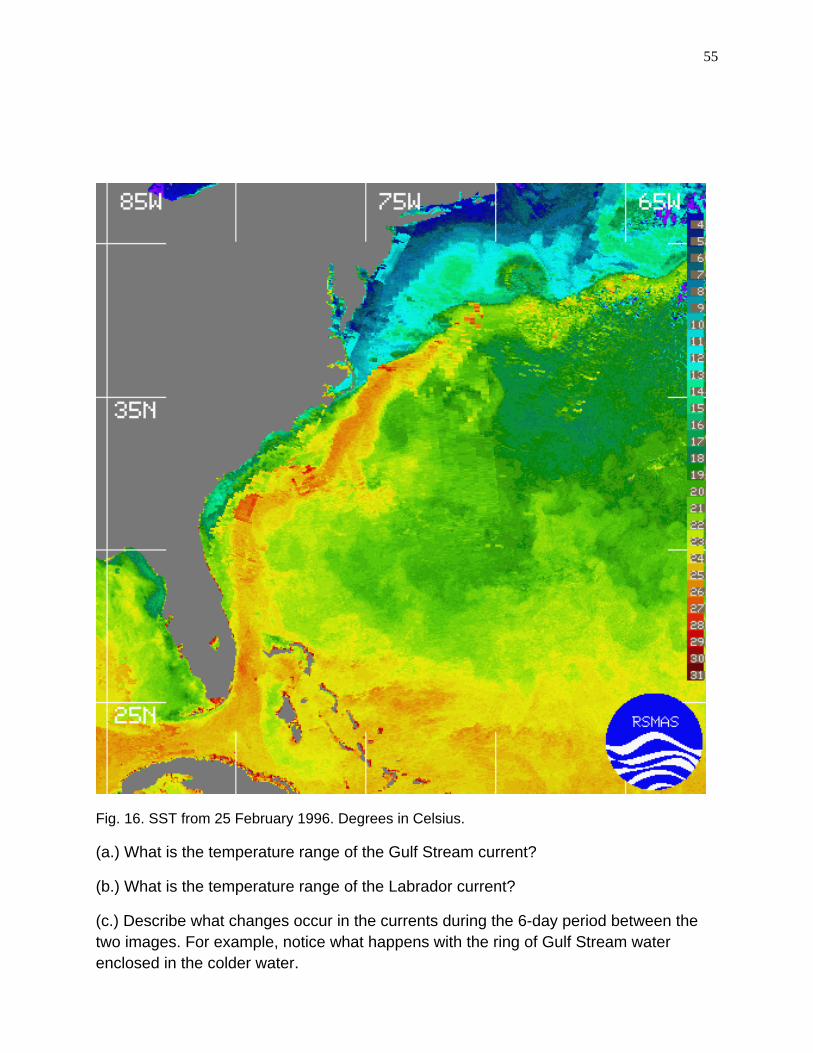
Fig. 16. SST from 25 February 1996. Degrees in Celsius.
(a.) What is the temperature range of the Gulf Stream current?
(b.) What is the temperature range of the Labrador current?
(c.) Describe what changes occur in the currents during the 6-day period between the two images. For example, notice what happens with the ring of Gulf Stream water enclosed in the colder water.
55
rrent from Feb. 21, 1996.
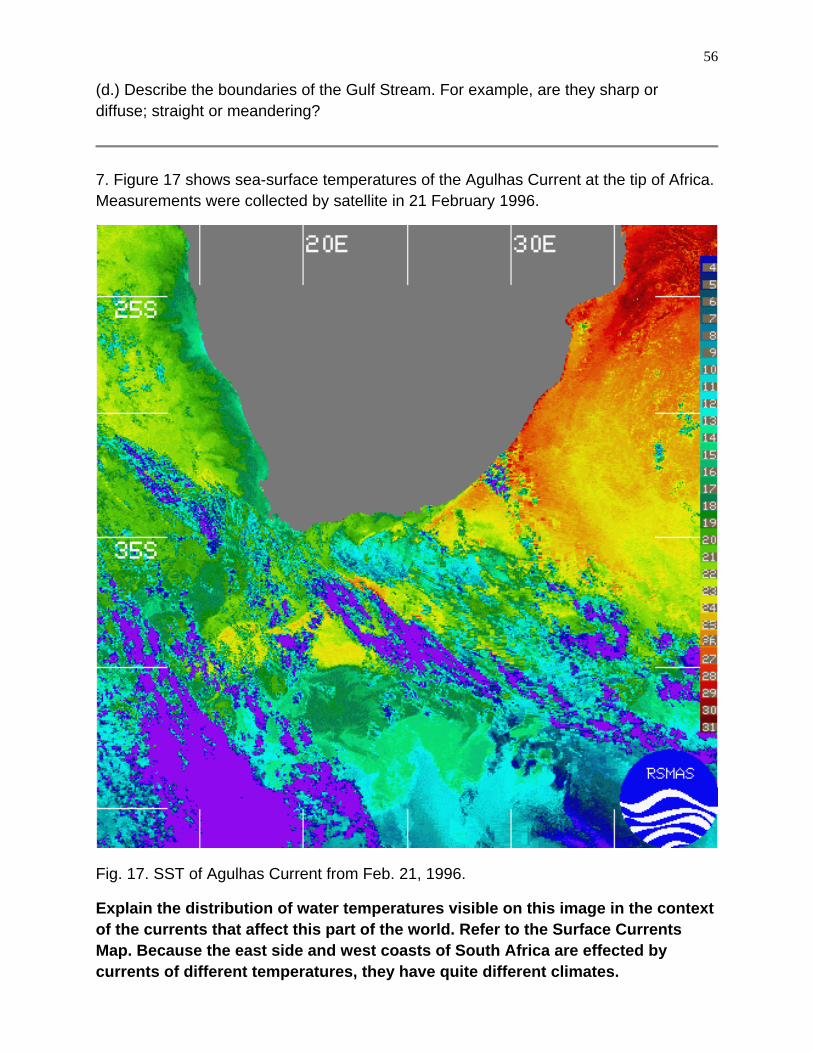
ater temperatures visible on this image in the context this part of the world. Refer to the Surface Currents
Map. Because the east side and west coasts of South Africa are effected by currents of different temperatures, they have quite different climates.
Fig. 17. SST of Agulhas Cu
Explain the distribution of wof the currents that affect
7. Figure 17 shows sea-surface temperatures of the Agulhas Current at the tip of Africa. Measurements were collected by satellite in 21 February 1996.
56
(d.) Describe the boundaries of the Gulf Stream. For example, are they sharp or diffuse; straight or meandering?
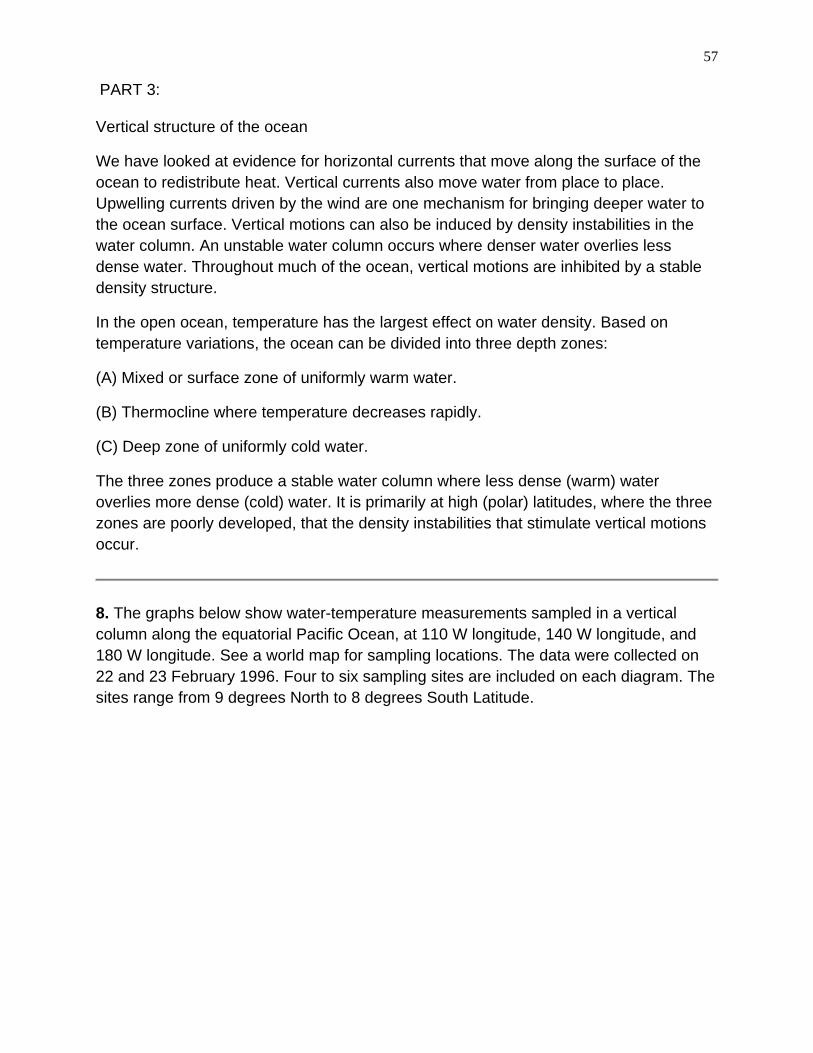
8. The graphs below show water-temperature measurements sampled in a vertical column along the equatorial Pacific Ocean, at 110 W longitude, 140 W longitude, and 180 W longitude. See a world map for sampling locations. The data were collected on 22 and 23 February 1996. Four to six sampling sites are included on each diagram. The sites range from 9 degrees North to 8 degrees South Latitude.
57
PART 3:
Vertical structure of the ocean
We have looked at evidence for horizontal currents that move along the surface of the ocean to redistribute heat. Vertical currents also move water from place to place. Upwelling currents driven by the wind are one mechanism for bringing deeper water to the ocean surface. Vertical motions can also be induced by density instabilities in the water column. An unstable water column occurs where denser water overlies less dense water. Throughout much of the ocean, vertical motions are inhibited by a stable density structure.
In the open ocean, temperature has the largest effect on water density. Based on temperature variations, the ocean can be divided into three depth zones:
(A) Mixed or surface zone of uniformly warm water.
(B) Thermocline where temperature decreases rapidly.
(C) Deep zone of uniformly cold water.
The three zones produce a stable water column where less dense (warm) water overlies more dense (cold) water. It is primarily at high (polar) latitudes, where the three zones are poorly developed, that the density instabilities that stimulate vertical motions occur.
Graph 1. Pacific Ocean water temperature measurements for 110 W longitude
58
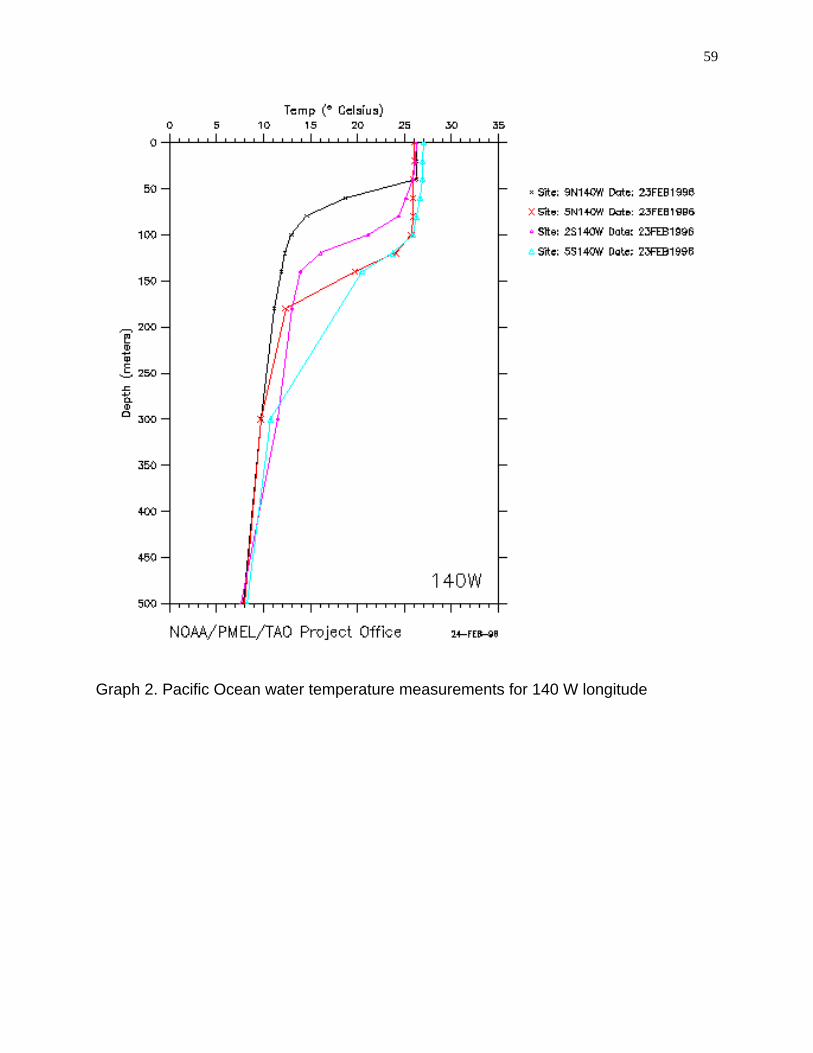
Graph 2. Pacific Ocean water temperature measurements for 140 W longitude
59
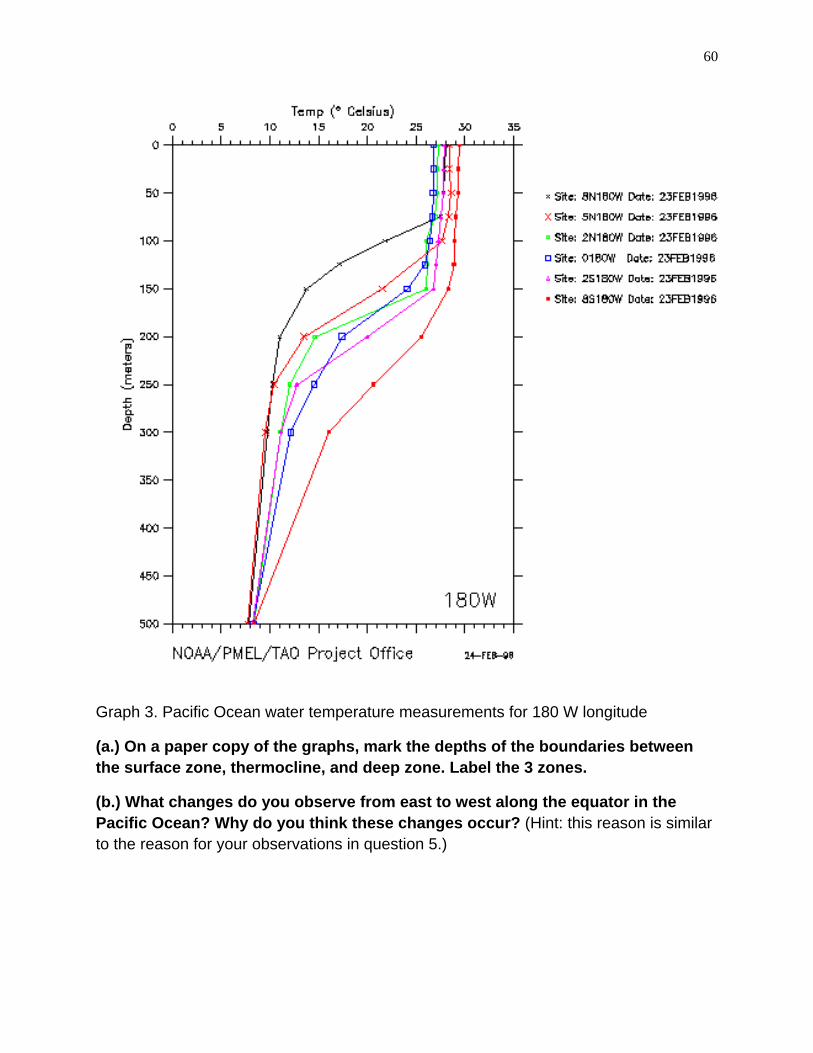
Graph 3. Pacific Ocean water temperature measurements for 180 W longitude
(a.) On a paper copy of the graphs, mark the depths of the boundaries between the surface zone, thermocline, and deep zone. Label the 3 zones.
(b.) What changes do you observe from east to west along the equator in the Pacific Ocean? Why do you think these changes occur? (Hint: this reason is similar to the reason for your observations in question 5.)
60
61
Part 4. Explore the world of ocean topography from space with this 3D interactive viewer from the Jet Propulsion Laboratory.
4A.http://climate.jpl.nasa.gov/
4A-1. What is Jason I?
4A-2. What does TOPEX Poseidon measure?
4A-3. How often does El Nino occur?
4A-4. What impact does El Nino have on our climate?
4A-5. What level on the Richter scale was the Sumatran earthquake?
4B. Sea level viewer: http://climatechange.jpl.nasa.gov/SeaLevelViewer/seaLevelViewer.cfm
4B-1. What percentage of ice was lost in the Arctic from 1979 to 2007?
4B-2. Which countries ice sheet, if melted, would cause a 5-7 meter rise in sea level?
4B-3. How much has sea level risen since 1992? over this century?
4B-4. What is our current CO2 level?
4B-5. When in our past were levels this high?
4B-6. What has been our average temperature change since 1895?
4B-7. Is the ozone hole growing or shrinking?
4B-8. What is ozone and how does it help our planet?
4B-9. What destroys ozone?
4C. Climate Time machine: http://climate.jpl.nasa.gov/ClimateTimeMachine/climateTimeMachine.cfm
4D. Global Change Theater: http://climate.jpl.nasa.gov/videos/index.cfm
62
Part 5. Sea Level rise in Hawaii SOEST’s Chip Fletcher
http://www.soest.hawaii.edu/coasts/sealevel/index.html
Watch the movie:
• The 1 m contour at high tide - the "Blue Line Project"
• Salt water flooding through storm drains in Mapunapuna
• Model of Sea-level rise, coastal erosion, and wave overtopping in Waimanalo
• Waikiki flooding under 1m of sea level rise
Part 6. Earth Science Highlights:
http://svs.gsfc.nasa.gov/stories/earth_sci_20040422/index.html
Watch the movie:
• SEASONS OF CHANGE: EVIDENCE OF ARCTIC WARMING GROWS
• THE CASE OF SOOT AND RECEDING ICE
63
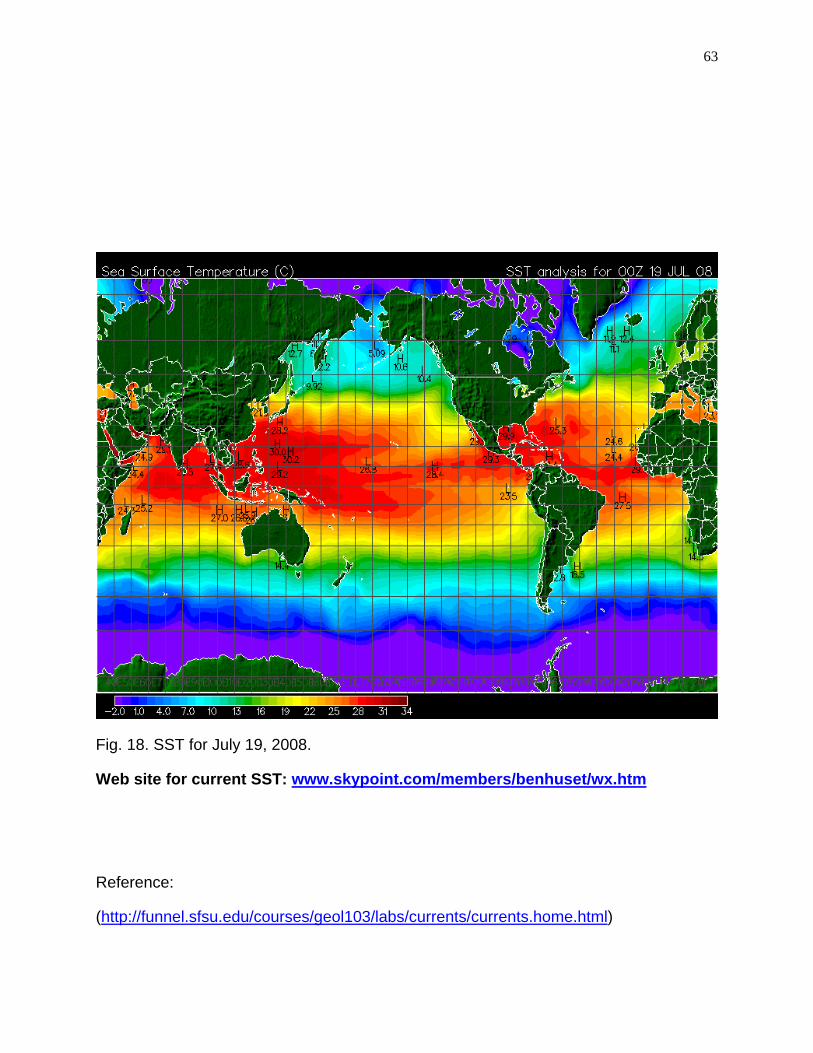
www.skypoint.com/members/benhuset/wx.htm
Fig. 18. SST for July 19, 2008.
Web site for current SST:
abs/currents/currents.home.html
Reference:
(http://funnel.sfsu.edu/courses/geol103/l )
64
Fig. 1. Surface Ocean Currents
65180 165 150 135 120 105 90 75 60 45 30 15 0 15 30 45 60 75 90 105 120 135 150 165 180
90
75
60
45
30
15
0
15
30
45
60
75
90Fig. 2
66
Fig. 3 Status of Global Drifter Array Feb. 12, 2007
67
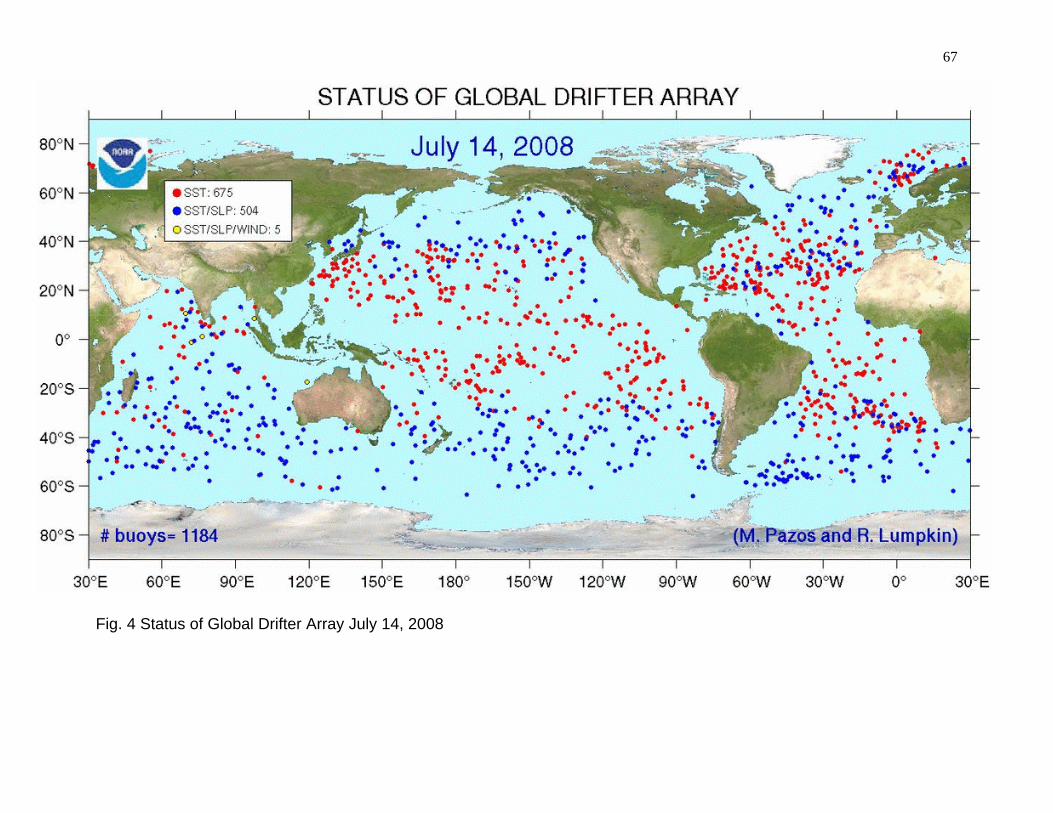
Fig. 4 Status of Global Drifter Array July 14, 2008
68
Fig. 5 Atmospheric Circulation Diagram