Embed Size (px)
Citation preview

1
Experimental Study on Heat Transfer of Flat-Wall-Impinging Diesel Spray Flame
(平板に衝突するディーゼル噴霧火炎の壁面熱伝達に関する実験的研究)
学位取得年月 2019年9月
Rizal Mahmud

2
EXPERIMENTAL STUDY ON HEAT
TRANSFER OF FLAT-WALL-IMPINGING DIESEL SPRAY FLAME
by
RIZAL MAHMUD
Dissertation
Submitted to the Graduate School of Engineering
University of Hiroshima
In Partial Fulfillment of the Requirements
For the Degree of
Doctor of Engineering
University of Hiroshima
September, 2019

i
ABSTRACT
In internal combustion engines, a substantial amount of the fuel’s energy input is lost
due to heat transfer through the walls of the combustion chamber. This heat loss reduces thermal
efficiency, as spray/wall impingement plays a crucial role in direct-injection diesel engines. The
engine’s heat loss occurs during combustion, mainly due to the heat transfer between the
impinging spray/flame and the piston cavity wall. This study investigated the mechanism of the
heat transfer from the spray flame to the impinging wall under small diesel engine-like
condition.
To investigate the correlation between the diesel flame and wall heat loss, this research
studied natural luminosity photography of the flame and measured transient heat flux to the
wall. Using a constant volume vessel with a fixed impingement wall, the study measured the
surface heat flux of the wall at the locations of spray flame impingement using three thin-film
thermocouple heat-flux (TFTHF) sensors. The effects of impingement distance, injection
pressure, nozzle hole diameter, and oxygen concentration and their combined effect on heat
transfer were investigated parametrically.
The results show the effects of various experimental parameters on the spray/flame
impingement behavior, with heat loss occurring significantly under some conditions. In some
of the investigated parameter conditions, decreasing the oxygen concentration was effective in
reducing the heat transfer through the wall due to the lower temperature distribution. Regarding
the ratio of total heat transfer between non-combustion and combustion, around 30% of the heat
transferred through the wall was caused by the convection of non-combustion evaporating
spray. Moreover, we confirmed that the relationship between the Nusselt number and the
Reynolds number was a useful measure for describing heat-transfer phenomena in diesel
combustion.

ii
CONTENTS
ABSTRACT ................................................................................................................................ i
CONTENTS .............................................................................................................................. ii
NOMENCLATURES ............................................................................................................... vi
CHAPTER 1 INTRODUCTION ............................................................................................... 1
1.1 BACKGROUND AND MOTIVATIONS .................................................................... 1
1.2 OBJECTIVES AND APPROACHES ........................................................................... 3
1.3 OUTLINES .................................................................................................................... 4
1.4 REVIEW OF PREVIOUS WORKS ............................................................................. 5
1.4.1 Heat Transfer in Engine Combustion Chamber ................................................ 5
1.4.2 Heat Transfer Correlation ..................................................................................... 6
1.4.3 Heat Transfer of Wall Impinging Spray ............................................................... 7
(1). Wall Impinging Spray Structure ..................................................................... 7
(2). Wall Impinging Spray on Heat Transfer and Combustion Process ................ 9
(3). Modeling of Wall Impingement .................................................................... 12
1.4.4 Optical Diagnostic Technique for Diesel Spray .................................................. 15
1.5 SUMMARY ................................................................................................................ 19
CHAPTER 2 EXPERIMENTAL APPERATUS, MEASURING METHODS, AND
EXPERIMENTAL CONDITIONS ........................................................................................ 21
2.1 HIGH-PRESSURE AND HIGH-TEMPERATURE CHAMBER ............................. 21
2.2 IMPINGEMENT WALL ............................................................................................. 24
2.3 OPTICAL MEASUREMENT TECHNIQUES ........................................................... 24
2.3.1 Mie Scattering Method ..................................................................................... 24
2.3.2 Natural Luminosity Recording System and Two-Color Pyrometry .................. 25
(1). Principle Two-Color Pyrometry .................................................................... 25
(2). Calibration of Two-Color Pyrometry ..................................................................... 26
2.4 HEAT FLUX SENSOR AND MEASUREMENT ...................................................... 29

iii
2.4.1 Thin Film Thermocouple Heat Flux Sensor ...................................................... 29
2.4.2 Heat Flux Measurement .................................................................................... 30
2.5 DATA ACQUISITION ............................................................................................... 33
2.6 TEST CONDITIONS .................................................................................................. 35
2.7 SUMMARY ................................................................................................................. 35
CHAPTER 3 HEAT TRANSFER UNDER BASELINE CONDITION.................................. 37
3.1 INTRODUCTION ....................................................................................................... 37
3.2 EXPERIMENTAL CONDITIONS ............................................................................ 37
3.3 SPRAY BEHAVIOR .................................................................................................. 39
3.4 COMBUSTION FLAME BEHAVIOR ..................................................................... 41
3.5 HEAT FLUX AND TOTAL HEAT TRANSFER ..................................................... 42
3.6 SUMMARY ............................................................................................................... 44
CHAPTER 4 HEAT TRANSFER UNDER VARIOUS IMPINGING DISTANCES ........... 47
4.1 INTRODUCTION ....................................................................................................... 47
4.2 EXPERIMENTAL CONDITIONS ............................................................................. 47
4.3 SPRAY BEHAVIOR .................................................................................................. 48
4.4 COMBUSTION FLAME CHARACTERISTICS ...................................................... 50
4.4.1 Flame Natural Luminosity ................................................................................ 50
4.4.2 Two-Color Method Results ............................................................................... 52
4.4.3 Flame Contact Area ........................................................................................... 56
4.5 HEAT FLUX AND TOTAL HEAT TRANSFER ..................................................... 58
4.6 SUMMARY ................................................................................................................ 63
CHAPTER 5 EFFECT OF INJECTION PRESSURE AND NOZZLE HOLE DIAMETER 65
5.1 INTRODUCTION ...................................................................................................... 65
5.2 EXPERIMENTAL CONDITIONS ............................................................................ 65
5.3 NON_COMBUSTION SPRAY BEHAVIOR AND WALL HEAT TRANSFER
UNDER INJECTION PRESSURE ............................................................................ 66
5.3.1 Spray Behavior .................................................................................................. 66
5.3.2 Heat Flux on the Wall Surface ......................................................................... 70

iv
5.4 COMBUSTION FLAME BEHAVIOR AND WALL HEAT TRANSFER UNDER
INJECTION PRESSURE .......................................................................................... 71
5.4.1 Combustion Flame Behavior ......................................................................................... 71
5.4.2 Heat Flux on the Wall Surface ........................................................................................ 74
5.5 COMBUSTION FLAME BEHAVIOR AND WALL HEAT TRANSFER UNDER
NOZZLE HOLE DIAMETER .................................................................................... 79
5.5.1 Combustion Flame Behavior ............................................................................. 79
5.5.2 Heat Flux on the Wall Surface ......................................................................... 81
5.5.3 Effect Nozzle Hole Diameter and Injection Pressure on Areal Transferred Heat
............................................................................................................................. 84
5.6 SUMMARY ................................................................................................................ 86
CHAPTER 6 EFFECT OF OXYGEN CONCENTRATION ON HEAT TRANSFER .......... 89
6.1 INTRODUCTION ....................................................................................................... 89
6.2 EXPERIMENTAL CONDITIONS ............................................................................ 89
6.3 COMBUSTION FLAME BEHAVIOR ...................................................................... 90
6.4 HEAT FLUX ON THE WALL SURFACE ............................................................... 93
6.5 SUMMARY ................................................................................................................ 95
CHAPTER 7 COMBINED EFFECT OF IMPINGEMENT DISTANCE/INJECTION
PRESSURE AND OXYGEN CONCENTRATION/INJECTION PRESSURE .................... 97
7.1 INTRODUCTION ....................................................................................................... 97
7.2 EXPERIMENTAL CONDITIONS ............................................................................. 97
7.3 COMBINED EFFECT OF IMPINGEMENT DISTANCE/INJECTION PRESSURE
ON WALL HEAT TRNASFER ................................................................................. 99
7.3.1. Combined Effect of Impingement Distance and Injection Pressure under Non-
combustion ...................................................................................................... 101
7.3.2. Combined Effect of Impingement Distance and Injection Pressure under
Combustion ..................................................................................................... 102
7.3.3. Combined Effect of Impingement Distance and Injection Pressure on Wall Heat
Transfer ........................................................................................................... 103
v
7.4 COMBINED EFFECT OF OXYGEN CONCENTRATION/INJECTION PRESSURE
ON WALL HEAT TRNASFER ............................................................................... 105
7.5 HEAT TRANSFER CORRELATIONS ................................................................... 108
7.5.1 Flamelet Velocity ............................................................................................................ 108
7.5.2 Relation between Reynolds Number and Nusselt Number ............................ 110
7.6 MULTIVARIABLE ANALYSIS ............................................................................. 111
7.7 SUMMARY .............................................................................................................. 114
CHAPTER 8 CONCLUSIONS ............................................................................................. 117
8.1 MAIN FINDINGS OF THIS STUDY ...................................................................... 117
8.2 RECOMMENDATIONS FOR FUTURE WORKS ................................................. 122
REFERENCES ..................................................................................................................... 124
ACKNOWLEDGEMENTS ................................................................................................. 135
APPENDIX ........................................................................................................................... 136
Data Acquisition Flowchart
Validation Between Experiment and Simulation
Paper Lists

vi
NOMENCLATURES
A Instantaneous contact area
ASOI After start of injection
CFD Computational fluid dynamics
CVV Constant volume vessel
DI Direct injection
Dimp Impingement distance
Dimp/Pinj Impingement distance and high injection pressure
Dhole Nozzle hole diameters
EGR Exhaust gas recirculation
ECU Electronic Control Unit
FFT Fast Fourier Transform
fps Frame speed per second
ℎ Heat transfer coefficient
i Step in the depth direction
ICE Internal combustion engines
K Bulk modulus of the fuel
k Step in the time direction
m Mass of fuel
L Characteristic lengt
LAS The laser absorption-scattering
LIEF Laser-induced exciplex fluorescence
LIF Laser-induced fluorescence
LRS Laser rayleigh scattering
O2/Pinj Oxygen concentration and high injection pressure
P Chamber pressure
q Heat flux

vii
RNG Renormalization group
RoHR Rate of heat release
SI Spark ignition
SRS Spontaneous raman scattering
TFTHF Thin film thermocouple heat flux
T Absolute temperature
T (i,k) Temperature of the depth i at time k.
Tgas Gas temperature
Twall Wall temperature
U Characteristic velocity
V Chamber volume
cp Specific heat.
Nu Nusselt number
Pr Prandtl number
Re Reynolds number
ρ Fuel density
λ Wavelength
α Thermal diffusivity
κ Thermal conductivity
𝜇 Viscosity

1
CHAPTER 1
INTRODUCTION
1.1 BACKGROUND AND MOTIVATIONS
Fossil fuel, a primary energy source worldwide, continues to be the main source of
energy for transportation. This primary energy consumption grew strongly in 2017 and grew
the fastest since 2013 [1]. It is estimated the demand for this fuel will continue to grow by
around 20% from 2016 to 2040 [2–3]. Even though demand for almost all types of fuel energy
for transportation is increasing, diesel and gasoline fuel will continue to dominate over the next
decades (2040) as shown in Figure 1.1.
Figure 1.1 Global transportation energy mix evolves [2]
Moreover, global transport emissions have also increased and heavily contribute
emissions such as NOX, particulates and CO. Therefore, to decrease these emissions, and for
environmental protection, emission regulations have gradually become increasingly stringent.
Examples include the European Euro 1 to 6 standards and the US Tier 1 to 3 standards [4]. This
controlled emission is significantly affected by advanced engine technology.
The increasingly strict global emission regulations for vehicles reflect the limited supply
of nonrenewable energy resources, which will eventually run out. Therefore, optimization of

2
engine combustion strategies to improve fuel economy and emissions are an important focus
for engine research and development. As a result, along with improvement in fuel economy,
recent small-size DI (direct injection) diesel engines have become more efficient and produced
low emission because of advanced emission control technologies [5]. However, heat loss is still
one of the major factors that contributes to a substantial amount of energy loss for engines.
More than half of total heat energy in the internal-combustion engine is lost by cooling through
the cylinder wall to the atmosphere and the exhaust gas. As explained by Heywood [6], the
conversion from total fuel energy to useful energy output for diesel and SI (spark ignition)
engines is only under 40% and 30%, respectively.
The energy balance in the engines is illustrated in Figure 1.2 (a-b). This figure represents
the energy losses (in the form of heat) in the engines from the initial applied fuel energy. In a
diesel engine, the conversion to effective power is slightly higher than in a SI engine because
of the higher compression ratio. The ratio between output work and energy losses is lower. Heat
energy loss reduction is essential for improving the thermal efficiency of the engines even
though it is impossible to exclude all the losses from the engines. However, it should be possible
to decrease heat loss in engines for maximizing the thermal efficiency further.
Figure 1.2 Energy balance in the engines [6]
The mechanism of heat transfer inside the combustion chamber is too complex to handle
completely. Complex processes affect heat loss to the cylinder wall, such as gas motion by
combustion chamber shape, spray-wall impingement from nozzle tip, and turbulence levels

3
caused by high-pressure injection and supercharging. The influence of spray impingement is
extremely important because generally, in combustion chamber design, the fuel spray impinges
on the piston cavity before vaporization and mixing are complete. A greater understanding of
the fuel spray impingement affect on heat transfer is the primary motivation for this research.
Furthermore, apart from importance of total heat loss from combustion gas to the
cylinder wall, understanding the mechanism of local heat flux is also important to know. The
general heat flux formula in a diesel engine is shown in below: q is heat flux, ℎ is heat transfer
coefficient, Tgas is the in-cylinder gas temperature, and Twall is the combustion chamber wall
temperature. According to formula (1.1), considering the decreasing value of temporal changes
in the heat transfer coefficient and difference between gas temperature and wall temperature is
required for decreasing heat flux.
𝑞 = ℎ (𝑇𝑔𝑎𝑠 − 𝑇𝑤𝑎𝑙𝑙) (1.1)
Many studies have been published in this field, particularly about heat transfer in diesel
engines. Because of the need to better understand the mechanism of wall heat transfer with
impinging flame on the wall, Senda and a coworker [7]–[10] recently published their study
series that analyzes heat loss using a wall insertion-type constant volume vessel (CVV).
However, these studies have not analyzed the proportion of the heat transferred through
the wall by the convection of non-combustion evaporating spray. Therefore, this study aims to
investigate the characteristics of heat transfer before and during combustion under various
experimental parameters. In addition, the wall temperature was controlled (not used by Senda)
to investigate the wall heat transfer mechanism from spray flame impingement to the wall
surface in CVV under diesel engine-like conditions.
1.2 OBJECTIVES AND APPROACHES
This study aimed at clarifying the heat transfer phenomenon through the combustion
chamber wall and was conducted as a basic investigation about the effect of spray flame
impingement on transient heat flux to the wall under small diesel engine-like conditions.
Several main objectives of this research include:

4
1. Clarify the effect of flat wall impinging spray flame behavior and heat transfer
characteristics under baseline conditions.
2. Investigate the influence of impingement distance on spray flame behavior, transient local
heat flux (non-combustion and combustion conditions), and soot formation.
3. Observe the proportion of heat loss between non-combustion and combustion conditions
under injection pressure and investigate the effect of nozzle hole diameter transient local
heat flux in a combustion condition.
4. Analyze the effect of oxygen concentration on the transient local heat flux characteristics.
5. Explain the combined effect to find the optimum level for decreasing heat loss in a
combustion diesel engine-like condition.
6. Confirm that the heat transfer correlation measurement results provided useful insights into
the diesel engine combustion.
In this study, spray flame behavior was recorded with a high-speed video camera, and
the Mie scattering method was adopted to support the spray impingement illumination
photography. To observe soot distribution and local temperature near wall, a two-color
pyrometry was applied for natural flame color images. In order to investigate the wall heat loss,
three Thin Film Thermocouple Heat Flux (TFTHF) sensors, which measure instantaneous
temperature, were mounted on the wall. Numerical simulation was conducted by CONVERGE
commercial software to obtain gas temperature at a non-combustion condition to calculate the
heat transfer coefficient.
1.3 OUTLINES
To present this work, the dissertation is organized as follows: a review of previous work
such as characteristics of spray flame impingement on the wall, the principle of heat transfer,
and parametric strategies affected in heat transfer combustion diesel engine are given in chapter
1. Chapter 2 describes the experimental apparatus such as constant volume vessel, fuel injection
system, and impingement wall test rig, including the TFTHF sensors. The observation by high-
speed video camera, two-color method, heat flux measurement, and data acquisition are also
introduced. Chapter 3 describes the spray flame combustion behaviors and transient local heat

5
flux characteristics under baseline conditions. Chapter 4 shows the effect of impingement
distance on the heat flux on diesel spray flame, including the distribution of temperature near a
wall and soot emission, respectively, by applying two-color techniques. Chapter 5 deals with
the spray flame behaviors of impinging spray and heat transfer characteristics under different
injection pressures and nozzle hole diameters. The transient heat flux under different oxygen
concentrations is given in chapter 6. Chapter 7 addresses the combination effect on heat transfer
and shows the optimum result to decreasing heat transfer on a diesel engine and a heat transfer
correlation is expressed in this study. Lastly, general conclusions on spray flame behavior and
transient local heat flux in diesel-like conditions and recommendations for future study are
summarized in chapter 8.
1.4 REVIEW OF PREVIOUS WORKS
1.4.1 Heat Transfer in Engine Combustion Chamber
Heat transfer is a primary part of the process that causes energy losses in the efficiency
of fuel conversion. This heat loss dominates in the energy balance in the engine, affecting
engine performance, efficiency, and emissions. In internal combustion engines (ICE), heat
loss from combustion gases through the cylinder wall to the coolant strongly influences the
thermodynamics of the engine cycle [5].
Figure 1.3 illustrates the schematic of the heat transfer process from hot gas inside the
cylinder through the combustion chamber wall to the coolant. Temperature profiles, such as gas
temperature (Tg), mean gas temperature (𝑇�̅�), wall temperature (Tw), and coolant temperature
(Tc), are also plotted in the figure. The heat flux into the wall has both convective and radiation
heat transfer. The heat flux is conducted through the wall and then convected from the wall to
the coolant [6]. Based on the Kono et al. [5] most cooling losses take place through the piston
wall than cylinder head wall and cylinder block wall.

6
Figure 1.3 Schematic of temperature distribution and heat flow across the combustion chamber wall [6]
1.4.2 Heat Transfer Correlation
According to reviewed studies by Borman and Nishiwaki [11], the first formula for
engine heat transfer was introduced by Nusselt in 1923. Nusselt showed that the pressure-
temperature term in his correlation was a free convection relationship [12]. Afterward,
published literature regarding the gas-to-wall heat transfer process in ICE and a number of
correlations have been proposed for calculating the instantons heat transfer coefficient [13]–
[21].
The several empirical correlations to predict the in-cylinder heat transfer coefficient in
ICE were reviewed by Finol and Robinson [22]. The most widely used heat transfer correlations
were derived by Woschni [15] and Annand [14]. The basis of these correlations has relied on
dimensional analysis for turbulent flow that corelates the Nusselt (Nu), Reynolds (Re), and
Prandtl (Pr) numbers. The relationship among Nu, Re, and Pr numbers, which follow those
found applied in a turbulent heat transfer equation of the pipe’s internal flow or over flat plates
[6], [21]. Recently, Kuboyama [23] provided alternative correlations that are applicable to
recent diesel engines. As characteristic velocity, mean piston speed is typically used in
previously proposed heat transfer equations. Kuboyama used flow induced by fuel injection
during the fuel injection period for characteristic velocity. After the fuel injection, character
velocity was used in Woshni’s equation.
gT
gT
T
RCV qq + CNq CVq
gas coolant
gwT ,cwT ,
cT
cT
Distance, x
tw
7
1.4.3 Heat Transfer of Wall Impinging Spray
(1). Wall Impingement Spray Structure
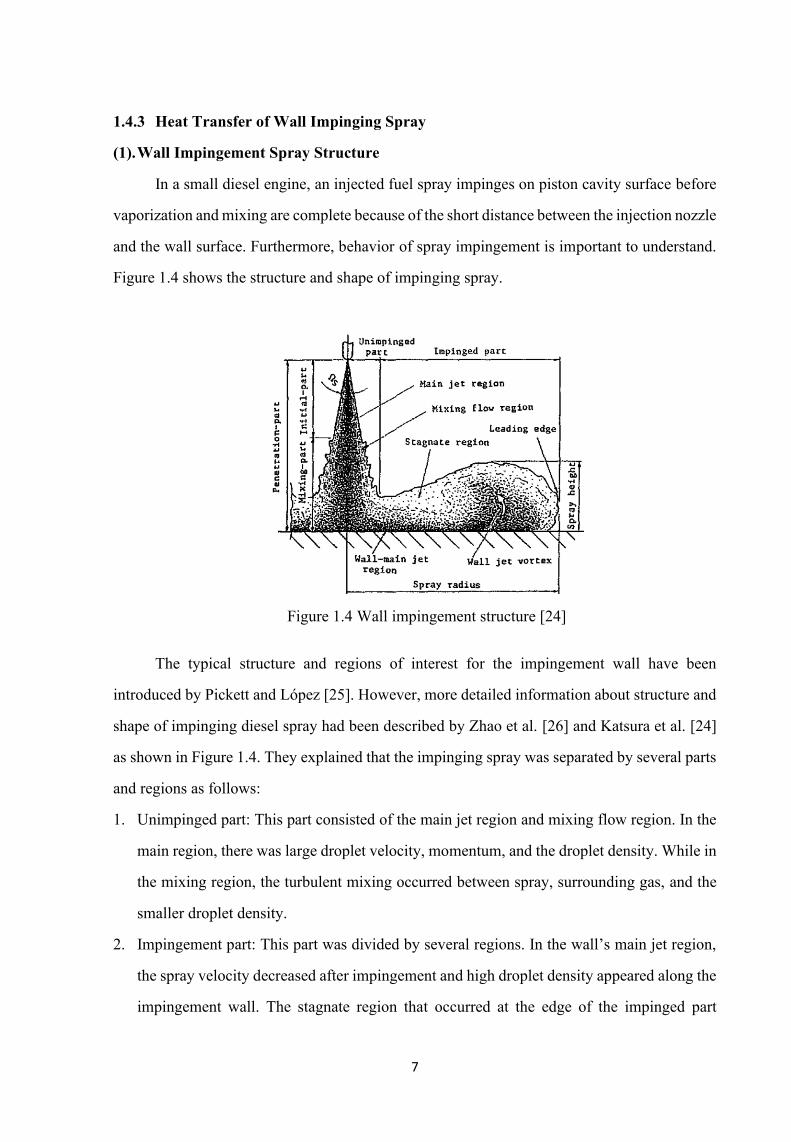
In a small diesel engine, an injected fuel spray impinges on piston cavity surface before
vaporization and mixing are complete because of the short distance between the injection nozzle
and the wall surface. Furthermore, behavior of spray impingement is important to understand.
Figure 1.4 shows the structure and shape of impinging spray.
Figure 1.4 Wall impingement structure [24]
The typical structure and regions of interest for the impingement wall have been
introduced by Pickett and López [25]. However, more detailed information about structure and
shape of impinging diesel spray had been described by Zhao et al. [26] and Katsura et al. [24]
as shown in Figure 1.4. They explained that the impinging spray was separated by several parts
and regions as follows:
1. Unimpinged part: This part consisted of the main jet region and mixing flow region. In the
main region, there was large droplet velocity, momentum, and the droplet density. While in
the mixing region, the turbulent mixing occurred between spray, surrounding gas, and the
smaller droplet density.
2. Impingement part: This part was divided by several regions. In the wall’s main jet region,
the spray velocity decreased after impingement and high droplet density appeared along the
impingement wall. The stagnate region that occurred at the edge of the impinged part

8
because of the droplets in the periphery regions were pushed upward and resulted in loss of
momentum. The wall jet vortex phenomena appeared at a peripheral region of the impinging
spray where the density of droplets was large and turbulent mixing occurred between spray
and surrounding gas. Furthermore, droplets were pushed out to the upper by droplets nearer
the wall.
3. Initial part: This part lies in the near the nozzle tip exit. The spray has a sharp and clear
shape with a spray cone angle (Ωs).
4. Mixing part: This part lies downstream of the end of the initial part to the impingement
wall. In this part, the strong turbulent mixing can be observed.
5. Penetration part: this part is comprised of the initial and mixing parts, where the spray shows
similar characteristics to that of steady spray.
Figure 1.5 Momentum conversion and forces on the impinged spray from the macroscopic point of a view [27]
The information on momentum conversion and forces on the impinged spray introduced
by Park [27] is illustrated in Figure 1.5. This momentum conversion and forces on the impinged
spray phenomenon was observed from the macroscopic point of view. In the center of the
impingement, the axial momentum is converted into the radial momentum. As a result, the
radial velocity of the impinged spray is increased by the impingement. The radial velocity is
decreased by several kinds of forces, or drag. This drag is caused by the ambient gas and wall
friction, the main factors that affect the spray impingement behavior. Studies on velocity
distribution after spray impingement have been carried out by Zama et al. [28] by using a time-
resolved Particle Image Velocimetry (PIV) technique. As a result, the average radial peak

9
velocity of the post impingement diesel spray decreased with an increase of ambient gas density
and a decrease of injection pressure.
Furthermore, spray impingement to the wall has a significant influence on mixture
formation, combustion, and emission. A schematic diagram depicting the conceptual model of
diesel jet combustion under an impinging condition during the stabilized diffusion-limited
combustion phase was described by Bruneaux [29], as shown in Figure 1.6. During the diffusion
combustion phase, the diffusion flame and OH* radical appear at the spray periphery, while the
soot particles are confined to the near flat wall region.
Figure 1.6 Schematic conceptual model of impinging diesel spray under stable diffusion combustion phase [29]
(2). Wall Impingement on Heat Transfer and Combustion Process
There is a long list of publications describing experimental and simulation work with
various parameters of heat transfer in diesel engines. Some studies showed that minimizing
temperature difference between in-cylinder gas and the combustion chamber wall surface was
possible by applying insulation material such as a ceramic coating on the surface [30]–[33]. As
a result, the heat loss was reduced. Thus, both exhaust energy and piston work increased, which
led to improved thermal efficiency.
Li et al. [34] stated that high injection pressure had a significant effect on the heat loss
from combustion gases to the chamber wall. The observations of local heat flux suggested that
in case of high injection pressure, the flux reached a peak, which is attributed to an increase in
local spray velocity. Another study showed that high injection pressure contributed to increases
of flame velocity, flame temperature, and flame contact area because of a fuel injection rate

10
increase [7]. According to a finding by Dahlström et al. [35], the higher the injection pressure
is, the shorter the combustion duration becomes, and thus rate of heat release (RoHR) increases.
The factor contributes to higher in-cylinder temperature and thus increased wall heat transfer.
Senda [36], [37] reported that wall impinging spray combustion has a significant effect
on the heat transfer characteristics. They found that heat transfer decreases as the droplet
impingement frequency increases because of interference between remaining liquid film and
impinging droplets. Nakata et al. [10] demonstrated that the heat flux decreased at some spray
impingement distance to the wall. Decreasing flame velocity because of the momentum loss by
turbulent mixing accounts for this effect.
Bowl geometries and swirl ratio also considered effects on heat loss. Kimura et al. [38]
found that transient heat flux in the piston cavity reduced with a larger cavity diameter and
higher swirl ratio. On the other hand, a transient heat flux in the piston head was not changed
by cavity diameter and swirl ratio. Similarly, Dahlström et al. [35] reported that swirl did not
have any effect on heat transfer. This is because of the spray affecting the in-cylinder flow
pattern, so the near-wall gas velocity may stay relatively unchanged and thus not alter the
convective heat transfer characteristics. Another simulation study reported that in a high
compression ratio case, the shallow dish combustion chamber shape with a plateau at the center
of the combustion chamber showed potential for heat loss reduction [39]. Kogo et al. [30]
demonstrated that the overall heat loss of the new combustion chamber shape (called the taper
lip combustion chamber) is approximately 10 J less than the heat loss of the previous reentrant
combustion chamber. The effect of gas velocity influences heat loss on the different bowl shape.
Perini et al. [40] reported different flow fields at the liner and piston bowl walls leads wall heat
transfer to increase significantly at higher swirl ratios. Kono et al. [5] have confirmed that by
suppressing the reversed squish flow, the heat flux can be decreased with the tapered shallow-
dish cavity compared to the standard cavity.
Engine load and engine speed variations influence heat transfer. Mayer et al. [41]
reported that at higher loads the heat release increases because of the larger amount of fuel
injected, leading to an increase in the cylinder pressure and mean gas temperature. Thus, an
enlarged wall heat flux to the piston occurs. At higher engine speed case, the mean piston

11
temperature increases because of the intensified convective heat transfer and leads to a heat flux
increase.
Tatsumi et al. [8] reported on the heat loss to the wall in a diesel spray flame under
various fuel temperature conditions. It was found that key factors to reduce heat loss under
various fuel temperatures are the flame flow velocity and flame contact area. Elsewhere,
Tatsumi et al. [9] investigated the effect of nozzle hole diameter on heat flux. The controlling
factor of the heat loss with respect to the injection hole diameter is the contact area of the flame
and duration timing of flame contact.
In a simulation study, applying the exhaust gas recirculation (EGR) rate also considered
decreasing flame temperature distribution on heat loss. Comparing the single injection results
at a different EGR rate, it was confirmed that the heat flux was decreased at a higher EGR rate
[42]. With an increasing EGR rate, the oxygen concentration in the fuel/gas mixture decreases
and the specific heat of the cylinder increases and leads to a reaction rate decrease. Further, in-
cylinder pressure and combustion decrease [43]. It was evident with an experimental study by
Kuboyama [44] that the results show that EGR in a diesel engine suggests that it has the effect
of reducing wall surface heat loss.
Spray flame impingement to the wall is also of interest in combustion and emission.
Many studies have been conducted on the impinging spray flame on the wall. In those studies,
researchers [25], [45] focused on the characteristics of combustion and soot formation. Li et al.
[46] investigated the OH* chemiluminescence, flame temperature, and soot emission of flat
wall impinging flame and free flame. The result showed that unburned hydrocarbon emission
and high soot formation increased when impingement occurred. Wang et al. [47] produced
similar results. For example, impingement flame caused deterioration of soot formation when
compared to the free flame. Furthermore, Dec and Tree [48] also concluded that spray/wall
interaction may increase particulate and unburned hydrocarbon emissions and reduce thermal
efficiency. However, Picket and Lo’Pez [25] reported that soot formation was improved by
impingement, because it enhanced combustion when compared with free flame.
(3). Modeling of Wall Impingement

12
Various prediction models for spray wall interaction have been developed in the last
thirty years. Naber and Reitz [49] have proposed a submodel on droplet-wall interaction at
impingement, called stick model, a reflect model (droplets rebound), and liquid jet analogy
model (wall jet), based on the Weber number of impinging droplets. Bai and Gosman [50] have
clasified the impingement model, i.e., dry wall, which consists of a stick, spread, and splash.
Another one is a wetted wall, which consists of rebound, spread, and splash. Senda et al. [51],
[52] developed a spray wall interaction model based on his experimental study on droplet
impingement. They developed the submodel in low-wall temperature and high-wall
temperature conditions, which included fuel film formation on the wall, its breakup process
because of droplet impingement, and the dispersion process of breakup droplets. Furthermore,
they developed the sub model based on several of their experimental results [53]. A good review
of spray-wall impact relevant to IC engines addressed the rationale of describing spray-wall
interactions based on the knowledge of droplet impacts [54], prediction models on wall-
impingement criteria, post-impingement characteristics of single drops, and external and
internal structures of the spray after the wall impact [55].
Criteria of droplet wall interaction can be classified for different conditions that are
shown schematically in Figure 1.7 [49]: (a). Stick: in which the impinging droplet adheres to
the wall in nearly spherical form when the impact energy is very low. (b). Rebound: in which
the impinging droplet bounces off the wall after impact. In a dry wall case, contact between the
liquid droplet and the hot surface is prevented by the intervening vapor film. On a wetted wall,
the air film trapped between the droplet and the liquid film causes low energy loss and results
in bouncing. (c). Spread: the impinging droplet spreads out to form a wall film for a dry wall or
merges with the preexisting liquid film for a wet wall. (d). Boiling-induced breakup: the droplet,
even at very low collision energy, disintegrates because of rapid liquid boiling on a hot wall.
(e). Rebound with break-up: the droplet bounces off a hot surface, accompanied by breakup
into two or three droplets. (f). Break-up: the droplet first undergoes a large deformation to form
a radial film on the ‘hot’ surface, and then the thermo-induced instability within the film causes
the fragmentation of the liquid film in a random manner. (g). Splash: following the collision of

13
a droplet with a surface at a very high impact energy, the jets become unstable and break up
into many fragments.
Figure 1.7 Schematic of different impact regimes [49]
The existence of these impingement regimes is governed by a number of parameters
characterizing the impingement conditions: droplet velocity, size, temperature, incidence angle,
fluid properties such as viscosity, surface tension, wall temperature, surface roughness, and, if
present, wall film thickness and a gas boundary layer at the wall.
They clasified the impinging droplet behavior based on the Weber number into three
types as shown in Figure 1.8 [51]. (I). We < 80 : Because there was no impinging droplet
breakup into film, the impinging droplets were stuck on the wall, and leads fuel film on the wall
surface occurred. (II). 80 ≤ We < 600 : In this We range, the remaining liquid fuel on the wall
or the impinging droplet breaks up into relatively large droplets due to the successive droplet
impingement. (III). We ≥ 600 : When the We number of the droplets were larger than 600, the
fuel film or the impinging droplet breaks up into small droplets.

14
Figure 1.8 Fuel film breakup model by impinging droplets after film formation [51]
Figure 1.9 Fuel film breakup model by impinging droplets after film formation [51]
Figure 1.9 shows their general models for heat transfer, impinging breakup, and droplet
dispersion [51]. Heat transfer model: the impinging droplet spreads as a fuel film in a radial
direction on the wall for a certain period, and thereafter the film shrinks and rebounds from the

15
wall without breaking up, or it breaks up into small droplets. In this case, where the temperature
of the impinging droplet (Tt) is lower than that of the wall surface (Tw), heat is transferred from
the surface to the film formed on the surface during the residence time (td) of the film. The heat
heats the film and evaporates it. Impinging droplet breakup model: the breakup resulting from
the boiling phenomena at the liquid–solid interface and the Sauter mean diameter of breakup
droplets from the liquid film on the wall were dependent upon both the Weber number of the
impinging droplet and the surface temperature (Tw). Breakup droplet dispersion model: an
impinging droplet breaks up into small droplets in a higher Weber number region, and they
must be dispersed in both upward and radial directions.
1.4.4 Optical Diagnostic Technique for Diesel Spray
Optical diagnostic techniques are one of the best ways to provide invaluable insight and
detail information for a better understanding the nature of diesel engine. For the last decades, a
lot of investigations study on some quantitative spray and flame parameters during the fuel-air
mixing and combustion process have been done in different all kinds of optical techniques
development. Different kinds of optical techniques for mixture formation measurement in IC
engine have done reviewed by Zhao and Ladommatos[56], [57]. Each measurement technique
gives some valuable insight into one of the fundamental processes in spray formation. Their
review of various techniques for observation is summarized by Li [45] as in Table 1.1.
The Mie scattering method was used to measure the liquid-phase spray angle and
penetration [58], [59]. In other words, the Mie scattering was applied to measure liquid fuel
behavior [60]. Furthermore, the Mie scattering method was used to measure droplet size and
concentration by Hodges et al. [61] by applying the ensemble-scattering polarization ratio
method. Similarly, 1-d and 2-d Mie scattering were applied to visualize the distribution of the
fuel droplets [62]. According to the Lorenz-Mie theory, the intensity of Mie scattering is
determined by the square of the droplet diameter and the droplets’ concentration when droplets
remain spherical and droplet diameter is larger than 1 μm [64].

16
Table 1.1 Summary of optical techniques for in-cylinder mixture formation measurement
Schlieren and shadowgraph techniques were used for imaging and measuring phenomena
in transparent media [63], [64]. To understand highly transient combustion phenomena such as
diesel spray injection and combustion, shadowgraph/schlieren techniques have been used for
flow visualization of reacting and nonreacting systems [65]–[67]. These optical diagnostics can
simultaneously observe the vapor phase and liquid phase of spray. The details of Schlieren and
Shadowgraph techniques have been described by Settles [63]. Researchers [65], [68], [69] also
using these techniques to identify the spray boundary under evaporating conditions. The optical
setup for Mie and schlieren diagnostics is shown in Figure 1.10 [65].
Technique Aplications Advantages LimitationsMie Liquid fuel distribution Simple setup Sensitive to large
Scattering dropletsSchliren and Observations of Overall Simple setup Sensitive to both liquidshadowgraph spray and vapor phase
LRS Density measurement Strong signal Interference from Mie Vapor concentration Simple setup and spurious
2-D imaging scatteringLimited to gasous fuel
SRS A/F ratio Multi-species detection Weak signalResidual gas fraction multi-point detection
Most accurate A/F readingsUnanffected by windows fouling
LIF Fuel concentration Strong red shifted signal Quenching at high2-D image of fuel pressures
Difficult to calibrateFARLIF A/F ratio Direct A/F measurements Careful calibration
2-D images of fuel required High pressure operation
LIEF Fuel vaporization & 2-D imaging Quenching by oxygenatomization Simultaneous detection of
Vapor and liquidLEA (LAS) Fuel vaporization & Quantitative concentration Poor spatial resolution
atomization measurementsDroplet size information

17
Figure 1.10 shows the optical setup for Mie and schlieren diagnostics [65].
The laser Rayleigh scattering (LRS) technique was applied to a vaporizing diesel spray
to show the transient mixing and attainment of a quasi-steady state. It is also used to determine
the equivalence ratio in the premixed-burn region of a diesel spray [70]. Zhao and Hiroyasu
[71] have reviewed the applications of LRS to combustion diagnostics. Espey et al. [72], [73]
used a planar LRS technique successfully to obtain the quantitative images of fuel vapor
concentration in an optical single cylinder direct injection diesel engine under motored and
firing conditions.
Spontaneous Raman scattering (SRS) is a technique to identify molecular species,
measure gaseous species concentrations, and calculate air/fuel ratio. Hoffmann et al. [62]
determined accurately by using the SRS technique how to measure the quantitative air/fuel ratio
and temperature in the vapor phase before the combustion. The SRS technique was applied,
enabling the quantitative measurement of the local air/fuel-ratio along a line of a few
millimeters by Egermann et al. [74]. The results clearly showed an additional air entrainment

18
into the wall jet and leaner air/fuel ratios in that location. Furthermore, the mixture formation
significantly improved by an increasing injection pressure. Use of the SRS technique
successfully applied in modern diesel injection system like diesel engine condition can be found
in studies by several researchers [75]–[79].
Laser-induced fluorescence (LIF) is an electronic absorption and emission process that
produces relatively strong signal intensity with high spatial resolution [56]. The method was
used in the previous studies to see in-cylinder fuel distribution [80], fuel film in the piston-top
under reacting combustion condition [81], and NO measurement in diesel spray flame [82] or
emissions from HCCI engines [83], [84]. Eventually, Bruneaux [85] clarified combustion
structure of free and wall impingement diesel spray using the information given by
simultaneous LIF techniques under the stable diffusion combustion phase.
Laser-induced exciplex fluorescence (LIEF) is a method to quantitatively measure the
vapor phase and liquid phase of spray simultaneously in engines since its development by
Melton [86]. Numerous studies [51], [85]–[90] exist for measuring the structures of
concentrations of the liquid phase and the vapor phase by applying LIEF. They provide detailed
information on the fuel mixture formation process and give some fundamental principles of free
and imping spray evolution.
The laser absorption-scattering (LAS) technique is an available method to detect vapor
concentration in the presence of liquid fuel droplet in a spray [91]. This technique is based on
the principle that the optical thickness of absorption light attribution to the attenuation by
droplets scattering and vapor absorption, and the optical thickness of transmitted light only
contributed by droplet scattering. LAS technique was firstly proposed by Chraplyvy [92], who
measured vapor and liquid scattering, respectively. During the past twenty years there has been
extensive research to analyze the mixture formation processes in the diesel engine [93]–[97].
Studies have provided the information of quantified liquid and vapor mass concentration,
entrained air concentration, and equivalence ratio.
1.5 SUMMARY
In order to determine the reduction of heat loss from combustion gas to the cylinder wall,
it is necessary to understand the heat transfer mechanism for maximizing the thermal efficiency

19
of the engine, especially in small-size diesel engines. Therefore, the target of this study is to
clarify the effects of impingement distance, injection pressure, oxygen concentration, nozzle
hole diameter, and their combined effect on impinging spray flame behavior, soot formation,
and heat transfer characteristics.
This chapter first gives the background and employed approaches of this study. Then,
the previous works of heat transfer principle, heat transfer in diesel engines, and a spray
impingement model are reviewed. Finally, the optical diagnostics applied in this research are
simply introduced.

20

21
CHAPTER 2
EXPERIMENTAL APPERATUS, MEASURING METHODS, AND
EXPERIMENTAL CONDITIONS
2.1 HIGH-PRESSURE AND HIGH-TEMPERATURE CHAMBER VESSEL
Experiments were performed in a high-pressure and high-temperature chamber vessel
with Denso injector as shown in Figure 2.1. The vessel has four side windows. Two of them
were used for installing an injector and a spray impinging wall plate facing each other. Others
were provided for visualization. In order to simulate an engine-like thermodynamic
environment, an electric heater was installed at the bottom of the chamber, and pressurized hot
air was supplied through an Electric Muffle Furnace. This preheater equipment was produced
hot air temperature up to 973 K, which it can be heated to 753-773 K when hot air entered into
the combustion chamber vessel. The internal and external surfaces of the chamber was covered
by the thermal insulator to avoid the heat conduction and maintain the stable environment. The
chamber pressure was manually operated, whereas the chamber temperature was controlled by
a volt slider for the heater. Water cooling galleries were installed around the glass windows and
the injector holder to avoid overheating. In order to measure ambient temperature, three K-type
thermocouples were fitted near the wall and remaining one K-type thermocouple was fitted at
a distance of 5 mm under the nozzle tip, which was placed between nozzle tip and wall. Diesel
fuel was injected into the chamber when the ambient temperature was achieved at the target
temperature measured by thermocouple placed in middle of nozzle tip and wall. It should be
noted that the temperature difference of thermocouples became within 5 K.
A heat flux measurement was done a little later after hot gas feed for avoiding turbulence
in the vessel. Diesel fuel was injected into the chamber when temperature difference of the
thermocouples became within 5 K. Fuel, which was supplied from a common rail system, was
injected through a single hole nozzle injector controlled by an Electronic Control Unit (ECU).
Injection quantity and timing was controlled by a delay pulse generator (Stanford Research
Systems DG645). Injection pulse had been calibrated by the injection rate measurement
previously.

22
According to Wakisaka and Azetsu [98], shapes of fuel injection rate influences on the
combustion and thus emission formation. Figure 2.2 shows an averaged result of ten times
injection rate measurement of the single-hole injector by Zeuch method by using Ono Sokki
Co. Ltd, FJ-7000. The injection rates of 80, 120 and 180 MPa injection pressure under nozzle
hole diameter of 0.133 mm and 0.133 and 0.122 mm under 120 MPa injection pressure are
shown in Figure 2.2 (a) and (b), respectively. In order to maintain the same fuel quantity of 5
mm3, injection durations were changed by the pressures and nozzle holes diameter. Bower and
Foster [99] was performed and confirmed that the Zeuch method is more accurate for measuring
injected volume. The Zeuch method is a measurement method based on the pressure
measurement in an airtight chamber in which diesel fuel is contained. When fuel is injected into
Figure 2.1 Experimental apparatus

23
(a). Injection pressure (b). Nozzle holes diameter
Figure 2.2 Injection rates
the chamber, it induces pressure rise in proportion to the fuel mass injected. The derivative of
the pressure with respect to volume produces the injection rate profile.
The equation for the Zeuch injection rate measuring method is derived based on the
conservation of mass. By inserting the fuel bulk modulus, the governing equation can be written
as follows.
𝑑𝑚
𝑑𝑡= 𝜌 .
𝑉
𝐾 .
𝑑𝑃
𝑑𝑡 (2.1)
Where m is mass of fuel, ρ is fuel density, V is chamber volume, K is bulk modulus of
the fuel, and P is chamber pressure. Regarding this equation, the mass injected rate is
proportional to the fuel density, chamber volume, and rate of chamber pressure rise and
inversely proportional to the fuel bulk modulus. The fuel bulk modulus is a function of pressure
and temperature, which it is defined as the change in pressure due to the injected volume of fuel
multiplied by the initial chamber volume. The bulk modulus is an analogous to the modulus of
elasticity for metals [99].
𝐾 = 𝑉 .𝑑𝑃
𝑑𝑉 (2.2)
However, concerning the chamber design, the volume must be sized so that the chamber
pressure rise is within the appropriate limits (1-3 MPa) for the desired volumetric injection rate
[99].
24
2.2 IMPINGEMENT WALL
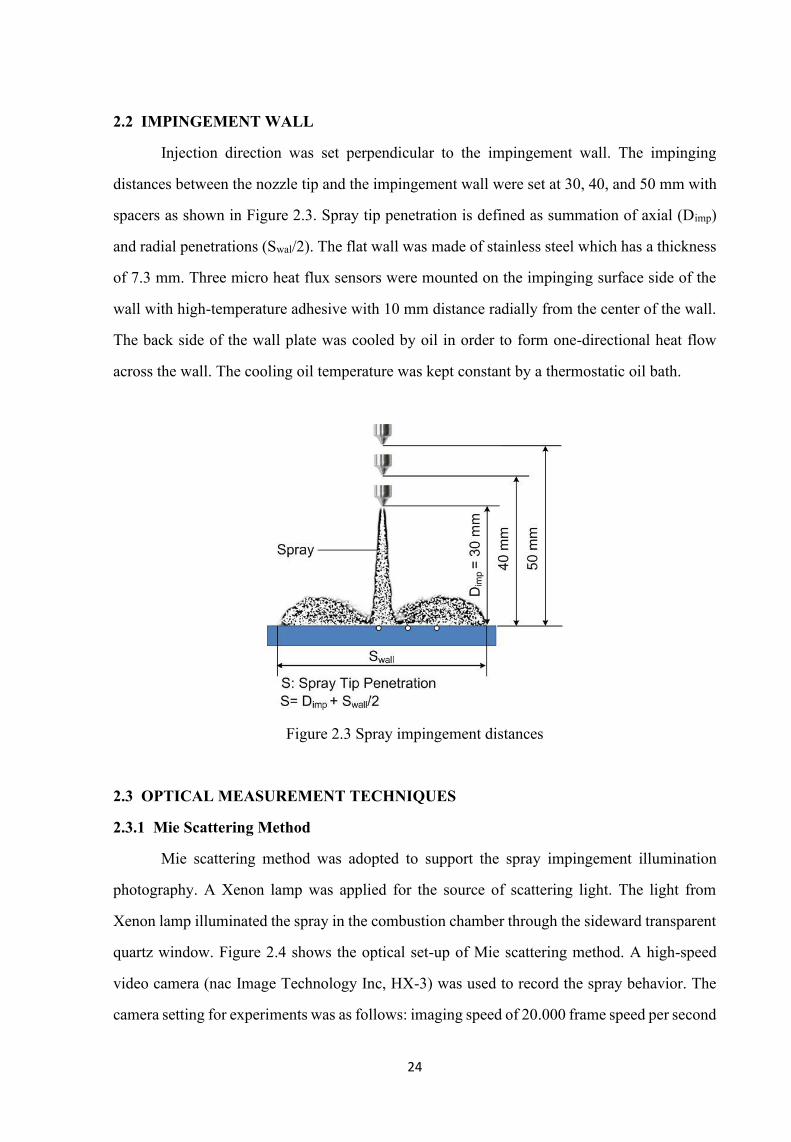
Injection direction was set perpendicular to the impingement wall. The impinging
distances between the nozzle tip and the impingement wall were set at 30, 40, and 50 mm with
spacers as shown in Figure 2.3. Spray tip penetration is defined as summation of axial (Dimp)
and radial penetrations (Swal/2). The flat wall was made of stainless steel which has a thickness
of 7.3 mm. Three micro heat flux sensors were mounted on the impinging surface side of the
wall with high-temperature adhesive with 10 mm distance radially from the center of the wall.
The back side of the wall plate was cooled by oil in order to form one-directional heat flow
across the wall. The cooling oil temperature was kept constant by a thermostatic oil bath.
Figure 2.3 Spray impingement distances
2.3 OPTICAL MEASUREMENT TECHNIQUES
2.3.1 Mie Scattering Method
Mie scattering method was adopted to support the spray impingement illumination
photography. A Xenon lamp was applied for the source of scattering light. The light from
Xenon lamp illuminated the spray in the combustion chamber through the sideward transparent
quartz window. Figure 2.4 shows the optical set-up of Mie scattering method. A high-speed
video camera (nac Image Technology Inc, HX-3) was used to record the spray behavior. The
camera setting for experiments was as follows: imaging speed of 20.000 frame speed per second

25
(fps) and resolution of 320 x 448 pixels, which each represent 5 pixels per mm. This Mie
scattering method was used in non-evaporating and non-combustion evaporation conditions to
detect spray behavior. As original images contain elements other than the spray in these
conditions, we removed such extra elements by image processing. This resulted in high-quality
spray images
Figure 2.4 Optical set-up of Mie scattering method
2.3.2 Natural Luminosity Recording System and Two-Color Pyrometry
Generally, rich mixture of fuel and air leads to soot formation with luminous flame.
Natural luminosity mainly comes from soot incandescence in diesel flame, which was related
to temperature and soot volume fractions. The natural flame luminosity measurements were
carried out in this research. A high-speed video camera and the camera setting were similar
with non-combustion case. A flame color image consists of red, blue, and green colors.
However, since red was a dominant flame color, we used it for luminosity analysis. Flame
luminosity was calculated by the summation of red color value for each pixel.
(1). Principle Two-Color Pyrometry
To observe local temperature near the wall and soot distribution, a two-color pyrometry
was applied for the natural flame color images. Detail discussion of the principle of two-color

26
pyrometry can be found in Matsui and his coworkers [100], [101], [102]. As reported in Ahn et
al. [102], the principle of the two-color method utilizes radiation intensity from soot particles
through the combustion process in order to calculate the flame temperature.
According to the Wien’s equation, the monochromatic radiance of the flame N (λ,T),
which can be expressed as:
N(λ, T) = C1λ−5exp (−C2
λTa) (2.3)
Where λ is the wavelength, T is absolute temperature, C1 and C2 are the first Planck’s
constant and the second Planck’s constant respectively, and Ta is the luminous temperature.
When ɛλ denoted the monochromatic emissivity of the flame, Eq. (2.3) can be rewritten.
N(λ, T) = ɛλC1λ−5exp (−C2
λT) (2.4)
If the emissivity of the luminous flame ɛλ is given by Hottel-Broughton equation [103],
it can be expressed by Eq (2.5).
ɛλ(λ, T) = 1 − exp (−KL
λα) (2.5)
Where K is the absorption coefficient, nearly proportional to the number density of soot
particles, L is the path length of the flame in the direction of the light axis of the flame detection,
and α is a constant within a specific range of wavelength.
Combining Eq (2.3), Eq (2.4) and Eq (2.5), it can be written as Eq (2.6):
KL = −λαln [1 − exp {−C2
λ(
1
Ta−
1
T)}] (2.6)
If there are two specific wavelengths λ1, λ2 that are measured simultaneously, the value
KL which is proportional to the integrated soot concentration can be eliminated:
[1 − exp {−C2
λ1(
1
Ta1−
1
T)}]
λ1α1
= [1 − exp {−C2
λ2(
1
Ta2−
1
T)}]
λ2α2
(2.7)

27
Figure 2.5 Experimental setup for natural luminosity and two-color pyrometry
By substituting the brightness temperature of the flame Ta1 and Ta2 at two specific
wavelengths λ1 and λ2, which can be obtained according to the calibration data, the actual
temperature and the KL value can be calculated. Data analysis was performed by nac Image
Technology’s “Thermias” as two-color pyrometry software. As a result, the flame temperature
and KL factor were two-dimensional with line-of-sight information.
(2). Calibration of Two-Color Pyrometry
The basic principle of calibration of two-color pyrometry was reported by Ahn et al.
[102]. Recently, the calibration was explained details by Li et al. [104], [45]. A standard light
illuminant was used for the calibration of the two-color method. The Eight neutral density filters
with different transmittance are rotating before the standard illuminant. In the optical set-up,
standard light was placed at the same distance with the flame to the camera. The Red, Green
and Blue channels could be obtained from high-speed video camera. However, we select the
red and blue channels for two-color calculation because these two channels have spectral
responses with insignificant overlap according Svensson et al. [105].
According to the Eq (2.4), the power of monochromatic emissive after passed through
the neutral filter with transmittance of 𝜏𝑖 can be expressed as, [104]

28
N(λ, T) = 𝜏𝑖ɛλC1λ−5exp (−C2
λT) (2.8)
Combining Eqs (2.3) and (2.8), it can be written as Eq (2.9):
1
𝑇−
1
𝑇a=
λ
𝐶2ln(𝜏𝑖ɛλ) (2.9)
When the transmittance is 1, the temperature T will be received by using a
thermodetector and then Ta will be calculated through equation 1. The empirical correlation of
𝜀𝜆=a0+a1𝜆+a2𝑇+a3𝜆𝑇 is used in this calculation.
The luminous intensity I perceived by camera sensor could be expressed as:
1 = a𝜏𝑖ɛλC1λ−5 exp (−C2
λT) + 𝑏 (2.10)
Where a and b are constants which depend on the camera sensor. Taking the logarithm
at both sides of Eq (2.10) gives,
ln(1 − b) = (−C2
λT) + ln (aɛλC1λ−5) (2.11)
According to this equation, the relationship between ln (1-b) and 1𝑇 follow linearity when
the illuminant happens. The slope equals to − C2
λ, in reverse, the effective wavelength of this
system could be defined as follows:
λ𝑒𝑓𝑓𝑒𝑐𝑡𝑖𝑣𝑒 = (−C2
slope) (2.12)
In this experiment, three effective wavelengths of color camera could be acquired:
𝜆𝑟𝑒𝑑=577.38 nm, 𝜆𝑔𝑟𝑒𝑒𝑛=541.12nm, 𝜆𝑏𝑙𝑢𝑒=517.82nm
When the source of the light is a standard illuminant, the 𝜀𝜆 in will becomes the value
of 1, and the T will be replaced by 𝑇a. By using Eq 2.12, results output from camera that
recorded eight kinds of luminous intensity which are attenuated by eight kinds of neutral filters
then the calibration line as shown Figure 2.6 will be obtained.

29
Figure 2.6 Calibration graph sample.
Figure 2.6 shows the vertical axis represents the black body’s temperature and the
horizontal axis represents the actual intensity 𝑙𝑛(𝐼−𝑏) which is received by camera sensor and
b is a constant of the camera. From this calibration, the temperatures of black body at two
effective wavelengths are received, which the actual temperature could be calculated by
applying Eq (2.7).
2.4 HEAT FLUX SENSOR AND MEASUREMENT
2.4.1 Thin Film Thermocouple Heat Flux Sensor
Three Alumel/Chromel Thin Film Thermocouples Heat Flux (TFTHF, Medtherm
10702B) sensors were mounted to obtain instantaneous surface heat flux of the wall. To detect
the surface temperature of the wall accurately, the sensors were installed as close as possible to
the wall surface, approaching exactly from the wall surface. The sensors location and its
arrangement as shown in Figure 2.7.
The sensor consists of two thermocouple sensors. One is a surface temperature sensor
and the other is an inner temperature sensor. Diameter of the sensors is ø 1.55 mm, and distances
between thermal contacts (surface and inner) is 3.30 mm. The sensors were radially located
with 10 mm distance each other as shown in Figure. 2.7. Positions of the sensors are designated
as Position1 (center of wall impingement), Position2 (10 mm from center) and Position3 (20
mm from center).

30
Figure 2.7 Thin film thermocouple heat flux sensor and sensor arrangement.
2.4.2 Heat Flux Measurement
Because direct measuring of transient heat flux is impossible, we identified heat flux
applying one-dimensional non-steady heat conduction equation using two measured
temperatures by one sensor as boundary conditions. The equation is written as a second order
partial differential equation (2.13).
𝜕𝑇
𝜕𝜏= 𝛼
𝜕2𝑇
𝜕𝑥2=
𝜅
𝑐𝑝.𝜌
𝜕2𝑇
𝜕𝑥2 (2.13)
Where T is temperature, 𝜏 is time, x is location of thickness direction, α is thermal
diffusivity, κ is thermal conductivity, cp is specific heat, and ρ is density. We solved the equation
by using finite difference method with measured surface and metal inner temperatures of each
TFTHF sensor as boundary condition, and obtained transient temperature distribution in the
wall. Divide from the wall surface of the thermocouple to the inside wall surface, divide it into
n, use i = 0 for the wall surface and i = n for the inside wall surface. The forward difference
type differential equation is used from equation (2.14) and the following equation is derived.

31
𝑇(𝑖, 𝑘 + 1) = 𝑇(𝑖, 𝑘) + 𝛩𝑥{𝑇(𝑖 + 1, 𝑘) + 𝑇(𝑖 − 1, 𝑘) − 2𝑇(𝑖, 𝑘)} (2.14)
Where i indicates a step in the depth direction, k indicates a step in the time direction,
and T (i,k) indicates the temperature of the depth i at time k. Approximate the time derivative
in Equation (2.14) with a forward difference and Eq. (2.15) is stability criteria of which should
not exceed the value imposed on by the following.
𝛩𝑥 = 𝛼𝛥𝜏
(𝛥𝑥)2 ≤1
2 (2.15)
The measured temperatures at the wall surface and inside wall of the TFTHF sensor are
given to the temperatures at i = 0 and n, and Δx and Δ are division widths in the step direction
and the time direction, respectively by the boundary condition. And then we calculated non-
steady surface heat flux component by using inner wall temperature distribution result with the
following equation.
𝑞(𝑘) = ℎ (𝑇𝑓𝑙𝑎𝑚𝑒 − 𝑇𝑤𝑎𝑙𝑙)
=𝜅
𝛥𝑥{𝑇(0, 𝑘) − 𝑇(1, 𝑘)} + 𝐶𝑝𝜌
𝛥𝑥
2
𝑇(0,𝑘+1)−𝑇(0,𝑘)
𝛥𝜏 (2.16)
Figure 2.8 Areas at wall surface

32
Total heat loss was calculated by integrating the heat flux with concentric area and time.
In area integration, heat flux affecting areas were defined as concentric circles of 0-5 mm for
Area1, 5-15 mm for Area2, and 15-25 mm for Area3, respectively as shown in Figure 2.8. The
heat fluxes measured were used as their representatives, as reported by Tatsumi et al. [7].
Furthermore, so as to predict heat transfer coefficient (ℎ) by CFD (computational fluid
dynamics) precisely, we need accurate ℎ experimentally. Steady state heat transfer coefficient
is expressed in equation (2.17), but this relation is also applicable for the transient heat transfer.
ℎ =𝑞𝑤𝑎𝑙𝑙
𝑇𝑔−𝑇𝑤𝑎𝑙𝑙 (2.17)
Where Twall is instantaneous local temperature and qwall is transient local heat flux, both
of them are obtained from TFTHF sensor measurement. Tg is gas temperature. To find an
accurate ℎ, we need to determine the gas temperature. However, gas temperature during
combustion varies both spatially and temporally and it is difficult to determine adequate value.
Whereas gas temperature at non-combustion is almost constant throughout the injection.
According to our CFD calculation, however, vaporized spray temperature near the wall surface
was around 60 K lower than the ambient temperature at evaporation condition. It decreased to
804, 808 and 810 K for injection pressure of 80, 120 and 180 MPa, respectively. Therefore, we
used predicted spray temperature as a mainstream temperature for heat transfer calculation. The
CFD solver CONVERGE software was used in this study. Turbulence model employed was
renormalization group (RNG) k-ε turbulence model, with wall film and wall heat transfer
models by O’Rourke and renormalization group Amsden. Modeling, initial and boundary
conditions were conducted same as an experimental study. Then to validate the results,
comparison with experiment is made as shown in appendix Figure 5. After validating, we are
able to use the data for calculation.
The local heat flux increase came from convection by turbulent spray arrival both
combustion and non-combustion cases [106]. Convection is dominant for the wall heat transfer
by impinging spray flame. In non-combustion case, we used temperature near wall obtained by
simulation at non-combustion condition as the gas temperature for the calculation. By this
approximation, we were able to find relatively precise value of ℎ. In combustion condition,

33
there exists large temperature gradient distributed in flame [106]. Then we used mean flame
temperature which was obtained from two-color method analysis as gas temperature.
In engines, the spray flame from fuel injected are turbulent flow and are therefore
strongly influenced by the properties of the fluid flow such as thermal conductivity, specific
heat, viscosity and density. However, rate processes are usually characterized by correlations
between dimensionless numbers i.e. Reynolds, Prandtl, Nusselt numbers [6]. Regarding
Bergman and Lavine [107] this parameter (Nusselt number) is equal to the dimensionless
temperature gradient at the surface, and it provides a measure of the convection heat transfer
occurring at the surface. The Nusselt number is to the thermal boundary layer what the friction
coefficient is to the velocity boundary layer.
The relation between Nusselt number (Nu) and Reynolds number (Re), Kuboyama et al.
[44] applied turbulent heat transfer equation of the pipe internal flow which is assumed to be
applicable for heat transfer in diesel engine. Where the Nu is a function of Re and Pr (Prandtl
number).
𝑁𝑢 = (𝐶𝑜𝑛𝑠𝑡) 𝑥 𝑅𝑒𝑚𝑥 𝑃𝑟𝑛 (2.18)
Where Nu, Re and Pr are defined as the following equation (2.19), (2.20), and (2.21). m
and n are defined based on the laminar or turbulent heat transfer. L is characteristic length, κ is
thermal conductivity of the working fluid, 𝜌 is density, U is characteristic velocity at each
position, 𝜇 is viscosity and cp is specific heat. We used impingement distance and flame height
as the characteristic length.
𝑁𝑢 =ℎ.𝐿
𝜅 (2.19)
𝑅𝑒 =𝜌.𝑈.𝐿
𝜇 (2.20)
𝑃𝑟 =𝜇.𝑐𝑝
𝜅=
𝑣
𝛼 (2.21)
As explained in the textbook [107], Reynolds number represents the ratio of the inertia
to viscous forces. Prandtl number is defined as the ratio of the kinematic viscosity, also referred
to as the momentum diffusivity, ν, to the thermal diffusivity α. The Prandtl number provides a

34
measure of the relative effectiveness of momentum and energy transport by diffusion in the
velocity and thermal boundary layers, respectively.
2.5 Data Acquisition
Signals from the TFTHF sensors were acquired by a data logger (Graphtec: GL 900)
and transferred to a PC. Sampling interval was 10 μs. As the original signal contained very large
noise component, low pass filtering was performed with Fast Fourier Transform (FFT)
technique. The FFT technique has been used by some reseachers [108], [21] to solving the noise
components as shown in the following equation:
𝑇(𝑡) = 𝑇𝑚 + ∑[𝐴𝑛𝑐𝑜𝑠(𝑛𝜔𝑡) + 𝐵𝑛𝑠𝑖𝑛(𝑛𝜔𝑡)] (2.22)
Where, T(t) is time-dependent temperature profile at the wall surface. Tm is the time-
average wall surface temperature. The FFT is applied in Fourier cooeficients (An and Bn), n is
the harmonic number and 𝜔 is angular velocity.
Figure 2.9 Original instantaneous temperature signals and their processed ones filtered by FFT: (a) original signal and (b) processed signal.
Figure 2.9 shows an example of original instantaneous temperature and its filtered one.
We had got noiseless clean signal by the noise reduction process. Then by using the method

35
similar to Tatsumi [7] and Senda [36], which solves non-steady heat transfer equation with
finite difference method by using measured temperatures as boundary conditions, we obtained
instantaneous surface heat flux waveforms. Because it was very short time for one
measurement, the surface temperature showed temperature rise by combustion, on the other
hand inner temperatures were constant during the shot.
TFTHF sensors signal and spray/flame video image were recorded simultaneously with
the injection. We cleaned the wall surface at every experiment condition change, since built-up
deposits on the wall from combustion process affect the measurement accuracy according to
Woschni and Huber [109]. Combustion differed from cycle to cycle and the surface
temperatures were changed in every measurement, therefore we had carried the same condition
measurement several times and averaged three good results.
2.6 TEST CONDITIONS
Measurement conditions, which were decided according to the actual diesel engine
operating condition. It is assumed low load in a small size diesel engine. We performed three
principal condition tests, i.e. non-evaporating spray, evaporation, and combusting spray in order
to investigate the relation between spray/flame and heat flux.
In order to know spray characteristics such as: an effect of impinging distance, injection
pressure, nozzle hole dimeter and oxygen concentration, we investigated non-evaporating spray
at room temperature without heating. Chamber pressure was set at 1.4 MPa with nitrogen gas
in order to keep the ambient gas density same as combustion condition of 16 kg/m3.
In order to know the effect non-combustion (evaporating spray), nitrogen gas was
supplied as ambient gas so as not to burn the spray. Ambient temperature and pressure
conditions were the same as the combustion test.
We measured the wall temperature and took high-speed video photographs at the same
time during combustion. Air (N2:79% and O2:21%) was used as ambient gas and its density
was held at 16 kg/m3 by setting chamber pressure and temperature 4.1 MPa and 873 K,
respectively. Natural flame luminosity images from the high-speed video camera were used to
analyze two-color method.

36
2.7 SUMMARY
In this chapter, the specific experimental apparatus, technical equipment and heat flux
measurement were introduced. In order to investigate the mechanism of wall heat transfer with
impinging spray/flame on the wall in improving the thermal efficiency. The spray/flame were
carried out in high-speed video camera. The spray behavior was observed by applying Mie
scattering method and flame temperature and soot concentration were calculated by applying
two-color pyrometry, which was based on the flame natural luminosity result perceived by high-
speed video color camera. Instantaneous temperature was detected by three Thin Film
Thermocouple Heat Flux Sensors which were mounted on the wall surface side. Instantaneous
heat flux into the impinging wall surface was computed using finite difference methodology
based on one-dimensional unsteady heat transfer equation in which measured temperatures are
used as boundary conditions.

37
CHAPTER 3
HEAT TRANSFER UNDER BASELINE CONDITION
3.1 INTRODUCTION
Heat loss is one of the main causes of energy loss in modern DI diesel engines. This
heat loss of the engine occurs during combustion, mainly due to the heat transfer between the
impinging spray flame and the piston cavity wall. In order to decrease heat transfer, we have to
understand the phenomenon of heat transfer through the combustion chamber wall more clearly.
Test rig of flat wall was used to investigate the effects of spray flame impingement on transient
heat flux to the wall. Varying experimental conditions such as effects of impingement distance,
injection pressure, nozzle hole diameter, oxygen concentration and its combined effect were
studied on wall heat transfer mechanism. In this chapter, as a part of preliminary experiments,
baseline condition will be used for comparing with all of parameter conditions in the all next
chapter. Three conditions such as non-evaporation, evaporation and combustion are discussed
in order to investigate the relation between spray/flame and heat flux.
3.2 EXPERIMENTAL CONDITIONS
The experimental apparatus used at all experiments are fundamentally the same, which
was set up under diesel engine-like conditions. Spray/flame behavior was investigated with a
high-speed video color camera. Simultaneously, the surface heat flux of the impingement wall
was studied by three Thin Film Thermocouple Heat Flux (TFTHF) sensors. These sensors were
mounted on the wall surface. Moreover, in order to investigate the mechanism of diesel flame
and the wall heat loss, the two-color method was used to observe flame temperature distribution
from luminous flame. The baseline condition information summarizes in Table 3.1 and 3.2.
Injector and injection conditions are listed in table 3.1. The fuel injection was electronically
controlled by a Bosch fuel injection system using a common rail. The injector was used a piezo
actuator type and had single-hole nozzle with 0.133 mm nozzle hole diameter. In the baseline
condition, injection pressure was kept at 120 MPa. Injection quantity and injection timing were
controlled by a delay pulse generator (DG645).

38
Table 3.1 Injector and Injection Conditions
Table 3.2 Experimental and Impingement Wall Conditions
We performed the test at three principal conditions such as non-evaporation,
evaporation, and combustion. Throughout all conditions were kept uniform ambient density,
i.e. 16 kg/m3. In case of non-evaporating spray, nitrogen gas was used as ambient gas at room
temperature without heating. Nitrogen gas also was supplied as ambient gas so as not to burn
the spray under evaporation condition. Ambient temperature and pressure conditions were the
same as the combustion test. The wall temperature was controlled at 460 ±10 K both
evaporation and combustion test. We measured the wall temperature and took high-speed video
photographs at the same time during combustion. Air (N2:79% and O2:21%) was used as
ambient gas under combustion case. The distance from nozzle tip to the wall was set up at 40
mm. Table 3.2 summarizes the experimental and impingement wall conditions.
3.3 SPRAY BEHAVIOR
Injector type Piezo actuator type
Number of nozzle holes 1
Injection quantity (mm³) 5
Diameter of nozzle holes (mm) 0.133
Injection pressure (MPa) 120
Ambient condition Non-Evaporation Evaporation and Combustion
Ambient gas N2 Combustion: Air (N2:79%,O2:21%)
Evaporation: N2
Ambient pressure (MPa) 1.4 4.1
Ambient temperature (K) 300 873
Ambient density (kg/m³) 16
Fuel Diesel Fuel
Impingement wall Flat plate, Stainless steel
Impingement distance (mm) 40
Wall temperature (K) 300 460 ±10
Cooling method - Oil cooling

39
In this section, the impinging spray behavior under non-evaporation and evaporation
conditions were studied. Spray images was recorded by high speed video color camera with
frame rate of 20,000 frame per second (fps) at 320 x 448 pixels image resolution, which each
represent 5 pixels per mm. Mie scattering method was used both non-evaporation and
evaporation conditions in order to investigated impinging spray behavior. A Xenon lamp and
two reflection mirrors were applied for the source of scattering light. The light from Xenon
lamp illuminated the spray in the combustion chamber through the sideward transparent quartz
window.
Figure 3.1 (a-b) shows line-of-sight images from high speed video camera. Left and
right side are non-evaporating and evaporating wall impinging spray images. These results after
removed such extra element by image processing. Spray travel from the top to the bottom at
each photo and impinges on the wall. Both non-evaporating and evaporating spray images were
observed at same ambient density (16 kg/m3), which used room temperature (300 K) for non-
evaporating spray and at high temperature (873 K) for evaporating spray. The vertical axis
shows time after start of injection (ASOI). Time 0.1 ms to 1.2 ms ASOI represents the spray
evolution during injection duration.
In the case non-evaporating spray in Figure 3.1 (a), spray was injected and impingement
to the wall at 0.45 ms ASOI. Spray continues to be injected and spray flows radially spread to
circumferential wall area after its impingement to the wall. The spray impingement on the wall
might affect to the mixture formation and air entrainment comparing with before impingement
to wall. On the other hand, under evaporating spray condition in Figure 3.1 (b), the liquid phase
concentration decreases significantly due to high ambient temperature which could promote
spray atomization and air-fuel mixture. The intensity of white color shows liquid spray
concentration. As can be seen in the figure, the liquid phase of the spray could not reach to the
wall. It indicates that impingement distance of 40 mm enough to do a conversion from liquid
to vapor phase before it reaches over to the wall. The liquid phase almost complete evaporates
at 1.2 ms ASOI as indication of the end of fuel injection.

40
Figure 3.1 High-speed video camera images of wall impinging spray at non-evaporating and evaporating
Spray tip penetration, which was obtained from the non-evaporating spray and liquid
length from evaporating spray images are presented in Figure 3.2. The injection duration was
1.2 ms ASOI. Spray tip penetration length in vertical axis on the left-side graph is defined as a
summation of axial (Dimp: impingement distance) and radial penetration distances (Swall: Spray
on the wall after impingement) as shown in Figure 2.3. The liquid length in vertical axis on the
right-side graph, which was defined similar to the non-evaporating spray, was obtained by the
image processing as the maximum liquid penetration during the injection using a pre-
-20 -10 0 10-30 3020 [mm]
0.7
ms
0.9
ms
1.2
ms
0.4
ms
(a). Non-Evaporation (b). Evaporation
01020
4030
0.1
ms
AS
OI

41
determined threshold intensity. We used a threshold intensity of 10 % on the 0 to 255 intensity
scale of the image.
Figure 3.2 Definition on non- evaporating spray tip penetration and its measurement result of spray tip penetration and liquid length
The closed and open triangles show the liquid length under evaporation before and after
the spray impingement on the wall, respectively. Under non-evaporating spray, the spray tip
penetration increased with time, although the fuel has done injected. This means that the spray
rate was continuously enhanced to cover a wider area along the flat wall. In contrast, the liquid
length linearly increased with time for only a few hundred milliseconds ASOI until it reached
a maximum liquid length penetration. The liquid length penetration was saturated under 40 mm.
When it reached the maximum value, the liquid length remained constant, with slight
fluctuation, although the fuel continued to be injected. Furthermore, the liquid length
immediately dropped just after the end of injection. In this time, all the fuel was completely
evaporated. As shown in the comparison in Figure 3.2, the liquid length of the evaporating
spray decreased significantly in relation to that of the non-evaporating spray condition.
3.4 COMBUSTION FLAME BEHAVIOR
In this section, the behaviors of the impinging flame and how combustion affects the
wall heat transfer are studied. Figure 3.3 shows impinging flame images captured by a high-

42
speed color video camera. These figures represent the time history of the impinging flame’s
natural luminosity development. As commonly discussed, the flame’s natural luminosity comes
primarily from soot incandescence and chemiluminescence. In a diesel engine, the soot
incandescence is dominated by the thermal radiation from soot particles in flame, with a
broadband emission spectrum. As illustrated in the non-evaporating spray photographs in
Figure 3.1a, luminous flames occurred a few hundred micro-seconds after the spray
impingement, at 0.9 ms ASOI, and then disappeared after 1.9 ms ASOI. The most luminous
flame was observed at 1.3–1.5 ms ASOI. Moreover, considering the photographs of non-
evaporating spray in Figure 3.1b, it can be seen that a luminous part was present in the vapor
area due to combustion. The combustion occurred in the vapor area near the center of the wall
impingement. This area provided a suitable equivalence ratio and temperature for ignition
[110].
Figure 3.3 Video images of impinging flame distribution
3.5 HEAT FLUX AND TOTAL HEAT TRANSFER
Unsteady local heat flux and integrated flame luminosity were used for studying heat
transfer from the combustion flame to the impingement wall. The local heat flux was computed
from temperatures measured by TFTHF sensors, and the integrated flame luminosity was

43
calculated using the total of red color values from natural flame color images. The results are
illustrated in Figure 3.4. The upper side shows the integrated flame’s natural luminosity, while
the lower side shows the local heat flux. The horizontal axis shows the time ASOI. The timings
of spray impinging and ignition, obtained from video images, are also plotted in the graph. The
luminosity increase starts nearly at the ignition timing.
Figure 3.4 Local heat flux and integrated flame luminosity
As shown in the local heat flux graph, the time histories of local heat fluxes were
different at the three measurement locations (Position1, Position2, and Position3). These
differences can be attributed to the spatial nonuniformity of the spray and flame flow. The spray
flowed radially after impingement, and it arrived at each position at different timings, causing
heat flux fluctuation. The local heat flux at Position1 started to increase earlier, followed by
Position2 and Position3 in all conditions. The observed increase in local heat flux at Position1
could be interpreted as being a result of the effect of convection when a turbulent part of the
evaporating spray impinges to the wall. Then, the large effect of combustion gas velocity was
responsible for starting the local heat flux peak at Position2. Another possible explanation for
this is that the impinging flame was strongly developed from Position1 to Position2 in this
timing, as shown in Figure 3.3. As commonly discussed, the luminosity is related to the soot
volume fraction and temperature, where the temperature has a high impact on the heat transfer

44
rate. In addition, the local heat flux at Position3 was significantly lower than the heat fluxes at
the other positions, since both wall friction and momentum loss due to turbulent mixing took
place. This local heat flux also increased later than it did at the other positions because the flame
travel took time to reach Position3 (20 mm from the center of impingement).
Figure 3.5 Areas and total transferred heat
Figure 3.5 shows the areas and total transferred heat. The values are a summation of
heat fluxes at the toroidal area of the sensors during the heating period; the definition of areas
on the wall surface can be seen in Figure 2.8. From the graph, it is evident that the transferred
heat increased with a wider area. This means the wider area (Area3) gave more transferred heat
to the wall, although the local heat flux value at Position3 was smaller, as shown in Figure 3.4.
The total transferred heat under the base condition was around 30 joules.
3.6 SUMMARY
At baseline, the correlation between spray/flame behavior and transient local heat flux
under diesel-like conditions was investigated in this chapter. Based on the results obtained, the
main conclusions can be summarized as follows:
1. There were significant differences between the images of evaporating and non-evaporating
spray in terms of liquid phase concentration. These were also confirmed in terms of the

45
liquid length, which showed a substantial decrease in the evaporating compared with the
non-evaporating spray condition. This suggests that a high ambient temperature under
evaporating conditions could promote spray atomization and the air-fuel mixture;
2. By using a high-speed video camera, it was found that the liquid phase concentration hardly
reaches the wall at a distance of 40 mm. At the vapor area around the center of impingement,
flame luminosity occurrence was identified after reaching a certain temperature for ignition;
3. The nonuniformities of spray and flame flow after impingement on the wall, resulting in
transient local heat fluxes, were different at the three measurement locations (Position1,
Position2, and Position3) in relation to different timing of rises and peak values;
4. The mechanism of heat transfer on the wall and its correlation with the spray/flame behavior
was explained in detail in the transient local heat flux waveform; and
5. The heat transfer area is more influential in wall-transferred heat compared with the local
heat flux value at each point.

46

47
CHAPTER 4
HEAT TRANSFER UNDER VARIOUS IMPINGING DISTANCES
4.1 INTRODUCTION
In small high speed-diesel engine, an injected fuel spray impinges on a piston cavity
surface due to the short distance between the injection nozzle tip and the surface, where the
distance between them varies both locational and time. However, it is too difficult to study the
relation of heat transfer and combustion with the running engine. Therefore, it is necessary to
investigate the impinging spray flame under different impingement distances with chamber rig
test. For these reasons, this chapter aims to investigate the effect of flat-wall impingement
distance on transient local heat flux, combustion and soot distribution from the spray and flame
to the impinging wall. In order to investigate the mechanism of diesel flame and the wall heat
loss, the two-color method was used to observe soot and flame temperature distribution from
luminous flame photography. Furthermore, measurement of heat flux into the impinging wall
surface was computed using finite difference methodology based on one-dimensional unsteady
heat transfer equation in which measured temperatures are used as boundary conditions.
4.2 EXPERIMENTAL CONDITIONS
Measurement conditions, which were decided according to the actual diesel engine
operating condition, are listed in Table 4.1 and 4.2. It is assumed low load in a small size diesel
engine. The ambient pressure and temperature for combustion and evaporating experiments
were selected as 4.1 MPa and 873 K to reproduce the thermodynamic environment near top
dead center in combustion chamber of a low compression ratio diesel. We performed three
principal condition tests, i.e. non-evaporating spray, evaporation, and combusting spray in order
to investigate the relation between diesel spray/flame and heat flux on the wall. All of conditions
were keep the same ambient gas density of 16 kg/m3. In order to measure ambient temperature,
four K-type thermocouples were fitted in the middle of the nozzle tip and the wall, and three
were near the wall. A heat flux measurement was done a little later after hot gas feed for
avoiding turbulence in the vessel. Injection direction was set perpendicular to the impingement

48
wall. To understand the impinging spray behavior, diesel sprays impinging on flat wall was
studied using Mie Scattering method at non-evaporation condition. The impingement distances
between the nozzle tip and impingement wall were set at 30, 40, and 50 mm with spacer as
shown in Figure 2.3.
Table 4.1 Injector and Injection Conditions
Table 4.2 Experimental and Impingement Wall Conditions
4.3 SPRAY BEHAVIOR
In this section, behavior of the impinging spray at room temperature with different
distances were studied. Three impingement distances from injection tip to the wall, i.e. 30, 40
and 50 mm, were investigated at injection pressure 120 MPa. In the all experiments, injected
quantity was uniform at 5 mm3.
At 0.3 ms ASOI, spray reach to the wall under impingement distance (Dimp) of 30 mm.
At this timing, no significant variations are appearing among spray behavior under different
distances. When impingement distance is increased to further, the spray/wall interaction does
not occur in this timing. By increasing the timing to 0.5 ms ASOI, the impingement just
Injector type Piezo actuator type
Number of nozzle holes 1
Injection quantity (mm³) 5
Diameter of nozzle holes (mm) 0.133
Injection pressure (MPa) 120
Ambient condition Non-Evaporation Evaporation and Combustion
Ambient gas N2 Combustion: Air (N2:79%,O2:21%)
Evaporation: N2
Ambient pressure (MPa) 1.4 4.1
Ambient temperature (K) 300 873
Ambient density (kg/m³) 16
Fuel Diesel Fuel
Impingement wall Flat plate, Stainless steel
Impingement distance “Dimp” (mm) 30, 40, 50
Wall temperature (K) 300 460 ±10
Cooling method - Oil cooling

49
occurred under Dimp = 40 mm. It just few hundred micro-second after Dimp = 30 mm
impingement to the wall. This confirms that the impingement timing of spray become later with
its distance. The spray distributions are nearly similar under Dimp = 40 and 50 mm. However,
under Dimp = 30 mm, the spray droplet radially spread along to wall after impingement.
Figure 4.2 Non-evaporating wall impinging spray at different distances
When time is increased to 1 ms ASOI, Dimp = 50 mm also undergoes impingement to
the wall. In this timing, distribution of spray droplet only around the center of impingement.
When attention is paid to Dimp = 30 and 40 mm, spray droplet spread to large area along to wall
especially at shorter impingement distance. By comparing each distance, the impingement
timings are linearly increased with its distance. Due to air entrainment and spray atomization
process at before and after impingement, the impingement timing influences the ignition delay
and even more at combustion process.

50
Spray tip penetration length with different distances obtained from the non-evaporating
spray images is plotted in the Figure 4 .3 (a). Close and open symbols show before and after
spray impingement on the wall each. Penetration loci of three impinging distances agree with
each other until impingement on the wall, but they differ each other after impingement. This
much difference in penetration length after impingement can be observed. Even though the Dimp
= 30 mm has more spray spread along to wall. By this figure, it can be finding the tip penetration
is reduced by smaller impinging. Figure 4.3 (b) shows spray tip penetration velocity during
spray injection. The figure shows almost the same inclination after impingement among the
three impingement distances. It indicates that the distance variation with same injection
pressure is not significant effect on the velocity.
Figure 4.3 Spray tip penetrations and spray tip penetration velocity at different impingement distances.
4.4 COMBUSTION FLAME CHARACTERISTICS
4.4.1 Flame Natural Luminosity
The influences of impingement distance on ignition and combustion process were
investigated. Figure 3.4 shows the luminous flames from the high-speed video color camera.
The flame structure and combustion behaviors were differed under various impingement
distances. At 1.1 ms ASOI, flame natural luminosity was observed in near wall surface area in
all distances. The flame behavior was similar with non-evaporation images, where the flame
luminosity more spread along to wall under smaller impingement distance. At this timing, the

51
ignition delay from these photographs by the luminosity change due to start of a chemical
reaction of combustion. It was confirmed that the ignition delay became later with distance. It
might spray mixture was improved by earlier impingement and the combustion occurred after
impingement to the wall in all conditions.
Figure 4.4 Video images of impinging flame at different distances
At 1.3 ms ASOI, the impinged flame was tended to roll up which caused by shorter
impingement distance at Dimp = 30 mm. It suggests that the wall-jet vortex was large due to
high turbulent effect in this distance. When the distance increases to Dimp = 40 mm, the
impinged flame natural luminosity was seen uniform. It means soot luminosity was significant
occurred in this distance. On the other hand, Dimp = 50 mm with longer impinging path, the
impinged flame became slow with small flame area. This longer impingement distance lead to
enough time the spray atomization and fuel-air mixture before its impingement. As time
continues to 1.5 ms ASOI, flame natural luminosity was decreased and the flame behavior
proceed to roll up under Dimp = 30 mm. However, the impinged flame continues develop along
(b). Dimp = 40 mm
1020
0
4030
50
(a). Dimp = 30 mm
(c). Dimp = 50 mm
1.1 ms ASOI 1.3 ms 1.5 ms
[mm]
1020
0
4030
[mm]
1020
0
30
-20 -10 0 10-30 20 30[mm]

52
to wall under both Dimp = 40 and 50 mm. It is because the ignition delay become later with the
longer distances, which influence to the combustion duration process.
4.4.2 Two-Color Method Results
This section shows results of combustion and soot formation process analyses under the
different impingement distances. In diesel combustion, radiated luminosity of flame, which is
generated from the soot combustion, can represent combustion temperature by black-body
radiation theory. Then we analyzed the natural flame images with two-color pyrometry.
Figure 4.5 Flame temperature at different distances
Figure. 4.5 and Figure 4.6 shows distribution of temperature and KL factor obtained at
each impinging distance. The figure compares from 1.1 ms until 1.5 ms ASOI, which is around
the maximum values at each distance. The distribution shapes of high temperature and KL
factor are similar, because both of them are obtained from images of luminous flame by soot
combustion.
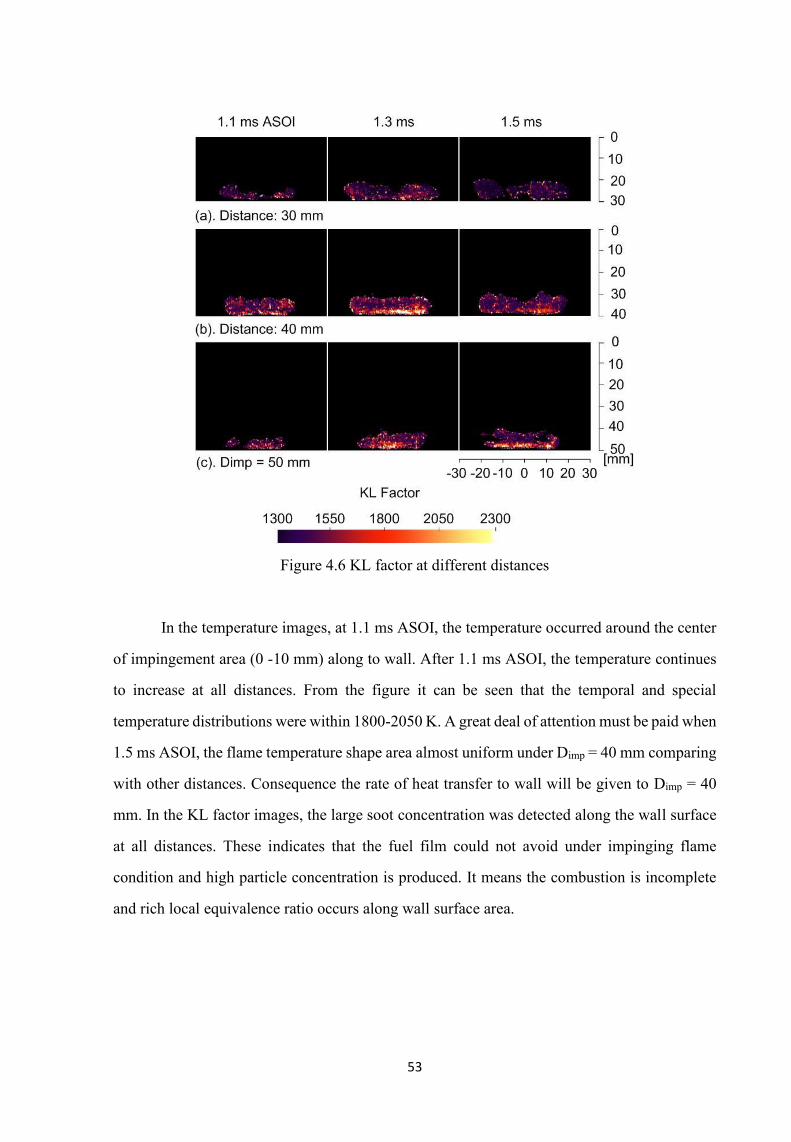
53
Figure 4.6 KL factor at different distances
In the temperature images, at 1.1 ms ASOI, the temperature occurred around the center
of impingement area (0 -10 mm) along to wall. After 1.1 ms ASOI, the temperature continues
to increase at all distances. From the figure it can be seen that the temporal and special
temperature distributions were within 1800-2050 K. A great deal of attention must be paid when
1.5 ms ASOI, the flame temperature shape area almost uniform under Dimp = 40 mm comparing
with other distances. Consequence the rate of heat transfer to wall will be given to Dimp = 40
mm. In the KL factor images, the large soot concentration was detected along the wall surface
at all distances. These indicates that the fuel film could not avoid under impinging flame
condition and high particle concentration is produced. It means the combustion is incomplete
and rich local equivalence ratio occurs along wall surface area.

54
Figure 4.7 Luminous flame area, mean temperature and KL factor at different distances
Each of Figure 4.7 (a-c) shows transition of luminous flame area, mean temperature and
integrated KL factor. Even though the Dimp = 30 mm has most widely spread flame temperature
area due to shorter impingement distance. However, flame area was slightly decreased
comparing with Dimp = 40 mm. These also applied to mean temperature and integrated KL
factor. Two possible explanations for the reduction in KL factor are as follows: (1) impinged
spray droplets were rolled up which caused by shorter impingement distance. This results in
better mixing with ambient air, which enhances oxidation of fuel and reduces soot formation.
(2) Thermal interaction that cools the spray, makes the rate of soot formation slow [25].
At Dimp = 40 mm shows higher flame area, mean temperature and KL factor compared
with the other impingement distances. It can be seen in temperature images that the large flame
temperature behavior was detected every timing increased. Regarding KL factor was increased,

55
it means the deteriorated combustion occurred at this distance thus it leads high soot formation.
It can be proved by the soot distribution near the wall was higher comparing with other distances
as shown in Figure 4.6. The mean temperature also higher in this distance, as flame natural
luminosity was much higher in Figure 4.4 which It was related to temperature and soot fraction.
When increasing the distance to 50 mm, flame area, mean temperature and KL factor
were significant lower value. At Dimp = 50 mm with longer impinging path, combustion became
slow with lower temperature and soot formation was reduced due to the improved fuel air
mixing before combustion occurrence. According to Li et al. [46] experiment, combustion is
enhanced by increasing the impingement distance. As shown in Figure 4.7, distribution of flame
are similar to KL factor, thereby temporal changes of luminous flame area are also similar to
the KL factor.
Spatial distribution of local temperature in near wall under flame impinging becomes
important to clarify the heat losses on the wall. Temperature near the wall highly influences to
the wall temperature due to rapid heat transfer by convection. Figure 4.8 shows the areal
averaged temperatures at 0.8 mm from wall surface in the three areas. These result in the all
plots were obtained from Figure 4.5. It cannot be plotted when no luminous flame was observed
at the area. The above figure shows that temperature distribution is varying in the radial
direction in that time. It implies strong combustion gas turbulent flow exists together with the
combustion reaction. At Dimp = 30 mm, the temperature near wall was higher in the earlier
timing at 1 ms to 1.1 ms ASOI than other distances. This was increased at all positions due to
earlier ignition which was occurred in near wall and flame spread to wider area. However,
because the impinged flame underwent roll up due to shorter distance, the temperature near
wall was saturated and decreased by increasing timing.

56
Figure 4.8 Near wall temperature at 0.8 mm from wall
The graphs show that the At Dimp = 40 mm has the maximum temperature at Position1
and 2. If these areas are dominant for wall heat transfer, Dimp = 40 mm shows the maximum
heat transferred. However, as shown in the later section, transferred heat is similar both Dimp =
30 and 40 mm. Therefore, average temperature has not so dominant effect on heat transfer to
the wall. On the other hand, Dimp = 50 mm was lower temperature except Position3 comparing
with other distances. However, at Position3, the impinged flame occurred later and short
resident time because the flame growth to wider area takes time due to longer path.
4.4.3 Flame Contact Area
Since temperature of flame is so high to increase instantaneous heat flux, flame contact
area can be thought one of the influential factors that affect the heat transfer rate by conduction.

57
In order to study the effect of flame contact to the wall, flame contact area was calculated using
the flame photographs. The flame contact area assumes where flame is in contact with the wall
surface with a concentric circular area as shown in Figure 4.9 (a).
Figure 4.9 Definition, flame contact areas and time integration of flame contact areas at different distances
Temporal changes of the flame contact area at the different distances are shown in
Figure 4.9 (b). It shows that Dimp = 30 mm which shorter distance makes quicker flame contact
area increase. However, when time is increased and impinged flame growth to wider area, Dimp
= 40 mm lead large flame contact area. The maximum flame contact area is around 1700 mm2.

58
On the other hand, Dimp = 50 mm in which longer distance from the wall surface have a smaller
contact area than smaller distance.
Time integration of the flame contact areas are shown in Figure 4.9 (c). For calculating
the time integration of flame contact area, it used the same equation to Tatsumi [8] as shown in
the follows:
Time integration of flame contact area = ∫ 𝐴 𝑑𝑡𝜏
0 (4.1)
Where A is an instantaneous contact area, and τ is end of combustion. The figure shows
that Dimp = 30 and 40 mm have similar contact area and they are larger than 50 mm, though
each of the three contact periods is similar. It can be thought that more heat was lost at Dimp =
30 and 40 mm due to the wider flame contact area than 50 mm.
4.5 HEAT FLUX AND TOTAL HEAT TRANSFER
Unsteady local heat flux with flame impinging on the wall was investigated. Figure 4.10
shows local heat flux computed from temperatures measured by the TFTHF sensors and
integrated luminosity of the red component of flame images at each impinging distance.
Timings of spray impinging and ignition, which are obtained from video images, are also
plotted in the graphs. Luminosity increase starts nearly at the ignition timings at all distances,
however, heat flux increase starts before the ignition timings at both Position1 and Position2 in
all distances. On the other hand, at Position3, it starts increase far after the luminosity increase
starts in all distances. Combustion photographs of Figure 4.4 show that combustion
simultaneously starts in some range, which covers Position1 and 2, near the wall then spreads
to the circumferential area of the wall with increasing brightness. Spray impinges at a range and
extends radially, therefore it takes time to reach the 20 mm position.

59
Figure 4.10 Local heat flux and integrated flame luminosity at different distances

60
Figure 4.11. Comparison of local heat flux between combustion and non-combustion
The increase timings of the Position3 are roughly agreed with penetration timings to the
point which are obtained from the Figure 4.3 (a). By these facts, it seems that the heat flux
increase comes from convection by turbulence with spray arrival. This convection theory also

61
explains that the heat fluxes continue after luminosity drops to the base level in all distances. It
indicates that strong hot gas flow non-luminous flame still exists after end the combustion.
The local heat flux waveform at Position1 has a large valley after increasing in Figure
3.12 (a). Combustion varied with time and was weak at this timing as shown Figure 4.4 (a). The
maximum local heat flux values are achieved at Position2 in all distances because in that
position has higher temperature near wall as shown in Figure 4.8. In this graph found that the
dominant higher temperature near wall was Dimp = 40 mm. This phenomenon can be explained
why Dimp = 40 mm have larger local heat flux. However, local heat flux at Position3 was lower
values except Dimp = 30 mm. It means the Dimp = 30 mm in which impinged flame spreads to a
larger area lead significant heat transfer rate.
Temporal variations of averaged heat flux were calculated by summing local heat flux
timed by area over all of the area. Figure 3.12 (b) shows the result of temporal variations of
averaged heat flux under impingement distance. It shows Dimp = 30 mm has the maximum
temporal variations of averaged heat flux value. The area is influential factor for the temporal
variations of averaged heat flux. At a smaller impingement distance, it was more affected. This
is evidenced by local heat flux at Position1, 2 and 3 has almost a similar maximum value as
shown in Figure 4.10 (a) compared with Dimp = 40 and 50 mm in Figure 4.10 (b-c), respectively.
It was 5.5 MW/m2 for Dimp = 30 mm, 3.8 and 3.4 MW/m2 for Dimp = 40 and 50 mm, respectively.
Even though, the local heat flux has peak value at Dimp = 40 mm, there were no significant
differences between Dimp = 40 and 50 mm in term temporal variations of averaged local heat
flux.
The reason of the heat flux increase phenomenon by convection could also be explained
by comparison of local heat flux between combustion and non-combustion in Figure 3.13 as
follows.
1. The start points of local heat flux increase at all positions are similar between combustion
and non-combustion in all distances.
2. In case of non-combustion, local heat flux increase only comes from convection by spray
impingement.
3. Under non-combustion, the local heat flux value was decreased with its distance.

62
4. There was significant local heat flux waveform at each distance in combustion case. These
differences can be attributed to spatial nonuniformity of spray and flame flow at difference
distances.
In non-combustion, the highest local heat flux occurs at the center of impingement. On
the other hand, in combustion, the local heat flux at Position2 has the maximum value. It can
be thought that the combustion flame most developed around the location somewhat distant
from the impingement center. According to this explanation, the local heat flux increase has
two stages. At first, the local heat flux is increased by turbulence by non-combustion spray.
Then combustion which starts after impingement accelerates the increase.
4
5
Figure 4.12 Comparison of the areal transferred heat and ratio of heat loss to total combustion heat at different distances
Figure 4.12 shows a comparison of the areal transferred heat. As an outer area is wider,
the areal transferred heat becomes larger with outer radial position. The heat transfer area is
more influential to this value than the heat flux at each point. Therefore, heat flux of Position3
most affects the total transferred heat as mentioned in previous section. The impingement
distance 40 mm has the maximum heat loss on the wall. As totaled flame area shown in Figure
4.9 (c) has similar relation with impingement distance, flame contact area may have dominant
effect for heat loss. The larger flame contact during resident time on the wall leads high wall
63
surface temperature, therefore it is important to decrease flame contact for improving heat loss.
Figure 4.12 also shows the ratio of heat loss through the wall to total combustion heat at
different impingement distances. It is about 14 to 15 % of total combustion energy.
4.6 SUMMARY
The effects of impingement distances (30 mm, 40 mm, and 50 mm) on transient local
heat flux, combustion and soot distribution in diesel like conditions were investigated in this
chapter. The main conclusions are summarized as follows.
1. By using the high speed video image analysis, we found that combustion was slow with low
temperature small flame at large impingement distance.
2. By applying TFTHF sensors on the impingement wall, we could obtain transient heat flux.
Transient heat transfer by impinging spray/flame is mainly caused by the turbulent
convection through detailed analysis of the heat flux waveform.
3. Flame contact area of wall affects heat transfer to the wall. Among the 3 different distances,
50 mm showed the least heat transfer to the wall. This was caused by slow combustion and
small flame contact area.
4. It was found that the correlation of flame temperature in near the wall with the local heat
flux reach peak value. This high temperature near wall is one of the contributing factors in
heat transfer rate to the wall.
5. Variation of impingement distance has an important role in the spray behavior, combustion
development, soot emission and then heat loss. At Dimp = 50 mm, KL factor and temperature
have the same variation in which both decreasing. With longer impinging path, fuel air
mixing improves before impingement occurrence which resulting combustion is enhanced
and then decreasing in soot luminosity.

64

65
CHAPTER 5
EFFECT OF INJECTION PRESSURE AND NOZZLE HOLE
DIAMETER
5.1 INTRODUCTION
Recently, kind of control parameter and physical factor such as injection condition and
nozzle parameter have been paid much attention as optimization of engine combustion
strategies in modern diesel engine. These strategies of course has an impact on fuel economy,
thermal efficiency, emission, and performance in engine. To clarify the influence of the
injection pressure and nozzle parameter on the thermal efficiency, energy lost in total fuel
conversion energy caused by heat loss will be studied. Therefore, in this chapter, focusing on
the heat loss caused by the collision spray flame with of the injection pressure and nozzle was
observed parametrically.
5.2 EXPERIMENTAL CONDITIONS
The injector and injector condition under various injection pressures and nozzle hole
diameter are shown in Table 5.1 and 5.2 respectively. In this chapter, the attentions were paid
to investigate the effect of injection pressure and nozzle hole diameter on heat transfer
impinging spray/flame. Under injection pressure, nozzle hole diameter was kept at 1.33 mm as
baseline condition and 80, 120, 180 MPa were selected to investigated injection pressure. On
the other hand, injection pressure was kept at 120 MPa and 1.33 and 1.22 mm were chosen in
Table 5.1 Injector and injection conditions under various injection pressures
Injector type Piezo actuator type
Number of nozzle holes 1
Injection quantity (mm³) 5
Diameter of nozzle holes (mm) 0.133
Injection pressure/duration of
injection (MPa/ms)80/1.4, 120/1.2, 180/0.9
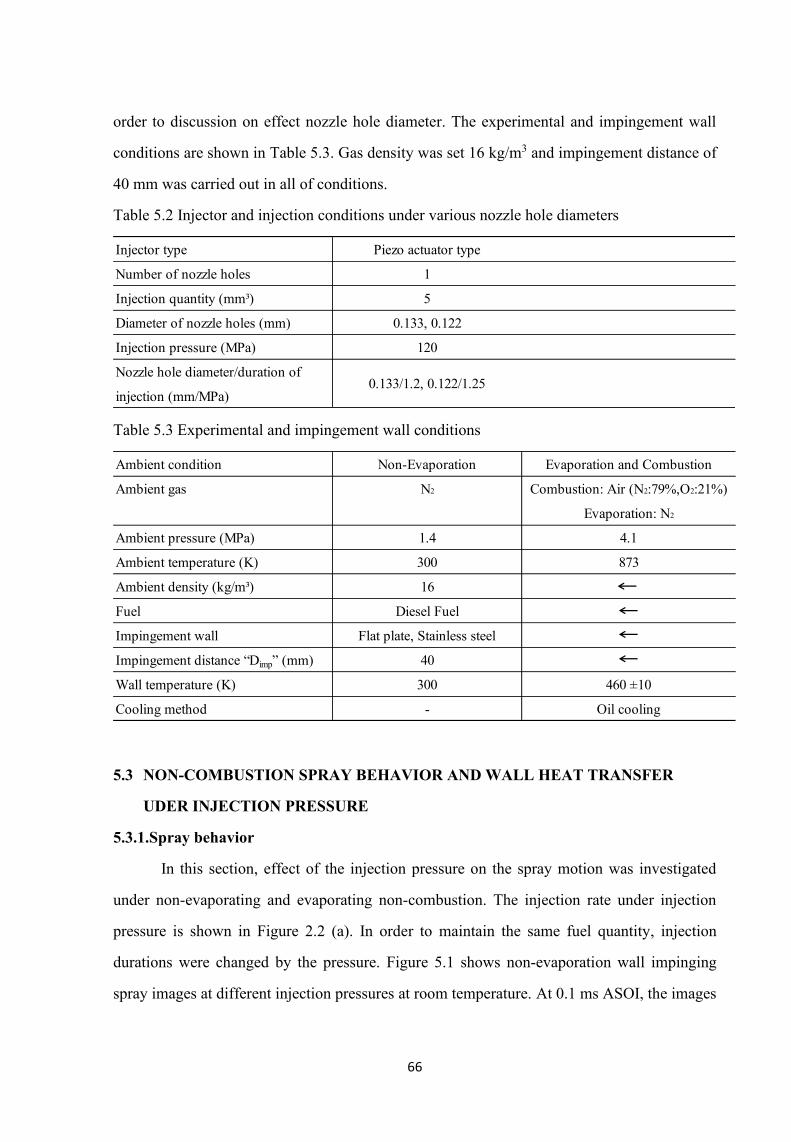
66
order to discussion on effect nozzle hole diameter. The experimental and impingement wall
conditions are shown in Table 5.3. Gas density was set 16 kg/m3 and impingement distance of
40 mm was carried out in all of conditions.
Table 5.2 Injector and injection conditions under various nozzle hole diameters
Table 5.3 Experimental and impingement wall conditions
5.3 NON-COMBUSTION SPRAY BEHAVIOR AND WALL HEAT TRANSFER
UDER INJECTION PRESSURE
5.3.1.Spray behavior
In this section, effect of the injection pressure on the spray motion was investigated
under non-evaporating and evaporating non-combustion. The injection rate under injection
pressure is shown in Figure 2.2 (a). In order to maintain the same fuel quantity, injection
durations were changed by the pressure. Figure 5.1 shows non-evaporation wall impinging
spray images at different injection pressures at room temperature. At 0.1 ms ASOI, the images
Injector type Piezo actuator type
Number of nozzle holes 1
Injection quantity (mm³) 5
Diameter of nozzle holes (mm) 0.133, 0.122
Injection pressure (MPa) 120
Nozzle hole diameter/duration of
injection (mm/MPa)0.133/1.2, 0.122/1.25
Ambient condition Non-Evaporation Evaporation and Combustion
Ambient gas N2 Combustion: Air (N2:79%,O2:21%)
Evaporation: N2
Ambient pressure (MPa) 1.4 4.1
Ambient temperature (K) 300 873
Ambient density (kg/m³) 16
Fuel Diesel Fuel
Impingement wall Flat plate, Stainless steel
Impingement distance “Dimp” (mm) 40
Wall temperature (K) 300 460 ±10
Cooling method - Oil cooling

67
revealed that higher injection pressure made the spray faster from top to bottom. These spray
leads to impingement to wall at 0.4 mm ASOI in which shorter impingement timing than both
injection pressure of 80 and 120 MPa. When time is increased to 0.7-1.2 ms ASOI, the spray
undergoes impingement in both injection pressure of 80 and 120 MPa. However, at injection
pressure of 180 MPa, spray development was enhanced then there became larger spray
spreading to the circumferential area of the flat wall. From images, it is noteworthy that as the
injection pressure increases, spray radius and spray height increase. Larger spray tangential and
normal velocities with increasing injection pressure are thought to be responsible for this spray
formation [50].
Figure 5.1 Non-evaporating wall impinging spray at different injection pressure
Non-combustion evaporating spray images under the three injection pressures at high
temperature (873K) are shown in Figure 5.2. From this figure, at 0.1 ms to 1.2 ms ASOI, liquid
phase could not impingement on the wall. The spray almost evaporated before impinging to the
wall. As Pickett et. al [69] pointed out, the liquid phase eventually reaches an axial position
where it is completely vaporized as hot gases entrain into the spray. Following, liquid phase
fluctuates throughout the injection duration, whereas vapor phase continues to penetrate
downstream. In case of injection pressure 80 MPa, liquid fuel existed till later period compared

68
with the other pressures. As shown in the injection rate graph, lower injection pressure requires
longer injection duration. The figure shows that 120 and 180 MPa images show smaller liquid
phase areas compared with 80MPa. This means that an increase in velocity with higher injection
pressure leads to more effective atomization. Consequently, more homogeneous mixture
distribution takes place due to faster evaporation rate. As it can be seen in Figure 5.2 (c) at 0.7
ms ASOI, some fuel droplets spread on the wall, which accounts for why some fuel droplets
impinge earlier on the wall.
Figure 5.2 Evaporating wall impinging spray (liquid component) at different injection pressure
Spray tip penetration lengths under different injection pressures obtained from the non-
evaporating images are plotted in the Figure 5.3. Closed and open markers show before and
after the spray impingement on the wall, respectively. The penetration pattern of each injection
pressure is different in respect of before or after impingement on the wall with different
injection duration. In Figure 5.3, we can see that the higher injection pressure made further
spray tip penetration. If the injection pressure rises, the spray droplet velocity increases. As a
consequence, it leads to increase in fuel momentum, which results in earlier impingement
timing and larger spray tip penetration. However, after injection duration complete at all
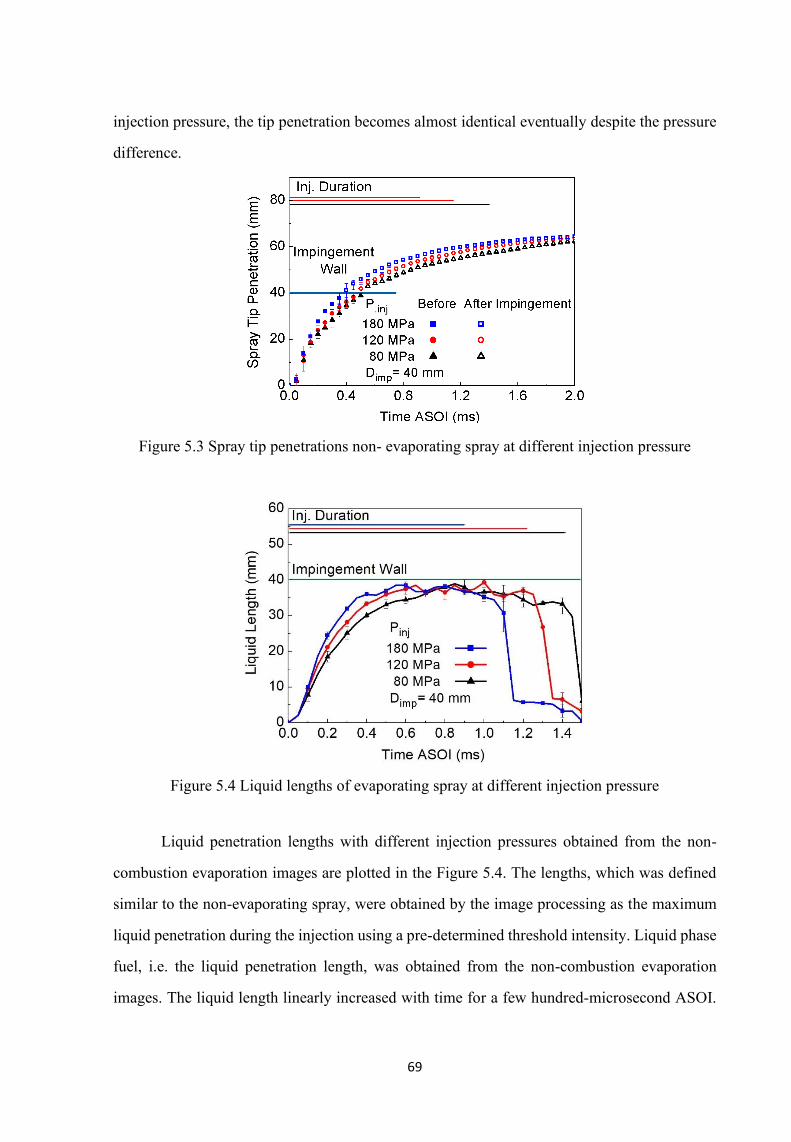
69
injection pressure, the tip penetration becomes almost identical eventually despite the pressure
difference.
Figure 5.3 Spray tip penetrations non- evaporating spray at different injection pressure
Figure 5.4 Liquid lengths of evaporating spray at different injection pressure
Liquid penetration lengths with different injection pressures obtained from the non-
combustion evaporation images are plotted in the Figure 5.4. The lengths, which was defined
similar to the non-evaporating spray, were obtained by the image processing as the maximum
liquid penetration during the injection using a pre-determined threshold intensity. Liquid phase
fuel, i.e. the liquid penetration length, was obtained from the non-combustion evaporation
images. The liquid length linearly increased with time for a few hundred-microsecond ASOI.

70
Higher injection pressure lead to a faster penetration velocity, however, they reached similar
distance at a maximum. The maximum liquid penetration lengths were around 35-40 mm.
Liquid length with slight fluctuation remained constant even though fuel continued to be
injected. During this Quasi-Steady Period, liquid penetration length was nearly constant at all
injection pressure even though their injection rate profiles ware different. This implies
accelerated evaporation occurred at the spray tip. The phenomenon suggests that the higher
injection pressure lead to enhanced evaporation rate for wider area. The average mixture
temperature decreased by evaporation. As a result, heat fluxes at non-combustion increased
much lower than combustion case. After the Quasi-Steady Period ended, the liquid length
immediately dropped just after the end of injection.
5.3.2.Heat Flux on the Wall Surface
To examine the effects of the injection pressure, heat fluxes in non-combustion condition were
measured. Figure 5.5 shows temporal variation of the local heat fluxes and the total heat fluxes.
Each of (a-c) shows local heat fluxes at the positions at 80, 120 and 180 MPa. The local heat
flux appears simple waveform due to combustion is not occur in evaporation condition [111].
As explained in the previous section, the unsteady wall heat transfer occurred due to the spray
impingement on the wall. This is true for these results. By increasing injection pressure, starts
of local heat flux increase became earlier, which were associated with the increased spray
velocity. That is to say the higher pressure leads to the earlier turbulent convection.
Higher injection pressure made total local heat flux increase earlier with a maximum
value of 2.11 kW as shown in Figure 5.5 (d). It increased the total heat flux due to higher
velocities as a consequence of an increased fuel injection rate. These higher velocities led to
hot gas flow toward to wider wall area. This was evident by local heat flux at Position3 which
start to increase earlier as shown in Figure 5.5 (c). As mentioned in the previous section, the
area was influential factor for the temporal variations of averaged total heat flux.

71
Figure 5.5 Temporal variation of local heat flux and total heat flux at non-combustion
5.4 COMBUSTION FLAME BEHAVIOR AND WALL HEAT TRANSFER UNDER
INJECTION PRESSURE
In this section, behaviors of the impinging flame and how combustion affects the wall
heat transfer under the different injection pressures are studied. Effects of the three injection
pressures, i.e. 80, 120, and 180 MPa were investigated.
5.4.1.Combustion Flame Behavior
Figure 5.6 shows images of impinging flame at different injection pressures. Comparing
with non-evaporating spray photographs in Figure 5.1, luminous flames occur a few hundred
micro-seconds after the spray impingement. It is evident from Figure 5.6 that luminous flame
appeared earlier with higher injection pressure. At 0.9 ms ASOI, flame luminosity was occurred
at injection pressure 120 and 180 MPa. In contrary, flame luminosity unfound at 80 MPa. It
means increasing injection pressure is to promote greater premixing between fuel and air and it
leads shorter ignition delay. Flame natural luminosity was detected at injection pressure 80 MPa

72
when time is increased to 1.2 ms ASOI. In this timing, injection 180 MPa reached most
brightness in flame luminosity. In all conditions, combustion occurred just after the spray
impingement on the wall and it began before the end of the fuel injection.
Figure 5.6 High-speed video camera images of impinging flame at different injection pressure
A comparison of the images between non-evaporating spray and combustion flame
revealed that the spray development at non-evaporating and spray flame growth at combustion
were significantly enhanced with increasing injection pressure. Furthermore, comparing the
photographs of non-combustion in Figure 5.2 and combustion in Figure 5.6, it can be seen that
the luminous part by combustion existed in the vapor area. The combustion occurred in the
vapor area near the center of wall impingement.
At time is 1.5 to 1.8 ms ASOI, in case of 180 MPa, flame luminosity started to decrease
and then disappeared. Similarly, injection pressure 120 MPa demonstrated flame luminosity
start to decrease at timing of 1.8 ms ASOI. However, under 80 MPa, the flame natural
luminosity continuous to develop in this timing. Since the natural luminosity mainly comes
from soot incandescence in diesel flame, this lower injection pressure of 80 MPa, more flame

73
natural luminosity was observed. It is because lower velocity lead to decreasing in atomization
and fuel air-mixing.
Figure 5.7 Flame temperature distribution at different injection pressure
Information of temperature distribution of impinging spray/flame is important for the
heat transfer analysis. Figure 5.7 shows flame temperature distributions at different injection
pressures obtained from two-color method analysis, which was performed with flame natural
luminosity images. The temperature distribution shapes were similar to those of flame, because
they were obtained from the flame luminosity and could not be obtained from non-luminous
area. The color distribution scale varying from dark to bright indicates temperature.
By comparing the temperature distributions with different injection pressures, it was
presented that temperature distribution was most spread to wider area and its complete earlier
at high injection pressure. On the other hand, it was opposite when injection pressure was lower.
This phenomenon contributed in heat transfer rate on the wall in term of timing of rises and its
value at each position. Even though the ignition timing, combustion duration and flame growth
rate in graph 5.8 (a) under different injection pressure were different each other. However, the

74
different of maximum temperature under injection pressures were around 100 K. As shown in
flame temperature distribution image, it can be expressed as the maximum flame temperature
distribution when time was 1.2, 1.5 and 1.8 ms ASOI at injection pressure of 180, 120 and 80
MPa. At these timing, it can be seen that the distribution of temperature value almost uniform
at 80 MPa than the others. Consequently, it had the highest mean temperature as shown in graph
5.8 (b). These phenomena can be explained as follows. At lower injection pressure of 80 MPa,
more flame natural luminosity was observed, which was related to temperature and soot volume
fractions. In this condition, soot is dramatically higher which is contributed by less air
entrainment with decreasing in spray atomization and fuel air-mixing and therefore bring it to
local high equivalent ratio. The correlation of high temperature with local high equivalent ratio
is commonly discussed for being account for soot production. In contrast, natural flame
intensity for an injection pressure of 180 MPa was reduced. High injection pressure is more air
entrainment with improving in spray atomization and premixing between fuel and air due to
high velocity which causes reducing in soot formation.
Figure 5.8 Integrated flame luminosity and mean temperature at different injection pressure
5.4.2.Heat Flux on the Wall Surface
Unsteady temporal variation of local heat flux values of flame impingement on the wall
and integrated flame luminosity under each injection pressure shown in Figure 5.9 (a-c). Spray
impinging and ignition timing have been also plotted on the graph. Time histories of local heat

75
fluxes at each position was discussed in the previous section. There were significant differences
local heat flux waveform under injection pressure variations in terms of time of roses and peak
values. These differences can be attributed to flame velocity differ at each injection pressure.
Figure 5.9 Temporal variation of local heat flux, integrated flame luminosity, and total heat flux at combustion
The effect of injection pressure in relation to local heat flux, it could be found from the
graphs as follow: At lower injection pressure i.e. 80 MPa, the local heat fluxes of Position1
increased simultaneously with the ignition. One possible explanation is that the convection by
turbulence from spray impinging takes time to reach the wall as can be seen in Figure 5.3. In

76
the case of increasing injection pressure, thus increasing injection velocity, leads to higher
kinetic energy in which fuel travels further distance. As a result, spray impingement and ignition
occur at a faster rate with higher injection pressure. It also found that a higher peak value of
local heat flux was detected at all positions because increased flame velocity which is caused
by an increased injection rate. These increasing flame velocities were toward to wider wall area,
which is responsible for local heat flux at Position3 increased. This Implies that increasing
flame velocity is due to high injection pressure can accelerate the rate of heat transfer to wall.
Figure 5.9 (d) shows temporal variation of the total heat flux at different injection
pressures. It can be seen in the graph, all of the waves had two peaks i.e. there were two stages
for the local heat transfer. At first, the local heat flux was increased by turbulence of
impingement spray. Then, heat transfer by flow along the wall, which started after
impingement, took place. The result showed that a maximum total heat flux value of 16.5, 8.2
and 6.9 kW for injection pressure of 180, 120, and 80. According to the more substantial amount
of total heat flux, it can be concluded that the increasing flame velocity because high injection
pressure causes more energy loss to the wall.
A comparison of the transferred heat at each area under different injection pressures
between non-combustion and combustion are presented in Figure 5.10 (a-b). This figure shows
transferred heat in vertical axis on the left-side graph and ratio of heat loss to total combustion
heat in vertical axis on the right-side graph. As can be seen in figure non-combustion condition,
the value of transferred heat was around 11-12 joule at different injection pressure. This heat
transfer was occurred by convection mainly from flow induced by the fuel spray injection
during injection period. However, it has a small amount of the effect when injection pressure
increased. In case of combustion, the transferred heat increased significantly, and it is also
found that the highest transferred heat is observed at 180 MPa among lower injection pressure
both. The flame velocity, which relates to heat transfer coefficient that will be explained in the
next figure, increased with the injection pressure and leads to hot gas flow spreading to the
circumferential area of the flat wall. Comparing non-combustion and combustion, around 30%
of the transferred heat through the wall was transferred by the convection of non-combustion

77
evaporating spray. Of total combustion heat loss, the ratio to the wall was shown in the graph
5.10. It comprises approximately 12 to 14% of total combustion energy.
h is one of the decisive factors which influence on the heat transfer loss through wall.
Temporal local heat transfer coefficients which were calculated by equation (2.22) with the
measured heat flux at non-combustion and combustion conditions at different injection
pressures are shown in Figure 5.11. As the gas temperature at non-combustion, we used
temperature near wall which was obtained by the simulation. The gas temperature at
combustion, which used in the convective h equation, was obtained from two-color method
analysis. The graph shows that the peak values differ at both conditions because of not only
turbulent convection by gas flow but also radiation which varies locally and temporally.
Figure 5.10 Comparison of the areal transferred heat and ratio of heat loss to total combustion heat between non-combustion and combustion at different injection pressure
Furthermore, in this condition, the combustion flame most developed around the
location somewhat distant from the impingement center. Consequently, the location of
Position2 had a higher value than that of others in all injection pressures. However, the graphs
showed that both combustion and non-combustion conditions have similar waveforms and
order of heat transfer coefficient at both all the positions and injection pressures. This indicates

78
that, in combustion, flow induced by the injected spray is dominant for the heat transfer to the
wall.
Figure 5.11 Comparison of local heat transfer coefficient between non-combustion and combustion at different injection pressure
Both graphs show that the local heat transfer coefficient increased proportionally in all
positions with injection pressures. It means higher injection pressure, which increases
momentum and velocity of the fuel spray, is one of the significant influential factors on the α.
In other words, higher injection pressure leads to larger local heat flux value as shown in Figure
5.5 and 5.9. Similarly, the dominant factor of heat loss variation under injection pressure could
be the heat transfer coefficient differences caused by the spray flame flow changes [112]. If the
heat transfer coefficient at the non-combustion condition fully contributed to the total heat

79
transfer in figure 5.11 (a), spray motion contributed 30 to 40 % for the total transferred heat
under the combustion condition.
5.5 COMBUSTION FLAME BEHAVIOR AND WALL HEAT TRANSFER UNDER
DIFFERENT NOZZLE HOLE DIAMETERS
In this section, the effects of nozzle hole diameter on flame temperature distribution and local
heat flux were investigated. The nozzle hole diameters (Dhole) were selected as 0.133 and 0.122
mm. The injection pressure and impingement distance were set at 120 MPa and 40 mm for both
nozzle hole diameters.
5.5.1.Combustion Flame Behavior
Heat transfer by convection may be formed significantly when gas or flame temperature
much different with wall surface. These gas or flame temperature distribution become important
since heat loss on the wall much affected to the large area. In order to understand this effect,
flame temperature distribution at different nozzle hole diameter is presented in Figure. 5.12.
The different injection rate at different nozzle hole diameters are shown in Figure 2.2 (b). At
the same fuel injected, larger nozzle hole diameter required in increasing injection rate value
and shorter injection duration. As a consequence, momentum and velocity become larger as the
value of injection rate increased.
At the flame temperature distribution, the figures did not show any significant difference
between both nozzle hole diameter as far as temperature concentration is concerned. However,
larger temperature distribution was observed at Dhole = 1.22 mm. As it was confirmed that a
smaller hole size nozzle produced smaller droplet sizes and a smaller amount of particulate
[113]. It is straightforward to atomization and air entrainment into the spray. As a result, the
combustion development into outer periphery of the spray flame, as a consequence of air
entrainment [9].
Figure 5.13 shows distribution of axial flame temperature from wall surface at each
sensor at 1.5 ms ASOI, when they are at combustion peak, by nozzle hole diameter. The figure
shows that temperature distribution is varying in the axial direction in that time. It implies strong
combustion gas turbulent flow exist together with the combustion reaction. It also confirmed

80
Figure 5.12 Flame temperature distribution at different nozzle hole diameters
Figure 5.13 Temperature distribution from wall surface at different positions
that temperature higher along the wall surface then decreases with increasing distance from
wall surface. At Position1, the temperature distribution almost similar each nozzle hole

81
diameter. When area is increases to Position2, the temperature values increase further with
smaller nozzle hole diameter, 0.122 mm. Improved mixture due to the fuel atomization effect
on ambient air entrainment play important role in this temperature increase. At Position3,
distribution of axial temperature slightly smaller. Far away from the center of impingement and
creating flame vortex are possibility reason in this phenomenon.
Considering the effect of nozzle hole diameter on flame contact area is presented in
Figure 5.14. When flame on the wall start to develop to radial area, flame contact increased
linearly with the time and both nozzles almost similar until timing of 1.6 ms ASOI. After this
timing, flame contact at Dhole = 1.33 mm started to collapse. However, due to longer injection
duration at Dhole = 1.22 mm, flame contact continues until it reached the maximum value though
it eventually collapsed. Apart from this slightly flame contact different, Figure 5.13 shows how
long the resident time the flame contact area on the wall. It was found that smaller nozzle hole
diameter was longer flame contact period on the wall. It can be thought more rate of heat
transfer at Dhole = 1.22 mm due larger area affected.
Figure 5.14 Flame contact area and time integration at different nozzle hole diameters
5.5.2.Heat Flux on the Wall Surface
To clarify the effect of nozzle hole diameter on the heat transfer characteristics, the local
heat flux and ratio of heat transfer to total combustion were examined. Figure 5.15 (a-c) presents
the data on local heat flux characteristics and total heat flux. The upper and bottom graph shows
non-combustion and combustion local heat flux. In this section, comparison nozzle hole

82
diameter different were discussed both local heat flux of combustion and non-combustion.
Comparison between non-combustion and combustion local heat flux itself has discussed in
detail in the previous section. At non-combustion condition under nozzle hole diameters, the
marked observation to emerge from the data comparison was heat flux rises at Position1 became
earlier and higher at Dhole = 1.33 mm in which larger nozzle hole diameter. It increased due to
higher momentum and velocities as a consequence of an increased fuel injection rate. The
maximum peak value at Position1 was around 2.3 MW/m2 both nozzle hole diameter.
In the case of combustion condition, the higher heat flux value at Position1 and 2 were
obtained at larger nozzle diameter as shown in Figure 5.15 (a). This shows that increased
impinging flame velocity correlated to increase in local heat flux value, rather than the effect
of flame temperature. Considering the effect of flame temperature near wall as shown in Figure
5.13 (b), area at Position2 reached the maximum temperature in which was responsible to local
heat flux at position2 increased to peak value at both nozzle hole diameter. However, due to
more combustion development to wider area at Dhole = 1.22 mm as shown in Figure 5.12 (b), as
a consequence Position3 was increase earlier and higher. More air entrainment and with
improving in spray atomization was achieved at small nozzle hole diameter, as a result flame
develops into the wider circumferential area.
Figure 5.15 (c) shows temporal variation of total heat flux at different nozzle hole
diameter. As a result, we can see in the graph (i.e. combustion case) that hole size diameter of
0.122 mm has a maximum peak value in the second stage. Although the higher heat flux value
was obtained at larger nozzle hole diameter as shown in Figure 5.13 (a). However, small nozzle
hole diameter was affected higher local heat flux at Position 3 as we can see in Figure 5.13 (b).
As mentioned in previous section the heat transferred over a larger area has more influence on
the total heat flux value. The non-combustion results have a number of similarities with
combustion case findings. However, in non-combustion, the differences between the two are
very small, such as the maximum value of 1.6 kW for Dhole = 1.22 mm and 1.4 kW for Dhole =
1.33 mm.

83
Figure 5.15 Local heat flux and total heat flux at different nozzle hole diameters
Figure 5.16 (a-b) shows a significant difference in the transferred heat at each area under
different nozzle hole diameters between non-combustion and combustion conditions. These
results also similar with total heat flux in Figure 5.15 (c), the differences were statically
significant between both conditions. It is due to the primary heat transfer come by convection
from flow induced by the fuel spray injection during injection period. At non-combustion
condition in Figure 5.16 (a), the results show the comparison between different nozzle hole
diameter did not significant effect on transferred heat. It was about 12-13 joules transferred heat
from impinging evaporation spray to the wall. Based on these results, energy loss become 6%

84
from total combustion heat. If compared with combustion in Figure 5.16 (b), the proportion
energy loss by evaporation non-combustion was around 30-40% energy lost. It was found that
the convective heat transfer from spray induce during injection given important factor on energy
loss.
When the combustion occurred, large amount of heat transfer was found as shown in
Figure 5.16 (b). As can be seen in the figure, the value of transferred heat increases as nozzle
hole diameter is decreased, the proportion of transferred heat was 32 joules when the nozzle
hole diameter was 0.122 mm. It is assumed that the hot gas flow from combustion spreading to
the circumferential area of the flat wall, because the smaller nozzle hole diameter with smaller
droplet size diameter can promote spray atomization and entrainment. The result on the ratio of
heat loss to total combustion heat was 14% at Dhole = 1.22 mm.
(a). Non-combustion (b). Combustion
Figure 5.16 Comparison of areal transferred heat and ratio of heat loss to total combustion heat between non-combustion and non-combustion at different nozzle hole diameters
5.5.3. Effect Nozzle Hole Diameter and Injection Pressure on Areal Transferred Heat
As previously investigated, nozzle hole diameter has significant effect on atomization,
fuel-air mixture and heat flux characteristics. Besides, injection pressure has also similar effect
due to its velocity. In this subsection, further study was compared the effect of injection pressure
and nozzle hole diameter. The aim was to understand to what extent this combination had effect

85
on transferred heat and ratio of heat loss to total combustion. The different nozzle hole
diameters, Dhole = 1.33 and 1.22 mm were compared with injection pressure of 80, 120 and 180
MPa, respectively. The impingement distance was set at 40 mm regardless of injection pressure
and nozzle hole diameter condition.
Figure 5.17 Comparison of the areal transferred heat at combined nozzle hole diameter/injection pressure
Figure 5.18 Comparison of temperature distribution at high injection pressure with different nozzle hole diameter
Comparison of the areal transferred heat at combination of nozzle hole
diameter/injection pressure (Dhole/Pinj) are presented in Figure 5.17. As shown in the figure, the

86
transferred heat increased proportional with injection pressure at both nozzle hole diameter.
These increases gradually at Dhole = 1.22 mm and at Dhole = 1.33 mm was transferred heat
significant increased when it was high injection pressure. As described in the previous section,
increasing injection pressure contributed to increases in flame velocity. These high turbulent
flow combustion by high injection pressure and larger areal heat affected are the reason to
influential to transferred heat rate in combined effect of injection pressure and nozzle hole
diameter on wall heat transfer.
In the case of lower injection pressure, 80 and 120 MPa, larger nozzle (Dhole = 1.33 mm)
generated lower heat loss as shown in Figure 5.17. Flame temperature, which is a dominant
factor on heat loss at this injection pressure, decreases with increasing nozzle hole diameter [9].
On the other hand, in the case of injection pressure 180 MPa, larger nozzle generated more heat
loss. High temperature end gases in outer boundary of the flame at the end of combustion largely
determines this heat loss. It is evident that the temperature distribution was found develops
further along the wall as shown in Figure 5.18. The flame contact area with a longer residence
time at Dhole/Pinj = 1.33/180, is the reason why transferred heat increased further. However,
when nozzle hole diameter decreased and pressure increased (Dhole/Pinj = 1.22/180), it can be
more air entrainment and accelerated the fuel-air mixing then lead rapid combustion. As a
result, resident time during impinging flame along the wall was decreased. Based on the Figure
5.17, ratio heat loss is around 13-15% to total combustion energy.
5.6 SUMMARY
This study is to clarify the effects of injection pressure and nozzle hole diameters on the
impinging combustion wall heat transfer. The measurement was investigated under diesel
engine-like conditions. The results show that the variation of local heat flux characteristics was
caused by spray flame velocity and temperature distribution. The main conclusions are
summarized as follows.
1. Convection by turbulence has a significant effect on resulted heat flux values. Spray
impingement to the wall was delayed at lower injection pressures, thus, injection pressure,
80 MPa, had the minimum heat flux value. Whereas impingement was realized at faster rates

87
with higher injection pressures due to earlier turbulent convection effect, which is reason for
the higher heat flux values.
2. Convection by spray motion contributes to the total transferred heat through the
impingement wall as does the higher injection pressure. The portion which was attributed to
spray motion reached around 30 % at injection pressure 180 MPa.
3. Local heat transfer coefficients were calculated by using measured heat flux and temperature
in both combustion and non-combustion conditions. The results showed that both
combustion and non-combustion conditions had similar waveforms of heat transfer
coefficient at all the positions. This largely determines that induced flow by the spray is
dominant for the heat transfer to the wall in combustion case.
4. Injection pressure increases was proportional with that the rate of heat transfer both non-
combustion and combustion conditions. Higher spray flame velocity by high injection
pressure was the main factor in these losses than flame distribution and resident time during
flame contact area.
5. A larger nozzle hole diameter has a significant effect on the peak value of local heat flux,
which was caused by the its high of velocity and momentum. However, it was decreased on
total heat flux and transferred heat due to flame temperature distribution was not as wide as
the smaller nozzle hole diameter.
6. Regarding with the effect of injection pressure and nozzle hole diameter on the wall heat
loss, the larger nozzle hole diameter, the less heat loss was generated at injection pressure of
80 and 120 MPa. Flame temperature was influencing factor on heat loss under these
conditions. in contrast, the larger nozzle hole diameter caused more heat loss at injection
pressure of 180 MPa. Local high-temperature end gas regions had dominant effect on heat
loss at this injection pressure/nozzle hole diameter condition.

88

89
CHAPTER 6
EFFECT OF OXYGEN CONCENTRATION ON HEAT TRANSFER
6.1 INTRODUCTION
In modern diesel engine, the fuel-air mixture become important factor on the
combustion process and exhaust emissions, and then in thermal efficiency. In order to reduce
the emission, exhaust gas recirculation (EGR) is effective equipment part to reduce nitrogen
oxides (NOx) from diesel engines because it lowers the flame temperature and the oxygen
concentration of the working fluid in the combustion chamber [114]. With increasing EGR rate,
the oxygen concentration in the fuel/gas mixture decreases and the specific heat of the cylinder
increases and leads reaction rate decrease. Further, in-cylinder pressure and combustion
decrease [43]. As described by the previous researchers in literature review, oxygen
concentration has an effect on combustion behavior, which closely relates with lower
temperature combustion. Therefore, to clarify an effect of oxygen concentration on decreasing
heat loss, variation of oxygen concentration will be investigated in this study.
6.2 EXPERIMENTAL CONDITIONS
Injector including injection condition and experimental measurement conditions are
listed in Table 6.1 and 6.2. Injection quantity was 5 mm3 with injection pressure 120 MPa using
a nozzle of 0.133 mm hole diameter. The impinging distance between the nozzle tip to the
impingement wall was set at 40 mm. Oxygen concentrations were conducted at 21 and 16% as
experimental parameters to investigate the effect of the heat transfer characteristics on the
impinging flame on the wall.
Table 6.1 Injector and Injection Conditions
Injector type Piezo actuator type
Number of nozzle holes 1
Injection quantity (mm³) 5
Diameter of nozzle holes (mm) 0.133
Injection pressure (MPa) 120

90
Table 6.2 Experimental and Impingement Wall Conditions
6.3 COMBUSTION FLAME BEHAVIOR
In this section, impinging flame behavior under oxygen concentration are studied.
Effects of the oxygen concentrations (O2), which were 21% were investigated at impingement
distance of 40 mm. Figure 6.1 shows images of impinging flame natural luminosity at different
oxygen concentrations. In this condition, non-evaporation and evaporation non-combustion has
explained in the previous section.
Figure 6.1 High-speed video camera images of impinging flame at different oxygen concentration
Ambient condition Combustion
Ambient gas O2 = 21 %
O2 = 16 %
Ambient pressure (MPa) 4.1
Ambient temperature (K) 873
Ambient density (kg/m³) 16
Fuel Diesel Fuel
Impingement wall Flat plate, Stainless steel
Impingement distance (mm) 40
Wall temperature (K) 460 ±10
Cooling method Oil cooling

91
In the Figure 6.1, the luminous flame appeared earlier with O2 = 21%. It had started at
0.9 ms ASOI before the end of injection (EOI) and at 1.25 ms ASOI just after the EOI for O2 =
16%. It is found that the reduction of the oxygen concentration in the enclosure mainly affects
the reactions in the gas phase and results in changes of the combustion behavior such as ignition
timing and flame development. It can be seen at 1.5 to 1.8 ms ASOI, flame natural luminosity
start to be decreased at O2 = 21%. However, it starts to develop at O2 = 16% due to ignition
delay was decrease. Consideration the intensity of luminous flame, they were surprisingly
different each other. As shown in the figure, lower oxygen concentration generated lower
luminous and flame develops quite slowly. Oxygen concentration is therefore required to
complete the combustion process since the ignition was not possible occurred without any
oxygen.
Figure 6.2 Comparison of flame contact area and time integrating of flame contact area at different oxygen concentration
Effect of flame contact to the wall at different oxygen concentrations are presented in
Figure 6.2. Figure 6.2 (a) shows that O2 =16% had smaller contact area than that O2 =21%. It
means with oxygen concentration of 21%, leads to flame contact significantly to spread wide
into circumferential area of flat wall. This flame contact area contributes to the heat transfer by
conduction. The larger flame contact area causes larger area to be affected to rate of heat
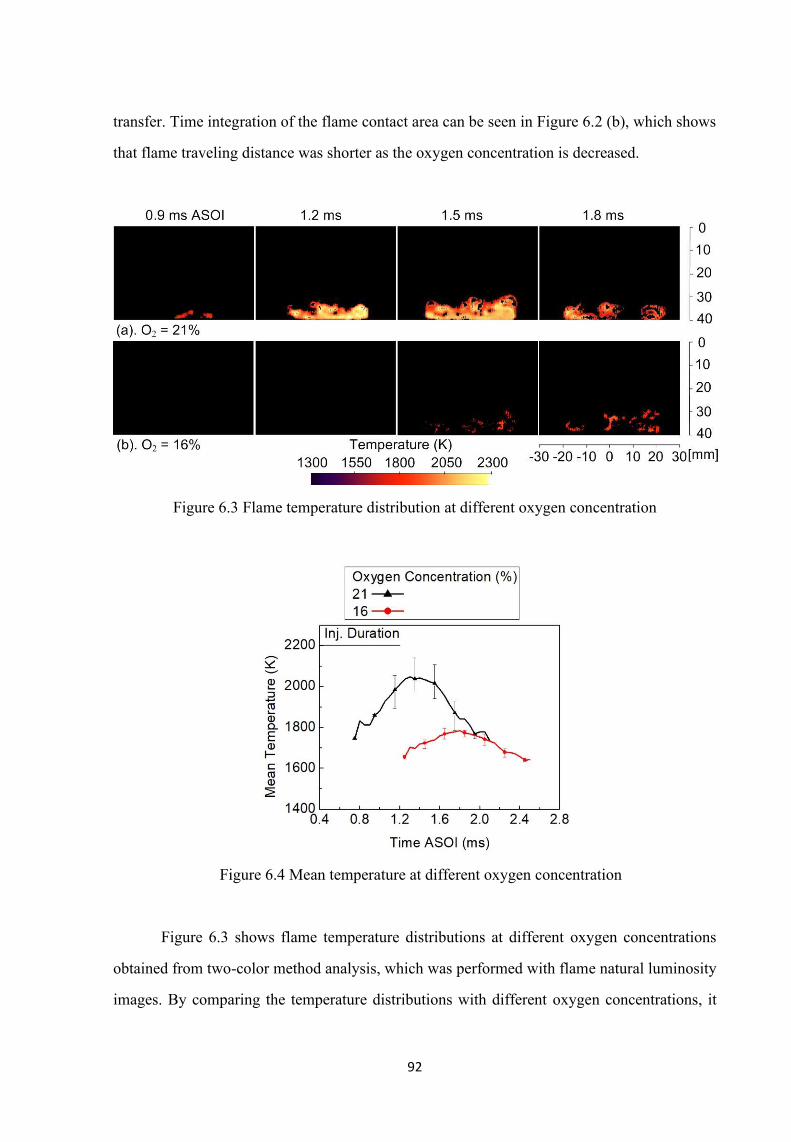
92
transfer. Time integration of the flame contact area can be seen in Figure 6.2 (b), which shows
that flame traveling distance was shorter as the oxygen concentration is decreased.
Figure 6.3 Flame temperature distribution at different oxygen concentration
Figure 6.4 Mean temperature at different oxygen concentration
Figure 6.3 shows flame temperature distributions at different oxygen concentrations
obtained from two-color method analysis, which was performed with flame natural luminosity
images. By comparing the temperature distributions with different oxygen concentrations, it

93
can be seen that the temperature distribution was decreased by decreasing oxygen
concentration. It can be inferred from Figure 6.4 that burned gas temperature decreases with
decreasing volume fraction of oxygen because the heat capacity of ambient gas increase with
decreasing the volume oxygen concentration [23]. When the combustion temperature was low,
the temperature difference between the flame and the wall surface were decreased. So that it
will have an impact on the reduced energy lost to the wall. Furthermore, soot emission during
combustion process also decreased at low temperature as can be seen that the luminous flame
significantly decreased. At O2 = 16%, the maximum temperature was 1785 K, around 400 K
decreased from the peak value of O2 = 21%.
6.4 HEAT FLUX ON THE WALL SURFACE
Non-steady local heat fluxes with flame impinging on the wall and integrated luminosity from
flame images at different oxygen concentrations are presented in Figure 6.5 (a-b). The figure
shows a significant difference in the ignition timing both conditions. The low temperature due
to decreasing oxygen concentration causes unsuitable equivalence ratio for ignition. As a result,
local heat flux at Position 1 and 2 started to increase earlier before the ignition occurred. The
most surprising is the peak value of local heat flux was dramatically decreased when the ignition
occurred later after spray impingement. It is because the both positions increased mainly by
convective evaporation spray during the injection duration. Consequently, the rate of heat
transfer was lower around area Position1 and 2. However, in case of O2 = 21%, the ignition
occurred just after impingement in which cover Position1 and 2, as a result Position2 increased
simultaneously with ignition and gave substantial amount on local heat flux in that region. The
temperature distribution also playing role on this phenomenon.
Even though, local heat flux increase and higher peak value was observed at Position1
and 2 under O2 = 21%. However, there was no significant difference in Position3 at both
conditions. The wall friction and momentum loss due to turbulent mixing took place at
Position3 as the far area from the center of impingement.

94
Figure 6.5 Temporal variation of local heat flux, integrated flame luminosity, and total heat flux at combustion
Figure 6.5 (c) shows temporal variation of the total heat flux at different oxygen
concentrations. It can be seen in the graph, O2 of 21% had two peaks waves i.e. there were two
stages for the local heat transfer. At first, the local heat flux was increased by turbulence of
impingement spray. Then, heat transfer by flow along the wall, which started after
impingement, took place. While O2 of 16% accumulated at the second stage for local heat
transfer due to significant ignition delay. Consequently, the temperature distribution was
appeared far away from the center of impingement in which influence on larger area.

95
Figure 6.6 Comparison of the areal transferred heat and ratio of heat loss to total combustion heat at different oxygen concentration
A comparison of the transferred heat at each area under different oxygen concentrations
are shown in Figure 6.6. Transferred heat value was decreased with lower oxygen
concentration. This effect is mainly due to the decrease in the burned gas temperature with
decreasing the volume fraction of oxygen concentration [23]. Regarding this graph, the
transferred heat at O2 = 16% decreased around 18% from O2 = 21%. This decrease was observed
at all areas. Decreasing oxygen concentration was effective parameter for reducing the heat
transfer on the wall. Ratios of heat lost through the wall to total combustion heat are also shown
in the graph. It is about 11% of total combustion energy at lower oxygen concentration.
6.5 SUMMARY
This chapter has explained the effects of oxygen concentration on the combustion wall
heat transfer under diesel engine-like conditions. The following conclusions can be deduced as
follows.
1. By using the two-color pyrometry analysis, we found that the combustion distribution was
low temperature at oxygen concentration of 16%.

96
2. The low temperature due to decreasing oxygen concentration delays start of ignition. As a
result, total heat flux accumulated at the peak of second waveform stage.
3. Comparing different oxygen concentration, O2 of 16% showed the lower transferred heat to
the wall. This was caused by decrease in burned gas temperature and small flame contact
area.
4. At O2 = 16% condition, transferred heat to the wall was reduced around 18%. It means
around 11% of heat was lost from total combustion energy.

97
CHAPTER 7
COMBINED EFFECT OF IMPINGEMENT DISTANCE/INJECTION
PRESSURE AND OXYGENT CONCENTRATION/INJECTION
PRESSURE
7.1 INTRODUCTION
In the previous chapter, the mechanism of wall heat transfer with impinging spray/flame
on the wall have studied with various effects parameter in order to improving the thermal
efficiency. In this chapter, further study was conducted with combined effect of impingement
distance/injection pressure and oxygen concentration/injection pressure. Furthermore, in this
study, relation between Nusselt number (Nu) and Reynolds number (Re) were also investigated
to understand the heat transfer phenomena in diesel engines. For the characteristic velocity,
mean piston speed is usually used in the previously proposed heat transfer equation. Recently,
Kuboyama, et al. [23] used spray tip velocity as characteristic velocity during the fuel injected
period. In this study, to obtained characteristics velocity for Re number, flamelet velocity as a
new method for determining characteristics velocity will be discussed in detail. The aim this
study to full understanding of the heat loss phenomenon at some combined effects as parameter
condition.
7.2 EXPERIMENTAL CONDITIONS
Table 7.1 demonstrates the injector and injector conditions that will be used in the
combined effect. The injection pressures were set 80, 120, and 180 MPa. Under the combined
effect of impingement distance/injection pressure, the experimental and impingement wall con-
Table 7.1 Injector and Injection Conditions
Injector type Piezo actuator type
Number of nozzle holes 1
Injection quantity (mm³) 5
Diameter of nozzle holes (mm) 0.133
Injection pressure (MPa) 80, 120, 180

98
Table 7.2 Experimental and Impingement Wall Conditions under Combined Effect of Impingement Distance/Injection Pressure
Table 7.3 Experimental and Impingement Wall Conditions under Combined Effect of Oxigen concentration/Injection Pressure
ditions are presented in Table 7.2. Distance from nozzle tip to wall was used 30, 40, and 50 mm
as various of impingement distances. The conditions at non-evaporation, evaporation and
combustion also presented in the table. Table 7.3 shows the experimental conditions and wall
condition under the combined effect of oxygen concentration/injection pressure. The oxygen
concentration was selected as 21 and 16% at impingement distance of 40 mm. The nozzle hole
diameter was set at 0.133 mm regardless of injection pressure, impingement distance, and
oxygen concentration.
Ambient condition Non-Evaporation Evaporation and Combustion
Ambient gas N2 Combustion: Air (N2:79%,O2:21%)
Evaporation: N2
Ambient pressure (MPa) 1.4 4.1
Ambient temperature (K) 300 873
Ambient density (kg/m³) 16
Fuel Diesel Fuel
Impingement wall Flat plate, Stainless steel
Impingement distance “Dimp” (mm) 30, 40, 50
Wall temperature (K) 300 460 ±10
Cooling method - Oil cooling
Ambient condition Combustion
Ambient gas O2 = 21 %
O2 = 16 %
Ambient pressure (MPa) 4.1
Ambient temperature (K) 873
Ambient density (kg/m³) 16
Fuel Diesel Fuel
Impingement wall Flat plate, Stainless steel
Impingement distance (mm) 40
Wall temperature (K) 460 ±10
Cooling method Oil cooling

99
7.3 COMBINED EFFECT OF IMPINGEMENT DISTANCE /INJECTION
PRESSURE ON WALL HEAT TRANSFER
In this section, combined effects of the impingement distance and injection pressure on
heat transfer were investigated. Figure 7.1 shows the combined effect of impingement
distance/injection pressure on the transferred heat and ratio to the total combustion heat. Three
injection pressures, i.e. 80, 120, and 180 MPa were investigated at each impingement distance
of 30, 40, and 50 mm. The combined effect can be explained as follows:
1. The transferred heat significantly increased at injection pressure of 180 MPa. Especially
combining with longer impingement distance, it dramatically increased.
2. On the other, there were small differences in them except 180 MPa by the distances.
3. The ratio of heat loss through the wall accounts for about 10-17 % of total combustion energy.
Figure 7.1 Comparison of the areal transferred heat at combined impingement distance/injection pressure
The heat loss phenomenon under the combined effect of impingement distance/injection
pressure, Dimp/Pinj conditions may be related to the liquid spray impingement on the wall. Figure
7.2 presents the evaporating wall impinging spray at combined Dimp/Pinj under the same injected
fuel quantity, which was taken just before the end of injection (EOI) each. Figure 7.2 (a) shows
liquid fuel adhered in all the pressure conditions due to small impingement distance. In general,
liquid film on a wall surface tended to decrease with increased injection pressure [115], because
the impinged spray spreads to wider area and distribution of the spray is more uniform as the

100
injection pressure rises. However, these photographs look similar in all injection pressures due
to the same amount of injected fuel. This means that the transferred heat decrease at the distance
of 30 mm under injection pressures in Figure 7.1 was influenced by liquid fuel adhered on the
wall. Moreover, Figure 7.2 (a-c) at 180 MPa injection pressure shows the short impingement
distance could not avoid liquid impingement on the wall. Consequently, the lower wall
temperature due to liquid impingement then influences combustion temperature in the near wall
region which led to the decelerating wall heat transfer.
Figure 7.2 Evaporating wall impinging spray (liquid component) at combined impingement distance/injection pressure under same amount injected fuel quantity
As the transferred heat was increased by combination of the longer distance with the
higher pressure we studied with the following combination, i.e. Impingement distance/injection
pressure, Dimp/Pinj = 30/80, 40/120 and 50/180 (mm/MPa), respectively. The nozzle hole
diameter was set at 0.133 mm regardless of injection pressure and impingement distance
conditions.

101
7.3.1 Combined Effect of Impingement Distance and Injection Pressure under Non-
combustion
(a). Non-evaporation condition
(b). Evaporation non-combustion condition Figure 7.3 Non-evaporating spray tip penetrations and evaporating liquid penetration length at
combined impingement distance/injection pressure.

102
Non-evaporating spray tip penetrations and evaporating liquid penetration length under
combined impingement distance/injection pressure are presented in Figure 7.3 (a). After fuel
being injected, momentum exchange between the liquid and surrounding gas lead to
deceleration of the droplets [116]. The spray tip experiences the strongest deceleration and the
droplets with low kinetic energy are pushed aside. This forms more diluted spray downstream
the nozzle, while liquid fuel mass is concentrated near the spray axis [117]. Combination of
Dimp/Pinj =50/180 reached a maximum spray tip penetration as shown in Figure 7.3 (a). In the
case of high injection pressure, thus, high injection velocity, the droplets at the spray tip are
continuously replaced with new ones, and the spray penetration increases further [117].
Combined effect of injection pressure and impingement distance on evaporating spray
tip penetrations can be seen in Figure 7.3 (b). In the case of Dimp/Pinj = 30/80 liquid spray length
still exists at time of impingement, while 120/40 hardly ever contact with impingement wall in
liquid phase. A further increase in injection pressure, 180 MPa, liquid fuel was completely
vaporized before reaching impingement distance, 50 mm.
7.3.2 Combined Effect of Impingement Distance and Injection Pressure under
Combustion Condition
Figure 7.4 (a-c) shows flame temperature distribution at combined impingement
distance/injection pressure. The flame temperature distribution will be greatly different from
that combined effect. Spray mixture during ignition delay is the main factor in combustion
develop including its flame temperature. The occurrence of a very bright intensity after auto-
ignition is considered as flame temperature. As impingement distance shorter and injection
pressure lower, temperature distribution become wider. The large flame growth is without any
doubt due to by effect of local high equivalence ratio, as this combination could not avoid fuel
film around the wall impingement as shown in Figure 7.2 and 7.3 (b). However, in longer
impingement distance and high injection pressure, Dimp/Pinj = 50/180 lead more air entrainment
with improving in spray atomization and premixing between fuel and air due to high velocity.
As a result, flame luminosity was reduced at Figure 7.4 (c). Due to weak intensity of the flame
luminosity image, when it applying to the two-color method, the flame temperature also
reduces.

103
Figure 7.4 Flame temperature distribution at combined impingement distance/injection pressure.
7.3.3 Combined Effect of Impingement Distance and Injection Pressure on Wall Heat
Transfer
As to the combined effect, the transferred heat was increased by combination of the
longer distance with the higher pressure, in this subsection will be studied with the following
combination, i.e. 30/80, 40/120 and 50/180, respectively. Figure 7.4 (a-c) shows temporal
changes of non-steady local heat flux and integrated luminosity with the combination of
Dimp/Pinj conditions. The combination showed far lower integrated flame luminosity at higher
injection pressure than that of lower injection pressure. This means more complete combustion
with sufficient oxygen was achieved.
By comparing the combination of 30/80, 40/120, and 50/180 as shown in the Figure 7.4
(a-c), combination of 50/180 showed that the heat fluxes rose more steeply and higher.
Moreover, start points of the steep rise at Position1 and 2 became simultaneous with the
combination. This was probably the convection by turbulence from spray impinging, which

104
took time to reach the wall due to longer impingement distance. As a result, it reached to the
wall simultaneously with the ignition which had a major impact on the local heat flux values.
At the same times, due to high injection pressure related to high velocity, the flame gas flow of
outer area became faster and led to the higher local heat flux waveform at position3 comparing
with the other combination.
Figure 7.4 Temporal variation of local heat flux, integrated flame luminosity, and total heat flux at combined impingement distance/injection pressure

105
On the other hand, combination of 30/80 had a lower local heat flux due to a large liquid
spray impingement to the wall. It could be explained with Figure 7.3 (b) that liquid component
of the spray reached to the wall only at impingement distance of 30 mm. It was plausible that
cooling effect from liquid fuel adhered on the wall could have influenced to the slow heat
transfer rate. Besides, liquid fuel adhered on the wall caused the local heat flux waveform at
Position1 had slope after increasing. For reducing heat loss through the wall, liquid spray
impingement was effective.
Figure 7.4 (d) shows total local heat flux at combination effect. The result showed that
a maximum total heat flux value of 16.2, 8.3, and 7.2 kW for combined effect of 50/180, 40/120,
and 30/80. According to the combined effect, it can be concluded that the high injection pressure
more influential to total heat flux at longer impingement distance.
7.4 COMBINED EFFECT OF IMPINGEMENT OXYGEN
CONCENTRATION/INJECTION PRESSURE ON WALL HEAT TRANSFER
In this subsection, combined effects of the oxygen concentration and injection pressure
on wall heat transfer were investigated. Figure 7.5 presents the combined effect of oxygen
concentration/injection pressure on the transferred heat and ratio to the total combustion heat.
21 and 16% as the various oxygen concentration were investigated at each injection pressure of
Figure 7.5 Comparison of the areal transferred heat at combined oxygen concentration/injection pressure

106
80, 120, and 180 MPa. The combined effect can be explained as follows:
Firstly, the heat transferred increased gradually with increasing injection pressure at O2
= 21%. However, it was not applied to O2 = 16%, the heat transferred increased
disproportionately even though the injection pressure was increased. It means high velocity by
increasing injection pressure was not dominant factor on transferred heat when oxygen
concentration under 21%.
Secondly, lower oxygen concentrations consistently reduce heat transfer on the wall in
all conditions. This decreased due to the flame temperature was lower. By higher oxygen
concentration as 21%, it allows more stable combustion with produce high flame temperature
then can lead more rate of heat transfer. And thirdly, the ratio of heat loss through the wall
accounts for about 10-15% of total combustion energy.
Considering Figure 7.6, at lower oxygen concentration, the transferred heat decreased
even though injection pressure was increase. It is inversely proportional when oxygen
concentration was set O2 = 21. Therefore, the studied will be focus on the following
combination, i.e. O2/Pinj = 16/80, 16/180 and 21/180 (%/MPa) each. These conditions can
represent both comparison different effect of injection pressures and oxygen concentration.
Non-steady local heat flux and integrated luminosity with the combination of O2/Pinj conditions
are presented in Figure 7.6 (a-c).
Figure 7.6 (a-b) demonstrates the comparison of injection pressure in the combined
effect. In the previous section, effect of injection pressure was explained in detail. However,
since the oxygen concentration of 16% produced lower flame temperature, it is interesting to
clarify the phenomenon in local heat flux history. By comparing the combination of 16/80 and
16/180 as shown in the Figure 7.6 (a-b), local heat flux waveform at all positions started to
increase earlier at combination of 16/180. It is certainly due to increasing injection pressure
related to increasing velocity. On the other hand, local heat flux peak value was almost similar
in these combinations. Regarding this phenomenon, increasing injection pressure did not affect
more on local heat flux at oxygen concentration of 16% due to both temperatures are lower.
Even though spray mixture increases by higher injection pressure, the time of ignition was not
change with pressure, but the combustion process was significant decreased in this condition.

107
At lower injection pressure, combustion duration is slightly longer which causes the flame
contact was stayed longer on the wall. As a result, transferred heat to the wall increased as
shown in Figure 7.5.
Figure 7.6 Temporal variation of local heat flux, integrated flame luminosity, and total heat
flux at combined oxygen concentration/injection pressure
Figure 7.6 (b-c) shows a comparison of oxygen concentration in the combined effect.
Combination of 21/180 had high local heat flux at all positions. with the increased oxygen
concentration, increased both the fuel-air mixture and the reaction rate. As a result, the flame

108
temperature increased and this flame gas flow distributed along the wall due to high injection
pressure, then lead the increase rate of the heat transfer. However, at lower oxygen
concentration, the heat loss was decreased. It is due to the lower flame temperature and the
reduced area contact period between the flame and the wall surface, caused by the higher heat
capacity and density of the ambient gas [118].
7.5 HEAT TRANSFER CORRELATIONS
According to the above explanations, the spray flame flow has considerable effect on
heat loss through the wall. Then, we studied relation between Reynold number (Re) and Nusselt
Nu number.
7.5.1 Flamelet Velocity
As shown in equation (2.18), Re number requires characteristic flow velocity. Recently,
Kuboyama, et al. [23] have provided alternative correlations which are applicable to recent
diesel engines. They used flow induced by fuel injection during the fuel injection period for
characteristic velocity. After the fuel injection, character velocity used in the Woshni’s equation
(piston speed). However, it was not possible to estimate the velocity by commonly used
measurements, so we utilized waveforms of the heat flux as represented characteristics
velocity. As characteristics velocity, mean piston speed is usually used in previously proposed
heat transfer equations.
The waveforms had clear peaks which seemed to have resulted from combustion flame
motion. If the peaks were similar in the different positions, by comparing peak by peak we
could obtain flamelet velocities along the wall as will be explained in flamelet velocity. The
characteristic velocity for the Reynolds number obtained from the single-shot heat flux
waveform. In order to investigate characteristic flow velocity, flamelet velocity determined
according to local combustion flame motion near wall which has direct impact on local heat
flux waveform characteristic. It was assumed that the waveform which had clear peaks as a
consequence of combustion flame motion.

109
Figure 7.7 Relation of heat flux waveforms between the two points
Figure 7.7 presents single shot heat flux waveform in which only Position2 and 3 are
displayed. The calculation method of flamelet velocity is as follows. First, the distance between
Position2 and Position3 was 10 mm, denoted as characteristics length. Position2 and Position3
were chosen with consideration that Positions had a more stable velocity compared to that of
Position1, at which it was in a state of stagnation. Next, time value can be detected from
measuring the change in waveform between Position2 and Position3 as depicted by number 1
to 7 inside square as shown in Figure 7.7. According by the time difference between Position2
and Position3 (for example number 1), we obtained time value to calculate characteristic
velocity. The Table 7.4 shows the result of flamelet velocity. From these results, it can be used
for calculating Re number.
Table 7.4 Flamelet velocity result from heat flux waveform
Distance from Position2
P2 P3 to Position3 (mm)
1 0.7 1.8 10 9.09
2 0.95 2.02 10 9.35
3 1.45 2.91 10 6.85
4 1.7 3.3 10 6.25
5 1.83 3.55 10 5.81
6 2.2 3.96 10 5.68
7 2.43 4.3 10 5.35
Times at Position (ms)Velocity (m/s)Number

110
Figure 7.8 Flamelet velocity at different injection pressure
Figure 7.8 shows characteristic velocities at the different injection pressures by the
method. 80 and 120 MPa showed similar velocity, while 180 MPa had higher velocity compared
with others. This result seemed reasonable, as is reported by some researcher [26,27] at which
the local flame velocity increased with high injection pressure. This increase is thought to be
due to the increasing fuel injection velocity. Then we used these values for calculating Re
number.
7.5.2 Correlation between Reynolds Number and Nusselt Number
Figure 7.9 (a) shows correlation between Re and Nu number in all of Positions at
difference of impingement distance and injection pressure. For Re number calculation,
impingement distance is selected as a representative length, i.e. 40 mm, whereas those shown
in Figure 7.8 were used for characteristic velocity. For Nu number calculation, thermodynamic
properties of air were taken into account. It can be seen from the figure, relation between Nu
number and Re number, approximates one line, regardless of the impingement distance and
injection pressure conditions. It was found that Nu number was directly proportional to Re
number of 0.8 powers for the combined case.
Figure 7.9 (b) performing a correlation between Re and Nu number at difference of
oxygen concentrations and injection pressures. Once again, the figure showing the Nu number
was proportional to Re number. High turbulence flow from combustion which is characterized
by high Reynolds number is one of the major factors causing a large amount of heat transfer on

111
the wall. Regarding these results, using flamelet velocity to calculate Re number was well
expressed in the correlation.
(a). Combined effect of impingement distance/injection pressure
(b). Combined effect of oxygen concentration/injection pressure
Figure 7.9 Correlation between Reynolds number and Nusselt number at combined impingement distance/injection pressure and oxygen concentration/injection pressure.
Differences in characteristics velocity for examples: Kuboyama et al.,[23] using flow
induced by fuel injection and piston speed and Fujikawa et al.,[119] using flame tip velocity as
shown in Figure 7.10, it can be compared as follows:
a. Nu number was directly proportional to Re number at all conditions.
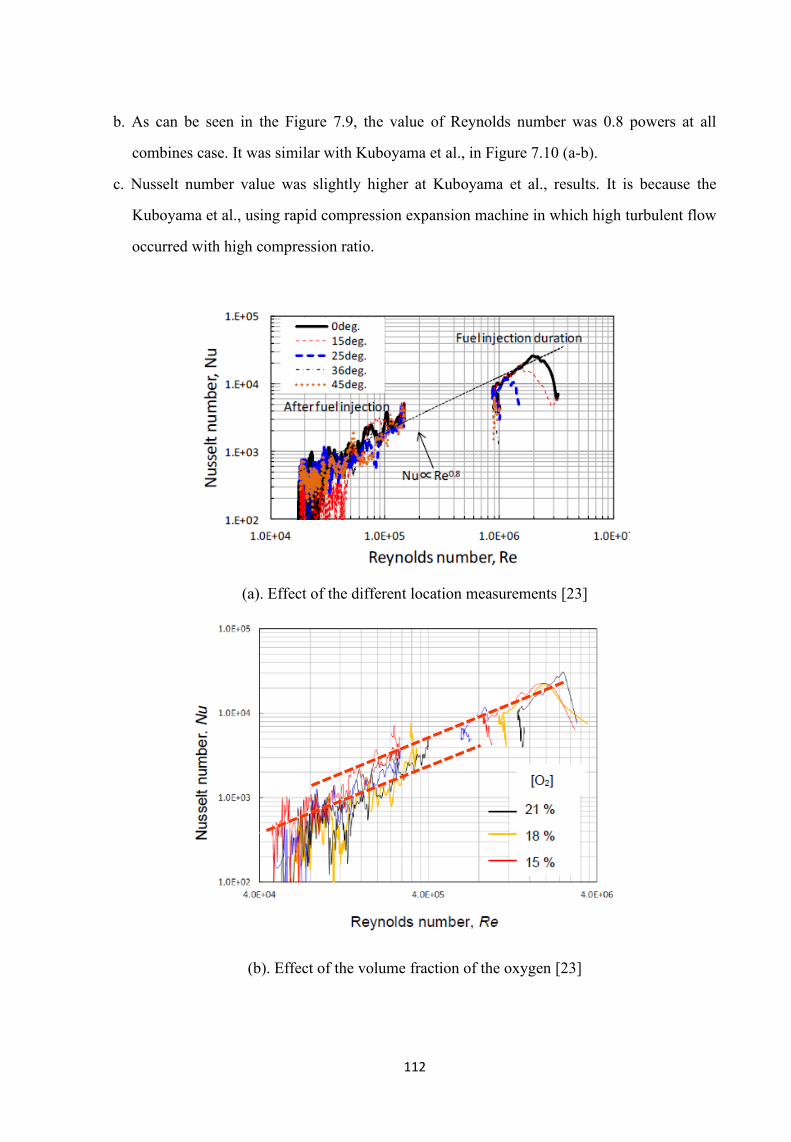
112
b. As can be seen in the Figure 7.9, the value of Reynolds number was 0.8 powers at all
combines case. It was similar with Kuboyama et al., in Figure 7.10 (a-b).
c. Nusselt number value was slightly higher at Kuboyama et al., results. It is because the
Kuboyama et al., using rapid compression expansion machine in which high turbulent flow
occurred with high compression ratio.
(a). Effect of the different location measurements [23]
(b). Effect of the volume fraction of the oxygen [23]

113
(c). Effect of the injection pressure, nozzle hole diameter, and fuel temperature [119]
Figure 7.10 Relation between Reynolds number and Nusselt number at different location measurements and different oxygen concentrations [23]; and injection pressure, nozzle hole
diameter, and fuel temperature [119]
d. However, Nusselt number value was slightly lower at Fujikawa et al., due to different
ambient density and characteristics height.
e. Comparison heat transfer correlation with others researcher can be seen in appendix Figure
7 (a-b).
To more accurately predict the heat transfer correlation, then we modified the
characteristics length from impingement distance to flame height as shown in Figure 7.10 (a-
b). As a result, Nusselt and Reynold number value was lower by using flame high characteristics
length at both combined effect of impingement distances/injection pressure and oxygen
concentration/injection pressure.

114
(a). Combined effect of impingement distance/injection pressure
(b). Combined effect of oxygen concentration/injection pressure
Figure 7.10 Correlation between Reynolds number and Nusselt number at combined impingement distance/injection pressure and oxygen concentration/injection pressure using
flame height as characteristics length.
7.6 SUMMARY OF ALL PARAMETER EFFECTS
In order to understand the heat loss at various of experimental parameters, Figure 7.11
shows relative change of the heat loss for experimental parameter corresponding to baseline

115
condition. From this graph, heat loss increased only under injection pressure of 180 MPa at
both experimental parameter of injection pressure, Pinj and impingement distance, Dimp.
Furthermore, it contributed heat loss around 17% when longer impingement distance and higher
injection pressure. Nozzle hole diameter, Dhole is another experimental parameter that
contributed heat loss on the wall. These Dhole generated heat loss at all of injection pressures. In
contrast with what was Dhole resulted, oxygen concentration produced lower heat loss at all
injection pressures. It was around 18% heat loss decreased at injection pressure 120 MPa.
Temperature gradient is as the major source of transferred heat, when the flame temperature is
weak, the result is slow heat transfer on the wall.
Figure 7.11 Relative change of the heat loss for experimental parameter.
7.7 SUMMARY
The combined effects of impingement distance/injection pressure and oxygen
concentration/injection pressure on the combustion wall heat transfer under diesel engine-like
conditions were investigated. Moreover, the correlation between Re and Nu number also was
investigated in this study. From these results and discussions, conclusions this work are derived
as follows.

116
1. The combined effect of injection pressure/impingement distance on the wall heat loss
showed that heat loss was dramatically increased at injection pressure and impingement
distance, 180/50 condition. Turbulent mixing effects before wall impingement played
important role for this heat loss.
2. Regarding with the combined effect of oxygen concentration/injection pressure on the wall
heat loss, the lower oxygen concentration, the less heat loss was generated at all injection
pressures. Lower flame temperature and reduced flame contact area and period were
influencing factor on heat loss under these conditions.
3. Under summary all of parameter effects (such as: Injection pressure, impingement distance,
nozzle hole diameter and oxygen concentration), the decreasing oxygen concentration was
effective to reduce heat loss on the wall.
4. The characteristics velocity in the heat transfer correlation under diesel engine-like
conditions based on flamelet velocity in which was obtained from heat flux waveform.
flamelet velocity determined according to local combustion flame motion near wall which
has direct impact on local heat flux waveform characteristic.
5. A new method for determining characteristic velocity to calculate Re number has been
proposed. By using the value, it was found that Nu number was proportional to Re number
of 0.8 powers.
117
CHAPTER 8
CONCLUSIONS
The aim of this dissertation was understanding the mechanism of heat transfer from
spray and flame to the impinging wall under small diesel engine–like conditions. The spray
behavior under non-evaporation and evaporation scenarios were investigated using the Mie
scattering technique. Moreover, the combustion behavior was investigated using direct imaging
of the flame’s natural luminosity. The distribution of the flame temperature and soot emission
were quantitatively calculated by applying the two-color method on the natural luminosity
images. The instantaneous temperature was detected via three thin-film thermocouple heat flux
(TFTHF) sensors that had been mounted on the wall surface side. Unsteady heat flux at the
impinging wall was calculated with the finite difference method using the measured
temperatures as a boundary condition. The impingement distances (30, 40, and 50 mm),
injection pressures (80, 120, and 180 MPa), nozzle hole diameters (0.133 and 0.122 mm),
oxygen concentrations (21 and 16%), and combined effects (impingement distance/injection
pressure, oxygen concentration/injection pressure) were investigated parametrically for
elucidating the heat transfer to the wall and ratio of heat loss to total combustion heat.
Furthermore, heat transfer coefficients were obtained from the measurements, and the
relationships between the Nusselt number and Reynolds number were investigated to clarify
the phenomenon of heat transfer in diesel engines. The general conclusions are discussed in
turn in this chapter.
8.1 MAIN FINDINGS OF THIS STUDY
Heat transfer under baseline conditions
The baseline conditions for investigating the heat transfer were selected as follows:
injection pressure of 120 MPa, impingement distance of 40 mm, nozzle hole diameter of 0.133
mm, and 21% oxygen concentration. The investigation aimed to clarify the relationship between
the impinging spray/flame and local heat flux under baseline conditions. To investigate this
118
relationship, three conditions of non-evaporation, evaporation, and combustion were
considered in this study. It was found that, under non-evaporating spray, the spray tip
penetration increased with time, although the fuel has done injected. Under evaporation
conditions, the liquid length penetration was saturated under 40 mm and remained constant,
while the fuel continued to be injected. This means that, under baseline conditions, the liquid
phase of the spray could not reach the wall. In other words, the impingement distance of 40 mm
was enough to generate a conversion from the liquid to vapor phase before the fuel reached the
wall. In the vapor area around the center of impingement, the flame’s natural luminosity
occurrence was identified after reaching a certain temperature for ignition.
Regarding the spatial nonuniformity of the spray and flame flow, the time histories of
local heat fluxes were different at the three measurement locations (Position1, Position2, and
Position3). The observed increase in local heat flux at Position1 could be interpreted as resulting
from the effect of convection when a turbulent part of the evaporating spray impinges the wall.
Then, the large effect of combustion gas velocity was responsible for starting the local heat flux
peak at Position2. Wall friction and momentum loss took place due to turbulent mixing, and the
local heat flux at Position3 was significantly lower than the heat fluxes at the other positions.
The total transferred heat under the base condition was around 30 joules.
Effects of impingement distances
To clarify the effects of impingement distance on the wall heat transfer, three
impingement distances from the injection tip to the wall were investigated. The variation of
impingement distance has an important role in the spray behavior, combustion development,
soot emission, and heat loss. Comparing three impingement distances under non-evaporating
spray, it was found that they had similar penetrations until impingement on the wall, but they
differed from each other after impingement due to the impingement timing difference.
However, the spray tip penetration velocity showed almost the same inclination after
impingement among the three impingement distances.
Under combustion conditions, it was confirmed that the ignition delay became longer
with distance. At Dimp = 40 mm, a higher flame area, mean temperature, and KL factor were
observed compared with the other impingement distances. This means that deteriorated

119
combustion occurred at this distance, thereby leading to high soot formation. However, at Dimp
= 30 mm, impinged spray droplets were rolled up, caused by the shorter impingement distance.
This resulted in better mixing with ambient air, enhancing the oxidation of fuel and reducing
soot formation. When increasing the distance to 50 mm, the flame area, mean temperature, and
KL factor had significantly lower values. At Dimp = 50 mm, with a longer impinging path,
combustion became slower, with a lower temperature, and soot formation was reduced due to
the improved fuel air mixing before combustion occurrence.
Among the three different distances, 40 mm had the maximum local heat flux and heat
loss on the wall. This was caused by high temperature near the wall and a large flame contact
area. The larger flame contact during resident time on the wall led to a high wall surface
temperature; therefore, it increased the rate of heat transfer. The ratio of heat loss through the
wall to total combustion heat at different impingement distances was around 14–15%.
Effects of injection pressure
The effects of the injection pressure on the spray motion, flame behavior, and wall heat
transfer were investigated. Under non-evaporating and evaporating non-combustion, it was
found that the spray development and spray tip penetration depended highly on the injection.
The higher the injection pressure became, the more the spray would spread to a larger
circumferential area on the flat wall and the greater the spray tip penetration would be. With
evaporating spray, an increase in velocity with higher injection pressure led to more effective
atomization. Consequently, a more homogeneous mixture distribution emerged due to the faster
evaporation rate.
Injection pressure also had a significant effect on the heat flux characteristics in the non-
combustion condition. By increasing the injection pressure, the initiation of the local heat flux
increase occurred at an earlier point, which was associated with the increased spray velocity
and led to earlier turbulent convection. As a result, the hot gas flowed toward a wider wall area,
which was an influential factor for the increasing temporal variations of the total heat flux.
In the case of combustion, the transferred heat increased significantly, and the highest
transferred heat was observed at 180 MPa among both lower injection pressures (80 and 120
MPa). The flame velocity, which relates to the heat transfer coefficient, increased with the

120
injection pressure, leading to hot gas flow spreading to the circumferential area of the flat wall.
Regarding both the combustion and non-combustion conditions, they had similar waveforms
and orders of heat transfer coefficients at all the positions and injection pressures. This indicates
that, in combustion, flow induced by the injected spray is dominant for the heat transfer to the
wall.
Effects of the nozzle hole diameter
The effects of the nozzle hole diameter on heat transfer were considered in this study. It
was found that, under the non-combustion condition, the local heat flux rises at Position1
became earlier and higher at Dhole = 0.133 mm in which larger nozzle hole diameter comparing
Dhole=0.122 mm. It increased due to the higher momentum and velocities stemming from an
increased fuel injection rate. Similarly, under the combustion condition, higher heat flux values
at Position1 and Position2 were obtained at a larger nozzle diameter. However, a smaller nozzle
hole diameter with smaller droplet size can promote spray atomization and entrainment. As a
result, the flame develops into a wider circumferential area at Dhole = 1.22 mm. As a
consequence of this phenomenon, Position3 exhibited an earlier and higher increase, leading to
a greater rate of heat transfer due to the larger affected area.
Regarding the effect of the injection pressure and nozzle hole diameter on the wall heat
loss, the larger the nozzle hole diameter, the less heat loss was generated at injection pressures
of 80 and 120 MPa. The flame temperature was an influencing factor on heat loss under these
conditions. In contrast, the larger nozzle hole diameter caused more heat loss at an injection
pressure of 180 MPa. Local high-temperature end gas regions had a dominant effect on heat
loss at this injection pressure/nozzle hole diameter condition.
Effects of oxygen concentration
The effects of oxygen concentration on heat transfer were investigated. By comparing
the temperature distributions with different oxygen concentrations, it was found that the
temperature distribution and flame contact area were decreased with a decreasing oxygen
concentration. When the combustion temperature was low, the temperature difference between
the flame and wall surface was smaller. As a result, the local heat flux decreased, and the
transferred heat value was also reduced.

121
Combined effects
Combined effects of the impingement distance and injection pressure on heat transfer
were examined. It was found that the transferred heat significantly increased at an injection
pressure of 180 MPa. Especially, it increased dramatically when combined with a longer
impingement distance. This was probably due to the convection by turbulence from spray
impinging, which took time to reach the wall because of the longer impingement distance. As
a result, it reached the wall simultaneously with the ignition, which had a major influence on
the local heat flux values. In contrast, the combination of Dimp/Pinj=30/80 had a lower local heat
flux due to a large liquid spray impingement to the wall.
Under the combined effects of the oxygen concentration and injection pressure, it was
found that lower oxygen concentrations consistently reduced the heat transfer on the wall in all
conditions. The transferred heat decreased even when the injection pressure was increased. This
occurred because the flame temperature was lower compared with the base oxygen
concentration of O2 = 21%.
As a new method for determining the characteristic velocity to calculate the Re number,
flamelet velocity has been proposed. Flamelet velocity is determined according to the local
combustion flame motion near the wall, which has a direct effect on the local heat flux
waveform characteristic. In this study, using the flamelet velocity value, it was found that the
Nu number was proportional to the Re number. Its mean, value of Nu number is high when the
Re number value increased.
Summary
In summary, this dissertation found that the wall impinging spray flame is a vital factor
with a significant effect on heat transfer characteristics. Comparing non-combustion and
combustion, around 30% of the transferred heat through the wall was transferred by the
convection of non-combustion evaporating spray. In terms of the effect of impingement
distance, a distance of 40 mm resulted in substantial heat transfer due to the high temperature
near wall and long flame contact period. Similarly, the results showed that the heat transfer
increased when the nozzle hole diameter was decreased to 0.122 mm. In contrast, a high
injection pressure reached the peak heat transfer, which was attributed to a high flame velocity

122
with the increasing heat transfer coefficient due to the increased fuel injection rate. However,
when the oxygen concentration decreased to 16%, less heat transfer was generated, even though
the injection pressures increased. The lower flame temperature and reduced flame contact area
period were influencing factors on heat loss under these conditions. Considering the combined
effects, heat transfer significantly increased under a high injection pressure and longer
impingement distance. This was probably because the ignition occurred almost simultaneously
with the impingement timing, which had a major effect on the local heat flux values, and
consequently, the total heat transfer.
Regarding some parameter conditions that were investigated, decreasing the oxygen
concentration was an effective parameter when it came to reducing the heat transfer on the wall
due to the lower temperature distribution. Furthermore, the cooling effect from liquid fuel
adhering to the wall could have influenced the slow heat transfer rate. This was achieved by the
combined effects of the lower impingement distance and lower injection pressure.
This study proposed that characteristic velocity in the heat transfer correlation in diesel
engines is defined by flamelet velocity. Flamelet velocity was determined from the assumption
that local combustion flame motion near the wall has a direct influence on the local heat flux
waveform characteristics.
8.2 RECOMMENDATIONS FOR FUTURE WORKS
Several recommendations can be made for future work in this field. The detailed
mechanism of the heat transfer on the flat wall impinging spray flames needs to be further
investigated. Therefore, to better understand the spray flame velocity, a particle image
velocimetry (PIV) system is needed at all conditions. in addition, future study should seek to
improve the systems for measuring pressure and gas temperature, allowing better calculation of
the heat release and heat transfer coefficient.
Some effect parameters for the wall heat transfer were investigated in this study;
however, the effects of split injection and similar injection rates with different nozzle hole
diameters should also be investigated in future research to better understand factors that will
improve the thermal efficiency of small diesel engines. In addition, computational fluid

123
dynamics should be applied to obtain valuable information on the physical phenomena
associated with heat transfer diesel engine combustion.
The main goal in this study was reducing heat loss for improving the thermal efficiency
in a small diesel engine. Although the ambient conditions and wall temperature were controlled,
such that the experimental setup was like a real diesel engine, a turbulent flow may affect the
combustion behavior, and thus, the rate of heat transfer. Therefore, future studies on the current
topic should investigate the heat transfer characteristics by applying different chamber shapes
and injection amounts, as well as using multi-hole injectors, to include multiple injection
strategies.

124

125
REFERENCES
[1] BP, “67 th edition Contents is one of the most widely respected,” Stat. Rev. World
Energy, pp. 1–56, 2018.
[2] ExxonMobil, “2017 Outlook for Energy,” Outlook for Energy, p. 52, 2017.
[3] ExxonMobil, “2018 Outlook for Energy: A View to 2040,” Outlook, 2018.
[4] Continental-automotive, Worldwide Emission Standards and Related Regulations.
2019.
[5] M. Kono, M. Basaki, M. Ito, T. Hashizume, S. Ishiyama, and K. Inagaki, “Cooling
Loss Reduction of Highly Dispersed Spray Combustion with Restricted In-Cylinder
Swirl and Squish Flow in Diesel Engine,” SAE Int. J. Engines, pp. 504–515, 2012.
[6] J. B. Heywood, Internal Combustion Engine Fundementals, vol. 21. New York:
McGraw-Hill, 1988.
[7] T. Tatsumi, S. Maeda, S. Miyata, Y. Kobashi, and et al., “A Study on the Wall Heat
Loss in Diesel Spray Flame (First Report: Effect of injection pressure on the heat
flux),” Trans. Soc. Automot. Eng. Japan, vol. 47, no. 6, pp. 1291–1296, 2016.
[8] T. Tatsumi, S. Maeda, M. Nakata, Y. Kobashi, and et al., “A Study on the Wall Heat
Loss in Diesel Spray Flame ( Third report: Effects of Fuel Heating on the Heat Flux),”
27th Intern. Combust. Engine Symp., p. in japanese, 2016.
[9] T. Tatsumi, S. Maeda, M. Nakata, Y. Kobashi, and et al., “A Study on the Wall Heat
Loss in Diesel Spray Flame (Fourt Report: Effect of Nozzle Hole Diameter on the Heat
Flux),” JSAE Trans., vol. 49, no. 2, pp. 144–149, 2018.
[10] M. Nakata, N. Arai, S. Maeda, T. Tatsumi, E. Matsumura, and J. Senda, “A Study on
the Wall Heat Loss in Diesel Spray Flame (Sixth Report: Effects of Impingement
Distance and Inclination Angel of The Wall on The Heat Flux),” in Proceeding of 2016
JSAE Annual Congress, 2016.
[11] G. Borman and K. Nishiwaki, “Internal-combustion engine heat transfer,” Prog.
Energy Combust. Sci., vol. 13, no. 1, pp. 1–46, 1987.
[12] T. Lefeuvre, P. S. Myers, and O. A. Uyehara, “Experimental Instantaneous Heat Fluxes
in a Diesel Engine and Their Correlation,” 1969.
[13] G. Eichelberg, “Some New Investigations on Old Combustion Engine Problems,”
Engineering, vol. 148, pp. 463–446, 547–560, 1939.
[14] W. J. D. Annand, “Heat Transfer in the Cylinder of Reciprocating Internal Engines,”

126
Proc. Instn Mech. Enginers, vol. 177, no. 36, pp. 973–990, 1963.
[15] G. Woschni, “A Universally Applicable Equation for the Instantaneous Heat Transfer
Coefficient in the Internal Combustion Engine,” 1967.
[16] G. Sitkei and GV Ramanaiah, “A Rational Approach for Calculation of Heat Transfer
in Diesel Engines,” SAE Tech. Pap. 720027, pp. 165–174, 1972.
[17] T. Morel and R. Keribar, “A Model for Predicting Spatially and Time Resolved
Convective Heat Transfer in Bowl-in-Piston Combustion Chambers,” SAE Tech. Pap.
850204, 1985.
[18] T. Morel, C. I. Rackmil, R. Keribar, and M. J. Jennings, “Model for Heat Transfer and
Combustion In Spark Ignited Engines and its Comparison with Experiments,” SAE
Tech. Pap. 880198, 1988.
[19] G. F. Hohenberg, “Advanced Approaches for Heat Transfer Calculations,” SAE Tech.
Pap. 790825, p. 19, 1979.
[20] S. Bin Han, Y. J. Chung, Y. J. Kwon, and S. Lee, “Empirical Formula for
Instantaneous Heat Transfer Coefficient in Spark Ignition Engine,” SAE Tech. Pap.
972995, 1997.
[21] J. Chang, O. Güralp, Z. Filipi, D. N. Assanis, and et al., “New heat transfer correlation
for an HCCI engine derived from measurements of instantaneous surface heat flux,”
SAE Tech. Pap. 2004-01-2996, 2004.
[22] C. A. Finol and K. Robinson, “Thermal modelling of modern engines: A review of
empirical correlations to estimate the in-cylinder heat transfer coefficient,” Proc. Inst.
Mech. Eng. Part D J. Automob. Eng., vol. 220, no. 12, pp. 1765–1781, 2006.
[23] T. Kuboyama and Y. Moriyoshi, “Heat Transfer Analysis in a Diesel Engine Based on
a Heat Flux Measurement using a Rapid Compression and Expansion Machine,” SAE
Tech. Pap. 2017-32-0115, p. 6, 2017.
[24] N. Katsura, M. Saito, J. Senda, and H. Fujimoto, “Characteristics of a Diesel Spray
Impinging on a Flat Wall,” SAE Tech. Pap. 890264, 1989.
[25] L. M. Pickett and J. J. López, “Jet-Wall Interaction Effects on Diesel Combustion and
Soot Formation Reprinted From : Compression Ignition Combustion Processes 2005,”
SAE Tech. Pap. 2005-01-0921, p. 17, 2005.
[26] L. Zhao, R. Torelli, X. Zhu, R. Scarcelli, and et al., “An Experimental and Numerical
Study of Diesel Spray Impingement on a Flat Plate,” SAE Int. J. Fuels Lubr., vol. 10,
no. 2, pp. 2017-01–0854, 2017.

127
[27] S. W. Park and C. S. Lee, “Macroscopic and microscopic characteristics of a fuel spray
impinged on the wall,” Exp. Fluids, vol. 37, no. 5, pp. 745–762, 2004.
[28] Y. Zama, Y. Odawara, and T. Furuhata, “Experimental investigation on velocity inside
a diesel spray after impingement on a wall,” Fuel, vol. 203, pp. 757–763, 2017.
[29] G. Bruneaux, “Combustion Structure of Free and Wall-Impingement Diesel Jets by
Simultaneous Laser-Induced Fluorescence of Formaldehyde, Poly-Aromatic
Hydrocarbons, and Hydroxides,” Int. J. Engine Res., vol. 9, no. 3, pp. 249–265, 2008.
[30] T. Kogo, Y. Hamamura, K. Nakatani, T. Toda, A. Kawaguchi, and A. Shoji, “High
Efficiency Diesel Engine with Low Heat Loss Combustion Concept - Toyota ’ s Inline
4-Cylinder,” SAE Int., no. 2016-01–0658, 2016.
[31] Y. Wakisaka, M. Inayoshi, K. Fukui, H. Kosaka, and et al., “Reduction of Heat Loss
and Improvement of Thermal Efficiency by Application of ‘Temperature Swing’
Insulation to Direct-Injection Diesel Engines,” SAE Int. J. Engines, vol. 9, no. 3, pp.
2016-01–0661, 2016.
[32] K. Fukui, Y. Wakisaka, K. Nishikawa, Y. Hattori, H. Kosaka, and A. Kawaguchi,
“Development of Instantaneous Temperature Measurement Technique for Combustion
Chamber Surface and Verification of Temperature Swing Concept,” SAE Tech. Pap.
2016-01-0675, 2016.
[33] N. Uchida. and H. Osada., “A New Piston Insulation Concept for Heavy-Duty DIesel
Engines to Reduce Heat Loss from the Wall,” SAE Int. J. Engines 2017-24-0161., pp.
10(5):2565-2574, 2017.
[34] S. Li, T. Kamimoto, S. Kobori, and Y. Enomoto, “Heat Transfer from Impinging
Diesel Flames to the Combustion Chamber Wall,” SAE Tech. Pap. 970896, 1997.
[35] J. Dahlstrom, O. Andersson, H. Persson, and M. Tuner, “Effect of Spray-Swirl
Interactions on Heat Losses in a Light Duty Diesel Engine,” ASME 2015 Int. Mech.
Eng. Congr. Expo. IMECE2015, pp. 1–11, 2015.
[36] J. Senda, H. Fujimoto, M. Kobayashi, K. Yamamoto, and Y. Enomoto, “Heat Transfer
Characteristics of a Diesel Spray Impinging on a Wall,” Transl. from J. MESJ, no. 9,
pp. 3–12, 1995.
[37] J. Senda, K. Yamada, H. Fujimoto, and " Miki, H., “The Heat-transfer Characteristics
of a Small Droplet Impinging upon a Hot Surface,” JSME Int. J. Ser. II, vol. 31, no. 1,
1988.
[38] S. Kimura, M. Koike, Y. Matsui, and Y. Enomoto, “Effect of combustion chamber

128
specifications and swirl ratio on transient heat transfer and combustion in a DI diesel
engine,” 3rd Int. Symp. diagnostics Model. Combust. Intern. engines (COMODIA 94),
pp. 131–138, 1994.
[39] K. Arato and T. Takashima, “A Study on Reduction of Heat Loss by Optimizing
Combustion Chamber Shape,” SAE Tech. Pap. 2015-01-0786, 2015.
[40] F. Perini, A. Dempsey, R. Reitz, D. Sahoo, B. Petersen, and P. Miles, “A
Computational Investigation of the Effects of Swirl Ratio and Injection Pressure on
Mixture Preparation and Wall Heat Transfer in a Light-Duty Diesel Engine,” SAE
Tech. Pap. 2013-04-08, p. 17, 2013.
[41] D. Mayer, A. Seelig, T. Kunz, F. Kopple, M. Mansbart, and M. Bargende,
“Experimental Investigation of Flame-Wall-Impingement and Near-Wall Combustion
on the Piston Temperature of a Diesel Engine Using Instantaneous Surface
Temperature Measurements,” SAE Tech. Pap. 2018-01-1782, pp. 1–18, 2018.
[42] H. Osada, N. Uchida, K. Shimada, and Y. Aoyagi, “Reexamination of Multiple Fuel
Injections for Improving the Thermal Efficiency of a Heavy-Duty Diesel Engine,” SAE
Tech. Pap. 2013-01-0909, 2013.
[43] X. Cheng, L. Chen, F. Yan, G. Hong, Y. Yin, and H. Liu, “Investigations of Split
Injection Strategies for the Improvement of Combustion and Soot Emissions
Chraracteristics Baesed on the Two-Color Method in a Heavy-Duty Diesel Engine,”
SAE Tech. Pap. 2013-01-2523., 2013.
[44] T. Kuboyama and H. Kosaka, “A Measurement of Heat loss in Combustion Chamber
of DI Diesel Engines,” Marit. Res. Inst. Technol. Saf., vol. 8, no. 215–221, pp. 89–96,
2008.
[45] Li Kuichun, “Effects of Wall Impingement and Multiple Injection on Mixture
Formation and Combustion Processes of Diesel Spray,” Hiroshima University,
Dissertation, 2014.
[46] K. Li, K. Nishida, Y. Ogata, and B. Shi, “Effect of flat-wall impingement on diesel
spray combustion,” Proc. Inst. Mech. Eng. Part D J. Automob. Eng., vol. 229, no. 5,
pp. 535–549, 2014.
[47] X. Wang, Z. Huang, W. Zhang, O. A. Kuti, and K. Nishida, “Effects of ultra-high
injection pressure and micro-hole nozzle on flame structure and soot formation of
impinging diesel spray,” Appl. Energy, vol. 88, no. 5, pp. 1620–1628, 2011.
[48] J. E. Dec and D. R. Tree, “Diffusion-flame/wall Interactions in a Heavy-Duty DI

129
Diesel Engine,” SAE Tech. Pap. 2001-01-1295, 2001.
[49] J. D. Naber and R. D. Reitz, “Modeling Engine Spray / Wal Impingement,” SAE Tech.
Pap. 880107, 1988.
[50] C. Bai and A. D. Gosman, “Development of Methodology for Spray Impingement
Simulation,” SAE Tech. Pap. 950283, 1995.
[51] J. Senda, M. Kobayashi, S. Iwashita, and H. G. Fujimoto, “Modeling of diesel spray
impinging on flat wall,” SAE Tech. Pap. 941894, 1994.
[52] J. Senda, M. Kobayashi, S. Iwashita, and H. Fujimoto, “Modeling of diesel spray
impinging on flat wall,” Int. J. JSME Ser. B Fluids Therm. Eng., vol. 39, no. 4, pp.
859–866, 1996.
[53] J. Senda, T. Kanda, M. Ai-roub, and P. V Farrell, “Modeling Spray Impingement
Considering Fuel Film Formation on the Wall,” SAE 1997 Trans. - J. Engines, vol.
106, no. 3, pp. 37–51, 1997.
[54] A. L. N. Moreira, A. S. Moita, and M. R. Panão, “Advances and challenges in
explaining fuel spray impingement: How much of single droplet impact research is
useful?,” Prog. Energy Combust. Sci., vol. 36, no. 5, pp. 554–580, 2010.
[55] S. Y. Lee and S. U. Ryu, “Recent progress of spray-wall interaction research,” J. Mech.
Sci. Technol., vol. 20, no. 8, pp. 1101–1117, 2006.
[56] H. Zhao and N. Ladommatos, “Optical diagnostics for soot and tempeature in diesel
engines,” Prog. Energy Combust. Sci., vol. 24, no. 97, pp. 221–255, 1998.
[57] H. Zhao and N. Ladammatos, Engine Combustion Instrumentation and Diagnostics.
Warrendale, Pa. : Society of Automotive Engineers, 2001.
[58] L. M. Pickett, J. Manin, C. L. Genzale, D. L. Siebers, M. P. B. Musculus, and C. A.
Idicheria, “Relationship Between Diesel Fuel Spray Vapor Penetration/Dispersion and
Local Fuel Mixture Fraction,” SAE Int. J. Engines, vol. 4, no. 1, pp. 2011-01–0686,
2011.
[59] J. Palmer, M. Ramesh, V. Kirsch, M. Reddemann, and R. Kneer, “Spray Analysis of C
8 H 18 O Fuel Blends using High-Speed Schlieren Imaging and Mie Scattering,” SAE
Tech. Pap. 2015-24-2478, 2015.
[60] A. Montanaro, M. Migliaccio, L. Allocca, V. Fraioli, and et al., “Schlieren and Mie
Scattering Visualization for Single-Hole Diesel Injector under Vaporizing Conditions
with Numerical Validation,” SAE Tech. Pap. 2014-01-1406, 2014.
[61] J. T. Hodges, T. A. Baritaud, and T. A. Heinze, “Planar Liquid and Gas Fuel and
130
Droplet Size Visualization in a DI Diesel Engine1,” SAE Tech. Pap. 910726, 1991.
[62] T. Hoffmann, P. Hottenbach, H.-J. Koss, C. Pauls, and G. Grünefeld, “Investigation of
Mixture Formation in Diesel Sprays under Quiescent Conditions using Raman, Mie
and LIF Diagnostics,” vol. 2008, no. 724, pp. 776–790, 2008.
[63] G.S. Settles, Schlieren and Shadowgraph Techniques: Visualizing Phenomena in
Transparent Media (Experimental Fluid Mechanic). Springer-Verlag Berlin
Heidelberg, 2001.
[64] G. S. Settles and M. J. Hargather, “A review of recent developments in schlieren and
shadowgraph techniques,” Meas. Sci. Technol., vol. 28, no. 4, 2017.
[65] L. M. Pickett, S. Kook, and T. C. Williams, “Visualization of Diesel Spray Penetration,
Cool-Flame, Ignition, High-Temperature Combustion, and Soot Formation Using
High-Speed Imaging,” SAE Int. J. Engines, vol. 2, no. 1, pp. 2009-01–0658, 2009.
[66] J. Pastor, J. M. Garcia-Oliver, A. Garcia, W. Zhong, C. Micó, and T. Xuan, “An
Experimental Study on Diesel Spray Injection into a Non-Quiescent Chamber,” SAE
Int. J. Fuels Lubr., vol. 10, no. 2, pp. 2017-01–0850, 2017.
[67] J. V. Pastor, R. Payri, J. M. Garcia-Oliver, and F. J. Briceño, “Schlieren Methodology
for the Analysis of Transient Diesel Flame Evolution,” SAE Int. J. Engines, vol. 6, no.
3, pp. 2013-24–0041, 2013.
[68] J. D. Naber and D. L. Siebers, “Effects of Gas Density and Vaporization on Penetration
and Dispersionof Diesel Sprays,” SAE Tech. Pap. 960034, 1996.
[69] L. Pickett, S. Kook, and T. Williams, “Transient Liquid Penetration of Early-Injection
Diesel Sprays,” SAE Int. J. Engines, vol. 2, no. 1, pp. 785–804, 2009.
[70] C. Idicheria and L. Pickett, “Quantitative Mixing Measurements in a Vaporizing Diesel
Spray by Rayleigh Imaging,” SAE Tech. Pap. 2007-01-0647, 2007.
[71] F. Q. Zhao and H. Hiroyasu, “The applications of laser Rayleigh scattering to
combustion diagnostics,” Prog. Energy Combust. Sci., vol. 19, no. 6, pp. 447–485,
1993.
[72] C. Espey, J. E. Dec, T. A. Litzinger, and D. A. Santavicca, “Quantitative 2-D Fuel
Vapor Concentration Imaging in a Firing D . I . Diesel Engine Using Planar Laser-
Induced Rayleigh Scattering,” SAE Tech. Pap. 940682, pp. 1851–1862, 1994.
[73] C. Espey, J. E. Dec, T. A. Litzinger, and D. A. Santavicca, “Planar Laser Rayleigh
Scattering for Quantitative Vapor-Fuel Imaging in a Diesel Jet,” Combust. Flame, no.
109, pp. 65–78, 1997.

131
[74] J. Egermann, A. Gottler, and A. Leipertz, “Application of Spontaneous Raman
Scattering for Studying the Diesel Mixture Formation Process Under Near-Wall
Conditions,” SAE Tech. Pap. 2001-01-3496, no. 724, 2001.
[75] M. Taschek, J. Egermann, S. Schwarz, and A. Leipertz, “Quantitative analysis of the
near-wall mixture formation process in a passenger car direct injection Diesel engine
by using linear Raman spectroscopy,” Appl. Opt., no. 44, pp. 6606–6615, 2005.
[76] M. Golombok and D. B. Pye, “Stimulated Raman scattering in diesel injected fuel
sprays.,” J. Phys. D Appl. Phys., vol. 22, p. 851, 1989.
[77] T. Brands, P. Hottenbach, H. Koss, G. Grünefeld, S. Pischinger, and P. Adomeit,
“Quantitative Fuel-Air-Mixing Measurements in Diesel-Like Sprays Emanating from
Convergent and Divergent Multi-Layer Nozzles,” SAE Int. J. Engines, vol. 5, no. 2, pp.
430–445, 2012.
[78] T. Raffius, C. Schulz, T. Ottenwälder, G. Grünefeld, and et al., “Flame-temperature,
light-attenuation, and CO measurements by spontaneous Raman scattering in non-
sooting diesel-like jets,” Combust. Flame, vol. 176, pp. 104–116, 2017.
[79] T. Heinze and T. Schmidt, “Fuel-Air Ratios in a Spray, Determined between Injection
and Autoignition by Pulsed Spontaneous Raman Spectroscopy,” SAE Tech. Pap.
892102, 1989.
[80] M. Hayashida, T. Yamato, H. Sekino, and Sugahara, K., “Investigation of Performance
and Fuel Distribution of a Direct Injection Gas Engine Using LIF Measurement,” SAE
Tech. Pap. 1999-01-3291, 1999.
[81] J. T. Kashdan, “Tracer LIF Visualisation Studies of Piston-Top Fuel Films in a Wall-
Guided, Low-NOx Diesel Engine,” SAE Tech. Pap. 2008-01-2474, no. 724, 2008.
[82] H. Nakagawa, H. Endo, Y. Deguchi, M. Noda, H. Oikawa, and T. Shimada, “NO
measurement in Diesel spray flame using laser induced fluorescence,” SAE Tech. Pap.
Ser., no. 412, p. 970874, 1997.
[83] S. De Zilwa and R. Steeper, “Predicting NOX Emissions from HCCI Engines Using
LIF Imaging,” SAE Tech. Pap. 2006-01-0025, 2006.
[84] S. De Zilwa and R. Steeper, “Predicting Emissions from HCCI Engines using LIF
Imaging,” SAE Tech. Pap. 2005-01-3747, no. 724, 2005.
[85] G. Bruneaux, “Mixing Process in High Pressure Diesel Jets by Normalized Laser
Induced Exciplex Fluorescence Part II: Wall Impinging Versus Free Jet,” SAE Tech.
Pap. 2005-01-2097, 2005.

132
[86] L.A. Melton, “Spectrally separated fluorescence emissions for diesel fuel droplets and
vapor,” Appl. Opt., no. 22, pp. 2224–2226, 1983.
[87] J. Senda, Y. Tanabe, H. Fujimoto, and Y. Fukami, “Vizualization of Evaporative
Diesel Spray Impinging Upon Wall Surface by Exciplex Fluorescence Method.,” SAE
Tech. Pap. 920578., 1992.
[88] H. Fujimoto, S. Kusano, and " Senda, J., “Distribution of Vapor Concentration in a
Diesel Spray Impinging on a Flat Wall by Means of Exciplex Fluorescence Method -In
Case of High Injection Pressure-,” SAE Tech. Pap. 972916, 1997.
[89] J. Senda, T. Kanda, M. Kobayashi, and H. (1997) Fujimoto, “Quantitative Analysis of
Fuel Vapor Concentration in Diesel Spray by Exciplex Fluorescence Method,” SAE
Tech. Pap. 970796., 1997.
[90] G. Bruneaux, “Mixing Process in High Pressure Diesel Jets by Normalized Laser
Induced Exciplex Fluorescence Part I: Free Jet,” SAE Tech. Pap. 2005-01-2100, 2005.
[91] Y. Zhang, T. Yoshizaki, and Keiya Nishida, “Imaging of droplets and vapor
distributions in a Diesel fuel spray by means of a laser absorption–scattering
technique,” Appl. Opt., no. 39, pp. 6221–6229, 2000.
[92] A. R. Chraplyvy, “Nonintrusive measurements of vapor concentrations inside sprays,”
Appl. Opt., no. 20, p. 2620, 1981.
[93] Y. Zhang, T. Ito, and K. Nishida, “Characterization of Mixture Formation in Split-
Injection Diesel Sprays via Laser Absorption-Scattering (LAS) Technique,” SAE Tech.
Pap. 2001-01-3498, 2001.
[94] Y. Matsumoto, J. Gao, M. Namba, and " Nishida, K., “Mixture Formation and
Combustion Processes of Multi-Hole Nozzle with Micro Orifices for D.I. Diesel
Engines,” SAE Tech. Pap. 2007-01-4049, 2007.
[95] J. Gao, Y. Matsumoto, M. Namba, and K. Nishida, “Group-Hole Nozzle Effects on
Mixture Formation and In-cylinder Combustion Processes in Direct-Injection Diesel
Engines,” SAE Tech. Pap. 2007-01-4050, 2007.
[96] S. Moon, Y. Matsumoto, and Nishida, K., “Entrainment, Evaporation and Mixing
Characteristics of Diesel Sprays around End-of-Injection,” SAE Tech. Pap. 2009-01-
0849, 2009.
[97] K. Yang, S. YASAKI, K. Nishida, and Y. Ogata, “Injection Strategy to Enhance
Mixture Formation and Combustion of Fuel Spray in Diesel Engine,” SAE Tech. Pap.
2018-01-0241, 2018.
133
[98] Y. Wakisaka and A. Azetsu, “Effects of Fuel Injection Rate Shaping on Combustion
and Emission Formation in Intermittent Spray,” SAE Tech. Pap. 2002-01-1159, 2002.
[99] G. R. Bower and D. E. Foster, “A Comparison of the Bosch and Zuech Rate of
Injection Meters,” SAE Tech. Pap. 910724, 1991.
[100] Y. Matsui, T. Kamimoto, Matsuoka, and Shin, “A Study on the Time and Space
Resolved Measurement of Flame Temperature and Soot Concentration in a D. I. Diesel
Engine by the Two-Color Method,” SAE Tech. Pap. 790491, 1979.
[101] Y. Matsui, T. Kamimoto, and S. Matsuoka, “A Study on the Application of the Two–
Color Method to the Measurement of Flame Temperature and Soot Concentration in
Diesel Engines,” SAE Tech. Pap. 800970, pp. 1808–1822, 1980.
[102] S. K. Ahn, Y. Matsui, T. Kamimoto, and S. Matsuoka, “Measurement of flame
temperature distribution in a D.I. diesel engine by means of image analysis of nega-
color photographs,” SAE Trans., vol. 90, no. 1, pp. 736–745, 1981.
[103] H. C. Hottel and F. P. Broughton, “Determination of True Temperature and Total
Radiation from Luminous Gas Flames: Use of Special Two-Color Optical Pyrometer,”
Ind. Eng. Chem. - Anal. Ed., vol. 4, no. 2, pp. 166–175, 1932.
[104] K. Li, M. Ido, Y. Ogata, K. Nishida, B. Shi, and D. Shimo, “Effect of Spray/Wall
Interaction on Diesel Combustion and Soot Formation in Two-Dimensional Piston
Cavity,” SAE Int. J. Engines 6(4)2061-2071, p. 11, 2013.
[105] K. Svensson, A. Mackrory, M. Richards, And, and D. Tree, “Calibration of an RGB,
CCD Camera and Interpretation of its Two-Color Images for KL and Temperature,”
SAE Tech. Pap. 2005-01-0648, 2005.
[106] R. Mahmud, T. Kurisu, K. Nishida, Y. Ogata, J. Kanzaki, and T. Tadokoro,
“Experimental study on flat-wall impinging spray flame and its heat flux on wall under
diesel engine–like condition: First report—effect of impingement distance,” Proc. Inst.
Mech. Eng. Part D J. Automob. Eng., pp. 1–4, 2018.
[107] D. P. D.- Theodore L. Bergman, Adrienne S. Lavine, Frank P. Incropera,
Fundamentals of Heat and Mass Transfer, Eighth. John Wiley & Sons, Inc., 2017.
[108] Eric Gingrich, J. Ghandhi, and R. Reitz, “Experimental investigation of piston heat
transfer in a light duty engine under conventional diesel, homogeneous charge
compression ignition, and reactivity controlled compression ignition combustion
regimes,” SAE Tech. Pap. 2014-01-1182, 2014.
[109] G. Woschni and K. Huber, “The Influence of Soot Deposits on Combustion Chamber
134
Walls on Heat Losses in Diesel Engines,” SAE Tech. Pap. 910297, 1991.
[110] Z. Wang, S. Wu, Y. Huang, Y. Chen, and et al., “Evaporation and ignition
characteristics of water emulsified diesel under conventional and low temperature
combustion conditions,” Energies, vol. 10, no. 8, 2017.
[111] S. Li, T. Kamimoto, and S. Kobori, “Heat Transfer From Impinging Diesel Flames to
the Combustion Chamber Wall,” SAE Int. J. Fuels Lubr. 5(1)1-6, 19972, no. 412, 2015.
[112] H. Osada, N. Uchida, and Y. Zama, “An Analysis on Heat Loss of a Heavy-Duty
Diesel Engine by Wall-Impinged Spray Flame Observation,” SAE Tech. Pap. 2015-01-
1832., 2015.
[113] T. Su, C. Chang, R. Reitz, P. Farrell, A. D. Pierpont, and T. C. Tow, “Effects of
Injection Pressure and Nozzle Geometry on Spray SMD and D.I. Emissions,” SAE
Tech. Pap. 952360, 1995.
[114] M. Zheng, G. T. Reader, and J. G. Hawley, “Diesel engine exhaust gas recirculation -
A review on advanced and novel concepts,” Energy Convers. Manag., vol. 45, no. 6,
pp. 883–900, 2004.
[115] M. Z. Akop, Y. Zama, T. Furuhata, and M. Arai, “Characteristics of Adhesion Diesel
Fuel on an Impingement Disk Wall. Part 3: Ambient Pressure Effect,” At. sprays, vol.
24(7), pp. 625–650, 2014.
[116] R. Gramlich, P. Leich, J. Kaleta, A. Miller, and et al., “Air Entrainment and
Momentum Distribution in the Near Field of Diesel Sprays from Group Hole Nozzles,”
ILASS Eur. 2016, 27th Annu. Conf. Liq. At. Spray Syst., pp. 4–7, 2016.
[117] C. Baumgarten, Mixture Formation in Internal Combustion Engine. Springer, 2006.
[118] T. Kuboyama, H. Kosaka, T. Aizawa, and Y. Matsui, “A Study on Heat Loss in DI
Diesel Engines by Using a Rapid Compression and Expansion Machine (1st Report,
The Effects of Oxygen Volume Fraction and Density of Ambient Gas on Heat Loss),”
Japan Soc. Mech. Eng., vol. 72, no. 721, pp. 2315–2322, 2006.
[119] S. Fujikawa, M. Nakata, S. Maeda, N. Arai, and et al., “Proposal of Wall Heat Transfer
Coefficient Applicable to Spray-wall Interaction Process in Diesel Engines,” Trans.
Soc. Automot. Eng. Japan, pp. 1120–1125, 2018.

135
ACKNOWLEDGEMENTS
This dissertation was accomplished at the Fluid Engineering Laboratory, Faculty of
Engineering, University of Hiroshima. I would like to express my gratitude to all those who
helped me during the working of this dissertation.
My deepest gratitude goes first and foremost to Professor. Keiya Nishida, my academic
supervisors, for his constant encouragement, earnest guidance, constructive criticism and
invaluable discussions throughout study in Fluid Engineering Laboratory.
Gratefulness is also given to Prof. Toru Kurisu (Mazda Co) and Prof. Yoichi Ogata, for
their extremely valuable comments and helpful suggestions of this research work. Also, my
sincere appreciation goes to the dissertation committee members: Professors Takuma Endo and
Professor Yukihiko Matsumura.
I would like to thanks are also given to Mazda Co: Mr. Jun Kanzaki, Mr. Tadashi
Tadokoro, and Mr. Makoto Namba, for their support with measurement in this study; M and K
Group: Mr. Seong Bum Kim, Mr. Akgol Onur, Mr. Wang and Mr. Van, for their assistance in
the experiment; FEST Lab: Dr. KIM Jae Heun, Mr. Saifiullah and FEST Lab members, for
useful discussion and advise.
I would like to appreciate the Ministry of Education, Japan (Monbukagakusho), for
sponsoring my studies by providing scholarship and tuitions fees. I would like to extend my
thank is also given to Adhi Tama Institute of Technology, for financial and moral support during
study in University of Hiroshima.
Last but not least, my deepest gratitude goes to my parent and family, especially to my
wife, Iis Rohmawati, for her consistent love, encouragement, and support.

136
APPENDIX
Data Acquisition Flowchart
Figure 1. Flowchart of data acquisition
Acquire sensor signals (surface & inner position) into the data-logger (GL900) and
convert analog signal to digital one
Transfer the temporal data of the temperature in csv format to PC
Read the csv file data into the post processing tool (Excel) and remove noise with Fast Fourier Transform
(FFT) low pass filtering
Calculate temporal heat flux from the noise removed temperature signalsby using non-steady heat transfer
simulation program
Average several heat fluxes measure at the same condition
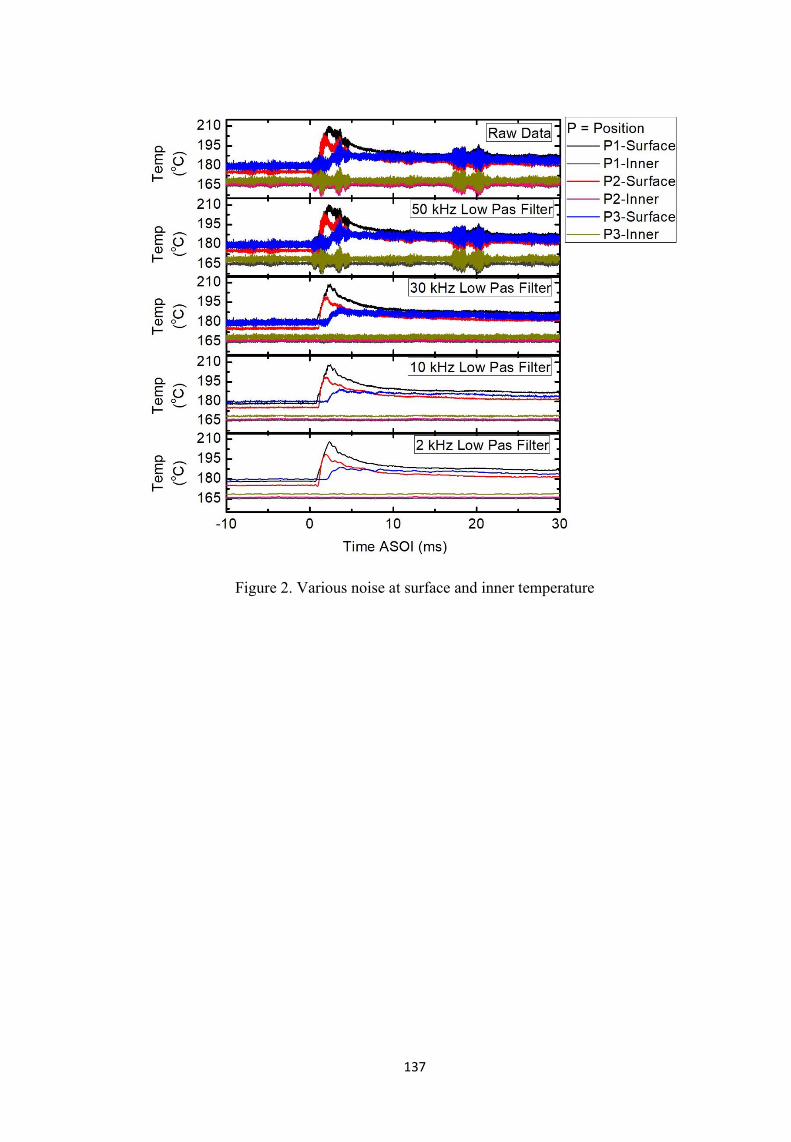
137
Figure 2. Various noise at surface and inner temperature

138
Figure 3. Temperature distribution at Position1, Position2 and Position3

139
Figure 4. Temperature distribution at Position1, Position2 and Position3

140
Figure 1 and 2 shows flowchart of data acquisition and various noise. Since the
electromotive force of the thermocouple is very small, noise is easy to get on the signal, and
various noises such as 60 kHz power supply noise and high frequency propagation noise are
carried. Therefore, we wrapped the compensating lead wire with aluminum foil, shielded the
ground from the GL900, used the battery to drive the GL900 at the time of measurement, and
took noise prevention measures. Even so, noise appeared on the signal waveform obtained as
shown in Figure 2. Therefore, noise was removed by digital data such as filtering the digital
output result from GL 900.
Figure 3. shows the temperature distribution of wall surface to inside the wall at
Position1, Position2, and Position3. These results are obtained by solving the equation 2.14.
Then, by applying the equation 2.16, the unsteady local heat flux can be observed at Figure 4.
Validation Between Experiment and Simulation
Figure 5. Temperature distribution at Position1, Position2 and Position3

141
Figure 6. Temperature distribution at Position1, Position2 and Position3
In order to obtained gas temperature at non-combustion condition, the Converge CFD
software was performed in this condition. Then to validate the results, comparison with
experiment is made as shown in Figure 5. The simulation results may not be accurate with that
of experiment, however, the diesel fuel spray characteristics can represent the experimental
phenomenon. After validating, we are able to use the data (Figure 6) for calculation heat transfer
coefficient.

142
Comparison Heat transfer correlation with other researchers.
(a). Combined effect of impingement distance/injection pressure
(b). Combined effect of oxygen concentration/injection pressure
Figure 7. Comparison heat transfer correlation

143
Paper Lists
1. Characteristics of flat-wall impinging spray flame and its heat transfer under small diesel
engine-like condition, 2017 Small Engine Technologies Conference & Exhibition, SAE
Paper No. 2017-32-0032/JSAE Paper No. 20179032 (2017), pp. 1-7.
2. Experimental study on flat-wall impinging spray flame and its heat flux on wall under diesel
engine–like condition: First report—effect of impingement distance, Journal of Automobile
Engineering, Institution of Mechanical Engineers, Part D, DOI:
10.1177/0954407018778153 (2018). (in press).
3. Characteristics of flat-wall impinging spray flame and its heat transfer under small diesel
engine-like condition. 3 th report: effect of oxygen concentration, ICATECH, IOP
Conference Series: Materials Science and Engineering. 462. 012046. DOI:10.1088/1757-
899X/462/1/012046. (2019).
4. Effects of injection pressure and impingement distance on flat-wall impinging spray flame
and its heat flux under diesel engine-like condition, Advances in Mechanical Engineering
(AIME) Journal, (2019). DOI.org/10.1177/1687814019862910
5. Characteristics of flat-wall impinging spray flame and its heat transfer under diesel engine-
like condition: effects of injection pressure, nozzle hole diameter and impingement distance,
JSAE 20199255. JSAE/SAE 2019 International Powertrains, Fuels and Lubricants
Conference.