Embed Size (px)
Citation preview

OECD Centre for
Opportunity and Equality Evidence-based, policy-oriented research on inequalities
Meeting of Providers of OECD Income Distribution Data -
February 2016
4. The measurement of imputed rents and social transfers
in kind in the OECD: results from a questionnaire
Sarka Sustova
OECD, Statistics Directorate & Czech Statistical Office
OECD/COPE
http://oe.cd/cope
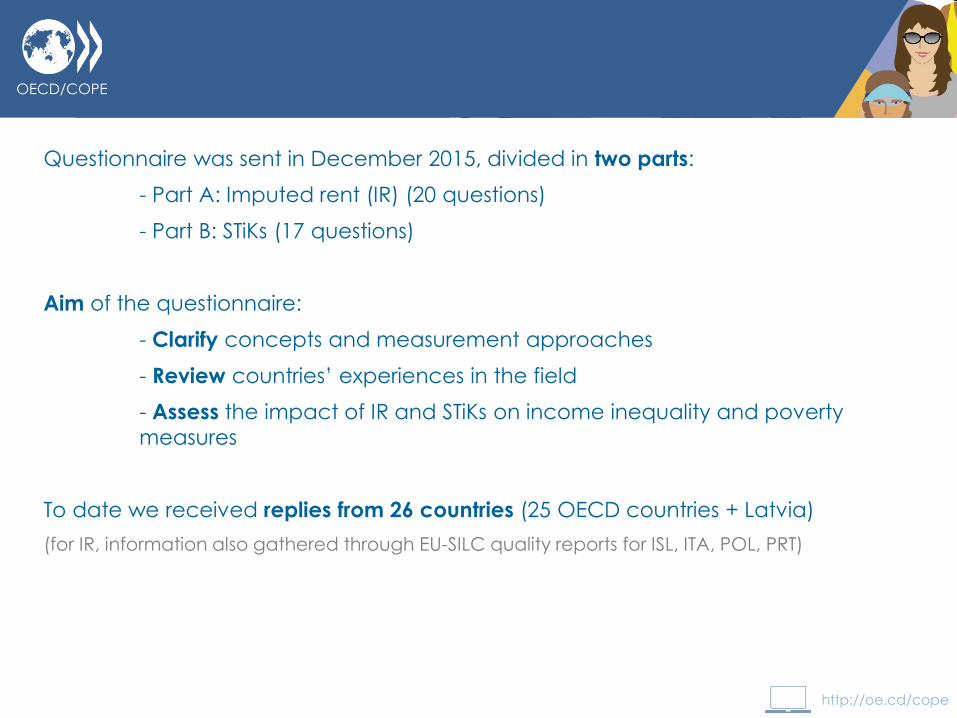
Questionnaire was sent in December 2015, divided in two parts:
- Part A: Imputed rent (IR) (20 questions)
- Part B: STiKs (17 questions)
Aim of the questionnaire:
- Clarify concepts and measurement approaches
- Review countries’ experiences in the field
- Assess the impact of IR and STiKs on income inequality and poverty
measures
To date we received replies from 26 countries (25 OECD countries + Latvia)
(for IR, information also gathered through EU-SILC quality reports for ISL, ITA, POL, PRT)
OECD/COPE
http://oe.cd/cope
A. Imputed rent
OECD/COPE
http://oe.cd/cope
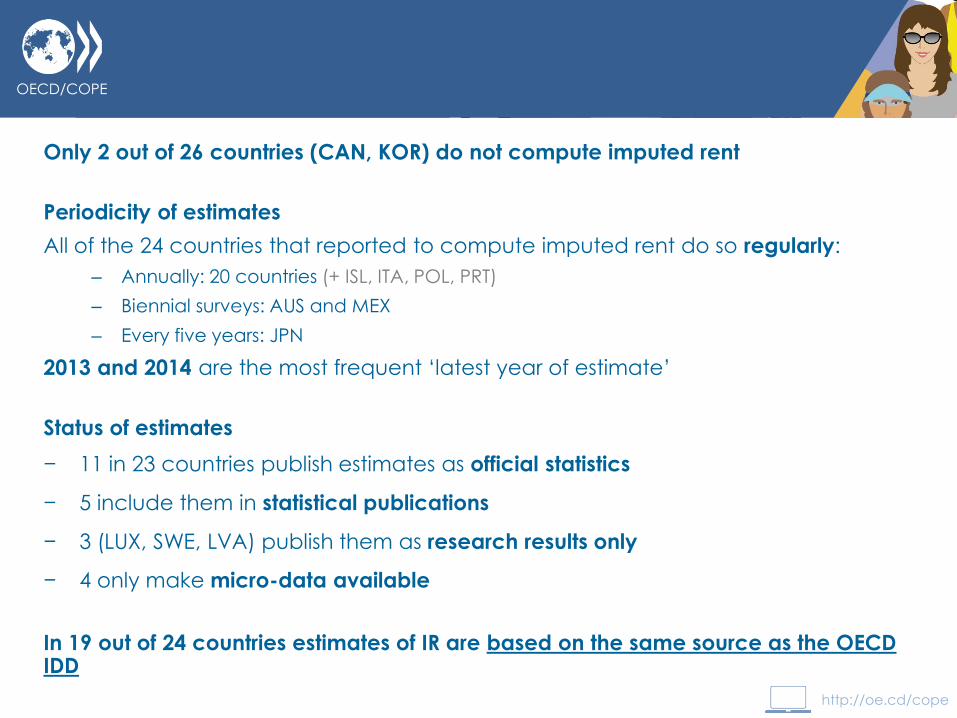
Only 2 out of 26 countries (CAN, KOR) do not compute imputed rent
Periodicity of estimates
All of the 24 countries that reported to compute imputed rent do so regularly:
– Annually: 20 countries (+ ISL, ITA, POL, PRT)
– Biennial surveys: AUS and MEX
– Every five years: JPN
2013 and 2014 are the most frequent ‘latest year of estimate’
Status of estimates
− 11 in 23 countries publish estimates as official statistics
− 5 include them in statistical publications
− 3 (LUX, SWE, LVA) publish them as research results only
− 4 only make micro-data available
In 19 out of 24 countries estimates of IR are based on the same source as the OECD IDD
OECD/COPE
http://oe.cd/cope
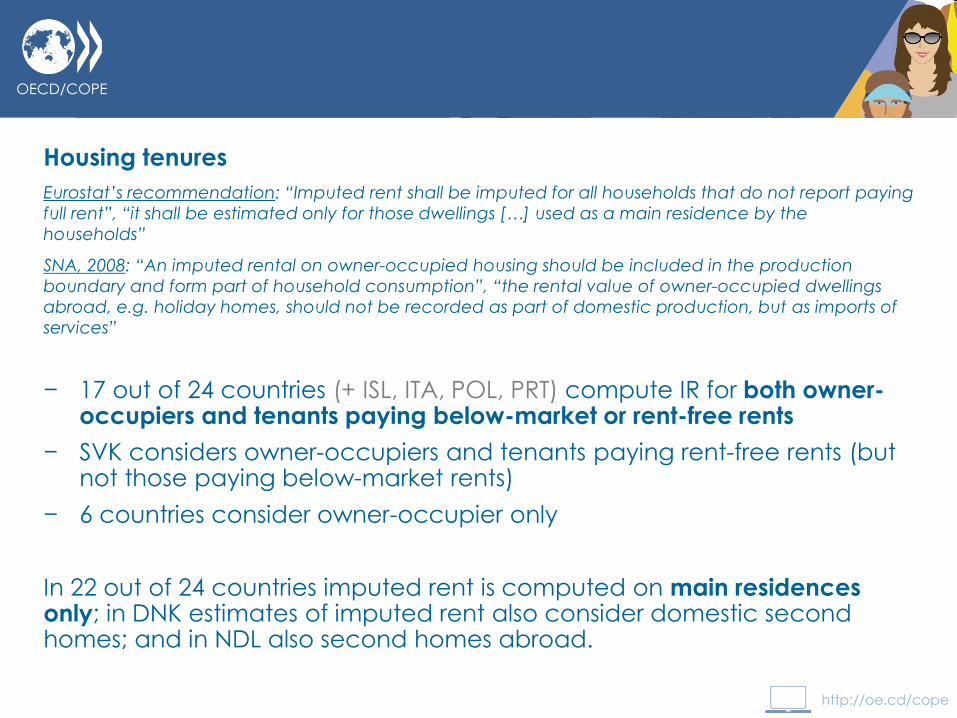
Housing tenures
Eurostat’s recommendation: “Imputed rent shall be imputed for all households that do not report paying
full rent”, “it shall be estimated only for those dwellings […] used as a main residence by the
households”
SNA, 2008: “An imputed rental on owner-occupied housing should be included in the production
boundary and form part of household consumption”, “the rental value of owner-occupied dwellings
abroad, e.g. holiday homes, should not be recorded as part of domestic production, but as imports of
services”
− 17 out of 24 countries (+ ISL, ITA, POL, PRT) compute IR for both owner-occupiers and tenants paying below-market or rent-free rents
− SVK considers owner-occupiers and tenants paying rent-free rents (but not those paying below-market rents)
− 6 countries consider owner-occupier only
In 22 out of 24 countries imputed rent is computed on main residences only; in DNK estimates of imputed rent also consider domestic second homes; and in NDL also second homes abroad.
OECD/COPE
http://oe.cd/cope
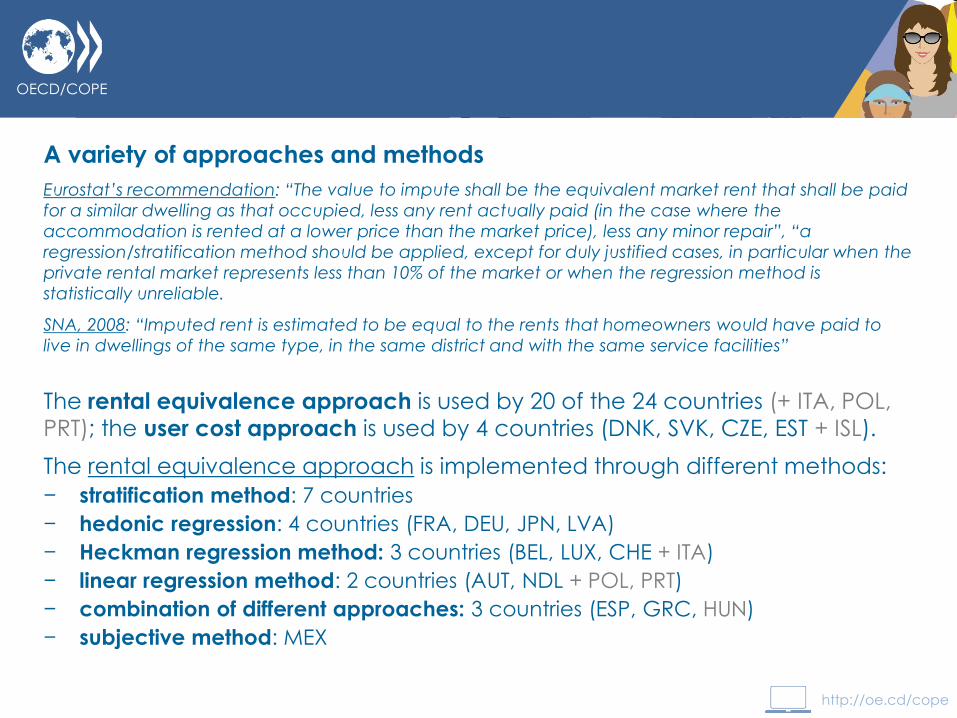
A variety of approaches and methods
Eurostat’s recommendation: “The value to impute shall be the equivalent market rent that shall be paid
for a similar dwelling as that occupied, less any rent actually paid (in the case where the
accommodation is rented at a lower price than the market price), less any minor repair”, “a
regression/stratification method should be applied, except for duly justified cases, in particular when the
private rental market represents less than 10% of the market or when the regression method is
statistically unreliable.
SNA, 2008: “Imputed rent is estimated to be equal to the rents that homeowners would have paid to
live in dwellings of the same type, in the same district and with the same service facilities”
The rental equivalence approach is used by 20 of the 24 countries (+ ITA, POL, PRT); the user cost approach is used by 4 countries (DNK, SVK, CZE, EST + ISL).
The rental equivalence approach is implemented through different methods:
− stratification method: 7 countries
− hedonic regression: 4 countries (FRA, DEU, JPN, LVA)
− Heckman regression method: 3 countries (BEL, LUX, CHE + ITA)
− linear regression method: 2 countries (AUT, NDL + POL, PRT)
− combination of different approaches: 3 countries (ESP, GRC, HUN)
− subjective method: MEX
OECD/COPE
http://oe.cd/cope
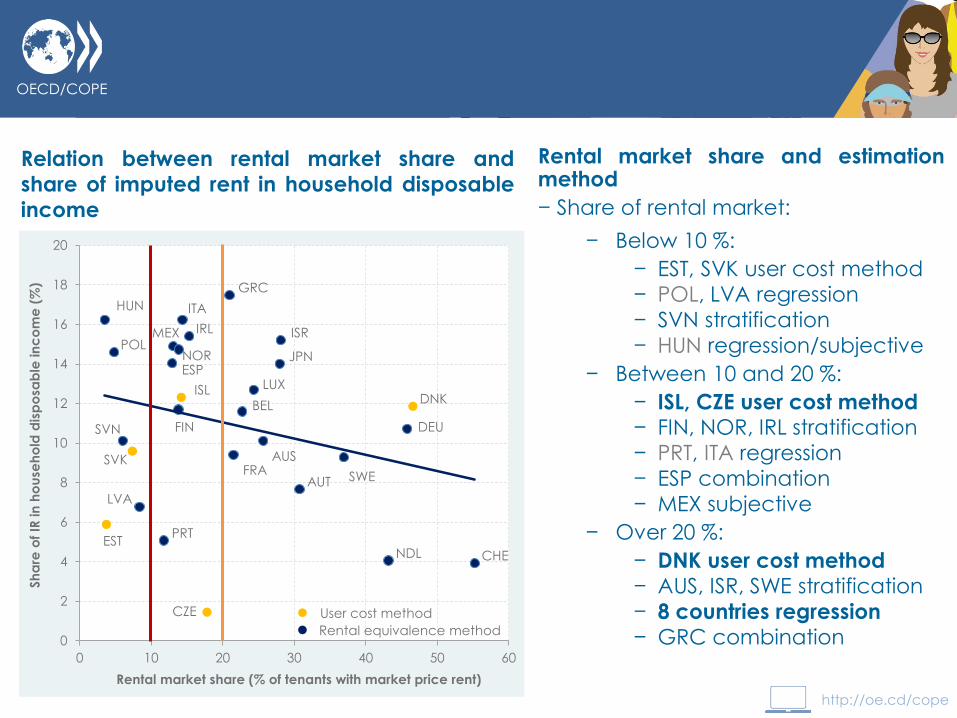
Relation between rental market share and
share of imputed rent in household disposable
income
HUN
EST
POL
SVN
SVK
LVA
PRT
ESP
MEX
FIN
NOR
ISL
ITA
IRL
CZE
GRC
FRA
BEL
LUX
AUS
JPN
ISR
AUT SWE
NDL
DEU
DNK
CHE
0
2
4
6
8
10
12
14
16
18
20
0 10 20 30 40 50 60
Sh
are
of
IR in
ho
use
ho
ld d
isp
osa
ble
in
co
me
(%
)
Rental market share (% of tenants with market price rent)
Rental equivalence method
User cost method
Rental market share and estimation method
− Share of rental market:
− Below 10 %:
− EST, SVK user cost method
− POL, LVA regression
− SVN stratification
− HUN regression/subjective
− Between 10 and 20 %:
− ISL, CZE user cost method − FIN, NOR, IRL stratification
− PRT, ITA regression
− ESP combination
− MEX subjective
− Over 20 %:
− DNK user cost method
− AUS, ISR, SWE stratification
− 8 countries regression
− GRC combination
OECD/COPE
http://oe.cd/cope
Plans for the future
18 countries do not plan to change approach/method in the near future because:
- Current approach gives satisfactory results
- They are using the best possible method (AUS, FIN)
- To avoid break in time series (SWE)
4 countries are considering future changes (GRC, JPN, LTV, SVK)
NOR plans to include imputed rent in the census-like household income statistics (which provides data for the OECD database): user cost approach deemed to be
more appropriate compared to rental equivalence approach
CAN and KOR, which are not currently computing imputed rent, do not plan to do
so in the future either
OECD/COPE
http://oe.cd/cope
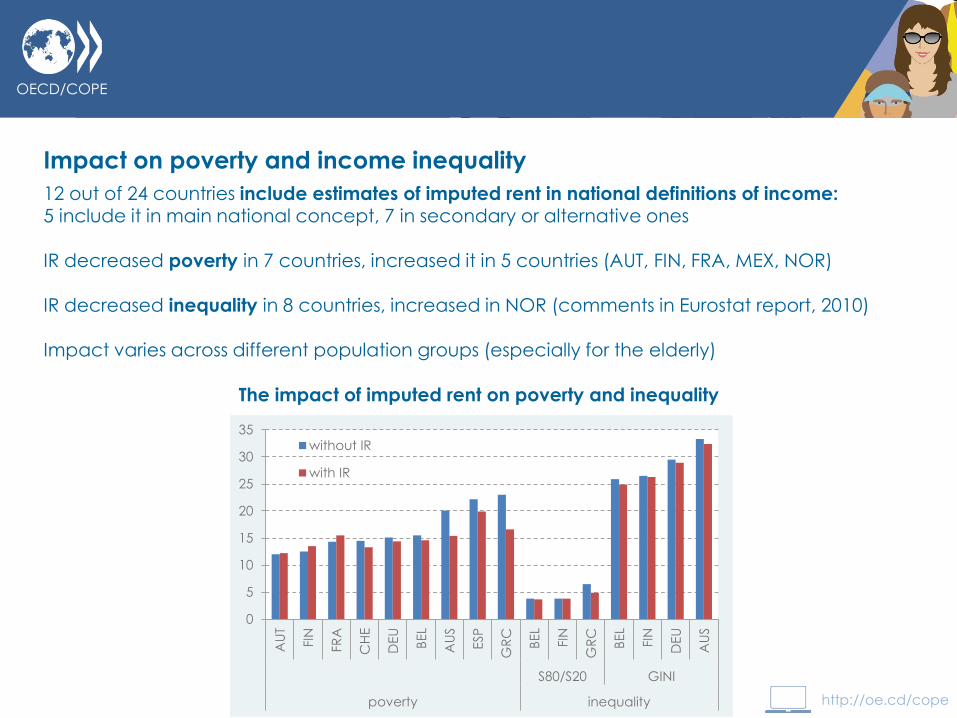
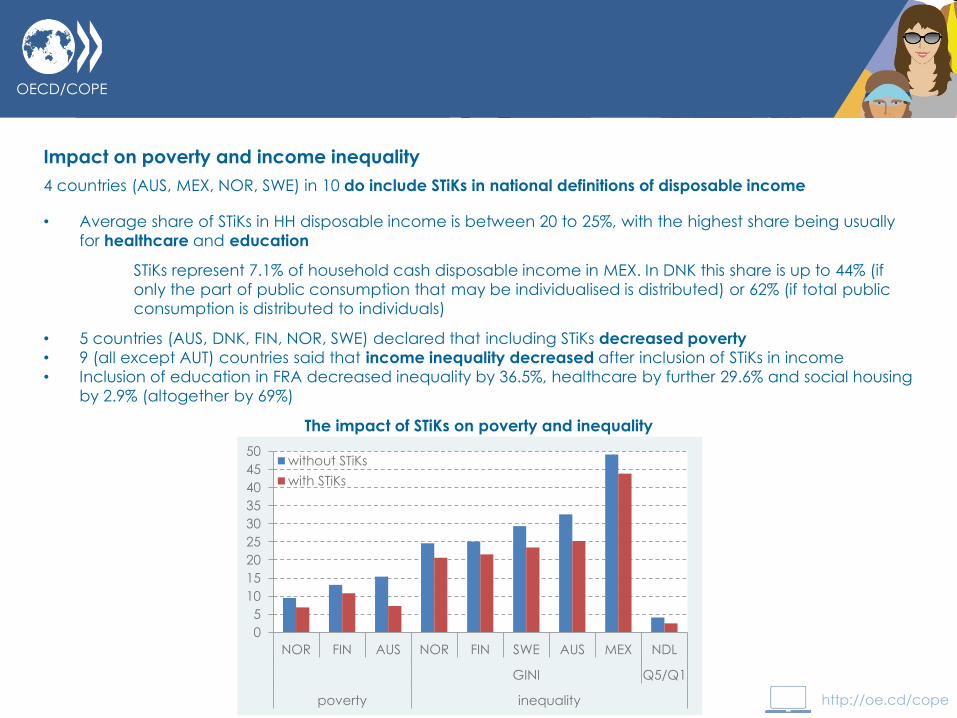
Impact on poverty and income inequality
12 out of 24 countries include estimates of imputed rent in national definitions of income: 5 include it in main national concept, 7 in secondary or alternative ones
IR decreased poverty in 7 countries, increased it in 5 countries (AUT, FIN, FRA, MEX, NOR) IR decreased inequality in 8 countries, increased in NOR (comments in Eurostat report, 2010) Impact varies across different population groups (especially for the elderly)
The impact of imputed rent on poverty and inequality
0
5
10
15
20
25
30
35
AU
T
FIN
FR
A
CH
E
DEU
BEL
AU
S
ESP
GR
C
BEL
FIN
GR
C
BEL
FIN
DEU
AU
S
S80/S20 GINI
poverty inequality
without IR
with IR
OECD/COPE
http://oe.cd/cope
B. Social transfers in kind (STiKs)
OECD/COPE
http://oe.cd/cope
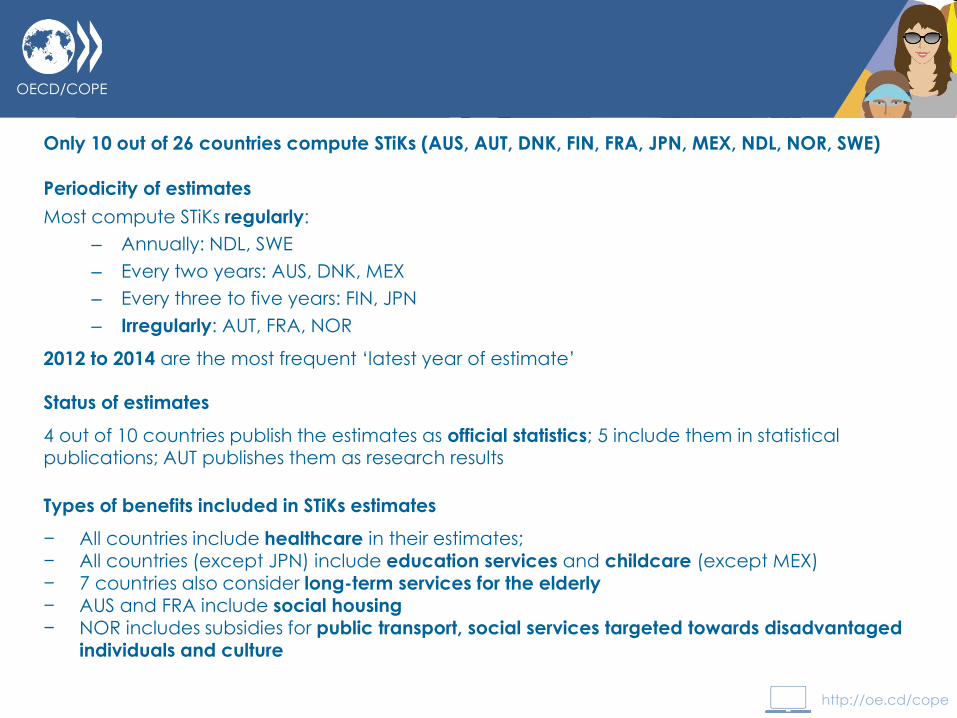
Only 10 out of 26 countries compute STiKs (AUS, AUT, DNK, FIN, FRA, JPN, MEX, NDL, NOR, SWE)
Periodicity of estimates
Most compute STiKs regularly:
– Annually: NDL, SWE
– Every two years: AUS, DNK, MEX
– Every three to five years: FIN, JPN
– Irregularly: AUT, FRA, NOR
2012 to 2014 are the most frequent ‘latest year of estimate’
Status of estimates
4 out of 10 countries publish the estimates as official statistics; 5 include them in statistical publications; AUT publishes them as research results
Types of benefits included in STiKs estimates
− All countries include healthcare in their estimates; − All countries (except JPN) include education services and childcare (except MEX) − 7 countries also consider long-term services for the elderly − AUS and FRA include social housing − NOR includes subsidies for public transport, social services targeted towards disadvantaged
individuals and culture
OECD/COPE
http://oe.cd/cope
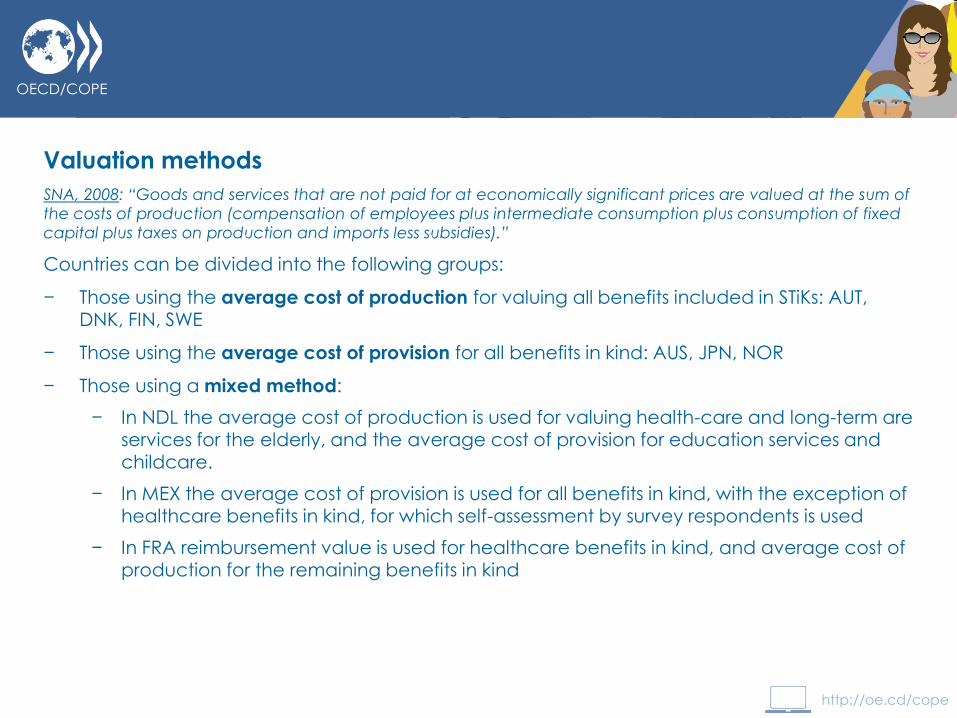
Valuation methods
SNA, 2008: “Goods and services that are not paid for at economically significant prices are valued at the sum of
the costs of production (compensation of employees plus intermediate consumption plus consumption of fixed
capital plus taxes on production and imports less subsidies).”
Countries can be divided into the following groups:
− Those using the average cost of production for valuing all benefits included in STiKs: AUT, DNK, FIN, SWE
− Those using the average cost of provision for all benefits in kind: AUS, JPN, NOR
− Those using a mixed method:
− In NDL the average cost of production is used for valuing health-care and long-term are services for the elderly, and the average cost of provision for education services and childcare.
− In MEX the average cost of provision is used for all benefits in kind, with the exception of healthcare benefits in kind, for which self-assessment by survey respondents is used
− In FRA reimbursement value is used for healthcare benefits in kind, and average cost of production for the remaining benefits in kind
OECD/COPE
http://oe.cd/cope
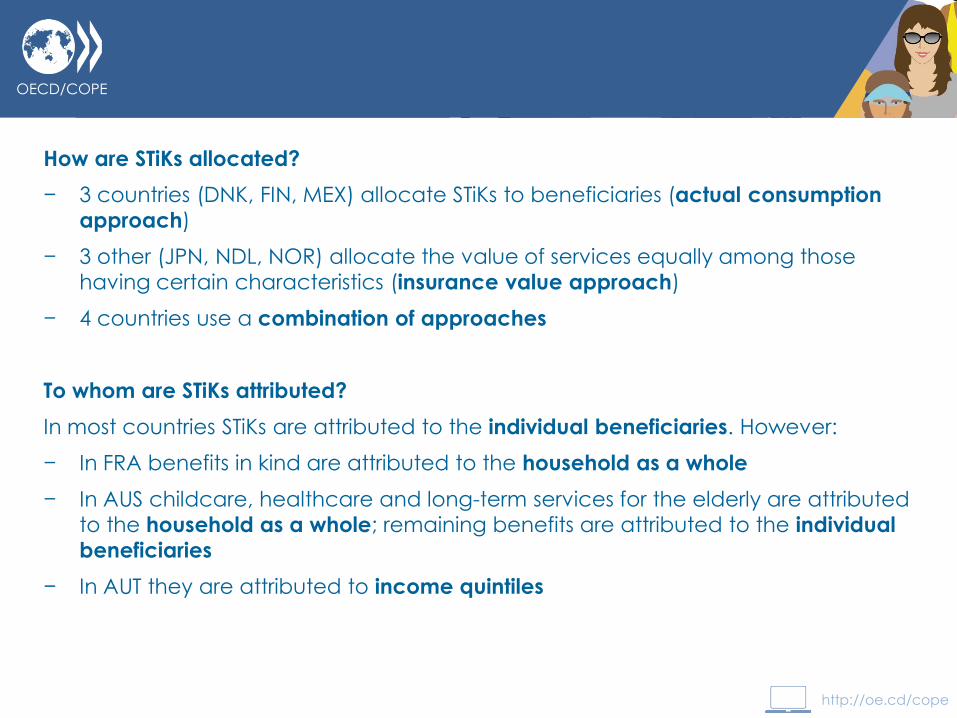
How are STiKs allocated?
− 3 countries (DNK, FIN, MEX) allocate STiKs to beneficiaries (actual consumption
approach)
− 3 other (JPN, NDL, NOR) allocate the value of services equally among those
having certain characteristics (insurance value approach)
− 4 countries use a combination of approaches
To whom are STiKs attributed?
In most countries STiKs are attributed to the individual beneficiaries. However:
− In FRA benefits in kind are attributed to the household as a whole
− In AUS childcare, healthcare and long-term services for the elderly are attributed
to the household as a whole; remaining benefits are attributed to the individual
beneficiaries
− In AUT they are attributed to income quintiles
OECD/COPE
http://oe.cd/cope
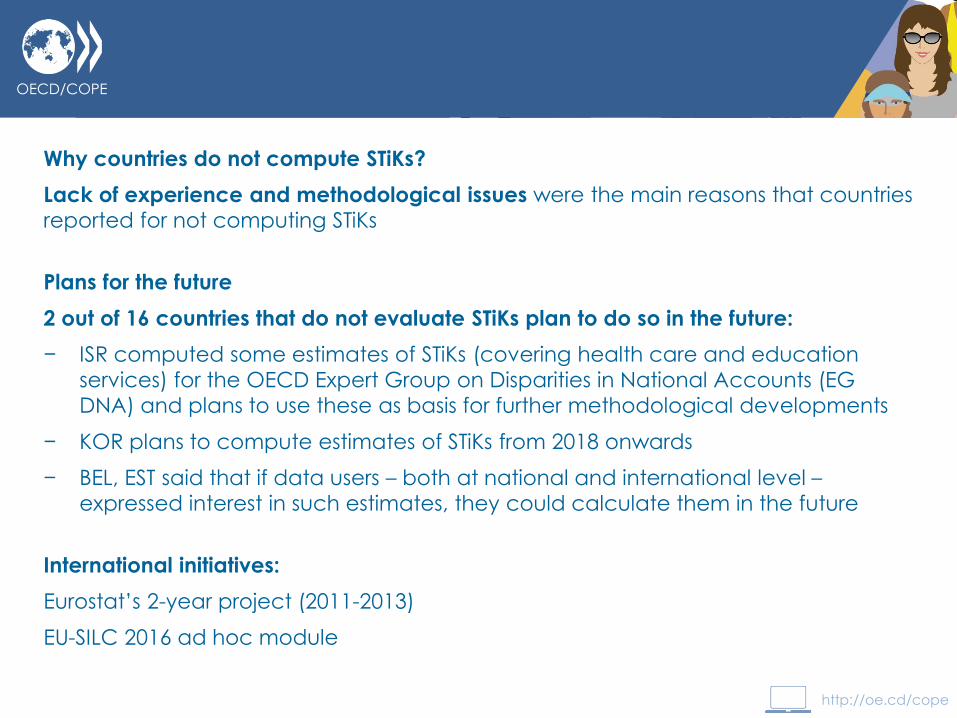
Why countries do not compute STiKs?
Lack of experience and methodological issues were the main reasons that countries
reported for not computing STiKs
Plans for the future
2 out of 16 countries that do not evaluate STiKs plan to do so in the future:
− ISR computed some estimates of STiKs (covering health care and education
services) for the OECD Expert Group on Disparities in National Accounts (EG
DNA) and plans to use these as basis for further methodological developments
− KOR plans to compute estimates of STiKs from 2018 onwards
− BEL, EST said that if data users – both at national and international level –
expressed interest in such estimates, they could calculate them in the future
International initiatives:
Eurostat’s 2-year project (2011-2013)
EU-SILC 2016 ad hoc module
OECD/COPE
http://oe.cd/cope
Impact on poverty and income inequality
4 countries (AUS, MEX, NOR, SWE) in 10 do include STiKs in national definitions of disposable income
• Average share of STiKs in HH disposable income is between 20 to 25%, with the highest share being usually
for healthcare and education
STiKs represent 7.1% of household cash disposable income in MEX. In DNK this share is up to 44% (if
only the part of public consumption that may be individualised is distributed) or 62% (if total public
consumption is distributed to individuals)
• 5 countries (AUS, DNK, FIN, NOR, SWE) declared that including STiKs decreased poverty
• 9 (all except AUT) countries said that income inequality decreased after inclusion of STiKs in income
• Inclusion of education in FRA decreased inequality by 36.5%, healthcare by further 29.6% and social housing
by 2.9% (altogether by 69%)
The impact of STiKs on poverty and inequality
0
5
10
15
20
25
30
35
40
45
50
NOR FIN AUS NOR FIN SWE AUS MEX NDL
GINI Q5/Q1
poverty inequality
without STiKs
with STiKs
OECD/COPE
http://oe.cd/cope
Conclusion & discussion
− While imputed rent is computed by almost all countries, the inclusion of
STiKs estimates in household income is less common
− Impact of imputed rent on inequality and poverty is significant and
even larger for STiKs
− More detailed analysis of country practices will be soon available in an
OECD Statistics Working Paper
? Effect of changes on market with rents – rising rents, decreasing
mortgage interests etc.
? International guidelines for STiKs could be helpful
? Dynamic or static poverty threshold for comparisons
? Experience with equivalence scales when computing STiKs
OECD/COPE
http://oe.cd/cope
Staying in touch with the OECD Centre for
Opportunity and Equality
Email me [email protected]
@OECD_social Follow us on Twitter
http://oe.cd/cope http://oe.cd/idd Visit our websites