Embed Size (px)
Citation preview
OECD Centre for
Opportunity and Equality
Evidence-based, policy-oriented research on inequalities
Inequality in the OECD Area: Trends, causes, consequences and remedies
Workshop Inequality By The Numbers, June 6 – 11, 2016
Michael Förster
OECD, Social Policy Division
OECD/COPE
http://oe.cd/cope
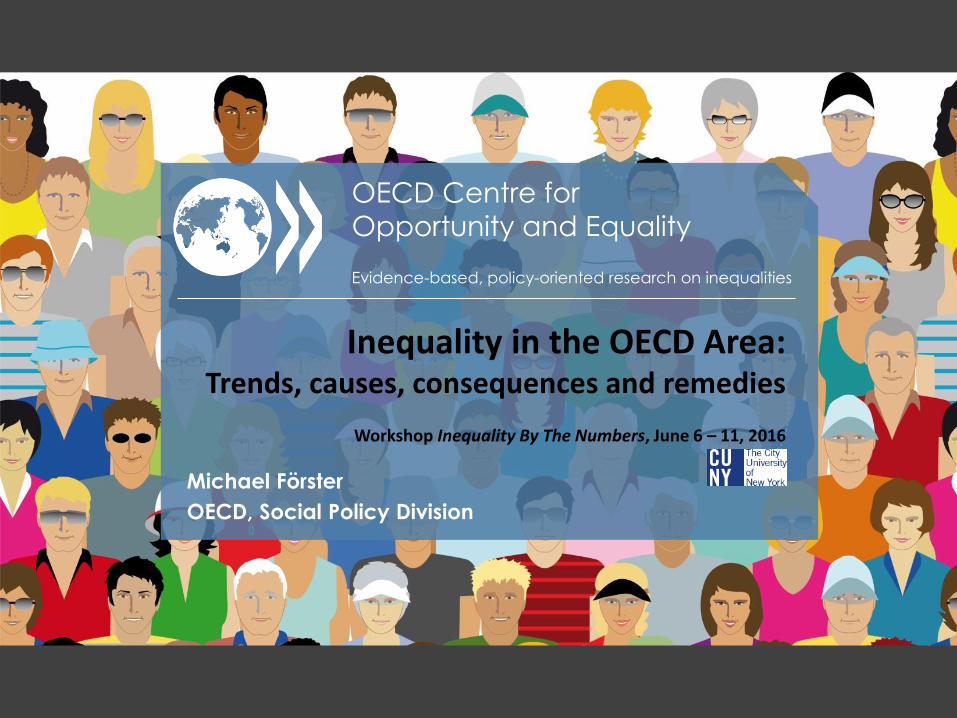
Inequality – in the heart of policy discourse and debate
2008 2011 2015
• “Rising income inequality is the defining challenge of our times” (President Obama, US)
• “Inequality can no longer be treated as an afterthought. We need to focus the debate on how the benefits of growth are distributed” (A. Gurría, OECD)
• “Reducing excessive inequality is not just morally and politically correct, but it is good economics” (C. Lagarde, IMF)
OECD/COPE
http://oe.cd/cope
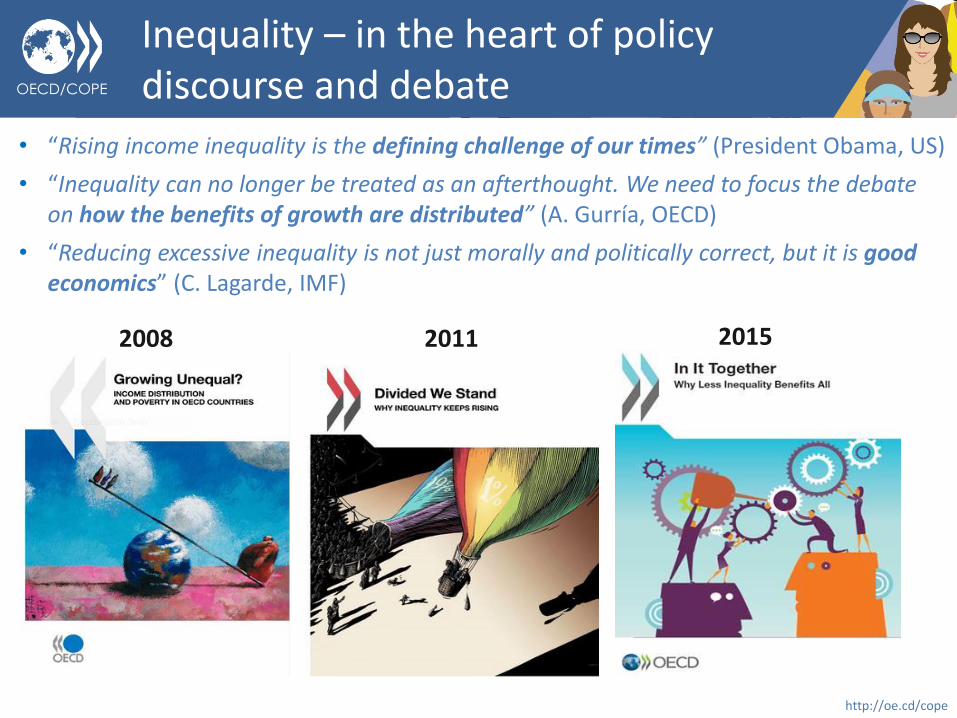
1. TRENDS: How do inequality levels compare and how have inequalities developed over the longer run? Was the crisis a game changer?
2. CAUSES: What are the major underlying forces behind increases in inequality?
3. CONSEQUENCES: Why do we care? What are the links between inequalities, opportunities and economic growth?
4. REMEDIES: Which policies are most promising to tackle high and increasing inequality?
Income inequality in OECD countries: outline of the discussion
OECD/COPE
http://oe.cd/cope
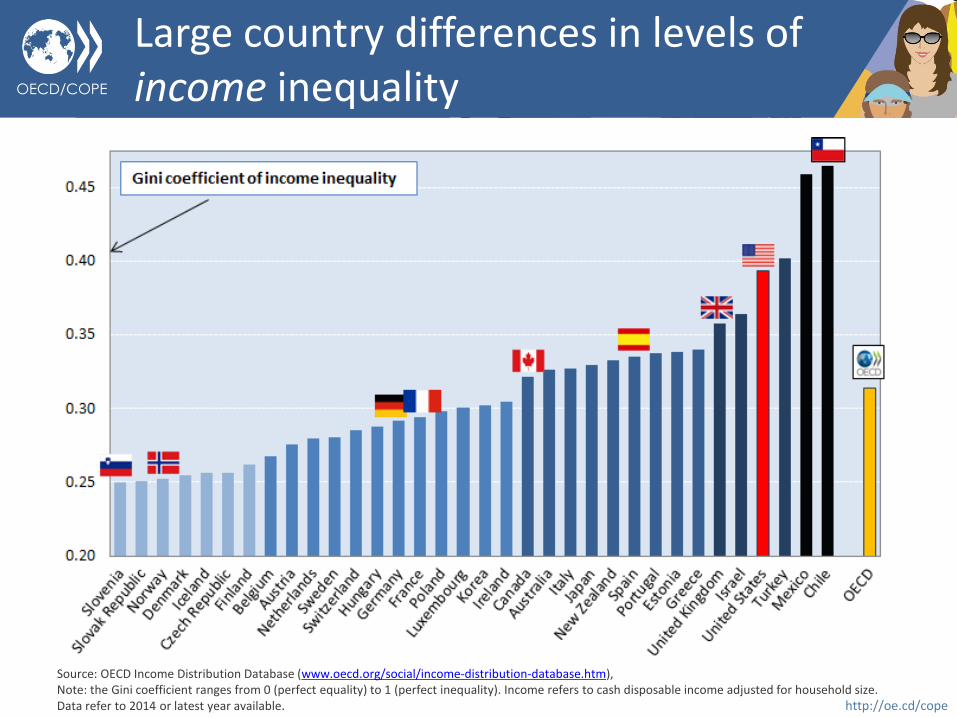
Large country differences in levels of income inequality
Source: OECD Income Distribution Database (www.oecd.org/social/income-distribution-database.htm), Note: the Gini coefficient ranges from 0 (perfect equality) to 1 (perfect inequality). Income refers to cash disposable income adjusted for household size. Data refer to 2014 or latest year available.
OECD/COPE
http://oe.cd/cope
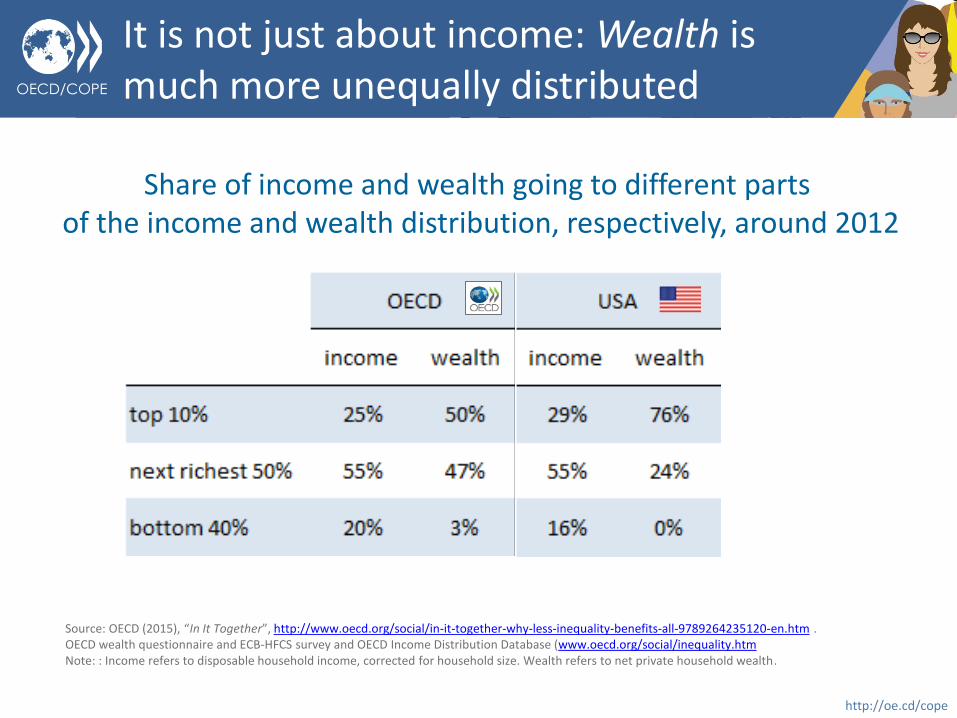
It is not just about income: Wealth is much more unequally distributed
Share of income and wealth going to different parts of the income and wealth distribution, respectively, around 2012
Source: OECD (2015), “In It Together”, http://www.oecd.org/social/in-it-together-why-less-inequality-benefits-all-9789264235120-en.htm . OECD wealth questionnaire and ECB-HFCS survey and OECD Income Distribution Database (www.oecd.org/social/inequality.htm Note: : Income refers to disposable household income, corrected for household size. Wealth refers to net private household wealth.
OECD/COPE
http://oe.cd/cope
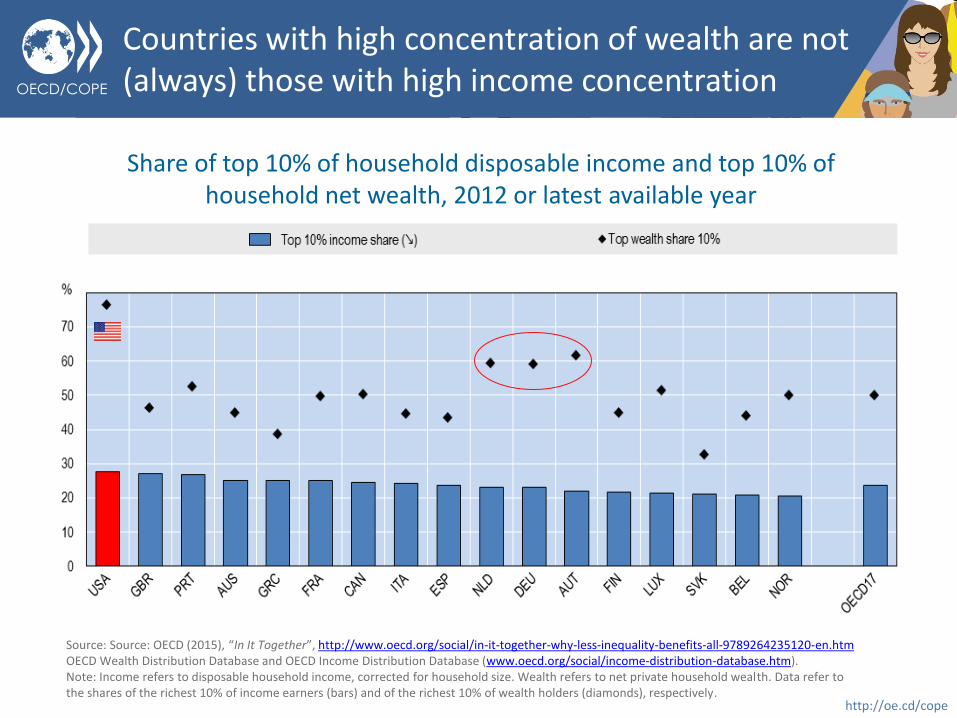
Countries with high concentration of wealth are not (always) those with high income concentration
Share of top 10% of household disposable income and top 10% of household net wealth, 2012 or latest available year
Source: Source: OECD (2015), “In It Together”, http://www.oecd.org/social/in-it-together-why-less-inequality-benefits-all-9789264235120-en.htm OECD Wealth Distribution Database and OECD Income Distribution Database (www.oecd.org/social/income-distribution-database.htm). Note: Income refers to disposable household income, corrected for household size. Wealth refers to net private household wealth. Data refer to the shares of the richest 10% of income earners (bars) and of the richest 10% of wealth holders (diamonds), respectively.
OECD/COPE
http://oe.cd/cope
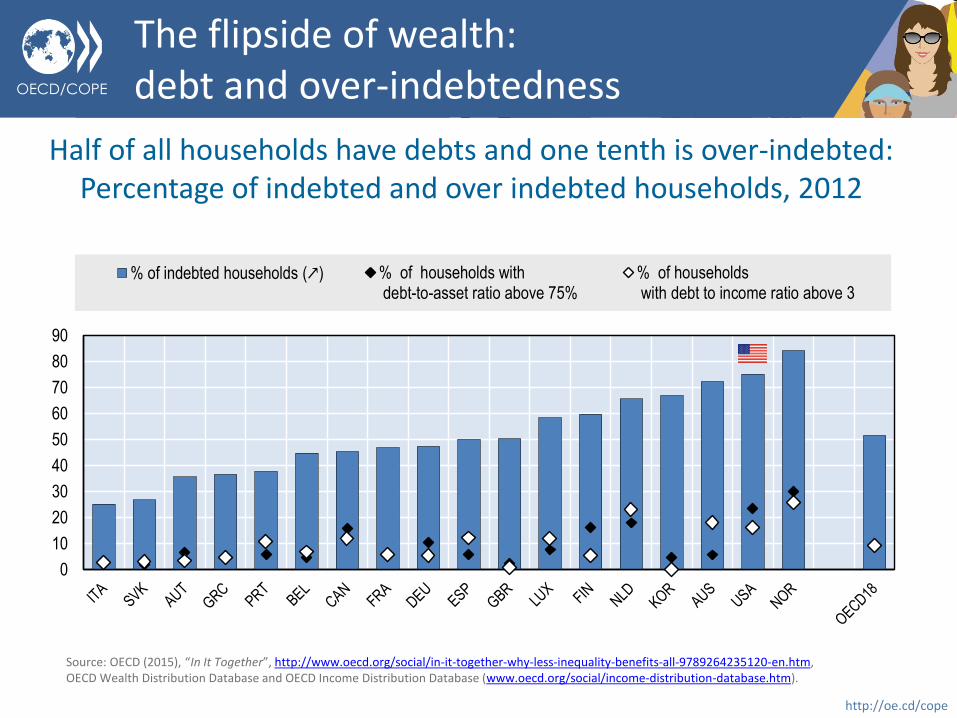
The flipside of wealth: debt and over-indebtedness
Half of all households have debts and one tenth is over-indebted: Percentage of indebted and over indebted households, 2012
0
10
20
30
40
50
60
70
80
90
% of indebted households (↗) % of households with debt-to-asset ratio above 75%
% of households with debt to income ratio above 3
Source: OECD (2015), “In It Together”, http://www.oecd.org/social/in-it-together-why-less-inequality-benefits-all-9789264235120-en.htm, OECD Wealth Distribution Database and OECD Income Distribution Database (www.oecd.org/social/income-distribution-database.htm).
OECD/COPE
http://oe.cd/cope
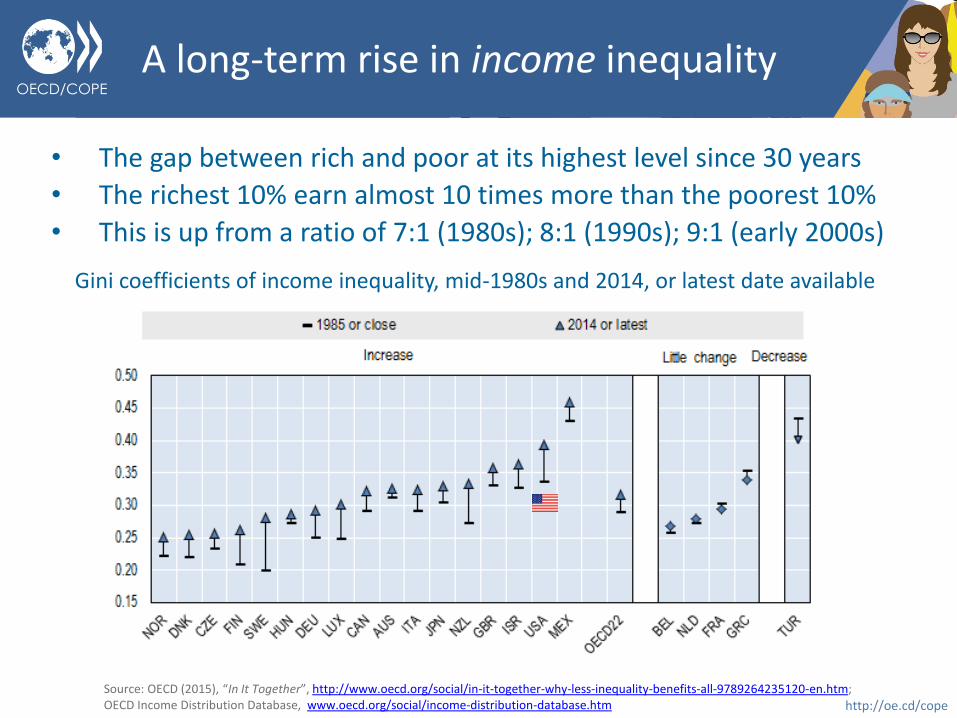
• The gap between rich and poor at its highest level since 30 years
• The richest 10% earn almost 10 times more than the poorest 10%
• This is up from a ratio of 7:1 (1980s); 8:1 (1990s); 9:1 (early 2000s)
A long-term rise in income inequality
Source: OECD (2015), “In It Together”, http://www.oecd.org/social/in-it-together-why-less-inequality-benefits-all-9789264235120-en.htm; OECD Income Distribution Database, www.oecd.org/social/income-distribution-database.htm
Gini coefficients of income inequality, mid-1980s and 2014, or latest date available
OECD/COPE
http://oe.cd/cope
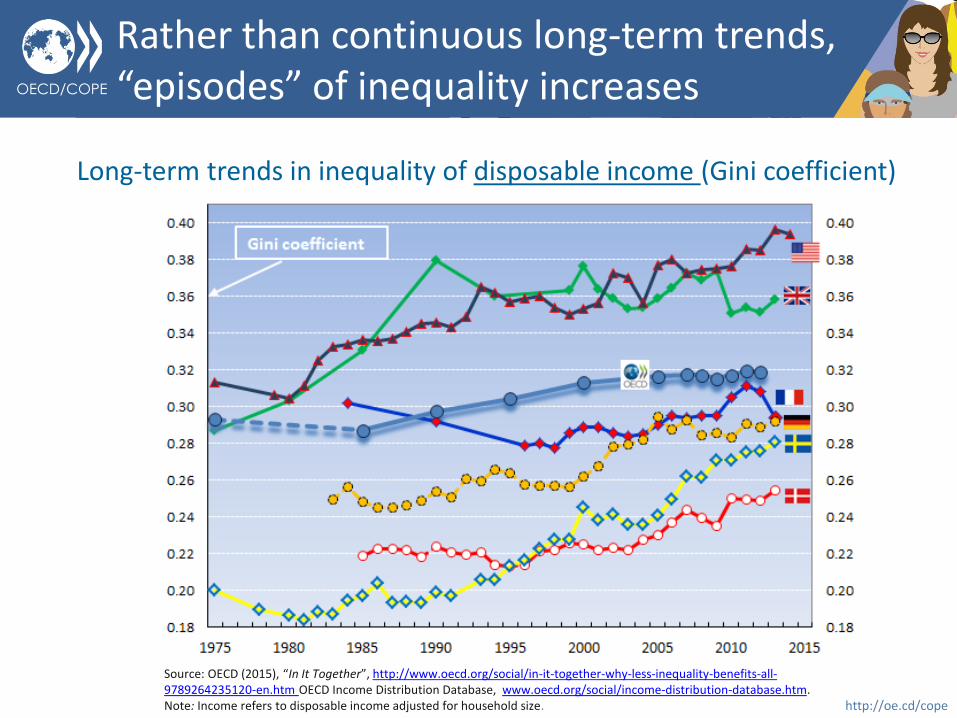
Rather than continuous long-term trends, “episodes” of inequality increases
Long-term trends in inequality of disposable income (Gini coefficient)
Source: OECD (2015), “In It Together”, http://www.oecd.org/social/in-it-together-why-less-inequality-benefits-all-9789264235120-en.htm OECD Income Distribution Database, www.oecd.org/social/income-distribution-database.htm. Note: Income refers to disposable income adjusted for household size.
OECD/COPE
http://oe.cd/cope
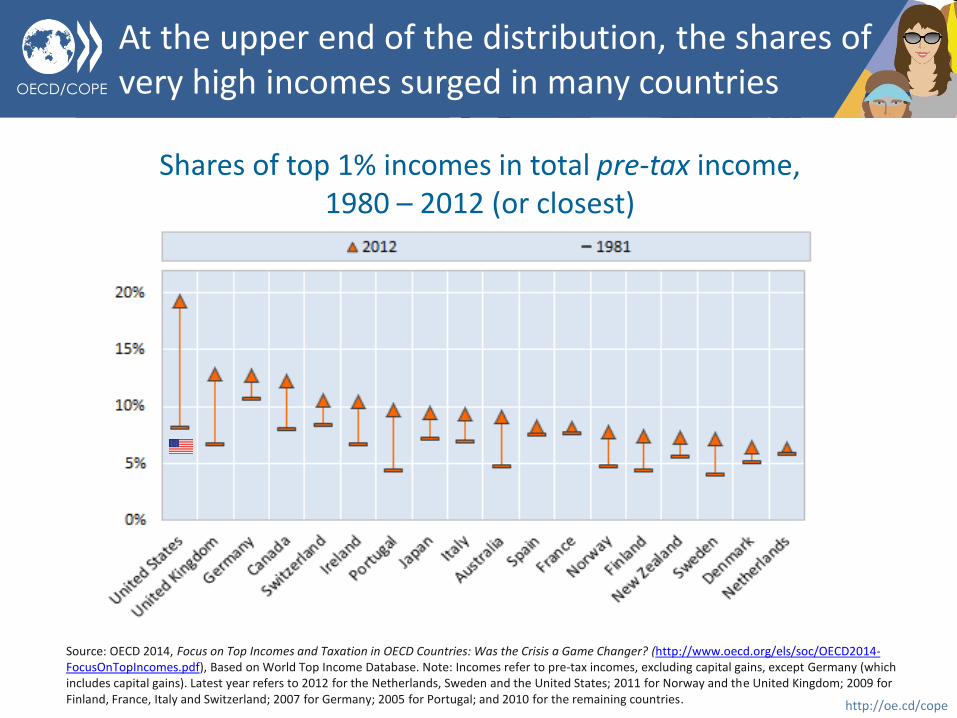
At the upper end of the distribution, the shares of very high incomes surged in many countries
Shares of top 1% incomes in total pre-tax income, 1980 – 2012 (or closest)
Source: OECD 2014, Focus on Top Incomes and Taxation in OECD Countries: Was the Crisis a Game Changer? (http://www.oecd.org/els/soc/OECD2014-FocusOnTopIncomes.pdf), Based on World Top Income Database. Note: Incomes refer to pre-tax incomes, excluding capital gains, except Germany (which includes capital gains). Latest year refers to 2012 for the Netherlands, Sweden and the United States; 2011 for Norway and the United Kingdom; 2009 for Finland, France, Italy and Switzerland; 2007 for Germany; 2005 for Portugal; and 2010 for the remaining countries.
OECD/COPE
http://oe.cd/cope
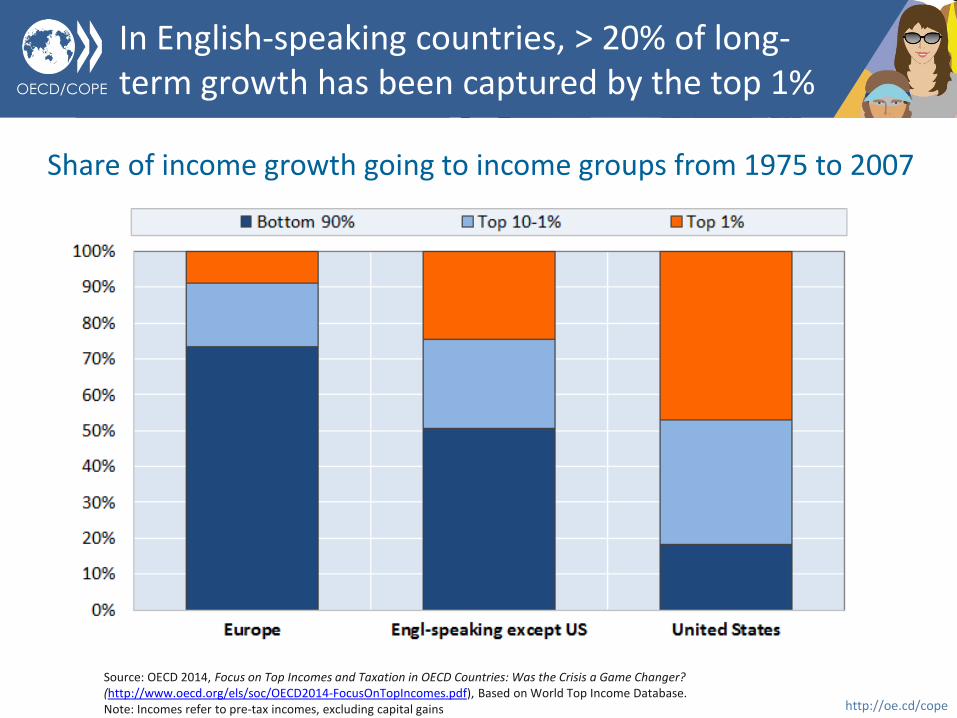
In English-speaking countries, > 20% of long-term growth has been captured by the top 1%
Share of income growth going to income groups from 1975 to 2007
Source: OECD 2014, Focus on Top Incomes and Taxation in OECD Countries: Was the Crisis a Game Changer? (http://www.oecd.org/els/soc/OECD2014-FocusOnTopIncomes.pdf), Based on World Top Income Database. Note: Incomes refer to pre-tax incomes, excluding capital gains
OECD/COPE
http://oe.cd/cope
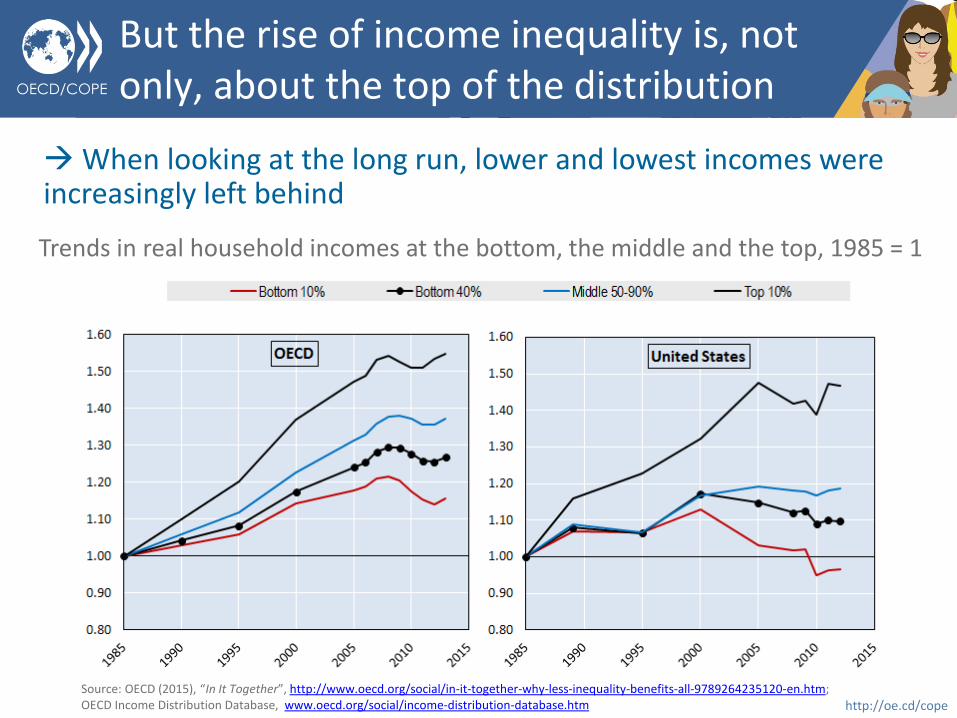
But the rise of income inequality is, not only, about the top of the distribution
Trends in real household incomes at the bottom, the middle and the top, 1985 = 1
When looking at the long run, lower and lowest incomes were increasingly left behind
Source: OECD (2015), “In It Together”, http://www.oecd.org/social/in-it-together-why-less-inequality-benefits-all-9789264235120-en.htm; OECD Income Distribution Database, www.oecd.org/social/income-distribution-database.htm
OECD/COPE
http://oe.cd/cope
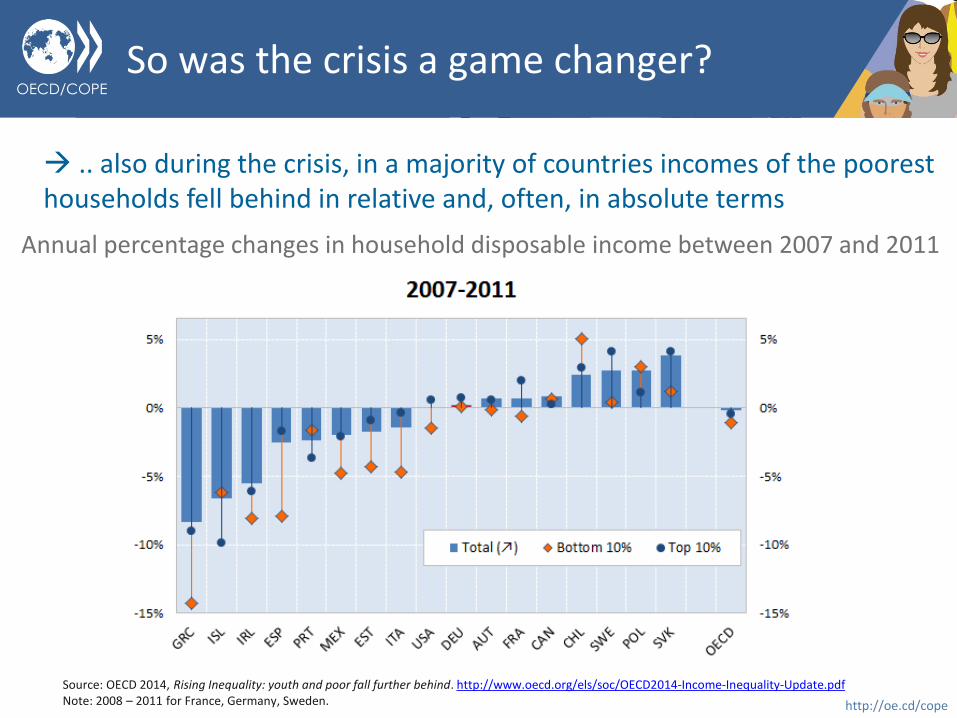
.. also during the crisis, in a majority of countries incomes of the poorest households fell behind in relative and, often, in absolute terms
So was the crisis a game changer?
Source: OECD 2014, Rising Inequality: youth and poor fall further behind. http://www.oecd.org/els/soc/OECD2014-Income-Inequality-Update.pdf Note: 2008 – 2011 for France, Germany, Sweden.
Annual percentage changes in household disposable income between 2007 and 2011
OECD/COPE
http://oe.cd/cope
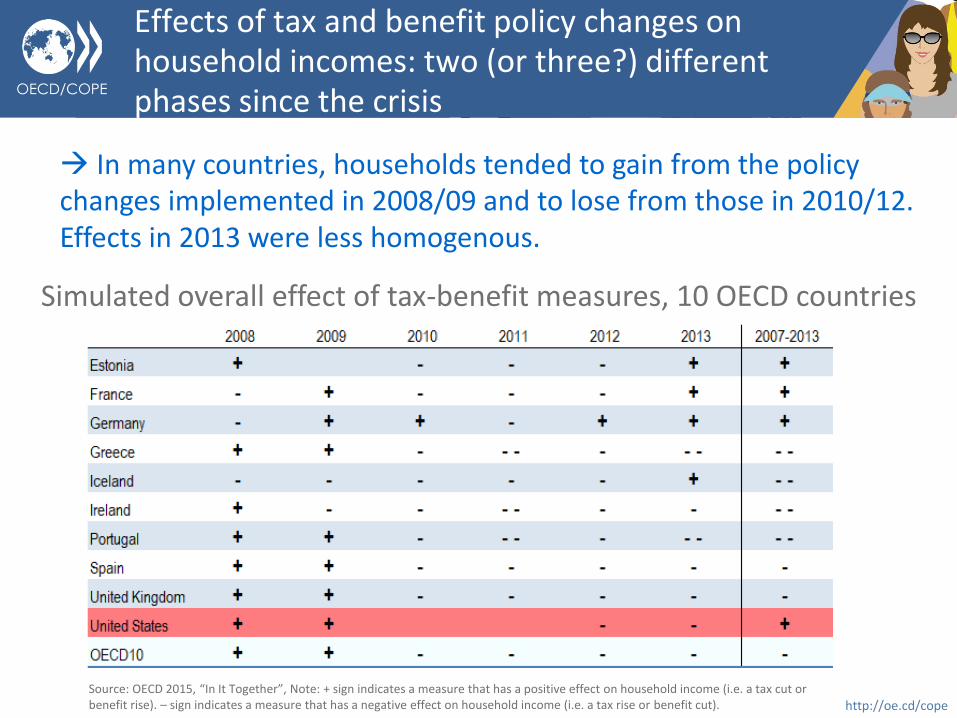
In many countries, households tended to gain from the policy changes implemented in 2008/09 and to lose from those in 2010/12. Effects in 2013 were less homogenous.
Simulated overall effect of tax-benefit measures, 10 OECD countries
Source: OECD 2015, “In It Together”, Note: + sign indicates a measure that has a positive effect on household income (i.e. a tax cut or benefit rise). – sign indicates a measure that has a negative effect on household income (i.e. a tax rise or benefit cut).
Effects of tax and benefit policy changes on household incomes: two (or three?) different phases since the crisis
OECD/COPE
http://oe.cd/cope
• Inequality increased in good times, and it increased in bad times: income inequality has reached record highs in most OECD countries;
• The distribution of wealth is (much) more unequal than that of income;
• Inequalities go beyond resources: education and health
• Poorer households are losing ground. But it is not only about poverty – it is about the bottom 40%;
• OECD countries recorded a historically high level of inequality as they were shattered by the Great Recession in 2008;
• The GR squeezed market incomes but the welfare state has prevented net income inequality going from bad to worse in the first years of the crisis..
• ..but as the jobs crisis persists and fiscal consolidation takes hold, inequality has been on the rise again in many countries.
Income inequality trends in the OECD area over the past three decades: the bottom line
OECD/COPE
http://oe.cd/cope
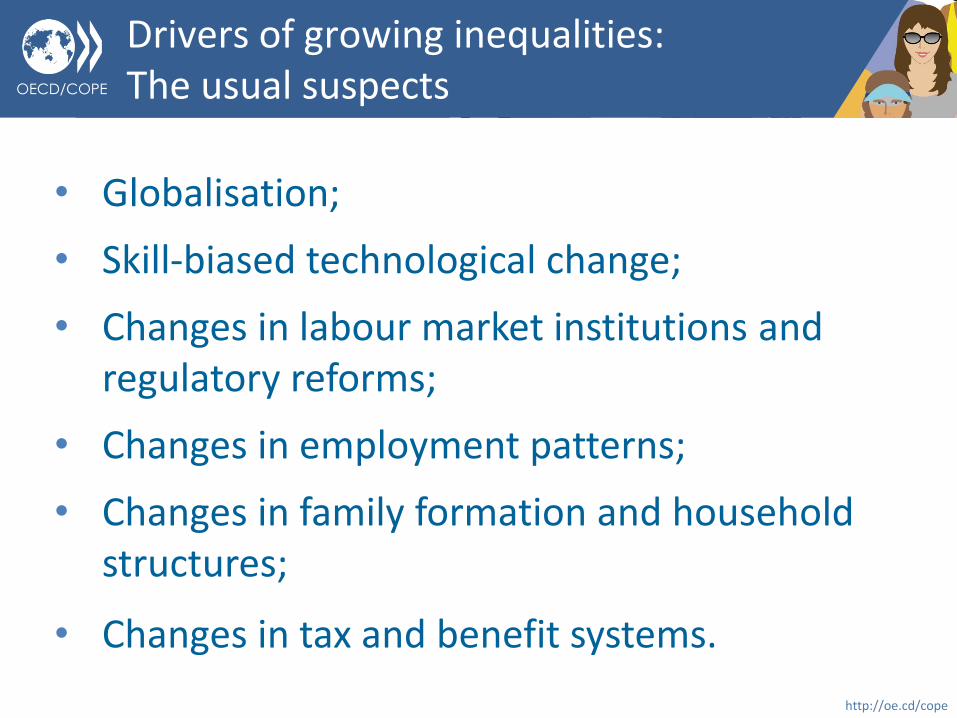
• Globalisation;
• Skill-biased technological change;
• Changes in labour market institutions and regulatory reforms;
• Changes in employment patterns;
• Changes in family formation and household structures;
• Changes in tax and benefit systems.
Drivers of growing inequalities: The usual suspects
OECD/COPE
http://oe.cd/cope
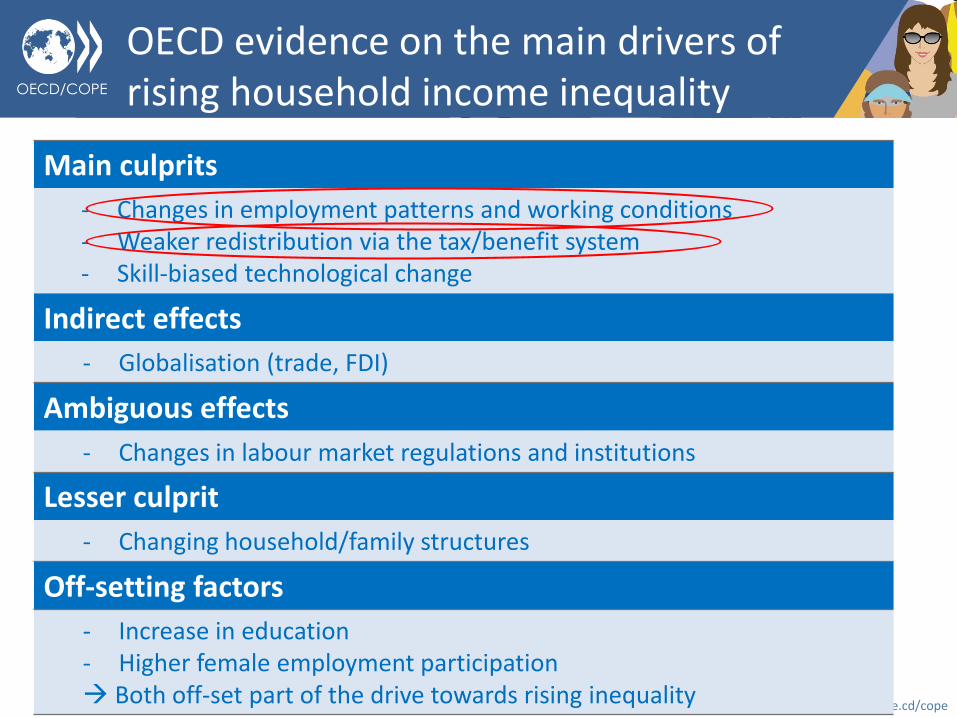
OECD evidence on the main drivers of rising household income inequality
Main culprits
- Changes in employment patterns and working conditions - Weaker redistribution via the tax/benefit system - Skill-biased technological change
Indirect effects
- Globalisation (trade, FDI)
Ambiguous effects
- Changes in labour market regulations and institutions
Lesser culprit
- Changing household/family structures
Off-setting factors
- Increase in education - Higher female employment participation Both off-set part of the drive towards rising inequality
OECD/COPE
http://oe.cd/cope
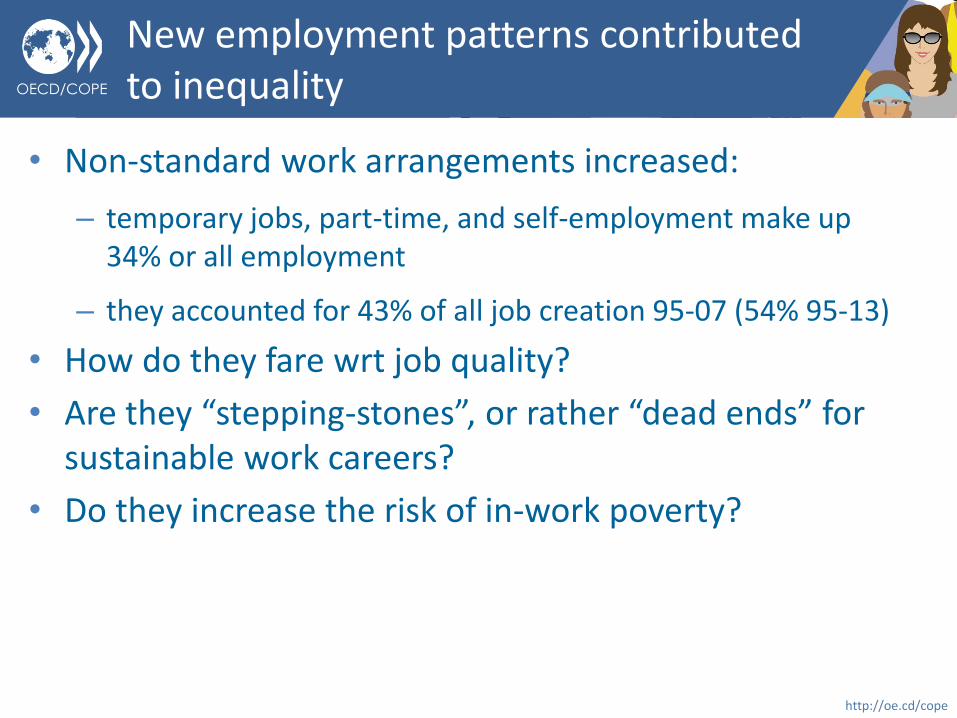
• Non-standard work arrangements increased:
– temporary jobs, part-time, and self-employment make up 34% or all employment
– they accounted for 43% of all job creation 95-07 (54% 95-13)
• How do they fare wrt job quality?
• Are they “stepping-stones”, or rather “dead ends” for sustainable work careers?
• Do they increase the risk of in-work poverty?
New employment patterns contributed to inequality
OECD/COPE
http://oe.cd/cope
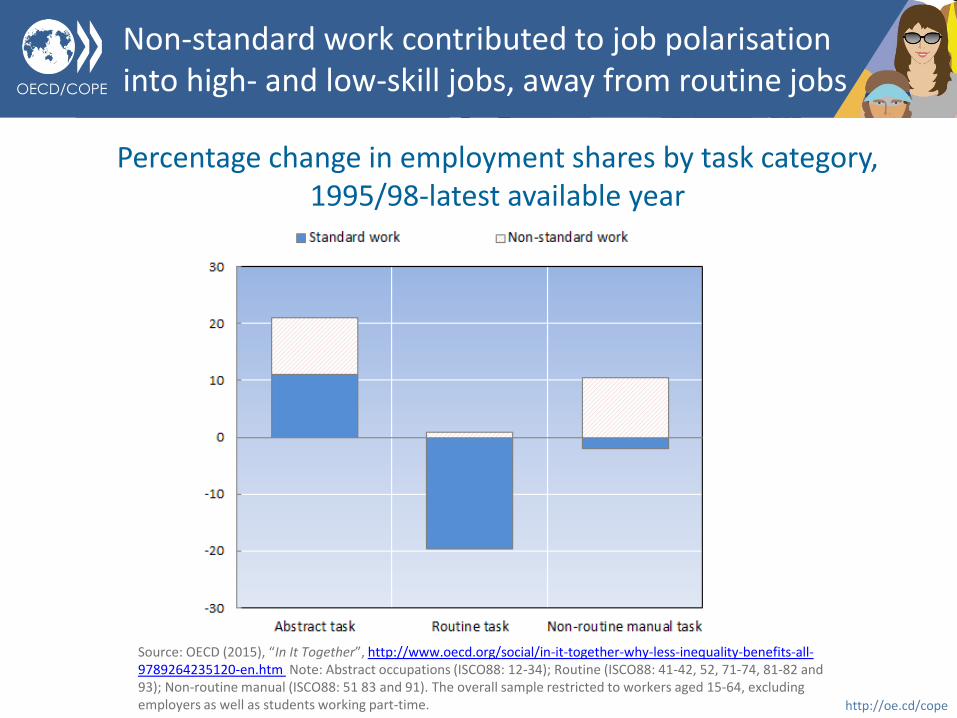
Non-standard work contributed to job polarisation into high- and low-skill jobs, away from routine jobs
Percentage change in employment shares by task category, 1995/98-latest available year
Source: OECD (2015), “In It Together”, http://www.oecd.org/social/in-it-together-why-less-inequality-benefits-all-9789264235120-en.htm Note: Abstract occupations (ISCO88: 12-34); Routine (ISCO88: 41-42, 52, 71-74, 81-82 and 93); Non-routine manual (ISCO88: 51 83 and 91). The overall sample restricted to workers aged 15-64, excluding employers as well as students working part-time.
OECD/COPE
http://oe.cd/cope
• Temporary workers have 30% lower hourly wages; they still face a wage penalty, about 12% controlling for observable characteristics, and 5-8% once unobservables are taken into account
– The penalty is higher for younger workers
• For part-time workers
– in permanent contracts, the penalty is small or a wage premium is found in some countries, mainly for women, when controlling for individual and job characteristics
• Sticky floors: the earnings gap for non-standard workers is (much) higher at the bottom of the wage distribution
Is there a wage penalty for non-standard workers?
OECD/COPE
http://oe.cd/cope
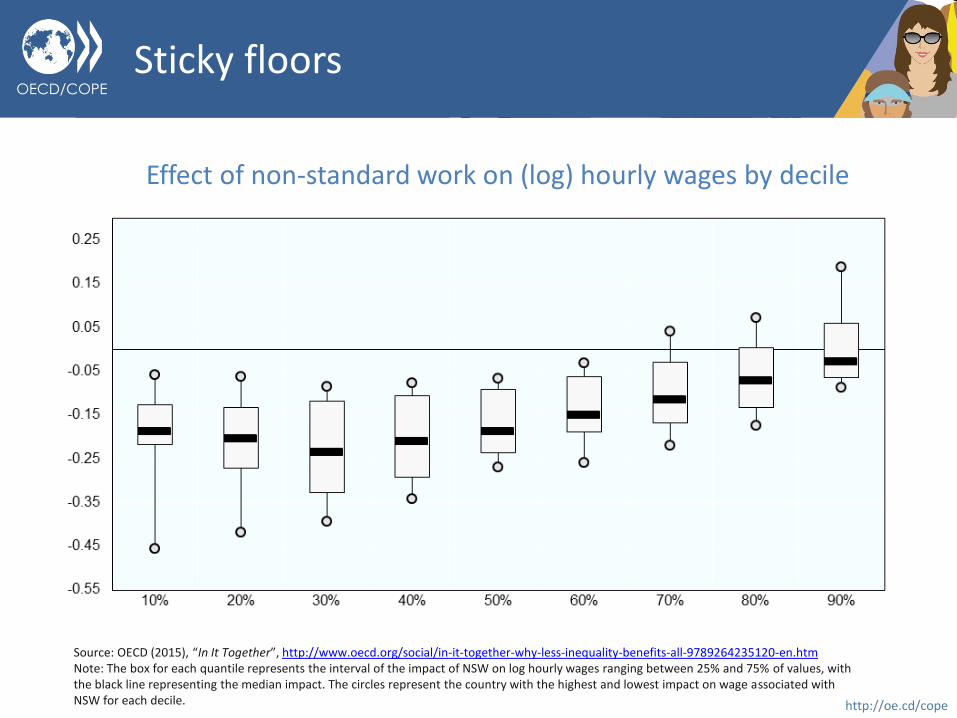
Sticky floors
Source: OECD (2015), “In It Together”, http://www.oecd.org/social/in-it-together-why-less-inequality-benefits-all-9789264235120-en.htm Note: The box for each quantile represents the interval of the impact of NSW on log hourly wages ranging between 25% and 75% of values, with the black line representing the median impact. The circles represent the country with the highest and lowest impact on wage associated with NSW for each decile.
Effect of non-standard work on (log) hourly wages by decile
OECD/COPE
http://oe.cd/cope
Other measures of job quality also suggest that non-standard workers are worse off
• hourly wages are lower;
• job insecurity is higher;
• they provide less training.
• and report a higher level of job strain
but do they improve labour market prospects, e.g. by a higher probability to move to a more stable job?
OECD/COPE
http://oe.cd/cope
• Controlling for characteristics and initial employment status, temporary workers are 12-13 points more likely than the unemployed to be in standard work after one year
• But only prime-age and older temporary workers exhibit higher transition probability into permanent jobs; a stepping-stone effect for young temporary workers (15-29) is generally not found
• In addition, transition rates remain low over a longer time span (less than 50% move to a permanent contract after 3 years)
• Temporary workers are at higher risk of both unemployment and inactivity than those with standard work in ¾ of countries
“Stepping stones or dead ends”: how likely are non-standard workers to move into standard jobs?
OECD/COPE
http://oe.cd/cope
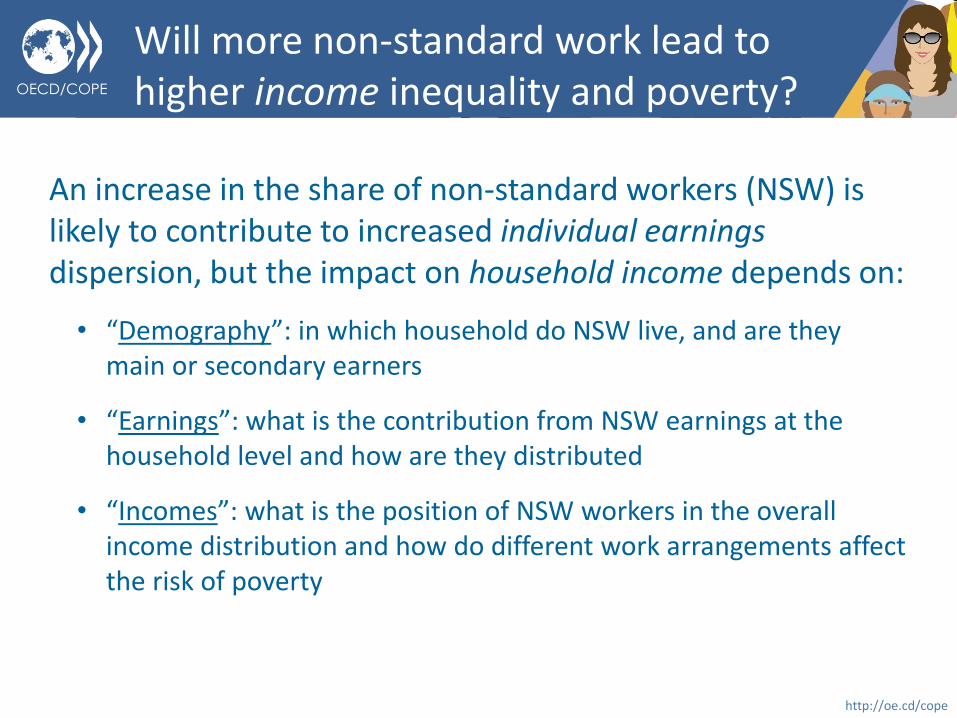
Will more non-standard work lead to higher income inequality and poverty?
An increase in the share of non-standard workers (NSW) is likely to contribute to increased individual earnings dispersion, but the impact on household income depends on:
• “Demography”: in which household do NSW live, and are they main or secondary earners
• “Earnings”: what is the contribution from NSW earnings at the household level and how are they distributed
• “Incomes”: what is the position of NSW workers in the overall income distribution and how do different work arrangements affect the risk of poverty
OECD/COPE
http://oe.cd/cope
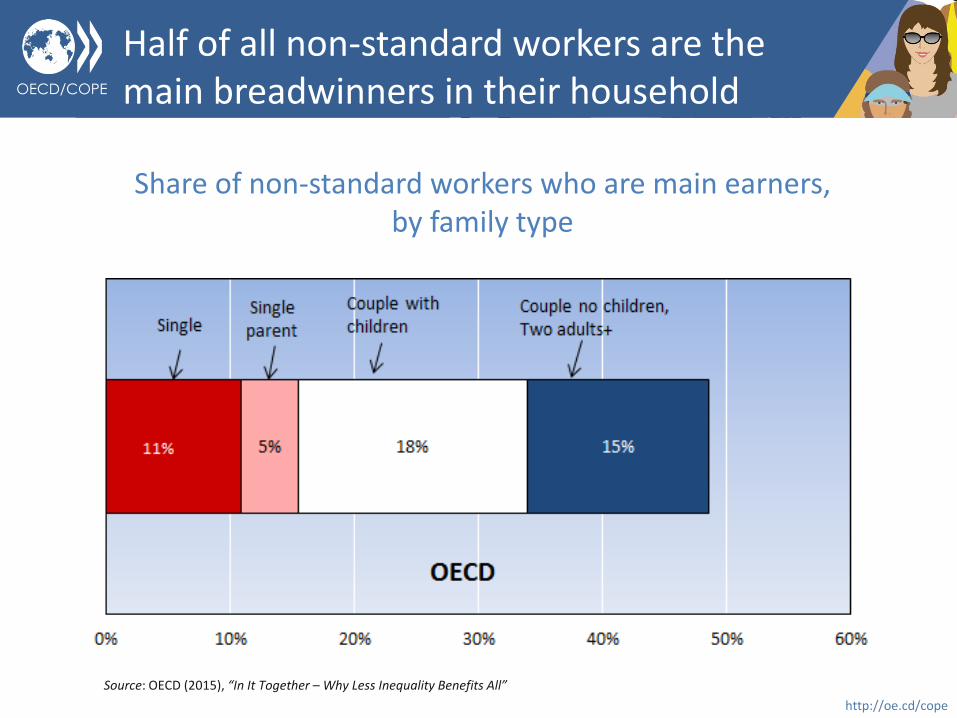
Half of all non-standard workers are the main breadwinners in their household
Share of non-standard workers who are main earners, by family type
Source: OECD (2015), “In It Together – Why Less Inequality Benefits All”
OECD/COPE
http://oe.cd/cope
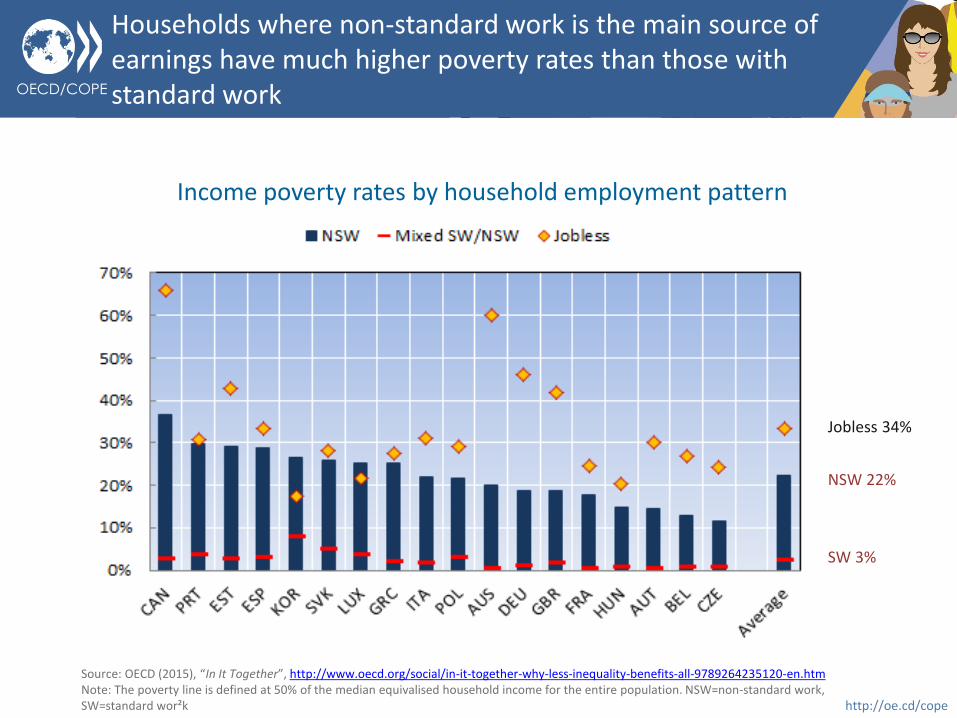
Income poverty rates by household employment pattern
NSW 22%
SW 3%
Jobless 34%
Source: OECD (2015), “In It Together”, http://www.oecd.org/social/in-it-together-why-less-inequality-benefits-all-9789264235120-en.htm Note: The poverty line is defined at 50% of the median equivalised household income for the entire population. NSW=non-standard work, SW=standard wor²k
Households where non-standard work is the main source of earnings have much higher poverty rates than those with standard work
OECD/COPE
http://oe.cd/cope
• Non-standard work arrangements increased:
– Temporary work, part-time and self-employment now make up 1/3 of all employment
– they accounted for more than half of all job creation since 1995
• Those jobs provide less job quality: – hourly wages;
– job security;
– training;
– job strain;
– social protection (esp. “new SE”).
• “Stepping-stone” effects do exist, but mostly for prime-age and older workers;
• For poverty risks, the household constellation matters
New employment patterns and inequality: the bottom line
OECD/COPE
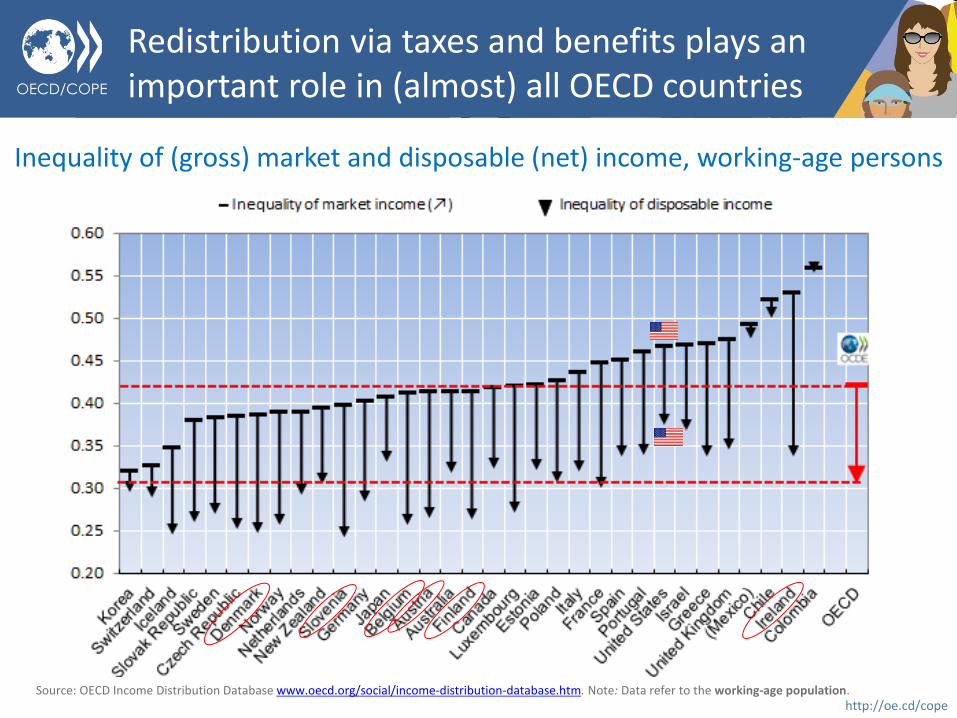
http://oe.cd/cope Source: OECD Income Distribution Database www.oecd.org/social/income-distribution-database.htm. Note: Data refer to the working-age population.
Inequality of (gross) market and disposable (net) income, working-age persons
Redistribution via taxes and benefits plays an important role in (almost) all OECD countries
OECD/COPE
http://oe.cd/cope
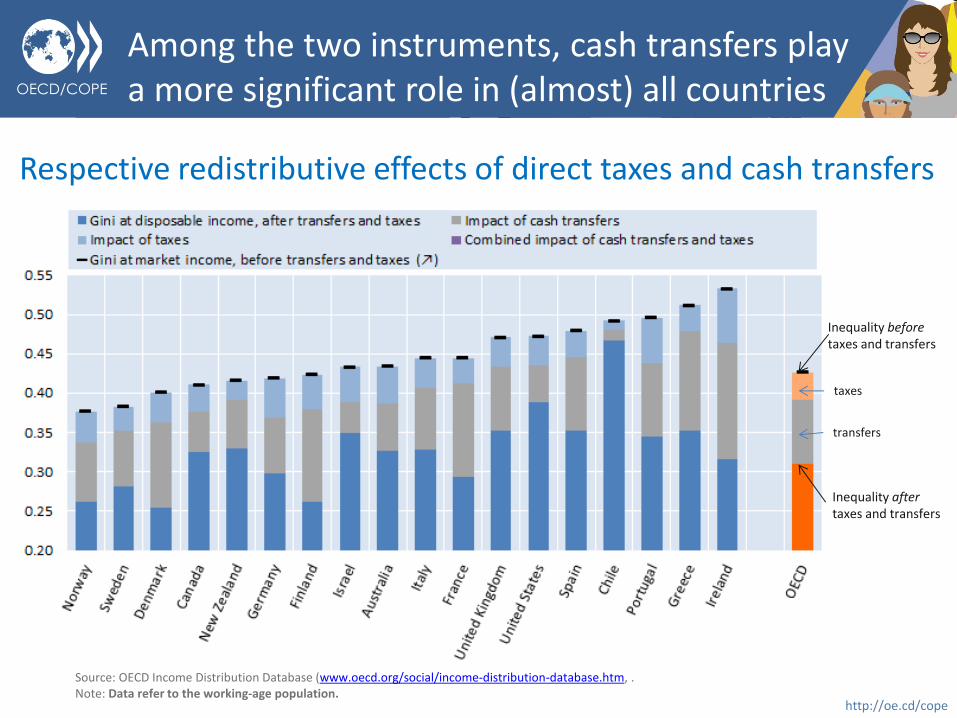
Among the two instruments, cash transfers play a more significant role in (almost) all countries
Source: OECD Income Distribution Database (www.oecd.org/social/income-distribution-database.htm, . Note: Data refer to the working-age population.
Respective redistributive effects of direct taxes and cash transfers
Inequality before taxes and transfers
Inequality after taxes and transfers
taxes
transfers
OECD/COPE
http://oe.cd/cope
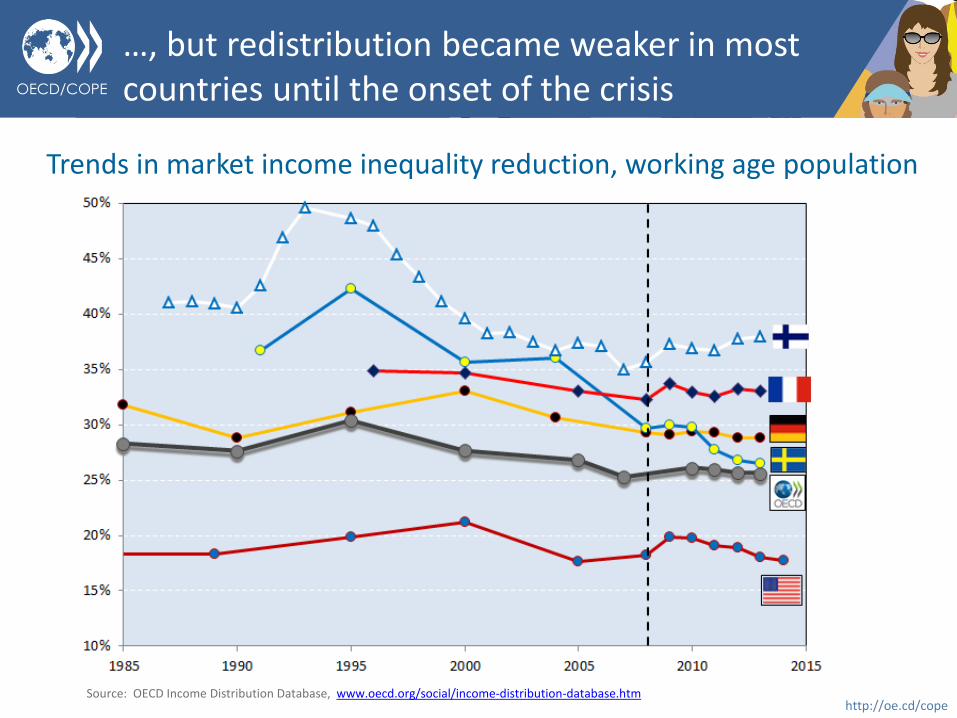
…, but redistribution became weaker in most countries until the onset of the crisis
Source: OECD Income Distribution Database, www.oecd.org/social/income-distribution-database.htm
Trends in market income inequality reduction, working age population
OECD/COPE
http://oe.cd/cope
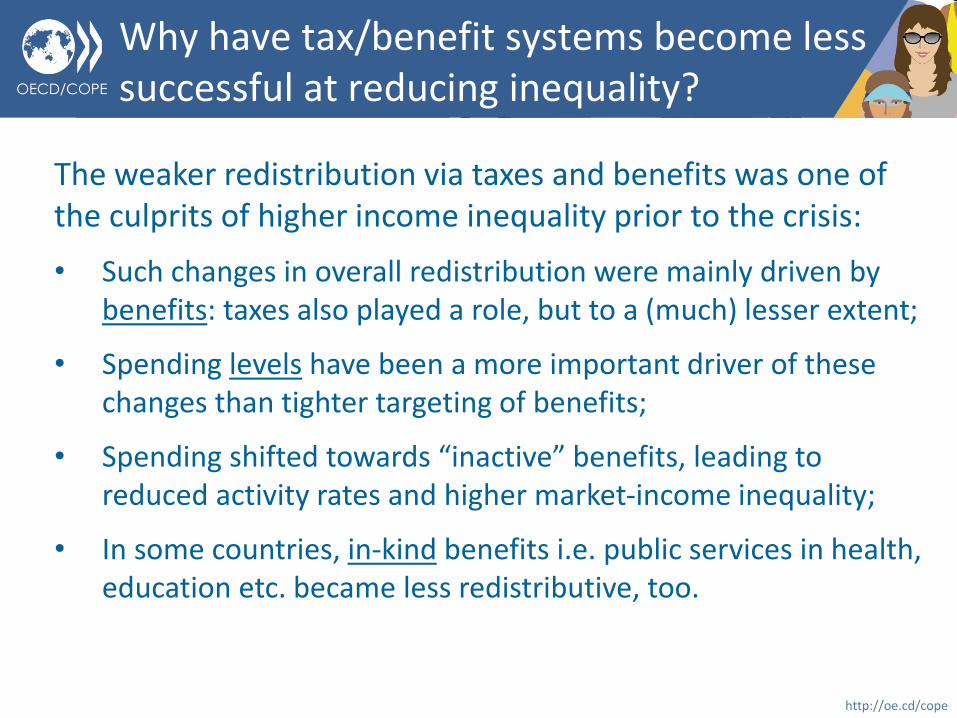
The weaker redistribution via taxes and benefits was one of the culprits of higher income inequality prior to the crisis:
• Such changes in overall redistribution were mainly driven by benefits: taxes also played a role, but to a (much) lesser extent;
• Spending levels have been a more important driver of these changes than tighter targeting of benefits;
• Spending shifted towards “inactive” benefits, leading to reduced activity rates and higher market-income inequality;
• In some countries, in-kind benefits i.e. public services in health, education etc. became less redistributive, too.
Why have tax/benefit systems become less successful at reducing inequality?
OECD/COPE
http://oe.cd/cope
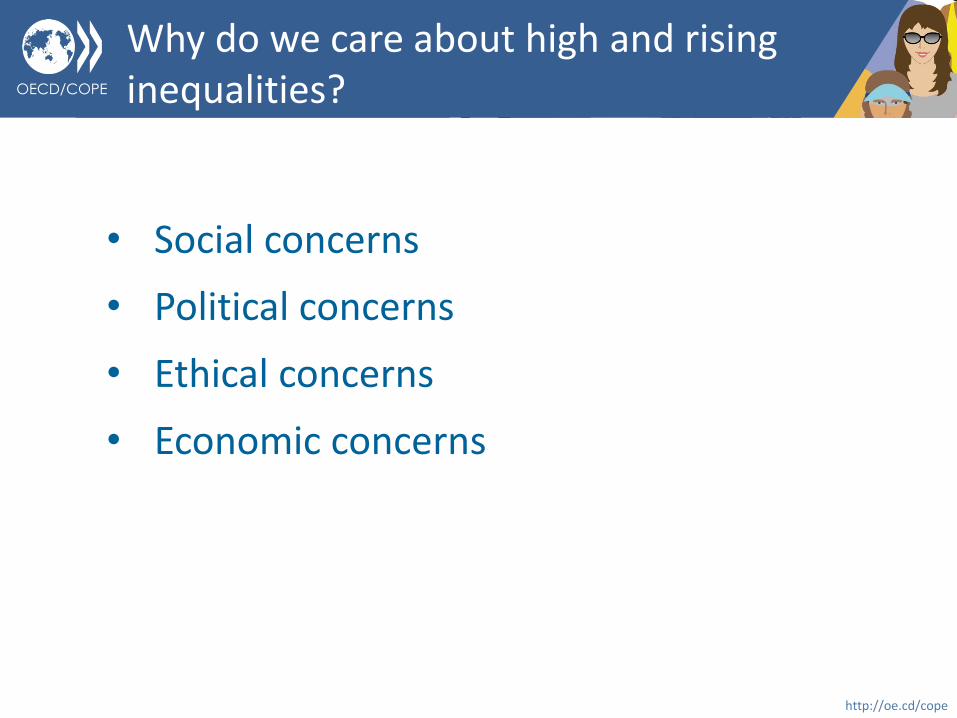
• Social concerns
• Political concerns
• Ethical concerns
• Economic concerns
Why do we care about high and rising inequalities?
OECD/COPE
http://oe.cd/cope
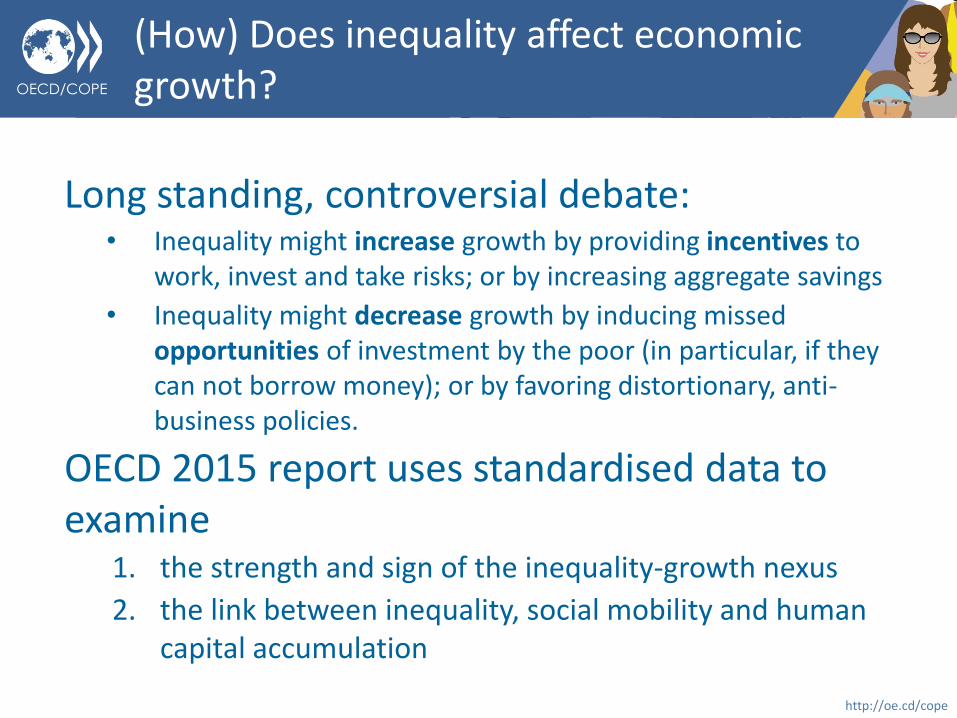
Long standing, controversial debate: • Inequality might increase growth by providing incentives to
work, invest and take risks; or by increasing aggregate savings
• Inequality might decrease growth by inducing missed opportunities of investment by the poor (in particular, if they can not borrow money); or by favoring distortionary, anti-business policies.
OECD 2015 report uses standardised data to examine
1. the strength and sign of the inequality-growth nexus
2. the link between inequality, social mobility and human capital accumulation
(How) Does inequality affect economic growth?
OECD/COPE
http://oe.cd/cope
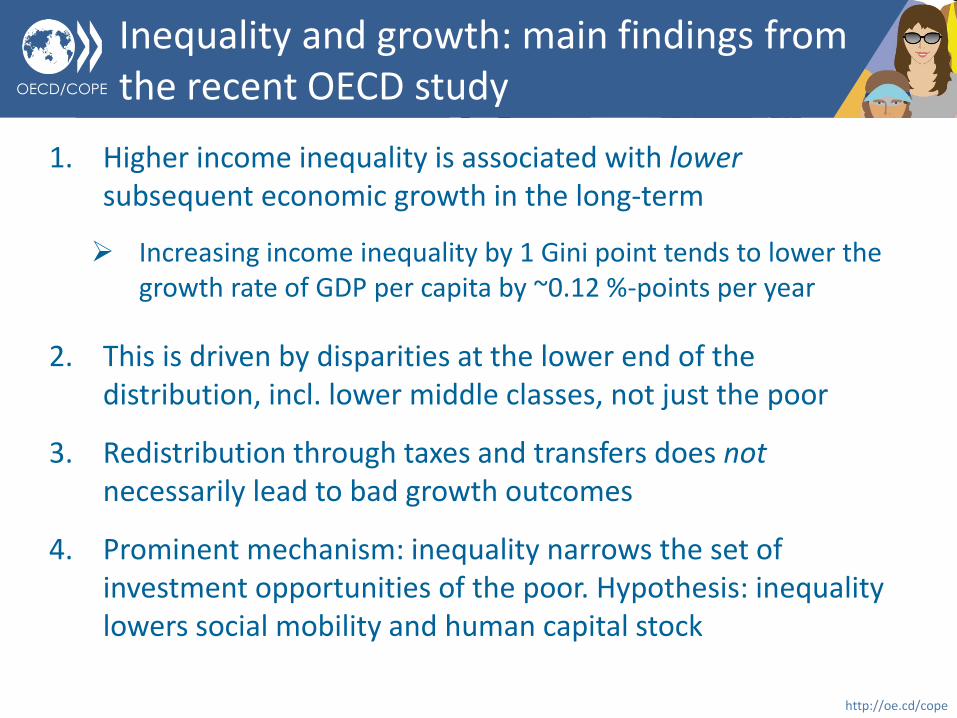
1. Higher income inequality is associated with lower subsequent economic growth in the long-term
Increasing income inequality by 1 Gini point tends to lower the growth rate of GDP per capita by ~0.12 %-points per year
2. This is driven by disparities at the lower end of the distribution, incl. lower middle classes, not just the poor
3. Redistribution through taxes and transfers does not necessarily lead to bad growth outcomes
4. Prominent mechanism: inequality narrows the set of investment opportunities of the poor. Hypothesis: inequality lowers social mobility and human capital stock
Inequality and growth: main findings from the recent OECD study
OECD/COPE
http://oe.cd/cope
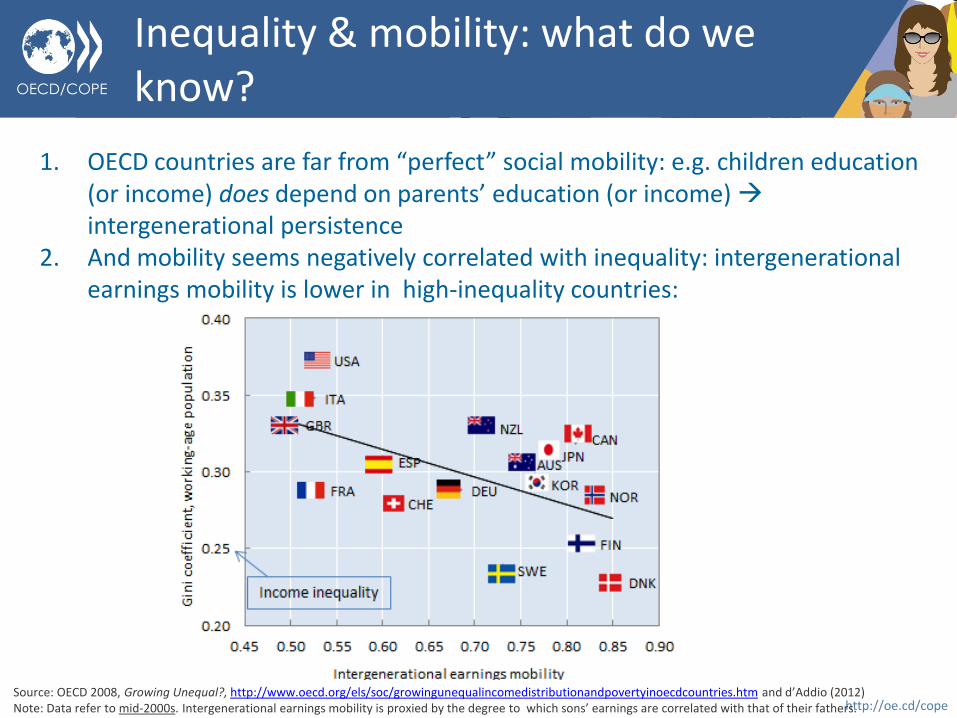
1. OECD countries are far from “perfect” social mobility: e.g. children education (or income) does depend on parents’ education (or income) intergenerational persistence
2. And mobility seems negatively correlated with inequality: intergenerational earnings mobility is lower in high-inequality countries:
Inequality & mobility: what do we know?
Source: OECD 2008, Growing Unequal?, http://www.oecd.org/els/soc/growingunequalincomedistributionandpovertyinoecdcountries.htm and d’Addio (2012) Note: Data refer to mid-2000s. Intergenerational earnings mobility is proxied by the degree to which sons’ earnings are correlated with that of their fathers.
OECD/COPE
http://oe.cd/cope
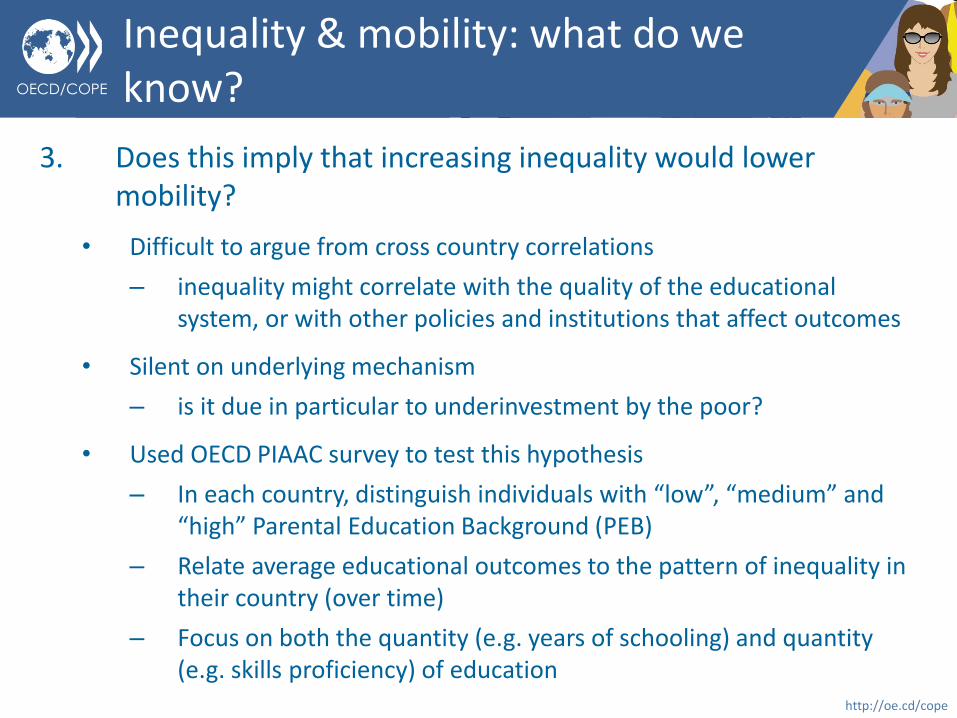
3. Does this imply that increasing inequality would lower mobility?
• Difficult to argue from cross country correlations
– inequality might correlate with the quality of the educational system, or with other policies and institutions that affect outcomes
• Silent on underlying mechanism
– is it due in particular to underinvestment by the poor?
• Used OECD PIAAC survey to test this hypothesis
– In each country, distinguish individuals with “low”, “medium” and “high” Parental Education Background (PEB)
– Relate average educational outcomes to the pattern of inequality in their country (over time)
– Focus on both the quantity (e.g. years of schooling) and quantity (e.g. skills proficiency) of education
Inequality & mobility: what do we know?
OECD/COPE
http://oe.cd/cope
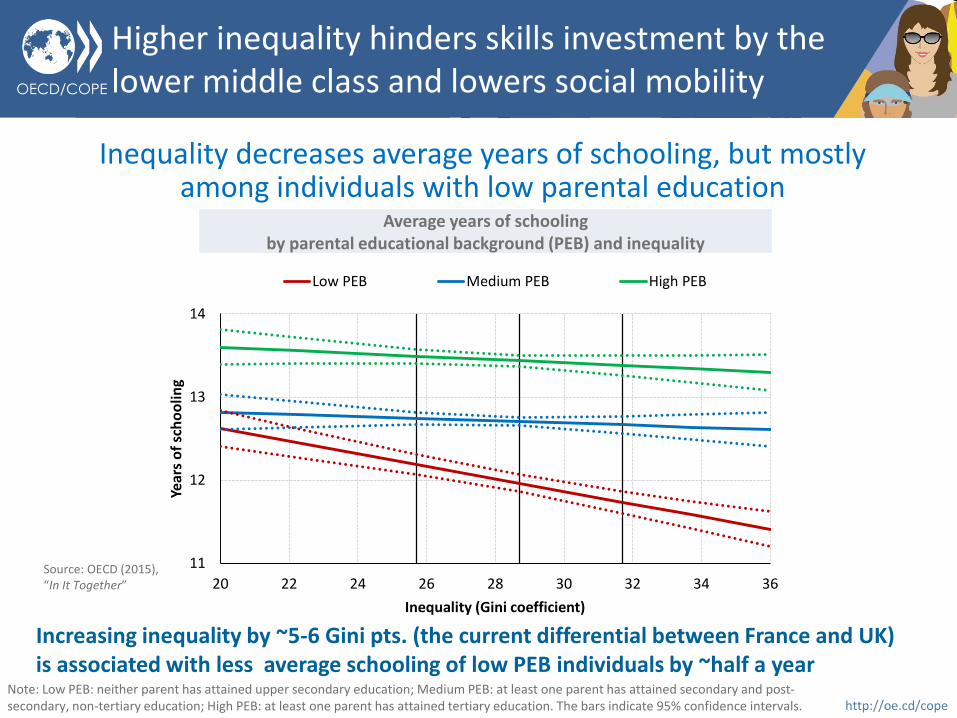
Inequality decreases average years of schooling, but mostly among individuals with low parental education
Note: Low PEB: neither parent has attained upper secondary education; Medium PEB: at least one parent has attained secondary and post-secondary, non-tertiary education; High PEB: at least one parent has attained tertiary education. The bars indicate 95% confidence intervals.
Average years of schooling by parental educational background (PEB) and inequality
11
12
13
14
20 22 24 26 28 30 32 34 36
Year
s o
f sc
ho
olin
g
Inequality (Gini coefficient)
Low PEB Medium PEB High PEB
Increasing inequality by ~5-6 Gini pts. (the current differential between France and UK) is associated with less average schooling of low PEB individuals by ~half a year
Source: OECD (2015), “In It Together”
Higher inequality hinders skills investment by the lower middle class and lowers social mobility
OECD/COPE
http://oe.cd/cope
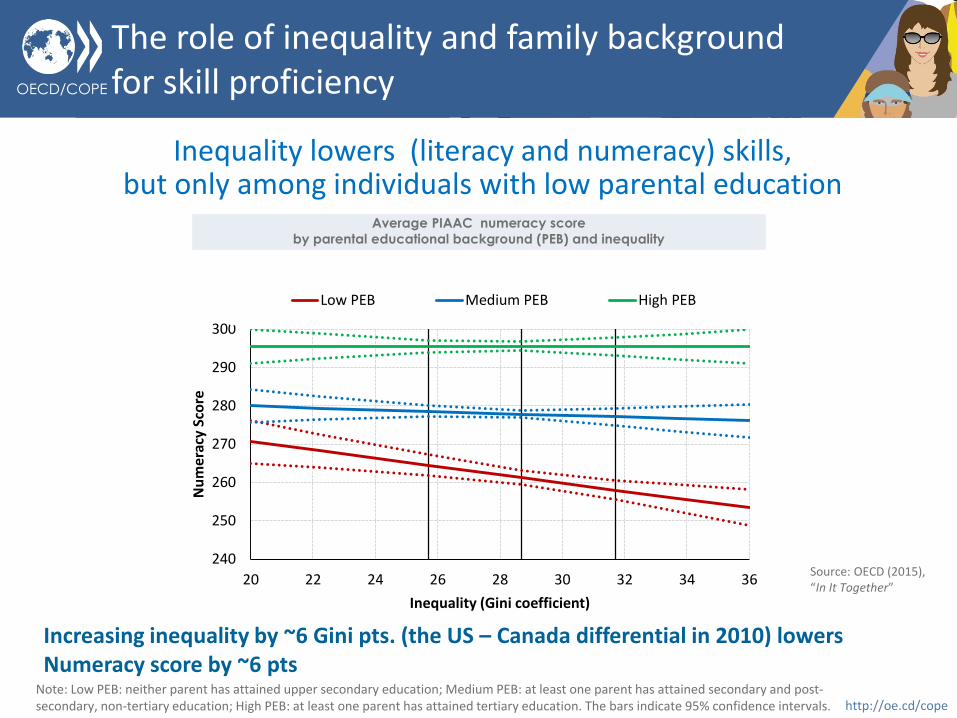
The role of inequality and family background for skill proficiency
Inequality lowers (literacy and numeracy) skills, but only among individuals with low parental education
Increasing inequality by ~6 Gini pts. (the US – Canada differential in 2010) lowers Numeracy score by ~6 pts
Note: Low PEB: neither parent has attained upper secondary education; Medium PEB: at least one parent has attained secondary and post-secondary, non-tertiary education; High PEB: at least one parent has attained tertiary education. The bars indicate 95% confidence intervals.
Average PIAAC numeracy score
by parental educational background (PEB) and inequality
240
250
260
270
280
290
300
20 22 24 26 28 30 32 34 36
Nu
mer
acy
Sco
re
Inequality (Gini coefficient)
Low PEB Medium PEB High PEB
Source: OECD (2015), “In It Together”
OECD/COPE
http://oe.cd/cope
2
3
1
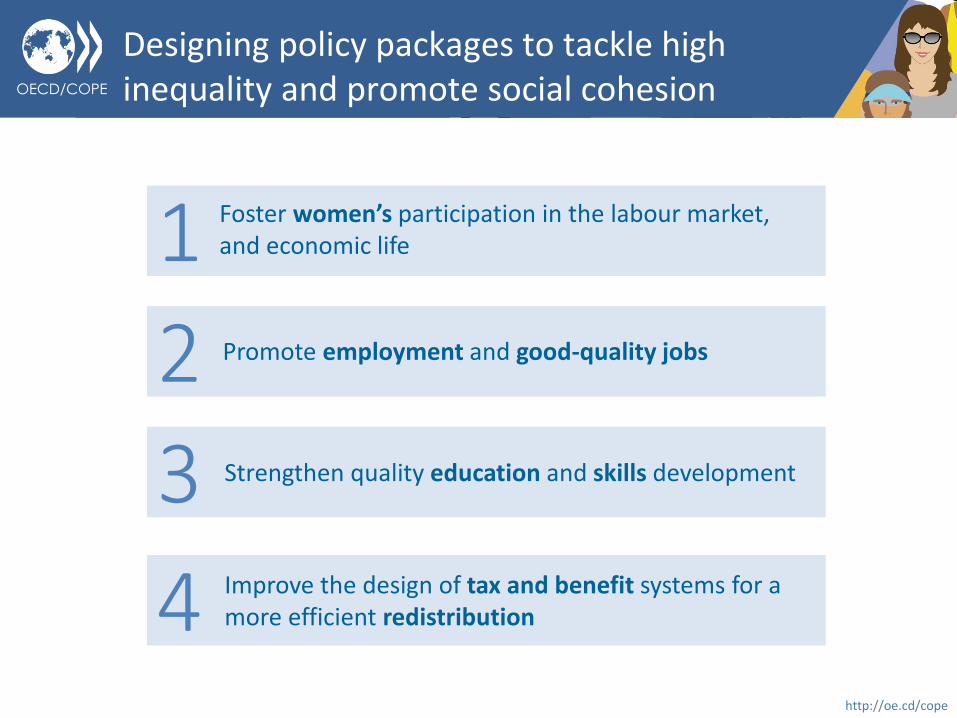
Designing policy packages to tackle high inequality and promote social cohesion
Foster women’s participation in the labour market, and economic life
Strengthen quality education and skills development
Promote employment and good-quality jobs
4 Improve the design of tax and benefit systems for a more efficient redistribution
OECD/COPE
http://oe.cd/cope
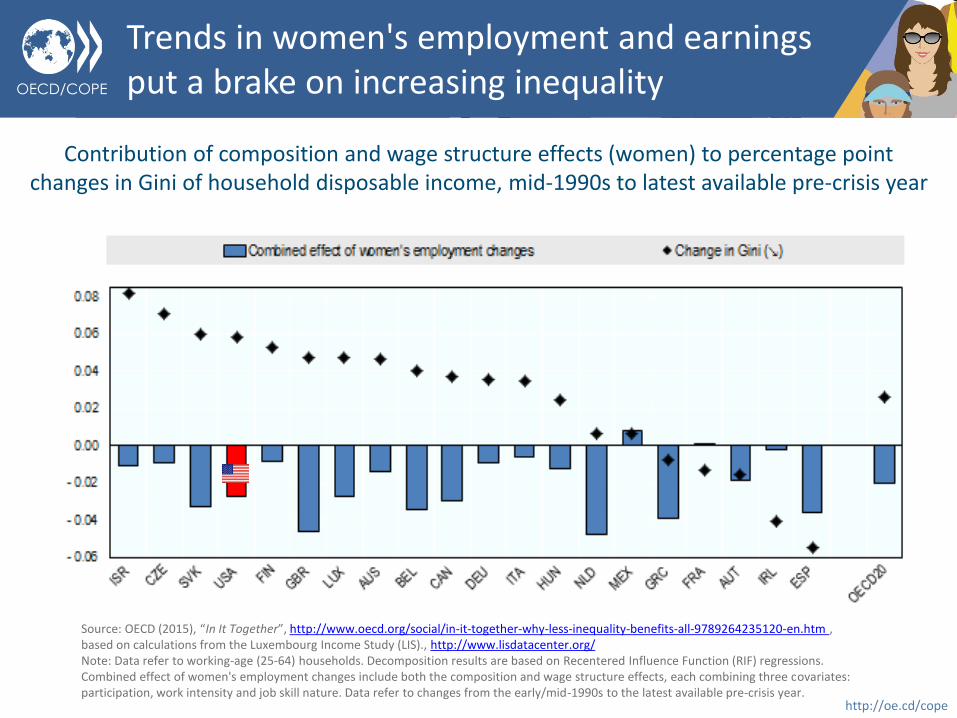
Trends in women's employment and earnings put a brake on increasing inequality
Contribution of composition and wage structure effects (women) to percentage point changes in Gini of household disposable income, mid-1990s to latest available pre-crisis year
Source: OECD (2015), “In It Together”, http://www.oecd.org/social/in-it-together-why-less-inequality-benefits-all-9789264235120-en.htm , based on calculations from the Luxembourg Income Study (LIS)., http://www.lisdatacenter.org/ Note: Data refer to working-age (25-64) households. Decomposition results are based on Recentered Influence Function (RIF) regressions. Combined effect of women's employment changes include both the composition and wage structure effects, each combining three covariates: participation, work intensity and job skill nature. Data refer to changes from the early/mid-1990s to the latest available pre-crisis year.
OECD/COPE
http://oe.cd/cope
Some lessons for employment policies
• Given the heterogeneity of non-standard workers and their households, it seems less promising to target policies specifically at atypical workers but rather
– Design policies that enhance the employability of vulnerable workers who are overrepresented in non-standard work arrangements (e.g. youth; single parents), and
– Target dual-earner policies such as child care provision to vulnerable households
OECD/COPE
http://oe.cd/cope
• Promoting access to education, particularly for the low-skilled.
• Improving job-related training and education (on-the-job training) and access to formal education over their working lives
• Promoting access to other public services, such as high-quality childcare, or health
• Facilitating access to jobs (and career prospects) for under-represented groups (youth, older workers, women and migrants)
Some lessons for education/skills policies
OECD/COPE
http://oe.cd/cope
• Abolishing/scaling back tax deductions and exemptions;
• Taxing fringe benefits, stock options etc. as ordinary income;
• Greater reliance on recurrent taxes on immovable property;
• Reviewing other wealth taxes such as inheritance taxes;
• Harmonising capital and labour income taxation;
• Increasing transparency and international cooperation on tax rules to minimise “treaty shopping” and tax optimisation;
• Reducing avoidance opportunities and thereby the elasticity of taxable income;
• Improving transparency and tax compliance, including efforts for automatic exchange of information between tax authorities.
Some lessons for tax reforms

OECD/COPE
http://oe.cd/cope
2
3
1
Designing policy packages to tackle high inequality and promote social cohesion
Foster women’s participation in the labour market, and economic life
Strengthen quality education and skills development
Promote employment and good-quality jobs
4 Improve the design of tax and benefit systems for a more efficient redistribution
OECD/COPE
http://oe.cd/cope
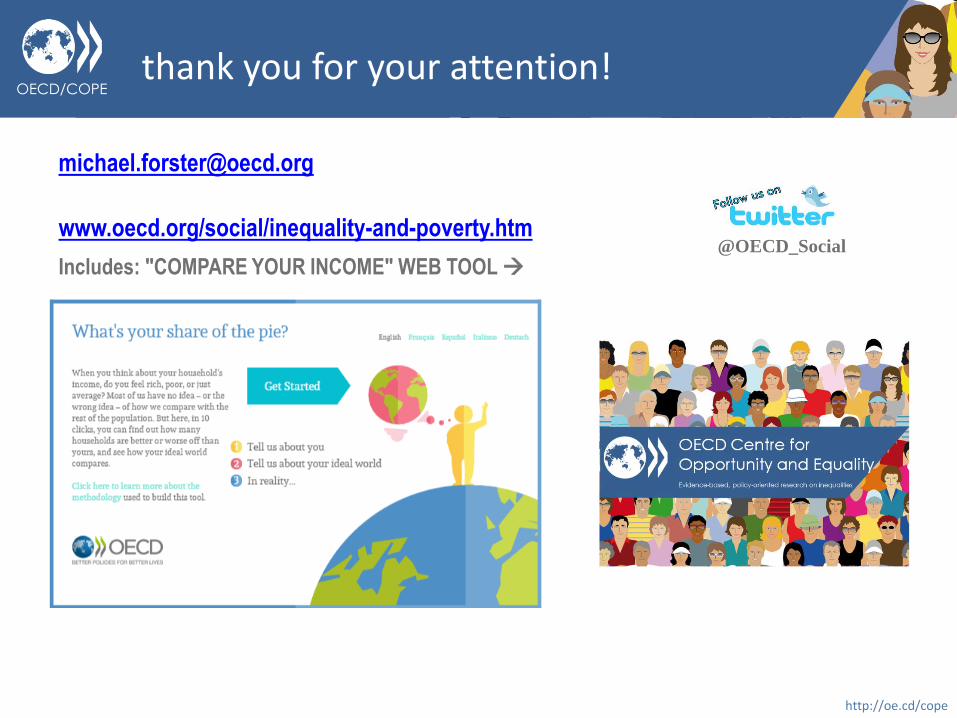
thank you for your attention!
www.oecd.org/social/inequality-and-poverty.htm
Includes: "COMPARE YOUR INCOME" WEB TOOL @OECD_Social