Embed Size (px)
Citation preview

OECD DEVELOPMENT CENTRE
Working Paper No. 242
INSTITUTIONAL CHANGEAND ITS IMPACT ON THE POORAND EXCLUDED: THE INDIAN
DECENTRALISATION EXPERIENCE
by
D. Narayana
Research programme on:Social Institutions and Dialogue
January 2005DEV/DOC(2005)02

Institutional Change and its Impact on the Poor and Excluded: The Indian Decentralisation Experience DEV/DOC(2005)02
© OECD / ILO 2005
2
Copyright © OECD and International Labour Organization 2005 Publications of the International Labour Office enjoy copyright under Protocol 2 of the Universal Copyright Convention. Nevertheless, short excerpts from them may be reproduced without authorization, on condition that the source is indicated.Applications for permission to reproduce or translate all or parts of this publication should be made to: Head of Publications Service, OECD, 2, rue André-Pascal, 75775 Paris Cedex 16, France.
Libraries, institutions and other users registered in the United Kingdom with the Copyright Licensing Agency, 90 TottenhamCourt Road, London W1T 4LP [Fax: (+44) (0)20 7631 5500; email: [email protected]], in the United States with the CopyrightClearance Center, 222 Rosewood Drive, Danvers, MA 01923 [Fax: (+1) (978) 750 4470; email: [email protected]] or in othercountries with associated Reproduction Rights Organizations, may make photocopies in accordance with the licences issued tothem for this purpose.
ISBN 92-2-117206-6 (print) ISBN 92-2-117207-4 (web pdf)
First published 2005
Cover: Institutional Change and its Impact on the Poor and Excluded: The Indian Decentralisation Experience OECD, Paris, 2005 International Labour Office, Geneva, 2005
The designations employed in ILO publications, which are in conformity with United Nations practice, and the presentation ofmaterial therein do not imply the expression of any opinion whatsoever on the part of the International Labour Office or OECDconcerning the legal status of any country, area or territory or of its authorities, or concerning the delimitation of its frontiers.
The responsibility for opinions expressed in signed articles, studies and other contributions rests solely with their authors, andpublication does not constitute an endorsement by the International Labour Office or OECD of the opinions expressed in them.
Reference to names of firms and commercial products and processes does not imply their endorsement by the InternationalLabour Office or OECD, and any failure to mention a particular firm, commercial product or process is not a sign ofdisapproval.
ILO publications can be obtained through major booksellers or ILO local offices in many countries, or direct from ILOPublications, International Labour Office, CH-1211 Geneva 22, Switzerland. Catalogues or lists of new publications are availablefree of charge from the above address, or by email: [email protected]. Visit ILO website: www.ilo.org/publns
Printed by the Organisation for Economic Co-operation and Development, Paris, France, and the International Labour Office, Geneva, Switzerland.

OECD Development Centre Working Paper No. 242 DEV/DOC(2005)02
© OECD / ILO 2005 3
DEVELOPMENT CENTRE WORKING PAPERS
This series of working papers is intended to disseminate the Development Centre’s research findings rapidly among specialists in the field concerned. These papers are generally available in the original English or French, with a summary in the other language.
Comments on this paper would be welcome and should be sent to the OECD Development Centre, 2, rue André Pascal, 75775 PARIS CEDEX 16, France; or to [email protected]. Documents may be downloaded from: http://www.oecd.org/dev/wp or obtained via e-mail ([email protected]).
THE OPINIONS EXPRESSED AND ARG UM ENTS EM PLO YED IN THIS DOCUM ENT ARE THE SOLE RESPONSIBILITY O F THE AUTHOR
AND DO NOT NECESSARILY REFLECT THOSE OF THE O ECD OR O F THE GO VERNM ENTS OF ITS M EM BER COUNTRIES
CENTRE DE DÉVELOPPEMENT DOCUMENTS DE TRAVAIL
Cette série de documents de travail a pour but de diffuser rapidement auprès des spécialistes dans les domaines concernés les résultats des travaux de recherche du Centre de Développement. Ces documents ne sont disponibles que dans leur langue originale, anglais ou français ; un résumé du document est rédigé dans l’autre langue.
Tout commentaire relatif à ce document peut être adressé au Centre de Développement de l’OCDE, 2, rue André Pascal, 75775 PARIS CEDEX 16, France; ou à [email protected]. Les documents peuvent être téléchargés à partir de: http://www.oecd.org/dev/wp ou obtenus via le mél ([email protected]).
LES IDÉES EXPRIM ÉES ET LES ARGUM ENTS AVANCÉS DANS CE DOCUM ENT SONT CEUX DE L’AUTEUR ET NE REFLÈTENT PAS NÉCESSAIREM ENT CEUX DE L’O CDE OU DES GOUVERNEM ENTS DE SES PAYS M EM BRES
Applications for perm ission to reproduce or translate all or part of this m aterial should be m ade to:
Head of Publications Service, OECD 2, rue André-Pascal, 75775 PARIS CEDEX 16, France

Institutional Change and its Impact on the Poor and Excluded: The Indian Decentralisation Experience DEV/DOC(2005)02
© OECD / ILO 2005
4
TABLE OF CONTENTS
ACKNOWLEDGEMENTS.......................................................................................................................... 5
PREFACE ...................................................................................................................................................... 6
RÉSUMÉ........................................................................................................................................................ 7
SUMMARY ................................................................................................................................................... 8
ABBREVIATIONS........................................................................................................................................ 9
I. INTRODUCTION................................................................................................................................... 10
II. PARTICIPATION IN LOCAL GOVERNANCE: A FRAMEWORK .............................................. 19
III. PARTICIPATION BY CITIZENS IN LOCAL GOVERNANCE: EVIDENCE FROM THE STATES......................................................................................................................................... 24
IV. DETERMINANTS OF SUCCESSFUL DEMOCRATIC DECENTRALISATION........................ 32
V. CONCLUSIONS.................................................................................................................................... 43
ANNEX: TABLES....................................................................................................................................... 45
APPENDIX I: SURVEY QUESTIONNAIRE........................................................................................... 57
APPENDIX II: MAPS OF THE SELECTED STATES ............................................................................ 61
BIBLIOGRAPHY........................................................................................................................................ 64
OTHER TITLES IN THE SERIES/ AUTRES TITRES DANS LA SÉRIE.............................................. 66

OECD Development Centre Working Paper No. 242 DEV/DOC(2005)02
© OECD / ILO 2005 5
ACKNOWLEDGEMENTS
I acknowledge my deep sense of gratitude to Johannes Jütting whose keen interest in the subject and encouragement led me to take up this study. The numerous stimulating discussions I had with him and his critical comments on earlier drafts have added value to the study. Elena Corsi did an excellent job in further strengthening the document as well as preparing it for publication. The study has greatly benefited from the inputs of the STEP programme of the International Labour Organization (ILO).
The methodological sections have benefited from the discussions with Chandan Mukherjee.

Institutional Change and its Impact on the Poor and Excluded: The Indian Decentralisation Experience DEV/DOC(2005)02
© OECD / ILO 2005
6
PREFACE
Donors are increasingly concerned at the speed of progress towards achieving the Millennium Development Goals. Consequently, they are looking for ways of strengthening the poverty focus of their international development policies and programmes. In part for this reason, decentralisation -- the transfer of power and responsibility from the central to the local level -- is receiving increasing international attention as a potential anti-poverty weapon. Though decentralisation would not be implemented solely for the direct purpose of poverty alleviation, the ensuing changes in the institutional architecture are very likely to impact on the governance, participation and efficiency of public-service delivery, all of which are important variables for poverty outcomes.
One of the major objectives of the Development Centre’s work on governance is to extend lessons and share experiences in order to improve our understanding of the mechanisms of institutional change, and thus derive maximum benefit from the whole range of available development strategies.
The findings of this case study on the impact of decentralisation on poverty in three Indian States reinforce those of a Development Centre overview paper: the impact of decentralisation on poverty reduction is far from being straightforward (WP 236). It is more often than not dependent on the overall commitment of policy makers to produce results and on the responsiveness and capacity of societies to mobilise themselves for development and poverty reduction. It is thus not surprising that different poverty outcomes in the three Indian States can be attributed to different initial conditions, as well as to different capacities for mobilisation proxied by years of schooling, newspaper readership and participation in self-help groups.
The study confirms that pro-poor decentralisation requires a clear understanding of the key factors influencing the process itself. This particular paper concerns India, but the challenges are the same in any developing-country context where decentralisation is presented and pursued as a policy to facilitate the fight against poverty.
Prof. Louka T. Katseli Director
OECD Development Centre 28 January 2005

OECD Development Centre Working Paper No. 242 DEV/DOC(2005)02
© OECD / ILO 2005 7
RÉSUMÉ
A partir de l’expérience de trois États indiens, ce document étudie l’impact de la décentralisation démocratique sur les chances des groupes exclus de participer aux toutes nouvelles institutions locales de gouvernance – les Panchayati Raj. Cette réforme institutionnelle avait instauré un système de quotas afin de garantir la participation effective des personnes défavorisées – les femmes et les membres des castes inférieures. Une analyse comparée des déterminants de la participation des exclus et des pauvres par rapport aux autres groupes dans ces trois États – le Kerala, le Tamil Nadu et le Madhya Pradesh – parvient à des résultats tout à fait intéressants et pertinents pour d’autres pays. Tout d’abord, les effets de la décentralisation sur la participation ont été différents d’un État à l’autre et entre groupes marginalisés. Si les groupes socialement défavorisés et les pauvres du Kerala sont mieux représentés que les autres au niveau du Panchayat, les premiers parviennent au même niveau de représentation que les autres groupes dans le Tamil Nadu et le Madhya Pradesh, mais les pauvres restent fortement sous-représentés. C’est aussi vrai des femmes et ce, dans les trois États. Par ailleurs, la sensibilisation des groupes grâce à la mobilisation politique semble expliquer l’essentiel de cette différence de résultats entre les trois États. De fait, le Kerala se distingue nettement des deux autres en termes de pouvoir de mobilisation via les partis politiques, de réseaux (plus denses), de groupes d’entraide et de résultats (meilleurs) pour ce qui est de l’éducation de base et de l’alphabétisation. D’où ce constat – le succès des réformes institutionnelles visant à accroître la participation politique dépend de la conception même du processus et des conditions locales. Le transfert effectif de ressources aux Panchayats semble avoir un impact positif sur la participation, tout comme le dynamisme politique de la société – pluripartisme, forte implication de la société civile et réel intérêt pour les médias écrits.

Institutional Change and its Impact on the Poor and Excluded: The Indian Decentralisation Experience DEV/DOC(2005)02
© OECD / ILO 2005
8
SUMMARY
This study analyses the impact of democratic decentralisation on the chances of socially excluded groups to participate in newly created local governance institutions – Panchayati Raj Institutions – in three Indian states. This institutional reform included a quota for the disadvantaged – women and lower castes – to ensure their effective participation. The comparative analysis on the determinants of participation of these groups and the poor vis-à-vis other groups across the states of Kerala, Tamil Nadu and Madhya Pradesh yields highly interesting results, relevant beyond the Indian context. First, the outcomes of decentralisation on participation are different across states and between different marginalised groups. While in Kerala socially disadvantaged groups and the poor are represented more than other groups at the Panchayat level, in Tamil Nadu and Madhya Pradesh the socially disadvantaged groups are as represented as the others whereas the poor continue to be largely under-represented. In all three states, women are under-represented. Secondly, creating awareness through political mobilisation seems to be the driving factor explaining the different outcomes across the three states. In fact, Kerala distinguished itself from the other two states significantly with respect to mobilisation possibilities through political parties, a denser network of self-help groups, better outcomes in basic education and literacy. The conclusion is that the success of institutional reforms aiming to increase political participation depends on the specific design of the process itself as well as on the local conditions. An effective devolution of resources to Panchayats seems to influence participation positively as does a vibrant political society characterised by a broad spectrum of political parties, active civil society and newspaper reading.

OECD Development Centre Working Paper No. 242 DEV/DOC(2005)02
© OECD / ILO 2005 9
ABBREVIATIONS
AMT Anna Marumalarchi Thittam (a scheme to provide convergence of all services and schemes) AP Andhra Pradesh BP Block Panchayat CEO Chief Executive Officer DP District Panchayat DPAP Drought Prone Area Program EAS Employment Assurance Scheme GP Grama Panchayat (local self government institution at the village level); GS Grama Sabha HP Himachal Pradesh IAY Indira Awas Yojana JP Janpad Panchayat (middle tier Panchayat; is called Block Panchayat in Kerala and Panchayat
Union Council in TN) KER Kerala MLA Member of Legislative Assembly MoP Member of Parliament MP Madhya Pradesh OBC Other Backward Castes PMSY Prime Minister’s Sadak Yojana PHC Primary Health Centre PRI Panchayati Raj Institutions (the usual term used for local self-government institutions in India) PS Panchayat Samiti SC Scheduled Caste SHG Self-help Group ST Scheduled Tribe TN Tamil Nadu UNDP United Nations Development Programme WB West Bengal ZP Zilla Parishad (the district level Panchayat)
Institutional Change and its Impact on the Poor and Excluded: The Indian Decentralisation Experience DEV/DOC(2005)02
© OECD / ILO 2005
10
I. INTRODUCTION1
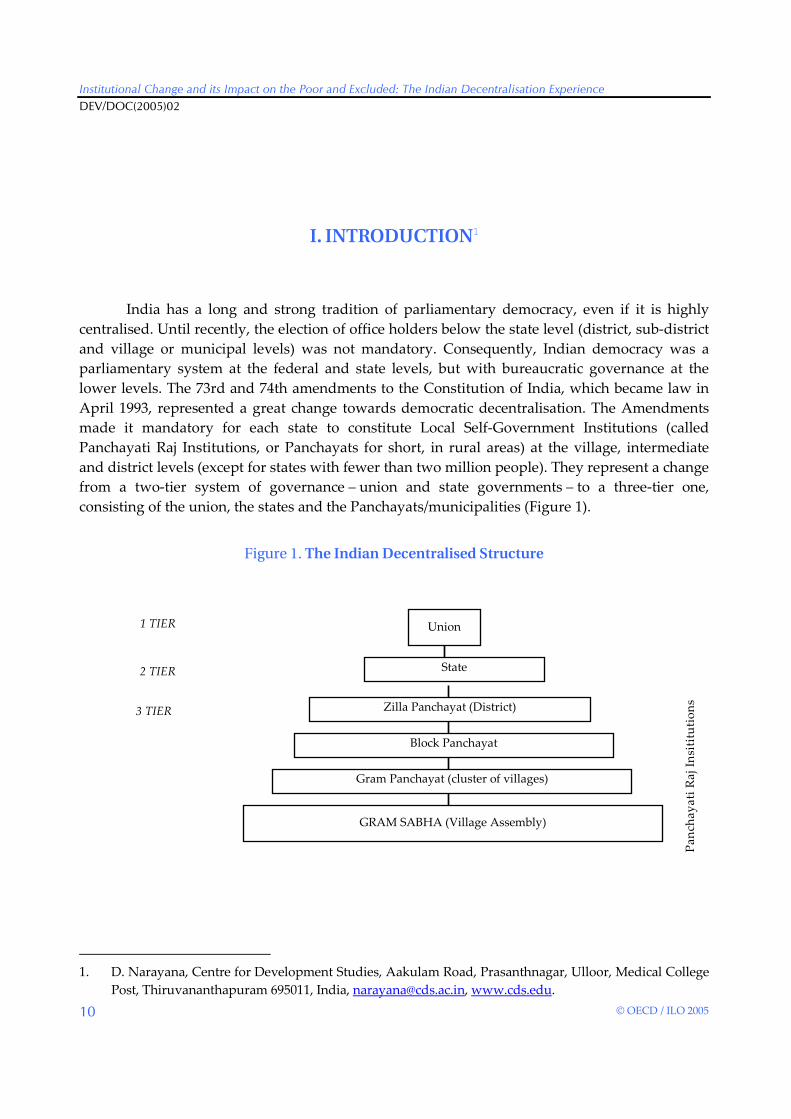
India has a long and strong tradition of parliamentary democracy, even if it is highly centralised. Until recently, the election of office holders below the state level (district, sub-district and village or municipal levels) was not mandatory. Consequently, Indian democracy was a parliamentary system at the federal and state levels, but with bureaucratic governance at the lower levels. The 73rd and 74th amendments to the Constitution of India, which became law in April 1993, represented a great change towards democratic decentralisation. The Amendments made it mandatory for each state to constitute Local Self-Government Institutions (called Panchayati Raj Institutions, or Panchayats for short, in rural areas) at the village, intermediate and district levels (except for states with fewer than two million people). They represent a change from a two-tier system of governance – union and state governments – to a three-tier one, consisting of the union, the states and the Panchayats/municipalities (Figure 1).
Figure 1. The Indian Decentralised Structure
1. D. Narayana, Centre for Development Studies, Aakulam Road, Prasanthnagar, Ulloor, Medical College
Post, Thiruvananthapuram 695011, India, [email protected], www.cds.edu.
Block Panchayat
Gram Panchayat (cluster of villages)
GRAM SABHA (Village Assembly)
Zilla Panchayat (District)3 TIER
Union
State
Panc
haya
ti R
aj In
sitit
utio
ns
1 TIER
2 TIER

OECD Development Centre Working Paper No. 242 DEV/DOC(2005)02
© OECD / ILO 2005 11
The amendments also mark a strong shift from representative to participatory democracy. Of particular importance is the introduction of the Gram Sabha or village assembly, defined by the 73rd Amendment as a body of community of persons registered in the electoral rolls within a village or group of villages. The Gram Sabha was mandated to approve all plans and programmes for social and economic development, audit the Panchayat accounts, and to select beneficiaries for all types of programmes. The provision is likely to restrict misuse of political leadership and bureaucracy and to bring a measure of transparency and accountability in the system. “It is ideally believed that power when used by the many through active participation, deliberation, decision-making and implementation tends to be used or at least attempted to be used for the advantage of the many” (Kothari, 1988, quoted in Nambiar, 2001: 3115).
The participatory character of the amendments can be also found in their effort to assure the participation in decision-making processes of those citizens usually excluded for social, economic or gender reasons. About one-third of the Indian population lives below the official poverty line, with the proportion ranging from under than 10 per cent to close to 50 per cent across states. Furthermore, caste hierarchies are deep-rooted and the castes at the lower end of the hierarchy suffer from social and economic disadvantages2. India also reports very high levels of illiteracy close to 40 per cent in 2001. Improvements in literacy and economic status could not dissolve caste hierarchies and economic inequalities. The amendments recognise social disadvantage and mandate that seats shall be reserved for Scheduled Castes and Tribes, in proportion to their share in the population, at all levels of the Panchayat as well as for the offices of chairperson of these institutions.
The Amendments also recognise the disadvantaged position of women, providing for them a similar treatment as for Scheduled Castes and Tribes3. In India, women are poorly educated and the gender gap in literacy is wide. They suffer discrimination in access to health and other basic services. Their participation in governance is low; for example, over the last 50 years, the representation of women in the lower house of the Parliament at the level of the Union has not exceeded 10 per cent.
I.1. Objectives
The Constitutional Amendments clearly recognise the disadvantaged position of certain groups and have made explicit provisions for their representation in Panchayats. However, does representation lead to participation in political decision-making? There is the famous argument of Myron Weiner that while India’s democracy has proven to be inclusive, by accommodating members of lower and middle castes into the political system, inclusiveness has not always 2. Caste is an endogamous group in the Indian context. “Caste possesses material substance. It exists not
only at the level of action and interaction. Caste, as a material reality, plays an important role in sustaining inequalities and exploitation” (Manor, 1989: 333). The provision of certain privileges to Scheduled Castes and Scheduled Tribes by the Fifth and Sixth schedules of the Indian Constitution represent an important recognition of the social and economic disadvantage of certain castes. Mostly Scheduled Castes are the Untouchable or Harijan Castes.
3. The Amendments reserve to women not less than one-third of the total number of seats filled in by direct election in every Panchayat/Nagar Palika and the offices of chairperson.

Institutional Change and its Impact on the Poor and Excluded: The Indian Decentralisation Experience DEV/DOC(2005)02
© OECD / ILO 2005
12
facilitated the adoption of policies, which benefited large numbers of people from lower and middle castes (Weiner, 2001). Did the situation change with the introduction of Panchayats?
Through the institutionalisation of local governments and the adoption of special provisions for the representation of the disadvantaged, the amendments mark a movement from representative to participatory democracy. However, it would become a truly participatory democracy only when excluded groups actually participate in challenging and counter balancing the decision-makers. Since the amendments have come into force (April 1993), there have been two elections to the Panchayats. As ten years is a reasonably long time for people to perceive the local governments, it is pertinent to ask the following questions:
i) Do women, the socially excluded, like scheduled castes and tribe, and the poor actively participate in the newly elected local institutions?
ii) What are the determinants for their participation?
iii) How can donors best support a pro-poor decentralisation process ensuring the effective participation of socially excluded groups?
The study proposes to address the above issues with regard to the rural local self-government institutions (Panchayats) by adopting a “multiple case – multiple layer” method4. This approach allows accommodating differences between the states selected for this study in terms of population structure, social structure (by caste and economic status), nature and level of economic activity and extent of powers delegated to local governments. In fact, while the Amendments institutionalise local governance, they only provide the enabling framework, leaving the onus of devolution of powers, staff, functions and funds on the states. Thus, Indian local self-government institutions may vary from state to state for their dimensions, functions and structures, offering interesting case studies for comparative research5.
4. A “multiple case-multiple layer” approach provides that the analysis focus on a selected number of
cases to accommodate fewer types of specificities. In each case (states) comparable layers (by sex, caste and economic status) have been chosen so that the comparison across layers and cases allows drawing valid inferences.
5. In Madhya Pradesh the Gram Sabha consists of all eligible voters of a village or group of villages. In Kerala, the villages are very large and often the Gram Panchayats are co-terminus with the villages. The Gram Sabha are constituted at the ward level of the Gram Panchayat so that the number of members is around 1 000 and the spirit of providing an open forum for the voters is fulfilled. The size of the Gram Panchayat Board varies between eight and twenty-five elected members across the states. Tamil Nadu and Kerala report relatively smaller sizes of the Board. In Tamil Nadu and Madhya Pradesh the Board is an executive committee of the Gram Sabha. The Gram Panchayat is the lowest level of the decentralised system of governance and in Madhya Pradesh it works through committees. The Block and the District Panchayat in all the states, except Kerala, include also a Member of the Legislative Assembly and a Member of Parliament. In Kerala, the Block Panchayat and District Panchayat have elected members and the Presidents of the immediately lower-tier Panchayats are ex-officio members. Broadly, the functions of the three tiers of the Panchayats seem similar in the three groups of states but powers and resources devolved to them seem very different.

OECD Development Centre Working Paper No. 242 DEV/DOC(2005)02
© OECD / ILO 2005 13
I.2. What Do We Know about Participation in Local Governance in India?
Democratic decentralisation entails a system of governance in which citizens possess the right to hold local public officials to account using elections, grievance meetings and other democratic means (Blair, 2000). A defining feature of such a system of governance is that decision-makers are under the “effective popular control” (Mayo, 1960: 60) of the people they are meant to govern. As decentralisation is a shift of power from central to local spheres of political life, it empowers new actors and creates conditions for new lines of participation and accountability.
What makes local self-government institutions accountable to the poor? Johnson (2003) defines three conditions under which local institutions can be made more accountable to the poor and marginal groups: i) an active citizenry, whose participation in broad areas of political life serves to counter the arbitrary use of power; ii) fiscal and political support from higher level authorities within the government; and iii) the existence of competitive political parties.
Confining ourselves to the issue of participation of citizenry in broad areas of political life, what do we know of the participation of women, socially disadvantaged and the poor in local governance in India? Unfortunately, our knowledge is very limited. There are only a handful of studies dealing with the subject. One of the early studies on participation, accountability and performance of decentralised governance in Karnataka (Crook and Manor, 1998) did deal with the issue of participation of men and women, disadvantaged castes and others. Crook and Manor found that attendance in Gram Sabha by women was very low and that they seldom contacted councillors and attended non-official meetings. Nonetheless, the difference between men and women in attending official meetings, contacting Mandal (the middle-tier local government in Karnataka) councillors and bureaucrats was not high. Turning to castes differences, members of scheduled castes (22.2 per cent) were nearly as active in associations as were people in other groups (25.3 per cent for the total sample). Attendance in Gram Sabha was 3.8 per cent for Scheduled Castes and 17 per cent for the full sample. Scheduled Castes were more active in petitioning and election campaigning than the others.
Echeverri-Gent’s (1992) study, which takes up the issue of public participation in helping poverty alleviation scheme design and implementation in West Bengal, does not touch the argument of the participation of women, socially disadvantaged or the poor, preferring instead to concentrate upon middle castes, such as Pradhans (presidents of institutions). Nambiar (2001) while affirming the importance of participating in Gram Sabha has no information on differentials in participation of women, socially disadvantaged or the poor, except for a few anecdotes of success stories. In their study on participatory governance in West Bengal, Ghatak and Ghatak (2002) mention that the average attendance in Gram Sansad (village constituency) was low at 12 per cent (10 per cent is the quorum), 91 per cent of whom were men. They, however, highlight the general perception regarding participation in the following words, “…There (West Bengal) a single member constituency has, on an average, less than 700 members. Even though so few people are involved, participation rates are low, especially for women and other minority groups. Those who do not belong to the ruling political party stay away...” (p. 56). Deshpande and Murthy (2002), while analysing participation in Gram Sabha in Karnataka, report that attendance is low, especially for women. They suggest that there is “no easy solution (to improve participation) but the long-term solution lies in making rural masses more conscious

Institutional Change and its Impact on the Poor and Excluded: The Indian Decentralisation Experience DEV/DOC(2005)02
© OECD / ILO 2005
14
and enlightened” (p. 1 766). Behar’s (2003) study of Madhya Pradesh observes that participation is higher after the introduction of Gram Swaraj and especially high in areas with pro-active NGOs. Scarce participation is ascribed to the fact that, owing to the lack of devolution of significant powers, Gram Sabha activities are mainly confined to the approval of beneficiary lists. He also lists the following factors as hindering the process of institutionalising Gram Sabha: i) the absence of effective communication strategies, ii) failure to create an enabling environment, iii) resistance from the bureaucracy, iv) inadequate capacity of Gram Sabha. Mathew and Mathew (2003) discuss participation in Gram Sansad and note that women’s participation is low. They argue that this is mainly a consequence of “lack of awareness of meetings, political minorities feeling that their views are not taken seriously, people from the disadvantaged sections/backward castes feeling that their voices are not heard if the leadership is from the dominant sections, etc.” (p. 48). Overall, it is evident that participation of the disadvantaged is perceived as important for the effective functioning of local governments, but hardly any systematic attempt has been made to collect data on differentials in participation or offer convincing explanations of the observed patterns.
I.3. The Methodology
Following the 73rd Amendment and the enabling state legislations, the Gram Sabha (GS) and the Gram Panchayat (GP) have become the soul of local self-government institutions in rural areas, being the lowest level of Panchayati Raj Institutions directly in contact with citizens. The study focuses on citizens’ participation (considered in its various forms) at the lowest level of Panchayati Raj Institutions, namely Gram Panchayat. As was argued in Section I, the size of Gram Sabha and Gram Panchayat as well as the degree of devolution of powers and resources to the different tiers of Panchayati Raj Institutions vary enormously across Indian states. The study seeks to consider this variation by comparing the different experiences of three states, (Kerala, Tamil Nadu and Madhya Pradesh), representative of distinct size-structure combinations of Panchayati Raj Institutions (see next section).
As the focus is on the impact of institutional change on the disadvantaged, the concern is with the participation in Panchayati Raj institutions of i ) women, ii) Scheduled Castes and Tribes, and iii) the poor, in relation to other groups of the population. The selection of areas and people for data collection was guided by this consideration. In particular, the districts were selected taking care that there were sizeable proportions of Scheduled Castes and Tribes in the total population. From within the districts having such population groups, Gram Panchayats could have been selected in two ways: i) select an adequate sample of Gram Panchayats from widely varying areas, by stratifying the entire area and choosing an adequate number of institutions from each stratum; ii) hold the environment – the higher levels of Panchayat and administrative departments – within which the Gram Panchayats function as given and select a sample of Gram Panchayats. Both methods have their advantages and disadvantages, as argued below.
One of the main problems with method i) above is that of conceiving the activities and behaviour of citizens and elected representatives in their relationship with civil servants and higher-level Panchayats. When a sample of Gram Panchayats is taken from widely varying areas, or various strata, it becomes difficult to control for variations in behaviour of civil servants and

OECD Development Centre Working Paper No. 242 DEV/DOC(2005)02
© OECD / ILO 2005 15
higher-level Panchayats stemming from differences between departments. We often end up drawing inferences on the behaviour of citizens and elected representatives in the face of varying conduct of civil servants and higher level Panchayats. It is difficult to understand to which extent the observed variation in behaviour of citizens and elected representatives stems from variations in-group characteristics or from institutional differences of Panchayats of different districts. One way out is to choose the group of civil servants and higher-level Panchayat and then select a cross section of citizens from within their area of operation.
The advantage with method ii) is that the set of civil servants and higher-level Panchayats, which citizens and elected representatives have to face, is fixed. Therefore, the variation in behaviour of citizens and elected representatives and their ability to deal with and control civil servants can be measured with some definiteness. The criticism against such a method could be that it would often take the form of a study of particular cases. Drawing general inferences and avoiding the specifics of the cases as far as possible could overcome this problem. As the focus of this study is the variation in behaviour of citizens across three categories of disadvantaged in relation to the advantaged, this study has followed method ii). Thus, first, the district and block within a state has been chosen and, then, a sample of citizens has been selected.
A questionnaire was canvassed on the selected citizens of Gram Panchayats (see Appendix I). The purpose of the survey was explained in detail to each person contacted. Oral consent was obtained before presenting the questionnaire. In general, people were willing to answer questions and discuss the Panchayati Raj Institutions, except for some women in Madhya Pradesh. The reason usually advanced was, “what do we know of Panchayats?”, or “the men know it best, ask them”, or “we have never attended a Gram Sabha, why come to us?”, or “we work, we earn, what do we know of state government (shasan) or Panchayat?”. Questions were of different types: some required only yes/no type of answer; others required giving some numbers; yet others were open-ended. Open-ended questions were used to get the perceptions of the people in their own words; this would not foreclose any option.
I.4. The Case Studies
Three states have been selected for this study: Kerala, Tamil Nadu and Madhya Pradesh. These states differ for the degree of devolution of powers and resources to local governments, density of self-help groups and size of local governments (see Figure 2 and Tables A.15, A.16 and A.17 for more details). As it will be argued in the following section, the underlining hypothesis of the research is that these factors are those most likely to influence participation, as past research done on the topic testifies.

Institutional Change and its Impact on the Poor and Excluded: The Indian Decentralisation Experience DEV/DOC(2005)02
© OECD / ILO 2005
16
Figure 2. State Selection
State Density of self -help groups
Decentralised structure of governance Size of local governments
Madhya Pradesh
Negligible 23 departments transferred, but not able to play significant role in the absence of financial devolution; a certain percentage of the state budget devolved; untied fund.
Small Gram Sabha and Gram Panchayat.
Tamil Nadu
High Village Panchayat has been devolved functions; Collector is the gov. inspector and has full control; civil bureaucracy controls the Panchayats.
Large Gram Sabha and moderate Gram Panchayat.
Kerala Moderate Elected local governments control bureaucracy; 40% plan funds devolved; active campaign for Gram Sabha participation.
Moderate Gram Sabha and large Gram Panchayat.
Kerala distinguishes itself from Tamil Nadu and Madhya Pradesh with respect to the decentralisation process by having pursued a more in-depth devolution of powers and resources to the Panchayat level and by promoting this through an active campaign.
One district and one development block (variously called Panchayat Union in Tamil Nadu and Janpad Panchayat in Madhya Pradesh) from each state has been selected. Care has been taken to select blocks with a significant proportion of scheduled castes and tribes. In each block, comparable numbers of Gram Panchayats have been chosen and, wherever relevant, sufficient numbers of wards have been selected to capture the variation within Gram Panchayats. In each Gram Panchayat, the group of citizens has been selected taking care to include men and women, socially disadvantaged as well as rich and poor (Table A.1)6.
In Kerala, the district selected has been Thrissur, with a total population of 2 975 000, and organised in 17 blocks and 98 Gram Panchayats. About 12.37 per cent of the district population is Scheduled Castes and 1.26 per cent is Scheduled Tribes. The block selected (Wadakkancherry) has nine Gram Panchayats with the proportion of Scheduled Castes population in the total varying between 10 and 20 per cent. The population ranged from 16 000 to 28 000 in the three selected Gram Panchayats. Literacy of the population in the district is 92.56-95.47 per cent for male and 89.94 per cent for female – in 2001 (the selected districts are shown in the maps of Appendix II).
Dindigul district in Tamil Nadu has 14 blocks (Panchayat Union) and 306 Gram Panchayats. The block selected (Shanarpatti) has 21 Gram Panchayats with an average population of about 5 000 persons per Gram Panchayat, the population varying from 2 200 to 10 000. The share of Scheduled Castes in the total population in the district is 19.41 per cent and in the selected Gram Panchayats ranges from 2 to 47 per cent. Literacy of the population was 69.83-80.29 per cent for male and 59.30 per cent for female in 2001.
6. The convention followed throughout the study is to indicate Tables in the annex as Table A.* and
Tables in the text as Table *.

OECD Development Centre Working Paper No. 242 DEV/DOC(2005)02
© OECD / ILO 2005 17
Mandla district in Madhya Pradesh has nine blocks (Janpad Panchayat) and 472 Gram Panchayats covering 1 214 villages for a total population of 894 000 in 2001. The block selected, Mawai, has 143 villages, distributed over 49 Gram Panchayats, of which only seven have a population of over 1 000 per village. With an average population of less than 500 per village, the population per Gram Panchayat is less than 1 500. The district is largely rural with 90 per cent of the total population residing in villages. It is a tribal district with Scheduled Tribes and Castes accounting for 58 per cent and 5 per cent respectively of the total population and reporting a level of literacy of 60.77-76.71 per cent for male and 45.39 per cent for female in 2001.
I.5. The Categories Used in the Study
The analysis of the participation of the disadvantaged, by its very nature, requires a comparative setting in the sense that measures of their participation needs to be in relation to those of the advantaged. The first step in this exercise is to identify the disadvantaged. Often, socially disadvantaged in India are identified by their caste. In general, Scheduled Castes and Tribes are disadvantaged compared to other castes. Economically disadvantaged are taken as the poor and the gender disadvantaged as the female. None of the above categories, except the last, is easy to identify in a given setting. For example, Scheduled Castes and Tribes versus the rest may not be the right classification if there is a large proportion of Other Backward Castes7 whose condition is not so different from the one of Scheduled Castes (as in Kerala). 0therwise the population concerned has only Scheduled Tribes and Other Backward Castes (e.g. Madhya Pradesh) or only Scheduled Castes and Other Backward ones (e.g. Tamil Nadu). Therefore, data for each of these groups has been collected and reported. Across states, in order to capture differences in participation between advantaged and disadvantaged castes, the group of reference changes, depending on the specific social composition of the district. Thus while in Kerala the focus is on Scheduled Castes (the disadvantaged) and forward castes or Other Backward Castes (the reference groups), in the other two cases, the disadvantaged group is Scheduled Castes (in Tamil Nadu) or Scheduled Tribes (in Madhya Pradesh) while the reference group is only Other Backward Castes for both.
Similarly, identifying the economically disadvantaged may not be an easy task in a country where getting information on income is difficult and a large proportion of citizens are engaged in self-employment. The type of material used for building the roofs of the houses has been taken as an indicator of the economic status in Kerala and Tamil Nadu. Thus, people living in houses with roofs in cement concrete (terrace) are considered rich, those with roofs in tile, middle income and, those in thatch, poor. In Madhya Pradesh, since all houses have roofs in tiles, housing type cannot be a good discriminating variable for economic status. Consequently, another measure, based on landholding, has been chosen here: people who own above 500 cents of land are rich (terrace), between 100 and 500 middle income (tile) and less than 100 poor (thatch). The same measure is used for income disparities in Kerala, where housing type, landholding and economic status usually correspond.
7. Other Backward Castes (OBC) are those castes which have received unequal treatment (with particular
emphasis on social and educational backwardness) and have been officially identified as backward by the respective state governments. Yet, the Indian Constitution reserves no seats for these castes.

Institutional Change and its Impact on the Poor and Excluded: The Indian Decentralisation Experience DEV/DOC(2005)02
© OECD / ILO 2005
18
The study is organised into five sections. Following this introduction, Section II discusses the factors influencing participation, analysing the literature on the subject and elaborates the research framework. Section III presents the results on the impact of the Indian institutional reform on the participation to governance of citizens grouped by sex, caste and economic status. Section IV attempts a modest explanation of the variations in participation while Section V concludes, with some recommendations.

OECD Development Centre Working Paper No. 242 DEV/DOC(2005)02
© OECD / ILO 2005 19
II. PARTICIPATION IN LOCAL GOVERNANCE: A FRAMEWORK
II.1. Explaining Participation
The research focuses on citizens’ participation in elections, campaigning activities, committees and Gram Sabha, as well as their involvement in raising issues in Gram Sabha, in signing petitions and contacting elected representatives and higher level Panchayats. The factors often mentioned as influencing citizens’ participation in governance, are: awareness, social capital or political society, power relations and structure of governance. These factors will constitute the framework of this analysis and they will be described in more detail in the next subsections.
II.2. Awareness
Lack of awareness is often highlighted as one of the reasons for poor participation of citizens in governance. Referring to the inability of Panchayati Raj institutions to perform their role as an effective grassroots participative mechanism, Deshpande and Murthy (2002) hold that “There are no easy solutions, but the long-term solution lies in making rural masses more conscious and enlightened which would ensure their active participation in the development process” (p. 1766). Behar (2003) considers the absence of effective communication strategies and the lack of awareness of Gram Swaraj as the factors hindering the process of institutionalisation of Gram Swaraj in Madhya Pradesh. Many of the failures at grassroots level resulted from information bottlenecks (Williams et al., 2003). Behar and Kumar (2002), while discussing the poor performance of Gram Sabha in Madhya Pradesh argue that “Low participation can be mainly attributed to the strong caste, class and gender divide in villages. On the basic question dealing with the awareness of villagers regarding the existence, functions and rights of Gram Sabha, a very high majority of people seemed completely ignorant” (pp. 36-7). Thus, lack of awareness could be a serious problem for participation and effective governance. That is why the attempt in Kerala at raising people’s participation through the People’s Planning Campaign is considered exceptional8.
8. The “People’s Planning” campaign launched in August 1996 by the government of Kerala was aimed at
empowering local self-governments through devolving resources and powers at the local level and increasing the participation of citizens to local governance. “Vital to the success of the programme was the generation of a new democratic civic culture. Thus, the process of decentralisation ceased to be merely an issue of administrative reforms but became an object of mass mobilisation and popular politics” (Isaac and Franke, 2000: xi).

Institutional Change and its Impact on the Poor and Excluded: The Indian Decentralisation Experience DEV/DOC(2005)02
© OECD / ILO 2005
20
Literacy, newspaper reading and participation in self-help groups and political party meetings might raise awareness and help improve participation in local governance. Especially, it may be argued that regular meetings of self-help groups and political parties where Panchayati Raj Institutions are discussed and could be of great help in improving awareness and participation. Following these arguments, if there are significant differences in literacy, newspaper readership and membership in self-help groups and political parties across population groups, then it should be found that participation in local governance differs to that extent.
II.3. Social Capital or Political Society behind Effective Participation?
Two rather distinct positions may be discerned as regards the role of social capital in the effective functioning of public institutions. One of the positions is that popularised by Putnam and actively propounded by the World Bank. Referring to the recent work on social capital, Majumdar says, “The central premise of this rapidly growing body of work is that social interactions and civic engagements in collective causes have pervasive influence on our public life; a vibrant civic life in a robust civil society is considered to be a precondition for effective participation in communal life and correspondingly for the proper functioning of public institutions” (Majumdar, 2000: 3). The main argument advanced by these theorists is that networks within and between groups of people (social capital) make for trust and co-operation, stimulating the participation of citizens in associations, which, from their part, expand trust and co-operation through society as well as increasing civic engagement and good governance. Going on this line of thought, the emergence of social networks and organisations (which should be apolitical) is crucial for participation in Panchayats. In the Indian context, especially significant should have been the birth, in the 1990s, of a large number of self-help groups of women. Following the theory of social capital, it should have increased participation in governance.
However, social capital hides also a dark side. Union or State governments might use social capital to actually scuttle the decentralisation process, as has recently happened in Andhra Pradesh: “…the AP government has been associated with a system of governance that has undermined the Panchayats in favour of line departments and ‘parallel bodies’ such as water user groups, joint forest management committees, self-help groups and the like” (Johnson, 2003: 38). Furthermore, the existence of a strong network amongst a particular group of people can be a very important resource for them but it might entail social exclusion for the non members (Harris, 2001).
Those who contest the social capital theory challenge the dominant view that “poorer people needed to build support networks in their communities in order to access the market and to defend themselves against predatory forms of rule”. The alternative suggested is that, “... in a democracy such as India it is likely that the workings of a participatory development scheme will be shaped more by existing political networks than it will by village based stocks of social capital”(Veron et al., 2003: 3). These authors highlight the importance of political society: “the political institutions and actors that mediate between higher level governments’ authorities and the population”. Political parties and their operatives are considered as part of the political
OECD Development Centre Working Paper No. 242 DEV/DOC(2005)02
© OECD / ILO 2005 21
society as also local political brokers and councillors, even if not affiliated to a political party (Veron et al., 2003). In this alternative view, it is the working of the political society that raises the capacity of the poor in their fight against poverty and exclusion and increases their political participation9.
A related strand of thought highlights how the concept of “civil society”, as it is used in the contemporary discourse on development, excludes “political society”. Political organisations (such as political parties or trade unions) cannot be considered “voluntary local associations” and thus linked to social capital. Yet there is increasing evidence that NGOs and grass-roots organisations (i.e. civil society) do not perform as effectively as it has been assumed in terms of poverty-reach, cost-effectiveness, sustainability, popular participation (including gender), flexibility and innovation. The relevance of social capital cannot be fully assessed unless one considers the power relations that mediate social interactions (Harris, 2001: 111). Thus, one needs to consider the alternative strands of thought in any assessment on the role of social networks in raising participation.
II.4. Power Relations and “Elite Capture”
A theme that has wide currency since the Asoka Mehta Committee of 1978 is the notion that decentralisation creates new opportunities for local dominant groups – organised around caste, gender, economic status, etc. – to “capture” power. Recently, Mitra (2001) formulated this aspect in terms of social closure – keeping those not born to power and privilege from entering leadership. He has come up with a four-fold typology of local leadership combining social closure and awareness of the given set of leaders of local democracy. This is no doubt a useful analytical tool but calls for a detailed study of the local society to identify the types.
The reservation of seats ensures that the excluded get representation in Panchayati Raj Institutions. Yet, this in itself does not ensure that the poor would be able to participate in local governance or would find a voice in the proceedings of Panchayati Raj Institutions, especially if socially and gender disadvantaged are also economically disadvantaged. Often literacy, educational achievements and participation in political forums are tied to economic status and power. In this case the poor and the generally disadvantaged will hardly have a voice in the decision-making process.
II.5. Structure of Governance
As it has been argued, while the Constitutional amendments institutionalise local governments, they leave the onus of devolution of powers, staff, functions and funds on the states. As a consequence, each state has found its own way of meeting the requirements of these amendments (Vyasulu, 2003: 8) and very different structures of Panchayats have come into being. The range varies from multiple levels of government, each with directly elected representatives and presidents with no cross representation at any level, to hierarchical structures with each higher level supervising or monitoring the immediately lower level. An
9. See also Chatterjee (1998; 2001), Williams et al. (2003).

Institutional Change and its Impact on the Poor and Excluded: The Indian Decentralisation Experience DEV/DOC(2005)02
© OECD / ILO 2005
22
inter-medium structure might be considered local governments in which representatives are directly elected, while presidents indirectly.
The 73rd Amendment defined the constitution of Gram Sabha but left to the discretion of State legislatures the delegation of powers and functions. Ideally, local governments should have received a wide range of functions which, for reasons of clarity, can be grouped under three heads: i) conventional civic functions, ii) provision of public services and iii) planning and implementation. The first group includes functions such as maintenance of roads and buildings, sanitation, maintenance of public wells and sources of water, lighting of village streets, prevention of contagious diseases, general administration and public assistance. The second might consist of public services provision (such as health and education) and the support of services related to agriculture and industry. The third group comprises functions such as the preparation of plans for economic development and the implementation of programmes and schemes.
Indian states have devolved widely varying functions, with some delegating all three groups of functions, thus empowering local governments, and others only selected functions under group iii) or i), thus treating local governments as simple agents of central institutions. It is mainly the devolution of functions under groups ii) and iii) which is discriminating in terms of real delegation of powers and recognition of local autonomy. Devolving local planning or the design of poverty alleviation programmes increases the power, and thus the activities of local governments, in contrast to when local governments are in charge of the mere implementation of centrally designed programmes. More action (stemming from more powers) brings to greater participation. Thus, what functions are devolved might greatly influence participation in governance. Furthermore, it might be assumed that the dimension of local governments might as well have an influence over the participation of women, the socially excluded and the poor. Smaller assemblies (of 10 or 15 members) might stimulate the participation of the disadvantaged. While smaller Gram Sabha will be more suitable for higher participation, larger Gram Sabha and especially larger Gram Panchayat will be administratively and financially viable.
Finally the size as well as the structure of local governments can influence their capacity to control public institutions such as Primary Health Centres or schools. As an example, if a particular Primary Health Centre, under the administrative control of a specific Gram Panchayat lacks a certain facility or provides poor services, local authorities can intervene to solve the problem. If ten Gram Panchayats share the same Primary Health Centre, then no single Gram Panchayat exercises control over it and hence no direct action can be taken (see Table A.17 for a description of the situation in Indian states).
In sum, any study of participation in governance of women, the socially excluded and the poor needs to have a broad frame in terms of the factors influencing it. This section has provided an outline of the factors and their relevance in the Indian context. Four sets of factors have been identified: awareness, social capital or political society “elite capture” and structure of governance. In this study educational attainment, newspaper reading, and participation in self-help groups and political parties’ meetings are taken as indicative of awareness; membership of self-help groups, their structure and frequency of their meetings are used as measures of social capital and the vibrancy of civil society. Membership of political parties and the political

OECD Development Centre Working Paper No. 242 DEV/DOC(2005)02
© OECD / ILO 2005 23
character of self-help groups (if they discuss local institutions and policies) are taken as indicators of the vibrancy of political society. Elite here is taken to be economically well off. Thus it is measured looking at the level of participation of the rich in political parties and the economic status of the members of local governments. The influence of the structure of governance is analysed by looking at the devolution of powers to the Gram Panchayat and Gram Sabha and the dimensions of local government. As our concern is the differential in participation of gender, socially and economically disadvantaged groups of citizens in relation to the others, these factors need to be taken in a differential sense to explain the disparities in participation.

Institutional Change and its Impact on the Poor and Excluded: The Indian Decentralisation Experience DEV/DOC(2005)02
© OECD / ILO 2005
24
III. PARTICIPATION BY CITIZENS IN LOCAL GOVERNANCE: EVIDENCE FROM THE STATES
III.1. Participation in Voting, Election Meetings, Campaigning and Contesting Elections
Almost all the citizens contacted responded positively to the question, “did you vote in the last Panchayat election” (Table A.6). Across categories of population groups, the differences were insignificant, but for three exceptions. In Kerala, the percentage of the population voting among the forward caste was 10 per cent points lower than that for Other Backward Castes and Scheduled Castes (Table A.6). In Tamil Nadu, the percentage voting among women and poor was almost 20 per cent points lower compared to men and rich respectively. Overall, the forward caste in Kerala and the poor and women in Tamil Nadu do not seem to be participating in Panchayat elections compared to, in Kerala, Other Backward Castes and Scheduled Castes and, in Tamil Nadu, men and the economically well.
Table 1. Participation in Elections by Groups and States
% Attending Election Meetings % Contesting Elections
Tamil Nadu Kerala MP Tamil Nadu Kerala MP
Women/Men <* <* <* <* <* <* Low Caste/Higher Caste NS >* NS NS NS NS Poor/Rich <* >* NS <* NS NS
Note: Tables 1 to 4 present the statistical significance of the differences in participation of the disadvantaged compared to the advantaged groups. * stands for statistically significant (at least 10%) and NS for not significant. “<“ means lower participation of the group considered (women, low caste, poor) if compared to the respective advantaged group and “>“ higher participation. For the comparisons between castes, the reference group is Other Backward Castes and forward caste in Kerala, Other Backward Castes in Tamil Nadu (where the low caste is Scheduled Caste) and Madhya Pradesh (Scheduled Tribe). The information is taken from the annex Tables. MP stands for Madhya Pradesh.
While attendance in election meetings was low in all the three states, in Madhya Pradesh it was at the lowest level (Table A.6). One common trend observed in all the three states was the significantly lower attendance by women in election meetings (Table 1). Participation by forward castes in election meetings in Kerala was lower than the participation of Other Backward Castes and Scheduled Castes. As regards participation by the poor, Tamil Nadu and Kerala provide contrasting pictures. While in Tamil Nadu participation by the poor was significantly lower than that by the rich, in Kerala participation by the poor was the highest. The pattern with regard to campaigning for election candidates was exactly similar to that of attending election meetings

OECD Development Centre Working Paper No. 242 DEV/DOC(2005)02
© OECD / ILO 2005 25
(Table A.6). In all the three states women were almost absent in campaigning and in Kerala, forward castes and the rich showed relatively less interest. The percentage of women who have contested Panchayat elections was very low in all the three states and was significantly lower than that of men (Table A.6). Nevertheless, there was no striking difference among caste groups. Among economic groups, a significantly lower percentage of poor had contested elections in Tamil Nadu.
III.2. Participation in Village Assembly (Gram Sabha)
Two types of questions regarding attendance in Gram Sabha have been addressed: “Did you attend any Gram Sabha during the last five years?” and “Did you attend the last Gram Sabha?” The answers to these questions clearly suggested that attendance in Gram Sabha was on the decline in both Kerala and Madhya Pradesh10 (Table A.7). The attendance reported for the last Gram Sabha suggests that probably the quorum was not met11. Looking at gender differentials in attendance, in Kerala, no significant difference in attendance could be observed between men and women, but the difference was significant in Madhya Pradesh. Here in fact, no more than 40 per cent of the women have attended a Gram Sabha during the last five years. Attendance in the last Gram Sabha was just 7.5 per cent. In one of the Gram Sabha, there were no more than 50 members present (in a Gram Panchayat with over 1 000 voters) between whom just five were women. The Gram Panchayat counts seven women as members (in a total of 20) and not all of them were present to the meeting.
Looking at the attendance of lower castes and the poor, in Kerala, attendance showed significant variations across castes and economic groups and such differences have persisted through all the five years, up to the last Gram Sabha. Attendance was generally lower among forward castes and the rich; attendance by Scheduled Castes and the poor was significantly higher (Table 2). In Madhya Pradesh, no significant difference could be observed between Scheduled Tribes and Other Backward Castes and between small and large landowners. The question, “have you ever signed the attendance register without attending the meeting”, received a negative answer by all the voters contacted in the three states. This opens the question as to how the quorum was obtained for the meetings.
10. Owing to a small technical mix up, it was not possible to collect the responses of the citizens of Tamil
Nadu. 11. This is the reason why, for this study, we decided against copying the attendance (percentage) in Gram
Sabha meetings from the attendance register maintained in the Gram Panchayat. The elected members and Presidents know that a meeting without the requisite quorum is invalid and, obviously, they affix signatures to get over this problem.

Institutional Change and its Impact on the Poor and Excluded: The Indian Decentralisation Experience DEV/DOC(2005)02
© OECD / ILO 2005
26
Table 2. Participation in Gram Sabha
% Attending Gram Sabha (GS) % Able to Raise Issues
Tamil Nadu Kerala MP Tamil Nadu Kerala MP
Women/Men NS <* NS <* NS Low /High Caste >* NS NS >* NS Poor/Rich >* NS NS >* NS
Note: * stands for statistically significant (at least 10%) and NS for not significant. “<“ means lower participation of the group considered (women, low caste, poor) if compared to the respective advantaged group and “>“ higher participation. For the comparisons between castes, the reference group is Other Backward Castes and forward caste in Kerala, Other Backward Castes in Tamil Nadu (where the low caste is Scheduled Caste) and Madhya Pradesh (Scheduled Tribe). The information is taken from the Annex Tables. MP stands for Madhya Pradesh. A blanc space means no information was available.
To the members of the Gram Sabha who attended the meetings it was asked if they had been able to raise issues in these occasions. The difference between men and women in their ability to raise issues was not significant in Tamil Nadu and Madhya Pradesh, but was significantly lower among women in Kerala. In Kerala, the differences were significant also among castes and between rich and poor. However, the percentages of Scheduled Castes and the poor able to raise issues in the meetings were significantly higher than those of the forward castes and the rich. In Tamil Nadu, a fairly high percentage of members answered positively and there was no significant difference in answers between castes or between rich and poor (Table 2). In Madhya Pradesh, the number of positive answers was much lower and especially low among the poor.
The next two questions were, “Did you raise issues of concern to women, scheduled castes and tribes and to the poor?” and “did you raise issues related to health/education?”. The differences between men and women in raising issues of concern to disadvantaged groups and on access to health and education are significant in Kerala but not in Tamil Nadu or Madhya Pradesh. Differences between castes groups were significant in Tamil Nadu and Kerala with regard to the first question and in Kerala also with regard to the second question (Table A.7). A significantly higher percentage of Scheduled Castes raised issues of concern to the poor in Gram Sabha compared to Other Backward Castes in Kerala and Tamil Nadu. In Kerala, such difference could be observed with regard to issues related to access to education and health. No such differences could be observed in Madhya Pradesh, largely because the absolute numbers turned out to be very small, owing to a very low percentage of people attending Gram Sabha and a still lower percentage able to raise issues in the meetings.
The differences across economic groups in the proportion of members raising issues of concern to women, Scheduled Castes and Tribes and poor are not significant in Tamil Nadu and Madhya Pradesh but are significant in Kerala. In Kerala, a larger proportion of poor raises issues of concern to the disadvantaged groups. As regards raising issues of access to health and education, there are no significant differences across economic groups in Tamil Nadu and Kerala, but in Madhya Pradesh, a significantly higher proportion of rich raises such issues in the meetings.

OECD Development Centre Working Paper No. 242 DEV/DOC(2005)02
© OECD / ILO 2005 27
III.3. Participation in Signing Petitions and Organising Meetings
The proportion of members signing petitions and organising meetings is high in Kerala (over 40 per cent) and is extremely low in Madhya Pradesh (less than 5 per cent) with Tamil Nadu reporting a figure closer to that of Kerala (about one-third, Table A.8). The difference between men and women is significant in Tamil Nadu but not in Madhya Pradesh and Kerala. The differences between castes are not significant in Tamil Nadu and Madhya Pradesh but are significant in Kerala (Table 3). In Kerala, forward castes do not show much interest in petitions and Scheduled Castes and Other Backward Castes sign more petitions. Among economic groups, the differences are significant in Kerala and Tamil Nadu. While in Tamil Nadu, almost 50 per cent of the rich and less than 25 per cent of the poor signed petitions, in Kerala, the orders are just reversed with close to 50 per cent of the poor and about 25 per cent of the rich signing petitions. The proportion of members reporting having organised meetings, participated in protests and refusing to co-operate with the Panchayat are extremely low in Tamil Nadu and Madhya Pradesh. In Kerala, the differences are insignificant between caste groups and between rich and poor, but more men participated in organising meetings compared to women.
Table 3. Participation in Signing Petitions
% Participating in Signing Petitions % Organising Meetings
Tamil Nadu Kerala MP Tamil Nadu Kerala MP
Women/Men <* NS NS - <* - Low Caste/High Caste NS >* - - NS - Poor/Rich <* >* - - NS -
Note: * stands for statistically significant (at least 10%) and NS for not significant. “<“ means lower participation of the group considered (women, low caste, poor) if compared to the respective advantaged group and “>“ higher participation. For the comparisons between castes, the reference group is Other Backward Castes and forward caste in Kerala, Other Backward Castes in Tamil Nadu (where the low caste is Scheduled Caste) and Madhya Pradesh (Scheduled Tribe). The information is taken from the annex Tables. MP stands for Madhya Pradesh. – signifies no difference.
III.4. Contacting Elected Representatives
Contacting the elected ward member or president of the Gram Panchayat for a problem affecting the local area/people has become common, with about 35 to 50 per cent of the people in the three states (Table A.9). The differences in the proportion of citizens contacting ward members/presidents are quite significant between men and women in all the three states (Table 4). The differences are 10 per cent points in Kerala, 20 per cent points in Tamil Nadu, and over 25 per cent points in Madhya Pradesh. The difference between Scheduled Tribes and Other Backward Castes is very high also in Madhya Pradesh, with about 50 per cent of Other Backward Castes contacting a ward member or president; the proportion for Scheduled Tribes being half that percentage (26.5 per cent). The differences are not significant across caste groups in Kerala and Tamil Nadu. Among economic groups, the differences are significant only in Kerala, with about one-in-four among the rich and above 50 per cent among the poor contacting a ward member/president for a local problem. Thus, not only do the rich in Kerala not participate in election meetings and campaigning but they have no contact with the ward member/president.

Institutional Change and its Impact on the Poor and Excluded: The Indian Decentralisation Experience DEV/DOC(2005)02
© OECD / ILO 2005
28
Table 4. Contacting Elected Representatives
% Contacting Elected Representatives % Contacting Higher Panchayats
Tamil Nadu Kerala MP Tamil Nadu Kerala MP
Women <* <* <* <* NS NS Low Caste/High Caste NS NS <* NS NS NS Poor/Rich NS >* NS NS >* NS
Note: * stands for statistically significant (at least 10%) and NS for not significant. “<“ means lower participation of the group considered (women, low caste, poor) if compared to the respective advantaged group and “>“ higher participation. For the comparisons between castes, the reference group is Other Backward Castes and forward caste in Kerala, Other Backward Castes in Tamil Nadu (where the low caste is Scheduled Caste) and Madhya Pradesh (Scheduled Tribe). The information is taken from the Annex Tables. MP stands for Madhya Pradesh.
Between 60 and 75 per cent of the voters who contacted a ward member/president reported that they found the person helpful with hardly any difference between sexes and across castes or economic groups. The only exception was Kerala, where only 60 per cent of the women who contacted a ward member or president said that they found the person helpful, a share which was lower than that of men reporting helpful behaviour from the elected representatives.
Contacting higher-level Panchayat members – Block or Zilla Panchayat – is not as common as contacting Gram Panchayat members. The percentage of people contacting the latter varied between 2 per cent in Madhya Pradesh and around 20 per cent in Kerala and Tamil Nadu. The differences in proportions contacting higher level Panchayat between sexes and among castes and economic groups are not significant in any of the states, except between sexes in Tamil Nadu and among economic groups in Kerala. In Tamil Nadu, while only 10 per cent of the women contacted the Block or Zilla Panchayat, the proportion of men was over double that figure (Table 4). In Kerala, almost 45 per cent of the poor had approached the Block or Zilla Panchayat with a problem, compared to less than 20 per cent for the other groups.
Visiting the Gram Panchayat office was fairly common among people in Kerala, with about 50 per cent reporting at least a visit during the previous year. On the contrary, in Madhya Pradesh citizens hardly knew about its existence (in part because frequently Gram Panchayats had no offices), while in Tamil Nadu only around 15 per cent (Table A.9) of the citizens interviewed visited the Gram Panchayat office. In Kerala and Tamil Nadu, the differences between the proportion of men and women visiting Panchayat office were significant. In both the states, the share is higher by about 15 percentage points for men. No such difference in the proportions of people visiting Panchayat office could be observed across castes or economic groups in the three states, except between Other Backward Castes and Scheduled Castes in Tamil Nadu. In Tamil Nadu, while almost a quarter of members of Scheduled Castes visited the office during the previous year, the percentage was less than ten for Other Backward Castes.

OECD Development Centre Working Paper No. 242 DEV/DOC(2005)02
© OECD / ILO 2005 29
III.5. Purpose of Contacting Ward Member/President
The purposes of contacting these authorities may be grouped under three heads of activities of the Panchayat (Section II): civic functions, public services and development functions. In Tamil Nadu, over 85 per cent of the people contacted elected ward members and Panchayat presidents for addressing problems of civic functions in the local area, such as drainage, water supply, street lights, roads and so on (Table A.10). The rest of the contacts were for demanding employment training, developing the village pond, complaining against favours shown in laying roads in some regions neglecting others and other problems of diverse nature.
In Madhya Pradesh, between one-third and two-thirds of the total number of contacts with the Gram Panchayat was for obtaining caste certificates among the different economic groups and another 10 to 33 per cent for obtaining housing assistance; only between 16.7 and 36.3 per cent of the contacts were for addressing issues regarding civic functions. The variation in purpose of contacting among the economic groups was large, with a higher proportion of the poor contacting for housing assistance and a higher proportion of the rich mainly for caste certificate or related requests. As it is evident, a large share of these contacts was for personal matters rather than civic functions.
In Kerala, citizens contacted public authorities for a more diverse set of purposes. Just about 50 per cent of the contacts were done by the rich (i.e. those owning terrace houses) and the moderately rich (tiled houses), but only about 11 per cent of those done by the poor were on account of civic functions. Close to 80 per cent of the poor and about 30 per cent of the moderately rich and 18 per cent of the rich contacted the Gram Panchayat for obtaining assistance to build houses and latrines. The rest – between 11 and 32 per cent – contacted members and presidents for various purposes, such as assistance for daughter’s marriage and solving personal disputes. Overall, the poor contacted public authorities mainly for personal matters and the rest of the population for civic functions.
As it may be seen, the contrast among states is rather striking as regards the purpose of contact of the citizens. While the focus is almost entirely on civic functions in Tamil Nadu, civic functions and personal matters form the bulk in Kerala and personal matters dominated in Madhya Pradesh. The purpose of contact is a clear manifestation of the perception of the role of the Panchayat by the citizens. Such a perception is expressed in the response to the question, “Do you think the Panchayati Raj serves a useful purpose; if yes, in what way?”. In Tamil Nadu a sizeable proportion of people answered that Panchayat is a good intermediary between governments and people, whereas in Madhya Pradesh people were rather indifferent (see next section).
III.6. Perception of the Usefulness of the Panchayat
In Kerala, close to 50 per cent of the people perceive the Panchayat to be useful because it is easy to access, it assures greater participation and it provides a forum for expressing views and needs. Between 13 per cent and 18 per cent of the citizens across different caste groups perceive

Institutional Change and its Impact on the Poor and Excluded: The Indian Decentralisation Experience DEV/DOC(2005)02
© OECD / ILO 2005
30
the Panchayat to be beneficial to the poor. They said that Panchayat is more efficient than line departments, especially in planning local development.
In Tamil Nadu, almost 60 per cent of men and women mentioned local development and taking care of basic amenities as the reasons for the usefulness of Panchayat. For about one fourth of the men and about 17 per cent of the women, Panchayat acts as a bridge between government and people; it is essentially an intermediary, obviating the need to frequent government offices for getting local works done. About 6 per cent of the people mentioning easy access could be put in the same class, as the Panchayat obviates the need to contact government departments and it is thus seen as an intermediary. Only a very small percentage of men and women gave other specific reasons for the usefulness of the Panchayat.
The citizens of the three states perceive the usefulness of the Gram Panchayat very differently. In Madhya Pradesh, the Panchayat is looked upon as a provider of employment by a large proportion of men and women (Table A.11). In fact, the only usefulness of the Panchayat as perceived by the women is the availability of employment in various construction works, such as roads, ponds and buildings taken up by the Panchayat as part of implementation of schemes of the Union and State government. Men agreed with this answer but about one third mentioned also other reasons such as that Panchayat provides a forum for expressing opinions and getting work done quickly.
III.7. Summary of Findings
The summary of findings with regard to participation in various aspects of the functioning of the Panchayats are presented in Table 5, where participation of women (relative to men), Scheduled Castes and Tribes (relative to Other Backward Castes and forward caste), and the poor (relative to the rich) are shown as very low, low, high and very high. The key findings are:
— Women’s participation in all aspects of governance of the Gram Panchayat is lower than that of men in all the three states. Among states, Kerala fares much better as the differences are not large, but for two aspects, namely attendance in election meetings and percentage able to raise issues in the meetings. In Tamil Nadu, women’s participation is lower than that of men in all aspects, even if they are more able to raise issues in Gram Sabha. In Madhya Pradesh, women’s participation is the lowest. In the activities of signing petition, contacting higher Panchayats and raising issues in Gram Sabha, there is no difference in participation between men and women, largely because the participation by men was also very low.
— As regards participation of the socially disadvantaged, namely Scheduled Castes and Tribes, in relation to Other Backward Castes and forward caste population, it may be seen that in Tamil Nadu and Madhya Pradesh participation by the socially disadvantaged was not lower in any aspect of governance. The socially disadvantaged do as well as the others. However, what is remarkable is that in Kerala the participation of Scheduled Castes is higher if compared to Other Backward Castes and forward castes and much higher if compared to the situation in the other states.

OECD Development Centre Working Paper No. 242 DEV/DOC(2005)02
© OECD / ILO 2005 31
— The most significant finding is that the participation of the poor in Kerala is high/very high compared to the one of the rich. A much higher percentage of the poor attends election meetings and Gram Sabha, signs petitions and contacts Panchayats at all levels. In contrast, in Tamil Nadu and Madhya Pradesh, participation of the poor is lower or on par; in particular, participation is significantly lower in contesting elections in Tamil Nadu, suggesting that there is a strong element of “elite capture” in Panchayat elections.
Table 5. Variation in Participation by Aspect, Group and State
Women Scheduled Castes and Tribes Poor Aspect of Participation
TN KER MP TN KER MP TN KER MP
Attendance in election meetings VL VL L - VH - VL VH - Participation in contesting L L L - - - VL - - Participation in Gram Sabha - VL VH - VH - Raise issues in Gram Sabha - VL - - H - - H - Sign petitions L - - - H - L H Contact Elected Representatives L L VL - - L - H - Contact Block/District Panchayat L - - - - - - VH -
* Note: H=High; VH=Very High; L=low; and VL=Very Low; TN=Tamil Nadu; KER=Kerala and MP=Madhya Pradesh. A blank means no information, and “-” signifies no difference. Participation of women in relation to men, Scheduled Castes and Tribes in relation to other backward caste or forward caste, and poor (thatch house) in relation to rich (terrace house) are shown.

Institutional Change and its Impact on the Poor and Excluded: The Indian Decentralisation Experience DEV/DOC(2005)02
© OECD / ILO 2005
32
IV. DETERMINANTS OF SUCCESSFUL DEMOCRATIC DECENTRALISATION
IV.1. Explaining Differences in Participation between Women and Men
Educational attainments of women compared to men are significantly lower in Madhya Pradesh, if compared with the situation in Kerala and Tamil Nadu. In Kerala, 46 per cent of women and 57 per cent of men and, in Tamil Nadu, 29 per cent of women and 28 per cent of men had over ten years of schooling. In striking contrast, in Madhya Pradesh, only 6 per cent of women and 27 per cent of men had completed ten years of schooling. Over 70 per cent of women and 50 per cent of men had less than five years of schooling in Madhya Pradesh. The figures in Kerala and Tamil Nadu were 20 per cent and 30 per cent respectively, with little difference between men and women. Thus, i) in Madhya Pradesh the basic skill of literacy is simply lacking for the vast majority of men and women; ii) the difference in literacy between men and women is high in Madhya Pradesh, while almost absent in Kerala and Tamil Nadu.
The poor literacy levels in Madhya Pradesh leads to poor newspaper readership (Figure 3). Only 7 per cent of women and 27 per cent of men read newspapers in Madhya Pradesh. In the highly literate Kerala, 69 per cent of women and 78 per cent of men read newspapers. In Tamil Nadu, the figures are 49 per cent and 57 per cent for women and men respectively. Thus, men and women in Madhya Pradesh are hardly exposed to the outside world through the newspapers – for the poor literacy levels.
Figure 3. Newspaper Readership by Sex Across States
0 20 40 60 80 100
MadhyaPradesh
Tamil Nadu
Kerala
% Reading Newspapers
Male
Female
Source: Own field

OECD Development Centre Working Paper No. 242 DEV/DOC(2005)02
© OECD / ILO 2005 33
Figure 4. Membership of Self-Help Groupsby Sex Across States
0 10 20 30 40Mad
hya Prad
esh
Tamil N
adu
Kerala
% Reporting Membership
Male
Female
Figure 5. Membership of Political Parties by Sex Across States
0 10 20 30 40
MadhyaPradesh
TamilNadu
Kerala
% Reporting Membership
Male
Female
Source:Own field.study.

Institutional Change and its Impact on the Poor and Excluded: The Indian Decentralisation Experience DEV/DOC(2005)02
© OECD / ILO 2005
34
The self-help groups (SHG), which have seen their emergence since the early 1990s, have made their presence felt in Kerala and Tamil Nadu but not in Madhya Pradesh (Figure 4). In Kerala and Tamil Nadu, around one-third of the women reported being members of self-help groups. In Madhya Pradesh, only 15 per cent have joined these organisations. Self-help groups are largely dominated by women, with hardly any men’s groups to be found anywhere.
Membership of political parties shows differences between men and women similar to those registered for newspaper readership across states and between sexes (Figure 5). In Kerala, 10.7 per cent of women and 28.4 per cent of men reported being members of political parties. In Tamil Nadu, the figures were 1.4 per cent and 32.7 per cent respectively and in Madhya Pradesh, 1.8 per cent and 5.5 per cent. Thus, the levels of membership of political parties are extremely low in Madhya Pradesh and differentials are strong in Tamil Nadu and Kerala. Nevertheless, in Kerala, the gender gap is smaller than in Tamil Nadu. Further, while membership among men in Kerala is lower than in Tamil Nadu, among women it is significantly higher than in Tamil Nadu. Overall, membership of political parties falls largely in men’s sphere; in all the three states, women are hardly represented in political parties. Only in Kerala, a small proportion of women have made a beginning in entering the sphere of political activity through party membership. Thus, while political party membership is a men’s preserve, that of self-help groups is largely confined to women.
Turning to the explanation of lower participation of women in terms of differentials in literacy, newspaper readership and membership of political parties and self-help groups, it may be argued that, in Madhya Pradesh, the generally low levels of literacy and newspaper readerships of the entire population have resulted in lower participation in local governance than in Kerala and Tamil Nadu. But that in itself does not adequately explain the lower participation by women compared to men. There are two interrelated questions: i) why does Kerala show higher levels of women’s participation compared to Tamil Nadu when literacy, newspaper readership, membership of political parties and self-help groups are similar between the two states? ii) Why does Madhya Pradesh report such poor participation of women in local governance despite a moderate – 15 per cent – membership of women in self-help groups?
The answer to the first question runs as follows. While Kerala and Tamil Nadu report similar levels of literacy and newspaper readership, there are two important differences. First, Kerala reports higher levels of women’s membership in political parties, close to 11 per cent compared to about 1 per cent in Tamil Nadu. The political awareness of Kerala women would be higher to that extent. The second difference is in terms of the content of the discussions in political parties and self-help groups’ meetings. In Kerala, 55 per cent of the women and 44 per cent of the men reported that Panchayati Raj issues were discussed in such meetings. The corresponding figures for Tamil Nadu were 7 per cent and 3 per cent respectively. Thus, the higher participation of women in local governance in Kerala is a reflection of their higher political mobilisation and awareness.
Regarding the poor participation of women in Madhya Pradesh, it may be seen that participation in a self-help group per se is not sufficient. What seems to be more important is meeting regularly and discussing issues of local governance. In Madhya Pradesh, women hardly attend one meeting per month, compared to 75 per cent of the women attending between two

OECD Development Centre Working Paper No. 242 DEV/DOC(2005)02
© OECD / ILO 2005 35
and four meetings per month in Tamil Nadu and 66.7 per cent of the women attending four meetings per month in Kerala. Further, while 55 per cent of the women in Kerala and 7 per cent in Tamil Nadu report having discussed about issues related to Panchayati Raj during the meetings of self-help groups, none in Madhya Pradesh reported such discussions having taken place. To the degree and type of activity of self-help groups has to be added another dimension: its structure. In Kerala and Tamil Nadu, the functionaries of self-help groups are rotated annually, while this practice seems to be absent in Madhya Pradesh. Part of the reason for the absence of such rotation is the low literacy, as the functionaries need to have a certain level of literacy to maintain the books of accounts and write the minutes.
As spelt out in Section II, membership of self-help groups and their functioning may be taken as an indicator of a vibrant civil society while membership of political parties and discussing local governance in self-help groups as indicators of a vibrant political society. Among the three states, Madhya Pradesh neither reflects a vibrant civil society nor a vibrant political society. Tamil Nadu does show signs of a vibrant civil society but politics are shunned by women. On the contrary, Kerala shows every sign of a vibrant political society with women reporting membership of political parties and local governance being discussed in self-help groups. The low level of civil and political society activity in Madhya Pradesh goes along with the low level of women’s participation in local governance. The vibrant civil society in Tamil Nadu, which is completely apolitical, has not led to higher participation of women in local governance. It is only in Kerala, with high levels of political mobilisation, that much greater participation of women in local governance may be observed.
The policy implication of the above findings may now be inferred. Higher levels of literacy and membership in self-help groups are necessary for women’s participation in local governance but not sufficient. The functioning of self-help groups or their dynamics – how often they meet, who are the functionaries – and to which extent discussions concern Panchayati Raj is very important for them to have an impact on women’s participation in local governance.
IV.2. Explaining Differences in Participation of Scheduled Castes and Tribes
As reported in Section III, no significant difference in participation in local governance of socially disadvantaged, that is Scheduled Castes and Tribes, compared to the other castes could be found in Tamil Nadu and Madhya Pradesh. Instead, in Kerala, the participation of Scheduled Castes is significantly higher.
Across caste groups the number of years of schooling does show some variation in all the three states (Tables A.3). In Kerala, forward castes are better educated than Other Backward Castes which in turn report higher levels of schooling than Scheduled Castes. The proportion with over ten years of schooling varies from 59 per cent among forward castes to 50 per cent among Other Backward Castes to 27 per cent among Scheduled Castes. In Tamil Nadu, no such difference in schooling could be observed between Other Backward Castes and Scheduled Castes. The proportion with over ten years of schooling varied from 31 per cent for Other Backward Castes to 22 per cent for Scheduled Castes. In Madhya Pradesh, men and women of Scheduled Tribes are less educated than men and women of Other Backward Castes and the proportion with over ten years of schooling stood at 12 per cent for Scheduled Tribes and at

Institutional Change and its Impact on the Poor and Excluded: The Indian Decentralisation Experience DEV/DOC(2005)02
© OECD / ILO 2005
36
22 per cent for Other Backward Castes. Overall, the differentials in literacy between Scheduled Castes and Tribes and Other Backward Castes in Tamil Nadu and Madhya Pradesh are small compared to Kerala.
In Kerala, over 40 per cent of the citizens purchase newspapers and the proportion purchasing newspapers is higher among forward castes and Other Backward Castes compared to Scheduled Castes (Table A.12., A.13 and A.14). Similar differentials persist with regard to newspaper readership. The proportion of citizens purchasing newspapers is low in Tamil Nadu and Madhya Pradesh and the differentials among castes are low. Newspaper readership in Tamil Nadu is comparable to that in Kerala for males and significantly lower for females, but the difference between Other Backward Castes and Scheduled Castes in Tamil Nadu is much lower than that in Kerala. The proportion of citizens reading newspapers is considerablty lower in Madhya Pradesh but the difference between Other Backward Castes and Scheduled Tribes is small.
Membership of self-help groups is, in Kerala, much higher for Scheduled Castes than for Other Backward Castes, in Tamil Nadu almost the same for Scheduled Castes and Other Backward Castes (the reference group) and, in Madhya Pradesh, higher for Other Backward Castes (the reference group) than for Scheduled Tribes (Figure 6). Considering now membership of political parties, in Kerala participation in political parties of Scheduled Castes is higher than that of Other Backward Castes and forward caste (Figure 7). Instead, in both Tamil Nadu and Madhya Pradesh, there is no worthwhile difference in participation in political parties between Scheduled Castes and Tribes and Other Backward Castes.
Figure 6. Membership of Self-help Groups by Caste, Across States
0 20 40 60 80
Kerala
TamilNadu
MadhyaPradesh
Scheduled Castesand Tribes
Other BackwardCastes
Forward Castes
Source: Own field study.
Figure 7. Membership of Political Parties by Caste, Across States
0 2 4 6
Tamil Nadu
Madhya Pradesh
Other Backward
Forward Castes
Kerala
Scheduled Castes & Tribes
Source: Own field study.

OECD Development Centre Working Paper No. 242 DEV/DOC(2005)02
© OECD / ILO 2005 37
In order to avoid that analysis on the participation of low castes be flawed by omitting to consider economic differences or similarities between castes of different states, there is a need to analyse also the economic status of these groups for each state. In Kerala, only 7 per cent of the total population lives in thatch houses (poor) out of which close to 50 per cent belong to Scheduled Castes (Table A.4; see also Table A.5). In contrast, 36 per cent of the population lives in terrace houses (rich) out of which only 5 per cent are Scheduled Castes. In terms of land ownership, in Kerala, 3 per cent of Scheduled Castes, 12 per cent of Other Backward Castes and 37 per cent of forward caste own over 500 cents of land. In Tamil Nadu, 9 per cent of the total population lives in terrace houses of which one-quarter belongs to Scheduled Castes; one-third of the total lives in thatch houses, of which over 60 per cent belong to Scheduled Castes. In terms of land ownership, in Tamil Nadu, 69 per cent of Scheduled Castes are landless compared to 41 per cent of Other Backward Castes. In Madhya Pradesh, 30 per cent of Other Backward Castes and 44 per cent of Scheduled Tribes own over 500 cents of land. In sum, while in Kerala the proportion of poor in the total is low and they are mainly Scheduled Castes, in Tamil Nadu, the proportion of poor is high, and again they are mainly coming from Scheduled Castes, even if a small proportion of them is rich. In Madhya Pradesh a higher proportion of Scheduled Tribes owns land and a high proportion of Other Backward Castes is landless. Nonetheless, the share of Other Backward Castes in the overall sample is only about 35 per cent. In general, in Tamil Nadu and Madhya Pradesh the distance in economic status and educational attainments between Scheduled Castes and Tribes and Other Backward Castes is small.
It is evident that, in Tamil Nadu and Madhya Pradesh, the socio-economic status of Other Backward Castes is not very different from that of Scheduled Castes and Tribes. Newspaper readership and membership of political party and self-help groups are also comparable and consequently differences in participation in local governance between the two groups are also small in the two states. Instead in Kerala, despite lower literacy and economic status of Scheduled Castes compared to others, their participation in local governance is significantly higher, owing largely to their greater participation in political parties and specific types of self-help groups. In Kerala, the regular meetings and their focus on Panchayati Raj institutions of self-help groups have also helped increasing the participation of Scheduled Castes in local governance. Thus, political mobilisation in Kerala has brought to higher participation in local governance of the Scheduled Castes.
IV.3. Participation of the Rich versus Poor
As already indicated the economic status of the individual is identified by the housing type in Kerala and Tamil Nadu and by the extent of land owned in Madhya Pradesh. It may be seen that the level of education (ten or more years of schooling) among the rich is much higher than that of the poor in Kerala and Tamil Nadu (Figure 8). The differential is particularly striking in Tamil Nadu, with less than 10 per cent of the poor reporting over ten years of schooling. In Madhya Pradesh, the level of education is low and the differentials across economic groups are also small. Thus, educational achievement improves with economic status in the three states, with the level of education of the poor significantly higher in Kerala.

Institutional Change and its Impact on the Poor and Excluded: The Indian Decentralisation Experience DEV/DOC(2005)02
© OECD / ILO 2005
38
It is known that newspaper readership increases with increasing levels of education. This pattern is borne out by the data for the three states with regard to the newspaper readership of population groups by economic status (Figure 9). The differentials are wide in Tamil Nadu, but less in Kerala. In Madhya Pradesh, it is difficult to say anything definite, as the levels are extremely low. Overall, the poor are less educated and less exposed to print media compared to the rich.
Figure 8. Proportion of Citizens with 10+ years of Schooling by Economic Status
0 20 40 60 80
MadhyaPradesh
Tamil Nadu
Kerala
Poor
Medium
Rich
Figure 9. Newspaper Readership by Economic Status
0 20 40 60 80 100
Madhya Pradesh
Tamil Nadu
Kerala
% Reading Newspapers
Poor
Middle
Rich
Note: Poor, Middle, Rich are calculated following the system of “thatch and tile” and landholdings.
As regards membership of self-help groups by economic status, the three states show three distinct patterns (Figure 10). In Kerala, a very small proportion of the rich is a member of self-help groups, with hardly any difference between the poor and the moderately rich; in Tamil Nadu, there is no difference between the poor and the moderately rich and in Madhya Pradesh, a higher proportion of the rich is member of self-help groups. Thus, while in Madhya Pradesh the rich have tried to capture self-help groups, in Kerala and Tamil Nadu, the poor have been able to become members of self-help groups in equal proportion to the moderately rich.
Source: Own field study.
Source: Own field study.

OECD Development Centre Working Paper No. 242 DEV/DOC(2005)02
© OECD / ILO 2005 39
Figure 10. Membership of Self-help Groupsby Economic Status
0 5 10 15 20 25 30
Madhya Pradesh
Tamil Nadu
Kerala
% Members
Poor
Middle
Rich
Figure 11. Membership of Political Partiesby Economic Status
0 5 10 15 20 25 30 35 40
Madhya Pradesh
Tamil Nadu
Kerala
% Members
Poor
Middle
Rich
Note: Poor, Middle, Rich are calculated following the system of “thatch and tile” and landholdings.
Differentials in membership of political parties across economic groups are what bring out the contrast between Kerala on the one side, and Tamil Nadu and Madhya Pradesh on the other (Figure 11). In Kerala, close to 40 per cent of the poor and less than 20 per cent of the rich and moderately rich are members of political parties. In Tamil Nadu and Madhya Pradesh, hardly any poor citizen is a member of a political party. Close to 30 per cent of the rich and moderately rich in Tamil Nadu and a small part of the rich and moderately rich in Madhya Pradesh are members of political parties. Thus, “elite capture” of the political party is observed in Madhya Pradesh and Tamil Nadu.
The participation of the poor in local governance is lower in Madhya Pradesh and Tamil Nadu but is much higher in Kerala. What explains such differentials in participation between the rich and the poor? In Tamil Nadu and Madhya Pradesh the poor are poorly educated and less exposed to the print media. Furthermore, a smaller per cent of the poor are members of political parties. Only with regard to membership of self-help groups the differences between rich and
Source: Own field study.
Source: Own field study

Institutional Change and its Impact on the Poor and Excluded: The Indian Decentralisation Experience DEV/DOC(2005)02
© OECD / ILO 2005
40
poor are irrelevant in Tamil Nadu and Madhya Pradesh. In Kerala, while the poor are less educated and less exposed to the print media than the rich, a larger proportion are members of self-help groups and political parties. The lower participation of the poor in local governance in Tamil Nadu and Madhya Pradesh may be explained by lower education, poor exposure to print media and low membership of the poor in political parties. The higher participation of the poor in local governance in Kerala may be explained by their higher membership in political parties and self-help groups which presents differences in structure, focus and frequency of meetings. As the case of Tamil Nadu clearly shows, membership of self-help groups of the poor in itself does not lead to higher participation in local governance. Yet, here, self-help groups, while being effective networks, are completely apolitical: Panchayati Raj is hardly ever discussed during their meetings. While they can be considered effective networks, self-help groups are completely apolitical in Tamil Nadu. Thus, political mobilisation is the key to the larger participation of the poor in local governance in Kerala. On the other side, the “elite capture” of political parties in Tamil Nadu and Madhya Pradesh is at the root of the scarce participation of the poor in local governance.
An analysis of the economic background of the elected representatives – ward members – and Panchayat presidents further confirms the phenomena of elite capture. Over two-thirds of the male ward members in Madhya Pradesh belong to families owning five or more acres of land and, in Tamil Nadu, 80 per cent of the members hail from families owning terrace houses or tiled houses (rich and middle rich). In Tamil Nadu and Madhya Pradesh, the Panchayat presidents also hail from rich families. Such a pattern cannot be seen in Kerala where all the ward members and Panchayat presidents are members of political parties and a higher proportion of the poor are members of political parties.
IV.4. The Structure of Governance
As set out in Section I, the three states selected for the study fall into three distinct size categories of Gram Sabha and Gram Panchayat. Kerala is characterised by moderate Gram Sabha and large Gram Panchayat, Tamil Nadu by large Gram Sabha and moderate Gram Panchayat and Madhya Pradesh by small Gram Sabha and Gram Panchayat. It was posited (Section II) that a smaller size of Gram Sabha and Gram Panchayat might be conducive to better and higher participation of disadvantaged groups. On the contrary, participation by the poor and Scheduled Castes is high in Kerala and Tamil Nadu and significantly low in Madhya Pradesh. Thus, the size of local governments does not seem to have much of an influence. Large size in itself does not dissuade the disadvantaged from participating in local governance.
Turning to the structure of governance, in Tamil Nadu, the Gram Panchayat has been vested with the responsibility of providing civic amenities while the middle-level officials retain large powers. In Madhya Pradesh, the Gram Panchayats are largely implementers of sponsored programmes with a lot more power vested in the middle-tier Panchayat. The structure in Kerala is different from that in the other two states in that substantive power and resources are vested in the Gram Panchayat. The structure of governance does influence participation through people’s perception of the role of Gram Panchayat. The purpose of contacting the Gram Panchayat changes accordingly. In Kerala, a large proportion of the poor and Scheduled Castes contact the

OECD Development Centre Working Paper No. 242 DEV/DOC(2005)02
© OECD / ILO 2005 41
Gram Panchayat also because many of the poverty alleviation programmes are designed and decided by the Gram Sabha and Gram Panchayat. In Tamil Nadu, as the emphasis is on civic functions, there is no special reason for the poor to contact the Gram Panchayat. In Madhya Pradesh, the Gram Panchayat is perceived as a provider of employment and, when a sponsored scheme is implemented, everyone gets employment rather than the poor alone. Thus, the structure of governance does have an influence on who contacts the Gram Panchayat and for what purpose.
IV.5. Main Findings
Comparing the different impact of the Indian democratic decentralisation reform on the participation of disadvantaged groups of citizens in three Indian states, it has been found that, while in general the participation of women relative to that of men is low across all states, that of low castes relative to others and the poor relative to rich vary from state to state. Furthermore, in one case (Kerala) women’s participation, even if lower than that of men, is higher than in the other states. This study has tried to understand the driving force behind these differences, analysing the influence of four sets of factors: awareness, social capital or political society, elite capture and governance structure. From the main findings it can be concluded that if each factor considered has an influence, governance structure and, most of all, political society are the driving forces.
Awareness:
Literacy and newspaper reading is a necessary condition for raising citizens’ awareness but is not sufficient to ensure participation in local governance, as the case of Kerala clearly shows. Here in fact the higher education of the rich and forward castes does not correspond to higher participation. Similarly, it can be argued that a higher economic status results in higher literacy and newspaper reading as well as increased awareness and participation. In Tamil Nadu and Madhya Pradesh this relation is quite strong, suggesting that increases in the economic status of low castes might bring to greater participation. Yet, this is not the driving force. In Kerala, the poor participate in governance more than the rich.
Social Capital:
A vibrant civil society, measured in terms of membership of self-help groups, does not necessarily lead to higher participation in local governance as the case of Tamil Nadu suggests. What seems to have a greater impact on women’s participation (self-help groups are mainly composed by women) is the structure of these groups, the frequency of their meetings (still all measures of social capital) and, most of all, the topics of discussion (if political or not). Thus, literacy, newspaper reading and membership of self-help groups might increase women’s awareness and participation in local governance. Nevertheless, the evidence seems to suggest that the driving force is political mobilisation and the vibrancy of the political society. In fact, in Kerala, where women participate more, self-help groups’ meetings are more institutionalised and focus on local institutions, while political parties include a larger share of women than in other states.

Institutional Change and its Impact on the Poor and Excluded: The Indian Decentralisation Experience DEV/DOC(2005)02
© OECD / ILO 2005
42
Political Parties:
A vibrant political society as reflected in the presence of political parties with members from all sections of the population, leads to higher participation in local governance. When political parties provide space for Scheduled Castes and Tribes and the poor in their institutions as members and functionaries, their participation in local governance increases. The differences in levels of participation between the disadvantaged groups of Kerala and those of the other two states suggests that the participation of the socially excluded and the poor can be raised when political mobilisation takes place, even at low levels of education and newspaper readership.
Power Relations:
The lack of political mobilisation of the poor leads to their exclusion from local governments, as the case of Tamil Nadu suggests. Here in fact, the participation of the poor to self-help groups is large, but their apolitical character does not increase political participation. Political parties are instead dominated by the elite. The scarce political mobilisation of the poor together with the limited powers delegated to local governments prevents their involvement in local institutions. These findings might also suggest that, in the absence of a vibrant political society, “elite capture” – the economically well off capturing the political space – in participation and representation in local governance, is more likely to occur, as also other theorist argue (see Harris, 2001). Yet further studies are required in order to ascertain the relation of causality and understand the importance of other variables.
Governance Structure:
As has been argued above, governance structure was measured by looking at the size of local governments (Gram Sabha or Gram Panchayat) and their functions. The size of local government has shown to have no relevant influence on the participation of women, Scheduled Castes and Tribes and the poor, dismissing the general opinion that larger local governments might dissuade the participation of the disadvantaged. On the contrary, the structure of local self-government institutions does influence participation. The devolution of larger resources and powers to local governments increases the incentive of citizens to participate, as the case of Kerala clearly shows.

OECD Development Centre Working Paper No. 242 DEV/DOC(2005)02
© OECD / ILO 2005 43
V. CONCLUSIONS
The success of democratic decentralisation depends largely on the achievement to include former marginalised groups in local decision-making and power structures effectively. This study is of specific interest as it looks at three states in India where the governments have followed a different approach to implement a transformation of a two-tier system of governance to a three-tier system. The heterogeneity of the given context in the three selected states in conjuncture with a different understanding and undertaking of the decentralisation process by the state governments let to quite different poverty outcomes.
In order to understand the relationship between decentralisation and participation better, this paper has looked at the influence of four sets of factors – awareness, social capital or political society, power relations and governance structure – in three Indian states. Adopting a wide definition of participation, the focus has been on the degree of participation in local governance of women, scheduled castes and tribes and the poor in relation to other groups, after the decentralisation reform. Several important results emerge from this study:
First, while the institutional reform creates the necessary framework for the empowerment of socially excluded groups, the final output seems to be largely influenced by citizen’s awareness, power relations, social capital and, most of all, vibrancy of political society and the structure of governance (in terms of type and amount of powers delegated to local governments). This leads to the important policy conclusion that decentralisation reforms should go together with the implementation of other policies and be part of a larger plan to empower the excluded and reduce disparities in society. This study has addressed some of the main issues that should be tackled by policy makers for democratic decentralisation to be effective and truly participative.
Secondly, decentralisation reforms should provide for a substantial and effective devolution of powers and resources. The case of Kerala has clearly demonstrated how a larger devolution of powers and resources to the Gram Panchayats improves the participation of the disadvantaged. As more functions and resources are devolved on Gram Panchayats, people’s perception of the role of local government changes and their interest and participation increases. Secondly, where literacy levels are low, institutional reforms should be accompanied by policies to increase literacy, which is important for raising awareness and participation in local governance. A top priority for donors and governments should be women’s education, in view of the fact that they are in general the most disadvantaged in terms of access to services, literacy, economic status and participation to governance. In the case of India, as the Gram Panchayats have already taken upon themselves the responsibility of running primary schools satisfactorily, larger devolution of powers and resources should help increase literacy levels. Devolution of

Institutional Change and its Impact on the Poor and Excluded: The Indian Decentralisation Experience DEV/DOC(2005)02
© OECD / ILO 2005
44
resources by the federal and state governments should be targeted to reduce the gap in literacy and enrolment rates of girls.
Thirdly, policies to increase literacy should be linked to policies aiming at fostering newspaper reading practice, such as funding libraries. The high levels of awareness in Kerala are also a consequence of a long tradition of library movement and newspaper reading habit.
Fourthly, donors and governments should sponsor and sustain the formation of self-help groups and, most of all, their adoption of a democratic structure. Although membership of self-help groups in itself does not lead to higher participation of women in local governance, it does open up a channel to come on to the public sphere. Along with micro credit activities, self-help groups serve an important function as women’s social networks. Yet, it has been argued that what seems to be more important for increasing women’s participation is the structure, functioning and, most of all, the focus of self-help groups’ meetings. This can be achieved by encouraging the rotation of functionaries, the regularity of meetings and a major focus on local institutions. Aid may be redirected to reward those self-help groups which decide to adopt a more democratic structure and focus, during their meetings, on local institutions. However, a note of caution should be addressed on the limitations and draw-backs of an unanimous support of self-groups. In some cases, the external support (by States or donors) to self-help groups has contributed to creating institutions parallel to the state’s administration structure and in competition with local self governments. A large devolution of resources to self-help groups while neglecting the democratic elected and accountable Panchayat Raj might reduce the power of local officials and policy makers, undermining decentralisation reforms.

OECD Development Centre Working Paper No. 242 DEV/DOC(2005)02
© OECD / ILO 2005 45
ANNEX: TABLES
Table A.1. The Sample Gram Panchayats and Survey Details
State/District/Block Names of Gram Panchayat selected Number of Citizens contacted
Survey period
Madhya Pradesh / Mandla / Mawai
Pody, Ghonta, Pursel, Dhangaon, Pakhwar, Persatola, Majhgaon, Amwar, Surajapur, Medha, Mawai, Jamgaon
110 15-30 August 2003
Tamil Nadu / Dindigul / Shanarpatti
Silvathoor, Thimmalloor, VSKottai, Anjukulipatti, Vembarpatti, Panchampatti
181 25 June-20 July 2003
Kerala / Thrissur / Wadakkancherry
Malloorkara, Thekkumkara, Wadakkancherry
244 15- 25 August 2003
Notes: Sample selection criteria: Both in Tamil Nadu and Madhya Pradesh, hamlets were randomly selected within
the Gram Panchayat. In Madhya Pradesh, two hamlets per Panchayat and at least five citizens per hamlet were chosen; in Tamil Nadu, six hamlets per panchayat and five citizens per hamlet were selected. In Kerala, each ward within the Gram Panchayat has been covered and at least six citizens per ward.
For the sample of citizens of Madhya Pradesh, about 80 of them were interviewed by D. Narayana with the help, also for the translations wherever needed, of Naresh Biswas and Amrit Lal of the Baiga Mahapanchayat. Amrit Lal carried out the survey of about 30 citizens.
The interviews of the citizens of Tamil Nadu were conducted by Mahendra Varman, a PhD scholar of the Indian Institute of Technology (Chennai).
The interviews of the citizens of Kerala were conducted by Aneesh Kumar, PhD scholar, and the MA students of St. Thomas College (Thrissur) with the support of A A Baby.

Institutional Change and its Impact on the Poor and Excluded: The Indian Decentralisation Experience DEV/DOC(2005)02
© OECD / ILO 2005
46
Table A.2. Distribution of Citizens (%) by Sex, Education and Religion
Female Male
Education (Years)
Less than 5 5-9 10-14 15 and
above Total Less than 5 5-9 10-14 15 and
above Total
Religion Kerala
Christian 13.3 16.0 22.0 30.0 18.8 0 19.4 10.0 57.1 17.9 Hindu 63.3 74.0 67.8 70.0 69.1 90.0 67.7 80.0 42.9 72.6 Muslim 23.3 10.0 10.2 0 12.1 10.0 12.9 10.0 0 9.5 Total % 100 100 100 100 100 100 100 100 100 100 Number 30 50 59 10 149 20 31 30 14 95
Religion Tamil Nadu
Christian 4.17 11.1 28.6 0 11.1 4.17 10.5 13.3 7.7 9.2 Hindu 95.83 88.9 71.4 100 88.9 95.83 89.5 86.7 92.3 90.8 Total % 100 100 100 100 100 100 100 100 100 100 Number 24 27 14 7 72 24 57 15 13 109
Table A.3. Distribution of Citizens (%) by Sex, Education and Caste
Female Male
Education (Years)
Less than 5 5-9 10-14 15 and
above Total Less than 5 5-9 10-14 15 and
above Total
Caste Kerala
Forward 20.0 22.0 27.1 80.0 27.5 5.0 32.3 23.3 64.3 28.4 OBC 43.3 46.0 57.6 20.0 48.3 40.0 41.9 53.3 28.6 43.2 SC/ST 36.7 32.0 15.3 0 24.2 55.0 25.8 23.3 7.1 28.4 Total % 100 100 100 100 100 100 100 100 100 100 Number 30 50 59 10 149 20 31 30 14 95
Caste Tamil Nadu
Forward 0 0 7.1 0 1.4 0 0 0 0 0 OBC 29.7 51.9 57.1 42.9 44.4 54.17 48.2 53.3 69.2 52.8 SC/ST 70.3 48.9 35.7 57.1 54.2 45.83 51.8 46.7 30.8 47.2 Total % 100 100 100 100 100 100 100 100 100 100 Number 24 27 14 7 72 24 57 15 13 109
Caste Madhya Pradesh
Forward 0 0 0 0 0 0 0 10.0 0 1.8 OBC 33.3 50.0 100 0 40.7 28.57 41.7 40.0 40.0 34.5 SC/ST 66.7 50.0 0 0 59.3 71.43 58.3 50.0 60.0 63.6 Total % 100 100 100 0 100 100 100 100 100 100 Number 39 12 3 54 28 12 10 5 55

OECD Development Centre Working Paper No. 242 DEV/DOC(2005)02
© OECD / ILO 2005 47
Table A.4. Distribution of Citizens by House Type/Landholding and Caste
Caste Housing type/Land holding (cents) Kerala Terrace Thatch Tile Total Less than 10 11-50 51-100 101 +
Forward 47.1 18.8 17.0 27.9 25.7 15.3 45.5 83.3 OBC 48.3 37.5 46.1 46.3 44.2 55.0 45.5 16.7 SC/ST 4.6 43.7 36.9 25.8 30.1 29.7 9.0 0 Total % 100 100 100 100 100 100 100 100 Number 87 16 141 244 113 91 22 18 Tamil Nadu Madhya Pradesh
Terrace Thatch Tile Total 0 1-100 101-500 501 +
Forward 6.7 0 0 0.6 4.2 0 0 0 OBC 66.7 31.1 59.0 50.3 58.3 100 31.0 28.6 SC/ST 26.6 68.9 41.0 49.1 37.5 0 69.0 71.4 Total % 100 100 100 100 100 100 100 100 Number 15 60 100 175 24 1 42 42
Notes: The share of Other Backward Castes in the total population in Madhya Pradesh is 36.7 per cent and of Scheduled Tribes 62.4 per cent. Terrace corresponds to rich, tile to middle income and thatch to poor. Less than 100 cents of land corresponds to poor, 101 – 500 cents middle income and above 500 cents rich.
Table A.5. Distribution of Citizens (%) by Sex, Landholding and Caste
Female Male Land holding (cents)
Less than 10 11-50 51-100 101 + Total
Less than 10 11-50 51-100 101 + Total
Caste Kerala
Forward 27.9 20.6 36.4 71.4 27.5 22.2 3.6 54.5 90.9 28.4 OBC 44.1 54.0 54.5 28.6 48.3 44.4 57.1 36.4 9.1 43.2 SC/ST 27.9 25.4 9.1 0 24.2 33.3 39.3 9.1 0 28.4 Total % 100 100 100 100 100 100 100 100 100 100 Number 68 63 11 7 149 45 28 11 11 95
Land holding (cents) 0 1-100 101- 500 501 + Total 0 1-100 101-500 501 + Total
Caste Madhya Pradesh
OBC 64.7 0 26.3 31.6 40.0 42.9 100 34.8 26.1 33.3 SC/ST 35.3 0 73.7 68.4 60.0 42.9 0 65.2 73.9 64.8 Total % 100 100 100 100 100 100 100 100 100 Number 17 19 19 55 7 1 23 23 54
Notes: The economic status is measured by looking at the material used to build the roof of the houses: terrace corresponds to rich, tile to middle income and thatch to poor. In MP, economic status is measured by landholding: less than 100 cents (poor), 101 to 500 cents (middle income), and above 500 cents (rich) are the categories used.

Institutional Change and its Impact on the Poor and Excluded: The Indian Decentralisation Experience DEV/DOC(2005)02
© OECD / ILO 2005 48
Table A.6. Participation in Panchayat Elections
% Voting in elections % Attending election meetings % Campaigning % Contesting elections
TN KER MP TN KER MP TN KER MP TN KER MP
By Caste Forward 88.2 16.2 13.2 4.4 OBC 86.50 96.5 100 16.90 20.5 9.52 20.20 11.50 7.14 9.0 0.9 9.52 SC/ST 81.11 98.40 97.10 23.33 34.90 11.80 23.33 22.20 4.41 11.11 4.80 5.88 Significant NS S NS NS S NS NS S NS NS NS NS By Sex Female 72.22 94.60 100 6.94 13.40 7.30 2.78 6.00 0 5.56 1.40 1.80 Male 91.74 94.70 96.40 28.44 38.30 14.50 33.94 28.40 9.10 12.84 5.30 12.70 Significant S NS NS S S S S S S S S S By Economic Status Terrace 92.90 9.80 100 35.70 16.10 14.3 35.70 13.80 7.1 21.40 5.70 14.3 Tile 91.00 97.20 98.0 23.00 25.00 9.8 24.00 13.50 3.7 12.00 1.40 7.8 Thatch 72.10 93.80 96.7 9.80 43.80 10.0 14.80 31.30 3.3 3.30 0 0 Significant S NS NS S S NS NS NS NS S NS NS
Notes: TN - Tamil Nadu, MP - Madhya Pradesh, KER - Kerala. The Economic status is measured by looking at the material used to build the roof of the houses: terrace corresponds to rich, tile to middle income and thatch to poor. In MP, economic status is measured by landholding: less than 100 cents (poor), 101 to 500 cents (middle income), and above 500 cents (rich) are the categories used. S and NS indicate if the difference between groups is statistically significant or not, using a chi square test with at least 10 per cent level of significance.

OECD Development Centre Working Paper No. 242 DEV/DOC(2005)02
© OECD / ILO 2005
49
Table A.7. Participation in Gram Sabha and in Raising Issues
% Raising Issues of Concern % Attending Gram Sabha %Attending Last Gram Sabha % Able to Raise Issues to Women/Scheduled Castes Last Five Years in Gram Sabha health/education)
TN KER MP TN KER MP TN KER MP TN KER MP By Caste
Forward 64.70 17.60 33.80 37.00 (20.60) OBC 62.50 52.38 13.40 23.81 86.80 26.50 46.15 24.60 34.60 37.50 (87.70) (9.90) (50.00) SC/ST 79.40 41.50 31.70 16.90 89.00 42.90 27.30 66.70 56.40 16.67 (82.40) (19.00) (16.67) Significant S NS S NS NS S NS S (NS) S (S) NS (NS) By Sex Female 67.60 38.30 18.20 7.50 86.30 26.20 0 35.21 32.10 0 (0) (56.34) (10.90) Male 67.40 63.00 21.10 31.50 89.00 43.20 42.90 37.74 55.40 30.80 (73.58) (22.10) (38.50) Significant NS S NS S NS S NS NS (NS) S (S) * By Economic Status Terrace 50.60 44.40 11.50 21.60 75.00 21.80 40.00 21.43 26.50 50.00 (42.86) (15.10) (66.70) Tile 77.10 44.80 22.10 17.20 92.00 36.90 50.00 34.00 49.40 25.00 (66.00) (14.30) (0) Thatch 75.00 46.00 37.50 16.00 83.60 56.30 25.00 40.98 54.50 0 (68.85) (25.00) (25.00) Significant S NS S NS NS S NS NS (NS) S NS(S)
Notes: * indicates numbers are too few to carry out a statistical test of significance. TN - Tamil Nadu, MP - Madhya Pradesh, KER - Kerala. The Economic status is measured by looking at the material used to build the roof of the houses:
terrace corresponds to rich, tile to middle income and thatch to poor. In MP, economic status is measured by landholding: less than 100 cents (poor), 101 to 500 cents (middle income), and above 500 cents (rich) are the categories used. S and NS indicate if the difference between groups is statistically significant or not, using a chi square test with at least 10 per cent level of significance.

Institutional Change and its Impact on the Poor and Excluded: The Indian Decentralisation Experience DEV/DOC(2005)02
© OECD / ILO 2005 50
Table A.8. Participation in Signing Petitions, Organising Meetings
% Signing petitions % Organising meetings % Organising protests % Refusing to participate TN KER MP TN KER MP TN KER MP TN KER MP
By Caste Forward 27.90 9.50 1.60 OBC 33.00 44.20 2.43 4.55 14.50 insig. 4.55 7.30 insig. 4.55 0 insig. SC/ST 36.00 46.00 4.40 0 10.3 insig. 6.74 3.40 insig. 4.55 0 insig. Significant NS S * NS * NS NS * * By Sex
Female 22.50 38.90 1.90 2.82 8.50 0 1.41 1.40 0 1.41 1.40 0 Male 42.50 42.10 5.50 1.89 17.80 1.82 9.43 10.00 0 7.70 0 Significant S NS NS S S S S By Economic Status Terrace 50.00 25.30 0 8.4 7.14 2.40 14.28 2.40 Tile 37.40 48.90 3.00 15.00 7.00 6.80 3.00 5.20 Thatch 23.70 43.80 1.64 6.7 4.92 0 4.92 0 Significant S S * NS * * * *
Notes: *The numbers are extremely small to carry out any statistical test. TN - Tamil Nadu, MP - Madhya Pradesh, KER - Kerala. The Economic status is measured by looking at the material used to build the roof of the houses: terrace corresponds to rich, tile to middle income and thatch to poor. In MP, economic status is measured by landholding: less than 100 cents (poor), 101 to 500 cents (middle income), and above 500 cents (rich) are the categories used. S and NS indicate if the difference between groups is statistically significant or not, using a chi square test with at least 10 per cent level of significance.
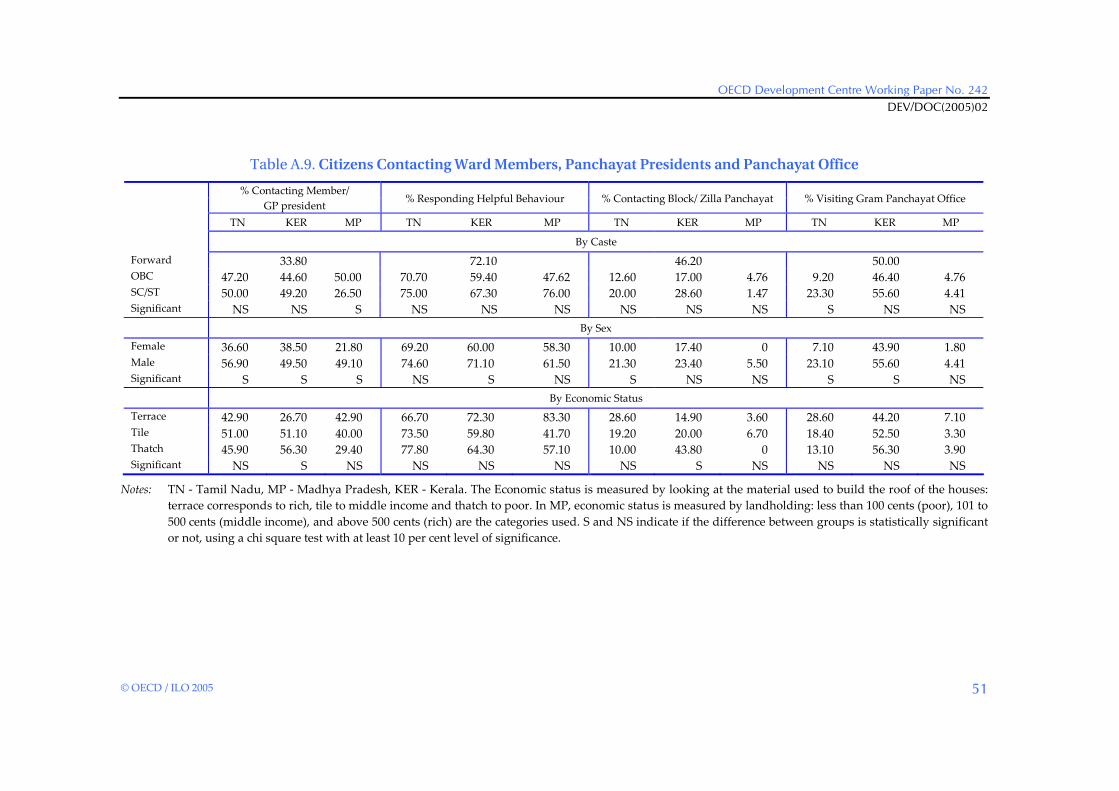
OECD Development Centre Working Paper No. 242 DEV/DOC(2005)02
© OECD / ILO 2005
51
Table A.9. Citizens Contacting Ward Members, Panchayat Presidents and Panchayat Office
% Contacting Member/ GP president
% Responding Helpful Behaviour % Contacting Block/ Zilla Panchayat % Visiting Gram Panchayat Office
TN KER MP TN KER MP TN KER MP TN KER MP By Caste
Forward 33.80 72.10 46.20 50.00 OBC 47.20 44.60 50.00 70.70 59.40 47.62 12.60 17.00 4.76 9.20 46.40 4.76 SC/ST 50.00 49.20 26.50 75.00 67.30 76.00 20.00 28.60 1.47 23.30 55.60 4.41 Significant NS NS S NS NS NS NS NS NS S NS NS
By Sex Female 36.60 38.50 21.80 69.20 60.00 58.30 10.00 17.40 0 7.10 43.90 1.80 Male 56.90 49.50 49.10 74.60 71.10 61.50 21.30 23.40 5.50 23.10 55.60 4.41 Significant S S S NS S NS S NS NS S S NS
By Economic Status Terrace 42.90 26.70 42.90 66.70 72.30 83.30 28.60 14.90 3.60 28.60 44.20 7.10 Tile 51.00 51.10 40.00 73.50 59.80 41.70 19.20 20.00 6.70 18.40 52.50 3.30 Thatch 45.90 56.30 29.40 77.80 64.30 57.10 10.00 43.80 0 13.10 56.30 3.90 Significant NS S NS NS NS NS NS S NS NS NS NS
Notes: TN - Tamil Nadu, MP - Madhya Pradesh, KER - Kerala. The Economic status is measured by looking at the material used to build the roof of the houses: terrace corresponds to rich, tile to middle income and thatch to poor. In MP, economic status is measured by landholding: less than 100 cents (poor), 101 to 500 cents (middle income), and above 500 cents (rich) are the categories used. S and NS indicate if the difference between groups is statistically significant or not, using a chi square test with at least 10 per cent level of significance.

Institutional Change and its Impact on the Poor and Excluded: The Indian Decentralisation Experience DEV/DOC(2005)02
© OECD / ILO 2005 52
Table A.10. Distribution of Citizens (%) by the Problem for which Ward Member/President Was Contacted
Madhya Pradesh Land Category (cents) Caste Certificate Housing assistance Electricity Anganwadi related (child care) Road Drinking water
<100 33.3 33.3 16.7 16.7 0 0 101-500 66.7 16.7 0 8.3 0 8.3
>500 54.5 9.1 0 0 9.1 27.3
Tamil Nadu Sex Drainage Drinking water Street lights Road Street clearing Employment training Pond Partiality in laying roads Others
Female 66.6 0 11.1 3.7 3.7 7.4 0 0 7.5 Male 40.7 7.5 28.5 7.5 0 0 4.5 1.5 10.3
Kerala House type Housing assistance Latrine assistance Canal clearing Road Drinking water Electricity Waste dumping Street lights Others Terrace 18.1 0 4.5 13.5 13.5 4.5 4.5 9.1 32.3 Tile 16.7 11.2 0 20.6 15.0 8.4 0 5.5 25.6 Thatch 77.7 0 0 11.1 0 0 0 0 11.2

OECD Development Centre Working Paper No. 242 DEV/DOC(2005)02
© OECD / ILO 2005
53
Table A.11. Distribution (%) of Citizens by Perception of the Usefulness of Panchayat
Madhya Pradesh
Sex Gives employment Provides forum for expressing opinions Panchayat gets work done
Female 95.7 0 4.3 Male 61.2 11.1 27.8
Tamil Nadu
Sex Basic menities taken care of Acts as a bridge (people-government) Better use of funds Easy access Local development Others
Female 20.8 17.4 1.6 6.4 37.9 15.9 Male 35.2 25.3 3.3 6.6 26.4 3.2
Kerala
Caste No opinion Easy access Panchayat
efficient Beneficial to
poor Plan development Power to people Greater
participation Express views
and needs Other
Forward 10.6 7.3 5.3 12.6 5.3 5.3 10.8 29.9 12.9 OBC 11.8 3.3 3.3 18.4 2.2 0 6.5 30.4 24.0 SC 8.5 8.5 6.8 15.3 0 1.7 6.8 35.6 16.8

Institutional Change and its Impact on the Poor and Excluded: The Indian Decentralisation Experience DEV/DOC(2005)02
© OECD / ILO 2005 54
Table A.12. Distribution of Citizens by Newspaper Readership, Membership in Self-help Groups, by Caste and Sex, Kerala
Items Female Male
% Reporting yes Forward OBC SC/ST Total Forward OBC SC/ST Total
Getting newspapers
51.2 38.9 19.4 37.6 70.4 48.8 22.2 47.4
Reading newspapers
78.0 70.8 52.8 68.5 88.9 80.5 63.0 77.9
Member 24.4 27.8 50.0 32.2 3.7 2.4 7.4 4.2 of SHGs Member of political party
12.2 5.6 19.4 10.7 25.9 24.4 37.0 28.4
Among members of self-help groups and political parties, % reporting yes
PRI discussed in meetings
52.2 60.0 52.2 55.3 33.3 46.7 50.0 43.9
Helped participate in Panchayat, GS
43.5 71.0 58.3 59.0 41.2 43.8 57.9 47.1
Helped raise issues in meetings
39.1 45.2 47.8 44.2 41.2 33.3 57.9 42.0
Helped become committee member
8.7 3.2 8.7 6.5 17.6 9.1 10.5 11.6
Helped contest elections
0 0 0 0 11.8 3.1 5.3 5.9
Table A.13. Distribution of Citizens by Newspaper Readership, Membership in Self-help Groups by Caste and Sex, Madhya Pradesh
Items Female Male
% Reporting yes Forward OBC SC/ST Total Forward OBC SC/ST Total Getting 0 0 0 0 0 2.9 1.8 newspapers Reading newspapers
9.1 6.1 7.3 100 26.3 22.9 25.5
Member 27.3 6.1 14.5 0 0 5.7 3.6 of SHG Member of political Party
4.5 0 1.8 0 5.3 5.7 5.5
Among members of self-help groups and political parties, % reporting yes PRI discussed in meetings
0 0 0 100 0 50.0
Helped participate in Panchayat, GS
33.3 0 33.3 100 0 50.0
Helped raise issues in meetings
0 0 0 100 0 50.0
Helped become committee member
0 0 0 100 0 50.0
Helped contest elections
0 0 0 100 0 50.0

OECD Development Centre Working Paper No. 242 DEV/DOC(2005)02
© OECD / ILO 2005
55
Table A.14. Distribution of Citizens by Newspaper Readership, Membership in Self-help Groups, by Caste and Sex, Tamil Nadu
Items Female Male
% Reporting yes Forward OBC SC/ST Total Forward OBC SC/ST Total Getting newspapers 100 0 5.1 4.2 12.5 5.9 9.3 Reading newspapers 100 56.3 41.0 48.6 82.1 62.7 73.9 Member of SHG 0 40.6 33.3 36.1 0 0 0 Member of political party 0 3.1 0 1.4 28.6 37.3 32.7
Among members of self-help groups and political parties % reporting yes
PRI discussed in meetings
7.1 7.7 7.4 0 5.3 2.9
Helped participate in Panchayat, GS
35.7 46.2 40.7 18.8 33.3 26.5
Helped raise issues in meetings
50.0 46.2 48.1 18.8 38.9 29.4
Helped become committee member
0 7.7 3.7 18.8 11.1 14.7
Helped contest elections 0 7.7 3.7 18.8 22.2 20.6
Table A.15. Distribution of Indian States by Size of Gram Sabha and Gram Panchayat
Size of Gram Sabha Size of Gram Panchayat (group of villages)
(one per village) Less than 2 000 people 2 000-5 000 people 5 000-10 000 people Greater than 10 000 people
Less than 1 000 Himachal Pradesh Assam, Orissa people Madhya Pradesh 1 000-2 000 people Punjab, Maharastra Uttar Pradesh,
Sikkim, Gujarat, Andhra Pradesh, Goa
Rajasthan, Karnataka
Bihar, West Bengal, Kerala
Greater than 2 000 Haryana Tamil Nadu (people)
Notes: Size of the Gram Sabha is defined in terms of number of population, except for the state of Kerala, where each ward of a Panchayat has a Gram Sabha. The new states of Chattisgarh, Jharkhand and Uttaranchal could not be included owing to lack of adequate information.
This table shows that at one end of the spectrum lies Himachal Pradesh and Madhya Pradesh with small villages (population around 600) and equally small size Gram Sabha and small Grama Panchayats with population less than 2 000. At the other end of the spectrum lie Bihar, West Bengal and Kerala with Gram Sabha of over 1 000 citizens and Gram Panchayats of over 10 000. At another level lie the states of Haryana and Tamil Nadu with Gram Sabha of over 2 000 population and comparatively smaller Gram Panchayats.

Institutional Change and its Impact on the Poor and Excluded: The Indian Decentralisation Experience DEV/DOC(2005)02
© OECD / ILO 2005 56
Table A. 16. Density of Self-help Groups and Decentralised Structure of Governance
State Density of SHG Decentralised structure of governance
Himachal Pradesh High Department of Panchayats supervises, controls grants, provides guidance and ensures adherence to provisions of the Act.
Madhya Pradesh Negligible 23 departments transferred, but not able to play significant role in the absence of financial devolution; a certain percentage of the state budget devolved; untied fund.
Haryana Negligible Under tight government control. Tamil Nadu High Village Panchayat has been devolved functions but Collector is the
inspector and has full control; civil bureaucracy controls the Panchayats. West Bengal Negligible Elected local governments control bureaucracy, but scheme funds only. Kerala Moderate Elected local governments control bureaucracy; 40% plan funds
devolved; active campaign for Gram Sabha participation.
Notes: Close to two-thirds of the total number of SHG are found in the four South Indian states. Their densities are especially high in South India, Himachal Pradesh, Uttaranchal and low in Haryana, Madhya Pradesh and West Bengal. They meet regularly, in many cases every week, save funds, loan funds among members and borrow to carry out economic activities. The regular meetings have become forums for discussing a number of issues affecting them or the community. Participation in self-help groups is compulsory for members as irregular attendance affects them adversely when evaluated for loan schemes by the formal banking sector.
Table A.17. Control over Public Institutions (Public Health Clinics)
State Number of Gram Pachayats covered by 1 PHC Andhra Pradesh, Gujarat, Haryana, Himachal Pradesh, Madhya Pradesh, Maharastra, Punjab and Uttar Pradesh
10 Gram Panchayats
Bihar, Rajasthan, Sikkim and Tamil Nadu 5-10 Gram Panchayats Assam, Karnataka, Orissa and West Bengal 5-3 Gram Panchayats Kerala 1 each Gram Panchayats
Notes: Almost everywhere the middle tier Panchayats have between three to ten PHCs in their geographical area.

OECD Development Centre Working Paper No. 242 DEV/DOC(2005)02
© OECD / ILO 2005
57
APPENDIX I: SURVEY QUESTIONNAIRE
CITIZEN’S SCHEDULE
I. Individual Profile
1. Grama Panchayat: Yes/No 2. Ward Yes/No 3. Respondent’s name 4. Sex: Male/Female 5. Caste: Scheduled Castes and Tribes, OBC, Forward 6. Religion 7. Age (Years) 8. Education (years of schooling) 9. Occupation:
Farmer-1 Trader/Sales/Business-2 Teacher/Doctor-3 Production Transport (food processing, tailor, fitter, driver)-4 Service (catering, hotel, hairdresser, watchman)-5 Manager/Administrator-6 Government servant-7 Other clerical/IOffice worker-8 Unemployed-9 Other-10
10. Land owned by family 11. House type: terraced/tiled/thatched 12. Electrified: Yes/No 13. Do you get a newspaper in your house? Yes/No 14. Do you read it? Yes/No

Institutional Change and its Impact on the Poor and Excluded: The Indian Decentralisation Experience DEV/DOC(2005)02
© OECD / ILO 2005 58
II. Memberships
15. Are you a member of any non-official organisations of the following type?
Name of organisation Member Yes/No
Since when?
In what capacity? ordinary member/active
member/office bearer
Number of meetings attended
last six months
Time spent during the last month (days)
Self-help groups Trade union Farmer’s club Co-operative Political party Religious association Caste association Any other- specify
16. If answer is yes to any question, then has Panchayati Raj - its merits/demerits, etc. – been discussed in any of these meetings? Yes/No
17. Has membership in any organisation helped you, participate in Gram Sabha/Panchayat? Yes/No
Raise issues in Gram Sabha meetings? Yes/No To be a member of Panchayat committees? Yes/No To contest Panchayat elections? Yes/No 18. Has membership in any of the above organisations prevented you from participating
in committees/in raising issues/in contesting elections? Yes/No If so, how? Explain.
III. Participation
19. Did you vote in last Panchayat election? Yes/No 20. If Yes, who decided which candidate to vote for? Myself/husband/caste leader/other caste
leader 21. If no, who prevented you from voting? husband/caste leader/other caste leader 22. Do you think the last election was fair? Yes/No 23. If not fair, why? 24. Did you attend any election meeting? Yes/No 25. Did you campaign for any candidate? Yes/No 26. Have you ever contested a Panchayat election? Yes/No 27. If no, did any one prevent you from contesting? Yes/No

OECD Development Centre Working Paper No. 242 DEV/DOC(2005)02
© OECD / ILO 2005
59
28. Have you participated in any of the following in the last two years?
a) Signed a petition/or written a letter to government/higher Panchayat Yes/No
If Yes, about what?
b) Held a meeting- Yes/No
c) Take part in a protest- Yes/No
d) Organised refusal to co-operate with the Panchayat? Yes/No
29. Have you been able to raise issues in the meeting? Yes/No 30. If yes, did you raise issues of concern to women/poor/Scheduled Castes and Tribes?
Yes/No 31. Did you raise issues related to access to health /education? Yes/No 32. Did you ever sign the attendance register without participating in the meeting? Yes/No 33. How frequently does your ward representative/Sarpanch come to meet you or your
fellow villagers? Once a month/once every 3-5 months/once6-13 months/other/never 34. Have you personally ever contacted a ward member/Sarpanch about a problem affecting
your area/people? Yes/No 35. If yes, what kind of problem? 36. Did you find the person helpful? Yes/No 37. Have you personally contacted a Block Panchayat/Zilla Panchayat member/president
about a problem? Yes/No 38. If yes, what problem? 39. Have you visited the Gram Panchayat office during the last one-year? Yes/No 40. If yes, how many times and for what purpose?
IV. Projects
41. Do you think your Gram Panchayat has been satisfactorily addressing the following issues/providing the following services?
Services Yes/No If no, what is the problem?
Maintenance of roads Sanitation/cleaning Maintenance of water sources Lighting village streets Public assistance/pension, etc. Public Distribution System Health care Education Agricultural extension
(The service providers may be departments, but does the GP address the issue of poor service, if any).
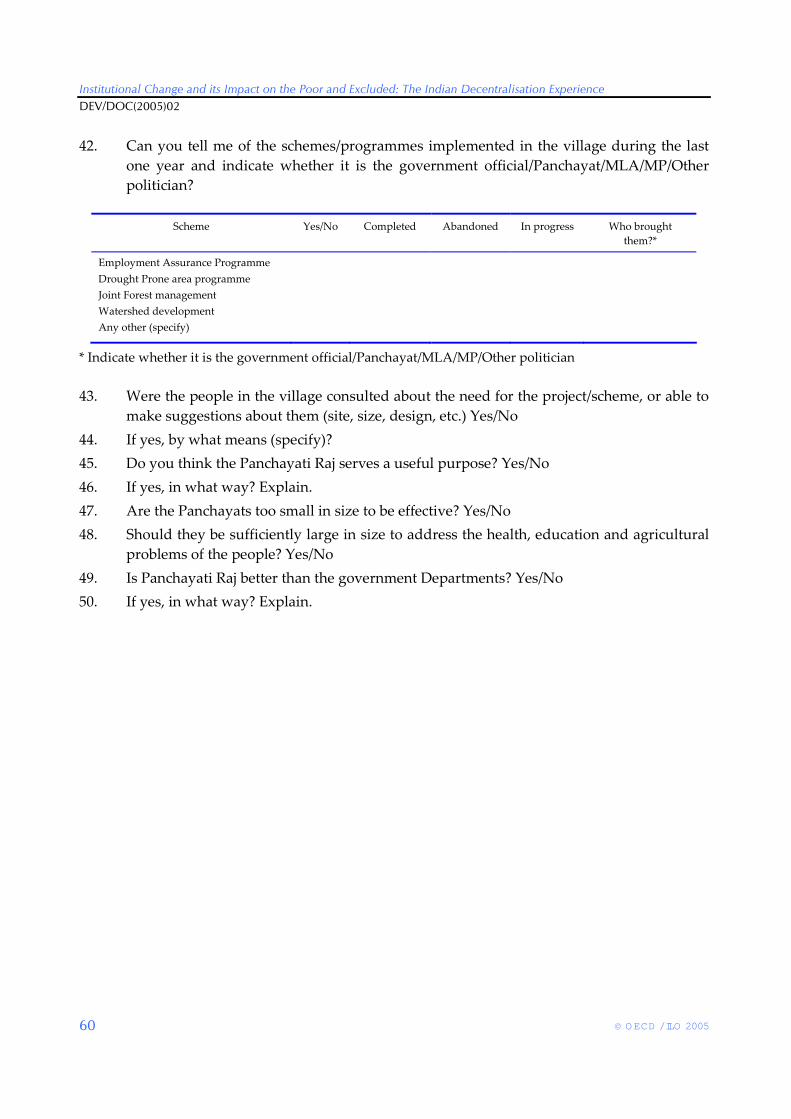
Institutional Change and its Impact on the Poor and Excluded: The Indian Decentralisation Experience DEV/DOC(2005)02
© OECD / ILO 2005 60
42. Can you tell me of the schemes/programmes implemented in the village during the last one year and indicate whether it is the government official/Panchayat/MLA/MP/Other politician?
Scheme Yes/No Completed Abandoned In progress Who brought them?*
Employment Assurance Programme Drought Prone area programme Joint Forest management Watershed development Any other (specify)
* Indicate whether it is the government official/Panchayat/MLA/MP/Other politician
43. Were the people in the village consulted about the need for the project/scheme, or able to make suggestions about them (site, size, design, etc.) Yes/No
44. If yes, by what means (specify)? 45. Do you think the Panchayati Raj serves a useful purpose? Yes/No 46. If yes, in what way? Explain. 47. Are the Panchayats too small in size to be effective? Yes/No 48. Should they be sufficiently large in size to address the health, education and agricultural
problems of the people? Yes/No 49. Is Panchayati Raj better than the government Departments? Yes/No 50. If yes, in what way? Explain.

OECD Development Centre Working Paper No. 242 DEV/DOC(2005)02
© OECD / ILO 2005
61
APPENDIX II: MAPS OF THE SELECTED STATES

Institutional Change and its Impact on the Poor and Excluded: The Indian Decentralisation Experience DEV/DOC(2005)02
© OECD / ILO 2005 62

OECD Development Centre Working Paper No. 242 DEV/DOC(2005)02
© OECD / ILO 2005
63

Institutional Change and its Impact on the Poor and Excluded: The Indian Decentralisation Experience DEV/DOC(2005)02
© OECD / ILO 2005 64
BIBLIOGRAPHY
BEHAR, A. and Y. KUMAR (2002), Decentralisation in Madhya Pradesh, India: from Panchayati Raj to Gram Swaraj (1995 to 2001), Overseas Development Institute, London.
BEHAR, A. (2003), “Madhya Pradesh: Experiment with Direct Democracy, Time for Reappraisal”, Economic and Political Weekly, 17 May.
BLAIR, H. (2000), “Participation and Accountability at the Periphery: Democratic Local Governance in Six Countries”, World Development, Vol. 28(4), pp. 21-39.
CHATTERJEE, P. (2001), “On Civil and Political Societies in Postcolonial Democracies”, in S. KAVIRAJ and S. KHILNANI (eds.), Civil Society: History and Possibilities, Cambridge University Press, Cambridge.
CHATTERJEE, P. (1998), “Introduction”, in P. CHATTERJEE (ed.), Wages of Freedom: Fifty Years of the Indian Nation State, Oxford University Press, Oxford.
CROOK, R.C. and J. MANOR (1998), Democracy and Decentralisation in South Asia and West Africa: Participation, Accountability and Performance, Cambridge University Press, Cambridge.
DESHPANDE, S.V. and G.B.V. MURTHY (2002), “Pressures from Below: Decentralised Governance in Karnataka”, Economic and Political Weekly, 4 May.
ECHEVERRI-GENT, J. (1992), “Public Participation and Poverty Alleviation: The Experience of Reform: Communists in India’s West Bengal”, World Development, Vol. 20(10), pp. 1401-1422.
GHATAK, M. and M. GHATAK (2002), “Recent Reforms in the Panchayat System in West Bengal: Toward Greater Participatory Governance”, Economic and Political Weekly, 5 January, pp. 45-58.
HARRIS, J. (2001), Depoliticizing Development: The World Bank and Social Capital, LeftWord Books, New Delhi.
ISAAC, T.M. and R. FRANKE (2000), Local Democracy and Development: People’s Campaign for Decentralised Planning in Kerala, LeftWord Books, New Delhi.
JOHNSON, C. (2003), “Decentralisation in India: Poverty, Politics and Panchayati Raj”, Working Paper 199, Overseas Development Institute, London.
KOTHARI, R. (1988), State Against Democracy: In Search of Humane Governance, Ajanta, Delhi.
MANOR, J. (1989), “Karnataka: Caste, Class, Dominance and Politics in a Cohesive Society”, in F.R. FRANKEL and M.S.A. RAO (eds.) (1989), Dominance and State Power in Modern India: Decline of a Social Order, Vol. I, Oxford University Press, Delhi.
MAJUMDAR, M. (2000), “Classes for the Masses? Social Ambition, Social Distance and Quality of the Government School System”, Working Paper 158, Madras Institute of Development Studies, Chennai.
MATHEW, G. and A. MATHEW, (2003). “India: Decentralisation and Local Governance: How Clientelism and Accountability Work”, in AXEL HADENIUS (ed.), Decentralisation and Democratic Governance, Elanders Gotab, Stockholm.

OECD Development Centre Working Paper No. 242 DEV/DOC(2005)02
© OECD / ILO 2005
65
MAYO, H.B. (1960), An Introduction to Democratic Theory, Oxford University Press, Oxford.
MITRA, S.K. (2001), “Making Local Government Work: Local Elites, Panchayati Raj and Governance in India”, in ATUL KOHLI (ed.), The Success of India’s Democracy, Cambridge University Press, Cambridge.
NAMBIAR, M. (2001), “Making the Gram Sabha Work”, Economic and Political Weekly, 18 August, pp. 3114-3117.
VERON, R., S. CORBRIDGE, G. WILLIAMS and M. SRIVASTAVA (2003), “The Everday State and Political Society in Eastern India: Structuring Access to the Employment Assurance Scheme”, Journal of Development Studies, Vol. 39(5), pp. 1-28.
VYASULU, V. (2003), Panchayats, Democracy and Development, Rawat Publications, New Delhi.
WEINER, M. (2001), “The Struggle for Equality: Caste in Indian Politics in Atul Kohli”, The Success of India’s Democracy, Cambridge University Press, Cambridge.
WILLIAMS, G., M. SRIVASTAVA, S. CORBRIDGE and R. VERON (2003), “Enhancing Pro-Poor Governance in Eastern India: Participation, Politics and Action Rsearch”, Progress in Development Studies, Vol. 3(2), pp. 159-178.

Institutional Change and its Impact on the Poor and Excluded: The Indian Decentralisation Experience DEV/DOC(2005)02
© OECD / ILO 2005 66
OTHER TITLES IN THE SERIES/ AUTRES TITRES DANS LA SÉRIE
The former series known as “Technical Papers” and “Webdocs” merged in November 2003 into “Development Centre Working Papers”. In the new series, former Webdocs 1-17 follow
former Technical Papers 1-212 as Working Papers 213-229.
All these documents may be downloaded from: http://www.oecd.org/dev/wp or obtained via e-mail ([email protected]).
Working Paper No.1, Macroeconomic Adjustment and Income Distribution: A Macro-Micro Simulation Model, by François Bourguignon, William H. Branson and Jaime de Melo, March 1989. Working Paper No. 2, International Interactions in Food and Agricultural Policies: The Effect of Alternative Policies, by Joachim Zietz and Alberto Valdés, April, 1989. Working Paper No. 3, The Impact of Budget Retrenchment on Income Distribution in Indonesia: A Social Accounting Matrix Application, by Steven Keuning and Erik Thorbecke, June 1989. Working Paper No. 3a, Statistical Annex: The Impact of Budget Retrenchment, June 1989. Document de travail No. 4, Le Rééquilibrage entre le secteur public et le secteur privé : le cas du Mexique, par C.-A. Michalet, juin 1989. Working Paper No. 5, Rebalancing the Public and Private Sectors: The Case of Malaysia, by R. Leeds, July 1989. Working Paper No. 6, Efficiency, Welfare Effects, and Political Feasibility of Alternative Antipoverty and Adjustment Programs, by Alain de Janvry and Elisabeth Sadoulet, December 1989. Document de travail No. 7, Ajustement et distribution des revenus : application d’un modèle macro-micro au Maroc, par Christian Morrisson, avec la collaboration de Sylvie Lambert et Akiko Suwa, décembre 1989. Working Paper No. 8, Emerging Maize Biotechnologies and their Potential Impact, by W. Burt Sundquist, December 1989. Document de travail No. 9, Analyse des variables socio-culturelles et de l’ajustement en Côte d’Ivoire, par W. Weekes-Vagliani, janvier 1990. Working Paper No. 10, A Financial Computable General Equilibrium Model for the Analysis of Ecuador’s Stabilization Programs, by André Fargeix and Elisabeth Sadoulet, February 1990. Working Paper No. 11, Macroeconomic Aspects, Foreign Flows and Domestic Savings Performance in Developing Countries: A ”State of The Art” Report, by Anand Chandavarkar, February 1990. Working Paper No. 12, Tax Revenue Implications of the Real Exchange Rate: Econometric Evidence from Korea and Mexico, by Viriginia Fierro and Helmut Reisen, February 1990. Working Paper No. 13, Agricultural Growth and Economic Development: The Case of Pakistan, by Naved Hamid and Wouter Tims, April 1990. Working Paper No. 14, Rebalancing the Public and Private Sectors in Developing Countries: The Case of Ghana, by H. Akuoko-Frimpong, June 1990. Working Paper No. 15, Agriculture and the Economic Cycle: An Economic and Econometric Analysis with Special Reference to Brazil, by Florence Contré and Ian Goldin, June 1990. Working Paper No. 16, Comparative Advantage: Theory and Application to Developing Country Agriculture, by Ian Goldin, June 1990. Working Paper No. 17, Biotechnology and Developing Country Agriculture: Maize in Brazil, by Bernardo Sorj and John Wilkinson, June 1990. Working Paper No. 18, Economic Policies and Sectoral Growth: Argentina 1913-1984, by Yair Mundlak, Domingo Cavallo, Roberto Domenech, June 1990. Working Paper No. 19, Biotechnology and Developing Country Agriculture: Maize In Mexico, by Jaime A. Matus Gardea, Arturo Puente Gonzalez and Cristina Lopez Peralta, June 1990. Working Paper No. 20, Biotechnology and Developing Country Agriculture: Maize in Thailand, by Suthad Setboonsarng, July 1990.

OECD Development Centre Working Paper No. 242 DEV/DOC(2005)02
© OECD / ILO 2005
67
Working Paper No. 21, International Comparisons of Efficiency in Agricultural Production, by Guillermo Flichmann, July 1990. Working Paper No. 22, Unemployment in Developing Countries: New Light on an Old Problem, by David Turnham and Denizhan Eröcal, July 1990. Working Paper No. 23, Optimal Currency Composition of Foreign Debt: the Case of Five Developing Countries, by Pier Giorgio Gawronski, August 1990. Working Paper No. 24, From Globalization to Regionalization: the Mexican Case, by Wilson Peres Núñez, August 1990. Working Paper No. 25, Electronics and Development in Venezuela: A User-Oriented Strategy and its Policy Implications, by Carlota Perez, October 1990. Working Paper No. 26, The Legal Protection of Software: Implications for Latecomer Strategies in Newly Industrialising Economies (NIEs) and Middle-Income Economies (MIEs), by Carlos Maria Correa, October 1990. Working Paper No. 27, Specialization, Technical Change and Competitiveness in the Brazilian Electronics Industry, by Claudio R. Frischtak, October 1990. Working Paper No. 28, Internationalization Strategies of Japanese Electronics Companies: Implications for Asian Newly Industrializing Economies (NIEs), by Bundo Yamada, October 1990. Working Paper No. 29, The Status and an Evaluation of the Electronics Industry in Taiwan, by Gee San, October 1990. Working Paper No. 30, The Indian Electronics Industry: Current Status, Perspectives and Policy Options, by Ghayur Alam, October 1990. Working Paper No. 31, Comparative Advantage in Agriculture in Ghana, by James Pickett and E. Shaeeldin, October 1990. Working Paper No. 32, Debt Overhang, Liquidity Constraints and Adjustment Incentives, by Bert Hofman and Helmut Reisen, October 1990. Working Paper No. 34, Biotechnology and Developing Country Agriculture: Maize in Indonesia, by Hidjat Nataatmadja et al., January 1991. Working Paper No. 35, Changing Comparative Advantage in Thai Agriculture, by Ammar Siamwalla, Suthad Setboonsarng and Prasong Werakarnjanapongs, March 1991. Working Paper No. 36, Capital Flows and the External Financing of Turkey’s Imports, by Ziya Önis and Süleyman Özmucur, July 1991. Working Paper No. 37, The External Financing of Indonesia’s Imports, by Glenn P. Jenkins and Henry B.F. Lim, July 1991. Working Paper No. 38, Long-term Capital Reflow under Macroeconomic Stabilization in Latin America, by Beatriz Armendariz de Aghion, July 1991. Working Paper No. 39, Buybacks of LDC Debt and the Scope for Forgiveness, by Beatriz Armendariz de Aghion, July 1991. Working Paper No. 40, Measuring and Modelling Non-Tariff Distortions with Special Reference to Trade in Agricultural Commodities, by Peter J. Lloyd, July 1991. Working Paper No. 41, The Changing Nature of IMF Conditionality, by Jacques J. Polak, August 1991. Working Paper No. 42, Time-Varying Estimates on the Openness of the Capital Account in Korea and Taiwan, by Helmut Reisen and Hélène Yèches, August 1991. Working Paper No. 43, Toward a Concept of Development Agreements, by F. Gerard Adams, August 1991. Document de travail No. 44, Le Partage du fardeau entre les créanciers de pays débiteurs défaillants, par Jean-Claude Berthélemy et Ann Vourc’h, septembre 1991. Working Paper No. 45, The External Financing of Thailand’s Imports, by Supote Chunanunthathum, October 1991. Working Paper No. 46, The External Financing of Brazilian Imports, by Enrico Colombatto, with Elisa Luciano, Luca Gargiulo, Pietro Garibaldi and Giuseppe Russo, October 1991. Working Paper No. 47, Scenarios for the World Trading System and their Implications for Developing Countries, by Robert Z. Lawrence, November 1991. Working Paper No. 48, Trade Policies in a Global Context: Technical Specifications of the Rural/Urban-North/South (RUNS) Applied General Equilibrium Model, by Jean-Marc Burniaux and Dominique van der Mensbrugghe, November 1991. Working Paper No. 49, Macro-Micro Linkages: Structural Adjustment and Fertilizer Policy in Sub-Saharan Africa, by Jean-Marc Fontaine with the collaboration of Alice Sindzingre, December 1991. Working Paper No. 50, Aggregation by Industry in General Equilibrium Models with International Trade, by Peter J. Lloyd, December 1991. Working Paper No. 51, Policy and Entrepreneurial Responses to the Montreal Protocol: Some Evidence from the Dynamic Asian Economies, by David C. O’Connor, December 1991. Working Paper No. 52, On the Pricing of LDC Debt: an Analysis Based on Historical Evidence from Latin America, by Beatriz Armendariz de Aghion, February 1992. Working Paper No. 53, Economic Regionalisation and Intra-Industry Trade: Pacific-Asian Perspectives, by Kiichiro Fukasaku, February 1992. Working Paper No. 54, Debt Conversions in Yugoslavia, by Mojmir Mrak, February 1992. Working Paper No. 55, Evaluation of Nigeria’s Debt-Relief Experience (1985-1990), by N.E. Ogbe, March 1992. Document de travail No. 56, L’Expérience de l’allégement de la dette du Mali, par Jean-Claude Berthélemy, février 1992. Working Paper No. 57, Conflict or Indifference: US Multinationals in a World of Regional Trading Blocs, by Louis T. Wells, Jr., March 1992. Working Paper No. 58, Japan’s Rapidly Emerging Strategy Toward Asia, by Edward J. Lincoln, April 1992.

Institutional Change and its Impact on the Poor and Excluded: The Indian Decentralisation Experience DEV/DOC(2005)02
© OECD / ILO 2005 68
Working Paper No. 59, The Political Economy of Stabilization Programmes in Developing Countries, by Bruno S. Frey and Reiner Eichenberger, April 1992. Working Paper No. 60, Some Implications of Europe 1992 for Developing Countries, by Sheila Page, April 1992. Working Paper No. 61, Taiwanese Corporations in Globalisation and Regionalisation, by Gee San, April 1992. Working Paper No. 62, Lessons from the Family Planning Experience for Community-Based Environmental Education, by Winifred Weekes-Vagliani, April 1992. Working Paper No. 63, Mexican Agriculture in the Free Trade Agreement: Transition Problems in Economic Reform, by Santiago Levy and Sweder van Wijnbergen, May 1992. Working Paper No. 64, Offensive and Defensive Responses by European Multinationals to a World of Trade Blocs, by John M. Stopford, May 1992. Working Paper No. 65, Economic Integration in the Pacific Region, by Richard Drobnick, May 1992. Working Paper No. 66, Latin America in a Changing Global Environment, by Winston Fritsch, May 1992. Working Paper No. 67, An Assessment of the Brady Plan Agreements, by Jean-Claude Berthélemy and Robert Lensink, May 1992. Working Paper No. 68, The Impact of Economic Reform on the Performance of the Seed Sector in Eastern and Southern Africa, by Elizabeth Cromwell, June 1992. Working Paper No. 69, Impact of Structural Adjustment and Adoption of Technology on Competitiveness of Major Cocoa Producing Countries, by Emily M. Bloomfield and R. Antony Lass, June 1992. Working Paper No. 70, Structural Adjustment and Moroccan Agriculture: an Assessment of the Reforms in the Sugar and Cereal Sectors, by Jonathan Kydd and Sophie Thoyer, June 1992. Document de travail No. 71, L’Allégement de la dette au Club de Paris : les évolutions récentes en perspective, par Ann Vourc’h, juin 1992. Working Paper No. 72, Biotechnology and the Changing Public/Private Sector Balance: Developments in Rice and Cocoa, by Carliene Brenner, July 1992. Working Paper No. 73, Namibian Agriculture: Policies and Prospects, by Walter Elkan, Peter Amutenya, Jochbeth Andima, Robin Sherbourne and Eline van der Linden, July 1992. Working Paper No. 74, Agriculture and the Policy Environment: Zambia and Zimbabwe, by Doris J. Jansen and Andrew Rukovo, July 1992. Working Paper No. 75, Agricultural Productivity and Economic Policies: Concepts and Measurements, by Yair Mundlak, August 1992. Working Paper No. 76, Structural Adjustment and the Institutional Dimensions of Agricultural Research and Development in Brazil: Soybeans, Wheat and Sugar Cane, by John Wilkinson and Bernardo Sorj, August 1992. Working Paper No. 77, The Impact of Laws and Regulations on Micro and Small Enterprises in Niger and Swaziland, by Isabelle Joumard, Carl Liedholm and Donald Mead, September 1992. Working Paper No. 78, Co-Financing Transactions between Multilateral Institutions and International Banks, by Michel Bouchet and Amit Ghose, October 1992. Document de travail No. 79, Allégement de la dette et croissance : le cas mexicain, par Jean-Claude Berthélemy et Ann Vourc’h, octobre 1992. Document de travail No. 80, Le Secteur informel en Tunisie : cadre réglementaire et pratique courante, par Abderrahman Ben Zakour et Farouk Kria, novembre 1992. Working Paper No. 81, Small-Scale Industries and Institutional Framework in Thailand, by Naruemol Bunjongjit and Xavier Oudin, November 1992. Working Paper No. 81a, Statistical Annex: Small-Scale Industries and Institutional Framework in Thailand, by Naruemol Bunjongjit and Xavier Oudin, November 1992. Document de travail No. 82, L’Expérience de l’allégement de la dette du Niger, par Ann Vourc’h et Maina Boukar Moussa, novembre 1992. Working Paper No. 83, Stabilization and Structural Adjustment in Indonesia: an Intertemporal General Equilibrium Analysis, by David Roland-Holst, November 1992. Working Paper No. 84, Striving for International Competitiveness: Lessons from Electronics for Developing Countries, by Jan Maarten de Vet, March 1993. Document de travail No. 85, Micro-entreprises et cadre institutionnel en Algérie, par Hocine Benissad, mars 1993. Working Paper No. 86, Informal Sector and Regulations in Ecuador and Jamaica, by Emilio Klein and Victor E. Tokman, August 1993. Working Paper No. 87, Alternative Explanations of the Trade-Output Correlation in the East Asian Economies, by Colin I. Bradford Jr. and Naomi Chakwin, August 1993. Document de travail No. 88, La Faisabilité politique de l’ajustement dans les pays africains, par Christian Morrisson, Jean-Dominique Lafay et Sébastien Dessus, novembre 1993. Working Paper No. 89, China as a Leading Pacific Economy, by Kiichiro Fukasaku and Mingyuan Wu, November 1993. Working Paper No. 90, A Detailed Input-Output Table for Morocco, 1990, by Maurizio Bussolo and David Roland-Holst November 1993. Working Paper No. 91, International Trade and the Transfer of Environmental Costs and Benefits, by Hiro Lee and David Roland-Holst, December 1993. Working Paper No. 92, Economic Instruments in Environmental Policy: Lessons from the OECD Experience and their Relevance to Developing Economies, by Jean-Philippe Barde, January 1994.

OECD Development Centre Working Paper No. 242 DEV/DOC(2005)02
© OECD / ILO 2005
69
Working Paper No. 93, What Can Developing Countries Learn from OECD Labour Market Programmes and Policies?, by Åsa Sohlman with David Turnham, January 1994. Working Paper No. 94, Trade Liberalization and Employment Linkages in the Pacific Basin, by Hiro Lee and David Roland-Holst, February 1994. Working Paper No. 95, Participatory Development and Gender: Articulating Concepts and Cases, by Winifred Weekes-Vagliani, February 1994. Document de travail No. 96, Promouvoir la maîtrise locale et régionale du développement : une démarche participative à Madagascar, par Philippe de Rham et Bernard Lecomte, juin 1994. Working Paper No. 97, The OECD Green Model: an Updated Overview, by Hiro Lee, Joaquim Oliveira-Martins and Dominique van der Mensbrugghe, August 1994. Working Paper No. 98, Pension Funds, Capital Controls and Macroeconomic Stability, by Helmut Reisen and John Williamson, August 1994. Working Paper No. 99, Trade and Pollution Linkages: Piecemeal Reform and Optimal Intervention, by John Beghin, David Roland-Holst and Dominique van der Mensbrugghe, October 1994. Working Paper No. 100, International Initiatives in Biotechnology for Developing Country Agriculture: Promises and Problems, by Carliene Brenner and John Komen, October 1994. Working Paper No. 101, Input-based Pollution Estimates for Environmental Assessment in Developing Countries, by Sébastien Dessus, David Roland-Holst and Dominique van der Mensbrugghe, October 1994. Working Paper No. 102, Transitional Problems from Reform to Growth: Safety Nets and Financial Efficiency in the Adjusting Egyptian Economy, by Mahmoud Abdel-Fadil, December 1994. Working Paper No. 103, Biotechnology and Sustainable Agriculture: Lessons from India, by Ghayur Alam, December 1994. Working Paper No. 104, Crop Biotechnology and Sustainability: a Case Study of Colombia, by Luis R. Sanint, January 1995. Working Paper No. 105, Biotechnology and Sustainable Agriculture: the Case of Mexico, by José Luis Solleiro Rebolledo, January 1995. Working Paper No. 106, Empirical Specifications for a General Equilibrium Analysis of Labor Market Policies and Adjustments, by Andréa Maechler and David Roland-Holst, May 1995. Document de travail No. 107, Les Migrants, partenaires de la coopération internationale : le cas des Maliens de France, par Christophe Daum, juillet 1995. Document de travail No. 108, Ouverture et croissance industrielle en Chine : étude empirique sur un échantillon de villes, par Sylvie Démurger, septembre 1995. Working Paper No. 109, Biotechnology and Sustainable Crop Production in Zimbabwe, by John J. Woodend, December 1995. Document de travail No. 110, Politiques de l’environnement et libéralisation des échanges au Costa Rica : une vue d’ensemble, par Sébastien Dessus et Maurizio Bussolo, février 1996. Working Paper No. 111, Grow Now/Clean Later, or the Pursuit of Sustainable Development?, by David O’Connor, March 1996. Working Paper No. 112, Economic Transition and Trade-Policy Reform: Lessons from China, by Kiichiro Fukasaku and Henri-Bernard Solignac Lecomte, July 1996. Working Paper No. 113, Chinese Outward Investment in Hong Kong: Trends, Prospects and Policy Implications, by Yun-Wing Sung, July 1996. Working Paper No. 114, Vertical Intra-industry Trade between China and OECD Countries, by Lisbeth Hellvin, July 1996. Document de travail No. 115, Le Rôle du capital public dans la croissance des pays en développement au cours des années 80, par Sébastien Dessus et Rémy Herrera, juillet 1996. Working Paper No. 116, General Equilibrium Modelling of Trade and the Environment, by John Beghin, Sébastien Dessus, David Roland-Holst and Dominique van der Mensbrugghe, September 1996. Working Paper No. 117, Labour Market Aspects of State Enterprise Reform in Viet Nam, by David O’Connor, September 1996. Document de travail No. 118, Croissance et compétitivité de l’industrie manufacturière au Sénégal, par Thierry Latreille et Aristomène Varoudakis, octobre 1996. Working Paper No. 119, Evidence on Trade and Wages in the Developing World, by Donald J. Robbins, December 1996. Working Paper No. 120, Liberalising Foreign Investments by Pension Funds: Positive and Normative Aspects, by Helmut Reisen, January 1997. Document de travail No. 121, Capital Humain, ouverture extérieure et croissance : estimation sur données de panel d’un modèle à coefficients variables, par Jean-Claude Berthélemy, Sébastien Dessus et Aristomène Varoudakis, janvier 1997. Working Paper No. 122, Corruption: The Issues, by Andrew W. Goudie and David Stasavage, January 1997. Working Paper No. 123, Outflows of Capital from China, by David Wall, March 1997. Working Paper No. 124, Emerging Market Risk and Sovereign Credit Ratings, by Guillermo Larraín, Helmut Reisen and Julia von Maltzan, April 1997. Working Paper No. 125, Urban Credit Co-operatives in China, by Eric Girardin and Xie Ping, August 1997. Working Paper No. 126, Fiscal Alternatives of Moving from Unfunded to Funded Pensions, by Robert Holzmann, August 1997. Working Paper No. 127, Trade Strategies for the Southern Mediterranean, by Peter A. Petri, December 1997. Working Paper No. 128, The Case of Missing Foreign Investment in the Southern Mediterranean, by Peter A. Petri, December 1997.

Institutional Change and its Impact on the Poor and Excluded: The Indian Decentralisation Experience DEV/DOC(2005)02
© OECD / ILO 2005 70
Working Paper No. 129, Economic Reform in Egypt in a Changing Global Economy, by Joseph Licari, December 1997. Working Paper No. 130, Do Funded Pensions Contribute to Higher Aggregate Savings? A Cross-Country Analysis, by Jeanine Bailliu and Helmut Reisen, December 1997. Working Paper No. 131, Long-run Growth Trends and Convergence Across Indian States, by Rayaprolu Nagaraj, Aristomène Varoudakis and Marie-Ange Véganzonès, January 1998. Working Paper No. 132, Sustainable and Excessive Current Account Deficits, by Helmut Reisen, February 1998. Working Paper No. 133, Intellectual Property Rights and Technology Transfer in Developing Country Agriculture: Rhetoric and Reality, by Carliene Brenner, March 1998. Working Paper No. 134, Exchange-rate Management and Manufactured Exports in Sub-Saharan Africa, by Khalid Sekkat and Aristomène Varoudakis, March 1998. Working Paper No. 135, Trade Integration with Europe, Export Diversification and Economic Growth in Egypt, by Sébastien Dessus and Akiko Suwa-Eisenmann, June 1998. Working Paper No. 136, Domestic Causes of Currency Crises: Policy Lessons for Crisis Avoidance, by Helmut Reisen, June 1998. Working Paper No. 137, A Simulation Model of Global Pension Investment, by Landis MacKellar and Helmut Reisen, August 1998. Working Paper No. 138, Determinants of Customs Fraud and Corruption: Evidence from Two African Countries, by David Stasavage and Cécile Daubrée, August 1998. Working Paper No. 139, State Infrastructure and Productive Performance in Indian Manufacturing, by Arup Mitra, Aristomène Varoudakis and Marie-Ange Véganzonès, August 1998. Working Paper No. 140, Rural Industrial Development in Viet Nam and China: A Study in Contrasts, by David O’Connor, September 1998. Working Paper No. 141,Labour Market Aspects of State Enterprise Reform in China, by Fan Gang,Maria Rosa Lunati and David O’Connor, October 1998. Working Paper No. 142, Fighting Extreme Poverty in Brazil: The Influence of Citizens’ Action on Government Policies, by Fernanda Lopes de Carvalho, November 1998. Working Paper No. 143, How Bad Governance Impedes Poverty Alleviation in Bangladesh, by Rehman Sobhan, November 1998. Document de travail No. 144, La libéralisation de l’agriculture tunisienne et l’Union européenne: une vue prospective, par Mohamed Abdelbasset Chemingui et Sébastien Dessus, février 1999. Working Paper No. 145, Economic Policy Reform and Growth Prospects in Emerging African Economies, by Patrick Guillaumont, Sylviane Guillaumont Jeanneney and Aristomène Varoudakis, March 1999. Working Paper No. 146, Structural Policies for International Competitiveness in Manufacturing: The Case of Cameroon, by Ludvig Söderling, March 1999. Working Paper No. 147, China’s Unfinished Open-Economy Reforms: Liberalisation of Services, by Kiichiro Fukasaku, Yu Ma and Qiumei Yang, April 1999. Working Paper No. 148, Boom and Bust and Sovereign Ratings, by Helmut Reisen and Julia von Maltzan, June 1999. Working Paper No. 149, Economic Opening and the Demand for Skills in Developing Countries: A Review of Theory and Evidence, by David O’Connor and Maria Rosa Lunati, June 1999. Working Paper No. 150, The Role of Capital Accumulation, Adjustment and Structural Change for Economic Take-off: Empirical Evidence from African Growth Episodes, by Jean-Claude Berthélemy and Ludvig Söderling, July 1999. Working Paper No. 151, Gender, Human Capital and Growth: Evidence from Six Latin American Countries, by Donald J. Robbins, September 1999. Working Paper No. 152, The Politics and Economics of Transition to an Open Market Economy in Viet Nam, by James Riedel and William S. Turley, September 1999. Working Paper No. 153, The Economics and Politics of Transition to an Open Market Economy: China, by Wing Thye Woo, October 1999. Working Paper No. 154, Infrastructure Development and Regulatory Reform in Sub-Saharan Africa: The Case of Air Transport, by Andrea E. Goldstein, October 1999. Working Paper No. 155, The Economics and Politics of Transition to an Open Market Economy: India, by Ashok V. Desai, October 1999. Working Paper No. 156, Climate Policy Without Tears: CGE-Based Ancillary Benefits Estimates for Chile, by Sébastien Dessus and David O’Connor, November 1999. Document de travail No. 157, Dépenses d’éducation, qualité de l’éducation et pauvreté : l’exemple de cinq pays d’Afrique francophone, par Katharina Michaelowa, avril 2000. Document de travail No. 158, Une estimation de la pauvreté en Afrique subsaharienne d’après les données anthropométriques, par Christian Morrisson, Hélène Guilmeau et Charles Linskens, mai 2000. Working Paper No. 159, Converging European Transitions, by Jorge Braga de Macedo, July 2000. Working Paper No. 160, Capital Flows and Growth in Developing Countries: Recent Empirical Evidence, by Marcelo Soto, July 2000. Working Paper No. 161, Global Capital Flows and the Environment in the 21st Century, by David O’Connor, July 2000. Working Paper No. 162, Financial Crises and International Architecture: A “Eurocentric” Perspective, by Jorge Braga de Macedo, August 2000. Document de travail No. 163, Résoudre le problème de la dette : de l’initiative PPTE à Cologne, par Anne Joseph, août 2000.

OECD Development Centre Working Paper No. 242 DEV/DOC(2005)02
© OECD / ILO 2005
71
Working Paper No. 164, E-Commerce for Development: Prospects and Policy Issues, by Andrea Goldstein and David O’Connor, September 2000. Working Paper No. 165, Negative Alchemy? Corruption and Composition of Capital Flows, by Shang-Jin Wei, October 2000. Working Paper No. 166, The HIPC Initiative: True and False Promises, by Daniel Cohen, October 2000. Document de travail No. 167, Les facteurs explicatifs de la malnutrition en Afrique subsaharienne, par Christian Morrisson et Charles Linskens, octobre 2000. Working Paper No. 168, Human Capital and Growth: A Synthesis Report, by Christopher A. Pissarides, November 2000. Working Paper No. 169, Obstacles to Expanding Intra-African Trade, by Roberto Longo and Khalid Sekkat, March 2001. Working Paper No. 170, Regional Integration In West Africa, by Ernest Aryeetey, March 2001. Working Paper No. 171, Regional Integration Experience in the Eastern African Region, by Andrea Goldstein and Njuguna S. Ndung’u, March 2001. Working Paper No. 172, Integration and Co-operation in Southern Africa, by Carolyn Jenkins, March 2001. Working Paper No. 173, FDI in Sub-Saharan Africa, by Ludger Odenthal, March 2001 Document de travail No. 174, La réforme des télécommunications en Afrique subsaharienne, par Patrick Plane, mars 2001. Working Paper No. 175, Fighting Corruption in Customs Administration: What Can We Learn from Recent Experiences?, by Irène Hors; April 2001. Working Paper No. 176, Globalisation and Transformation: Illusions and Reality, by Grzegorz W. Kolodko, May 2001. Working Paper No. 177, External Solvency, Dollarisation and Investment Grade: Towards a Virtuous Circle?, by Martin Grandes, June 2001. Document de travail No. 178, Congo 1965-1999: Les espoirs déçus du « Brésil africain », par Joseph Maton avec Henri-Bernard Solignac Lecomte, septembre 2001. Working Paper No. 179, Growth and Human Capital: Good Data, Good Results, by Daniel Cohen and Marcelo Soto, September 2001. Working Paper No. 180, Corporate Governance and National Development, by Charles P. Oman, October 2001. Working Paper No. 181, How Globalisation Improves Governance, by Federico Bonaglia, Jorge Braga de Macedo and Maurizio Bussolo, November 2001. Working Paper No. 182, Clearing the Air in India: The Economics of Climate Policy with Ancillary Benefits, by Maurizio Bussolo and David O’Connor, November 2001. Working Paper No. 183, Globalisation, Poverty and Inequality in sub-Saharan Africa: A Political Economy Appraisal, by Yvonne M. Tsikata, December 2001. Working Paper No. 184, Distribution and Growth in Latin America in an Era of Structural Reform: The Impact of Globalisation, by Samuel A. Morley, December 2001. Working Paper No. 185, Globalisation, Liberalisation, Poverty and Income Inequality in Southeast Asia, by K.S. Jomo, December 2001. Working Paper No. 186, Globalisation, Growth and Income Inequality: The African Experience, by Steve Kayizzi-Mugerwa, December 2001. Working Paper No. 187, The Social Impact of Globalisation in Southeast Asia, by Mari Pangestu, December 2001. Working Paper No. 188, Where Does Inequality Come From? Ideas and Implications for Latin America, by James A. Robinson, December 2001. Working Paper No. 189, Policies and Institutions for E-Commerce Readiness: What Can Developing Countries Learn from OECD Experience?, by Paulo Bastos Tigre and David O’Connor, April 2002. Document de travail No. 190, La réforme du secteur financier en Afrique, par Anne Joseph, juillet 2002. Working Paper No. 191, Virtuous Circles? Human Capital Formation, Economic Development and the Multinational Enterprise, by Ethan B. Kapstein, August 2002. Working Paper No. 192, Skill Upgrading in Developing Countries: Has Inward Foreign Direct Investment Played a Role?, by Matthew J. Slaughter, August 2002. Working Paper No. 193, Government Policies for Inward Foreign Direct Investment in Developing Countries: Implications for Human Capital Formation and Income Inequality, by Dirk Willem te Velde, August 2002. Working Paper No. 194, Foreign Direct Investment and Intellectual Capital Formation in Southeast Asia, by Bryan K. Ritchie, August 2002. Working Paper No. 195, FDI and Human Capital: A Research Agenda, by Magnus Blomström and Ari Kokko, August 2002. Working Paper No. 196, Knowledge Diffusion from Multinational Enterprises: The Role of Domestic and Foreign Knowledge-Enhancing Activities, by Yasuyuki Todo and Koji Miyamoto, August 2002. Working Paper No. 197, Why Are Some Countries So Poor? Another Look at the Evidence and a Message of Hope, by Daniel Cohen and Marcelo Soto, October 2002. Working Paper No. 198, Choice of an Exchange-Rate Arrangement, Institutional Setting and Inflation: Empirical Evidence from Latin America, by Andreas Freytag, October 2002. Working Paper No. 199, Will Basel II Affect International Capital Flows to Emerging Markets?, by Beatrice Weder and Michael Wedow, October 2002. Working Paper No. 200, Convergence and Divergence of Sovereign Bond Spreads: Lessons from Latin America, by Martin Grandes, October 2002.

Institutional Change and its Impact on the Poor and Excluded: The Indian Decentralisation Experience DEV/DOC(2005)02
© OECD / ILO 2005 72
Working Paper No. 201, Prospects for Emerging-Market Flows amid Investor Concerns about Corporate Governance, by Helmut Reisen, November 2002. Working Paper No. 202, Rediscovering Education in Growth Regressions, by Marcelo Soto, November 2002. Working Paper No. 203, Incentive Bidding for Mobile Investment: Economic Consequences and Potential Responses, by Andrew Charlton, January 2003. Working Paper No. 204, Health Insurance for the Poor? Determinants of participation Community-Based Health Insurance Schemes in Rural Senegal, by Johannes Jütting, January 2003. Working Paper No. 205, China’s Software Industry and its Implications for India, by Ted Tschang, February 2003. Working Paper No. 206, Agricultural and Human Health Impacts of Climate Policy in China: A General Equilibrium Analysis with Special Reference to Guangdong, by David O’Connor, Fan Zhai, Kristin Aunan, Terje Berntsen and Haakon Vennemo, March 2003. Working Paper No. 207, India’s Information Technology Sector: What Contribution to Broader Economic Development?, by Nirvikar Singh, March 2003. Working Paper No. 208, Public Procurement: Lessons from Kenya, Tanzania and Uganda, by Walter Odhiambo and Paul Kamau, March 2003. Working Paper No. 209, Export Diversification in Low-Income Countries: An International Challenge after Doha, by Federico Bonaglia and Kiichiro Fukasaku, June 2003. Working Paper No. 210, Institutions and Development: A Critical Review, by Johannes Jütting, July 2003. Working Paper No. 211, Human Capital Formation and Foreign Direct Investment in Developing Countries, by Koji Miyamoto, July 2003. Working Paper No. 212, Central Asia since 1991: The Experience of the New Independent States, by Richard Pomfret, July 2003. Working Paper No. 213, A Multi-Region Social Accounting Matrix (1995) and Regional Environmental General Equilibrium Model for India (REGEMI), by Maurizio Bussolo, Mohamed Chemingui and David O’Connor, November 2003. Working Paper No. 214, Ratings Since the Asian Crisis, by Helmut Reisen, November 2003. Working Paper No. 215, Development Redux: Reflactions for a New Paradigm, by Jorge Braga de Macedo, November 2003. Working Paper No. 216, The Political Economy of Regulatory Reform: Telecoms in the Southern Mediterranean, by Andrea Goldstein, November 2003. Working Paper No. 217, The Impact of Education on Fertility and Child Mortality: Do Fathers Really Matter Less than Mothers?, by Lucia Breierova and Esther Duflo, November 2003. Working Paper No. 218, Float in Order to Fix? Lessons from Emerging Markets for EU Accession Countries, by Jorge Braga de Macedo and Helmut Reisen, November 2003. Working Paper No. 219, Globalisation in Developing Countries: The Role of Transaction Costs in Explaining Economic Performance in India, by Maurizio Bussolo and John Whalley, November 2003. Working Paper No. 220, Poverty Reduction Strategies in a Budget-Constrained Economy: The Case of Ghana, by Maurizio Bussolo and Jeffery I. Round, November 2003. Working Paper No. 221, Public-Private Partnerships in Development: Three Applications in Timor Leste, by José Braz, November 2003. Working Paper No. 222, Public Opinion Research, Global Education and Development Co-operation Reform: In Search of a Virtuous Circle, by Ida Mc Donnell, Henri-Bernard Solignac Lecomte and Liam Wegimont, November 2003. Working Paper No. 223, Building Capacity to Trade: What Are the Priorities?, by Henry-Bernard Solignac Lecomte, November 2003. Working Paper No. 224, Of Flying Geeks and O-Rings: Locating Software and IT Services in India’s Economic Development, by David O’Connor, November 2003. Document de travail No. 225, Cap Vert: Gouvernance et Développement, par Jaime Lourenço and Colm Foy, novembre 2003. Working Paper No. 226, Globalisation and Poverty Changes in Colombia, by Maurizio Bussolo and Jann Lay, November 2003. Working Paper No. 227, The Composite Indicator of Economic Activity in Mozambique (ICAE): Filling in the Knowledge Gaps to Enhance Public-Private Partnership (PPP), by Roberto J. Tibana, November 2003. Working Paper No. 228, Economic-Reconstruction in Post-Conflict Transitions: Lessons for the Democratic Republic of Congo (DRC), by Graciana del Castillo, November 2003. Working Paper No. 229, Providing Low-Cost Information Technology Access to Rural Communities In Developing Countries: What Works? What Pays? by Georg Caspary and David O’Connor, November 2003. Working Paper No. 230, The Currency Premium and Local-Currency Denominated Debt Costs in South Africa, by Martin Grandes, Marcel Peter and Nicolas Pinaud, December 2003. Working Paper No. 231, Macroeconomic Convergence in Southern Africa: The Rand Zone Experience, by Martin Grandes, December 2003. Working Paper No. 232, Financing Global and Regional Public Goods through ODA: Analysis and Evidence from the OECD Creditor Reporting System, by Helmut Reisen, Marcelo Soto and Thomas Weithöner, January 2004. Working Paper No. 233, Land, Violent Conflict and Development, by Nicolas Pons-Vignon and Henri-Bernard Solignac Lecomte, February 2004. Working Paper No. 234, The Impact of Social Institutions on the Economic Role of Women in Developing Countries, by Christian Morrisson and Johannes Jütting, May 2004. Document de travail No. 235, La condition desfemmes en Inde, Kenya, Soudan et Tunisie, par Christian Morrisson, août 2004.
OECD Development Centre Working Paper No. 242 DEV/DOC(2005)02
© OECD / ILO 2005
73
Working Paper No. 236, Decentralisation and Poverty in Developing Countries: Exploring the Impact, by Johannes Jütting, Céline Kauffmann, Ida Mc Donnell, Holger Osterrieder, Nicolas Pinaud and Lucia Wegner, August 2004. Working Paper No. 237, Natural Disasters and Adaptive Capacity, by Jeff Dayton-Johnson, August 2004. Working Paper No. 238, Public Opinion Polling and the Millennium Development Goals, by Jude Fransman, Alphonse L. MacDonnald, Ida Mc Donnell and Nicolas Pons-Vignon, October 2004. Working Paper No. 239, Overcoming Barriers to Competitiveness, by Orsetta Causa and Daniel Cohen, December 2004. Working Paper No. 240, Extending Insurance? Funeral Associations in Ethiopia and Tanzania, by Stefan Dercon, Tessa Bold, Joachim De Weerdt and Alula Pankhurst, December 2004. Working Paper No. 241, Macroeconomic Policies: New Issues of Interdependence, by Helmut Reisen, Martin Grandes and Nicolas Pinaud, January 2005.