Embed Size (px)
Citation preview
OECD Economic Surveys
Greece
April 2018
OVERVIEW
www.oecd.org/eco/surveys/economic-survey-greece.htm
This Overview is extracted from the Economic Survey of Greece. The Survey is published on the
responsibility of the Economic and Development Review Committee (EDRC) of the OECD, which is
charged with the examination of the economic situation of member countries.
This document and any map included herein are without prejudice to the status of or sovereignty
over any territory, to the delimitation of international frontiers and boundaries and to the name
of any territory, city or area.
1. Note by Turkey:
The information in this document with reference to “Cyprus” relates to the southern part of the
Island. There is no single authority representing both Turkish and Greek Cypriot people on the
Island. Turkey recognizes the Turkish Republic of Northern Cyprus (TRNC). Until a lasting and
equitable solution is found within the context of United Nations, Turkey shall preserve its position
concerning the “Cyprus issue”.
2. Note by all the European Union:
Member States of the OECD and the European Union: The Republic of Cyprus is recognised by all
members of the United Nations with the exception of Turkey. The information in this document
relates to the area under the effective control of the Government of the Republic of Cyprus.
OECD Economic Surveys: Greece© OECD 2018
You can copy, download or print OECD content for your own use, and you can include excerpts
from OECD publications, databases and multimedia products in your own documents,
presentations, blogs, websites and teaching materials, provided that suitable acknowledgment of
OECD as source and copyright owner is given. All requests for public or commercial use and
translation rights should be submitted to [email protected]. Requests for permission to photocopy
portions of this material for public or commercial use shall be addressed directly to the Copyright
Clearance Center (CCC) at [email protected] or the Centre français d’exploitation du droit de
copie (CFC) at [email protected].
OECD Economic Surveys: Greece
© OECD 2018
11
Executive summary
● The economy is recovering and fiscal credibility has improved
● Well targeted social programmes will enhance social inclusion and intergenerationalequity
● Despite significant reforms, cumbersome regulation and lack of finance hinderprivate investment
©OECD 3
EXECUTIVE SUMMARY
OECD ECONOMIC SURVEYS: GREECE © OECD 201812
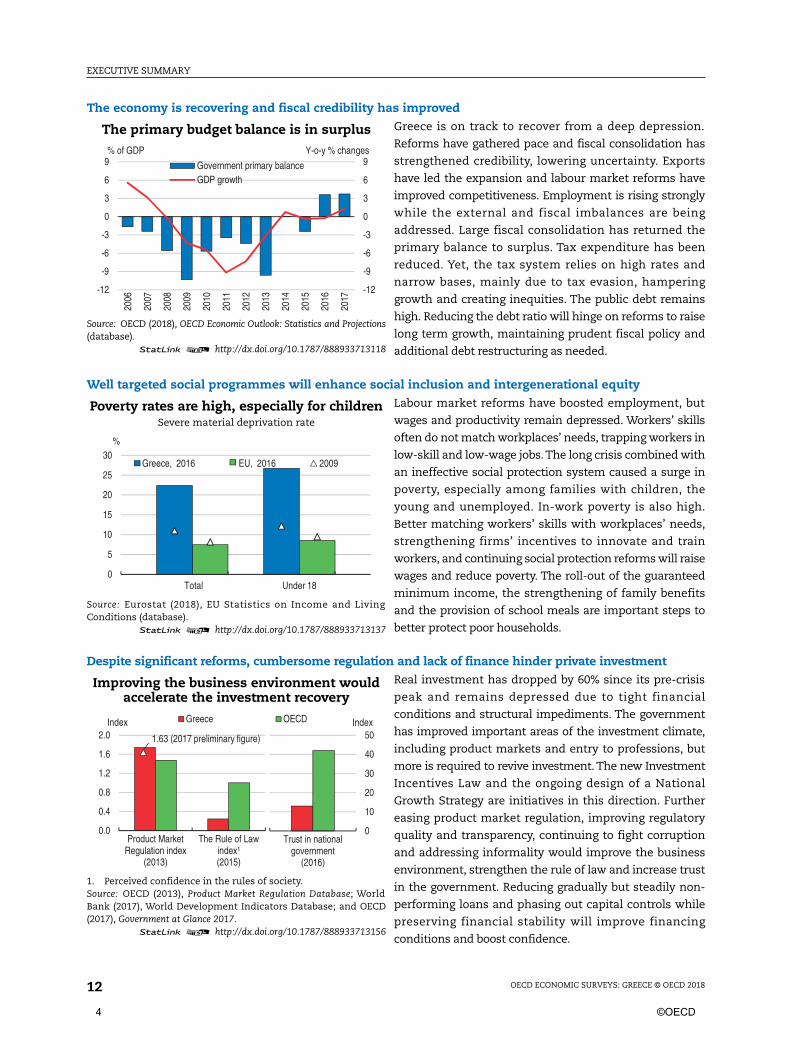
The economy is recovering and fiscal credibility has improvedGreece is on track to recover from a deep depression.
Reforms have gathered pace and fiscal consolidation has
strengthened credibility, lowering uncertainty. Exports
have led the expansion and labour market reforms have
improved competitiveness. Employment is rising strongly
while the external and fiscal imbalances are being
addressed. Large fiscal consolidation has returned the
primary balance to surplus. Tax expenditure has been
reduced. Yet, the tax system relies on high rates and
narrow bases, mainly due to tax evasion, hampering
growth and creating inequities. The public debt remains
high. Reducing the debt ratio will hinge on reforms to raise
long term growth, maintaining prudent fiscal policy and
additional debt restructuring as needed.
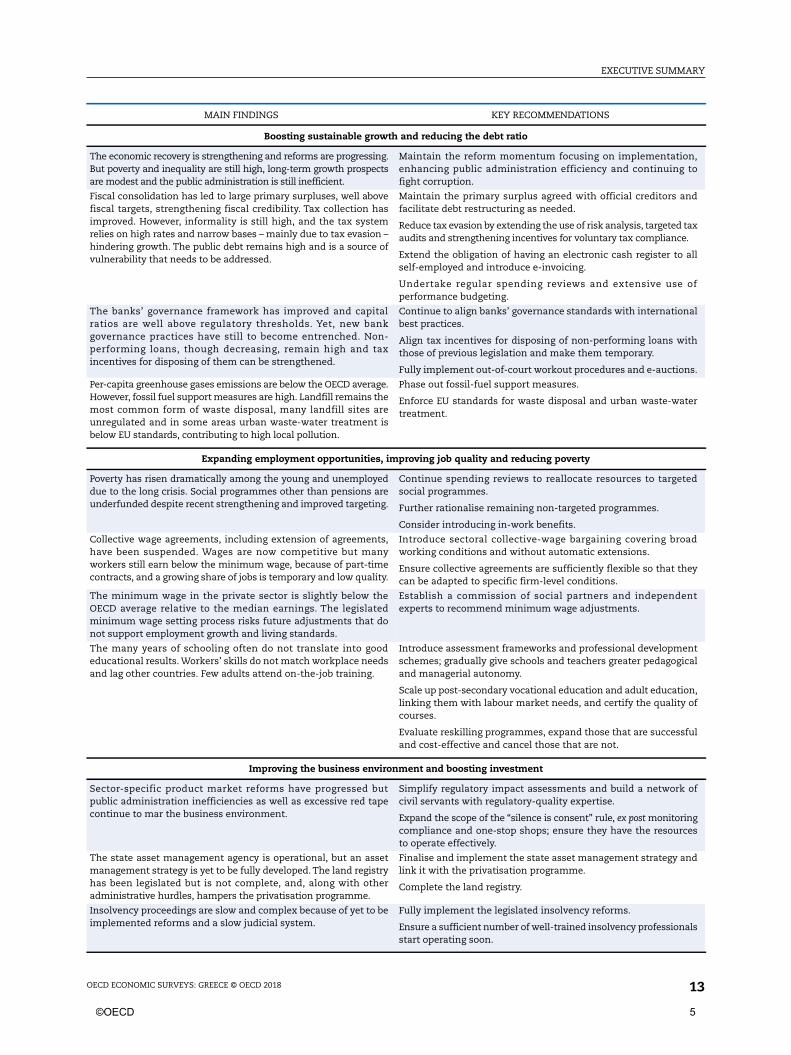
Well targeted social programmes will enhance social inclusion and intergenerational equityLabour market reforms have boosted employment, but
wages and productivity remain depressed. Workers’ skills
often do not match workplaces’ needs, trapping workers in
low-skill and low-wage jobs.The long crisis combined with
an ineffective social protection system caused a surge in
poverty, especially among families with children, the
young and unemployed. In-work poverty is also high.
Better matching workers’ skills with workplaces’ needs,
strengthening firms’ incentives to innovate and train
workers, and continuing social protection reforms will raise
wages and reduce poverty. The roll-out of the guaranteed
minimum income, the strengthening of family benefits
and the provision of school meals are important steps to
better protect poor households.
Despite significant reforms, cumbersome regulation and lack of finance hinder private investmentReal investment has dropped by 60% since its pre-crisis
peak and remains depressed due to tight financial
conditions and structural impediments. The government
has improved important areas of the investment climate,
including product markets and entry to professions, but
more is required to revive investment. The new Investment
Incentives Law and the ongoing design of a National
Growth Strategy are initiatives in this direction. Further
easing product market regulation, improving regulatory
quality and transparency, continuing to fight corruption
and addressing informality would improve the business
environment, strengthen the rule of law and increase trust
in the government. Reducing gradually but steadily non-
performing loans and phasing out capital controls while
preserving financial stability will improve financing
conditions and boost confidence.
The primary budget balance is in surplus
Source: OECD (2018), OECD Economic Outlook: Statistics and Projections(database).
1 2 http://dx.doi.org/10.1787/888933713118
-12
-9
-6
-3
0
3
6
9
-12
-9
-6
-3
0
3
6
9
2006
2007
2008
2009
2010
2011
2012
2013
2014
2015
2016
2017
Government primary balanceGDP growth
Y-o-y % changes% of GDP
Poverty rates are high, especially for childrenSevere material deprivation rate
Source: Eurostat (2018), EU Statistics on Income and LivingConditions (database).
1 2 http://dx.doi.org/10.1787/888933713137
0
5
10
15
20
25
30%
Total Under 18
Greece, 2016 EU, 2016 2009
Improving the business environment wouldaccelerate the investment recovery
1. Perceived confidence in the rules of society.Source: OECD (2013), Product Market Regulation Database; WorldBank (2017), World Development Indicators Database; and OECD(2017), Government at Glance 2017.
1 2 http://dx.doi.org/10.1787/888933713156
0.0
0.4
0.8
1.2
1.6
2.0
Product MarketRegulation index
(2013)
The Rule of Lawindex¹(2015)
Greece OECDIndex
0
10
20
30
40
50
Trust in nationalgovernment
(2016)
Index
1.63 (2017 preliminary figure)
4 ©OECD
EXECUTIVE SUMMARY
OECD ECONOMIC SURVEYS: GREECE © OECD 2018 13
MAIN FINDINGS KEY RECOMMENDATIONS
Boosting sustainable growth and reducing the debt ratio
The economic recovery is strengthening and reforms are progressing.But poverty and inequality are still high, long-term growth prospectsare modest and the public administration is still inefficient.
Maintain the reform momentum focusing on implementation,enhancing public administration efficiency and continuing tofight corruption.
Fiscal consolidation has led to large primary surpluses, well abovefiscal targets, strengthening fiscal credibility. Tax collection hasimproved. However, informality is still high, and the tax systemrelies on high rates and narrow bases – mainly due to tax evasion –hindering growth. The public debt remains high and is a source ofvulnerability that needs to be addressed.
Maintain the primary surplus agreed with official creditors andfacilitate debt restructuring as needed.
Reduce tax evasion by extending the use of risk analysis, targeted taxaudits and strengthening incentives for voluntary tax compliance.
Extend the obligation of having an electronic cash register to allself-employed and introduce e-invoicing.
Undertake regular spending reviews and extensive use ofperformance budgeting.
The banks’ governance framework has improved and capitalratios are well above regulatory thresholds. Yet, new bankgovernance practices have still to become entrenched. Non-performing loans, though decreasing, remain high and taxincentives for disposing of them can be strengthened.
Continue to align banks’ governance standards with internationalbest practices.
Align tax incentives for disposing of non-performing loans withthose of previous legislation and make them temporary.
Fully implement out-of-court workout procedures and e-auctions.
Per-capita greenhouse gases emissions are below the OECD average.However, fossil fuel support measures are high. Landfill remains themost common form of waste disposal, many landfill sites areunregulated and in some areas urban waste-water treatment isbelow EU standards, contributing to high local pollution.
Phase out fossil-fuel support measures.
Enforce EU standards for waste disposal and urban waste-watertreatment.
Expanding employment opportunities, improving job quality and reducing poverty
Poverty has risen dramatically among the young and unemployeddue to the long crisis. Social programmes other than pensions areunderfunded despite recent strengthening and improved targeting.
Continue spending reviews to reallocate resources to targetedsocial programmes.
Further rationalise remaining non-targeted programmes.
Consider introducing in-work benefits.
Collective wage agreements, including extension of agreements,have been suspended. Wages are now competitive but manyworkers still earn below the minimum wage, because of part-timecontracts, and a growing share of jobs is temporary and low quality.
Introduce sectoral collective-wage bargaining covering broadworking conditions and without automatic extensions.
Ensure collective agreements are sufficiently flexible so that theycan be adapted to specific firm-level conditions.
The minimum wage in the private sector is slightly below theOECD average relative to the median earnings. The legislatedminimum wage setting process risks future adjustments that donot support employment growth and living standards.
Establish a commission of social partners and independentexperts to recommend minimum wage adjustments.
The many years of schooling often do not translate into goodeducational results. Workers’ skills do not match workplace needsand lag other countries. Few adults attend on-the-job training.
Introduce assessment frameworks and professional developmentschemes; gradually give schools and teachers greater pedagogicaland managerial autonomy.
Scale up post-secondary vocational education and adult education,linking them with labour market needs, and certify the quality ofcourses.
Evaluate reskilling programmes, expand those that are successfuland cost-effective and cancel those that are not.
Improving the business environment and boosting investment
Sector-specific product market reforms have progressed butpublic administration inefficiencies as well as excessive red tapecontinue to mar the business environment.
Simplify regulatory impact assessments and build a network ofcivil servants with regulatory-quality expertise.
Expand the scope of the “silence is consent” rule, ex post monitoringcompliance and one-stop shops; ensure they have the resourcesto operate effectively.
The state asset management agency is operational, but an assetmanagement strategy is yet to be fully developed. The land registryhas been legislated but is not complete, and, along with otheradministrative hurdles, hampers the privatisation programme.
Finalise and implement the state asset management strategy andlink it with the privatisation programme.
Complete the land registry.
Insolvency proceedings are slow and complex because of yet to beimplemented reforms and a slow judicial system.
Fully implement the legislated insolvency reforms.
Ensure a sufficient number of well-trained insolvency professionalsstart operating soon.
©OECD 5

6 ©OECD
OECD Economic Surveys: Greece
© OECD 2018
15
Assessment and recommendations
● The economy is finally growing again
● Strengthening the banking sector
● Higher growth, prudent fiscal policy and debt restructuring will reduce the public debt
● Redressing public finance to bolster inclusive growth
● Boosting employment, reducing poverty and improving skills
● Greening the economy
● Improving the business environment to raise investment
Note by Turkey:The information in this document with reference to “Cyprus” relates to the southern part of the Island.There is no single authority representing both Turkish and Greek Cypriot people on the Island. Turkeyrecognises the Turkish Republic of Northern Cyprus (TRNC). Until a lasting and equitable solution isfound within the context of the United Nations, Turkey shall preserve its position concerning the“Cyprus issue”.Note by all the European Union Member States of the OECD and the European Union:The Republic of Cyprus is recognised by all members of the United Nations with the exception of Turkey.The information in this document relates to the area under the effective control of the Government ofthe Republic of Cyprus.
©OECD 7
ASSESSMENT AND RECOMMENDATIONS
OECD ECONOMIC SURVEYS: GREECE © OECD 201816
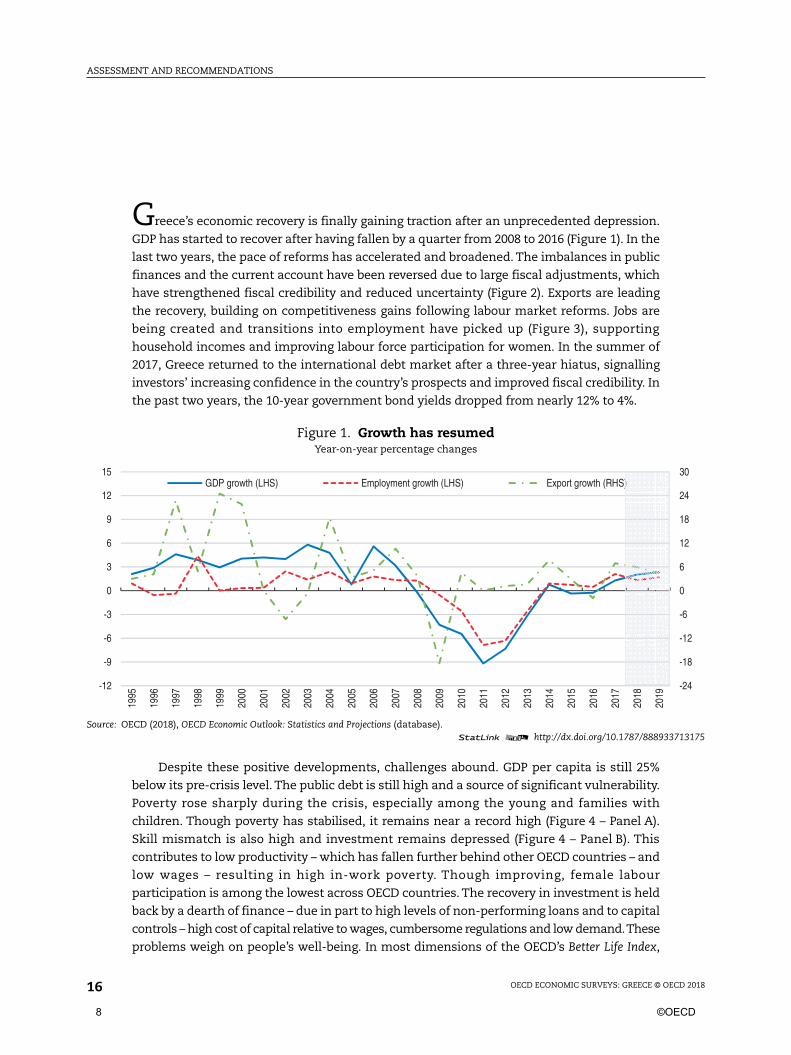
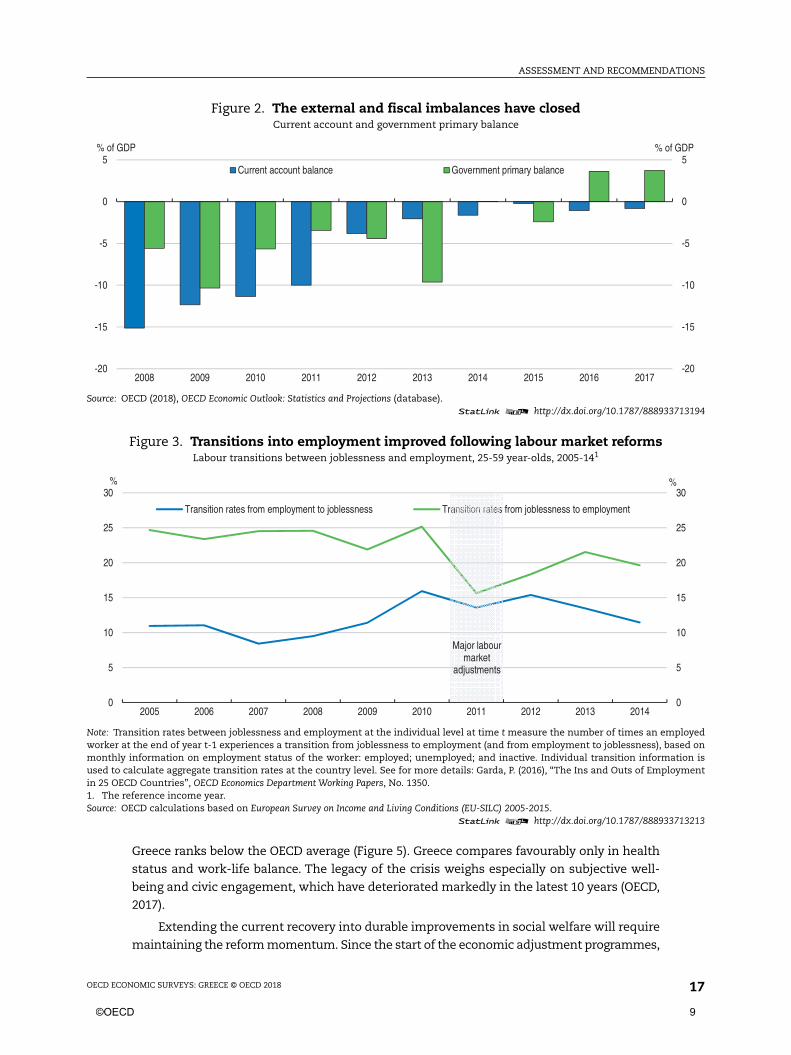
Greece’s economic recovery is finally gaining traction after an unprecedented depression.
GDP has started to recover after having fallen by a quarter from 2008 to 2016 (Figure 1). In the
last two years, the pace of reforms has accelerated and broadened. The imbalances in public
finances and the current account have been reversed due to large fiscal adjustments, which
have strengthened fiscal credibility and reduced uncertainty (Figure 2). Exports are leading
the recovery, building on competitiveness gains following labour market reforms. Jobs are
being created and transitions into employment have picked up (Figure 3), supporting
household incomes and improving labour force participation for women. In the summer of
2017, Greece returned to the international debt market after a three-year hiatus, signalling
investors’ increasing confidence in the country’s prospects and improved fiscal credibility. In
the past two years, the 10-year government bond yields dropped from nearly 12% to 4%.
Despite these positive developments, challenges abound. GDP per capita is still 25%
below its pre-crisis level. The public debt is still high and a source of significant vulnerability.
Poverty rose sharply during the crisis, especially among the young and families with
children. Though poverty has stabilised, it remains near a record high (Figure 4 – Panel A).
Skill mismatch is also high and investment remains depressed (Figure 4 – Panel B). This
contributes to low productivity – which has fallen further behind other OECD countries – and
low wages – resulting in high in-work poverty. Though improving, female labour
participation is among the lowest across OECD countries. The recovery in investment is held
back by a dearth of finance – due in part to high levels of non-performing loans and to capital
controls – high cost of capital relative to wages, cumbersome regulations and low demand.These
problems weigh on people’s well-being. In most dimensions of the OECD’s Better Life Index,
Figure 1. Growth has resumedYear-on-year percentage changes
Source: OECD (2018), OECD Economic Outlook: Statistics and Projections (database).1 2 http://dx.doi.org/10.1787/888933713175
-24
-18
-12
-6
0
6
12
18
24
30
-12
-9
-6
-3
0
3
6
9
12
15
1995
1996
1997
1998
1999
2000
2001
2002
2003
2004
2005
2006
2007
2008
2009
2010
2011
2012
2013
2014
2015
2016
2017
2018
2019
GDP growth (LHS) Employment growth (LHS) Export growth (RHS)
8 ©OECD
ASSESSMENT AND RECOMMENDATIONS
OECD ECONOMIC SURVEYS: GREECE © OECD 2018 17
Greece ranks below the OECD average (Figure 5). Greece compares favourably only in health
status and work-life balance. The legacy of the crisis weighs especially on subjective well-
being and civic engagement, which have deteriorated markedly in the latest 10 years (OECD,
2017).
Extending the current recovery into durable improvements in social welfare will require
maintaining the reform momentum. Since the start of the economic adjustment programmes,
Figure 2. The external and fiscal imbalances have closedCurrent account and government primary balance
Source: OECD (2018), OECD Economic Outlook: Statistics and Projections (database).1 2 http://dx.doi.org/10.1787/888933713194
Figure 3. Transitions into employment improved following labour market reformsLabour transitions between joblessness and employment, 25-59 year-olds, 2005-141
Note: Transition rates between joblessness and employment at the individual level at time t measure the number of times an employedworker at the end of year t-1 experiences a transition from joblessness to employment (and from employment to joblessness), based onmonthly information on employment status of the worker: employed; unemployed; and inactive. Individual transition information isused to calculate aggregate transition rates at the country level. See for more details: Garda, P. (2016), “The Ins and Outs of Employmentin 25 OECD Countries”, OECD Economics Department Working Papers, No. 1350.1. The reference income year.Source: OECD calculations based on European Survey on Income and Living Conditions (EU-SILC) 2005-2015.
1 2 http://dx.doi.org/10.1787/888933713213
-20
-15
-10
-5
0
5
-20
-15
-10
-5
0
5
2008 2009 2010 2011 2012 2013 2014 2015 2016 2017
% of GDP% of GDP
Current account balance Government primary balance
0
5
10
15
20
25
30
0
5
10
15
20
25
30
2005 2006 2007 2008 2009 2010 2011 2012 2013 2014
%%
Transition rates from employment to joblessness Transition rates from joblessness to employment
Major labour market
adjustments
©OECD 9

ASSESSMENT AND RECOMMENDATIONS
OECD ECONOMIC SURVEYS: GREECE © OECD 201818
structural reforms have focussed mostly on the labour market and controlling pension
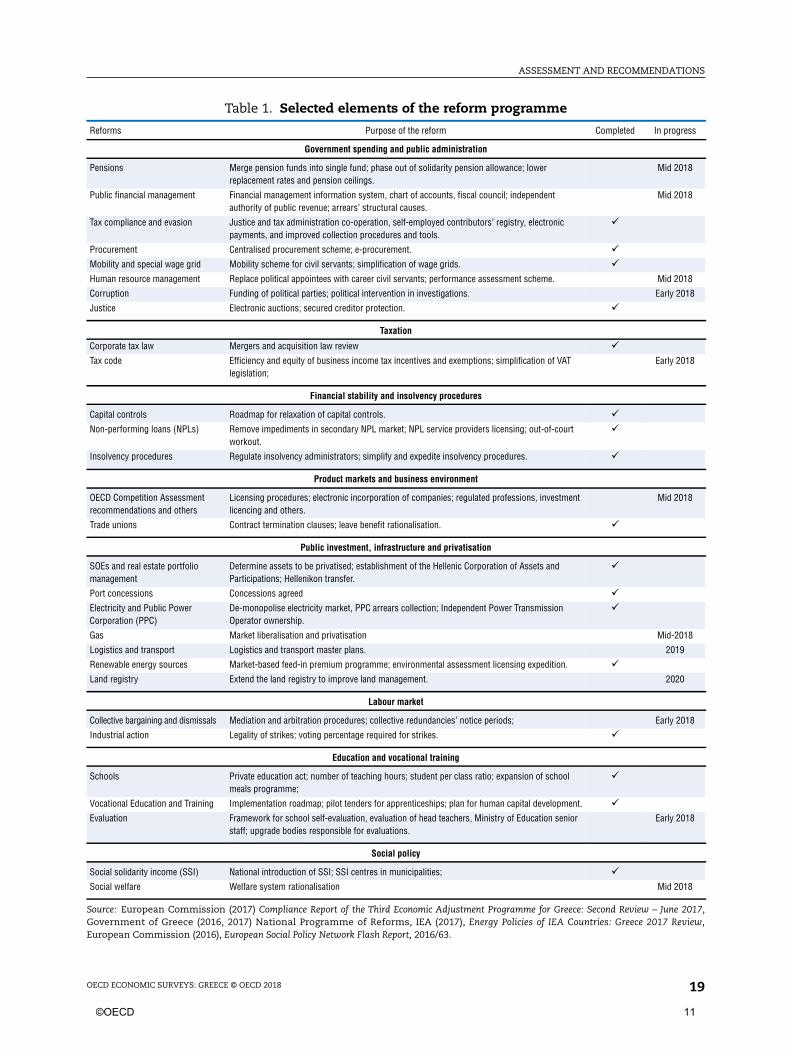
spending. In the latest two years, reforms have accelerated, especially in product markets –
supporting Greece’s competitiveness – and social protection, but progress has been uneven
across sectors (Table 1). Reforms of education, job search and training policies, public
Figure 4. Poverty rose sharply during the crisis, especially among children,and investment collapsed
1. The severe material deprivation rate is the proportion of the population living in households unable to afford at least four of thefollowing items: unexpected expenses, a one-week annual holiday away from home, a meal involving meat, chicken or fish everysecond day, the adequate heating of a dwelling, durable goods like a washing machine, colour television, telephone or car, or areconfronted with payment arrears.
Source: Eurostat (2018), EU Statistics on Income and Living Conditions (database) and OECD (2018), OECD Economic Outlook: Statistics andProjections (database).
1 2 http://dx.doi.org/10.1787/888933713232
Figure 5. Greece’s well-being outcomes are lowBetter Life Index, 20171
1. Each well-being dimension is measured by one to four indicators from the OECD Better Life Index set. Normalised indicators areaveraged with equal weights. Indicators are normalised to range between 10 (best) and 0 (worst) according to the following formula:(indicator value - minimum value)/(maximum value - minimum value) x 10.
Source: OECD (2017), OECD Better Life Index, www.oecdbetterlifeindex.org.1 2 http://dx.doi.org/10.1787/888933713251
0
5
10
15
20
25
30
2003
2004
2005
2006
2007
2008
2009
2010
2011
2012
2013
2014
2015
2016
%
Less than 18 18-64
65 and over
0
25
50
75
100
125
150
0
6
12
18
24
30
36
2003
Q4
2004
Q4
2005
Q4
2006
Q4
2007
Q4
2008
Q4
2009
Q4
2010
Q4
2011
Q4
2012
Q4
2013
Q4
2014
Q4
2015
Q4
2016
Q4
2017
Q4
B. Nominal and real investment
Nominal investment (LHS)Real investment (RHS)
% of GDP Index 2009 = 100
A. Severe material deprivation rate¹ by age group
0.0
2.0
4.0
6.0
8.0
10.0Income and wealth
Jobs and earnings
Housing
Work and life balance
Health status
Education and skillsSocial connections
Civic engagement and governance
Environmental quality
Personal security
Subjective well-being
Greece OECD
10 ©OECD
ASSESSMENT AND RECOMMENDATIONS
OECD ECONOMIC SURVEYS: GREECE © OECD 2018 19
Table 1. Selected elements of the reform programme
Reforms Purpose of the reform Completed In progress
Government spending and public administration
Pensions Merge pension funds into single fund; phase out of solidarity pension allowance; lowerreplacement rates and pension ceilings.
Mid 2018
Public financial management Financial management information system, chart of accounts, fiscal council; independentauthority of public revenue; arrears’ structural causes.
Mid 2018
Tax compliance and evasion Justice and tax administration co-operation, self-employed contributors’ registry, electronicpayments, and improved collection procedures and tools.
ü
Procurement Centralised procurement scheme; e-procurement. üMobility and special wage grid Mobility scheme for civil servants; simplification of wage grids. üHuman resource management Replace political appointees with career civil servants; performance assessment scheme. Mid 2018
Corruption Funding of political parties; political intervention in investigations. Early 2018
Justice Electronic auctions; secured creditor protection. ü
Taxation
Corporate tax law Mergers and acquisition law review üTax code Efficiency and equity of business income tax incentives and exemptions; simplification of VAT
legislation;Early 2018
Financial stability and insolvency procedures
Capital controls Roadmap for relaxation of capital controls. üNon-performing loans (NPLs) Remove impediments in secondary NPL market; NPL service providers licensing; out-of-court
workout.ü
Insolvency procedures Regulate insolvency administrators; simplify and expedite insolvency procedures. ü
Product markets and business environment
OECD Competition Assessmentrecommendations and others
Licensing procedures; electronic incorporation of companies; regulated professions, investmentlicencing and others.
Mid 2018
Trade unions Contract termination clauses; leave benefit rationalisation. ü
Public investment, infrastructure and privatisation
SOEs and real estate portfoliomanagement
Determine assets to be privatised; establishment of the Hellenic Corporation of Assets andParticipations; Hellenikon transfer.
ü
Port concessions Concessions agreed üElectricity and Public PowerCorporation (PPC)
De-monopolise electricity market, PPC arrears collection; Independent Power TransmissionOperator ownership.
ü
Gas Market liberalisation and privatisation Mid-2018
Logistics and transport Logistics and transport master plans. 2019
Renewable energy sources Market-based feed-in premium programme; environmental assessment licensing expedition. üLand registry Extend the land registry to improve land management. 2020
Labour market
Collective bargaining and dismissals Mediation and arbitration procedures; collective redundancies’ notice periods; Early 2018
Industrial action Legality of strikes; voting percentage required for strikes. ü
Education and vocational training
Schools Private education act; number of teaching hours; student per class ratio; expansion of schoolmeals programme;
ü
Vocational Education and Training Implementation roadmap; pilot tenders for apprenticeships; plan for human capital development. üEvaluation Framework for school self-evaluation, evaluation of head teachers, Ministry of Education senior
staff; upgrade bodies responsible for evaluations.Early 2018
Social policy
Social solidarity income (SSI) National introduction of SSI; SSI centres in municipalities; üSocial welfare Welfare system rationalisation Mid 2018
Source: European Commission (2017) Compliance Report of the Third Economic Adjustment Programme for Greece: Second Review – June 2017,Government of Greece (2016, 2017) National Programme of Reforms, IEA (2017), Energy Policies of IEA Countries: Greece 2017 Review,European Commission (2016), European Social Policy Network Flash Report, 2016/63.
©OECD 11
ASSESSMENT AND RECOMMENDATIONS
OECD ECONOMIC SURVEYS: GREECE © OECD 201820
administration, and fighting corruption and informality have ample room to progress.
Improving the allocation of public spending and the fiscal policy mix can better support
inclusive growth. The integration of refugees in the education system and the labour market
has further to go so as to raise wellbeing and reduce social tensions.
In the coming years, the success of reforms will hinge on creating an enabling
environment based on transparent regulation, an efficient public sector, competitive
markets and effective social protection. Against this background the main messages of this
Survey are:
● Cutting tax evasion, enlarging the tax base, rationalising public spending and enhancing
public administration efficiency are pro-growth and inclusive ways to sustain the
primary surplus targets of 3.5% of GDP over the medium term and above but close to 2%
over the long term. Pro-growth reforms and appropriate debt restructuring are needed to
support the country’s economic outlook, improve debt sustainability and reduce
vulnerabilities to shocks;
● Enhancing the quality of regulation, continuing to fight corruption and boosting competition
would help revive domestic and foreign direct investment, and productivity, thus leading
to higher living standards;
● Actively helping and retraining the unemployed and discouraged workers to find jobs
and reducing poverty, especially among children and young families, while boosting
work incentives, would sustain social progress.
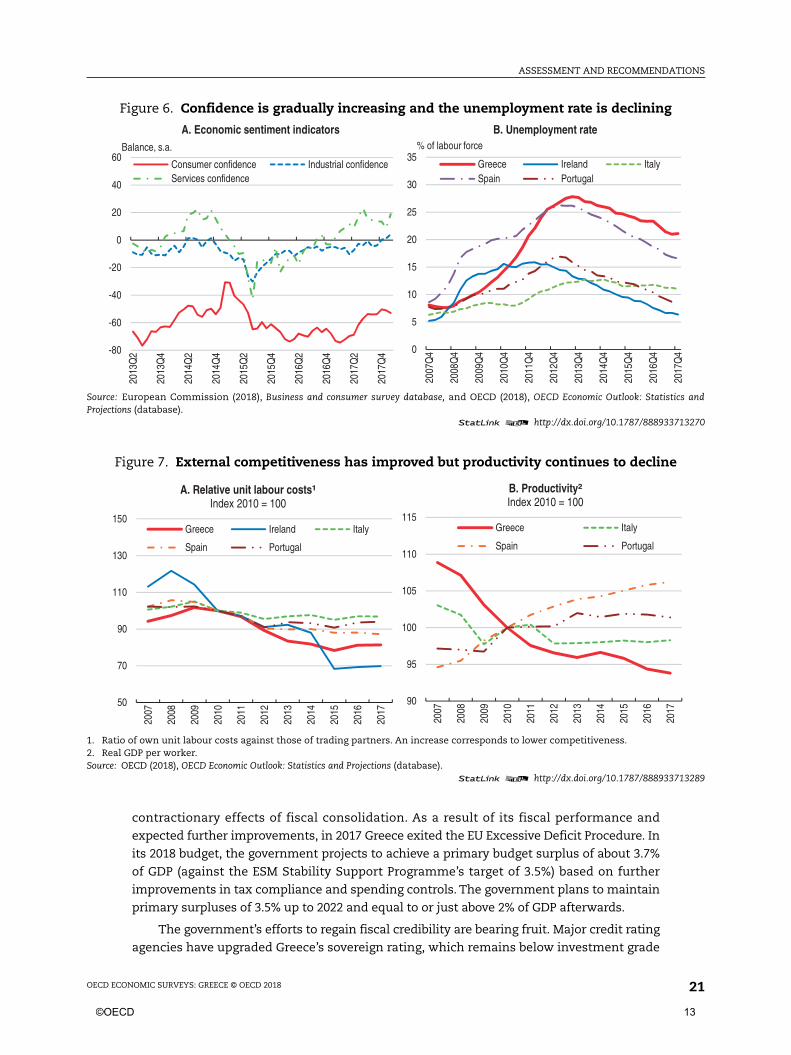
The economy is finally growing againIn 2017 GDP expanded by 1.3%, according to initial estimates, the fastest pace since the
onset of the crisis. The completion of the second review of the ESM Stability Support
Programme in June 2017 and the progress made towards completing the third review, which
was concluded in March 2018, buoyed confidence, supporting activity (Figure 6 – Panel A).
Unemployment is declining (Figure 6 – Panel B), although many new positions are temporary
or part-time and pay the minimum wage. Greece’s improved competitiveness in
combination with rising external demand is boosting exports, though productivity growth
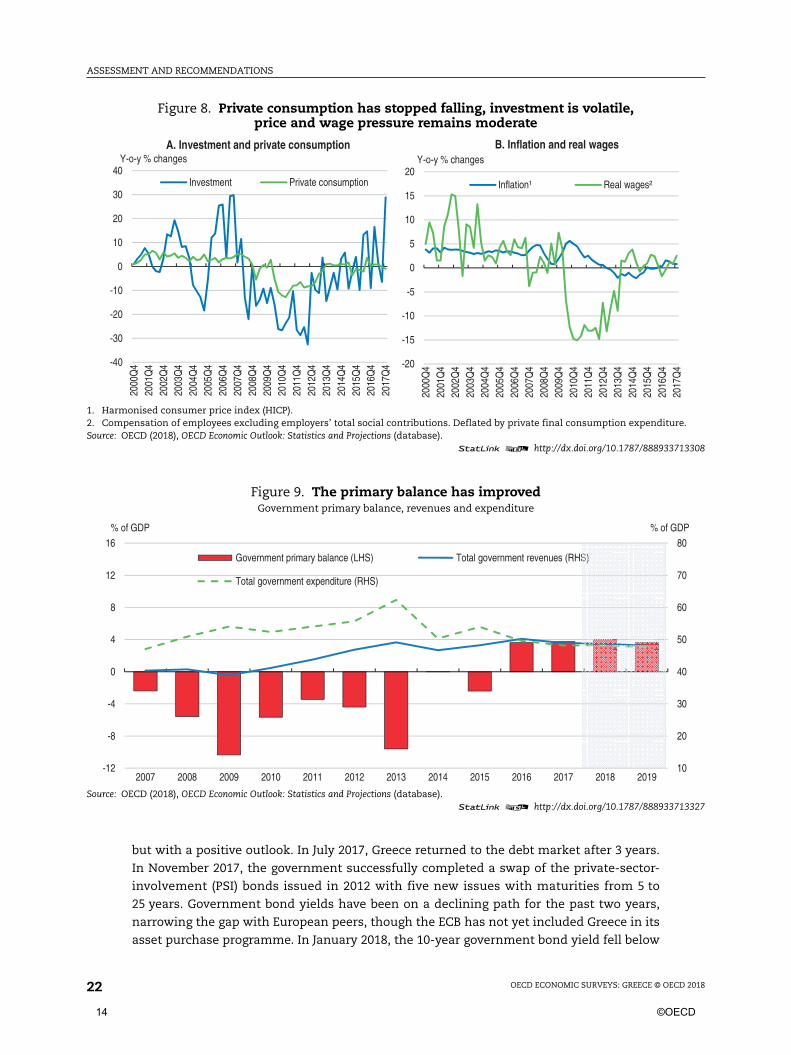
remains weak (Figure 7). Private consumption has stabilised (Figure 8 – Panel A) and sizeable
spare capacity continues mitigating consumer price and wage inflation (Figure 8 – Panel B).
Overall the economy is becoming more open. Exports rose from 24% of GDP in 2008 to
34% in 2017, though this is still below the EU average of 46%. Moreover, the economy is
gradually shifting towards tradable sectors. The share in total gross value added of tradable
sectors rose from 40% in 2013 to 43% in 2017, slightly above the EU average. Goods account
for an increasing share of total exports, having risen from 40% in 2008 to 50% in 2016. Within
service exports, the share shipping dropped from 52% to 23% over 2008-16 while that of
tourism increased from 34% to 53%.
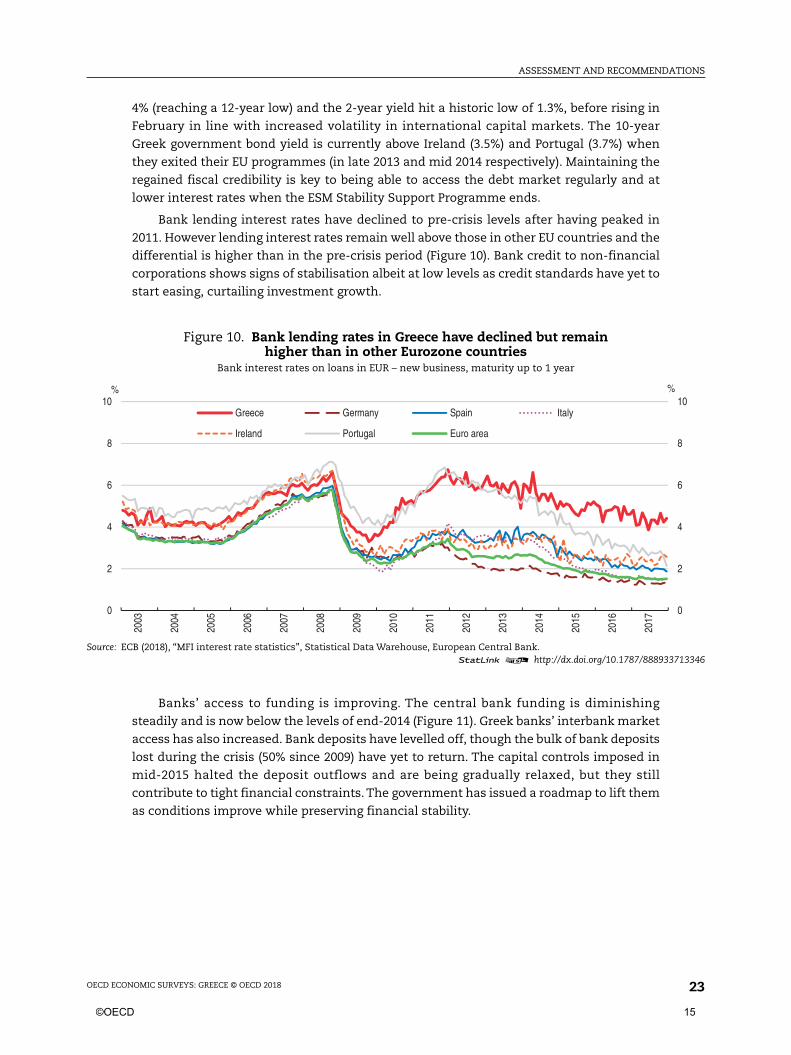
Greece’s budget primary balance swung from a deficit of 2.4% of GDP in 2015, including
bank recapitalisation, to a surplus of 3.5% of GDP in 2016 (Figure 9). In the same year, the
general government budget balance was in surplus for the first time in 44 years. This fiscal
consolidation effort has been unprecedented, totalling 13 percentage points of GDP between
2009 and 2016. Over the same period nominal GDP fell by more than a quarter and the IMF
and EU programmes helped to close the external financing gap. In 2017, Greece’s primary
surplus is expected to have been above 3.5% of GDP, outperforming its target of 1.75% of GDP.
The fiscal over-achievement of 2015-17 may have boosted confidence, mitigating the
12 ©OECD
ASSESSMENT AND RECOMMENDATIONS
OECD ECONOMIC SURVEYS: GREECE © OECD 2018 21
contractionary effects of fiscal consolidation. As a result of its fiscal performance and
expected further improvements, in 2017 Greece exited the EU Excessive Deficit Procedure. In
its 2018 budget, the government projects to achieve a primary budget surplus of about 3.7%
of GDP (against the ESM Stability Support Programme’s target of 3.5%) based on further
improvements in tax compliance and spending controls. The government plans to maintain
primary surpluses of 3.5% up to 2022 and equal to or just above 2% of GDP afterwards.
The government’s efforts to regain fiscal credibility are bearing fruit. Major credit rating
agencies have upgraded Greece’s sovereign rating, which remains below investment grade
Figure 6. Confidence is gradually increasing and the unemployment rate is declining
Source: European Commission (2018), Business and consumer survey database, and OECD (2018), OECD Economic Outlook: Statistics andProjections (database).
1 2 http://dx.doi.org/10.1787/888933713270
Figure 7. External competitiveness has improved but productivity continues to decline
1. Ratio of own unit labour costs against those of trading partners. An increase corresponds to lower competitiveness.2. Real GDP per worker.Source: OECD (2018), OECD Economic Outlook: Statistics and Projections (database).
1 2 http://dx.doi.org/10.1787/888933713289
-80
-60
-40
-20
0
20
40
60
2013
Q2
2013
Q4
2014
Q2
2014
Q4
2015
Q2
2015
Q4
2016
Q2
2016
Q4
2017
Q2
2017
Q4
Balance, s.a.
A. Economic sentiment indicators
Consumer confidence Industrial confidenceServices confidence
0
5
10
15
20
25
30
35
2007
Q4
2008
Q4
2009
Q4
2010
Q4
2011
Q4
2012
Q4
2013
Q4
2014
Q4
2015
Q4
2016
Q4
2017
Q4
B. Unemployment rate
Greece Ireland ItalySpain Portugal
% of labour force
50
70
90
110
130
150
2007
2008
2009
2010
2011
2012
2013
2014
2015
2016
2017
A. Relative unit labour costs¹Index 2010 = 100
Greece Ireland Italy
Spain Portugal
90
95
100
105
110
115
2007
2008
2009
2010
2011
2012
2013
2014
2015
2016
2017
B. Productivity²Index 2010 = 100
Greece Italy
Spain Portugal
©OECD 13
ASSESSMENT AND RECOMMENDATIONS
OECD ECONOMIC SURVEYS: GREECE © OECD 201822
but with a positive outlook. In July 2017, Greece returned to the debt market after 3 years.
In November 2017, the government successfully completed a swap of the private-sector-
involvement (PSI) bonds issued in 2012 with five new issues with maturities from 5 to
25 years. Government bond yields have been on a declining path for the past two years,
narrowing the gap with European peers, though the ECB has not yet included Greece in its
asset purchase programme. In January 2018, the 10-year government bond yield fell below
Figure 8. Private consumption has stopped falling, investment is volatile,price and wage pressure remains moderate
1. Harmonised consumer price index (HICP).2. Compensation of employees excluding employers’ total social contributions. Deflated by private final consumption expenditure.Source: OECD (2018), OECD Economic Outlook: Statistics and Projections (database).
1 2 http://dx.doi.org/10.1787/888933713308
Figure 9. The primary balance has improvedGovernment primary balance, revenues and expenditure
Source: OECD (2018), OECD Economic Outlook: Statistics and Projections (database).1 2 http://dx.doi.org/10.1787/888933713327
-40
-30
-20
-10
0
10
20
30
40
2000
Q4
2001
Q4
2002
Q4
2003
Q4
2004
Q4
2005
Q4
2006
Q4
2007
Q4
2008
Q4
2009
Q4
2010
Q4
2011
Q4
2012
Q4
2013
Q4
2014
Q4
2015
Q4
2016
Q4
2017
Q4
A. Investment and private consumption
Investment Private consumption
Y-o-y % changes
-20
-15
-10
-5
0
5
10
15
20
2000
Q4
2001
Q4
2002
Q4
2003
Q4
2004
Q4
2005
Q4
2006
Q4
2007
Q4
2008
Q4
2009
Q4
2010
Q4
2011
Q4
2012
Q4
2013
Q4
2014
Q4
2015
Q4
2016
Q4
2017
Q4
B. Inflation and real wages
Inflation¹ Real wages²
Y-o-y % changes
10
20
30
40
50
60
70
80
-12
-8
-4
0
4
8
12
16
2007 2008 2009 2010 2011 2012 2013 2014 2015 2016 2017 2018 2019
% of GDP% of GDP
Government primary balance (LHS) Total government revenues (RHS)
Total government expenditure (RHS)
14 ©OECD
ASSESSMENT AND RECOMMENDATIONS
OECD ECONOMIC SURVEYS: GREECE © OECD 2018 23
4% (reaching a 12-year low) and the 2-year yield hit a historic low of 1.3%, before rising in
February in line with increased volatility in international capital markets. The 10-year
Greek government bond yield is currently above Ireland (3.5%) and Portugal (3.7%) when
they exited their EU programmes (in late 2013 and mid 2014 respectively). Maintaining the
regained fiscal credibility is key to being able to access the debt market regularly and at
lower interest rates when the ESM Stability Support Programme ends.
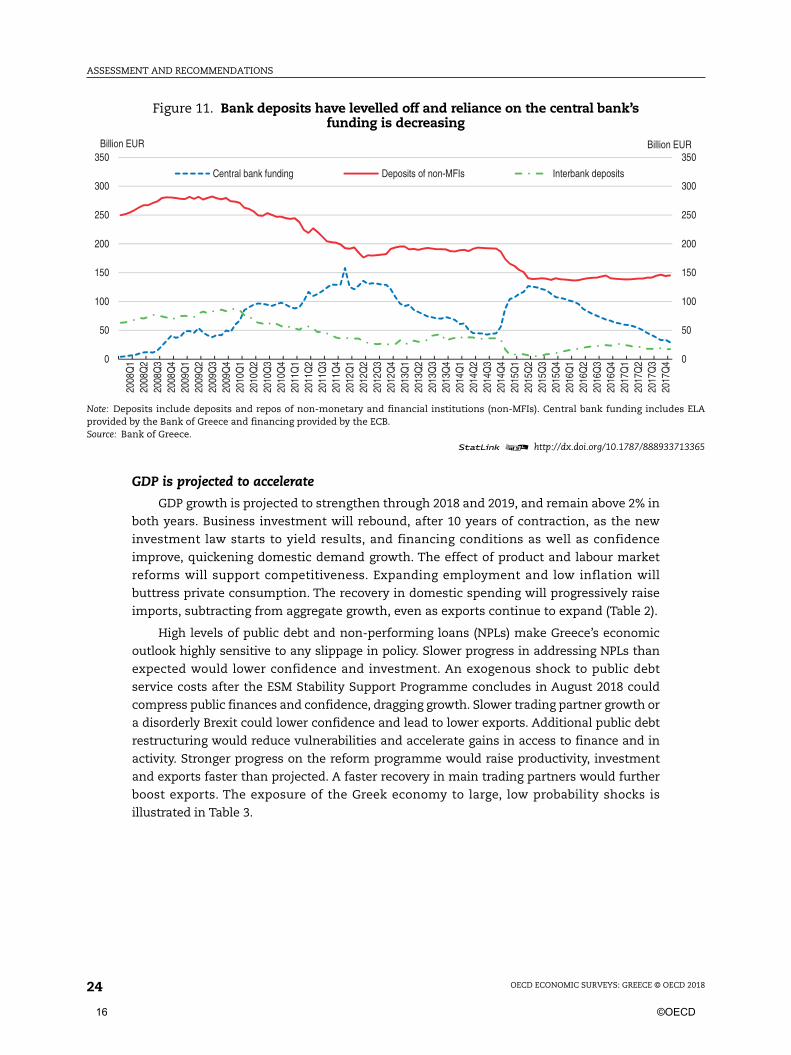
Bank lending interest rates have declined to pre-crisis levels after having peaked in
2011. However lending interest rates remain well above those in other EU countries and the
differential is higher than in the pre-crisis period (Figure 10). Bank credit to non-financial
corporations shows signs of stabilisation albeit at low levels as credit standards have yet to
start easing, curtailing investment growth.
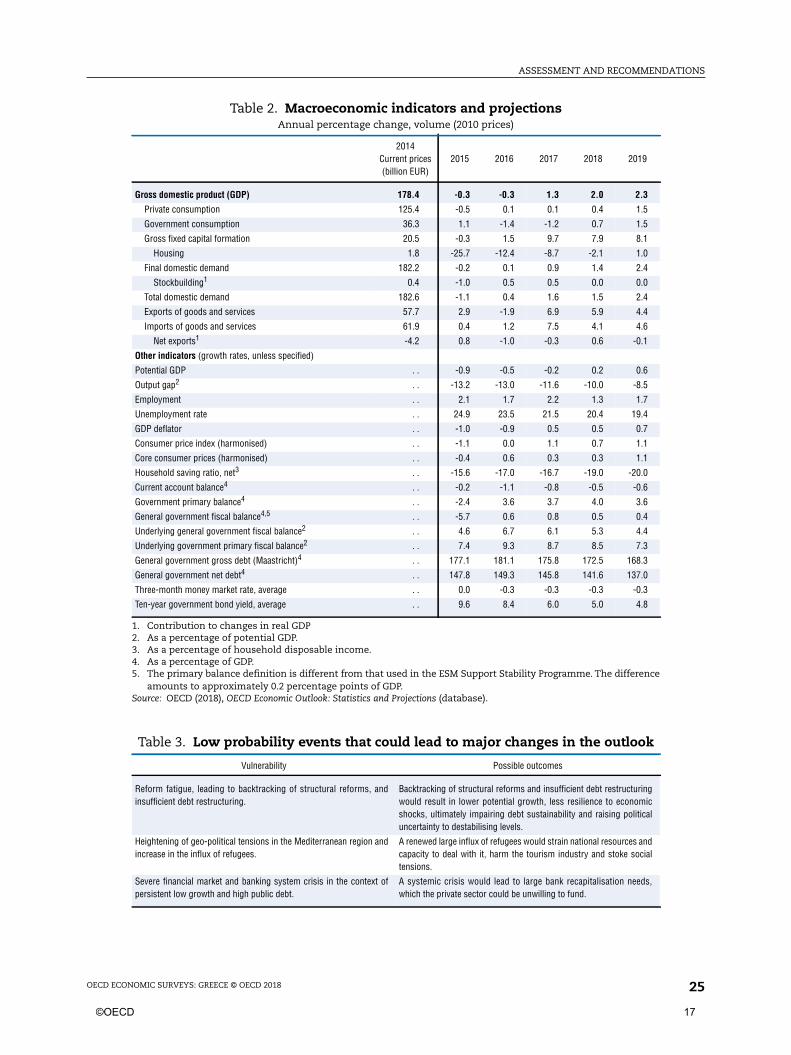
Banks’ access to funding is improving. The central bank funding is diminishing
steadily and is now below the levels of end-2014 (Figure 11). Greek banks’ interbank market
access has also increased. Bank deposits have levelled off, though the bulk of bank deposits
lost during the crisis (50% since 2009) have yet to return. The capital controls imposed in
mid-2015 halted the deposit outflows and are being gradually relaxed, but they still
contribute to tight financial constraints. The government has issued a roadmap to lift them
as conditions improve while preserving financial stability.
Figure 10. Bank lending rates in Greece have declined but remainhigher than in other Eurozone countries
Bank interest rates on loans in EUR – new business, maturity up to 1 year
Source: ECB (2018), “MFI interest rate statistics”, Statistical Data Warehouse, European Central Bank.1 2 http://dx.doi.org/10.1787/888933713346
0
2
4
6
8
10
0
2
4
6
8
10
2003
2004
2005
2006
2007
2008
2009
2010
2011
2012
2013
2014
2015
2016
2017
%%
Greece Germany Spain Italy
Ireland Portugal Euro area
©OECD 15
ASSESSMENT AND RECOMMENDATIONS
OECD ECONOMIC SURVEYS: GREECE © OECD 201824
GDP is projected to accelerate
GDP growth is projected to strengthen through 2018 and 2019, and remain above 2% in
both years. Business investment will rebound, after 10 years of contraction, as the new
investment law starts to yield results, and financing conditions as well as confidence
improve, quickening domestic demand growth. The effect of product and labour market
reforms will support competitiveness. Expanding employment and low inflation will
buttress private consumption. The recovery in domestic spending will progressively raise
imports, subtracting from aggregate growth, even as exports continue to expand (Table 2).
High levels of public debt and non-performing loans (NPLs) make Greece’s economic
outlook highly sensitive to any slippage in policy. Slower progress in addressing NPLs than
expected would lower confidence and investment. An exogenous shock to public debt
service costs after the ESM Stability Support Programme concludes in August 2018 could
compress public finances and confidence, dragging growth. Slower trading partner growth or
a disorderly Brexit could lower confidence and lead to lower exports. Additional public debt
restructuring would reduce vulnerabilities and accelerate gains in access to finance and in
activity. Stronger progress on the reform programme would raise productivity, investment
and exports faster than projected. A faster recovery in main trading partners would further
boost exports. The exposure of the Greek economy to large, low probability shocks is
illustrated in Table 3.
Figure 11. Bank deposits have levelled off and reliance on the central bank’sfunding is decreasing
Note: Deposits include deposits and repos of non-monetary and financial institutions (non-MFIs). Central bank funding includes ELAprovided by the Bank of Greece and financing provided by the ECB.Source: Bank of Greece.
1 2 http://dx.doi.org/10.1787/888933713365
0
50
100
150
200
250
300
350
0
50
100
150
200
250
300
350
2008
Q1
2008
Q2
2008
Q3
2008
Q4
2009
Q1
2009
Q2
2009
Q3
2009
Q4
2010
Q1
2010
Q2
2010
Q3
2010
Q4
2011
Q1
2011
Q2
2011
Q3
2011
Q4
2012
Q1
2012
Q2
2012
Q3
2012
Q4
2013
Q1
2013
Q2
2013
Q3
2013
Q4
2014
Q1
2014
Q2
2014
Q3
2014
Q4
2015
Q1
2015
Q2
2015
Q3
2015
Q4
2016
Q1
2016
Q2
2016
Q3
2016
Q4
2017
Q1
2017
Q2
2017
Q3
2017
Q4
Billion EURBillion EUR
Central bank funding Deposits of non-MFIs Interbank deposits
16 ©OECD
ASSESSMENT AND RECOMMENDATIONS
OECD ECONOMIC SURVEYS: GREECE © OECD 2018 25
Table 2. Macroeconomic indicators and projectionsAnnual percentage change, volume (2010 prices)
2014Current prices(billion EUR)
2015 2016 2017 2018 2019
Gross domestic product (GDP) 178.4 -0.3 -0.3 1.3 2.0 2.3
Private consumption 125.4 -0.5 0.1 0.1 0.4 1.5
Government consumption 36.3 1.1 -1.4 -1.2 0.7 1.5
Gross fixed capital formation 20.5 -0.3 1.5 9.7 7.9 8.1
Housing 1.8 -25.7 -12.4 -8.7 -2.1 1.0
Final domestic demand 182.2 -0.2 0.1 0.9 1.4 2.4
Stockbuilding1 0.4 -1.0 0.5 0.5 0.0 0.0
Total domestic demand 182.6 -1.1 0.4 1.6 1.5 2.4
Exports of goods and services 57.7 2.9 -1.9 6.9 5.9 4.4
Imports of goods and services 61.9 0.4 1.2 7.5 4.1 4.6
Net exports1 -4.2 0.8 -1.0 -0.3 0.6 -0.1
Other indicators (growth rates, unless specified)
Potential GDP . . -0.9 -0.5 -0.2 0.2 0.6
Output gap2 . . -13.2 -13.0 -11.6 -10.0 -8.5
Employment . . 2.1 1.7 2.2 1.3 1.7
Unemployment rate . . 24.9 23.5 21.5 20.4 19.4
GDP deflator . . -1.0 -0.9 0.5 0.5 0.7
Consumer price index (harmonised) . . -1.1 0.0 1.1 0.7 1.1
Core consumer prices (harmonised) . . -0.4 0.6 0.3 0.3 1.1
Household saving ratio, net3 . . -15.6 -17.0 -16.7 -19.0 -20.0
Current account balance4 . . -0.2 -1.1 -0.8 -0.5 -0.6
Government primary balance4 . . -2.4 3.6 3.7 4.0 3.6
General government fiscal balance4,5 . . -5.7 0.6 0.8 0.5 0.4
Underlying general government fiscal balance2 . . 4.6 6.7 6.1 5.3 4.4
Underlying government primary fiscal balance2 . . 7.4 9.3 8.7 8.5 7.3
General government gross debt (Maastricht)4 . . 177.1 181.1 175.8 172.5 168.3
General government net debt4 . . 147.8 149.3 145.8 141.6 137.0
Three-month money market rate, average . . 0.0 -0.3 -0.3 -0.3 -0.3
Ten-year government bond yield, average . . 9.6 8.4 6.0 5.0 4.8
1. Contribution to changes in real GDP2. As a percentage of potential GDP.3. As a percentage of household disposable income.4. As a percentage of GDP.5. The primary balance definition is different from that used in the ESM Support Stability Programme. The difference
amounts to approximately 0.2 percentage points of GDP.Source: OECD (2018), OECD Economic Outlook: Statistics and Projections (database).
Table 3. Low probability events that could lead to major changes in the outlook
Vulnerability Possible outcomes
Reform fatigue, leading to backtracking of structural reforms, andinsufficient debt restructuring.
Backtracking of structural reforms and insufficient debt restructuringwould result in lower potential growth, less resilience to economicshocks, ultimately impairing debt sustainability and raising politicaluncertainty to destabilising levels.
Heightening of geo-political tensions in the Mediterranean region andincrease in the influx of refugees.
A renewed large influx of refugees would strain national resources andcapacity to deal with it, harm the tourism industry and stoke socialtensions.
Severe financial market and banking system crisis in the context ofpersistent low growth and high public debt.
A systemic crisis would lead to large bank recapitalisation needs,which the private sector could be unwilling to fund.
©OECD 17
ASSESSMENT AND RECOMMENDATIONS
OECD ECONOMIC SURVEYS: GREECE © OECD 201826
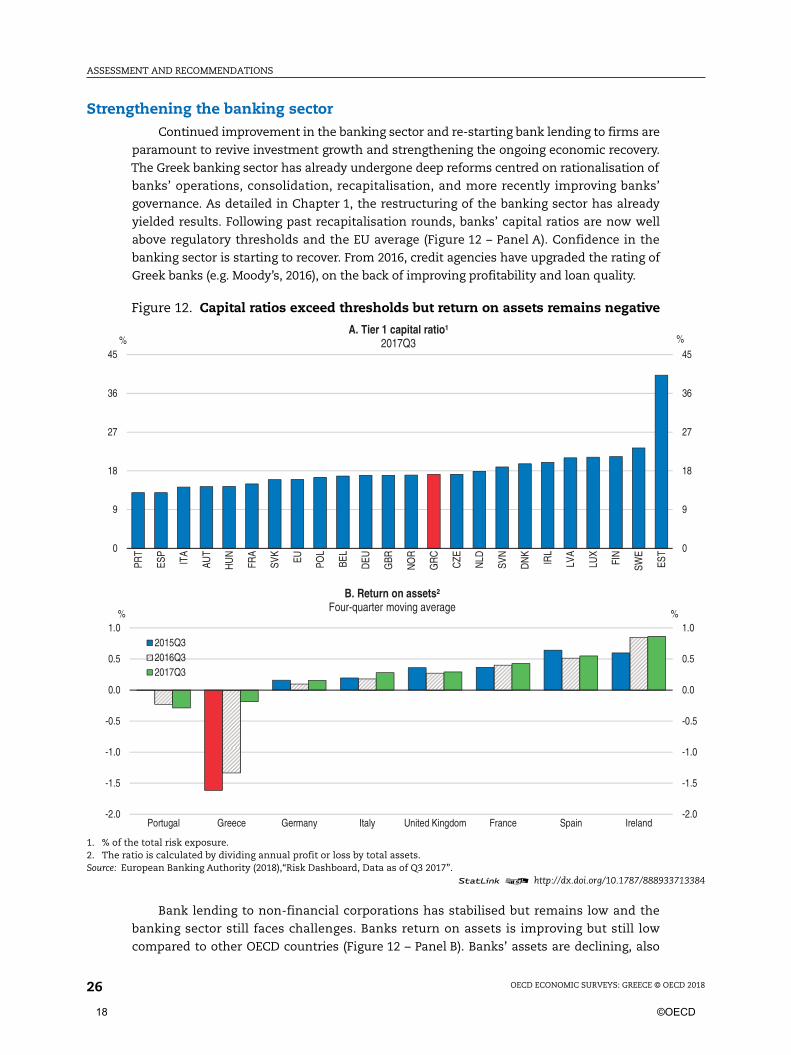
Strengthening the banking sectorContinued improvement in the banking sector and re-starting bank lending to firms are
paramount to revive investment growth and strengthening the ongoing economic recovery.
The Greek banking sector has already undergone deep reforms centred on rationalisation of
banks’ operations, consolidation, recapitalisation, and more recently improving banks’
governance. As detailed in Chapter 1, the restructuring of the banking sector has already
yielded results. Following past recapitalisation rounds, banks’ capital ratios are now well
above regulatory thresholds and the EU average (Figure 12 – Panel A). Confidence in the
banking sector is starting to recover. From 2016, credit agencies have upgraded the rating of
Greek banks (e.g. Moody’s, 2016), on the back of improving profitability and loan quality.
Bank lending to non-financial corporations has stabilised but remains low and the
banking sector still faces challenges. Banks return on assets is improving but still low
compared to other OECD countries (Figure 12 – Panel B). Banks’ assets are declining, also
Figure 12. Capital ratios exceed thresholds but return on assets remains negative
1. % of the total risk exposure.2. The ratio is calculated by dividing annual profit or loss by total assets.Source: European Banking Authority (2018),“Risk Dashboard, Data as of Q3 2017”.
1 2 http://dx.doi.org/10.1787/888933713384
0
9
18
27
36
45
0
9
18
27
36
45
PRT
ESP
ITA
AUT
HU
N
FRA
SVK
EU POL
BEL
DEU
GBR
NO
R
GR
C
CZE
NLD
SVN
DN
K
IRL
LVA
LUX
FIN
SWE
EST
%%A. Tier 1 capital ratio¹
2017Q3
-2.0
-1.5
-1.0
-0.5
0.0
0.5
1.0
-2.0
-1.5
-1.0
-0.5
0.0
0.5
1.0
Portugal Greece Germany Italy United Kingdom France Spain Ireland
%%
B. Return on assets²Four-quarter moving average
2015Q32016Q32017Q3
18 ©OECD
ASSESSMENT AND RECOMMENDATIONS
OECD ECONOMIC SURVEYS: GREECE © OECD 2018 27
because of disinvestment of foreign subsidiaries. Moreover, banks are well capitalised but the
stock of NPLs remains high and about half of capital consists of deferred tax credits (or 7% of
total assets) (Moody’s, 2017).
Banks’ governance framework has improved
Improving banks’ governance is essential to reap the full benefits of the banking-
sector reforms already undertaken. In the past, banks had poor corporate governance.
Eligibility criteria for banks’ boards were weak, resulting in poor management. Credit risks
were not properly assessed due to insufficient risk controls, lack of data and uneven use of
credit-scoring methodologies (IMF, 2006). These problems have skewed lending decisions
and contributed over the crisis to the rise in NPLs and their ineffective management.
The Single Supervisory Mechanism and the Bank of Greece supervise banks’ corporate
governance. The Hellenic Financial Stability Fund (HFSF) as a shareholder of banks plays an
important role in implementing corporate governance reforms. Such reforms have
progressed since the banks were consolidated and recapitalised in 2015. In 2016, the four
systemic banks replaced many members of their boards to conform to the new strict “fit and
proper” criteria. In 2017, the HFSF led an in-depth review of the governance and performance
of the four systemic banks’ boards of directors and their committees, aiming at establishing
a culture of evaluation at the board level and at focusing attention on managing NPLs.
Entrenching corporate governance reforms is a precondition for HFSF to divest its equity
holdings in the banks by 2020. The HFSF should keep aligning banks’ corporate governance
standards with international best practices and help ensure that respecting such standards
becomes common practice. The government should ensure HFSF’s continued independence
and authority to fully implement the new compulsory corporate governance standards.
Reducing non-performing loans
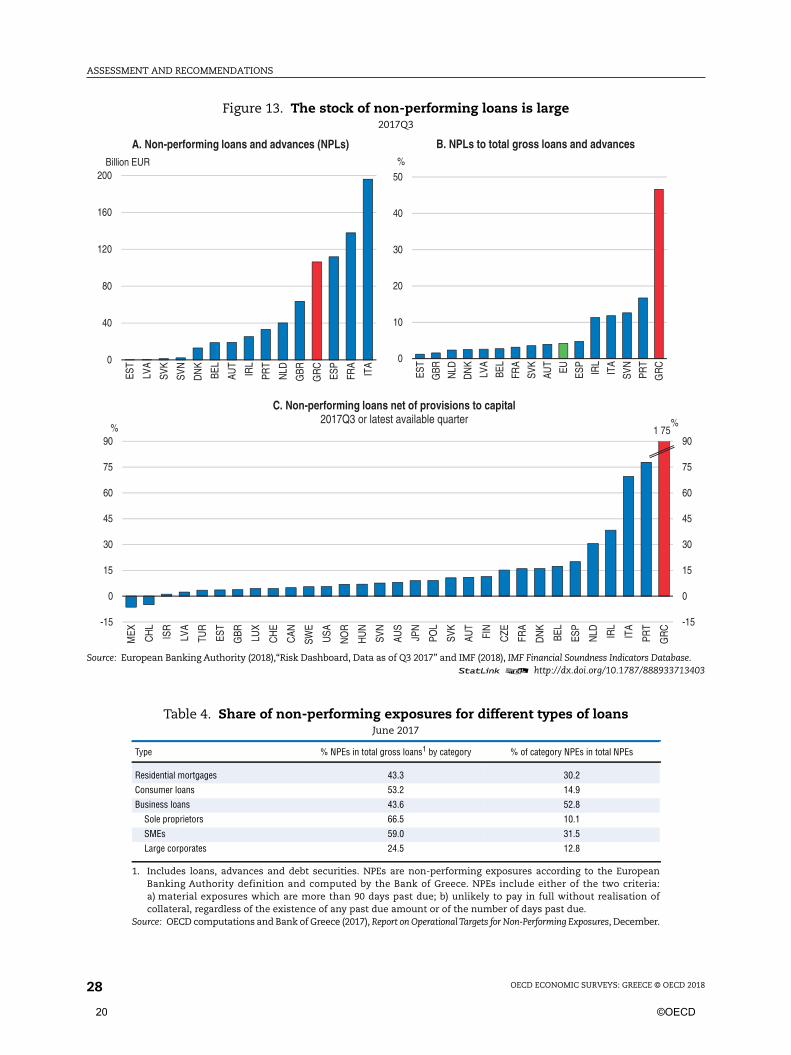
In September 2017, the gross value of NPLs stood at EUR 106 billion, which is about 47%
of total loans (Figure 13 – Panels A and B). The size of non-performing exposures (NPEs) –
which in addition to loans and advances consider debt securities other than those held for
trading – is similar to that of NPLs. In September 2017 the NPE ratio was 42% in Greece,
against 14% in Portugal and 10% in Italy and Ireland (EBA, 2017). In Greece, provisions
amount to 48% of NPLs’ gross value, higher than the EU average, and the net value of NPLs
(gross value minus provisions) amounts to about 175% of banks’ capital (Figure 13 – Panel C).
A large share of NPEs consists of loans towards SMEs and residential mortgages (Table 4).
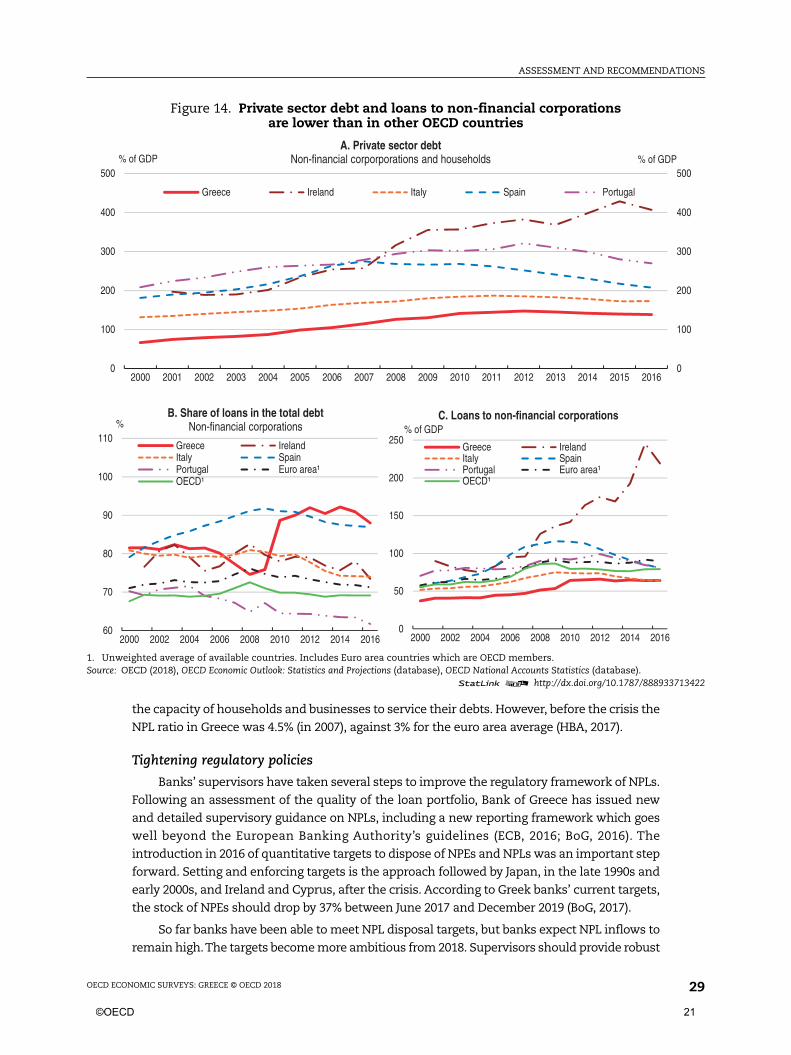
The prolonged crisis has led to the rise in NPLs in combination with structural and bank
governance problems. Private debt relative to GDP and the share of loans to non-financial
corporations is low compared to other OECD countries (Figure 14) but the long crisis has eroded
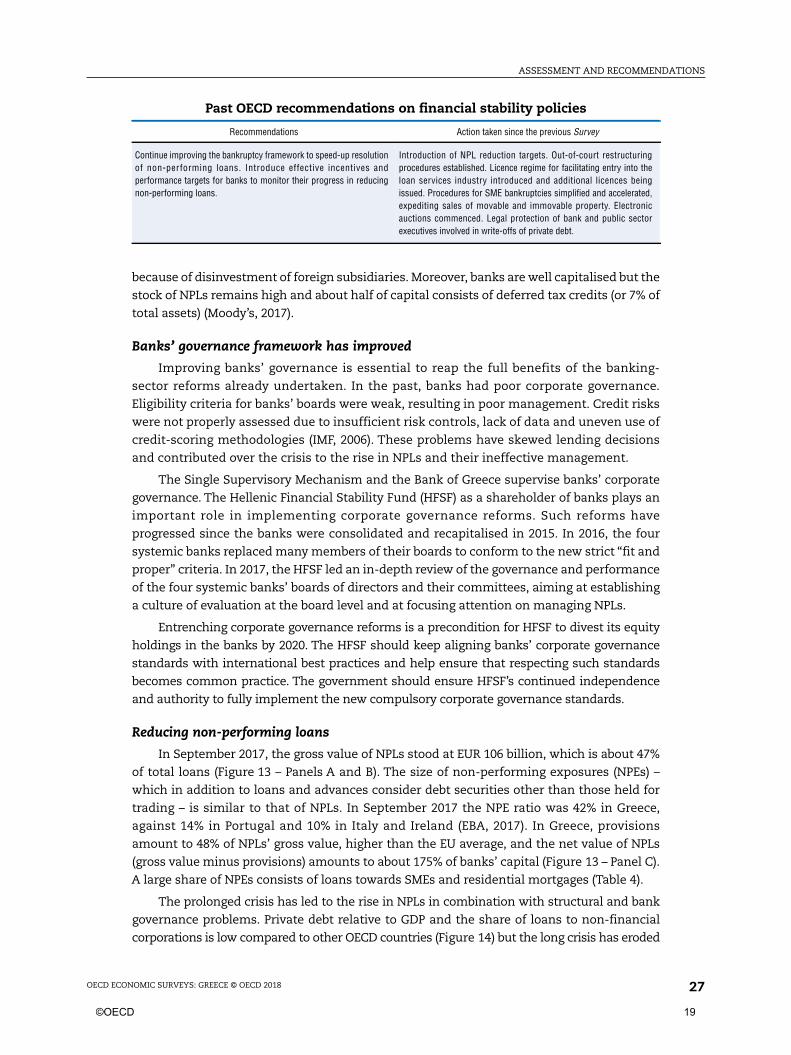
Past OECD recommendations on financial stability policies
Recommendations Action taken since the previous Survey
Continue improving the bankruptcy framework to speed-up resolutionof non-performing loans. Introduce effective incentives andperformance targets for banks to monitor their progress in reducingnon-performing loans.
Introduction of NPL reduction targets. Out-of-court restructuringprocedures established. Licence regime for facilitating entry into theloan services industry introduced and additional licences beingissued. Procedures for SME bankruptcies simplified and accelerated,expediting sales of movable and immovable property. Electronicauctions commenced. Legal protection of bank and public sectorexecutives involved in write-offs of private debt.
©OECD 19
ASSESSMENT AND RECOMMENDATIONS
OECD ECONOMIC SURVEYS: GREECE © OECD 201828
Figure 13. The stock of non-performing loans is large2017Q3
Source: European Banking Authority (2018),“Risk Dashboard, Data as of Q3 2017” and IMF (2018), IMF Financial Soundness Indicators Database.1 2 http://dx.doi.org/10.1787/888933713403
0
40
80
120
160
200
EST
LVA
SVK
SVN
DN
K
BEL
AUT
IRL
PRT
NLD
GBR
GR
C
ESP
FRA
ITA
A. Non-performing loans and advances (NPLs)Billion EUR
0
10
20
30
40
50
EST
GBR NLD
DN
K
LVA
BEL
FRA
SVK
AUT
EU ESP
IRL
ITA
SVN
PRT
GR
C
%
B. NPLs to total gross loans and advances
-15
0
15
30
45
60
75
90
-15
0
15
30
45
60
75
90
MEX CH
L
ISR
LVA
TUR
EST
GBR LU
X
CH
E
CAN
SWE
USA
NO
R
HU
N
SVN
AUS
JPN
POL
SVK
AUT
FIN
CZE
FRA
DN
K
BEL
ESP
NLD IR
L
ITA
PRT
GR
C
%%
C. Non-performing loans net of provisions to capital2017Q3 or latest available quarter
1 75
Table 4. Share of non-performing exposures for different types of loansJune 2017
Type % NPEs in total gross loans1 by category % of category NPEs in total NPEs
Residential mortgages 43.3 30.2
Consumer loans 53.2 14.9
Business loans 43.6 52.8
Sole proprietors 66.5 10.1
SMEs 59.0 31.5
Large corporates 24.5 12.8
1. Includes loans, advances and debt securities. NPEs are non-performing exposures according to the EuropeanBanking Authority definition and computed by the Bank of Greece. NPEs include either of the two criteria:a) material exposures which are more than 90 days past due; b) unlikely to pay in full without realisation ofcollateral, regardless of the existence of any past due amount or of the number of days past due.
Source: OECD computations and Bank of Greece (2017), Report on Operational Targets for Non-Performing Exposures, December.
20 ©OECD
ASSESSMENT AND RECOMMENDATIONS
OECD ECONOMIC SURVEYS: GREECE © OECD 2018 29
the capacity of households and businesses to service their debts. However, before the crisis the
NPL ratio in Greece was 4.5% (in 2007), against 3% for the euro area average (HBA, 2017).
Tightening regulatory policies
Banks’ supervisors have taken several steps to improve the regulatory framework of NPLs.
Following an assessment of the quality of the loan portfolio, Bank of Greece has issued new
and detailed supervisory guidance on NPLs, including a new reporting framework which goes
well beyond the European Banking Authority’s guidelines (ECB, 2016; BoG, 2016). The
introduction in 2016 of quantitative targets to dispose of NPEs and NPLs was an important step
forward. Setting and enforcing targets is the approach followed by Japan, in the late 1990s and
early 2000s, and Ireland and Cyprus, after the crisis. According to Greek banks’ current targets,
the stock of NPEs should drop by 37% between June 2017 and December 2019 (BoG, 2017).
So far banks have been able to meet NPL disposal targets, but banks expect NPL inflows to
remain high.The targets become more ambitious from 2018. Supervisors should provide robust
Figure 14. Private sector debt and loans to non-financial corporationsare lower than in other OECD countries
1. Unweighted average of available countries. Includes Euro area countries which are OECD members.Source: OECD (2018), OECD Economic Outlook: Statistics and Projections (database), OECD National Accounts Statistics (database).
1 2 http://dx.doi.org/10.1787/888933713422
60
70
80
90
100
110
2000 2002 2004 2006 2008 2010 2012 2014 2016
%B. Share of loans in the total debt
Non-financial corporations
Greece IrelandItaly SpainPortugal Euro area¹OECD¹
0
50
100
150
200
250
2000 2002 2004 2006 2008 2010 2012 2014 2016
% of GDPC. Loans to non-financial corporations
Greece IrelandItaly SpainPortugal Euro area¹OECD¹
0
100
200
300
400
500
0
100
200
300
400
500
2000 2001 2002 2003 2004 2005 2006 2007 2008 2009 2010 2011 2012 2013 2014 2015 2016
% of GDP% of GDPA. Private sector debt
Non-financial corporporations and households
Greece Ireland Italy Spain Portugal
©OECD 21
ASSESSMENT AND RECOMMENDATIONS
OECD ECONOMIC SURVEYS: GREECE © OECD 201830
and proactive supervision to ensure prudent NPL recognition and provisioning as well as strong
capital buffers. Non-compliance with NPL targets should trigger additional supervisory
measures, speeding up bank restructuring. Moreover, efforts should be pursued to enhance the
capacity of banks to manage NPLs internally, which is still low. As requested by supervisors all
major banks need to have independent internal units specialising in the management and
recovery of NPLs. Supervisors should ensure they are well staffed and resourced.
Supervisors (the Bank of Greece and the Single Supervisory Mechanism) should ensure
that as the disposal of NPLs gathers pace banks remain well capitalised. The banks’ stress
tests to be conducted in 2018 should be able to identify potential capital shortfalls before the
end of the ESM Stability Support Programme. In the event capital shortfalls are identified
that cannot be covered by the private sector, ESM Programme’s funds should be used to
ensure banks remain well capitalised.
Developing a market for distressed debt
The lack of a distressed debt market and weak demand for distressed debt explain why
to date there have been few non-performing loan sales.The first two NPL sales by Greek banks
took place in the second half of 2017; additional NPL sales are expected to be completed in
2018. Regulation and lack of competition has severely hindered the development of a loan
servicing (i.e. loan administration) industry in Greece. New law and regulations were
approved in 2015-16, lowering barriers to entry and allowing non-bank entities to be licensed
as loan servicers, in-line with international best practices (IMF, 2015). Licensed servicers will
be able to manage, transfer (i.e. purchase) and refinance large corporate loans. The BoG has
licenced 10 loan servicers at the end of 2017. The licensed loan services will help develop
distressed debt markets. Allowing loan services to manage or purchase SME loans is expected
to accelerate resolution of distressed debt given the large number of distressed SME
borrowers. Japan provides a good example of developing a distressed debt market in a
relationship banking environment with many SMEs as detailed in Chapter 1.
Tax incentives for banks to dispose of NPLs need to be streamlined. The new loan
servicing legislation introduced some tax-related provisions, but these are less advantageous
and partly inconsistent with those provided by the 2003 securitisation law. Aligning the tax
incentives provided by the loan servicing legislation with those of the securitisation law
would enhance tax transparency and encourage the disposal of NPLs. Tax incentives can be
an important tool to encourage the disposal of NPLs (KPMG, 2016). Making such incentives
temporary, for instance with sunset clauses, will accelerate their effects and ensure such
incentives expire when no longer needed.
Higher growth, prudent fiscal policy and debt restructuring will reducethe public debt
Greece’s government debt level as a share of GDP has stabilised. Yet, despite
restructuring efforts early in the crisis, the public debt at 180% of GDP is still among the
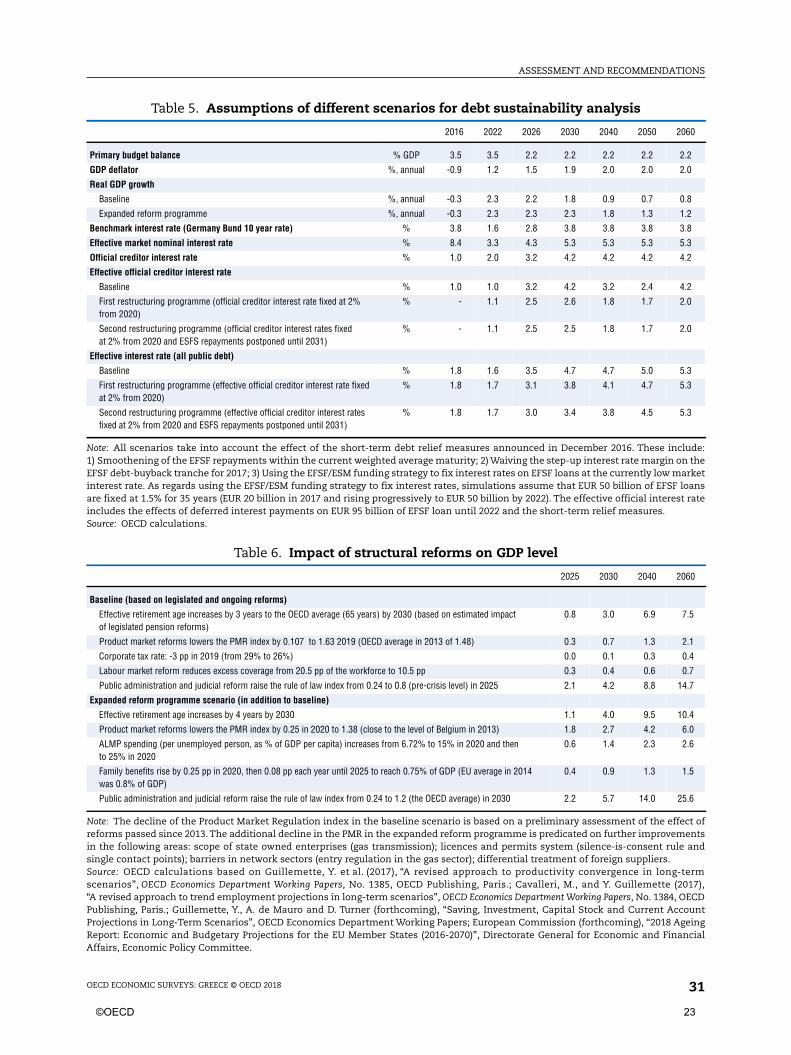
highest in the world. Under different assumptions (Table 5) debt will remain high, calling for
additional debt restructuring (Figure 15). The results of such simulations depend on GDP
growth, interest rate and other assumptions. The baseline scenario takes into account the
effect of selected reforms undertaken by the Greek government and short-term debt relief
measures being implemented by the ESM announced in December 2016 (Table 6). The
primary surplus is assumed to reach 3.5% from 2018 to 2022, then to stay at 2.2% of GDP from
2025 onwards. Under this scenario the debt ratio will gradually decline to about 120% of GDP
22 ©OECD
ASSESSMENT AND RECOMMENDATIONS
OECD ECONOMIC SURVEYS: GREECE © OECD 2018 31
Table 5. Assumptions of different scenarios for debt sustainability analysis
2016 2022 2026 2030 2040 2050 2060
Primary budget balance % GDP 3.5 3.5 2.2 2.2 2.2 2.2 2.2
GDP deflator %, annual -0.9 1.2 1.5 1.9 2.0 2.0 2.0
Real GDP growth
Baseline %, annual -0.3 2.3 2.2 1.8 0.9 0.7 0.8
Expanded reform programme %, annual -0.3 2.3 2.3 2.3 1.8 1.3 1.2
Benchmark interest rate (Germany Bund 10 year rate) % 3.8 1.6 2.8 3.8 3.8 3.8 3.8
Effective market nominal interest rate % 8.4 3.3 4.3 5.3 5.3 5.3 5.3
Official creditor interest rate % 1.0 2.0 3.2 4.2 4.2 4.2 4.2
Effective official creditor interest rate
Baseline % 1.0 1.0 3.2 4.2 3.2 2.4 4.2
First restructuring programme (official creditor interest rate fixed at 2%from 2020)
% - 1.1 2.5 2.6 1.8 1.7 2.0
Second restructuring programme (official creditor interest rates fixedat 2% from 2020 and ESFS repayments postponed until 2031)
% - 1.1 2.5 2.5 1.8 1.7 2.0
Effective interest rate (all public debt)
Baseline % 1.8 1.6 3.5 4.7 4.7 5.0 5.3
First restructuring programme (effective official creditor interest rate fixedat 2% from 2020)
% 1.8 1.7 3.1 3.8 4.1 4.7 5.3
Second restructuring programme (effective official creditor interest ratesfixed at 2% from 2020 and ESFS repayments postponed until 2031)
% 1.8 1.7 3.0 3.4 3.8 4.5 5.3
Note: All scenarios take into account the effect of the short-term debt relief measures announced in December 2016. These include:1) Smoothening of the EFSF repayments within the current weighted average maturity; 2) Waiving the step-up interest rate margin on theEFSF debt-buyback tranche for 2017; 3) Using the EFSF/ESM funding strategy to fix interest rates on EFSF loans at the currently low marketinterest rate. As regards using the EFSF/ESM funding strategy to fix interest rates, simulations assume that EUR 50 billion of EFSF loansare fixed at 1.5% for 35 years (EUR 20 billion in 2017 and rising progressively to EUR 50 billion by 2022). The effective official interest rateincludes the effects of deferred interest payments on EUR 95 billion of EFSF loan until 2022 and the short-term relief measures.Source: OECD calculations.
Table 6. Impact of structural reforms on GDP level
2025 2030 2040 2060
Baseline (based on legislated and ongoing reforms)
Effective retirement age increases by 3 years to the OECD average (65 years) by 2030 (based on estimated impactof legislated pension reforms)
0.8 3.0 6.9 7.5
Product market reforms lowers the PMR index by 0.107 to 1.63 2019 (OECD average in 2013 of 1.48) 0.3 0.7 1.3 2.1
Corporate tax rate: -3 pp in 2019 (from 29% to 26%) 0.0 0.1 0.3 0.4
Labour market reform reduces excess coverage from 20.5 pp of the workforce to 10.5 pp 0.3 0.4 0.6 0.7
Public administration and judicial reform raise the rule of law index from 0.24 to 0.8 (pre-crisis level) in 2025 2.1 4.2 8.8 14.7
Expanded reform programme scenario (in addition to baseline)
Effective retirement age increases by 4 years by 2030 1.1 4.0 9.5 10.4
Product market reforms lowers the PMR index by 0.25 in 2020 to 1.38 (close to the level of Belgium in 2013) 1.8 2.7 4.2 6.0
ALMP spending (per unemployed person, as % of GDP per capita) increases from 6.72% to 15% in 2020 and thento 25% in 2020
0.6 1.4 2.3 2.6
Family benefits rise by 0.25 pp in 2020, then 0.08 pp each year until 2025 to reach 0.75% of GDP (EU average in 2014was 0.8% of GDP)
0.4 0.9 1.3 1.5
Public administration and judicial reform raise the rule of law index from 0.24 to 1.2 (the OECD average) in 2030 2.2 5.7 14.0 25.6
Note: The decline of the Product Market Regulation index in the baseline scenario is based on a preliminary assessment of the effect ofreforms passed since 2013. The additional decline in the PMR in the expanded reform programme is predicated on further improvementsin the following areas: scope of state owned enterprises (gas transmission); licences and permits system (silence-is-consent rule andsingle contact points); barriers in network sectors (entry regulation in the gas sector); differential treatment of foreign suppliers.Source: OECD calculations based on Guillemette, Y. et al. (2017), “A revised approach to productivity convergence in long-termscenarios”, OECD Economics Department Working Papers, No. 1385, OECD Publishing, Paris.; Cavalleri, M., and Y. Guillemette (2017),“A revised approach to trend employment projections in long-term scenarios”, OECD Economics Department Working Papers, No. 1384, OECDPublishing, Paris.; Guillemette, Y., A. de Mauro and D. Turner (forthcoming), “Saving, Investment, Capital Stock and Current AccountProjections in Long-Term Scenarios”, OECD Economics Department Working Papers; European Commission (forthcoming), “2018 AgeingReport: Economic and Budgetary Projections for the EU Member States (2016-2070)”, Directorate General for Economic and FinancialAffairs, Economic Policy Committee.
©OECD 23
ASSESSMENT AND RECOMMENDATIONS
OECD ECONOMIC SURVEYS: GREECE © OECD 201832
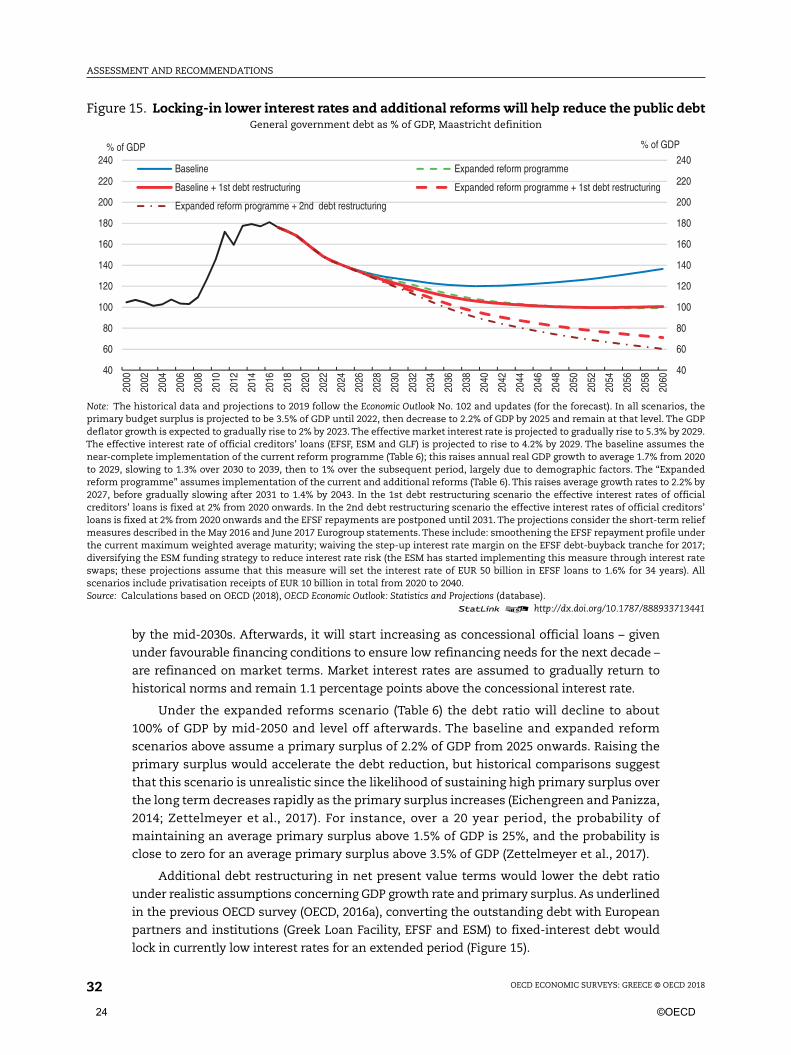
by the mid-2030s. Afterwards, it will start increasing as concessional official loans – given
under favourable financing conditions to ensure low refinancing needs for the next decade –
are refinanced on market terms. Market interest rates are assumed to gradually return to
historical norms and remain 1.1 percentage points above the concessional interest rate.
Under the expanded reforms scenario (Table 6) the debt ratio will decline to about
100% of GDP by mid-2050 and level off afterwards. The baseline and expanded reform
scenarios above assume a primary surplus of 2.2% of GDP from 2025 onwards. Raising the
primary surplus would accelerate the debt reduction, but historical comparisons suggest
that this scenario is unrealistic since the likelihood of sustaining high primary surplus over
the long term decreases rapidly as the primary surplus increases (Eichengreen and Panizza,
2014; Zettelmeyer et al., 2017). For instance, over a 20 year period, the probability of
maintaining an average primary surplus above 1.5% of GDP is 25%, and the probability is
close to zero for an average primary surplus above 3.5% of GDP (Zettelmeyer et al., 2017).
Additional debt restructuring in net present value terms would lower the debt ratio
under realistic assumptions concerning GDP growth rate and primary surplus. As underlined
in the previous OECD survey (OECD, 2016a), converting the outstanding debt with European
partners and institutions (Greek Loan Facility, EFSF and ESM) to fixed-interest debt would
lock in currently low interest rates for an extended period (Figure 15).
Figure 15. Locking-in lower interest rates and additional reforms will help reduce the public debtGeneral government debt as % of GDP, Maastricht definition
Note: The historical data and projections to 2019 follow the Economic Outlook No. 102 and updates (for the forecast). In all scenarios, theprimary budget surplus is projected to be 3.5% of GDP until 2022, then decrease to 2.2% of GDP by 2025 and remain at that level. The GDPdeflator growth is expected to gradually rise to 2% by 2023. The effective market interest rate is projected to gradually rise to 5.3% by 2029.The effective interest rate of official creditors’ loans (EFSF, ESM and GLF) is projected to rise to 4.2% by 2029. The baseline assumes thenear-complete implementation of the current reform programme (Table 6); this raises annual real GDP growth to average 1.7% from 2020to 2029, slowing to 1.3% over 2030 to 2039, then to 1% over the subsequent period, largely due to demographic factors. The “Expandedreform programme” assumes implementation of the current and additional reforms (Table 6). This raises average growth rates to 2.2% by2027, before gradually slowing after 2031 to 1.4% by 2043. In the 1st debt restructuring scenario the effective interest rates of officialcreditors’ loans is fixed at 2% from 2020 onwards. In the 2nd debt restructuring scenario the effective interest rates of official creditors’loans is fixed at 2% from 2020 onwards and the EFSF repayments are postponed until 2031. The projections consider the short-term reliefmeasures described in the May 2016 and June 2017 Eurogroup statements. These include: smoothening the EFSF repayment profile underthe current maximum weighted average maturity; waiving the step-up interest rate margin on the EFSF debt-buyback tranche for 2017;diversifying the ESM funding strategy to reduce interest rate risk (the ESM has started implementing this measure through interest rateswaps; these projections assume that this measure will set the interest rate of EUR 50 billion in EFSF loans to 1.6% for 34 years). Allscenarios include privatisation receipts of EUR 10 billion in total from 2020 to 2040.Source: Calculations based on OECD (2018), OECD Economic Outlook: Statistics and Projections (database).
1 2 http://dx.doi.org/10.1787/888933713441
40
60
80
100
120
140
160
180
200
220
240
40
60
80
100
120
140
160
180
200
220
240
2000
2002
2004
2006
2008
2010
2012
2014
2016
2018
2020
2022
2024
2026
2028
2030
2032
2034
2036
2038
2040
2042
2044
2046
2048
2050
2052
2054
2056
2058
2060
% of GDP
Baseline Expanded reform programme
Baseline + 1st debt restructuring Expanded reform programme + 1st debt restructuring
Expanded reform programme + 2nd debt restructuring
% of GDP
24 ©OECD
ASSESSMENT AND RECOMMENDATIONS
OECD ECONOMIC SURVEYS: GREECE © OECD 2018 33
Under the expanded reform programme scenario, locking in low interest rates on
concessional loans would lead to a faster and continued decline in the debt ratio throughout
the projection period, which would fall below 80% by 2060. This policy would have the
additional benefit of lowering the uncertainty relating to concessional loans’ interest rate
movements, which might result in a lower Greek bond spread on benchmark rates than
projected and further accelerate the debt reduction. Reducing the interest rate risk is already
being partially undertaken as part of the short-term relief measures announced in December
2016, which these projections take into account. Rescheduling principal payments of
European partners and institutions loans until 2031 will contribute to lower the debt ratio but
only marginally (Figure 15).
Overall, this analysis suggests that durably reducing the public debt hinges on a three-
pronged strategy: additional reforms to boost GDP growth, large but realistic primary
surpluses (close to 2% of GDP) for an extended period, and additional debt restructuring, as
needed, by for instance locking in currently low interest rates. To this end and to enhance
trust, the government is designing a long-term National Growth Strategy with key
commitments for the post-programme period in different areas, including strategic and
private sector investments, use of European structural funds, infrastructure and
entrepreneurship. Wide and strong political ownership of this strategy is key for its
credibility and to maintain confidence in Greece’s reform momentum. The strategy will be
finalised before the end of the programme.
Redressing public finance to bolster inclusive growth
Enlarging the tax base to build a fairer and pro-growth taxation system
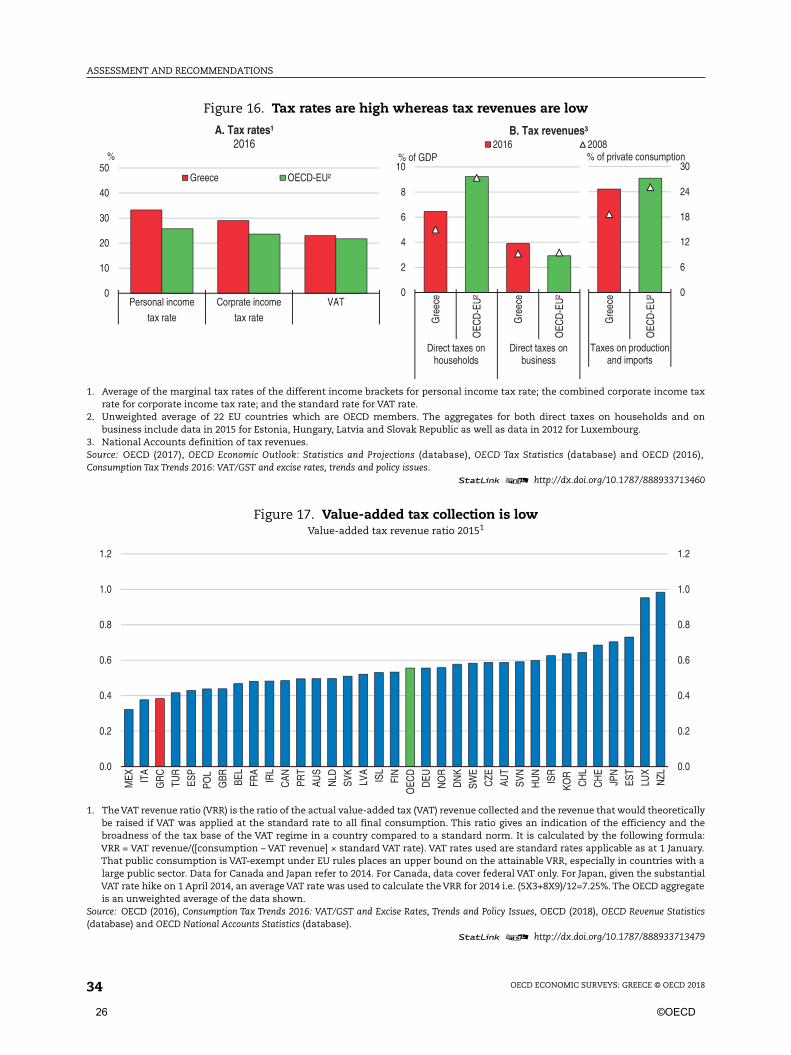
The tax system relies on high rates and narrow bases. Following repeated increases, the
rate of all major taxes are now higher than in other European countries but tax collection is
lower relative to GDP (Figure 16). Also, the average tax wedge on labour for families with
children is one of the highest among OECD countries. The tax wedge for households without
children is lower but still ranks in the top half of OECD countries (OECD, 2017a).
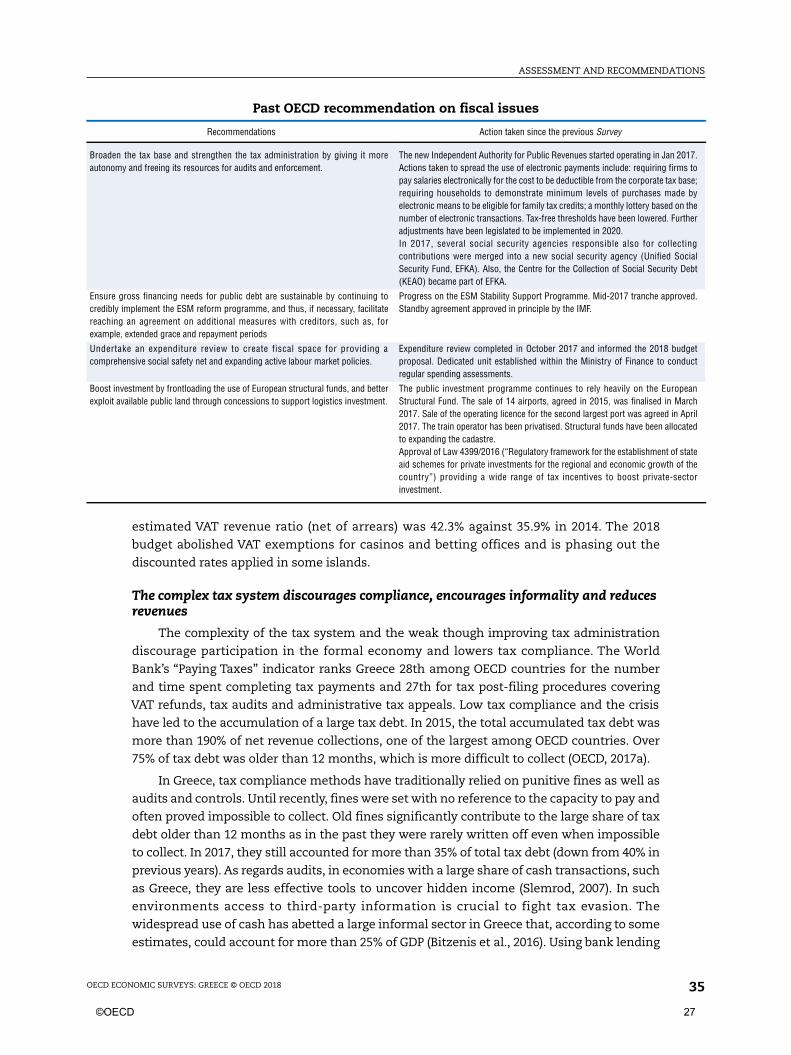
Most tax expenditures have been eliminated, but tax evasion results in a narrow tax
base. For instance, in 2015 the VAT revenue ratio was one-third below the OECD average
(Figure 17) because of low collections but also reduced VAT rates and exemptions. Some
exemptions are without any social rationale as for instance exemptions for casinos and
betting offices. Also, post office services and national broadcasting networks are VAT
exempted whereas hotels enjoy a reduced VAT rate of 13% (from 6.5% in 2016). According
to the Ministry of Finance, VAT exemptions account for 0.5% of GDP (those for casinos and
betting offices amount to 0.2% of GDP). The tax-free personal income threshold is high (at
about EUR 8 600 annual income) and is above the median private sector wage.
Base broadening is more growth friendly than increases in tax rates (IMF, 2013; Gale and
Samwick, 2016). The government is aware of this and is taking initiatives in this direction. In
2016 Greece moved from a dual to a comprehensive personal income tax by taxing labour
remuneration, pensions and personal business income jointly instead of taxing these
income categories under separate rate schedules (OECD, 2017a).The legislated medium-term
fiscal strategy indicates that the tax-free personal income threshold will fall by 35% in 2020,
and, if fiscal targets are met, the corporate, personal and property tax rates will also fall in a
revenue-neutral way. VAT collection has increased as some reduced rates have been raised,
some exemptions closed and collection approaches have improved. In 2016, the preliminary
©OECD 25
ASSESSMENT AND RECOMMENDATIONS
OECD ECONOMIC SURVEYS: GREECE © OECD 201834
Figure 16. Tax rates are high whereas tax revenues are low
1. Average of the marginal tax rates of the different income brackets for personal income tax rate; the combined corporate income taxrate for corporate income tax rate; and the standard rate for VAT rate.
2. Unweighted average of 22 EU countries which are OECD members. The aggregates for both direct taxes on households and onbusiness include data in 2015 for Estonia, Hungary, Latvia and Slovak Republic as well as data in 2012 for Luxembourg.
3. National Accounts definition of tax revenues.Source: OECD (2017), OECD Economic Outlook: Statistics and Projections (database), OECD Tax Statistics (database) and OECD (2016),Consumption Tax Trends 2016: VAT/GST and excise rates, trends and policy issues.
1 2 http://dx.doi.org/10.1787/888933713460
Figure 17. Value-added tax collection is lowValue-added tax revenue ratio 20151
1. The VAT revenue ratio (VRR) is the ratio of the actual value-added tax (VAT) revenue collected and the revenue that would theoreticallybe raised if VAT was applied at the standard rate to all final consumption. This ratio gives an indication of the efficiency and thebroadness of the tax base of the VAT regime in a country compared to a standard norm. It is calculated by the following formula:VRR = VAT revenue/([consumption – VAT revenue] × standard VAT rate). VAT rates used are standard rates applicable as at 1 January.That public consumption is VAT-exempt under EU rules places an upper bound on the attainable VRR, especially in countries with alarge public sector. Data for Canada and Japan refer to 2014. For Canada, data cover federal VAT only. For Japan, given the substantialVAT rate hike on 1 April 2014, an average VAT rate was used to calculate the VRR for 2014 i.e. (5X3+8X9)/12=7.25%. The OECD aggregateis an unweighted average of the data shown.
Source: OECD (2016), Consumption Tax Trends 2016: VAT/GST and Excise Rates, Trends and Policy Issues, OECD (2018), OECD Revenue Statistics(database) and OECD National Accounts Statistics (database).
1 2 http://dx.doi.org/10.1787/888933713479
0
10
20
30
40
50
Personal income Corprate income VAT
tax rate tax rate
%
A. Tax rates¹2016
Greece OECD-EU²
0
2
4
6
8
10
Gre
ece
OEC
D-E
U²
Gre
ece
OEC
D-E
U²
Direct taxes onhouseholds
Direct taxes onbusiness
% of GDP
B. Tax revenues³2016 2008
0
6
12
18
24
30
Gre
ece
OEC
D-E
U²
Taxes on productionand imports
% of private consumption
0.0
0.2
0.4
0.6
0.8
1.0
1.2
0.0
0.2
0.4
0.6
0.8
1.0
1.2
MEX IT
A
GR
C
TUR
ESP
POL
GBR BE
L
FRA
IRL
CAN PR
T
AUS
NLD
SVK
LVA
ISL
FIN
OEC
D
DEU
NO
R
DN
K
SWE
CZE
AUT
SVN
HU
N
ISR
KOR
CH
L
CH
E
JPN
EST
LUX
NZL
26 ©OECD
ASSESSMENT AND RECOMMENDATIONS
OECD ECONOMIC SURVEYS: GREECE © OECD 2018 35
estimated VAT revenue ratio (net of arrears) was 42.3% against 35.9% in 2014. The 2018
budget abolished VAT exemptions for casinos and betting offices and is phasing out the
discounted rates applied in some islands.
The complex tax system discourages compliance, encourages informality and reducesrevenues
The complexity of the tax system and the weak though improving tax administration
discourage participation in the formal economy and lowers tax compliance. The World
Bank’s “Paying Taxes” indicator ranks Greece 28th among OECD countries for the number
and time spent completing tax payments and 27th for tax post-filing procedures covering
VAT refunds, tax audits and administrative tax appeals. Low tax compliance and the crisis
have led to the accumulation of a large tax debt. In 2015, the total accumulated tax debt was
more than 190% of net revenue collections, one of the largest among OECD countries. Over
75% of tax debt was older than 12 months, which is more difficult to collect (OECD, 2017a).
In Greece, tax compliance methods have traditionally relied on punitive fines as well as
audits and controls. Until recently, fines were set with no reference to the capacity to pay and
often proved impossible to collect. Old fines significantly contribute to the large share of tax
debt older than 12 months as in the past they were rarely written off even when impossible
to collect. In 2017, they still accounted for more than 35% of total tax debt (down from 40% in
previous years). As regards audits, in economies with a large share of cash transactions, such
as Greece, they are less effective tools to uncover hidden income (Slemrod, 2007). In such
environments access to third-party information is crucial to fight tax evasion. The
widespread use of cash has abetted a large informal sector in Greece that, according to some
estimates, could account for more than 25% of GDP (Bitzenis et al., 2016). Using bank lending
Past OECD recommendation on fiscal issues
Recommendations Action taken since the previous Survey
Broaden the tax base and strengthen the tax administration by giving it moreautonomy and freeing its resources for audits and enforcement.
The new Independent Authority for Public Revenues started operating in Jan 2017.Actions taken to spread the use of electronic payments include: requiring firms topay salaries electronically for the cost to be deductible from the corporate tax base;requiring households to demonstrate minimum levels of purchases made byelectronic means to be eligible for family tax credits; a monthly lottery based on thenumber of electronic transactions. Tax-free thresholds have been lowered. Furtheradjustments have been legislated to be implemented in 2020.In 2017, several social security agencies responsible also for collectingcontributions were merged into a new social security agency (Unified SocialSecurity Fund, EFKA). Also, the Centre for the Collection of Social Security Debt(KEAO) became part of EFKA.
Ensure gross financing needs for public debt are sustainable by continuing tocredibly implement the ESM reform programme, and thus, if necessary, facilitatereaching an agreement on additional measures with creditors, such as, forexample, extended grace and repayment periods
Progress on the ESM Stability Support Programme. Mid-2017 tranche approved.Standby agreement approved in principle by the IMF.
Undertake an expenditure review to create fiscal space for providing acomprehensive social safety net and expanding active labour market policies.
Expenditure review completed in October 2017 and informed the 2018 budgetproposal. Dedicated unit established within the Ministry of Finance to conductregular spending assessments.
Boost investment by frontloading the use of European structural funds, and betterexploit available public land through concessions to support logistics investment.
The public investment programme continues to rely heavily on the EuropeanStructural Fund. The sale of 14 airports, agreed in 2015, was finalised in March2017. Sale of the operating licence for the second largest port was agreed in April2017. The train operator has been privatised. Structural funds have been allocatedto expanding the cadastre.Approval of Law 4399/2016 (“Regulatory framework for the establishment of stateaid schemes for private investments for the regional and economic growth of thecountry”) providing a wide range of tax incentives to boost private-sectorinvestment.
©OECD 27
ASSESSMENT AND RECOMMENDATIONS
OECD ECONOMIC SURVEYS: GREECE © OECD 201836
data, Artavanis et al., (2016) estimated that more than 40% of self-employment income goes
unreported and for 2009 alone the foregone tax revenues amounted to more than 10% of total
revenue. The informal economy might have increased substantially during the crisis. Had
the informal economy not expanded so much, the required increases in tax rates would have
been smaller (Dellas et al., 2017).
Recent reforms have stepped up efforts against tax evasion and improved collection
approaches based on better enforcement procedures and encouraging voluntary tax
compliance. Better enforcement procedures require extending the use of risk analysis and
targeted audits, and access to third-party information. Enhancing tax compliance depends
on raising trust in the tax administration and tax awareness (Muehlbacher et al., 2011). The
establishment of the independent revenue agency (Independent Authority for Public
Revenues), as recommended in the previous OECD Survey, in early 2017 is a big step in this
direction. In addition to extending the use of risk analysis and targeted tax audits the new
agency has introduced a systematic approach to deal with the tax debt by systematically
pursuing the largest possible number of debtors, prioritising new tax debts, large taxpayers,
and enforcement against strategic defaulters. At end 2017 60% of tax debtors who could be
pursued, about 1 million debtors, were under some enforcement measure.
These efforts are yielding results and should be pursued. The gross new tax debt declined
markedly to EUR 11.5 billion in 2017 (from EUR 14 billion in 2016 and nearly EUR 16 billion in
2015). The growth of the total tax debt declined to 6% in 2017 and 9% in 2016 from double
digit growth rates in the previous two years. The old tax debt is being managed in a more
systematic way, focussing on collectable tax arrears and progressively writing off those
arrears deemed uncollectable (to a large extent old punitive fines). Punitive fines have been
abolished and are now based on the capacity to pay. A voluntary scheme introduced in 2016
has led to the disclosure of hitherto unreported income of EUR 9.5 billion.
Raising the share of non-cash payments, which is low by international standards, is
essential to combat tax evasion. Capital controls have increased the share of non-cash
payments, reversing the downward trend that started in 2011 (Figure 18), thus boosting VAT
revenue significantly (Hondroyiannis and Papaoikonomou, 2017).The cash-payment threshold
for retail transactions is already low (EUR 500) but electronic payments need to become the
norm given the government’s plan to lift capital controls as the economy improves. The
government has taken innovative steps to encourage electronic payments: firms have to pay
salaries electronically for the cost to be deductible from the corporate tax base; households
have to demonstrate minimum levels of purchases done electronically to be eligible for family
tax credits. This approach emulates Korea’s cash receipt system, which reduced hidden
payments (Krever, 2014). At a macroeconomic level, it also has the advantage of shifting
taxation from personal income to consumption. Besides, the government has introduced a
monthly lottery based on the number of electronic transactions. A similar scheme introduced
in Chinese Taipei has raised VAT revenue by up to 20%. Other recent experiences in Portugal
and Slovakia however indicate modest effect on revenues (European Commission, 2015).
These innovative approaches to combat tax evasion are welcome and represent a
change with the past. However, they should better target those industries most prone to tax
evasion, such as professional services (Artavanis et al., 2017). From mid-2017, commercial
and most professional activities are obliged to have a point-of-sale terminal. The use of
point-of-sale terminals can be further extended by ensuring all the self-employed have an
electronic cash register. The introduction of e-invoicing will also help stanch tax evasion.
Italy introduced e-invoicing for sales to the public administration in 2014 and will phase it in
28 ©OECD
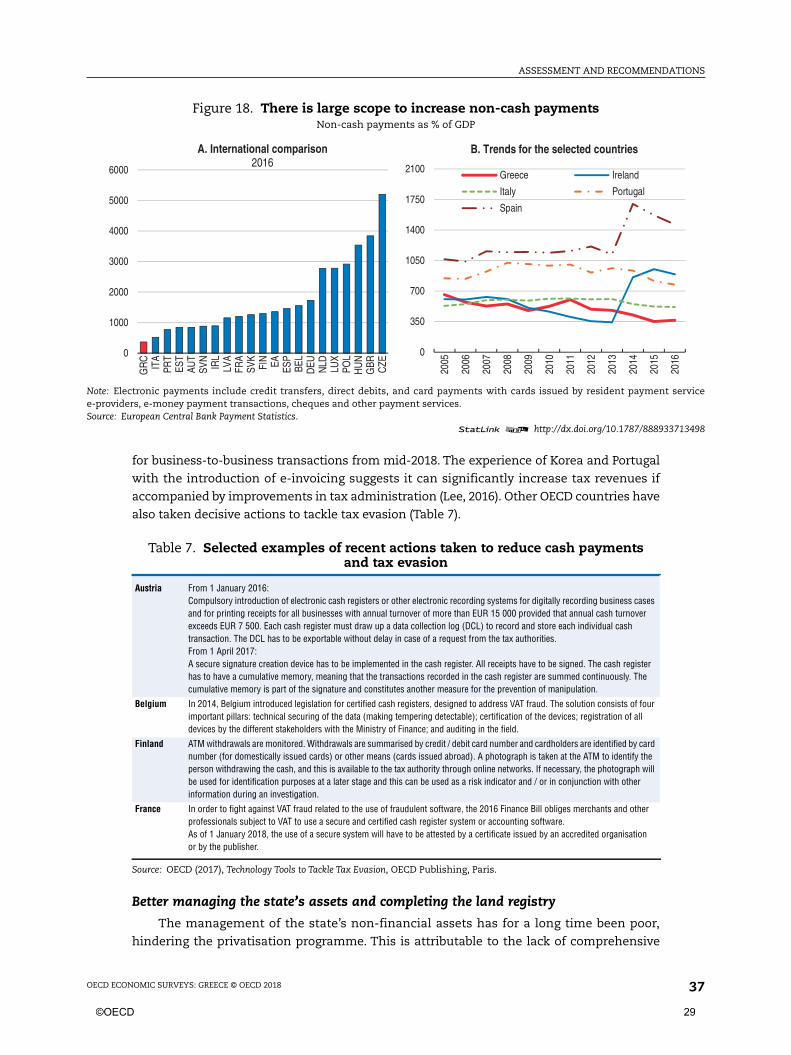
ASSESSMENT AND RECOMMENDATIONS
OECD ECONOMIC SURVEYS: GREECE © OECD 2018 37
for business-to-business transactions from mid-2018. The experience of Korea and Portugal
with the introduction of e-invoicing suggests it can significantly increase tax revenues if
accompanied by improvements in tax administration (Lee, 2016). Other OECD countries have
also taken decisive actions to tackle tax evasion (Table 7).
Better managing the state’s assets and completing the land registry
The management of the state’s non-financial assets has for a long time been poor,
hindering the privatisation programme. This is attributable to the lack of comprehensive
Figure 18. There is large scope to increase non-cash paymentsNon-cash payments as % of GDP
Note: Electronic payments include credit transfers, direct debits, and card payments with cards issued by resident payment servicee-providers, e-money payment transactions, cheques and other payment services.Source: European Central Bank Payment Statistics.
1 2 http://dx.doi.org/10.1787/888933713498
0
1000
2000
3000
4000
5000
6000
GR
CIT
APR
TES
TAU
TSV
NIR
LLV
AFR
ASV
KFI
N EA ESP
BEL
DEU NLD LU
XPO
LH
UN
GBR CZE
A. International comparison2016
0
350
700
1050
1400
1750
2100
2005
2006
2007
2008
2009
2010
2011
2012
2013
2014
2015
2016
B. Trends for the selected countries
Greece Ireland
Italy Portugal
Spain
Table 7. Selected examples of recent actions taken to reduce cash paymentsand tax evasion
Austria From 1 January 2016:Compulsory introduction of electronic cash registers or other electronic recording systems for digitally recording business casesand for printing receipts for all businesses with annual turnover of more than EUR 15 000 provided that annual cash turnoverexceeds EUR 7 500. Each cash register must draw up a data collection log (DCL) to record and store each individual cashtransaction. The DCL has to be exportable without delay in case of a request from the tax authorities.From 1 April 2017:A secure signature creation device has to be implemented in the cash register. All receipts have to be signed. The cash registerhas to have a cumulative memory, meaning that the transactions recorded in the cash register are summed continuously. Thecumulative memory is part of the signature and constitutes another measure for the prevention of manipulation.
Belgium In 2014, Belgium introduced legislation for certified cash registers, designed to address VAT fraud. The solution consists of fourimportant pillars: technical securing of the data (making tempering detectable); certification of the devices; registration of alldevices by the different stakeholders with the Ministry of Finance; and auditing in the field.
Finland ATM withdrawals are monitored. Withdrawals are summarised by credit / debit card number and cardholders are identified by cardnumber (for domestically issued cards) or other means (cards issued abroad). A photograph is taken at the ATM to identify theperson withdrawing the cash, and this is available to the tax authority through online networks. If necessary, the photograph willbe used for identification purposes at a later stage and this can be used as a risk indicator and / or in conjunction with otherinformation during an investigation.
France In order to fight against VAT fraud related to the use of fraudulent software, the 2016 Finance Bill obliges merchants and otherprofessionals subject to VAT to use a secure and certified cash register system or accounting software.As of 1 January 2018, the use of a secure system will have to be attested by a certificate issued by an accredited organisationor by the publisher.
Source: OECD (2017), Technology Tools to Tackle Tax Evasion, OECD Publishing, Paris.
©OECD 29
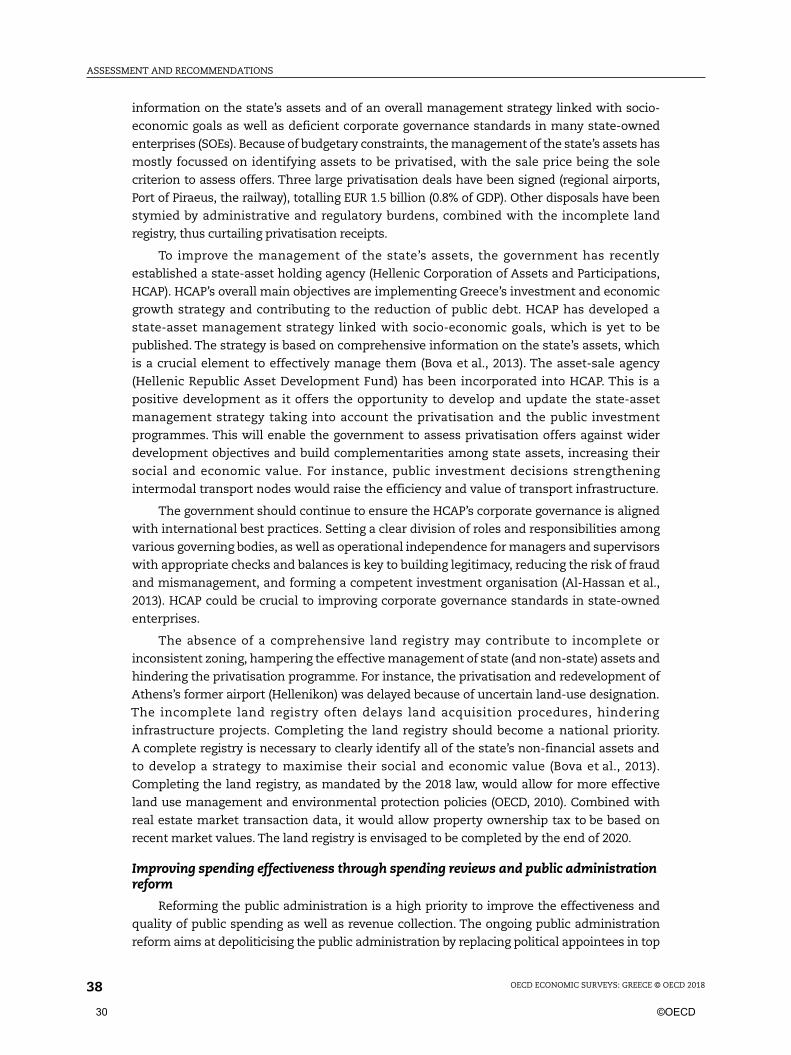
ASSESSMENT AND RECOMMENDATIONS
OECD ECONOMIC SURVEYS: GREECE © OECD 201838
information on the state’s assets and of an overall management strategy linked with socio-
economic goals as well as deficient corporate governance standards in many state-owned
enterprises (SOEs). Because of budgetary constraints, the management of the state’s assets has
mostly focussed on identifying assets to be privatised, with the sale price being the sole
criterion to assess offers. Three large privatisation deals have been signed (regional airports,
Port of Piraeus, the railway), totalling EUR 1.5 billion (0.8% of GDP). Other disposals have been
stymied by administrative and regulatory burdens, combined with the incomplete land
registry, thus curtailing privatisation receipts.
To improve the management of the state’s assets, the government has recently
established a state-asset holding agency (Hellenic Corporation of Assets and Participations,
HCAP). HCAP’s overall main objectives are implementing Greece’s investment and economic
growth strategy and contributing to the reduction of public debt. HCAP has developed a
state-asset management strategy linked with socio-economic goals, which is yet to be
published. The strategy is based on comprehensive information on the state’s assets, which
is a crucial element to effectively manage them (Bova et al., 2013). The asset-sale agency
(Hellenic Republic Asset Development Fund) has been incorporated into HCAP. This is a
positive development as it offers the opportunity to develop and update the state-asset
management strategy taking into account the privatisation and the public investment
programmes. This will enable the government to assess privatisation offers against wider
development objectives and build complementarities among state assets, increasing their
social and economic value. For instance, public investment decisions strengthening
intermodal transport nodes would raise the efficiency and value of transport infrastructure.
The government should continue to ensure the HCAP’s corporate governance is aligned
with international best practices. Setting a clear division of roles and responsibilities among
various governing bodies, as well as operational independence for managers and supervisors
with appropriate checks and balances is key to building legitimacy, reducing the risk of fraud
and mismanagement, and forming a competent investment organisation (Al-Hassan et al.,
2013). HCAP could be crucial to improving corporate governance standards in state-owned
enterprises.
The absence of a comprehensive land registry may contribute to incomplete or
inconsistent zoning, hampering the effective management of state (and non-state) assets and
hindering the privatisation programme. For instance, the privatisation and redevelopment of
Athens’s former airport (Hellenikon) was delayed because of uncertain land-use designation.
The incomplete land registry often delays land acquisition procedures, hindering
infrastructure projects. Completing the land registry should become a national priority.
A complete registry is necessary to clearly identify all of the state’s non-financial assets and
to develop a strategy to maximise their social and economic value (Bova et al., 2013).
Completing the land registry, as mandated by the 2018 law, would allow for more effective
land use management and environmental protection policies (OECD, 2010). Combined with
real estate market transaction data, it would allow property ownership tax to be based on
recent market values. The land registry is envisaged to be completed by the end of 2020.
Improving spending effectiveness through spending reviews and public administrationreform
Reforming the public administration is a high priority to improve the effectiveness and
quality of public spending as well as revenue collection. The ongoing public administration
reform aims at depoliticising the public administration by replacing political appointees in top
30 ©OECD
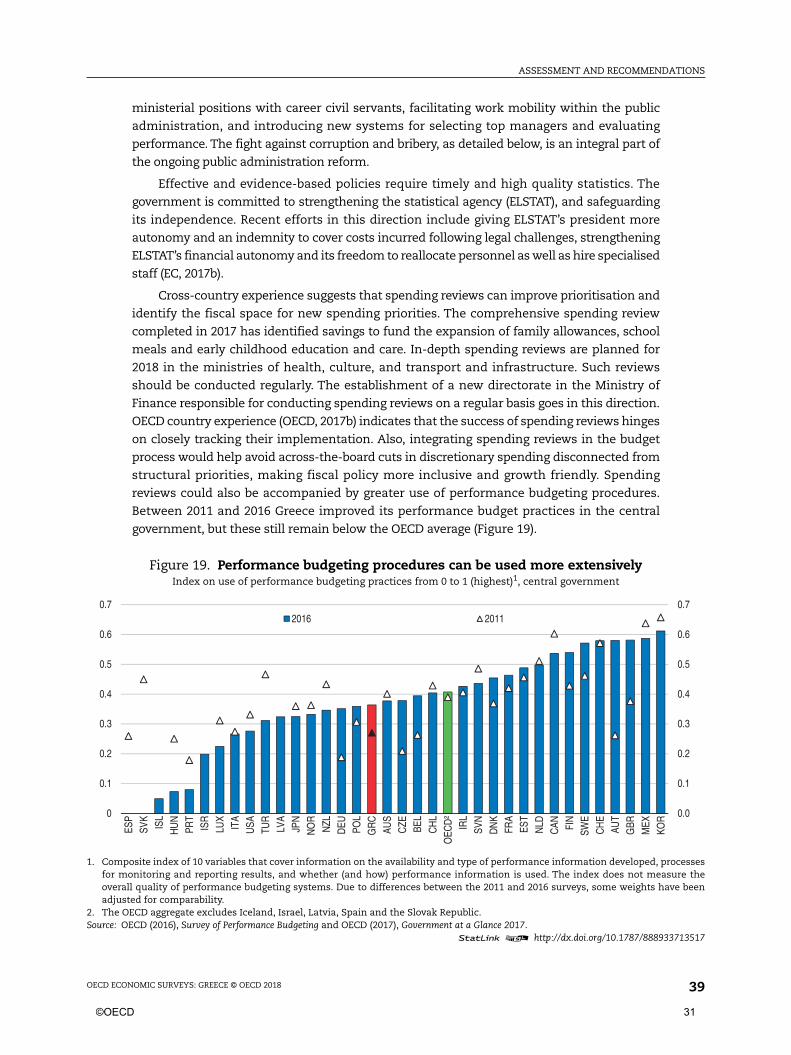
ASSESSMENT AND RECOMMENDATIONS
OECD ECONOMIC SURVEYS: GREECE © OECD 2018 39
ministerial positions with career civil servants, facilitating work mobility within the public
administration, and introducing new systems for selecting top managers and evaluating
performance. The fight against corruption and bribery, as detailed below, is an integral part of
the ongoing public administration reform.
Effective and evidence-based policies require timely and high quality statistics. The
government is committed to strengthening the statistical agency (ELSTAT), and safeguarding
its independence. Recent efforts in this direction include giving ELSTAT’s president more
autonomy and an indemnity to cover costs incurred following legal challenges, strengthening
ELSTAT’s financial autonomy and its freedom to reallocate personnel as well as hire specialised
staff (EC, 2017b).
Cross-country experience suggests that spending reviews can improve prioritisation and
identify the fiscal space for new spending priorities. The comprehensive spending review
completed in 2017 has identified savings to fund the expansion of family allowances, school
meals and early childhood education and care. In-depth spending reviews are planned for
2018 in the ministries of health, culture, and transport and infrastructure. Such reviews
should be conducted regularly. The establishment of a new directorate in the Ministry of
Finance responsible for conducting spending reviews on a regular basis goes in this direction.
OECD country experience (OECD, 2017b) indicates that the success of spending reviews hinges
on closely tracking their implementation. Also, integrating spending reviews in the budget
process would help avoid across-the-board cuts in discretionary spending disconnected from
structural priorities, making fiscal policy more inclusive and growth friendly. Spending
reviews could also be accompanied by greater use of performance budgeting procedures.
Between 2011 and 2016 Greece improved its performance budget practices in the central
government, but these still remain below the OECD average (Figure 19).
Figure 19. Performance budgeting procedures can be used more extensivelyIndex on use of performance budgeting practices from 0 to 1 (highest)1, central government
1. Composite index of 10 variables that cover information on the availability and type of performance information developed, processesfor monitoring and reporting results, and whether (and how) performance information is used. The index does not measure theoverall quality of performance budgeting systems. Due to differences between the 2011 and 2016 surveys, some weights have beenadjusted for comparability.
2. The OECD aggregate excludes Iceland, Israel, Latvia, Spain and the Slovak Republic.Source: OECD (2016), Survey of Performance Budgeting and OECD (2017), Government at a Glance 2017.
1 2 http://dx.doi.org/10.1787/888933713517
0.0
0.1
0.2
0.3
0.4
0.5
0.6
0.7
0
0.1
0.2
0.3
0.4
0.5
0.6
0.7
ESP
SVK
ISL
HU
NPR
TIS
RLU
XIT
AU
SATU
RLV
AJP
NN
OR
NZL
DEU PO
LG
RC
AUS
CZE BE
LC
HL
OEC
D²
IRL
SVN
DN
KFR
AES
TN
LDC
AN FIN
SWE
CH
EAU
TG
BRM
EXKO
R
2016 2011
©OECD 31
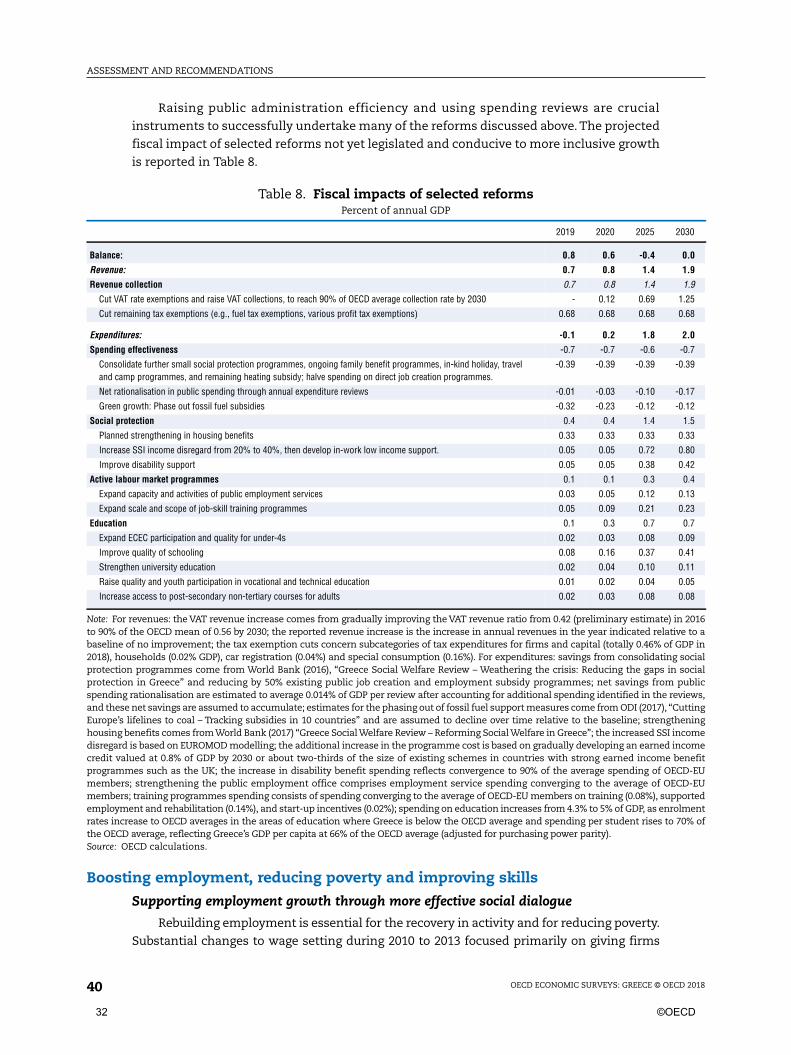
ASSESSMENT AND RECOMMENDATIONS
OECD ECONOMIC SURVEYS: GREECE © OECD 201840
Raising public administration efficiency and using spending reviews are crucial
instruments to successfully undertake many of the reforms discussed above. The projected
fiscal impact of selected reforms not yet legislated and conducive to more inclusive growth
is reported in Table 8.
Boosting employment, reducing poverty and improving skills
Supporting employment growth through more effective social dialogue
Rebuilding employment is essential for the recovery in activity and for reducing poverty.
Substantial changes to wage setting during 2010 to 2013 focused primarily on giving firms
Table 8. Fiscal impacts of selected reformsPercent of annual GDP
2019 2020 2025 2030
Balance: 0.8 0.6 -0.4 0.0
Revenue: 0.7 0.8 1.4 1.9
Revenue collection 0.7 0.8 1.4 1.9
Cut VAT rate exemptions and raise VAT collections, to reach 90% of OECD average collection rate by 2030 - 0.12 0.69 1.25
Cut remaining tax exemptions (e.g., fuel tax exemptions, various profit tax exemptions) 0.68 0.68 0.68 0.68
Expenditures: -0.1 0.2 1.8 2.0
Spending effectiveness -0.7 -0.7 -0.6 -0.7
Consolidate further small social protection programmes, ongoing family benefit programmes, in-kind holiday, traveland camp programmes, and remaining heating subsidy; halve spending on direct job creation programmes.
-0.39 -0.39 -0.39 -0.39
Net rationalisation in public spending through annual expenditure reviews -0.01 -0.03 -0.10 -0.17
Green growth: Phase out fossil fuel subsidies -0.32 -0.23 -0.12 -0.12
Social protection 0.4 0.4 1.4 1.5
Planned strengthening in housing benefits 0.33 0.33 0.33 0.33
Increase SSI income disregard from 20% to 40%, then develop in-work low income support. 0.05 0.05 0.72 0.80
Improve disability support 0.05 0.05 0.38 0.42
Active labour market programmes 0.1 0.1 0.3 0.4
Expand capacity and activities of public employment services 0.03 0.05 0.12 0.13
Expand scale and scope of job-skill training programmes 0.05 0.09 0.21 0.23
Education 0.1 0.3 0.7 0.7
Expand ECEC participation and quality for under-4s 0.02 0.03 0.08 0.09
Improve quality of schooling 0.08 0.16 0.37 0.41
Strengthen university education 0.02 0.04 0.10 0.11
Raise quality and youth participation in vocational and technical education 0.01 0.02 0.04 0.05
Increase access to post-secondary non-tertiary courses for adults 0.02 0.03 0.08 0.08
Note: For revenues: the VAT revenue increase comes from gradually improving the VAT revenue ratio from 0.42 (preliminary estimate) in 2016to 90% of the OECD mean of 0.56 by 2030; the reported revenue increase is the increase in annual revenues in the year indicated relative to abaseline of no improvement; the tax exemption cuts concern subcategories of tax expenditures for firms and capital (totally 0.46% of GDP in2018), households (0.02% GDP), car registration (0.04%) and special consumption (0.16%). For expenditures: savings from consolidating socialprotection programmes come from World Bank (2016), “Greece Social Welfare Review – Weathering the crisis: Reducing the gaps in socialprotection in Greece” and reducing by 50% existing public job creation and employment subsidy programmes; net savings from publicspending rationalisation are estimated to average 0.014% of GDP per review after accounting for additional spending identified in the reviews,and these net savings are assumed to accumulate; estimates for the phasing out of fossil fuel support measures come from ODI (2017), “CuttingEurope’s lifelines to coal – Tracking subsidies in 10 countries” and are assumed to decline over time relative to the baseline; strengtheninghousing benefits comes from World Bank (2017) “Greece Social Welfare Review – Reforming Social Welfare in Greece”; the increased SSI incomedisregard is based on EUROMOD modelling; the additional increase in the programme cost is based on gradually developing an earned incomecredit valued at 0.8% of GDP by 2030 or about two-thirds of the size of existing schemes in countries with strong earned income benefitprogrammes such as the UK; the increase in disability benefit spending reflects convergence to 90% of the average spending of OECD-EUmembers; strengthening the public employment office comprises employment service spending converging to the average of OECD-EUmembers; training programmes spending consists of spending converging to the average of OECD-EU members on training (0.08%), supportedemployment and rehabilitation (0.14%), and start-up incentives (0.02%); spending on education increases from 4.3% to 5% of GDP, as enrolmentrates increase to OECD averages in the areas of education where Greece is below the OECD average and spending per student rises to 70% ofthe OECD average, reflecting Greece’s GDP per capita at 66% of the OECD average (adjusted for purchasing power parity).Source: OECD calculations.
32 ©OECD
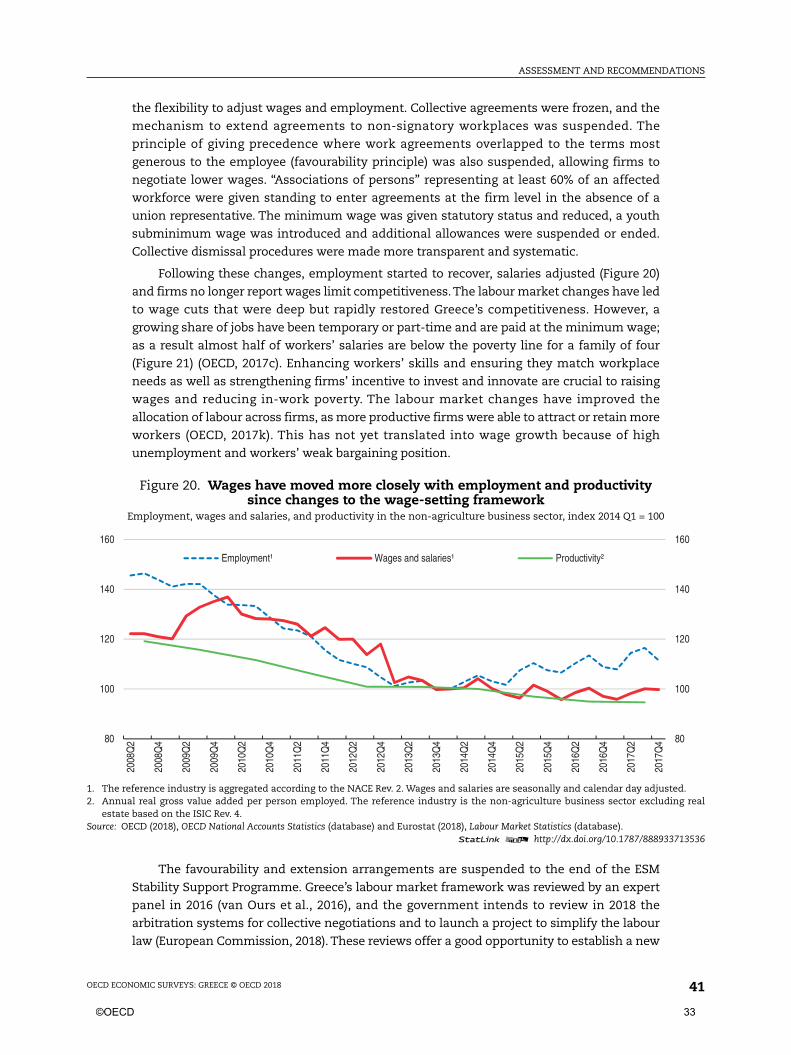
ASSESSMENT AND RECOMMENDATIONS
OECD ECONOMIC SURVEYS: GREECE © OECD 2018 41
the flexibility to adjust wages and employment. Collective agreements were frozen, and the
mechanism to extend agreements to non-signatory workplaces was suspended. The
principle of giving precedence where work agreements overlapped to the terms most
generous to the employee (favourability principle) was also suspended, allowing firms to
negotiate lower wages. “Associations of persons” representing at least 60% of an affected
workforce were given standing to enter agreements at the firm level in the absence of a
union representative. The minimum wage was given statutory status and reduced, a youth
subminimum wage was introduced and additional allowances were suspended or ended.
Collective dismissal procedures were made more transparent and systematic.
Following these changes, employment started to recover, salaries adjusted (Figure 20)
and firms no longer report wages limit competitiveness. The labour market changes have led
to wage cuts that were deep but rapidly restored Greece’s competitiveness. However, a
growing share of jobs have been temporary or part-time and are paid at the minimum wage;
as a result almost half of workers’ salaries are below the poverty line for a family of four
(Figure 21) (OECD, 2017c). Enhancing workers’ skills and ensuring they match workplace
needs as well as strengthening firms’ incentive to invest and innovate are crucial to raising
wages and reducing in-work poverty. The labour market changes have improved the
allocation of labour across firms, as more productive firms were able to attract or retain more
workers (OECD, 2017k). This has not yet translated into wage growth because of high
unemployment and workers’ weak bargaining position.
The favourability and extension arrangements are suspended to the end of the ESM
Stability Support Programme. Greece’s labour market framework was reviewed by an expert
panel in 2016 (van Ours et al., 2016), and the government intends to review in 2018 the
arbitration systems for collective negotiations and to launch a project to simplify the labour
law (European Commission, 2018). These reviews offer a good opportunity to establish a new
Figure 20. Wages have moved more closely with employment and productivitysince changes to the wage-setting framework
Employment, wages and salaries, and productivity in the non-agriculture business sector, index 2014 Q1 = 100
1. The reference industry is aggregated according to the NACE Rev. 2. Wages and salaries are seasonally and calendar day adjusted.2. Annual real gross value added per person employed. The reference industry is the non-agriculture business sector excluding real
estate based on the ISIC Rev. 4.Source: OECD (2018), OECD National Accounts Statistics (database) and Eurostat (2018), Labour Market Statistics (database).
1 2 http://dx.doi.org/10.1787/888933713536
80
100
120
140
160
80
100
120
140
160
2008
Q2
2008
Q4
2009
Q2
2009
Q4
2010
Q2
2010
Q4
2011
Q2
2011
Q4
2012
Q2
2012
Q4
2013
Q2
2013
Q4
2014
Q2
2014
Q4
2015
Q2
2015
Q4
2016
Q2
2016
Q4
2017
Q2
2017
Q4
Employment¹ Wages and salaries¹ Productivity²
©OECD 33
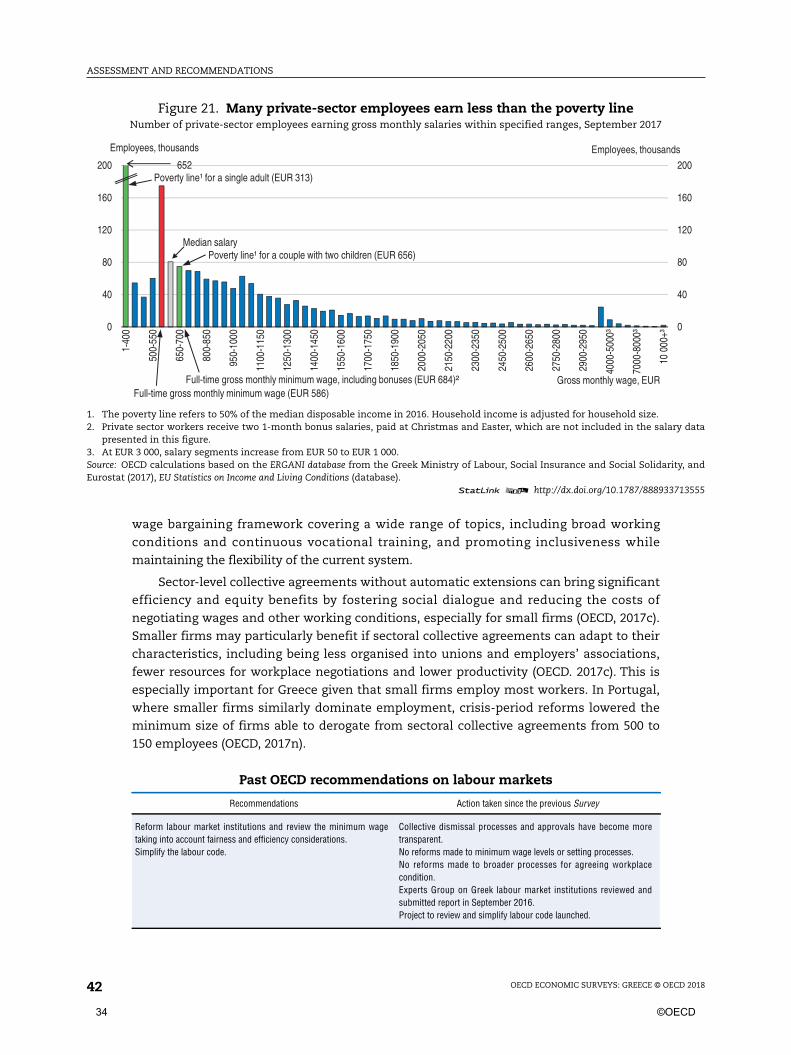
ASSESSMENT AND RECOMMENDATIONS
OECD ECONOMIC SURVEYS: GREECE © OECD 201842
wage bargaining framework covering a wide range of topics, including broad working
conditions and continuous vocational training, and promoting inclusiveness while
maintaining the flexibility of the current system.
Sector-level collective agreements without automatic extensions can bring significant
efficiency and equity benefits by fostering social dialogue and reducing the costs of
negotiating wages and other working conditions, especially for small firms (OECD, 2017c).
Smaller firms may particularly benefit if sectoral collective agreements can adapt to their
characteristics, including being less organised into unions and employers’ associations,
fewer resources for workplace negotiations and lower productivity (OECD. 2017c). This is
especially important for Greece given that small firms employ most workers. In Portugal,
where smaller firms similarly dominate employment, crisis-period reforms lowered the
minimum size of firms able to derogate from sectoral collective agreements from 500 to
150 employees (OECD, 2017n).
Figure 21. Many private-sector employees earn less than the poverty lineNumber of private-sector employees earning gross monthly salaries within specified ranges, September 2017
1. The poverty line refers to 50% of the median disposable income in 2016. Household income is adjusted for household size.2. Private sector workers receive two 1-month bonus salaries, paid at Christmas and Easter, which are not included in the salary data
presented in this figure.3. At EUR 3 000, salary segments increase from EUR 50 to EUR 1 000.Source: OECD calculations based on the ERGANI database from the Greek Ministry of Labour, Social Insurance and Social Solidarity, andEurostat (2017), EU Statistics on Income and Living Conditions (database).
1 2 http://dx.doi.org/10.1787/888933713555
0
40
80
120
160
200
0
40
80
120
160
200
1-40
0
500-
550
650-
700
800-
850
950-
1000
1100
-115
0
1250
-130
0
1400
-145
0
1550
-160
0
1700
-175
0
1850
-190
0
2000
-205
0
2150
-220
0
2300
-235
0
2450
-250
0
2600
-265
0
2750
-280
0
2900
-295
0
4000
-500
0³
7000
-800
0³
10 0
00+³
Gross monthly wage, EURFull-time gross monthly minimum wage (EUR 586)
Full-time gross monthly minimum wage, including bonuses (EUR 684)²
Employees, thousands
652
Employees, thousands
Median salary
Poverty line¹ for a single adult (EUR 313)
Poverty line¹ for a couple with two children (EUR 656)
Past OECD recommendations on labour markets
Recommendations Action taken since the previous Survey
Reform labour market institutions and review the minimum wagetaking into account fairness and efficiency considerations.Simplify the labour code.
Collective dismissal processes and approvals have become moretransparent.No reforms made to minimum wage levels or setting processes.No reforms made to broader processes for agreeing workplacecondition.Experts Group on Greek labour market institutions reviewed andsubmitted report in September 2016.Project to review and simplify labour code launched.
34 ©OECD
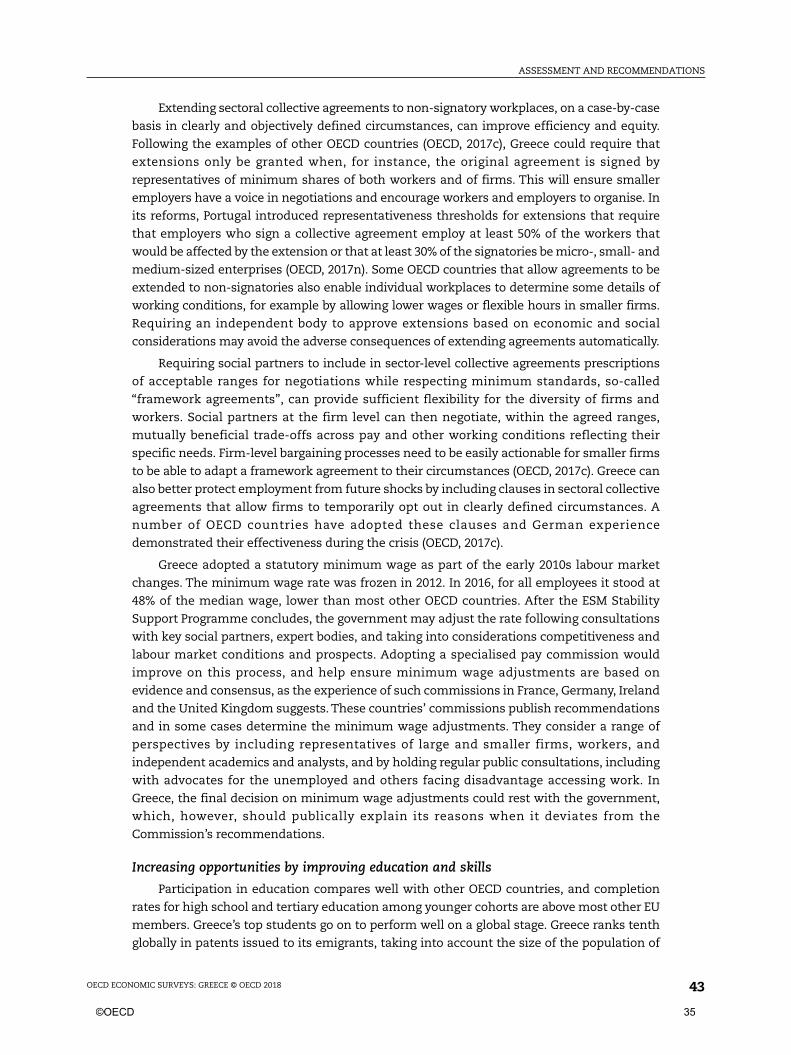
ASSESSMENT AND RECOMMENDATIONS
OECD ECONOMIC SURVEYS: GREECE © OECD 2018 43
Extending sectoral collective agreements to non-signatory workplaces, on a case-by-case
basis in clearly and objectively defined circumstances, can improve efficiency and equity.
Following the examples of other OECD countries (OECD, 2017c), Greece could require that
extensions only be granted when, for instance, the original agreement is signed by
representatives of minimum shares of both workers and of firms. This will ensure smaller
employers have a voice in negotiations and encourage workers and employers to organise. In
its reforms, Portugal introduced representativeness thresholds for extensions that require
that employers who sign a collective agreement employ at least 50% of the workers that
would be affected by the extension or that at least 30% of the signatories be micro-, small- and
medium-sized enterprises (OECD, 2017n). Some OECD countries that allow agreements to be
extended to non-signatories also enable individual workplaces to determine some details of
working conditions, for example by allowing lower wages or flexible hours in smaller firms.
Requiring an independent body to approve extensions based on economic and social
considerations may avoid the adverse consequences of extending agreements automatically.
Requiring social partners to include in sector-level collective agreements prescriptions
of acceptable ranges for negotiations while respecting minimum standards, so-called
“framework agreements”, can provide sufficient flexibility for the diversity of firms and
workers. Social partners at the firm level can then negotiate, within the agreed ranges,
mutually beneficial trade-offs across pay and other working conditions reflecting their
specific needs. Firm-level bargaining processes need to be easily actionable for smaller firms
to be able to adapt a framework agreement to their circumstances (OECD, 2017c). Greece can
also better protect employment from future shocks by including clauses in sectoral collective
agreements that allow firms to temporarily opt out in clearly defined circumstances. A
number of OECD countries have adopted these clauses and German experience
demonstrated their effectiveness during the crisis (OECD, 2017c).
Greece adopted a statutory minimum wage as part of the early 2010s labour market
changes. The minimum wage rate was frozen in 2012. In 2016, for all employees it stood at
48% of the median wage, lower than most other OECD countries. After the ESM Stability
Support Programme concludes, the government may adjust the rate following consultations
with key social partners, expert bodies, and taking into considerations competitiveness and
labour market conditions and prospects. Adopting a specialised pay commission would
improve on this process, and help ensure minimum wage adjustments are based on
evidence and consensus, as the experience of such commissions in France, Germany, Ireland
and the United Kingdom suggests. These countries’ commissions publish recommendations
and in some cases determine the minimum wage adjustments. They consider a range of
perspectives by including representatives of large and smaller firms, workers, and
independent academics and analysts, and by holding regular public consultations, including
with advocates for the unemployed and others facing disadvantage accessing work. In
Greece, the final decision on minimum wage adjustments could rest with the government,
which, however, should publically explain its reasons when it deviates from the
Commission’s recommendations.
Increasing opportunities by improving education and skills
Participation in education compares well with other OECD countries, and completion
rates for high school and tertiary education among younger cohorts are above most other EU
members. Greece’s top students go on to perform well on a global stage. Greece ranks tenth
globally in patents issued to its emigrants, taking into account the size of the population of
©OECD 35
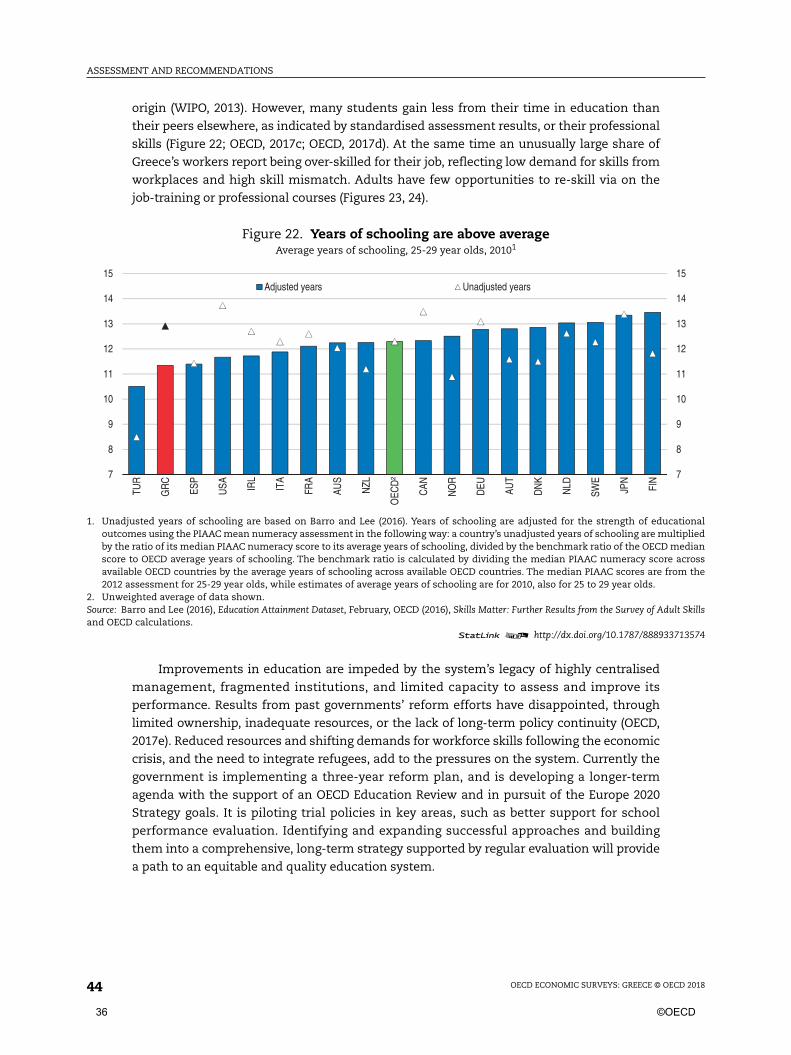
ASSESSMENT AND RECOMMENDATIONS
OECD ECONOMIC SURVEYS: GREECE © OECD 201844
origin (WIPO, 2013). However, many students gain less from their time in education than
their peers elsewhere, as indicated by standardised assessment results, or their professional
skills (Figure 22; OECD, 2017c; OECD, 2017d). At the same time an unusually large share of
Greece’s workers report being over-skilled for their job, reflecting low demand for skills from
workplaces and high skill mismatch. Adults have few opportunities to re-skill via on the
job-training or professional courses (Figures 23, 24).
Improvements in education are impeded by the system’s legacy of highly centralised
management, fragmented institutions, and limited capacity to assess and improve its
performance. Results from past governments’ reform efforts have disappointed, through
limited ownership, inadequate resources, or the lack of long-term policy continuity (OECD,
2017e). Reduced resources and shifting demands for workforce skills following the economic
crisis, and the need to integrate refugees, add to the pressures on the system. Currently the
government is implementing a three-year reform plan, and is developing a longer-term
agenda with the support of an OECD Education Review and in pursuit of the Europe 2020
Strategy goals. It is piloting trial policies in key areas, such as better support for school
performance evaluation. Identifying and expanding successful approaches and building
them into a comprehensive, long-term strategy supported by regular evaluation will provide
a path to an equitable and quality education system.
Figure 22. Years of schooling are above averageAverage years of schooling, 25-29 year olds, 20101
1. Unadjusted years of schooling are based on Barro and Lee (2016). Years of schooling are adjusted for the strength of educationaloutcomes using the PIAAC mean numeracy assessment in the following way: a country’s unadjusted years of schooling are multipliedby the ratio of its median PIAAC numeracy score to its average years of schooling, divided by the benchmark ratio of the OECD medianscore to OECD average years of schooling. The benchmark ratio is calculated by dividing the median PIAAC numeracy score acrossavailable OECD countries by the average years of schooling across available OECD countries. The median PIAAC scores are from the2012 assessment for 25-29 year olds, while estimates of average years of schooling are for 2010, also for 25 to 29 year olds.
2. Unweighted average of data shown.Source: Barro and Lee (2016), Education Attainment Dataset, February, OECD (2016), Skills Matter: Further Results from the Survey of Adult Skillsand OECD calculations.
1 2 http://dx.doi.org/10.1787/888933713574
7
8
9
10
11
12
13
14
15
7
8
9
10
11
12
13
14
15
TUR
GR
C
ESP
USA IR
L
ITA
FRA
AUS
NZL
OEC
D²
CAN
NO
R
DEU AU
T
DN
K
NLD
SWE
JPN
FIN
Adjusted years Unadjusted years
36 ©OECD
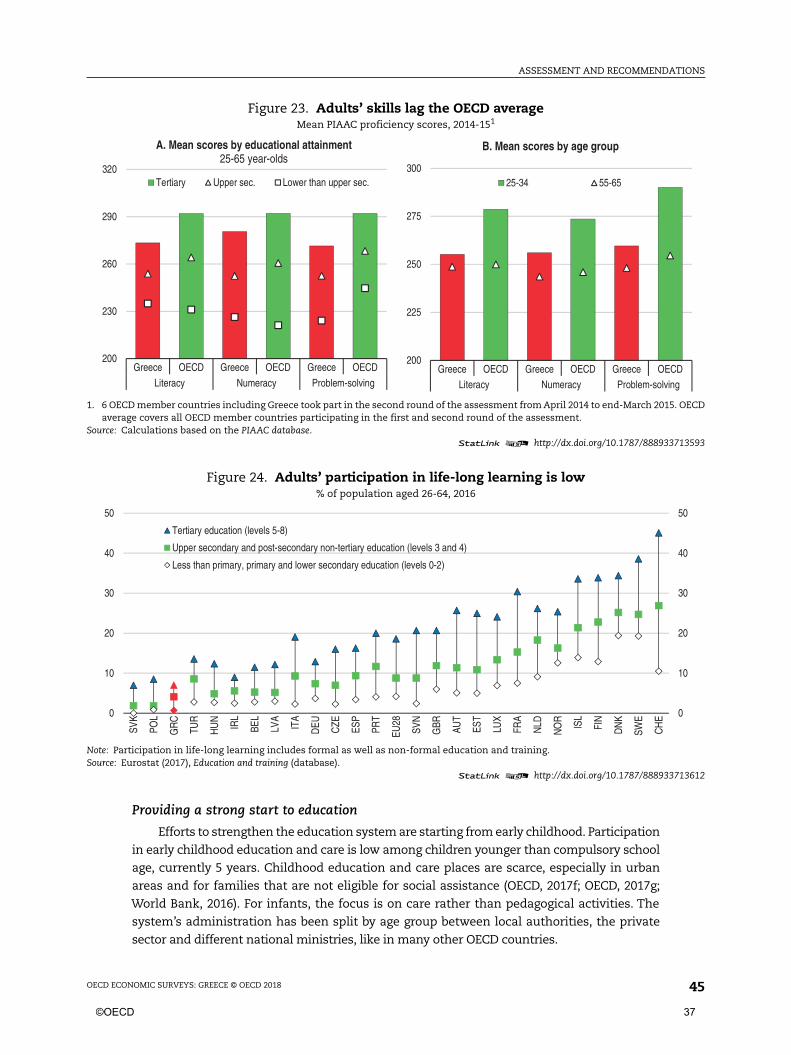
ASSESSMENT AND RECOMMENDATIONS
OECD ECONOMIC SURVEYS: GREECE © OECD 2018 45
Providing a strong start to education
Efforts to strengthen the education system are starting from early childhood. Participation
in early childhood education and care is low among children younger than compulsory school
age, currently 5 years. Childhood education and care places are scarce, especially in urban
areas and for families that are not eligible for social assistance (OECD, 2017f; OECD, 2017g;
World Bank, 2016). For infants, the focus is on care rather than pedagogical activities. The
system’s administration has been split by age group between local authorities, the private
sector and different national ministries, like in many other OECD countries.
Figure 23. Adults’ skills lag the OECD averageMean PIAAC proficiency scores, 2014-151
1. 6 OECD member countries including Greece took part in the second round of the assessment from April 2014 to end-March 2015. OECDaverage covers all OECD member countries participating in the first and second round of the assessment.
Source: Calculations based on the PIAAC database.1 2 http://dx.doi.org/10.1787/888933713593
Figure 24. Adults’ participation in life-long learning is low% of population aged 26-64, 2016
Note: Participation in life-long learning includes formal as well as non-formal education and training.Source: Eurostat (2017), Education and training (database).
1 2 http://dx.doi.org/10.1787/888933713612
200
230
260
290
320
Greece OECD Greece OECD Greece OECD
Literacy Numeracy Problem-solving
A. Mean scores by educational attainment 25-65 year-olds
Tertiary Upper sec. Lower than upper sec.
200
225
250
275
300
Greece OECD Greece OECD Greece OECD
Literacy Numeracy Problem-solving
B. Mean scores by age group
25-34 55-65
0
10
20
30
40
50
0
10
20
30
40
50
SVK
POL
GR
C
TUR
HU
N
IRL
BEL
LVA
ITA
DEU CZE
ESP
PRT
EU28
SVN
GBR AU
T
EST
LUX
FRA
NLD
NO
R
ISL
FIN
DN
K
SWE
CH
E
Tertiary education (levels 5-8)
Upper secondary and post-secondary non-tertiary education (levels 3 and 4)
Less than primary, primary and lower secondary education (levels 0-2)
©OECD 37
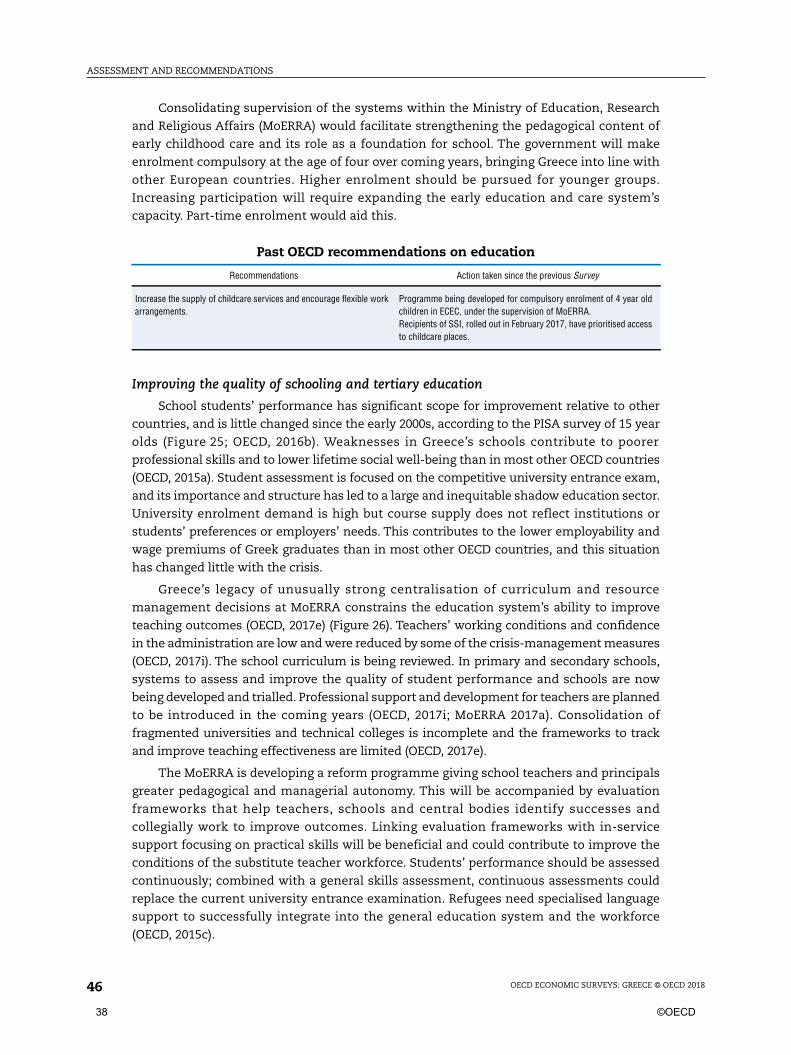
ASSESSMENT AND RECOMMENDATIONS
OECD ECONOMIC SURVEYS: GREECE © OECD 201846
Consolidating supervision of the systems within the Ministry of Education, Research
and Religious Affairs (MoERRA) would facilitate strengthening the pedagogical content of
early childhood care and its role as a foundation for school. The government will make
enrolment compulsory at the age of four over coming years, bringing Greece into line with
other European countries. Higher enrolment should be pursued for younger groups.
Increasing participation will require expanding the early education and care system’s
capacity. Part-time enrolment would aid this.
Improving the quality of schooling and tertiary education
School students’ performance has significant scope for improvement relative to other
countries, and is little changed since the early 2000s, according to the PISA survey of 15 year
olds (Figure 25; OECD, 2016b). Weaknesses in Greece’s schools contribute to poorer
professional skills and to lower lifetime social well-being than in most other OECD countries
(OECD, 2015a). Student assessment is focused on the competitive university entrance exam,
and its importance and structure has led to a large and inequitable shadow education sector.
University enrolment demand is high but course supply does not reflect institutions or
students’ preferences or employers’ needs. This contributes to the lower employability and
wage premiums of Greek graduates than in most other OECD countries, and this situation
has changed little with the crisis.
Greece’s legacy of unusually strong centralisation of curriculum and resource
management decisions at MoERRA constrains the education system’s ability to improve
teaching outcomes (OECD, 2017e) (Figure 26). Teachers’ working conditions and confidence
in the administration are low and were reduced by some of the crisis-management measures
(OECD, 2017i). The school curriculum is being reviewed. In primary and secondary schools,
systems to assess and improve the quality of student performance and schools are now
being developed and trialled. Professional support and development for teachers are planned
to be introduced in the coming years (OECD, 2017i; MoERRA 2017a). Consolidation of
fragmented universities and technical colleges is incomplete and the frameworks to track
and improve teaching effectiveness are limited (OECD, 2017e).
The MoERRA is developing a reform programme giving school teachers and principals
greater pedagogical and managerial autonomy. This will be accompanied by evaluation
frameworks that help teachers, schools and central bodies identify successes and
collegially work to improve outcomes. Linking evaluation frameworks with in-service
support focusing on practical skills will be beneficial and could contribute to improve the
conditions of the substitute teacher workforce. Students’ performance should be assessed
continuously; combined with a general skills assessment, continuous assessments could
replace the current university entrance examination. Refugees need specialised language
support to successfully integrate into the general education system and the workforce
(OECD, 2015c).
Past OECD recommendations on education
Recommendations Action taken since the previous Survey
Increase the supply of childcare services and encourage flexible workarrangements.
Programme being developed for compulsory enrolment of 4 year oldchildren in ECEC, under the supervision of MoERRA.Recipients of SSI, rolled out in February 2017, have prioritised accessto childcare places.
38 ©OECD
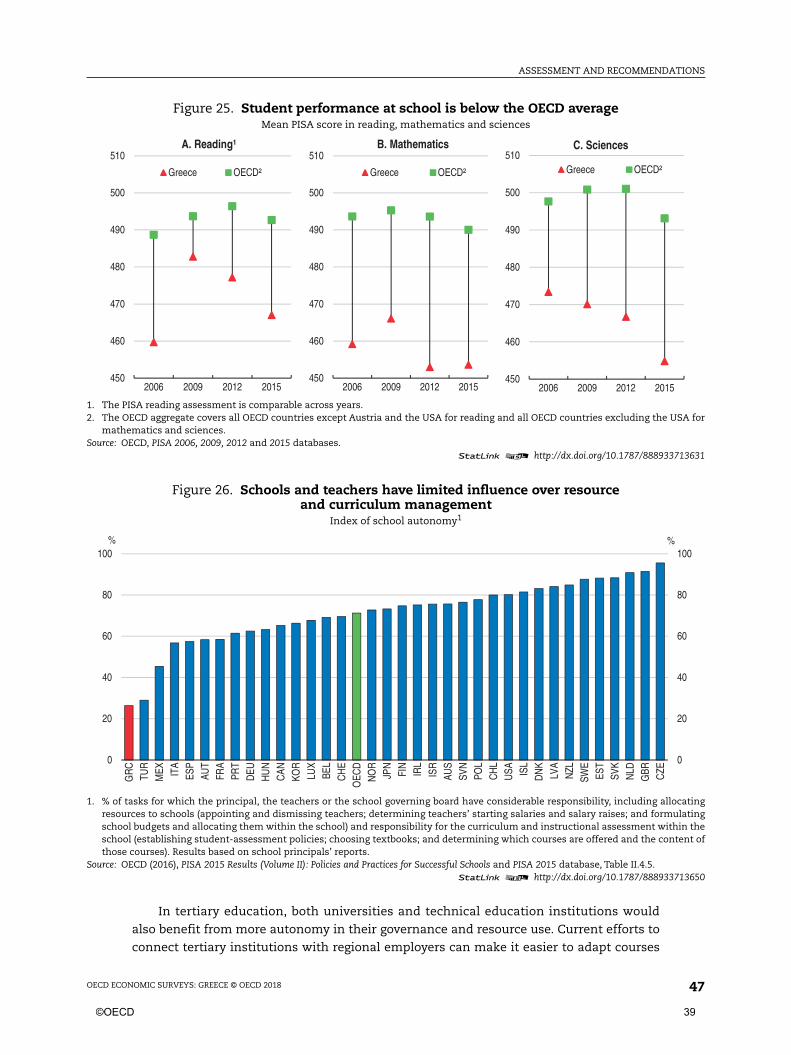
ASSESSMENT AND RECOMMENDATIONS
OECD ECONOMIC SURVEYS: GREECE © OECD 2018 47
In tertiary education, both universities and technical education institutions would
also benefit from more autonomy in their governance and resource use. Current efforts to
connect tertiary institutions with regional employers can make it easier to adapt courses
Figure 25. Student performance at school is below the OECD averageMean PISA score in reading, mathematics and sciences
1. The PISA reading assessment is comparable across years.2. The OECD aggregate covers all OECD countries except Austria and the USA for reading and all OECD countries excluding the USA for
mathematics and sciences.Source: OECD, PISA 2006, 2009, 2012 and 2015 databases.
1 2 http://dx.doi.org/10.1787/888933713631
Figure 26. Schools and teachers have limited influence over resourceand curriculum management
Index of school autonomy1
1. % of tasks for which the principal, the teachers or the school governing board have considerable responsibility, including allocatingresources to schools (appointing and dismissing teachers; determining teachers’ starting salaries and salary raises; and formulatingschool budgets and allocating them within the school) and responsibility for the curriculum and instructional assessment within theschool (establishing student-assessment policies; choosing textbooks; and determining which courses are offered and the content ofthose courses). Results based on school principals’ reports.
Source: OECD (2016), PISA 2015 Results (Volume II): Policies and Practices for Successful Schools and PISA 2015 database, Table II.4.5.1 2 http://dx.doi.org/10.1787/888933713650
450
460
470
480
490
500
510
2006 2009 2012 2015
A. Reading¹
Greece OECD²
450
460
470
480
490
500
510
2006 2009 2012 2015
B. Mathematics
Greece OECD²
450
460
470
480
490
500
510
2006 2009 2012 2015
C. Sciences
Greece OECD²
0
20
40
60
80
100
0
20
40
60
80
100
GR
CTU
RM
EX ITA
ESP
AUT
FRA
PRT
DEU
HU
NC
ANKO
RLU
XBE
LC
HE
OEC
DN
OR
JPN
FIN
IRL
ISR
AUS
SVN
POL
CH
LU
SA ISL
DN
KLV
AN
ZLSW
EES
TSV
KN
LDG
BR CZE
%%
©OECD 39
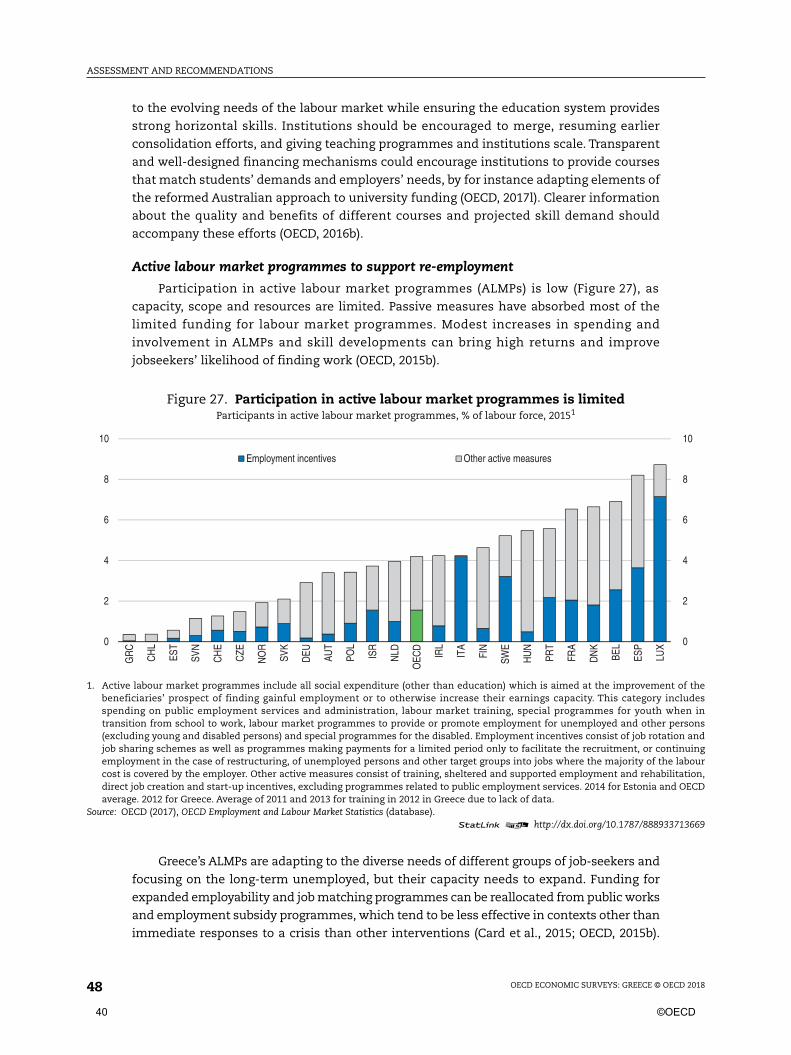
ASSESSMENT AND RECOMMENDATIONS
OECD ECONOMIC SURVEYS: GREECE © OECD 201848
to the evolving needs of the labour market while ensuring the education system provides
strong horizontal skills. Institutions should be encouraged to merge, resuming earlier
consolidation efforts, and giving teaching programmes and institutions scale. Transparent
and well-designed financing mechanisms could encourage institutions to provide courses
that match students’ demands and employers’ needs, by for instance adapting elements of
the reformed Australian approach to university funding (OECD, 2017l). Clearer information
about the quality and benefits of different courses and projected skill demand should
accompany these efforts (OECD, 2016b).
Active labour market programmes to support re-employment
Participation in active labour market programmes (ALMPs) is low (Figure 27), as
capacity, scope and resources are limited. Passive measures have absorbed most of the
limited funding for labour market programmes. Modest increases in spending and
involvement in ALMPs and skill developments can bring high returns and improve
jobseekers’ likelihood of finding work (OECD, 2015b).
Greece’s ALMPs are adapting to the diverse needs of different groups of job-seekers and
focusing on the long-term unemployed, but their capacity needs to expand. Funding for
expanded employability and job matching programmes can be reallocated from public works
and employment subsidy programmes, which tend to be less effective in contexts other than
immediate responses to a crisis than other interventions (Card et al., 2015; OECD, 2015b).
Figure 27. Participation in active labour market programmes is limitedParticipants in active labour market programmes, % of labour force, 20151
1. Active labour market programmes include all social expenditure (other than education) which is aimed at the improvement of thebeneficiaries’ prospect of finding gainful employment or to otherwise increase their earnings capacity. This category includesspending on public employment services and administration, labour market training, special programmes for youth when intransition from school to work, labour market programmes to provide or promote employment for unemployed and other persons(excluding young and disabled persons) and special programmes for the disabled. Employment incentives consist of job rotation andjob sharing schemes as well as programmes making payments for a limited period only to facilitate the recruitment, or continuingemployment in the case of restructuring, of unemployed persons and other target groups into jobs where the majority of the labourcost is covered by the employer. Other active measures consist of training, sheltered and supported employment and rehabilitation,direct job creation and start-up incentives, excluding programmes related to public employment services. 2014 for Estonia and OECDaverage. 2012 for Greece. Average of 2011 and 2013 for training in 2012 in Greece due to lack of data.
Source: OECD (2017), OECD Employment and Labour Market Statistics (database).1 2 http://dx.doi.org/10.1787/888933713669
0
2
4
6
8
10
0
2
4
6
8
10
GR
C
CH
L
EST
SVN
CH
E
CZE
NO
R
SVK
DEU AU
T
POL
ISR
NLD
OEC
D
IRL
ITA
FIN
SWE
HU
N
PRT
FRA
DN
K
BEL
ESP
LUX
Employment incentives Other active measures
40 ©OECD
ASSESSMENT AND RECOMMENDATIONS
OECD ECONOMIC SURVEYS: GREECE © OECD 2018 49
ALMP reforms should ensure that those out-of-work can access effective programmes. Such
programmes need to:
● Enhance employability; adults with work experience benefit from programmes that
strengthen practical skills; training courses are better integrating with local employers,
but their scale is still modest and needs expanding.
● Better match job seekers’ skills with employers’ needs; the public employment service is
being re-engineered to connect better with employers, and would benefit from capacity
dedicated to SMEs; new community service centres can improve access across the
country; new requirements that social benefit recipients who are able to work engage in
job search improves their likelihood of finding work; the Ministry of Labour and Social
Inclusion’s improved IT platforms can support this engagement.
● Bring youth into work; programmes that first ensure strong general skills, and then
provide practical sector-specific skills and experience, generate the best results; these
have been limited but are now a priority and successful programmes to improve youth
work-experience now being piloted (MoERRA, 2017b) should be expanded.
Lowering poverty and protecting households
Jobs are the best antidote against poverty (Causa et al., 2016). The loss of jobs and wage
cuts through the crisis has led to a surge in poverty. Younger households without work and
with children have been most severely affected, while poverty rates have fallen among
retirees. Rising and more entrenched child poverty brings significant risks for long-term well-
being and opportunities. Recent reforms improved the sustainability and targeting of social
expenditure, but inequality and poverty after taxes and transfers remain high (Figure 28).
Consolidating and improving targeting of social protection
Greece’s social expenditure system is large and remains dominated by pensions
(Figure 29). Public social expenditure, at 27% of GDP in 2016 or nearly half of government
expenditure, is above the average of OECD and European countries (OECD, 2017j). A series of
reforms to delay retirement, reduce pension allowances, increase contributions, and lessen
inequalities between beneficiaries and across generations, have improved the sustainability
of the pension system. Merging agencies and funds have improved collections of
Past OECD recommendations on labour market programmes
Recommendations Action taken since the previous Survey
Condition access to unemployment benefits on stricter obligations forparticipation in training and employment service programmes. Extendthis principle to active job search as the economy improves.Strengthen sanctions for non-compliance.
Eligibility and job search requirements for unemployment benefitswere tightened for most cases, and extended to those in employmentdisputes.Guaranteed minimum income programme designed to includeobligatory engagement with labour market programmes amongrecipients able to work..
Bring forward to the extent possible the implementation of therestructuring plan of the public employment service (OAED). Monitorclosely the post-programme outcomes (such as job characteristicsand earnings) of the activation programmes, and focus spending onthose that prove successful.
Re-engineering of OAED is underway, including improvedcommunications with employers to identify skill needs, and improvedIT systems to allow staff to take a more active role in job matching.Labour and social security IT systems now allow better tracking ofoutcomes, but are yet to be used for performance assessments.
Consider over the longer term and the fiscal situation allowing,increasing the duration of unemployment insurance benefits byanother year, but tapering the benefits over time. The net replacementrate of unemployment insurance benefits could also be brought closerto the international average.
No action. National roll-out of SSI may support the unemployed.
©OECD 41
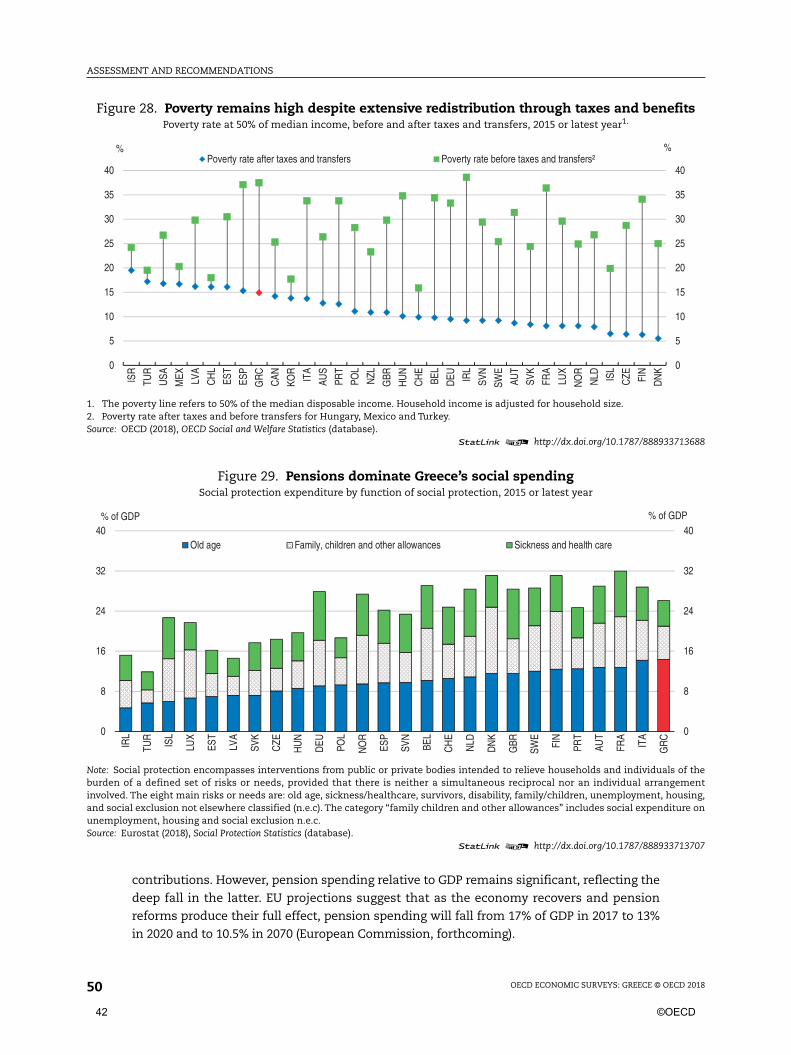
ASSESSMENT AND RECOMMENDATIONS
OECD ECONOMIC SURVEYS: GREECE © OECD 201850
contributions. However, pension spending relative to GDP remains significant, reflecting the
deep fall in the latter. EU projections suggest that as the economy recovers and pension
reforms produce their full effect, pension spending will fall from 17% of GDP in 2017 to 13%
in 2020 and to 10.5% in 2070 (European Commission, forthcoming).
Figure 28. Poverty remains high despite extensive redistribution through taxes and benefitsPoverty rate at 50% of median income, before and after taxes and transfers, 2015 or latest year1.
1. The poverty line refers to 50% of the median disposable income. Household income is adjusted for household size.2. Poverty rate after taxes and before transfers for Hungary, Mexico and Turkey.Source: OECD (2018), OECD Social and Welfare Statistics (database).
1 2 http://dx.doi.org/10.1787/888933713688
Figure 29. Pensions dominate Greece’s social spendingSocial protection expenditure by function of social protection, 2015 or latest year
Note: Social protection encompasses interventions from public or private bodies intended to relieve households and individuals of theburden of a defined set of risks or needs, provided that there is neither a simultaneous reciprocal nor an individual arrangementinvolved. The eight main risks or needs are: old age, sickness/healthcare, survivors, disability, family/children, unemployment, housing,and social exclusion not elsewhere classified (n.e.c). The category “family children and other allowances” includes social expenditure onunemployment, housing and social exclusion n.e.c.Source: Eurostat (2018), Social Protection Statistics (database).
1 2 http://dx.doi.org/10.1787/888933713707
0
5
10
15
20
25
30
35
40
0
5
10
15
20
25
30
35
40
ISR
TUR
USA
MEX LV
A
CH
L
EST
ESP
GR
C
CAN
KOR
ITA
AUS
PRT
POL
NZL
GBR
HU
N
CH
E
BEL
DEU IR
L
SVN
SWE
AUT
SVK
FRA
LUX
NO
R
NLD IS
L
CZE FI
N
DN
K
%%Poverty rate after taxes and transfers Poverty rate before taxes and transfers²
0
8
16
24
32
40
0
8
16
24
32
40
IRL
TUR
ISL
LUX
EST
LVA
SVK
CZE
HU
N
DEU PO
L
NO
R
ESP
SVN
BEL
CH
E
NLD
DN
K
GBR
SWE
FIN
PRT
AUT
FRA
ITA
GR
C
% of GDP% of GDP
Old age Family, children and other allowances Sickness and health care
42 ©OECD
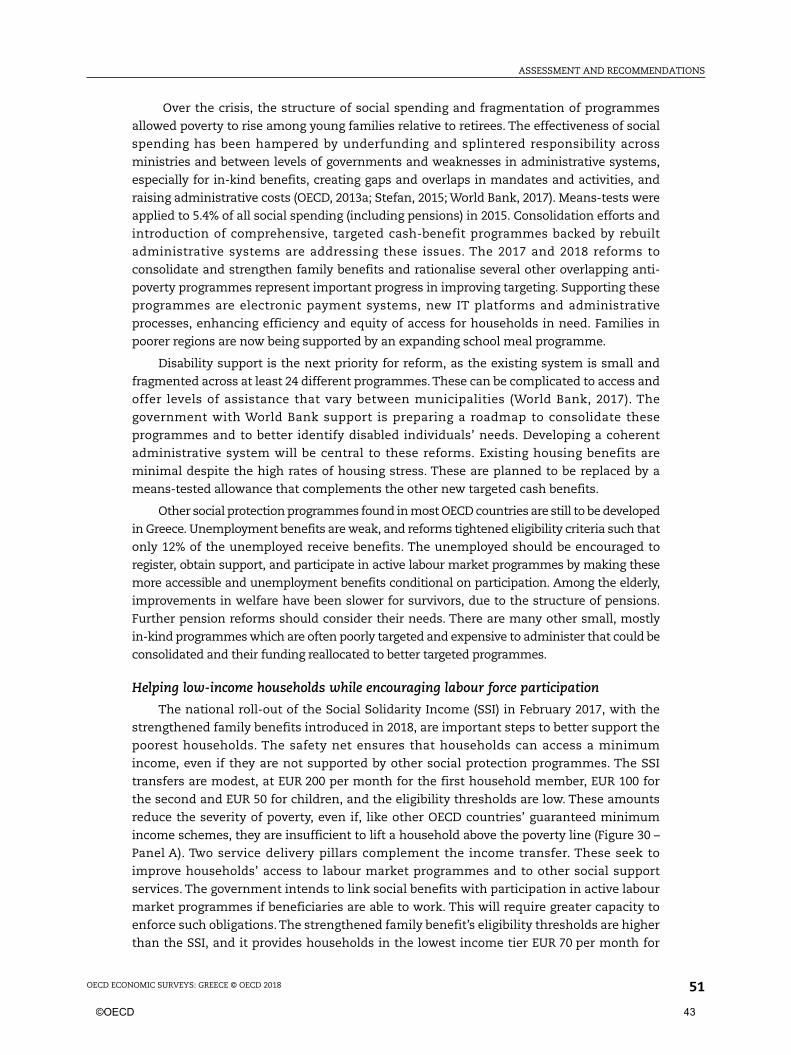
ASSESSMENT AND RECOMMENDATIONS
OECD ECONOMIC SURVEYS: GREECE © OECD 2018 51
Over the crisis, the structure of social spending and fragmentation of programmes
allowed poverty to rise among young families relative to retirees. The effectiveness of social
spending has been hampered by underfunding and splintered responsibility across
ministries and between levels of governments and weaknesses in administrative systems,
especially for in-kind benefits, creating gaps and overlaps in mandates and activities, and
raising administrative costs (OECD, 2013a; Stefan, 2015; World Bank, 2017). Means-tests were
applied to 5.4% of all social spending (including pensions) in 2015. Consolidation efforts and
introduction of comprehensive, targeted cash-benefit programmes backed by rebuilt
administrative systems are addressing these issues. The 2017 and 2018 reforms to
consolidate and strengthen family benefits and rationalise several other overlapping anti-
poverty programmes represent important progress in improving targeting. Supporting these
programmes are electronic payment systems, new IT platforms and administrative
processes, enhancing efficiency and equity of access for households in need. Families in
poorer regions are now being supported by an expanding school meal programme.
Disability support is the next priority for reform, as the existing system is small and
fragmented across at least 24 different programmes. These can be complicated to access and
offer levels of assistance that vary between municipalities (World Bank, 2017). The
government with World Bank support is preparing a roadmap to consolidate these
programmes and to better identify disabled individuals’ needs. Developing a coherent
administrative system will be central to these reforms. Existing housing benefits are
minimal despite the high rates of housing stress. These are planned to be replaced by a
means-tested allowance that complements the other new targeted cash benefits.
Other social protection programmes found in most OECD countries are still to be developed
in Greece. Unemployment benefits are weak, and reforms tightened eligibility criteria such that
only 12% of the unemployed receive benefits. The unemployed should be encouraged to
register, obtain support, and participate in active labour market programmes by making these
more accessible and unemployment benefits conditional on participation. Among the elderly,
improvements in welfare have been slower for survivors, due to the structure of pensions.
Further pension reforms should consider their needs. There are many other small, mostly
in-kind programmes which are often poorly targeted and expensive to administer that could be
consolidated and their funding reallocated to better targeted programmes.
Helping low-income households while encouraging labour force participation
The national roll-out of the Social Solidarity Income (SSI) in February 2017, with the
strengthened family benefits introduced in 2018, are important steps to better support the
poorest households. The safety net ensures that households can access a minimum
income, even if they are not supported by other social protection programmes. The SSI
transfers are modest, at EUR 200 per month for the first household member, EUR 100 for
the second and EUR 50 for children, and the eligibility thresholds are low. These amounts
reduce the severity of poverty, even if, like other OECD countries’ guaranteed minimum
income schemes, they are insufficient to lift a household above the poverty line (Figure 30 –
Panel A). Two service delivery pillars complement the income transfer. These seek to
improve households’ access to labour market programmes and to other social support
services. The government intends to link social benefits with participation in active labour
market programmes if beneficiaries are able to work. This will require greater capacity to
enforce such obligations. The strengthened family benefit’s eligibility thresholds are higher
than the SSI, and it provides households in the lowest income tier EUR 70 per month for
©OECD 43
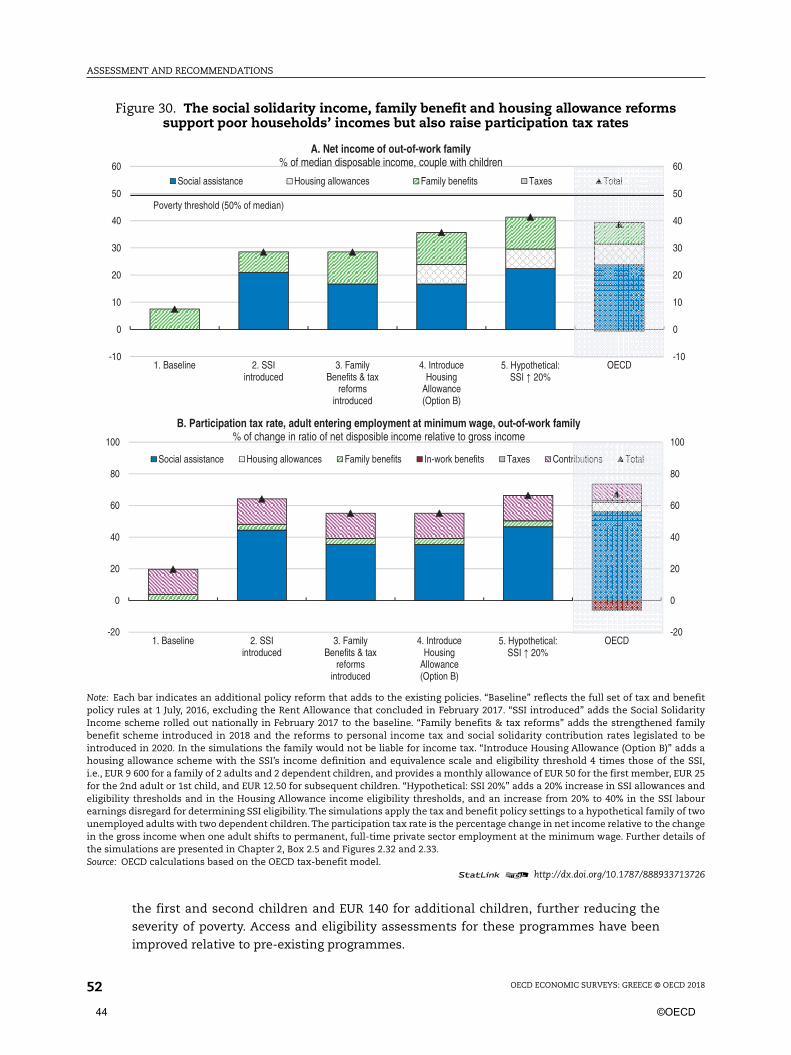
ASSESSMENT AND RECOMMENDATIONS
OECD ECONOMIC SURVEYS: GREECE © OECD 201852
the first and second children and EUR 140 for additional children, further reducing the
severity of poverty. Access and eligibility assessments for these programmes have been
improved relative to pre-existing programmes.
Figure 30. The social solidarity income, family benefit and housing allowance reformssupport poor households’ incomes but also raise participation tax rates
Note: Each bar indicates an additional policy reform that adds to the existing policies. “Baseline” reflects the full set of tax and benefitpolicy rules at 1 July, 2016, excluding the Rent Allowance that concluded in February 2017. “SSI introduced” adds the Social SolidarityIncome scheme rolled out nationally in February 2017 to the baseline. “Family benefits & tax reforms” adds the strengthened familybenefit scheme introduced in 2018 and the reforms to personal income tax and social solidarity contribution rates legislated to beintroduced in 2020. In the simulations the family would not be liable for income tax. “Introduce Housing Allowance (Option B)” adds ahousing allowance scheme with the SSI’s income definition and equivalence scale and eligibility threshold 4 times those of the SSI,i.e., EUR 9 600 for a family of 2 adults and 2 dependent children, and provides a monthly allowance of EUR 50 for the first member, EUR 25for the 2nd adult or 1st child, and EUR 12.50 for subsequent children. “Hypothetical: SSI 20%” adds a 20% increase in SSI allowances andeligibility thresholds and in the Housing Allowance income eligibility thresholds, and an increase from 20% to 40% in the SSI labourearnings disregard for determining SSI eligibility. The simulations apply the tax and benefit policy settings to a hypothetical family of twounemployed adults with two dependent children. The participation tax rate is the percentage change in net income relative to the changein the gross income when one adult shifts to permanent, full-time private sector employment at the minimum wage. Further details ofthe simulations are presented in Chapter 2, Box 2.5 and Figures 2.32 and 2.33.Source: OECD calculations based on the OECD tax-benefit model.
1 2 http://dx.doi.org/10.1787/888933713726
-10
0
10
20
30
40
50
60
-10
0
10
20
30
40
50
60
1. Baseline 2. SSIintroduced
3. FamilyBenefits & tax
reformsintroduced
4. IntroduceHousing
Allowance(Option B)
5. Hypothetical:SSI 20%
OECD
A. Net income of out-of-work family% of median disposable income, couple with children
Social assistance Housing allowances Family benefits Taxes Total
Poverty threshold (50% of median)
-20
0
20
40
60
80
100
-20
0
20
40
60
80
100
1. Baseline 2. SSIintroduced
3. FamilyBenefits & tax
reformsintroduced
4. IntroduceHousing
Allowance(Option B)
5. Hypothetical:SSI 20%
OECD
B. Participation tax rate, adult entering employment at minimum wage, out-of-work family% of change in ratio of net disposible income relative to gross income
Social assistance Housing allowances Family benefits In-work benefits Taxes Contributions Total
44 ©OECD
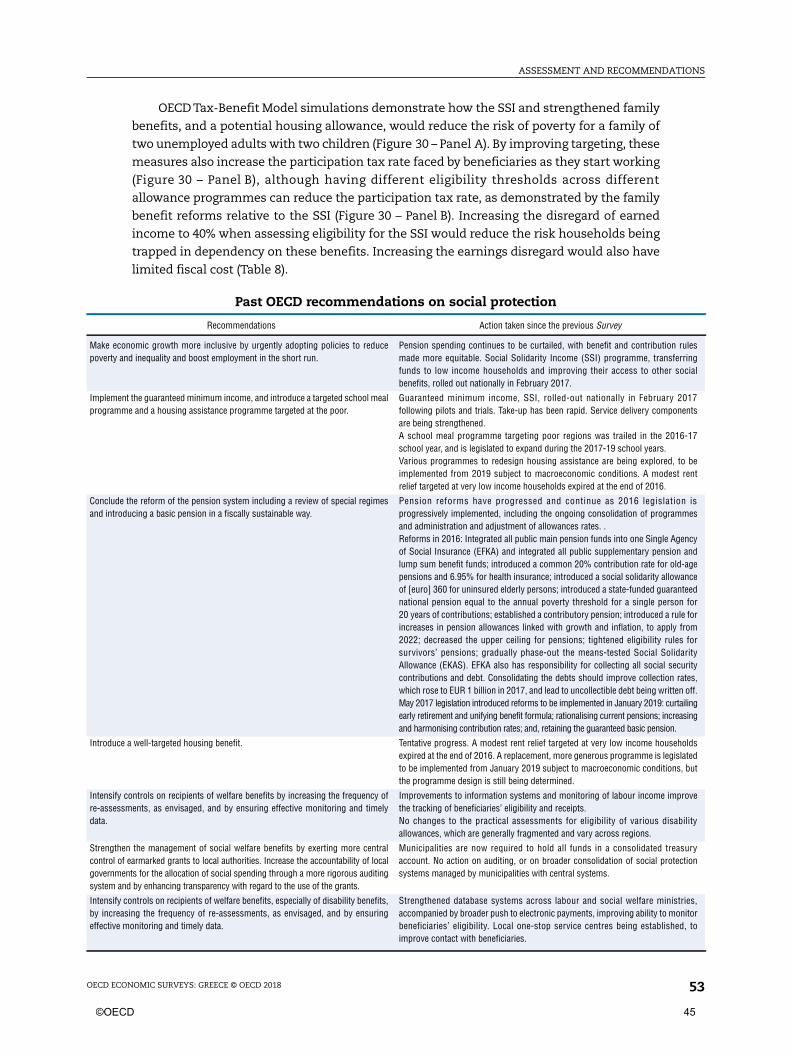
ASSESSMENT AND RECOMMENDATIONS
OECD ECONOMIC SURVEYS: GREECE © OECD 2018 53
OECD Tax-Benefit Model simulations demonstrate how the SSI and strengthened family
benefits, and a potential housing allowance, would reduce the risk of poverty for a family of
two unemployed adults with two children (Figure 30 – Panel A). By improving targeting, these
measures also increase the participation tax rate faced by beneficiaries as they start working
(Figure 30 – Panel B), although having different eligibility thresholds across different
allowance programmes can reduce the participation tax rate, as demonstrated by the family
benefit reforms relative to the SSI (Figure 30 – Panel B). Increasing the disregard of earned
income to 40% when assessing eligibility for the SSI would reduce the risk households being
trapped in dependency on these benefits. Increasing the earnings disregard would also have
limited fiscal cost (Table 8).
Past OECD recommendations on social protection
Recommendations Action taken since the previous Survey
Make economic growth more inclusive by urgently adopting policies to reducepoverty and inequality and boost employment in the short run.
Pension spending continues to be curtailed, with benefit and contribution rulesmade more equitable. Social Solidarity Income (SSI) programme, transferringfunds to low income households and improving their access to other socialbenefits, rolled out nationally in February 2017.
Implement the guaranteed minimum income, and introduce a targeted school mealprogramme and a housing assistance programme targeted at the poor.
Guaranteed minimum income, SSI, rolled-out nationally in February 2017following pilots and trials. Take-up has been rapid. Service delivery componentsare being strengthened.A school meal programme targeting poor regions was trailed in the 2016-17school year, and is legislated to expand during the 2017-19 school years.Various programmes to redesign housing assistance are being explored, to beimplemented from 2019 subject to macroeconomic conditions. A modest rentrelief targeted at very low income households expired at the end of 2016.
Conclude the reform of the pension system including a review of special regimesand introducing a basic pension in a fiscally sustainable way.
Pension reforms have progressed and continue as 2016 legislation isprogressively implemented, including the ongoing consolidation of programmesand administration and adjustment of allowances rates. .Reforms in 2016: Integrated all public main pension funds into one Single Agencyof Social Insurance (EFKA) and integrated all public supplementary pension andlump sum benefit funds; introduced a common 20% contribution rate for old-agepensions and 6.95% for health insurance; introduced a social solidarity allowanceof [euro] 360 for uninsured elderly persons; introduced a state-funded guaranteednational pension equal to the annual poverty threshold for a single person for20 years of contributions; established a contributory pension; introduced a rule forincreases in pension allowances linked with growth and inflation, to apply from2022; decreased the upper ceiling for pensions; tightened eligibility rules forsurvivors’ pensions; gradually phase-out the means-tested Social SolidarityAllowance (EKAS). EFKA also has responsibility for collecting all social securitycontributions and debt. Consolidating the debts should improve collection rates,which rose to EUR 1 billion in 2017, and lead to uncollectible debt being written off.May 2017 legislation introduced reforms to be implemented in January 2019: curtailingearly retirement and unifying benefit formula; rationalising current pensions; increasingand harmonising contribution rates; and, retaining the guaranteed basic pension.
Introduce a well-targeted housing benefit. Tentative progress. A modest rent relief targeted at very low income householdsexpired at the end of 2016. A replacement, more generous programme is legislatedto be implemented from January 2019 subject to macroeconomic conditions, butthe programme design is still being determined.
Intensify controls on recipients of welfare benefits by increasing the frequency ofre-assessments, as envisaged, and by ensuring effective monitoring and timelydata.
Improvements to information systems and monitoring of labour income improvethe tracking of beneficiaries’ eligibility and receipts.No changes to the practical assessments for eligibility of various disabilityallowances, which are generally fragmented and vary across regions.
Strengthen the management of social welfare benefits by exerting more centralcontrol of earmarked grants to local authorities. Increase the accountability of localgovernments for the allocation of social spending through a more rigorous auditingsystem and by enhancing transparency with regard to the use of the grants.
Municipalities are now required to hold all funds in a consolidated treasuryaccount. No action on auditing, or on broader consolidation of social protectionsystems managed by municipalities with central systems.
Intensify controls on recipients of welfare benefits, especially of disability benefits,by increasing the frequency of re-assessments, as envisaged, and by ensuringeffective monitoring and timely data.
Strengthened database systems across labour and social welfare ministries,accompanied by broader push to electronic payments, improving ability to monitorbeneficiaries’ eligibility. Local one-stop service centres being established, toimprove contact with beneficiaries.
©OECD 45

ASSESSMENT AND RECOMMENDATIONS
OECD ECONOMIC SURVEYS: GREECE © OECD 201854
Over time, as administrative capacity improves, the government should consider
introducing working tax credits as a way to reduce in-work poverty, encourage labour force
participation and formalise the shadow economy. Such systems already in place in some
OECD countries, such as the United States, the United Kingdom, France and the Netherlands,
have proved effective if targeted and designed well (OECD, 2005; Immervoll and Pearson,
2009). Increasing the earned income disregard applied to the SSI could be a step in this
direction.
Greening the economyGreece’s per capita greenhouse gases emissions have declined for several years and
are now significantly below the OECD average. This is mostly due to the recession as CO2
intensity has remained broadly stable (Figure 31). Increased use of low-carbon energy has
also played a part. The share of final energy from renewable sources is 15%, close to the
EU28 average. Greece’s per capita levels of solar power (both for photovoltaic and solar
thermal) is among the top five in the world (REN21, 2017).
Average air pollution, measured in terms of particle pollution, is above the OECD
average, although pollution hotpots are somewhat less prominent than in the average
OECD country. Road traffic, heating and other human activities are the main source of air
pollution. Also, pollution from local biomass burning has increased despite declining fossil
fuel use (Emmanouil, et al., 2017).
Bathing water is among the best in the EU (EEA, 2017). Drinking water quality is generally
good, but some areas lack comprehensive sewage treatment. Landfill remains by far the most
common destination for waste and household waste production is rising, in contrast to many
countries. There is still much unregulated and illegal dumping of household waste. Greece’s
Waste Management Plan of 2012 foresaw the introduction of a landfill tax from 2014 but it is
unclear whether it has been implemented (EC, 2017a).
The EU Court of Justice has repeatedly fined Greece because of numerous unregulated
landfill sites and breaching the urban waste water treatment directives. The 2018 budget
allocates EUR 1 billion for unforeseen and urgent spending, including environmental fines
relating to landfill sites and sewage collection and treatment. Making all waste disposal
sites and urban waste treatment conform to EU regulations is urgent to lower local
pollution and avoid using scarce budget resources to pay fines.
Greece is one of the few countries where environment-related tax revenues have
increased relative to GDP over the last decade. However, revenue from taxes other than on
energy and motor vehicles remains negligible, as in most countries. The tax on diesel fuel
is less than half that on petrol. Also, Greece grants several excise tax and VAT reductions
for fossil fuels used in industrial and residential sectors. According to OECD’s data, Greece
is one of the OECD countries with the largest fossil fuel support measures (i.e. measures
encouraging the production and consumption of fossil fuels) as a share of government
spending and total taxes. Greece also provides support to the development of coal-fired
electricity plants, locking in carbon-intensive capital assets and increasing the risk of
stranded assets. Phasing out fossil-fuel support measures would accelerate the shift
towards renewable energy and facilitate the implementation of the new EU Emission
Trading System Directive and the Industrial Emissions Directive.
46 ©OECD
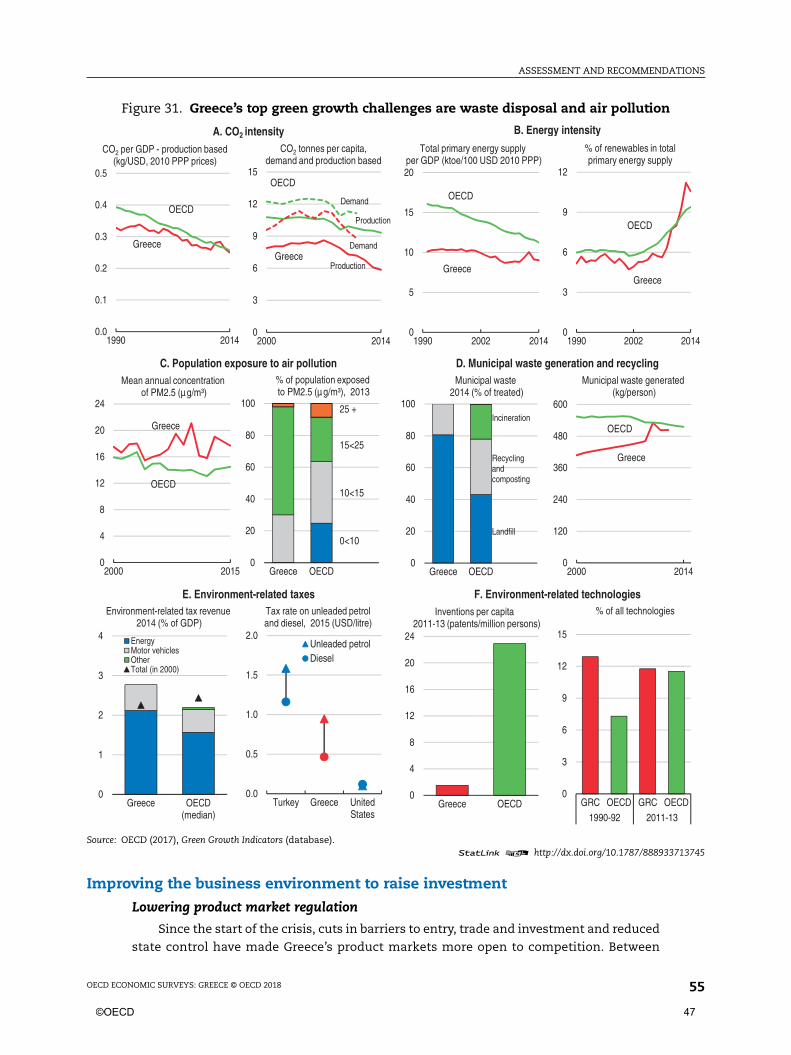
ASSESSMENT AND RECOMMENDATIONS
OECD ECONOMIC SURVEYS: GREECE © OECD 2018 55
Improving the business environment to raise investment
Lowering product market regulation
Since the start of the crisis, cuts in barriers to entry, trade and investment and reduced
state control have made Greece’s product markets more open to competition. Between
Figure 31. Greece’s top green growth challenges are waste disposal and air pollution
Source: OECD (2017), Green Growth Indicators (database).1 2 http://dx.doi.org/10.1787/888933713745
A. CO2 intensity B. Energy intensity
C. Population exposure to air pollution D. Municipal waste generation and recycling
E. Environment-related taxes F. Environment-related technologies
0.0
0.1
0.2
0.3
0.4
0.5
1990 2014
CO2 per GDP - production based(kg/USD, 2010 PPP prices)
OECD
Greece
0
3
6
9
12
15
2000 2014
CO2 tonnes per capita,demand and production based
OECD
Greece
Demand
Demand
Production
Production
0
5
10
15
20
1990 2002 2014
Total primary energy supply per GDP (ktoe/100 USD 2010 PPP)
OECD
Greece
0
3
6
9
12
1990 2002 2014
% of renewables in totalprimary energy supply
OECD
Greece
0
4
8
12
16
20
24
2000 2015
Mean annual concentration of PM2.5 (μg/m³)
OECD
Greece
0
20
40
60
80
100
Greece OECD
% of population exposed to PM2.5 (μg/m³), 2013
25 +
15<25
10<15
0<10
0
20
40
60
80
100
Greece OECD
Municipal waste 2014 (% of treated)
0
120
240
360
480
600
2000 2014
Municipal waste generated (kg/person)
OECD
Greece
0.0
0.5
1.0
1.5
2.0
Turkey Greece UnitedStates
Unleaded petrolDiesel
Tax rate on unleaded petroland diesel, 2015 (USD/litre)
0
4
8
12
16
20
24
Greece OECD
Inventions per capita 2011-13 (patents/million persons)
0
3
6
9
12
15
GRC OECD GRC OECD
1990-92 2011-13
% of all technologies
Incineration
Recycling and composting
Landfill
0
1
2
3
4
Greece OECD(median)
EnergyMotor vehiclesOtherTotal (in 2000)
Environment-related tax revenue 2014 (% of GDP)
©OECD 47
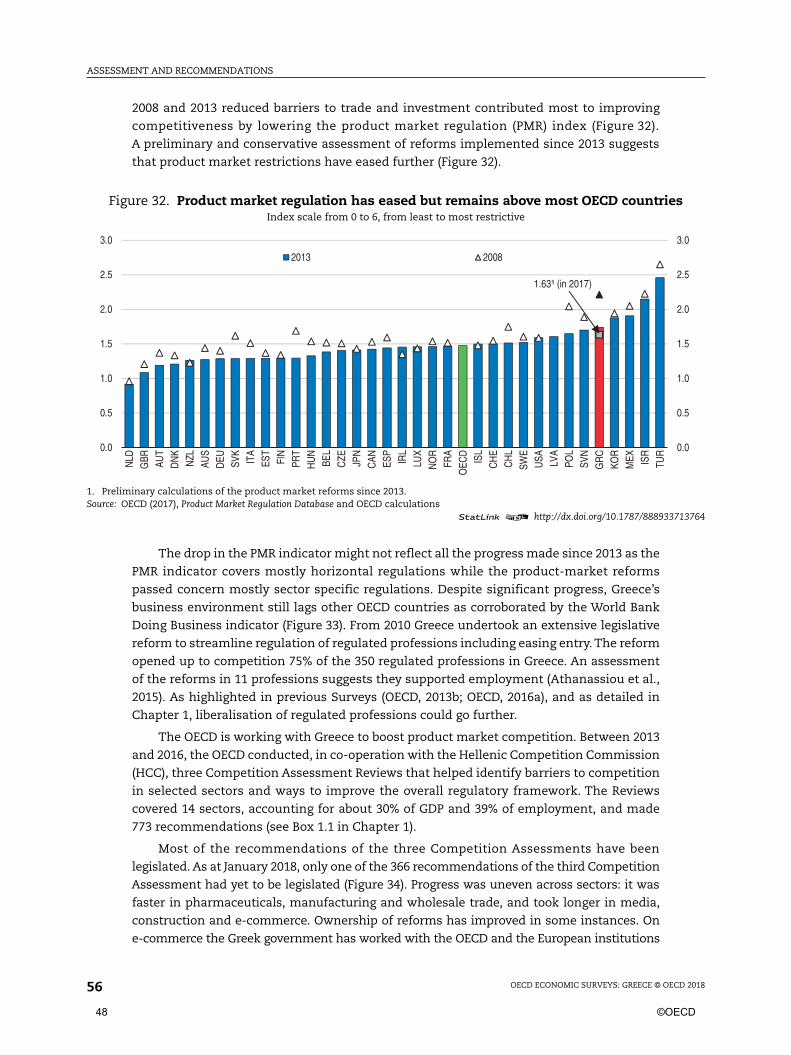
ASSESSMENT AND RECOMMENDATIONS
OECD ECONOMIC SURVEYS: GREECE © OECD 201856
2008 and 2013 reduced barriers to trade and investment contributed most to improving
competitiveness by lowering the product market regulation (PMR) index (Figure 32).
A preliminary and conservative assessment of reforms implemented since 2013 suggests
that product market restrictions have eased further (Figure 32).
The drop in the PMR indicator might not reflect all the progress made since 2013 as the
PMR indicator covers mostly horizontal regulations while the product-market reforms
passed concern mostly sector specific regulations. Despite significant progress, Greece’s
business environment still lags other OECD countries as corroborated by the World Bank
Doing Business indicator (Figure 33). From 2010 Greece undertook an extensive legislative
reform to streamline regulation of regulated professions including easing entry. The reform
opened up to competition 75% of the 350 regulated professions in Greece. An assessment
of the reforms in 11 professions suggests they supported employment (Athanassiou et al.,
2015). As highlighted in previous Surveys (OECD, 2013b; OECD, 2016a), and as detailed in
Chapter 1, liberalisation of regulated professions could go further.
The OECD is working with Greece to boost product market competition. Between 2013
and 2016, the OECD conducted, in co-operation with the Hellenic Competition Commission
(HCC), three Competition Assessment Reviews that helped identify barriers to competition
in selected sectors and ways to improve the overall regulatory framework. The Reviews
covered 14 sectors, accounting for about 30% of GDP and 39% of employment, and made
773 recommendations (see Box 1.1 in Chapter 1).
Most of the recommendations of the three Competition Assessments have been
legislated. As at January 2018, only one of the 366 recommendations of the third Competition
Assessment had yet to be legislated (Figure 34). Progress was uneven across sectors: it was
faster in pharmaceuticals, manufacturing and wholesale trade, and took longer in media,
construction and e-commerce. Ownership of reforms has improved in some instances. On
e-commerce the Greek government has worked with the OECD and the European institutions
Figure 32. Product market regulation has eased but remains above most OECD countriesIndex scale from 0 to 6, from least to most restrictive
1. Preliminary calculations of the product market reforms since 2013.Source: OECD (2017), Product Market Regulation Database and OECD calculations
1 2 http://dx.doi.org/10.1787/888933713764
0.0
0.5
1.0
1.5
2.0
2.5
3.0
0.0
0.5
1.0
1.5
2.0
2.5
3.0
NLD
GBR AU
TD
NK
NZL
AUS
DEU SV
KIT
AES
TFI
NPR
TH
UN
BEL
CZE JP
NC
AN ESP
IRL
LUX
NO
RFR
AO
ECD
ISL
CH
EC
HL
SWE
USA LV
APO
LSV
NG
RC
KOR
MEX IS
RTU
R
2013 2008
1.63¹ (in 2017)
48 ©OECD
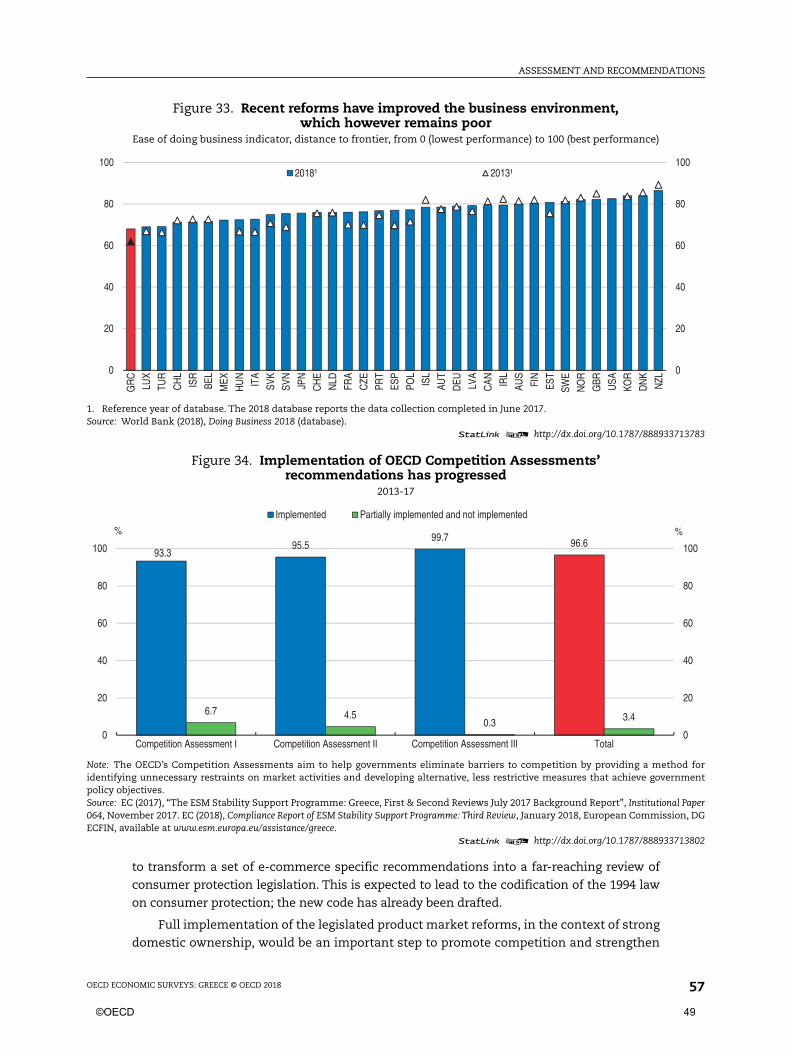
ASSESSMENT AND RECOMMENDATIONS
OECD ECONOMIC SURVEYS: GREECE © OECD 2018 57
to transform a set of e-commerce specific recommendations into a far-reaching review of
consumer protection legislation. This is expected to lead to the codification of the 1994 law
on consumer protection; the new code has already been drafted.
Full implementation of the legislated product market reforms, in the context of strong
domestic ownership, would be an important step to promote competition and strengthen
Figure 33. Recent reforms have improved the business environment,which however remains poor
Ease of doing business indicator, distance to frontier, from 0 (lowest performance) to 100 (best performance)
1. Reference year of database. The 2018 database reports the data collection completed in June 2017.Source: World Bank (2018), Doing Business 2018 (database).
1 2 http://dx.doi.org/10.1787/888933713783
Figure 34. Implementation of OECD Competition Assessments’recommendations has progressed
2013-17
Note: The OECD’s Competition Assessments aim to help governments eliminate barriers to competition by providing a method foridentifying unnecessary restraints on market activities and developing alternative, less restrictive measures that achieve governmentpolicy objectives.Source: EC (2017), “The ESM Stability Support Programme: Greece, First & Second Reviews July 2017 Background Report”, Institutional Paper064, November 2017. EC (2018), Compliance Report of ESM Stability Support Programme: Third Review, January 2018, European Commission, DGECFIN, available at www.esm.europa.eu/assistance/greece.
1 2 http://dx.doi.org/10.1787/888933713802
0
20
40
60
80
100
0
20
40
60
80
100
GR
C
LUX
TUR
CH
L
ISR
BEL
MEX
HU
N
ITA
SVK
SVN
JPN
CH
E
NLD
FRA
CZE
PRT
ESP
POL
ISL
AUT
DEU LV
A
CAN IR
L
AUS
FIN
EST
SWE
NO
R
GBR USA
KOR
DN
K
NZL
2018¹ 2013¹
93.395.5
99.7 96.6
6.7 4.50.3 3.4
0
20
40
60
80
100
0
20
40
60
80
100
Competition Assessment I Competition Assessment II Competition Assessment III Total
%%
Implemented Partially implemented and not implemented
©OECD 49

ASSESSMENT AND RECOMMENDATIONS
OECD ECONOMIC SURVEYS: GREECE © OECD 201858
incentives to invest. Reducing horizontal product market restrictions would help the
implementation of such reforms. One-stop shops now provide newly created companies
with electronic access to the tax authority’s online platform and automatically make the
founders’ details available to the social security agency (EFKA) to speed up the social
security registration process. Moreover, the 2016 investment law has allowed for the
registration of new companies remotely through the e-one-stop shop and simplified
licensing procedures. By the end of 2018 a more complete version of the electronic system
covering licensing procedures is expected to be in place. The new system is also expected
to make inspections more effective by, among other things, prioritising them based on risk
assessments and enabling the exchange of information among competent authorities. The
e-one-stop shop is expected to provide services for free during the first year of operation.
The government should make sure one-stop shops have the resources and capabilities to
perform their tasks effectively.
Also, reaping the full benefits of recent progress will require streamlining cumbersome
regulation and improving the public administration efficiency. The “silence is consent”
rule, whereby licences are automatically issued if the competent authority does not act
within the statutory period, could be expanded.
Greece attracts little foreign direct investment (FDI) despite lower FDI restrictions than
many OECD countries (Figure 35; Figure 36). Attracting more FDI hinges on improving the
business environment by lowering product market restrictions, improving the quality of
institutions and the efficiency of the public administration. The World Economic Forum (WEF,
2017) ranks Greece 130th out of 137 countries for the burden of government regulation, 112th
as regards FDI and technology transfer and 61st for the protection of intellectual property
rights in 2017.
Improving the business environment will enable to reap the full benefit of the 2016 law
establishing state aid schemes for private investment. This law introduces a range of
financial incentives covering tangible and intangible capital with the aim of attracting FDI
in addition to encouraging entrepreneurships, innovative SMEs and innovation clusters.
Incentives for major investment projects include a fixed corporate income tax rate for
12 years, tax exemption equal to 10% of eligible expenditure (capped at EUR 5 billion) and
fast track licencing procedures.
Improving the quality of regulation and fighting corruption
Greece has a well-developed framework to ensure the quality of regulation. The 2012
law on Better Regulation states basic principles for regulation, such as efficiency and
transparency. Draft regulations are published on a portal (www.opengov.gr). Public
consultations are usually informal but it is unclear how comments received are
considered. The law also requires an ex ante regulatory impact assessment (RIA) for every
legislative draft or amendment to existing regulations and an ex post impact assessment.
Ex post reviews of existing regulations have been used rarely (Figure 37). To address this, the
Ministry of Administrative Reconstruction is beginning an extensive evaluation of existing
legislation, with a view to curtail the large “stock” of regulations.
Major challenges, however, persist in fully implementing the law on Better Regulation
(OECD, 2015d). The Better Regulation Office (BRO) lacks budget and skills. RIA quality is
often poor due to the limited time to develop new drafts. Responsibilities for regulatory
policy are fragmented between the Ministry of Interior, the Ministry of Administrative
50 ©OECD
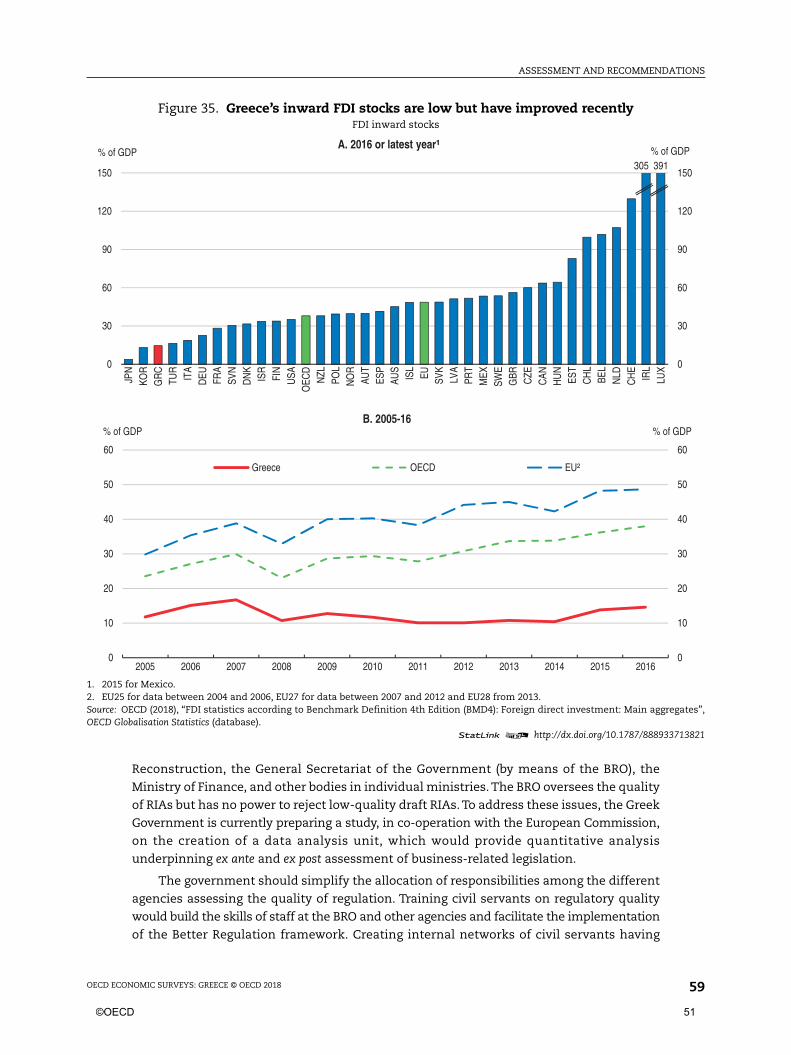
ASSESSMENT AND RECOMMENDATIONS
OECD ECONOMIC SURVEYS: GREECE © OECD 2018 59
Reconstruction, the General Secretariat of the Government (by means of the BRO), the
Ministry of Finance, and other bodies in individual ministries. The BRO oversees the quality
of RIAs but has no power to reject low-quality draft RIAs. To address these issues, the Greek
Government is currently preparing a study, in co-operation with the European Commission,
on the creation of a data analysis unit, which would provide quantitative analysis
underpinning ex ante and ex post assessment of business-related legislation.
The government should simplify the allocation of responsibilities among the different
agencies assessing the quality of regulation. Training civil servants on regulatory quality
would build the skills of staff at the BRO and other agencies and facilitate the implementation
of the Better Regulation framework. Creating internal networks of civil servants having
Figure 35. Greece’s inward FDI stocks are low but have improved recentlyFDI inward stocks
1. 2015 for Mexico.2. EU25 for data between 2004 and 2006, EU27 for data between 2007 and 2012 and EU28 from 2013.Source: OECD (2018), “FDI statistics according to Benchmark Definition 4th Edition (BMD4): Foreign direct investment: Main aggregates”,OECD Globalisation Statistics (database).
1 2 http://dx.doi.org/10.1787/888933713821
0
30
60
90
120
150
0
30
60
90
120
150
JPN
KOR
GR
CTU
RIT
AD
EU FRA
SVN
DN
KIS
RFI
NU
SAO
ECD
NZL
POL
NO
RAU
TES
PAU
SIS
LEU SV
KLV
APR
TM
EXSW
EG
BR CZE
CAN
HU
NES
TC
HL
BEL
NLD
CH
EIR
LLU
X
% of GDP% of GDPA. 2016 or latest year¹
305 391
0
10
20
30
40
50
60
0
10
20
30
40
50
60
2005 2006 2007 2008 2009 2010 2011 2012 2013 2014 2015 2016
% of GDP% of GDPB. 2005-16
Greece OECD EU²
©OECD 51
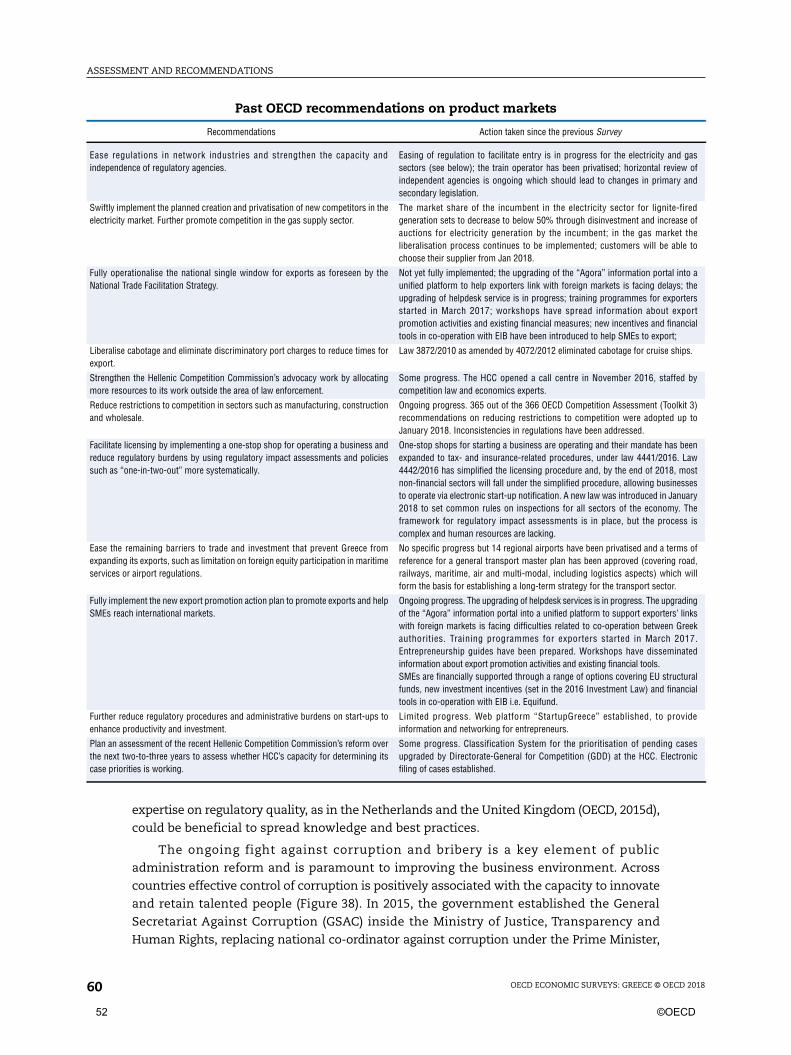
ASSESSMENT AND RECOMMENDATIONS
OECD ECONOMIC SURVEYS: GREECE © OECD 201860
expertise on regulatory quality, as in the Netherlands and the United Kingdom (OECD, 2015d),
could be beneficial to spread knowledge and best practices.
The ongoing fight against corruption and bribery is a key element of public
administration reform and is paramount to improving the business environment. Across
countries effective control of corruption is positively associated with the capacity to innovate
and retain talented people (Figure 38). In 2015, the government established the General
Secretariat Against Corruption (GSAC) inside the Ministry of Justice, Transparency and
Human Rights, replacing national co-ordinator against corruption under the Prime Minister,
Past OECD recommendations on product markets
Recommendations Action taken since the previous Survey
Ease regulations in network industries and strengthen the capacity andindependence of regulatory agencies.
Easing of regulation to facilitate entry is in progress for the electricity and gassectors (see below); the train operator has been privatised; horizontal review ofindependent agencies is ongoing which should lead to changes in primary andsecondary legislation.
Swiftly implement the planned creation and privatisation of new competitors in theelectricity market. Further promote competition in the gas supply sector.
The market share of the incumbent in the electricity sector for lignite-firedgeneration sets to decrease to below 50% through disinvestment and increase ofauctions for electricity generation by the incumbent; in the gas market theliberalisation process continues to be implemented; customers will be able tochoose their supplier from Jan 2018.
Fully operationalise the national single window for exports as foreseen by theNational Trade Facilitation Strategy.
Not yet fully implemented; the upgrading of the “Agora” information portal into aunified platform to help exporters link with foreign markets is facing delays; theupgrading of helpdesk service is in progress; training programmes for exportersstarted in March 2017; workshops have spread information about exportpromotion activities and existing financial measures; new incentives and financialtools in co-operation with EIB have been introduced to help SMEs to export;
Liberalise cabotage and eliminate discriminatory port charges to reduce times forexport.
Law 3872/2010 as amended by 4072/2012 eliminated cabotage for cruise ships.
Strengthen the Hellenic Competition Commission’s advocacy work by allocatingmore resources to its work outside the area of law enforcement.
Some progress. The HCC opened a call centre in November 2016, staffed bycompetition law and economics experts.
Reduce restrictions to competition in sectors such as manufacturing, constructionand wholesale.
Ongoing progress. 365 out of the 366 OECD Competition Assessment (Toolkit 3)recommendations on reducing restrictions to competition were adopted up toJanuary 2018. Inconsistencies in regulations have been addressed.
Facilitate licensing by implementing a one-stop shop for operating a business andreduce regulatory burdens by using regulatory impact assessments and policiessuch as “one-in-two-out” more systematically.
One-stop shops for starting a business are operating and their mandate has beenexpanded to tax- and insurance-related procedures, under law 4441/2016. Law4442/2016 has simplified the licensing procedure and, by the end of 2018, mostnon-financial sectors will fall under the simplified procedure, allowing businessesto operate via electronic start-up notification. A new law was introduced in January2018 to set common rules on inspections for all sectors of the economy. Theframework for regulatory impact assessments is in place, but the process iscomplex and human resources are lacking.
Ease the remaining barriers to trade and investment that prevent Greece fromexpanding its exports, such as limitation on foreign equity participation in maritimeservices or airport regulations.
No specific progress but 14 regional airports have been privatised and a terms ofreference for a general transport master plan has been approved (covering road,railways, maritime, air and multi-modal, including logistics aspects) which willform the basis for establishing a long-term strategy for the transport sector.
Fully implement the new export promotion action plan to promote exports and helpSMEs reach international markets.
Ongoing progress. The upgrading of helpdesk services is in progress. The upgradingof the “Agora” information portal into a unified platform to support exporters’ linkswith foreign markets is facing difficulties related to co-operation between Greekauthorities. Training programmes for exporters started in March 2017.Entrepreneurship guides have been prepared. Workshops have disseminatedinformation about export promotion activities and existing financial tools.SMEs are financially supported through a range of options covering EU structuralfunds, new investment incentives (set in the 2016 Investment Law) and financialtools in co-operation with EIB i.e. Equifund.
Further reduce regulatory procedures and administrative burdens on start-ups toenhance productivity and investment.
Limited progress. Web platform “StartupGreece” established, to provideinformation and networking for entrepreneurs.
Plan an assessment of the recent Hellenic Competition Commission’s reform overthe next two-to-three years to assess whether HCC’s capacity for determining itscase priorities is working.
Some progress. Classification System for the prioritisation of pending casesupgraded by Directorate-General for Competition (GDD) at the HCC. Electronicfiling of cases established.
52 ©OECD
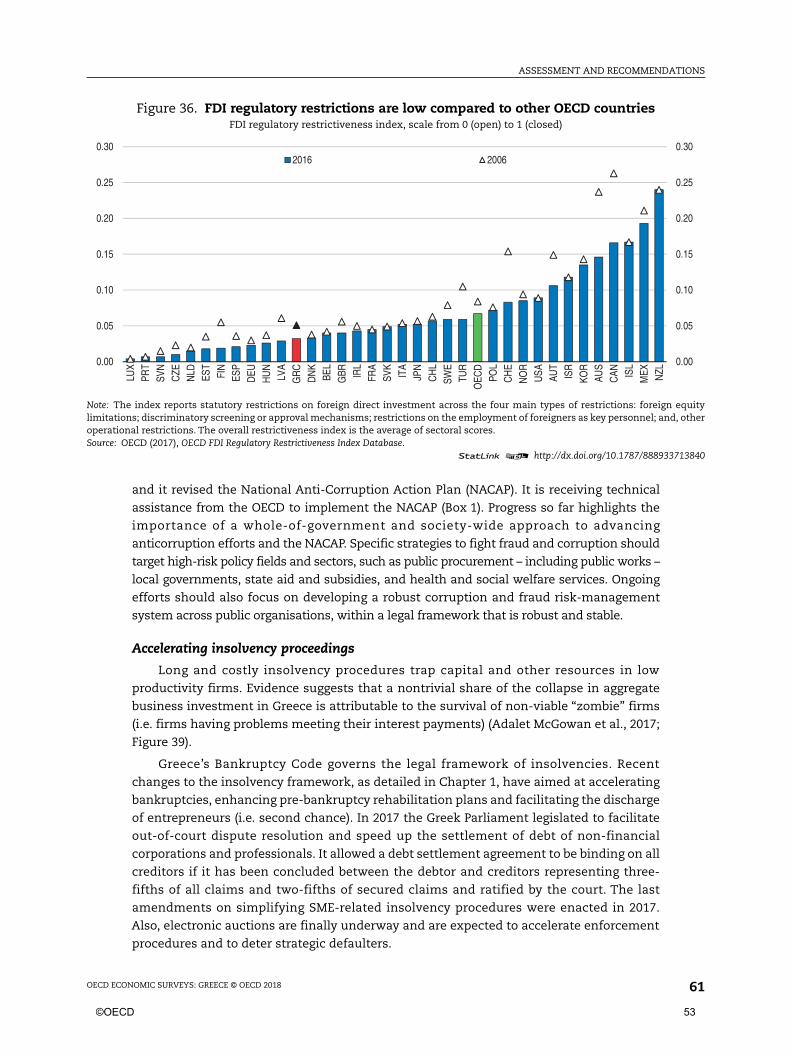
ASSESSMENT AND RECOMMENDATIONS
OECD ECONOMIC SURVEYS: GREECE © OECD 2018 61
and it revised the National Anti-Corruption Action Plan (NACAP). It is receiving technical
assistance from the OECD to implement the NACAP (Box 1). Progress so far highlights the
importance of a whole-of-government and society-wide approach to advancing
anticorruption efforts and the NACAP. Specific strategies to fight fraud and corruption should
target high-risk policy fields and sectors, such as public procurement – including public works –
local governments, state aid and subsidies, and health and social welfare services. Ongoing
efforts should also focus on developing a robust corruption and fraud risk-management
system across public organisations, within a legal framework that is robust and stable.
Accelerating insolvency proceedings
Long and costly insolvency procedures trap capital and other resources in low
productivity firms. Evidence suggests that a nontrivial share of the collapse in aggregate
business investment in Greece is attributable to the survival of non-viable “zombie” firms
(i.e. firms having problems meeting their interest payments) (Adalet McGowan et al., 2017;
Figure 39).
Greece’s Bankruptcy Code governs the legal framework of insolvencies. Recent
changes to the insolvency framework, as detailed in Chapter 1, have aimed at accelerating
bankruptcies, enhancing pre-bankruptcy rehabilitation plans and facilitating the discharge
of entrepreneurs (i.e. second chance). In 2017 the Greek Parliament legislated to facilitate
out-of-court dispute resolution and speed up the settlement of debt of non-financial
corporations and professionals. It allowed a debt settlement agreement to be binding on all
creditors if it has been concluded between the debtor and creditors representing three-
fifths of all claims and two-fifths of secured claims and ratified by the court. The last
amendments on simplifying SME-related insolvency procedures were enacted in 2017.
Also, electronic auctions are finally underway and are expected to accelerate enforcement
procedures and to deter strategic defaulters.
Figure 36. FDI regulatory restrictions are low compared to other OECD countriesFDI regulatory restrictiveness index, scale from 0 (open) to 1 (closed)
Note: The index reports statutory restrictions on foreign direct investment across the four main types of restrictions: foreign equitylimitations; discriminatory screening or approval mechanisms; restrictions on the employment of foreigners as key personnel; and, otheroperational restrictions. The overall restrictiveness index is the average of sectoral scores.Source: OECD (2017), OECD FDI Regulatory Restrictiveness Index Database.
1 2 http://dx.doi.org/10.1787/888933713840
0.00
0.05
0.10
0.15
0.20
0.25
0.30
0.00
0.05
0.10
0.15
0.20
0.25
0.30
LUX
PRT
SVN
CZE
NLD ES
TFI
NES
PD
EUH
UN
LVA
GR
CD
NK
BEL
GBR IR
LFR
ASV
KIT
AJP
NC
HL
SWE
TUR
OEC
DPO
LC
HE
NO
RU
SA AUT
ISR
KOR
AUS
CAN IS
LM
EX NZL
2016 2006
©OECD 53
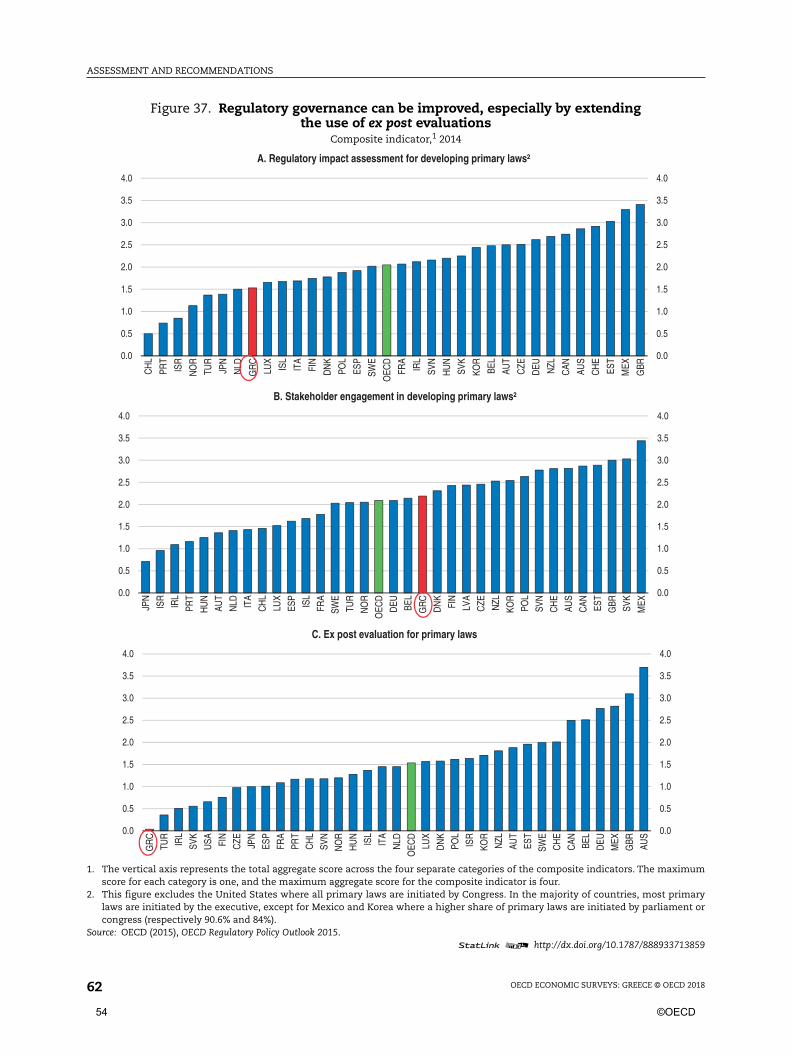
ASSESSMENT AND RECOMMENDATIONS
OECD ECONOMIC SURVEYS: GREECE © OECD 201862
Figure 37. Regulatory governance can be improved, especially by extendingthe use of ex post evaluations
Composite indicator,1 2014
1. The vertical axis represents the total aggregate score across the four separate categories of the composite indicators. The maximumscore for each category is one, and the maximum aggregate score for the composite indicator is four.
2. This figure excludes the United States where all primary laws are initiated by Congress. In the majority of countries, most primarylaws are initiated by the executive, except for Mexico and Korea where a higher share of primary laws are initiated by parliament orcongress (respectively 90.6% and 84%).
Source: OECD (2015), OECD Regulatory Policy Outlook 2015.1 2 http://dx.doi.org/10.1787/888933713859
0.0
0.5
1.0
1.5
2.0
2.5
3.0
3.5
4.0
0.0
0.5
1.0
1.5
2.0
2.5
3.0
3.5
4.0
CH
L
PRT
ISR
NO
R
TUR
JPN
NLD
GR
C
LUX
ISL
ITA
FIN
DN
K
POL
ESP
SWE
OEC
D
FRA
IRL
SVN
HU
N
SVK
KOR
BEL
AUT
CZE
DEU NZL
CAN AU
S
CH
E
EST
MEX
GBR
A. Regulatory impact assessment for developing primary laws²
0.0
0.5
1.0
1.5
2.0
2.5
3.0
3.5
4.0
0.0
0.5
1.0
1.5
2.0
2.5
3.0
3.5
4.0
JPN
ISR
IRL
PRT
HU
N
AUT
NLD IT
A
CH
L
LUX
ESP
ISL
FRA
SWE
TUR
NO
R
OEC
D
DEU BE
L
GR
C
DN
K
FIN
LVA
CZE NZL
KOR
POL
SVN
CH
E
AUS
CAN ES
T
GBR SV
K
MEX
B. Stakeholder engagement in developing primary laws²
0.0
0.5
1.0
1.5
2.0
2.5
3.0
3.5
4.0
0.0
0.5
1.0
1.5
2.0
2.5
3.0
3.5
4.0
GR
C
TUR
IRL
SVK
USA FI
N
CZE JP
N
ESP
FRA
PRT
CH
L
SVN
NO
R
HU
N
ISL
ITA
NLD
OEC
D
LUX
DN
K
POL
ISR
KOR
NZL
AUT
EST
SWE
CH
E
CAN BE
L
DEU
MEX
GBR AU
SC. Ex post evaluation for primary laws
54 ©OECD
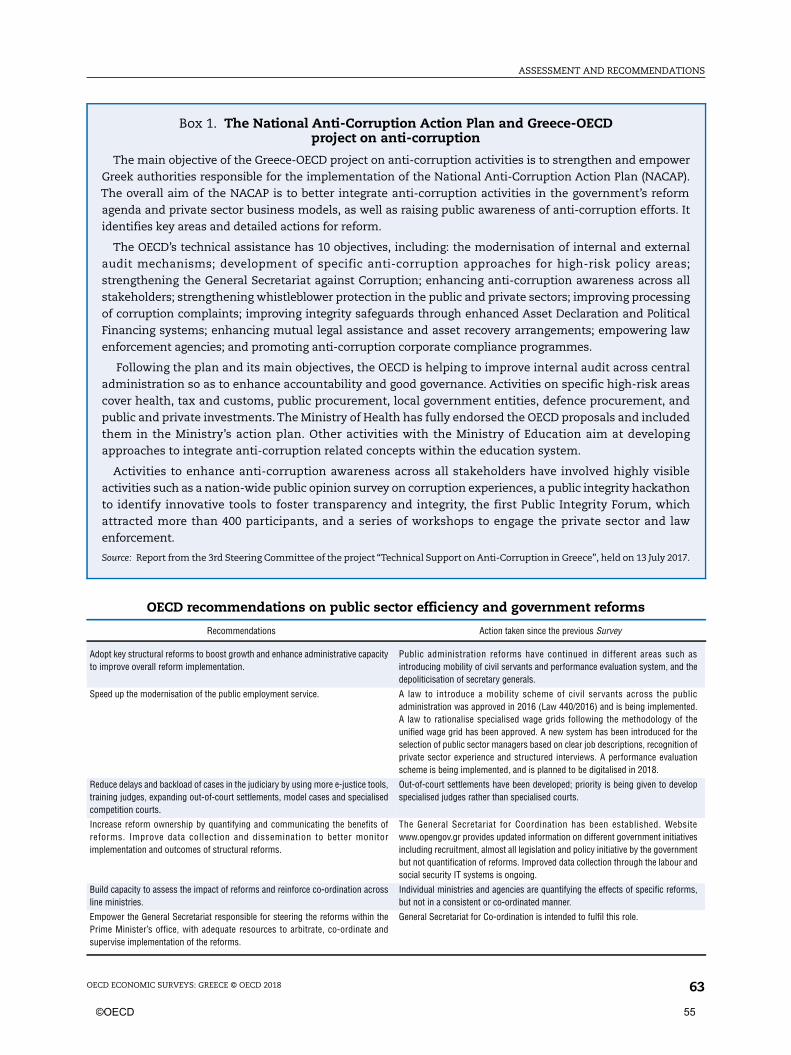
ASSESSMENT AND RECOMMENDATIONS
OECD ECONOMIC SURVEYS: GREECE © OECD 2018 63
Box 1. The National Anti-Corruption Action Plan and Greece-OECDproject on anti-corruption
The main objective of the Greece-OECD project on anti-corruption activities is to strengthen and empowerGreek authorities responsible for the implementation of the National Anti-Corruption Action Plan (NACAP).The overall aim of the NACAP is to better integrate anti-corruption activities in the government’s reformagenda and private sector business models, as well as raising public awareness of anti-corruption efforts. Itidentifies key areas and detailed actions for reform.
The OECD’s technical assistance has 10 objectives, including: the modernisation of internal and externalaudit mechanisms; development of specific anti-corruption approaches for high-risk policy areas;strengthening the General Secretariat against Corruption; enhancing anti-corruption awareness across allstakeholders; strengthening whistleblower protection in the public and private sectors; improving processingof corruption complaints; improving integrity safeguards through enhanced Asset Declaration and PoliticalFinancing systems; enhancing mutual legal assistance and asset recovery arrangements; empowering lawenforcement agencies; and promoting anti-corruption corporate compliance programmes.
Following the plan and its main objectives, the OECD is helping to improve internal audit across centraladministration so as to enhance accountability and good governance. Activities on specific high-risk areascover health, tax and customs, public procurement, local government entities, defence procurement, andpublic and private investments. The Ministry of Health has fully endorsed the OECD proposals and includedthem in the Ministry’s action plan. Other activities with the Ministry of Education aim at developingapproaches to integrate anti-corruption related concepts within the education system.
Activities to enhance anti-corruption awareness across all stakeholders have involved highly visibleactivities such as a nation-wide public opinion survey on corruption experiences, a public integrity hackathonto identify innovative tools to foster transparency and integrity, the first Public Integrity Forum, whichattracted more than 400 participants, and a series of workshops to engage the private sector and lawenforcement.
Source: Report from the 3rd Steering Committee of the project “Technical Support on Anti-Corruption in Greece”, held on 13 July 2017.
OECD recommendations on public sector efficiency and government reforms
Recommendations Action taken since the previous Survey
Adopt key structural reforms to boost growth and enhance administrative capacityto improve overall reform implementation.
Public administration reforms have continued in different areas such asintroducing mobility of civil servants and performance evaluation system, and thedepoliticisation of secretary generals.
Speed up the modernisation of the public employment service. A law to introduce a mobility scheme of civil servants across the publicadministration was approved in 2016 (Law 440/2016) and is being implemented.A law to rationalise specialised wage grids following the methodology of theunified wage grid has been approved. A new system has been introduced for theselection of public sector managers based on clear job descriptions, recognition ofprivate sector experience and structured interviews. A performance evaluationscheme is being implemented, and is planned to be digitalised in 2018.
Reduce delays and backload of cases in the judiciary by using more e-justice tools,training judges, expanding out-of-court settlements, model cases and specialisedcompetition courts.
Out-of-court settlements have been developed; priority is being given to developspecialised judges rather than specialised courts.
Increase reform ownership by quantifying and communicating the benefits ofreforms. Improve data collection and dissemination to better monitorimplementation and outcomes of structural reforms.
The General Secretariat for Coordination has been established. Websitewww.opengov.gr provides updated information on different government initiativesincluding recruitment, almost all legislation and policy initiative by the governmentbut not quantification of reforms. Improved data collection through the labour andsocial security IT systems is ongoing.
Build capacity to assess the impact of reforms and reinforce co-ordination acrossline ministries.
Individual ministries and agencies are quantifying the effects of specific reforms,but not in a consistent or co-ordinated manner.
Empower the General Secretariat responsible for steering the reforms within thePrime Minister’s office, with adequate resources to arbitrate, co-ordinate andsupervise implementation of the reforms.
General Secretariat for Co-ordination is intended to fulfil this role.
©OECD 55
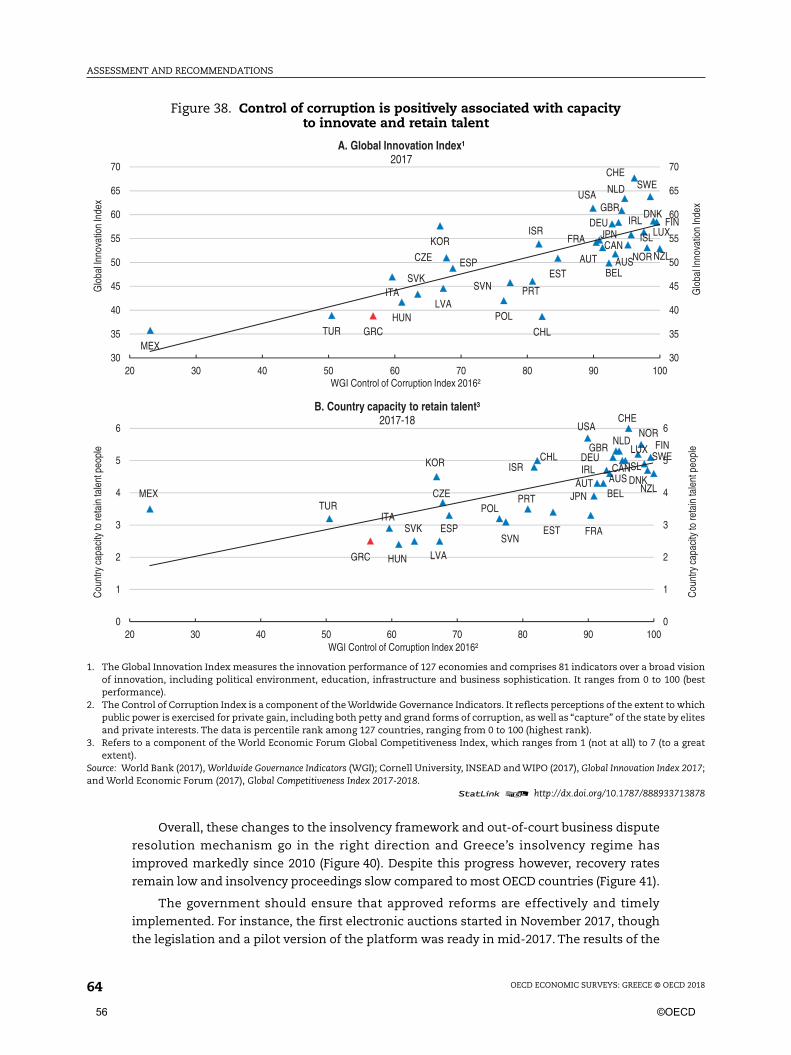
ASSESSMENT AND RECOMMENDATIONS
OECD ECONOMIC SURVEYS: GREECE © OECD 201864
Overall, these changes to the insolvency framework and out-of-court business dispute
resolution mechanism go in the right direction and Greece’s insolvency regime has
improved markedly since 2010 (Figure 40). Despite this progress however, recovery rates
remain low and insolvency proceedings slow compared to most OECD countries (Figure 41).
The government should ensure that approved reforms are effectively and timely
implemented. For instance, the first electronic auctions started in November 2017, though
the legislation and a pilot version of the platform was ready in mid-2017. The results of the
Figure 38. Control of corruption is positively associated with capacityto innovate and retain talent
1. The Global Innovation Index measures the innovation performance of 127 economies and comprises 81 indicators over a broad visionof innovation, including political environment, education, infrastructure and business sophistication. It ranges from 0 to 100 (bestperformance).
2. The Control of Corruption Index is a component of the Worldwide Governance Indicators. It reflects perceptions of the extent to whichpublic power is exercised for private gain, including both petty and grand forms of corruption, as well as “capture” of the state by elitesand private interests. The data is percentile rank among 127 countries, ranging from 0 to 100 (highest rank).
3. Refers to a component of the World Economic Forum Global Competitiveness Index, which ranges from 1 (not at all) to 7 (to a greatextent).
Source: World Bank (2017), Worldwide Governance Indicators (WGI); Cornell University, INSEAD and WIPO (2017), Global Innovation Index 2017;and World Economic Forum (2017), Global Competitiveness Index 2017-2018.
1 2 http://dx.doi.org/10.1787/888933713878
AUSAUTBEL
CAN
CHE
CHL
CZE
DEUDNK
ESPEST
FIN
FRA
GBR
GRCHUN
IRL
ISLISR
ITA
JPNKOR
LUX
LVA
MEX
NLD
NOR NZL
POL
PRTSVK
SVN
SWE
TUR
USA
30
35
40
45
50
55
60
65
70
30
35
40
45
50
55
60
65
70
20 30 40 50 60 70 80 90 100
Glo
bal I
nnov
atio
n In
dex
Glo
bal I
nnov
atio
n In
dex
WGI Control of Corruption Index 2016²
A. Global Innovation Index¹2017
AUSAUTBEL
CAN
CHE
CHL
CZE
DEU
DNK
ESP EST
FIN
FRA
GBR
GRC HUN
IRL ISLISR
ITA
JPN
KORLUX
LVA
MEX
NLDNOR
NZL
POLPRT
SVKSVN
SWE
TUR
USA
0
1
2
3
4
5
6
0
1
2
3
4
5
6
20 30 40 50 60 70 80 90 100
Cou
ntry
cap
acity
to re
tain
tale
nt p
eopl
e
Cou
ntry
cap
acity
to re
tain
tale
nt p
eopl
e
WGI Control of Corruption Index 2016²
B. Country capacity to retain talent³2017-18
56 ©OECD
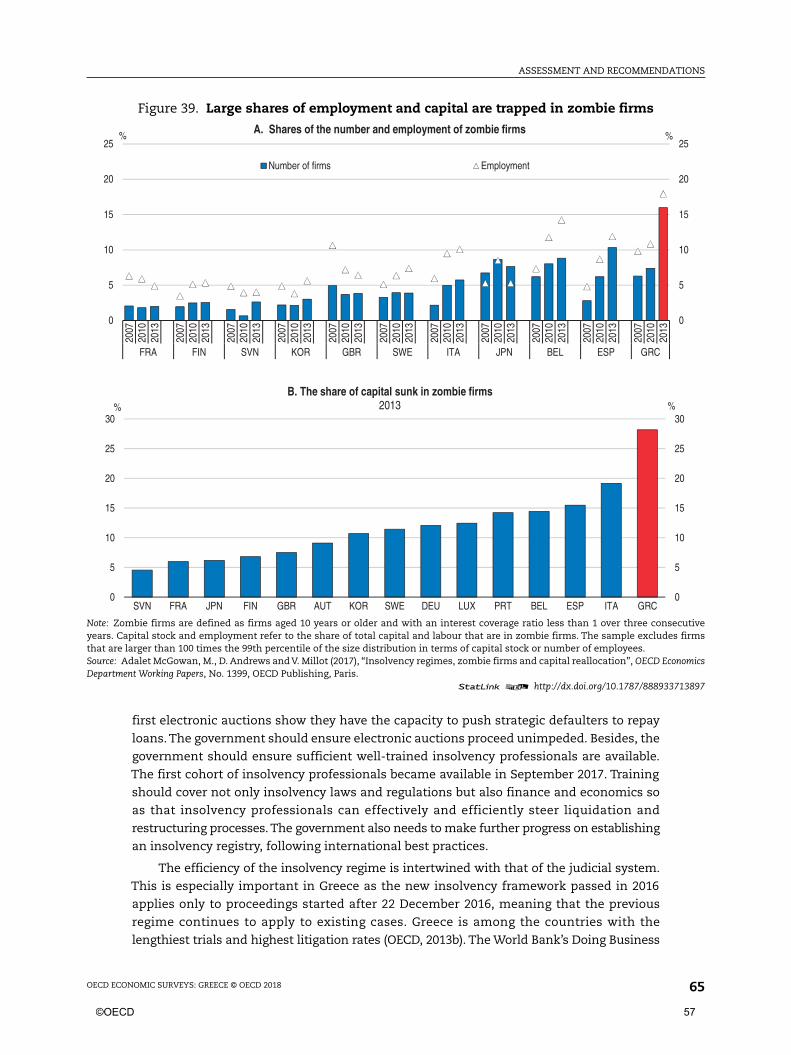
ASSESSMENT AND RECOMMENDATIONS
OECD ECONOMIC SURVEYS: GREECE © OECD 2018 65
first electronic auctions show they have the capacity to push strategic defaulters to repay
loans. The government should ensure electronic auctions proceed unimpeded. Besides, the
government should ensure sufficient well-trained insolvency professionals are available.
The first cohort of insolvency professionals became available in September 2017. Training
should cover not only insolvency laws and regulations but also finance and economics so
as that insolvency professionals can effectively and efficiently steer liquidation and
restructuring processes. The government also needs to make further progress on establishing
an insolvency registry, following international best practices.
The efficiency of the insolvency regime is intertwined with that of the judicial system.
This is especially important in Greece as the new insolvency framework passed in 2016
applies only to proceedings started after 22 December 2016, meaning that the previous
regime continues to apply to existing cases. Greece is among the countries with the
lengthiest trials and highest litigation rates (OECD, 2013b). The World Bank’s Doing Business
Figure 39. Large shares of employment and capital are trapped in zombie firms
Note: Zombie firms are defined as firms aged 10 years or older and with an interest coverage ratio less than 1 over three consecutiveyears. Capital stock and employment refer to the share of total capital and labour that are in zombie firms. The sample excludes firmsthat are larger than 100 times the 99th percentile of the size distribution in terms of capital stock or number of employees.Source: Adalet McGowan, M., D. Andrews and V. Millot (2017), “Insolvency regimes, zombie firms and capital reallocation”, OECD EconomicsDepartment Working Papers, No. 1399, OECD Publishing, Paris.
1 2 http://dx.doi.org/10.1787/888933713897
0
5
10
15
20
25
0
5
10
15
20
25
2007
2010
2013
2007
2010
2013
2007
2010
2013
2007
2010
2013
2007
2010
2013
2007
2010
2013
2007
2010
2013
2007
2010
2013
2007
2010
2013
2007
2010
2013
2007
2010
2013
FRA FIN SVN KOR GBR SWE ITA JPN BEL ESP GRC
%A. Shares of the number and employment of zombie firms
Number of firms Employment
%
0
5
10
15
20
25
30
0
5
10
15
20
25
30
SVN FRA JPN FIN GBR AUT KOR SWE DEU LUX PRT BEL ESP ITA GRC
%%B. The share of capital sunk in zombie firms
2013
©OECD 57
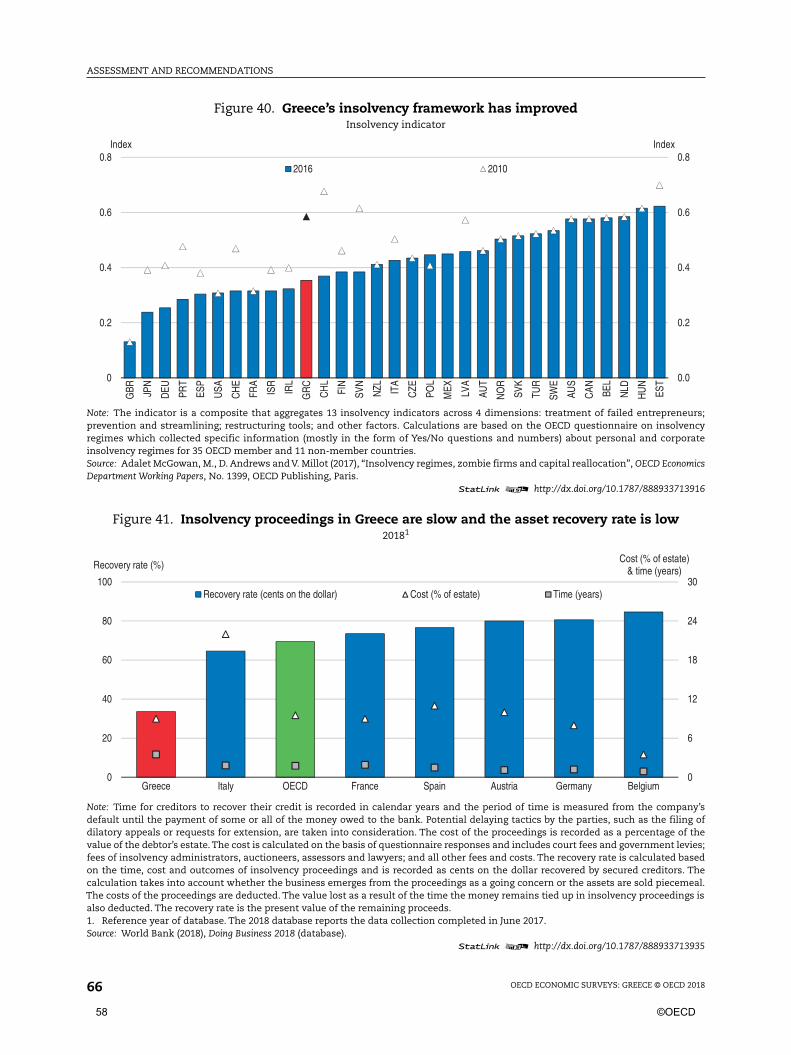
ASSESSMENT AND RECOMMENDATIONS
OECD ECONOMIC SURVEYS: GREECE © OECD 201866
Figure 40. Greece’s insolvency framework has improvedInsolvency indicator
Note: The indicator is a composite that aggregates 13 insolvency indicators across 4 dimensions: treatment of failed entrepreneurs;prevention and streamlining; restructuring tools; and other factors. Calculations are based on the OECD questionnaire on insolvencyregimes which collected specific information (mostly in the form of Yes/No questions and numbers) about personal and corporateinsolvency regimes for 35 OECD member and 11 non-member countries.Source: Adalet McGowan, M., D. Andrews and V. Millot (2017), “Insolvency regimes, zombie firms and capital reallocation”, OECD EconomicsDepartment Working Papers, No. 1399, OECD Publishing, Paris.
1 2 http://dx.doi.org/10.1787/888933713916
Figure 41. Insolvency proceedings in Greece are slow and the asset recovery rate is low20181
Note: Time for creditors to recover their credit is recorded in calendar years and the period of time is measured from the company’sdefault until the payment of some or all of the money owed to the bank. Potential delaying tactics by the parties, such as the filing ofdilatory appeals or requests for extension, are taken into consideration. The cost of the proceedings is recorded as a percentage of thevalue of the debtor’s estate. The cost is calculated on the basis of questionnaire responses and includes court fees and government levies;fees of insolvency administrators, auctioneers, assessors and lawyers; and all other fees and costs. The recovery rate is calculated basedon the time, cost and outcomes of insolvency proceedings and is recorded as cents on the dollar recovered by secured creditors. Thecalculation takes into account whether the business emerges from the proceedings as a going concern or the assets are sold piecemeal.The costs of the proceedings are deducted. The value lost as a result of the time the money remains tied up in insolvency proceedings isalso deducted. The recovery rate is the present value of the remaining proceeds.1. Reference year of database. The 2018 database reports the data collection completed in June 2017.Source: World Bank (2018), Doing Business 2018 (database).
1 2 http://dx.doi.org/10.1787/888933713935
0.0
0.2
0.4
0.6
0.8
0
0.2
0.4
0.6
0.8
GBR JP
N
DEU PR
T
ESP
USA
CH
E
FRA
ISR
IRL
GR
C
CH
L
FIN
SVN
NZL ITA
CZE
POL
MEX LV
A
AUT
NO
R
SVK
TUR
SWE
AUS
CAN BE
L
NLD
HU
N
EST
IndexIndex
2016 2010
0
6
12
18
24
30
0
20
40
60
80
100
Greece Italy OECD France Spain Austria Germany Belgium
Cost (% of estate) & time (years)Recovery rate (%)
Recovery rate (cents on the dollar) Cost (% of estate) Time (years)
58 ©OECD
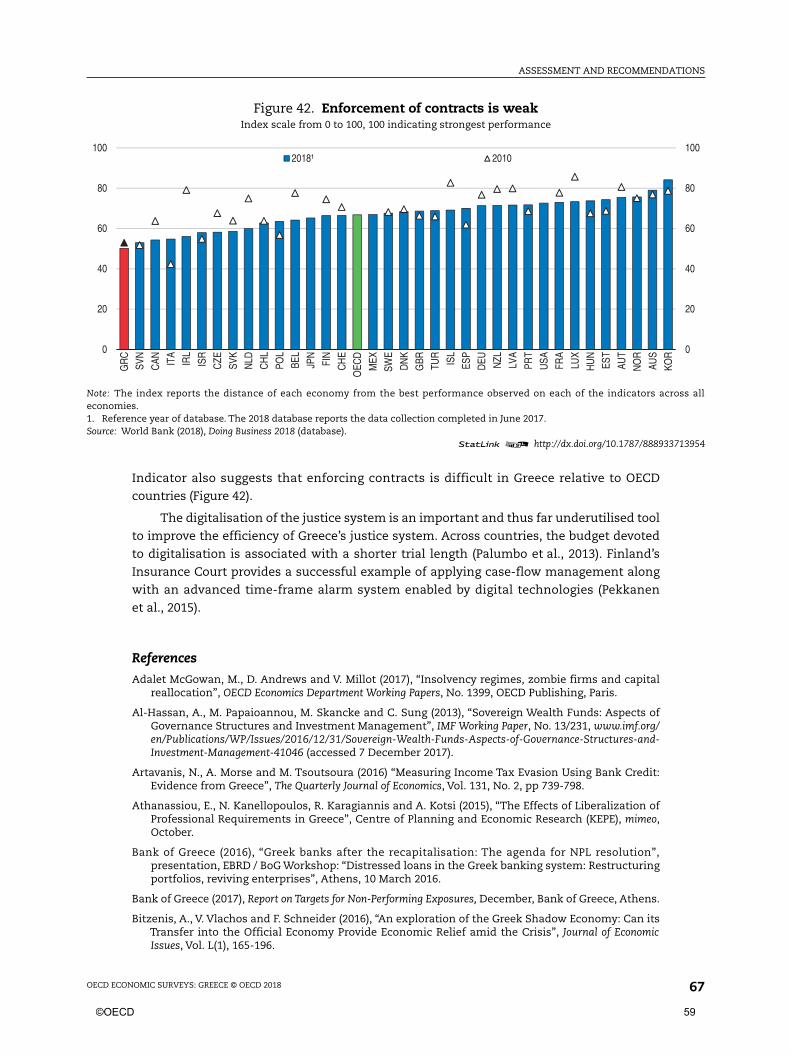
ASSESSMENT AND RECOMMENDATIONS
OECD ECONOMIC SURVEYS: GREECE © OECD 2018 67
Indicator also suggests that enforcing contracts is difficult in Greece relative to OECD
countries (Figure 42).
The digitalisation of the justice system is an important and thus far underutilised tool
to improve the efficiency of Greece’s justice system. Across countries, the budget devoted
to digitalisation is associated with a shorter trial length (Palumbo et al., 2013). Finland’s
Insurance Court provides a successful example of applying case-flow management along
with an advanced time-frame alarm system enabled by digital technologies (Pekkanen
et al., 2015).
References
Adalet McGowan, M., D. Andrews and V. Millot (2017), “Insolvency regimes, zombie firms and capitalreallocation”, OECD Economics Department Working Papers, No. 1399, OECD Publishing, Paris.
Al-Hassan, A., M. Papaioannou, M. Skancke and C. Sung (2013), “Sovereign Wealth Funds: Aspects ofGovernance Structures and Investment Management”, IMF Working Paper, No. 13/231, www.imf.org/en/Publications/WP/Issues/2016/12/31/Sovereign-Wealth-Funds-Aspects-of-Governance-Structures-and-Investment-Management-41046 (accessed 7 December 2017).
Artavanis, N., A. Morse and M. Tsoutsoura (2016) “Measuring Income Tax Evasion Using Bank Credit:Evidence from Greece”, The Quarterly Journal of Economics, Vol. 131, No. 2, pp 739-798.
Athanassiou, E., N. Kanellopoulos, R. Karagiannis and A. Kotsi (2015), “The Effects of Liberalization ofProfessional Requirements in Greece”, Centre of Planning and Economic Research (KEPE), mimeo,October.
Bank of Greece (2016), “Greek banks after the recapitalisation: The agenda for NPL resolution”,presentation, EBRD / BoG Workshop: “Distressed loans in the Greek banking system: Restructuringportfolios, reviving enterprises”, Athens, 10 March 2016.
Bank of Greece (2017), Report on Targets for Non-Performing Exposures, December, Bank of Greece, Athens.
Bitzenis, A., V. Vlachos and F. Schneider (2016), “An exploration of the Greek Shadow Economy: Can itsTransfer into the Official Economy Provide Economic Relief amid the Crisis”, Journal of EconomicIssues, Vol. L(1), 165-196.
Figure 42. Enforcement of contracts is weakIndex scale from 0 to 100, 100 indicating strongest performance
Note: The index reports the distance of each economy from the best performance observed on each of the indicators across alleconomies.1. Reference year of database. The 2018 database reports the data collection completed in June 2017.Source: World Bank (2018), Doing Business 2018 (database).
1 2 http://dx.doi.org/10.1787/888933713954
0
20
40
60
80
100
0
20
40
60
80
100
GR
C
SVN
CAN IT
A
IRL
ISR
CZE
SVK
NLD
CH
L
POL
BEL
JPN
FIN
CH
E
OEC
D
MEX
SWE
DN
K
GBR TU
R
ISL
ESP
DEU NZL
LVA
PRT
USA FR
A
LUX
HU
N
EST
AUT
NO
R
AUS
KOR
2018¹ 2010
©OECD 59
ASSESSMENT AND RECOMMENDATIONS
OECD ECONOMIC SURVEYS: GREECE © OECD 201868
Bova, E., R. Dippelsman, K. Rideout, and A. Schaechte (2013), “Another Look at Governments’ BalanceSheets: The Role of Nonfinancial Assets”, IMF Working Paper, 13/95, www.imf.org/external/pubs/ft/wp/2013/wp1395.pdf.
Card, D., J. Kluve and A. Weber (2015), “What Works? A Meta Analysis of Recent Active Labor MarketProgram Evaluations”, IZA Discussion Paper, No. 9236, www.ftp.iza.org/dp9236.pdf.
Causa, O., M. Hermansen and N. Ruiz (2016), “The Distributional Impact of Structural Reforms”, OECDEconomics Department Working Papers, No. 1342, OECD Publishing, Paris, http://dx.doi.org/10.1787/5jln041nkpwc-en.
Dellas, H., D. Malliaropulos, D. Papageorgiou and E. Vourvachaki (2017), “Fiscal Policy with an InformalSector”, Bank of Greece Working Paper, No. 235.
EBA (2017), Risk Dashboard Data as of Q3 2017, European Banking Authority, available at www.eba.europa.eu/risk-analysis-and-data/risk-dashboard.
Eichengreen, B. and U. Panizza (2014), “A Surplus of Ambition: Can Europe Rely on Large PrimarySurpluses to Solve its Debt Problem?”, NBER Working Paper, No. 20316.
Emmanouil, C., E. Drositi, V. Vasilatou, E. Diapouli, K. Krikonis, K. Eleftheriadis and A. Kungolos (2017),Study on particulate matter air pollution, source origin, and human health risk based of PM10metal content in Volos City, Greece”, Toxicological & Environmental Chemistry, 99:4, 691-709, http://dx.doi.org/10.1080/02772248.2016.1242005.
European Central Bank (2016), “Stocktake of national supervisory practices and legal frameworksrelated to NPLs”, September, European Central Bank, Frankfurt am Main.
European Central Bank (2017), “Opinion of the European Central Bank of 15 March 2017 on CertainAmendments to the deferred Tax Assets Legal Framework in Greece”, CON/2017/7.
European Commission (2014), Guide to Cost-Benefit Analysis of Investment Projects: Economic appraisal toolfor Cohesion Policy 2014-2020, European Commission, Directorate-General for Regional and Urbanpolicy, Brussels, December 2014, http://ec.europa.eu/regional_policy/sources/docgener/studies/pdf/cba_guide.pdf (accessed 13 September 2017).
European Commission (2015), Improving VAT compliance – random awards for tax compliance, EuropeanUnion: Brussels, http://ec.europa.eu/taxation_customs/taxation/index_en.htm.
European Commission (2017a), “The EU Environmental Implementation Review Country Report –GREECE”, European Commission Staff Working Document, SWD (2017) 41 final, http://ec.europa.eu/environment/eir/pdf/report_el_en.pdf
European Commission (2017b), “Compliance Report of the Third Economic Adjustment Programme forGreece: Second Review – June 2017”, Directorate General for Economic and Fiscal Affairs, https://ec.europa.eu/info/sites/info/files/compliance_report-to_ewg_2017_06_21.pdf (accessed 20 November 2017).
European Commission (2018), “Compliance Report: ESM Stability Support Programme for Greece – ThirdReview, January 2018”, Directorate General for Economic and Financial Affairs, https://ec.europa.eu/info/sites/info/files/economy-finance/compliance_report_-_3rd_review.pdf (accessed 2 February 2018).
European Commission (forthcoming), “2018 Ageing Report: Economic and Budgetary Projections forthe EU Member States (2016-2070)”, Directorate General for Economic and Financial Affairs,Economic Policy Committee.
European Environment Agency (2017), Greek bathing water quality in 2016, European Environment AgencyCountry Report, www.eea.europa.eu/themes/water/status-and-monitoring/state-of-bathing-water/country-reports-2016-bathing-season/greece-2016-bathing-water-report/view (accessed 10 October 2017).
Gale, W. and A. Samwick (2016), “Effects of Income Tax Changes on Economic Growth”, Brookings Papers.
Hellenic Bank Association (2017), Documentation Data on the Operation of the Greek Banking System,www.hba.gr/UplDocs/HBA_GreekBankingSystem_January2017_EN.pdf (accessed on 20 November 2017).
Hellenic Financial Stability Fund (2010), HFSF operational strategy, www.hfsf.gr/files/operationalstrategy.pdf(accessed 20 November 2017).
Hellenic Financial Stability Fund (2016), “Updated Analysis of Non-Regulatory Constraints andImpediments for the development of an NPL market in Greece”, September.
Hondroyiannis, G. and D. Papaoikonomou (2017), “The Effect of Card Payments on VAT Revenue inGreece”, Economic Letters, Vol. 157, 17-20.
60 ©OECD
ASSESSMENT AND RECOMMENDATIONS
OECD ECONOMIC SURVEYS: GREECE © OECD 2018 69
IMF (2006), “Greece: Financial System Stability Assessment, including Reports on the Observance ofStandards and Codes on the following topics, Banking Supervision, Insurance Supervision,Securities Regulation, and Anti-Money Laundering and Combating the Financing of Terrorism”,IMF Country Report, No. 06/6.
IMF (2013), “Reassessing the Role and Modalities of Fiscal Policy in Advanced Economies”, Policy Paper.
IMF (2015), “Euro Area Policies: Selected Issues”, IMF Country Report, No. 15/205, www.imf.org/external/pubs/ft/scr/2015/cr15205.pdf.
Immervoll, H. and M. Pearson (2009), “A Good Time for Making Work Pay? Taking Stock of In-WorkBenefits and Related Measures across the OECD”, OECD Social, Employment and Migration WorkingPapers, No. 81, OECD Publishing, Paris, http://dx.doi.org/10.1787/225442803245.
KPMG (2016), Sales of distressed portfolios, Presentation at the Bank of Greece conference “Distressed loansin the Greek banking system: Restructuring portfolios, reviving enterprises”, www.bankofgreece.gr/BoGDocuments/EBRD_Sales%20of%20Distressed%20Portfolios.pdf (accessed August 2017).
Krever (2014), “Combating VAT Fraud: Lessons from Korea?”, British Tax Review, Vol. 3, 303-315.
Lee, H. (2016), “Can Electronic Tax Invoicing Improve Tax Compliance? A Case Study of the Republic ofKorea’s Electronic Tax Invoicing for Value-Added Tax”, World Bank Policy Research Working Paper,No. 7592.
Ministry of Education Research and Religious Affairs (2017a), Three Year Plan, www.minedu.gov.gr/news/28206-19-05-17-to-trietes-sxedio-gia-tin-ekpaidefsi-plaisio-katefthynseon-kai-protaseis (accessed on06 June 2017).
Ministry of Education Research and Religious Affairs (2017b), Reform and Upgrading of General Lyceum andNew System of Admission to Higher Education (In Greek), www.minedu.gov.gr/rss/29783-28-08-2017-metarrythmisi-kai-anavathmisi-tou-genikoy-lykeiou-kai-neo-systima-eisagogis-stin-tritovathmia-ekpaidefsi-3(accessed on 31 August 2017).
Moody’s (2016), “Moody’s Revises Outlook on Greek Banking System to Stable From Negative AmidProfitability and Funding Improvements”, www.moodys.com/research/Moodys-Revises-Outlook-on-Greek-Banking-System-to-Stable-From--PR_358469 (accessed 20 November 2017).
Moody’s (2017), “Moody’s maintains stable outlook on the Greek banking system amid improvedprofitability prospects, balanced by still very high problem loans”, www.moodys.com/research/Moodys-maintains-stable-outlook-on-the-Greek-banking-system-amid--PR_366708 (accessed 20 November 2017).
Muehlbacher, S., E. Kirchler and H. Schwarzenberger (2011), “Voluntary Versus Enforced Tax Compliance:Empirical Evidence for the ‘Slippery Slope’ Framework”, Journal of Law and Economics, Vol. 32(1), 89-97.
OECD (2005), OECD Employment Outlook, OECD Publishing, Paris.
OECD (2010), OECD Environmental Performance Reviews: Greece, OECD Publishing, Paris, http://dx.doi.org/10.1787/9789264061330-en.
OECD (2013a), Greece: Reform of Social Welfare Programmes, OECD Public Governance Reviews, OECDPublishing, Paris, http://dx.doi.org/10.1787/9789264196490-en.
OECD (2013b), OECD Economic Surveys: Greece 2013, OECD Publishing, Paris, http://dx.doi.org/10.1787/eco_surveys-grc-2013-en.
OECD (2015a), How’s Life? 2015: Measuring Well-being, OECD Publishing, Paris, http://dx.doi.org/10.1787/how_life-2015-e.
OECD (2015b), OECD Employment Outlook 2015, OECD Publishing, Paris, http://dx.doi.org/10.1787/empl_outlook-2015-en.
OECD (2015c), Immigrant Students at School: Easing the Journey towards Integration, OECD Reviews ofMigrant Education, OECD Publishing, Paris, http://dx.doi.org/10.1787/9789264249509-en.
OECD (2015d), “Greece”, in OECD Regulatory Policy Outlook 2015, OECD Publishing, Paris, http://dx.doi.org/10.1787/9789264238770-23-en.
OECD (2016a), OECD Economic Surveys: Greece 2016, OECD Publishing, Paris, http://dx.doi.org/10.1787/eco_surveys-grc-2016-en.
OECD (2016b), Getting Skills Right: Assessing and Anticipating Changing Skill Needs, OECD Publishing, Paris,http://dx.doi.org/10.1787/9789264252073-en.
OECD (2016b), PISA 2015 Results (Volume I): Excellence and Equity in Education, PISA, OECD Publishing,Paris, http://dx.doi.org/10.1787/9789264266490-en.
©OECD 61
ASSESSMENT AND RECOMMENDATIONS
OECD ECONOMIC SURVEYS: GREECE © OECD 201870
OECD (2017a), Tax Policy Reforms 2017: OECD and Selected Partner Economies, OECD Publishing, Paris, http://dx.doi.org/10.1787/9789264279919-en.
OECD (2017b), Government at a Glance 2017, OECD Publishing, Paris, http://dx.doi.org/10.1787/gov_glance-2017-en.
OECD (2017c), OECD Employment Outlook 2017, OECD Publishing, Paris, http://dx.doi.org/10.1787/empl_outlook-2017-en.
OECD (2017d), Employment by education level (indicator), http://dx.doi.org/10.1787/26f676c7-en (last accessedon 20 November 2017).
OECD (2017e), Education Policy in Greece: A Preliminary Assessment, OECD Publishing, Paris.
OECD (2017f), Starting Strong 2017: Key OECD Indicators on Early Childhood Education and Care, OECDPublishing, Paris, http://dx.doi.org/10.1787/9789264276116-en.
OECD (2017g), Family Database: PF3.4: Childcare support, www.oecd.org/els/family/database.htm, update27 August, 2017.
OECD (2017i), “Education Policy in Greece: Targeted policy recommendations on school and schoolleader evaluation for improvement”, OECD Publishing, Paris.
OECD (2017j), Social spending (indicator), http://dx.doi.org/10.1787/7497563b-en.
OECD (2017k), “Draft New OECD Jobs Strategy”, COM/ECO/CPE/DELSA/ELSA(2017)2.
OECD (2017l), Financial Incentives for Steering Education and Training, Getting Skills Right, OECD Publishing,Paris, http://dx.doi.org/10.1787/9789264272415-en.
OECD (2017m), How’s Life in Greece, OECD Publishing, Paris, available at www.oecd.org/statistics/Better-Life-Initiative-country-note-Greece.pdf.
OECD (2017n), Labour Market Reforms in Portugal 2011-15: A Preliminary Assessment, OECD Publishing,Paris, http://dx.doi.org/10.1787/9789264269576-en.
Palumbo, G. et al. (2013), “The Economics of Civil Justice: New Cross-country Data and Empirics”, OECDEconomics Department Working Papers, No. 1060, OECD Publishing, Paris, http://dx.doi.org/10.1787/5k41w04ds6kf-en.
Pekkanen et al. (2015 ), “Timeframe Alarm System: Designing a Practical Tool for Caseflow Management”.
REN21 (2016), RENEWABLES 2015 Global Status Report, www.ren21.net/wp-content/uploads/2015/07/REN12-GSR2015_Onlinebook_low1.pdf (accessed 10 October 2017).
Slemrod, J. (2007), “Cheating Ourselves: The Economics of Tax Evasion”, Journal of Economic Perspectives,Vol. 21, No. 1, pp. 25-48, http://dx.doi.org/10.1257/jep.21.1.25.
Stefan, G. (2015), “A Brief Analysis of the Administration Costs of National Social Protection Systems inEU member states”, Procedia Economics and Finance, Vol. 30, pp 780-789, http://dx.doi.org/10.1016/S2212-5671(15)01327-1.
van Ours, J., G. Bosch, W. Däubler, I. Koukiadis, A. Fernandes, B. Veneziani, J. Jimeno and P. Martins(2016), “Recommendations Expert Group for the Review of Greek Labour Market Institutions”,European Parliament, www.ypakp.gr/uploads/docs/9946.pdf (accessed 20 November 2017).
Watson Farley & Williams (2016), “New Regulation Framework for Non-performing Loans in Greece”,Briefing June.
World Bank (2016), “Greece Social Welfare Review – Weathering the Crisis: Reducing the Gaps in SocialProtection in Greece”.
World Bank (2017), “Greece Social Welfare Review – Output D5: Reforming Social Welfare in Greece”.
World Economic Forum (2017), The Global Competitiveness Report 2017-2018, Geneva, Switzerland,available, September 2017, www3.weforum.org/docs/GCR2017-2018/05FullReport/TheGlobalCompetitivenessReport2017%E2%80%932018.pdf (accessed 20 November 2017).
World Intellectual Property Organisation (2013), World Intellectual Property Indicators: 2013,www.wipo.int/edocs/pubdocs/en/intproperty/941/wipo_pub_941_2013.pdf (accessed 1 December 2017).
Zettelmeyer, J., E. Kreplin and U. Panizza (2017), “Does Greece Need More Official Debt Relief? If So, HowMuch?”, Peterson Institute for International Economics Working Paper, No. 17-6, https://piie.com/system/files/documents/wp17-6.pdf.
62 ©OECD
OECD Economic Surveys: Greece
© OECD 2018
71
ANNEX
Progress in structural reforms
©OECD 63
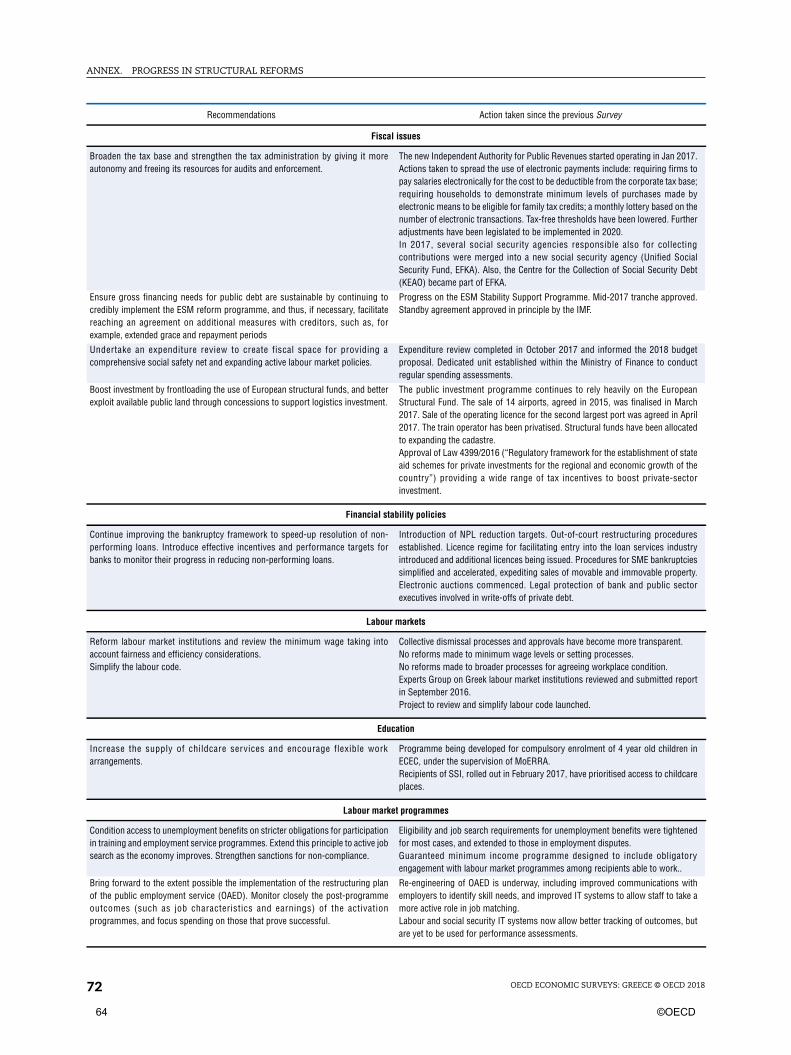
ANNEX. PROGRESS IN STRUCTURAL REFORMS
OECD ECONOMIC SURVEYS: GREECE © OECD 201872
Recommendations Action taken since the previous Survey
Fiscal issues
Broaden the tax base and strengthen the tax administration by giving it moreautonomy and freeing its resources for audits and enforcement.
The new Independent Authority for Public Revenues started operating in Jan 2017.Actions taken to spread the use of electronic payments include: requiring firms topay salaries electronically for the cost to be deductible from the corporate tax base;requiring households to demonstrate minimum levels of purchases made byelectronic means to be eligible for family tax credits; a monthly lottery based on thenumber of electronic transactions. Tax-free thresholds have been lowered. Furtheradjustments have been legislated to be implemented in 2020.In 2017, several social security agencies responsible also for collectingcontributions were merged into a new social security agency (Unified SocialSecurity Fund, EFKA). Also, the Centre for the Collection of Social Security Debt(KEAO) became part of EFKA.
Ensure gross financing needs for public debt are sustainable by continuing tocredibly implement the ESM reform programme, and thus, if necessary, facilitatereaching an agreement on additional measures with creditors, such as, forexample, extended grace and repayment periods
Progress on the ESM Stability Support Programme. Mid-2017 tranche approved.Standby agreement approved in principle by the IMF.
Undertake an expenditure review to create fiscal space for providing acomprehensive social safety net and expanding active labour market policies.
Expenditure review completed in October 2017 and informed the 2018 budgetproposal. Dedicated unit established within the Ministry of Finance to conductregular spending assessments.
Boost investment by frontloading the use of European structural funds, and betterexploit available public land through concessions to support logistics investment.
The public investment programme continues to rely heavily on the EuropeanStructural Fund. The sale of 14 airports, agreed in 2015, was finalised in March2017. Sale of the operating licence for the second largest port was agreed in April2017. The train operator has been privatised. Structural funds have been allocatedto expanding the cadastre.Approval of Law 4399/2016 (“Regulatory framework for the establishment of stateaid schemes for private investments for the regional and economic growth of thecountry”) providing a wide range of tax incentives to boost private-sectorinvestment.
Financial stability policies
Continue improving the bankruptcy framework to speed-up resolution of non-performing loans. Introduce effective incentives and performance targets forbanks to monitor their progress in reducing non-performing loans.
Introduction of NPL reduction targets. Out-of-court restructuring proceduresestablished. Licence regime for facilitating entry into the loan services industryintroduced and additional licences being issued. Procedures for SME bankruptciessimplified and accelerated, expediting sales of movable and immovable property.Electronic auctions commenced. Legal protection of bank and public sectorexecutives involved in write-offs of private debt.
Labour markets
Reform labour market institutions and review the minimum wage taking intoaccount fairness and efficiency considerations.Simplify the labour code.
Collective dismissal processes and approvals have become more transparent.No reforms made to minimum wage levels or setting processes.No reforms made to broader processes for agreeing workplace condition.Experts Group on Greek labour market institutions reviewed and submitted reportin September 2016.Project to review and simplify labour code launched.
Education
Increase the supply of childcare services and encourage flexible workarrangements.
Programme being developed for compulsory enrolment of 4 year old children inECEC, under the supervision of MoERRA.Recipients of SSI, rolled out in February 2017, have prioritised access to childcareplaces.
Labour market programmes
Condition access to unemployment benefits on stricter obligations for participationin training and employment service programmes. Extend this principle to active jobsearch as the economy improves. Strengthen sanctions for non-compliance.
Eligibility and job search requirements for unemployment benefits were tightenedfor most cases, and extended to those in employment disputes.Guaranteed minimum income programme designed to include obligatoryengagement with labour market programmes among recipients able to work..
Bring forward to the extent possible the implementation of the restructuring planof the public employment service (OAED). Monitor closely the post-programmeoutcomes (such as job characteristics and earnings) of the activationprogrammes, and focus spending on those that prove successful.
Re-engineering of OAED is underway, including improved communications withemployers to identify skill needs, and improved IT systems to allow staff to take amore active role in job matching.Labour and social security IT systems now allow better tracking of outcomes, butare yet to be used for performance assessments.
64 ©OECD

ANNEX. PROGRESS IN STRUCTURAL REFORMS
OECD ECONOMIC SURVEYS: GREECE © OECD 2018 73
Consider over the longer term and the fiscal situation allowing, increasing theduration of unemployment insurance benefits by another year, but tapering thebenefits over time. The net replacement rate of unemployment insurance benefitscould also be brought closer to the international average.
No action. National roll-out of SSI may support the unemployed.
Social protection
Make economic growth more inclusive by urgently adopting policies to reducepoverty and inequality and boost employment in the short run.
Pension spending continues to be curtailed, with benefit and contribution rulesmade more equitable. Social Solidarity Income (SSI) programme, transferringfunds to low income households and improving their access to other socialbenefits, rolled out nationally in February 2017.
Implement the guaranteed minimum income, and introduce a targeted school mealprogramme and a housing assistance programme targeted at the poor.
Guaranteed minimum income, SSI, rolled-out nationally in February 2017following pilots and trials. Take-up has been rapid. Service delivery componentsare being strengthened.A school meal programme targeting poor regions was trailed in the 2016-17school year, and is legislated to expand during the 2017-19 school years.Various programmes to redesign housing assistance are being explored, to beimplemented from 2019 subject to macroeconomic conditions. A modest rentrelief targeted at very low income households expired at the end of 2016.
Conclude the reform of the pension system including a review of special regimesand introducing a basic pension in a fiscally sustainable way.
Pension reforms have progressed and continue as 2016 legislation isprogressively implemented, including the ongoing consolidation of programmesand administration and adjustment of allowances rates. .Reforms in 2016: Integrated all public main pension funds into one Single Agencyof Social Insurance (EFKA) and integrated all public supplementary pension andlump sum benefit funds; introduced a common 20% contribution rate for old-agepensions and 6.95% for health insurance; introduced a social solidarity allowanceof EUR 360 for uninsured elderly persons; introduced a state-funded guaranteednational pension equal to the annual poverty threshold for a single person for20 years of contributions; established a contributory pension; introduced a rule forincreases in pension allowances linked with growth and inflation, to apply from2022; decreased the upper ceiling for pensions; tightened eligibility rules forsurvivors’ pensions; gradually phase-out the means-tested Social SolidarityAllowance (EKAS). EFKA also has responsibility for collecting all social securitycontributions and debt. Consolidating the debts should improve collection rates,which rose to EUR 1 billion in 2017, and lead to uncollectible debt being written off.May 2017 legislation introduced reforms to be implemented in January 2019:curtailing early retirement and unifying benefit formula; rationalising currentpensions; increasing and harmonising contribution rates; and, retaining theguaranteed basic pension.
Introduce a well-targeted housing benefit. Tentative progress. A modest rent relief targeted at very low income householdsexpired at the end of 2016. A replacement, more generous programme is legislatedto be implemented from January 2019 subject to macroeconomic conditions, butthe programme design is still being determined.
Intensify controls on recipients of welfare benefits by increasing the frequency ofre-assessments, as envisaged, and by ensuring effective monitoring and timelydata.
Improvements to information systems and monitoring of labour income improvethe tracking of beneficiaries’ eligibility and receipts.No changes to the practical assessments for eligibility of various disabilityallowances, which are generally fragmented and vary across regions.
Strengthen the management of social welfare benefits by exerting more centralcontrol of earmarked grants to local authorities. Increase the accountability of localgovernments for the allocation of social spending through a more rigorousauditing system and by enhancing transparency with regard to the use of thegrants.
Municipalities are now required to hold all funds in a consolidated treasuryaccount. No action on auditing, or on broader consolidation of social protectionsystems managed by municipalities with central systems.
Intensify controls on recipients of welfare benefits, especially of disability benefits,by increasing the frequency of re-assessments, as envisaged, and by ensuringeffective monitoring and timely data.
Strengthened database systems across labour and social welfare ministries,accompanied by broader push to electronic payments, improving ability to monitorbeneficiaries’ eligibility. Local one-stop service centres being established, toimprove contact with beneficiaries.
Product markets
Ease regulations in network industries and strengthen the capacity andindependence of regulatory agencies.
Easing of regulation to facilitate entry is in progress for the electricity and gassectors (see below); the train operator has been privatised; horizontal review ofindependent agencies is ongoing which should lead to changes in primary andsecondary legislation.
Recommendations Action taken since the previous Survey
©OECD 65
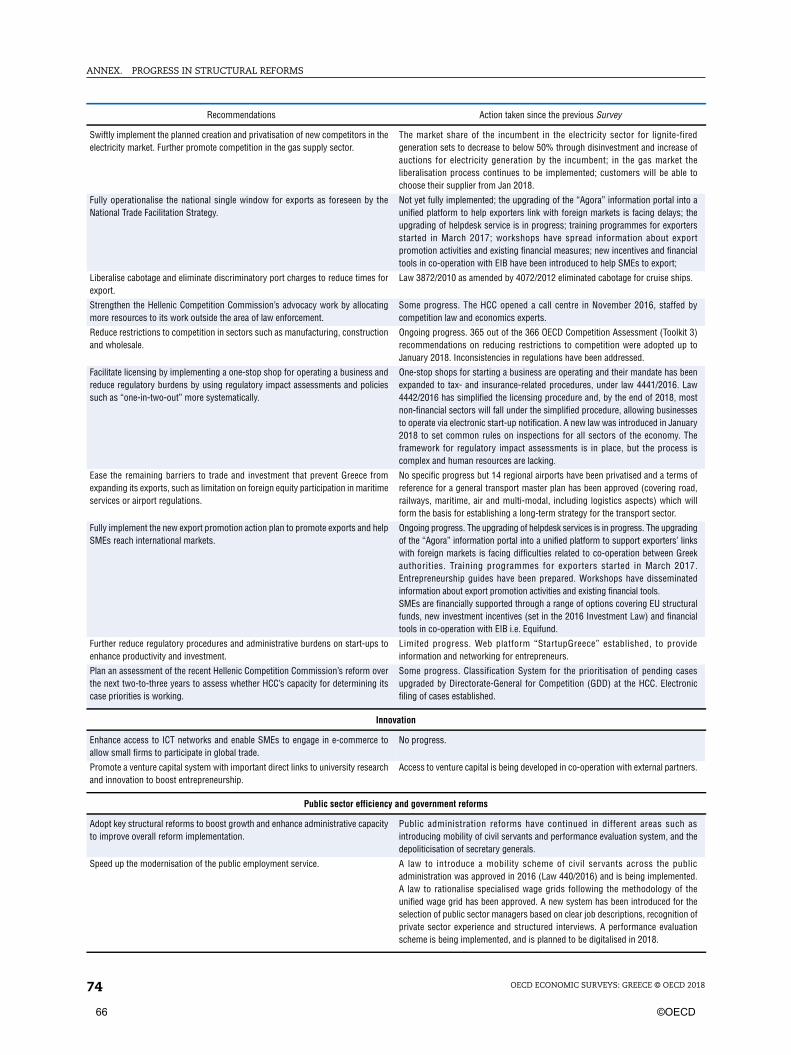
ANNEX. PROGRESS IN STRUCTURAL REFORMS
OECD ECONOMIC SURVEYS: GREECE © OECD 201874
Swiftly implement the planned creation and privatisation of new competitors in theelectricity market. Further promote competition in the gas supply sector.
The market share of the incumbent in the electricity sector for lignite-firedgeneration sets to decrease to below 50% through disinvestment and increase ofauctions for electricity generation by the incumbent; in the gas market theliberalisation process continues to be implemented; customers will be able tochoose their supplier from Jan 2018.
Fully operationalise the national single window for exports as foreseen by theNational Trade Facilitation Strategy.
Not yet fully implemented; the upgrading of the “Agora” information portal into aunified platform to help exporters link with foreign markets is facing delays; theupgrading of helpdesk service is in progress; training programmes for exportersstarted in March 2017; workshops have spread information about exportpromotion activities and existing financial measures; new incentives and financialtools in co-operation with EIB have been introduced to help SMEs to export;
Liberalise cabotage and eliminate discriminatory port charges to reduce times forexport.
Law 3872/2010 as amended by 4072/2012 eliminated cabotage for cruise ships.
Strengthen the Hellenic Competition Commission’s advocacy work by allocatingmore resources to its work outside the area of law enforcement.
Some progress. The HCC opened a call centre in November 2016, staffed bycompetition law and economics experts.
Reduce restrictions to competition in sectors such as manufacturing, constructionand wholesale.
Ongoing progress. 365 out of the 366 OECD Competition Assessment (Toolkit 3)recommendations on reducing restrictions to competition were adopted up toJanuary 2018. Inconsistencies in regulations have been addressed.
Facilitate licensing by implementing a one-stop shop for operating a business andreduce regulatory burdens by using regulatory impact assessments and policiessuch as “one-in-two-out” more systematically.
One-stop shops for starting a business are operating and their mandate has beenexpanded to tax- and insurance-related procedures, under law 4441/2016. Law4442/2016 has simplified the licensing procedure and, by the end of 2018, mostnon-financial sectors will fall under the simplified procedure, allowing businessesto operate via electronic start-up notification. A new law was introduced in January2018 to set common rules on inspections for all sectors of the economy. Theframework for regulatory impact assessments is in place, but the process iscomplex and human resources are lacking.
Ease the remaining barriers to trade and investment that prevent Greece fromexpanding its exports, such as limitation on foreign equity participation in maritimeservices or airport regulations.
No specific progress but 14 regional airports have been privatised and a terms ofreference for a general transport master plan has been approved (covering road,railways, maritime, air and multi-modal, including logistics aspects) which willform the basis for establishing a long-term strategy for the transport sector.
Fully implement the new export promotion action plan to promote exports and helpSMEs reach international markets.
Ongoing progress. The upgrading of helpdesk services is in progress. The upgradingof the “Agora” information portal into a unified platform to support exporters’ linkswith foreign markets is facing difficulties related to co-operation between Greekauthorities. Training programmes for exporters started in March 2017.Entrepreneurship guides have been prepared. Workshops have disseminatedinformation about export promotion activities and existing financial tools.SMEs are financially supported through a range of options covering EU structuralfunds, new investment incentives (set in the 2016 Investment Law) and financialtools in co-operation with EIB i.e. Equifund.
Further reduce regulatory procedures and administrative burdens on start-ups toenhance productivity and investment.
Limited progress. Web platform “StartupGreece” established, to provideinformation and networking for entrepreneurs.
Plan an assessment of the recent Hellenic Competition Commission’s reform overthe next two-to-three years to assess whether HCC’s capacity for determining itscase priorities is working.
Some progress. Classification System for the prioritisation of pending casesupgraded by Directorate-General for Competition (GDD) at the HCC. Electronicfiling of cases established.
Innovation
Enhance access to ICT networks and enable SMEs to engage in e-commerce toallow small firms to participate in global trade.
No progress.
Promote a venture capital system with important direct links to university researchand innovation to boost entrepreneurship.
Access to venture capital is being developed in co-operation with external partners.
Public sector efficiency and government reforms
Adopt key structural reforms to boost growth and enhance administrative capacityto improve overall reform implementation.
Public administration reforms have continued in different areas such asintroducing mobility of civil servants and performance evaluation system, and thedepoliticisation of secretary generals.
Speed up the modernisation of the public employment service. A law to introduce a mobility scheme of civil servants across the publicadministration was approved in 2016 (Law 440/2016) and is being implemented.A law to rationalise specialised wage grids following the methodology of theunified wage grid has been approved. A new system has been introduced for theselection of public sector managers based on clear job descriptions, recognition ofprivate sector experience and structured interviews. A performance evaluationscheme is being implemented, and is planned to be digitalised in 2018.
Recommendations Action taken since the previous Survey
66 ©OECD
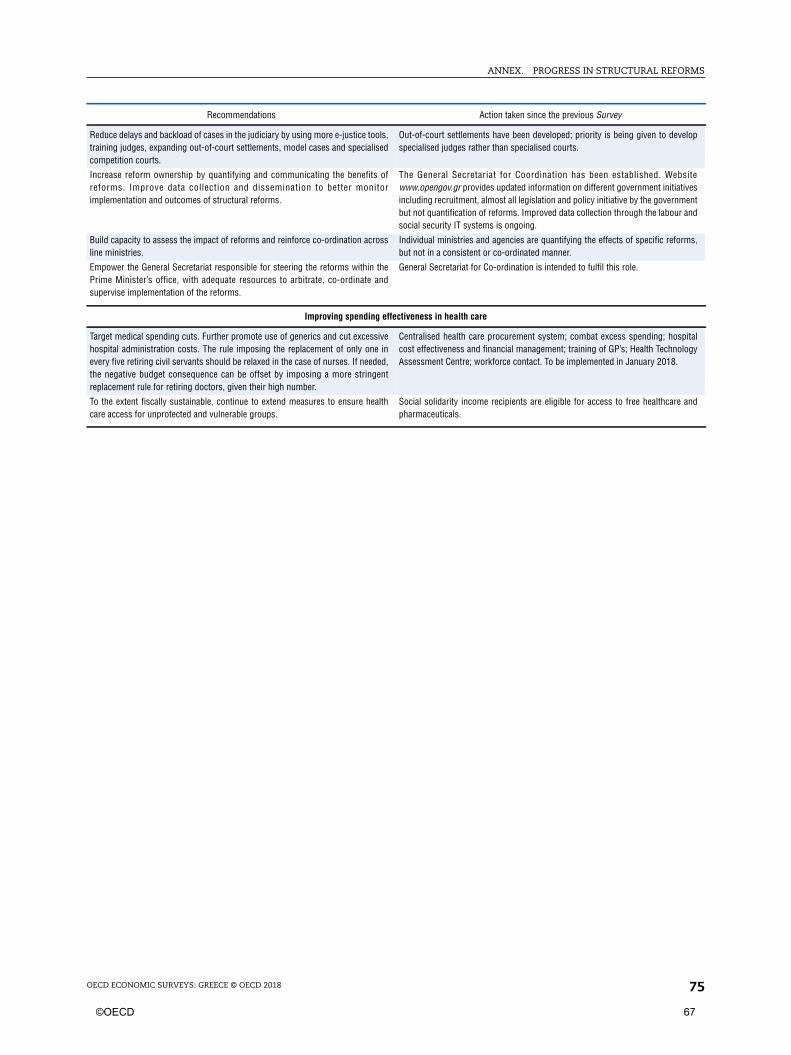
ANNEX. PROGRESS IN STRUCTURAL REFORMS
OECD ECONOMIC SURVEYS: GREECE © OECD 2018 75
Reduce delays and backload of cases in the judiciary by using more e-justice tools,training judges, expanding out-of-court settlements, model cases and specialisedcompetition courts.
Out-of-court settlements have been developed; priority is being given to developspecialised judges rather than specialised courts.
Increase reform ownership by quantifying and communicating the benefits ofreforms. Improve data collection and dissemination to better monitorimplementation and outcomes of structural reforms.
The General Secretariat for Coordination has been established. Websitewww.opengov.gr provides updated information on different government initiativesincluding recruitment, almost all legislation and policy initiative by the governmentbut not quantification of reforms. Improved data collection through the labour andsocial security IT systems is ongoing.
Build capacity to assess the impact of reforms and reinforce co-ordination acrossline ministries.
Individual ministries and agencies are quantifying the effects of specific reforms,but not in a consistent or co-ordinated manner.
Empower the General Secretariat responsible for steering the reforms within thePrime Minister’s office, with adequate resources to arbitrate, co-ordinate andsupervise implementation of the reforms.
General Secretariat for Co-ordination is intended to fulfil this role.
Improving spending effectiveness in health care
Target medical spending cuts. Further promote use of generics and cut excessivehospital administration costs. The rule imposing the replacement of only one inevery five retiring civil servants should be relaxed in the case of nurses. If needed,the negative budget consequence can be offset by imposing a more stringentreplacement rule for retiring doctors, given their high number.
Centralised health care procurement system; combat excess spending; hospitalcost effectiveness and financial management; training of GP’s; Health TechnologyAssessment Centre; workforce contact. To be implemented in January 2018.
To the extent fiscally sustainable, continue to extend measures to ensure healthcare access for unprotected and vulnerable groups.
Social solidarity income recipients are eligible for access to free healthcare andpharmaceuticals.
Recommendations Action taken since the previous Survey
©OECD 67

68 ©OECD