Embed Size (px)
Citation preview

Bilateral trade in services matrix OECD-WTO co-operation on building a global
matrix of trade in services statistics
Fabienne Fortanier, Antonella Liberatore,
Andreas Maurer and Laura Thomson
GTAP conference, 15-17 June 2016, Washington, D.C.
1
• Aim: an International Dataset for bilateral trade in services (benchmark)
• Stakeholders
– OECD/WTO
• Other stakeholders
– APEC
• Expressed interest:
– ECB
– GTAP
What and Who?
2
3
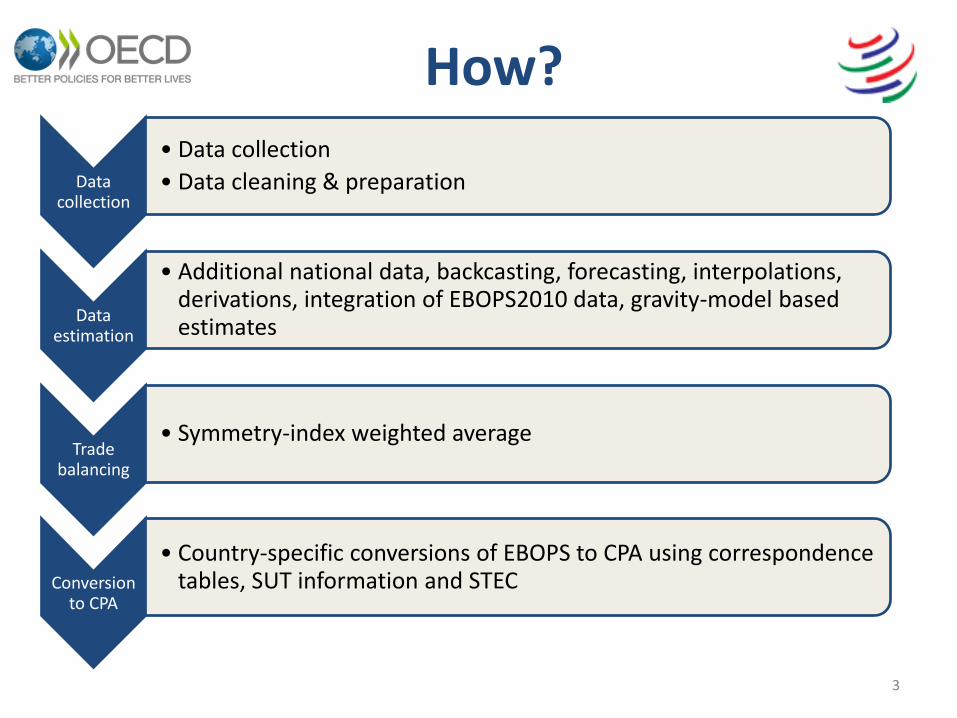
How?
Data collection
• Data collection
• Data cleaning & preparation
Data estimation
• Additional national data, backcasting, forecasting, interpolations, derivations, integration of EBOPS2010 data, gravity-model based estimates
Trade balancing
• Symmetry-index weighted average
Conversion to CPA
• Country-specific conversions of EBOPS to CPA using correspondence tables, SUT information and STEC
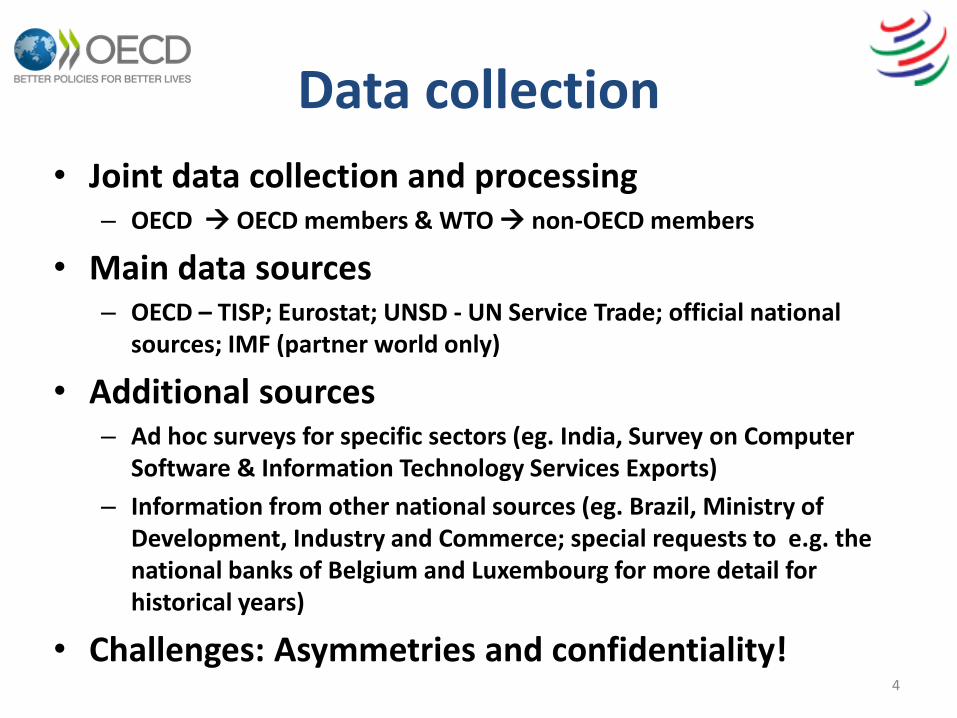
Data collection
• Joint data collection and processing – OECD OECD members & WTO non-OECD members
• Main data sources – OECD – TISP; Eurostat; UNSD - UN Service Trade; official national
sources; IMF (partner world only)
• Additional sources – Ad hoc surveys for specific sectors (eg. India, Survey on Computer
Software & Information Technology Services Exports)
– Information from other national sources (eg. Brazil, Ministry of Development, Industry and Commerce; special requests to e.g. the national banks of Belgium and Luxembourg for more detail for historical years)
• Challenges: Asymmetries and confidentiality!
4
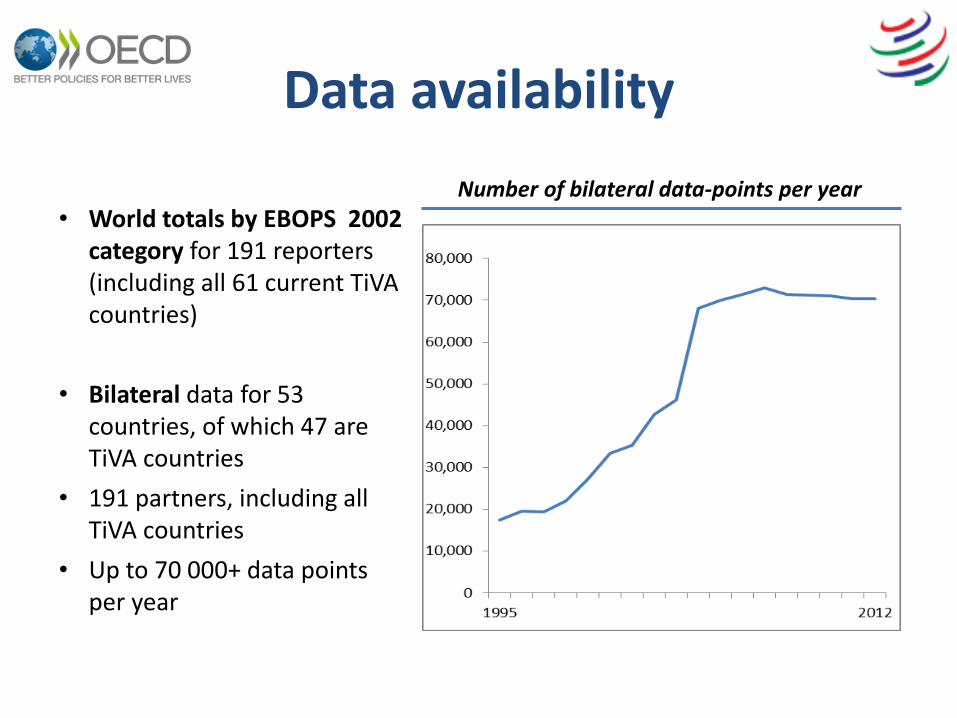
Data availability
5
• World totals by EBOPS 2002 category for 191 reporters (including all 61 current TiVA countries)
• Bilateral data for 53 countries, of which 47 are TiVA countries
• 191 partners, including all TiVA countries
• Up to 70 000+ data points per year
Number of bilateral data-points per year
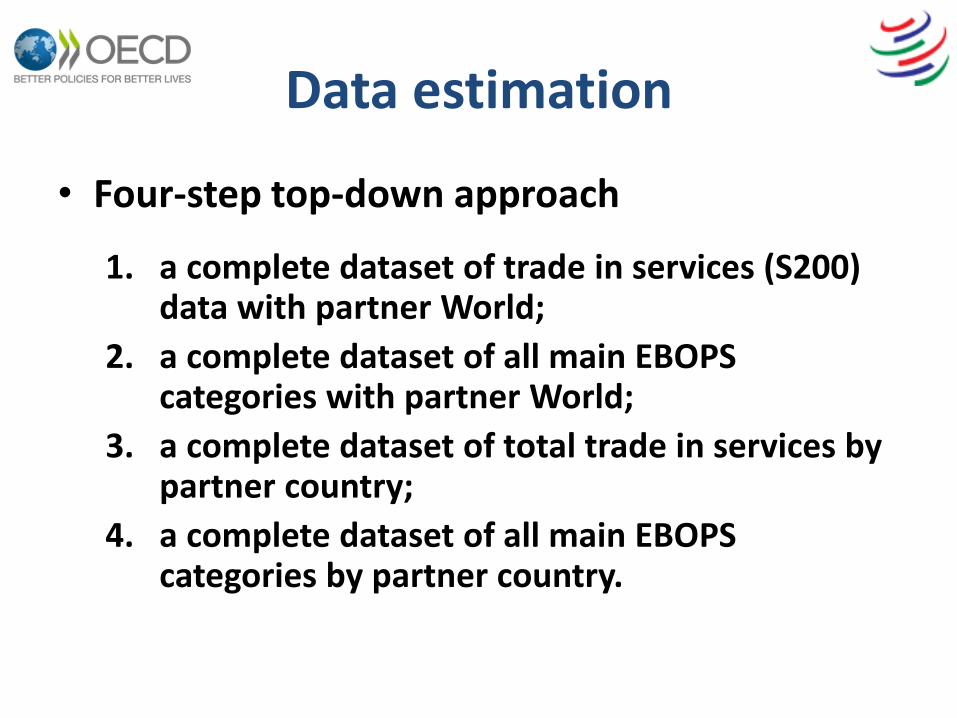
Data estimation
• Four-step top-down approach
1. a complete dataset of trade in services (S200) data with partner World;
2. a complete dataset of all main EBOPS categories with partner World;
3. a complete dataset of total trade in services by partner country;
4. a complete dataset of all main EBOPS categories by partner country.
6
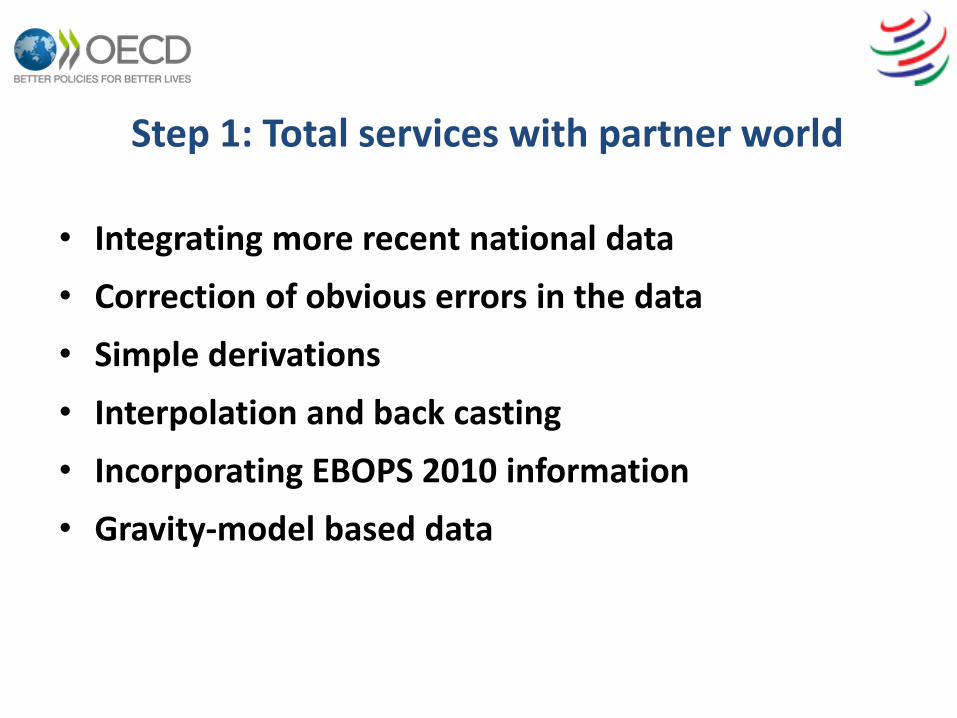
Step 1: Total services with partner world
• Integrating more recent national data
• Correction of obvious errors in the data
• Simple derivations
• Interpolation and back casting
• Incorporating EBOPS 2010 information
• Gravity-model based data
7
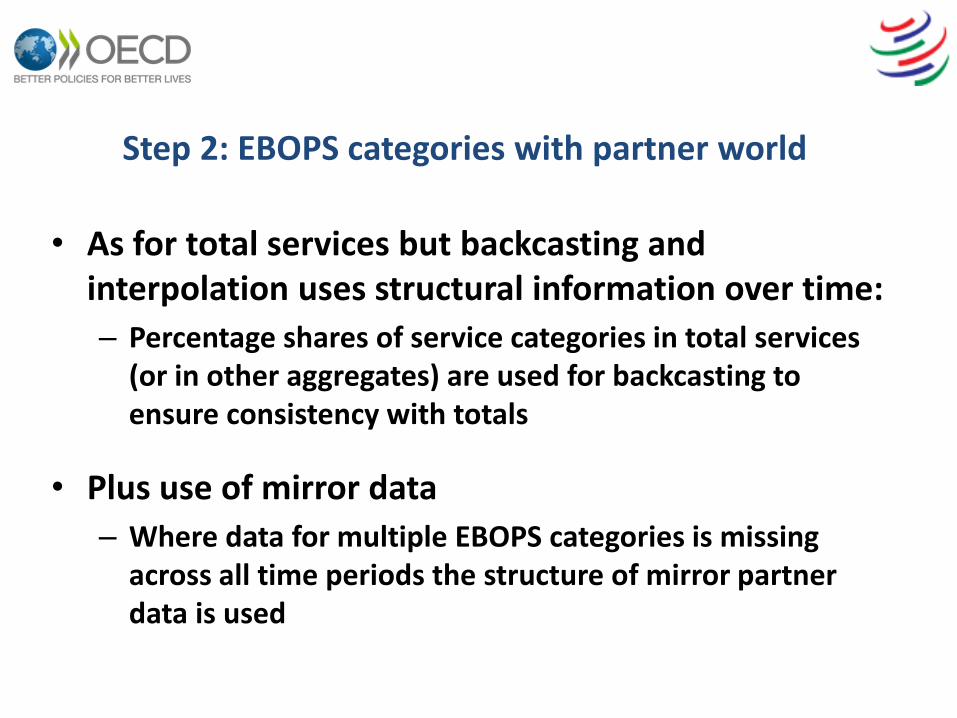
Step 2: EBOPS categories with partner world
• As for total services but backcasting and interpolation uses structural information over time:
– Percentage shares of service categories in total services (or in other aggregates) are used for backcasting to ensure consistency with totals
• Plus use of mirror data
– Where data for multiple EBOPS categories is missing across all time periods the structure of mirror partner data is used
8
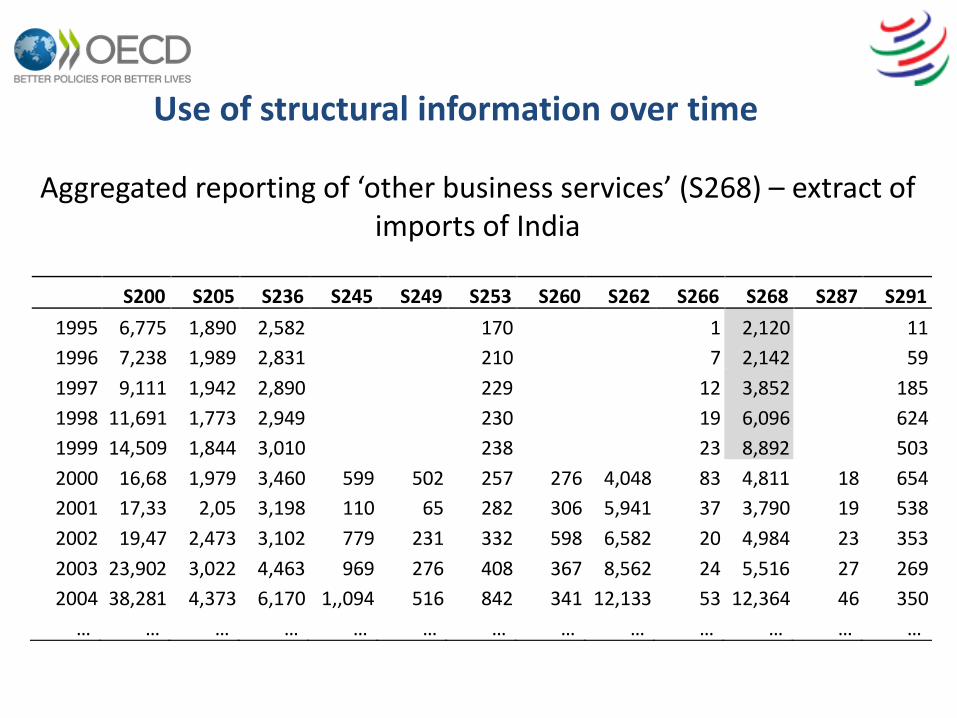
Use of structural information over time
9
Aggregated reporting of ‘other business services’ (S268) – extract of imports of India
S200 S205 S236 S245 S249 S253 S260 S262 S266 S268 S287 S291
1995 6 , 77 5 1 , 890 2 , 58 2
170
1 2 , 1 20
11
1996 7 , 238 1 , 98 9 2 , 831
2 10
7 2 , 142
59
1997 9 , 11 1 1 , 942 2 , 8 90
22 9
12 3 , 852
185
1998 11 , 691 1 , 773 2 , 94 9
230
19 6 , 096
624
1999 14 , 509 1 , 84 4 3 , 0 10
238
2 3 8 , 89 2
503
2000 16 , 68 1 , 97 9 3 , 4 60 59 9 50 2 257 276 4 , 048 8 3 4 , 81 1 1 8 65 4
2001 17 , 33 2 , 05 3 , 198 110 65 282 306 5 , 94 1 37 3 , 790 19 53 8
2002 19 , 47 2 , 473 3 , 102 779 231 33 2 598 6 , 58 2 20 4 , 984 2 3 35 3
2003 23 , 90 2 3 , 02 2 4 , 46 3 96 9 27 6 40 8 36 7 8 , 562 24 5 , 51 6 27 269
2004 38 , 28 1 4 ,373 6 , 1 70 1 ,, 09 4 516 84 2 341 12 , 13 3 5 3 12 , 364 4 6 350
… … … … … … … … … … … … …
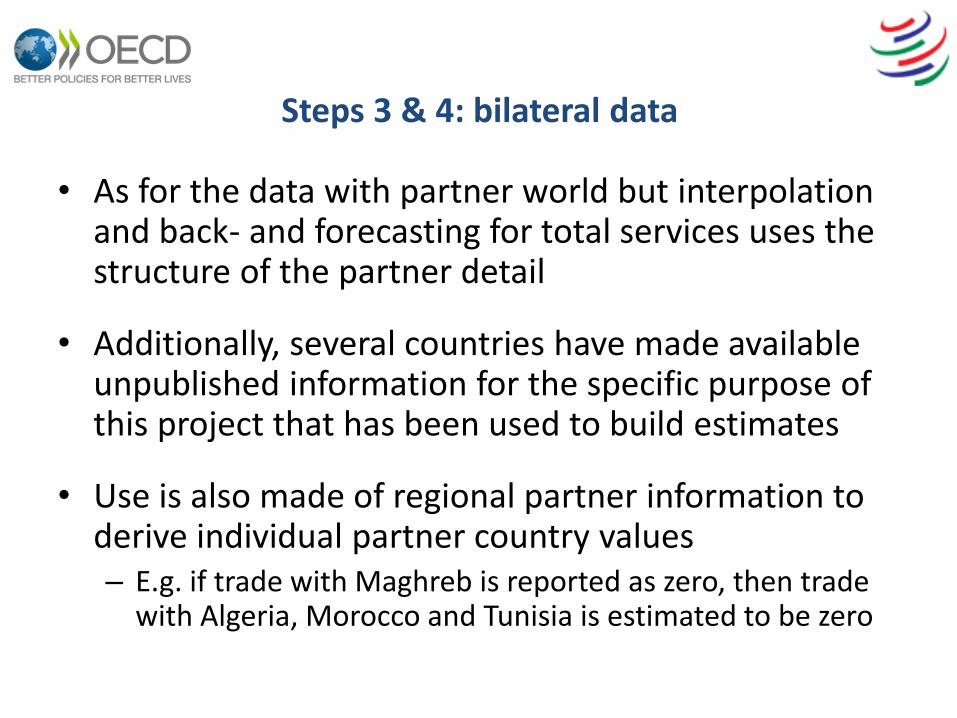
Steps 3 & 4: bilateral data
• As for the data with partner world but interpolation and back- and forecasting for total services uses the structure of the partner detail
• Additionally, several countries have made available unpublished information for the specific purpose of this project that has been used to build estimates
• Use is also made of regional partner information to derive individual partner country values – E.g. if trade with Maghreb is reported as zero, then trade
with Algeria, Morocco and Tunisia is estimated to be zero
10
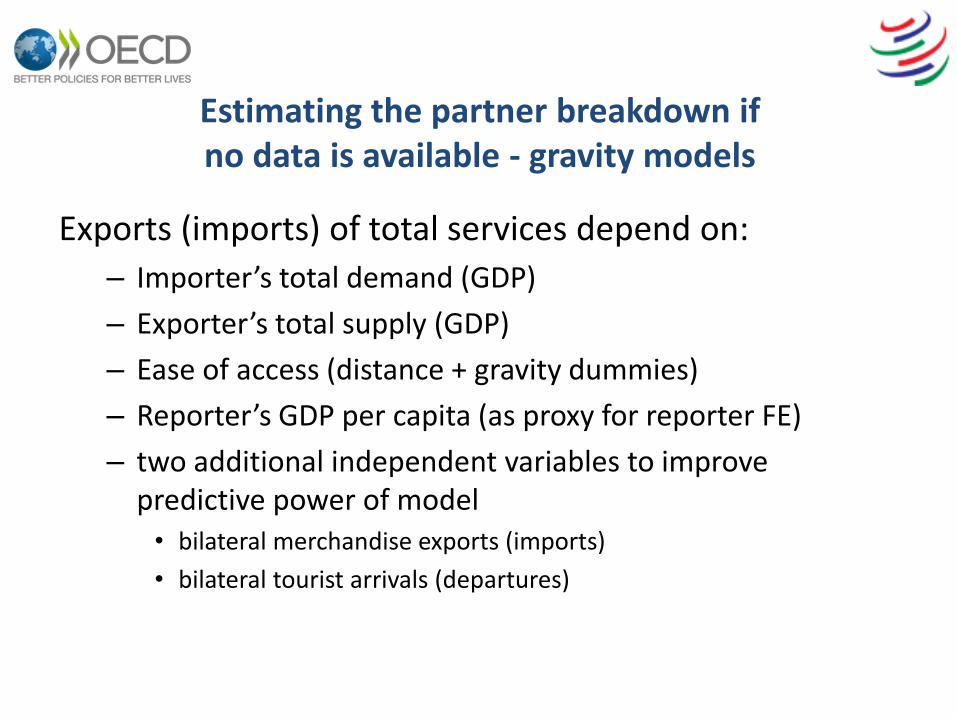
Estimating the partner breakdown if no data is available - gravity models
Exports (imports) of total services depend on:
– Importer’s total demand (GDP)
– Exporter’s total supply (GDP)
– Ease of access (distance + gravity dummies)
– Reporter’s GDP per capita (as proxy for reporter FE)
– two additional independent variables to improve predictive power of model • bilateral merchandise exports (imports)
• bilateral tourist arrivals (departures)
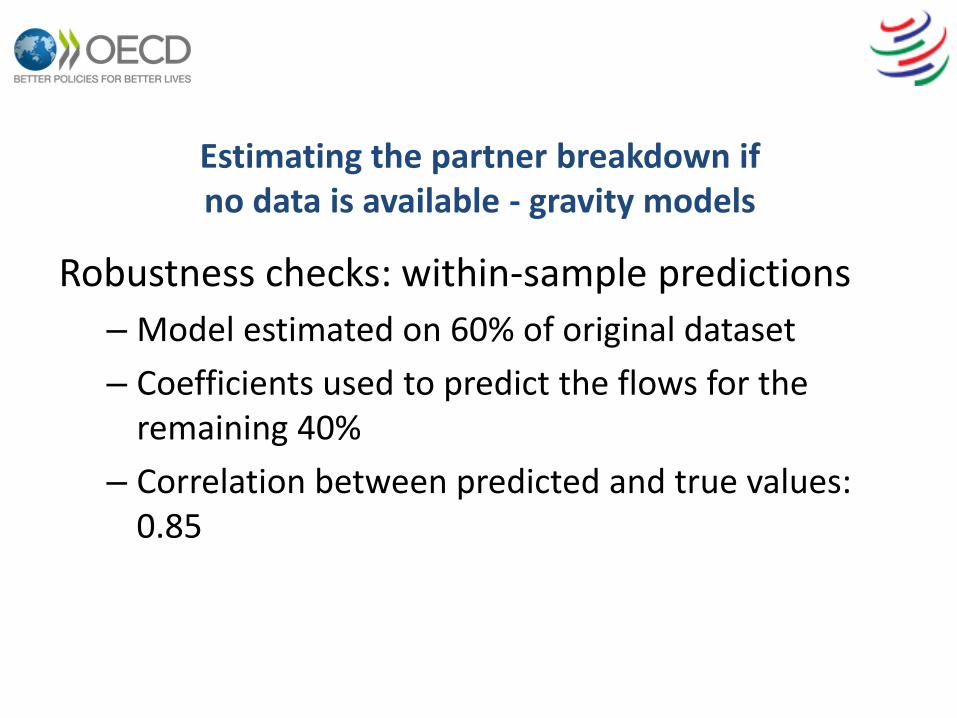
Estimating the partner breakdown if no data is available - gravity models
Robustness checks: within-sample predictions
– Model estimated on 60% of original dataset
– Coefficients used to predict the flows for the remaining 40%
– Correlation between predicted and true values: 0.85
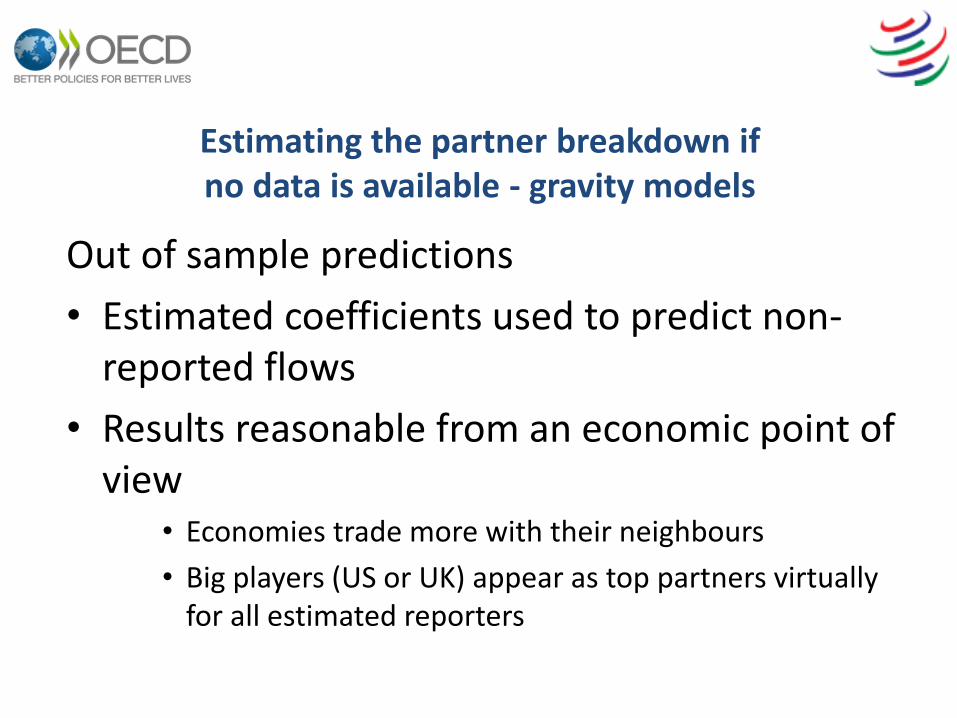
Estimating the partner breakdown if no data is available - gravity models
Out of sample predictions
• Estimated coefficients used to predict non-reported flows
• Results reasonable from an economic point of view
• Economies trade more with their neighbours
• Big players (US or UK) appear as top partners virtually for all estimated reporters
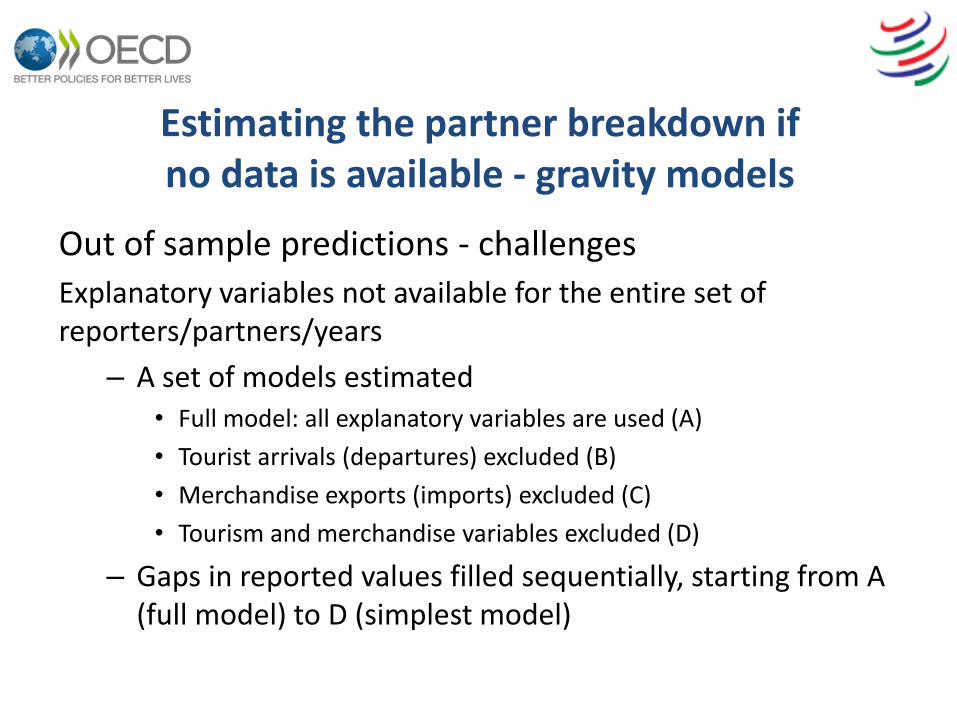
Estimating the partner breakdown if no data is available - gravity models
Out of sample predictions - challenges
Explanatory variables not available for the entire set of reporters/partners/years
– A set of models estimated • Full model: all explanatory variables are used (A)
• Tourist arrivals (departures) excluded (B)
• Merchandise exports (imports) excluded (C)
• Tourism and merchandise variables excluded (D)
– Gaps in reported values filled sequentially, starting from A (full model) to D (simplest model)
Estimating the partner breakdown if no data is available - gravity models
Out of sample predictions – ensuring overall consistency
- Reported values or values estimated in previous steps are NOT replaced by model predictions
- Model predictions are rescaled to make them fit with reported world totals
Estimating the partner breakdown if no data is available - gravity models
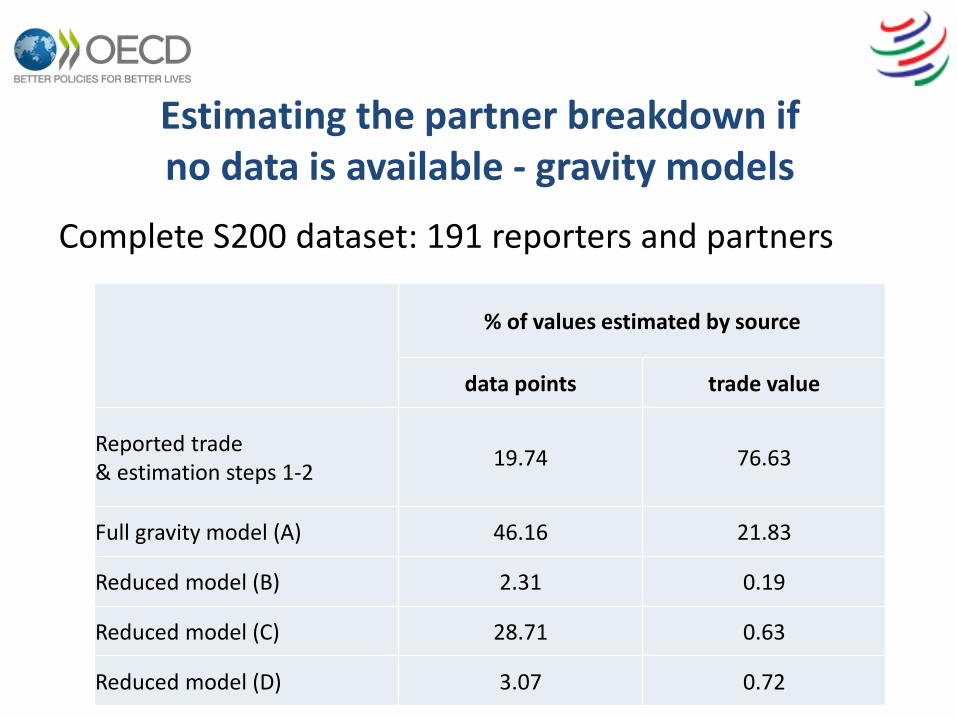
Complete S200 dataset: 191 reporters and partners
% of values estimated by source
data points trade value
Reported trade & estimation steps 1-2
19.74 76.63
Full gravity model (A) 46.16 21.83
Reduced model (B) 2.31 0.19
Reduced model (C) 28.71 0.63
Reduced model (D) 3.07 0.72
Estimating the partner breakdown if no data is available - gravity models
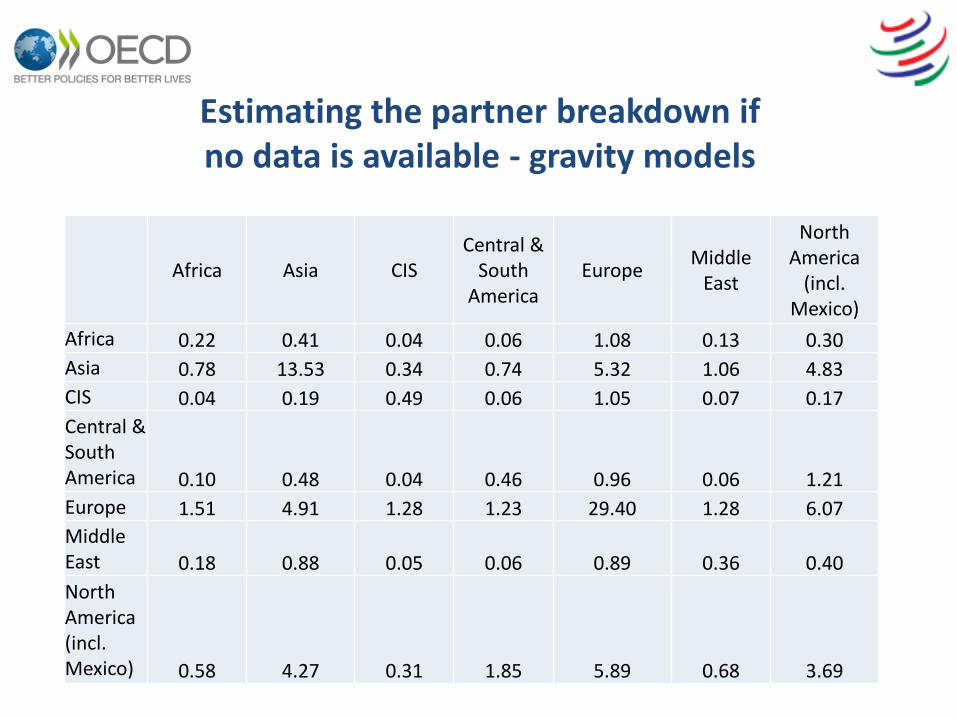
Africa Asia CIS Central &
South America
Europe Middle
East
North America
(incl. Mexico)
Africa 0.22 0.41 0.04 0.06 1.08 0.13 0.30
Asia 0.78 13.53 0.34 0.74 5.32 1.06 4.83
CIS 0.04 0.19 0.49 0.06 1.05 0.07 0.17
Central & South America 0.10 0.48 0.04 0.46 0.96 0.06 1.21
Europe 1.51 4.91 1.28 1.23 29.40 1.28 6.07
Middle East 0.18 0.88 0.05 0.06 0.89 0.36 0.40
North America (incl. Mexico) 0.58 4.27 0.31 1.85 5.89 0.68 3.69
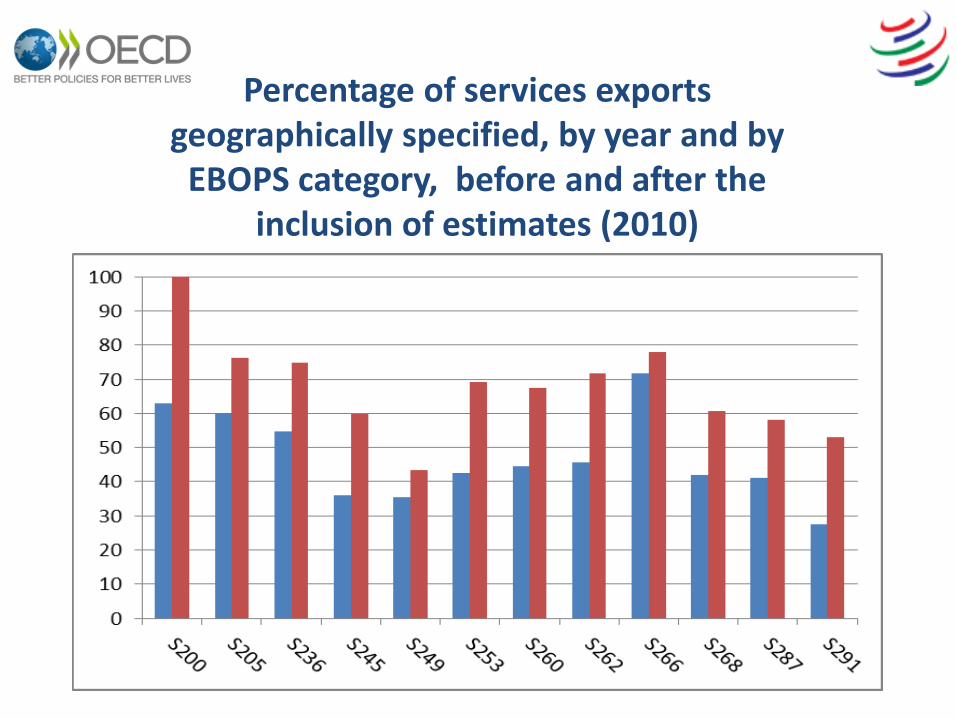
Percentage of services exports geographically specified, by year and by
EBOPS category, before and after the inclusion of estimates (2010)
18
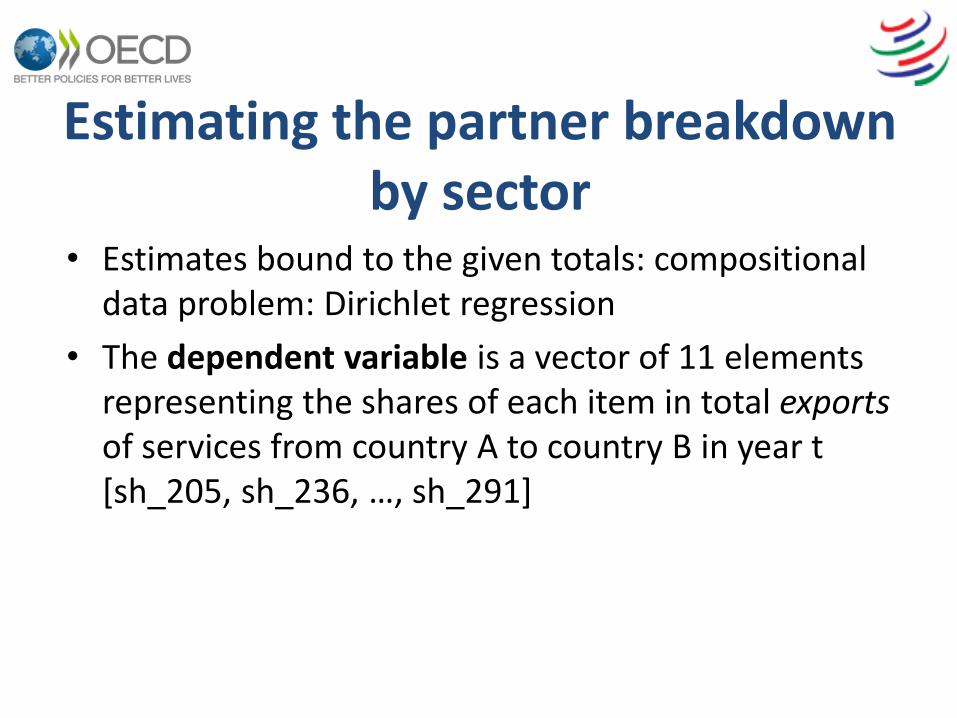
Estimating the partner breakdown by sector
• Estimates bound to the given totals: compositional data problem: Dirichlet regression
• The dependent variable is a vector of 11 elements representing the shares of each item in total exports of services from country A to country B in year t [sh_205, sh_236, …, sh_291]
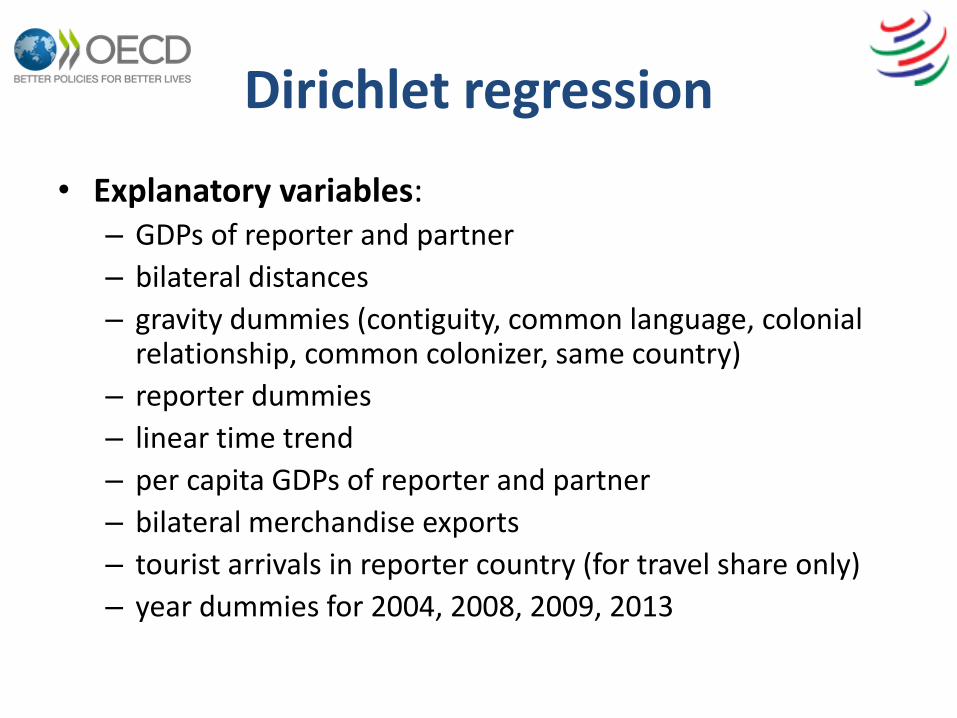
Dirichlet regression
• Explanatory variables: – GDPs of reporter and partner
– bilateral distances
– gravity dummies (contiguity, common language, colonial relationship, common colonizer, same country)
– reporter dummies
– linear time trend
– per capita GDPs of reporter and partner
– bilateral merchandise exports
– tourist arrivals in reporter country (for travel share only)
– year dummies for 2004, 2008, 2009, 2013
… and results
• Coefficients are significant and have expected sign for most variables
• GDPs per capita, exports of merchandise and tourist arrivals are important explanatory variables
• Time trend allows predictions out of the observation period
• Specific year dummies allow for evident breaks in the trend
Next steps
• Adding additional estimates
• Looking in detail at certain countries
• Considering trade asymmetries and the use of mirror data
• Dealing with countries for which there is no partner data at all
• Ensuring the consistency of the data in light of the estimates added
22
Next steps
• Balancing the data – focusing on the reduction of trade asymmetries
• Conversion to CPA
• Building on the results of the OECD’s bilateral asymmetry meetings
• Developing a matrix according to EBOPS 2010
23
Feedback
• Thank you for your attention
• We would very much appreciate your feedback on this work:
– Comments on the methods we have used
– Suggested improvements
– Ideas for tackling the next steps
24
• Anderson, et.al. (2015)
• Fortanier, F. and Sarrazin, K. (2016) ‘Balanced Merchandise Trade Statistics: Version 1’, Paper presented at the OECD WPTGS meeting, COTE: STD/CSSP/WPTGS(2016)18.
• Francois, J. and Pindyuk, O. (2013) ‘Consolidated Data on International Trade in Services v8.9’, IIDE Discussion paper 20130101.
• Head, K., and Mayer, T. (2014) "Gravity Equations: Workhorse, Toolkit, and Cookbook", chapter 3 in Gopinath, G, E. Helpman and K. Rogoff (eds), vol. 4 of the Handbook of International Economics, Elsevier: 131-195.
• OECD and WTO Services Databases
• Santos Silva, J.M.C. and Tenreyro, S. (2006) ‘The Log of Gravity’, The Review of Economics and Statistics, 88(4): 641-658.
• World Bank Services Database
Literature
25