Embed Size (px)
DESCRIPTION
Overall Equipment Effectiveness(OEE)A General Discussion on its Application and Benefits
Citation preview
Overall Equipment Effectiveness(OEE)
A General Discussion on its Application and Benefits
© 2001-2009 Capstone Metrics LLC
www.capstonemetrics.com

© 2001-2009 Capstone Metrics LLC www.capstonemetrics.com Page 2
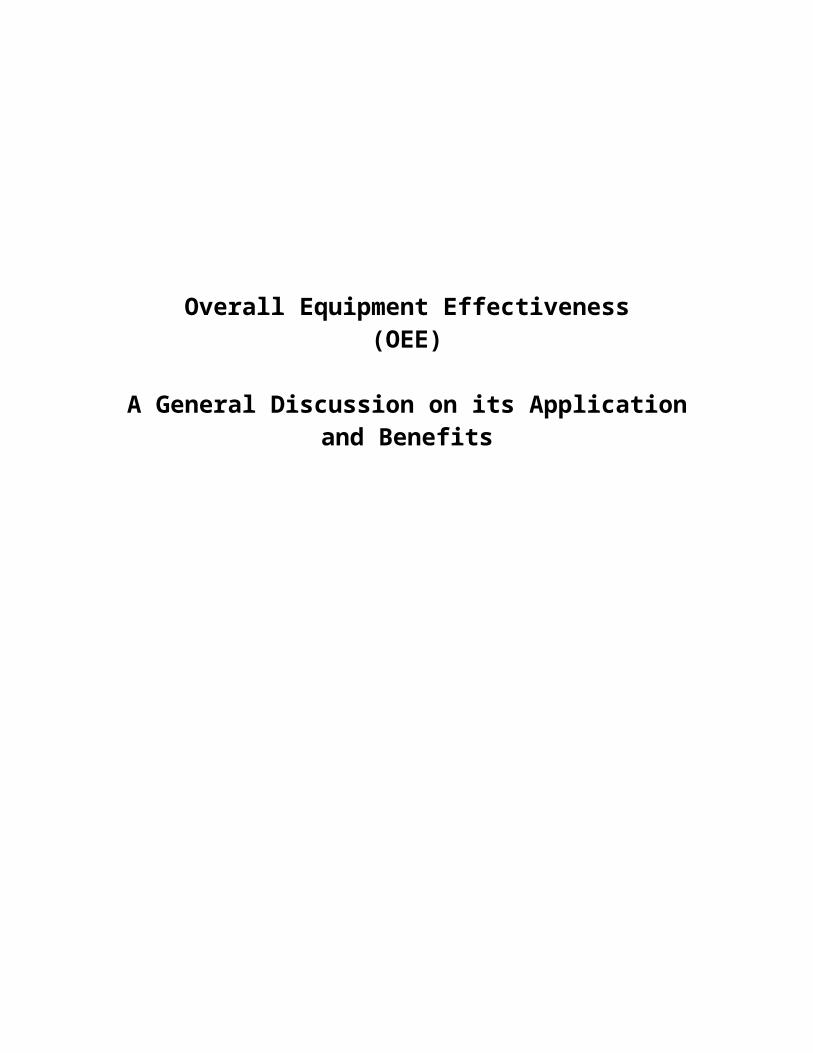
Table of Contents
Overview of the System of OEE Metrics..............................................................................3What is OEE....................................................................................................................3The Two Top-Level Metrics............................................................................................3The Four Underlying Metrics..........................................................................................3Visualizing OEE/TEEP by use of a Cascade Chart.........................................................4
Benefits of OEE / TEEP Management................................................................................6Improved Profitability.....................................................................................................6Increased Customer Satisfaction......................................................................................6Continuous Improvement Driver.....................................................................................7
Implementation of OEE / TEEP Management....................................................................8Setting Goals for all Key Metrics....................................................................................8Access to Information; the Cornerstone for Improvement..............................................8Continuous Improvement – All the Time........................................................................8
The OEE Information Model.............................................................................................10Standard Performance Rates..........................................................................................10Capture of Specific Losses (Downtime & Scrap)..........................................................10Entity Hierarchy.............................................................................................................10
OEE Information Challenges.............................................................................................12Data Capture and Storage..............................................................................................12Tailoring OEE Management to the Existing Data Model.............................................12
Calculations for OEE and TEEP........................................................................................14OEE (Overall Equipment Effectiveness).......................................................................14TEEP (Total Effective Equipment Performance)..........................................................14Loading..........................................................................................................................14Availability....................................................................................................................15Performance...................................................................................................................15Quality...........................................................................................................................15
© 2001-2009 Capstone Metrics LLC www.capstonemetrics.com Page 3
Overview of the System of OEE Metrics
What is OEEIn the most general sense, OEE (Overall Equipment Effectiveness) can be described as a universally accepted set of metrics that bring clear focus to the key success drivers for manufacturing enterprises. The OEE strategy is considered “best practice” and dovetails well with the Lean Manufacturing philosophy. In fact, the OEE set of metrics can provide the key indicators of progress on the Lean journey.
OEE should not be viewed as a fad or flavor of the month; the measurement technique has been in practice for many years, albeit with a narrower purpose. Historically, OEE was used as a top-level summary view of capacity and it’s utilization. In recent years it has reappeared but with a more valuable multi-level view of the business, placing emphasis on the underlying issues that limit performance. The resurgence of OEE is doubtless related to its ability to plainly portray the opportunities for improvement that exist for all manufacturers.
Functionally, these metrics provide the basis by which excellent manufacturers may systematically direct their business towards attainment of critical objectives…
Ever-Improving Operating Margins Optimized Competitive Position Maximized Utilization of Capital
More specifically, OEE can be best illustrated by a brief discussion of the six metrics that comprise the system. The hierarchy consists of two top-level measures and four underlying measures.
The Two Top-Level MetricsOverall Equipment Effectiveness (or OEE) and Total Effective Equipment Performance (or TEEP) are two closely related measurements that report the overall utilization of facilities, time and material for manufacturing operations. These top view metrics directly indicate the gap between actual and ideal performance.
Overall Equipment Effectiveness (or OEE) quantifies how well a manufacturing unit performs relative to its designed capacity, during the periods when it is scheduled to run.
Total Effective Equipment Performance (or TEEP) measures OEE effectiveness against calendar hours, i.e.: 24 hours per day, 365 days per year.
The Four Underlying MetricsIn addition to the above measures, there are four underlying metrics that provide understanding as to why and where the OEE and TEEP performance gaps exist. A comprehensive OEE measurement system, such as OEE Management by Capstone Metrics, allows this data to be the primary driver for improvement at all levels of the enterprise.
The measurements are described below: Loading: The portion of the TEEP Metric that represents the percentage of total calendar
time that is actually scheduled for operation. Availability: The portion of the OEE Metric represents the percentage of scheduled time
© 2001-2009 Capstone Metrics LLC www.capstonemetrics.com Page 4
that the operation is available to operate. Often referred to as Uptime. Performance: The portion of the OEE Metric represents the speed at which the Work
Center runs as a percentage of its designed speed. Quality: The portion of the OEE Metric represents the Good Units produced as a
percentage of the Total Units Started. Commonly referred to as First Pass Yield.
Visualizing OEE/TEEP by use of a Cascade ChartTo more clearly understand the metrics and their roles, a Cascade Chart is useful. An example of comprehensive OEE/TEEP presentation is shown below in a sample report from Capstone Metrics OEE Management Software.
Sample Report from Capstone Metrics OEE Management Software 2001-2007
The left three bars indicate what is presented to the production team in terms of scheduled time and/or booked business volume. This combination is also referred to as Loading.
The three bars on the right side display how effectively that scheduled capacity is utilized. This is the OEE performance. Note that the blue OEE Goal Line depicts plant OEE targets based on the actual Loading.
In total, the six bars signify the progressive erosion of ideal capacity and the categories of loss that are responsible. The remaining utilized capacity, after losses, is reflected by the TEEP metric. It can now be seen that TEEP = Loading x OEE.
© 2001-2009 Capstone Metrics LLC www.capstonemetrics.com Page 5
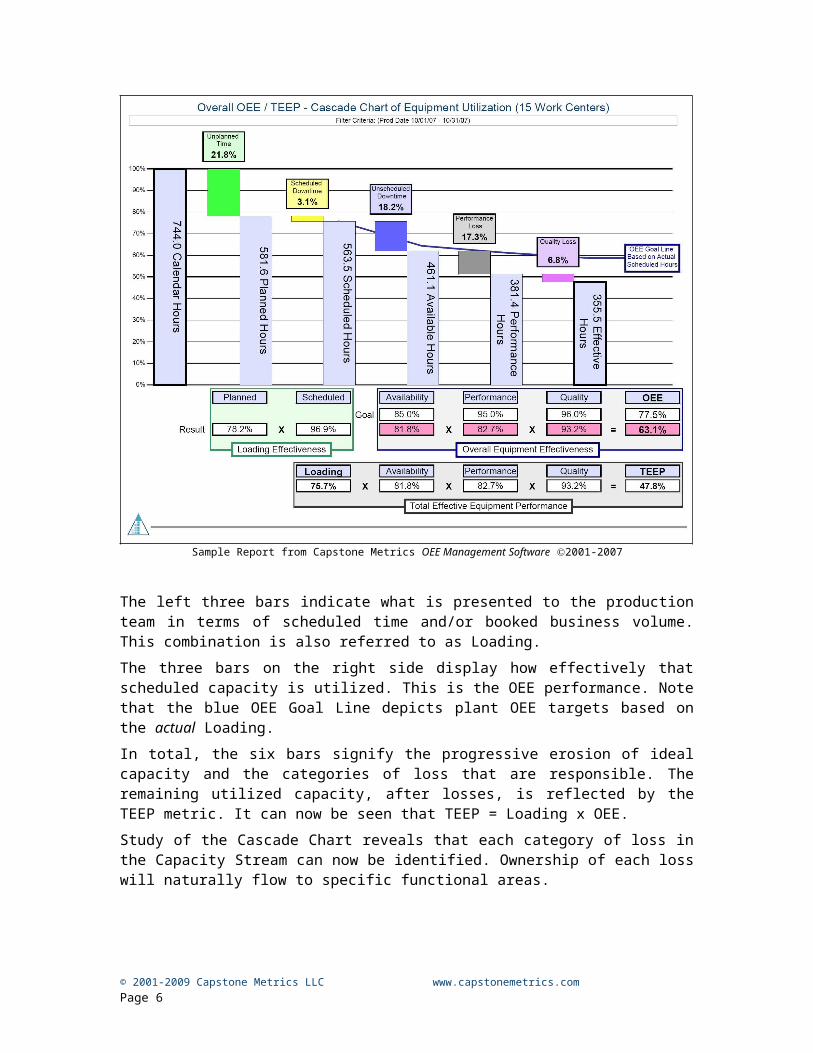
Study of the Cascade Chart reveals that each category of loss in the Capacity Stream can now be identified. Ownership of each loss will naturally flow to specific functional areas.
© 2001-2009 Capstone Metrics LLC www.capstonemetrics.com Page 6

Benefits of OEE / TEEP ManagementOEE Management means much more than posting a monthly scorecard. Unfortunately, many companies attempt to perform top-level OEE calculations as a stand-alone key success metric, but without the ability to say much more about it.
An optimal implementation of OEE Management will inherently provide the structure and tools to drive the key results in favorable directions. The result will be improvements to the overall business and manufacturing processes as the organization strives to push the OEE metrics up.
Improved Profitability1. Reduced Manufacturing Cost – Driving variable costs down through waste reduction…
With a properly implemented OEE/TEEP measurement strategy, all levels of the organization have clear visibility to a universal scorecard as well as extensive cause detail for each performance gap. This ability allows leadership to put all players on the same team, systematically addressing the top causes of waste, and then proceeding down to the next item.
The result will be visible in improved variable costs and higher margins.
2. Take full advantage of Capital – Driving overhead costs down by utilization improvement…
The TEEP metric directly relates the utilization of capital equipment and facilities. When an operation fails to perform at planned or designed capacity, the result is that fixed cost allocation to each part produced must increase. The ideal target for TEEP should reflect an operation that runs 24 hours per day 365 days per year, and runs at world class OEE, say 85%.
Although ideal TEEP may not always be attainable, it must persistently remain on the radar screen. Generally operations management is challenged to deliver excellent OEE results. Given the OEE results, it is now up to senior leadership to take the steps necessary to achieve ideal TEEP.
Strategies for improving TEEP will target the Loading Metric and are based on a combination of increased sales volumes and/or consolidation of manufacturing capacity.
3. Reduction of Working Capital – Driving inventories down as processes improve…
It is commonly accepted that the primary purpose of work in process and finished goods inventories is to provide layers of protection against failures in the manufacturing processes. Successful Lean Manufacturing initiatives directly improve the reliability and responsiveness of these processes. Stated more directly, drive OEE improvements, then go back and reduce inventory targets accordingly. These reductions lead to immediate favorable cash flow as well as the reduction of associated carrying cost and property tax.
Increased Customer SatisfactionSuccessful realization of OEE Management techniques will lead to improvements of manufacturing processes on many fronts. The process characteristics that are most transparent to customers are throughput and quality. Throughput capability is readily visible via a supplier’s ability to deliver on time – every time. External quality, the quality issues seen by the customer,
© 2001-2009 Capstone Metrics LLC www.capstonemetrics.com Page 7
is generally accepted to be proportional to internal quality. Therefore, any improvement in internal reject rates will result in similar improvement as viewed by the customer. This relationship is valid regardless of attempts to protect the customer through extra inspection.
Continuous Improvement DriverThe aim of instilling the desire and impetus to improve the business is one that is difficult to accomplish. In reality, most organizations tend to easily fall back to the tried and true method of waiting until something breaks. If ownership for continuous improvement is to be passed to the responsible individuals and groups, then the results of their efforts must be highly visible and should be presented relative to improvement goals.
A comprehensive OEE Management strategy provides this needed framework by acting as the final arbiter of manufacturing success measures and speaking a common language across department and facility lines.
In addition to providing the key results, the best OEE methodologies will also provide a vast amount of underlying information as to when and where the waste is occurring. This access to the pulse of the process provides the path to improvement, as well as making day-to-day troubleshooting much more efficient and effective.
© 2001-2009 Capstone Metrics LLC www.capstonemetrics.com Page 8
Implementation of OEE / TEEP Management
Setting Goals for all Key MetricsDuring the last decade, much was written regarding the fact that setting numerical goals can be the cause of sub-optimization, or even sandbagging. Fortunately, this trend has passed and current philosophy, particularly applied to OEE, recognizes the critical nature of knowing where the business needs to be and pushing hard to attain that end. The reality of today’s manufacturing is that worldwide competition will quickly cull out the players who are not able to stay with the pack.
A successful OEE / TEEP Management system will incorporate goals for each of the key metrics. Goals are not static numbers but rather a moving target that clearly emphasizes the need for continuous improvement. Continuous improvement, then, becomes not an optional activity but is a key responsibility for each person in the organization.
Access to Information; the Cornerstone for ImprovementClearly the most critical factor in being able to improve any business performance is to have access to timely and focused information. In addition to the above statement, the information must be tailored for the organizational level at which it is to be used. The challenge then becomes having access to timely, accurate data at a level of detail that corresponds to the task. Senior leadership must see the forest, but must have the optional capability to find the trees. Floor level personnel, conversely must clearly see the detailed measures for which they are responsible.
Historically, these varying levels of information have come from different sources, and therefore, do not present the same picture. A properly integrated system of OEE/TEEP information must present data relevant all organizational levels from top to bottom.
1. Typical Enterprise Level Scorecard data: OEE / TEEP Trended by Month – relative to Goals
2. Internal Plant / Department Level Communication OEE / Availability / Performance / Quality Trended by Day or Week – relative to Goals Trended Pareto charting for most significant loss causes
3. Detailed Information for Problem Solving Paynter Chart depictions of Waste Causes - Scrap and Downtime Crosstab presentation of Waste Causes by Work Center, Part Number, or Order Number Trended Performance information Detailed History Reports showing every event
Continuous Improvement – All the TimeThe above discussion highlights the critical nature of two attributes: Clear Goals and Extensive Information. With these in place, CI (Continuous Improvement) is almost a natural extension. Even at best, though, the CI journey will not thrive without some mechanisms intended to keep the efforts moving. Although much information is in print regarding Lean Manufacturing and the CI process, the following key attributes illustrate the critical nature of the information system that provides the basis for improvement.
© 2001-2009 Capstone Metrics LLC www.capstonemetrics.com Page 9
1. Periodic Review and AnalysisIt is the responsibility of leadership to provide focus on CI through periodic review of the results. This activity would generally include key members of the team and would consist of:
Review top-level OEE metrics vs. the goal lines. Failure to meet the goals triggers actions as discussed below.
Trend analysis of individual work centers and part numbers to identify any new unfavorable trends. Any unfavorable trend also creates an action item.
Search for proactive opportunities, typically directed at poor margin products and processes.
This monthly meeting should not take significant time but is critical to insuring that the process is ongoing and focused. A typical meeting might add 4 or 5 new action items.
2. Action Planning ProcessIn response to the direction of the periodic review team, another mid-level team now takes the responsibility for determining the appropriate actions to address the noted problem areas. Their charter is to perform further data analysis then determine the actions that are most appropriate to each issue. In the case of clearly defined problem areas, specific corrective actions may be directly assigned to individuals or groups. In the case of more complex problem areas, the Kaizen event is often an ideal option.
3. Kaizen EventsKaizen events are arguably the single most effective Lean technique for insuring that CI is a way of life. These events, often designed around a one week ‘blitz’ schedule, rapidly improve the targeted work center or cell. The Kaizen Team is deployed quickly and includes borrowed resources from Engineering, Operations, Maintenance, Quality and other groups.
The Kaizen toolbox is extensive with the ability to implement Cellular Manufacturing, Kanban or Pull Scheduling, Work Leveling, 5S, Poka-Yoke and Autonomation, Total Productive Maintenance, SMED (Single Minute Exchange of Die), One Piece Flow, Standardized Work, Visual Manufacturing, and many others. Kaizen, then, becomes the central method by which Lean principles are put in place with great speed and efficiency.
Generally, the action planning team will provide the specific focus areas for each particular Kaizen to insure that the event addresses the problem areas. A successful Kaizen will find solutions for the assigned issues but will go much further by delivering additional improvements.
Kaizen events should be occurring on a fixed schedule that is a function of the availability of resources to staff the teams. Given this schedule, the action planning team now need only focus each event in the directions that are of most value at the time.
In conclusion, Continuous Improvement will succeed when it is driven by reliable consistent data sources and is championed by leadership. The resulting benefit will be evident in persistent improving trends of the OEE metrics.
© 2001-2009 Capstone Metrics LLC www.capstonemetrics.com Page 10
The OEE Information ModelIn order to reliably and comprehensively make OEE data available to users throughout the organization, a carefully planned framework of data must exist.
Standard Performance RatesNeither OEE nor TEEP may be measured without clear performance standards for each combination of Part Number and Work Center. There must exist a table of standards that represent the best-case production rates, generally stated in units per hour. These rates should be based on engineered or designed capabilities. Engineering design information, when available, should provide the standard rate. Where engineered data does not exist, or is obsolete due to process changes, a time study is called for.
When establishing rates for work centers using several sequential steps, it is important that the standard reflects the bottleneck step. The bottleneck step is that which has the slowest rate and restricts the overall line rate.
A word of caution on standard rates: in the case where any work center posts a Performance metric greater than 100%, there is reason to go back and review its standard rate. Allowing use of an inflated Standard Rate hides real capacity that might otherwise be utilized. The Standard Rate, therefore, becomes the critical number to identify and understand for each combination of part number and work center.
Capture of Specific Losses (Downtime & Scrap)As mentioned earlier, OEE measurements, in and of themselves, offer little value without visibility to the underlying detail. Knowledge that equipment availability is draining 22% of capacity does nothing to facilitate improvement. With this in mind, a comprehensive OEE management strategy must include the tools to understand and address the specific problem areas and deficiencies.
Specific causes for Scrap and Downtime events must be captured and reported in a format that will lead to their improvement. Additionally a level of cause classification should exist such that analysis will conveniently indicate which general classifications are most significant.
A typical manufacturing operation should identify 20 – 30 specific causes for scrap losses and a similar amount for downtime causes. In addition, it is helpful for each of the common causes to fit into specific categories. This type of structure allows for the statement: “37% of our scrap is in the “Start-Up Scrap” category and the top three issues are…” or “We are experiencing only 78% Availability, with the number one category being “Equipment” and here’s the trended pareto of the specific issues…”
In conclusion, it is essential that a defined set of causes and general cause classifications exist and that they form the basis for all analysis. In the case of multi-plant OEE management, the opportunity to standardize this set of causes across the organization may exist. There are several benefits to using the standardized approach, most significant being the opportunity to compare operations, and also the impetus for better collaboration between operations.
© 2001-2009 Capstone Metrics LLC www.capstonemetrics.com Page 11
Entity HierarchyTo provide complete capability for precise targeting of problem areas, a rational hierarchical structure must be in place. For a given manufacturing facility an optimal structure might be similar to:
1. Facility2. Department3. Work Cell or other rational grouping4. Work Center5. Part Number6. Work Order Number, Lot Number, etc
With the above structure in place, the continuous improvement process is jump-started since careful targeting of opportunities for improvement can be done quickly and easily.
A well-designed OEE Management system will go a step further by making the opportunities jump off the page!
© 2001-2009 Capstone Metrics LLC www.capstonemetrics.com Page 12
OEE Information Challenges
Data Capture and StorageSuccessful implementation of an OEE measurement system relies heavily on existence of a complete and timely dataset. When contemplating effective use of an OEE management strategy, some thought needs to be directed at data availability and its sources.
The methods used by organizations for collecting performance data cover a wide range of options. There is a continuum of strategies ranging from manual paper reporting to automated interfacing to the production machinery. There is no right approach to this challenge; it is largely a matter of what best fits a particular business.
Businesses vary widely as to what information is collected and where it can be found. In general, the information availability will fall into some combination of the following categories.
1. Currently Doesn’t Exist
In this case there is no formal data collection structure in place. This is a very common situation particularly as applied to downtime and scrap information.
2. Exists in Informal Systems
Production data and losses are collected manually and entered into some sort of homegrown information system. Normally this is accomplished using spreadsheets and or databases. Information from these systems is then used to produce charts and reports for the organization.
3. Resides in Legacy ERP (Enterprise Resource Planning) System
Many businesses use a central business system, or ERP, that integrates all facets of the business, including planning, manufacturing, sales, and marketing. The capability of an ERP to collect and process OEE-relevant information varies greatly depending on its vintage and implementation.
In conclusion, the data picture for any given organization can be expressed as a two-axis matrix of data locations and capture methods. In reality, most businesses would represent a hybrid with several points on the chart.
Tailoring OEE Management to the Existing Data ModelAt first glance the data challenge can appear daunting, and in fact, has deterred many businesses from properly implementing OEE Management. This concern over data issues and implementation is generally unfounded as is discussed below.
OEE Management software which is properly designed, can dovetail into nearly any existing data scenario. The required characteristics for this type of flexible and adaptable design include:
Network deployed to allow for access anywhere in the organization Capability for direct data entry, on shop floor or by clerical support Capability to import existing data from ERP, shop floor, or other sources Capability to export data for use by ERP, or for analysis
© 2001-2009 Capstone Metrics LLC www.capstonemetrics.com Page 13
ODBC Compliant making data accessible to other database applications
In summary, the system design should provide a very flexible information system that can easily receive external data as well as making its data available for other uses.
The functionality listed above insures that an OEE Management application can be implemented with the following advantages:
Low cost of installation and start-up, requires no additional hardware Extremely fast launch, typically a just few days Negligible installation or maintenance workload for IT Department Requires no redundant data entry, and is likely to reduce data entry cost Completely table driven insuring consistent and relevant data
OEE Management Software from Capstone Metrics LLC is an example of an OEE application that delivers all of the above functionality and benefits with a low cost purchase and fast track launch capability.
© 2001-2009 Capstone Metrics LLC www.capstonemetrics.com Page 14
Calculations for OEE and TEEPWhat follows is a detailed presentation of each of the six OEE / TEEP Metrics and examples of how to perform calculations. The calculations are not particularly complicated, but care must be taken as to standards that are used as the basis. Additionally, these calculations are valid at the work center or part number level but become more complicated if rolling up to aggregate levels.
OEE (Overall Equipment Effectiveness)OEE breaks the performance of a manufacturing unit into three separate but measurable components: Availability, Performance, and Quality. Each component points to an aspect of the process that can be targeted for improvement. OEE may be applied to any individual Work Center, or rolled up to Department or Plant levels. This tool also allows for drilling down for very specific analysis, such as a particular Part Number, Shift, or any of several other parameters.
It is unlikely that any manufacturing process can run at 100% OEE. Many manufacturers benchmark their industry to set a challenging target, 85% is not uncommon.
Calculation: OEE = Availability x Performance x QualityExample:A given Work Center experiences:
Availability of 86.7%.The Work Center Performance is 93.0%.Work Center Quality is 95.0%.OEE = 86.7% Availability x 93.0% Performance x 95.0% Quality = 76.6%
TEEP (Total Effective Equipment Performance)Where OEE measures effectiveness based on scheduled hours, TEEP measures effectiveness against calendar hours, i.e.: 24 hours per day, 365 days per year. TEEP, therefore, reports the 'bottom line' utilization of assets.
Calculation: TEEP = Loading x OEEExample:A given Work Center experiences
OEE of 76.67%.Work Center Loading is 71.4%TEEP = 71.4% Loading x 76.7% OEE = 54.8%
Stated another way, TEEP adds a fourth metric 'Loading'.TEEP = Loading x Availability x Performance x Quality
LoadingThe Loading portion of the TEEP Metric represents the percentage of time that an operation is scheduled to operate compared to the total Calendar Time that is available. The Loading Metric is a pure measurement of Schedule Effectiveness and is designed to exclude the effects how well that operation may perform.
Calculation: Loading = Scheduled Time / Calendar TimeExample:
A given Work Center is scheduled to run 5 Days per Week, 24 Hours per Day.
© 2001-2009 Capstone Metrics LLC www.capstonemetrics.com Page 15
For a given week, the Total Calendar Time is 7 Days at 24 Hours.Loading = (5 days x 24 hours) / (7 days x 24 hours) = 71.4%
AvailabilityThe Availability portion of the OEE Metric represents the percentage of scheduled time that the operation is available to operate. The Availability Metric is a pure measurement of Uptime that is designed to exclude the effects of Quality, Performance, and Scheduled Downtime Events.
Calculation: Availability = Available Time / Scheduled TimeExample:
A given Work Center is scheduled to run for an 8 hour (480 minute) shift.The normal shift includes a scheduled 30 minute break when the Work Center is expected to be down.The Work Center experiences 60 minutes of unscheduled downtime.Scheduled Time = 480 min - 30 min break = 450 MinAvailable Time = 450 min Scheduled - 60 min Unscheduled Downtime = 390 MinAvailability = 390 Avail Min / 450 Scheduled Min = 86.7%
PerformanceThe Performance portion of the OEE Metric represents the speed at which the Work Center runs as a percentage of its designed speed. The Performance Metric is a pure measurement of speed that is designed to exclude the effects of Quality and Availability.
Calculation: Performance = Actual Rate / Standard RateExample:
A given Work Center is scheduled to run for an 8 hour (480 minute) shift with a 30 minute scheduled break.Available Time = 450 Min Sched - 60 Min Unsched Downtime = 390 MinutesThe Standard Rate for the part being produced is 40 Units/Hour.The Work Center produces 242 Total Units during the shift. Note: The basis is Total Units, not Good Units. The Performance metric does not penalize for Quality.Actual Rate = 242 Units / (390 Avail min / 60 min/hr) = 37.2 Units/HourPerformance = 37.2 Units/Hour / 40 Units/Hour = 93.0%
QualityThe Quality portion of the OEE Metric represents the Good Units produced as a percentage of the Total Units Started. The Quality Metric is a pure measurement of Process Yield that is designed to exclude the effects of Availability and Performance.
Calculation: Quality = Good Units / Units StartedExample:
A given Work Center produces 230 Good Units during a shift.242 Units were started in order to produce the 230 Good Units.Quality = 230 Good Units / 242 Units Started = 95.0%
© 2001-2009 Capstone Metrics LLC www.capstonemetrics.com Page 16