Embed Size (px)
Citation preview
THE JOURNAL OF BIOLOGICAL CHEMISTRY 0 1987 by The American Society of Biological Chemists, Inc.
The Function of Catalase-bound NADPH*
Vol. 262, No. 2, Iesue of January 15, p : %I+, 1987 nnted m U.S.A.
(Received for publication, July 29,1986)
Henry N. Kirkman$, Silvana Galianoe, and Gian F. Gaetanie From the $Biological Sciences Research Center, University of North Carolina, Chapel Hill, North Carolina 27514 and the SIstituto Scientijico di Medicina Interna, University of Genoa, 16132 &ma, Ztaly
Catalase (H202:H202 oxidoreductase, EC 1.11.1.6) is of historical interest for having been the subject of some of the earliest investigations of enzymes. A fea- ture of catalase that has been poorly understood for several decades, however, is the mechanism by which catalase remains active in the presence of its own sub- strate, hydrogen peroxide. We reported recently that catalase contains tightly bound NADPH. The present study with bovine and human catalase revealed that NADPH both prevents and reverses the accumulation of compound 11, an inactive form of catalase that is generated slowly when catalase is exposed to hydrogen peroxide. Since the effect of NADPH occurs even at NADPH concentrations below 0.1 g ~ , the protective mechanism is likely to operate in vivo. This discovery of the role of catalase-bound NADPH brings a unity to the concept of two different mechanisms for disposing of hydrogen peroxide (catalase and the glutathione reductsse/peroxidase pathway) by revealing that both mechanisms are dependent on NADPH.
During studies of human erythrocytes, earlier investigators noticed that activity of catalase (H202:H202 oxidoreductase, EC 1.11.1.6) declined under conditions in which erythrocytes or hemolysates had not only exposure to peroxides but also limitations in ability to generate NADPH (1, 2). The cause for the decline in activity was unknown. We recently studied the role of NADP-binding proteins in the regulation of intra- cellular glucose-6-phosphate dehydrogenase (D-glucose 6- phosphate:NADP+ 1-oxidoreductase, EC 1.1.1.49) (3, 4). Those studies led to the unexpected finding that catalase contains tightly bound NADPH ( 5 ) . Each tetrameric molecule of the enzyme from human erythrocytes and bovine liver was found to bind four molecules of NADPH with a dissociation constant for NADPH that was less than 10 nM. The order of affinity was NADPH > NADH >> NADP+ > NAD+. Removal of the catalase-bound NADP did not abolish the ability of the enzyme to catalyze the conversion of HZO2 to oxygen and water during brief assays ( 5 ) . During lengthy exposure of catalase to H202 through gaseous diffusion, however, the catalase-bound NADPH became oxidized to NADP+, and activity of the catalase fell to about one-third of the initial activity. The presence of glucose-6-phosphate dehydrogenase and glucose 6-phosphate served to keep the catalase-bound NADP fully reduced and to keep the catalase fully active ( 5 ) . As a consequence of these observations, one of the three hypotheses we proposed for the role of catalase-bound
* This work was supported by National Institutes of Health Grants AM-29864 and HD-03110 and by Consiglio Nazionale delle Ricerche Grants PF 85.01411.51 and 86.00083.51. The costs of publication of this article were defrayed in part by the payment of page charges. This article must therefore be hereby marked ‘‘duertkement’’ in accordance with 18 U.S.C. Section 1734 solely to indicate this fact.
NADPH was that NADPH protects the enzyme against in- activation by its own substrate, H20, (5) . Simultaneously with the submission of the present report, Jouve (6) reported that dithioerythritol induced changes in the absorption spectrum of bovine catalase comparable to the formation of compound 11, an inactive form of catalase (6). Some reversal of the change was achieved with NADPH and NADH at micromolar concentrations. They suggested that NADPH may be involved in reversing the inactivation of catalase by its substrate, H20,. The effect of NADPH, however, was only partial; and in porcine catalase, for example, thiol compounds are known to induce changes in the activity and absorption spectrum of catalase that do not represent conversion of the active enzyme to compound I1 (7).
This report confirms the hypothesis that NADPH protects catalase against inactivation by H20z and offers certain details on how the protection may be accomplished. Except for inclu- sion of observations on the presence and function of NADP, some of the experiments of this report are repetitions of experiments 36 years ago by Britton Chance (8). He provided one of the earliest identifications of an enzyme-substrate complex, and his efforts, along with those of D. Keilin, E. F. Hartree, and P. Nicholls, led to much of the present under- standing of the mechanism of action of catalase (8-10). In considerations of the action of catalase to follow, only the substrates of the present study (Hz02 and ethanol) are in- cluded. Compound 111, which did not seem to be formed in the present study, is omitted from consideration.
As the first step in the catalase cycle, interaction between H202 and ferricatalase (catalase before exposure to H20z) causes the enzyme to become compound I, a spectroscopically distinct and enzymically active form of catalase. Reaction of compound I with a second molecule of H202 results in ferri- catalase, 02, and water. An alternative substrate for this second part of the cycle is ethanol, which reacts with com- pound I to form ferricatalase, acetaldehyde, and water. Al- though the rate constant is much greater with H20, than with ethanol, the latter can be added to a concentration in vitro that is several orders of magnitude higher than that of H202 in uiuo and in the experiments to follow. Under this condition, compound I is almost imperceptible, whereas detectable amounts of compound 1 are present when catalase has H202 as the only substrate. Whenever compound I is present, the enzyme undergoes inactivation by the gradual conversion of compound I to compound I1 through a one-electron reduction of compound I by unidentified reductants (10). Compound I1 is an inactive form of catalase that has a different absorption spectrum from that of ferricatalase and compound I. A de- crease in the concentration of compound I, from either (a) the cessation in generation of H202 or (b) the addition of ethanol, results in spontaneous reactivation of catalase by an apparent one-electron reduction of compound I1 to ferricata- lase. As with the formation of compound 11, the nature of the
660
Function of Catalase-bound NADPH 661
reducing substances is poorly understood. The reaction rate varies with concentrations of catalase in a manner suggesting that the reducing substances are within the molecule of cat- alase itself (10). These various reactions involving catalase are illustrated and further described under "Discussion."
EXPERIMENTAL PROCEDURES
A homogeneous preparation of human catalase was obtained from erythrocytes by the method of Morikofer-Zwez et al. (111, as previ- ously described (5). The final preparation had a specific activity of 3.5 X 10' M" and had 4 heme groups and 3.5 molecules of NADPH per molecule of catalase. Crystalline catalase from bovine liver was a preparation from Boehringer Mannheim. The following sequence allowed the crystals to be dissolved in dilute phosphate buffer. To 6 ml of a Krebs-Ringer solution/Tes' buffer, pH 7.4 (3), were added 3.2 mg of the bovine catalase. The suspension was mixed and then allowed to stand at room temperature for 10 min, during which time the crystals dissolved. The catalase was concentrated to a volume of 0.05-0.15 ml by centrifugation at 2 "C for 10 min at 1,000 X g in a CF-25 ultrafiltration cone (Amicon). The concentrate was resus- pended in 6 ml of 0.01 M (sodium) phosphate buffer, pH 6.5, again ultrafiltered, then adjusted to a volume of 0.8 ml. Particles were removed by centrifugation at 16,000 X g for 10 min. NADPH-satu- rated bovine catalase was prepared in the same manner except that NADPH was present in the 6 ml of Krebs-Ringer solution/Tes buffer and the 6 ml of phosphate buffer a t a final concentration of 1 b ~ . The addition of phosphate buffer, without NADPH, to the concen- trate after the second centrifugation brought the volume to 0.8 ml, and the unbound NADPH content to 0.027 mol of NADPH per mole of catalase. The dissolved bovine catalase (unexposed to NADPH) had a specific activity of 2.1 X lo7 s-' M" and had 3.1 molecules of NADPH per molecule of catalase. Extinction coefficients of the catalase indicated that each molecule contained only 3 heme groups, as has been observed with mammalian liver catalase by others (8, 10). Yeast glucose-6-phosphate dehydrogenase was obtained from Boehringer Mannhein. Glucose oxidase (6-D-gluc0se:oxygen l-oxi- doreductase, EC 1.1.3.4) from Aspergillus niger was a product of Sigma.
The addition of glucose oxidase and glucose to solutions of catalase served to expose the catalase to Hz02 at steady-state concentrations of H,O, as described by Chance (8). Preliminary assays of the glucose oxidase permitted a choice to be made of the concentration of glucose oxidase that would allow continuous generation of H202 at the desired rate. The assays for glucose oxidase were carried out under conditions identical to those for the incubations with catalase: 0.01 M sodium phosphate buffer, pH 6.5,2 mM glucose at 37 "C in a reaction volume of 500 pl in a cuvette having a light path of 1 cm and a width of 4 mm. In addition, the assay mixture contained horseradish peroxidase, phenol, and 4-aminoantipyrine as specified for the spectrophotomet- ric determination of H,02 by the method of Green and Hill (12). Under these conditions, the rate of generation of H202 was constant for 1 h at concentrations of glucose oxidase up to 6.7 nM, which resulted in a generation rate of 2 nmol ml" min". Assays for catalase activity were by observation of decreasing absorbance of the H202 at 240 nm (13).
NADP and NADPH were assayed by the enzymic cycling methods of Burch et al. (14) and of Lowry and Passonneau (15), as described earlier (16). Readings of blanks in the cycling assay indicated that the exchangeable NADP content of the glucose-6-phosphate dehy- drogenase was less than 0.8 pmol/pg. Determination of 6-phosphoglu- conate was by a fluorometric and enzymic method (15).
RESULTS
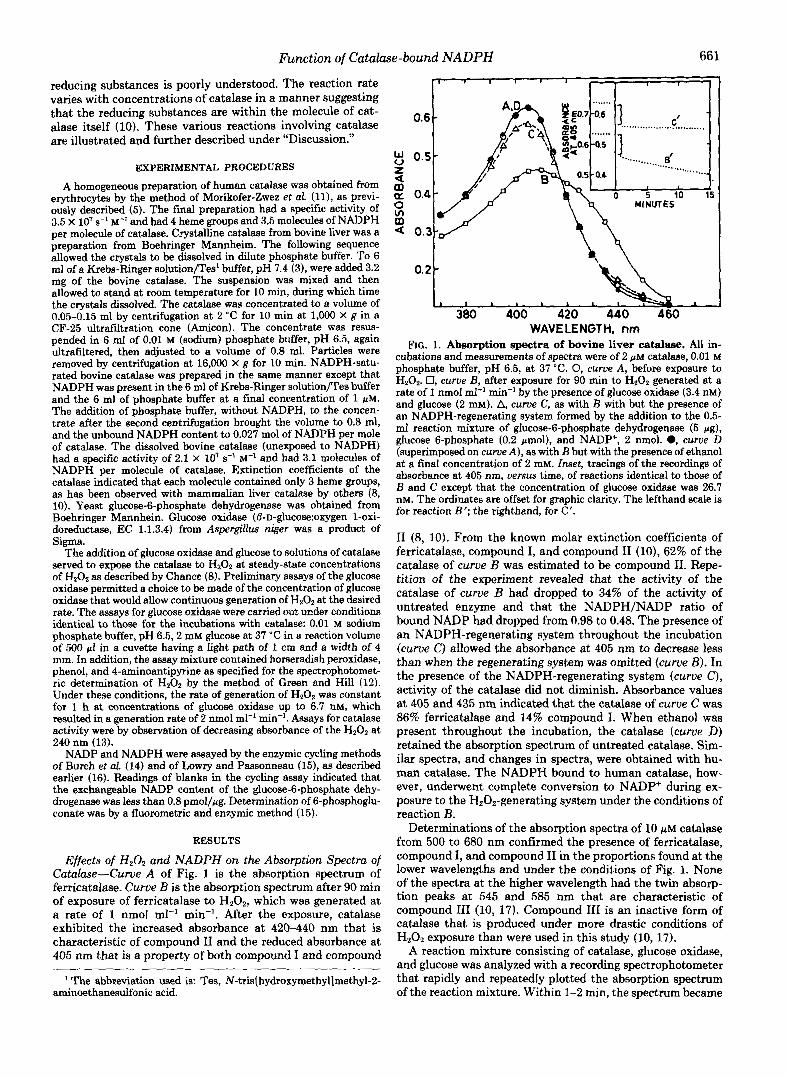
Effects of H202 and NADPH on the Absorption Spectra of Cutahe-Curue A of Fig. 1 is the absorption spectrum of ferricatalase. Curve B is the absorption spectrum after 90 rnin of exposure of ferricatalase to HZ02, which was generated at a rate of 1 nmol ml" min". After the exposure, catalase exhibited the increased absorbance at 420-440 nm that is characteristic of compound I1 and the reduced absorbance at 405 nm that is a property of both compound I and compound
The abbreviation used is: Tes, N-tris[hydrosymethyl]methy1-2- aminoethanesulfonic acid.
0.6
0.5 z a m
m e 0.3
K 0.4 0 VI
0.2 - I S , , L L L I
380 400 420 440 460 WAVELENGTH, nm
FIG. 1. Absorption spectra of bovine liver catalase. All in- cubations and measurements of spectra were of 2 pM catalase, 0.01 M phosphate buffer, pH 6.5, at 37 "C. 0, curue A , before exposure to HZ02. 0, curue E, after exposure for 90 min to H202 generated at a rate of 1 nmol ml" min" by the presence of glucose oxidase (3.4 nM) and glucose (2 mM). A, curve C, as with B with but the presence of an NADPH-regenerating system formed by the addition to the 0.5- mf reaction mixture of glucose-6-phosphate dehydrogenase (5 pg), glucose 6-phosphate (0.2 pmol), and NADP', 2 nmol. 0, curue D (superimposed on curue A ) , as with E but with the presence of ethanol at a final concentration of 2 mM. [wet, tracings of the recordings of absorbance at 405 nm, versus time, of reactions identical to those of E and C except that the concentration of glucose oxidase was 26.7 nM. The ordinates are offset for graphic clarity. The lefthand scale is for reaction B'; the righthand, for C'.
I1 (8, 10). From the known molar extinction coefficients of ferricatalase, compound I, and compound I1 (lo), 62% of the catalase of curue B was estimated to be compound 11. Repe- tition of the experiment revealed that the activity of the catalase of curve B had dropped to 34% of the activity of untreated enzyme and that the NADPH/NADP ratio of bound NADP had dropped from 0.98 to 0.48. The presence of an NADPH-regenerating system throughout the incubation (curve C) allowed the absorbance at 405 nm to decrease less than when the regenerating system was omitted (curue B). In the presence of the NADPH-regenerating system (curue C), activity of the catalase did not diminish. Absorbance values at 405 and 435 nm indicated that the catalase of curue C was 86% ferricatalase and 14% compound I. When ethanol was present throughout the incubation, the catalase (curue D) retained the absorption spectrum of untreated catalase. Sim- ilar spectra, and changes in spectra, were obtained with hu- man catalase. The NADPH bound to human catalase, how- ever, underwent complete conversion to NADP+ during ex- posure to the Ha02-generating system under the conditions of reaction B.
Determinations of the absorption spectra of 10 WM catalase from 500 to 680 nm confirmed the presence of ferricatalase, compound I, and compound I1 in the proportions found at the lower wavelengths and under the conditions of Fig. 1. None of the spectra at the higher wavelength had the twin absorp- tion peaks at 545 and 585 nm that are characteristic of compound I11 (10, 17). Compound 111 is an inactive form of catalase that is produced under more drastic conditions of H,02 exposure than were used in this study (10,17).
A reaction mixture consisting of catalase, glucose oxidase, and glucose was analyzed with a recording spectrophotometer that rapidly and repeatedly plotted the absorption spectrum of the reaction mixture. Within 1-2 min, the spectrum became
662 Function of Catalase-bound NADPH
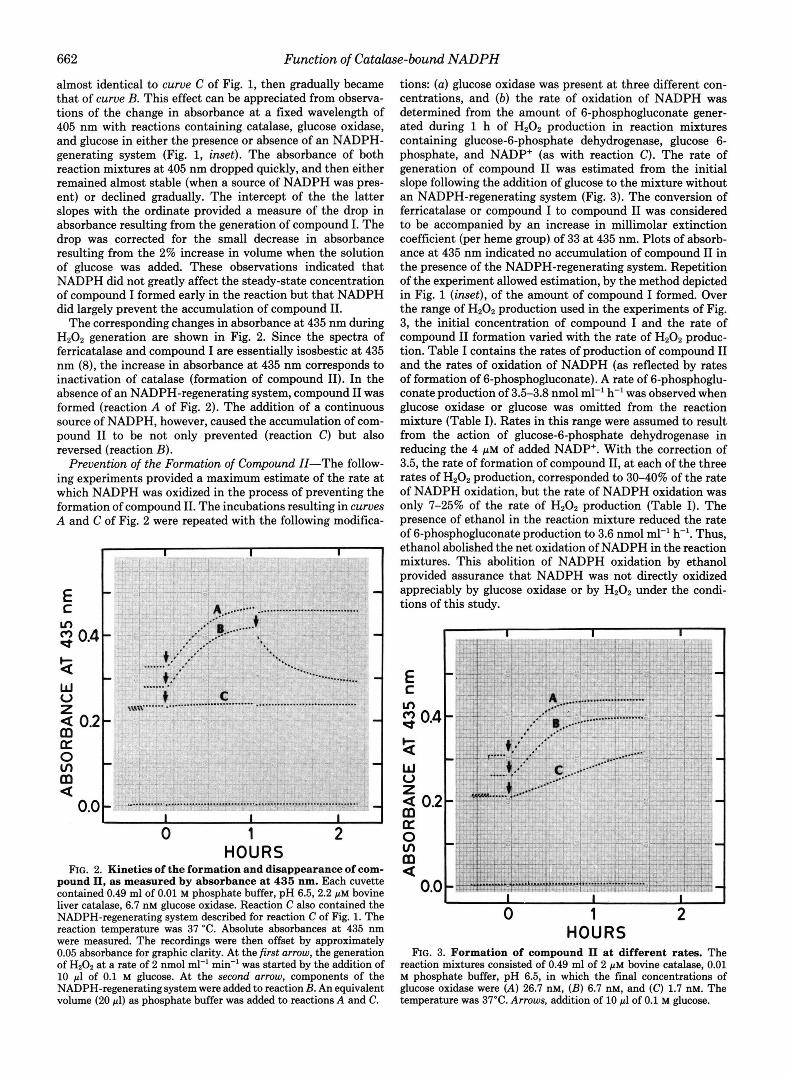
almost identical to curve C of Fig. 1, then gradually became that of curve B. This effect can be appreciated from observa- tions of the change in absorbance at a fixed wavelength of 405 nm with reactions containing catalase, glucose oxidase, and glucose in either the presence or absence of an NADPH- generating system (Fig. 1, inset). The absorbance of both reaction mixtures at 405 nm dropped quickly, and then either remained almost stable (when a source of NADPH was pres- ent) or declined gradually. The intercept of the the latter slopes with the ordinate provided a measure of the drop in absorbance resulting from the generation of compound I. The drop was corrected for the small decrease in absorbance resulting from the 2% increase in volume when the solution of glucose was added. These observations indicated that NADPH did not greatly affect the steady-state concentration of compound I formed early in the reaction but that NADPH did largely prevent the accumulation of compound 11.
The corresponding changes in absorbance at 435 nm during H202 generation are shown in Fig. 2. Since the spectra of ferricatalase and compound I are essentially isosbestic at 435 nm (8), the increase in absorbance at 435 nm corresponds to inactivation of catalase (formation of compound 11). In the absence of an NADPH-regenerating system, compound I1 was formed (reaction A of Fig. 2). The addition of a continuous source of NADPH, however, caused the accumulation of com- pound I1 to be not only prevented (reaction C) but also reversed (reaction B).
Prevention of the Formation of Compound 11-The follow- ing experiments provided a maximum estimate of the rate at which NADPH was oxidized in the process of preventing the formation of compound 11. The incubations resulting in curves A and C of Fig. 2 were repeated with the following modifica-
: [ 0.4
z a 0.2 m U
" m a - 0.01
I I I I I 0 1 2
HOURS FIG. 2. Kinetics of the formation and disappearance of com-
pound 11, as measured by absorbance at 435 nm. Each cuvette contained 0.49 ml of 0.01 M phosphate buffer, pH 6.5,2.2 p~ bovine liver catalase, 6.7 nM glucose oxidase. Reaction C also contained the NADPH-regenerating system described for reaction C of Fig. 1. The reaction temperature was 37 "C. Absolute absorbances at 435 nm were measured. The recordings were then offset by approximately 0.05 absorbance for graphic clarity. At the first arrow, the generation of Hz02 at a rate of 2 nmol ml" min" was started by the addition of 10 pl of 0.1 M glucose. At the second arrow, components of the NADPH-regenerating system were added to reaction B. An equivalent volume (20 pl) as phosphate buffer was added to reactions A and C.
tions: (a) glucose oxidase was present at three different con- centrations, and (b) the rate of oxidation of NADPH was determined from the amount of 6-phosphogluconate gener- ated during 1 h of Hz02 production in reaction mixtures containing glucose-6-phosphate dehydrogenase, glucose 6- phosphate, and NADP+ (as with reaction C). The rate of generation of compound I1 was estimated from the initial slope following the addition of glucose to the mixture without an NADPH-regenerating system (Fig. 3). The conversion of ferricatalase or compound I to compound I1 was considered to be accompanied by an increase in millimolar extinction coefficient (per heme group) of 33 at 435 nm. Plots of absorb- ance at 435 nm indicated no accumulation of compound I1 in the presence of the NADPH-regenerating system. Repetition of the experiment allowed estimation, by the method depicted in Fig. 1 (inset), of the amount of compound I formed. Over the range of H202 production used in the experiments of Fig. 3, the initial concentration of compound I and the rate of compound I1 formation varied with the rate of H202 produc- tion. Table I contains the rates of production of compound I1 and the rates of oxidation of NADPH (as reflected by rates of formation of 6-phosphogluconate). A rate of 6-phosphoglu- conate production of 3.5-3.8 nmol ml-' h" was observed when glucose oxidase or glucose was omitted from the reaction mixture (Table I). Rates in this range were assumed to result from the action of glucose-6-phosphate dehydrogenase in reducing the 4 ~ C I M of added NADP+. With the correction of 3.5, the rate of formation of compound 11, at each of the three rates of H202 production, corresponded to 30-40% of the rate of NADPH oxidation, but the rate of NADPH oxidation was only 7-25% of the rate of H202 production (Table I). The presence of ethanol in the reaction mixture reduced the rate of 6-phosphogluconate production to 3.6 nmol ml" h-'. Thus, ethanol abolished the net oxidation of NADPH in the reaction mixtures. This abolition of NADPH oxidation by ethanol provided assurance that NADPH was not directly oxidized appreciably by glucose oxidase or by H202 under the condi- tions of this study.
i [ 0.4
I"
W V
a
5 0.2- m a
m a 0 Ln
0.0 - I I I I I
0 1 2 HOURS
FIG. 3. Formation of compound I1 at different rates. The reaction mixtures consisted of 0.49 ml of 2 pM bovine catalase, 0.01 M phosphate buffer, pH 6.5, in which the final concentrations of glucose oxidase were (A) 26.7 nM, (B) 6.7 nM, and (C) 1.7 nM. The temperature was 37°C. Arrows, addition of 10 pl of 0.1 M glucose.
Function of Catalase-bound NADPH 663 TABLE I
Rates of formation of compound ZZ and of oxidation of NADPH at various rates of generation of H202
Rates of formation of compound I1 were calculated from the initial slopes for reactions in Fig. 3. Rates of oxidation of NADPH were determined from the rates of 6-phosphogluconate formation during 1 h in reaction mixtures identical to those of Fig. 3 but also containing the NADPH-regenerating system (Fig. 1).
Rates of formation Rates of oxidation Glucose oxidase
H202 Compound I1 NADPH, total NADPH, net nht nmol ml" h" nmol ml-' h-l 0 0 0 3.5 0.0 1.7 30 2.3 11.0 7.5 6.7 120 6.7 24.3 20.8
26.7 480 10.2 38.0 34.5 26.7" 0 0 3.8 0.3 6.7' 120 0 3.6 0.1
a Glucose omitted. * Ethanol present at a final concentration of 2 mM.
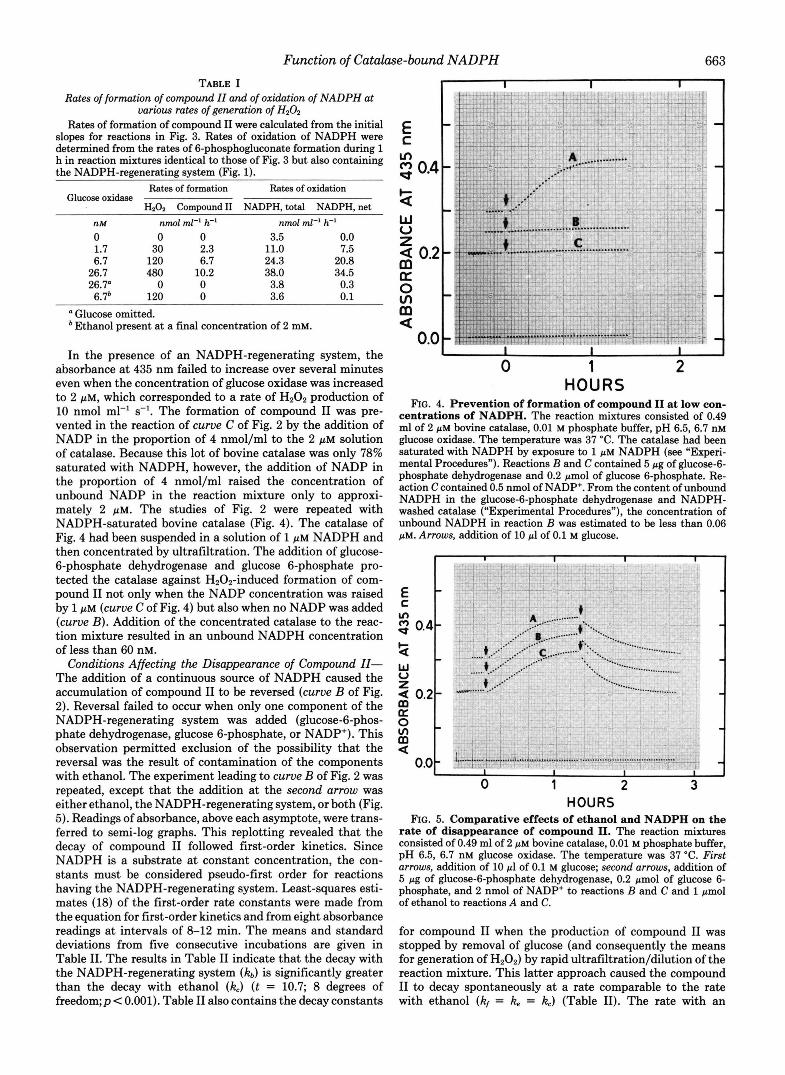
In the presence of an NADPH-regenerating system, the absorbance at 435 nm failed to increase over several minutes even when the concentration of glucose oxidase was increased to 2 PM, which corresponded to a rate of H,O, production of 10 nmol ml" s-'. The formation of compound I1 was pre- vented in the reaction of curve C of Fig. 2 by the addition of NADP in the proportion of 4 nmol/ml to the 2 PM solution of catalase. Because this lot of bovine catalase was only 78% saturated with NADPH, however, the addition of NADP in the proportion of 4 nmol/ml raised the concentration of unbound NADP in the reaction mixture only to approxi- mately 2 PM. The studies of Fig. 2 were repeated with NADPH-saturated bovine catalase (Fig. 4). The catalase of Fig. 4 had been suspended in a solution of 1 /IM NADPH and then concentrated by ultrafiltration. The addition of glucose- 6-phosphate dehydrogenase and glucose 6-phosphate pro- tected the catalase against HpOz-induced formation of com- pound I1 not only when the NADP concentration was raised by 1 PM (curve C of Fig. 4) but also when no NADP was added (curve B). Addition of the concentrated catalase to the reac- tion mixture resulted in an unbound NADPH concentration of less than 60 nM.
Conditions Affecting the Disappearance of Compound II- The addition of a continuous source of NADPH caused the accumulation of compound I1 to be reversed (curve B of Fig. 2). Reversal failed to occur when only one component of the NADPH-regenerating system was added (glucose-6-phos- phate dehydrogenase, glucose 6-phosphate, or NADP+). This observation permitted exclusion of the possibility that the reversal was the result of contamination of the components with ethanol. The experiment leading to curve B of Fig. 2 was repeated, except that the addition at the second arrow was either ethanol, the NADPH-regenerating system, or both (Fig. 5). Readings of absorbance, above each asymptote, were trans- ferred to semi-log graphs. This replotting revealed that the decay of compound I1 followed first-order kinetics. Since NADPH is a substrate at constant concentration, the con- stants must be considered pseudo-first order for reactions having the NADPH-regenerating system. Least-squares esti- mates (18) of the first-order rate constants were made from the equation for first-order kinetics and from eight absorbance readings at intervals of 8-12 min. The means and standard deviations from five consecutive incubations are given in Table 11. The results in Table I1 indicate that the decay with the NADPH-regenerating system (kJ is significantly greater than the decay with ethanol (kc) (t = 10.7; 8 degrees of freedom;p < 0.001). Table I1 also contains the decay constants
€
2 0.4
C m
2 w
. . . . . . . ......... ~
V
5 0.2 rn U 0 v) m a 0.0 ............. - . " ." -
I
0 1 2 ~~
HOURS FIG. 4. Prevention of formation of compound II at low con-
centrations of NADPH. The reaction mixtures consisted of 0.49 mi of 2 p~ bovine catalase, 0.01 M phosphate buffer, pH 6.5, 6.7 nM glucose oxidase. The temperature was 37 "C. The catalase had been saturated with NADPH by exposure to 1 p~ NADPH (see "Experi- mental Procedures"). Reactions B and C contained 5 pg of glucose-6- phosphate dehydrogenase and 0.2 pmol of glucose 6-phosphate. Re- action C contained 0.5 nmol of NADP+. From the content of unbound NADPH in the glucose-6-phosphate dehydrogenase and NADPH- washed catalase ("Experimental Procedures"), the concentration of unbound NADPH in reaction B was estimated to be less than 0.06 pM. Arrows, addition of 10 pl of 0.1 M glucose.
E C m
0.4
. . . . I
......... - - - W V
f 0.2- - m a
m a 0.0 - 1 .. ....................................................................................... ~. ~ .. -
0 ln - -
I , , I I I
0 1 2 3 HOURS
FIG. 5. Comparative effects of ethanol and NADPH on the rate of disappearance of compound 11. The reaction mixtures consisted of 0.49 ml of 2 p~ bovine catalase, 0.01 M phosphate buffer, pH 6.5, 6.7 nM glucose oxidase. The temperature was 37 "C. First arrows, addition of 10 pl of 0.1 M glucose; second arrows, addition of 5 pg of glucose-6-phosphate dehydrogenase, 0.2 pmol of glucose 6- phosphate, and 2 nmol of NADP+ to reactions B and C and 1 pmol of ethanol to reactions A and C.
for compound I1 when the production of compound I1 was stopped by removal of glucose (and consequently the means for generation of Hz02) by rapid ultrafiltration/dilution of the reaction mixture. This latter approach caused the compound I1 to decay spontaneously at a rate comparable to the rate with ethanol (lzf = k, = kc) (Table 11). The rate with an
664 Function of Catalase-bound NADPH TABLE I1
Rate constants for disappearance of compound 11 Compound I1 was generated by the addition of glucose and glucose
oxidase to bovine catalase under conditions described in the legend to Fig. 5. Compound I1 was then made to disappear by the addition of an NADPH-regenerating system (denoted by an NADPH concen- tration of 4 p ~ ) or ethanol, by the use of ultrafiltration/dilution for removal of glucose and cessation of Hz02 production (denoted by a glucose concentration of 0 p ~ ) , or by combinations of these measures. Means and standard deviations of the rate constants were calculated, as described in the text, from the rate of decline in concentration of compound I1 in five consecutive performances of the experiments.
Glucose NADPH Ethanol Rate constants (10' X k, s-')
Mean S.D. Designation mM P M mM 2 4 2 8.18 0.77
2 0 2 4.42 0.40 0 4 0 8.00 0.83
kc
0 k d
0 2 3.98 0.25
2 4 0 7.30 0.45 k
0 0 0 4.25 0.48 2 NADPH-regenerating system (kJ, however, was decidedly faster than the spontaneous rate (k,) (t = 8.7; 8 degrees of freedom; p < 0.001) (Table 11). Since kd > kf, NADPH must enhance the rate of disappearance of compound 11. The sim- ilarity between it. and Itb (Table 11), however, indicates that NADPH also has some ability to retard the conversion of compound I to compound 11.
The catalase-bound NADPH of bovine catalase was stripped of 96% of enzymically detectable NADP through 48 h of exposure to low concentrations of H,02 by the gaseous diffusion method previously described (5). The sample was then carried through the sequence indicated for curve A of Fig. 5. The absorbance at 435 nm rose during the generation of H202. This result was interpreted to mean that NADPH was not essential for the inactivation of catalase by reduction of compound I to compound 11. Moreover, the addition of ethanol to a final concentration of 2 mM resulted in a drop in absorbance at 435 nm as with reaction A of Fig. 5. The NADPH bound to human catalase became entirely NADP+ during exposure to H202 under conditions of reaction A of Fig. 5. As with the bovine enzyme, however, the addition of ethanol resulted in the disappearance of compound I1 of this NADPH-depleted catalase. This subsequent incubation with ethanol did not change the amount or NADPH/NADP ratio of the catalase-bound NADP. Thus, the presence of catalase- bound NADPH was not necessary for the frequently cited "spontaneous" disappearance of compound I1 that accompan- ies a decrease in concentration of compound I.
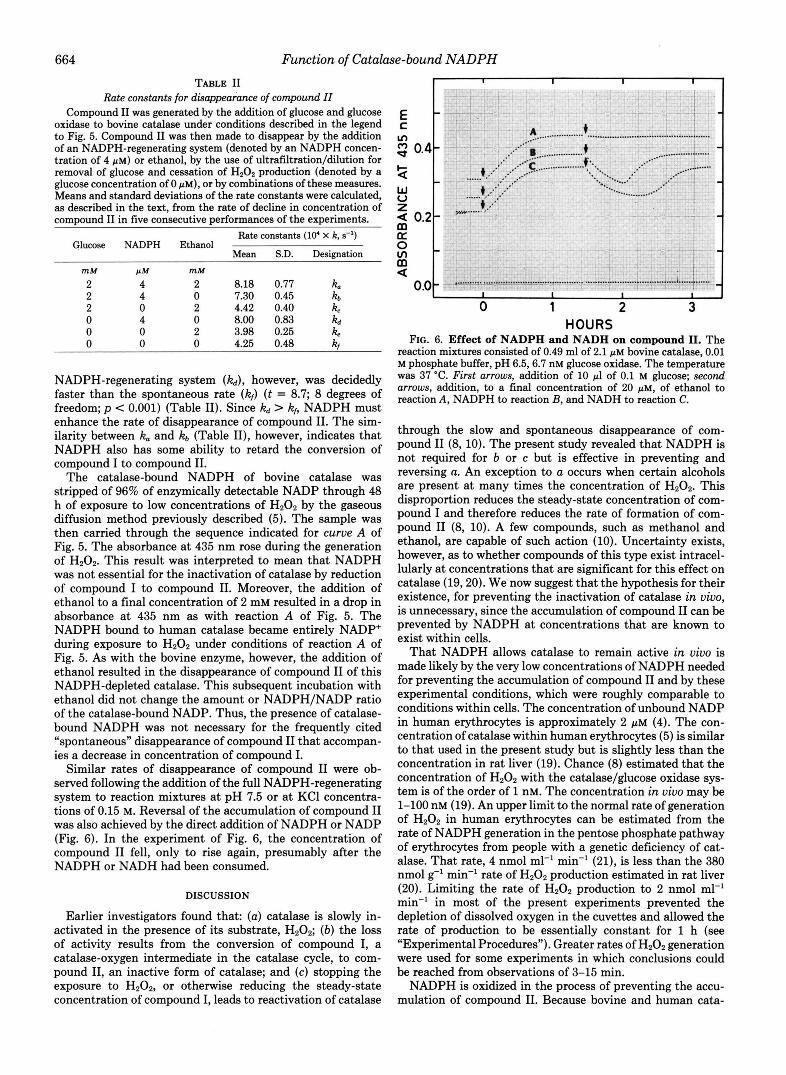
Similar rates of disappearance of compound I1 were ob- served following the addition of the full NADPH-regenerating system to reaction mixtures at pH 7.5 or at KC1 concentra- tions of 0.15 M. Reversal of the accumulation of compound I1 was also achieved by the direct addition of NADPH or NADP (Fig. 6). In the experiment of Fig. 6, the concentration of compound I1 fell, only to rise again, presumably after the NADPH or NADH had been consumed.
DISCUSSION
Earlier investigators found that: (a) catalase is slowly in- activated in the presence of its substrate, H202; (b) the loss of activity results from the conversion of compound I, a catalase-oxygen intermediate in the catalase cycle, to com- pound 11, an inactive form of catalase; and ( c ) stopping the exposure to Hz02, or otherwise reducing the steady-state concentration of compound I, leads to reactivation of catalase
I I I 1
E C
d 0.41
" W u
. .
i I ,... ~ .... 1. .._ ..-. ~ .......................................... ; ...................... ' .... 1 ...... ...... " . .. . i J
A I
f 0.2 q m Q
0.0 U 1 3
HOURS FIG. 6. Effect of NADPH and NADH on compound II. The
reaction mixtures consisted of 0.49 ml of 2.1 p~ bovine catalase, 0.01 M phosphate buffer, pH 6.5,6.7 nM glucose oxidase. The temperature was 37 "C. First arrows, addition of 10 p1 of 0.1 M glucose; second arrows, addition, to a final concentration of 20 pM, of ethanol to reaction A, NADPH to reaction B, and NADH to reaction C.
through the slow and spontaneous disappearance of com- pound I1 (8, 10). The present study revealed that NADPH is not required for b or c but is effective in preventing and reversing a. An exception to a occurs when certain alcohols are present at many times the concentration of H20z. This disproportion reduces the steady-state concentration of com- pound I and therefore reduces the rate of formation of com- pound I1 (8, 10). A few compounds, such as methanol and ethanol, are capable of such action (10). Uncertainty exists, however, as to whether compounds of this type exist intracel- lularly at concentrations that are significant for this effect on catalase (19,20). We now suggest that the hypothesis for their existence, for preventing the inactivation of catalase in vivo, is unnecessary, since the accumulation of compound I1 can be prevented by NADPH at concentrations that are known to exist within cells.
That NADPH allows catalase to remain active in vivo is made likely by the very low concentrations of NADPH needed for preventing the accumulation of compound I1 and by these experimental conditions, which were roughly comparable to conditions within cells. The concentration of unbound NADP in human erythrocytes is approximately 2 PM (4). The con- centration of catalase within human erythrocytes (5) is similar to that used in the present study but is slightly less than the concentration in rat liver (19). Chance (8) estimated that the concentration of H202 with the catalase/glucose oxidase sys- tem is of the order of 1 nM. The concentration in vivo may be 1-100 nM (19). An upper limit to the normal rate of generation of H202 in human erythrocytes can be estimated from the rate of NADPH generation in the pentose phosphate pathway of erythrocytes from people with a genetic deficiency of cat- alase. That rate, 4 nmol ml" min" (21), is less than the 380 nmol g" min" rate of H202 production estimated in rat liver (20). Limiting the rate of H202 production to 2 nmol ml-l min" in most of the present experiments prevented the depletion of dissolved oxygen in the cuvettes and allowed the rate of production to be essentially constant for 1 h (see "Experimental Procedures"). Greater rates of Hz02 generation were used for some experiments in which conclusions could be reached from observations of 3-15 min.
NADPH is oxidized in the process of preventing the accu- mulation of compound 11. Because bovine and human cata-
Function of Cataluse-bound NADPH 665
lases strongly bind NADPH (dissociation constant less than 10 nM) and have a greater affinity for NADPH than for NADP+ (5), the bound NADP+ is readily displaced by NADPH, even at concentrations of unbound NADPH of less than 0.1 JLM. NADH also reverses the accumulation of com- pound I1 (Fig. 6). But catalase binds NADPH to the exclusion of NADH when presented with the two reduced dinucleotides at equimolar concentrations (5). Moreover, cytoplasmic NADP is largely in the reduced form, whereas NAD is largely in the oxidized form. NADPH, therefore, is the more likely of the two reduced dinucleotides to be involved in the protection of cytoplasmic catalase.
Although ethanol prevents the accumulation of compound 11, the mechanism involving ethanol is different from that involving NADPH. Under the conditions of the present study, ethanol greatly decreases the steady-state concentration of compound I (Fig. 1) (8, lo), thereby decreasing the rate of conversion of compound I to compound 11. Moreover, ethanol is known to be consumed at a rate approaching the rate at which the source of H202 (glucose oxidase and glucose) is producing H202 (10). In contrast, NADPH does not greatly decrease the concentration of compound I (Fig. 1, inset), and the NADPH is oxidized at a rate that is only a fraction of the rate of generation of HzOz (Table I). The rate of oxidation of NADPH when catalase is exposed to H20z is greater than the rate of formation of compound I1 in the absence of NADPH (Table I). Consequently, a possibility exists that NADPH is utilized to some extent in a manner similar to ethanol (reac- tion 26 of Fig. 7). The results of the present study neither confirm nor refute that possibility.
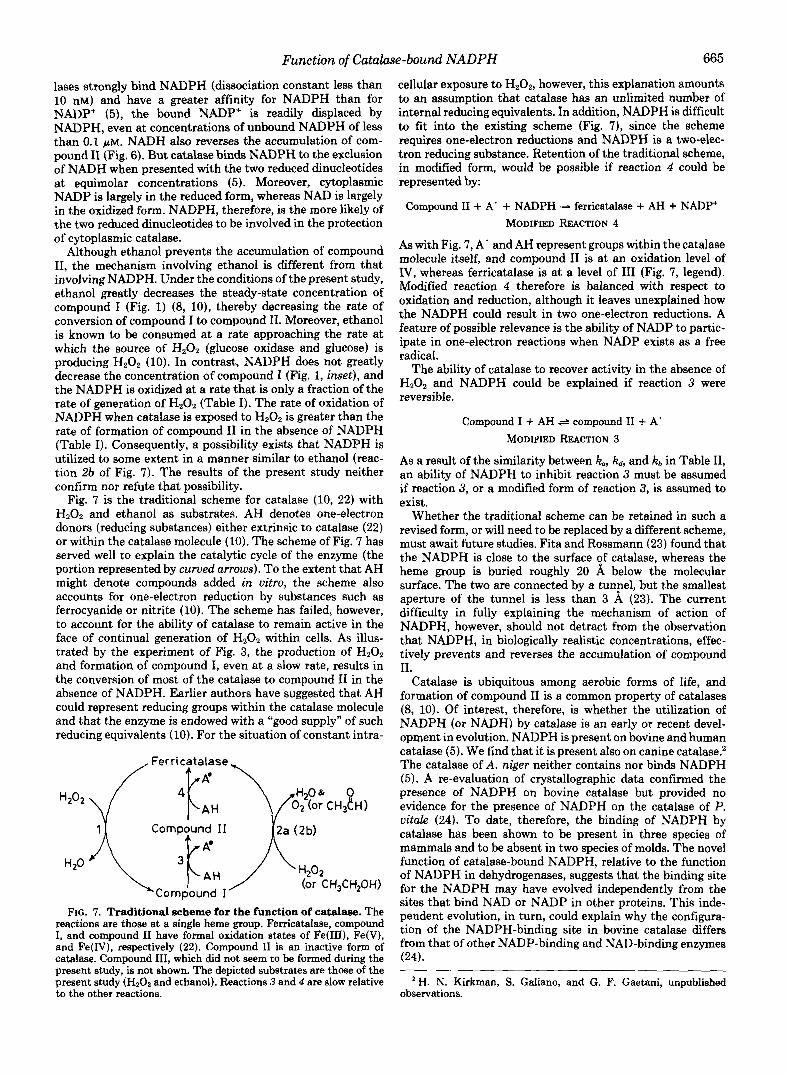
Fig. 7 is the traditional scheme for catalase (10, 22) with H202 and ethanol as substrates. AH denotes one-electron donors (reducing substances) either extrinsic to catalase (22) or within the catalase molecule (10). The scheme of Fig. 7 has served well to explain the catalytic cycle of the enzyme (the portion represented by curved arrows). To the extent that AH might denote compounds added in vitro, the scheme also accounts for one-electron reduction by substances such as ferrocyanide or nitrite (10). The scheme has failed, however, to account for the ability of catalase to remain active in the face of continual generation of H202 within cells. As illus- trated by the experiment of Fig. 3, the production of H202 and formation of compound I, even at a slow rate, results in the conversion of most of the catalase to compound I1 in the absence of NADPH. Earlier authors have suggested that AH could represent reducing groups within the catalase molecule and that the enzyme is endowed with a “good supply” of such reducing equivalents (10). For the situation of constant intra-
FIG. 7. Traditional scheme for the function of catalase. The reactions are those at a single heme group. Femcatalase, compound I, and compound I1 have formal oxidation states of Fe(III), Fe(V), and Fe(IV), respectively (22). Compound I1 is an inactive form of catalase. Compound 111, which did not seem to be formed during the present study, is not shown. The depicted substrates are those of the present study (HZ02 and ethanol). Reactions 3 and 4 are slow relative to the other reactions.
cellular exposure to H202, however, this explanation amounts to an assumption that catalase has an unlimited number of internal reducing equivalents. In addition, NADPH is difficult to fit into the existing scheme (Fig. 7), since the scheme requires one-electron reductions and NADPH is a two-elec- tron reducing substance. Retention of the traditional scheme, in modified form, would be possible if reaction 4 could be represented by:
Compound I1 + A’ + NADPH - ferricatalase + AH + NADP+ MODIFIED REACTION 4
As with Fig. 7, A’ and AH represent groups within the catalase molecule itself, and compound I1 is at an oxidation level of IV, whereas ferricatalase is at a level of I11 (Fig. 7, legend). Modified reaction 4 therefore is balanced with respect to oxidation and reduction, although it leaves unexplained how the NADPH could result in two one-electron reductions. A feature of possible relevance is the ability of NADP to partic- ipate in one-electron reactions when NADP exists as a free radical.
The ability of catalase to recover activity in the absence of HzOz and NADPH could be explained if reaction 3 were reversible.
Compound I + AH e compound I1 + A‘ MODIFIED REACTION 3
As a result of the similarity between ka, kd, and kb in Table 11, an ability of NADPH to inhibit reaction 3 must be assumed if reaction 3, or a modified form of reaction 3, is assumed to exist.
Whether the traditional scheme can be retained in such a revised form, or will need to be replaced by a different scheme, must await future studies. Fita and Rossmann (23) found that the NADPH is close to the surface of catalase, whereas the heme group is buried roughly 20 A below the molecular surface. The two are connected by a tunpel, but the smallest aperture of the tunnel is less than 3 A (23). The current difficulty in fully explaining the mechanism of action of NADPH, however, should not detract from the observation that NADPH, in biologically realistic concentrations, effec- tively prevents and reverses the accumulation of compound 11.
Catalase is ubiquitous among aerobic forms of life, and formation of compound I1 is a common property of catalases (8, 10). Of interest, therefore, is whether the utilization of NADPH (or NADH) by catalase is an early or recent devel- opment in evolution. NADPH is present on bovine and human catalase (5). We find that it is present also on canine catalase? The catalase of A. niger neither contains nor binds NADPH (5). A re-evaluation of crystallographic data confirmed the presence of NADPH on bovine catalase but provided no evidence for the presence of NADPH on the catalase of P. vitak (24). To date, therefore, the binding of NADPH by catalase has been shown to be present in three species of mammals and to be absent in two species of molds. The novel function of catalase-bound NADPH, relative to the function of NADPH in dehydrogenases, suggests that the binding site for the NADPH may have evolved independently from the sites that bind NAD or NADP in other proteins. This inde- pendent evolution, in turn, could explain why the configura- tion of the NADPH-binding site in bovine catalase differs from that of other NADP-binding and NAD-binding enzymes (24).
‘H. N. Kirkman, S. Galiano, and G. F. Gaetani, unpublished observations.
666 Function of Catalase-bound NADPH
Earlier in this century, the action of catalase was thought to be the principal intracellular means for degrading H202. Largely through the studies of Cohen and Hochstein (25), however, the disposal of HzOZ in certain mammalian cells began to be attributed to the enzymic utilization of NADPH for the reduction of oxidized glutathione, followed by the action of glutathione peroxidase on H202. Supporting the importance of the NADPH/glutathione mechanism were ob- servations that genetically determined deficiencies of glucose- 6-phosphate dehydrogenase lead to either chronic hemolytic disease or susceptibility to acute hemolytic anemia. This susceptibility, which affects over 100 million people (26), is attributed to inability of affected erythrocytes to withstand certain peroxidative stresses. Discovery of the presence and role of catalase-bound NADPH, however, brings a unity to the concept of two different mechanisms for disposing of hydrogen peroxide (catalase and the glutathione reductase/ peroxidase pathway) by revealing that both mechanisms are dependent on NADPH.
6. Jouve, H. M., Pelmont, J., and Gaillard, J. (1986) Arch. Biochem.
7. Takeda, A.. Mivahara. T.. Hachimori. A.. and Sameiima. T. Biophys. 248, 71-79
(1980) J. Biochem. ( ibkyo) 87,429-439 ' " ,
8. Chance, B. (1950) Biochem. J. 46,387-402 9. Keilin, D., and Hartree, E. F. (1945) Bwchem. J. 39, 293-301
10. Nicholls, P., and Schonbaum, G. R. (1963) in The Enzymes (Boyer, P. D., Lardy, H., and Myrback, K., eds) 2nd Ed., Vol. 8, pp. 147-225, Academic Press, New York
11. Morikofer-Zwez, S., Cantz, M., Kaufmann, H., von Wartburg, J. P., and Aebi, H. (1969) Eur. J . Biochem. 11,49-57
12. Green, M. J., and Hill, H. A. 0. (1984) Methods Enzymol. 105,
13. Aebi, H. (1984) Methods Enzymol. 105, 121-126 14. Burch, H. B., Bradley, M. E., and Lowry, 0. H. (1967) J. Bhl.
15. Lowry, 0. H., and Passonneau, J. V. (1972) A Flezible System of
16. Kirkman, H. N., Gaetani, G. D., Clemons, E. H., and Mareni, C.
17. Chance, B. (1952) Arch. Biochem. Bwphys. 41,404-415 18. Cleland, W. W. (1967) Adv. Enzymol. Re& Areas Mol. Bwl. 29,
19. .Oshino, N., Chance, B., Sies, H., and Bucher, T. (1973) Arch.
15-16
Chem. 242,4546-4554
Enzymatic Analysis, pp. 126-136, Academic Press, New York
(1975) J. Clin. Invest. 55,875-878
1-33
1.
2.
3.
4.
5.
REFERENCES Biochem. Biophys. 154, 117-131 20. Chance, B., Sies, H., and Boveris, A. (1979) Physiol. Reu. 59,
Eaton, J. W., Boraas, M., and Etkin, N. L. (1972) Adv. Exp. Med. 527-605
McMahon, S., and Stern, A. (1979) in Molecular Diseases 44,1187-1199 Biol. 28, 121-131 21. Jacob, H. S., Ingbar, S. H., and Jandl, J. H. (1965) J. Clin. Invest.
(Schewe, T. and ~ p o p o ~ , s., e&) pp. 41-46, pergamon press, 22. Schonbaum, G. R., and Chance, B. (1976) in The Enzymes ( B o w , New York P. D., ed) 2nd Ed. Vol. 13, pp. 363-408, Academic Press, New
York Kirkman, H. N., and Gaetani, G. F. (1986) J. Chem. 261, 23. Fib, I., and Rossmann, M. G. (1985) J. Mol. Bwl. 185, 21-37 4033-4038
Kirkman, H. N., Gaetani, G. F., and Clemons, E. H. (1986) J. 24. Fita, I., and Rossmann, M. G. (1985) Proc. Natl. Acad. Sci.
25. Cohen, G., and Hochstein, P. (1963) Biochemistry 2,1420-1428 Kirkman, H. N., and Gaetani, G. F. (1984) Proc. Natl. Acad. Sci. 26. W. H. 0. Scientific Group (1967) W H O . Tech. Rep. Ser. 366,
Biol. Chem. 261,4039-4045 U. 5'. A. 82,1604-1608
U. S. A. 81,4343-4347 1-53