Embed Size (px)
Citation preview

A N N U A L R E P O R T
H AWA I I A N H O L D I N G S, I N C.
2015A HIGHER LEVEL
OF COMFORT
The cover illustrates the design of our new 180-degree
lie-flat seats, the centerpiece of our upcoming A330 premium
cabin redesign. Developed as a collaboration with paulwylde
and Optimares, these seats demonstrate our dedication
to leading the way to the future with quality, comfort
and customer service.
HARP-09388_AnnualReportCover2015.indd 1 3/28/16 2:25 PM
OPERATED BY EMPIRE AIRLINES
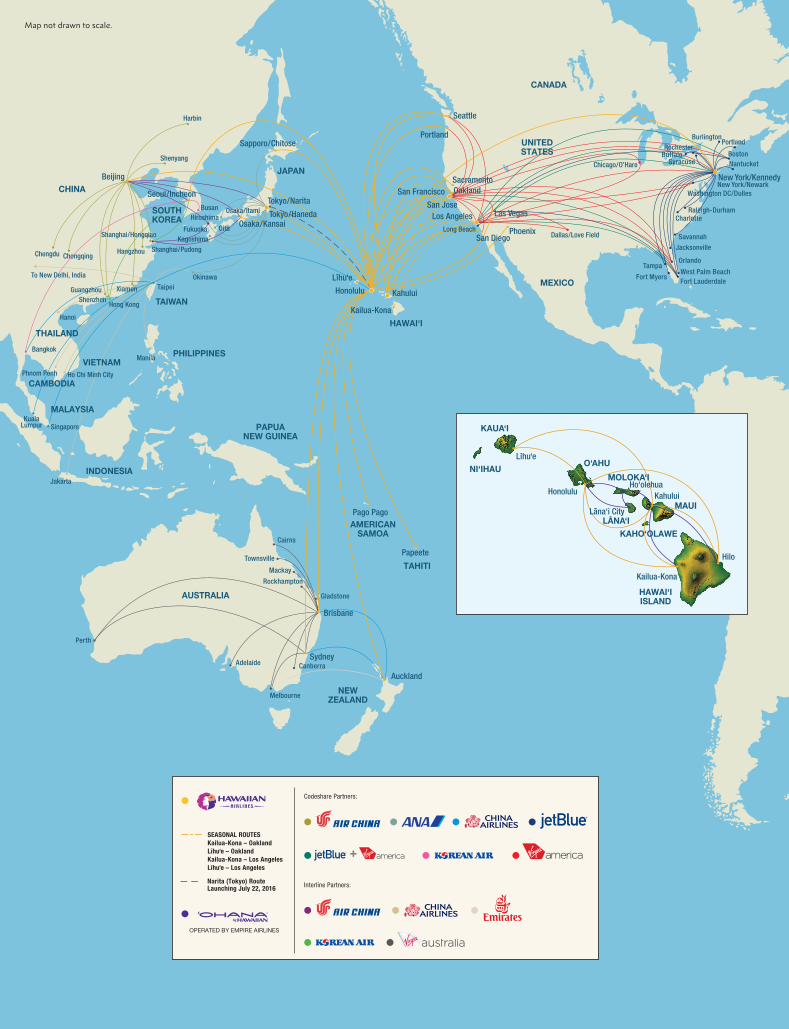
SEASONAL ROUTESKailua-Kona – OaklandLıhu‘e – Oakland Kailua-Kona – Los AngelesLıhu‘e – Los Angeles
Codeshare Partners:
Interline Partners:Launching July 22, 2016Narita (Tokyo) Route
New York/Kennedy
Raleigh-Durham
New York/Newark
Charlotte
Savannah
Jacksonville
Lıhu‘e
KualaLumpur Singapore
Manila
Jakarta
SOUTHKOREA
PHILIPPINESVIETNAM
MALAYSIA
CAMBODIA
THAILAND
CHINA
AUSTRALIA
INDONESIA
PAPUANEW GUINEA
NEWZEALAND
AMERICANSAMOA
TAHITI
JAPAN
UNITEDSTATES
MEXICO
HAWAI‘I
CANADA
TAIWAN
Tokyo/Haneda
Tokyo/Narita
Osaka/Kansai Fukuoka
Pago Pago
Papeete
Seoul/Incheon
Taipei
Sapporo/Chitose
Sydney
Brisbane
Auckland
San FranciscoSacramento
Portland
Phoenix
Oakland
Las Vegas
Seattle
San Jose
Kahului
Okinawa
Kagoshima
Beijing
Shanghai/Pudong
Hong Kong
Busan Osaka/Itami
Oita
Hiroshima
Bangkok
Hanoi
Ho Chi Minh CityPhnom Penh
Perth
Canberra
Gladstone
Rockhampton
Townsville
Mackay
Adelaide
Melbourne
Cairns
Dallas/Love Field
Chicago/O’Hare
PortlandBurlington
Boston
Orlando
West Palm BeachFort Lauderdale
Tampa
Fort Myers
Washington DC/Dulles
RochesterBuffalo
Syracuse
Honolulu
Kailua-Kona
KAUA‘I
O‘AHU
MAUI
HAWAI‘IISLAND
MOLOKA‘I
LANA‘I
NI‘IHAU
KAHO‘OLAWE
Kahului
Kailua-Kona
Hilo
Lıhu‘e
Honolulu
Shanghai/Hongqiao
Hangzhou
Xiamen
Chengdu Chongqing
GuangzhouShenzhen
Shenyang
Harbin
To New Delhi, India
Nantucket
Los AngelesLong Beach
San Diego
Lana‘i City-
Ho‘olehua
Map not drawn to scale.
B O A R D O F D I R E C T O R S
Lawrence S. HershfieldChairman of the Board Hawaiian Holdings, Inc. and Hawaiian Airlines, Inc.
Chief Executive Officer Ranch Capital, LLC
Mark B. DunkerleyPresident and Chief Executive Officer Hawaiian Holdings, Inc. and Hawaiian Airlines, Inc.
Gregory S. AndersonChief Executive Officer Legacy Senior Housing and Development Company
Randall L. JensonPresident Ranch Capital, LLC
Chief Financial Officer Berkadia
Tomoyuki MoriizumiFormer President and Chief Executive Officer Jupiter Telecommunications Co., Ltd.
Samson PoomaihealaniGrand Lodge Representative (Retired) International Association of Machinists and Aerospace Workers
Crystal K. RosePartner Bays Lung Rose & Holma
William S. SwelbarResearch Engineer Massachusetts Institute of Technology
Duane E. WoerthFormer U.S. Ambassador International Civil Aviation Organization
Richard N. ZwernWorldwide Director-Executive Development WPP
C O R P O R AT E O F F I C E R S
Mark B. DunkerleyPresident and Chief Executive Officer Hawaiian Holdings, Inc. and Hawaiian Airlines, Inc.
Aaron J. AlterCorporate Secretary Hawaiian Holdings, Inc.
Executive Vice President Chief Legal Officer and Corporate Secretary Hawaiian Airlines, Inc.
Shannon L. OkinakaExecutive Vice President Chief Financial Officer and Treasurer Hawaiian Holdings, Inc.
Executive Vice President Chief Financial Officer Hawaiian Airlines, Inc.
Ron Anderson-LehmanExecutive Vice President and Chief Administrative Officer Hawaiian Airlines, Inc.
Peter R. IngramExecutive Vice President and Chief Commercial Officer Hawaiian Airlines, Inc.
Jonathan D. SnookExecutive Vice President and Chief Operating Officer Hawaiian Airlines, Inc.
Ann R. BotticelliSenior Vice President Corporate Communications and Public Affairs Hawaiian Airlines, Inc.
Barbara D. FalveySenior Vice President Human Resources Hawaiian Airlines, Inc.
Avi A. MannisSenior Vice President Marketing Hawaiian Airlines, Inc.
Theo PanagiotouliasSenior Vice President Global Sales and Alliances Hawaiian Airlines, Inc.
Karen A. BerryVice President Labor and Employee Relations Hawaiian Airlines, Inc.
K. Sayle HirashimaVice President Controller Hawaiian Airlines, Inc.
James W. LandersVice President Maintenance and Engineering Hawaiian Airlines, Inc.
Philip D. MooreVice President Information Technology Hawaiian Airlines, Inc.
Vicki NakataVice President Loyalty and Travel Products Hawaiian Airlines, Inc.
Brent OverbeekVice President Network Planning and Revenue Management Hawaiian Airlines, Inc.
Kenneth E. RewickVice President Flight Operations Hawaiian Airlines, Inc.
John F. Schaefer, Jr.Vice President Treasurer Hawaiian Airlines, Inc.
Robin A. SparlingVice President Inflight Services Hawaiian Airlines, Inc.
Edward T. StraussVice President Cargo Hawaiian Airlines, Inc.
Noel P. VillamilVice President Financial Planning and Analysis Hawaiian Airlines, Inc.
C O R P O R AT E I N F O R M AT I O N
Hawaiian Airlines, Inc.3375 Koapaka Street, Suite G350Honolulu, Hawai‘i 96819 Telephone: (808) 835-3700 Facsimile: (808) 835-3690
MAILING ADDRESSP. O. Box 30008 Honolulu, Hawai‘i 96820
INTERNET ADDRESSwww.HawaiianAirlines.com
INVESTOR RELATIONSAshlee [email protected]
STOCK TRANSFER AGENT AND REGISTRARAmerican Stock Transfer & Trust Company6201 15th Avenue Brooklyn, New York 11219 Telephone: (800) 937-5449 [email protected]
STOCK EXCHANGE LISTINGSymbol – HA NASDAQ Stock Market, LLCNew York, New York
INDEPENDENT AUDITORSErnst & Young, LLPHonolulu, Hawai‘i
CORPORATE COUNSELWilson Sonsini Goodrich & Rosati, P.C.Palo Alto, California
A N N U A L M E E T I N GThe 2016 Annual Meeting of Stockholders of Hawaiian Holdings, Inc. will be held on Wednesday, May 18, 2016 at 8:00 a.m.
Hilton Hawaiian Village Beach Resort and Spa Kalia Executive Conference Center Hibiscus Room 2005 Kalia Road Honolulu, Hawai‘i 96815
HARP-09388_AnnualReportCover2015.indd 2 3/28/16 2:25 PM
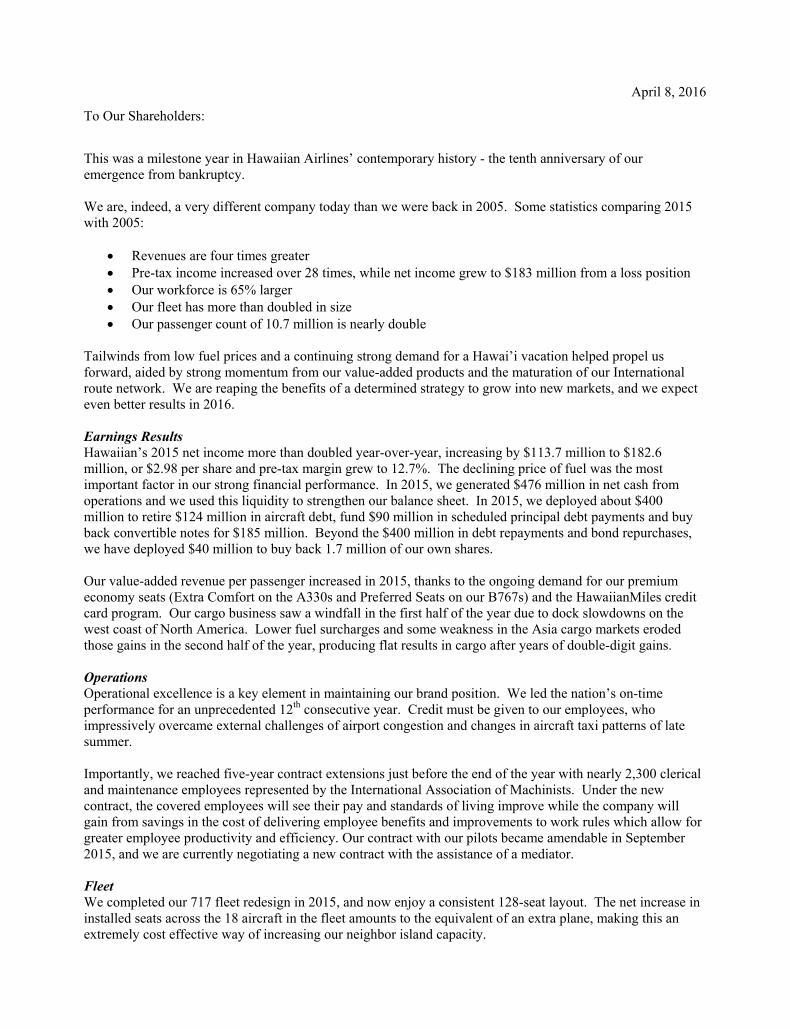
April 8, 2016
To Our Shareholders:
This was a milestone year in Hawaiian Airlines’ contemporary history - the tenth anniversary of our emergence from bankruptcy. We are, indeed, a very different company today than we were back in 2005. Some statistics comparing 2015 with 2005:
Revenues are four times greater Pre-tax income increased over 28 times, while net income grew to $183 million from a loss position Our workforce is 65% larger Our fleet has more than doubled in size Our passenger count of 10.7 million is nearly double
Tailwinds from low fuel prices and a continuing strong demand for a Hawai’i vacation helped propel us forward, aided by strong momentum from our value-added products and the maturation of our International route network. We are reaping the benefits of a determined strategy to grow into new markets, and we expect even better results in 2016. Earnings Results Hawaiian’s 2015 net income more than doubled year-over-year, increasing by $113.7 million to $182.6 million, or $2.98 per share and pre-tax margin grew to 12.7%. The declining price of fuel was the most important factor in our strong financial performance. In 2015, we generated $476 million in net cash from operations and we used this liquidity to strengthen our balance sheet. In 2015, we deployed about $400 million to retire $124 million in aircraft debt, fund $90 million in scheduled principal debt payments and buy back convertible notes for $185 million. Beyond the $400 million in debt repayments and bond repurchases, we have deployed $40 million to buy back 1.7 million of our own shares. Our value-added revenue per passenger increased in 2015, thanks to the ongoing demand for our premium economy seats (Extra Comfort on the A330s and Preferred Seats on our B767s) and the HawaiianMiles credit card program. Our cargo business saw a windfall in the first half of the year due to dock slowdowns on the west coast of North America. Lower fuel surcharges and some weakness in the Asia cargo markets eroded those gains in the second half of the year, producing flat results in cargo after years of double-digit gains. Operations Operational excellence is a key element in maintaining our brand position. We led the nation’s on-time performance for an unprecedented 12th consecutive year. Credit must be given to our employees, who impressively overcame external challenges of airport congestion and changes in aircraft taxi patterns of late summer. Importantly, we reached five-year contract extensions just before the end of the year with nearly 2,300 clerical and maintenance employees represented by the International Association of Machinists. Under the new contract, the covered employees will see their pay and standards of living improve while the company will gain from savings in the cost of delivering employee benefits and improvements to work rules which allow for greater employee productivity and efficiency. Our contract with our pilots became amendable in September 2015, and we are currently negotiating a new contract with the assistance of a mediator. Fleet We completed our 717 fleet redesign in 2015, and now enjoy a consistent 128-seat layout. The net increase in installed seats across the 18 aircraft in the fleet amounts to the equivalent of an extra plane, making this an extremely cost effective way of increasing our neighbor island capacity.
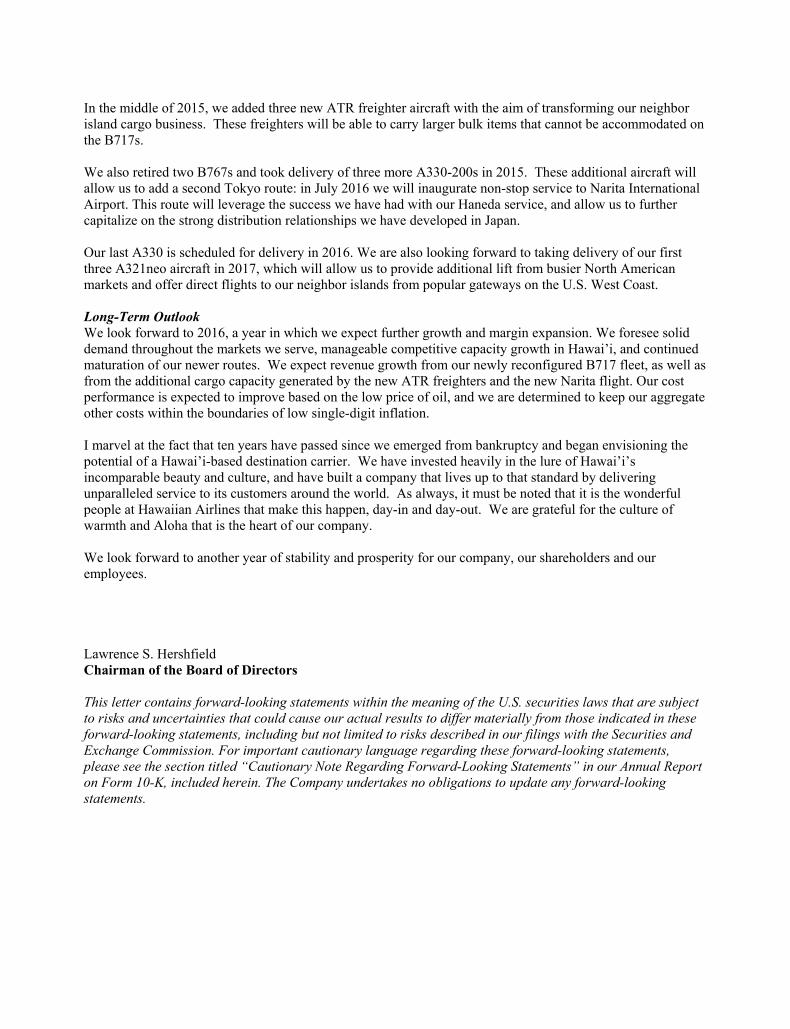
In the middle of 2015, we added three new ATR freighter aircraft with the aim of transforming our neighbor island cargo business. These freighters will be able to carry larger bulk items that cannot be accommodated on the B717s. We also retired two B767s and took delivery of three more A330-200s in 2015. These additional aircraft will allow us to add a second Tokyo route: in July 2016 we will inaugurate non-stop service to Narita International Airport. This route will leverage the success we have had with our Haneda service, and allow us to further capitalize on the strong distribution relationships we have developed in Japan. Our last A330 is scheduled for delivery in 2016. We are also looking forward to taking delivery of our first three A321neo aircraft in 2017, which will allow us to provide additional lift from busier North American markets and offer direct flights to our neighbor islands from popular gateways on the U.S. West Coast. Long-Term Outlook We look forward to 2016, a year in which we expect further growth and margin expansion. We foresee solid demand throughout the markets we serve, manageable competitive capacity growth in Hawai’i, and continued maturation of our newer routes. We expect revenue growth from our newly reconfigured B717 fleet, as well as from the additional cargo capacity generated by the new ATR freighters and the new Narita flight. Our cost performance is expected to improve based on the low price of oil, and we are determined to keep our aggregate other costs within the boundaries of low single-digit inflation. I marvel at the fact that ten years have passed since we emerged from bankruptcy and began envisioning the potential of a Hawai’i-based destination carrier. We have invested heavily in the lure of Hawai’i’s incomparable beauty and culture, and have built a company that lives up to that standard by delivering unparalleled service to its customers around the world. As always, it must be noted that it is the wonderful people at Hawaiian Airlines that make this happen, day-in and day-out. We are grateful for the culture of warmth and Aloha that is the heart of our company. We look forward to another year of stability and prosperity for our company, our shareholders and our employees. Lawrence S. Hershfield Chairman of the Board of Directors This letter contains forward-looking statements within the meaning of the U.S. securities laws that are subject to risks and uncertainties that could cause our actual results to differ materially from those indicated in these forward-looking statements, including but not limited to risks described in our filings with the Securities and Exchange Commission. For important cautionary language regarding these forward-looking statements, please see the section titled “Cautionary Note Regarding Forward-Looking Statements” in our Annual Report on Form 10-K, included herein. The Company undertakes no obligations to update any forward-looking statements.

THE FOLLOWING PAGES CONTAIN THE ANNUAL REPORT ON FORM 10-K OF HAWAIIAN HOLDINGS, INC. AS FILED WITH THE
SECURITIES AND EXCHANGE COMMISSION

[This Page Intentionally Left Blank]
UNITED STATESSECURITIES AND EXCHANGE COMMISSION
Washington, DC 20549
FORM 10-K(Mark One)
� ANNUAL REPORT PURSUANT TO SECTION 13 OR 15(d) OF THE SECURITIES EXCHANGEACT OF 1934
For the fiscal year ended December 31, 2015
or
� TRANSITION REPORT PURSUANT TO SECTION 13 OR 15(d) OF THE SECURITIESEXCHANGE ACT OF 1934
For the transition period from to .
Commission file number 1-31443
HAWAIIAN HOLDINGS, INC.(Exact name of registrant as specified in its charter)
Delaware 71-0879698(State or other jurisdiction of (I.R.S. employerincorporation or organization) identification no.)
3375 Koapaka Street, Suite G-350,Honolulu, Hawai’i 96819
(Address of principal executive offices) (Zip code)
Registrant’s telephone number, including area code: (808) 835-3700
Securities registered pursuant to Section 12(b) of the Act:Title of each class Name of each exchange on which registered
Common Stock ($0.01 par value) NASDAQ Stock Market, LLC(NASDAQ Global Select Market)
Securities registered pursuant to Section 12(g) of the Act: None
Indicate by check mark if the registrant is a well-known seasoned issuer, as defined in Rule 405 of the SecuritiesAct. Yes � No �
Indicate by check mark if the registrant is not required to file reports pursuant to Section 13 or Section 15(d) of theAct. Yes � No �
Indicate by check mark whether the registrant: (1) has filed all reports required to be filed by Section 13 or 15(d) of theSecurities Exchange Act of 1934 during the preceding 12 months (or for such shorter period that the registrant was requiredto file such reports), and (2) has been subject to such filing requirements for the past 90 days. Yes � No �
Indicate by check mark whether the registrant has submitted electronically and posted on its corporate Web site, if any, everyInteractive Data File required to be submitted and posted pursuant to Rule 405 of Regulation S-T during the preceding12 months (or for such shorter period that the registrant was required to submit and post such files). Yes � No �
Indicate by check mark if disclosure of delinquent filers pursuant to Item 405 of Regulation S-K is not contained herein, andwill not be contained, to the best of registrant’s knowledge, in definitive proxy or information statements incorporated byreference in Part III of this Form 10-K or any amendment to this Form 10-K. �
Indicate by check mark whether the registrant is a large accelerated filer, an accelerated filer, a non-accelerated filer, or asmaller reporting company. See the definitions of ‘‘large accelerated filer’’, ‘‘accelerated filer’’ and ‘‘smaller reportingcompany’’ in Rule 12b-2 of the Exchange Act.
Large accelerated filer � Accelerated filer � Non-accelerated filer � Smaller reporting company �(Do not check if a
smaller reporting company)
Indicate by check mark whether the registrant is a shell company (as defined in Exchange Rule Act 12b-2). Yes � No �
The aggregate market value of the voting and non-voting common equity stock held by non-affiliates of the registrant wasapproximately $1.2 billion, computed by reference to the closing sale price of the Common Stock on the NASDAQ GlobalSelect Market, on June 30, 2015, the last business day of the registrant’s most recently completed second fiscal quarter.
As of January 22, 2016, 53,401,439 shares of Common Stock of the registrant were outstanding.
DOCUMENTS INCORPORATED BY REFERENCE
Portions of the registrant’s Proxy Statement for Annual Meeting of Stockholders to be held on May 18, 2016 will beincorporated by reference into Part III of this Form 10-K.

[This Page Intentionally Left Blank]
TABLE OF CONTENTS
Page
PART I . . . . . . . . . . . . . . . . . . . . . . . . . . . . . . . . . . . . . . . . . . . . . . . . . . . . . . . . . . . . . . . . . . 4ITEM 1. BUSINESS . . . . . . . . . . . . . . . . . . . . . . . . . . . . . . . . . . . . . . . . . . . . . . . . . . . . 4ITEM 1A. RISK FACTORS . . . . . . . . . . . . . . . . . . . . . . . . . . . . . . . . . . . . . . . . . . . . . . . 11ITEM 1B. UNRESOLVED STAFF COMMENTS . . . . . . . . . . . . . . . . . . . . . . . . . . . . . . . 24ITEM 2. PROPERTIES . . . . . . . . . . . . . . . . . . . . . . . . . . . . . . . . . . . . . . . . . . . . . . . . . 24ITEM 3. LEGAL PROCEEDINGS . . . . . . . . . . . . . . . . . . . . . . . . . . . . . . . . . . . . . . . . . 26ITEM 4. MINE SAFETY DISCLOSURES . . . . . . . . . . . . . . . . . . . . . . . . . . . . . . . . . . . 26
PART II . . . . . . . . . . . . . . . . . . . . . . . . . . . . . . . . . . . . . . . . . . . . . . . . . . . . . . . . . . . . . . . . . 27ITEM 5. MARKET FOR REGISTRANT’S COMMON EQUITY, RELATED
STOCKHOLDER MATTERS AND ISSUER PURCHASES OF EQUITYSECURITIES . . . . . . . . . . . . . . . . . . . . . . . . . . . . . . . . . . . . . . . . . . . . . . . . 27
ITEM 6. SELECTED FINANCIAL DATA . . . . . . . . . . . . . . . . . . . . . . . . . . . . . . . . . . . 29ITEM 7. MANAGEMENT’S DISCUSSION AND ANALYSIS OF FINANCIAL
CONDITION AND RESULTS OF OPERATIONS . . . . . . . . . . . . . . . . . . . . . 31ITEM 7A. QUANTITATIVE AND QUALITATIVE DISCLOSURES ABOUT MARKET
RISK . . . . . . . . . . . . . . . . . . . . . . . . . . . . . . . . . . . . . . . . . . . . . . . . . . . . . . 46ITEM 8. FINANCIAL STATEMENTS AND SUPPLEMENTARY DATA . . . . . . . . . . . . . 48ITEM 9. CHANGES IN AND DISAGREEMENTS WITH ACCOUNTANTS ON
ACCOUNTING AND FINANCIAL DISCLOSURE . . . . . . . . . . . . . . . . . . . . 100ITEM 9A. CONTROLS AND PROCEDURES . . . . . . . . . . . . . . . . . . . . . . . . . . . . . . . . . 100ITEM 9B. OTHER INFORMATION . . . . . . . . . . . . . . . . . . . . . . . . . . . . . . . . . . . . . . . . 103
PART III . . . . . . . . . . . . . . . . . . . . . . . . . . . . . . . . . . . . . . . . . . . . . . . . . . . . . . . . . . . . . . . . 103ITEM 10. DIRECTORS, EXECUTIVE OFFICERS AND CORPORATE GOVERNANCE 103ITEM 11. EXECUTIVE COMPENSATION . . . . . . . . . . . . . . . . . . . . . . . . . . . . . . . . . . . 103ITEM 12. SECURITY OWNERSHIP OF CERTAIN BENEFICIAL OWNERS AND
MANAGEMENT AND RELATED STOCKHOLDER MATTERS . . . . . . . . . 103ITEM 13. CERTAIN RELATIONSHIPS AND RELATED TRANSACTIONS, AND
DIRECTOR INDEPENDENCE . . . . . . . . . . . . . . . . . . . . . . . . . . . . . . . . . . 103ITEM 14. PRINCIPAL ACCOUNTANT FEES AND SERVICES . . . . . . . . . . . . . . . . . . . . 103
PART IV . . . . . . . . . . . . . . . . . . . . . . . . . . . . . . . . . . . . . . . . . . . . . . . . . . . . . . . . . . . . . . . . 103ITEM 15. EXHIBITS, FINANCIAL STATEMENT SCHEDULES . . . . . . . . . . . . . . . . . . . 103SIGNATURES . . . . . . . . . . . . . . . . . . . . . . . . . . . . . . . . . . . . . . . . . . . . . . . . . . . . . . . . . . 114
1
CAUTIONARY NOTE REGARDING FORWARD-LOOKING STATEMENTS
This annual report on Form 10-K contains ‘‘forward-looking statements’’ within the meaning of thePrivate Securities Litigation Reform Act of 1995 that reflect our current views with respect to certaincurrent and future events and financial performance. Such forward-looking statements include, withoutlimitation: any expectations of operating expenses, deferred revenue, interest rates, income taxes,deferred tax assets, valuation allowance or other financial items; expectations regarding available seatmiles, operating revenue per available seat mile and operating cost per available seat mile for the firstquarter of 2016; statements regarding factors that may affect our operating results; statementsregarding our goals, mission and areas of focus; statements regarding factors that may affect our abilityto fund our working capital, capital expenditures or other general purpose needs; statements related tothe impact of our low-cost structure on funding our growth strategy and market opportunities;statements regarding our ability to pay taxes with working capital; estimates of fair valuemeasurements; statements related to aircraft maintenance and repair costs and deposits and timing ofmaintenance activities; statements related to cash flow from operations and seasonality; estimates ofrequired funding of and contributions to our defined benefit pension and disability plan; estimates ofannual fuel expenses and measure of the effects of fuel prices on our business; statements regardingthe availability and cost of fuel; statements regarding our wages and benefits and labor costs andagreements; statements regarding the implementation, effective date and costs of compliance withregulations promulgated by the FAA, DOT and other regulatory agencies; statements related to airportrent rates and landing fees; statements regarding aircraft rent expense; statements regarding the statusof federal and state legislation; statements regarding our total capacity and yields on routes; statementsregarding compliance with potential environmental regulations; statements regarding potential dilutionof our securities; statements regarding cost liability and deferred revenue estimates related to thefrequent flyer program; statements related to our hedging program; statements concerning the impactof, and changes to, accounting principles, policies and estimates; statements regarding our net operatingloss carryforwards; statements regarding credit card holdback; statements regarding the availability offinancing; statements regarding our capital expenditures; statements regarding potential violationsunder the our debt or lease obligations; statements regarding our intent to settle the principal amountof our convertible notes in cash; statements regarding our ability to comply with covenants under ourfinancing arrangements; statements regarding our intention to obtain additional debt or lease financingfor aircraft deliveries; statements related to capital expenditures impacting future debt levels andpre-delivery payments; statements regarding the expiration of aircraft leases; statements related to riskmanagement, credit risks and air traffic liability; statements related to future U.S. and global economicconditions or performance; statements related to changes in our fleet plan and related cash outlays;statements related to expected delivery of new aircraft and associated costs for spare engines,replacement parts, maintenance, employee training and other implementation activities; statementsprojecting non-aircraft related capital expenditures; statements related to the effects of any litigation onour operations or business; statements related to the amount of competition on our routes by otherdomestic and foreign carriers; statements related to continuous investments in technology and systems;and statements as to other matters that do not relate strictly to historical facts or statements ofassumptions underlying any of the foregoing. Words such as ‘‘expects,’’ ‘‘anticipates,’’ ‘‘projects,’’‘‘intends,’’ ‘‘plans,’’ ‘‘believes,’’ ‘‘estimates,’’ variations of such words, and similar expressions are alsointended to identify such forward- looking statements. These forward-looking statements are and willbe, as the case may be, subject to many risks, uncertainties and factors relating to our operations andbusiness environment, all of which may cause our actual results to be materially different from anyfuture results, expressed or implied, in these forward-looking statements.
2

The risks, uncertainties and assumptions referred to above that could cause our results to differmaterially from the results expressed or implied by such forward-looking statements include thosediscussed under the heading ‘‘Risk Factors’’ in Item 1A in this Annual Report on Form 10-K and therisks, uncertainties and assumptions discussed from time to time in our other public filings and publicannouncements. All forward-looking statements included in this document are based on informationavailable to us as of the date hereof. We undertake no obligation to publicly update or revise anyforward-looking statements to reflect events or circumstances that may arise after the date hereof.
3
PART I
ITEM 1. BUSINESS.
Overview
Hawaiian Holdings, Inc. (the Company, Holdings, we, us and our) is a holding company incorporatedin the State of Delaware. The Company’s primary asset is the sole ownership of all issued andoutstanding shares of common stock of Hawaiian Airlines, Inc. (Hawaiian). Hawaiian was originallyincorporated in January 1929 under the laws of the Territory of Hawai’i and became our indirectwholly-owned subsidiary pursuant to a corporate restructuring that was consummated in August 2002.Hawaiian became a Delaware corporation and the Company’s direct wholly-owned subsidiaryconcurrent with its reorganization and reacquisition by the Company in June 2005.
Our Business
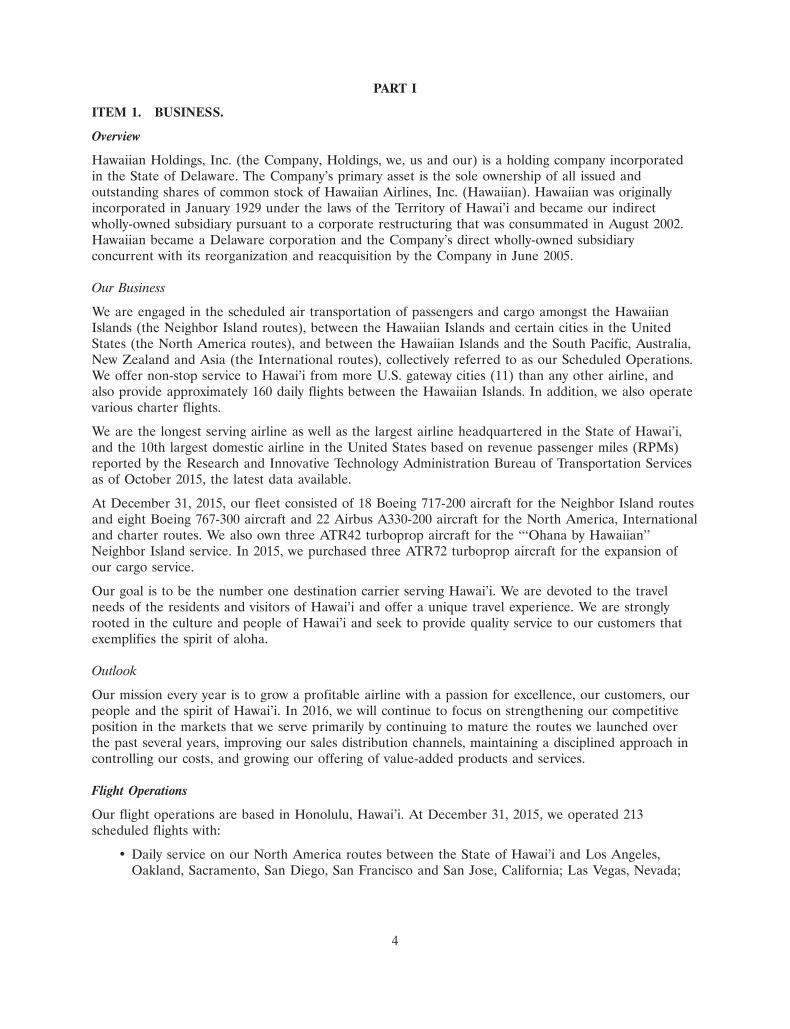
We are engaged in the scheduled air transportation of passengers and cargo amongst the HawaiianIslands (the Neighbor Island routes), between the Hawaiian Islands and certain cities in the UnitedStates (the North America routes), and between the Hawaiian Islands and the South Pacific, Australia,New Zealand and Asia (the International routes), collectively referred to as our Scheduled Operations.We offer non-stop service to Hawai’i from more U.S. gateway cities (11) than any other airline, andalso provide approximately 160 daily flights between the Hawaiian Islands. In addition, we also operatevarious charter flights.
We are the longest serving airline as well as the largest airline headquartered in the State of Hawai’i,and the 10th largest domestic airline in the United States based on revenue passenger miles (RPMs)reported by the Research and Innovative Technology Administration Bureau of Transportation Servicesas of October 2015, the latest data available.
At December 31, 2015, our fleet consisted of 18 Boeing 717-200 aircraft for the Neighbor Island routesand eight Boeing 767-300 aircraft and 22 Airbus A330-200 aircraft for the North America, Internationaland charter routes. We also own three ATR42 turboprop aircraft for the ‘‘‘Ohana by Hawaiian’’Neighbor Island service. In 2015, we purchased three ATR72 turboprop aircraft for the expansion ofour cargo service.
Our goal is to be the number one destination carrier serving Hawai’i. We are devoted to the travelneeds of the residents and visitors of Hawai’i and offer a unique travel experience. We are stronglyrooted in the culture and people of Hawai’i and seek to provide quality service to our customers thatexemplifies the spirit of aloha.
Outlook
Our mission every year is to grow a profitable airline with a passion for excellence, our customers, ourpeople and the spirit of Hawai’i. In 2016, we will continue to focus on strengthening our competitiveposition in the markets that we serve primarily by continuing to mature the routes we launched overthe past several years, improving our sales distribution channels, maintaining a disciplined approach incontrolling our costs, and growing our offering of value-added products and services.
Flight Operations
Our flight operations are based in Honolulu, Hawai’i. At December 31, 2015, we operated 213scheduled flights with:
• Daily service on our North America routes between the State of Hawai’i and Los Angeles,Oakland, Sacramento, San Diego, San Francisco and San Jose, California; Las Vegas, Nevada;
4
Phoenix, Arizona; Portland, Oregon; and Seattle, Washington; and scheduled service between theState of Hawai’i and New York City, New York.
• Daily service on our Neighbor Island routes among the six major islands of the State of Hawai’i.
• Daily service on our International routes between the State of Hawai’i and Sydney, Australia;and Tokyo and Osaka, Japan and scheduled service between the State of Hawai’i and Pago Pago,American Samoa; Papeete, Tahiti; Brisbane, Australia; Auckland, New Zealand; Sapporo, Japan;Seoul, South Korea; and Beijing, China.
• Other ad hoc charters.
Fuel
Our operations and financial results are significantly affected by the availability and price of jet fuel.The following table sets forth statistics about our aircraft fuel consumption and cost.
Gallons Total cost, Average cost Percent ofYear consumed including taxes per gallon operating expenses
(in thousands)
2015 . . . . . . . . . . . . . . . . . . . . . . . . . . . . . . . . 234,183 $417,728 $1.78 22.1%2014 . . . . . . . . . . . . . . . . . . . . . . . . . . . . . . . . 230,199 $678,253 $2.95 32.8%2013 . . . . . . . . . . . . . . . . . . . . . . . . . . . . . . . . 226,214 $698,802 $3.09 34.6%
As illustrated by the table above, fuel costs constitute a significant portion of our operating expenses.We purchase aircraft fuel at prevailing market prices, but seek to manage market risk through theexecution of a hedging strategy. To manage economic risks associated with fluctuations in aircraft fuelprices, we periodically enter into derivative financial instruments such as heating oil puts and swaps andcrude oil call and put options and collars.
Aircraft Maintenance
Our aircraft maintenance programs consist of a series of phased or continuous checks for each aircrafttype. These checks are performed at specified intervals measured by calendar months, time flown or bythe number of takeoffs and landings, or cycles operated. In addition, we perform inspections, repairsand modifications of our aircraft in response to Federal Aviation Administration (FAA) directives.Checks range from ‘‘walk around’’ inspections before each flight’s departure, to major overhauls of theairframes which can take several weeks to complete. Aircraft engines are subject to phasedmaintenance programs designed to detect and remedy potential problems before they occur. Theservice lives of certain airframe and engine parts and components are time or cycle controlled, andsuch parts and components are replaced or refurbished prior to the expiration of their time or cyclelimits. We have contracts with third parties to provide certain maintenance on our aircraft and aircraftengines.
Marketing and Ticket Distribution
We utilize various distribution channels including our website, www.hawaiianairlines.com, primarily forour North America and Neighbor Island routes, and travel agencies and wholesale distributorsprimarily for our International routes.
Our website, now available in English, Japanese, Korean and Chinese, offers our customers informationon our flight schedules, information on our HawaiianMiles frequent flyer program, the ability to bookreservations on our flights or connecting flights with any of our code-share partners, the status of ourflights as well as the ability to purchase hotels, cars and vacation packages. We also publish fares withweb-based travel services such as Orbitz, Travelocity, Expedia, Hotwire and Priceline. These
5
comprehensive travel planning websites provide customers with convenient online access to airline,hotel, car rental and other travel services.
Frequent Flyer Program
The HawaiianMiles frequent flyer program was initiated in 1983 to encourage and develop customerloyalty. HawaiianMiles allows passengers to earn mileage credits by flying with us and our partnercarriers. In addition, members earn mileage credits for patronage with our other program partners,including credit card issuers, hotels, car rental firms and general merchants, pursuant to our exchangepartnership agreements. We also sell mileage credits to other companies participating in the program.
HawaiianMiles members have a choice of various awards based on accumulated mileage credits, withmost of the awards being for free air travel on Hawaiian.
HawaiianMiles accounts with no activity (frequent flyer miles earned or redeemed) for 18 monthsautomatically expire (36 months for non-U.S. members). The number of free travel awards used fortravel on Hawaiian was approximately 512,000 in 2015. The amount of free travel awards as apercentage of total revenue passengers was approximately 5% in 2015. We believe displacement ofrevenue passengers is minimal due to our ability to manage frequent flyer seat inventory, and therelatively low ratio of free award usage to total revenue passengers.
Code-Share and Other Alliances
We have marketing alliances with other airlines that provide reciprocal frequent flyer mileage accrualand redemption privileges and code-shares on certain flights (one carrier placing its name and flightnumbers, or code, on flights operated by the other carrier). These programs enhance our revenueopportunities by:
• increasing value to our customers by offering easier access to more travel destinations and bettermileage accrual/redemption opportunities;
• gaining access to more connecting traffic from other airlines; and
• providing members of our alliance partners’ frequent flyer programs an opportunity to travel onour system while earning mileage credit in the alliance partners’ programs.
Our marketing alliances with other airlines as of December 31, 2015 were as follows:
Code-share—Hawaiian Code-share—OtherHawaiian Miles Other Airline Flight # on Flights Airline Flight # onFrequent Flyer Frequent Flyer Operated by Other Flights Operated by
Agreement Agreement Airline Hawaiian
Air China . . . . . . . . . . . . . . . . No No Yes YesAll Nippon Airways (ANA) . . . Yes Yes Yes YesAmerican Airlines (American) . Yes Yes No YesChina Airlines . . . . . . . . . . . . . Yes Yes Yes YesDelta Air Lines (Delta) . . . . . . No Yes No YesJetBlue . . . . . . . . . . . . . . . . . . Yes Yes Yes NoKorean Air . . . . . . . . . . . . . . . Yes Yes Yes YesUnited Airlines (United) . . . . . No Yes No YesVirgin America (Virgin) . . . . . . Yes Yes Yes NoVirgin Atlantic Airways . . . . . . Yes Yes No NoVirgin Australia . . . . . . . . . . . Yes Yes No Yes
Although these programs and services increase our ability to be more competitive, they also increaseour reliance on third parties.
6
Competition
The airline industry is extremely competitive. We believe that the principal competitive factors in theairline industry are:
• Price;
• Flight frequency and schedule;
• On-time performance and reliability;
• Name recognition;
• Marketing affiliations;
• Frequent flyer benefits;
• Customer service;
• Aircraft type; and
• In-flight services.
North America—We face multiple competitors on our North America routes including major networkcarriers such as Alaska Airlines, American, United, Delta and Virgin. Various charter companies alsoprovide non scheduled service to Hawai’i mostly under public charter arrangements.
Neighbor Island—Our Neighbor Island competitors consist of regional carriers, which include IslandAir, Mokulele Airlines and a number of other ‘‘air taxi’’ companies.
International—Currently, we are the only provider of direct service between Honolulu and each ofSapporo, Japan; Pago Pago, American Samoa; and Papeete, Tahiti. However, we face multiplecompetitors from both domestic and foreign carriers on our other International routes.
Employees
As of December 31, 2015, we had 5,548 active employees, and approximately 84% of our employeeswere covered by labor agreements with the following organized labor groups:
Number of AgreementEmployee Group Represented by Employees amendable on(*)
Flight deck crew members . . . . . . . . . Air Line Pilots Association 606 September 15, 2015(ALPA)
Cabin crew members . . . . . . . . . . . . . Association of Flight Attendants 1,704 January 1, 2017(AFA)
Maintenance and engineeringpersonnel . . . . . . . . . . . . . . . . . . . International Association of 782 April 20, 2014(**)
Machinists and AerospaceWorkers (IAM-M)
Clerical . . . . . . . . . . . . . . . . . . . . . . IAM-C 1,518 January 1, 2014(**)Flight dispatch personnel . . . . . . . . . Transport Workers Union 39 November 1, 2013
(TWU)
(*) Our relations with our labor organizations are governed by Title II of the Railway Labor Act of1926, pursuant to which the collective bargaining agreements between us and these organizationsdo not expire but instead become amendable as of a certain date if either party wishes to modifythe terms of the agreement.
(**) These agreements were amended in January 2016 and become amendable again in January 2021.
7
Seasonality
Hawai’i is a popular vacation destination for travelers. For that reason, our operations and financialresults are subject to substantial seasonal and cyclical volatility, primarily due to leisure and holidaytravel patterns. Demand levels are typically weaker in the first quarter of the year with strongerdemand periods occurring during June, July, August and December. We may adjust our pricing or theavailability of particular fares to obtain an optimal passenger load factor depending on seasonaldemand differences.
Customers
Our business is not dependent upon any single customer, or a few customers. The loss of any onecustomer would not have a material adverse effect on our business.
Regulation
Our business is subject to extensive and evolving federal, state and local laws and regulations. Manygovernmental agencies regularly examine our operations to monitor compliance with applicable lawsand regulations. Governmental authorities can enforce compliance with applicable laws and regulationsand obtain injunctions or impose civil or criminal penalties or modify, suspend or revoke our operatingcertificates in case of violations.
Industry Regulations
We are subject to the regulatory jurisdiction of the U.S. Department of Transportation (DOT) and theFederal Aviation Administration (FAA). The DOT has jurisdiction over international routes and faresfor some countries (based upon treaty relations with those countries), consumer protection policiesincluding baggage liability and denied boarding compensation, and unfair competitive practices as setforth in the Airline Deregulation Act of 1978. The FAA has regulatory jurisdiction over flightoperations, including equipment, ground facilities, security systems, maintenance and other safetymatters. Pursuant to these regulations, we have established, and the FAA has approved, a maintenanceprogram for each type of aircraft we operate that provides for the ongoing maintenance of our aircraft,ranging from frequent routine inspections to major overhauls.
Maintenance Directives
The FAA approves all airline maintenance programs, including modifications to the programs. Inaddition, the FAA licenses the repair stations and mechanics that perform inspections, repairs andoverhauls, as well as the inspectors who monitor the work.
The FAA frequently issues airworthiness directives, often in response to specific incidents or reports byoperators or manufacturers, requiring operators of specified equipment types to perform prescribedinspections, repairs or modifications within stated time periods or numbers of cycles. In the last severalyears, the FAA has issued a number of maintenance directives and other regulations relating to, amongother things, wiring requirement for aging aircraft, fuel tank flammability, cargo compartment firedetection/suppression systems, collision avoidance systems, airborne windshear avoidance systems, noiseabatement and increased inspection requirements.
Airport Security
The Aviation and Transportation Security Act (ATSA) mandates that the Transportation SecurityAdministration (TSA) provide for the screening of all passengers and property, including mail, cargo,carry-on and checked baggage, and other articles that will be carried aboard a passenger aircraft.Under the ATSA, substantially all security screeners at airports are federal employees and significant
8
other elements of airline and airport security are now overseen and performed by federal employees,including security managers, law enforcement officers and Federal Air Marshals. The ATSA alsoprovides for increased security on flight decks of aircraft and requires Federal Air Marshals to bepresent on certain flights, improved airport perimeter access security, airline crew security training,enhanced security screening of passengers, baggage, cargo, mail, employees and vendors, enhancedtraining and qualifications of security screening personnel, provision of passenger data to U.S. Customsand Border Protection and enhanced background checks.
The TSA also has the authority to impose additional fees on the air carriers, if necessary, to coveradditional federal aviation security costs.
Environmental and Employee Safety and Health
We are subject to various laws and government regulations concerning environmental matters andemployee safety and health in the U.S. and other countries in which we do business. Many aspects ofairlines’ operations are subject to increasingly stringent federal, state, local and foreign laws protectingthe environment. U.S. federal laws that have a particular impact on us include the Airport Noise andCapacity Act of 1990, the Clean Air Act, the Resource Conservation and Recovery Act, the CleanWater Act, the Safe Drinking Water Act, and the Comprehensive Environmental Response,Compensation, and Liability Act. Certain of our operations are also subject to the oversight of theOccupational Safety and Health Administration (OSHA) concerning employee safety and healthmatters. The U.S. Environmental Protection Agency (EPA), OSHA, and other federal agencies havebeen authorized to promulgate regulations that affect our operations. In addition to these federalactivities, various states have been delegated certain authority under the aforementioned federalstatutes. Many state and local governments have adopted environmental and employee safety andhealth laws and regulations, some of which are similar to or stricter than federal requirements, such asCalifornia.
The EPA is authorized to regulate aircraft emissions and has historically implemented emissions controlstandards previously adopted by the International Civil Aviation Organization. Our aircraft comply withthe existing EPA standards as applicable by engine design date.
We seek to minimize the impact of carbon emissions from our operations through reductions in ourfuel consumption and other efforts. We have reduced the fuel needs of our aircraft fleet through theretirement and replacement of certain elements of our fleet and with newer, more fuel efficientaircraft. In addition, we have implemented fuel saving procedures in our flight and ground supportoperations that further reduce carbon emissions. In 2012, we earned the first-ever aviation basedcarbon credits, through the reduction of our carbon dioxide emissions with the use of an eco-friendlyengine washing technology. We are also supporting efforts to develop alternative fuels and efforts tomodernize the air traffic control system in the U.S. as part of our efforts to reduce our emissions andminimize our impact on the environment.
Noise Abatement
Under the Airport Noise and Capacity Act, the DOT allows local airport authorities to implementprocedures designed to abate special noise problems, provided such procedures do not unreasonablyinterfere with interstate and foreign commerce, or the national transportation system. Certain airports,including the major airports at Los Angeles, San Diego, San Francisco, and San Jose, California,Sydney, Australia and Tokyo, Japan, have established airport restrictions to limit noise, includingrestrictions on aircraft types to be used and limits on the number of hourly or daily operations or thetime of such operations. Local authorities at other airports could consider adopting similar noiseregulations. In some instances, these restrictions have caused curtailments in services or increases inoperating costs, and such restrictions could limit our ability to expand our operations.
9
Civil Reserve Air Fleet Program
The U.S. Department of Defense regulates the Civil Reserve Air Fleet (CRAF) and governmentcharters. We have elected to participate in the CRAF program by agreeing to make aircraft available tothe federal government for use by the U.S. military under certain stages of readiness related to nationalemergencies. The program is a standby arrangement that allows the U.S. Department of Defense U.S.Transportation Command to call on as many as 13 contractually committed Hawaiian aircraft and crewsto supplement military airlift capabilities. None of our aircraft are presently mobilized under thisprogram.
Other Regulations
The State of Hawai’i is uniquely dependent upon air transportation. The 2008 shutdowns of air carriersAloha Airlines and ATA Airlines affected the State of Hawai’i, and its legislature responded byenacting legislation that reflects and attempts to address its concerns. For example, House Bill 2250HD1, Act 1 of the 2008 Special Session, establishes a statutory scheme for the regulation of Hawai’ineighbor island air carriers, provided that federal legislation is enacted to permit its implementation.Congress has not enacted any legislation that would allow this legislation to go into effect.
Additionally, several aspects of airline operations are subject to regulation or oversight by federalagencies other than the FAA and the DOT. Federal antitrust laws are enforced by the U.S. Departmentof Justice. The U.S. Postal Service has jurisdiction over certain aspects of the transportation of mailand related services provided by our cargo services. Labor relations in the air transportation industryare generally regulated under the Railway Labor Act. We and other airlines certificated prior toOctober 24, 1978 are also subject to preferential hiring rights granted by the Airline Deregulation Actto certain airline employees who have been furloughed or terminated (other than for cause). TheFederal Communications Commission issues licenses and regulates the use of all communicationsfrequencies assigned to us and the other airlines. There is increased focus on consumer protection bothon the federal and state level. We cannot predict the cost of such requirements on our operations.
Additional laws and regulations are proposed from time to time, which could significantly increase thecost of airline operations by imposing additional requirements or restrictions. U.S. law restricts theownership of U.S. airlines to corporations where no more than 25% of the voting stock may be held bynon-U.S. citizens and the airline must be under the actual control of U.S. citizens. The President andtwo thirds of the Board of Directors and other managing officers must also be U.S. citizens.Regulations also have been considered from time to time that would prohibit or restrict the ownershipand/or transfer of airline routes or takeoff and landing slots and authorizations. Also, the award ofinternational routes to U.S. carriers (and their retention) is regulated by treaties and relatedagreements between the U.S. and foreign governments, which are amended from time to time. Wecannot predict what laws and regulations will be adopted or what changes to international airtransportation treaties will be adopted, if any, or how we will be affected by those changes.
Business Segment Data
We operate in a single industry segment. All required financial segment information can be found inthe consolidated financial statements.
Information about Geographic Revenue and Foreign Operations
Information concerning revenues by geographic area is set forth in Note 14 to the consolidatedfinancial statements.
10
Available Information
General information about us, including the charters for the committees of our Board of Directors, canbe found at https://www.hawaiianairlines.com . Our annual reports on Form 10-K, quarterly reports onForm 10-Q and current reports on Form 8-K, as well as any amendments and exhibits to those reports,are available free of charge through our website as soon as reasonably practicable after weelectronically file them with, or furnish them to, the Securities and Exchange Commission (SEC). TheSEC maintains an Internet site that contains reports, proxy and information statements, and otherinformation regarding issuers that file electronically with the SEC, which can be found athttp://www.sec.gov . Information on our website is not incorporated into this Annual Report onForm 10-K or our other securities filings and is not a part of such filings.
ITEM 1A. RISK FACTORS.
In addition to the risks identified elsewhere in this report, the following risk factors apply to ourbusiness, results of operations and financial conditions:
ECONOMIC RISKS
Our business is affected by global economic volatility.
Our business and results of operations are significantly impacted by general world-wide economicconditions. Demand for discretionary purchases including air travel and vacations to Hawai’i remainsunpredictable. Deterioration in demand resulting from economic uncertainty or another recession mayresult in a reduction in our passenger traffic and/or increased competitive pressure on fares in themarkets we serve, resulting in a negative impact to our results of operations and financial condition.We cannot assure that we would be able to offset such revenue reductions by reducing our costs.
Our business is highly dependent on tourism to, from and amongst the Hawaiian Islands and our financialresults could suffer if there is a downturn in tourism levels.
Our principal base of operations is in Hawai’i and our revenue is linked primarily to the number oftravelers (mostly tourists) to, from and amongst the Hawaiian Islands. Hawai’i tourism levels areaffected by, among other things, the political and economic climate in Hawai’i’s main tourism markets,the availability of hotel accommodations, promotional spending by competing destinations, thepopularity of Hawai’i as a tourist destination relative to other vacation destinations and other globalfactors, including natural disasters, safety and security. From time to time, various events and industryspecific problems such as labor strikes have had a negative impact on tourism in Hawai’i. Theoccurrence of natural disasters, such as earthquakes and tsunamis, in Hawai’i or other parts of theworld, could also have a material adverse effect on Hawai’i tourism. In addition, the potential or actualoccurrence of terrorist attacks, wars, and the threat of other negative world events have had, and mayin the future again have, a material adverse effect on Hawai’i tourism. No assurance can be given thatthe level of passenger traffic to Hawai’i will not decline in the future. A decline in the level of Hawai’ipassenger traffic could have a material adverse effect on our results of operations and financialcondition.
Our business is exposed to foreign currency exchange rate fluctuations.
Our business is expanding internationally with an increasing percentage of our passenger revenuegenerated from our International routes. Fluctuations in foreign currencies can significantly affect ourresults of operations and financial condition. To manage the effects of fluctuating exchange rates, weperiodically enter into foreign currency forward contracts. There is no assurance that such agreementswill protect us against foreign currency exchange rate fluctuations during unfavorable market conditionsor that our counterparties will be able to perform under these hedge arrangements.
11
Our business is highly dependent on the price and availability of fuel.
Our results and operations are heavily impacted by the price and availability of jet fuel. While we havebenefited recently from lower fuel costs, we cannot assure you that fuel costs will remain low in thefuture. The cost and availability of jet fuel remain volatile and are subject to political, economic andmarket factors that are generally outside of our control. Prices may be affected by many factorsincluding, without limitation, the impact of political instability, crude oil production and refiningcapacity, unexpected changes in the availability of petroleum products due to disruptions at distributionsystems or refineries, unpredicted increases in demand due to weather or the pace of global economicgrowth, inventory reserve levels of crude oil and other petroleum products, the relative fluctuationbetween the U.S. dollar and other major currencies and the actions of speculators in commoditymarkets. Because of the effects of these factors on the price and availability of jet fuel, the cost andfuture availability of fuel cannot be predicted with any degree of certainty. Also, due to the competitivenature of the airline industry, there can be no assurance that we will be able to increase our fares orother fees to sufficiently offset increased fuel prices.
We enter into derivative agreements to protect against the volatility of fuel costs. There is no assurancethat such agreements will protect us during unfavorable market conditions or that our counterpartieswill be able to perform under these hedge arrangements. Also, if fuel prices fall significantly below thelevels in existence at the time we enter into our hedging contracts, we may be required to post asignificant amount of cash collateral, which could have an impact on the level of our unrestricted cashand cash equivalents and adversely affect our liquidity.
Also, see Item 7A, Quantitative and Qualitative Disclosures About Market Risk, for further informationregarding our exposure to the price of fuel.
COMPETITIVE ENVIRONMENT RISKS
We operate in an extremely competitive environment.
The airline industry is characterized by low profit margins, high fixed costs and significant pricecompetition. We currently compete with other airlines on our Neighbor Island, North America andInternational routes. The commencement of, or increase in, service on our routes by existing or newcarriers could negatively impact our operating results. Many of our competitors on our North Americaand International routes are larger and have greater financial resources and brand recognition than wedo. Aggressive marketing tactics or a prolonged fare war initiated by one or more of these competitorscould adversely affect our financial resources and our ability to compete in these markets. Since airlinemarkets have few natural barriers to entry, we also face the threat of new entrants in all of ourmarkets. For example, Virgin launched flights from the West Coast to Hawai’i in the fourth quarter of2015, and while Southwest Airlines has taken steps to enable it to provide service to Hawai’i in thefuture, it has yet to formally announce the service.
Furthermore, large network carriers have significantly reduced their costs and adjusted their routes tocompete with low-cost carriers (LCC) in their existing markets by diverting resources to long-haulmarkets such as Hawai’i, where LCC competition has been less severe. Additional capacity to Hawai’i,whether from network carriers or LCCs, could decrease our share of the markets in which we operate,could cause a decline in our yields, or both, which could have a material adverse effect on our resultsof operations and financial condition.
Airline bankruptcy restructuring, strategic combinations or industry consolidation could have an impact onour competitive environment.
Many of our competitors have dramatically reduced operating costs through a combination ofbankruptcy restructuring, industry consolidation and vendor and labor negotiations to increase market
12
strength. Several domestic airlines were able to reduce labor costs, restructure debt and leaseagreements and implement other financial improvements through the bankruptcy process. In addition,certain of our competitors have merged (for example, the American Airlines and US Airways merger inDecember 2013) to create larger and more financially sound airlines.
Through consolidation, carriers have the opportunity to achieve cost reductions by eliminatingredundancy in their networks and operating structures. With reduced costs, these competitors are morecapable of operating profitably in an environment of reduced fares and may, as a result, increaseservice in our primary markets or reduce fares to attract additional customers. Because airlinecustomers are price sensitive, we cannot ensure that we will be able to attract a sufficient number ofcustomers at sufficiently high fare levels to generate profitability, or that we will be able to reduce ouroperating costs sufficiently to remain competitive with these other airlines.
The concentration of our business in Hawai’i, and between Hawai’i and the U.S. mainland, provides littlediversification of our revenue.
During fiscal year 2015, approximately 75% of our passenger revenue was generated from airtransportation between the Hawaiian Islands and the U.S. mainland, and amongst the HawaiianIslands. Many of our competitors, particularly major network carriers with whom we compete on ourNorth America routes, enjoy greater geographical diversification of their revenue. A reduction in thelevel of demand for travel within Hawai’i, or to Hawai’i from the U.S. mainland, or an increase in thelevel of industry capacity on these routes may reduce the revenue we are able to generate andadversely affect our financial results. As these routes account for a significantly higher proportion ofour revenue than they do for many of our competitors, such a reduction would have a relatively greateradverse effect on our financial results.
Our business is affected by the competitive advantages held by network carriers in the North America market.
During fiscal year 2015, over 50% of our passenger revenue was generated from our North Americaroutes. The majority of competition on our North America routes is from network carriers such asAlaska, American, Delta and United that have a number of competitive advantages. Primarily, networkcarriers generate passenger traffic from and throughout the U.S. mainland, which enable them toattract higher customer traffic levels as compared to us.
In contrast, we lack a comparable direct network to feed passengers to our North America flights andare therefore more reliant on passenger demand in the specific cities we serve. We also rely on ourcode-share partner agreements (jetBlue, Virgin, America Airlines, etc.) to provide customers access toand from North America destinations currently unserved by us. Most network carriers operate fromhubs, which can provide a built-in market of passengers, depending on the economic strength of thehub city and the size of the customer group that frequent the airline. Our Honolulu and Maui hubs donot originate a large proportion of North American travel, nor do they have the population or potentialcustomer franchise of a larger city to provide us with a built-in market. Passengers in the NorthAmerica market, for the most part, do not originate in Honolulu, but rather on the U.S. mainland,making Honolulu primarily a destination rather than an origin of passenger traffic.
Our Neighbor Island routes are affected by increased capacity provided by our competitors.
During fiscal year 2015, approximately 25% of our passenger revenue was generated from ourNeighbor Island routes. Although we enjoy a strong competitive position on the Neighbor Islandservice, our competitors have increased capacity to Hawai’i either by introducing new routes orincreasing the frequency of existing routes from North America to the Neighbor Islands. Thisadditional capacity provided by our competitors has the effect of decreasing our share of traffic on our
13
Neighbor Island routes, which could have a material adverse effect on our results of operations andfinancial condition.
Our International routes are affected by competition from domestic and foreign carriers.
During fiscal year 2015, approximately 20% of our revenue was generated from our Internationalroutes. Our competitors on these routes include both domestic and foreign carriers. Both domestic andforeign competitors have a number of competitive advantages that may enable them to attract highercustomer traffic levels as compared to us.
Many of our domestic competitors have joined airline alliances, which provide customers access to eachparticipating airline’s international network, allowing for convenience and connectivity to theirdestinations. These alliances formed by our domestic competitors have increased in recent years. Insome instances our domestic competitors have been granted antitrust exemptions to form joint venturearrangements in certain geographies, further deepening their cooperation on certain routes. Wecurrently do not participate in a world-wide airline alliance or any joint ventures, which may negativelyimpact our market share and operations as capacity provided by our competitors increase. To mitigatethis risk, we rely on code-share agreements with partner airlines to provide customers access tointernational destinations currently unserved by us.
Many of our foreign competitors are network carriers that benefit from network feed to supportInternational routes on which we compete. In contrast, we lack a comparable direct network to feedpassengers to our International flights, and are therefore more reliant on passenger demand in thespecific destinations that we serve. Most network carriers operate from hubs, which can provide abuilt-in home base market of passengers. Passengers on our International routes, for the most part, donot originate in Hawai’i, but rather internationally, in these foreign markets’ home base. We also relyon our code-share agreements and our relationships with travel agencies and wholesale distributors toprovide customers access to and from International destinations currently unserved by us.
INFORMATION TECHNOLOGY AND THIRD-PARTY RISKS
If we do not maintain the privacy and security of customer-related information or fail to comply withapplicable U.S. and foreign privacy or data security regulations or security standards imposed by ourcommercial partners, we could damage our reputation, incur substantial additional costs and become subjectto litigation or regulatory penalties.
We receive, retain, and transmit certain personal information about our customers and we are subjectto increasing legislative, regulatory and customer focus on privacy issues and data security. A numberof our commercial partners, including credit card companies, have imposed data security standards thatwe are obligated to meet and these standards continue to evolve. We will continue our efforts to meetnew and increasing privacy and security standards; however, it is possible that such new standards mayprove difficult to meet and require us to expend additional resources. Additionally, any compromise ofour technology systems could result in the loss, disclosure, misappropriation of or access to ourcustomers’, employees’ or business partners’ information. Any such loss, disclosure, misappropriation oraccess could result in legal claims or proceedings, liability or regulatory penalties under laws protectingthe privacy of personal information. Any significant data breach or our failure to comply withapplicable U.S. and foreign privacy or data security regulations or security standards imposed by ourcommercial partners may adversely affect our reputation, business, results of operations and financialcondition and may require that we expend significant additional resources related to the security ofinformation systems.
14
We are increasingly dependent on technology and automated systems to operate our business.
We depend heavily on technology and automated systems to effectively operate our business. Thesesystems include flight operations systems, communications systems, airport systems, reservationssystems, management and accounting systems, commercial websites, including www.hawaiianairlines.com,and other systems, all of which must be able to accommodate high traffic volumes, maintain secureinformation and provide accurate flight information, as well as process critical financial relatedtransactions. Any substantial or repeated failures of these systems could negatively affect our customerservice, compromise the security of customer information, result in the loss of important data, loss ofrevenue and increased costs, and generally harm our business. Like other companies, our systems maybe vulnerable to disruptions due to events beyond our control, including natural disasters, powerdisruptions, software or equipment failures, terrorist attacks, cybersecurity threats, computer viruses andhackers. There can be no assurance that the measures we have taken to reduce the adverse effects ofcertain potential failures or disruptions are adequate to prevent or remedy disruptions of our systems.In addition, we will need to continuously make significant investments in technology to periodicallyupgrade and replace existing systems. If we are unable to make these investments or fail to successfullyimplement, upgrade or replace our systems, our business could be adversely impacted.
We are highly reliant on third-party contractors to provide certain facilities and services for our operations,and termination of our third-party agreements could have a potentially adverse effect on our financial results.
We have historically relied on outside vendors for a variety of services and functions critical to ourbusiness, including aircraft maintenance and parts, code-sharing, reservations, computer servicesincluding hosting and software maintenance, accounting, frequent flyer programs, passenger processing,ground facilities, baggage and cargo handling, personnel training and the distribution and sale of airlineseats. As part of our cost-control efforts, our reliance on outside vendors has increased and maycontinue to do so in the future.
The failure of any of our third-party service providers to adequately perform our service obligations, orother interruptions of services, may reduce our revenues, increase expenses, and prevent us fromoperating our flights and providing other services to our customers. In addition, our business andfinancial performance could be materially harmed if our customers believe that our services areunreliable or unsatisfactory.
LABOR RELATIONS AND RELATED COSTS RISKS
We are dependent on satisfactory labor relations.
Labor costs are a significant component of airline expenses and can substantially impact an airline’sresults of operations. A significant portion of our workforce is represented by labor unions. We maymake strategic and operational decisions that require the consent of one or more of these labor unions,and these labor unions could demand additional wages, benefits or other consideration in return fortheir consent.
In addition, we have entered into collective bargaining agreements with our pilots, mechanical groupemployees, clerical group employees, flight attendants and dispatchers. We cannot ensure that futureagreements with our employees’ labor unions will be on terms in line with our expectations orcomparable to agreements entered into by our competitors, and any future agreements may increaseour labor costs or otherwise adversely affect our business. If we are unable to reach an agreement withany unionized work group, we may be subject to future work interruptions and/or stoppages, which mayhamper or halt operations.
15
Our operations may be adversely affected if we are unable to attract and retain qualified personnel and keyexecutives.
We are dependent on the knowledge and expertise of our key executives. Attracting and retaining suchpersonnel in the airline industry is highly competitive. We cannot be certain that we will be able toretain our key executives or attract other qualified personnel in the future. Any inability to retain ourkey executives, or attract and retain additional qualified executives, could have a negative impact onour operations.
In addition, as we continue to expand our operations through the acquisition of new aircraft andintroduction of service to new markets, it may be challenging to attract qualified personnel includingpilots, mechanics and other skilled labor. As we compete with other carriers for qualified personnel wealso face the challenge of attracting individuals who embrace our team-oriented, friendly and customer-driven corporate culture. Our inability to attract and retain qualified personnel who embrace ourcorporate culture could have a negative impact on our reputation and overall operations.
A higher than normal number of pilot retirements could adversely affect us.
We currently have a large number of pilots eligible for retirement. Among other things, the extensionof pilot careers facilitated by the FAA’s 2007 modification of the mandatory retirement age from age 60to age 65 has now been fully implemented, resulting in large numbers of pilots in the industryapproaching the revised mandatory retirement age. If pilot retirements were to exceed normal levels inthe future, and we are not able to replace these pilots in a timely fashion, it may adversely affect ouroperations.
STRATEGY AND BRAND RISKS
Our failure to successfully implement our route and network maturation strategy could harm our business.
Our route maturation strategy includes initiatives to increase revenue, decrease costs, mature ournetwork, and improve our distribution sales channels. It is critical that we execute upon our plannedstrategy in order for our business to attain economies of scale and to sustain or improve our results ofoperations. If we are unable to utilize and fill increased capacity provided by additional aircraftentering our fleet, hire and retain skilled personnel, or secure the required equipment and facilities in acost-effective manner, we may be unable to successfully develop and grow our existing markets, whichmay adversely affect our business and operations.
We continue to strive toward aggressive cost-containment goals which are an important part of ourbusiness strategy to offer the best value to passengers through competitive fares while maintainingacceptable profit margins and return on capital. We believe a lower cost structure will better position usto fund our strategy and take advantage of market opportunities. If we are unable to adequatelycontain our non-fuel unit costs, our financial results may suffer.
Our reputation and financial results could be harmed in the event of adverse publicity, including the event ofan aircraft accident or incident.
Our customer base is broad and our business activities have significant prominence, particularly inHawai’i and other destinations we serve. Consequently, negative publicity resulting from real orperceived shortcomings in our customer service, employee relations, business conduct, or other eventsaffecting our operations could negatively affect the public image of our company and the willingness ofcustomers to purchase services from us, which could affect our financial results.
Additionally, we are exposed to potential losses that may be incurred in the event of an aircraftaccident or incident. Any such accident or incident involving our aircraft or an aircraft operated by oneof our code-share partners could involve not only the repair or replacement of a damaged aircraft and
16
its consequential temporary or permanent loss of revenue, but also significant potential claims ofinjured passengers and others. We are required by the U.S. Department of Transportation (DOT) tocarry liability insurance, and although we currently maintain liability insurance in amounts consistentwith the industry, we cannot be assured that our insurance coverage will adequately cover us from allclaims and we may be forced to bear substantial losses incurred with the accident. In addition, anyaircraft accident or incident could cause a public perception that we are less safe or reliable than otherairlines, which would harm our business.
AIRLINE INDUSTRY, REGULATION AND RELATED COSTS RISKS
The airline industry has substantial operating leverage and is affected by many conditions that are beyond itscontrol, including delays, cancellations and other conditions, which could harm our financial condition andresults of operations.
The airline industry has historically operated on low gross profit margins as a result of a highpercentage of fixed costs. Due to these fixed costs, there is a disproportionate relationship between thecost of operating each flight and the number of passengers carried. However, the revenue generatedfrom a particular flight is directly related to the number of passengers carried and the respectiveaverage fares applied. Accordingly, a decrease in the number of passengers carried would cause acorresponding decrease in revenue (if not offset by higher fares), and it may result in adisproportionately greater decrease in profits. Therefore, any general reduction in airline passengertraffic as a result of any of the following or other factors, which are largely outside of our control,could harm our business, financial condition and results of operations:
• decline in general economic conditions;
• continued threat of terrorist attacks and conflicts overseas;
• actual or threatened war and political instability;
• increased security measures or breaches in security;
• adverse weather and natural disasters;
• changes in consumer preferences, perceptions or spending patterns;
• increased costs related to security and safety measures;
• increased fares as a result of increases in fuel costs;
• outbreak of contagious diseases or fear of contagion; and
• congestion at airports and actual or potential disruptions in the air traffic control system.
Our results from operations may be volatile due to the conditions identified above. We cannot ensurethat our financial resources will be sufficient to absorb the effects of any of these unexpected factorsshould they arise.
Our financial results and operations may be negatively affected by the State of Hawai’i’s airportmodernization plan.
The State of Hawai’i has begun to implement a modernization plan encompassing the airports we servewithin the State. Our landing fees and airport rent rates have increased to fund the modernizationprogram. Additionally, we expect the costs for our Neighbor Island operations to increase more thanthe costs related to our North America and International operations due to phased adjustments to theairport’s funding mechanism. Therefore, costs related to the modernization program will have a greaterimpact on our operations as compared to our competitors, who do not have significant Neighbor Islandoperations. We can offer no assurance that we will be successful in offsetting these cost increases
17
through other cost reductions or increases in our revenue and, therefore, can offer no assurance thatour future financial results will not be negatively affected by them.
The construction work that is performed in connection with the State’s modernization plan hastemporarily narrowed the taxilanes used by our aircraft to depart and arrive at our assigned terminal atHonolulu International Airport. The temporary narrowing of the taxilanes has congested the aircrafttraffic in these areas, which has resulted in the delay of the departure and arrival of our aircraft.Significant delays and potential displacement resulting from the State’s modernization plan may have anegative impact on our operations and on-time performance.
Our operations may be disrupted if we are unable to obtain and maintain adequate facilities andinfrastructure at airports within the State of Hawai’i.
We must be able to maintain and/or obtain adequate gates, office space, operations area and ticketingfacilities at the airports within the State of Hawai’i to be able to operate our existing and proposedflight schedules. Failure to maintain such facilities and infrastructure may adversely impact ouroperations and financial performance.
Our business is subject to substantial seasonal and cyclical volatility.
Our results of operations will reflect the impact of seasonal volatility primarily due to passenger leisureand holiday travel patterns. As Hawai’i is a popular vacation destination, demand from North America,our largest source of visitors, is typically stronger during June, July, August and December andconsiderably weaker at other times of the year. Because of fluctuations in our results from seasonality,operating results for a historical period are not necessarily indicative of operating results for a futureperiod and operating results for an interim period are not necessarily indicative of operating results foran entire year.
Terrorist attacks or international hostilities, or the fear of terrorist attacks or hostilities, even if not madedirectly on the airline industry, could negatively affect us and the airline industry.
Terrorist attacks, even if not made directly on the airline industry, or the fear of such attacks, hostilitiesor act of war, could adversely affect the airline industry, including us, and could result in a significantdecrease in demand for air travel, increased security costs, increased insurance costs coveringwar-related risks, and increased flight operational loss due to cancellations and delays. Any futureterrorist attacks or the implementation of additional security-related fees could have a material adverseeffect on our business, financial condition and results of operations and on the airline industry ingeneral.
The airline industry is subject to extensive government regulation, new regulations, and taxes which couldhave an adverse effect on our financial condition and results of operations.
Airlines are subject to extensive regulatory requirements that result in significant costs. Additional laws,regulations, taxes and airport rates and charges imposed by domestic and foreign governments havebeen proposed from time to time that could significantly increase the cost of airline operations orreduce revenue. For example, the ATSA, which became law in November 2001, mandates thefederalization of certain airport security procedures and imposes additional security requirements onairlines. The FAA from time to time issues directives and other regulations relating to the maintenanceand operation of aircraft that require significant expenditures. Some FAA requirements cover, amongother things, retirement of older aircraft, security measures, collision avoidance systems, airbornewindshear avoidance systems, noise abatement and other environmental concerns, commuter aircraftsafety and increased inspections and maintenance procedures to be conducted on older aircraft. A
18
failure to be in compliance, or a modification, suspension or revocation of any of our DOT/FAAauthorizations or certificates would have a material adverse impact on our operations.
We cannot predict the impact that laws or regulations may have on our operations, nor can we ensurethat laws or regulations enacted in the future will not adversely affect our business. Further we cannotguarantee that we will be able to obtain or maintain necessary governmental approvals. Once obtained,operating permits are subject to modification and revocation by the issuing agencies. Compliance withthese and any future regulatory requirements could require us to incur significant capital and operatingexpenditures.
In addition to extensive government regulations, the airline industry is dependent on certain servicesprovided by government agencies (DOT, FAA, etc.). For example, spending restrictions due to federalsequestration of air traffic controllers in the United States subject to furlough may lead to a reductionin air traffic control services. A reduction in such services could have a material adverse effect on ourresults of operations.
Furthermore, because of significantly higher security and other costs incurred by airports sinceSeptember 11, 2001, many airports have significantly increased their rates and charges to airlines,including us, and may do so again in the future.
The airline industry is required to comply with various environmental laws and regulations, which couldinhibit our ability to operate and could also have an adverse effect on our results of operations.
Many aspects of airlines’ operations are subject to increasingly stringent federal, state, local and foreignlaws protecting the environment. U.S. federal laws that have a particular impact on us include theAirport Noise and Capacity Act of 1990, the Clean Air Act, the Resource Conservation and RecoveryAct, the Clean Water Act, the Safe Drinking Water Act, the Comprehensive Environmental ResponseAct and the Compensation and Liability Act. Compliance with these and other environmental laws andregulations can require significant expenditures, and violations can lead to significant fines andpenalties. Governments globally are increasingly focusing on the environmental impact caused by theconsumption of fossil fuels and as a result have proposed or enacted legislation which may increase thecost of providing airline service or restrict its provision. We expect the focus on environmental mattersto increase.
Concern about climate change and greenhouse gases may result in additional regulation of aircraftemissions in the U.S. and abroad. As a result, we may become subject to taxes, charges or additionalrequirements to obtain permits or purchase allowances or emission credits for greenhouse gas emissionsin various jurisdictions, which could result in taxation or permitting requirements from multiplejurisdictions for the same operations.
Cap and trade restrictions have also been proposed in Congress. In addition, other legislative orregulatory action to regulate greenhouse gas emissions is possible. In particular, the EPA has foundthat greenhouse gases threaten the public health and welfare, which could result in regulation ofgreenhouse gas emissions from aircraft. In the event that legislation or regulation is enacted in the U.S.or in the event similar legislation or regulation is enacted in jurisdictions where we operate or wherewe may operate in the future, it could adversely affect operations and result in significant costs for usand the airline industry. At this time, we cannot predict whether any such legislation or regulationwould apportion costs between one or more jurisdictions in which we operate flights. Under thesesystems, certain credits may be available to reduce the costs of permits in order to mitigate the impactof such regulations on consumers, but we cannot predict whether we or the airline industry in generalwill have access to offsets or credits. We are monitoring and evaluating the potential impact of suchlegislative and regulatory developments.
19
In addition to direct costs, such regulation may have a greater effect on the airline industry throughincreases in fuel costs that could result from fuel suppliers passing on increased costs that they incurunder such a system. The impact to us and our industry from such actions is likely to be adverse andcould be significant, particularly if regulators were to conclude that emissions from commercial aircraftcause significant harm to the upper atmosphere or have a greater impact on climate change than otherindustries.
Our operations may be adversely affected by our expansion into non-U.S. jurisdictions and the related increasein laws to which we are subject.
The expansion of our operations into non-U.S. jurisdictions has expanded the scope of the laws towhich we are subject, both domestically and internationally. In addition, operations in non-U.S.jurisdictions are in many cases subject to the laws of those jurisdictions rather than U.S. law. Laws insome jurisdictions differ in significant respects from those in the United States, and these differencescan affect our ability to react to changes in our business. Further, enforcement of laws in somejurisdictions can be inconsistent and unpredictable, which can affect our ability to enforce our rightsand to undertake activities that we believe are beneficial to our business.
Our insurance costs are susceptible to significant increases and further increases in insurance costs orreductions in coverage could have an adverse effect on our financial results.
We carry types and amounts of insurance customary in the airline industry, including coverage forgeneral liability, passenger liability, property damage, aircraft loss or damage, baggage and cargoliability and workers’ compensation. We are required by the DOT to carry liability insurance on each ofour aircraft. We currently maintain commercial airline insurance with a major group of independentinsurers that regularly participate in world aviation insurance markets, including public liabilityinsurance and coverage for losses resulting from the physical destruction or damage to our aircraft.However, there can be no assurance that the amount of such coverage will not change or that we willnot bear substantial losses from accidents or damage to, or loss of, aircraft or other property due toother factors such as natural disasters. We could incur substantial claims resulting from an accident ordamage to, or loss of, aircraft or other property due to other factors such as natural disasters in excessof related insurance coverage that could have a material adverse effect on our results of operations andfinancial condition.
Following the terrorist attacks on September 11, 2001, our insurance costs increased significantly andthe availability of third-party war risk (terrorism) insurance decreased significantly. We have obtainedthird-party war risk (terrorism) insurance through a special program administered by the FAA. Anextension of such authority will require legislation by the U.S. Congress. Should the governmentdiscontinue this coverage, obtaining comparable coverage from commercial underwriters could result insubstantially higher premiums and more restrictive terms, if it is available at all. If we are unable toobtain adequate third-party war risk (terrorism) insurance, our business could be materially andadversely affected.
FLEET AND FLEET-RELATED RISKS
We are dependent on a limited number of suppliers for aircraft, aircraft engines and parts.
We are dependent on Airbus S.A.S. (Airbus) and The Boeing Company (Boeing) as our primarysuppliers of aircraft and aircraft-related items. As a result, we are vulnerable to any problemsassociated with the supply of those aircraft and parts which could result in increased parts andmaintenance costs in future years.
20
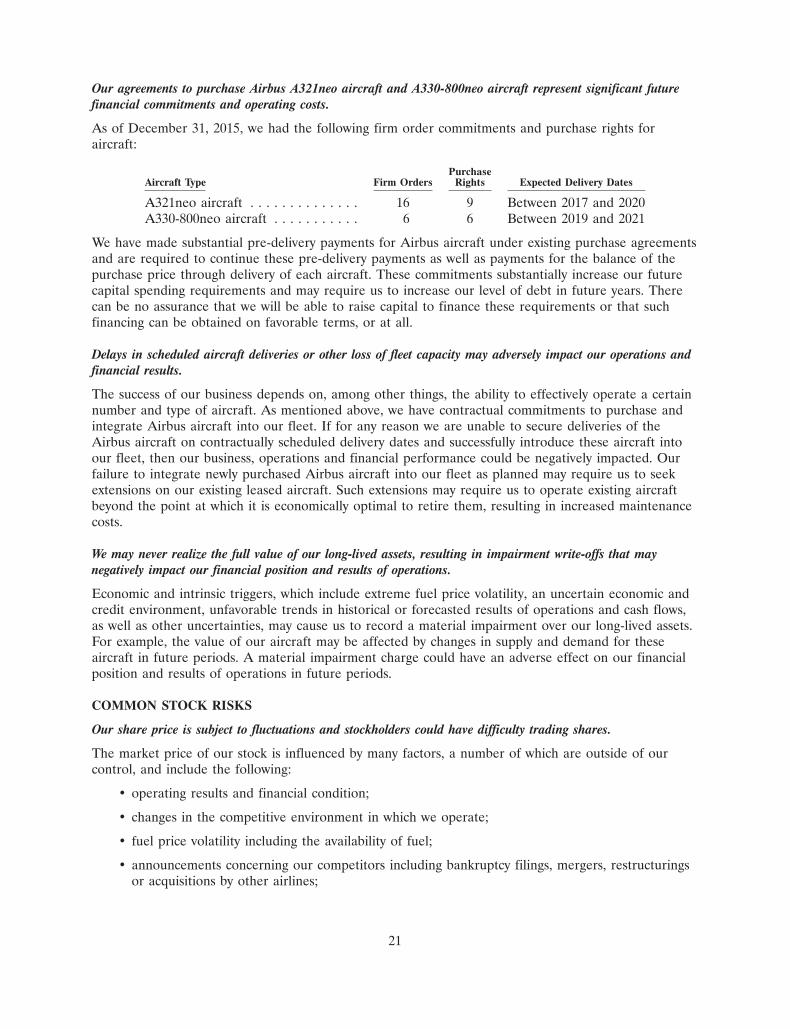
Our agreements to purchase Airbus A321neo aircraft and A330-800neo aircraft represent significant futurefinancial commitments and operating costs.
As of December 31, 2015, we had the following firm order commitments and purchase rights foraircraft:
PurchaseAircraft Type Firm Orders Rights Expected Delivery Dates
A321neo aircraft . . . . . . . . . . . . . . 16 9 Between 2017 and 2020A330-800neo aircraft . . . . . . . . . . . 6 6 Between 2019 and 2021
We have made substantial pre-delivery payments for Airbus aircraft under existing purchase agreementsand are required to continue these pre-delivery payments as well as payments for the balance of thepurchase price through delivery of each aircraft. These commitments substantially increase our futurecapital spending requirements and may require us to increase our level of debt in future years. Therecan be no assurance that we will be able to raise capital to finance these requirements or that suchfinancing can be obtained on favorable terms, or at all.
Delays in scheduled aircraft deliveries or other loss of fleet capacity may adversely impact our operations andfinancial results.
The success of our business depends on, among other things, the ability to effectively operate a certainnumber and type of aircraft. As mentioned above, we have contractual commitments to purchase andintegrate Airbus aircraft into our fleet. If for any reason we are unable to secure deliveries of theAirbus aircraft on contractually scheduled delivery dates and successfully introduce these aircraft intoour fleet, then our business, operations and financial performance could be negatively impacted. Ourfailure to integrate newly purchased Airbus aircraft into our fleet as planned may require us to seekextensions on our existing leased aircraft. Such extensions may require us to operate existing aircraftbeyond the point at which it is economically optimal to retire them, resulting in increased maintenancecosts.
We may never realize the full value of our long-lived assets, resulting in impairment write-offs that maynegatively impact our financial position and results of operations.
Economic and intrinsic triggers, which include extreme fuel price volatility, an uncertain economic andcredit environment, unfavorable trends in historical or forecasted results of operations and cash flows,as well as other uncertainties, may cause us to record a material impairment over our long-lived assets.For example, the value of our aircraft may be affected by changes in supply and demand for theseaircraft in future periods. A material impairment charge could have an adverse effect on our financialposition and results of operations in future periods.
COMMON STOCK RISKS
Our share price is subject to fluctuations and stockholders could have difficulty trading shares.
The market price of our stock is influenced by many factors, a number of which are outside of ourcontrol, and include the following:
• operating results and financial condition;
• changes in the competitive environment in which we operate;
• fuel price volatility including the availability of fuel;
• announcements concerning our competitors including bankruptcy filings, mergers, restructuringsor acquisitions by other airlines;
21
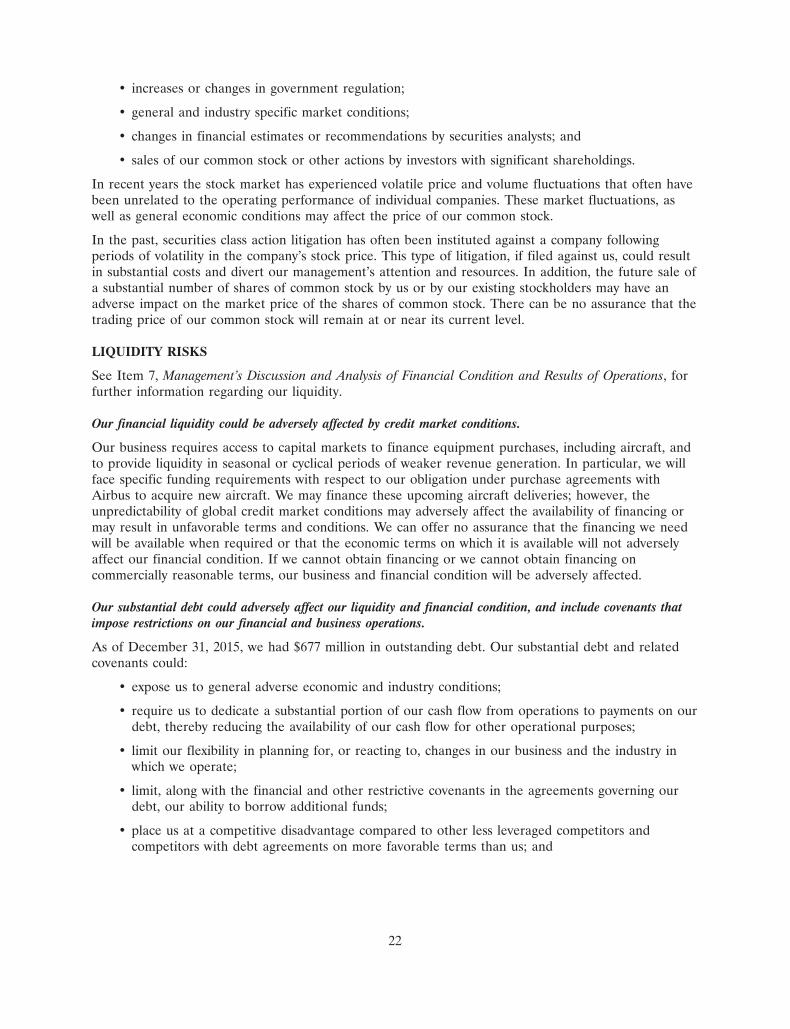
• increases or changes in government regulation;
• general and industry specific market conditions;
• changes in financial estimates or recommendations by securities analysts; and
• sales of our common stock or other actions by investors with significant shareholdings.
In recent years the stock market has experienced volatile price and volume fluctuations that often havebeen unrelated to the operating performance of individual companies. These market fluctuations, aswell as general economic conditions may affect the price of our common stock.
In the past, securities class action litigation has often been instituted against a company followingperiods of volatility in the company’s stock price. This type of litigation, if filed against us, could resultin substantial costs and divert our management’s attention and resources. In addition, the future sale ofa substantial number of shares of common stock by us or by our existing stockholders may have anadverse impact on the market price of the shares of common stock. There can be no assurance that thetrading price of our common stock will remain at or near its current level.
LIQUIDITY RISKS
See Item 7, Management’s Discussion and Analysis of Financial Condition and Results of Operations, forfurther information regarding our liquidity.
Our financial liquidity could be adversely affected by credit market conditions.
Our business requires access to capital markets to finance equipment purchases, including aircraft, andto provide liquidity in seasonal or cyclical periods of weaker revenue generation. In particular, we willface specific funding requirements with respect to our obligation under purchase agreements withAirbus to acquire new aircraft. We may finance these upcoming aircraft deliveries; however, theunpredictability of global credit market conditions may adversely affect the availability of financing ormay result in unfavorable terms and conditions. We can offer no assurance that the financing we needwill be available when required or that the economic terms on which it is available will not adverselyaffect our financial condition. If we cannot obtain financing or we cannot obtain financing oncommercially reasonable terms, our business and financial condition will be adversely affected.
Our substantial debt could adversely affect our liquidity and financial condition, and include covenants thatimpose restrictions on our financial and business operations.
As of December 31, 2015, we had $677 million in outstanding debt. Our substantial debt and relatedcovenants could:
• expose us to general adverse economic and industry conditions;
• require us to dedicate a substantial portion of our cash flow from operations to payments on ourdebt, thereby reducing the availability of our cash flow for other operational purposes;
• limit our flexibility in planning for, or reacting to, changes in our business and the industry inwhich we operate;
• limit, along with the financial and other restrictive covenants in the agreements governing ourdebt, our ability to borrow additional funds;
• place us at a competitive disadvantage compared to other less leveraged competitors andcompetitors with debt agreements on more favorable terms than us; and
22
• adversely affect our ability to secure additional financing in the future on acceptable terms or atall, which would impact our ability to fund our working capital, capital expenditures, acquisitionsor other general purpose needs.
The terms of certain of our financing agreements restrict our ability to, among other things, incuradditional indebtedness, issue preferred stock or pay dividends.
These agreements also require us to meet certain financial covenants. If we breach any of thesecovenants it could result in a default under these facilities, which could cause our outstandingobligations under these facilities to accelerate and become due and payable immediately, and couldalso cause us to default under our other debt or lease obligations and lead to an acceleration of theobligations related to such other debt or lease obligations. The existence of such a default could alsopreclude us from borrowing funds under our credit facilities.
Our ability to comply with the provisions of financing agreements can be affected by events beyond ourcontrol and a default under any such financing agreements if not cured or waived, could have amaterial adverse effect on us. In the event our debt is accelerated, we may not have sufficient liquidityto repay these obligations or to refinance our debt obligations, resulting in a material adverse effect onour financial condition.
We could be required to maintain reserves under our credit card processing agreements which could adverselyaffect our financial and business operations.
Under our bank-issued credit card processing agreements, certain proceeds from advance ticket salesmay be held back to serve as collateral to cover any possible chargebacks or other disputed chargesthat may occur. These holdbacks totaled $5.0 million as of December 31, 2015. In the event of amaterial adverse change in our business, the holdback could incrementally increase to an amount up to100% of the applicable credit card air traffic liability, which would also cause an increase in the level ofrestricted cash. If we are unable to obtain a waiver, or otherwise mitigate the increase in restrictedcash, it could adversely affect our liquidity and also cause a covenant violation under other debt orlease obligations and have a material adverse effect on our financial condition.
Our obligations for funding our defined benefit pension plans are significant and are affected by factorsbeyond our control.
We sponsor three defined benefit pension plans, as well as a separate plan to administer pilots’disability benefits. As of December 31, 2015, the unfunded pension and disability obligation related tothese plans was $201 million. The timing and amount of funding requirements depend upon a numberof factors, including labor negotiations and changes to pension plan benefits as well as factors outsideour control, such as the number and demographic data of qualified retiring employees, asset returns,interest rates and changes in pension laws. These factors, along with the impact of results that can varysignificantly from estimates, may significantly impact our funding requirements and have an adverseeffect on our financial condition.
Our ability to use our net operating loss (NOL) carryforwards to offset future taxable income for U.S. federalincome tax purposes may be significantly limited due to various circumstances, including certain possiblefuture transactions involving the sale or issuance of our common stock.
Our ability to use our NOL carryforwards may be limited if we experience an ‘‘ownership change’’ asdefined in Section 382 (Section 382) of the Internal Revenue Code of 1986, as amended. An ownershipchange generally occurs if certain stockholders increase their aggregate percentage ownership of acorporation’s stock by more than 50 percentage points over their lowest percentage ownership at anytime during the testing period, which is generally the three-year period preceding any potentialownership change.
23
There is no assurance that we will not experience a future ownership change under Section 382 thatmay significantly limit or possibly eliminate our ability to use our NOL carryforwards. Potential futuretransactions involving the sale or issuance of our common stock, including the issuance of our commonstock for cash and the acquisition or disposition of such stock by a stockholder owning 5% or more ofour common stock, or a combination of such transactions, may increase the possibility that we willexperience a future ownership change under Section 382.
Under Section 382, a future ownership change could subject us to additional annual limitations thatapply to the amount of pre-ownership change NOL carryforwards that may be used to offsetpost-ownership change taxable income. This limitation is generally determined by multiplying the valueof a corporation’s stock immediately before the ownership change by the applicable long-termtax-exempt rate. Any unused annual limitation may, subject to certain limits, be carried over to lateryears, and the limitation may under certain circumstances be increased by built-in gains (for example,the amount by which the fair market value of an asset exceeds our adjusted basis) in the assets held byus at the time of the ownership change. This limitation could cause our U.S. federal income taxes to begreater, or to be paid earlier, than they otherwise would be, and could cause all or a portion of ourNOL carryforwards to expire unused. Similar rules and limitations may apply for state income taxpurposes.
ITEM 1B. UNRESOLVED STAFF COMMENTS.
None.
ITEM 2. PROPERTIES.
Aircraft
The table below summarizes our total fleet as of December 31, 2014, 2015 and expected 2016 (basedon existing agreements):
Seating SimpleDecember 31, 2014 December 31, 2015 December 31, 2016 Capacity Average AgeAircraft Type Leased(4) Owned Total Leased(4) Owned Total Leased(4) Owned Total (Per Aircraft) (In Years)
A330-200(1) . . . . . . . . . 7 12 19 10 12 22 11 12 23 294 2.9767-300(2) . . . . . . . . . . 6 4 10 4 4 8 4 3 7 252 - 264 16.8717-200 . . . . . . . . . . . . 3 15 18 3 15 18 3 15 18 128 14.0ATR turboprop(3) . . . . . — 3 3 — 6 6 — 6 6 48 17.0
Total . . . . . . . . . . . . . . 16 34 50 17 37 54 18 36 54
(1) During 2015, we took delivery and placed into revenue service three Airbus A330-200 aircraft for service on our NorthAmerica and International routes. These aircraft were financed through purchase assignment and lease transactions. Theincrease in the number of leased aircraft in 2016 is due to the planned delivery of an aircraft financed through a six-yearlease agreement. See Note 13 for further details.
(2) During 2015, we returned two Boeing 767-300 aircraft at the end of their lease term. The decrease in the number of ownedBoeing 767-300 aircraft from 2015 to 2016 is due to the planned retirement of an aircraft at the end of its useful life.
(3) The ATR turboprop aircraft are owned by Airline Contract Maintenance & Equipment, Inc., a wholly-owned subsidiary ofthe Company.
(4) Leased aircraft include both aircraft under capital and operating leases. See Note 9 to the consolidated financial statementsfor further discussion regarding our aircraft leases.
24
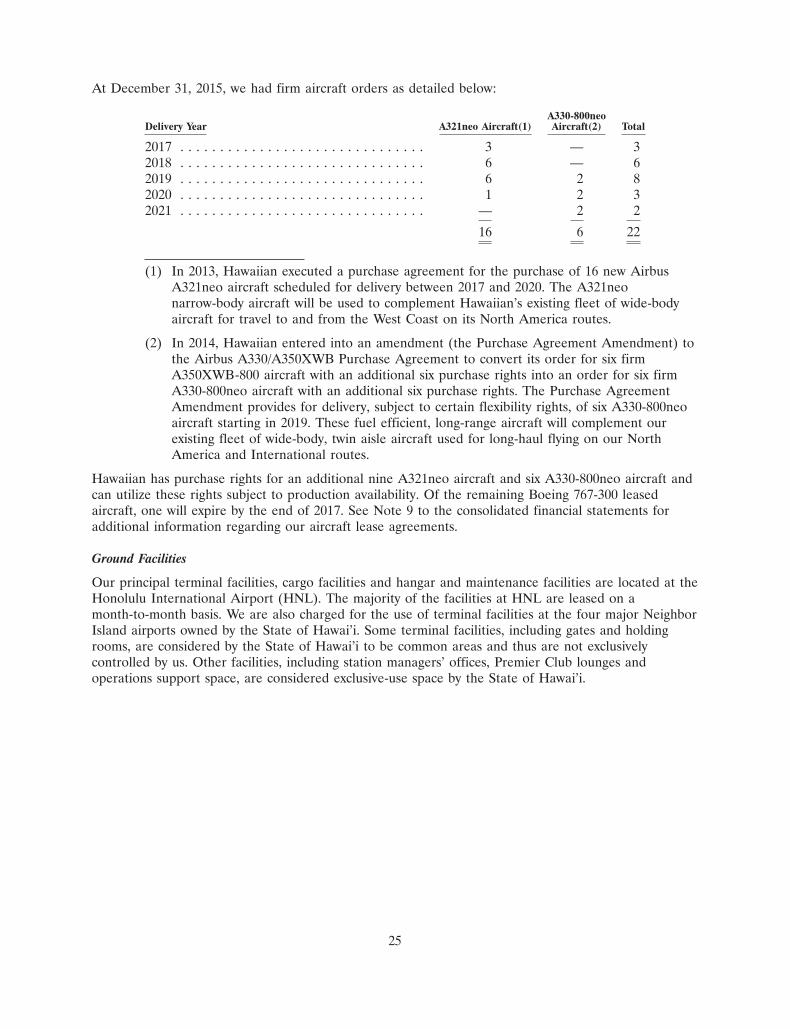
At December 31, 2015, we had firm aircraft orders as detailed below:
A330-800neoDelivery Year A321neo Aircraft(1) Aircraft(2) Total
2017 . . . . . . . . . . . . . . . . . . . . . . . . . . . . . . . 3 — 32018 . . . . . . . . . . . . . . . . . . . . . . . . . . . . . . . 6 — 62019 . . . . . . . . . . . . . . . . . . . . . . . . . . . . . . . 6 2 82020 . . . . . . . . . . . . . . . . . . . . . . . . . . . . . . . 1 2 32021 . . . . . . . . . . . . . . . . . . . . . . . . . . . . . . . — 2 2
16 6 22
(1) In 2013, Hawaiian executed a purchase agreement for the purchase of 16 new AirbusA321neo aircraft scheduled for delivery between 2017 and 2020. The A321neonarrow-body aircraft will be used to complement Hawaiian’s existing fleet of wide-bodyaircraft for travel to and from the West Coast on its North America routes.
(2) In 2014, Hawaiian entered into an amendment (the Purchase Agreement Amendment) tothe Airbus A330/A350XWB Purchase Agreement to convert its order for six firmA350XWB-800 aircraft with an additional six purchase rights into an order for six firmA330-800neo aircraft with an additional six purchase rights. The Purchase AgreementAmendment provides for delivery, subject to certain flexibility rights, of six A330-800neoaircraft starting in 2019. These fuel efficient, long-range aircraft will complement ourexisting fleet of wide-body, twin aisle aircraft used for long-haul flying on our NorthAmerica and International routes.
Hawaiian has purchase rights for an additional nine A321neo aircraft and six A330-800neo aircraft andcan utilize these rights subject to production availability. Of the remaining Boeing 767-300 leasedaircraft, one will expire by the end of 2017. See Note 9 to the consolidated financial statements foradditional information regarding our aircraft lease agreements.
Ground Facilities
Our principal terminal facilities, cargo facilities and hangar and maintenance facilities are located at theHonolulu International Airport (HNL). The majority of the facilities at HNL are leased on amonth-to-month basis. We are also charged for the use of terminal facilities at the four major NeighborIsland airports owned by the State of Hawai’i. Some terminal facilities, including gates and holdingrooms, are considered by the State of Hawai’i to be common areas and thus are not exclusivelycontrolled by us. Other facilities, including station managers’ offices, Premier Club lounges andoperations support space, are considered exclusive-use space by the State of Hawai’i.
25
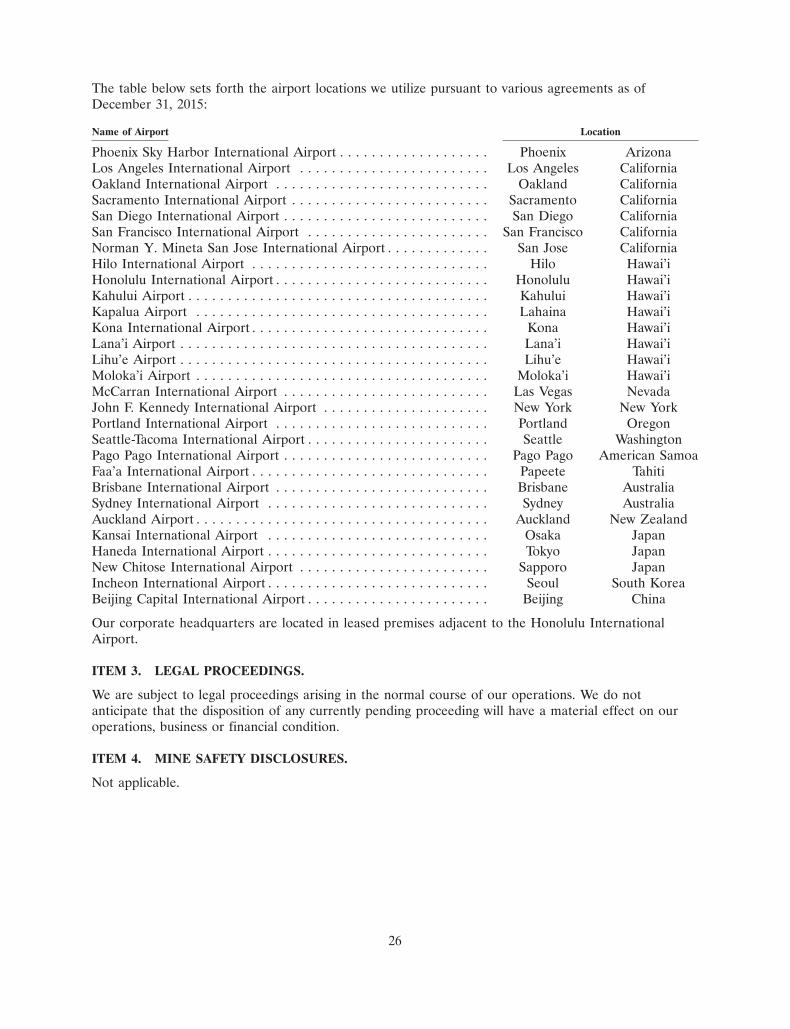
The table below sets forth the airport locations we utilize pursuant to various agreements as ofDecember 31, 2015:
Name of Airport Location
Phoenix Sky Harbor International Airport . . . . . . . . . . . . . . . . . . . Phoenix ArizonaLos Angeles International Airport . . . . . . . . . . . . . . . . . . . . . . . . Los Angeles CaliforniaOakland International Airport . . . . . . . . . . . . . . . . . . . . . . . . . . . Oakland CaliforniaSacramento International Airport . . . . . . . . . . . . . . . . . . . . . . . . . Sacramento CaliforniaSan Diego International Airport . . . . . . . . . . . . . . . . . . . . . . . . . . San Diego CaliforniaSan Francisco International Airport . . . . . . . . . . . . . . . . . . . . . . . San Francisco CaliforniaNorman Y. Mineta San Jose International Airport . . . . . . . . . . . . . San Jose CaliforniaHilo International Airport . . . . . . . . . . . . . . . . . . . . . . . . . . . . . . Hilo Hawai’iHonolulu International Airport . . . . . . . . . . . . . . . . . . . . . . . . . . . Honolulu Hawai’iKahului Airport . . . . . . . . . . . . . . . . . . . . . . . . . . . . . . . . . . . . . . Kahului Hawai’iKapalua Airport . . . . . . . . . . . . . . . . . . . . . . . . . . . . . . . . . . . . . Lahaina Hawai’iKona International Airport . . . . . . . . . . . . . . . . . . . . . . . . . . . . . . Kona Hawai’iLana’i Airport . . . . . . . . . . . . . . . . . . . . . . . . . . . . . . . . . . . . . . . Lana’i Hawai’iLihu’e Airport . . . . . . . . . . . . . . . . . . . . . . . . . . . . . . . . . . . . . . . Lihu’e Hawai’iMoloka’i Airport . . . . . . . . . . . . . . . . . . . . . . . . . . . . . . . . . . . . . Moloka’i Hawai’iMcCarran International Airport . . . . . . . . . . . . . . . . . . . . . . . . . . Las Vegas NevadaJohn F. Kennedy International Airport . . . . . . . . . . . . . . . . . . . . . New York New YorkPortland International Airport . . . . . . . . . . . . . . . . . . . . . . . . . . . Portland OregonSeattle-Tacoma International Airport . . . . . . . . . . . . . . . . . . . . . . . Seattle WashingtonPago Pago International Airport . . . . . . . . . . . . . . . . . . . . . . . . . . Pago Pago American SamoaFaa’a International Airport . . . . . . . . . . . . . . . . . . . . . . . . . . . . . . Papeete TahitiBrisbane International Airport . . . . . . . . . . . . . . . . . . . . . . . . . . . Brisbane AustraliaSydney International Airport . . . . . . . . . . . . . . . . . . . . . . . . . . . . Sydney AustraliaAuckland Airport . . . . . . . . . . . . . . . . . . . . . . . . . . . . . . . . . . . . . Auckland New ZealandKansai International Airport . . . . . . . . . . . . . . . . . . . . . . . . . . . . Osaka JapanHaneda International Airport . . . . . . . . . . . . . . . . . . . . . . . . . . . . Tokyo JapanNew Chitose International Airport . . . . . . . . . . . . . . . . . . . . . . . . Sapporo JapanIncheon International Airport . . . . . . . . . . . . . . . . . . . . . . . . . . . . Seoul South KoreaBeijing Capital International Airport . . . . . . . . . . . . . . . . . . . . . . . Beijing China
Our corporate headquarters are located in leased premises adjacent to the Honolulu InternationalAirport.
ITEM 3. LEGAL PROCEEDINGS.
We are subject to legal proceedings arising in the normal course of our operations. We do notanticipate that the disposition of any currently pending proceeding will have a material effect on ouroperations, business or financial condition.
ITEM 4. MINE SAFETY DISCLOSURES.
Not applicable.
26
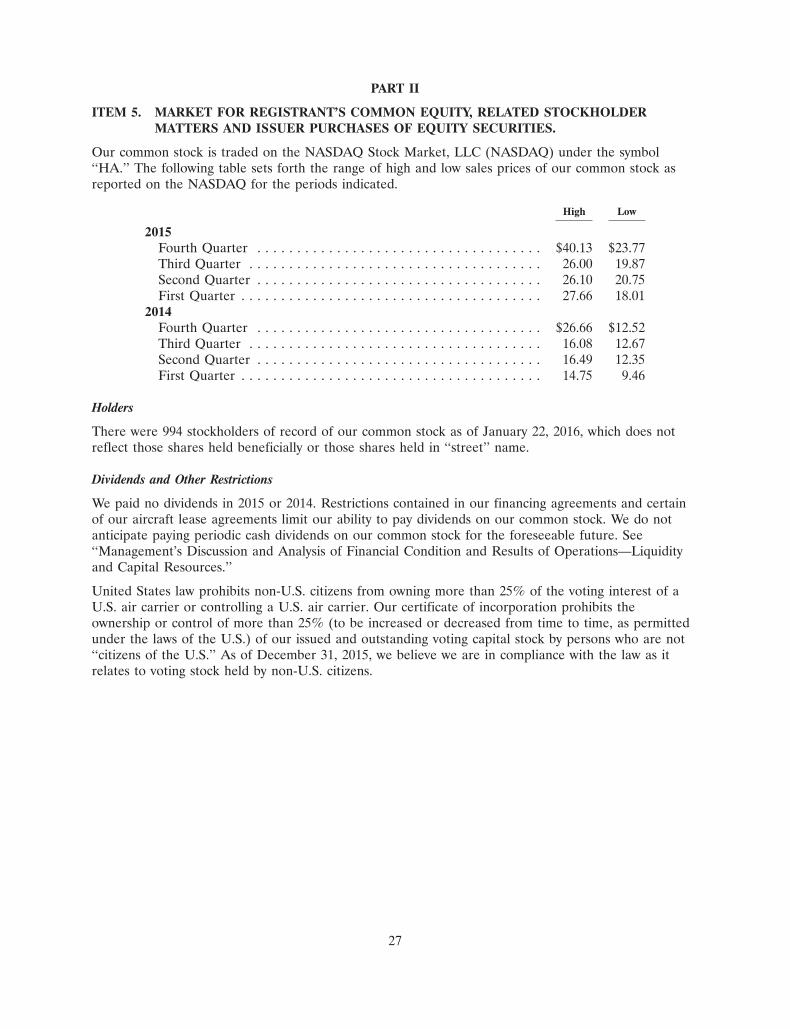
PART II
ITEM 5. MARKET FOR REGISTRANT’S COMMON EQUITY, RELATED STOCKHOLDERMATTERS AND ISSUER PURCHASES OF EQUITY SECURITIES.
Our common stock is traded on the NASDAQ Stock Market, LLC (NASDAQ) under the symbol‘‘HA.’’ The following table sets forth the range of high and low sales prices of our common stock asreported on the NASDAQ for the periods indicated.
High Low
2015Fourth Quarter . . . . . . . . . . . . . . . . . . . . . . . . . . . . . . . . . . . . $40.13 $23.77Third Quarter . . . . . . . . . . . . . . . . . . . . . . . . . . . . . . . . . . . . . 26.00 19.87Second Quarter . . . . . . . . . . . . . . . . . . . . . . . . . . . . . . . . . . . . 26.10 20.75First Quarter . . . . . . . . . . . . . . . . . . . . . . . . . . . . . . . . . . . . . . 27.66 18.01
2014Fourth Quarter . . . . . . . . . . . . . . . . . . . . . . . . . . . . . . . . . . . . $26.66 $12.52Third Quarter . . . . . . . . . . . . . . . . . . . . . . . . . . . . . . . . . . . . . 16.08 12.67Second Quarter . . . . . . . . . . . . . . . . . . . . . . . . . . . . . . . . . . . . 16.49 12.35First Quarter . . . . . . . . . . . . . . . . . . . . . . . . . . . . . . . . . . . . . . 14.75 9.46
Holders
There were 994 stockholders of record of our common stock as of January 22, 2016, which does notreflect those shares held beneficially or those shares held in ‘‘street’’ name.
Dividends and Other Restrictions
We paid no dividends in 2015 or 2014. Restrictions contained in our financing agreements and certainof our aircraft lease agreements limit our ability to pay dividends on our common stock. We do notanticipate paying periodic cash dividends on our common stock for the foreseeable future. See‘‘Management’s Discussion and Analysis of Financial Condition and Results of Operations—Liquidityand Capital Resources.’’
United States law prohibits non-U.S. citizens from owning more than 25% of the voting interest of aU.S. air carrier or controlling a U.S. air carrier. Our certificate of incorporation prohibits theownership or control of more than 25% (to be increased or decreased from time to time, as permittedunder the laws of the U.S.) of our issued and outstanding voting capital stock by persons who are not‘‘citizens of the U.S.’’ As of December 31, 2015, we believe we are in compliance with the law as itrelates to voting stock held by non-U.S. citizens.
27
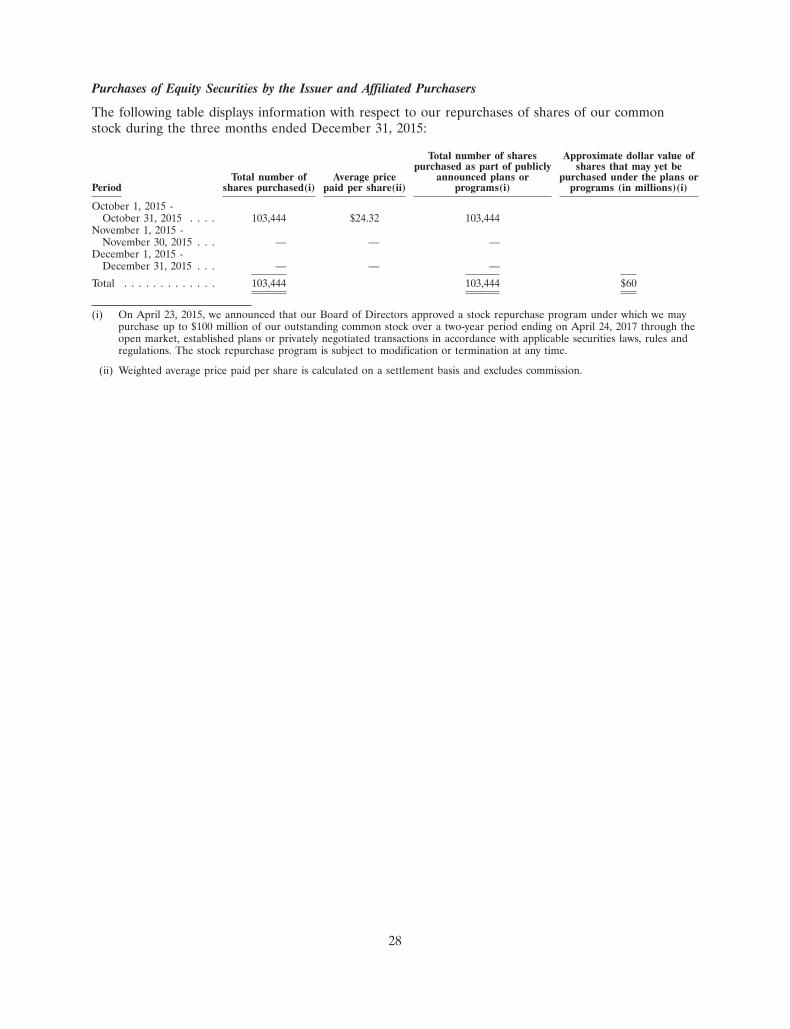
Purchases of Equity Securities by the Issuer and Affiliated Purchasers
The following table displays information with respect to our repurchases of shares of our commonstock during the three months ended December 31, 2015:
Total number of shares Approximate dollar value ofpurchased as part of publicly shares that may yet be
Total number of Average price announced plans or purchased under the plans orPeriod shares purchased(i) paid per share(ii) programs(i) programs (in millions)(i)
October 1, 2015 -October 31, 2015 . . . . 103,444 $24.32 103,444
November 1, 2015 -November 30, 2015 . . . — — —
December 1, 2015 -December 31, 2015 . . . — — —
Total . . . . . . . . . . . . . 103,444 103,444 $60
(i) On April 23, 2015, we announced that our Board of Directors approved a stock repurchase program under which we maypurchase up to $100 million of our outstanding common stock over a two-year period ending on April 24, 2017 through theopen market, established plans or privately negotiated transactions in accordance with applicable securities laws, rules andregulations. The stock repurchase program is subject to modification or termination at any time.
(ii) Weighted average price paid per share is calculated on a settlement basis and excludes commission.
28
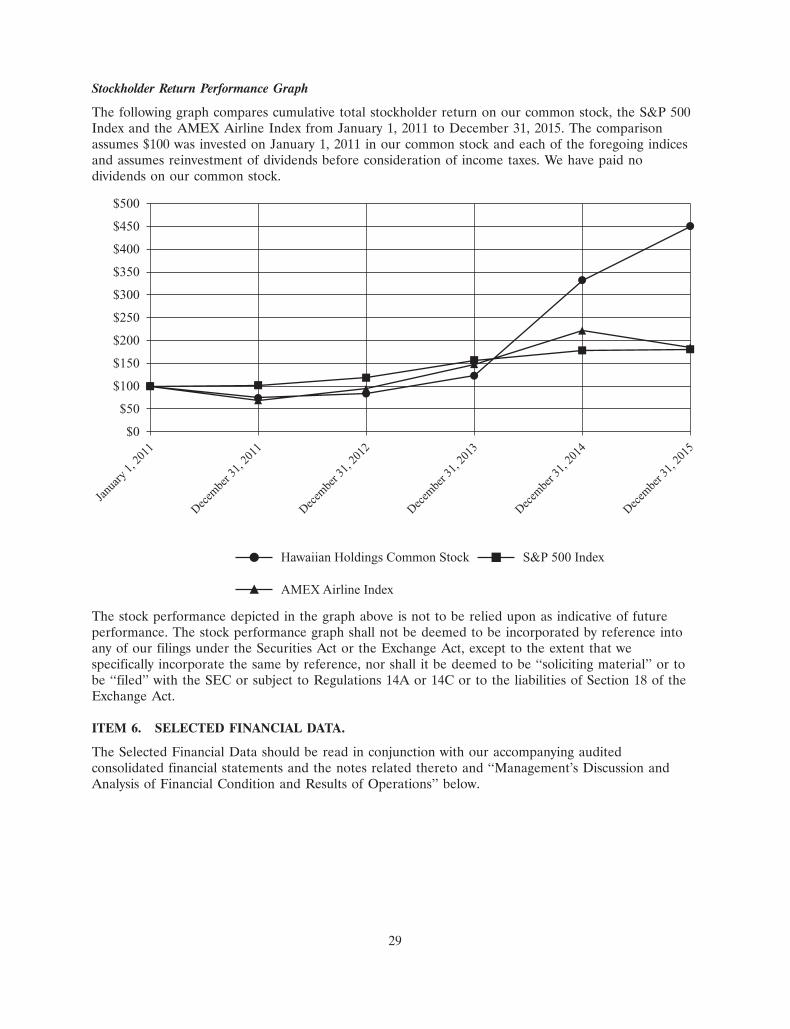
18MAR201611183372
Stockholder Return Performance Graph
The following graph compares cumulative total stockholder return on our common stock, the S&P 500Index and the AMEX Airline Index from January 1, 2011 to December 31, 2015. The comparisonassumes $100 was invested on January 1, 2011 in our common stock and each of the foregoing indicesand assumes reinvestment of dividends before consideration of income taxes. We have paid nodividends on our common stock.
$500
$450
$400
$350
$300
$250
$200
$150
$100
$50
$0
Janu
ary 1
, 201
1
Decem
ber 3
1, 20
11
Decem
ber 3
1, 20
12
Decem
ber 3
1, 20
13
Decem
ber 3
1, 20
14
Decem
ber 3
1, 20
15
Hawaiian Holdings Common Stock S&P 500 Index
AMEX Airline Index
The stock performance depicted in the graph above is not to be relied upon as indicative of futureperformance. The stock performance graph shall not be deemed to be incorporated by reference intoany of our filings under the Securities Act or the Exchange Act, except to the extent that wespecifically incorporate the same by reference, nor shall it be deemed to be ‘‘soliciting material’’ or tobe ‘‘filed’’ with the SEC or subject to Regulations 14A or 14C or to the liabilities of Section 18 of theExchange Act.
ITEM 6. SELECTED FINANCIAL DATA.
The Selected Financial Data should be read in conjunction with our accompanying auditedconsolidated financial statements and the notes related thereto and ‘‘Management’s Discussion andAnalysis of Financial Condition and Results of Operations’’ below.
29
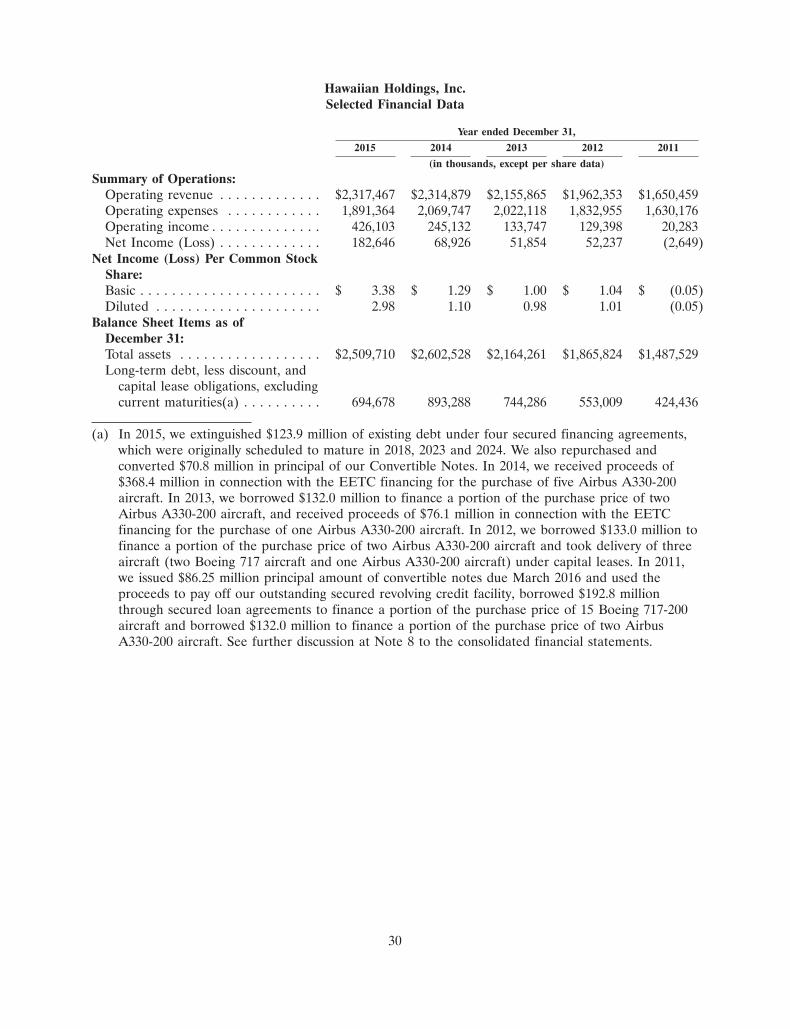
Hawaiian Holdings, Inc.Selected Financial Data
Year ended December 31,
2015 2014 2013 2012 2011
(in thousands, except per share data)
Summary of Operations:Operating revenue . . . . . . . . . . . . . $2,317,467 $2,314,879 $2,155,865 $1,962,353 $1,650,459Operating expenses . . . . . . . . . . . . 1,891,364 2,069,747 2,022,118 1,832,955 1,630,176Operating income . . . . . . . . . . . . . . 426,103 245,132 133,747 129,398 20,283Net Income (Loss) . . . . . . . . . . . . . 182,646 68,926 51,854 52,237 (2,649)
Net Income (Loss) Per Common StockShare:Basic . . . . . . . . . . . . . . . . . . . . . . . $ 3.38 $ 1.29 $ 1.00 $ 1.04 $ (0.05)Diluted . . . . . . . . . . . . . . . . . . . . . 2.98 1.10 0.98 1.01 (0.05)
Balance Sheet Items as ofDecember 31:Total assets . . . . . . . . . . . . . . . . . . $2,509,710 $2,602,528 $2,164,261 $1,865,824 $1,487,529Long-term debt, less discount, and
capital lease obligations, excludingcurrent maturities(a) . . . . . . . . . . 694,678 893,288 744,286 553,009 424,436
(a) In 2015, we extinguished $123.9 million of existing debt under four secured financing agreements,which were originally scheduled to mature in 2018, 2023 and 2024. We also repurchased andconverted $70.8 million in principal of our Convertible Notes. In 2014, we received proceeds of$368.4 million in connection with the EETC financing for the purchase of five Airbus A330-200aircraft. In 2013, we borrowed $132.0 million to finance a portion of the purchase price of twoAirbus A330-200 aircraft, and received proceeds of $76.1 million in connection with the EETCfinancing for the purchase of one Airbus A330-200 aircraft. In 2012, we borrowed $133.0 million tofinance a portion of the purchase price of two Airbus A330-200 aircraft and took delivery of threeaircraft (two Boeing 717 aircraft and one Airbus A330-200 aircraft) under capital leases. In 2011,we issued $86.25 million principal amount of convertible notes due March 2016 and used theproceeds to pay off our outstanding secured revolving credit facility, borrowed $192.8 millionthrough secured loan agreements to finance a portion of the purchase price of 15 Boeing 717-200aircraft and borrowed $132.0 million to finance a portion of the purchase price of two AirbusA330-200 aircraft. See further discussion at Note 8 to the consolidated financial statements.
30
ITEM 7. MANAGEMENT’S DISCUSSION AND ANALYSIS OF FINANCIAL CONDITION ANDRESULTS OF OPERATIONS.
Overview
The following Management’s Discussion and Analysis of Financial Condition and Results of Operations(MD&A) is intended to help the reader understand the Company and its operations. This discussionand analysis of our financial condition and results of operations contains forward-looking statementsthat involve risks and uncertainties. We have based these forward-looking statements on our currentexpectations and projections of future events. However, our actual results could differ materially fromthose discussed herein as a result of the risks that we face, including but not limited to those risksstated in ‘‘Risk Factors.’’ See ‘‘Cautionary Note Regarding Forward-Looking Statements,’’ above. Inaddition, the following discussion should be read in conjunction with the audited consolidated financialstatements and the related notes thereto included elsewhere in this report.
Year in Review
2015 Financial Highlights
• Operating income grew to $426 million compared to $245 million in the prior-year period.
• Pre-tax income grew to $296 million compared to $113 million in the prior-year period.
• GAAP net income of $183 million or $2.98 per diluted share compared to $69 million or$1.10 per diluted share in the prior-year period.
• Adjusted net income of $189 million or $3.09 per diluted share compared to $97 million or$1.55 per share in the prior-year period.
• Unrestricted cash and cash equivalents and short-term investments of $560 million compared to$524 millionin the prior year period.
• Extinguished $124 million of debt instruments that were originally scheduled to mature in 2018through 2024.
• Repurchased and converted $71 million in principal of convertible notes.
See ‘‘Non-GAAP Financial Measures’’ below for our reconciliation of non-GAAP measures.
Outlook
We expect our financial performance to improve in the first quarter of 2016 compared to the samequarter in 2015 as a result of favorable fuel prices. We expect available seat miles during the firstquarter of 2016 to increase by 2.5% to 4.5% from the same prior year period. With the continuedstrengthening of the U.S. dollar, a decrease in fuel surcharges on our international routes, and anincrease in industry capacity on our North America routes, operating revenue per available seat milecould increase or decrease by up to 1.5% from the same prior year period. We expect operating costper available seat mile, excluding fuel, for the first quarter of 2016 to increase by 3% to 6% from thesame prior year period due to the recent ratification of our labor agreements and an increase in theexpected number of maintenance events.
31
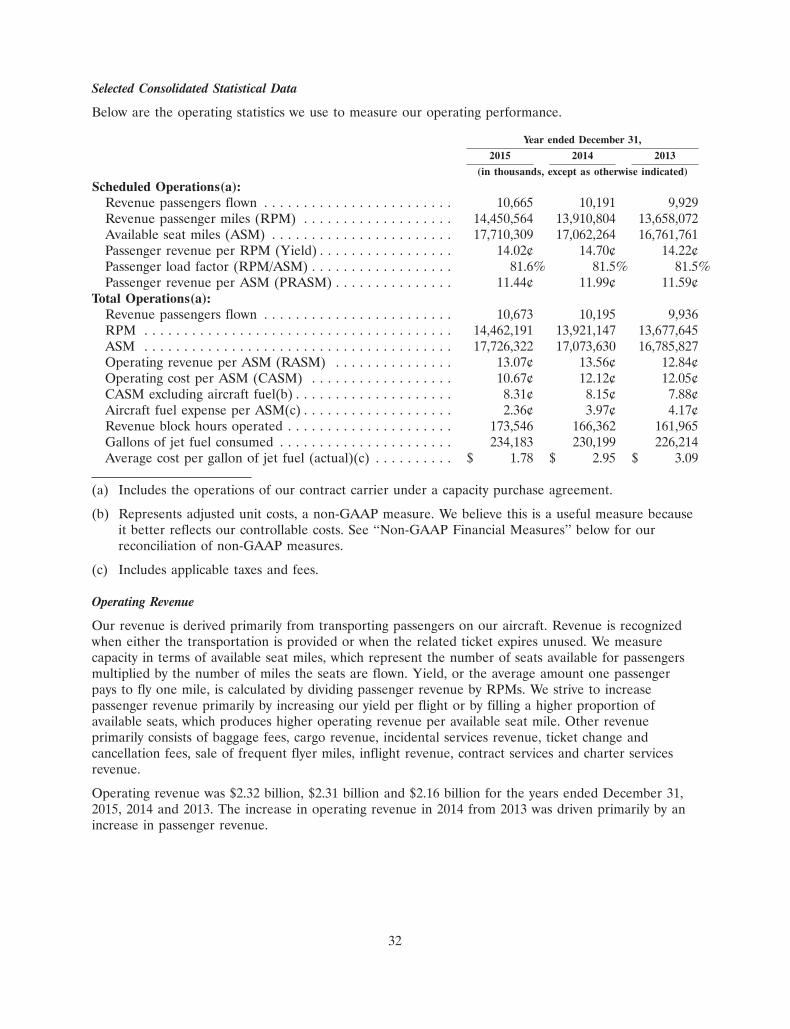
Selected Consolidated Statistical Data
Below are the operating statistics we use to measure our operating performance.
Year ended December 31,
2015 2014 2013
(in thousands, except as otherwise indicated)
Scheduled Operations(a):Revenue passengers flown . . . . . . . . . . . . . . . . . . . . . . . . 10,665 10,191 9,929Revenue passenger miles (RPM) . . . . . . . . . . . . . . . . . . . 14,450,564 13,910,804 13,658,072Available seat miles (ASM) . . . . . . . . . . . . . . . . . . . . . . . 17,710,309 17,062,264 16,761,761Passenger revenue per RPM (Yield) . . . . . . . . . . . . . . . . . 14.02¢ 14.70¢ 14.22¢Passenger load factor (RPM/ASM) . . . . . . . . . . . . . . . . . . 81.6% 81.5% 81.5%Passenger revenue per ASM (PRASM) . . . . . . . . . . . . . . . 11.44¢ 11.99¢ 11.59¢
Total Operations(a):Revenue passengers flown . . . . . . . . . . . . . . . . . . . . . . . . 10,673 10,195 9,936RPM . . . . . . . . . . . . . . . . . . . . . . . . . . . . . . . . . . . . . . . 14,462,191 13,921,147 13,677,645ASM . . . . . . . . . . . . . . . . . . . . . . . . . . . . . . . . . . . . . . . 17,726,322 17,073,630 16,785,827Operating revenue per ASM (RASM) . . . . . . . . . . . . . . . 13.07¢ 13.56¢ 12.84¢Operating cost per ASM (CASM) . . . . . . . . . . . . . . . . . . 10.67¢ 12.12¢ 12.05¢CASM excluding aircraft fuel(b) . . . . . . . . . . . . . . . . . . . . 8.31¢ 8.15¢ 7.88¢Aircraft fuel expense per ASM(c) . . . . . . . . . . . . . . . . . . . 2.36¢ 3.97¢ 4.17¢Revenue block hours operated . . . . . . . . . . . . . . . . . . . . . 173,546 166,362 161,965Gallons of jet fuel consumed . . . . . . . . . . . . . . . . . . . . . . 234,183 230,199 226,214Average cost per gallon of jet fuel (actual)(c) . . . . . . . . . . $ 1.78 $ 2.95 $ 3.09
(a) Includes the operations of our contract carrier under a capacity purchase agreement.
(b) Represents adjusted unit costs, a non-GAAP measure. We believe this is a useful measure becauseit better reflects our controllable costs. See ‘‘Non-GAAP Financial Measures’’ below for ourreconciliation of non-GAAP measures.
(c) Includes applicable taxes and fees.
Operating Revenue
Our revenue is derived primarily from transporting passengers on our aircraft. Revenue is recognizedwhen either the transportation is provided or when the related ticket expires unused. We measurecapacity in terms of available seat miles, which represent the number of seats available for passengersmultiplied by the number of miles the seats are flown. Yield, or the average amount one passengerpays to fly one mile, is calculated by dividing passenger revenue by RPMs. We strive to increasepassenger revenue primarily by increasing our yield per flight or by filling a higher proportion ofavailable seats, which produces higher operating revenue per available seat mile. Other revenueprimarily consists of baggage fees, cargo revenue, incidental services revenue, ticket change andcancellation fees, sale of frequent flyer miles, inflight revenue, contract services and charter servicesrevenue.
Operating revenue was $2.32 billion, $2.31 billion and $2.16 billion for the years ended December 31,2015, 2014 and 2013. The increase in operating revenue in 2014 from 2013 was driven primarily by anincrease in passenger revenue.
32
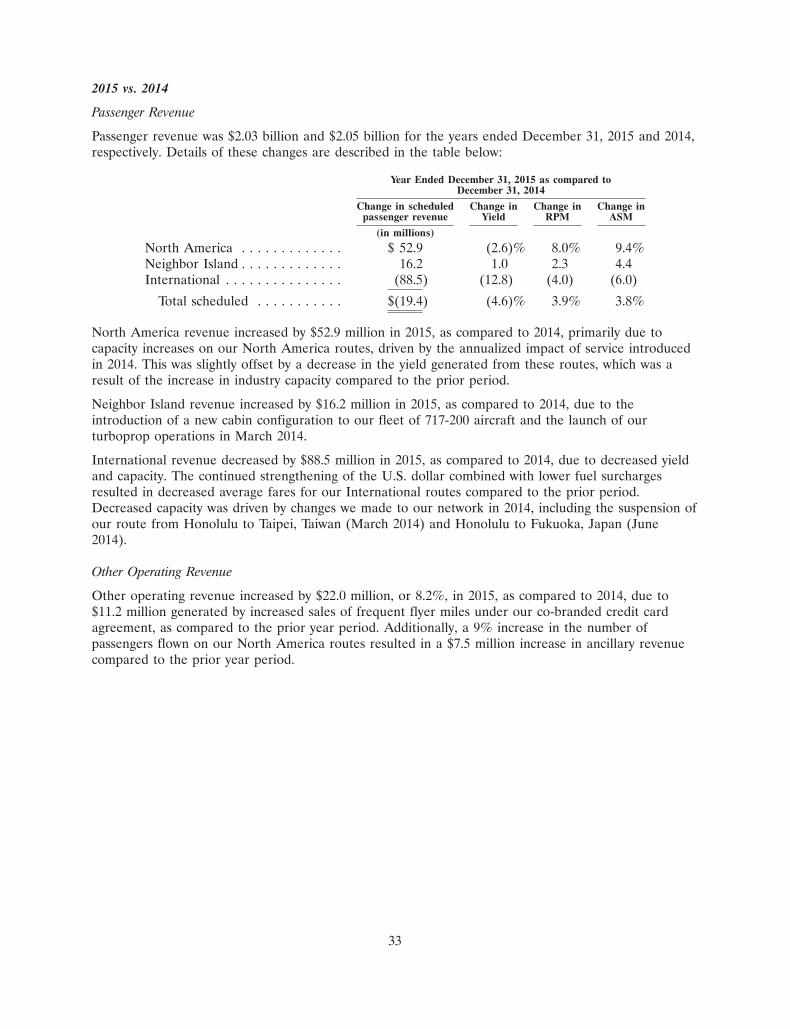
2015 vs. 2014
Passenger Revenue
Passenger revenue was $2.03 billion and $2.05 billion for the years ended December 31, 2015 and 2014,respectively. Details of these changes are described in the table below:
Year Ended December 31, 2015 as compared toDecember 31, 2014
Change in scheduled Change in Change in Change inpassenger revenue Yield RPM ASM
(in millions)
North America . . . . . . . . . . . . . $ 52.9 (2.6)% 8.0% 9.4%Neighbor Island . . . . . . . . . . . . . 16.2 1.0 2.3 4.4International . . . . . . . . . . . . . . . (88.5) (12.8) (4.0) (6.0)
Total scheduled . . . . . . . . . . . $(19.4) (4.6)% 3.9% 3.8%
North America revenue increased by $52.9 million in 2015, as compared to 2014, primarily due tocapacity increases on our North America routes, driven by the annualized impact of service introducedin 2014. This was slightly offset by a decrease in the yield generated from these routes, which was aresult of the increase in industry capacity compared to the prior period.
Neighbor Island revenue increased by $16.2 million in 2015, as compared to 2014, due to theintroduction of a new cabin configuration to our fleet of 717-200 aircraft and the launch of ourturboprop operations in March 2014.
International revenue decreased by $88.5 million in 2015, as compared to 2014, due to decreased yieldand capacity. The continued strengthening of the U.S. dollar combined with lower fuel surchargesresulted in decreased average fares for our International routes compared to the prior period.Decreased capacity was driven by changes we made to our network in 2014, including the suspension ofour route from Honolulu to Taipei, Taiwan (March 2014) and Honolulu to Fukuoka, Japan (June2014).
Other Operating Revenue
Other operating revenue increased by $22.0 million, or 8.2%, in 2015, as compared to 2014, due to$11.2 million generated by increased sales of frequent flyer miles under our co-branded credit cardagreement, as compared to the prior year period. Additionally, a 9% increase in the number ofpassengers flown on our North America routes resulted in a $7.5 million increase in ancillary revenuecompared to the prior year period.
33
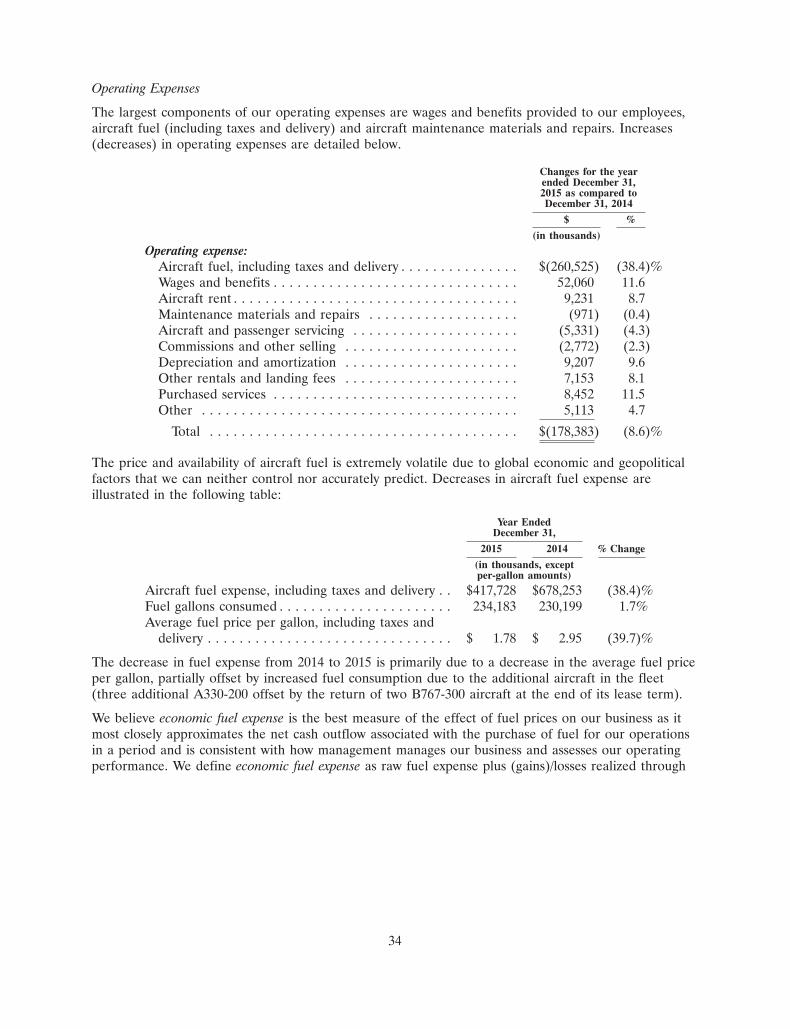
Operating Expenses
The largest components of our operating expenses are wages and benefits provided to our employees,aircraft fuel (including taxes and delivery) and aircraft maintenance materials and repairs. Increases(decreases) in operating expenses are detailed below.
Changes for the yearended December 31,2015 as compared toDecember 31, 2014
$ %
(in thousands)
Operating expense:Aircraft fuel, including taxes and delivery . . . . . . . . . . . . . . . $(260,525) (38.4)%Wages and benefits . . . . . . . . . . . . . . . . . . . . . . . . . . . . . . . 52,060 11.6Aircraft rent . . . . . . . . . . . . . . . . . . . . . . . . . . . . . . . . . . . . 9,231 8.7Maintenance materials and repairs . . . . . . . . . . . . . . . . . . . (971) (0.4)Aircraft and passenger servicing . . . . . . . . . . . . . . . . . . . . . (5,331) (4.3)Commissions and other selling . . . . . . . . . . . . . . . . . . . . . . (2,772) (2.3)Depreciation and amortization . . . . . . . . . . . . . . . . . . . . . . 9,207 9.6Other rentals and landing fees . . . . . . . . . . . . . . . . . . . . . . 7,153 8.1Purchased services . . . . . . . . . . . . . . . . . . . . . . . . . . . . . . . 8,452 11.5Other . . . . . . . . . . . . . . . . . . . . . . . . . . . . . . . . . . . . . . . . 5,113 4.7
Total . . . . . . . . . . . . . . . . . . . . . . . . . . . . . . . . . . . . . . . $(178,383) (8.6)%
The price and availability of aircraft fuel is extremely volatile due to global economic and geopoliticalfactors that we can neither control nor accurately predict. Decreases in aircraft fuel expense areillustrated in the following table:
Year EndedDecember 31,
2015 2014 % Change
(in thousands, exceptper-gallon amounts)
Aircraft fuel expense, including taxes and delivery . . $417,728 $678,253 (38.4)%Fuel gallons consumed . . . . . . . . . . . . . . . . . . . . . . 234,183 230,199 1.7%Average fuel price per gallon, including taxes and
delivery . . . . . . . . . . . . . . . . . . . . . . . . . . . . . . . $ 1.78 $ 2.95 (39.7)%
The decrease in fuel expense from 2014 to 2015 is primarily due to a decrease in the average fuel priceper gallon, partially offset by increased fuel consumption due to the additional aircraft in the fleet(three additional A330-200 offset by the return of two B767-300 aircraft at the end of its lease term).
We believe economic fuel expense is the best measure of the effect of fuel prices on our business as itmost closely approximates the net cash outflow associated with the purchase of fuel for our operationsin a period and is consistent with how management manages our business and assesses our operatingperformance. We define economic fuel expense as raw fuel expense plus (gains)/losses realized through
34
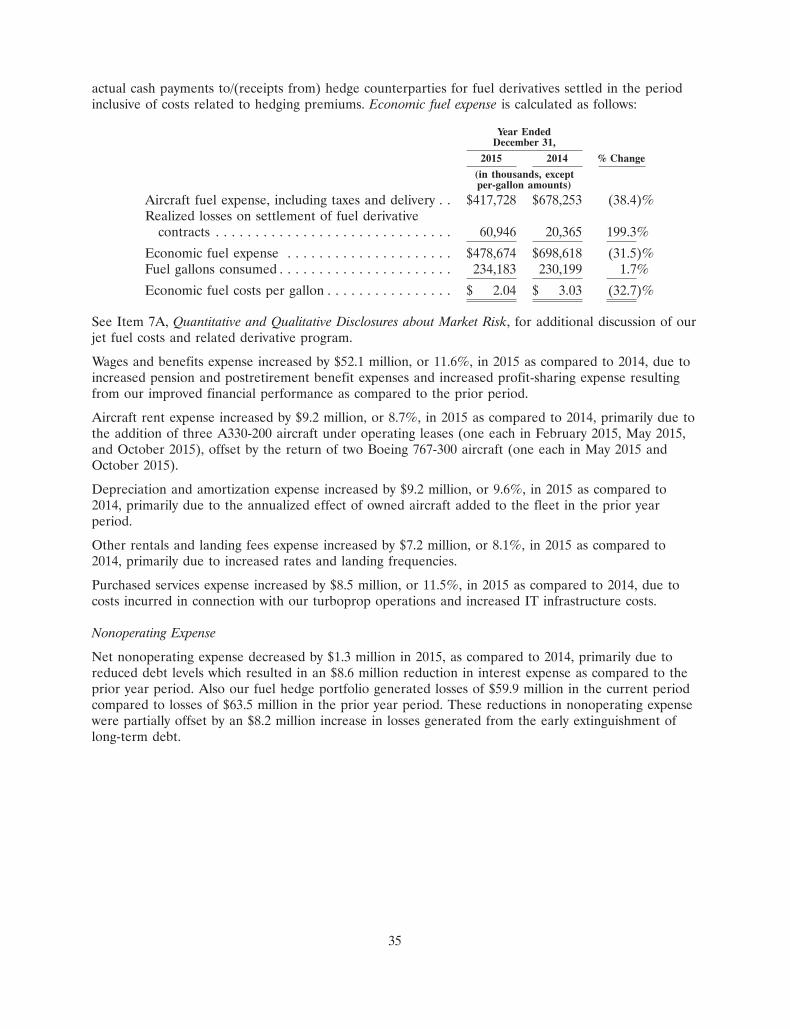
actual cash payments to/(receipts from) hedge counterparties for fuel derivatives settled in the periodinclusive of costs related to hedging premiums. Economic fuel expense is calculated as follows:
Year EndedDecember 31,
2015 2014 % Change
(in thousands, exceptper-gallon amounts)
Aircraft fuel expense, including taxes and delivery . . $417,728 $678,253 (38.4)%Realized losses on settlement of fuel derivative
contracts . . . . . . . . . . . . . . . . . . . . . . . . . . . . . . 60,946 20,365 199.3%
Economic fuel expense . . . . . . . . . . . . . . . . . . . . . $478,674 $698,618 (31.5)%Fuel gallons consumed . . . . . . . . . . . . . . . . . . . . . . 234,183 230,199 1.7%
Economic fuel costs per gallon . . . . . . . . . . . . . . . . $ 2.04 $ 3.03 (32.7)%
See Item 7A, Quantitative and Qualitative Disclosures about Market Risk, for additional discussion of ourjet fuel costs and related derivative program.
Wages and benefits expense increased by $52.1 million, or 11.6%, in 2015 as compared to 2014, due toincreased pension and postretirement benefit expenses and increased profit-sharing expense resultingfrom our improved financial performance as compared to the prior period.
Aircraft rent expense increased by $9.2 million, or 8.7%, in 2015 as compared to 2014, primarily due tothe addition of three A330-200 aircraft under operating leases (one each in February 2015, May 2015,and October 2015), offset by the return of two Boeing 767-300 aircraft (one each in May 2015 andOctober 2015).
Depreciation and amortization expense increased by $9.2 million, or 9.6%, in 2015 as compared to2014, primarily due to the annualized effect of owned aircraft added to the fleet in the prior yearperiod.
Other rentals and landing fees expense increased by $7.2 million, or 8.1%, in 2015 as compared to2014, primarily due to increased rates and landing frequencies.
Purchased services expense increased by $8.5 million, or 11.5%, in 2015 as compared to 2014, due tocosts incurred in connection with our turboprop operations and increased IT infrastructure costs.
Nonoperating Expense
Net nonoperating expense decreased by $1.3 million in 2015, as compared to 2014, primarily due toreduced debt levels which resulted in an $8.6 million reduction in interest expense as compared to theprior year period. Also our fuel hedge portfolio generated losses of $59.9 million in the current periodcompared to losses of $63.5 million in the prior year period. These reductions in nonoperating expensewere partially offset by an $8.2 million increase in losses generated from the early extinguishment oflong-term debt.
35
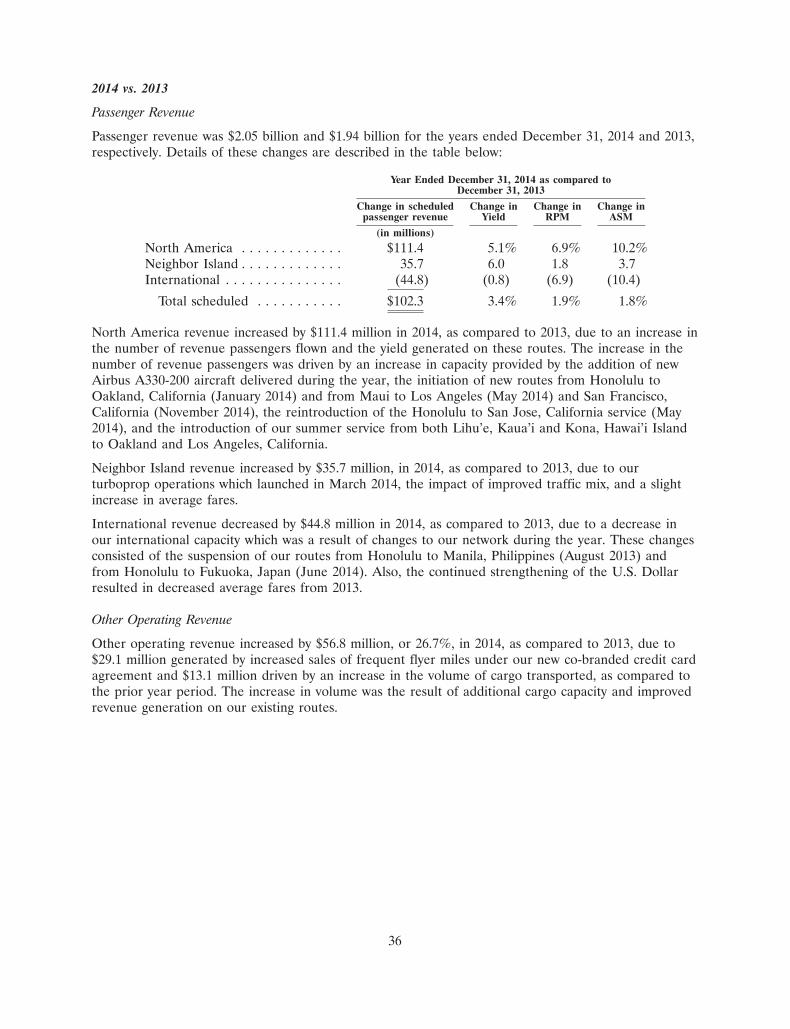
2014 vs. 2013
Passenger Revenue
Passenger revenue was $2.05 billion and $1.94 billion for the years ended December 31, 2014 and 2013,respectively. Details of these changes are described in the table below:
Year Ended December 31, 2014 as compared toDecember 31, 2013
Change in scheduled Change in Change in Change inpassenger revenue Yield RPM ASM
(in millions)
North America . . . . . . . . . . . . . $111.4 5.1% 6.9% 10.2%Neighbor Island . . . . . . . . . . . . . 35.7 6.0 1.8 3.7International . . . . . . . . . . . . . . . (44.8) (0.8) (6.9) (10.4)
Total scheduled . . . . . . . . . . . $102.3 3.4% 1.9% 1.8%
North America revenue increased by $111.4 million in 2014, as compared to 2013, due to an increase inthe number of revenue passengers flown and the yield generated on these routes. The increase in thenumber of revenue passengers was driven by an increase in capacity provided by the addition of newAirbus A330-200 aircraft delivered during the year, the initiation of new routes from Honolulu toOakland, California (January 2014) and from Maui to Los Angeles (May 2014) and San Francisco,California (November 2014), the reintroduction of the Honolulu to San Jose, California service (May2014), and the introduction of our summer service from both Lihu’e, Kaua’i and Kona, Hawai’i Islandto Oakland and Los Angeles, California.
Neighbor Island revenue increased by $35.7 million, in 2014, as compared to 2013, due to ourturboprop operations which launched in March 2014, the impact of improved traffic mix, and a slightincrease in average fares.
International revenue decreased by $44.8 million in 2014, as compared to 2013, due to a decrease inour international capacity which was a result of changes to our network during the year. These changesconsisted of the suspension of our routes from Honolulu to Manila, Philippines (August 2013) andfrom Honolulu to Fukuoka, Japan (June 2014). Also, the continued strengthening of the U.S. Dollarresulted in decreased average fares from 2013.
Other Operating Revenue
Other operating revenue increased by $56.8 million, or 26.7%, in 2014, as compared to 2013, due to$29.1 million generated by increased sales of frequent flyer miles under our new co-branded credit cardagreement and $13.1 million driven by an increase in the volume of cargo transported, as compared tothe prior year period. The increase in volume was the result of additional cargo capacity and improvedrevenue generation on our existing routes.
36
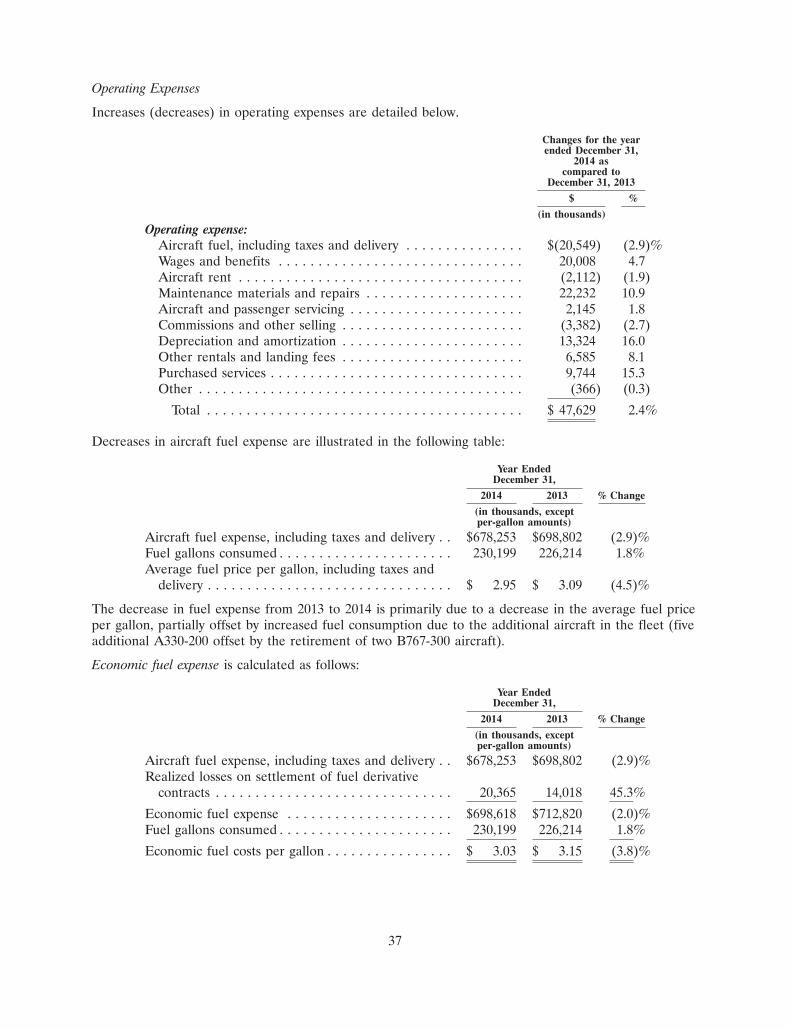
Operating Expenses
Increases (decreases) in operating expenses are detailed below.
Changes for the yearended December 31,
2014 ascompared to
December 31, 2013
$ %
(in thousands)
Operating expense:Aircraft fuel, including taxes and delivery . . . . . . . . . . . . . . . $(20,549) (2.9)%Wages and benefits . . . . . . . . . . . . . . . . . . . . . . . . . . . . . . . 20,008 4.7Aircraft rent . . . . . . . . . . . . . . . . . . . . . . . . . . . . . . . . . . . . (2,112) (1.9)Maintenance materials and repairs . . . . . . . . . . . . . . . . . . . . 22,232 10.9Aircraft and passenger servicing . . . . . . . . . . . . . . . . . . . . . . 2,145 1.8Commissions and other selling . . . . . . . . . . . . . . . . . . . . . . . (3,382) (2.7)Depreciation and amortization . . . . . . . . . . . . . . . . . . . . . . . 13,324 16.0Other rentals and landing fees . . . . . . . . . . . . . . . . . . . . . . . 6,585 8.1Purchased services . . . . . . . . . . . . . . . . . . . . . . . . . . . . . . . . 9,744 15.3Other . . . . . . . . . . . . . . . . . . . . . . . . . . . . . . . . . . . . . . . . . (366) (0.3)
Total . . . . . . . . . . . . . . . . . . . . . . . . . . . . . . . . . . . . . . . . $ 47,629 2.4%
Decreases in aircraft fuel expense are illustrated in the following table:
Year EndedDecember 31,
2014 2013 % Change
(in thousands, exceptper-gallon amounts)
Aircraft fuel expense, including taxes and delivery . . $678,253 $698,802 (2.9)%Fuel gallons consumed . . . . . . . . . . . . . . . . . . . . . . 230,199 226,214 1.8%Average fuel price per gallon, including taxes and
delivery . . . . . . . . . . . . . . . . . . . . . . . . . . . . . . . $ 2.95 $ 3.09 (4.5)%
The decrease in fuel expense from 2013 to 2014 is primarily due to a decrease in the average fuel priceper gallon, partially offset by increased fuel consumption due to the additional aircraft in the fleet (fiveadditional A330-200 offset by the retirement of two B767-300 aircraft).
Economic fuel expense is calculated as follows:
Year EndedDecember 31,
2014 2013 % Change
(in thousands, exceptper-gallon amounts)
Aircraft fuel expense, including taxes and delivery . . $678,253 $698,802 (2.9)%Realized losses on settlement of fuel derivative
contracts . . . . . . . . . . . . . . . . . . . . . . . . . . . . . . 20,365 14,018 45.3%
Economic fuel expense . . . . . . . . . . . . . . . . . . . . . $698,618 $712,820 (2.0)%Fuel gallons consumed . . . . . . . . . . . . . . . . . . . . . . 230,199 226,214 1.8%
Economic fuel costs per gallon . . . . . . . . . . . . . . . . $ 3.03 $ 3.15 (3.8)%
37
Wages and benefits expense increased by $20.0 million, or 4.7%, in 2014, as compared to 2013, due to a2.5% increase in the number of employees as we continue to expand our operations with additionalaircraft. Our profit-sharing expense also increased in 2014, which was driven by our improved financialperformance from 2013.
Maintenance materials and repairs expense increased by $22.2 million, or 10.9%, in 2014, as comparedto 2013, primarily due to the increase in the number and utilization of Airbus A330-200 aircraft in ourfleet, partially offset by a decrease in the number and utilization of Boeing 767-300 aircraft in our fleet.
Depreciation and amortization expense increased by $13.3 million, or 16.0%, in 2014, as compared to2013, primarily due to the increase in the number of owned aircraft (five A330-200 aircraft offset bythe retirement of two B767-300 aircraft).
Other rentals and landing fees expense increased by $6.6 million, or 8.1%, in 2014 as compared to2013, primarily due to increased rates and landing frequencies.
Purchased services expense increased by $9.7 million, or 15.3%, in 2014 as compared to 2013, primarilydue to costs incurred in connection with our turboprop operations that began in March 2014.
Nonoperating Expense
Net nonoperating expense increased by $84.3 million in 2014, as compared to 2013, primarily due toour fuel hedge portfolio generating losses of $63.5 million in the current period compared to losses of$5.3 million in the prior year period. The strengthening of the US dollar resulted in foreign exchangeloss of $8.7 million in the current period compared to a loss of $4.4 million in the prior period. Theinterest expense incurred in connection with the equipment notes under the EETC financing alsocontributed to the increase in nonoperating expense for the period.
Income Tax Expense
We recorded income tax expense of $113.0 million, $44.5 million and $34.6 million during the yearsended December 31, 2015, 2014, and 2013, respectively. In 2015, 2014 and 2013, we had an effective taxrate of 38.2%, 39.2% and 40.0%, respectively.
See Note 10 to the consolidated financial statements for further discussion.
Liquidity and Capital Resources
Our liquidity is dependent on the cash we generate from operating activities, our existing cashresources and our debt financing arrangements. As of December 31, 2015, we had $281.5 million incash and cash equivalents and $278.5 million in short-term investments, representing an increase of$35.8 million from December 31, 2014. As of December 31, 2015 and 2014, our restricted cash balanceof $5.0 million and $6.6 million, respectively, primarily consisted of cash held as collateral by entitiesthat process our credit card transactions for advanced ticket sales.
We have been able to generate sufficient funds from our operations to meet our working capitalrequirements and typically finance our aircraft through secured debt and lease financings. AtDecember 31, 2015, Hawaiian had $772.1 million of debt and capital lease obligations, including$77.5 million classified as a current liability in the Consolidated Balance Sheets. As of December 31,2015, our current liabilities exceeded our current assets by approximately $28.8 million. However,approximately $430.8 million of our current liabilities are related to our advanced ticket sales andfrequent flyer deferred revenue, both of which largely represent revenue to be recognized for travelwithin the next 12 months and not actual cash outlays. The deficit in working capital does not have anadverse impact to our cash flows, liquidity or operations.
38
We also have access to a secured revolving credit and letter of credit facility (the Revolving CreditFacility) in an amount of up to $175 million, maturing in November 2017. As of December 31, 2015 wehad no outstanding borrowings under the Revolving Credit Facility.
Cash Flows
Net cash provided by operating activities was $476.0 million, $300.4 million and $243.3 million in 2015,2014 and 2013, respectively. The increase in 2015 was primarily due to the increased net income beforedeferred income tax expense, which does not impact our cash flows because our net operating losscarryforwards were used to satisfy this income tax obligation. The increase in 2014 was primarily due toincreased net income before the expense associated with unrealized loss positions on our fuel derivativecontracts, which do not immediately impact our cash flows from operating activities because the losseswere unrealized as of December 31, 2014.
Net cash used in investing activities was $35.3 million, $686.8 million and $327.8 million for 2015, 2014and 2013, respectively. The decrease in 2015 was due to acquisition of fewer aircraft during the year,which resulted in a $323.4 million reduction in capital expenditures. We also received $101.7 millionfrom the purchase assignment and leaseback of three Airbus A330-200 aircraft during the year, andreduced our net purchases of investments by $240.2 million in 2015. The increase in 2014 was due tothe $261.5 million in net purchases of investments, and the acquisition of five Airbus A330-200 aircraftduring the year.
Net cash used in financing activities was $423.3 million for 2015 and net cash provided by financingactivities was $227.1 million and $102.0 million for 2014 and 2013, respectively. The increase in cashused in financing activities in 2015 was due to the lack of long-term borrowings during the year, theearly repayment of long-term debt, and the repurchase of convertible notes and common stock. Thiswas partially offset by the net settlement of the convertible note call options and warrants. The increasein 2014 was due to the receipt of $368.4 million in proceeds from the EETC financing, partially offsetby $54.2 million of debt extinguishment in October 2014 and repurchase of $15.1 million of convertiblenotes.
Covenants under our Financing Arrangements
Under our bank-issued credit card processing agreements, certain proceeds from advance ticket salesmay be held back to serve as collateral to cover any possible chargebacks or other disputed chargesthat may occur. These holdbacks, which are included in restricted cash in our Consolidated BalanceSheets, totaled $5.0 million as of December 31, 2015 and 2014.
In the event of a material adverse change in the business, the holdback could increase to an amount upto 100% of the applicable credit card air traffic liability, which would also result in an increase in therequired level of restricted cash. If we are unable to obtain a waiver of, or otherwise mitigate theincrease in the restriction of cash, it could have a material adverse impact on our operations.
Pension and Other Postretirement Benefit Plan Funding
As of December 31, 2015, the excess of the projected benefit obligations over the fair value of planassets was approximately $375.8 million. We contributed $20.4 million, $8.9 million and $18.7 million, toour defined benefit pension plans and disability plan during 2015, 2014 and 2013, respectively. Futurefunding requirements for our defined benefit and other postretirement plans are dependent upon manyfactors such as interest rates, funded status, applicable regulatory requirements and the level and timingof asset returns. In 2016, our minimum required contribution to our defined benefit pension plans anddisability plan is $5.3 million.
39
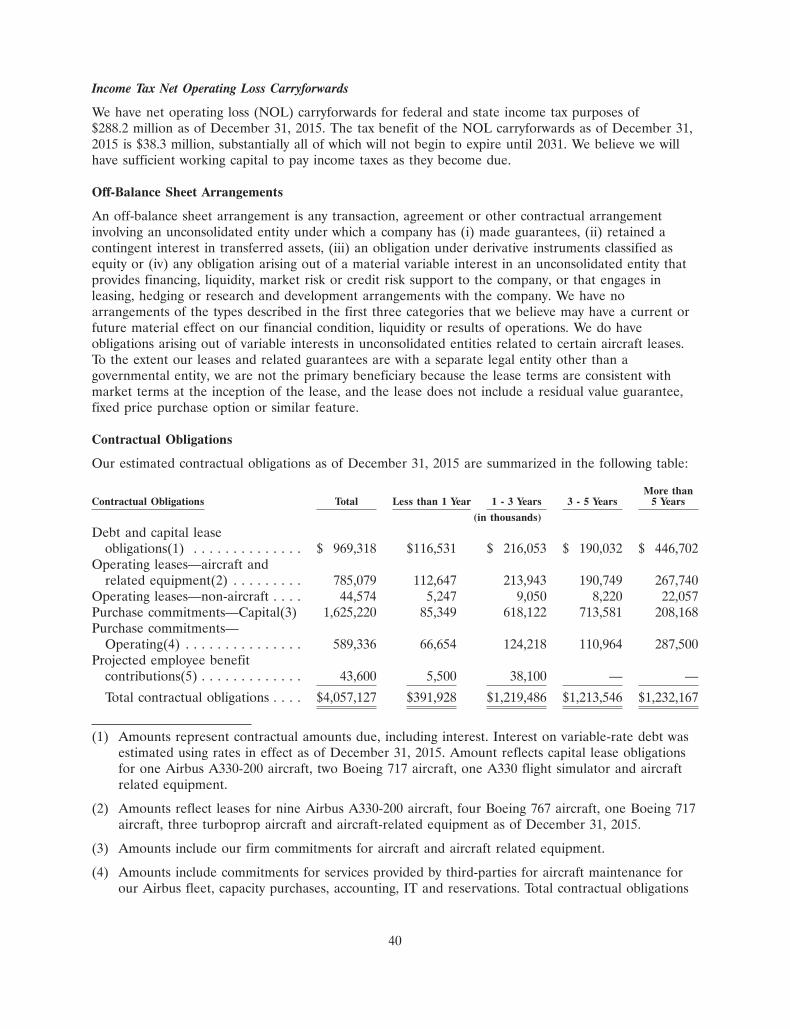
Income Tax Net Operating Loss Carryforwards
We have net operating loss (NOL) carryforwards for federal and state income tax purposes of$288.2 million as of December 31, 2015. The tax benefit of the NOL carryforwards as of December 31,2015 is $38.3 million, substantially all of which will not begin to expire until 2031. We believe we willhave sufficient working capital to pay income taxes as they become due.
Off-Balance Sheet Arrangements
An off-balance sheet arrangement is any transaction, agreement or other contractual arrangementinvolving an unconsolidated entity under which a company has (i) made guarantees, (ii) retained acontingent interest in transferred assets, (iii) an obligation under derivative instruments classified asequity or (iv) any obligation arising out of a material variable interest in an unconsolidated entity thatprovides financing, liquidity, market risk or credit risk support to the company, or that engages inleasing, hedging or research and development arrangements with the company. We have noarrangements of the types described in the first three categories that we believe may have a current orfuture material effect on our financial condition, liquidity or results of operations. We do haveobligations arising out of variable interests in unconsolidated entities related to certain aircraft leases.To the extent our leases and related guarantees are with a separate legal entity other than agovernmental entity, we are not the primary beneficiary because the lease terms are consistent withmarket terms at the inception of the lease, and the lease does not include a residual value guarantee,fixed price purchase option or similar feature.
Contractual Obligations
Our estimated contractual obligations as of December 31, 2015 are summarized in the following table:
More thanContractual Obligations Total Less than 1 Year 1 - 3 Years 3 - 5 Years 5 Years
(in thousands)
Debt and capital leaseobligations(1) . . . . . . . . . . . . . . $ 969,318 $116,531 $ 216,053 $ 190,032 $ 446,702
Operating leases—aircraft andrelated equipment(2) . . . . . . . . . 785,079 112,647 213,943 190,749 267,740
Operating leases—non-aircraft . . . . 44,574 5,247 9,050 8,220 22,057Purchase commitments—Capital(3) 1,625,220 85,349 618,122 713,581 208,168Purchase commitments—
Operating(4) . . . . . . . . . . . . . . . 589,336 66,654 124,218 110,964 287,500Projected employee benefit
contributions(5) . . . . . . . . . . . . . 43,600 5,500 38,100 — —
Total contractual obligations . . . . $4,057,127 $391,928 $1,219,486 $1,213,546 $1,232,167
(1) Amounts represent contractual amounts due, including interest. Interest on variable-rate debt wasestimated using rates in effect as of December 31, 2015. Amount reflects capital lease obligationsfor one Airbus A330-200 aircraft, two Boeing 717 aircraft, one A330 flight simulator and aircraftrelated equipment.
(2) Amounts reflect leases for nine Airbus A330-200 aircraft, four Boeing 767 aircraft, one Boeing 717aircraft, three turboprop aircraft and aircraft-related equipment as of December 31, 2015.
(3) Amounts include our firm commitments for aircraft and aircraft related equipment.
(4) Amounts include commitments for services provided by third-parties for aircraft maintenance forour Airbus fleet, capacity purchases, accounting, IT and reservations. Total contractual obligations
40
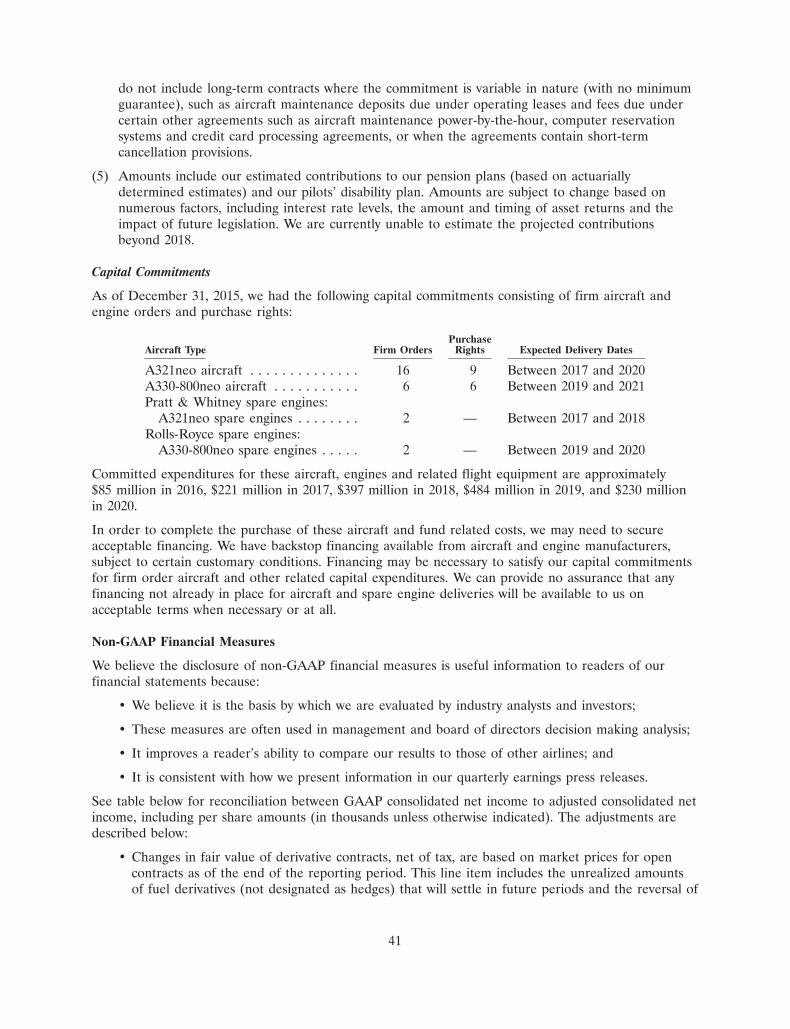
do not include long-term contracts where the commitment is variable in nature (with no minimumguarantee), such as aircraft maintenance deposits due under operating leases and fees due undercertain other agreements such as aircraft maintenance power-by-the-hour, computer reservationsystems and credit card processing agreements, or when the agreements contain short-termcancellation provisions.
(5) Amounts include our estimated contributions to our pension plans (based on actuariallydetermined estimates) and our pilots’ disability plan. Amounts are subject to change based onnumerous factors, including interest rate levels, the amount and timing of asset returns and theimpact of future legislation. We are currently unable to estimate the projected contributionsbeyond 2018.
Capital Commitments
As of December 31, 2015, we had the following capital commitments consisting of firm aircraft andengine orders and purchase rights:
PurchaseAircraft Type Firm Orders Rights Expected Delivery Dates
A321neo aircraft . . . . . . . . . . . . . . 16 9 Between 2017 and 2020A330-800neo aircraft . . . . . . . . . . . 6 6 Between 2019 and 2021Pratt & Whitney spare engines:
A321neo spare engines . . . . . . . . 2 — Between 2017 and 2018Rolls-Royce spare engines:
A330-800neo spare engines . . . . . 2 — Between 2019 and 2020
Committed expenditures for these aircraft, engines and related flight equipment are approximately$85 million in 2016, $221 million in 2017, $397 million in 2018, $484 million in 2019, and $230 millionin 2020.
In order to complete the purchase of these aircraft and fund related costs, we may need to secureacceptable financing. We have backstop financing available from aircraft and engine manufacturers,subject to certain customary conditions. Financing may be necessary to satisfy our capital commitmentsfor firm order aircraft and other related capital expenditures. We can provide no assurance that anyfinancing not already in place for aircraft and spare engine deliveries will be available to us onacceptable terms when necessary or at all.
Non-GAAP Financial Measures
We believe the disclosure of non-GAAP financial measures is useful information to readers of ourfinancial statements because:
• We believe it is the basis by which we are evaluated by industry analysts and investors;
• These measures are often used in management and board of directors decision making analysis;
• It improves a reader’s ability to compare our results to those of other airlines; and
• It is consistent with how we present information in our quarterly earnings press releases.
See table below for reconciliation between GAAP consolidated net income to adjusted consolidated netincome, including per share amounts (in thousands unless otherwise indicated). The adjustments aredescribed below:
• Changes in fair value of derivative contracts, net of tax, are based on market prices for opencontracts as of the end of the reporting period. This line item includes the unrealized amountsof fuel derivatives (not designated as hedges) that will settle in future periods and the reversal of
41
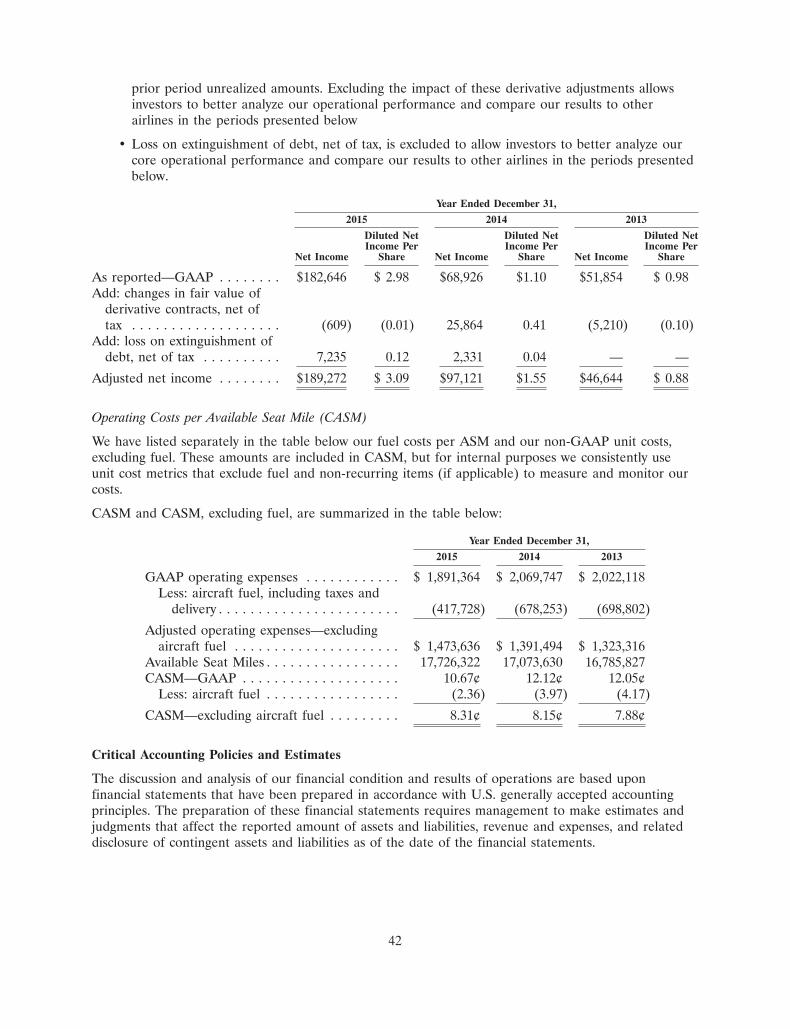
prior period unrealized amounts. Excluding the impact of these derivative adjustments allowsinvestors to better analyze our operational performance and compare our results to otherairlines in the periods presented below
• Loss on extinguishment of debt, net of tax, is excluded to allow investors to better analyze ourcore operational performance and compare our results to other airlines in the periods presentedbelow.
Year Ended December 31,
2015 2014 2013
Diluted Net Diluted Net Diluted NetIncome Per Income Per Income Per
Net Income Share Net Income Share Net Income Share
As reported—GAAP . . . . . . . . $182,646 $ 2.98 $68,926 $1.10 $51,854 $ 0.98Add: changes in fair value of
derivative contracts, net oftax . . . . . . . . . . . . . . . . . . . (609) (0.01) 25,864 0.41 (5,210) (0.10)
Add: loss on extinguishment ofdebt, net of tax . . . . . . . . . . 7,235 0.12 2,331 0.04 — —
Adjusted net income . . . . . . . . $189,272 $ 3.09 $97,121 $1.55 $46,644 $ 0.88
Operating Costs per Available Seat Mile (CASM)
We have listed separately in the table below our fuel costs per ASM and our non-GAAP unit costs,excluding fuel. These amounts are included in CASM, but for internal purposes we consistently useunit cost metrics that exclude fuel and non-recurring items (if applicable) to measure and monitor ourcosts.
CASM and CASM, excluding fuel, are summarized in the table below:
Year Ended December 31,
2015 2014 2013
GAAP operating expenses . . . . . . . . . . . . $ 1,891,364 $ 2,069,747 $ 2,022,118Less: aircraft fuel, including taxes and
delivery . . . . . . . . . . . . . . . . . . . . . . . (417,728) (678,253) (698,802)
Adjusted operating expenses—excludingaircraft fuel . . . . . . . . . . . . . . . . . . . . . $ 1,473,636 $ 1,391,494 $ 1,323,316
Available Seat Miles . . . . . . . . . . . . . . . . . 17,726,322 17,073,630 16,785,827CASM—GAAP . . . . . . . . . . . . . . . . . . . . 10.67¢ 12.12¢ 12.05¢
Less: aircraft fuel . . . . . . . . . . . . . . . . . (2.36) (3.97) (4.17)
CASM—excluding aircraft fuel . . . . . . . . . 8.31¢ 8.15¢ 7.88¢
Critical Accounting Policies and Estimates
The discussion and analysis of our financial condition and results of operations are based uponfinancial statements that have been prepared in accordance with U.S. generally accepted accountingprinciples. The preparation of these financial statements requires management to make estimates andjudgments that affect the reported amount of assets and liabilities, revenue and expenses, and relateddisclosure of contingent assets and liabilities as of the date of the financial statements.
42
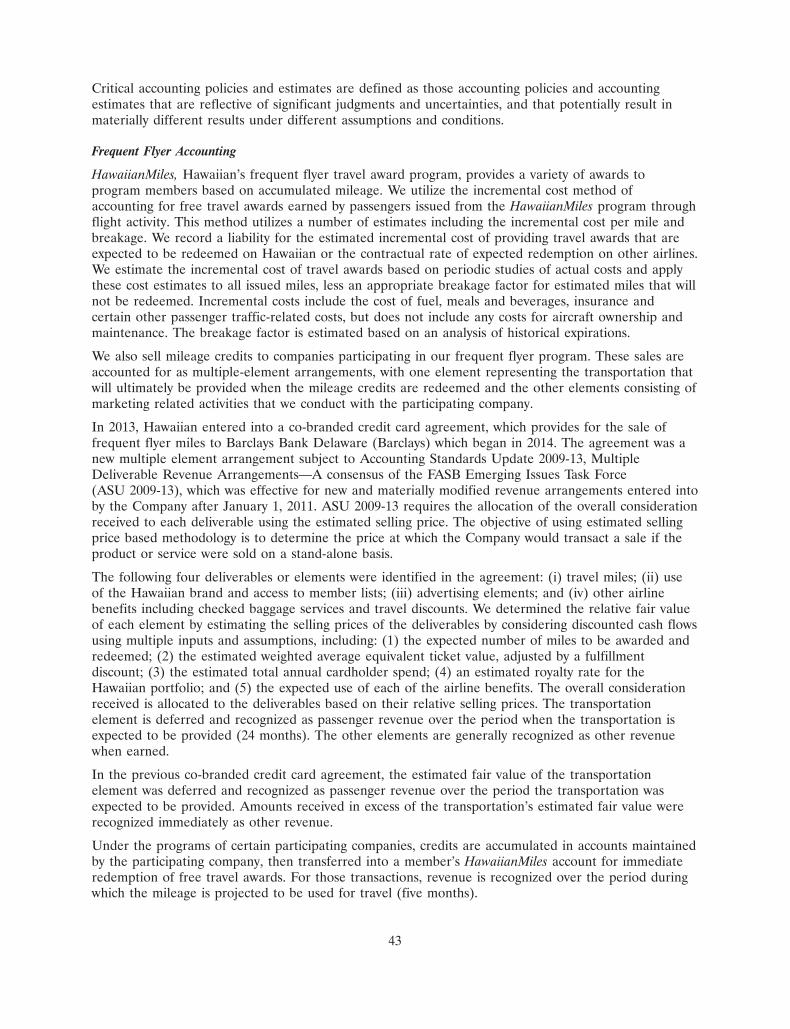
Critical accounting policies and estimates are defined as those accounting policies and accountingestimates that are reflective of significant judgments and uncertainties, and that potentially result inmaterially different results under different assumptions and conditions.
Frequent Flyer Accounting
HawaiianMiles, Hawaiian’s frequent flyer travel award program, provides a variety of awards toprogram members based on accumulated mileage. We utilize the incremental cost method ofaccounting for free travel awards earned by passengers issued from the HawaiianMiles program throughflight activity. This method utilizes a number of estimates including the incremental cost per mile andbreakage. We record a liability for the estimated incremental cost of providing travel awards that areexpected to be redeemed on Hawaiian or the contractual rate of expected redemption on other airlines.We estimate the incremental cost of travel awards based on periodic studies of actual costs and applythese cost estimates to all issued miles, less an appropriate breakage factor for estimated miles that willnot be redeemed. Incremental costs include the cost of fuel, meals and beverages, insurance andcertain other passenger traffic-related costs, but does not include any costs for aircraft ownership andmaintenance. The breakage factor is estimated based on an analysis of historical expirations.
We also sell mileage credits to companies participating in our frequent flyer program. These sales areaccounted for as multiple-element arrangements, with one element representing the transportation thatwill ultimately be provided when the mileage credits are redeemed and the other elements consisting ofmarketing related activities that we conduct with the participating company.
In 2013, Hawaiian entered into a co-branded credit card agreement, which provides for the sale offrequent flyer miles to Barclays Bank Delaware (Barclays) which began in 2014. The agreement was anew multiple element arrangement subject to Accounting Standards Update 2009-13, MultipleDeliverable Revenue Arrangements—A consensus of the FASB Emerging Issues Task Force(ASU 2009-13), which was effective for new and materially modified revenue arrangements entered intoby the Company after January 1, 2011. ASU 2009-13 requires the allocation of the overall considerationreceived to each deliverable using the estimated selling price. The objective of using estimated sellingprice based methodology is to determine the price at which the Company would transact a sale if theproduct or service were sold on a stand-alone basis.
The following four deliverables or elements were identified in the agreement: (i) travel miles; (ii) useof the Hawaiian brand and access to member lists; (iii) advertising elements; and (iv) other airlinebenefits including checked baggage services and travel discounts. We determined the relative fair valueof each element by estimating the selling prices of the deliverables by considering discounted cash flowsusing multiple inputs and assumptions, including: (1) the expected number of miles to be awarded andredeemed; (2) the estimated weighted average equivalent ticket value, adjusted by a fulfillmentdiscount; (3) the estimated total annual cardholder spend; (4) an estimated royalty rate for theHawaiian portfolio; and (5) the expected use of each of the airline benefits. The overall considerationreceived is allocated to the deliverables based on their relative selling prices. The transportationelement is deferred and recognized as passenger revenue over the period when the transportation isexpected to be provided (24 months). The other elements are generally recognized as other revenuewhen earned.
In the previous co-branded credit card agreement, the estimated fair value of the transportationelement was deferred and recognized as passenger revenue over the period the transportation wasexpected to be provided. Amounts received in excess of the transportation’s estimated fair value wererecognized immediately as other revenue.
Under the programs of certain participating companies, credits are accumulated in accounts maintainedby the participating company, then transferred into a member’s HawaiianMiles account for immediateredemption of free travel awards. For those transactions, revenue is recognized over the period duringwhich the mileage is projected to be used for travel (five months).
43
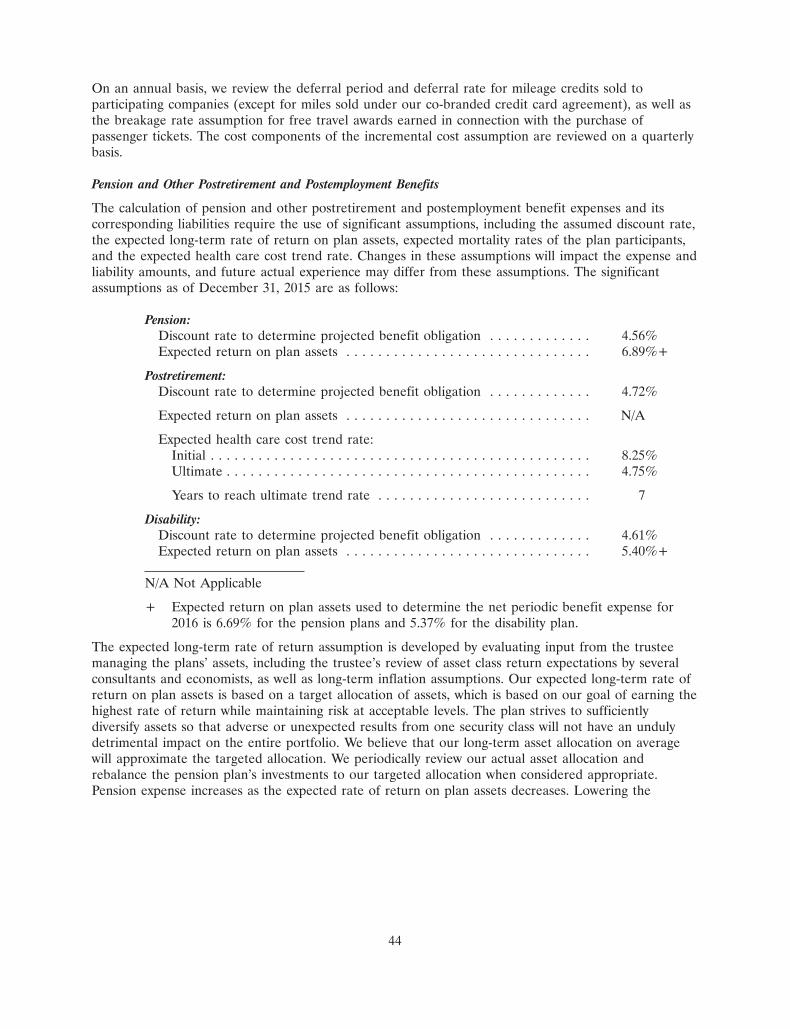
On an annual basis, we review the deferral period and deferral rate for mileage credits sold toparticipating companies (except for miles sold under our co-branded credit card agreement), as well asthe breakage rate assumption for free travel awards earned in connection with the purchase ofpassenger tickets. The cost components of the incremental cost assumption are reviewed on a quarterlybasis.
Pension and Other Postretirement and Postemployment Benefits
The calculation of pension and other postretirement and postemployment benefit expenses and itscorresponding liabilities require the use of significant assumptions, including the assumed discount rate,the expected long-term rate of return on plan assets, expected mortality rates of the plan participants,and the expected health care cost trend rate. Changes in these assumptions will impact the expense andliability amounts, and future actual experience may differ from these assumptions. The significantassumptions as of December 31, 2015 are as follows:
Pension:Discount rate to determine projected benefit obligation . . . . . . . . . . . . . 4.56%Expected return on plan assets . . . . . . . . . . . . . . . . . . . . . . . . . . . . . . . 6.89%+
Postretirement:Discount rate to determine projected benefit obligation . . . . . . . . . . . . . 4.72%
Expected return on plan assets . . . . . . . . . . . . . . . . . . . . . . . . . . . . . . . N/A
Expected health care cost trend rate:Initial . . . . . . . . . . . . . . . . . . . . . . . . . . . . . . . . . . . . . . . . . . . . . . . . 8.25%Ultimate . . . . . . . . . . . . . . . . . . . . . . . . . . . . . . . . . . . . . . . . . . . . . . 4.75%
Years to reach ultimate trend rate . . . . . . . . . . . . . . . . . . . . . . . . . . . 7
Disability:Discount rate to determine projected benefit obligation . . . . . . . . . . . . . 4.61%Expected return on plan assets . . . . . . . . . . . . . . . . . . . . . . . . . . . . . . . 5.40%+
N/A Not Applicable
+ Expected return on plan assets used to determine the net periodic benefit expense for2016 is 6.69% for the pension plans and 5.37% for the disability plan.
The expected long-term rate of return assumption is developed by evaluating input from the trusteemanaging the plans’ assets, including the trustee’s review of asset class return expectations by severalconsultants and economists, as well as long-term inflation assumptions. Our expected long-term rate ofreturn on plan assets is based on a target allocation of assets, which is based on our goal of earning thehighest rate of return while maintaining risk at acceptable levels. The plan strives to sufficientlydiversify assets so that adverse or unexpected results from one security class will not have an undulydetrimental impact on the entire portfolio. We believe that our long-term asset allocation on averagewill approximate the targeted allocation. We periodically review our actual asset allocation andrebalance the pension plan’s investments to our targeted allocation when considered appropriate.Pension expense increases as the expected rate of return on plan assets decreases. Lowering the
44
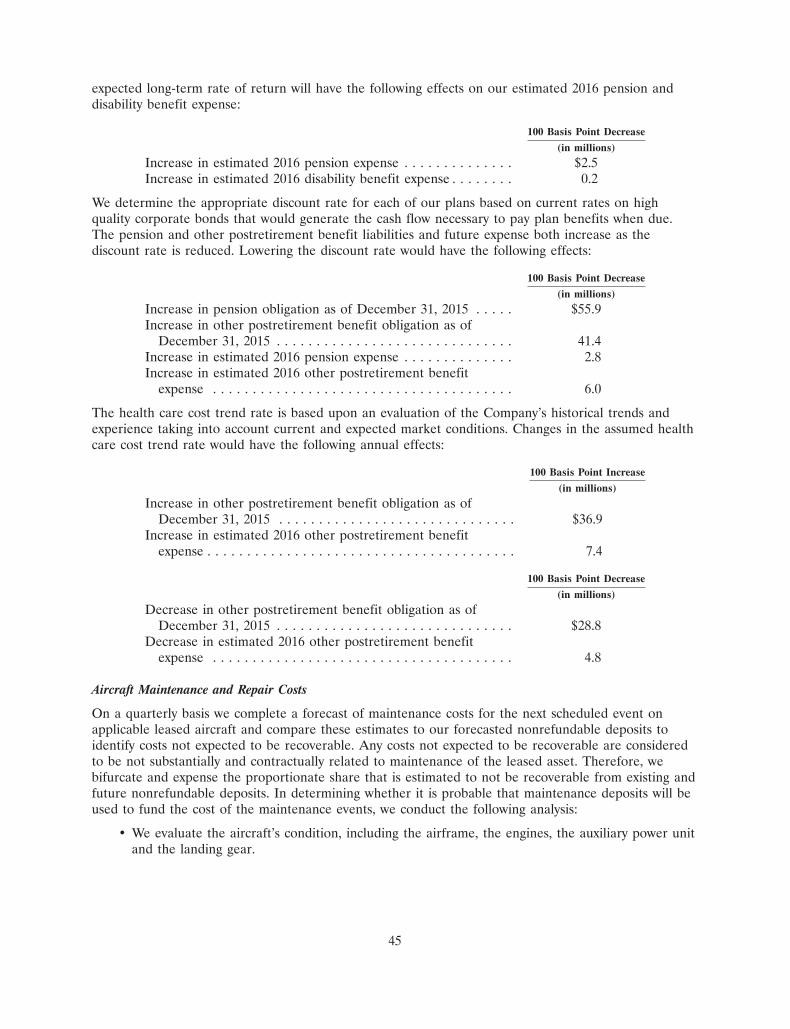
expected long-term rate of return will have the following effects on our estimated 2016 pension anddisability benefit expense:
100 Basis Point Decrease
(in millions)
Increase in estimated 2016 pension expense . . . . . . . . . . . . . . $2.5Increase in estimated 2016 disability benefit expense . . . . . . . . 0.2
We determine the appropriate discount rate for each of our plans based on current rates on highquality corporate bonds that would generate the cash flow necessary to pay plan benefits when due.The pension and other postretirement benefit liabilities and future expense both increase as thediscount rate is reduced. Lowering the discount rate would have the following effects:
100 Basis Point Decrease
(in millions)
Increase in pension obligation as of December 31, 2015 . . . . . $55.9Increase in other postretirement benefit obligation as of
December 31, 2015 . . . . . . . . . . . . . . . . . . . . . . . . . . . . . . 41.4Increase in estimated 2016 pension expense . . . . . . . . . . . . . . 2.8Increase in estimated 2016 other postretirement benefit
expense . . . . . . . . . . . . . . . . . . . . . . . . . . . . . . . . . . . . . . 6.0
The health care cost trend rate is based upon an evaluation of the Company’s historical trends andexperience taking into account current and expected market conditions. Changes in the assumed healthcare cost trend rate would have the following annual effects:
100 Basis Point Increase
(in millions)
Increase in other postretirement benefit obligation as ofDecember 31, 2015 . . . . . . . . . . . . . . . . . . . . . . . . . . . . . . $36.9
Increase in estimated 2016 other postretirement benefitexpense . . . . . . . . . . . . . . . . . . . . . . . . . . . . . . . . . . . . . . . 7.4
100 Basis Point Decrease
(in millions)
Decrease in other postretirement benefit obligation as ofDecember 31, 2015 . . . . . . . . . . . . . . . . . . . . . . . . . . . . . . $28.8
Decrease in estimated 2016 other postretirement benefitexpense . . . . . . . . . . . . . . . . . . . . . . . . . . . . . . . . . . . . . . 4.8
Aircraft Maintenance and Repair Costs
On a quarterly basis we complete a forecast of maintenance costs for the next scheduled event onapplicable leased aircraft and compare these estimates to our forecasted nonrefundable deposits toidentify costs not expected to be recoverable. Any costs not expected to be recoverable are consideredto be not substantially and contractually related to maintenance of the leased asset. Therefore, webifurcate and expense the proportionate share that is estimated to not be recoverable from existing andfuture nonrefundable deposits. In determining whether it is probable that maintenance deposits will beused to fund the cost of the maintenance events, we conduct the following analysis:
• We evaluate the aircraft’s condition, including the airframe, the engines, the auxiliary power unitand the landing gear.
45
• We then project future usage of the aircraft during the term of the lease based on our businessand fleet plan.
• We estimate the cost of performing the next scheduled maintenance event. These estimates arebased on the experience of our maintenance personnel and available industry data, includinghistorical fleet operating statistic reports published by the aircraft and engine manufacturers.
• We compare the forecasted maintenance deposits to be paid at the time of the next scheduledmaintenance event to the estimated cost of the next scheduled maintenance event. Those costsnot expected to be recoverable are considered to be not substantially and contractually relatedto maintenance of the leased asset.
• We prospectively account for any changes in estimates.
Our assessment of the recoverability of our maintenance deposits is subject to change in the event thatkey estimates and assumptions change over time. Those key estimates and assumptions include ourfleet plan and the projected total cost and, to a lesser extent, anticipated timing of the majormaintenance activities covered by the maintenance reserves.
Based on current market conditions, we believe that further significant changes in our fleet plan areunlikely. Furthermore, based on historical trends and future projections, including those published bythe manufacturers of our aircraft and engines, we believe it is unlikely that future maintenance costsfor our aircraft will decline to such an extent that the maintenance deposits currently recorded on ourConsolidated Balance Sheets would not be used to fund the cost of future maintenance events and,therefore, not be recoverable.
ITEM 7A. QUANTITATIVE AND QUALITATIVE DISCLOSURES ABOUT MARKET RISK.
We are subject to certain market risks, including commodity price risk (i.e. jet fuel prices), interest raterisk and foreign currency risk. We have market-sensitive instruments in the form of variable-rate debtand financial derivatives used to offset Hawaiian’s exposure to jet fuel price increases, and financialhedge instruments used to hedge Hawaiian’s exposure to variable interest rate risk and foreign currencyexchange risk. The adverse effects of potential changes in these market risks are discussed below.
The sensitivity analyses presented do not consider the effects that such adverse changes may have onoverall economic activity nor do they consider additional actions we might undertake to mitigate ourexposure to such changes. Actual results may differ.
Aircraft Fuel Costs
Aircraft fuel costs constitute a significant portion of our operating expense. Fuel costs represented 22%of our operating expenses for the year ended December 31, 2015. Approximately 70% of our fuel isbased on Singapore jet fuel prices and 30% is based on U.S. West Coast jet fuel prices. Based ongallons expected to be consumed in 2016, for every one cent increase in the cost of a gallon of jet fuel,our fuel expense would increase by approximately $2.4 million, excluding the results of our fuel hedgeprogram.
We periodically enter into derivative financial instruments to manage our exposure to changes in theprice of jet fuel. During 2015, our fuel hedge program primarily consisted of heating oil puts andswaps. Put option contracts provide for a settlement in favor of the holder in the event the prices fallbelow a predetermined contractual level during a particular time period. Swaps provide for a settlementin our favor in the event the prices exceed a predetermined contractual level and are unfavorable inthe event prices fall below a predetermined contractual level.
As of December 31, 2015, we hedged approximately 35% of our projected fuel requirements for 2016with heating oil puts and swaps. As of December 31, 2015, the fair value of these fuel derivative
46
agreements reflected a net liability of $39.5 million that is recorded in other accrued liabilities in theConsolidated Balance Sheets.
We expect to continue our program of offsetting some of our exposure to future changes in the priceof jet fuel with a combination of fixed forward pricing contracts, swaps, puts and other option-basedstructures.
We do not hold or issue derivative financial instruments for trading purposes.
Interest Rates
Our results of operations are affected by fluctuations in interest rates due to our variable-rate debt andinterest income earned on our cash deposits. Our variable-rate debt agreements include the RevolvingCredit Facility and secured loan agreements, the terms of which are discussed in Note 8 to ourconsolidated financial statements.
At December 31, 2015, we had $51.0 million of variable-rate debt indexed to the following interest rate:
Index Rate
Three-month LIBOR . . . . . . . . . . . . . . . . . . . . . . . . . . . . . . . . . . . . . . . . . . 0.54%
Changes in market interest rates have a direct and corresponding effect on our pre-tax earnings andcash flows associated with our variable-rate debt and interest-bearing cash accounts. Based on thebalances of our cash and cash equivalents, restricted cash, short-term investments, and variable-ratedebt as of December 31, 2015, a change in interest rates is unlikely to have a material impact on ourresults of operations.
At December 31, 2015, we had $721 million of fixed-rate debt including aircraft capital leaseobligations, a convertible note, facility agreements for aircraft purchases, and the outstandingequipment notes related to the EETC financing. Market risk for fixed-rate long-term debt is estimatedas the potential increase in fair value resulting from a hypothetical 10% decrease in market rates, andamounted to approximately $15 million as of December 31, 2015.
In April 2013, we issued variable-rate debt to finance a portion of the purchase price of another AirbusA330-200 aircraft. The interest rate associated with this debt is based on a market index rate that resetsevery three months. To limit our exposure to significant increases in the applicable market index ratesfor this debt, we entered into a forward starting interest swap agreement, which had an immaterialimpact on our financial statements.
Foreign Currency
We generate revenues and incur expenses in foreign currencies. Changes in foreign currency exchangerates impact our results of operations through changes in the dollar value of foreign currency-denominated operating revenues and expenses. Our most significant foreign currency exposures are theJapanese Yen and Australian Dollar. Based on expected 2016 revenues and expenses denominated inJapanese Yen and Australian Dollars, a 10% strengthening in value of the U.S. dollar, relative to theJapanese Yen and Australian Dollar, would result in a decrease in operating income of approximately$18 million and $9 million, respectively, which excludes the offset of the hedges discussed below. Thispotential impact to the results of our operation is driven by the inherent nature of our internationaloperations, which requires us to accept a large volume of sales transactions denominated in foreigncurrencies while few expense transactions are settled in foreign currencies. This disparity is the primaryfactor in our exposure to foreign currency exchange rates.
As of December 31, 2015, the fair value of our foreign currency forwards reflected a net asset of$5.9 million that is recorded in prepaid expenses and other, and $0.4 million recorded in otherliabilities and deferred credits reflected in the Consolidated Balance Sheets.
47
ITEM 8. FINANCIAL STATEMENTS AND SUPPLEMENTARY DATA.
INDEX TO FINANCIAL STATEMENTS
Page
Hawaiian Holdings, Inc.Report of Independent Registered Public Accounting Firm . . . . . . . . . . . . . . . . . . . . . . . . . . . . 49Consolidated Statements of Operations for the years ended December 31, 2015, 2014 and 2013 . . 50Consolidated Statements of Comprehensive Income for the years ended December 31, 2015,
2014 and 2013 . . . . . . . . . . . . . . . . . . . . . . . . . . . . . . . . . . . . . . . . . . . . . . . . . . . . . . . . . . . 51Consolidated Balance Sheets as of December 31, 2015 and 2014 . . . . . . . . . . . . . . . . . . . . . . . . 52Consolidated Statements of Shareholders’ Equity for the years ended December 31, 2015, 2014
and 2013 . . . . . . . . . . . . . . . . . . . . . . . . . . . . . . . . . . . . . . . . . . . . . . . . . . . . . . . . . . . . . . . 53Consolidated Statements of Cash Flows for the years ended December 31, 2015, 2014 and 2013 . 54Notes to Consolidated Financial Statements . . . . . . . . . . . . . . . . . . . . . . . . . . . . . . . . . . . . . . . 55
48
REPORT OF INDEPENDENT REGISTERED PUBLIC ACCOUNTING FIRM
The Board of Directors and Shareholders of Hawaiian Holdings, Inc.
We have audited the accompanying consolidated balance sheets of Hawaiian Holdings, Inc. as ofDecember 31, 2015 and 2014, and the related consolidated statements of operations, comprehensiveincome (loss), shareholders’ equity, and cash flows for each of the three years in the period endedDecember 31, 2015. Our audits also included the financial statement schedule listed in the Index atItem 15(a). These financial statements and schedule are the responsibility of the Company’smanagement. Our responsibility is to express an opinion on these financial statements and schedulebased on our audits.
We conducted our audits in accordance with the standards of the Public Company AccountingOversight Board (United States). Those standards require that we plan and perform the audit to obtainreasonable assurance about whether the financial statements are free of material misstatement. Anaudit includes examining, on a test basis, evidence supporting the amounts and disclosures in thefinancial statements. An audit also includes assessing the accounting principles used and significantestimates made by management, as well as evaluating the overall financial statement presentation. Webelieve that our audits provide a reasonable basis for our opinion.
In our opinion, the financial statements referred to above present fairly, in all material respects, theconsolidated financial position of Hawaiian Holdings, Inc. at December 31, 2015 and 2014, and theconsolidated results of its operations and its cash flows for each of the three years in the period endedDecember 31, 2015, in conformity with U.S. generally accepted accounting principles. Also, in ouropinion, the related financial statement schedule, when considered in relation to the basic financialstatements taken as a whole, presents fairly in all material respects the information set forth therein.
We also have audited, in accordance with the standards of the Public Company Accounting OversightBoard (United States), Hawaiian Holdings, Inc.’s internal control over financial reporting as ofDecember 31, 2015, based on criteria established in Internal Control—Integrated Framework issued bythe Committee of Sponsoring Organizations of the Treadway Commission (2013 framework) and ourreport dated February 8, 2016, expressed an unqualified opinion thereon.
/s/ ERNST & YOUNG LLP
Honolulu, Hawai’iFebruary 8, 2016
49
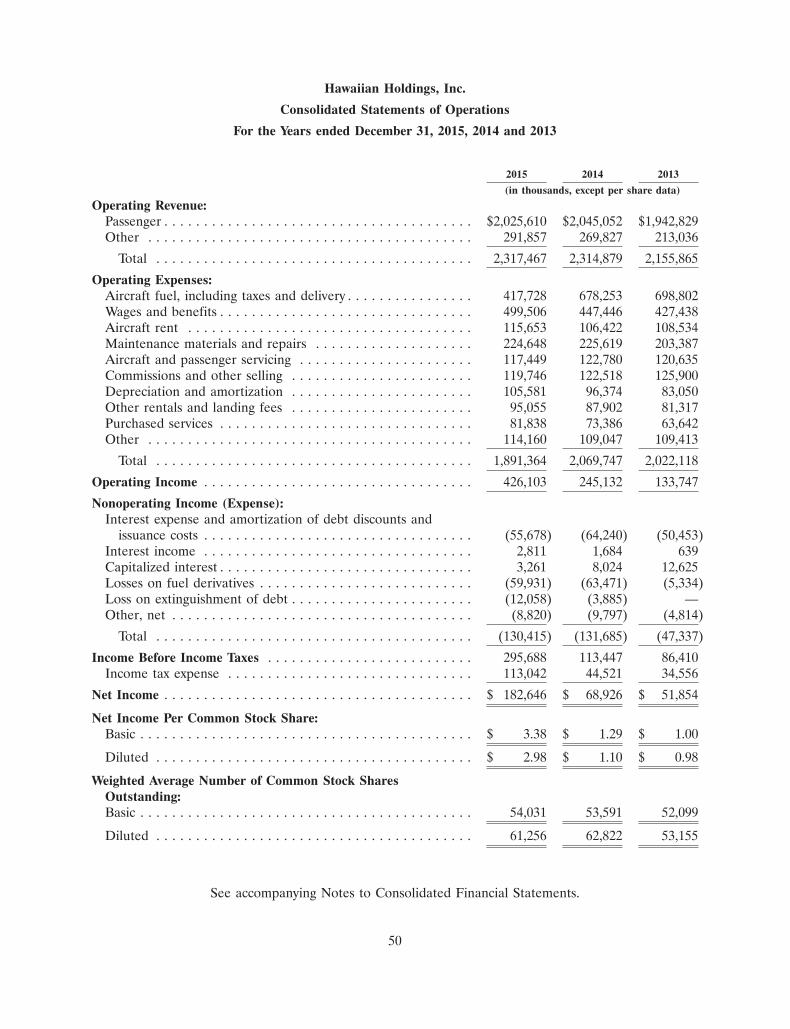
Hawaiian Holdings, Inc.
Consolidated Statements of Operations
For the Years ended December 31, 2015, 2014 and 2013
2015 2014 2013
(in thousands, except per share data)
Operating Revenue:Passenger . . . . . . . . . . . . . . . . . . . . . . . . . . . . . . . . . . . . . . . $2,025,610 $2,045,052 $1,942,829Other . . . . . . . . . . . . . . . . . . . . . . . . . . . . . . . . . . . . . . . . . 291,857 269,827 213,036
Total . . . . . . . . . . . . . . . . . . . . . . . . . . . . . . . . . . . . . . . . 2,317,467 2,314,879 2,155,865
Operating Expenses:Aircraft fuel, including taxes and delivery . . . . . . . . . . . . . . . . 417,728 678,253 698,802Wages and benefits . . . . . . . . . . . . . . . . . . . . . . . . . . . . . . . . 499,506 447,446 427,438Aircraft rent . . . . . . . . . . . . . . . . . . . . . . . . . . . . . . . . . . . . 115,653 106,422 108,534Maintenance materials and repairs . . . . . . . . . . . . . . . . . . . . 224,648 225,619 203,387Aircraft and passenger servicing . . . . . . . . . . . . . . . . . . . . . . 117,449 122,780 120,635Commissions and other selling . . . . . . . . . . . . . . . . . . . . . . . 119,746 122,518 125,900Depreciation and amortization . . . . . . . . . . . . . . . . . . . . . . . 105,581 96,374 83,050Other rentals and landing fees . . . . . . . . . . . . . . . . . . . . . . . 95,055 87,902 81,317Purchased services . . . . . . . . . . . . . . . . . . . . . . . . . . . . . . . . 81,838 73,386 63,642Other . . . . . . . . . . . . . . . . . . . . . . . . . . . . . . . . . . . . . . . . . 114,160 109,047 109,413
Total . . . . . . . . . . . . . . . . . . . . . . . . . . . . . . . . . . . . . . . . 1,891,364 2,069,747 2,022,118
Operating Income . . . . . . . . . . . . . . . . . . . . . . . . . . . . . . . . . . 426,103 245,132 133,747
Nonoperating Income (Expense):Interest expense and amortization of debt discounts and
issuance costs . . . . . . . . . . . . . . . . . . . . . . . . . . . . . . . . . . (55,678) (64,240) (50,453)Interest income . . . . . . . . . . . . . . . . . . . . . . . . . . . . . . . . . . 2,811 1,684 639Capitalized interest . . . . . . . . . . . . . . . . . . . . . . . . . . . . . . . . 3,261 8,024 12,625Losses on fuel derivatives . . . . . . . . . . . . . . . . . . . . . . . . . . . (59,931) (63,471) (5,334)Loss on extinguishment of debt . . . . . . . . . . . . . . . . . . . . . . . (12,058) (3,885) —Other, net . . . . . . . . . . . . . . . . . . . . . . . . . . . . . . . . . . . . . . (8,820) (9,797) (4,814)
Total . . . . . . . . . . . . . . . . . . . . . . . . . . . . . . . . . . . . . . . . (130,415) (131,685) (47,337)
Income Before Income Taxes . . . . . . . . . . . . . . . . . . . . . . . . . . 295,688 113,447 86,410Income tax expense . . . . . . . . . . . . . . . . . . . . . . . . . . . . . . . 113,042 44,521 34,556
Net Income . . . . . . . . . . . . . . . . . . . . . . . . . . . . . . . . . . . . . . . $ 182,646 $ 68,926 $ 51,854
Net Income Per Common Stock Share:Basic . . . . . . . . . . . . . . . . . . . . . . . . . . . . . . . . . . . . . . . . . . $ 3.38 $ 1.29 $ 1.00
Diluted . . . . . . . . . . . . . . . . . . . . . . . . . . . . . . . . . . . . . . . . $ 2.98 $ 1.10 $ 0.98
Weighted Average Number of Common Stock SharesOutstanding:Basic . . . . . . . . . . . . . . . . . . . . . . . . . . . . . . . . . . . . . . . . . . 54,031 53,591 52,099
Diluted . . . . . . . . . . . . . . . . . . . . . . . . . . . . . . . . . . . . . . . . 61,256 62,822 53,155
See accompanying Notes to Consolidated Financial Statements.
50
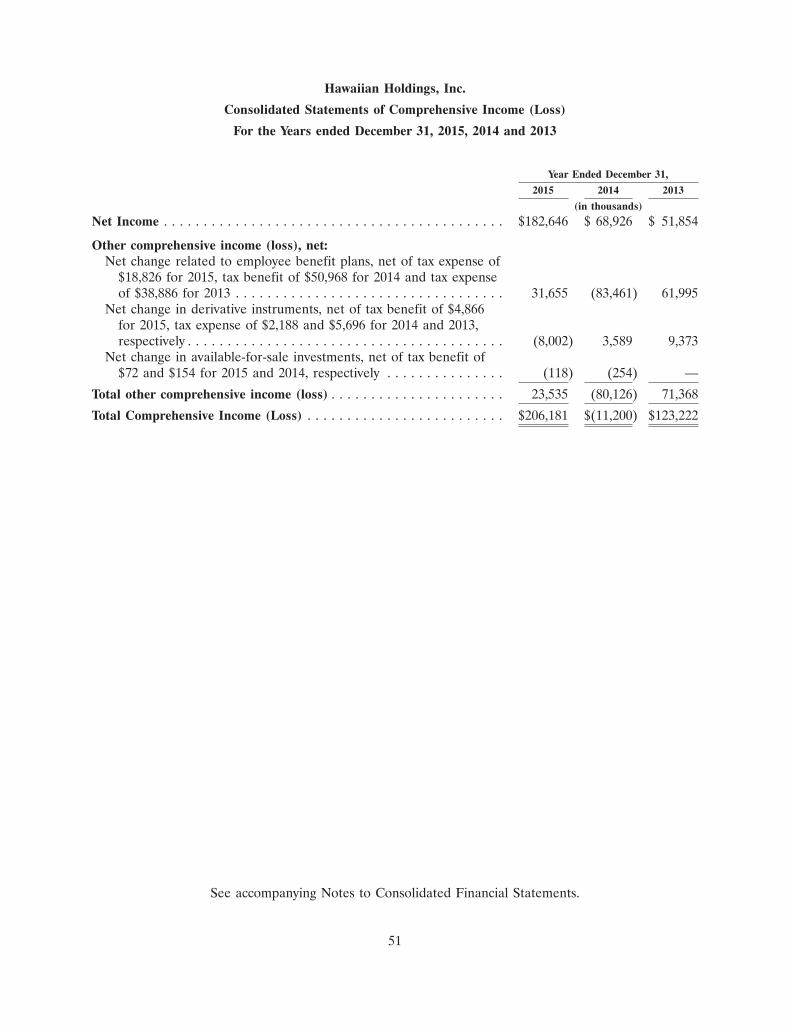
Hawaiian Holdings, Inc.
Consolidated Statements of Comprehensive Income (Loss)
For the Years ended December 31, 2015, 2014 and 2013
Year Ended December 31,
2015 2014 2013
(in thousands)
Net Income . . . . . . . . . . . . . . . . . . . . . . . . . . . . . . . . . . . . . . . . . . . $182,646 $ 68,926 $ 51,854
Other comprehensive income (loss), net:Net change related to employee benefit plans, net of tax expense of
$18,826 for 2015, tax benefit of $50,968 for 2014 and tax expenseof $38,886 for 2013 . . . . . . . . . . . . . . . . . . . . . . . . . . . . . . . . . . 31,655 (83,461) 61,995
Net change in derivative instruments, net of tax benefit of $4,866for 2015, tax expense of $2,188 and $5,696 for 2014 and 2013,respectively . . . . . . . . . . . . . . . . . . . . . . . . . . . . . . . . . . . . . . . . (8,002) 3,589 9,373
Net change in available-for-sale investments, net of tax benefit of$72 and $154 for 2015 and 2014, respectively . . . . . . . . . . . . . . . (118) (254) —
Total other comprehensive income (loss) . . . . . . . . . . . . . . . . . . . . . . 23,535 (80,126) 71,368
Total Comprehensive Income (Loss) . . . . . . . . . . . . . . . . . . . . . . . . . $206,181 $(11,200) $123,222
See accompanying Notes to Consolidated Financial Statements.
51
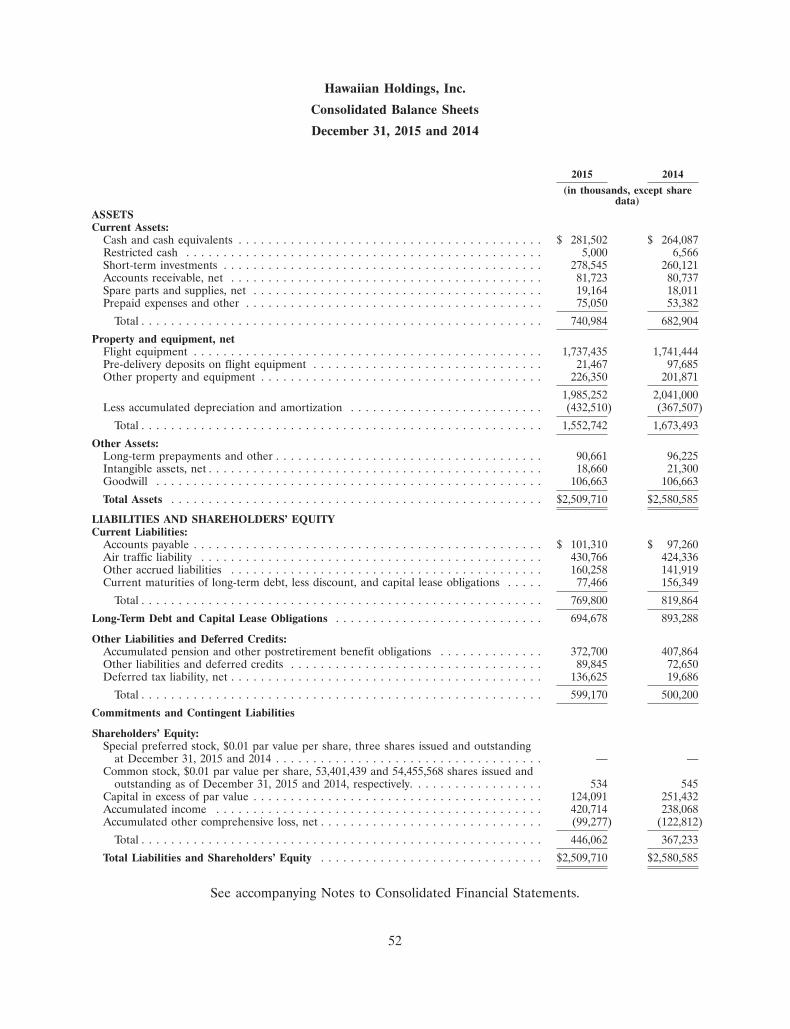
Hawaiian Holdings, Inc.
Consolidated Balance Sheets
December 31, 2015 and 2014
2015 2014
(in thousands, except sharedata)
ASSETSCurrent Assets:
Cash and cash equivalents . . . . . . . . . . . . . . . . . . . . . . . . . . . . . . . . . . . . . . . . . $ 281,502 $ 264,087Restricted cash . . . . . . . . . . . . . . . . . . . . . . . . . . . . . . . . . . . . . . . . . . . . . . . . 5,000 6,566Short-term investments . . . . . . . . . . . . . . . . . . . . . . . . . . . . . . . . . . . . . . . . . . . 278,545 260,121Accounts receivable, net . . . . . . . . . . . . . . . . . . . . . . . . . . . . . . . . . . . . . . . . . . 81,723 80,737Spare parts and supplies, net . . . . . . . . . . . . . . . . . . . . . . . . . . . . . . . . . . . . . . . 19,164 18,011Prepaid expenses and other . . . . . . . . . . . . . . . . . . . . . . . . . . . . . . . . . . . . . . . . 75,050 53,382
Total . . . . . . . . . . . . . . . . . . . . . . . . . . . . . . . . . . . . . . . . . . . . . . . . . . . . . . 740,984 682,904
Property and equipment, netFlight equipment . . . . . . . . . . . . . . . . . . . . . . . . . . . . . . . . . . . . . . . . . . . . . . . 1,737,435 1,741,444Pre-delivery deposits on flight equipment . . . . . . . . . . . . . . . . . . . . . . . . . . . . . . . 21,467 97,685Other property and equipment . . . . . . . . . . . . . . . . . . . . . . . . . . . . . . . . . . . . . . 226,350 201,871
1,985,252 2,041,000Less accumulated depreciation and amortization . . . . . . . . . . . . . . . . . . . . . . . . . . (432,510) (367,507)
Total . . . . . . . . . . . . . . . . . . . . . . . . . . . . . . . . . . . . . . . . . . . . . . . . . . . . . . 1,552,742 1,673,493
Other Assets:Long-term prepayments and other . . . . . . . . . . . . . . . . . . . . . . . . . . . . . . . . . . . . 90,661 96,225Intangible assets, net . . . . . . . . . . . . . . . . . . . . . . . . . . . . . . . . . . . . . . . . . . . . . 18,660 21,300Goodwill . . . . . . . . . . . . . . . . . . . . . . . . . . . . . . . . . . . . . . . . . . . . . . . . . . . . 106,663 106,663
Total Assets . . . . . . . . . . . . . . . . . . . . . . . . . . . . . . . . . . . . . . . . . . . . . . . . . . $2,509,710 $2,580,585
LIABILITIES AND SHAREHOLDERS’ EQUITYCurrent Liabilities:
Accounts payable . . . . . . . . . . . . . . . . . . . . . . . . . . . . . . . . . . . . . . . . . . . . . . . $ 101,310 $ 97,260Air traffic liability . . . . . . . . . . . . . . . . . . . . . . . . . . . . . . . . . . . . . . . . . . . . . . 430,766 424,336Other accrued liabilities . . . . . . . . . . . . . . . . . . . . . . . . . . . . . . . . . . . . . . . . . . 160,258 141,919Current maturities of long-term debt, less discount, and capital lease obligations . . . . . 77,466 156,349
Total . . . . . . . . . . . . . . . . . . . . . . . . . . . . . . . . . . . . . . . . . . . . . . . . . . . . . . 769,800 819,864
Long-Term Debt and Capital Lease Obligations . . . . . . . . . . . . . . . . . . . . . . . . . . . . 694,678 893,288
Other Liabilities and Deferred Credits:Accumulated pension and other postretirement benefit obligations . . . . . . . . . . . . . . 372,700 407,864Other liabilities and deferred credits . . . . . . . . . . . . . . . . . . . . . . . . . . . . . . . . . . 89,845 72,650Deferred tax liability, net . . . . . . . . . . . . . . . . . . . . . . . . . . . . . . . . . . . . . . . . . . 136,625 19,686
Total . . . . . . . . . . . . . . . . . . . . . . . . . . . . . . . . . . . . . . . . . . . . . . . . . . . . . . 599,170 500,200
Commitments and Contingent Liabilities
Shareholders’ Equity:Special preferred stock, $0.01 par value per share, three shares issued and outstanding
at December 31, 2015 and 2014 . . . . . . . . . . . . . . . . . . . . . . . . . . . . . . . . . . . . — —Common stock, $0.01 par value per share, 53,401,439 and 54,455,568 shares issued and
outstanding as of December 31, 2015 and 2014, respectively. . . . . . . . . . . . . . . . . . 534 545Capital in excess of par value . . . . . . . . . . . . . . . . . . . . . . . . . . . . . . . . . . . . . . . 124,091 251,432Accumulated income . . . . . . . . . . . . . . . . . . . . . . . . . . . . . . . . . . . . . . . . . . . . 420,714 238,068Accumulated other comprehensive loss, net . . . . . . . . . . . . . . . . . . . . . . . . . . . . . . (99,277) (122,812)
Total . . . . . . . . . . . . . . . . . . . . . . . . . . . . . . . . . . . . . . . . . . . . . . . . . . . . . . 446,062 367,233
Total Liabilities and Shareholders’ Equity . . . . . . . . . . . . . . . . . . . . . . . . . . . . . . $2,509,710 $2,580,585
See accompanying Notes to Consolidated Financial Statements.
52
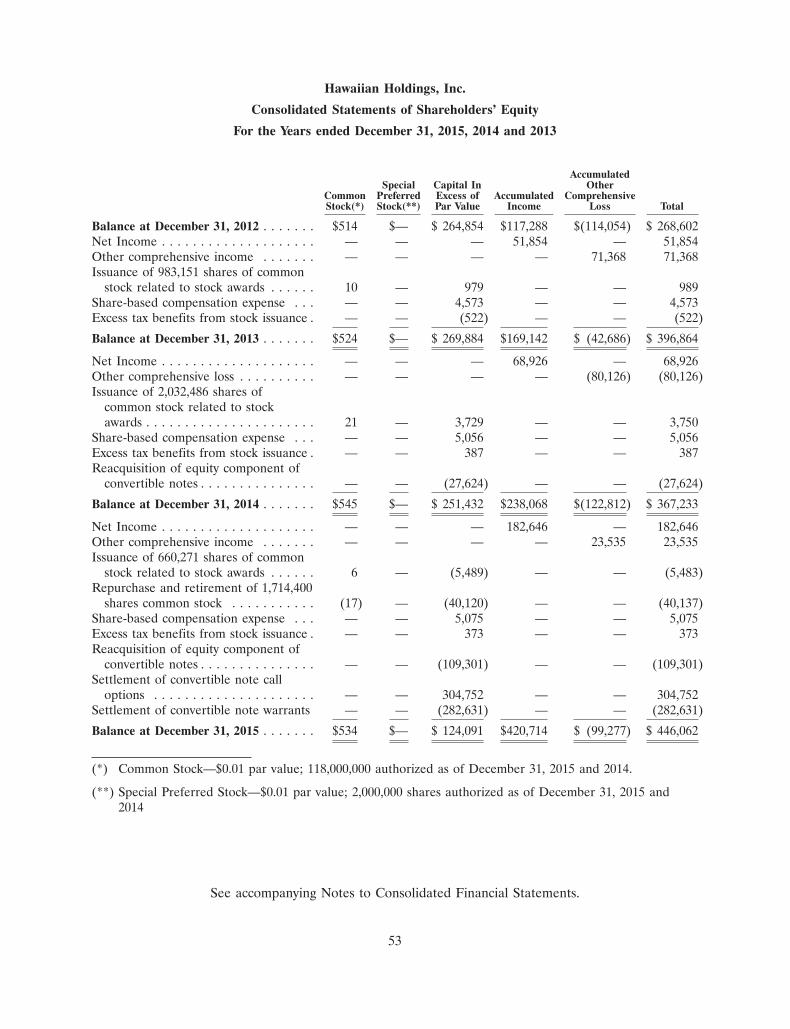
Hawaiian Holdings, Inc.
Consolidated Statements of Shareholders’ Equity
For the Years ended December 31, 2015, 2014 and 2013
AccumulatedSpecial Capital In Other
Common Preferred Excess of Accumulated ComprehensiveStock(*) Stock(**) Par Value Income Loss Total
Balance at December 31, 2012 . . . . . . . $514 $— $ 264,854 $117,288 $(114,054) $ 268,602Net Income . . . . . . . . . . . . . . . . . . . . — — — 51,854 — 51,854Other comprehensive income . . . . . . . — — — — 71,368 71,368Issuance of 983,151 shares of common
stock related to stock awards . . . . . . 10 — 979 — — 989Share-based compensation expense . . . — — 4,573 — — 4,573Excess tax benefits from stock issuance . — — (522) — — (522)
Balance at December 31, 2013 . . . . . . . $524 $— $ 269,884 $169,142 $ (42,686) $ 396,864
Net Income . . . . . . . . . . . . . . . . . . . . — — — 68,926 — 68,926Other comprehensive loss . . . . . . . . . . — — — — (80,126) (80,126)Issuance of 2,032,486 shares of
common stock related to stockawards . . . . . . . . . . . . . . . . . . . . . . 21 — 3,729 — — 3,750
Share-based compensation expense . . . — — 5,056 — — 5,056Excess tax benefits from stock issuance . — — 387 — — 387Reacquisition of equity component of
convertible notes . . . . . . . . . . . . . . . — — (27,624) — — (27,624)
Balance at December 31, 2014 . . . . . . . $545 $— $ 251,432 $238,068 $(122,812) $ 367,233
Net Income . . . . . . . . . . . . . . . . . . . . — — — 182,646 — 182,646Other comprehensive income . . . . . . . — — — — 23,535 23,535Issuance of 660,271 shares of common
stock related to stock awards . . . . . . 6 — (5,489) — — (5,483)Repurchase and retirement of 1,714,400
shares common stock . . . . . . . . . . . (17) — (40,120) — — (40,137)Share-based compensation expense . . . — — 5,075 — — 5,075Excess tax benefits from stock issuance . — — 373 — — 373Reacquisition of equity component of
convertible notes . . . . . . . . . . . . . . . — — (109,301) — — (109,301)Settlement of convertible note call
options . . . . . . . . . . . . . . . . . . . . . — — 304,752 — — 304,752Settlement of convertible note warrants — — (282,631) — — (282,631)
Balance at December 31, 2015 . . . . . . . $534 $— $ 124,091 $420,714 $ (99,277) $ 446,062
(*) Common Stock—$0.01 par value; 118,000,000 authorized as of December 31, 2015 and 2014.
(**) Special Preferred Stock—$0.01 par value; 2,000,000 shares authorized as of December 31, 2015 and2014
See accompanying Notes to Consolidated Financial Statements.
53
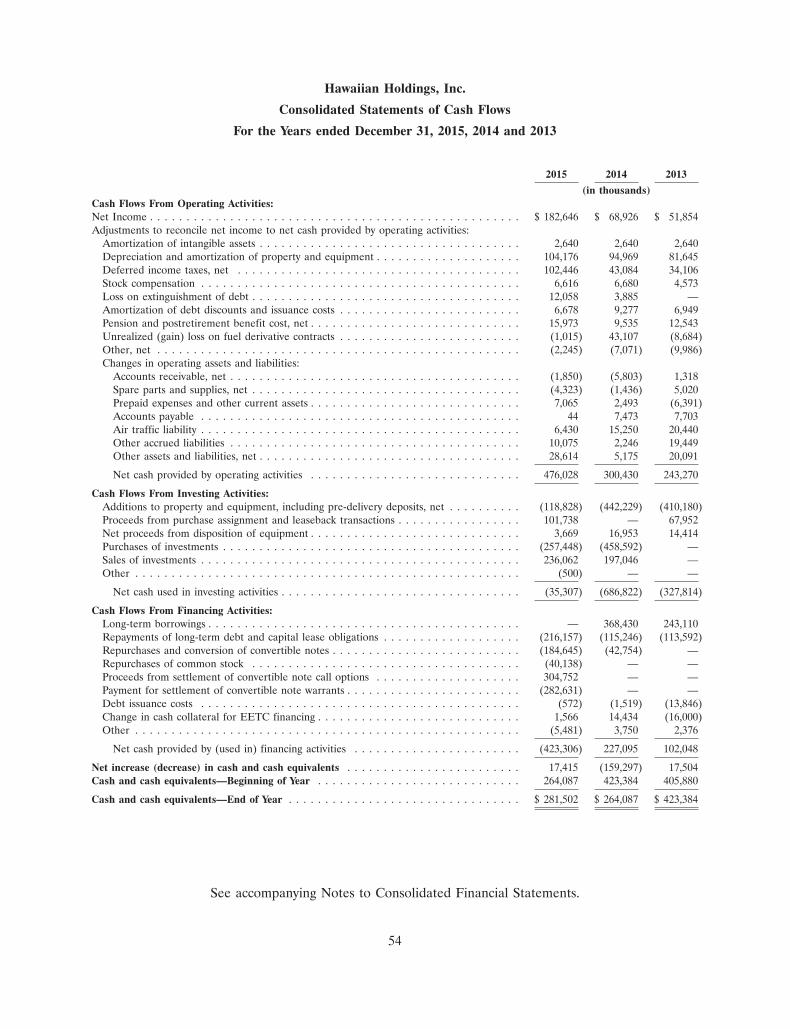
Hawaiian Holdings, Inc.
Consolidated Statements of Cash Flows
For the Years ended December 31, 2015, 2014 and 2013
2015 2014 2013
(in thousands)Cash Flows From Operating Activities:Net Income . . . . . . . . . . . . . . . . . . . . . . . . . . . . . . . . . . . . . . . . . . . . . . . . . . . $ 182,646 $ 68,926 $ 51,854Adjustments to reconcile net income to net cash provided by operating activities:
Amortization of intangible assets . . . . . . . . . . . . . . . . . . . . . . . . . . . . . . . . . . . . 2,640 2,640 2,640Depreciation and amortization of property and equipment . . . . . . . . . . . . . . . . . . . . 104,176 94,969 81,645Deferred income taxes, net . . . . . . . . . . . . . . . . . . . . . . . . . . . . . . . . . . . . . . . 102,446 43,084 34,106Stock compensation . . . . . . . . . . . . . . . . . . . . . . . . . . . . . . . . . . . . . . . . . . . . 6,616 6,680 4,573Loss on extinguishment of debt . . . . . . . . . . . . . . . . . . . . . . . . . . . . . . . . . . . . . 12,058 3,885 —Amortization of debt discounts and issuance costs . . . . . . . . . . . . . . . . . . . . . . . . . 6,678 9,277 6,949Pension and postretirement benefit cost, net . . . . . . . . . . . . . . . . . . . . . . . . . . . . . 15,973 9,535 12,543Unrealized (gain) loss on fuel derivative contracts . . . . . . . . . . . . . . . . . . . . . . . . . (1,015) 43,107 (8,684)Other, net . . . . . . . . . . . . . . . . . . . . . . . . . . . . . . . . . . . . . . . . . . . . . . . . . . (2,245) (7,071) (9,986)Changes in operating assets and liabilities:
Accounts receivable, net . . . . . . . . . . . . . . . . . . . . . . . . . . . . . . . . . . . . . . . . (1,850) (5,803) 1,318Spare parts and supplies, net . . . . . . . . . . . . . . . . . . . . . . . . . . . . . . . . . . . . . (4,323) (1,436) 5,020Prepaid expenses and other current assets . . . . . . . . . . . . . . . . . . . . . . . . . . . . . 7,065 2,493 (6,391)Accounts payable . . . . . . . . . . . . . . . . . . . . . . . . . . . . . . . . . . . . . . . . . . . . 44 7,473 7,703Air traffic liability . . . . . . . . . . . . . . . . . . . . . . . . . . . . . . . . . . . . . . . . . . . . 6,430 15,250 20,440Other accrued liabilities . . . . . . . . . . . . . . . . . . . . . . . . . . . . . . . . . . . . . . . . 10,075 2,246 19,449Other assets and liabilities, net . . . . . . . . . . . . . . . . . . . . . . . . . . . . . . . . . . . . 28,614 5,175 20,091
Net cash provided by operating activities . . . . . . . . . . . . . . . . . . . . . . . . . . . . . 476,028 300,430 243,270
Cash Flows From Investing Activities:Additions to property and equipment, including pre-delivery deposits, net . . . . . . . . . . (118,828) (442,229) (410,180)Proceeds from purchase assignment and leaseback transactions . . . . . . . . . . . . . . . . . 101,738 — 67,952Net proceeds from disposition of equipment . . . . . . . . . . . . . . . . . . . . . . . . . . . . . 3,669 16,953 14,414Purchases of investments . . . . . . . . . . . . . . . . . . . . . . . . . . . . . . . . . . . . . . . . . (257,448) (458,592) —Sales of investments . . . . . . . . . . . . . . . . . . . . . . . . . . . . . . . . . . . . . . . . . . . . 236,062 197,046 —Other . . . . . . . . . . . . . . . . . . . . . . . . . . . . . . . . . . . . . . . . . . . . . . . . . . . . . (500) — —
Net cash used in investing activities . . . . . . . . . . . . . . . . . . . . . . . . . . . . . . . . . (35,307) (686,822) (327,814)
Cash Flows From Financing Activities:Long-term borrowings . . . . . . . . . . . . . . . . . . . . . . . . . . . . . . . . . . . . . . . . . . . — 368,430 243,110Repayments of long-term debt and capital lease obligations . . . . . . . . . . . . . . . . . . . (216,157) (115,246) (113,592)Repurchases and conversion of convertible notes . . . . . . . . . . . . . . . . . . . . . . . . . . (184,645) (42,754) —Repurchases of common stock . . . . . . . . . . . . . . . . . . . . . . . . . . . . . . . . . . . . . (40,138) — —Proceeds from settlement of convertible note call options . . . . . . . . . . . . . . . . . . . . 304,752 — —Payment for settlement of convertible note warrants . . . . . . . . . . . . . . . . . . . . . . . . (282,631) — —Debt issuance costs . . . . . . . . . . . . . . . . . . . . . . . . . . . . . . . . . . . . . . . . . . . . (572) (1,519) (13,846)Change in cash collateral for EETC financing . . . . . . . . . . . . . . . . . . . . . . . . . . . . 1,566 14,434 (16,000)Other . . . . . . . . . . . . . . . . . . . . . . . . . . . . . . . . . . . . . . . . . . . . . . . . . . . . . (5,481) 3,750 2,376
Net cash provided by (used in) financing activities . . . . . . . . . . . . . . . . . . . . . . . (423,306) 227,095 102,048
Net increase (decrease) in cash and cash equivalents . . . . . . . . . . . . . . . . . . . . . . . . 17,415 (159,297) 17,504Cash and cash equivalents—Beginning of Year . . . . . . . . . . . . . . . . . . . . . . . . . . . . 264,087 423,384 405,880
Cash and cash equivalents—End of Year . . . . . . . . . . . . . . . . . . . . . . . . . . . . . . . . $ 281,502 $ 264,087 $ 423,384
See accompanying Notes to Consolidated Financial Statements.
54
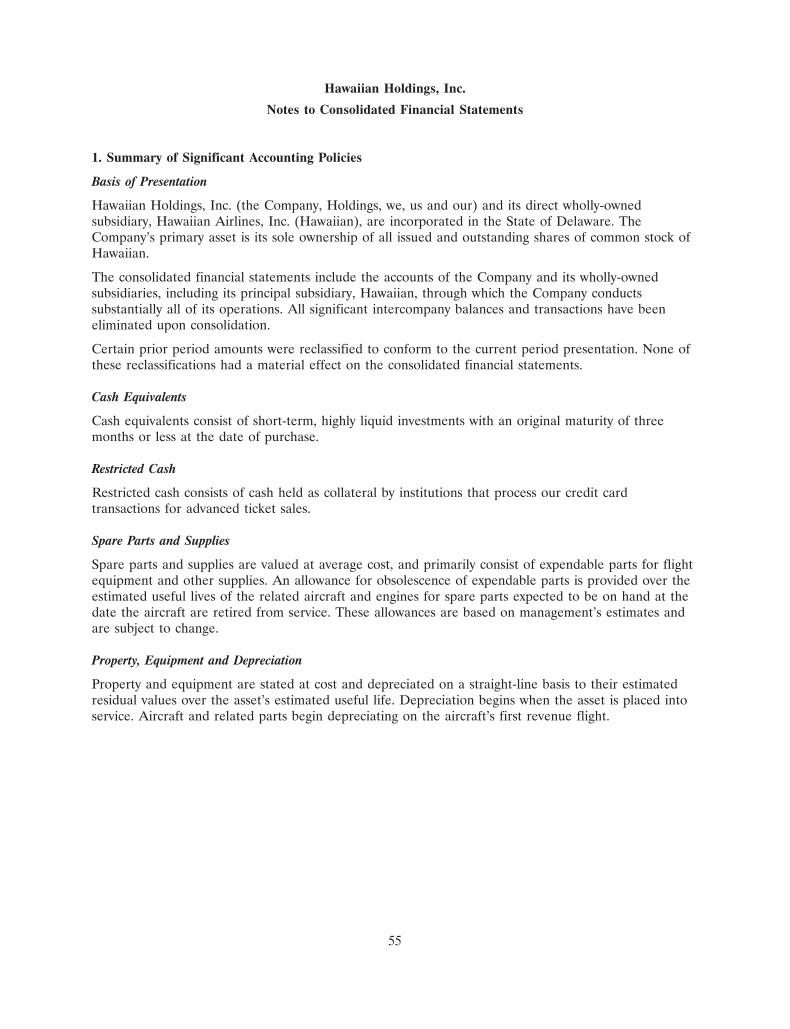
Hawaiian Holdings, Inc.
Notes to Consolidated Financial Statements
1. Summary of Significant Accounting Policies
Basis of Presentation
Hawaiian Holdings, Inc. (the Company, Holdings, we, us and our) and its direct wholly-ownedsubsidiary, Hawaiian Airlines, Inc. (Hawaiian), are incorporated in the State of Delaware. TheCompany’s primary asset is its sole ownership of all issued and outstanding shares of common stock ofHawaiian.
The consolidated financial statements include the accounts of the Company and its wholly-ownedsubsidiaries, including its principal subsidiary, Hawaiian, through which the Company conductssubstantially all of its operations. All significant intercompany balances and transactions have beeneliminated upon consolidation.
Certain prior period amounts were reclassified to conform to the current period presentation. None ofthese reclassifications had a material effect on the consolidated financial statements.
Cash Equivalents
Cash equivalents consist of short-term, highly liquid investments with an original maturity of threemonths or less at the date of purchase.
Restricted Cash
Restricted cash consists of cash held as collateral by institutions that process our credit cardtransactions for advanced ticket sales.
Spare Parts and Supplies
Spare parts and supplies are valued at average cost, and primarily consist of expendable parts for flightequipment and other supplies. An allowance for obsolescence of expendable parts is provided over theestimated useful lives of the related aircraft and engines for spare parts expected to be on hand at thedate the aircraft are retired from service. These allowances are based on management’s estimates andare subject to change.
Property, Equipment and Depreciation
Property and equipment are stated at cost and depreciated on a straight-line basis to their estimatedresidual values over the asset’s estimated useful life. Depreciation begins when the asset is placed intoservice. Aircraft and related parts begin depreciating on the aircraft’s first revenue flight.
55
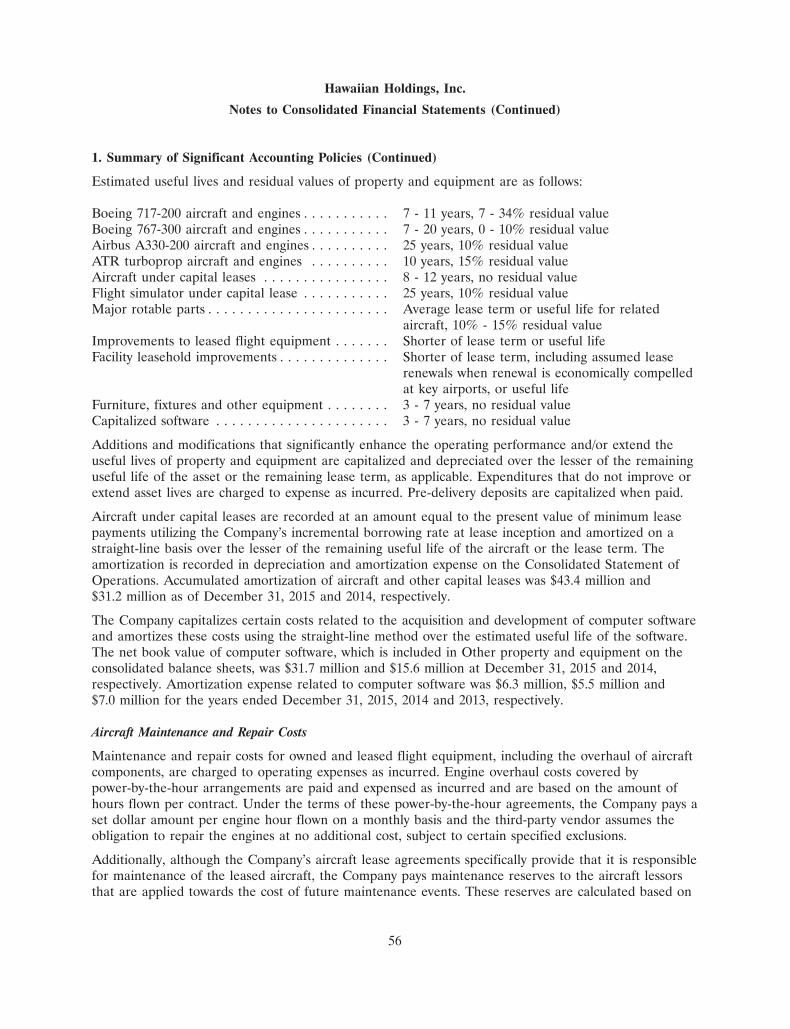
Hawaiian Holdings, Inc.
Notes to Consolidated Financial Statements (Continued)
1. Summary of Significant Accounting Policies (Continued)
Estimated useful lives and residual values of property and equipment are as follows:
Boeing 717-200 aircraft and engines . . . . . . . . . . . 7 - 11 years, 7 - 34% residual valueBoeing 767-300 aircraft and engines . . . . . . . . . . . 7 - 20 years, 0 - 10% residual valueAirbus A330-200 aircraft and engines . . . . . . . . . . 25 years, 10% residual valueATR turboprop aircraft and engines . . . . . . . . . . 10 years, 15% residual valueAircraft under capital leases . . . . . . . . . . . . . . . . 8 - 12 years, no residual valueFlight simulator under capital lease . . . . . . . . . . . 25 years, 10% residual valueMajor rotable parts . . . . . . . . . . . . . . . . . . . . . . . Average lease term or useful life for related
aircraft, 10% - 15% residual valueImprovements to leased flight equipment . . . . . . . Shorter of lease term or useful lifeFacility leasehold improvements . . . . . . . . . . . . . . Shorter of lease term, including assumed lease
renewals when renewal is economically compelledat key airports, or useful life
Furniture, fixtures and other equipment . . . . . . . . 3 - 7 years, no residual valueCapitalized software . . . . . . . . . . . . . . . . . . . . . . 3 - 7 years, no residual value
Additions and modifications that significantly enhance the operating performance and/or extend theuseful lives of property and equipment are capitalized and depreciated over the lesser of the remaininguseful life of the asset or the remaining lease term, as applicable. Expenditures that do not improve orextend asset lives are charged to expense as incurred. Pre-delivery deposits are capitalized when paid.
Aircraft under capital leases are recorded at an amount equal to the present value of minimum leasepayments utilizing the Company’s incremental borrowing rate at lease inception and amortized on astraight-line basis over the lesser of the remaining useful life of the aircraft or the lease term. Theamortization is recorded in depreciation and amortization expense on the Consolidated Statement ofOperations. Accumulated amortization of aircraft and other capital leases was $43.4 million and$31.2 million as of December 31, 2015 and 2014, respectively.
The Company capitalizes certain costs related to the acquisition and development of computer softwareand amortizes these costs using the straight-line method over the estimated useful life of the software.The net book value of computer software, which is included in Other property and equipment on theconsolidated balance sheets, was $31.7 million and $15.6 million at December 31, 2015 and 2014,respectively. Amortization expense related to computer software was $6.3 million, $5.5 million and$7.0 million for the years ended December 31, 2015, 2014 and 2013, respectively.
Aircraft Maintenance and Repair Costs
Maintenance and repair costs for owned and leased flight equipment, including the overhaul of aircraftcomponents, are charged to operating expenses as incurred. Engine overhaul costs covered bypower-by-the-hour arrangements are paid and expensed as incurred and are based on the amount ofhours flown per contract. Under the terms of these power-by-the-hour agreements, the Company pays aset dollar amount per engine hour flown on a monthly basis and the third-party vendor assumes theobligation to repair the engines at no additional cost, subject to certain specified exclusions.
Additionally, although the Company’s aircraft lease agreements specifically provide that it is responsiblefor maintenance of the leased aircraft, the Company pays maintenance reserves to the aircraft lessorsthat are applied towards the cost of future maintenance events. These reserves are calculated based on
56
Hawaiian Holdings, Inc.
Notes to Consolidated Financial Statements (Continued)
1. Summary of Significant Accounting Policies (Continued)
a performance measure, such as flight hours, and are available for reimbursement to the Companyupon the completion of the maintenance of the leased aircraft. However, reimbursements are limited tothe available reserves associated with the specific maintenance activity for which the Company requestsreimbursement.
Under certain aircraft lease agreements, if there are excess amounts on deposit at the expiration of thelease, the lessor is entitled to retain any excess amounts; whereas at the expiration of certain otherexisting aircraft lease agreements any such excess amounts are returned to the Company, provided thatit has fulfilled all of its obligations under the lease agreements. The maintenance reserves paid underthe lease agreements do not transfer either the obligation to maintain the aircraft or the cost riskassociated with the maintenance activities to the aircraft lessor. In addition, the Company maintains theright to select any third-party maintenance provider.
Maintenance reserve payments that are expected to be recovered from lessors are recorded as depositsin the Consolidated Balance Sheets as an asset until it is less than probable that any portion of thedeposit is recoverable. In addition, payments of maintenance reserves that are not substantially andcontractually related to the maintenance of the leased assets are expensed as incurred. Any costs thatare substantially and contractually unrelated to the maintenance of the leased asset are considered tobe unrecoverable. In order to properly account for the costs that are related to the maintenance of theleased asset, the Company bifurcates its maintenance reserves into two groups and expenses theproportionate share that is expected to be unrecoverable.
Goodwill and Indefinite-lived Intangible Assets
Goodwill and intangible assets with indefinite lives are not amortized, but are tested for impairment atleast annually using a three-step process in accordance with Accounting Standard Codification (ASC)Intangibles—Goodwill and Other (ASC 350).
In the event that the Company determines that the values of goodwill or indefinite-lived intangibleassets have become impaired, the Company will incur an accounting charge during the period in whichsuch determination is made. No impairments were recorded in 2015.
Impairment of Long-Lived Assets and Finite-lived Intangible Assets
Long-lived assets used in operations, consisting principally of property and equipment and finite-livedintangible assets, are tested for impairment when events or changes in circumstances indicate, inmanagement’s judgment, that the assets might be impaired and the undiscounted cash flows estimatedto be generated by those assets are less than its carrying amount. When testing for impairment,management considers market trends, the expected useful lives of the assets, changes in economicconditions, recent transactions involving sales of similar assets and, if necessary, estimates of futurediscounted cash flows. To determine whether an impairment exists for aircraft used in operations, assetsare grouped at the fleet-type level (the lowest level for which there are identifiable cash flows) andfuture cash flows are estimated based on projections of capacity, passenger mile yield, fuel costs, laborcosts and other relevant factors. If, at any time, management determines the net carrying value of anasset is not recoverable, the amount is reduced to its fair value during the period in which suchdetermination is made. Any changes in the estimated useful lives of these assets will be accounted forprospectively.
57
Hawaiian Holdings, Inc.
Notes to Consolidated Financial Statements (Continued)
1. Summary of Significant Accounting Policies (Continued)
Operating Leases
The Company leases aircraft, engines, airport and terminal facilities, office space, and other equipmentunder operating leases. Some of these lease agreements include escalation clauses and renewal options.For scheduled rent escalation clauses during the lease terms or for rental payments commencing at adate other than the date of initial occupancy, the Company records minimum rental expenses on astraight-line basis over the terms of the leases in the Consolidated Statements of Operations. Whenlease renewals are considered to be reasonably assured, the rental payments that will be due during therenewal periods are included in the determination of rent expense over the life of the lease. Rentalexpense for operating leases totaled $174.9 million, $160.7 million, and $158.6 million for the yearsended December 31, 2015, 2014 and 2013, respectively.
Leased Aircraft Return Costs
Costs associated with the return of leased aircraft are accrued when it is probable that a payment willbe made and that amount is reasonably estimable. Any accrual is based on the time remaining on thelease, planned aircraft usage and the provisions included in the lease agreement, although the actualamount due to any lessor upon return will not be known with certainty until lease termination.
Revenue Recognition
Passenger revenue is recognized either when the transportation is provided or when tickets expireunused. The value of passenger tickets for future travel is included as air traffic liability.
Various taxes and fees assessed on the sale of tickets to end customers are collected by the Company asan agent and remitted to taxing authorities. These taxes and fees have been presented on a net basis inthe accompanying Consolidated Statements of Operations and recorded as a liability until remitted tothe appropriate taxing authority.
Other operating revenue includes checked baggage revenue, cargo revenue, ticket change andcancellation fees, charter revenue, ground handling fees, commissions and fees earned under certainjoint marketing agreements with other companies, inflight revenue and other incidental sales.
Ticket change and cancellation fees are recognized at the time the fees are assessed. All other revenueis recognized as revenue when the related goods and services are provided.
Frequent Flyer Program
HawaiianMiles, Hawaiian’s frequent flyer travel award program provides a variety of awards to programmembers based on accumulated mileage. The Company utilizes the incremental cost method ofaccounting for free travel awards earned by passengers issued from the HawaiianMiles program throughflight activity. The Company records a liability for the estimated incremental cost of providing travelawards that are expected to be redeemed on Hawaiian or the contractual rate of expected redemptionon other airlines. The Company estimates the incremental cost of travel awards based on periodicstudies of actual costs and applies these cost estimates to all issued miles, less an appropriate breakagefactor for estimated miles that will not be redeemed. Incremental cost includes the costs of fuel, mealsand beverages, insurance and certain other passenger traffic-related costs, but does not include anycosts for aircraft ownership and maintenance. The breakage factor is estimated based on an analysis ofhistorical expirations.
58
Hawaiian Holdings, Inc.
Notes to Consolidated Financial Statements (Continued)
1. Summary of Significant Accounting Policies (Continued)
The Company also sells mileage credits to companies participating in our frequent flyer program. Thesesales are accounted for as multiple-element arrangements, with one element representing the travel thatwill ultimately be provided when the mileage credits are redeemed and the other consisting ofmarketing related activities that we conduct with the participating company.
In 2013, Hawaiian entered into a co-branded credit card agreement, which provides for the sale offrequent flyer miles to Barclays Bank Delaware (Barclays) which began in 2014. The agreement was anew multiple element arrangement subject to Accounting Standards Update 2009-13, MultipleDeliverable Revenue Arrangements—A consensus of the FASB Emerging Issues Task Force(ASU 2009-13), which was effective for new and materially modified revenue arrangements entered intoby the Company after January 1, 2011. ASU 2009-13 requires the allocation of the overall considerationreceived to each deliverable using the estimated selling price. The objective of using estimated sellingprice based methodology is to determine the price at which the Company would transact a sale if theproduct or service were sold on a stand-alone basis.
The following four deliverables or elements were identified in the agreement: (i) travel miles; (ii) useof the Hawaiian brand and access to member lists; (iii) advertising elements; and (iv) other airlinebenefits including checked baggage services and travel discounts. The Company determined the relativefair value of each element by estimating the selling prices of the deliverables by considering discountedcash flows using multiple inputs and assumptions, including: (1) the expected number of miles to beawarded and redeemed; (2) the estimated weighted average equivalent ticket value, adjusted by afulfillment discount; (3) the estimated total annual cardholder spend; (4) an estimated royalty rate forthe Hawaiian portfolio; and (5) the expected use of each of the airline benefits. The overallconsideration received is allocated to the deliverables based on their relative selling prices. Thetransportation element is deferred and recognized as passenger revenue over the period when thetransportation is expected to be provided (24 months). The other elements will generally be recognizedas other revenue when earned.
The Company’s total frequent flyer liability for future award redemptions is reflected as components ofAir traffic liability and Other liabilities and deferred credits within the Consolidated Balance Sheets asfollows:
As of December 31,
2015 2014
(in thousands)
Air traffic liability . . . . . . . . . . . . . . . . . . . . . . . . . . . . . . . . . . . $56,833 $49,618Other liabilities and deferred credits . . . . . . . . . . . . . . . . . . . . . 18,054 15,830
Total frequent flyer liability . . . . . . . . . . . . . . . . . . . . . . . . . . . . $74,887 $65,448
Under the programs of certain participating companies, credits are accumulated in accounts maintainedby the participating company and then transferred into a member’s HawaiianMiles account forimmediate redemption of free travel awards. For those transactions, revenue is recognized over theperiod during which the mileage is projected to be used for travel (five months).
On an annual basis, the Company reviews the deferral period and deferral rate for mileage credits soldto participating companies, as well as the breakage rate assumption for free travel awards earned in
59
Hawaiian Holdings, Inc.
Notes to Consolidated Financial Statements (Continued)
1. Summary of Significant Accounting Policies (Continued)
connection with the purchase of passenger tickets. The Company’s incremental cost assumption isreviewed on a quarterly basis.
Pension and Postretirement and Postemployment Benefits
The Company accounts for its defined benefit pension and other postretirement and postemploymentplans in accordance with ASC 715, Compensation—Retirement Benefits (ASC 715), which requirescompanies to measure their plans’ assets and obligations to determine the funded status at fiscalyear-end, reflect the funded status in the statement of financial position as an asset or liability, andrecognize changes in the funded status of the plans in comprehensive income during the year in whichthe changes occur. Pension and other postretirement and postemployment benefit expenses arerecognized on an accrual basis over each employee’s service periods. Pension expense is generallyindependent of funding decisions or requirements.
The Company uses the corridor approach in the valuation of its defined benefit pension and otherpostretirement and postemployment plans. The corridor approach defers all actuarial gains and lossesresulting from variances between actual results and actuarial assumptions. These unrecognized actuarialgains and losses re amortized when the net gains and losses exceed 10% of the greater of the market-related value of plan assets or the projected benefit obligation at the beginning of the year. Theamount in excess of the corridor is amortized over the average remaining service period to retirementdate of active plan participants.
Advertising Costs
Advertising costs are expensed when incurred. Advertising expense was $17.6 million, $15.6 million and$14.1 million for the years ended December 31, 2015, 2014, and 2013, respectively.
Capitalized Interest
Interest is capitalized upon the payment of predelivery deposits for aircraft and engines, and isdepreciated over the estimated useful life of the asset from service inception date.
Stock Compensation Plans
The Company has a stock compensation plan for it and its subsidiaries’ officers, consultants andnon-employee directors. The Company accounts for stock compensation awards under ASC 718,Compensation—Stock Compensation , which requires companies to measure the cost of employeeservices received in exchange for an award of equity instruments based on the fair value of such awardson the dates they are granted. The fair value of the awards are estimated using the following:(1) option-pricing models for grants of stock options or (2) fair value at the measurement date (usuallythe grant date) for awards of stock subject to time and / or performance-based vesting. The resultantcost is recognized as compensation expense over the period of time during which an employee isrequired to provide services to the Company (the service period) in exchange for the award, the serviceperiod generally being the vesting period of the award.
60
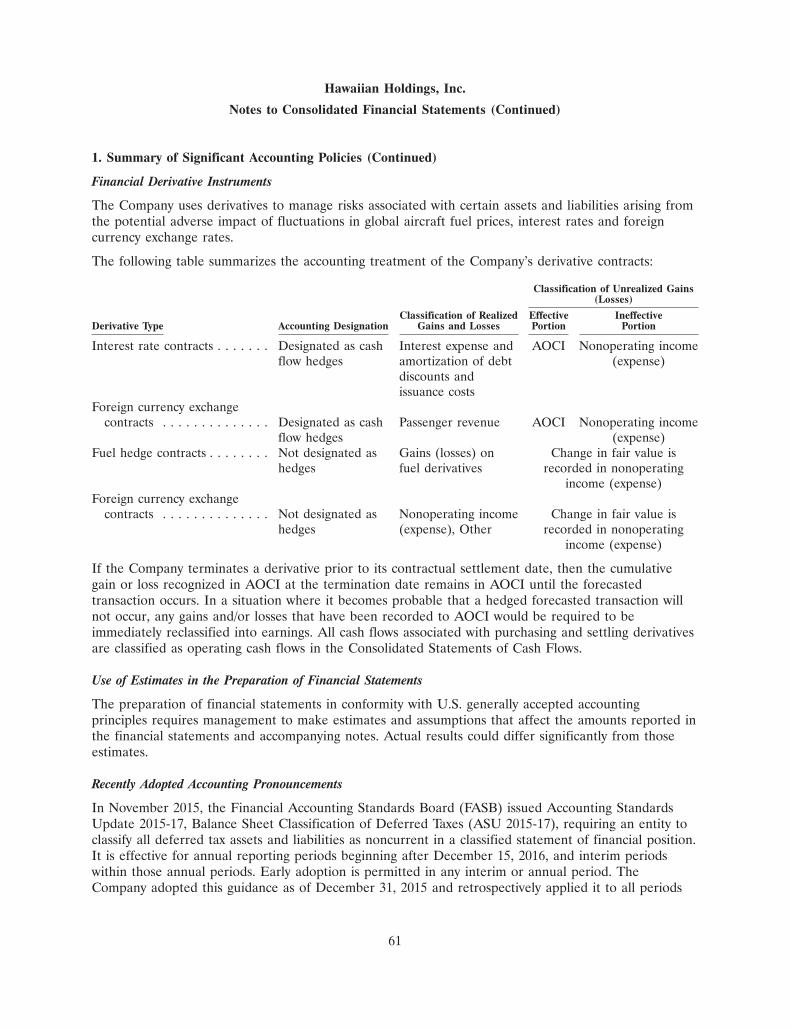
Hawaiian Holdings, Inc.
Notes to Consolidated Financial Statements (Continued)
1. Summary of Significant Accounting Policies (Continued)
Financial Derivative Instruments
The Company uses derivatives to manage risks associated with certain assets and liabilities arising fromthe potential adverse impact of fluctuations in global aircraft fuel prices, interest rates and foreigncurrency exchange rates.
The following table summarizes the accounting treatment of the Company’s derivative contracts:
Classification of Unrealized Gains(Losses)
Classification of Realized Effective IneffectiveDerivative Type Accounting Designation Gains and Losses Portion Portion
Interest rate contracts . . . . . . . Designated as cash Interest expense and AOCI Nonoperating incomeflow hedges amortization of debt (expense)
discounts andissuance costs
Foreign currency exchangecontracts . . . . . . . . . . . . . . Designated as cash Passenger revenue AOCI Nonoperating income
flow hedges (expense)Fuel hedge contracts . . . . . . . . Not designated as Gains (losses) on Change in fair value is
hedges fuel derivatives recorded in nonoperatingincome (expense)
Foreign currency exchangecontracts . . . . . . . . . . . . . . Not designated as Nonoperating income Change in fair value is
hedges (expense), Other recorded in nonoperatingincome (expense)
If the Company terminates a derivative prior to its contractual settlement date, then the cumulativegain or loss recognized in AOCI at the termination date remains in AOCI until the forecastedtransaction occurs. In a situation where it becomes probable that a hedged forecasted transaction willnot occur, any gains and/or losses that have been recorded to AOCI would be required to beimmediately reclassified into earnings. All cash flows associated with purchasing and settling derivativesare classified as operating cash flows in the Consolidated Statements of Cash Flows.
Use of Estimates in the Preparation of Financial Statements
The preparation of financial statements in conformity with U.S. generally accepted accountingprinciples requires management to make estimates and assumptions that affect the amounts reported inthe financial statements and accompanying notes. Actual results could differ significantly from thoseestimates.
Recently Adopted Accounting Pronouncements
In November 2015, the Financial Accounting Standards Board (FASB) issued Accounting StandardsUpdate 2015-17, Balance Sheet Classification of Deferred Taxes (ASU 2015-17), requiring an entity toclassify all deferred tax assets and liabilities as noncurrent in a classified statement of financial position.It is effective for annual reporting periods beginning after December 15, 2016, and interim periodswithin those annual periods. Early adoption is permitted in any interim or annual period. TheCompany adopted this guidance as of December 31, 2015 and retrospectively applied it to all periods
61
Hawaiian Holdings, Inc.
Notes to Consolidated Financial Statements (Continued)
1. Summary of Significant Accounting Policies (Continued)
presented in the consolidated balance sheets. The adoption of this ASU resulted in a $21.9 millionreclassification of the Company’s deferred tax assets from a current asset to a noncurrent asset in theconsolidated balance sheet as of December 31, 2014.
In May 2015, the FASB issued Accounting Standards Update 2015-07, Disclosures for Investments inCertain Entities That Calculate Net Asset Value per Share (or Its Equivalent) (ASU 2015-07). Certaininvestments measured at fair value using the Net Asset Value (NAV) practical expedient are no longerrequired to be categorized within a level within the fair value hierarchy table. It is effective for interimand annual reporting periods beginning after December 15, 2015, but early adoption is permitted. It isto be applied retrospectively in all periods presented in an entity’s financial statements. The Companyadopted this guidance as of December 31, 2015, and the adoption is reflected in Note 5 and Note 11 tothe financial statements.
Recently Issued Accounting Pronouncements
In April 2015, the FASB issued Accounting Standards Update 2015-03, Simplifying the Presentation ofDebt Issuance Costs (ASU 2015-03), requiring an entity to present its debt issuance costs on thebalance sheet as a deduction from the carrying amount of the related debt liability instead of adeferred charge. It is effective for annual reporting periods beginning after December 15, 2015, butearly adoption is permitted. The impact of ASU 2015-03 on the Company’s consolidated balance sheetas of December 31, 2015 and 2014 would include an estimated reclassification of unamortized debtissuance costs of $23.9 million and $30.9 million, respectively, from long-term prepayments and other tolong-term debt.
In May 2014, the FASB issued Accounting Standards Update 2014-09, Revenue from Contracts withCustomers (ASU 2014-09), requiring an entity to recognize the amount of revenue to which it expectsto be entitled for the transfer of promised goods or services to customers. ASU 2014-09 will replacemost existing revenue recognition guidance in GAAP when it becomes effective. In July 2015, the FASBvoted to defer the amendments in ASU 2014-09 by one year to December 15, 2017. The terms ofASU 2014-09 are effective for fiscal years, and interim periods within those fiscal years, beginning afterthe revised effective date, and allow for either full retrospective or modified retrospective adoption.Organizations are permitted to adopt the new revenue standard early, but not before December 15,2016. The Company is currently evaluating the effect that the provisions of ASU 2014-09 will have onits consolidated financial statements and related disclosures. The Company has determined that thenew standard, once effective, will preclude the Company from accounting for miles earned under itsHawaiianMiles customer loyalty program using the incremental cost method, and will require use of thedeferred revenue method. This change could have a significant impact on the Company’s financialstatements.
62
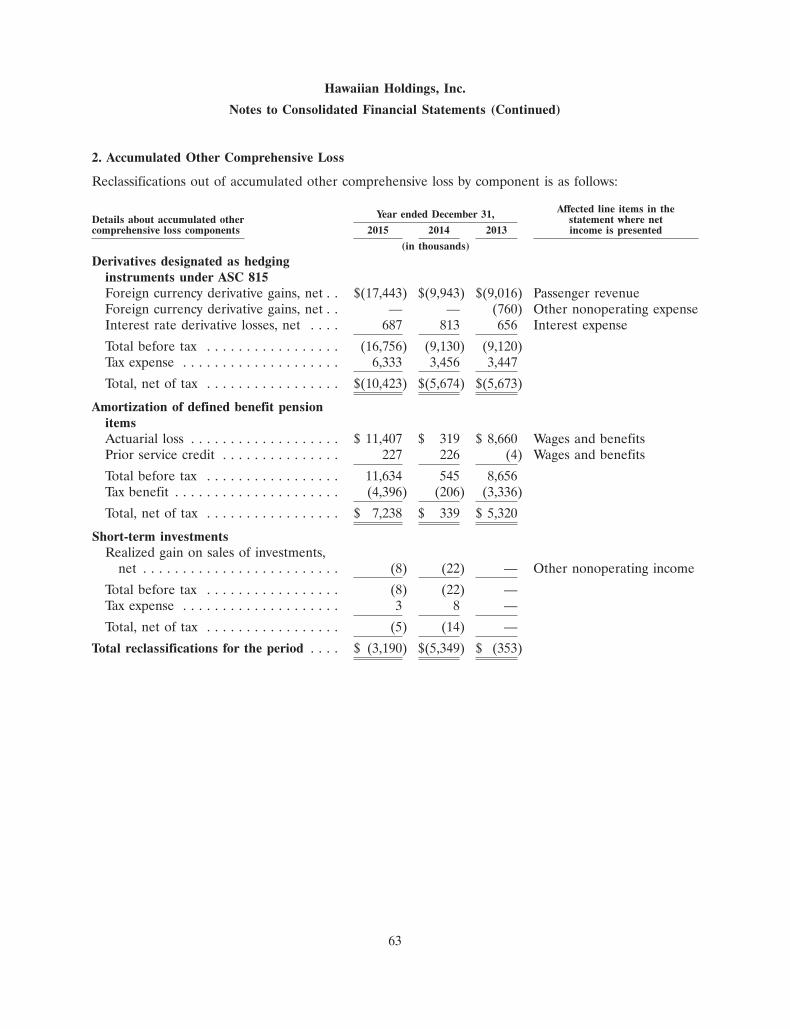
Hawaiian Holdings, Inc.
Notes to Consolidated Financial Statements (Continued)
2. Accumulated Other Comprehensive Loss
Reclassifications out of accumulated other comprehensive loss by component is as follows:
Affected line items in theYear ended December 31,Details about accumulated other statement where netcomprehensive loss components 2015 2014 2013 income is presented
(in thousands)
Derivatives designated as hedginginstruments under ASC 815Foreign currency derivative gains, net . . $(17,443) $(9,943) $(9,016) Passenger revenueForeign currency derivative gains, net . . — — (760) Other nonoperating expenseInterest rate derivative losses, net . . . . 687 813 656 Interest expense
Total before tax . . . . . . . . . . . . . . . . . (16,756) (9,130) (9,120)Tax expense . . . . . . . . . . . . . . . . . . . . 6,333 3,456 3,447
Total, net of tax . . . . . . . . . . . . . . . . . $(10,423) $(5,674) $(5,673)
Amortization of defined benefit pensionitemsActuarial loss . . . . . . . . . . . . . . . . . . . $ 11,407 $ 319 $ 8,660 Wages and benefitsPrior service credit . . . . . . . . . . . . . . . 227 226 (4) Wages and benefits
Total before tax . . . . . . . . . . . . . . . . . 11,634 545 8,656Tax benefit . . . . . . . . . . . . . . . . . . . . . (4,396) (206) (3,336)
Total, net of tax . . . . . . . . . . . . . . . . . $ 7,238 $ 339 $ 5,320
Short-term investmentsRealized gain on sales of investments,
net . . . . . . . . . . . . . . . . . . . . . . . . . (8) (22) — Other nonoperating income
Total before tax . . . . . . . . . . . . . . . . . (8) (22) —Tax expense . . . . . . . . . . . . . . . . . . . . 3 8 —
Total, net of tax . . . . . . . . . . . . . . . . . (5) (14) —
Total reclassifications for the period . . . . $ (3,190) $(5,349) $ (353)
63
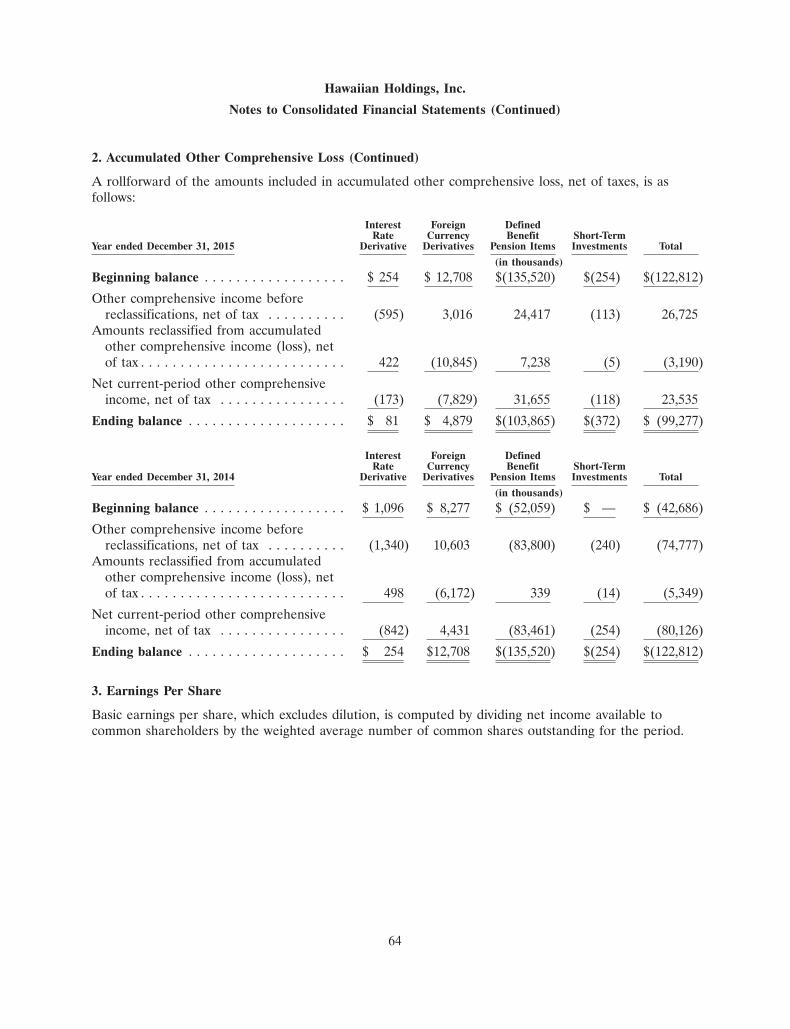
Hawaiian Holdings, Inc.
Notes to Consolidated Financial Statements (Continued)
2. Accumulated Other Comprehensive Loss (Continued)
A rollforward of the amounts included in accumulated other comprehensive loss, net of taxes, is asfollows:
Interest Foreign DefinedRate Currency Benefit Short-Term
Year ended December 31, 2015 Derivative Derivatives Pension Items Investments Total
(in thousands)
Beginning balance . . . . . . . . . . . . . . . . . . $ 254 $ 12,708 $(135,520) $(254) $(122,812)
Other comprehensive income beforereclassifications, net of tax . . . . . . . . . . (595) 3,016 24,417 (113) 26,725
Amounts reclassified from accumulatedother comprehensive income (loss), netof tax . . . . . . . . . . . . . . . . . . . . . . . . . . 422 (10,845) 7,238 (5) (3,190)
Net current-period other comprehensiveincome, net of tax . . . . . . . . . . . . . . . . (173) (7,829) 31,655 (118) 23,535
Ending balance . . . . . . . . . . . . . . . . . . . . $ 81 $ 4,879 $(103,865) $(372) $ (99,277)
Interest Foreign DefinedRate Currency Benefit Short-Term
Year ended December 31, 2014 Derivative Derivatives Pension Items Investments Total
(in thousands)
Beginning balance . . . . . . . . . . . . . . . . . . $ 1,096 $ 8,277 $ (52,059) $ — $ (42,686)
Other comprehensive income beforereclassifications, net of tax . . . . . . . . . . (1,340) 10,603 (83,800) (240) (74,777)
Amounts reclassified from accumulatedother comprehensive income (loss), netof tax . . . . . . . . . . . . . . . . . . . . . . . . . . 498 (6,172) 339 (14) (5,349)
Net current-period other comprehensiveincome, net of tax . . . . . . . . . . . . . . . . (842) 4,431 (83,461) (254) (80,126)
Ending balance . . . . . . . . . . . . . . . . . . . . $ 254 $12,708 $(135,520) $(254) $(122,812)
3. Earnings Per Share
Basic earnings per share, which excludes dilution, is computed by dividing net income available tocommon shareholders by the weighted average number of common shares outstanding for the period.
64
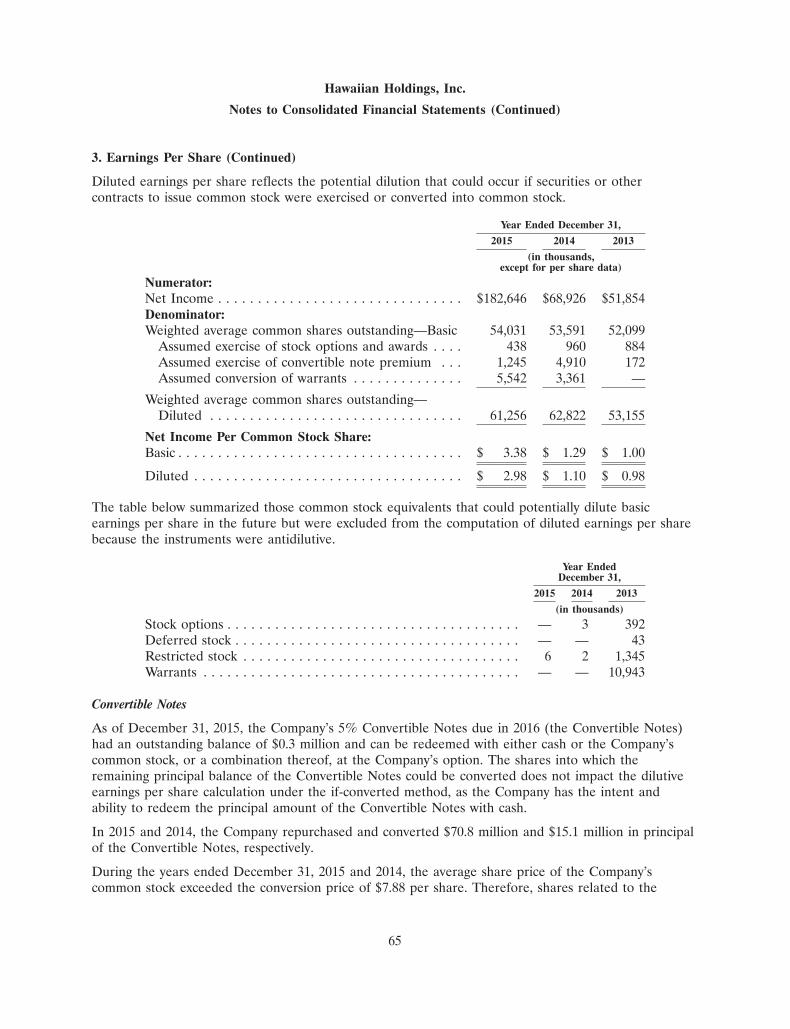
Hawaiian Holdings, Inc.
Notes to Consolidated Financial Statements (Continued)
3. Earnings Per Share (Continued)
Diluted earnings per share reflects the potential dilution that could occur if securities or othercontracts to issue common stock were exercised or converted into common stock.
Year Ended December 31,
2015 2014 2013
(in thousands,except for per share data)
Numerator:Net Income . . . . . . . . . . . . . . . . . . . . . . . . . . . . . . . $182,646 $68,926 $51,854Denominator:Weighted average common shares outstanding—Basic 54,031 53,591 52,099
Assumed exercise of stock options and awards . . . . 438 960 884Assumed exercise of convertible note premium . . . 1,245 4,910 172Assumed conversion of warrants . . . . . . . . . . . . . . 5,542 3,361 —
Weighted average common shares outstanding—Diluted . . . . . . . . . . . . . . . . . . . . . . . . . . . . . . . . 61,256 62,822 53,155
Net Income Per Common Stock Share:Basic . . . . . . . . . . . . . . . . . . . . . . . . . . . . . . . . . . . . $ 3.38 $ 1.29 $ 1.00
Diluted . . . . . . . . . . . . . . . . . . . . . . . . . . . . . . . . . . $ 2.98 $ 1.10 $ 0.98
The table below summarized those common stock equivalents that could potentially dilute basicearnings per share in the future but were excluded from the computation of diluted earnings per sharebecause the instruments were antidilutive.
Year EndedDecember 31,
2015 2014 2013
(in thousands)
Stock options . . . . . . . . . . . . . . . . . . . . . . . . . . . . . . . . . . . . . — 3 392Deferred stock . . . . . . . . . . . . . . . . . . . . . . . . . . . . . . . . . . . . — — 43Restricted stock . . . . . . . . . . . . . . . . . . . . . . . . . . . . . . . . . . . 6 2 1,345Warrants . . . . . . . . . . . . . . . . . . . . . . . . . . . . . . . . . . . . . . . . — — 10,943
Convertible Notes
As of December 31, 2015, the Company’s 5% Convertible Notes due in 2016 (the Convertible Notes)had an outstanding balance of $0.3 million and can be redeemed with either cash or the Company’scommon stock, or a combination thereof, at the Company’s option. The shares into which theremaining principal balance of the Convertible Notes could be converted does not impact the dilutiveearnings per share calculation under the if-converted method, as the Company has the intent andability to redeem the principal amount of the Convertible Notes with cash.
In 2015 and 2014, the Company repurchased and converted $70.8 million and $15.1 million in principalof the Convertible Notes, respectively.
During the years ended December 31, 2015 and 2014, the average share price of the Company’scommon stock exceeded the conversion price of $7.88 per share. Therefore, shares related to the
65
Hawaiian Holdings, Inc.
Notes to Consolidated Financial Statements (Continued)
3. Earnings Per Share (Continued)
conversion premium of the Convertible Notes (for which share settlement is assumed for EPSpurposes) are included in the Company’s computation of diluted earnings per share for the period therelated Notes were outstanding.
See Note 8 for further information over the Convertible Notes.
Convertible Note Call Options and Warrants
In connection with the issuance of the Convertible Notes, the Company entered into separate calloption transactions and separate warrant transactions with certain financial investors to reduce thepotential dilution of the Company’s common stock and to offset potential payments by the Company toholders of the Convertible Notes in excess of the principal of the Convertible Notes upon conversion.
During the quarter ended December 31, 2015, the Company settled the call options and warrants withits respective counterparties and received net settlement proceeds of $22.1 million, which wasrecognized as an increase to shareholders’ equity. Gross proceeds from the settlement of the calloptions of $304.8 million and gross payments for the settlement of the warrants of $282.6 million arereflected in the Consolidated Statements of Shareholders’ Equity and Consolidated Statements of CashFlows.
For the years ended December 31, 2015 and 2014, the average share price of the Company’s commonstock exceeded the warrant strike price of $10.00 per share. Therefore, the impact of the assumedconversion of the warrants are included in the Company’s computation of diluted earnings per sharefor the period they were outstanding. For the year ended December 31, 2013, the weighted commonstock equivalents for warrants were excluded from the computation of diluted earnings per sharebecause the warrant strike price exceeded the average share price of the Company’s common stock.
Stock Repurchase Program
In April 2015, the Company’s Board of Directors approved a stock repurchase program under whichthe Company may repurchase up to $100 million of its outstanding common stock over a two-yearperiod through the open market, established plans or privately negotiated transactions in accordancewith all applicable securities laws, rules and regulations. The stock repurchase program is subject tomodification or termination at any time. The Company spent $40.2 million to repurchase approximately1.7 million shares of the Company’s common stock in open market transactions during the year endedDecember 31, 2015. As of December 31, 2015, the Company has $59.8 million remaining to spendunder the stock repurchase program. See Part II, Item 2., ‘‘Unregistered Sales of Equity Securities andUse of Proceeds’’ of this report for additional information on the stock repurchase program.
4. Short-Term Investments
Debt securities that are not classified as cash equivalents are classified as available-for-sale investmentsand are stated at fair value. Realized gains and losses on sales of investments are reflected innonoperating income (expense). Unrealized gains and losses on available-for-sale securities arereflected as a component of accumulated other comprehensive loss.
66
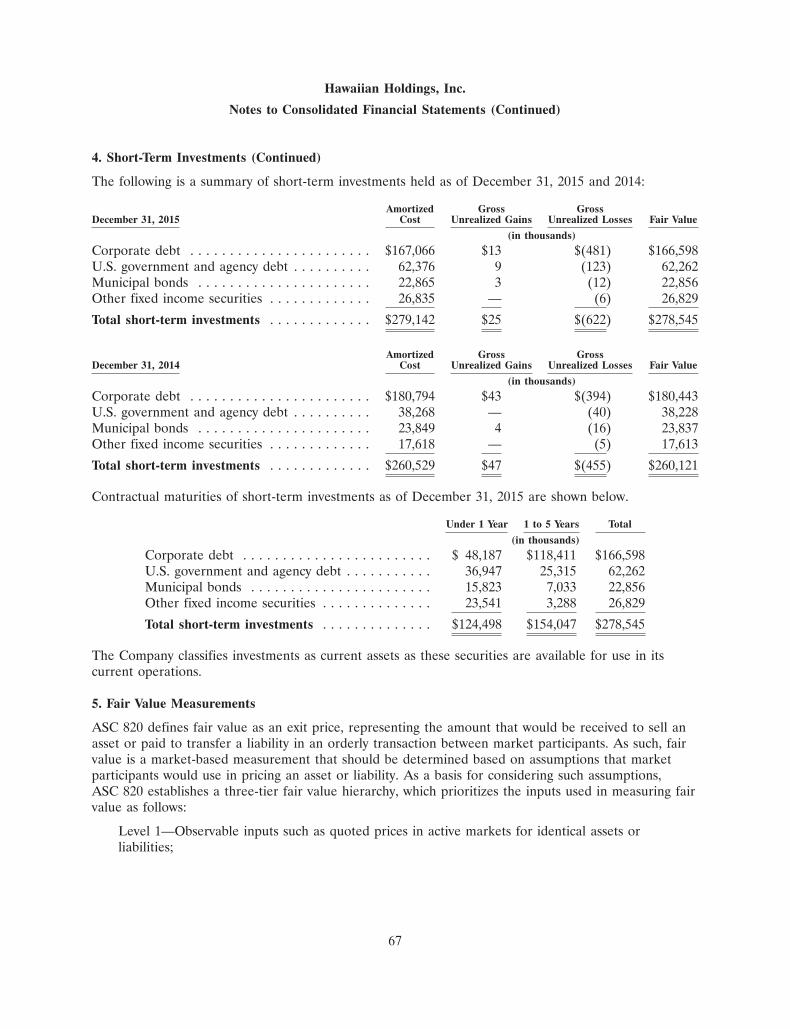
Hawaiian Holdings, Inc.
Notes to Consolidated Financial Statements (Continued)
4. Short-Term Investments (Continued)
The following is a summary of short-term investments held as of December 31, 2015 and 2014:
Amortized Gross GrossDecember 31, 2015 Cost Unrealized Gains Unrealized Losses Fair Value
(in thousands)
Corporate debt . . . . . . . . . . . . . . . . . . . . . . . $167,066 $13 $(481) $166,598U.S. government and agency debt . . . . . . . . . . 62,376 9 (123) 62,262Municipal bonds . . . . . . . . . . . . . . . . . . . . . . 22,865 3 (12) 22,856Other fixed income securities . . . . . . . . . . . . . 26,835 — (6) 26,829
Total short-term investments . . . . . . . . . . . . . $279,142 $25 $(622) $278,545
Amortized Gross GrossDecember 31, 2014 Cost Unrealized Gains Unrealized Losses Fair Value
(in thousands)
Corporate debt . . . . . . . . . . . . . . . . . . . . . . . $180,794 $43 $(394) $180,443U.S. government and agency debt . . . . . . . . . . 38,268 — (40) 38,228Municipal bonds . . . . . . . . . . . . . . . . . . . . . . 23,849 4 (16) 23,837Other fixed income securities . . . . . . . . . . . . . 17,618 — (5) 17,613
Total short-term investments . . . . . . . . . . . . . $260,529 $47 $(455) $260,121
Contractual maturities of short-term investments as of December 31, 2015 are shown below.
Under 1 Year 1 to 5 Years Total
(in thousands)
Corporate debt . . . . . . . . . . . . . . . . . . . . . . . . $ 48,187 $118,411 $166,598U.S. government and agency debt . . . . . . . . . . . 36,947 25,315 62,262Municipal bonds . . . . . . . . . . . . . . . . . . . . . . . 15,823 7,033 22,856Other fixed income securities . . . . . . . . . . . . . . 23,541 3,288 26,829
Total short-term investments . . . . . . . . . . . . . . $124,498 $154,047 $278,545
The Company classifies investments as current assets as these securities are available for use in itscurrent operations.
5. Fair Value Measurements
ASC 820 defines fair value as an exit price, representing the amount that would be received to sell anasset or paid to transfer a liability in an orderly transaction between market participants. As such, fairvalue is a market-based measurement that should be determined based on assumptions that marketparticipants would use in pricing an asset or liability. As a basis for considering such assumptions,ASC 820 establishes a three-tier fair value hierarchy, which prioritizes the inputs used in measuring fairvalue as follows:
Level 1—Observable inputs such as quoted prices in active markets for identical assets orliabilities;
67
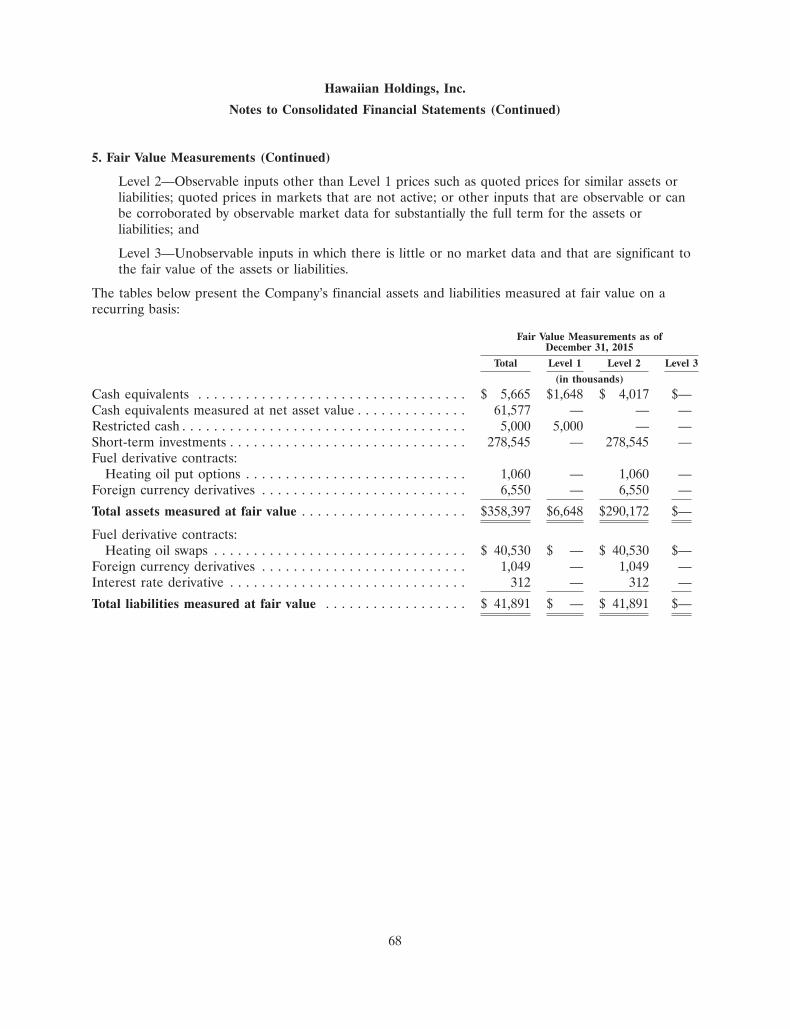
Hawaiian Holdings, Inc.
Notes to Consolidated Financial Statements (Continued)
5. Fair Value Measurements (Continued)
Level 2—Observable inputs other than Level 1 prices such as quoted prices for similar assets orliabilities; quoted prices in markets that are not active; or other inputs that are observable or canbe corroborated by observable market data for substantially the full term for the assets orliabilities; and
Level 3—Unobservable inputs in which there is little or no market data and that are significant tothe fair value of the assets or liabilities.
The tables below present the Company’s financial assets and liabilities measured at fair value on arecurring basis:
Fair Value Measurements as ofDecember 31, 2015
Total Level 1 Level 2 Level 3
(in thousands)
Cash equivalents . . . . . . . . . . . . . . . . . . . . . . . . . . . . . . . . . . $ 5,665 $1,648 $ 4,017 $—Cash equivalents measured at net asset value . . . . . . . . . . . . . . 61,577 — — —Restricted cash . . . . . . . . . . . . . . . . . . . . . . . . . . . . . . . . . . . . 5,000 5,000 — —Short-term investments . . . . . . . . . . . . . . . . . . . . . . . . . . . . . . 278,545 — 278,545 —Fuel derivative contracts:
Heating oil put options . . . . . . . . . . . . . . . . . . . . . . . . . . . . 1,060 — 1,060 —Foreign currency derivatives . . . . . . . . . . . . . . . . . . . . . . . . . . 6,550 — 6,550 —
Total assets measured at fair value . . . . . . . . . . . . . . . . . . . . . $358,397 $6,648 $290,172 $—
Fuel derivative contracts:Heating oil swaps . . . . . . . . . . . . . . . . . . . . . . . . . . . . . . . . $ 40,530 $ — $ 40,530 $—
Foreign currency derivatives . . . . . . . . . . . . . . . . . . . . . . . . . . 1,049 — 1,049 —Interest rate derivative . . . . . . . . . . . . . . . . . . . . . . . . . . . . . . 312 — 312 —
Total liabilities measured at fair value . . . . . . . . . . . . . . . . . . $ 41,891 $ — $ 41,891 $—
68
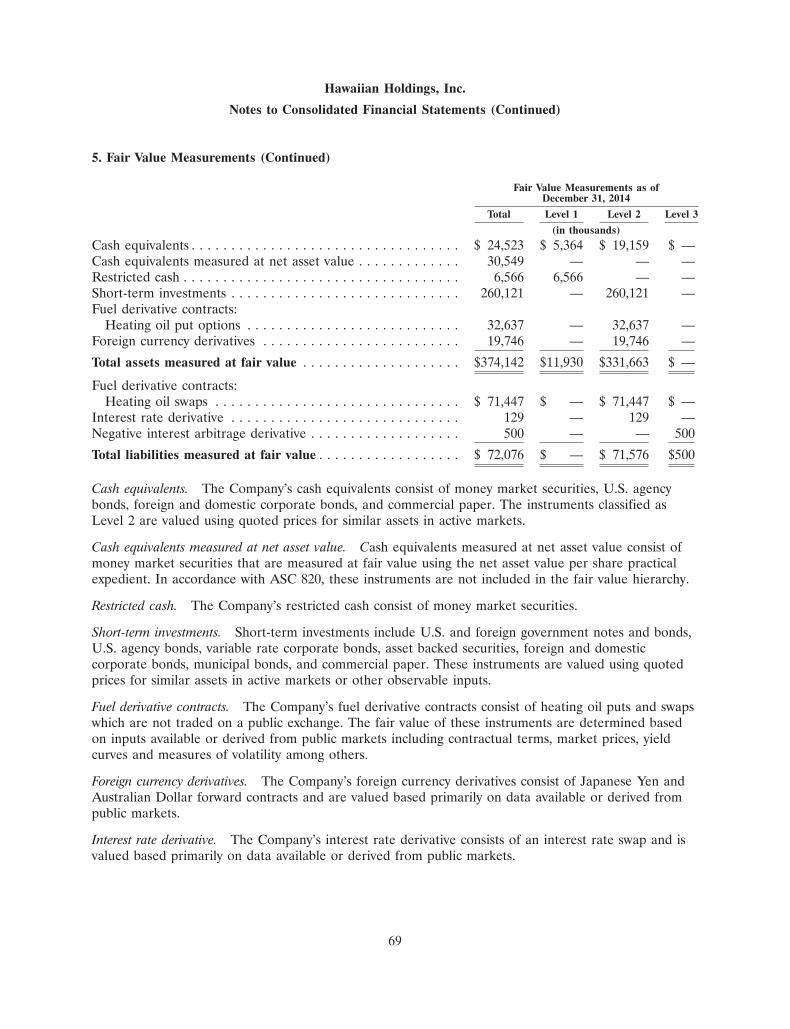
Hawaiian Holdings, Inc.
Notes to Consolidated Financial Statements (Continued)
5. Fair Value Measurements (Continued)
Fair Value Measurements as ofDecember 31, 2014
Total Level 1 Level 2 Level 3
(in thousands)
Cash equivalents . . . . . . . . . . . . . . . . . . . . . . . . . . . . . . . . . . $ 24,523 $ 5,364 $ 19,159 $ —Cash equivalents measured at net asset value . . . . . . . . . . . . . 30,549 — — —Restricted cash . . . . . . . . . . . . . . . . . . . . . . . . . . . . . . . . . . . 6,566 6,566 — —Short-term investments . . . . . . . . . . . . . . . . . . . . . . . . . . . . . 260,121 — 260,121 —Fuel derivative contracts:
Heating oil put options . . . . . . . . . . . . . . . . . . . . . . . . . . . 32,637 — 32,637 —Foreign currency derivatives . . . . . . . . . . . . . . . . . . . . . . . . . 19,746 — 19,746 —
Total assets measured at fair value . . . . . . . . . . . . . . . . . . . . $374,142 $11,930 $331,663 $ —
Fuel derivative contracts:Heating oil swaps . . . . . . . . . . . . . . . . . . . . . . . . . . . . . . . $ 71,447 $ — $ 71,447 $ —
Interest rate derivative . . . . . . . . . . . . . . . . . . . . . . . . . . . . . 129 — 129 —Negative interest arbitrage derivative . . . . . . . . . . . . . . . . . . . 500 — — 500
Total liabilities measured at fair value . . . . . . . . . . . . . . . . . . $ 72,076 $ — $ 71,576 $500
Cash equivalents. The Company’s cash equivalents consist of money market securities, U.S. agencybonds, foreign and domestic corporate bonds, and commercial paper. The instruments classified asLevel 2 are valued using quoted prices for similar assets in active markets.
Cash equivalents measured at net asset value. Cash equivalents measured at net asset value consist ofmoney market securities that are measured at fair value using the net asset value per share practicalexpedient. In accordance with ASC 820, these instruments are not included in the fair value hierarchy.
Restricted cash. The Company’s restricted cash consist of money market securities.
Short-term investments. Short-term investments include U.S. and foreign government notes and bonds,U.S. agency bonds, variable rate corporate bonds, asset backed securities, foreign and domesticcorporate bonds, municipal bonds, and commercial paper. These instruments are valued using quotedprices for similar assets in active markets or other observable inputs.
Fuel derivative contracts. The Company’s fuel derivative contracts consist of heating oil puts and swapswhich are not traded on a public exchange. The fair value of these instruments are determined basedon inputs available or derived from public markets including contractual terms, market prices, yieldcurves and measures of volatility among others.
Foreign currency derivatives. The Company’s foreign currency derivatives consist of Japanese Yen andAustralian Dollar forward contracts and are valued based primarily on data available or derived frompublic markets.
Interest rate derivative. The Company’s interest rate derivative consists of an interest rate swap and isvalued based primarily on data available or derived from public markets.
69
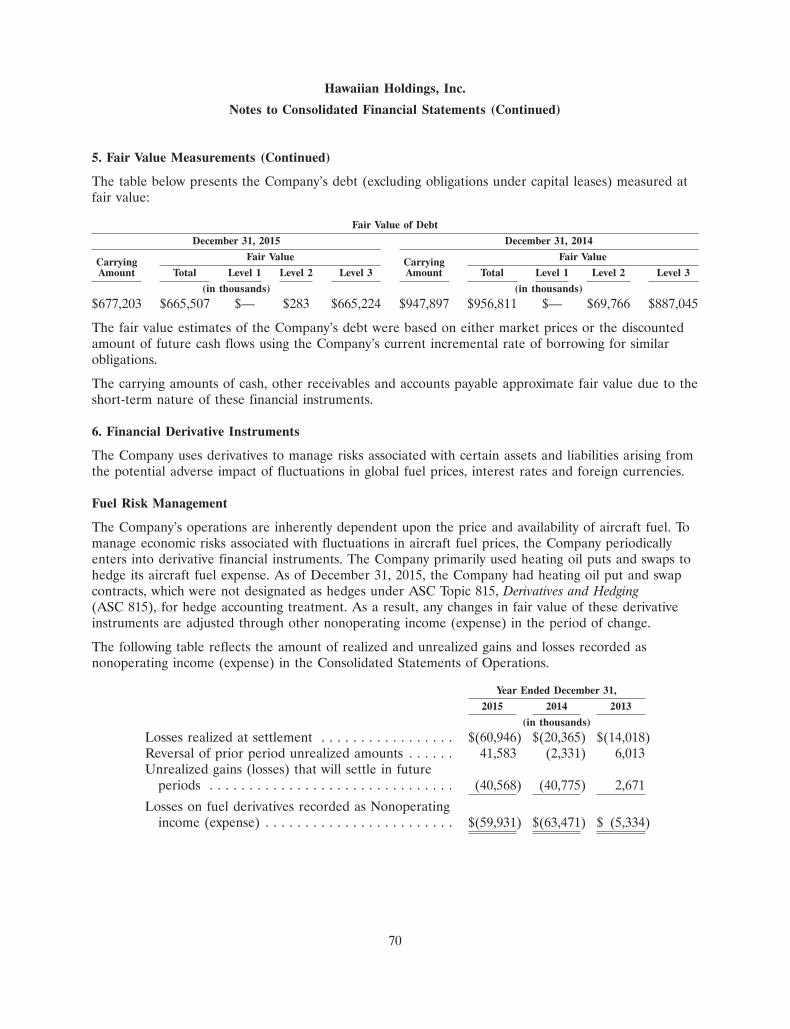
Hawaiian Holdings, Inc.
Notes to Consolidated Financial Statements (Continued)
5. Fair Value Measurements (Continued)
The table below presents the Company’s debt (excluding obligations under capital leases) measured atfair value:
Fair Value of Debt
December 31, 2015 December 31, 2014
Fair Value Fair ValueCarrying CarryingAmount Total Level 1 Level 2 Level 3 Amount Total Level 1 Level 2 Level 3
(in thousands) (in thousands)
$677,203 $665,507 $— $283 $665,224 $947,897 $956,811 $— $69,766 $887,045
The fair value estimates of the Company’s debt were based on either market prices or the discountedamount of future cash flows using the Company’s current incremental rate of borrowing for similarobligations.
The carrying amounts of cash, other receivables and accounts payable approximate fair value due to theshort-term nature of these financial instruments.
6. Financial Derivative Instruments
The Company uses derivatives to manage risks associated with certain assets and liabilities arising fromthe potential adverse impact of fluctuations in global fuel prices, interest rates and foreign currencies.
Fuel Risk Management
The Company’s operations are inherently dependent upon the price and availability of aircraft fuel. Tomanage economic risks associated with fluctuations in aircraft fuel prices, the Company periodicallyenters into derivative financial instruments. The Company primarily used heating oil puts and swaps tohedge its aircraft fuel expense. As of December 31, 2015, the Company had heating oil put and swapcontracts, which were not designated as hedges under ASC Topic 815, Derivatives and Hedging(ASC 815), for hedge accounting treatment. As a result, any changes in fair value of these derivativeinstruments are adjusted through other nonoperating income (expense) in the period of change.
The following table reflects the amount of realized and unrealized gains and losses recorded asnonoperating income (expense) in the Consolidated Statements of Operations.
Year Ended December 31,
2015 2014 2013
(in thousands)
Losses realized at settlement . . . . . . . . . . . . . . . . . $(60,946) $(20,365) $(14,018)Reversal of prior period unrealized amounts . . . . . . 41,583 (2,331) 6,013Unrealized gains (losses) that will settle in future
periods . . . . . . . . . . . . . . . . . . . . . . . . . . . . . . . (40,568) (40,775) 2,671
Losses on fuel derivatives recorded as Nonoperatingincome (expense) . . . . . . . . . . . . . . . . . . . . . . . . $(59,931) $(63,471) $ (5,334)
70
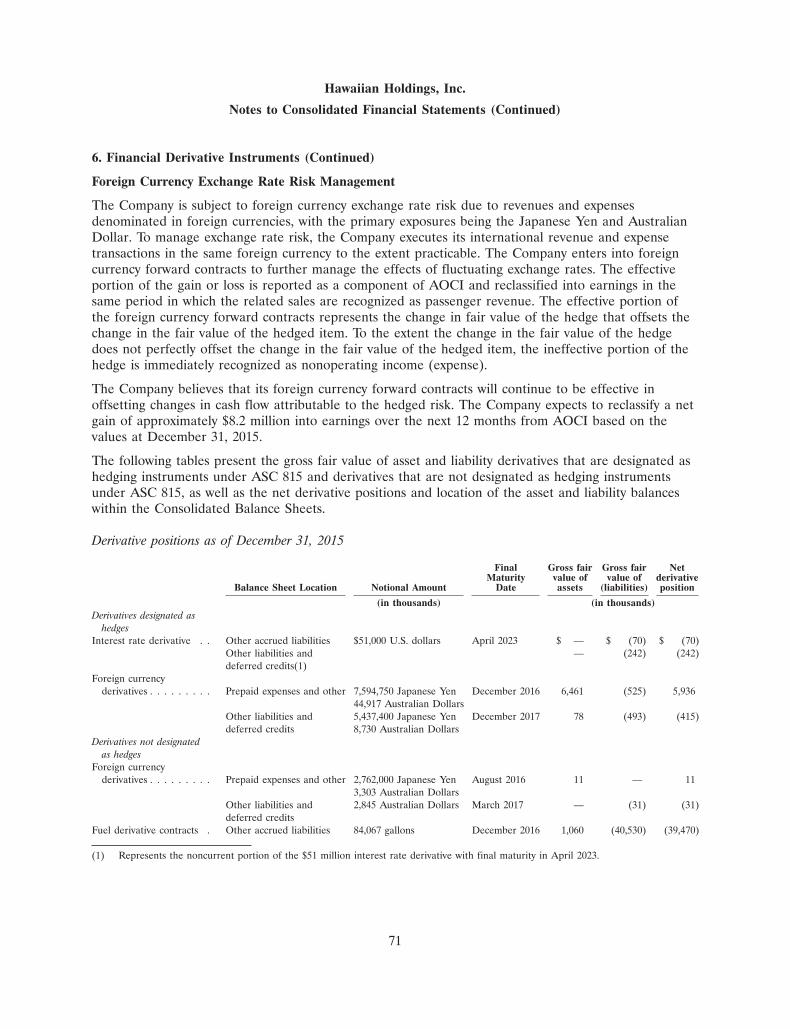
Hawaiian Holdings, Inc.
Notes to Consolidated Financial Statements (Continued)
6. Financial Derivative Instruments (Continued)
Foreign Currency Exchange Rate Risk Management
The Company is subject to foreign currency exchange rate risk due to revenues and expensesdenominated in foreign currencies, with the primary exposures being the Japanese Yen and AustralianDollar. To manage exchange rate risk, the Company executes its international revenue and expensetransactions in the same foreign currency to the extent practicable. The Company enters into foreigncurrency forward contracts to further manage the effects of fluctuating exchange rates. The effectiveportion of the gain or loss is reported as a component of AOCI and reclassified into earnings in thesame period in which the related sales are recognized as passenger revenue. The effective portion ofthe foreign currency forward contracts represents the change in fair value of the hedge that offsets thechange in the fair value of the hedged item. To the extent the change in the fair value of the hedgedoes not perfectly offset the change in the fair value of the hedged item, the ineffective portion of thehedge is immediately recognized as nonoperating income (expense).
The Company believes that its foreign currency forward contracts will continue to be effective inoffsetting changes in cash flow attributable to the hedged risk. The Company expects to reclassify a netgain of approximately $8.2 million into earnings over the next 12 months from AOCI based on thevalues at December 31, 2015.
The following tables present the gross fair value of asset and liability derivatives that are designated ashedging instruments under ASC 815 and derivatives that are not designated as hedging instrumentsunder ASC 815, as well as the net derivative positions and location of the asset and liability balanceswithin the Consolidated Balance Sheets.
Derivative positions as of December 31, 2015
Final Gross fair Gross fair NetMaturity value of value of derivative
Balance Sheet Location Notional Amount Date assets (liabilities) position
(in thousands) (in thousands)Derivatives designated as
hedgesInterest rate derivative . . Other accrued liabilities $51,000 U.S. dollars April 2023 $ — $ (70) $ (70)
Other liabilities and — (242) (242)deferred credits(1)
Foreign currencyderivatives . . . . . . . . . Prepaid expenses and other 7,594,750 Japanese Yen December 2016 6,461 (525) 5,936
44,917 Australian DollarsOther liabilities and 5,437,400 Japanese Yen December 2017 78 (493) (415)deferred credits 8,730 Australian Dollars
Derivatives not designatedas hedges
Foreign currencyderivatives . . . . . . . . . Prepaid expenses and other 2,762,000 Japanese Yen August 2016 11 — 11
3,303 Australian DollarsOther liabilities and 2,845 Australian Dollars March 2017 — (31) (31)deferred credits
Fuel derivative contracts . Other accrued liabilities 84,067 gallons December 2016 1,060 (40,530) (39,470)
(1) Represents the noncurrent portion of the $51 million interest rate derivative with final maturity in April 2023.
71
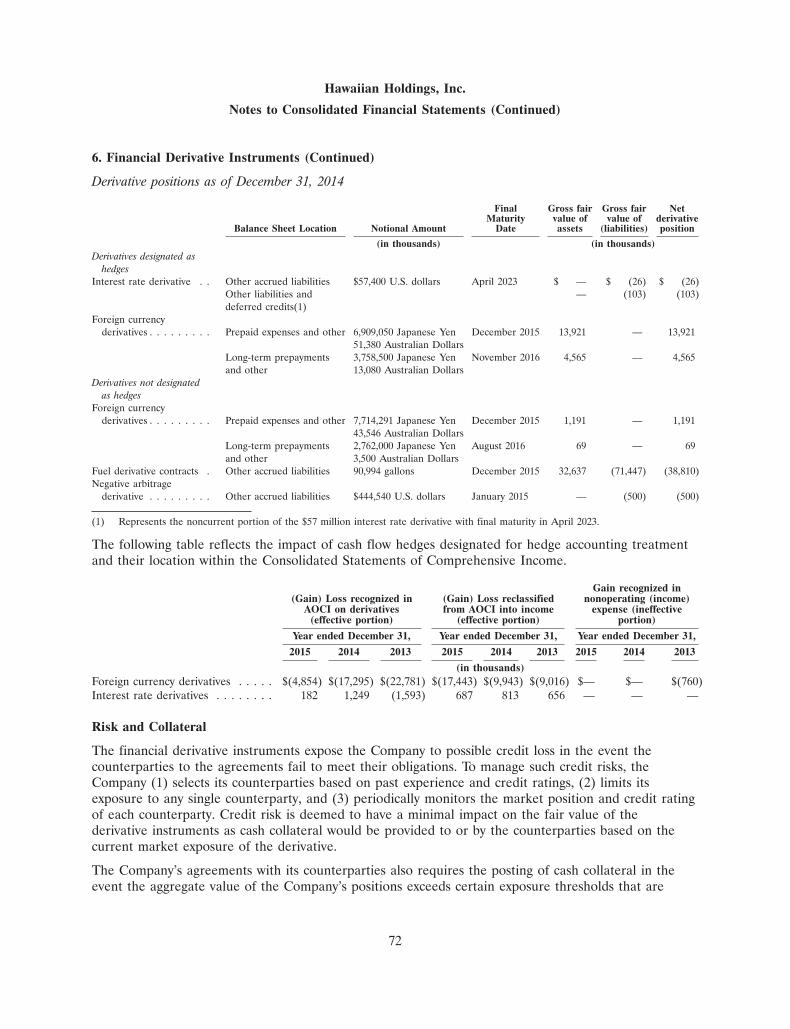
Hawaiian Holdings, Inc.
Notes to Consolidated Financial Statements (Continued)
6. Financial Derivative Instruments (Continued)
Derivative positions as of December 31, 2014
Final Gross fair Gross fair NetMaturity value of value of derivative
Balance Sheet Location Notional Amount Date assets (liabilities) position
(in thousands) (in thousands)Derivatives designated as
hedgesInterest rate derivative . . Other accrued liabilities $57,400 U.S. dollars April 2023 $ — $ (26) $ (26)
Other liabilities and — (103) (103)deferred credits(1)
Foreign currencyderivatives . . . . . . . . . Prepaid expenses and other 6,909,050 Japanese Yen December 2015 13,921 — 13,921
51,380 Australian DollarsLong-term prepayments 3,758,500 Japanese Yen November 2016 4,565 — 4,565and other 13,080 Australian Dollars
Derivatives not designatedas hedges
Foreign currencyderivatives . . . . . . . . . Prepaid expenses and other 7,714,291 Japanese Yen December 2015 1,191 — 1,191
43,546 Australian DollarsLong-term prepayments 2,762,000 Japanese Yen August 2016 69 — 69and other 3,500 Australian Dollars
Fuel derivative contracts . Other accrued liabilities 90,994 gallons December 2015 32,637 (71,447) (38,810)Negative arbitrage
derivative . . . . . . . . . Other accrued liabilities $444,540 U.S. dollars January 2015 — (500) (500)
(1) Represents the noncurrent portion of the $57 million interest rate derivative with final maturity in April 2023.
The following table reflects the impact of cash flow hedges designated for hedge accounting treatmentand their location within the Consolidated Statements of Comprehensive Income.
Gain recognized in(Gain) Loss recognized in (Gain) Loss reclassified nonoperating (income)
AOCI on derivatives from AOCI into income expense (ineffective(effective portion) (effective portion) portion)
Year ended December 31, Year ended December 31, Year ended December 31,
2015 2014 2013 2015 2014 2013 2015 2014 2013
(in thousands)Foreign currency derivatives . . . . . $(4,854) $(17,295) $(22,781) $(17,443) $(9,943) $(9,016) $— $— $(760)Interest rate derivatives . . . . . . . . 182 1,249 (1,593) 687 813 656 — — —
Risk and Collateral
The financial derivative instruments expose the Company to possible credit loss in the event thecounterparties to the agreements fail to meet their obligations. To manage such credit risks, theCompany (1) selects its counterparties based on past experience and credit ratings, (2) limits itsexposure to any single counterparty, and (3) periodically monitors the market position and credit ratingof each counterparty. Credit risk is deemed to have a minimal impact on the fair value of thederivative instruments as cash collateral would be provided to or by the counterparties based on thecurrent market exposure of the derivative.
The Company’s agreements with its counterparties also requires the posting of cash collateral in theevent the aggregate value of the Company’s positions exceeds certain exposure thresholds that are
72
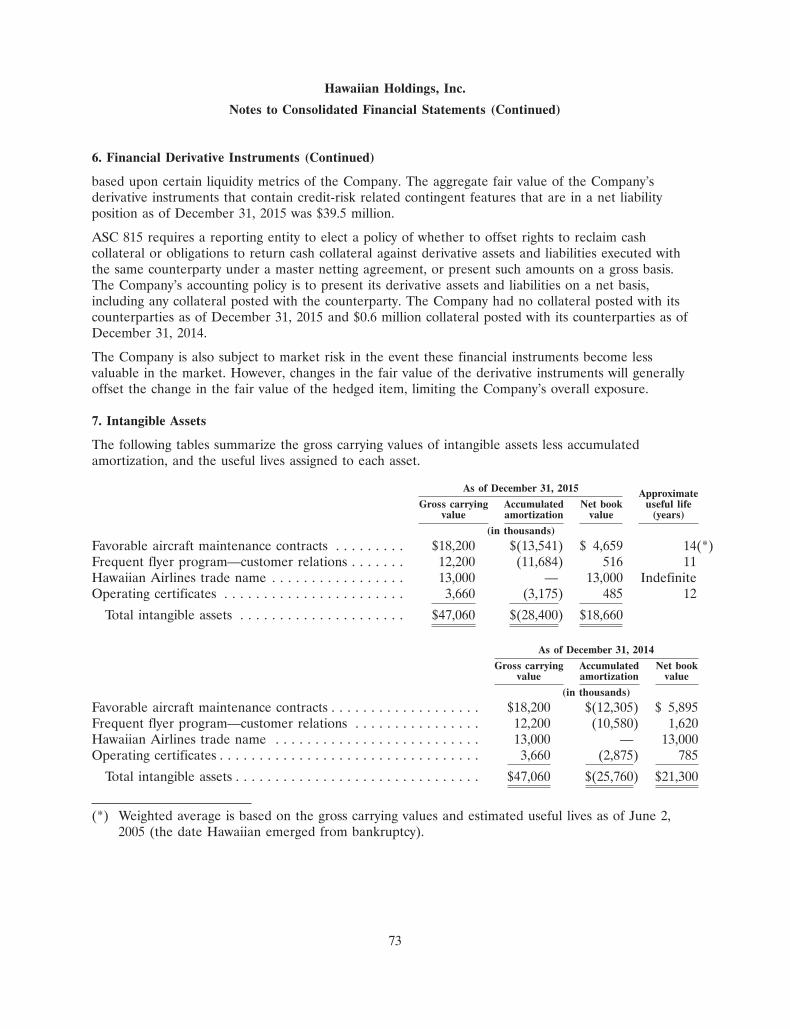
Hawaiian Holdings, Inc.
Notes to Consolidated Financial Statements (Continued)
6. Financial Derivative Instruments (Continued)
based upon certain liquidity metrics of the Company. The aggregate fair value of the Company’sderivative instruments that contain credit-risk related contingent features that are in a net liabilityposition as of December 31, 2015 was $39.5 million.
ASC 815 requires a reporting entity to elect a policy of whether to offset rights to reclaim cashcollateral or obligations to return cash collateral against derivative assets and liabilities executed withthe same counterparty under a master netting agreement, or present such amounts on a gross basis.The Company’s accounting policy is to present its derivative assets and liabilities on a net basis,including any collateral posted with the counterparty. The Company had no collateral posted with itscounterparties as of December 31, 2015 and $0.6 million collateral posted with its counterparties as ofDecember 31, 2014.
The Company is also subject to market risk in the event these financial instruments become lessvaluable in the market. However, changes in the fair value of the derivative instruments will generallyoffset the change in the fair value of the hedged item, limiting the Company’s overall exposure.
7. Intangible Assets
The following tables summarize the gross carrying values of intangible assets less accumulatedamortization, and the useful lives assigned to each asset.
As of December 31, 2015 ApproximateGross carrying Accumulated Net book useful life
value amortization value (years)
(in thousands)
Favorable aircraft maintenance contracts . . . . . . . . . $18,200 $(13,541) $ 4,659 14(*)Frequent flyer program—customer relations . . . . . . . 12,200 (11,684) 516 11Hawaiian Airlines trade name . . . . . . . . . . . . . . . . . 13,000 — 13,000 IndefiniteOperating certificates . . . . . . . . . . . . . . . . . . . . . . . 3,660 (3,175) 485 12
Total intangible assets . . . . . . . . . . . . . . . . . . . . . $47,060 $(28,400) $18,660
As of December 31, 2014
Gross carrying Accumulated Net bookvalue amortization value
(in thousands)
Favorable aircraft maintenance contracts . . . . . . . . . . . . . . . . . . . $18,200 $(12,305) $ 5,895Frequent flyer program—customer relations . . . . . . . . . . . . . . . . 12,200 (10,580) 1,620Hawaiian Airlines trade name . . . . . . . . . . . . . . . . . . . . . . . . . . 13,000 — 13,000Operating certificates . . . . . . . . . . . . . . . . . . . . . . . . . . . . . . . . . 3,660 (2,875) 785
Total intangible assets . . . . . . . . . . . . . . . . . . . . . . . . . . . . . . . $47,060 $(25,760) $21,300
(*) Weighted average is based on the gross carrying values and estimated useful lives as of June 2,2005 (the date Hawaiian emerged from bankruptcy).
73
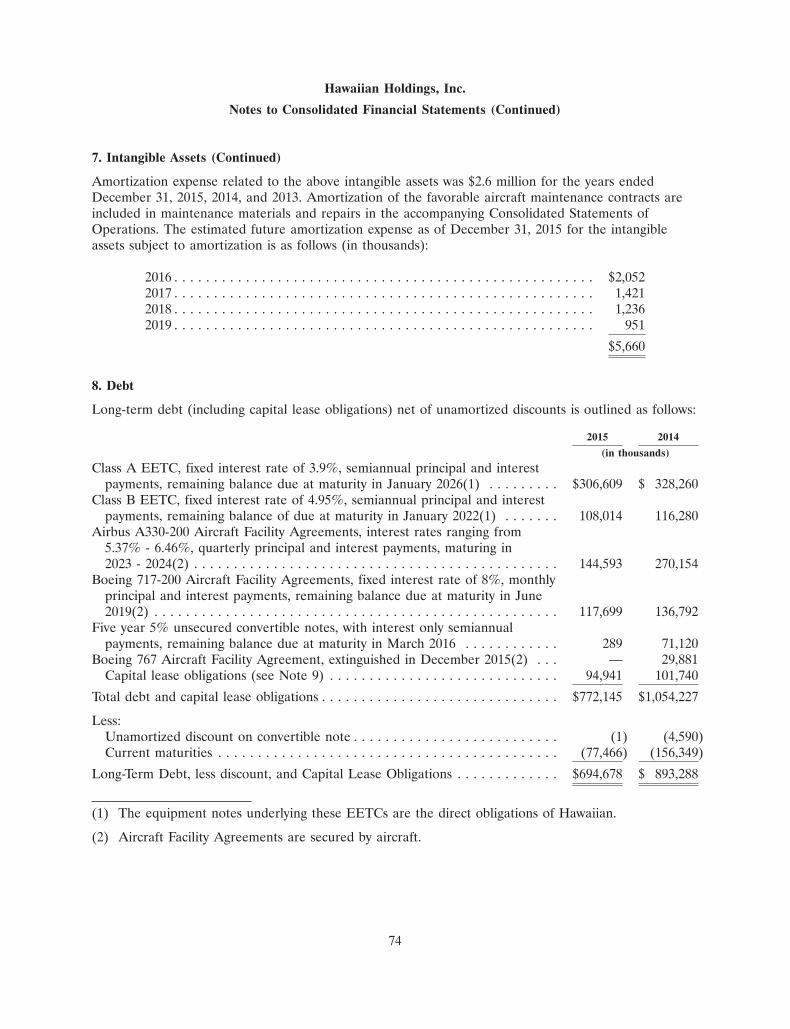
Hawaiian Holdings, Inc.
Notes to Consolidated Financial Statements (Continued)
7. Intangible Assets (Continued)
Amortization expense related to the above intangible assets was $2.6 million for the years endedDecember 31, 2015, 2014, and 2013. Amortization of the favorable aircraft maintenance contracts areincluded in maintenance materials and repairs in the accompanying Consolidated Statements ofOperations. The estimated future amortization expense as of December 31, 2015 for the intangibleassets subject to amortization is as follows (in thousands):
2016 . . . . . . . . . . . . . . . . . . . . . . . . . . . . . . . . . . . . . . . . . . . . . . . . . . . . . $2,0522017 . . . . . . . . . . . . . . . . . . . . . . . . . . . . . . . . . . . . . . . . . . . . . . . . . . . . . 1,4212018 . . . . . . . . . . . . . . . . . . . . . . . . . . . . . . . . . . . . . . . . . . . . . . . . . . . . . 1,2362019 . . . . . . . . . . . . . . . . . . . . . . . . . . . . . . . . . . . . . . . . . . . . . . . . . . . . . 951
$5,660
8. Debt
Long-term debt (including capital lease obligations) net of unamortized discounts is outlined as follows:
2015 2014
(in thousands)
Class A EETC, fixed interest rate of 3.9%, semiannual principal and interestpayments, remaining balance due at maturity in January 2026(1) . . . . . . . . . $306,609 $ 328,260
Class B EETC, fixed interest rate of 4.95%, semiannual principal and interestpayments, remaining balance of due at maturity in January 2022(1) . . . . . . . 108,014 116,280
Airbus A330-200 Aircraft Facility Agreements, interest rates ranging from5.37% - 6.46%, quarterly principal and interest payments, maturing in2023 - 2024(2) . . . . . . . . . . . . . . . . . . . . . . . . . . . . . . . . . . . . . . . . . . . . . . 144,593 270,154
Boeing 717-200 Aircraft Facility Agreements, fixed interest rate of 8%, monthlyprincipal and interest payments, remaining balance due at maturity in June2019(2) . . . . . . . . . . . . . . . . . . . . . . . . . . . . . . . . . . . . . . . . . . . . . . . . . . . 117,699 136,792
Five year 5% unsecured convertible notes, with interest only semiannualpayments, remaining balance due at maturity in March 2016 . . . . . . . . . . . . 289 71,120
Boeing 767 Aircraft Facility Agreement, extinguished in December 2015(2) . . . — 29,881Capital lease obligations (see Note 9) . . . . . . . . . . . . . . . . . . . . . . . . . . . . . 94,941 101,740
Total debt and capital lease obligations . . . . . . . . . . . . . . . . . . . . . . . . . . . . . . $772,145 $1,054,227
Less:Unamortized discount on convertible note . . . . . . . . . . . . . . . . . . . . . . . . . . (1) (4,590)Current maturities . . . . . . . . . . . . . . . . . . . . . . . . . . . . . . . . . . . . . . . . . . . (77,466) (156,349)
Long-Term Debt, less discount, and Capital Lease Obligations . . . . . . . . . . . . . $694,678 $ 893,288
(1) The equipment notes underlying these EETCs are the direct obligations of Hawaiian.
(2) Aircraft Facility Agreements are secured by aircraft.
74
Hawaiian Holdings, Inc.
Notes to Consolidated Financial Statements (Continued)
8. Debt (Continued)
Enhanced Equipment Trust Certificates (EETC)
In 2013, Hawaiian consummated an EETC financing, whereby it created two pass-through trusts, eachof which issued pass-through certificates. The proceeds of the issuance of the pass-through certificateswere used to purchase equipment notes issued by the Company to fund a portion of the purchase pricefor six Airbus aircraft, all of which were delivered in 2013 and 2014. The equipment notes are securedby a lien on the aircraft, and the payment obligations of Hawaiian under the equipment notes will befully and unconditionally guaranteed by the Company. The Company issued the equipment notes to thetrusts as aircraft were delivered to Hawaiian. Hawaiian received all proceeds from the pass-throughtrusts by 2014 and recorded the debt obligation upon issuance of the equipment notes rather than uponthe initial issuance of the pass-through certificates.
Convertible Notes
On March 2011, the Company issued $86.25 million principal amount of the Convertible Notes dueMarch 2016. The Convertible Notes were issued at par and bear interest at a rate of 5.00% per annum.Interest is paid semiannually, in arrears, on March 15 and September 15 each year.
During 2015, the Company repurchased and converted $70.8 million in principal of its ConvertibleNotes for $184.6 million. During 2014, the Company repurchased $15.1 million in principal of itsConvertible Notes for $42.7 million. The cash consideration was allocated to the fair value of theliability component immediately before extinguishment and the remaining consideration was allocatedto the equity component and recognized as a reduction of shareholders’ equity.
During 2015 and 2014, the repurchase and conversion of the Convertible Notes resulted in a loss onextinguishment of $7.4 million and $1.4 million, respectively, which is reflected in nonoperating income(expense) in the Consolidated Statement of Operations.
Each $1,000 of principal of the Convertible Notes is convertible under certain circumstances, at aninitial conversion rate of 126.8730 shares of the Company’s common stock, which is the equivalent ofapproximately $7.8819 per share, subject to adjustment upon the occurrence of certain specified eventsas set forth in the indenture governing the terms of the Convertible Notes. Upon conversion, theCompany will have the right, at the Company’s election, to pay or deliver cash, shares of theCompany’s common stock or a combination thereof. As of December 31, 2015, the Company has theintent and ability to settle the principal balance of the Convertible Notes in cash.
Up through and including the second business day immediately preceding March 15, 2016, Holders mayconvert their Convertible Notes.
Holders may require the Company to repurchase all or a portion of their Convertible Notes upon afundamental change, primarily a change in control or termination of trading, at a cash repurchase priceequal to 100% of the principal amount of the Convertible Notes plus accrued and unpaid interest, ifany. The Company may not redeem the Convertible Notes prior to their maturity date. TheConvertible Notes do not limit the amount that the Company would be required to pay or the numberof shares that would be required to be issued upon conversion.
Amortization of the discount allocated to the debt component of the Convertible Notes for the yearsended December 31, 2015, 2014 and 2013 was $0.7 million, $4.1 million and $3.9 million, respectively,
75
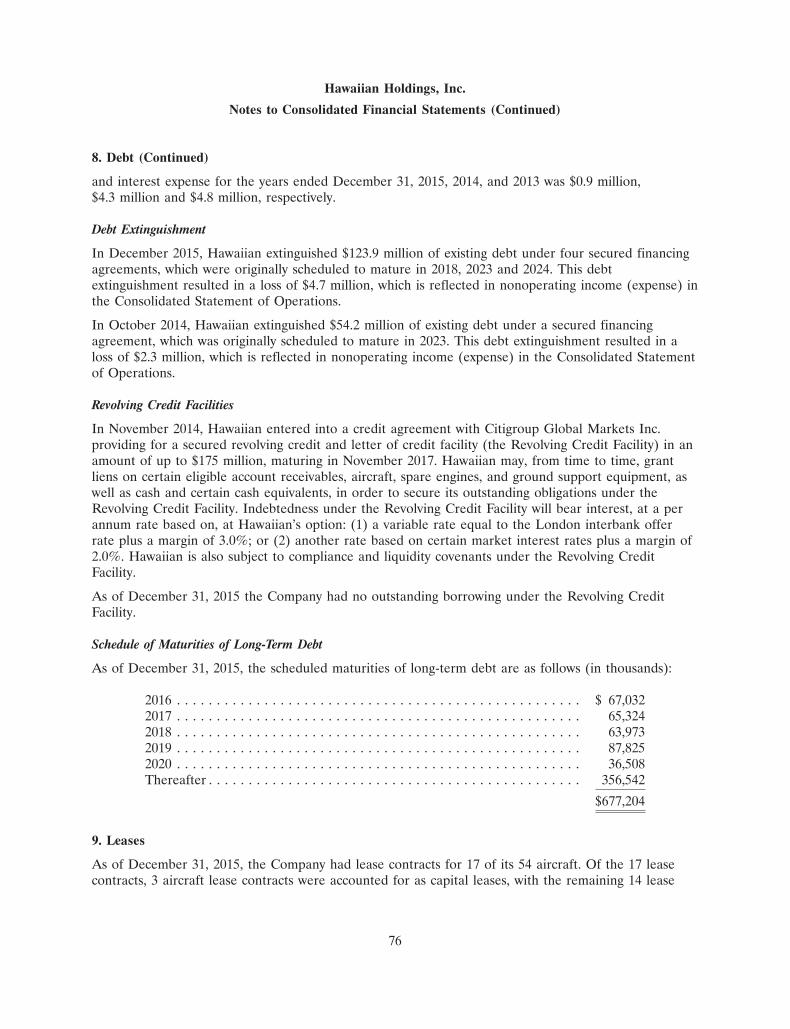
Hawaiian Holdings, Inc.
Notes to Consolidated Financial Statements (Continued)
8. Debt (Continued)
and interest expense for the years ended December 31, 2015, 2014, and 2013 was $0.9 million,$4.3 million and $4.8 million, respectively.
Debt Extinguishment
In December 2015, Hawaiian extinguished $123.9 million of existing debt under four secured financingagreements, which were originally scheduled to mature in 2018, 2023 and 2024. This debtextinguishment resulted in a loss of $4.7 million, which is reflected in nonoperating income (expense) inthe Consolidated Statement of Operations.
In October 2014, Hawaiian extinguished $54.2 million of existing debt under a secured financingagreement, which was originally scheduled to mature in 2023. This debt extinguishment resulted in aloss of $2.3 million, which is reflected in nonoperating income (expense) in the Consolidated Statementof Operations.
Revolving Credit Facilities
In November 2014, Hawaiian entered into a credit agreement with Citigroup Global Markets Inc.providing for a secured revolving credit and letter of credit facility (the Revolving Credit Facility) in anamount of up to $175 million, maturing in November 2017. Hawaiian may, from time to time, grantliens on certain eligible account receivables, aircraft, spare engines, and ground support equipment, aswell as cash and certain cash equivalents, in order to secure its outstanding obligations under theRevolving Credit Facility. Indebtedness under the Revolving Credit Facility will bear interest, at a perannum rate based on, at Hawaiian’s option: (1) a variable rate equal to the London interbank offerrate plus a margin of 3.0%; or (2) another rate based on certain market interest rates plus a margin of2.0%. Hawaiian is also subject to compliance and liquidity covenants under the Revolving CreditFacility.
As of December 31, 2015 the Company had no outstanding borrowing under the Revolving CreditFacility.
Schedule of Maturities of Long-Term Debt
As of December 31, 2015, the scheduled maturities of long-term debt are as follows (in thousands):
2016 . . . . . . . . . . . . . . . . . . . . . . . . . . . . . . . . . . . . . . . . . . . . . . . . . . . $ 67,0322017 . . . . . . . . . . . . . . . . . . . . . . . . . . . . . . . . . . . . . . . . . . . . . . . . . . . 65,3242018 . . . . . . . . . . . . . . . . . . . . . . . . . . . . . . . . . . . . . . . . . . . . . . . . . . . 63,9732019 . . . . . . . . . . . . . . . . . . . . . . . . . . . . . . . . . . . . . . . . . . . . . . . . . . . 87,8252020 . . . . . . . . . . . . . . . . . . . . . . . . . . . . . . . . . . . . . . . . . . . . . . . . . . . 36,508Thereafter . . . . . . . . . . . . . . . . . . . . . . . . . . . . . . . . . . . . . . . . . . . . . . . 356,542
$677,204
9. Leases
As of December 31, 2015, the Company had lease contracts for 17 of its 54 aircraft. Of the 17 leasecontracts, 3 aircraft lease contracts were accounted for as capital leases, with the remaining 14 lease
76
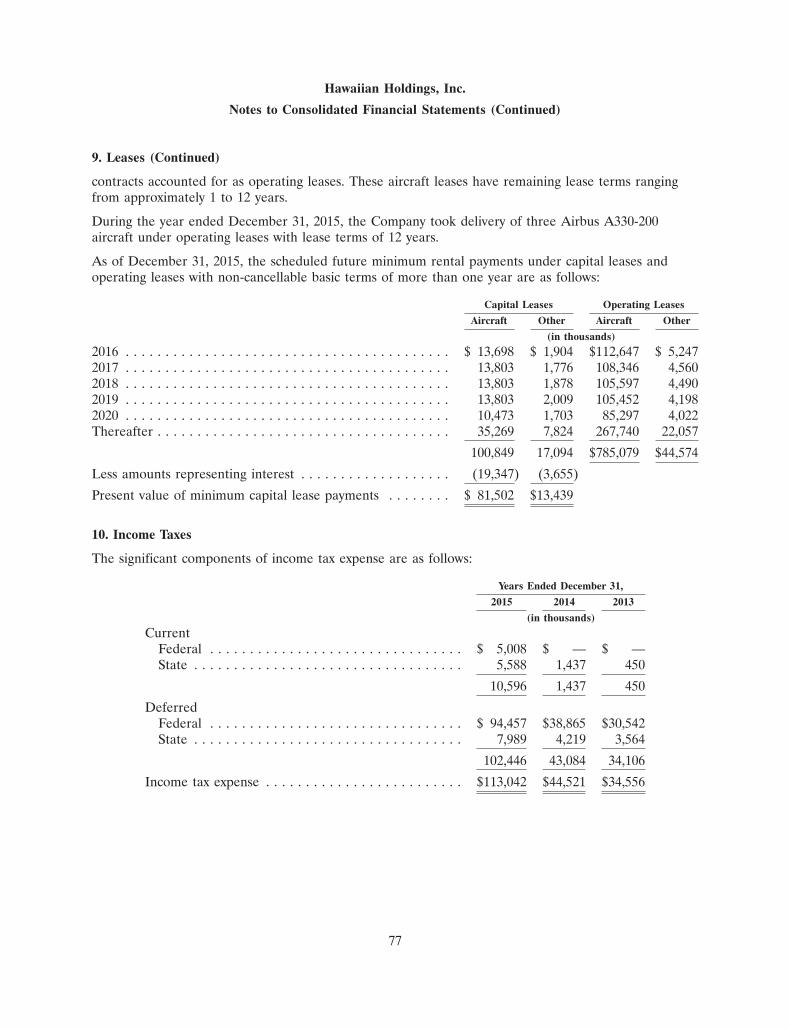
Hawaiian Holdings, Inc.
Notes to Consolidated Financial Statements (Continued)
9. Leases (Continued)
contracts accounted for as operating leases. These aircraft leases have remaining lease terms rangingfrom approximately 1 to 12 years.
During the year ended December 31, 2015, the Company took delivery of three Airbus A330-200aircraft under operating leases with lease terms of 12 years.
As of December 31, 2015, the scheduled future minimum rental payments under capital leases andoperating leases with non-cancellable basic terms of more than one year are as follows:
Capital Leases Operating Leases
Aircraft Other Aircraft Other
(in thousands)
2016 . . . . . . . . . . . . . . . . . . . . . . . . . . . . . . . . . . . . . . . . . $ 13,698 $ 1,904 $112,647 $ 5,2472017 . . . . . . . . . . . . . . . . . . . . . . . . . . . . . . . . . . . . . . . . . 13,803 1,776 108,346 4,5602018 . . . . . . . . . . . . . . . . . . . . . . . . . . . . . . . . . . . . . . . . . 13,803 1,878 105,597 4,4902019 . . . . . . . . . . . . . . . . . . . . . . . . . . . . . . . . . . . . . . . . . 13,803 2,009 105,452 4,1982020 . . . . . . . . . . . . . . . . . . . . . . . . . . . . . . . . . . . . . . . . . 10,473 1,703 85,297 4,022Thereafter . . . . . . . . . . . . . . . . . . . . . . . . . . . . . . . . . . . . . 35,269 7,824 267,740 22,057
100,849 17,094 $785,079 $44,574
Less amounts representing interest . . . . . . . . . . . . . . . . . . . (19,347) (3,655)
Present value of minimum capital lease payments . . . . . . . . $ 81,502 $13,439
10. Income Taxes
The significant components of income tax expense are as follows:
Years Ended December 31,
2015 2014 2013
(in thousands)
CurrentFederal . . . . . . . . . . . . . . . . . . . . . . . . . . . . . . . . $ 5,008 $ — $ —State . . . . . . . . . . . . . . . . . . . . . . . . . . . . . . . . . . 5,588 1,437 450
10,596 1,437 450
DeferredFederal . . . . . . . . . . . . . . . . . . . . . . . . . . . . . . . . $ 94,457 $38,865 $30,542State . . . . . . . . . . . . . . . . . . . . . . . . . . . . . . . . . . 7,989 4,219 3,564
102,446 43,084 34,106
Income tax expense . . . . . . . . . . . . . . . . . . . . . . . . . $113,042 $44,521 $34,556
77
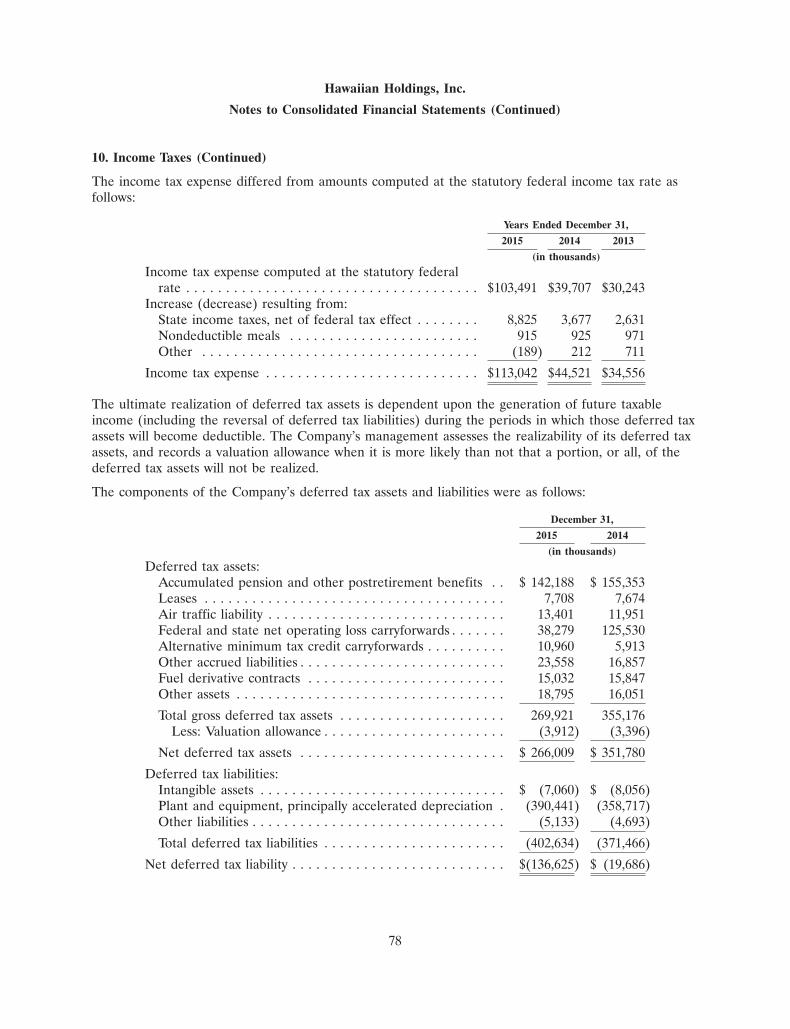
Hawaiian Holdings, Inc.
Notes to Consolidated Financial Statements (Continued)
10. Income Taxes (Continued)
The income tax expense differed from amounts computed at the statutory federal income tax rate asfollows:
Years Ended December 31,
2015 2014 2013
(in thousands)
Income tax expense computed at the statutory federalrate . . . . . . . . . . . . . . . . . . . . . . . . . . . . . . . . . . . . . $103,491 $39,707 $30,243
Increase (decrease) resulting from:State income taxes, net of federal tax effect . . . . . . . . 8,825 3,677 2,631Nondeductible meals . . . . . . . . . . . . . . . . . . . . . . . . 915 925 971Other . . . . . . . . . . . . . . . . . . . . . . . . . . . . . . . . . . . (189) 212 711
Income tax expense . . . . . . . . . . . . . . . . . . . . . . . . . . . $113,042 $44,521 $34,556
The ultimate realization of deferred tax assets is dependent upon the generation of future taxableincome (including the reversal of deferred tax liabilities) during the periods in which those deferred taxassets will become deductible. The Company’s management assesses the realizability of its deferred taxassets, and records a valuation allowance when it is more likely than not that a portion, or all, of thedeferred tax assets will not be realized.
The components of the Company’s deferred tax assets and liabilities were as follows:
December 31,
2015 2014
(in thousands)
Deferred tax assets:Accumulated pension and other postretirement benefits . . $ 142,188 $ 155,353Leases . . . . . . . . . . . . . . . . . . . . . . . . . . . . . . . . . . . . . . 7,708 7,674Air traffic liability . . . . . . . . . . . . . . . . . . . . . . . . . . . . . . 13,401 11,951Federal and state net operating loss carryforwards . . . . . . . 38,279 125,530Alternative minimum tax credit carryforwards . . . . . . . . . . 10,960 5,913Other accrued liabilities . . . . . . . . . . . . . . . . . . . . . . . . . . 23,558 16,857Fuel derivative contracts . . . . . . . . . . . . . . . . . . . . . . . . . 15,032 15,847Other assets . . . . . . . . . . . . . . . . . . . . . . . . . . . . . . . . . . 18,795 16,051
Total gross deferred tax assets . . . . . . . . . . . . . . . . . . . . . 269,921 355,176Less: Valuation allowance . . . . . . . . . . . . . . . . . . . . . . . (3,912) (3,396)
Net deferred tax assets . . . . . . . . . . . . . . . . . . . . . . . . . . $ 266,009 $ 351,780
Deferred tax liabilities:Intangible assets . . . . . . . . . . . . . . . . . . . . . . . . . . . . . . . $ (7,060) $ (8,056)Plant and equipment, principally accelerated depreciation . (390,441) (358,717)Other liabilities . . . . . . . . . . . . . . . . . . . . . . . . . . . . . . . . (5,133) (4,693)
Total deferred tax liabilities . . . . . . . . . . . . . . . . . . . . . . . (402,634) (371,466)
Net deferred tax liability . . . . . . . . . . . . . . . . . . . . . . . . . . . $(136,625) $ (19,686)
78
Hawaiian Holdings, Inc.
Notes to Consolidated Financial Statements (Continued)
10. Income Taxes (Continued)
As of December 31, 2015, the Company had available for federal income tax purposes an alternativeminimum tax credit carryforward of approximately $11.0 million, which is available for an indefiniteperiod, and net operating loss carryforwards of $288.2 million. The tax benefit of the net operating losscarryforwards as of December 31, 2015 was $38.3 million, substantially all of which will not begin toexpire until 2031.
During the year ended December 31, 2015, the Company reduced its state taxes payable for the excesstax benefits from employee stock plan awards, which offset additional paid-in-capital. In addition, theCompany has unrecorded excess tax benefits from stock option exercises and other employee stockprograms of approximately $12.4 million as of December 31, 2015. These amounts will be credited toadditional paid-in-capital when such amounts reduce income taxes payable.
In accordance with ASC 740, the Company reviews its uncertain tax positions on an ongoing basis. Asof December 31, 2015, and 2014, the Company had no unrecognized tax benefits related to uncertaintax positions.
The Company records interest and penalties relating to unrecognized tax benefits in other nonoperatingexpense in its Consolidated Statements of Operations.
The Company files its tax returns as prescribed by the tax laws of the jurisdictions in which it operates.The Company’s federal income tax returns for tax years 2012 and beyond remain subject toexamination by the Internal Revenue Service.
11. Employee Benefit Plans
Defined Benefit Plans
Hawaiian sponsors various defined benefit pension plans covering the Air Line Pilots Association,International Association of Machinists and Aerospace Workers (AFL-CIO) (IAM) and otherpersonnel (salaried, Transport Workers Union, Network Engineering Group). The plans for the IAMand other employees were frozen in September 1993. Effective January 1, 2008, benefit accruals forpilots under age 50 as of July 1, 2005 were frozen (with the exception of certain pilots who were bothage 50 and older and participants of the plan on July 1, 2005) and Hawaiian began makingcontributions to an alternate defined contribution retirement program for its pilots. All of the pilots’accrued benefits under their defined benefit plan at the date of the freeze were preserved. In addition,Hawaiian sponsors four unfunded defined benefit postretirement medical and life insurance plans and aseparate plan to administer the pilots’ disability benefits.
79
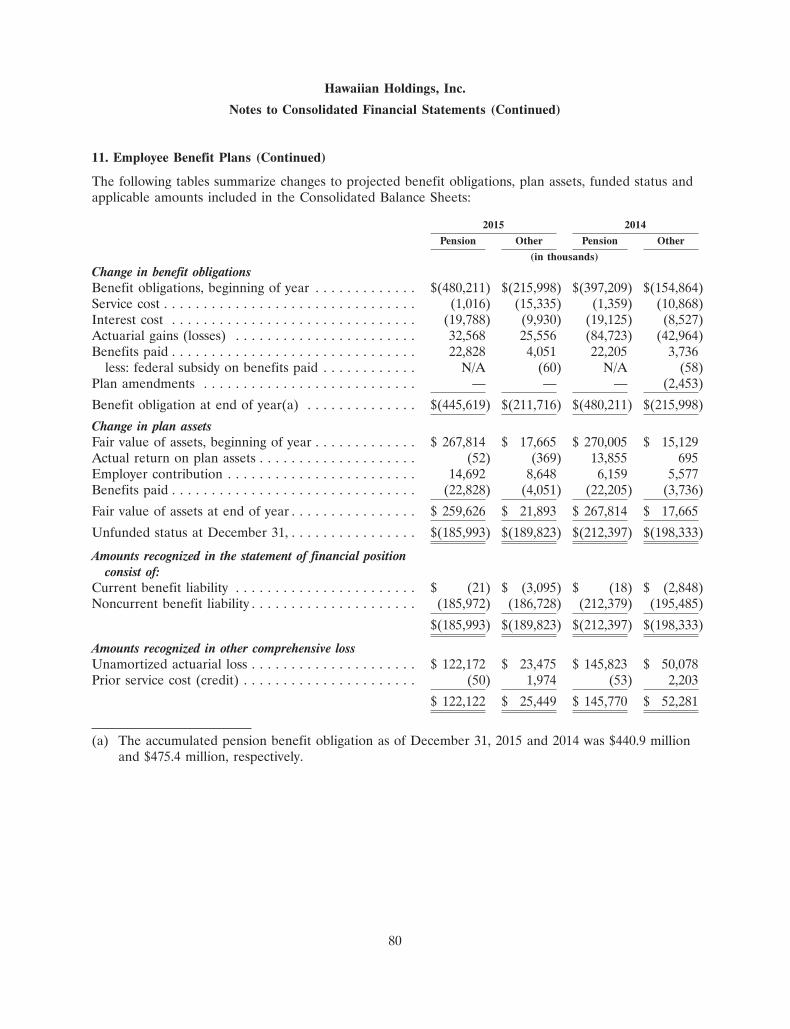
Hawaiian Holdings, Inc.
Notes to Consolidated Financial Statements (Continued)
11. Employee Benefit Plans (Continued)
The following tables summarize changes to projected benefit obligations, plan assets, funded status andapplicable amounts included in the Consolidated Balance Sheets:
2015 2014
Pension Other Pension Other
(in thousands)
Change in benefit obligationsBenefit obligations, beginning of year . . . . . . . . . . . . . $(480,211) $(215,998) $(397,209) $(154,864)Service cost . . . . . . . . . . . . . . . . . . . . . . . . . . . . . . . . (1,016) (15,335) (1,359) (10,868)Interest cost . . . . . . . . . . . . . . . . . . . . . . . . . . . . . . . (19,788) (9,930) (19,125) (8,527)Actuarial gains (losses) . . . . . . . . . . . . . . . . . . . . . . . 32,568 25,556 (84,723) (42,964)Benefits paid . . . . . . . . . . . . . . . . . . . . . . . . . . . . . . . 22,828 4,051 22,205 3,736
less: federal subsidy on benefits paid . . . . . . . . . . . . N/A (60) N/A (58)Plan amendments . . . . . . . . . . . . . . . . . . . . . . . . . . . — — — (2,453)
Benefit obligation at end of year(a) . . . . . . . . . . . . . . $(445,619) $(211,716) $(480,211) $(215,998)
Change in plan assetsFair value of assets, beginning of year . . . . . . . . . . . . . $ 267,814 $ 17,665 $ 270,005 $ 15,129Actual return on plan assets . . . . . . . . . . . . . . . . . . . . (52) (369) 13,855 695Employer contribution . . . . . . . . . . . . . . . . . . . . . . . . 14,692 8,648 6,159 5,577Benefits paid . . . . . . . . . . . . . . . . . . . . . . . . . . . . . . . (22,828) (4,051) (22,205) (3,736)
Fair value of assets at end of year . . . . . . . . . . . . . . . . $ 259,626 $ 21,893 $ 267,814 $ 17,665
Unfunded status at December 31, . . . . . . . . . . . . . . . . $(185,993) $(189,823) $(212,397) $(198,333)
Amounts recognized in the statement of financial positionconsist of:
Current benefit liability . . . . . . . . . . . . . . . . . . . . . . . $ (21) $ (3,095) $ (18) $ (2,848)Noncurrent benefit liability . . . . . . . . . . . . . . . . . . . . . (185,972) (186,728) (212,379) (195,485)
$(185,993) $(189,823) $(212,397) $(198,333)
Amounts recognized in other comprehensive lossUnamortized actuarial loss . . . . . . . . . . . . . . . . . . . . . $ 122,172 $ 23,475 $ 145,823 $ 50,078Prior service cost (credit) . . . . . . . . . . . . . . . . . . . . . . (50) 1,974 (53) 2,203
$ 122,122 $ 25,449 $ 145,770 $ 52,281
(a) The accumulated pension benefit obligation as of December 31, 2015 and 2014 was $440.9 millionand $475.4 million, respectively.
80
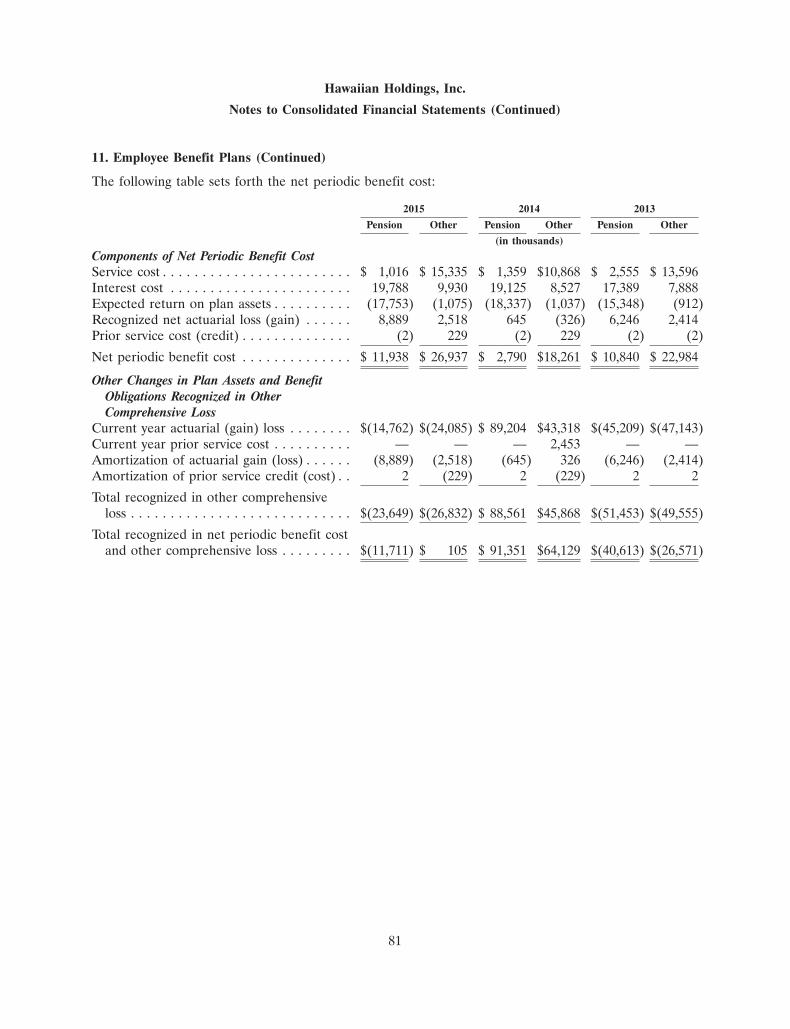
Hawaiian Holdings, Inc.
Notes to Consolidated Financial Statements (Continued)
11. Employee Benefit Plans (Continued)
The following table sets forth the net periodic benefit cost:
2015 2014 2013
Pension Other Pension Other Pension Other
(in thousands)
Components of Net Periodic Benefit CostService cost . . . . . . . . . . . . . . . . . . . . . . . . $ 1,016 $ 15,335 $ 1,359 $10,868 $ 2,555 $ 13,596Interest cost . . . . . . . . . . . . . . . . . . . . . . . 19,788 9,930 19,125 8,527 17,389 7,888Expected return on plan assets . . . . . . . . . . (17,753) (1,075) (18,337) (1,037) (15,348) (912)Recognized net actuarial loss (gain) . . . . . . 8,889 2,518 645 (326) 6,246 2,414Prior service cost (credit) . . . . . . . . . . . . . . (2) 229 (2) 229 (2) (2)
Net periodic benefit cost . . . . . . . . . . . . . . $ 11,938 $ 26,937 $ 2,790 $18,261 $ 10,840 $ 22,984
Other Changes in Plan Assets and BenefitObligations Recognized in OtherComprehensive Loss
Current year actuarial (gain) loss . . . . . . . . $(14,762) $(24,085) $ 89,204 $43,318 $(45,209) $(47,143)Current year prior service cost . . . . . . . . . . — — — 2,453 — —Amortization of actuarial gain (loss) . . . . . . (8,889) (2,518) (645) 326 (6,246) (2,414)Amortization of prior service credit (cost) . . 2 (229) 2 (229) 2 2
Total recognized in other comprehensiveloss . . . . . . . . . . . . . . . . . . . . . . . . . . . . $(23,649) $(26,832) $ 88,561 $45,868 $(51,453) $(49,555)
Total recognized in net periodic benefit costand other comprehensive loss . . . . . . . . . $(11,711) $ 105 $ 91,351 $64,129 $(40,613) $(26,571)
81
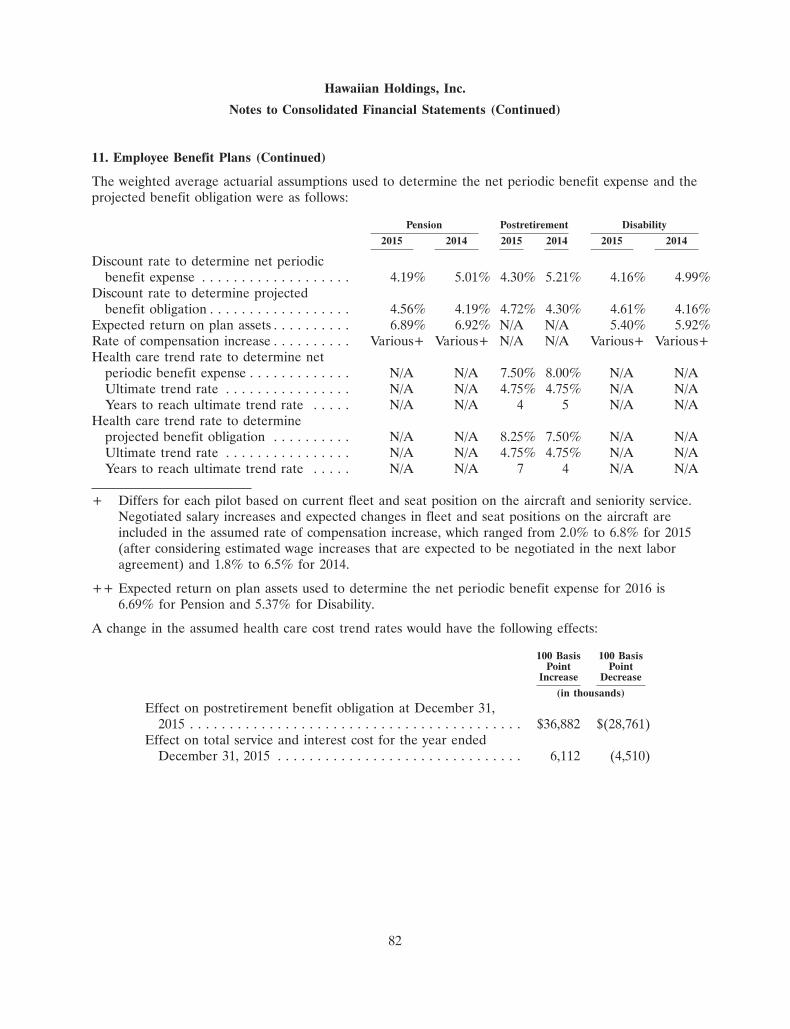
Hawaiian Holdings, Inc.
Notes to Consolidated Financial Statements (Continued)
11. Employee Benefit Plans (Continued)
The weighted average actuarial assumptions used to determine the net periodic benefit expense and theprojected benefit obligation were as follows:
Pension Postretirement Disability
2015 2014 2015 2014 2015 2014
Discount rate to determine net periodicbenefit expense . . . . . . . . . . . . . . . . . . . 4.19% 5.01% 4.30% 5.21% 4.16% 4.99%
Discount rate to determine projectedbenefit obligation . . . . . . . . . . . . . . . . . . 4.56% 4.19% 4.72% 4.30% 4.61% 4.16%
Expected return on plan assets . . . . . . . . . . 6.89% 6.92% N/A N/A 5.40% 5.92%Rate of compensation increase . . . . . . . . . . Various+ Various+ N/A N/A Various+ Various+Health care trend rate to determine net
periodic benefit expense . . . . . . . . . . . . . N/A N/A 7.50% 8.00% N/A N/AUltimate trend rate . . . . . . . . . . . . . . . . N/A N/A 4.75% 4.75% N/A N/AYears to reach ultimate trend rate . . . . . N/A N/A 4 5 N/A N/A
Health care trend rate to determineprojected benefit obligation . . . . . . . . . . N/A N/A 8.25% 7.50% N/A N/AUltimate trend rate . . . . . . . . . . . . . . . . N/A N/A 4.75% 4.75% N/A N/AYears to reach ultimate trend rate . . . . . N/A N/A 7 4 N/A N/A
+ Differs for each pilot based on current fleet and seat position on the aircraft and seniority service.Negotiated salary increases and expected changes in fleet and seat positions on the aircraft areincluded in the assumed rate of compensation increase, which ranged from 2.0% to 6.8% for 2015(after considering estimated wage increases that are expected to be negotiated in the next laboragreement) and 1.8% to 6.5% for 2014.
++ Expected return on plan assets used to determine the net periodic benefit expense for 2016 is6.69% for Pension and 5.37% for Disability.
A change in the assumed health care cost trend rates would have the following effects:
100 Basis 100 BasisPoint Point
Increase Decrease
(in thousands)
Effect on postretirement benefit obligation at December 31,2015 . . . . . . . . . . . . . . . . . . . . . . . . . . . . . . . . . . . . . . . . . . $36,882 $(28,761)
Effect on total service and interest cost for the year endedDecember 31, 2015 . . . . . . . . . . . . . . . . . . . . . . . . . . . . . . . 6,112 (4,510)
82
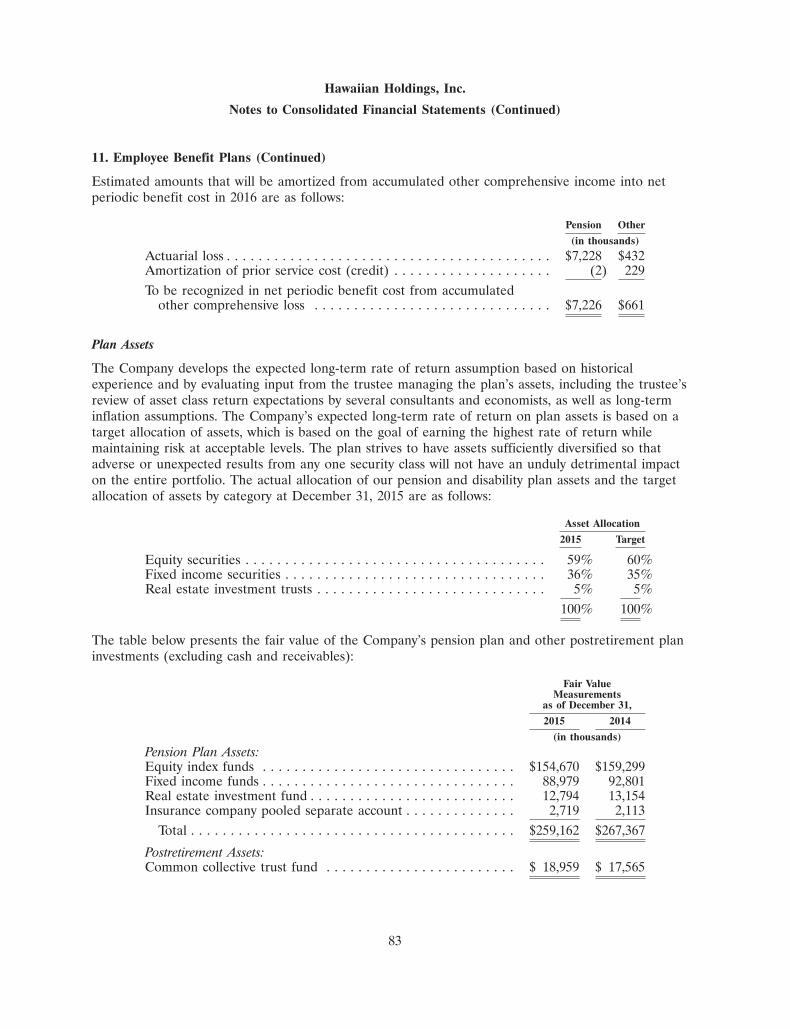
Hawaiian Holdings, Inc.
Notes to Consolidated Financial Statements (Continued)
11. Employee Benefit Plans (Continued)
Estimated amounts that will be amortized from accumulated other comprehensive income into netperiodic benefit cost in 2016 are as follows:
Pension Other
(in thousands)
Actuarial loss . . . . . . . . . . . . . . . . . . . . . . . . . . . . . . . . . . . . . . . . . $7,228 $432Amortization of prior service cost (credit) . . . . . . . . . . . . . . . . . . . . (2) 229To be recognized in net periodic benefit cost from accumulated
other comprehensive loss . . . . . . . . . . . . . . . . . . . . . . . . . . . . . . $7,226 $661
Plan Assets
The Company develops the expected long-term rate of return assumption based on historicalexperience and by evaluating input from the trustee managing the plan’s assets, including the trustee’sreview of asset class return expectations by several consultants and economists, as well as long-terminflation assumptions. The Company’s expected long-term rate of return on plan assets is based on atarget allocation of assets, which is based on the goal of earning the highest rate of return whilemaintaining risk at acceptable levels. The plan strives to have assets sufficiently diversified so thatadverse or unexpected results from any one security class will not have an unduly detrimental impacton the entire portfolio. The actual allocation of our pension and disability plan assets and the targetallocation of assets by category at December 31, 2015 are as follows:
Asset Allocation
2015 Target
Equity securities . . . . . . . . . . . . . . . . . . . . . . . . . . . . . . . . . . . . . . 59% 60%Fixed income securities . . . . . . . . . . . . . . . . . . . . . . . . . . . . . . . . . 36% 35%Real estate investment trusts . . . . . . . . . . . . . . . . . . . . . . . . . . . . . 5% 5%
100% 100%
The table below presents the fair value of the Company’s pension plan and other postretirement planinvestments (excluding cash and receivables):
Fair ValueMeasurements
as of December 31,
2015 2014
(in thousands)
Pension Plan Assets:Equity index funds . . . . . . . . . . . . . . . . . . . . . . . . . . . . . . . . $154,670 $159,299Fixed income funds . . . . . . . . . . . . . . . . . . . . . . . . . . . . . . . . 88,979 92,801Real estate investment fund . . . . . . . . . . . . . . . . . . . . . . . . . . 12,794 13,154Insurance company pooled separate account . . . . . . . . . . . . . . 2,719 2,113
Total . . . . . . . . . . . . . . . . . . . . . . . . . . . . . . . . . . . . . . . . . $259,162 $267,367
Postretirement Assets:Common collective trust fund . . . . . . . . . . . . . . . . . . . . . . . . $ 18,959 $ 17,565
83
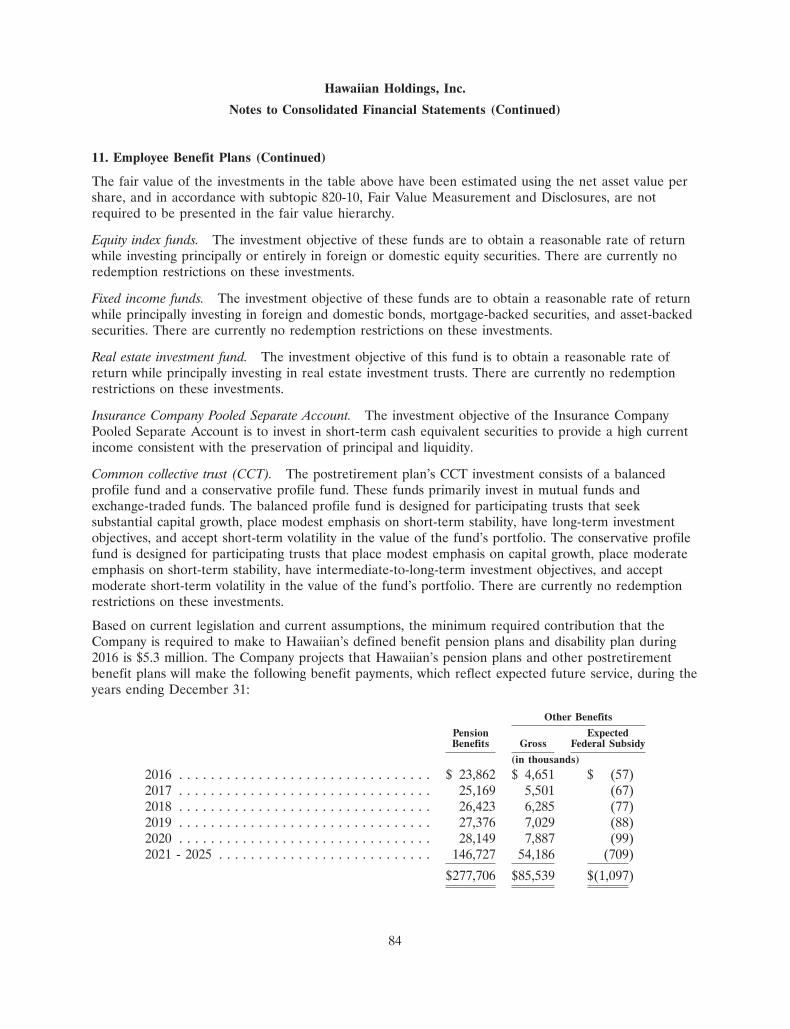
Hawaiian Holdings, Inc.
Notes to Consolidated Financial Statements (Continued)
11. Employee Benefit Plans (Continued)
The fair value of the investments in the table above have been estimated using the net asset value pershare, and in accordance with subtopic 820-10, Fair Value Measurement and Disclosures, are notrequired to be presented in the fair value hierarchy.
Equity index funds. The investment objective of these funds are to obtain a reasonable rate of returnwhile investing principally or entirely in foreign or domestic equity securities. There are currently noredemption restrictions on these investments.
Fixed income funds. The investment objective of these funds are to obtain a reasonable rate of returnwhile principally investing in foreign and domestic bonds, mortgage-backed securities, and asset-backedsecurities. There are currently no redemption restrictions on these investments.
Real estate investment fund. The investment objective of this fund is to obtain a reasonable rate ofreturn while principally investing in real estate investment trusts. There are currently no redemptionrestrictions on these investments.
Insurance Company Pooled Separate Account. The investment objective of the Insurance CompanyPooled Separate Account is to invest in short-term cash equivalent securities to provide a high currentincome consistent with the preservation of principal and liquidity.
Common collective trust (CCT). The postretirement plan’s CCT investment consists of a balancedprofile fund and a conservative profile fund. These funds primarily invest in mutual funds andexchange-traded funds. The balanced profile fund is designed for participating trusts that seeksubstantial capital growth, place modest emphasis on short-term stability, have long-term investmentobjectives, and accept short-term volatility in the value of the fund’s portfolio. The conservative profilefund is designed for participating trusts that place modest emphasis on capital growth, place moderateemphasis on short-term stability, have intermediate-to-long-term investment objectives, and acceptmoderate short-term volatility in the value of the fund’s portfolio. There are currently no redemptionrestrictions on these investments.
Based on current legislation and current assumptions, the minimum required contribution that theCompany is required to make to Hawaiian’s defined benefit pension plans and disability plan during2016 is $5.3 million. The Company projects that Hawaiian’s pension plans and other postretirementbenefit plans will make the following benefit payments, which reflect expected future service, during theyears ending December 31:
Other Benefits
Pension ExpectedBenefits Gross Federal Subsidy
(in thousands)
2016 . . . . . . . . . . . . . . . . . . . . . . . . . . . . . . . . $ 23,862 $ 4,651 $ (57)2017 . . . . . . . . . . . . . . . . . . . . . . . . . . . . . . . . 25,169 5,501 (67)2018 . . . . . . . . . . . . . . . . . . . . . . . . . . . . . . . . 26,423 6,285 (77)2019 . . . . . . . . . . . . . . . . . . . . . . . . . . . . . . . . 27,376 7,029 (88)2020 . . . . . . . . . . . . . . . . . . . . . . . . . . . . . . . . 28,149 7,887 (99)2021 - 2025 . . . . . . . . . . . . . . . . . . . . . . . . . . . 146,727 54,186 (709)
$277,706 $85,539 $(1,097)
84
Hawaiian Holdings, Inc.
Notes to Consolidated Financial Statements (Continued)
11. Employee Benefit Plans (Continued)
Defined Contribution Plans
The Company also sponsors separate defined contribution plans for its pilots, flight attendants andground and salaried personnel. Contributions to the Company’s defined contribution plans were$29.4 million, $27.3 million and $25.1 million for the years ended December 31, 2015, 2014 and 2013,respectively.
12. Capital Stock and Share-based Compensation
Common Stock
The Company has one class of common stock issued and outstanding. Each share of common stock isentitled to one vote per share.
No dividends were paid by the Company during the years ended December 31, 2015, 2014 or 2013.Provisions in certain of the Company’s aircraft lease agreements restrict the Company’s ability to paydividends.
Special Preferred Stock
The IAM, AFA, and ALPA each hold one share of Special Preferred Stock, which entitles each unionto nominate one director to the Company’s Board of Directors. In addition, each series of the SpecialPreferred Stock, unless otherwise specified: (i) ranks senior to the Company’s common stock and rankspari passu with each other series of Special Preferred Stock with respect to liquidation, dissolution andwinding up of the Company and will be entitled to receive $0.01 per share before any payments aremade, or assets distributed to holders of any stock ranking junior to the Special Preferred Stock;(ii) has no dividend rights unless a dividend is declared and paid on the Company’s common stock, inwhich case the Special Preferred Stock would be entitled to receive a dividend in an amount per shareequal to two times the dividend per share paid on the common stock; (iii) is entitled to one vote pershare of such series and votes with the common stock as a single class on all matters submitted toholders of the Company’s common stock; and (iv) automatically converts into the Company’s commonstock on a 1:1 basis, at such time as such shares are transferred or such holders are no longer entitledto nominate a representative to the Company’s Board of Directors pursuant to their respectivecollective bargaining agreements.
Share-Based Compensation
Total share-based compensation expense recognized by the Company under ASC 718 was $6.6 million,$6.7 million and $4.6 million for the years ended December 31, 2015, 2014 and 2013, respectively. As ofDecember 31, 2015, $7.2 million of share-based compensation expense related to unvested stockoptions and other stock awards (inclusive of $0.4 million for stock options and other stock awardsgranted to non-employee directors) is attributable to future performance and has not yet beenrecognized. The related expense will be recognized over a weighted average period of approximately0.9 years.
Stock Options
The aggregate intrinsic value of stock options outstanding as of December 31, 2015 and 2014 was$3.1 million and $7.6 million, respectively. The aggregate intrinsic value of stock options exercisable as
85
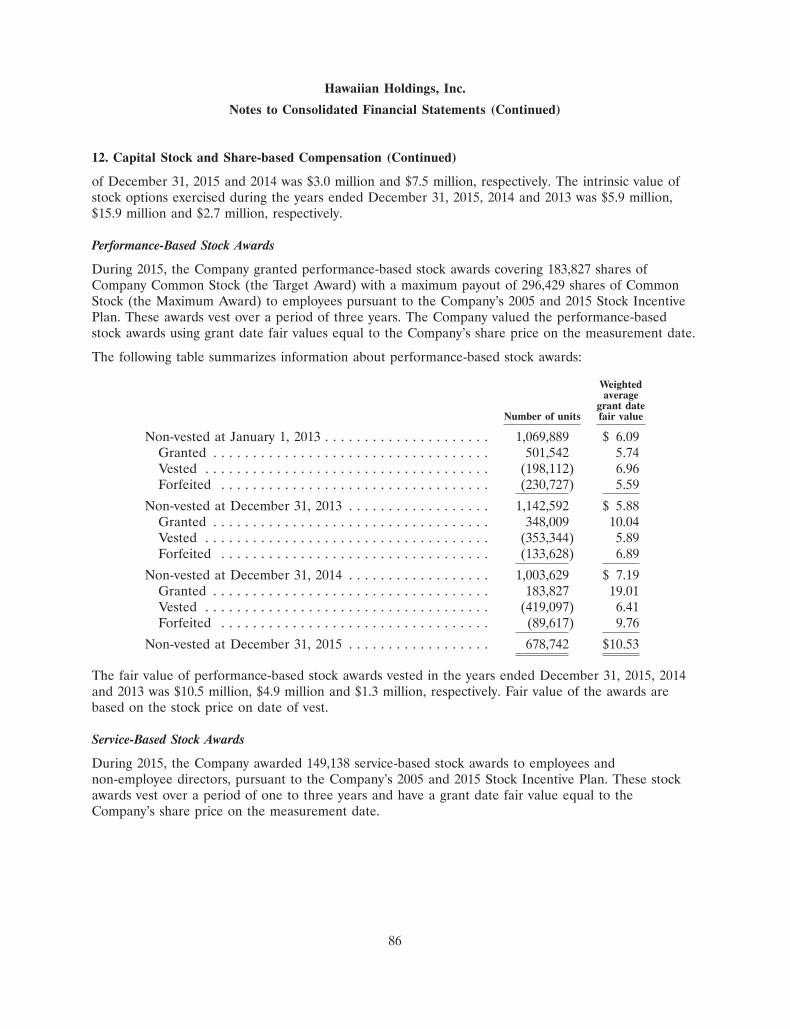
Hawaiian Holdings, Inc.
Notes to Consolidated Financial Statements (Continued)
12. Capital Stock and Share-based Compensation (Continued)
of December 31, 2015 and 2014 was $3.0 million and $7.5 million, respectively. The intrinsic value ofstock options exercised during the years ended December 31, 2015, 2014 and 2013 was $5.9 million,$15.9 million and $2.7 million, respectively.
Performance-Based Stock Awards
During 2015, the Company granted performance-based stock awards covering 183,827 shares ofCompany Common Stock (the Target Award) with a maximum payout of 296,429 shares of CommonStock (the Maximum Award) to employees pursuant to the Company’s 2005 and 2015 Stock IncentivePlan. These awards vest over a period of three years. The Company valued the performance-basedstock awards using grant date fair values equal to the Company’s share price on the measurement date.
The following table summarizes information about performance-based stock awards:
Weightedaverage
grant dateNumber of units fair value
Non-vested at January 1, 2013 . . . . . . . . . . . . . . . . . . . . . 1,069,889 $ 6.09Granted . . . . . . . . . . . . . . . . . . . . . . . . . . . . . . . . . . . 501,542 5.74Vested . . . . . . . . . . . . . . . . . . . . . . . . . . . . . . . . . . . . (198,112) 6.96Forfeited . . . . . . . . . . . . . . . . . . . . . . . . . . . . . . . . . . (230,727) 5.59
Non-vested at December 31, 2013 . . . . . . . . . . . . . . . . . . 1,142,592 $ 5.88Granted . . . . . . . . . . . . . . . . . . . . . . . . . . . . . . . . . . . 348,009 10.04Vested . . . . . . . . . . . . . . . . . . . . . . . . . . . . . . . . . . . . (353,344) 5.89Forfeited . . . . . . . . . . . . . . . . . . . . . . . . . . . . . . . . . . (133,628) 6.89
Non-vested at December 31, 2014 . . . . . . . . . . . . . . . . . . 1,003,629 $ 7.19Granted . . . . . . . . . . . . . . . . . . . . . . . . . . . . . . . . . . . 183,827 19.01Vested . . . . . . . . . . . . . . . . . . . . . . . . . . . . . . . . . . . . (419,097) 6.41Forfeited . . . . . . . . . . . . . . . . . . . . . . . . . . . . . . . . . . (89,617) 9.76
Non-vested at December 31, 2015 . . . . . . . . . . . . . . . . . . 678,742 $10.53
The fair value of performance-based stock awards vested in the years ended December 31, 2015, 2014and 2013 was $10.5 million, $4.9 million and $1.3 million, respectively. Fair value of the awards arebased on the stock price on date of vest.
Service-Based Stock Awards
During 2015, the Company awarded 149,138 service-based stock awards to employees andnon-employee directors, pursuant to the Company’s 2005 and 2015 Stock Incentive Plan. These stockawards vest over a period of one to three years and have a grant date fair value equal to theCompany’s share price on the measurement date.
86
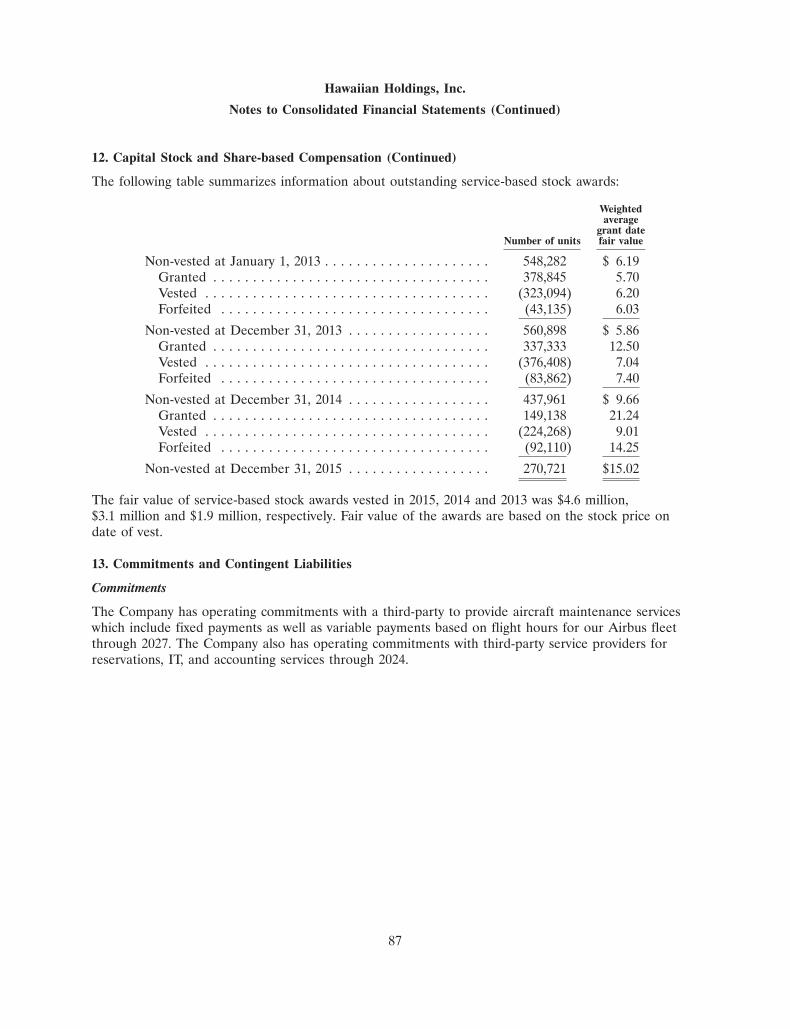
Hawaiian Holdings, Inc.
Notes to Consolidated Financial Statements (Continued)
12. Capital Stock and Share-based Compensation (Continued)
The following table summarizes information about outstanding service-based stock awards:
Weightedaverage
grant dateNumber of units fair value
Non-vested at January 1, 2013 . . . . . . . . . . . . . . . . . . . . . 548,282 $ 6.19Granted . . . . . . . . . . . . . . . . . . . . . . . . . . . . . . . . . . . 378,845 5.70Vested . . . . . . . . . . . . . . . . . . . . . . . . . . . . . . . . . . . . (323,094) 6.20Forfeited . . . . . . . . . . . . . . . . . . . . . . . . . . . . . . . . . . (43,135) 6.03
Non-vested at December 31, 2013 . . . . . . . . . . . . . . . . . . 560,898 $ 5.86Granted . . . . . . . . . . . . . . . . . . . . . . . . . . . . . . . . . . . 337,333 12.50Vested . . . . . . . . . . . . . . . . . . . . . . . . . . . . . . . . . . . . (376,408) 7.04Forfeited . . . . . . . . . . . . . . . . . . . . . . . . . . . . . . . . . . (83,862) 7.40
Non-vested at December 31, 2014 . . . . . . . . . . . . . . . . . . 437,961 $ 9.66Granted . . . . . . . . . . . . . . . . . . . . . . . . . . . . . . . . . . . 149,138 21.24Vested . . . . . . . . . . . . . . . . . . . . . . . . . . . . . . . . . . . . (224,268) 9.01Forfeited . . . . . . . . . . . . . . . . . . . . . . . . . . . . . . . . . . (92,110) 14.25
Non-vested at December 31, 2015 . . . . . . . . . . . . . . . . . . 270,721 $15.02
The fair value of service-based stock awards vested in 2015, 2014 and 2013 was $4.6 million,$3.1 million and $1.9 million, respectively. Fair value of the awards are based on the stock price ondate of vest.
13. Commitments and Contingent Liabilities
Commitments
The Company has operating commitments with a third-party to provide aircraft maintenance serviceswhich include fixed payments as well as variable payments based on flight hours for our Airbus fleetthrough 2027. The Company also has operating commitments with third-party service providers forreservations, IT, and accounting services through 2024.
87
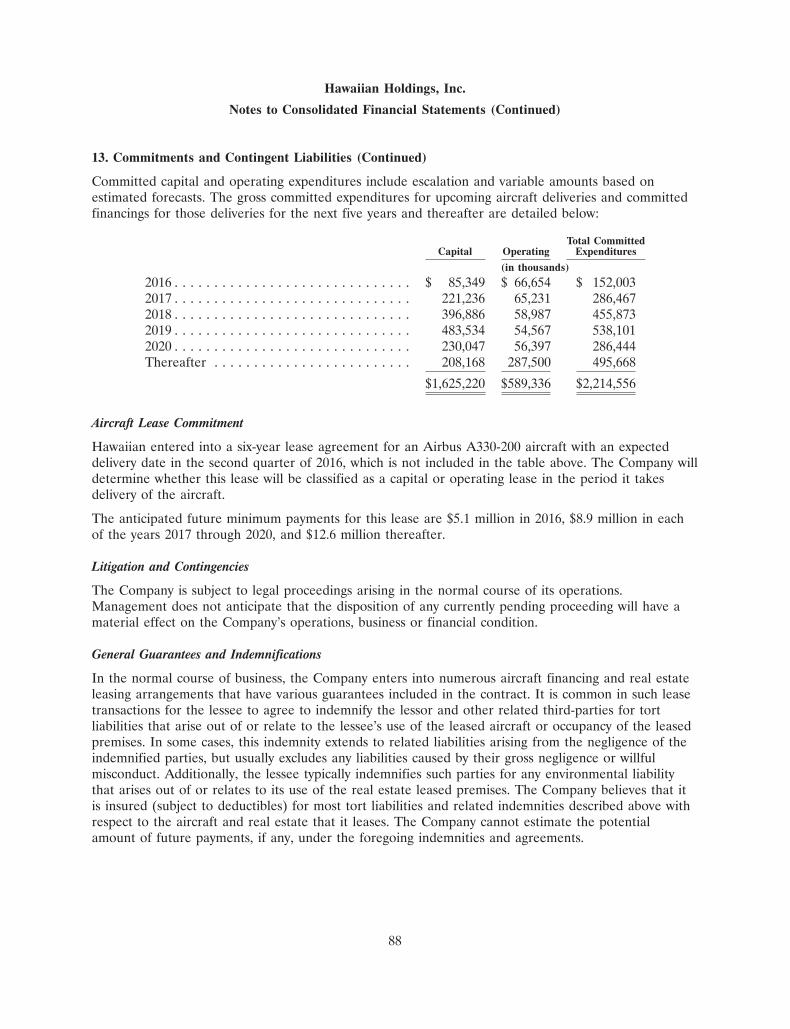
Hawaiian Holdings, Inc.
Notes to Consolidated Financial Statements (Continued)
13. Commitments and Contingent Liabilities (Continued)
Committed capital and operating expenditures include escalation and variable amounts based onestimated forecasts. The gross committed expenditures for upcoming aircraft deliveries and committedfinancings for those deliveries for the next five years and thereafter are detailed below:
Total CommittedCapital Operating Expenditures
(in thousands)
2016 . . . . . . . . . . . . . . . . . . . . . . . . . . . . . . $ 85,349 $ 66,654 $ 152,0032017 . . . . . . . . . . . . . . . . . . . . . . . . . . . . . . 221,236 65,231 286,4672018 . . . . . . . . . . . . . . . . . . . . . . . . . . . . . . 396,886 58,987 455,8732019 . . . . . . . . . . . . . . . . . . . . . . . . . . . . . . 483,534 54,567 538,1012020 . . . . . . . . . . . . . . . . . . . . . . . . . . . . . . 230,047 56,397 286,444Thereafter . . . . . . . . . . . . . . . . . . . . . . . . . 208,168 287,500 495,668
$1,625,220 $589,336 $2,214,556
Aircraft Lease Commitment
Hawaiian entered into a six-year lease agreement for an Airbus A330-200 aircraft with an expecteddelivery date in the second quarter of 2016, which is not included in the table above. The Company willdetermine whether this lease will be classified as a capital or operating lease in the period it takesdelivery of the aircraft.
The anticipated future minimum payments for this lease are $5.1 million in 2016, $8.9 million in eachof the years 2017 through 2020, and $12.6 million thereafter.
Litigation and Contingencies
The Company is subject to legal proceedings arising in the normal course of its operations.Management does not anticipate that the disposition of any currently pending proceeding will have amaterial effect on the Company’s operations, business or financial condition.
General Guarantees and Indemnifications
In the normal course of business, the Company enters into numerous aircraft financing and real estateleasing arrangements that have various guarantees included in the contract. It is common in such leasetransactions for the lessee to agree to indemnify the lessor and other related third-parties for tortliabilities that arise out of or relate to the lessee’s use of the leased aircraft or occupancy of the leasedpremises. In some cases, this indemnity extends to related liabilities arising from the negligence of theindemnified parties, but usually excludes any liabilities caused by their gross negligence or willfulmisconduct. Additionally, the lessee typically indemnifies such parties for any environmental liabilitythat arises out of or relates to its use of the real estate leased premises. The Company believes that itis insured (subject to deductibles) for most tort liabilities and related indemnities described above withrespect to the aircraft and real estate that it leases. The Company cannot estimate the potentialamount of future payments, if any, under the foregoing indemnities and agreements.
88
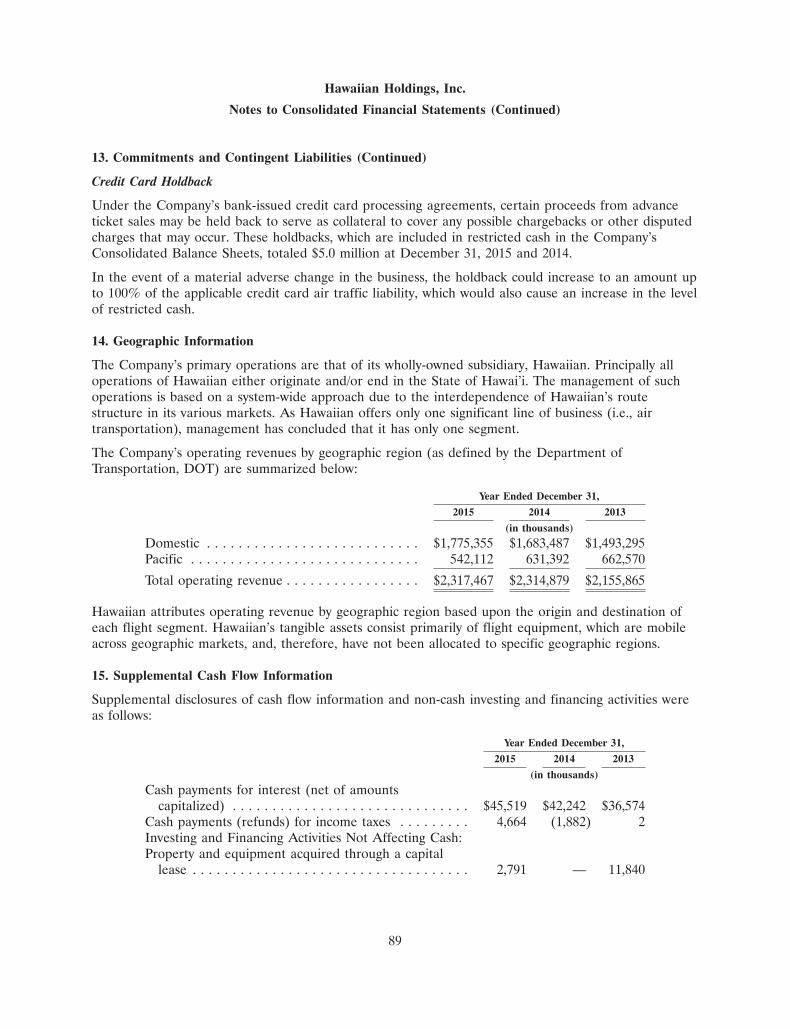
Hawaiian Holdings, Inc.
Notes to Consolidated Financial Statements (Continued)
13. Commitments and Contingent Liabilities (Continued)
Credit Card Holdback
Under the Company’s bank-issued credit card processing agreements, certain proceeds from advanceticket sales may be held back to serve as collateral to cover any possible chargebacks or other disputedcharges that may occur. These holdbacks, which are included in restricted cash in the Company’sConsolidated Balance Sheets, totaled $5.0 million at December 31, 2015 and 2014.
In the event of a material adverse change in the business, the holdback could increase to an amount upto 100% of the applicable credit card air traffic liability, which would also cause an increase in the levelof restricted cash.
14. Geographic Information
The Company’s primary operations are that of its wholly-owned subsidiary, Hawaiian. Principally alloperations of Hawaiian either originate and/or end in the State of Hawai’i. The management of suchoperations is based on a system-wide approach due to the interdependence of Hawaiian’s routestructure in its various markets. As Hawaiian offers only one significant line of business (i.e., airtransportation), management has concluded that it has only one segment.
The Company’s operating revenues by geographic region (as defined by the Department ofTransportation, DOT) are summarized below:
Year Ended December 31,
2015 2014 2013
(in thousands)
Domestic . . . . . . . . . . . . . . . . . . . . . . . . . . . $1,775,355 $1,683,487 $1,493,295Pacific . . . . . . . . . . . . . . . . . . . . . . . . . . . . . 542,112 631,392 662,570
Total operating revenue . . . . . . . . . . . . . . . . . $2,317,467 $2,314,879 $2,155,865
Hawaiian attributes operating revenue by geographic region based upon the origin and destination ofeach flight segment. Hawaiian’s tangible assets consist primarily of flight equipment, which are mobileacross geographic markets, and, therefore, have not been allocated to specific geographic regions.
15. Supplemental Cash Flow Information
Supplemental disclosures of cash flow information and non-cash investing and financing activities wereas follows:
Year Ended December 31,
2015 2014 2013
(in thousands)
Cash payments for interest (net of amountscapitalized) . . . . . . . . . . . . . . . . . . . . . . . . . . . . . . $45,519 $42,242 $36,574
Cash payments (refunds) for income taxes . . . . . . . . . 4,664 (1,882) 2Investing and Financing Activities Not Affecting Cash:Property and equipment acquired through a capital
lease . . . . . . . . . . . . . . . . . . . . . . . . . . . . . . . . . . . 2,791 — 11,840
89
Hawaiian Holdings, Inc.
Notes to Consolidated Financial Statements (Continued)
16. Condensed Consolidating Financial Information
The following condensed consolidating financial information is presented in accordance withRegulation S-X paragraph 210.3-10 because, in connection with the issuance by two pass-through trustsformed by Hawaiian (which is also referred to in this Note 16 as Subsidiary Issuer / Guarantor) ofpass-through certificates, as discussed in Note 8, the Company (which is also referred to in this Note 16as Parent Issuer / Guarantor), is fully and unconditionally guaranteeing the payment obligations ofHawaiian, which is a 100% owned subsidiary of the Company, under equipment notes to be issued byHawaiian to purchase new aircraft.
90
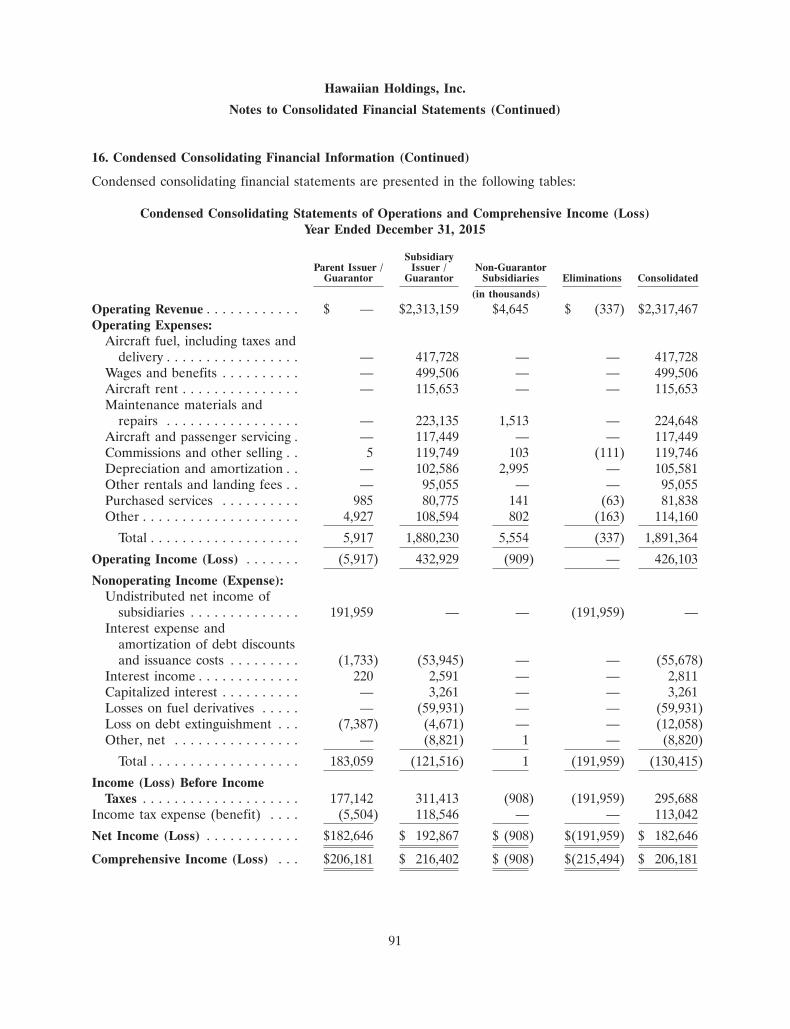
Hawaiian Holdings, Inc.
Notes to Consolidated Financial Statements (Continued)
16. Condensed Consolidating Financial Information (Continued)
Condensed consolidating financial statements are presented in the following tables:
Condensed Consolidating Statements of Operations and Comprehensive Income (Loss)Year Ended December 31, 2015
SubsidiaryParent Issuer / Issuer / Non-Guarantor
Guarantor Guarantor Subsidiaries Eliminations Consolidated
(in thousands)
Operating Revenue . . . . . . . . . . . . $ — $2,313,159 $4,645 $ (337) $2,317,467Operating Expenses:
Aircraft fuel, including taxes anddelivery . . . . . . . . . . . . . . . . . — 417,728 — — 417,728
Wages and benefits . . . . . . . . . . — 499,506 — — 499,506Aircraft rent . . . . . . . . . . . . . . . — 115,653 — — 115,653Maintenance materials and
repairs . . . . . . . . . . . . . . . . . — 223,135 1,513 — 224,648Aircraft and passenger servicing . — 117,449 — — 117,449Commissions and other selling . . 5 119,749 103 (111) 119,746Depreciation and amortization . . — 102,586 2,995 — 105,581Other rentals and landing fees . . — 95,055 — — 95,055Purchased services . . . . . . . . . . 985 80,775 141 (63) 81,838Other . . . . . . . . . . . . . . . . . . . . 4,927 108,594 802 (163) 114,160
Total . . . . . . . . . . . . . . . . . . . 5,917 1,880,230 5,554 (337) 1,891,364
Operating Income (Loss) . . . . . . . (5,917) 432,929 (909) — 426,103
Nonoperating Income (Expense):Undistributed net income of
subsidiaries . . . . . . . . . . . . . . 191,959 — — (191,959) —Interest expense and
amortization of debt discountsand issuance costs . . . . . . . . . (1,733) (53,945) — — (55,678)
Interest income . . . . . . . . . . . . . 220 2,591 — — 2,811Capitalized interest . . . . . . . . . . — 3,261 — — 3,261Losses on fuel derivatives . . . . . — (59,931) — — (59,931)Loss on debt extinguishment . . . (7,387) (4,671) — — (12,058)Other, net . . . . . . . . . . . . . . . . — (8,821) 1 — (8,820)
Total . . . . . . . . . . . . . . . . . . . 183,059 (121,516) 1 (191,959) (130,415)
Income (Loss) Before IncomeTaxes . . . . . . . . . . . . . . . . . . . . 177,142 311,413 (908) (191,959) 295,688
Income tax expense (benefit) . . . . (5,504) 118,546 — — 113,042
Net Income (Loss) . . . . . . . . . . . . $182,646 $ 192,867 $ (908) $(191,959) $ 182,646
Comprehensive Income (Loss) . . . $206,181 $ 216,402 $ (908) $(215,494) $ 206,181
91
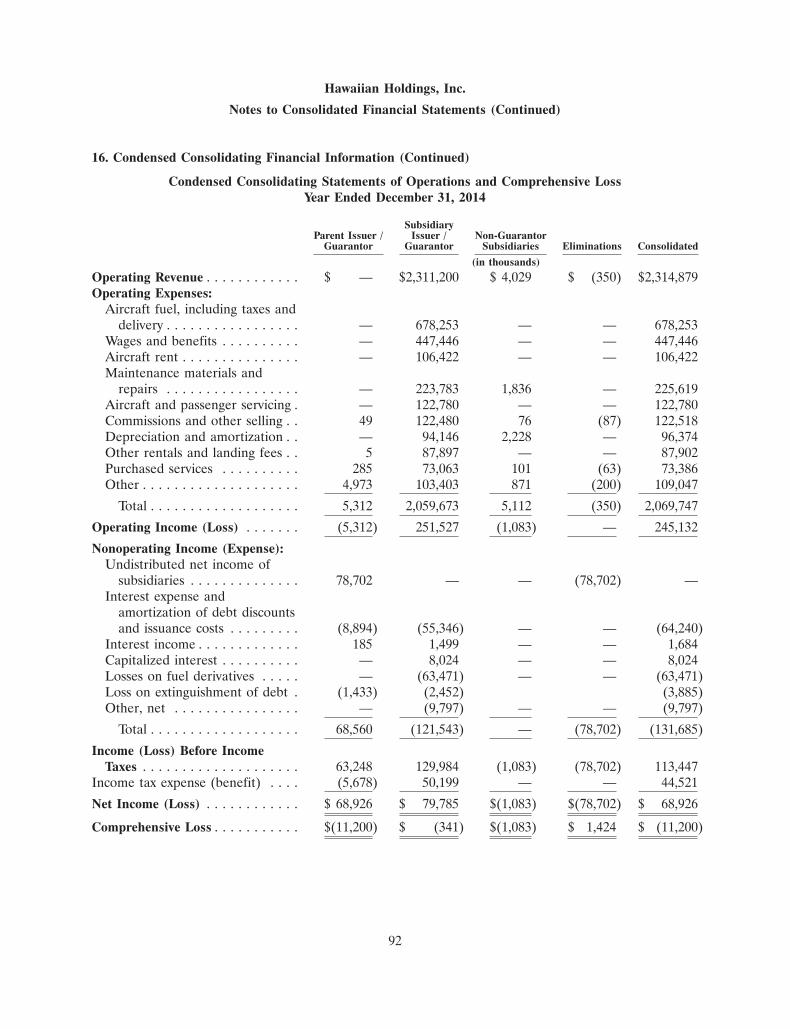
Hawaiian Holdings, Inc.
Notes to Consolidated Financial Statements (Continued)
16. Condensed Consolidating Financial Information (Continued)
Condensed Consolidating Statements of Operations and Comprehensive LossYear Ended December 31, 2014
SubsidiaryParent Issuer / Issuer / Non-Guarantor
Guarantor Guarantor Subsidiaries Eliminations Consolidated
(in thousands)
Operating Revenue . . . . . . . . . . . . $ — $2,311,200 $ 4,029 $ (350) $2,314,879Operating Expenses:
Aircraft fuel, including taxes anddelivery . . . . . . . . . . . . . . . . . — 678,253 — — 678,253
Wages and benefits . . . . . . . . . . — 447,446 — — 447,446Aircraft rent . . . . . . . . . . . . . . . — 106,422 — — 106,422Maintenance materials and
repairs . . . . . . . . . . . . . . . . . — 223,783 1,836 — 225,619Aircraft and passenger servicing . — 122,780 — — 122,780Commissions and other selling . . 49 122,480 76 (87) 122,518Depreciation and amortization . . — 94,146 2,228 — 96,374Other rentals and landing fees . . 5 87,897 — — 87,902Purchased services . . . . . . . . . . 285 73,063 101 (63) 73,386Other . . . . . . . . . . . . . . . . . . . . 4,973 103,403 871 (200) 109,047
Total . . . . . . . . . . . . . . . . . . . 5,312 2,059,673 5,112 (350) 2,069,747
Operating Income (Loss) . . . . . . . (5,312) 251,527 (1,083) — 245,132
Nonoperating Income (Expense):Undistributed net income of
subsidiaries . . . . . . . . . . . . . . 78,702 — — (78,702) —Interest expense and
amortization of debt discountsand issuance costs . . . . . . . . . (8,894) (55,346) — — (64,240)
Interest income . . . . . . . . . . . . . 185 1,499 — — 1,684Capitalized interest . . . . . . . . . . — 8,024 — — 8,024Losses on fuel derivatives . . . . . — (63,471) — — (63,471)Loss on extinguishment of debt . (1,433) (2,452) (3,885)Other, net . . . . . . . . . . . . . . . . — (9,797) — — (9,797)
Total . . . . . . . . . . . . . . . . . . . 68,560 (121,543) — (78,702) (131,685)
Income (Loss) Before IncomeTaxes . . . . . . . . . . . . . . . . . . . . 63,248 129,984 (1,083) (78,702) 113,447
Income tax expense (benefit) . . . . (5,678) 50,199 — — 44,521
Net Income (Loss) . . . . . . . . . . . . $ 68,926 $ 79,785 $(1,083) $(78,702) $ 68,926
Comprehensive Loss . . . . . . . . . . . $(11,200) $ (341) $(1,083) $ 1,424 $ (11,200)
92
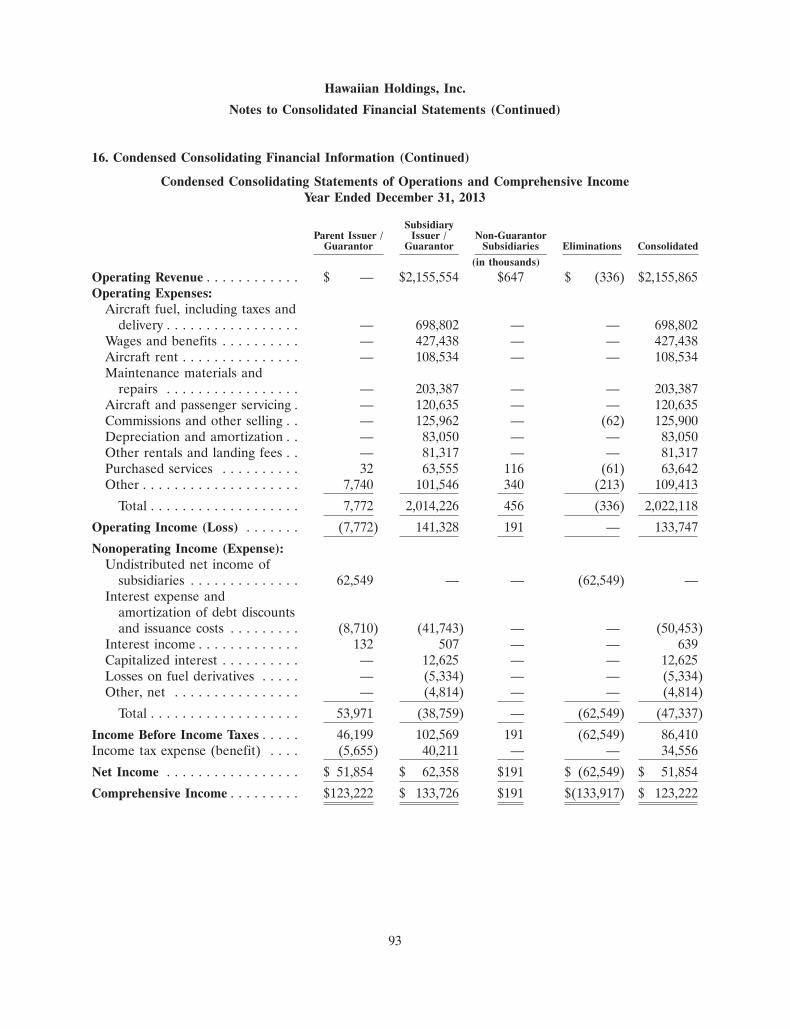
Hawaiian Holdings, Inc.
Notes to Consolidated Financial Statements (Continued)
16. Condensed Consolidating Financial Information (Continued)
Condensed Consolidating Statements of Operations and Comprehensive IncomeYear Ended December 31, 2013
SubsidiaryParent Issuer / Issuer / Non-Guarantor
Guarantor Guarantor Subsidiaries Eliminations Consolidated
(in thousands)
Operating Revenue . . . . . . . . . . . . $ — $2,155,554 $647 $ (336) $2,155,865Operating Expenses:
Aircraft fuel, including taxes anddelivery . . . . . . . . . . . . . . . . . — 698,802 — — 698,802
Wages and benefits . . . . . . . . . . — 427,438 — — 427,438Aircraft rent . . . . . . . . . . . . . . . — 108,534 — — 108,534Maintenance materials and
repairs . . . . . . . . . . . . . . . . . — 203,387 — — 203,387Aircraft and passenger servicing . — 120,635 — — 120,635Commissions and other selling . . — 125,962 — (62) 125,900Depreciation and amortization . . — 83,050 — — 83,050Other rentals and landing fees . . — 81,317 — — 81,317Purchased services . . . . . . . . . . 32 63,555 116 (61) 63,642Other . . . . . . . . . . . . . . . . . . . . 7,740 101,546 340 (213) 109,413
Total . . . . . . . . . . . . . . . . . . . 7,772 2,014,226 456 (336) 2,022,118
Operating Income (Loss) . . . . . . . (7,772) 141,328 191 — 133,747
Nonoperating Income (Expense):Undistributed net income of
subsidiaries . . . . . . . . . . . . . . 62,549 — — (62,549) —Interest expense and
amortization of debt discountsand issuance costs . . . . . . . . . (8,710) (41,743) — — (50,453)
Interest income . . . . . . . . . . . . . 132 507 — — 639Capitalized interest . . . . . . . . . . — 12,625 — — 12,625Losses on fuel derivatives . . . . . — (5,334) — — (5,334)Other, net . . . . . . . . . . . . . . . . — (4,814) — — (4,814)
Total . . . . . . . . . . . . . . . . . . . 53,971 (38,759) — (62,549) (47,337)
Income Before Income Taxes . . . . . 46,199 102,569 191 (62,549) 86,410Income tax expense (benefit) . . . . (5,655) 40,211 — — 34,556
Net Income . . . . . . . . . . . . . . . . . $ 51,854 $ 62,358 $191 $ (62,549) $ 51,854
Comprehensive Income . . . . . . . . . $123,222 $ 133,726 $191 $(133,917) $ 123,222
93
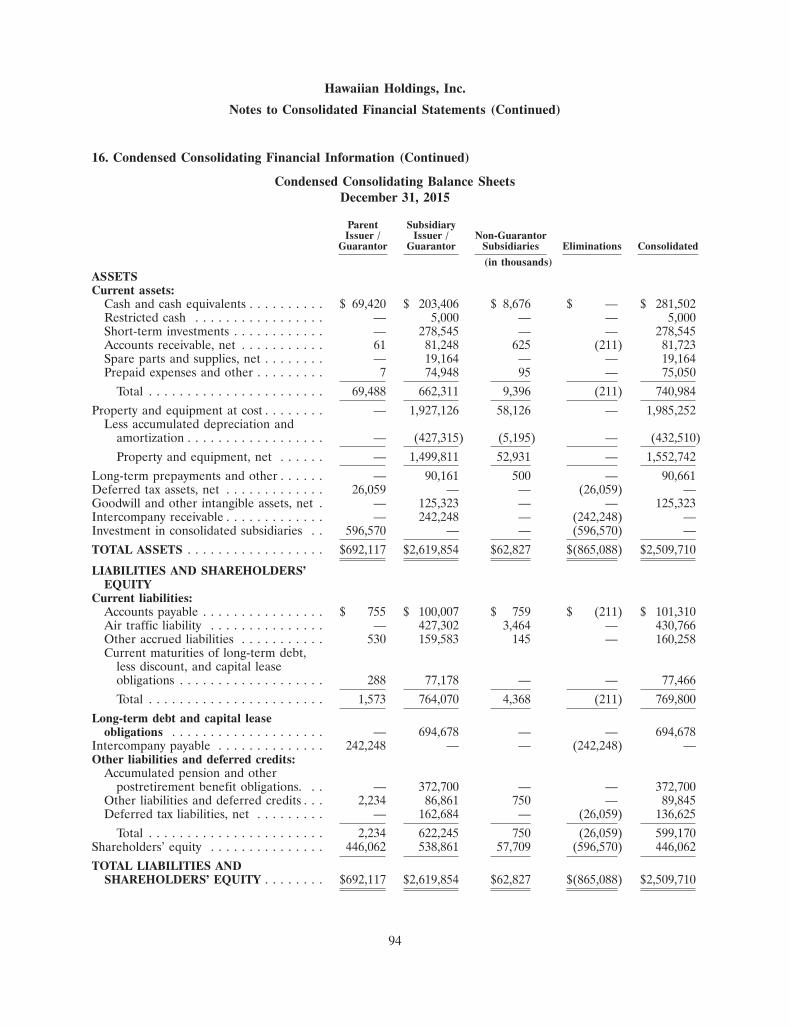
Hawaiian Holdings, Inc.
Notes to Consolidated Financial Statements (Continued)
16. Condensed Consolidating Financial Information (Continued)
Condensed Consolidating Balance SheetsDecember 31, 2015
Parent SubsidiaryIssuer / Issuer / Non-Guarantor
Guarantor Guarantor Subsidiaries Eliminations Consolidated
(in thousands)ASSETSCurrent assets:
Cash and cash equivalents . . . . . . . . . . $ 69,420 $ 203,406 $ 8,676 $ — $ 281,502Restricted cash . . . . . . . . . . . . . . . . . — 5,000 — — 5,000Short-term investments . . . . . . . . . . . . — 278,545 — — 278,545Accounts receivable, net . . . . . . . . . . . 61 81,248 625 (211) 81,723Spare parts and supplies, net . . . . . . . . — 19,164 — — 19,164Prepaid expenses and other . . . . . . . . . 7 74,948 95 — 75,050
Total . . . . . . . . . . . . . . . . . . . . . . . 69,488 662,311 9,396 (211) 740,984
Property and equipment at cost . . . . . . . . — 1,927,126 58,126 — 1,985,252Less accumulated depreciation and
amortization . . . . . . . . . . . . . . . . . . — (427,315) (5,195) — (432,510)
Property and equipment, net . . . . . . — 1,499,811 52,931 — 1,552,742
Long-term prepayments and other . . . . . . — 90,161 500 — 90,661Deferred tax assets, net . . . . . . . . . . . . . 26,059 — — (26,059) —Goodwill and other intangible assets, net . — 125,323 — — 125,323Intercompany receivable . . . . . . . . . . . . . — 242,248 — (242,248) —Investment in consolidated subsidiaries . . 596,570 — — (596,570) —
TOTAL ASSETS . . . . . . . . . . . . . . . . . . $692,117 $2,619,854 $62,827 $(865,088) $2,509,710
LIABILITIES AND SHAREHOLDERS’EQUITY
Current liabilities:Accounts payable . . . . . . . . . . . . . . . . $ 755 $ 100,007 $ 759 $ (211) $ 101,310Air traffic liability . . . . . . . . . . . . . . . — 427,302 3,464 — 430,766Other accrued liabilities . . . . . . . . . . . 530 159,583 145 — 160,258Current maturities of long-term debt,
less discount, and capital leaseobligations . . . . . . . . . . . . . . . . . . . 288 77,178 — — 77,466
Total . . . . . . . . . . . . . . . . . . . . . . . 1,573 764,070 4,368 (211) 769,800
Long-term debt and capital leaseobligations . . . . . . . . . . . . . . . . . . . . — 694,678 — — 694,678
Intercompany payable . . . . . . . . . . . . . . 242,248 — — (242,248) —Other liabilities and deferred credits:
Accumulated pension and otherpostretirement benefit obligations. . . — 372,700 — — 372,700
Other liabilities and deferred credits . . . 2,234 86,861 750 — 89,845Deferred tax liabilities, net . . . . . . . . . — 162,684 — (26,059) 136,625
Total . . . . . . . . . . . . . . . . . . . . . . . 2,234 622,245 750 (26,059) 599,170Shareholders’ equity . . . . . . . . . . . . . . . 446,062 538,861 57,709 (596,570) 446,062
TOTAL LIABILITIES ANDSHAREHOLDERS’ EQUITY . . . . . . . . $692,117 $2,619,854 $62,827 $(865,088) $2,509,710
94
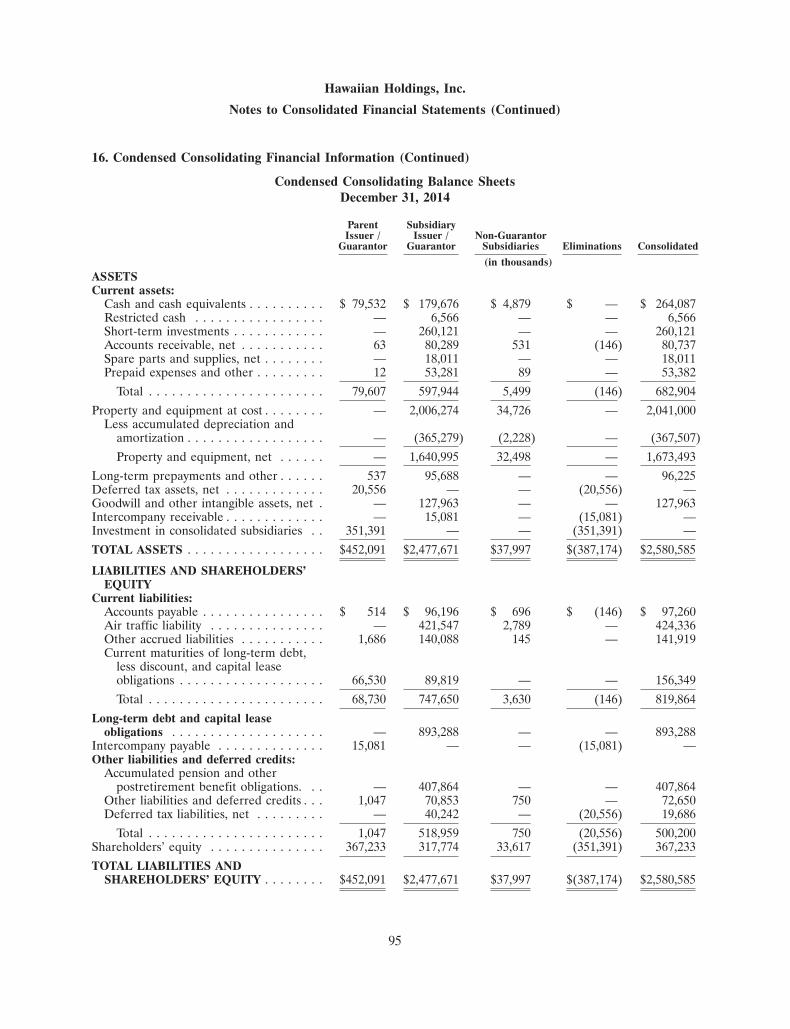
Hawaiian Holdings, Inc.
Notes to Consolidated Financial Statements (Continued)
16. Condensed Consolidating Financial Information (Continued)
Condensed Consolidating Balance SheetsDecember 31, 2014
Parent SubsidiaryIssuer / Issuer / Non-Guarantor
Guarantor Guarantor Subsidiaries Eliminations Consolidated
(in thousands)ASSETSCurrent assets:
Cash and cash equivalents . . . . . . . . . . $ 79,532 $ 179,676 $ 4,879 $ — $ 264,087Restricted cash . . . . . . . . . . . . . . . . . — 6,566 — — 6,566Short-term investments . . . . . . . . . . . . — 260,121 — — 260,121Accounts receivable, net . . . . . . . . . . . 63 80,289 531 (146) 80,737Spare parts and supplies, net . . . . . . . . — 18,011 — — 18,011Prepaid expenses and other . . . . . . . . . 12 53,281 89 — 53,382
Total . . . . . . . . . . . . . . . . . . . . . . . 79,607 597,944 5,499 (146) 682,904
Property and equipment at cost . . . . . . . . — 2,006,274 34,726 — 2,041,000Less accumulated depreciation and
amortization . . . . . . . . . . . . . . . . . . — (365,279) (2,228) — (367,507)
Property and equipment, net . . . . . . — 1,640,995 32,498 — 1,673,493
Long-term prepayments and other . . . . . . 537 95,688 — — 96,225Deferred tax assets, net . . . . . . . . . . . . . 20,556 — — (20,556) —Goodwill and other intangible assets, net . — 127,963 — — 127,963Intercompany receivable . . . . . . . . . . . . . — 15,081 — (15,081) —Investment in consolidated subsidiaries . . 351,391 — — (351,391) —
TOTAL ASSETS . . . . . . . . . . . . . . . . . . $452,091 $2,477,671 $37,997 $(387,174) $2,580,585
LIABILITIES AND SHAREHOLDERS’EQUITY
Current liabilities:Accounts payable . . . . . . . . . . . . . . . . $ 514 $ 96,196 $ 696 $ (146) $ 97,260Air traffic liability . . . . . . . . . . . . . . . — 421,547 2,789 — 424,336Other accrued liabilities . . . . . . . . . . . 1,686 140,088 145 — 141,919Current maturities of long-term debt,
less discount, and capital leaseobligations . . . . . . . . . . . . . . . . . . . 66,530 89,819 — — 156,349
Total . . . . . . . . . . . . . . . . . . . . . . . 68,730 747,650 3,630 (146) 819,864
Long-term debt and capital leaseobligations . . . . . . . . . . . . . . . . . . . . — 893,288 — — 893,288
Intercompany payable . . . . . . . . . . . . . . 15,081 — — (15,081) —Other liabilities and deferred credits:
Accumulated pension and otherpostretirement benefit obligations. . . — 407,864 — — 407,864
Other liabilities and deferred credits . . . 1,047 70,853 750 — 72,650Deferred tax liabilities, net . . . . . . . . . — 40,242 — (20,556) 19,686
Total . . . . . . . . . . . . . . . . . . . . . . . 1,047 518,959 750 (20,556) 500,200Shareholders’ equity . . . . . . . . . . . . . . . 367,233 317,774 33,617 (351,391) 367,233
TOTAL LIABILITIES ANDSHAREHOLDERS’ EQUITY . . . . . . . . $452,091 $2,477,671 $37,997 $(387,174) $2,580,585
95
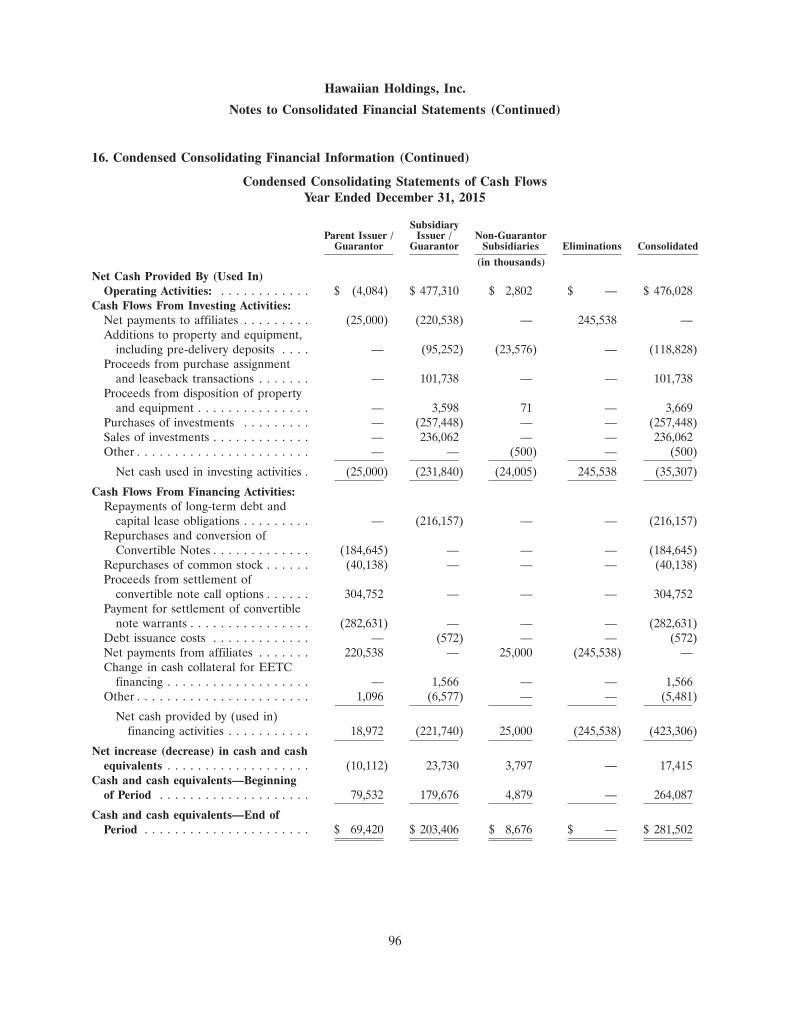
Hawaiian Holdings, Inc.
Notes to Consolidated Financial Statements (Continued)
16. Condensed Consolidating Financial Information (Continued)
Condensed Consolidating Statements of Cash FlowsYear Ended December 31, 2015
SubsidiaryParent Issuer / Issuer / Non-Guarantor
Guarantor Guarantor Subsidiaries Eliminations Consolidated
(in thousands)Net Cash Provided By (Used In)
Operating Activities: . . . . . . . . . . . . $ (4,084) $ 477,310 $ 2,802 $ — $ 476,028Cash Flows From Investing Activities:
Net payments to affiliates . . . . . . . . . (25,000) (220,538) — 245,538 —Additions to property and equipment,
including pre-delivery deposits . . . . — (95,252) (23,576) — (118,828)Proceeds from purchase assignment
and leaseback transactions . . . . . . . — 101,738 — — 101,738Proceeds from disposition of property
and equipment . . . . . . . . . . . . . . . — 3,598 71 — 3,669Purchases of investments . . . . . . . . . — (257,448) — — (257,448)Sales of investments . . . . . . . . . . . . . — 236,062 — — 236,062Other . . . . . . . . . . . . . . . . . . . . . . . — — (500) — (500)
Net cash used in investing activities . (25,000) (231,840) (24,005) 245,538 (35,307)
Cash Flows From Financing Activities:Repayments of long-term debt and
capital lease obligations . . . . . . . . . — (216,157) — — (216,157)Repurchases and conversion of
Convertible Notes . . . . . . . . . . . . . (184,645) — — — (184,645)Repurchases of common stock . . . . . . (40,138) — — — (40,138)Proceeds from settlement of
convertible note call options . . . . . . 304,752 — — — 304,752Payment for settlement of convertible
note warrants . . . . . . . . . . . . . . . . (282,631) — — — (282,631)Debt issuance costs . . . . . . . . . . . . . — (572) — — (572)Net payments from affiliates . . . . . . . 220,538 — 25,000 (245,538) —Change in cash collateral for EETC
financing . . . . . . . . . . . . . . . . . . . — 1,566 — — 1,566Other . . . . . . . . . . . . . . . . . . . . . . . 1,096 (6,577) — — (5,481)
Net cash provided by (used in)financing activities . . . . . . . . . . . 18,972 (221,740) 25,000 (245,538) (423,306)
Net increase (decrease) in cash and cashequivalents . . . . . . . . . . . . . . . . . . . (10,112) 23,730 3,797 — 17,415
Cash and cash equivalents—Beginningof Period . . . . . . . . . . . . . . . . . . . . 79,532 179,676 4,879 — 264,087
Cash and cash equivalents—End ofPeriod . . . . . . . . . . . . . . . . . . . . . . $ 69,420 $ 203,406 $ 8,676 $ — $ 281,502
96
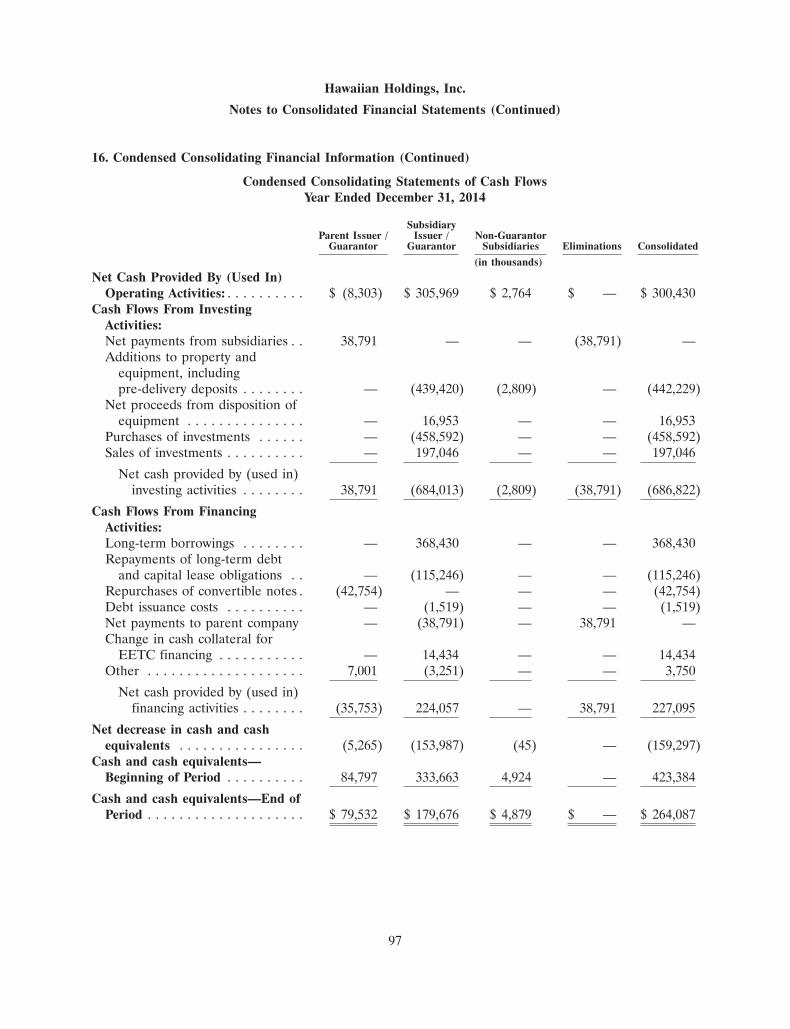
Hawaiian Holdings, Inc.
Notes to Consolidated Financial Statements (Continued)
16. Condensed Consolidating Financial Information (Continued)
Condensed Consolidating Statements of Cash FlowsYear Ended December 31, 2014
SubsidiaryParent Issuer / Issuer / Non-Guarantor
Guarantor Guarantor Subsidiaries Eliminations Consolidated
(in thousands)
Net Cash Provided By (Used In)Operating Activities: . . . . . . . . . . $ (8,303) $ 305,969 $ 2,764 $ — $ 300,430
Cash Flows From InvestingActivities:Net payments from subsidiaries . . 38,791 — — (38,791) —Additions to property and
equipment, includingpre-delivery deposits . . . . . . . . — (439,420) (2,809) — (442,229)
Net proceeds from disposition ofequipment . . . . . . . . . . . . . . . — 16,953 — — 16,953
Purchases of investments . . . . . . — (458,592) — — (458,592)Sales of investments . . . . . . . . . . — 197,046 — — 197,046
Net cash provided by (used in)investing activities . . . . . . . . 38,791 (684,013) (2,809) (38,791) (686,822)
Cash Flows From FinancingActivities:Long-term borrowings . . . . . . . . — 368,430 — — 368,430Repayments of long-term debt
and capital lease obligations . . — (115,246) — — (115,246)Repurchases of convertible notes . (42,754) — — — (42,754)Debt issuance costs . . . . . . . . . . — (1,519) — — (1,519)Net payments to parent company — (38,791) — 38,791 —Change in cash collateral for
EETC financing . . . . . . . . . . . — 14,434 — — 14,434Other . . . . . . . . . . . . . . . . . . . . 7,001 (3,251) — — 3,750
Net cash provided by (used in)financing activities . . . . . . . . (35,753) 224,057 — 38,791 227,095
Net decrease in cash and cashequivalents . . . . . . . . . . . . . . . . (5,265) (153,987) (45) — (159,297)
Cash and cash equivalents—Beginning of Period . . . . . . . . . . 84,797 333,663 4,924 — 423,384
Cash and cash equivalents—End ofPeriod . . . . . . . . . . . . . . . . . . . . $ 79,532 $ 179,676 $ 4,879 $ — $ 264,087
97
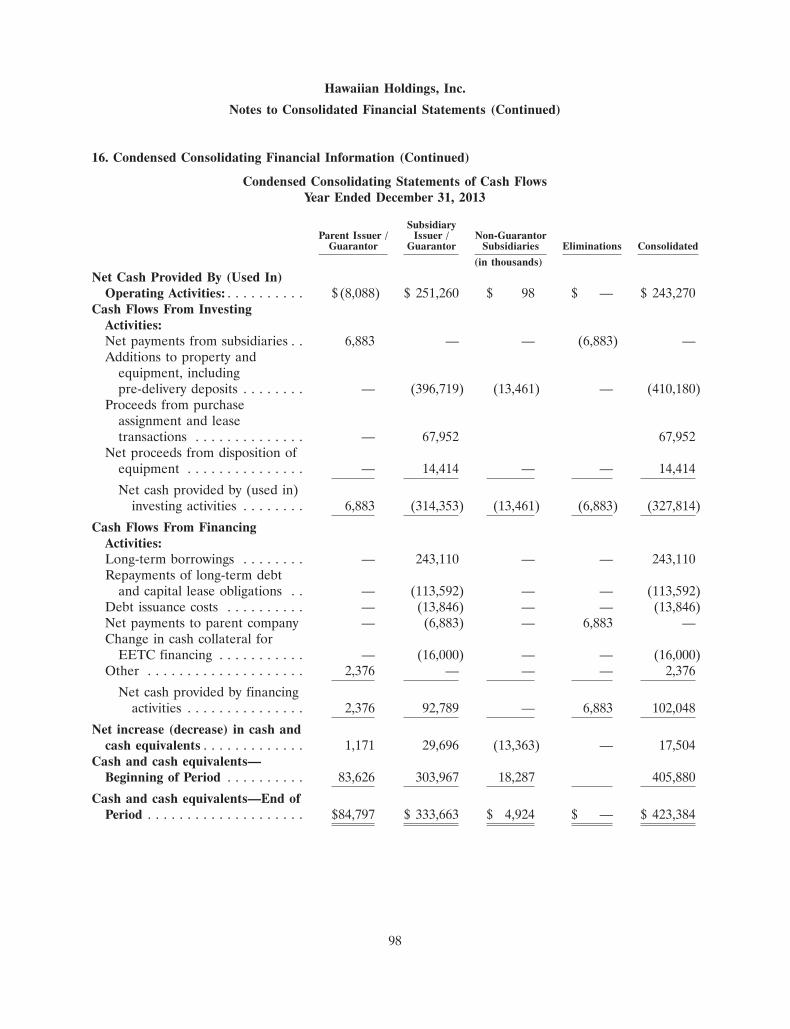
Hawaiian Holdings, Inc.
Notes to Consolidated Financial Statements (Continued)
16. Condensed Consolidating Financial Information (Continued)
Condensed Consolidating Statements of Cash FlowsYear Ended December 31, 2013
SubsidiaryParent Issuer / Issuer / Non-Guarantor
Guarantor Guarantor Subsidiaries Eliminations Consolidated
(in thousands)
Net Cash Provided By (Used In)Operating Activities: . . . . . . . . . . $ (8,088) $ 251,260 $ 98 $ — $ 243,270
Cash Flows From InvestingActivities:Net payments from subsidiaries . . 6,883 — — (6,883) —Additions to property and
equipment, includingpre-delivery deposits . . . . . . . . — (396,719) (13,461) — (410,180)
Proceeds from purchaseassignment and leasetransactions . . . . . . . . . . . . . . — 67,952 67,952
Net proceeds from disposition ofequipment . . . . . . . . . . . . . . . — 14,414 — — 14,414
Net cash provided by (used in)investing activities . . . . . . . . 6,883 (314,353) (13,461) (6,883) (327,814)
Cash Flows From FinancingActivities:Long-term borrowings . . . . . . . . — 243,110 — — 243,110Repayments of long-term debt
and capital lease obligations . . — (113,592) — — (113,592)Debt issuance costs . . . . . . . . . . — (13,846) — — (13,846)Net payments to parent company — (6,883) — 6,883 —Change in cash collateral for
EETC financing . . . . . . . . . . . — (16,000) — — (16,000)Other . . . . . . . . . . . . . . . . . . . . 2,376 — — — 2,376
Net cash provided by financingactivities . . . . . . . . . . . . . . . 2,376 92,789 — 6,883 102,048
Net increase (decrease) in cash andcash equivalents . . . . . . . . . . . . . 1,171 29,696 (13,363) — 17,504
Cash and cash equivalents—Beginning of Period . . . . . . . . . . 83,626 303,967 18,287 405,880
Cash and cash equivalents—End ofPeriod . . . . . . . . . . . . . . . . . . . . $84,797 $ 333,663 $ 4,924 $ — $ 423,384
98
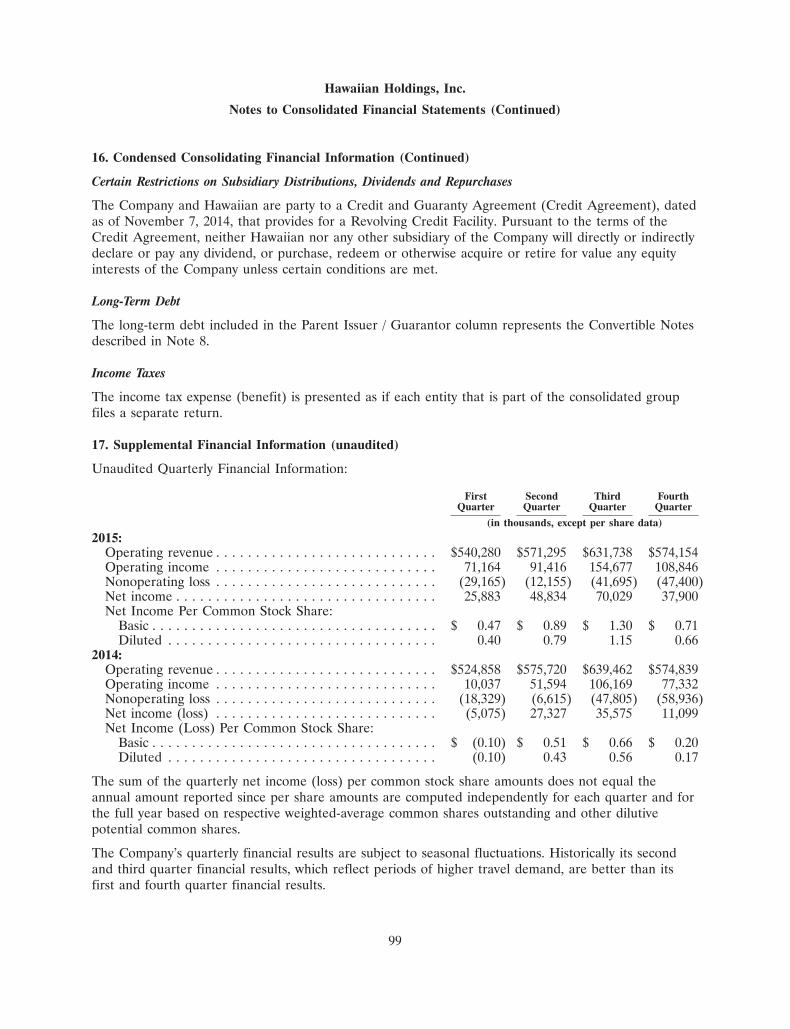
Hawaiian Holdings, Inc.
Notes to Consolidated Financial Statements (Continued)
16. Condensed Consolidating Financial Information (Continued)
Certain Restrictions on Subsidiary Distributions, Dividends and Repurchases
The Company and Hawaiian are party to a Credit and Guaranty Agreement (Credit Agreement), datedas of November 7, 2014, that provides for a Revolving Credit Facility. Pursuant to the terms of theCredit Agreement, neither Hawaiian nor any other subsidiary of the Company will directly or indirectlydeclare or pay any dividend, or purchase, redeem or otherwise acquire or retire for value any equityinterests of the Company unless certain conditions are met.
Long-Term Debt
The long-term debt included in the Parent Issuer / Guarantor column represents the Convertible Notesdescribed in Note 8.
Income Taxes
The income tax expense (benefit) is presented as if each entity that is part of the consolidated groupfiles a separate return.
17. Supplemental Financial Information (unaudited)
Unaudited Quarterly Financial Information:
First Second Third FourthQuarter Quarter Quarter Quarter
(in thousands, except per share data)
2015:Operating revenue . . . . . . . . . . . . . . . . . . . . . . . . . . . . $540,280 $571,295 $631,738 $574,154Operating income . . . . . . . . . . . . . . . . . . . . . . . . . . . . 71,164 91,416 154,677 108,846Nonoperating loss . . . . . . . . . . . . . . . . . . . . . . . . . . . . (29,165) (12,155) (41,695) (47,400)Net income . . . . . . . . . . . . . . . . . . . . . . . . . . . . . . . . . 25,883 48,834 70,029 37,900Net Income Per Common Stock Share:
Basic . . . . . . . . . . . . . . . . . . . . . . . . . . . . . . . . . . . . $ 0.47 $ 0.89 $ 1.30 $ 0.71Diluted . . . . . . . . . . . . . . . . . . . . . . . . . . . . . . . . . . 0.40 0.79 1.15 0.66
2014:Operating revenue . . . . . . . . . . . . . . . . . . . . . . . . . . . . $524,858 $575,720 $639,462 $574,839Operating income . . . . . . . . . . . . . . . . . . . . . . . . . . . . 10,037 51,594 106,169 77,332Nonoperating loss . . . . . . . . . . . . . . . . . . . . . . . . . . . . (18,329) (6,615) (47,805) (58,936)Net income (loss) . . . . . . . . . . . . . . . . . . . . . . . . . . . . (5,075) 27,327 35,575 11,099Net Income (Loss) Per Common Stock Share:
Basic . . . . . . . . . . . . . . . . . . . . . . . . . . . . . . . . . . . . $ (0.10) $ 0.51 $ 0.66 $ 0.20Diluted . . . . . . . . . . . . . . . . . . . . . . . . . . . . . . . . . . (0.10) 0.43 0.56 0.17
The sum of the quarterly net income (loss) per common stock share amounts does not equal theannual amount reported since per share amounts are computed independently for each quarter and forthe full year based on respective weighted-average common shares outstanding and other dilutivepotential common shares.
The Company’s quarterly financial results are subject to seasonal fluctuations. Historically its secondand third quarter financial results, which reflect periods of higher travel demand, are better than itsfirst and fourth quarter financial results.
99
ITEM 9. CHANGES IN AND DISAGREEMENTS WITH ACCOUNTANTS ON ACCOUNTING ANDFINANCIAL DISCLOSURE.
None.
ITEM 9A. CONTROLS AND PROCEDURES.
Management’s Evaluation of Disclosure Controls and Procedures
Our management, including our Chief Executive Officer (CEO) and Chief Financial Officer (CFO),performed an evaluation of our disclosure controls and procedures (as defined in Rules 13a-15(e) and15d-15(e) under the Exchange Act). Based on that evaluation, our management, including our CEOand CFO, concluded that our disclosure controls and procedures were effective as of December 31,2015, and provide reasonable assurance that the information required to be disclosed by the Companyin reports it files under the Securities Exchange Act of 1934, as amended (the Exchange Act), isrecorded, processed, summarized and reported within the time periods specified in the rules and formsof the SEC, and is accumulated and communicated to our management, including our CEO and CFO,to allow timely decisions regarding required disclosure.
Management’s Report on Internal Control over Financial Reporting
Our management is responsible for establishing and maintaining effective internal control over financialreporting as defined in Rules 13a-15(f) and 15d-15(f) under the Exchange Act. Our internal controlover financial reporting is designed to provide reasonable assurance regarding the reliability of financialreporting and the preparation of financial statements for external purposes in accordance with U.S.generally accepted accounting principles.
Under the supervision and with the participation of our management, including our CEO and CFO, anassessment of the effectiveness of our internal control over financial reporting as of December 31, 2015was conducted. In making this assessment, management used the criteria set forth by the Committee ofSponsoring Organizations of the Treadway Commission (COSO) in Internal Control—IntegratedFramework (2013 framework). Based on their assessment, we concluded that, as of December 31, 2015,the Company’s internal control over financial reporting was effective to provide reasonable assuranceregarding the reliability of financial reporting and the preparation of financial statements for externalpurposes in accordance with U.S. generally accepted accounting principles. We reviewed the results ofmanagement’s assessment with the Audit Committee of our Board of Directors.
The effectiveness of our internal control over financial reporting as of December 31, 2015, has beenaudited by Ernst & Young LLP, the independent registered public accounting firm who also has auditedthe Company’s consolidated financial statements included in this Annual Report on Form 10-K.Ernst & Young’s report on the Company’s internal control over financial reporting appears below.
Changes in Internal Control over Financial Reporting
There were no changes in our internal control over financial reporting during the quarter endedDecember 31, 2015 that materially affected, or are reasonably likely to materially affect, our internalcontrol over financial reporting.
Inherent Limitations on Effectiveness of Controls
Our management, including our CEO and CFO, does not expect that our disclosure controls or ourinternal control over financial reporting will prevent or detect all error and all fraud. A control system,no matter how well designed and operated, can provide only reasonable, not absolute, assurance thatthe control system’s objectives will be met. The design of a control system must reflect the fact thatthere are resource constraints, and the benefits of controls must be considered relative to their costs.
100
Further, because of the inherent limitations in all control systems, no evaluation of controls can provideabsolute assurance that misstatements due to error or fraud will not occur or that all control issues andinstances of fraud, if any, have been detected. These inherent limitations include the realities thatjudgments in decision-making can be faulty and that breakdowns can occur because of simple error ormistake. Controls can also be circumvented by the individual acts of some persons, by collusion of twoor more people, or by management override of the controls. The design of any system of controls isbased in part on certain assumptions about the likelihood of future events, and there can be noassurance that any design will succeed in achieving its stated goals under all potential future conditions.Projections of any evaluation of controls effectiveness to future periods are subject to risks. Over time,controls may become inadequate because of changes in conditions or deterioration in the degree ofcompliance with policies or procedures.
101
Report of Independent Registered Public Accounting Firm
The Board of Directors and Stockholders of Hawaiian Holdings, Inc.
We have audited Hawaiian Holdings, Inc.’s internal control over financial reporting as of December 31,2015, based on criteria established in Internal Control—Integrated Framework issued by the Committeeof Sponsoring Organizations of the Treadway Commission (2013 framework) (the COSO criteria).Hawaiian Holdings, Inc.’s management is responsible for maintaining effective internal control overfinancial reporting, and for its assessment of the effectiveness of internal control over financialreporting included in the accompanying Management’s Report on Internal Control over FinancialReporting. Our responsibility is to express an opinion on the company’s internal control over financialreporting based on our audit.
We conducted our audit in accordance with the standards of the Public Company Accounting OversightBoard (United States). Those standards require that we plan and perform the audit to obtainreasonable assurance about whether effective internal control over financial reporting was maintainedin all material respects. Our audit included obtaining an understanding of internal control overfinancial reporting, assessing the risk that a material weakness exists, testing and evaluating the designand operating effectiveness of internal control based on the assessed risk, and performing such otherprocedures as we considered necessary in the circumstances. We believe that our audit provides areasonable basis for our opinion.
A company’s internal control over financial reporting is a process designed to provide reasonableassurance regarding the reliability of financial reporting and the preparation of financial statements forexternal purposes in accordance with generally accepted accounting principles. A company’s internalcontrol over financial reporting includes those policies and procedures that (1) pertain to themaintenance of records that, in reasonable detail, accurately and fairly reflect the transactions anddispositions of the assets of the company; (2) provide reasonable assurance that transactions arerecorded as necessary to permit preparation of financial statements in accordance with generallyaccepted accounting principles, and that receipts and expenditures of the company are being made onlyin accordance with authorizations of management and directors of the company; and (3) providereasonable assurance regarding prevention or timely detection of unauthorized acquisition, use ordisposition of the company’s assets that could have a material effect on the financial statements.
Because of its inherent limitations, internal control over financial reporting may not prevent or detectmisstatements. Also, projections of any evaluation of effectiveness to future periods are subject to therisk that controls may become inadequate because of changes in conditions, or that the degree ofcompliance with the policies or procedures may deteriorate.
In our opinion, Hawaiian Holdings, Inc. maintained, in all material respects, effective internal controlover financial reporting as of December 31, 2015, based on the COSO criteria.
We also have audited, in accordance with the standards of the Public Company Accounting OversightBoard (United States), the consolidated balance sheets of Hawaiian Holdings, Inc. as of December 31,2015 and 2014 and the related consolidated statements of operations, comprehensive income,shareholders’ equity, and cash flows for each of the three years in the period ended December 31, 2015of Hawaiian Holdings, Inc. and our report dated February 8, 2016 expressed an unqualified opinionthereon.
/s/ ERNST & YOUNG LLP
Honolulu, Hawai’iFebruary 8, 2016
102
ITEM 9B. OTHER INFORMATION.
None.
PART III
ITEM 10. DIRECTORS, EXECUTIVE OFFICERS AND CORPORATE GOVERNANCE.
The information required by this item is incorporated herein by reference from our definitive proxystatement relating to our 2016 Annual Meeting of Stockholders.
ITEM 11. EXECUTIVE COMPENSATION.
The information required by this item is incorporated herein by reference from our definitive proxystatement relating to our 2016 Annual Meeting of Stockholders.
ITEM 12. SECURITY OWNERSHIP OF CERTAIN BENEFICIAL OWNERS AND MANAGEMENTAND RELATED STOCKHOLDER MATTERS.
The information required by this item is incorporated herein by reference from our definitive proxystatement relating to our 2016 Annual Meeting of Stockholders.
ITEM 13. CERTAIN RELATIONSHIPS AND RELATED TRANSACTIONS, AND DIRECTORINDEPENDENCE.
The information required by this item is incorporated herein by reference from our definitive proxystatement relating to our 2016 Annual Meeting of Stockholders.
ITEM 14. PRINCIPAL ACCOUNTANT FEES AND SERVICES.
The information required by this item is incorporated herein by reference from our definitive proxystatement relating to our 2016 Annual Meeting of Stockholders.
PART IV
ITEM 15. EXHIBITS, FINANCIAL STATEMENT SCHEDULES.
(a) Financial Statements and Financial Statement Schedules:
(1) Financial Statements of Hawaiian Holdings, Inc.
i. Report of Ernst & Young LLP, Independent Registered Public Accounting Firm.
ii. Consolidated Statements of Operations for the Years ended December 31, 2015, 2014 and2013.
iii. Consolidated Statements of Comprehensive Income, December 31, 2015, 2014 and 2013.
iv. Consolidated Balance Sheets, December 31, 2015 and 2014.
v. Consolidated Statements of Shareholders’ Equity Years ended December 31, 2015, 2014and 2013.
vi. Consolidated Statements of Cash Flows for the Years ended December 31, 2015, 2014and 2013.
vii. Notes to Consolidated Financial Statements.
103
(2) Schedule of Valuation and Qualifying Accounts of Hawaiian Holdings, Inc.
The information required by Schedule I, ‘‘Condensed Financial Information of Registrant’’ hasbeen provided in Note 16 to the consolidated financial statements. All other schedules have beenomitted because they are not required.
(b) Exhibits:
2.1 Third Amended Joint Plan of Reorganization of Joshua Gotbaum, as Chapter 11 Trusteefor Hawaiian Airlines, Inc., the Official Committee of Unsecured Creditors, HHIC, Inc.,Hawaiian Holdings, Inc., and RC Aviation, LLC, dated as of March 11, 2005 (filed asExhibit 2.01 to the Form 8-K filed by Hawaiian Holdings, Inc. on June 7, 2005).*
2.2 Order Confirming Third Amended Joint Plan of Joshua Gotbaum, as Chapter 11 Trusteefor Hawaiian Airlines, The Official Committee of Unsecured Creditors, HHIC, Inc., theCompany and RC Aviation, dated as of March 11, 2005, as amended (filed as Exhibit 2.02to the Form 8-K filed by Hawaiian Holdings, Inc. on June 7, 2005).*
3.1 Amended and Restated Certificate of Incorporation of Hawaiian Holdings, Inc. (filed asExhibit 3.1 to the Form S-1, File No. 333-129503, filed by Hawaiian Holdings, Inc. onNovember 7, 2005).*
3.2 Amended Bylaws of Hawaiian Holdings, Inc. (filed as Exhibit 3.2 to the Form 10-Q filedby Hawaiian Holdings, Inc. on November 7, 2007).*
4.1 Indenture, dated March 23, 2011, between Hawaiian Holdings, Inc. and U.S. BankNational Association, as trustee (filed as Exhibit 4.1 to the Form 8-K filed by HawaiianHoldings, Inc. on March 23, 2011).*
4.2 Supplemental Indenture, dated March 23, 2011, between Hawaiian Holdings, Inc. andU.S. Bank National Association, as trustee (filed as Exhibit 4.2 to the Form 8-K filed byHawaiian Holdings, Inc. on March 23, 2011).*
4.3 Form of 5.00% Senior Convertible Note due 2016 (filed as Exhibit 4.3 to the Form 8-Kfiled by Hawaiian Holdings, Inc. on March 23, 2011 and incorporated by reference toExhibit 4.2 thereto).*
10.1 Form of Hawaiian Holdings, Inc. Stock Option Agreement for certain employees andexecutive officers (filed as Exhibit 10.14 to the Form 10-K filed by HawaiianHoldings, Inc. on February 25, 2009).*+
10.2 Form of Hawaiian Holdings, Inc. Restricted Stock Agreement for certain employees andexecutive officers (filed as Exhibit 10.15 to the Form 10-K filed by HawaiianHoldings, Inc. on February 25, 2009).*+
10.3 Form of Hawaiian Holdings, Inc. Restricted Stock Unit Award Agreement for certainemployees and executive officers (filed as Exhibit 10.15.2 to the Form 10-K filed byHawaiian Holdings, Inc. on February 11, 2011).*+
10.4 Form of Hawaiian Holdings, Inc. Performance-Based Restricted Stock Unit AwardAgreement for certain employees and executive officers (filed as Exhibit 10.15.3 to theForm 10-K filed by Hawaiian Holdings, Inc. on February 11, 2011).*+
10.5 Form of Hawaiian Holdings, Inc. Deferred Stock Unit Agreement for certain employeesand executive officers (filed as Exhibit 10.16 to the Form 10-K filed by HawaiianHoldings, Inc. on February 25, 2009).*+
104
10.6 Form of Hawaiian Holdings, Inc. Award Agreement for directors (filed as Exhibit 10.17 tothe Form 10-K filed by Hawaiian Holdings, Inc. on February 25, 2009).*+
10.7 Hawaiian Holdings, Inc. 2005 Stock Incentive Plan (incorporated by reference to theRegistrant’s Definitive Proxy Statement on Schedule 14A as filed with the Commission onMarch 26, 2010, File No. 001-31443).*+
10.8 Hawaiian Holdings, Inc. 2006 Management Incentive Plan (filed as Exhibit 10.1 to theForm 8-K filed by Hawaiian Holdings, Inc. on June 6, 2006.*+
10.9 Amended and Restated Mark B. Dunkerley Employment Agreement, dated as ofNovember 15, 2012, by and between Mark B. Dunkerley and each of HawaiianHoldings, Inc. and its wholly-owned subsidiary Hawaiian Airlines, Inc. (filed asExhibit 10.1 to the Form 8-K filed by Hawaiian Holdings, Inc. on November 21, 2012).*+
10.10 Employment Agreement, dated as of November 18, 2005, between Hawaiian Airlines, Inc.and Peter R. Ingram (filed as Exhibit 10.24 to the Form 10-K filed by HawaiianHoldings, Inc. on March 23, 2006).*+
10.10.1 First Amendment to Employment Agreement, dated as of November 2008, by andbetween Peter R. Ingram and Hawaiian Airlines, Inc. (filed as Exhibit 10.23 to theForm 10-K filed by Hawaiian Holdings, Inc. on February 26, 2009).*+
10.10.2 Second Amendment to Employment Agreement, dated as of April 6, 2009, by andbetween Peter R. Ingram and Hawaiian Airlines, Inc. (filed as Exhibit 10.1 to theForm 10-Q filed by Hawaiian Holdings, Inc. on April 30, 2009).*+
10.11 Employment Agreement, dated as of July 11, 2005, between Hawaiian Airlines, Inc. andBarbara Falvey (filed as Exhibit 10.1 to the Form 10-Q filed by Hawaiian Holdings, Inc.on May 9, 2007).*+
10.11.1 First Amendment to Employment Agreement, dated as of April 6, 2009, betweenHawaiian Airlines, Inc. and Barbara Falvey (filed as Exhibit 10.2 to the Form 10-Q filedby Hawaiian Holdings, Inc. on April 30, 2009).*+
10.12 Form of Hawaiian Holdings, Inc. Indemnification Agreement for directors and executiveofficers (filed as Exhibit 10.25 to the Form 10-K filed by Hawaiian Holdings, Inc. onFebruary 11, 2011).*+
10.13 Form of Executive Severance Agreement for executive officers (filed as Exhibit 10.1 to theForm 10-Q filed by Hawaiian Holdings, Inc. on October 25, 2012).*+
10.14 Airbus A330/A350XWB Purchase Agreement, dated as of January 31, 2008, betweenAirbus S.A.S. and Hawaiian Airlines, Inc. (filed as Exhibit 10.52 to the Form 10-K filed byHawaiian Holdings, Inc. on March 3, 2008 in redacted form since confidential treatmenthas been granted for certain provisions thereof pursuant to Rule 24b-2 of the SecuritiesExchange Act of 1934, as amended).*‡
10.14.1 Amendment No. 1 to the Airbus A330/A350XWB Purchase Agreement dated as ofJanuary 31, 2008 between Airbus S.A.S. and Hawaiian Airlines, Inc. (filed as Exhibit 10.1to the Form 10-Q filed by Hawaiian Holdings, Inc. on August 6, 2008 in redacted formsince confidential treatment has been granted for certain provisions thereof pursuant toRule 24b-2 of the Securities Exchange Act of 1934, as amended).*‡
10.14.2 Amendment No. 2 to the Airbus A330/A350XWB Purchase Agreement dated as ofJanuary 31, 2008 between Airbus S.A.S. and Hawaiian Airlines, Inc. (filed as Exhibit 10.2to the Form 10-Q filed by Hawaiian Holdings, Inc. on April 27, 2010).*
105
10.14.3 Amendment No. 3 to the Airbus A330/A350XWB Purchase Agreement dated as ofJanuary 31, 2008 between Airbus S.A.S. and Hawaiian Airlines, Inc. (filed as Exhibit 10.3to the Form 10-Q filed by Hawaiian Holdings, Inc. on April 27, 2010 in redacted formsince confidential treatment has been granted for certain provisions thereof pursuant toRule 24b-2 of the Securities Exchange Act of 1934, as amended).*‡
10.14.4 Amendment No. 4 to the Airbus A330/A350XWB Purchase Agreement dated as ofJanuary 31, 2008 between Airbus S.A.S. and Hawaiian Airlines, Inc. (filed asExhibit 10.44.3 to the Form 10-K filed by Hawaiian Holdings, Inc. on February 11, 2011 inredacted form since confidential treatment has been granted for certain provisions thereofpursuant to Rule 24b-2 of the Securities Exchange Act of 1934, as amended).*‡
10.14.5 Amendment No. 5 to the Airbus A330/A350XWB Purchase Agreement dated as ofJanuary 31, 2008 between Airbus S.A.S. and Hawaiian Airlines, Inc. (filed asExhibit 10.44.4 to the Form 10-K filed by Hawaiian Holdings, Inc. on February 11, 2011 inredacted form since confidential treatment has been granted for certain provisions thereofpursuant to Rule 24b-2 of the Securities Exchange Act of 1934, as amended).*‡
10.14.6 Amendment No. 6 to the Airbus A330/A350XWB Purchase Agreement dated as ofJanuary 31, 2008 between Airbus S.A.S. and Hawaiian Airlines, Inc. (filed asExhibit 10.44.5 to the Form 10-K filed by Hawaiian Holdings, Inc. on February 9, 2012 inredacted form since confidential treatment has been granted for certain provisions thereofpursuant to Rule 24b-2 of the Securities Exchange Act of 1934, as amended).*‡
10.14.7 Amendment No. 7 to the Airbus A330/A350XWB Purchase Agreement dated as ofJanuary 31, 2008 between Airbus S.A.S. and Hawaiian Airlines, Inc. (filed as Exhibit 10.2to the Form 10-Q filed by Hawaiian Holdings, Inc. on July 26, 2012 in redacted formsince confidential treatment has been granted for certain provisions thereof pursuant toRule 24b-2 of the Securities Exchange Act of 1934, as amended).*‡
10.14.8 Amendment No. 8 to the Airbus A330/A350XWB Purchase Agreement dated as ofJanuary 31, 2008 between Airbus S.A.S. and Hawaiian Airlines, Inc.‡
10.14.9 Amendment No. 9 to the Airbus A330/A350XWB Purchase Agreement dated as ofJanuary 31, 2008 between Airbus S.A.S. and Hawaiian Airlines, Inc.‡
10.14.10 Amended and Restated Letter Agreement No. 3 to the Airbus A330/A350XWB PurchaseAgreement dated as of January 31, 2008 between Airbus S.A.S. and HawaiianAirlines, Inc. (filed as Exhibit 10.44.5 to the Form 10-K filed by Hawaiian Holdings, Inc.on February 11, 2011 in redacted form since confidential treatment has been granted forcertain provisions thereof pursuant to Rule 24b-2 of the Securities Exchange Act of 1934,as amended).*‡
106
10.15 General Terms Agreement, dated as of October 27, 2008, between Rolls- Royce PLC,Rolls-Royce TotalCare Services Limited and Hawaiian Airlines, Inc., relating to thepurchase of Trent 772B engines (the Rolls-Royce Agreement) (filed as Exhibit 10.47 tothe Form 10-K filed by Hawaiian Holdings, Inc. on February 26, 2009 in redacted formpursuant to a request for confidential treatment for certain provisions thereof pursuant toRule 24b-2 of the Securities Exchange Act of 1934, as amended). Hawaiian Airlines, Inc.also entered into an Agreement, dated as of October 27, 2008, between Rolls-Royce PLC, Rolls-Royce TotalCare Services Limited and Hawaiian Airlines, Inc. relatingto the purchase of Trent XWB engines, the terms of which are substantially identical tothe terms contained in the Rolls-Royce Agreement, except with respect to engineidentification information and specifications, delivery dates and certain other informationas to which Hawaiian Airlines, Inc. has requested confidential treatment and pursuant toRegulation S-K Item 601, Instruction 2, this agreement was not filed.*‡
10.15.1 Amendment #1 to General Terms Agreement by and between Rolls- Royce PLC, Rolls-Royce TotalCare Services Limited and Hawaiian Airlines, Inc. dated October 27, 2008(filed as Exhibit 10.10 to the Form 10-Q filed by Hawaiian Holdings, Inc. on April 26,2011 in redacted form since confidential treatment has been granted for certain provisionsthereof pursuant to Rule 24b-2 of the Securities Exchange Act of 1934, as amended).*‡
10.15.2 Amendment #2 to General Terms Agreement by and between Rolls- Royce PLC, Rolls-Royce TotalCare Services Limited and Hawaiian Airlines, Inc. dated October 27, 2008(filed as Exhibit 10.11 to the Form 10-Q filed by Hawaiian Holdings, Inc. on April 26,2011 in redacted form since confidential treatment has been granted for certain provisionsthereof pursuant to Rule 24b-2 of the Securities Exchange Act of 1934, as amended).*‡
10.15.3 Amendment #3 to General Terms Agreement by and between Rolls- Royce PLC, Rolls-Royce TotalCare Services Limited and Hawaiian Airlines, Inc. dated October 27, 2008(filed as Exhibit 10.48.2 to the Form 10-K filed by Hawaiian Holdings, Inc. on February 9,2012 in redacted form since confidential treatment has been granted for certain provisionsthereof pursuant to Rule 24b-2 of the Securities Exchange Act of 1934, as amended).*‡
10.15.4 Amendment #4 to General Terms Agreement by and between Rolls- Royce PLC, Rolls-Royce TotalCare Services Limited and Hawaiian Airlines, Inc. dated October 27, 2008.‡
10.15.5 Amendment #5 to General Terms Agreement by and between Rolls- Royce PLC, Rolls-Royce TotalCare Services Limited and Hawaiian Airlines, Inc. dated October 27, 2008.‡
10.15.6 Amendment #6 to General Terms Agreement by and between Rolls- Royce PLC, Rolls-Royce TotalCare Services Limited and Hawaiian Airlines, Inc. dated October 27, 2008.‡
10.15.7 Amendment #7 to General Terms Agreement by and between Rolls- Royce PLC, Rolls-Royce TotalCare Services Limited and Hawaiian Airlines, Inc. dated October 27, 2008.‡
10.15.8 Amendment #8 to General Terms Agreement by and between Rolls- Royce PLC, Rolls-Royce TotalCare Services Limited and Hawaiian Airlines, Inc. dated October 27, 2008.‡
10.16 Amendment #1 to the Side Letter Agreement Number One to General Terms Agreementby and between Rolls-Royce PLC, Rolls-Royce TotalCare Services Limited and HawaiianAirlines, Inc. dated October 27, 2008 (filed as Exhibit 10.12 to the Form 10-Q/A filed byHawaiian Holdings, Inc. on July 21, 2011).*‡
107
10.16.1 Amendment #2 to the Side Letter Agreement Number One to General Terms Agreementby and between Rolls-Royce PLC, Rolls-Royce TotalCare Services Limited and HawaiianAirlines, Inc. dated October 27, 2008 (filed as Exhibit 10.49.1 to the Form 10-K filed byHawaiian Holdings, Inc. on February 9, 2012 in redacted form since confidential treatmenthas been granted for certain provisions thereof pursuant to Rule 24b-2 of the SecuritiesExchange Act of 1934, as amended).*‡
10.17 Amendment No. 1 to Lease Agreement (Aircraft No. 2), dated as of November 10, 2008,between Pegasus Aviation Finance Company and Hawaiian Airlines, Inc. (filed asExhibit 10.49 to the Form 10-K filed by Hawaiian Holdings, Inc. on February 26, 2009 inredacted form pursuant to a request for confidential treatment for certain provisionsthereof pursuant to Rule 24b-2 of the Securities Exchange Act of 1934, as amended).*‡
10.18 Amendment Number One to Aircraft Lease Agreement, dated as of November 10, 2008,between C.I.T. Leasing Corporation and Hawaiian Airlines, Inc. (filed as Exhibit 10.50 tothe Form 10-K filed by Hawaiian Holdings, Inc. on February 26, 2009 in redacted formpursuant to a request for confidential treatment for certain provisions thereof pursuant toRule 24b-2 of the Securities Exchange Act of 1934, as amended).*‡
10.19 Complete Fleet Services Agreement, dated as of December 14, 2009, between Delta AirLines, Inc. and Hawaiian Airlines, Inc. (filed as Exhibit 10.1 to the Form 10-Q filed byHawaiian Holdings, Inc. on April 27, 2010).*
10.20 Loan Agreement [1217], dated as of April 6, 2011, by and among Hawaiian Airlines, Inc.;Natixis as administrative agent; Wells Fargo Bank Northwest, National Association, not inits individual capacity, except as expressly stated therein, as security trustee; LandesbankHessen- Thuringen Girozentrale, KfW IPEX-Bank GmbH and Natixis Transport Finance,as joint lead arrangers; and any additional lenders from time to time party thereto (filedas Exhibit 10.1 to the Form 10-Q filed by Hawaiian Holdings, Inc. on July 27, 2011 inredacted form since confidential treatment has been granted for certain provisions thereofpursuant to Rule 24b-2 of the Securities Exchange Act of 1934, as amended). HawaiianAirlines, Inc. also entered into Loan Agreement [1295], dated as of June 29, 2011 by andamong Landesbank Hessen-Thuringen Girozentrale, as administrative agent; Wells FargoBank Northwest, National Association, not in its individual capacity, except as expresslystated therein, as security trustee; Landesbank Hessen- Thuringen Girozentrale, KfWIPEX-Bank GmbH and Natixis Transport Finance, as lenders; and any additional lendersfrom time to time party thereto, which loan agreement is substantially identical to LoanAgreement [1217], except with respect to total principal amount and certain otherinformation as to which Hawaiian Airlines, Inc. has been granted confidential treatment,and pursuant to Regulation S-K Item 601, Instruction 2, this loan agreement was notfiled.*‡
10.21 Purchase Agreement, dated as of June 27, 2011, by and among Wells Fargo BankNorthwest, National Association, solely as owner trustee of trusts beneficially owned byBCC Equipment Leasing Corporation and MDFC Spring Company, and HawaiianAirlines, Inc. (filed as Exhibit 10.2 to the Form 10-Q filed by Hawaiian Holdings, Inc. onJuly 27, 2011 in redacted form since confidential treatment has been granted for certainprovisions thereof pursuant to Rule 24b-2 of the Securities Exchange Act of 1934, asamended).*‡
108
10.22 Facility Agreement [Hawaiian 717-200 [55001]], dated as of June 27, 2011 by and betweenHawaiian Airlines, Inc. and Boeing Capital Loan Corporation (filed as Exhibit 10.3 to theForm 10-Q/A filed by Hawaiian Holdings, Inc. on December 14, 2011 in redacted formsince confidential treatment has been granted for certain provisions thereof pursuant toRule 24b-2 of the Securities Exchange Act of 1934, as amended). Hawaiian Airlines, Inc.also entered into Facility Agreement [Hawaiian 717-200 [55002]], dated as of June 27,2011; Facility Agreement [Hawaiian 717-200 [55118]], dated as of June 27, 2011; FacilityAgreement [Hawaiian 717-200 [55121]], dated as of June 27, 2011; Facility Agreement[Hawaiian 717-200 [55122]], dated as of June 27, 2011; Facility Agreement[Hawaiian 717-200 [55123]], dated as of June 27, 2011; Facility Agreement[Hawaiian 717-200 [55124]], dated as of June 27, 2011; Facility Agreement[Hawaiian 717-200 [55125]], dated as of June 27, 2011; Facility Agreement[Hawaiian 717-200 [55126]], dated as of June 27, 2011; Facility Agreement[Hawaiian 717-200 [55128]], dated as of June 27, 2011; Facility Agreement[Hawaiian 717-200 [55129]], dated as of June 27, 2011; Facility Agreement[Hawaiian 717-200 [55130]], dated as of June 27, 2011; Facility Agreement[Hawaiian 717-200 [55131]], dated as of June 27, 2011; Facility Agreement[Hawaiian 717-200 [55132]], dated as of June 27, 2011; and Facility Agreement[Hawaiian 717-200 [55151]], dated as of June 27, 2011, which facility agreements aresubstantially identical to Facility Agreement 55001, and pursuant to Regulation S-KItem 601, Instruction 2, these facility agreements were not filed.*‡
10.23 Lease Agreement 491HA, dated as of June 28, 2011, by and between Wells Fargo BankNorthwest, National Association, a national banking association organized under the lawsof the United States of America, not in its individual capacity, but solely as owner trusteeof a trust beneficially owned by BCC Equipment Leasing Corporation, and HawaiianAirlines, Inc. (filed as Exhibit 10.5 to Form 10-Q/A filed by Hawaiian Holdings, Inc. onDecember 14, 2011 in redacted form since confidential treatment has been granted forcertain provisions thereof pursuant to Rule 24b-2 of the Securities Exchange Act of 1934,as amended). Hawaiian Airlines, Inc. also entered into Lease Agreement 492HA, dated asof June 28, 2011; and Lease Agreement 493HA, dated as of June 28, 2011, which leaseagreements are substantially identical to Lease Agreement 491HA, and pursuant toRegulation S-K Item 601, Instruction 2, these lease agreements were not filed.*‡
10.24 Facility Agreement [Hawaiian A330 [1259]], dated as of June 29, 2011, by and amongHawaiian Airlines, Inc.; Bank of Utah, as security trustee; and each of NorddeutscheLandesbank Girozentrale and BNP Paribas, as loan participants (filed as Exhibit 10.6 tothe Form 10-Q/A filed by Hawaiian Holdings, Inc. on December 14, 2011 in redactedform since confidential treatment has been granted for certain provisions thereof pursuantto Rule 24b-2 of the Securities Exchange Act of 1934, as amended). HawaiianAirlines, Inc. also entered into Facility Agreement [Hawaiian A330 [1302]], dated as ofJune 29, 2011, which facility agreement is substantially identical to Facility Agreement[Hawaiian A330 [1259]], except with respect to certain information as to which HawaiianAirlines, Inc. has been granted confidential treatment, and pursuant to Regulation S-KItem 601, Instruction 2, this facility agreement was not filed.*‡
10.25 Contract Services Agreement, dated as of June 29, 2011, by and between HawaiianAirlines, Inc. and Airline Contract Maintenance and Equipment, Inc. (filed as Exhibit 10.7to the Form 10-Q filed by Hawaiian Holdings, Inc. on July 27, 2011 in redacted formsince confidential treatment has been granted for certain provisions thereof pursuant toRule 24b-2 of the Securities Exchange Act of 1934, as amended).*‡
109
10.26 Type A Restricted Stock Unit Award Agreement, dated as of February 7, 2013, by andbetween Mark B. Dunkerley and Hawaiian Holdings, Inc. (filed as Exhibit 10.2 toform 10-Q filed by Hawaiian Holdings, Inc. on April 25, 2013).*+
10.27 Type B Restricted Stock Unit Award Agreement, dated as of February 7, 2013, by andbetween Mark B. Dunkerley and Hawaiian Holdings, Inc. (filed as Exhibit 10.3 toform 10-Q filed by Hawaiian Holdings, Inc. on April 25, 2013).*+
10.28 Airbus A320 Family Purchase Agreement, dated as of March 18, 2013, betweenAirbus S.A.S. and Hawaiian Airlines, Inc. (filed as Exhibit 10.1 to Form 10-Q/A filed byHawaiian Holdings, Inc. on October 17, 2013 in redacted form pursuant to a request forconfidential treatment for certain provisions thereof pursuant to Rule 24b-2 of theSecurities Exchange Act of 1934, as amended).*‡
10.28.1 Amendment #1 to Airbus A320 Family Purchase Agreement, dated as of March 18, 2013,between Airbus S.A.S. and Hawaiian Airlines, Inc.‡
10.28.2 Amendment #2 to Airbus A320 Family Purchase Agreement, dated as of March 18, 2013,between Airbus S.A.S. and Hawaiian Airlines, Inc.‡
10.29 Pass Through Trust Agreement, dated May 29, 2013, between Hawaiian Airlines, Inc. andWilmington Trust, National Association, as trustee (filed as Exhibit 4.1to the Form 8-Kfiled by Hawaiian Holdings, Inc. on May 31, 2013).*
10.30 Trust Supplement No. 2013-1A-O, dated as of May 29, 2013, between Wilmington Trust,National Association, as Trustee, and Hawaiian Airlines, Inc. to Pass Through TrustAgreement, dated as of May 29, 2013 (filed as Exhibit 4.2 to the Form 8-K filed byHawaiian Holdings, Inc. on May 31, 2013).*
10.31 Trust Supplement No. 2013-1A-S, dated as of May 29, 2013, between Wilmington Trust,National Association, as Trustee, and Hawaiian Airlines, Inc. to Pass Through TrustAgreement, dated as of May 29, 2013 (filed as Exhibit 4.3 to the Form 8-K filed byHawaiian Holdings, Inc. on May 31, 2013).*
10.32 Trust Supplement No. 2013-1B-O, dated as of May 29, 2013, between Wilmington Trust,National Association, as Trustee, and Hawaiian Airlines, Inc. to Pass Through TrustAgreement, dated as of May 29, 2013 (filed as Exhibit 4.4 to the Form 8-K filed byHawaiian Holdings, Inc. on May 31, 2013).*
10.33 Trust Supplement No. 2013-1B-S, dated as of May 29, 2013, between Wilmington Trust,National Association, as Trustee, and Hawaiian Airlines, Inc. to Pass Through TrustAgreement, dated as of May 29, 2013 (filed as Exhibit 4.5 to the Form 8-K filed byHawaiian Holdings, Inc. on May 31, 2013).*
10.34 Revolving Credit Agreement (2013-1A), dated as of May 29, 2013, between WilmingtonTrust, National Association, as subordination agent, as agent and trustee, and as borrower,and Natixis S.A., acting via its New York Branch, as liquidity provider (filed as Exhibit 4.6to the Form 8-K filed by Hawaiian Holdings, Inc. on May 31, 2013).*
10.35 Revolving Credit Agreement (2013-1B), dated as of May 29, 2013, between WilmingtonTrust, National Association, as subordination agent, as agent and trustee, and as borrower,and Natixis S.A., acting via its New York Branch, as liquidity provider (filed as Exhibit 4.7to the Form 8-K filed by Hawaiian Holdings, Inc. on May 31, 2013).*
110
10.36 Intercreditor Agreement, dated as of May 29, 2013, among Wilmington Trust, NationalAssociation, as trustee, Natixis S.A., acting via its New York Branch, as liquidity provider,and Wilmington Trust, National Association, as subordination agent and trustee (filed asExhibit 4.8 to the Form 8-K filed by Hawaiian Holdings, Inc. on May 31, 2013).*
10.37 Deposit Agreement (Class A), dated as of May 29, 2013, between Wells Fargo BankNorthwest, National Association, as escrow agent, and Natixis S.A., acting via its NewYork Branch, as depositary (filed as Exhibit 4.9 to the Form 8-K filed by HawaiianHoldings, Inc. on May 31, 2013).*
10.38 Deposit Agreement (Class B), dated as of May 29, 2013, between Wells Fargo BankNorthwest, National Association, as escrow agent, and Natixis S.A., acting via its NewYork Branch, as depositary (filed as Exhibit 4.10 to the Form 8-K filed by HawaiianHoldings, Inc. on May 31, 2013).*
10.39 Escrow and Paying Agent Agreement (Class A), dated as of May 29, 2013, among WellsFargo Bank Northwest, National Association, as escrow agent, Citigroup GlobalMarkets Inc., Goldman, Sachs & Co. and Morgan Stanley & Co. LLC, for themselves andon behalf of the several Underwriters of the Certificates, Wilmington Trust, NationalAssociation, as trustee, and Wilmington Trust, National Association, as paying agent (filedas Exhibit 4.11 to the Form 8-K filed by Hawaiian Holdings, Inc. on May 31, 2013).*
10.40 Escrow and Paying Agent Agreement (Class B), dated as of May 29, 2013, among WellsFargo Bank Northwest, National Association, as escrow agent, Citigroup GlobalMarkets Inc., Goldman, Sachs & Co. and Morgan Stanley & Co. LLC, for themselves andon behalf of the several Underwriters of the Certificates, Wilmington Trust, NationalAssociation, as trustee, and Wilmington Trust, National Association, as paying agent (filedas Exhibit 4.12 to the Form 8-K filed by Hawaiian Holdings, Inc. on May 31, 2013).*
10.41 Note Purchase Agreement, dated as of May 29, 2013, among Hawaiian Airlines, Inc.,Wilmington Trust, National Association, as trustee, Wilmington Trust, NationalAssociation, as subordination agent, Wells Fargo Bank Northwest, National Association, asescrow agent, and Wilmington Trust, National Association, as paying agent (filed as theExhibit 4.13 to the Form 8-K filed by Hawaiian Holdings, Inc. on May 31, 2013).*
10.42 Form of Participation Agreement (Participation Agreement between HawaiianAirlines, Inc. and Wilmington Trust, National Association, as mortgagee, subordinationagent and trustee) (Exhibit B to Note Purchase Agreement) (filed as Exhibit 4.14 to theForm 8-K filed by Hawaiian Holdings, Inc. on May 31, 2013).*
10.43 Form of Indenture (Trust Indenture and Mortgage between Hawaiian Airlines, Inc. andWilmington Trust, National Association, as mortgagee and securities intermediary)(Exhibit C to Note Purchase Agreement) (filed Exhibit 4.15 to the Form 8-K filed byHawaiian Holdings, Inc. on May 31, 2013).*
10.44 Form of Hawaiian Airlines Pass Through Certificate, Series 2013-1A-O (filed asExhibit 4.16 to the Form 8-K filed by Hawaiian Holdings, Inc. on May 31, 2013).*
10.45 Form of Hawaiian Airlines Pass Through Certificate, Series 2013-1B-O (filed asExhibit 4.17 to the Form 8-K filed by Hawaiian Holdings, Inc. on May 31, 2013).*
10.46 Agreement dated December 11, 2013 by and among Hawaiian Holdings, Inc., HirzelCapital Management LLC and Zac S. Hirzel. (filed as Exhibit 10.1 to the form 8-K filedby Hawaiian Holdings, Inc. on December 11, 2013).*
111
10.47 Credit and Guaranty Agreement dated as of November 7, 2014 among HawaiianAirlines, Inc., Hawaiian Holdings, Inc., certain other subsidiaries of Hawaiian Holdings,Inc, the lenders party thereto and Citibank, N.A.‡
10.48 General Terms Agreement, dated as of December 17, 2014, between Rolls-Royce PLC,Rolls-Royce TotalCare Services Limited and Hawaiian Airlines, Inc. for Trent 7000Engines.‡
10.49 Hawaiian Holdings, Inc. 2015 Stock Incentive Plan (filed as Exhibit 10.1 to the Form 8-Kfiled by Hawaiian Holdings, Inc. on May 12, 2015).*+
10.50 Form of Hawaiian Holdings, Inc. Restricted Stock Unit Agreement (filed as Exhibit 10.2to the Form 8-K filed by Hawaiian Holdings, Inc. on May 28, 2015).*+
10.51 Form of Hawaiian Holdings, Inc. Performance Restricted Stock Unit Agreement (filed asExhibit 10.3 to the Form 8-K filed by Hawaiian Holdings, Inc. on May 28, 2015).*+
10.52 Form of Hawaiian Holdings, Inc. Stock Option Agreement (filed as Exhibit 10.4 to theForm 8-K filed by Hawaiian Holdings, Inc. on May 28, 2015).*+
12 Computation of ratio of earnings to fixed charges for the years ended December 31, 2015,2014, 2013, 2012, and 2011.
21.1 List of Subsidiaries of Hawaiian Holdings, Inc.
23.1 Consent of Ernst & Young LLP.
31.1 Rule 13a-14(a) Certification of Chief Executive Officer.
31.2 Rule 13a-14(a) Certification of Chief Financial Officer.
32.1 Certification of Chief Executive Officer pursuant to 18 U.S.C. Section 1350, as adoptedpursuant to Section 906 of the Sarbanes-Oxley Act of 2002.
32.2 Certification of Chief Financial Officer pursuant to 18 U.S.C. Section 1350, as adoptedpursuant to Section 906 of the Sarbanes-Oxley Act of 2002.
101.INS XBRL Instance Document.
101.SCH XBRL Taxonomy Extension Schema Document
101.CAL XBRL Taxonomy Extension Valuation Linkbase Document.
101.DEF XBRL Taxonomy Extension Definition Linkbase Document.
101.LAB XBRL Taxonomy Extension Label Linkbase Document.
101.PRE XBRL Taxonomy Extension Presentation Linkbase Document.
+ These exhibits relate to management contracts or compensatory plans or arrangements.
* Previously filed; incorporated herein by reference.
‡ Confidential treatment has been requested for a portion of this exhibit.
112
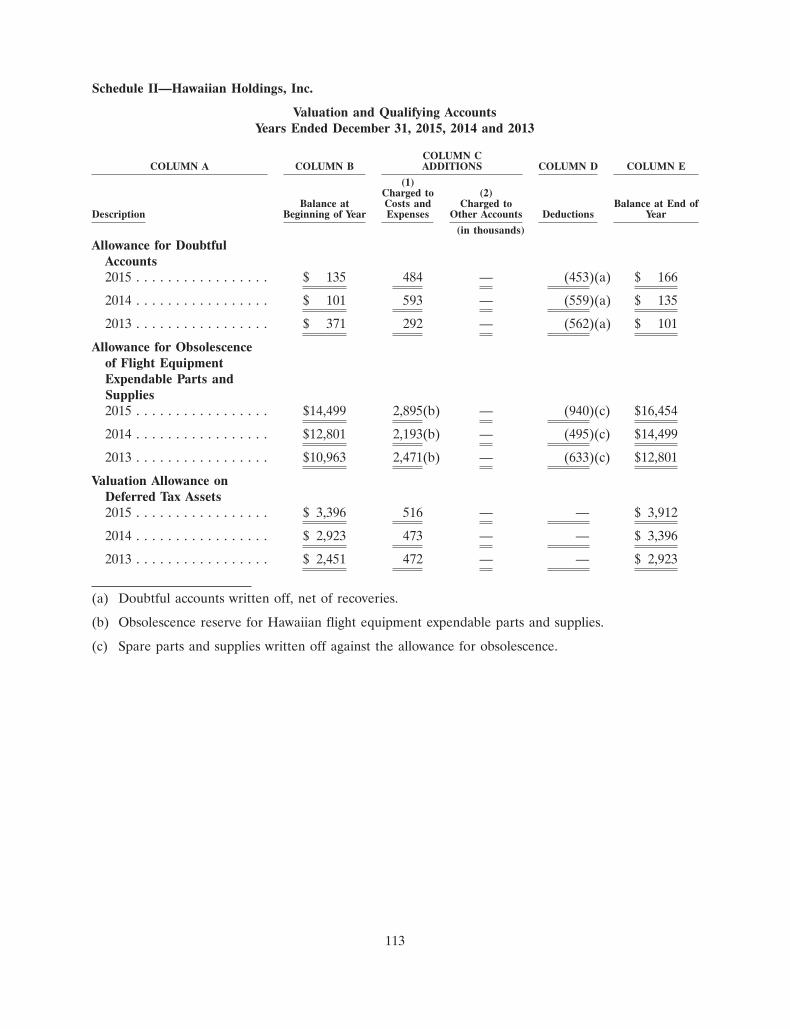
Schedule II—Hawaiian Holdings, Inc.
Valuation and Qualifying AccountsYears Ended December 31, 2015, 2014 and 2013
COLUMN CCOLUMN A COLUMN B ADDITIONS COLUMN D COLUMN E
(1)Charged to (2)
Balance at Costs and Charged to Balance at End ofDescription Beginning of Year Expenses Other Accounts Deductions Year
(in thousands)
Allowance for DoubtfulAccounts2015 . . . . . . . . . . . . . . . . . $ 135 484 — (453)(a) $ 166
2014 . . . . . . . . . . . . . . . . . $ 101 593 — (559)(a) $ 135
2013 . . . . . . . . . . . . . . . . . $ 371 292 — (562)(a) $ 101
Allowance for Obsolescenceof Flight EquipmentExpendable Parts andSupplies2015 . . . . . . . . . . . . . . . . . $14,499 2,895(b) — (940)(c) $16,454
2014 . . . . . . . . . . . . . . . . . $12,801 2,193(b) — (495)(c) $14,499
2013 . . . . . . . . . . . . . . . . . $10,963 2,471(b) — (633)(c) $12,801
Valuation Allowance onDeferred Tax Assets2015 . . . . . . . . . . . . . . . . . $ 3,396 516 — — $ 3,912
2014 . . . . . . . . . . . . . . . . . $ 2,923 473 — — $ 3,396
2013 . . . . . . . . . . . . . . . . . $ 2,451 472 — — $ 2,923
(a) Doubtful accounts written off, net of recoveries.
(b) Obsolescence reserve for Hawaiian flight equipment expendable parts and supplies.
(c) Spare parts and supplies written off against the allowance for obsolescence.
113
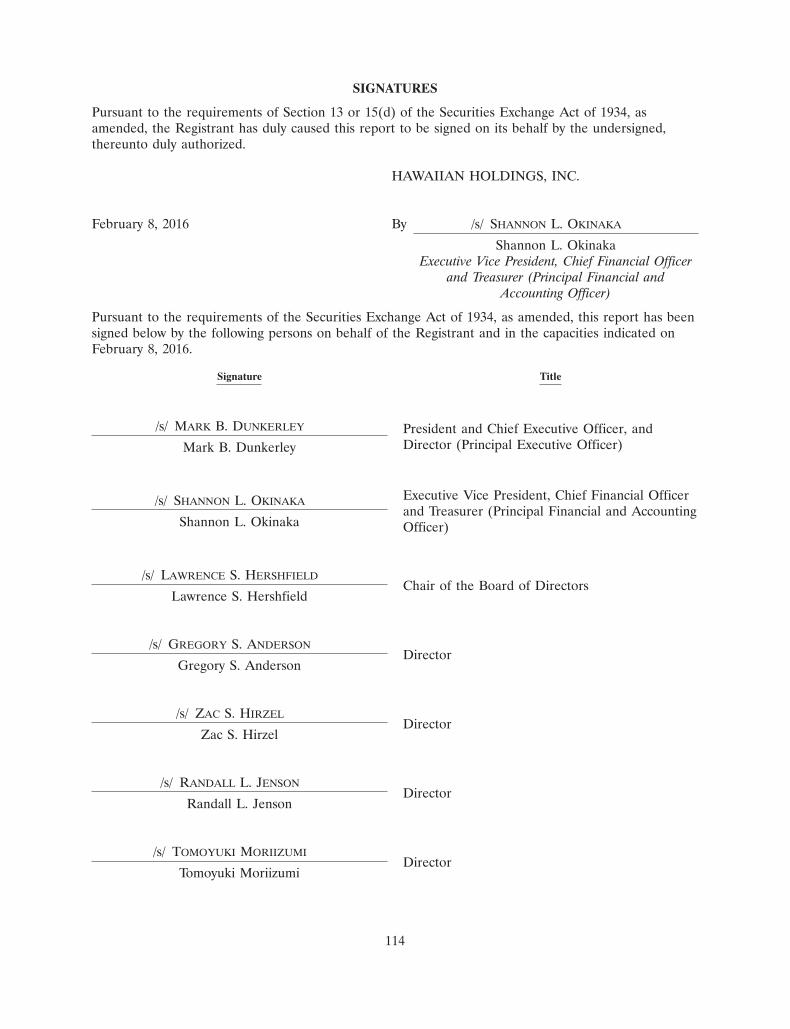
SIGNATURES
Pursuant to the requirements of Section 13 or 15(d) of the Securities Exchange Act of 1934, asamended, the Registrant has duly caused this report to be signed on its behalf by the undersigned,thereunto duly authorized.
HAWAIIAN HOLDINGS, INC.
February 8, 2016 By /s/ SHANNON L. OKINAKA
Shannon L. OkinakaExecutive Vice President, Chief Financial Officer
and Treasurer (Principal Financial andAccounting Officer)
Pursuant to the requirements of the Securities Exchange Act of 1934, as amended, this report has beensigned below by the following persons on behalf of the Registrant and in the capacities indicated onFebruary 8, 2016.
Signature Title
/s/ MARK B. DUNKERLEY President and Chief Executive Officer, andDirector (Principal Executive Officer)Mark B. Dunkerley
Executive Vice President, Chief Financial Officer/s/ SHANNON L. OKINAKAand Treasurer (Principal Financial and Accounting
Shannon L. Okinaka Officer)
/s/ LAWRENCE S. HERSHFIELDChair of the Board of Directors
Lawrence S. Hershfield
/s/ GREGORY S. ANDERSONDirector
Gregory S. Anderson
/s/ ZAC S. HIRZELDirector
Zac S. Hirzel
/s/ RANDALL L. JENSONDirector
Randall L. Jenson
/s/ TOMOYUKI MORIIZUMIDirector
Tomoyuki Moriizumi
114
Signature Title
/s/ SAMSON POOMAIHEALANIDirector
Samson Poomaihealani
/s/ CRYSTAL K. ROSEDirector
Crystal K. Rose
/s/ WILLIAM S. SWELBARDirector
William S. Swelbar
/s/ DUANE E. WOERTHDirector
Duane E. Woerth
/s/ RICHARD N. ZWERNDirector
Richard N. Zwern
115

[This Page Intentionally Left Blank]

[This Page Intentionally Left Blank]

[This Page Intentionally Left Blank]

OPERATED BY EMPIRE AIRLINES
SEASONAL ROUTESKailua-Kona – OaklandLıhu‘e – Oakland Kailua-Kona – Los AngelesLıhu‘e – Los Angeles
Codeshare Partners:
Interline Partners:Launching July 22, 2016Narita (Tokyo) Route
New York/Kennedy
Raleigh-Durham
New York/Newark
Charlotte
Savannah
Jacksonville
Lıhu‘e
KualaLumpur Singapore
Manila
Jakarta
SOUTHKOREA
PHILIPPINESVIETNAM
MALAYSIA
CAMBODIA
THAILAND
CHINA
AUSTRALIA
INDONESIA
PAPUANEW GUINEA
NEWZEALAND
AMERICANSAMOA
TAHITI
JAPAN
UNITEDSTATES
MEXICO
HAWAI‘I
CANADA
TAIWAN
Tokyo/Haneda
Tokyo/Narita
Osaka/Kansai Fukuoka
Pago Pago
Papeete
Seoul/Incheon
Taipei
Sapporo/Chitose
Sydney
Brisbane
Auckland
San FranciscoSacramento
Portland
Phoenix
Oakland
Las Vegas
Seattle
San Jose
Kahului
Okinawa
Kagoshima
Beijing
Shanghai/Pudong
Hong Kong
Busan Osaka/Itami
Oita
Hiroshima
Bangkok
Hanoi
Ho Chi Minh CityPhnom Penh
Perth
Canberra
Gladstone
Rockhampton
Townsville
Mackay
Adelaide
Melbourne
Cairns
Dallas/Love Field
Chicago/O’Hare
PortlandBurlington
Boston
Orlando
West Palm BeachFort Lauderdale
Tampa
Fort Myers
Washington DC/Dulles
RochesterBuffalo
Syracuse
Honolulu
Kailua-Kona
KAUA‘I
O‘AHU
MAUI
HAWAI‘IISLAND
MOLOKA‘I
LANA‘I
NI‘IHAU
KAHO‘OLAWE
Kahului
Kailua-Kona
Hilo
Lıhu‘e
Honolulu
Shanghai/Hongqiao
Hangzhou
Xiamen
Chengdu Chongqing
GuangzhouShenzhen
Shenyang
Harbin
To New Delhi, India
Nantucket
Los AngelesLong Beach
San Diego
Lana‘i City-
Ho‘olehua
Map not drawn to scale.
B O A R D O F D I R E C T O R S
Lawrence S. HershfieldChairman of the Board Hawaiian Holdings, Inc. and Hawaiian Airlines, Inc.
Chief Executive Officer Ranch Capital, LLC
Mark B. DunkerleyPresident and Chief Executive Officer Hawaiian Holdings, Inc. and Hawaiian Airlines, Inc.
Gregory S. AndersonChief Executive Officer Legacy Senior Housing and Development Company
Randall L. JensonPresident Ranch Capital, LLC
Chief Financial Officer Berkadia
Tomoyuki MoriizumiFormer President and Chief Executive Officer Jupiter Telecommunications Co., Ltd.
Samson PoomaihealaniGrand Lodge Representative (Retired) International Association of Machinists and Aerospace Workers
Crystal K. RosePartner Bays Lung Rose & Holma
William S. SwelbarResearch Engineer Massachusetts Institute of Technology
Duane E. WoerthFormer U.S. Ambassador International Civil Aviation Organization
Richard N. ZwernWorldwide Director-Executive Development WPP
C O R P O R AT E O F F I C E R S
Mark B. DunkerleyPresident and Chief Executive Officer Hawaiian Holdings, Inc. and Hawaiian Airlines, Inc.
Aaron J. AlterCorporate Secretary Hawaiian Holdings, Inc.
Executive Vice President Chief Legal Officer and Corporate Secretary Hawaiian Airlines, Inc.
Shannon L. OkinakaExecutive Vice President Chief Financial Officer and Treasurer Hawaiian Holdings, Inc.
Executive Vice President Chief Financial Officer Hawaiian Airlines, Inc.
Ron Anderson-LehmanExecutive Vice President and Chief Administrative Officer Hawaiian Airlines, Inc.
Peter R. IngramExecutive Vice President and Chief Commercial Officer Hawaiian Airlines, Inc.
Jonathan D. SnookExecutive Vice President and Chief Operating Officer Hawaiian Airlines, Inc.
Ann R. BotticelliSenior Vice President Corporate Communications and Public Affairs Hawaiian Airlines, Inc.
Barbara D. FalveySenior Vice President Human Resources Hawaiian Airlines, Inc.
Avi A. MannisSenior Vice President Marketing Hawaiian Airlines, Inc.
Theo PanagiotouliasSenior Vice President Global Sales and Alliances Hawaiian Airlines, Inc.
Karen A. BerryVice President Labor and Employee Relations Hawaiian Airlines, Inc.
K. Sayle HirashimaVice President Controller Hawaiian Airlines, Inc.
James W. LandersVice President Maintenance and Engineering Hawaiian Airlines, Inc.
Philip D. MooreVice President Information Technology Hawaiian Airlines, Inc.
Vicki NakataVice President Loyalty and Travel Products Hawaiian Airlines, Inc.
Brent OverbeekVice President Network Planning and Revenue Management Hawaiian Airlines, Inc.
Kenneth E. RewickVice President Flight Operations Hawaiian Airlines, Inc.
John F. Schaefer, Jr.Vice President Treasurer Hawaiian Airlines, Inc.
Robin A. SparlingVice President Inflight Services Hawaiian Airlines, Inc.
Edward T. StraussVice President Cargo Hawaiian Airlines, Inc.
Noel P. VillamilVice President Financial Planning and Analysis Hawaiian Airlines, Inc.
C O R P O R AT E I N F O R M AT I O N
Hawaiian Airlines, Inc.3375 Koapaka Street, Suite G350Honolulu, Hawai‘i 96819 Telephone: (808) 835-3700 Facsimile: (808) 835-3690
MAILING ADDRESSP. O. Box 30008 Honolulu, Hawai‘i 96820
INTERNET ADDRESSwww.HawaiianAirlines.com
INVESTOR RELATIONSAshlee [email protected]
STOCK TRANSFER AGENT AND REGISTRARAmerican Stock Transfer & Trust Company6201 15th Avenue Brooklyn, New York 11219 Telephone: (800) 937-5449 [email protected]
STOCK EXCHANGE LISTINGSymbol – HA NASDAQ Stock Market, LLCNew York, New York
INDEPENDENT AUDITORSErnst & Young, LLPHonolulu, Hawai‘i
CORPORATE COUNSELWilson Sonsini Goodrich & Rosati, P.C.Palo Alto, California
A N N U A L M E E T I N GThe 2016 Annual Meeting of Stockholders of Hawaiian Holdings, Inc. will be held on Wednesday, May 18, 2016 at 8:00 a.m.
Hilton Hawaiian Village Beach Resort and Spa Kalia Executive Conference Center Hibiscus Room 2005 Kalia Road Honolulu, Hawai‘i 96815
HARP-09388_AnnualReportCover2015.indd 2 3/28/16 2:25 PM

A N N U A L R E P O R T
H AWA I I A N H O L D I N G S, I N C.
2015A HIGHER LEVEL
OF COMFORT
The cover illustrates the design of our new 180-degree
lie-flat seats, the centerpiece of our upcoming A330 premium
cabin redesign. Developed as a collaboration with paulwylde
and Optimares, these seats demonstrate our dedication
to leading the way to the future with quality, comfort
and customer service.
HARP-09388_AnnualReportCover2015.indd 1 3/28/16 2:25 PM

![FACETS MODELS€¦ · Boeing 767-300 Boeing 777-300er Turkish Airlines Airbus a330 Boeing 727-200 Variant - Hawaiian Airlines* Fighters Commercial . 6 $Û50RGHOV @ 2SWLPL]HGIRU4XDQWXP](https://img.pdfslide.net/doc/110x75/5f05fe707e708231d415c273/facets-models-boeing-767-300-boeing-777-300er-turkish-airlines-airbus-a330-boeing.jpg)