Embed Size (px)
Citation preview

JOB#: HACA-36333
If you have questions concerning this file, please contact our Production Manager immediately at 808.539.3487
CLIENT: Hawaiian AirlinesDESCRIPTION: 2-SidedOutside and Inside Covers
COLLATERAL: Annual ReportCover 2012
COLOR: 4C
BLEED: .125”FLAT: w 16.5” x h 10.75”FOLDED: w 8.25” x h 10.75”
ANNUAL REPORT 2012 H A W A I I A N H O L D I N G S , I N C .
HACA-36333-2012AnnualReportCvr.indd 1 4/3/13 1:57 PM

SOUTHKOREA
PHILIPPINESVIETNAM
MALAYSIA
THAILAND
CHINA
AUSTRALIA
INDONESIA
PAPUANEW GUINEA
NEWZEALAND
AMERICANSAMOA
TAHITI
JAPAN
NORTH AMERICA
MEXICO
HAWAI‘I
CANADA
TAIWAN
Tokyo (Haneda)
Osaka (Kansai)
Fukuoka
Manila
Pago Pago
Papeete
Seoul (Incheon)
Taipei
Sapporo (New Chitose)
Sydney
Brisbane
Auckland
San Francisco
San Diego
Sacramento
Portland
Phoenix
Oakland
Las VegasLos Angeles
Seattle
New York City (JFK)
San Jose
Kahului
Okinawa
Kagoshima
Beijing
Shanghai
Busan Osaka (Itami)
Oita
Sendai
Bangkok
Perth
Canberra
Gladstone
Rockhampton
Townsville
Mackay
Adelaide
Melbourne
Cairns
MontereySanta Barbara
Fresno
Dallas/Fort Worth
Chicago (ORD)
PortlandBurlington
Boston
Raleigh-DurhamCharlotte
Orlando
West Palm BeachFort Lauderdale
Tampa
Fort Myers
PhiladelphiaWashington (IAD)
RochesterBuffalo
Syracuse
Honolulu
BOARD OF DIRECTORS
Ronald Anderson-LehmanSenior Vice PresidentChief Information OfficerHawaiian Airlines, Inc.
Ann BotticelliSenior Vice PresidentCorporate Communications and Public AffairsHawaiian Airlines, Inc.
Barbara D. FalveySenior Vice President Human ResourcesHawaiian Airlines, Inc.
Charles R. NardelloSenior Vice PresidentOperationsHawaiian Airlines, Inc.
Glenn G. TaniguchiSenior Vice PresidentMarketing and SalesHawaiian Airlines, Inc.
Karen A. BerryVice President Labor and Employee RelationsHawaiian Airlines, Inc.
Monisa ClineVice President Sales and AlliancesHawaiian Airlines, Inc.
Christian V. ForbesVice President Financial Planning and AnalysisHawaiian Airlines, Inc.
Doreen M. LawrenceVice President Inflight ServicesHawaiian Airlines, Inc.
Avi A. MannisVice PresidentMarketing Hawaiian Airlines, Inc.
Blaine J. MiyasatoVice PresidentProduct Development Hawaiian Airlines, Inc.
Shannon L. OkinakaVice President ControllerHawaiian Airlines, Inc.
Kenneth E. RewickVice President Flight Operations Hawaiian Airlines, Inc.
Louis D. Saint-CyrVice PresidentCustomer Services Hawaiian Airlines, Inc.
Lorrin L. M. SardinhaVice PresidentMaintenance and EngineeringHawaiian Airlines, Inc.
Donald A. E. SealeyVice PresidentCorporate Audit Hawaiian Airlines, Inc.
John R. WagnerVice PresidentPublic AffairsHawaiian Airlines, Inc.
Andrew M. WattersonVice PresidentPlanning and Revenue ManagementHawaiian Airlines, Inc.
Tom E. WessnerVice PresidentStrategic ProcurementHawaiian Airlines, Inc.
CORPORATE INFORMATION
HEADQUARTERSHawaiian Airlines, Inc.3375 Koapaka Street, Suite G350Honolulu, Hawai‘i 96819
Telephone: (808) 835-3700Facsimile: (808) 835-3690
MAILING ADDRESSP. O. Box 30008Honolulu, Hawai‘i 96820
INTERNET ADDRESSwww.HawaiianAirlines.com
INVESTOR RELATIONSSusan [email protected]
STOCK TRANSFER AGENT AND REGISTRARAmerican Stock Transfer & Trust Company6201 15th Avenue Brooklyn, New York 11219
Telephone: (800) [email protected]
STOCK EXCHANGE LISTINGSymbol – HANASDAQ Stock Market, LLCNew York, New York
INDEPENDENT AUDITORSErnst & Young, LLPHonolulu, Hawai‘i
CORPORATE COUNSELWilson Sonsini Goodrich & Rosati, P.C.Palo Alto, California
The 2013 Annual Meeting of Stockholders of Hawaiian Holdings, Inc. will be held on Wednesday, May 22, 2013 at 10:00 a.m.
Hilton Hawaiian Village Beach Resort and SpaKalia Executive Conference Center2005 Kalia RoadHonolulu, Hawai‘i 96815
ANNUAL MEETING
Lawrence S. HershfieldChairman of the BoardHawaiian Holdings, Inc. and Hawaiian Airlines, Inc.
Chief Executive OfficerRanch Capital, LLC
Mark B. DunkerleyPresident and Chief Executive OfficerHawaiian Holdings, Inc. and Hawaiian Airlines, Inc.
Gregory S. AndersonChief Executive OfficerLegacy Senior Housing andDevelopment Company
Brian E. BoyerChairman of the BoardPlanes of Fame Air Museum
Randall L. JensonPresidentRanch Capital, LLC
President and Chief Financial OfficerBerkadia
Bert T. Kobayashi, Jr.Senior PartnerKobayashi, Sugita & Goda
Tomoyuki MoriizumiFormer President and Chief Executive Officer Jupiter Telecommunications Co., Ltd.
Samson PoomaihealaniGrand Lodge Representative (Retired)International Association of Machinists and Aerospace Workers
Crystal K. RosePartnerBays Lung Rose & Holma
William S. SwelbarResearch EngineerMassachusetts Institute of Technology
Richard N. ZwernWorldwide Director – Executive DevelopmentWPP
CORPORATE OFFICERS
Mark B. DunkerleyPresident and Chief Executive OfficerHawaiian Holdings, Inc. and Hawaiian Airlines, Inc.
Scott E. ToppingExecutive Vice PresidentChief Financial Officer and TreasurerHawaiian Holdings, Inc. and Hawaiian Airlines, Inc.
Hoyt H. ZiaSecretaryHawaiian Holdings, Inc.
Senior Vice PresidentGeneral Counsel and Corporate SecretaryHawaiian Airlines, Inc.
Peter R. IngramExecutive Vice PresidentChief Commercial OfficerHawaiian Airlines, Inc.
Map not drawn to scale.
*Subject to government approval
JOB#: HACA-36333
If you have questions concerning this file, please contact our Production Manager immediately at 808.539.3487
CLIENT: Hawaiian AirlinesDESCRIPTION: 2-SidedOutside and Inside Covers
COLLATERAL: Annual ReportCover 2012
COLOR: 4C
BLEED: .125”FLAT: w 16.5” x h 10.75”FOLDED: w 8.25” x h 10.75”
HACA-36333-2012AnnualReportCvr.indd 2 4/3/13 1:57 PM

April 12, 2013
To Our Stockholders:
We made significant progress in our long-term plan to grow profitably and strengthen our business through diversification in 2012.
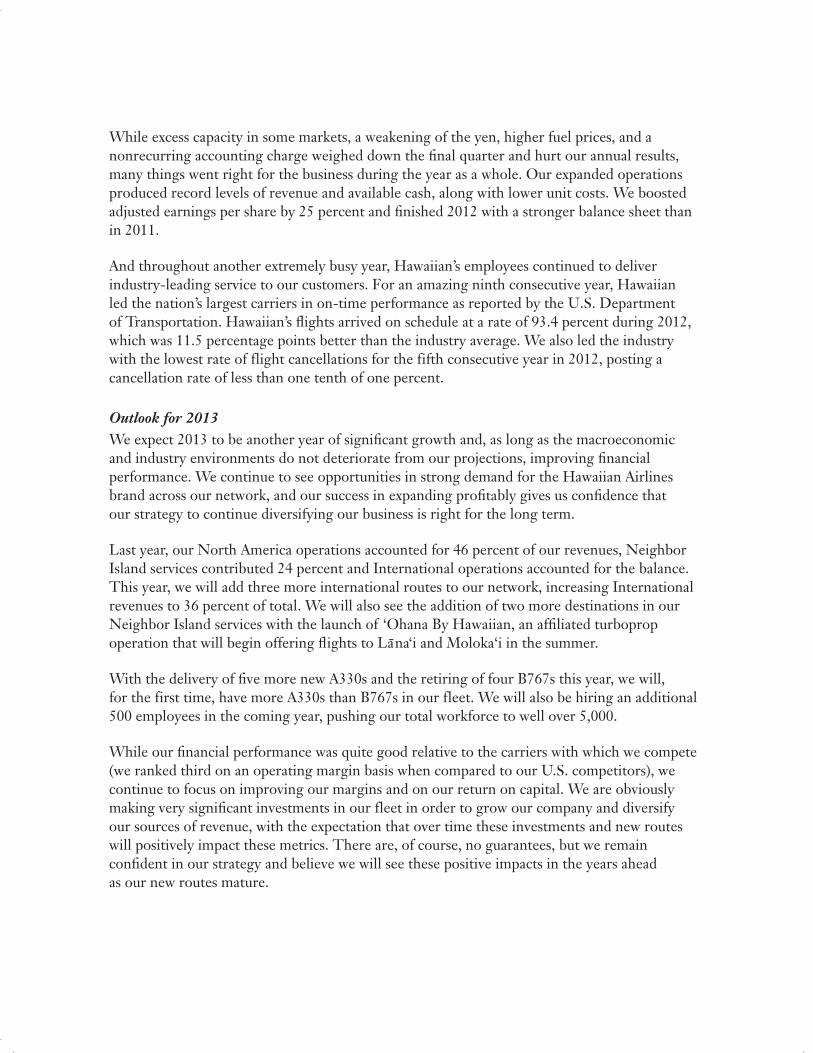
Four new Airbus A330-200 aircraft were delivered in 2012, allowing us to launch four new long-haul routes. One of these was New York, our first U.S. East Coast destination, which for the first time gives our company a presence in the third largest market that generates traffic to Hawai‘i. We, of course, already serve the top two markets: the U.S. West Coast and Asia.
Fukuoka and Sapporo, our third and fourth cities in Japan, respectively; and Brisbane, our second gateway in Australia, were the other additions to our network, bolstering our presence in Asia and Oceania. Remarkably, the company now generates more than 30 percent of its passenger revenues from international flying, up from just 10 percent three years ago.
We also took significant steps to increase the connectivity of our Neighbor Island and North America operations. Using our expanded 717 fleet and increased non-stop service to Maui from five West Coast gateways, we established a second Hawai‘i hub on The Valley Isle, added flights to other Neighbor Islands and optimized schedules. These changes not only offer more choices for visitors, but also improve convenience for our Neighbor Island residents with more direct connections to other islands. With the added services settling into the marketplace, our focus this year has been on fine-tuning flight schedules to increase efficiency.
Another important element of our growth strategy has been to leverage our network with partnerships that can provide traffic feed from points beyond our gateways. Last year, we added new or expanded partnerships with the leading carriers in three key markets: All Nippon Airways (ANA), Japan’s leading carrier; JetBlue Airways, the leading carrier at JFK International; and San Francisco-based Virgin America.
Hawaiian’s expansion in 2012 produced a 22 percent increase in system-wide capacity, and we served a company record 9.5 million customers. Most importantly, we were able to improve our financial performance and remain profitable even as we executed our growth strategy.
On a market-by-market basis, results of our business in 2012 were mixed, with excess capacity hurting route performance in each segment of our business. Some of our international and domestic long-haul routes suffered the effects of capacity increases by competitors, while in our Neighbor Island operations, those effects were mostly self-inflicted. The network initiatives we’ve taken will better balance capacity with demand across our network in 2013.
HACA-36333-2_AnnualShareholderLetter.indd 1 4/3/13 2:24 PM
While excess capacity in some markets, a weakening of the yen, higher fuel prices, and a nonrecurring accounting charge weighed down the final quarter and hurt our annual results, many things went right for the business during the year as a whole. Our expanded operations produced record levels of revenue and available cash, along with lower unit costs. We boosted adjusted earnings per share by 25 percent and finished 2012 with a stronger balance sheet than in 2011.
And throughout another extremely busy year, Hawaiian’s employees continued to deliver industry-leading service to our customers. For an amazing ninth consecutive year, Hawaiian led the nation’s largest carriers in on-time performance as reported by the U.S. Department of Transportation. Hawaiian’s flights arrived on schedule at a rate of 93.4 percent during 2012, which was 11.5 percentage points better than the industry average. We also led the industry with the lowest rate of flight cancellations for the fifth consecutive year in 2012, posting a cancellation rate of less than one tenth of one percent.
Outlook for 2013We expect 2013 to be another year of significant growth and, as long as the macroeconomic and industry environments do not deteriorate from our projections, improving financial performance. We continue to see opportunities in strong demand for the Hawaiian Airlines brand across our network, and our success in expanding profitably gives us confidence that our strategy to continue diversifying our business is right for the long term.
Last year, our North America operations accounted for 46 percent of our revenues, Neighbor Island services contributed 24 percent and International operations accounted for the balance. This year, we will add three more international routes to our network, increasing International revenues to 36 percent of total. We will also see the addition of two more destinations in our Neighbor Island services with the launch of ‘Ohana By Hawaiian, an affiliated turboprop operation that will begin offering flights to La-na‘i and Moloka‘i in the summer.
With the delivery of five more new A330s and the retiring of four B767s this year, we will, for the first time, have more A330s than B767s in our fleet. We will also be hiring an additional 500 employees in the coming year, pushing our total workforce to well over 5,000.
While our financial performance was quite good relative to the carriers with which we compete (we ranked third on an operating margin basis when compared to our U.S. competitors), we continue to focus on improving our margins and on our return on capital. We are obviously making very significant investments in our fleet in order to grow our company and diversify our sources of revenue, with the expectation that over time these investments and new routes will positively impact these metrics. There are, of course, no guarantees, but we remain confident in our strategy and believe we will see these positive impacts in the years ahead as our new routes mature.
HACA-36333-2_AnnualShareholderLetter.indd 2 4/3/13 2:24 PM

Early in 2013 we announced our intention to acquire long-haul narrowbody aircraft. First deliveries will be in 2017. This new fleet will, for the first time, allow us to serve “thinner” markets, mostly direct routes to the Neighbor Islands from cities we currently serve in the western U.S. mainland. We believe our brand and reputation is very strong in these cities; with these new aircraft, we will be able to attract customers who want to fly on us but prefer not to change planes in Honolulu. And on a cost-per-seat basis, these planes will be competitive with our widebody aircraft.
I cannot close this letter without a short comment about the quality of the customer experience being provided by our company. Hopefully, each of our shareholders has had a chance to experience this service firsthand. While virtually all airlines tout the importance of customer service, few deliver as well as Hawaiian. This is not just my opinion, but rather is recognized in customer surveys year after year (I refer you to such surveys in Condé Nast and Travel + Leisure as examples). And the service gets better each year. This is not an accident; it is the result of management’s incessant focus combined with a workforce that truly understands and serves with the spirit of Aloha. I am very proud to be affiliated with the folks that manage and work at Hawaiian Airlines. They are the best in the industry.
Finally, on behalf of the board of directors and everyone at Hawaiian, I want to thank you, our shareholders, for your continued support.
Sincerely,
Lawrence S. Hershfield Chairman of the Board of Directors
This letter contains forward-looking statements within the meaning of the U.S. securities laws that are subject to risks and uncertainties that could cause our actual results to differ materially from those indicated in these forward-looking statements, including but not limited to risks described in our filings with the Securities and Exchange Commission. For important cautionary language regarding these forward-looking statements, please see the section titled “Cautionary Note Regarding Forward-Looking Statements” in our Annual Report on Form 10-K, included herein. The Company undertakes no obligations to update any forward-looking statements.
HACA-36333-2_AnnualShareholderLetter.indd 3 4/3/13 2:24 PM

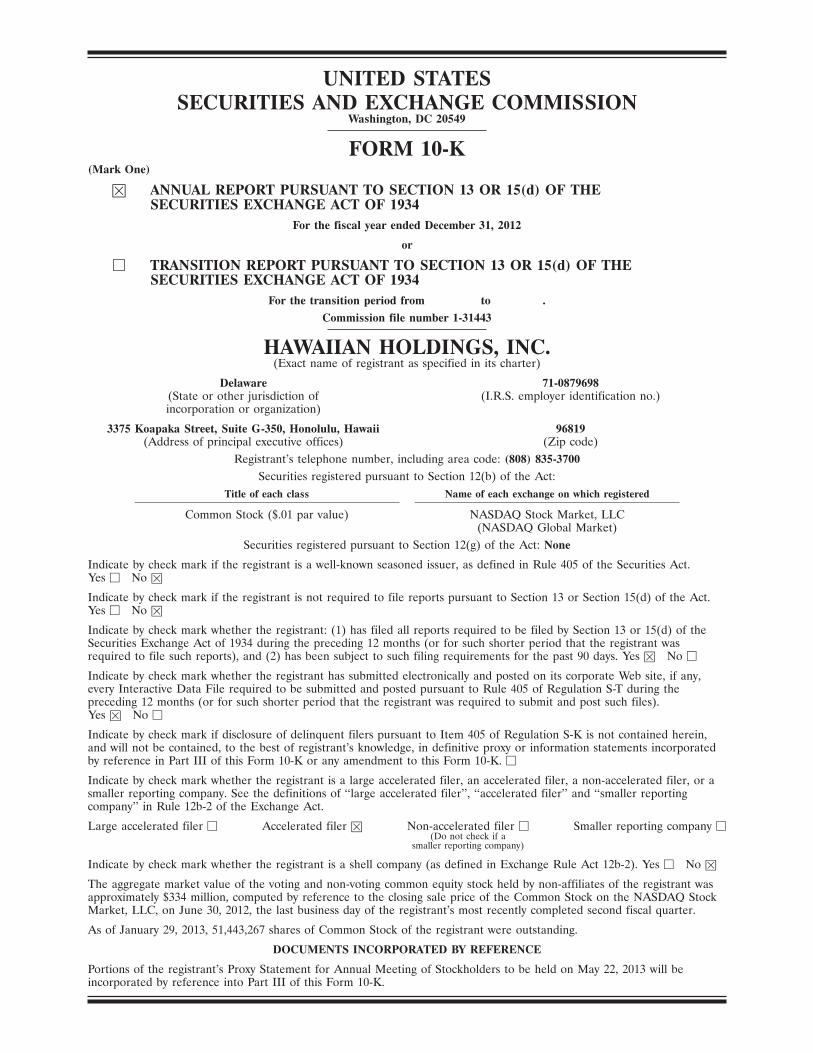
UNITED STATESSECURITIES AND EXCHANGE COMMISSION
Washington, DC 20549
FORM 10-K(Mark One)
� ANNUAL REPORT PURSUANT TO SECTION 13 OR 15(d) OF THESECURITIES EXCHANGE ACT OF 1934
For the fiscal year ended December 31, 2012
or
� TRANSITION REPORT PURSUANT TO SECTION 13 OR 15(d) OF THESECURITIES EXCHANGE ACT OF 1934
For the transition period from to .Commission file number 1-31443
HAWAIIAN HOLDINGS, INC.(Exact name of registrant as specified in its charter)
Delaware 71-0879698(State or other jurisdiction of (I.R.S. employer identification no.)incorporation or organization)
3375 Koapaka Street, Suite G-350, Honolulu, Hawaii 96819(Address of principal executive offices) (Zip code)
Registrant’s telephone number, including area code: (808) 835-3700Securities registered pursuant to Section 12(b) of the Act:
Title of each class Name of each exchange on which registered
Common Stock ($.01 par value) NASDAQ Stock Market, LLC(NASDAQ Global Market)
Securities registered pursuant to Section 12(g) of the Act: None
Indicate by check mark if the registrant is a well-known seasoned issuer, as defined in Rule 405 of the Securities Act.Yes � No �
Indicate by check mark if the registrant is not required to file reports pursuant to Section 13 or Section 15(d) of the Act.Yes � No �
Indicate by check mark whether the registrant: (1) has filed all reports required to be filed by Section 13 or 15(d) of theSecurities Exchange Act of 1934 during the preceding 12 months (or for such shorter period that the registrant wasrequired to file such reports), and (2) has been subject to such filing requirements for the past 90 days. Yes � No �
Indicate by check mark whether the registrant has submitted electronically and posted on its corporate Web site, if any,every Interactive Data File required to be submitted and posted pursuant to Rule 405 of Regulation S-T during thepreceding 12 months (or for such shorter period that the registrant was required to submit and post such files).Yes � No �
Indicate by check mark if disclosure of delinquent filers pursuant to Item 405 of Regulation S-K is not contained herein,and will not be contained, to the best of registrant’s knowledge, in definitive proxy or information statements incorporatedby reference in Part III of this Form 10-K or any amendment to this Form 10-K. �
Indicate by check mark whether the registrant is a large accelerated filer, an accelerated filer, a non-accelerated filer, or asmaller reporting company. See the definitions of ‘‘large accelerated filer’’, ‘‘accelerated filer’’ and ‘‘smaller reportingcompany’’ in Rule 12b-2 of the Exchange Act.
Large accelerated filer � Accelerated filer � Non-accelerated filer � Smaller reporting company �(Do not check if a
smaller reporting company)
Indicate by check mark whether the registrant is a shell company (as defined in Exchange Rule Act 12b-2). Yes � No �
The aggregate market value of the voting and non-voting common equity stock held by non-affiliates of the registrant wasapproximately $334 million, computed by reference to the closing sale price of the Common Stock on the NASDAQ StockMarket, LLC, on June 30, 2012, the last business day of the registrant’s most recently completed second fiscal quarter.
As of January 29, 2013, 51,443,267 shares of Common Stock of the registrant were outstanding.
DOCUMENTS INCORPORATED BY REFERENCE
Portions of the registrant’s Proxy Statement for Annual Meeting of Stockholders to be held on May 22, 2013 will beincorporated by reference into Part III of this Form 10-K.

TABLE OF CONTENTS
Page
PART I . . . . . . . . . . . . . . . . . . . . . . . . . . . . . . . . . . . . . . . . . . . . . . . . . . . . . . . . . . . . . . . . . . 3ITEM 1. BUSINESS . . . . . . . . . . . . . . . . . . . . . . . . . . . . . . . . . . . . . . . . . . . . . . . . . . . . 3ITEM 1A. RISK FACTORS . . . . . . . . . . . . . . . . . . . . . . . . . . . . . . . . . . . . . . . . . . . . . . . . 12ITEM 1B. UNRESOLVED STAFF COMMENTS . . . . . . . . . . . . . . . . . . . . . . . . . . . . . . . . 24ITEM 2. PROPERTIES . . . . . . . . . . . . . . . . . . . . . . . . . . . . . . . . . . . . . . . . . . . . . . . . . 25ITEM 3. LEGAL PROCEEDINGS . . . . . . . . . . . . . . . . . . . . . . . . . . . . . . . . . . . . . . . . . 27ITEM 4. SUBMISSION OF MATTERS TO A VOTE OF SECURITY HOLDERS . . . . . . 27
PART II . . . . . . . . . . . . . . . . . . . . . . . . . . . . . . . . . . . . . . . . . . . . . . . . . . . . . . . . . . . . . . . . . 28ITEM 5. MARKET FOR REGISTRANT’S COMMON EQUITY, RELATED
STOCKHOLDER MATTERS AND ISSUER PURCHASES OF EQUITYSECURITIES . . . . . . . . . . . . . . . . . . . . . . . . . . . . . . . . . . . . . . . . . . . . . . . . 28
ITEM 6. SELECTED FINANCIAL DATA . . . . . . . . . . . . . . . . . . . . . . . . . . . . . . . . . . . . 30ITEM 7. MANAGEMENT’S DISCUSSION AND ANALYSIS OF FINANCIAL
CONDITION AND RESULTS OF OPERATIONS . . . . . . . . . . . . . . . . . . . . . 31ITEM 7A. QUANTITATIVE AND QUALITATIVE DISCLOSURES ABOUT MARKET
RISK . . . . . . . . . . . . . . . . . . . . . . . . . . . . . . . . . . . . . . . . . . . . . . . . . . . . . . 51ITEM 8. FINANCIAL STATEMENTS AND SUPPLEMENTARY DATA . . . . . . . . . . . . . 54ITEM 9. CHANGES IN AND DISAGREEMENTS WITH ACCOUNTANTS ON
ACCOUNTING AND FINANCIAL DISCLOSURE . . . . . . . . . . . . . . . . . . . . 95ITEM 9A. CONTROLS AND PROCEDURES . . . . . . . . . . . . . . . . . . . . . . . . . . . . . . . . . 95ITEM 9B. OTHER INFORMATION . . . . . . . . . . . . . . . . . . . . . . . . . . . . . . . . . . . . . . . . . 98
PART III . . . . . . . . . . . . . . . . . . . . . . . . . . . . . . . . . . . . . . . . . . . . . . . . . . . . . . . . . . . . . . . . 98ITEM 10. DIRECTORS, EXECUTIVE OFFICERS AND CORPORATE GOVERNANCE 98ITEM 11. EXECUTIVE COMPENSATION . . . . . . . . . . . . . . . . . . . . . . . . . . . . . . . . . . . 98ITEM 12. SECURITY OWNERSHIP OF CERTAIN BENEFICIAL OWNERS AND
MANAGEMENT AND RELATED STOCKHOLDER MATTERS . . . . . . . . . 98ITEM 13. CERTAIN RELATIONSHIPS AND RELATED TRANSACTIONS, AND
DIRECTOR INDEPENDENCE . . . . . . . . . . . . . . . . . . . . . . . . . . . . . . . . . . . 98ITEM 14. PRINCIPAL ACCOUNTANT FEES AND SERVICES . . . . . . . . . . . . . . . . . . . . 98
PART IV . . . . . . . . . . . . . . . . . . . . . . . . . . . . . . . . . . . . . . . . . . . . . . . . . . . . . . . . . . . . . . . . 98ITEM 15. EXHIBITS, FINANCIAL STATEMENT SCHEDULES . . . . . . . . . . . . . . . . . . . 98SIGNATURES . . . . . . . . . . . . . . . . . . . . . . . . . . . . . . . . . . . . . . . . . . . . . . . . . . . . . . . . . . 114
1

CAUTIONARY NOTE REGARDING FORWARD-LOOKING STATEMENTS
This annual report on Form 10-K contains ‘‘forward-looking statements’’ within the meaning of thePrivate Securities Litigation Reform Act of 1995 that reflect our current views with respect to certaincurrent and future events and financial performance. Such forward-looking statements include, withoutlimitation: any expectations of operating expenses, deferred revenue, interest rates, income taxes,deferred tax assets, valuation allowance or other financial items; statements regarding factors that mayaffect our operating results; statements regarding areas of strategic focus; statements regarding factorsthat may affect our ability to fund our working capital, capital expenditures or other general purposeneeds; statements related to the impact of our low-cost structure on funding our growth strategy andmarket opportunities; statements regarding our ability to pay taxes with working capital; estimates offair value measurements; statements related to aircraft maintenance and repair costs and deposits andtiming of maintenance activities; statements related to cash flow from operations and seasonality;estimates of required funding of and contributions to our defined benefit pension and disability plan;estimates of annual fuel expenses and measure of the effects of fuel prices on our business; statementsregarding the availability and cost of fuel; statements regarding our wages and benefits and labor costsand agreements; statements regarding the implementation, effective date and costs of compliance withregulations promulgated by the FAA, DOT and other regulatory agencies; statements related to airportrent rates and landing fees; statements regarding aircraft rent expense; statements regarding our totalcapacity and yields on routes; statements regarding compliance with potential environmentalregulations; statements regarding potential dilution of our securities; statements regarding cost liabilityand deferred revenue estimates related to the frequent flyer program; statements related to ourhedging program; statements concerning the impact of, and changes to, accounting principles, policiesand estimates; statements regarding our tax valuation allowance; statements regarding credit cardholdback; statements regarding the availability of financing; statements regarding our capitalexpenditures; statements regarding potential violations under the Company’s debt or lease obligations;statements regarding our ability to comply with covenants under our financing arrangements;statements regarding our expectations about executing a firm commitment to purchase aircraft in thefirst quarter of 2013; statements regarding our intention to obtain additional debt or lease financing foraircraft deliveries; statements related to capital expenditures impacting future debt levels andpre-delivery payments; statements regarding the expiration of aircraft leases; statements related to riskmanagement, credit risks and air traffic liability; statements related to future U.S. and global economicconditions or performance; statements related to changes in our fleet plan and related cash outlays;statements related to expected delivery of new aircraft; and associated costs for spare engines,replacement parts, maintenance, employee training and other implementation activities; statementsprojecting non-aircraft related capital expenditures; statements related to commissions and sellingexpenses; statements related to potential route expansion; statements related to aircraft and passengerservicing; statements related to service expansion and related operating expenses; statements related tothe effects of any litigation on our operations or business; statements related to the amount ofcompetition on our routes by other domestic and foreign carriers; statements related to faremodifications; statements related to the presence of foreign languages on our website; statementsrelated to continuous investments in technology and systems; and statements as to other matters thatdo not relate strictly to historical facts or statements of assumptions underlying any of the foregoing.Words such as ‘‘expects,’’ ‘‘anticipates,’’ ‘‘projects,’’ ‘‘intends,’’ ‘‘plans,’’ ‘‘believes,’’ ‘‘estimates,’’variations of such words, and similar expressions are also intended to identify such forward-lookingstatements. These forward-looking statements are and will be, as the case may be, subject to manyrisks, uncertainties and factors relating to our operations and business environment, all of which maycause our actual results to be materially different from any future results, expressed or implied, in theseforward-looking statements.
The risks, uncertainties and assumptions referred to above that could cause our results to differmaterially from the results expressed or implied by such forward-looking statements include those
2

discussed under the heading ‘‘Risk Factors’’ in Item 1A in this Annual Report on Form 10-K and therisks, uncertainties and assumptions discussed from time to time in our other public filings and publicannouncements. All forward-looking statements included in this document are based on informationavailable to us as of the date hereof. We undertake no obligation to publicly update or revise anyforward-looking statements to reflect events or circumstances that may arise after the date hereof.
PART I
ITEM 1. BUSINESS.
Overview
Hawaiian Holdings, Inc. (the ‘‘Company,’’ ‘‘Holdings,’’ ‘‘we,’’ ‘‘us’’ and ‘‘our’’) is a holding companyincorporated in the State of Delaware. The Company’s primary asset is the sole ownership of all issuedand outstanding shares of common stock of Hawaiian Airlines, Inc. (Hawaiian). Hawaiian was originallyincorporated in January 1929 under the laws of the Territory of Hawaii and became our indirectwholly-owned subsidiary pursuant to a corporate restructuring that was consummated in August 2002.Hawaiian became a Delaware corporation and the Company’s direct wholly-owned subsidiaryconcurrent with its reorganization and reacquisition by the Company in June 2005.
Hawaiian is engaged in the scheduled air transportation of passengers and cargo amongst the HawaiianIslands (the Neighbor Island routes), between the Hawaiian Islands and certain cities in the United States(the North America routes), and between the Hawaiian Islands and the South Pacific, Australia and Asia(the International routes), collectively referred to as our Scheduled Operations. In addition, Hawaiianalso operates various charter flights. Hawaiian is the largest airline headquartered in Hawaii and theeleventh largest domestic airline in the United States based on revenue passenger miles reported by theResearch and Innovative Technology Administration Bureau of Transportation Services as of October 31,2012, latest data available. At December 31, 2012, Hawaiian’s fleet consisted of 18 Boeing 717-200aircraft for its Neighbor Island routes and 16 Boeing 767-300 aircraft and nine Airbus A330-200 aircraftfor its North America, International and charter routes. The Company also purchased two ATR42turboprop aircraft that it expects to begin service in 2013.
Flight Operations
Our flight operations are based in Honolulu, Hawaii. At December 31, 2012, we operatedapproximately 209 scheduled flights per day with:
• Daily service on our North America routes between the State of Hawaii and Los Angeles,Oakland, Sacramento, San Diego, San Francisco and San Jose, California; Las Vegas, Nevada;Phoenix, Arizona; Portland, Oregon; Seattle, Washington; and New York City, New York.
• Daily service on our Neighbor Island routes among the four major islands of the State ofHawaii;
• Daily service on our International routes between the State of Hawaii and Seoul, South Korea;Sydney, Australia; and Tokyo, Osaka, and Fukuoka, Japan and scheduled service between theState of Hawaii and Pago Pago, American Samoa; Papeete, Tahiti; Manila, Philippines; Brisbane,Australia; and Sapporo, Japan.
• Other ad hoc charters.
Fuel
Our operations and financial results are significantly affected by the availability and price of jet fuel.The following table sets forth statistics about Hawaiian’s aircraft fuel consumption and cost, including
3
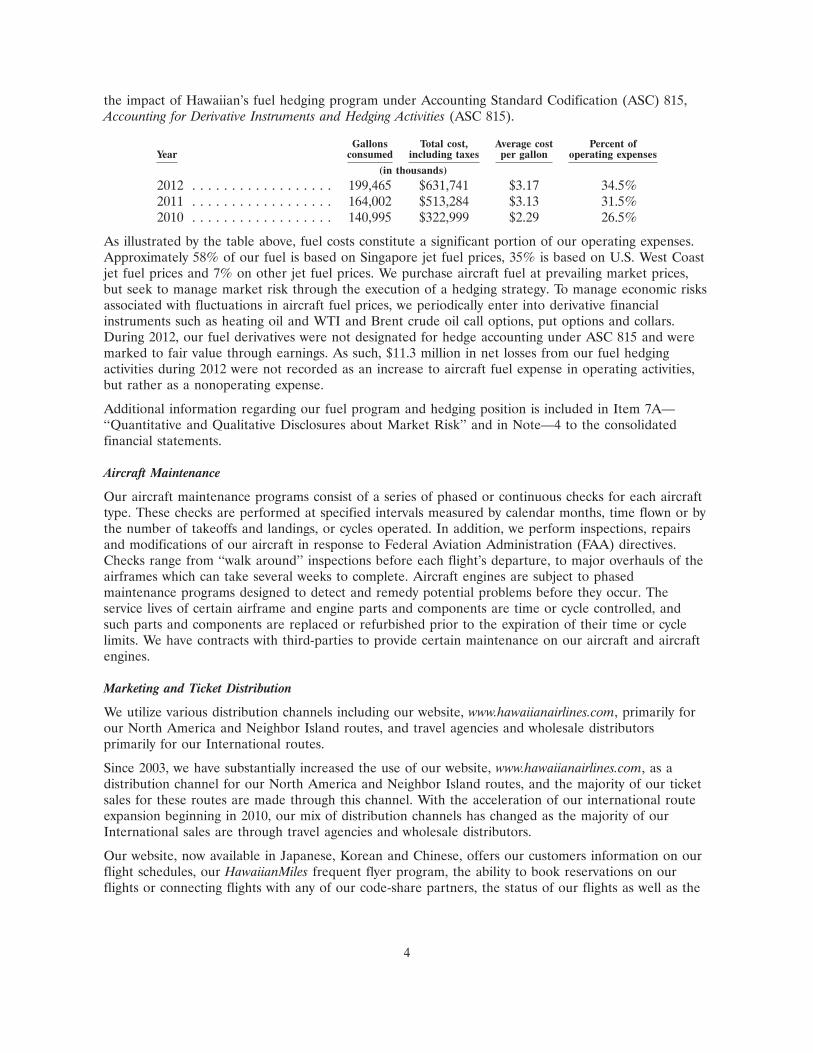
the impact of Hawaiian’s fuel hedging program under Accounting Standard Codification (ASC) 815,Accounting for Derivative Instruments and Hedging Activities (ASC 815).
Gallons Total cost, Average cost Percent ofYear consumed including taxes per gallon operating expenses
(in thousands)
2012 . . . . . . . . . . . . . . . . . . 199,465 $631,741 $3.17 34.5%2011 . . . . . . . . . . . . . . . . . . 164,002 $513,284 $3.13 31.5%2010 . . . . . . . . . . . . . . . . . . 140,995 $322,999 $2.29 26.5%
As illustrated by the table above, fuel costs constitute a significant portion of our operating expenses.Approximately 58% of our fuel is based on Singapore jet fuel prices, 35% is based on U.S. West Coastjet fuel prices and 7% on other jet fuel prices. We purchase aircraft fuel at prevailing market prices,but seek to manage market risk through the execution of a hedging strategy. To manage economic risksassociated with fluctuations in aircraft fuel prices, we periodically enter into derivative financialinstruments such as heating oil and WTI and Brent crude oil call options, put options and collars.During 2012, our fuel derivatives were not designated for hedge accounting under ASC 815 and weremarked to fair value through earnings. As such, $11.3 million in net losses from our fuel hedgingactivities during 2012 were not recorded as an increase to aircraft fuel expense in operating activities,but rather as a nonoperating expense.
Additional information regarding our fuel program and hedging position is included in Item 7A—‘‘Quantitative and Qualitative Disclosures about Market Risk’’ and in Note—4 to the consolidatedfinancial statements.
Aircraft Maintenance
Our aircraft maintenance programs consist of a series of phased or continuous checks for each aircrafttype. These checks are performed at specified intervals measured by calendar months, time flown or bythe number of takeoffs and landings, or cycles operated. In addition, we perform inspections, repairsand modifications of our aircraft in response to Federal Aviation Administration (FAA) directives.Checks range from ‘‘walk around’’ inspections before each flight’s departure, to major overhauls of theairframes which can take several weeks to complete. Aircraft engines are subject to phasedmaintenance programs designed to detect and remedy potential problems before they occur. Theservice lives of certain airframe and engine parts and components are time or cycle controlled, andsuch parts and components are replaced or refurbished prior to the expiration of their time or cyclelimits. We have contracts with third-parties to provide certain maintenance on our aircraft and aircraftengines.
Marketing and Ticket Distribution
We utilize various distribution channels including our website, www.hawaiianairlines.com, primarily forour North America and Neighbor Island routes, and travel agencies and wholesale distributorsprimarily for our International routes.
Since 2003, we have substantially increased the use of our website, www.hawaiianairlines.com, as adistribution channel for our North America and Neighbor Island routes, and the majority of our ticketsales for these routes are made through this channel. With the acceleration of our international routeexpansion beginning in 2010, our mix of distribution channels has changed as the majority of ourInternational sales are through travel agencies and wholesale distributors.
Our website, now available in Japanese, Korean and Chinese, offers our customers information on ourflight schedules, our HawaiianMiles frequent flyer program, the ability to book reservations on ourflights or connecting flights with any of our code-share partners, the status of our flights as well as the
4

ability to purchase tickets or travel packages. We also publish fares with web-based travel services suchas Orbitz, Travelocity, Expedia, Hotwire and Priceline. These comprehensive travel planning websitesprovide customers with convenient online access to airline, hotel, car rental and other travel services.
Frequent Flyer Program
The HawaiianMiles frequent flyer program was initiated in 1983 to encourage and develop customerloyalty. HawaiianMiles allows passengers to earn mileage credits by flying with us and our partnercarriers. In addition, members earn mileage credits for patronage with our other program partners,including credit card issuers, hotels, car rental firms and general merchants, pursuant to our exchangepartnership agreements. We also sell mileage credits to other companies participating in the program.
HawaiianMiles members have a choice of various awards based on accumulated mileage credits, withmost of the awards being for free air travel on Hawaiian. Travel awards range from a 7,500 mile award,which is redeemable for a SuperSaver one-way neighbor island flight, to a 210,000 mile award, which isredeemable for an anytime one-way first class flight between the mainland U.S. and Sydney andBrisbane, Australia; Manila, Philippines; Tokyo, Osaka, Fukuoka and Sapporo, Japan; and Seoul, SouthKorea.
HawaiianMiles accounts with no activity (frequent flyer miles earned or redeemed) for eighteen monthsautomatically expire. The number of free travel awards used for travel on Hawaiian was approximately490,000 and 492,000 in 2012 and 2011, respectively. The amount of free travel awards as a percentageof total revenue passengers equaled approximately 5.2% and 5.7% in 2012 and 2011, respectively. Webelieve displacement of revenue passengers is minimal due to our ability to manage frequent flyer seatinventory, and the relatively low ratio of free award usage to total revenue passengers.
Code-Sharing and Other Alliances
We have marketing alliances with other airlines that provide reciprocal frequent flyer mileage accrualand redemption privileges and code-sharing on certain flights (one carrier placing its name and flightnumbers, or code, on flights operated by the other carrier). These programs enhance our revenueopportunities by:
• Increasing value to our customers by offering easier access to more travel destinations and bettermileage accrual/redemption opportunities;
• gaining access to more connecting traffic from other airlines; and
• providing members of our alliance partners’ frequent flyer programs an opportunity to travel onour system while earning mileage credit in the alliance partners’ programs.
5
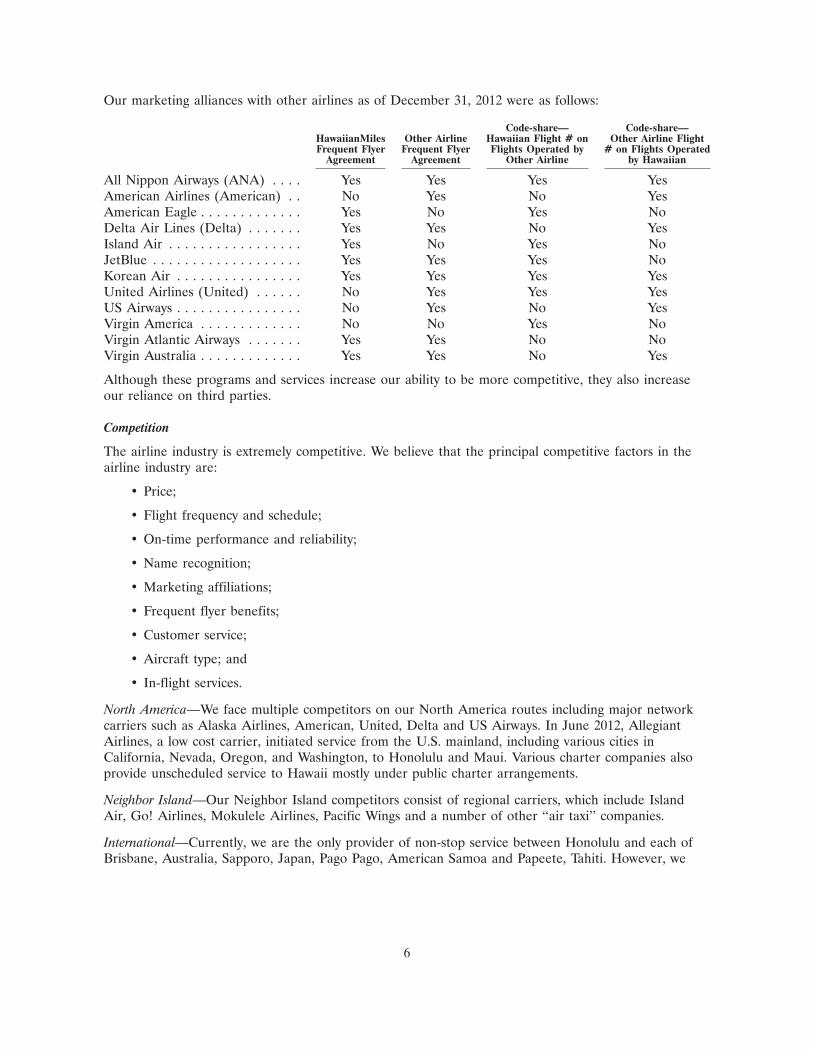
Our marketing alliances with other airlines as of December 31, 2012 were as follows:
Code-share— Code-share—HawaiianMiles Other Airline Hawaiian Flight # on Other Airline FlightFrequent Flyer Frequent Flyer Flights Operated by # on Flights Operated
Agreement Agreement Other Airline by Hawaiian
All Nippon Airways (ANA) . . . . Yes Yes Yes YesAmerican Airlines (American) . . No Yes No YesAmerican Eagle . . . . . . . . . . . . . Yes No Yes NoDelta Air Lines (Delta) . . . . . . . Yes Yes No YesIsland Air . . . . . . . . . . . . . . . . . Yes No Yes NoJetBlue . . . . . . . . . . . . . . . . . . . Yes Yes Yes NoKorean Air . . . . . . . . . . . . . . . . Yes Yes Yes YesUnited Airlines (United) . . . . . . No Yes Yes YesUS Airways . . . . . . . . . . . . . . . . No Yes No YesVirgin America . . . . . . . . . . . . . No No Yes NoVirgin Atlantic Airways . . . . . . . Yes Yes No NoVirgin Australia . . . . . . . . . . . . . Yes Yes No Yes
Although these programs and services increase our ability to be more competitive, they also increaseour reliance on third parties.
Competition
The airline industry is extremely competitive. We believe that the principal competitive factors in theairline industry are:
• Price;
• Flight frequency and schedule;
• On-time performance and reliability;
• Name recognition;
• Marketing affiliations;
• Frequent flyer benefits;
• Customer service;
• Aircraft type; and
• In-flight services.
North America—We face multiple competitors on our North America routes including major networkcarriers such as Alaska Airlines, American, United, Delta and US Airways. In June 2012, AllegiantAirlines, a low cost carrier, initiated service from the U.S. mainland, including various cities inCalifornia, Nevada, Oregon, and Washington, to Honolulu and Maui. Various charter companies alsoprovide unscheduled service to Hawaii mostly under public charter arrangements.
Neighbor Island—Our Neighbor Island competitors consist of regional carriers, which include IslandAir, Go! Airlines, Mokulele Airlines, Pacific Wings and a number of other ‘‘air taxi’’ companies.
International—Currently, we are the only provider of non-stop service between Honolulu and each ofBrisbane, Australia, Sapporo, Japan, Pago Pago, American Samoa and Papeete, Tahiti. However, we
6

face multiple competitors from both domestic and foreign carriers on our other non-stop Internationalroutes as summarized below:
• Daily flights between Honolulu and Sydney, Australia competing directly with Qantas Airways.
• Scheduled flights between Honolulu and Manila, Philippines competing directly with PhilippineAirlines.
• Daily flights between Honolulu and Tokyo’s Haneda International Airport competing directlywith Japan Airlines, All Nippon Airways and indirectly competing with Delta, United, and ChinaAirlines which provide service to Honolulu from Tokyo’s Narita International Airport.
• Daily flights between Honolulu and Osaka, Japan competing directly with Japan Airlines andDelta.
• Daily flights between Honolulu and Fukuoka, Japan competing directly with Delta.
• Daily flights between Honolulu and Seoul, South Korea competing directly with Korean Air andAsiana Airlines.
Employees
As of December 31, 2012, Hawaiian had 4,906 active employees compared to 4,314 active employees asof December 31, 2011. Wages and benefits expense represented approximately 20.5% and 19.7% of ourtotal operating expenses in 2012 and 2011, respectively. As of December 31, 2012, approximately 86.9%of our employees were covered by labor agreements with the following organized labor groups:
Number ofEmployee Group Represented by Employees Agreement amendable on(*)
Flight deck crewmembers . . . . . . . . . . Air Line Pilots Association (ALPA) 609 September 15, 2015
Cabin crew members . . . Association of Flight Attendants (AFA) 1,464 January 1, 2017
Maintenance andengineering personnel International Association of Machinists 688 April 20, 2014
and Aerospace Workers (IAM)
Customer servicerepresentatives . . . . . . IAM 1,468 January 1, 2014
Flight dispatch personnel Transport Workers Union (TWU) 33 November 1, 2013
(*) Our relations with our labor organizations are governed by Title II of the Railway Labor Act of1926, pursuant to which the collective bargaining agreements between us and these organizationsdo not expire but instead become amendable as of a certain date if either party wishes to modifythe terms of the agreement.
Seasonality
Our operations and financial results are subject to substantial seasonal and cyclical volatility, primarilydue to leisure and holiday travel patterns. Hawaii is a popular vacation destination for travelers.Demand levels are typically weaker in the first quarter of the year with stronger demand periodsoccurring during June, July, August and December. We may adjust our pricing or the availability ofparticular fares to obtain an optimal passenger load factor depending on seasonal demand differences.
7

Customers
Our business is not dependent upon any single customer, or a few customers, the loss of any one wouldnot have a material adverse effect on our business.
Regulation
Our business is subject to extensive and evolving federal, state and local laws and regulations. Manygovernmental agencies regularly examine our operations to monitor compliance with applicable lawsand regulations. Governmental authorities can enforce compliance with applicable laws and regulationsand obtain injunctions or impose civil or criminal penalties or modify, suspend or revoke our operatingcertificates in case of violations.
We cannot guarantee that we will be able to obtain or maintain necessary governmental approvals.Once obtained, operating permits are subject to modification and revocation by the issuing agencies.Compliance with these and any future regulatory requirements could require us to make significantcapital and operating expenditures. However, most of these expenditures are made in the normalcourse of business and do not place us at any competitive disadvantage. The primary U.S. federalstatutes affecting our business are discussed below.
Industry Regulations
We are subject to the regulatory jurisdiction of the U.S. Department of Transportation (DOT) and theFederal Aviation Administration (FAA). We operate under a Certificate of Public Convenience andNecessity issued by the DOT (authorizing us to provide commercial aircraft service) as well as aPart 121 Scheduled Carrier Operating Certificate issued by the FAA. Both certificates may be altered,amended, modified, suspended or revoked by the DOT/FAA for our failure to comply with the termsand conditions of a certificate. Such action may only be taken after notice and an opportunity forcomment is provided, except in emergency situations where such actions may be immediately effective.The DOT has jurisdiction over international routes and international fares for some countries (basedupon treaty relations with those countries), consumer protection policies including baggage liability anddenied-boarding compensation, and unfair competitive practices as set forth in the Airline DeregulationAct of 1978. The FAA has regulatory jurisdiction over flight operations generally, including equipment,ground facilities, security systems, maintenance and other safety matters. Pursuant to these regulations,we have established, and the FAA has approved, a maintenance program for each type of aircraft weoperate that provides for the ongoing maintenance of our aircraft, ranging from frequent routineinspections to major overhauls. In January 2012, new regulations concerning airline passengerprotections went into effect. These new regulations included the requirement that airlines and ticketagents include all mandatory taxes and fees in advertised airfares and that all baggage fees aredisclosed to consumers when booking online. Additionally, new requirements on placing a reservationon hold without payment and canceling a booking without penalty within 24 hours if the reservationwas made at least a week in advance of departure, as well as notification of passengers of flight delays,cancellations, and diversions went into effect. These new regulations were part of the airline passengerprotection rules issued by the DOT in April 2011, which included additional rules that were effective asof August 2011. In December 2011, the FAA approved changes to pilots’ current flight schedulesincluding the number of flight hours and scheduled duty time allowed as well as mandating minimumoff duty hours and rest breaks. These FAA rules will become effective at the end of 2013 or beginningof 2014.
8
Maintenance Directives
The FAA approves all airline maintenance programs, including modifications to the programs. Inaddition, the FAA licenses the repair stations and mechanics that perform inspections, repairs andoverhauls, as well as the inspectors who monitor the work.
The FAA frequently issues airworthiness directives, often in response to specific incidents or reports byoperators or manufacturers, requiring operators of specified equipment types to perform prescribedinspections, repairs or modifications within stated time periods or numbers of cycles. In the last severalyears, the FAA has issued a number of maintenance directives and other regulations relating to, amongother things, wiring requirement for aging aircraft, fuel tank flammability, cargo compartment firedetection/suppression systems, collision avoidance systems, airborne windshear avoidance systems, noiseabatement and increased inspection requirements. We cannot predict what new airworthiness directiveswill be issued and what new regulations will be adopted, or how our business will be affected by anysuch directives or regulations. We expect that we may incur expenses to comply with new airworthinessdirectives and regulations.
We believe we are in compliance with all requirements necessary to be in good standing with our aircarrier operating certificate issued by the FAA and our certificate of Public Convenience and Necessityissued by the DOT. A modification, suspension or revocation of any of our DOT/FAA authorizations orcertificates would have a material adverse impact on our operations.
Airport Security
The Aviation and Transportation Security Act (ATSA) mandates that the Transportation SecurityAdministration (TSA) provide for the screening of all passengers and property, including mail, cargo,carry-on and checked baggage, and other articles that will be carried aboard a passenger aircraft.Under the ATSA, substantially all security screeners at airports are federal employees and significantother elements of airline and airport security are now overseen and performed by federal employees,including security managers, law enforcement officers and Federal Air Marshals. The ATSA alsoprovides for increased security on flight decks of aircraft and requires Federal Air Marshals to bepresent on certain flights, improved airport perimeter access security, airline crew security training,enhanced security screening of passengers, baggage, cargo, mail, employees and vendors, enhancedtraining and qualifications of security screening personnel, provision of passenger data to U.S. Customsand Border Protection and enhanced background checks. The TSA also has the authority to imposeadditional fees on the air carriers, if necessary, to cover additional federal aviation security costs. Since2002, the TSA has imposed an Aviation Security Infrastructure Fee on all airlines in operation prior to2000 to assist in the cost of providing aviation security. The fees assessed are based on airlines’ actualsecurity costs for the year ended December 31, 2000. The TSA may increase these fees throughrulemaking, but has not yet initiated such a proceeding. The existing fee structure will remain in placeuntil further notice. Furthermore, because of significantly higher security and other costs incurred byairports since September 11, 2001, many airports have significantly increased their rates and charges toairlines, including us, and may do so again in the future.
Environmental and Employee Safety and Health
We are subject to various laws and government regulations concerning environmental matters andemployee safety and health in the U.S. and other countries in which we do business. Many aspects ofairlines’ operations are subject to increasingly stringent federal, state, local and foreign laws protectingthe environment. U.S. federal laws that have a particular impact on us include the Airport Noise andCapacity Act of 1990, the Clean Air Act, the Resource Conservation and Recovery Act, the CleanWater Act, the Safe Drinking Water Act, and the Comprehensive Environmental Response,Compensation, and Liability Act. Certain of our operations are also subject to the oversight of the
9
Occupational Safety and Health Administration (OSHA) concerning employee safety and healthmatters. The U.S. Environmental Protection Agency (EPA), OSHA, and other federal agencies havebeen authorized to promulgate regulations that affect our operations. In addition to these federalactivities, various states have been delegated certain authority under the aforementioned federalstatutes. Many state and local governments have adopted environmental and employee safety andhealth laws and regulations, some of which are similar to or stricter than federal requirements, such asCalifornia.
The EPA is authorized to regulate aircraft emissions and has historically implemented emissions controlstandards previously adopted by the International Civil Aviation Organization. Our aircraft comply withthe existing EPA standards as applicable by engine design date. Concern about climate change andgreenhouse gases may result in additional regulation of aircraft emissions in the U.S. and abroad. As aresult, we may become subject to taxes, charges or additional requirements to obtain permits orpurchase allowances or emission credits for greenhouse gas emissions in various jurisdictions, whichcould result in taxation or permitting requirements from multiple jurisdictions for the same operations.Cap and trade restrictions have also been proposed in Congress. In addition, other legislative orregulatory action, to regulate greenhouse gas emissions is possible. In particular, the EPA has foundthat greenhouse gases threaten the public health and welfare, which could result in regulation ofgreenhouse gas emissions from aircraft. In the event that legislation or regulation is enacted in the U.S.or in the event similar legislation or regulation is enacted in jurisdictions where we operate or wherewe may operate in the future, it could result in significant costs for us and the airline industry. At thistime, we cannot predict whether any such legislation or regulation would apportion costs between oneor more jurisdictions in which we operate flights. Under these systems, certain credits may be availableto reduce the costs of permits in order to mitigate the impact of such regulations on consumers, but wecannot predict whether we or the airline industry in general will have access to offsets or credits. Weare monitoring and evaluating the potential impact of such legislative and regulatory developments. Inaddition to direct costs, such regulation may have a greater effect on the airline industry throughincreases in fuel costs that could result from fuel suppliers passing on increased costs that they incurunder such a system.
We seek to minimize the impact of carbon emissions from our operations through reductions in ourfuel consumption and other efforts. We have reduced the fuel needs of our aircraft fleet through theretirement and replacement of certain elements of our fleet and with newer, more fuel efficientaircraft. In addition, we have implemented fuel saving procedures in our flight and ground supportoperations that further reduce carbon emissions. In February 2012, we earned the first-ever aviationbased carbon credits, through the reduction of our carbon dioxide emissions with the use of aneco-friendly engine washing technology. We are also supporting efforts to develop alternative fuels andefforts to modernize the air traffic control system in the U.S. as part of our efforts to reduce ouremissions and minimize our impact on the environment.
Noise Abatement
Under the Airport Noise and Capacity Act, the DOT allows local airport authorities to implementprocedures designed to abate special noise problems, provided such procedures do not unreasonablyinterfere with interstate and foreign commerce, or the national transportation system. Certain airports,including the major airports at Los Angeles, San Diego, San Francisco, San Jose, California andSydney, Australia, have established airport restrictions to limit noise, including restrictions on aircrafttypes to be used and limits on the number of hourly or daily operations or the time of such operations.Local authorities at other airports could consider adopting similar noise regulations. In some instances,these restrictions have caused curtailments in services or increases in operating costs, and suchrestrictions could limit our ability to expand our operations.
10

Taxes
The airline industry is subject to various passenger ticket, cargo and fuel taxes, which change from timeto time. Certain of these taxes are assessed directly to the air carrier (e.g., excise taxes on fuel), whilecertain other of these taxes are pass-through taxes (e.g., excise taxes on air transportation of passengersand cargo). In February 2012, Congress passed the Federal Aviation Administration Modernization andReform Act of 2012 which provides funding through 2014 for FAA programs and infrastructureprojects, including improvements to the national aviation system, reductions in waste and improvementsto aviation safety and capacity. This new act extends existing tax structures, including the taxes and feesthat airlines, passengers and aircraft owners pay in order to operate the United States aviation system.We cannot predict what future actions Congress may take or whether any such actions by Congress, orany similar activity by the State of Hawaii, will have a material effect on our costs or revenue.
Civil Reserve Air Fleet Program
The U.S. Department of Defense regulates the Civil Reserve Air Fleet (CRAF) and governmentcharters. We have elected to participate in the CRAF program whereby in 2012 we agreed to make upto six of our aircraft (four Boeing 767 and two Airbus A330 aircraft) and in 2013 up to nine of ouraircraft (four Boeing 767 and five Airbus A330 aircraft) available to the federal government for use bythe U.S. military under certain stages of readiness related to national emergencies. The program is astandby arrangement that lets the U.S. Department of Defense U.S. Transportation Command call onas many as nine contractually committed Hawaiian aircraft and crews to supplement military airliftcapabilities in 2013.
A Stage 1 mobilization of the CRAF program is the lowest activation level and would require us tomake one passenger aircraft available (Airbus A330). Under the requirements of a Stage 2mobilization, additional passenger aircraft would be required (one Boeing 767 and two Airbus A330aircraft in 2013). The remaining aircraft subject to the CRAF program would be mobilized under aStage 3 mobilization, which for us in 2013 would involve a total of four Boeing 767 and five AirbusA330 aircraft. While the government would reimburse us for the use of these aircraft, the mobilizationof aircraft under the CRAF program could have a significant adverse impact on our results ofoperations. None of our aircraft are presently mobilized under this program.
Other Regulations
The State of Hawaii is uniquely dependent upon air transportation. The 2008 shutdowns of air carriersAloha Airlines and ATA Airlines affected the State of Hawaii, and its legislature responded by enactinglegislation that reflects and attempts to address its concerns. For example, House Bill 2250 HD1, Act 1of the 2008 Special Session, establishes a statutory scheme for the regulation of Hawaii neighbor islandair carriers, provided that federal legislation is enacted to permit its implementation. Congress has notenacted any legislation that would allow this legislation to go into effect. Additionally, several aspects ofairline operations are subject to regulation or oversight by federal agencies other than the FAA and theDOT. Federal antitrust laws are enforced by the U.S. Department of Justice. The U.S. Postal Servicehas jurisdiction over certain aspects of the transportation of mail and related services provided by ourcargo services. Labor relations in the air transportation industry are generally regulated under theRailway Labor Act. We and other airlines certificated prior to October 24, 1978 are also subject topreferential hiring rights granted by the Airline Deregulation Act to certain airline employees who havebeen furloughed or terminated (other than for cause). The Federal Communications Commission issueslicenses and regulates the use of all communications frequencies assigned to us and the other airlines.There is increased focus on consumer protection both on the federal and state level. We cannot predictthe cost of such requirements on our operations.
11

Additional laws and regulations are proposed from time to time, which could significantly increase thecost of airline operations by imposing additional requirements or restrictions. U.S. law restricts theownership of U.S. airlines to corporations where no more than 25% of the voting stock may be held bynon-U.S. citizens and the airline must be under the actual control of U.S. citizens. The President andtwo thirds of the Board of Directors and other managing officers must also be U.S. citizens.Regulations also have been considered from time to time that would prohibit or restrict the ownershipand/or transfer of airline routes or takeoff and landing slots and authorizations. Also, the award ofinternational routes to U.S. carriers (and their retention) is regulated by treaties and relatedagreements between the U.S. and foreign governments, which are amended from time to time. Wecannot predict what laws and regulations will be adopted or what changes to international airtransportation treaties will be adopted, if any, or how we will be affected by those changes.
Available Information
General information about us, including the charters for the committees of our Board of Directors, canbe found at http://www.hawaiianairlines.com. Our Board of Directors has adopted a code of ethicsentitled ‘‘Code of Business Ethics and Conduct’’ that applies to all of our employees, officers anddirectors. Our code of ethics can be found at http://www.hawaiianairlines.com. Our annual reports onForm 10-K, quarterly reports on Form 10-Q and current reports on Form 8-K, as well as anyamendments and exhibits to those reports, are available free of charge through our website as soon asreasonably practicable after we electronically file them with, or furnish them to, the Securities andExchange Commission (SEC). Information on our website is not incorporated into this Annual Reporton Form 10-K or our other securities filings and is not a part of such filings.
Information about Segment and Geographic Revenue
Information about segment and geographic revenue is set forth in Note 12—Geographic Information tothe Consolidated Financial Statements under Item 8 of this Annual Report on Form 10-K.
ITEM 1A. RISK FACTORS.
In addition to the risks identified elsewhere in this report, the following risk factors apply to ourbusiness, results of operations and financial conditions:
ECONOMIC RISKS
Our business is affected by global economic volatility.
Our business and results of operations are significantly impacted by the general world-wide economicconditions. Demand for discretionary purchases including air travel and vacations to Hawaii, remainsunpredictable. Deterioration in demand may result in a reduction in our passenger traffic and/orincreased competitive pressure on fares in the markets we serve, resulting in a negative impact to ouroperations and financial condition. We cannot assure that we would be able to offset such revenuereductions by reducing our costs.
Our business is highly dependent on the price and availability of fuel.
Our results and operations are heavily impacted by the price and availability of jet fuel. Fuel costsrepresented 34.5%, 31.5%, and 26.5% of Hawaiian’s operating expenses for the years endedDecember 31, 2012, 2011, and 2010, respectively. Approximately 58% of our fuel is based on Singaporejet fuel prices, 35% is based on U.S. West Coast jet fuel prices and 7% on other jet fuel prices. As ofDecember 31, 2012, Singapore jet fuel prices were $2.98 and U.S West Coast jet fuel prices were $3.06,compared to $3.05 and $2.97, respectively, at December 31, 2011. Based on gallons expected to beconsumed in 2013, for every one cent change in the cost per gallon of jet fuel, Hawaiian’s annual fuel
12

expense increases or decreases by approximately $2.3 million. The cost and availability of jet fuelremains volatile and are subject to political, economic and market factors that are generally outside ofour control. Prices may be affected by many factors including, without limitation, the impact of politicalinstability, crude oil production and refining capacity, unexpected changes in the availability ofpetroleum products due to disruptions at distribution systems or refineries, unpredicted increases indemand due to weather or the pace of global economic growth, inventory reserve levels of crude oiland other petroleum products, the relative fluctuation between the U.S. dollar and other majorcurrencies and the actions of speculators in commodity markets. Because of the effects of these factorson the price and availability of jet fuel, the cost and future availability of fuel cannot be predicted withany degree of certainty. Also, due to the competitive nature of the airline industry, there can be noassurance that we will increase our fares or other fees to sufficiently offset increased fuel prices.
The Company enters into derivative agreements to protect against fuel price risk to provide an offsetagainst rising fuel costs. These derivative instruments have not been designated as hedges under ASCTopic 815, Derivatives and Hedging (ASC 815), for hedge accounting treatment. There is no assurancethat such agreements will protect us against price volatility during unfavorable market conditions whichmay also expose us to counterparty credit risk. Also, if fuel prices fall significantly below the levels atthe time we enter into our hedging contracts, we may be required to post a significant amount of cashcollateral, which could have an impact on the level of our unrestricted cash and cash equivalents andadversely affect our liquidity.
Our business is highly dependent on tourism to, from and amongst Hawaii and our financial results couldsuffer if there is a downturn in tourism levels.
Our principal base of operations is in Hawaii and our revenue is linked primarily to the number oftravelers (mostly tourists) to, from and amongst the Hawaiian Islands. Hawaii tourism levels areaffected by, among other things, the political and economic climate in Hawaii’s main tourism markets,the availability of hotel accommodations, promotional spending by competing destinations, thepopularity of Hawaii as a tourist destination relative to other vacation destinations, and other globalfactors, including natural disasters, safety and security. From time to time, various events and industryspecific problems such as strikes have had a negative impact on tourism in Hawaii. The occurrence ofnatural disasters, such as earthquakes and tsunamis, in Hawaii or other parts of the world, could alsohave a material adverse effect on Hawaii tourism. In addition, the potential or actual occurrence ofterrorist attacks, wars such as those in Afghanistan and Iraq, and the threat of other negative worldevents have had, and may in the future again have, a material adverse effect on Hawaii tourism. Noassurance can be given that the level of passenger traffic to Hawaii will not decline in the future. Adecline in the level of Hawaii passenger traffic could have a material adverse effect on our results ofoperations and financial condition.
Our business is exposed to foreign currency exchange rate fluctuations.
Our business is expanding internationally with approximately 30% of our passenger revenue from ourInternational routes. Fluctuations in foreign currencies can significantly affect our results of operationsand financial condition.
LIQUIDITY RISKS
See Item 7, Management’s Discussion and Analysis of Financial Condition and Results of Operations, forfurther information regarding our liquidity.
13

Our financial liquidity could be adversely affected by credit market conditions.
Our business requires access to capital markets to finance equipment purchases, including aircraft, andto provide liquidity in seasonal or cyclical periods of weaker revenue generation. In particular, weintend to obtain additional debt or lease financing for our upcoming aircraft deliveries. Additionally, wewill face specific funding requirements upon the expiration of indebtedness related to the purchase ofthree previously leased Boeing 767-300 aircraft at the end of 2013 and with respect to our obligationunder a purchase agreement with Airbus to acquire wide-body A330-200 aircraft and A350XWB (ExtraWide Body) -800 aircraft with expected delivery dates through 2020. Global credit market conditionsremain unsettled, affecting the availability of financing and increasing the cost of financing that can beacquired. We can offer no assurance that the financing we need will be available when required or thatthe economic terms on which it is available will not adversely affect our financial condition. If wecannot obtain financing or we cannot obtain financing on commercially reasonably terms, our businessand financial condition will be adversely affected.
Our substantial debt could adversely affect our liquidity and financial condition, and include covenants thatimpose restrictions on our financial and business operations.
At December 31, 2012, our total debt was $554.6 million, of which $489.8 million is fixed-rate debt.Our fixed-rate debt primarily consists of facility agreements for our aircraft purchases. Our substantialdebt obligations may adversely affect our ability to incur additional debt in the future on acceptableterms or at all, which will impact our ability to fund our working capital, capital expenditures,acquisitions or other general purpose needs.
Our substantial debt and related covenants could:
• expose us to general adverse economic and industry conditions;
• require us to dedicate a substantial portion of our cash flow from operations to payments on ourdebt, thereby reducing the availability of our cash flow for other operational purposes;
• increase the volatility of the price of our common stock;
• limit our flexibility in planning for, or reacting to, changes in our business and the industry inwhich we operate;
• limit, along with the financial and other restrictive covenants in the agreements governing ourdebt, our ability to borrow additional funds; and
• place us at a competitive disadvantage compared to other less leveraged competitors andcompetitors with debt agreements on more favorable terms than us.
The terms of certain of our financing agreements restrict our ability to, among other things, incuradditional indebtedness, grant liens, merge or consolidate, dispose of assets, prepay indebtedness, makeinvestments, make acquisitions, enter into certain transactions with affiliates, repurchase stock and, inthe case of Hawaiian, pay dividends or make distributions to our parent company. These agreementsalso require us to meet certain financial covenants. If we breach any of these covenants it could resultin a default under these facilities, which could cause our outstanding obligations under these facilitiesto accelerate and become due and payable immediately, and could also cause us to default under ourother debt or lease obligations and lead to an acceleration of the obligations related to such other debtor lease obligations. The existence of such a default could also preclude us from borrowing funds underour credit facilities. Our ability to comply with the provisions of financing agreements can be affectedby events beyond our control and a default under any such financing agreements if not cured orwaived, could have a material adverse impact on us. In the event our debt is accelerated, we may nothave sufficient liquidity to repay these obligations or to refinance our debt obligations, resulting in amaterial adverse impact on us.
14

We could be required to maintain reserves under our credit card processing agreements which could adverselyimpact our financial and business operations.
Under our bank-issued credit card processing agreements, certain proceeds from advance ticket salesmay be held back to serve as collateral to cover any possible chargebacks or other disputed chargesthat may occur. These holdbacks, which are included in restricted cash in our Consolidated BalanceSheets, totaled $5.0 million at December 31, 2012. In the event of a material adverse change in ourbusiness, the holdback could incrementally increase to an amount up to 100% of the applicable creditcard air traffic liability, which would also cause an increase in the level of restricted cash. If we areunable to obtain a waiver, or otherwise mitigate the increase in restricted cash, it could adversely affectour liquidity and also cause a covenant violation under other debt or lease obligations and have amaterial adverse impact on us.
Our obligations for funding our defined benefit pension plans are significant and are affected by factorsbeyond our control.
We sponsor three defined benefit pension plans, as well as a separate plan to administer pilots’disability benefits. Two of the pension plans were frozen effective October 1, 1993, and our collectivebargaining agreement with our pilots provides that pension benefit accruals for certain pilots werefrozen effective January 1, 2008. Nevertheless, our unfunded pension and disability obligation was$193.3 million as of December 31, 2012. We made contributions of $19.4 million and $12.9 million for2012 and 2011, respectively, and anticipate funding $14.7 million (minimum required contribution) tothe defined benefit pension and disability plans during 2013. The timing and amount of fundingrequirements depend upon a number of factors, including labor negotiations and changes to pensionplan benefits as well as factors outside our control, such as the number and demographic data ofqualified retiring employees, asset returns, interest rates and changes in pension laws. These factors,along with the impact of results that can vary significantly from estimates, may significantly impact ourfunding requirements and have an adverse effect on our financial condition.
COMPETITIVE ENVIRONMENT RISKS
We operate in an extremely competitive environment.
The airline industry is characterized by low profit margins, high fixed costs and significant pricecompetition. We currently compete with other airlines on our Neighbor Island, North America andInternational routes. The commencement of, or increase in, service on our routes by existing or newcarriers could negatively impact our operating results. Many of our competitors on our North Americaand International routes are larger and have greater financial resources and brand recognition than wedo. Aggressive marketing tactics or a prolonged fare war initiated by one or more of these competitorscould adversely affect our financial resources and our ability to compete in these markets.
Since airline markets have few natural barriers to entry, we also face the threat of new entrants in allof our markets, including competition from low-cost carriers (LCC). Allegiant, a LCC, launched flightsfrom the West Coast to Hawaii in 2012 and Southwest Airlines has taken further steps to enable thecarrier to provide service to Hawaii in the future, but has yet to formally announce the service.Furthermore, large network carriers have significantly reduced their costs and adjusted their routes tocompete with LCCs in their existing markets by diverting resources to long-haul markets such asHawaii, where LCC competition has been less severe. As a result, network carriers have reduced theircosts of operation and increased capacity in the Hawaii market. Additional capacity to Hawaii, whetherfrom network carriers or LCCs, could result in a decrease in our share of the markets in which weoperate, a decline in our yields, or both, which could have a material adverse effect on our results ofoperations and financial condition.
15
Airline bankruptcy restructuring, strategic combinations or industry consolidation could have an impact onour competitive environment.
In recent years, many of our competitors have dramatically reduced operating costs through acombination of bankruptcy restructuring, industry consolidation and vendor and labor negotiations toincrease market strength. Several domestic airlines were able to reduce labor costs, restructure debtand lease agreements, and implement other financial improvements through the bankruptcy process. Inaddition, certain of our competitors have merged to create larger and more-financially sound airlines.Through consolidation, carriers have the opportunity to achieve cost reductions by eliminatingredundancy in their networks and operating structures. With reduced costs, these competitors are morecapable of operating profitably in an environment of reduced fares and may, as a result, increaseservice in our primary markets or reduce fares to attract additional customers. Because airlinecustomers are price sensitive, we cannot assure that we will be able to attract a sufficient number ofcustomers at sufficiently high fare levels to generate profitability, or that we will be able to reduce ouroperating costs sufficiently to remain competitive with these other airlines.
The concentration of our business in Hawaii, and between Hawaii and the U.S. mainland, provides littlediversification of our revenue.
Approximately 70% of our revenue is generated from air transportation between the islands of Hawaiiand the U.S. mainland, and within the Hawaiian Islands. Many of our competitors, particularly majornetwork carriers with whom we compete on our North America routes, enjoy greater geographicaldiversification of their revenue. A reduction in the level of demand for travel within Hawaii, or toHawaii from the U.S. mainland, or an increase in the level of industry capacity on these routes mayreduce the revenue we are able to generate and adversely affect our financial results. As these routesaccount for a significantly higher proportion of our revenue than they do for many of our competitors,such a reduction would have a relatively greater adverse impact on our financial results.
Our business is affected by the competitive advantages held by network carriers in the North America market.
The majority of competition on our North America routes are from network carriers such as Alaska,American, Delta, United and US Airways. Network carriers have a number of competitive advantagesthat may enable them to offer lower fares and attract higher customer traffic levels as compared to us:
• Network carriers generate passenger traffic from and throughout the U.S. mainland. In contrast,we lack a comparable direct network to feed passengers to our North America flights and are,therefore, more reliant on passenger demand in the specific cities we serve. We also rely on ourcode-share partner agreements (jetBlue, Virgin America Airlines, etc.) to provide customers’access to/from North America destinations currently unserved by us.
• Most network carriers operate from hubs, which can provide a built-in market of passengers,depending on the economic strength of the hub city and the size of the customer group thatfrequent the airline. Our Honolulu and Maui hubs do not originate a large proportion of NorthAmerican travel, nor does it have the population or potential customer franchise of a larger cityto provide us with a built-in market. Passengers in the North America market, for the most part,do not originate in Honolulu, but rather on the U.S. mainland, making Honolulu primarily adestination rather than an origin of passenger traffic.
Our Neighbor Island market is affected by narrow body competition from regional carriers.
Approximately 24% of our revenue is generated from our Neighbor Island routes. Our competitors onthese routes include regional carriers which provide service amongst the Hawaiian Islands includingservice between Oahu, Maui, Hawaii, Molokai, Kauai and Lanai. Although we enjoy a competitiveposition on the Neighbor Island service, increased competition is possible. For example, Island Air
16

recently announced its intent to increase capacity on travel throughout the Neighbor Island routes withlease commitments for six additional aircraft. We have also recently purchased two turboprop aircraftto expand our Neighbor Island network to areas we currently do not serve and to meet the traveldemands of our passengers. However, a decline in our share of the Neighbor Island market due toincreased capacity provided by our competitors could have a material adverse effect on our results ofoperations and financial condition.
Our International routes are affected by competition from domestic and foreign carriers.
Approximately 30% of our revenue is generated from our International routes. Our competitors onthese routes include both domestic and foreign carriers. Both domestic and foreign competitors have anumber of competitive advantages that may enable them to offer lower fares and attract highercustomer traffic levels as compared to us:
• Many of our domestic competitors have joined airline alliances, including SkyTeam, Star Allianceand Oneworld, none of which we participate in, which provide customers access to eachparticipating airline’s international network, allowing for convenience and connectivity to theirdestinations. These alliances formed by our domestic competitors have increased in recent years.In some instances our domestic competitors have been granted antitrust exemptions to formjoint venture arrangements in certain geographies further deepening their cooperation on certainroutes. We currently do not participate in a world-wide airline alliance or any joint ventures,which may negatively impact our market share and operations as capacity provided by ourcompetitors increase. To mitigate this risk, we rely on code-share agreements with partnerairlines to provide customers access to international destinations currently unserved by us.
• Many of our foreign competitors such as Japan Airlines, All Nippon Airways, Qantas, KoreanAir, Philippine Airlines, are network carriers that generate passenger traffic throughoutInternational routes that we service. In contrast, we lack a comparable direct network to feedpassengers to our International flights, and are therefore, more reliant on passenger demand inthe specific destinations that we serve. Most network carriers operate from hubs, which canprovide a built-in home base market of passengers. Passengers on our International routes, forthe most part, do not originate in Hawaii, but rather internationally, in these foreign markets’home base. We also rely on our code-sharing agreements (All Nippon Airways, Korean Air,Virgin Australia, etc.) and our relationships with travel agencies and wholesale distributors toprovide customers’ access to/from International destinations currently unserved by us.
STRATEGY AND BRAND RISKS
Our failure to successfully implement our growth strategy and related cost-reduction goals could harm ourbusiness.
Our growth strategy includes initiatives to increase revenue, decrease costs, expand our existingmarkets, and initiate service on new routes and markets that we currently do not serve in the U.S. andinternationally. It is critical that we achieve our growth strategy in order for our business to attaineconomies of scale and to sustain or improve our results of operations. If we are unable to utilize andfill increased capacity provided by additional aircraft entering our fleet, hire and retain skilledpersonnel, secure the required equipment and facilities in a cost-effective manner, or obtain thenecessary regulatory approvals, we may not be able to successfully implement our growth strategy intonew and existing markets in the U.S. and internationally, and our business and operations could beadversely affected.
17
We continue to strive toward aggressive cost-containment goals which are an important part of ourbusiness strategy to offer the best value to passengers through competitive fares while maintainingacceptable profit margins and return on capital. We believe a lower cost structure will better position usto fund our growth strategy and take advantage of market opportunities. If we are unable to adequatelycontain our non-fuel unit costs, we likely will not be able to achieve our growth plan and our financialresults may suffer.
Our reputation and financial results could be harmed in the event of adverse publicity, including the event ofan aircraft accident.
Our customer base is broad and our business activities have significant prominence, particularly in theState of Hawaii and the other cities we serve. Consequently, negative publicity resulting from real orperceived shortcomings in our customer service, employee relations, business conduct, or other eventsaffecting our operations could negatively affect the public image of our company and the willingness ofcustomers to purchase services from us, which could affect our revenue and financial results.
Additionally, we are exposed to potential losses that may be incurred in the event of an aircraftaccident. Any such accident could involve not only the repair or replacement of a damaged aircraft andits consequential temporary or permanent loss of revenue, but also significant potential claims ofinjured passengers and others. We are required by the DOT to carry liability insurance, and althoughwe currently maintain liability insurance in amounts consistent with the industry, we cannot be assuredthat our insurance coverage will adequately cover us from all claims and we may be forced to bearsubstantial losses incurred with the accident. In addition, any aircraft accident or incident could cause apublic perception that we are less safe or reliable than other airlines, which would harm our business.
Our failure to successfully implement our turboprop operations may impact our financial and businessoperations.
In 2012, we purchased and took delivery of two ATR42 turboprop aircraft with service to new NeighborIsland routes previously unserved by us to begin in 2013. We cannot be assured that we will successfullyimplement our turboprop operations in a timely and cost-efficient manner and comply with allapplicable state and operational regulations. New entrants or changes to existing competition on theseNeighbor Island routes currently unserved by us could have an adverse effect on our results ofoperations and financial condition.
FLEET AND FLEET-RELATED RISKS
We are dependent on a limited number of suppliers for aircraft, aircraft engines and parts.
We are dependent on Boeing and Airbus as our primary supplier of aircraft and aircraft-related items.As a result, we are vulnerable to any problems associated with the supply of those aircraft and partswhich could result in increased parts and maintenance costs in future years.
Our agreement to purchase Airbus A330-200 and A350XWB-800 aircraft and our memorandum ofunderstanding to purchase Airbus A321neo aircraft significantly increases our future financial commitmentsand operating costs and creates implementation risk associated with the transition from our existing Boeing767-300 fleet.
As of December 31, 2012, our firm aircraft orders consisted of thirteen A330-200 aircraft for deliverybetween 2013 and 2015 and six A350XWB-800 aircraft for delivery beginning in 2017, along withpurchase rights for an additional three A330-200 aircraft and six A350XWB-800 aircraft. We havemade substantial pre-delivery payments for the purchased aircraft and are required to continue thesepre-delivery payments as well as payments for the balance of the purchase price through delivery ofeach aircraft. These commitments substantially increase our future capital spending requirements and
18

will require us to significantly increase our level of debt in future years. There can be no assurance thatwe will be able to raise capital to finance these requirements or that such financing can be obtained onfavorable terms, or at all.
In January 2013, we entered into a memorandum of understanding for the purchase of 16 AirbusA321neo aircraft scheduled for delivery between 2017 and 2020, along with purchase rights for anadditional nine aircraft. When we execute a firm commitment through the execution of a purchaseagreement, which we expect will occur in the first quarter of 2013, we expect our future capitalspending requirement and level of debt to increase significantly in future years. We also anticipatesubstantial pre-delivery payments through the delivery date of each aircraft.
The Airbus aircraft will replace expiring leased and retiring Boeing 767-300 aircraft in future years.Although we do not expect to incur significant lease return costs, we cannot be assured that such costswill not exceed our expectations and adversely impact our results of operations and liquidity.
The addition of the Airbus aircraft to our fleet will require us to incur additional costs related to theacquisition of spare engines and replacement parts, maintenance of the aircraft, training of crews andground employees, the addition of these aircraft types to our operating certificate and otherimplementation activities. There can be no assurance that we will be able to recover these coststhrough the future operation of these aircraft in our fleet or that we will not experience delays in theimplementation process which could adversely affect our operations or financial performance.
Delays in scheduled aircraft deliveries or other loss of fleet capacity may adversely impact our operations andfinancial results.
The success of our business depends on, among other things, the ability to effectively operate a certainnumber and type of aircraft. As mentioned above, we have contractual commitments to purchase andintegrate Airbus aircraft into our fleet. If for any reason we are unable to secure deliveries of theAirbus aircraft on contractually scheduled delivery dates and successfully introduce these aircraft intoour fleet, then our business, operations and financial performance could be negatively impacted. Ourfailure to integrate newly purchased Airbus aircraft into our fleet as planned may require us to seekextensions on our existing leased aircraft. Such extensions may require us to operate existing aircraftbeyond the point at which it is economically optimal to retire them, resulting in increased maintenancecosts.
COMMON STOCK RISKS
Our share price is subject to fluctuations and stockholders could have difficulty trading shares.
The market price of our stock is influenced by many factors, a number of which are outside of ourcontrol, and include the following:
• operating results and financial condition;
• changes in the competitive environment in which we operate;
• fuel price volatility including the availability of fuel;
• announcements concerning our competitors including bankruptcy filings, mergers, restructuringsor acquisitions by other airlines;
• increases or changes in government regulation;
• general and industry specific market conditions;
• changes in financial estimates or recommendations by securities analysts; and
• sales of our common stock or other actions by investors with significant shareholdings.
19

In recent years the stock market has experienced volatile price and volume fluctuations that often havebeen unrelated to the operating performance of individual companies. These market fluctuations, aswell as general economic conditions may affect the price of our common stock.
In the past, securities class action litigation has often been instituted against a company followingperiods of volatility in the company’s stock price. This type of litigation, if filed against us, could resultin substantial costs and divert our management’s attention and resources. In addition, the future sale ofa substantial number of shares of common stock by us or by our existing stockholders may have anadverse impact on the market price of the shares of common stock. There can be no assurance that thetrading price of our common stock will remain at or near its current level.
The issuance of common stock upon conversion of convertible notes could cause dilution to the interests of ourexisting stockholders.
As of December 31, 2012, we had $86.25 million aggregate principal amount of convertible notesoutstanding. Upon conversion, we will have the right, at our election, to pay or deliver cash, shares ofthe Company’s common stock or a combination thereof. Holders may convert their convertible notes attheir option at any time prior to November 15, 2015, if specific conditions are met. Holders mayrequire us to repurchase all or a portion of the convertible notes upon a fundamental change, primarilya change in control or a termination of trading, at a cash repurchase price equal to 100% of theprincipal amount of the convertible notes plus accrued and unpaid interest. The number of sharesissued could be significant and such an issuance could cause significant dilution to the interests of theexisting stockholders. In addition, if we elect to pay the repurchase price in cash, our liquidity could beadversely affected.
INFORMATION TECHNOLOGY AND THIRD-PARTY RISKS
We are increasingly dependent on technology and automated systems to operate our business.
We depend heavily on technology and automated systems to effectively operate our business. Thesesystems include flight operations systems, communications systems, airport systems, reservationssystems, management and accounting systems, commercial websites, including www.hawaiianairlines.com,and other systems, all of which must be able to accommodate high traffic volumes, maintain secureinformation and provide accurate flight information, as well as process critical financial relatedtransactions. Any substantial or repeated failures of these systems could negatively affect our customerservice, compromise the security of customer information, result in the loss of important data, loss ofrevenue and increased costs, and generally harm our business. Like other companies, our systems maybe vulnerable to disruptions due to events beyond our control, including natural disasters, powerdisruptions, software or equipment failures, terrorist attacks, cybersecurity threats, computer viruses andhackers. There can be no assurance that the measures we have taken to reduce the adverse effects ofcertain potential failures or disruptions are adequate to prevent or remedy disruptions of our systems.In addition, we will need to continuously make significant investments in technology to periodicallyupgrade and replace existing systems. If we are unable to make these investments or fail to successfullyimplement, upgrade or replace our systems, our business could be adversely impacted.
If we do not maintain the privacy and security of customer-related information, we could damage ourreputation, incur substantial additional costs and become subject to litigation.
We receive, retain, and transmit certain personal information about our customers. In addition, ouronline operation at www.hawaiianairlines.com relies on the secure transmission of confidentialinformation over public networks, including credit card information. A compromise of our physical andnetwork security systems through a cybersecurity attack, including those of our business partners, maythreaten our customers’ personal information being obtained by unauthorized persons, which could
20
adversely affect our reputation, as well as negatively impact our business, results of operations, financialposition and liquidity, and could result in the imposition of penalties or litigation against us. Inaddition, a cybersecurity breach could require that we expend significant additional resources related tothe security of information systems which could result in a disruption of our operations.
We are highly reliant on third-party contractors to provide certain facilities and services for our operations,and termination of our third-party agreements could have a potentially adverse effect on our financial results.
We have historically relied on outside vendors for a variety of services and functions critical to ourbusiness, including aircraft maintenance and parts, code-sharing, reservations, computer servicesincluding hosting and software maintenance, accounting, frequent flyer programs, passenger processing,ground facilities, baggage and cargo handling, personnel training and the distribution and sale of airlineseats. As part of our cost-reduction efforts, our reliance on outside vendors has increased and maycontinue to do so in the future.
The failure of any of our third-party service providers to adequately perform our service obligations, orother interruptions of services, may reduce our revenues, increase expenses, and prevent us fromoperating our flights and providing other services to our customers. In addition, our business andfinancial performance could be materially harmed if our customers believe that our services areunreliable or unsatisfactory.
LABOR RELATIONS AND RELATED COSTS RISKS
We are dependent on satisfactory labor relations.
Labor costs are a significant component of airline expenses and can substantially impact an airline’sresults of operations. Labor and related benefit costs represented approximately 21% of our operatingexpenses for the year ended December 31, 2012. At December 31, 2012, approximately 87% of ourworkforce was unionized. We may make strategic and operational decisions that require the consent ofone or more of our labor unions, and cannot assure you that these labor unions will not requireadditional wages, benefits or other consideration in return for their consent. In addition, we haveentered into collective bargaining agreements with our pilots, mechanical group employees, clericalgroup employees, flight attendants, and dispatchers. Currently, we are not in negotiations with respectto any of our existing collective bargaining agreements. We cannot assure you that future agreementswith our employees’ unions will be on terms in line with our expectations or comparable to agreementsentered into by our competitors, and any future agreements may increase our labor costs or otherwiseadversely affect us. If we are unable to reach an agreement with any unionized work group, we may besubject to future work interruptions and/or stoppages, which may hamper or halt operations.
Our operations may be adversely affected if we are unable to attract and retain qualified personnel and keyexecutives, including our Chief Executive Officer.
We are dependent on the knowledge and expertise of our key executives, particularly Mark B.Dunkerley, our Chief Executive Officer, who signed an amended and restated employment agreementin November 2012, for employment through January 1, 2017. Our ability to attract and retain suchpersonnel in the airline industry is highly competitive, and we cannot be certain that we will be able toretain our Chief Executive Officer or other key executives or that we can attract other qualifiedpersonnel in the future. Any inability to retain our Chief Executive Officer and other key executives, orattract and retain additional qualified executives, could have a negative impact on our operations.
In addition, as we continue to expand our operations through the acquisition of new aircraft andintroduction of service to new markets, it may be challenging to attract qualified personnel includingpilots, mechanics, flight attendants and other skilled labor. As we compete with other carriers forqualified personnel we also face the challenge of attracting individuals who embrace our team-oriented,
21
friendly and customer-driven corporate culture. Our inability to attract and retain qualified personnel,who embrace our corporate culture, could have a negative impact on our reputation and overalloperations.
AIRLINE INDUSTRY, REGULATION AND RELATED COSTS RISKS
The airline industry has substantial operating leverage and is affected by many conditions that are beyond itscontrol, including delays, cancellations and other conditions, which could harm our financial condition andresults of operations.
The airline industry operates on low gross profit margins consisting of a high percentage of fixed costs.Due to these fixed costs, the expense incurred on each flight does not vary proportionately with thenumber of passengers carried, however the revenue generated from a particular flight is directly relatedto the number of passengers carried and the respective average fares applied. Accordingly, a decreasein the number of passengers carried would cause a corresponding decrease in revenue (if not offset byhigher fares), and it may result in a disproportionately greater decrease in profits. Therefore, anygeneral reduction in airline passenger traffic as a result of any of the following or other factors, whichare largely outside of our control, could harm our business, financial condition and results ofoperations.
• continued threat of terrorist attacks and conflicts overseas;
• actual or threatened war and political instability;
• adverse weather and natural disasters;
• changes in consumer preferences, perceptions or spending patterns;
• increased costs related to security and safety measures;
• outbreak of contagious diseases; and
• actual or potential disruptions in the air traffic control system.
Our results from operations may be volatile subject to the conditions identified above. We cannotassure you that our financial resources will be sufficient to absorb the effects of any of theseunexpected factors should they arise.
Our business is subject to substantial seasonal and cyclical volatility.
Our results of operations will reflect the impact of seasonal volatility primarily due to passenger leisureand holiday travel patterns. As Hawaii is a popular vacation destination, demand from North America,our largest source of visitors, is typically stronger during June, July, August and December andconsiderably weaker at other times of the year. As we enter new markets, we could be subject toadditional seasonal variations. Because of fluctuations in our results from seasonality, operating resultsfor a historical period are not necessarily indicative of operating results for a future period andoperating results for an interim period are not necessarily indicative of operating results for an entireyear.
Terrorist attacks or international hostilities, or the fear of terrorist attacks or hostilities, even if not madedirectly on the airline industry could negatively affect us and the airline industry.
Terrorist attacks, even if not made directly on the airline industry or the fear of such attacks, hostilitiesor act of war, could adversely affect the airline industry, including us, and could result in a significantdecrease in demand for air travel, increased security costs, increased insurance costs coveringwar-related risks, and increased flight operational loss due to cancellations and delays. Any futureterrorist attacks or the implementation of additional security-related fees could have a material adverse
22

impact on our business, financial condition and results of operations and on the airline industry ingeneral.
The airline industry is subject to extensive government regulation, new regulations, and taxes which couldhave an adverse effect on our financial condition and results of operations.
Airlines are subject to extensive regulatory requirements that result in significant costs. Additional laws,regulations, taxes and airport rates and charges imposed by domestic and foreign governments havebeen proposed from time to time that could significantly increase the cost of airline operations orreduce revenue. For example, the ATSA, which became law in November 2001, mandates thefederalization of certain airport security procedures and imposes additional security requirements onairlines. The FAA from time to time issues directives and other regulations relating to the maintenanceand operation of aircraft that require significant expenditures. Some FAA requirements cover, amongother things, retirement of older aircraft, security measures, collision avoidance systems, airbornewindshear avoidance systems, noise abatement and other environmental concerns, commuter aircraftsafety and increased inspections and maintenance procedures to be conducted on older aircraft. UnderDepartment of Transportation regulations effective January 2012, all taxes and fees imposed by thegovernment must be disclosed in fares charged to customers. Also, in January 2012, the Department ofTransportation announced new flight crew rest rules which require mandatory rest periods for airlineflight crews, including flight attendants and pilots for both traditional scheduled service and charteroperations, to prevent fatigue on flights. This rule is effective as of January 2014; however we havestarted to implement crew rest pods in our Airbus aircraft that provide long-haul service exceeding theminimum rest requirement rules. We expect to continue incurring expenses to comply with applicableregulations. We cannot predict the impact that laws or regulations may have on our operations orassure you that laws or regulations enacted in the future will not adversely affect us.
Many aspects of airlines’ operations also are subject to increasingly stringent federal, state, local andforeign laws protecting the environment. U.S. federal laws that have a particular impact on us includethe Airport Noise and Capacity Act of 1990, the Clean Air Act, the Resource Conservation andRecovery Act, the Clean Water Act, the Safe Drinking Water Act, the Comprehensive EnvironmentalResponse Act, and the Compensation and Liability Act. Governments globally are increasingly focusingon the environmental impact caused by the consumption of fossil fuels and as a result have proposedor enacted legislation which may increase the cost of providing airline service or restrict its provision.We expect the focus on environmental matters to increase. Future regulatory developments in the U.S.and abroad could adversely affect operations and increase operating costs in the airline industry. Forexample, potential future actions that may be taken by the U.S. government, foreign governments, orthe International Civil Aviation Organization to limit the emission of greenhouse gases by the aviationsector are unknown at this time, but the effect on us and our industry is likely to be adverse and couldbe significant. The U.S. Congress is considering climate change legislation and the EnvironmentalProtection Agency issued a rule which regulates larger emitters of greenhouse gases. We cannot predictthe impact that future environment regulations may have on our operations or assure you thatregulations enacted in the future will not adversely affect us. The impact to us and our industry fromsuch actions is likely to be adverse and could be significant, particularly if regulators were to concludethat emissions from commercial aircraft cause significant harm to the upper atmosphere or have agreater impact on climate change than other industries.
Our operations may be adversely affected by its expansion into non-U.S. jurisdictions and the related increasein laws to which it is subject.
The expansion of our operations into non-U.S. jurisdictions has expanded the scope of the laws towhich we are subject, both domestically and internationally. In addition, operations in non-U.S.jurisdictions are in many cases subject to the laws of those jurisdictions rather than U.S. laws. Laws in
23

some jurisdictions differ in significant respects from those in the United States, and these differencescan affect our ability to react to changes in our business. Further, enforcement of laws in somejurisdictions can be inconsistent and unpredictable, which can affect our ability to enforce our rightsand to undertake activities that we believe are beneficial to our business. As a result, our ability togenerate revenue and the expenses paid in non-U.S. jurisdictions may differ from what would beexpected if U.S. law governed these operations.
Our financial results may be negatively affected by increased airport rent rates and landing fees at theairports within the State of Hawaii as a result of the State’s modernization plan.
The State of Hawaii has begun to implement a modernization plan encompassing the airports we servewithin the State. Our landing fees and airport rent rates have increased to fund the modernizationprogram. Additionally, we expect the costs for our Neighbor Island operations to increase more thanthe costs related to our North America and International operations due to phased adjustments to theairport’s funding mechanism. Therefore, costs related to the modernization program will have a greaterimpact on our operations as compared to our competitors, whom do not have significant NeighborIsland operations. We can offer no assurance that we will be successful in offsetting these cost increasesthrough other cost reductions or increases in our revenue and, therefore, can offer no assurance thatour future financial results will not be negatively affected by them.
Our insurance costs are susceptible to significant increases and further increases in insurance costs orreductions in coverage could have an adverse effect on our financial results.
We carry types and amounts of insurance customary in the airline industry, including coverage forgeneral liability, passenger liability, property damage, aircraft loss or damage, baggage and cargoliability and workers’ compensation. We are required by the DOT to carry liability insurance on each ofour aircraft. We currently maintain commercial airline insurance with a major group of independentinsurers that regularly participate in world aviation insurance markets, including public liabilityinsurance and coverage for losses resulting from the physical destruction or damage to our aircraft.However, there can be no assurance that the amount of such coverage will not be changed or that wewill not bear substantial losses from accidents or damage to, or loss of, aircraft or other property dueto other factors such as natural disasters. We could incur substantial claims resulting from an accidentor damage to, or loss of, aircraft or other property due to other factors such as natural disasters inexcess of related insurance coverage that could have a material adverse effect on our results ofoperations and financial condition.
After the events of September 11, 2001, aviation insurers significantly reduced the maximum amount ofinsurance coverage available to commercial air carriers for liability to persons other than employees orpassengers for claims resulting from acts of terrorism, war or similar events (war-risk coverage). At thesame time, they significantly increased the premiums for such coverage as well as for aviation insurancein general. As a result, war-risk insurance in amounts necessary for our operations, and at premiumsthat are not excessive, is not currently available in the commercial insurance market and we havetherefore purchased from the U.S. government third-party war-risk insurance coverage. Should thegovernment discontinue this coverage, obtaining comparable coverage from commercial underwriterscould result in substantially higher premiums and more restrictive terms, if it is available at all. If weare unable to obtain adequate war-risk insurances our business could be materially and adverselyaffected.
ITEM 1B. UNRESOLVED STAFF COMMENTS.
None.
24
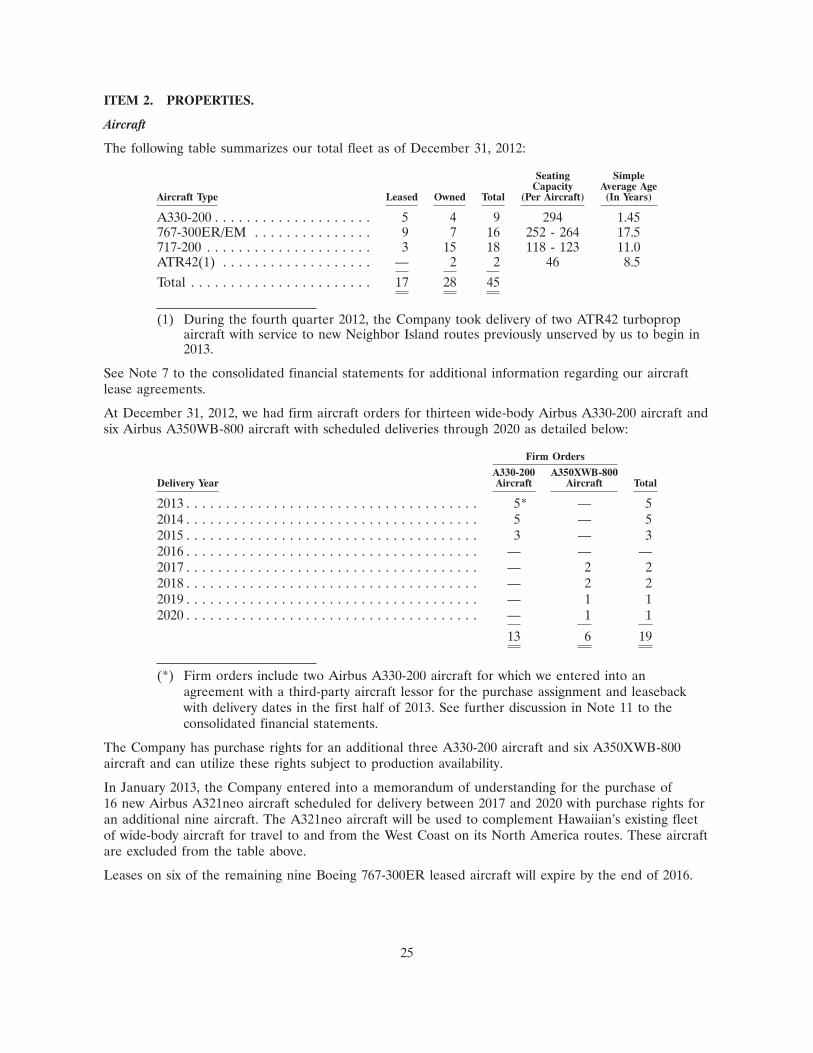
ITEM 2. PROPERTIES.
Aircraft
The following table summarizes our total fleet as of December 31, 2012:
Seating SimpleCapacity Average Age
Aircraft Type Leased Owned Total (Per Aircraft) (In Years)
A330-200 . . . . . . . . . . . . . . . . . . . . 5 4 9 294 1.45767-300ER/EM . . . . . . . . . . . . . . . 9 7 16 252 - 264 17.5717-200 . . . . . . . . . . . . . . . . . . . . . 3 15 18 118 - 123 11.0ATR42(1) . . . . . . . . . . . . . . . . . . . — 2 2 46 8.5Total . . . . . . . . . . . . . . . . . . . . . . . 17 28 45
(1) During the fourth quarter 2012, the Company took delivery of two ATR42 turbopropaircraft with service to new Neighbor Island routes previously unserved by us to begin in2013.
See Note 7 to the consolidated financial statements for additional information regarding our aircraftlease agreements.
At December 31, 2012, we had firm aircraft orders for thirteen wide-body Airbus A330-200 aircraft andsix Airbus A350WB-800 aircraft with scheduled deliveries through 2020 as detailed below:
Firm Orders
A330-200 A350XWB-800Delivery Year Aircraft Aircraft Total
2013 . . . . . . . . . . . . . . . . . . . . . . . . . . . . . . . . . . . . . 5* — 52014 . . . . . . . . . . . . . . . . . . . . . . . . . . . . . . . . . . . . . 5 — 52015 . . . . . . . . . . . . . . . . . . . . . . . . . . . . . . . . . . . . . 3 — 32016 . . . . . . . . . . . . . . . . . . . . . . . . . . . . . . . . . . . . . — — —2017 . . . . . . . . . . . . . . . . . . . . . . . . . . . . . . . . . . . . . — 2 22018 . . . . . . . . . . . . . . . . . . . . . . . . . . . . . . . . . . . . . — 2 22019 . . . . . . . . . . . . . . . . . . . . . . . . . . . . . . . . . . . . . — 1 12020 . . . . . . . . . . . . . . . . . . . . . . . . . . . . . . . . . . . . . — 1 1
13 6 19
(*) Firm orders include two Airbus A330-200 aircraft for which we entered into anagreement with a third-party aircraft lessor for the purchase assignment and leasebackwith delivery dates in the first half of 2013. See further discussion in Note 11 to theconsolidated financial statements.
The Company has purchase rights for an additional three A330-200 aircraft and six A350XWB-800aircraft and can utilize these rights subject to production availability.
In January 2013, the Company entered into a memorandum of understanding for the purchase of16 new Airbus A321neo aircraft scheduled for delivery between 2017 and 2020 with purchase rights foran additional nine aircraft. The A321neo aircraft will be used to complement Hawaiian’s existing fleetof wide-body aircraft for travel to and from the West Coast on its North America routes. These aircraftare excluded from the table above.
Leases on six of the remaining nine Boeing 767-300ER leased aircraft will expire by the end of 2016.
25

Ground Facilities
Our principal terminal facilities, cargo facilities and hangar and maintenance facilities are located at theHonolulu International Airport (HNL). The majority of the facilities at HNL are leased on amonth-to-month basis. We are also charged for the use of terminal facilities at the four major NeighborIsland airports owned by the State of Hawaii. Some terminal facilities, including gates and holdingrooms, are considered by the State of Hawaii to be common areas and thus are not exclusivelycontrolled by us. Other facilities, including station managers’ offices, Premier Club lounges andoperations support space, are considered exclusive-use space by the State of Hawaii.
We are party to signatory agreements with the Port of Portland and McCarran International Airport(Las Vegas), and operating agreements with the City of Phoenix, Port of San Diego, McCarranInternational Airport in Las Vegas, Nevada, the City of Los Angeles, the County of Sacramento, theCity of Oakland, Societe D’Equipment De Tahiti Et Des Iles (SETIL) for Faa’a International Airportin Papeete, Tahiti, Fukuoka International Airport in Fukuoka, Japan, Haneda International Airport inTokyo, Japan, Kansai International Airport in Osaka, Japan, and Incheon International Airport inSeoul, South Korea. We are party to a License Agreement with jetBlue Airlines in San Diego,California, Phoenix, Arizona, and New York, New York for the use of ticket counter space and otheroperational areas. We are party to lease agreements with the Government of American Samoa in PagoPago, Sydney Airport Corporation, Limited, in Sydney, Australia and Hokkaido Airport Terminal Co.,Limited, in Sapporo, Japan. We also have agreements in place for alternate landing sites with the Portof Moses Lake, King County (Boeing Field) in Seattle, Ontario International Airport in California,Fairbanks International Airport in Alaska and the Guam International Airport in Guam.
26

The table below sets forth the airport locations we utilize pursuant to various lease agreements as ofDecember 31, 2012:
Name of Airport Location
Phoenix Sky Harbor International Airport . . . . . Phoenix ArizonaLos Angeles International Airport . . . . . . . . . . . Los Angeles CaliforniaOakland International Airport . . . . . . . . . . . . . . Oakland CaliforniaSacramento International Airport . . . . . . . . . . . . Sacramento CaliforniaSan Diego International Airport . . . . . . . . . . . . San Diego CaliforniaSan Francisco International Airport . . . . . . . . . . San Francisco CaliforniaNorman Y. Mineta San Jose International
Airport . . . . . . . . . . . . . . . . . . . . . . . . . . . . . San Jose CaliforniaHilo International Airport . . . . . . . . . . . . . . . . . Hilo HawaiiHonolulu International Airport . . . . . . . . . . . . . Honolulu HawaiiKahului Airport . . . . . . . . . . . . . . . . . . . . . . . . Kahului HawaiiKona International Airport . . . . . . . . . . . . . . . . Kona HawaiiLihue Airport . . . . . . . . . . . . . . . . . . . . . . . . . . Lihue HawaiiMcCarran International Airport . . . . . . . . . . . . . Las Vegas NevadaJohn F. Kennedy International Airport . . . . . . . . New York New YorkPortland International Airport . . . . . . . . . . . . . . Portland OregonSeattle-Tacoma International Airport . . . . . . . . . Seattle WashingtonPago Pago International Airport . . . . . . . . . . . . Pago Pago American SamoaFaa’a International Airport . . . . . . . . . . . . . . . . Papeete TahitiBrisbane International Airport . . . . . . . . . . . . . . Brisbane AustraliaSydney International Airport . . . . . . . . . . . . . . . Sydney AustraliaNinoy Aquino International Airport . . . . . . . . . . Manila PhilippinesFukuoka International Airport . . . . . . . . . . . . . . Fukuoka JapanKansai International Airport . . . . . . . . . . . . . . . Osaka JapanHaneda International Airport . . . . . . . . . . . . . . Tokyo JapanNew Chitose International Airport . . . . . . . . . . . Sapporo JapanIncheon International Airport . . . . . . . . . . . . . . Seoul South Korea
Our corporate headquarters are located in leased premises adjacent to the Honolulu InternationalAirport.
ITEM 3. LEGAL PROCEEDINGS.
We are subject to legal proceedings arising in the normal course of our operations. We do notanticipate that the disposition of any currently pending proceeding will have a material effect on ouroperations, business or financial condition.
ITEM 4. MINE SAFETY DISCLOSURES.
Not applicable.
27
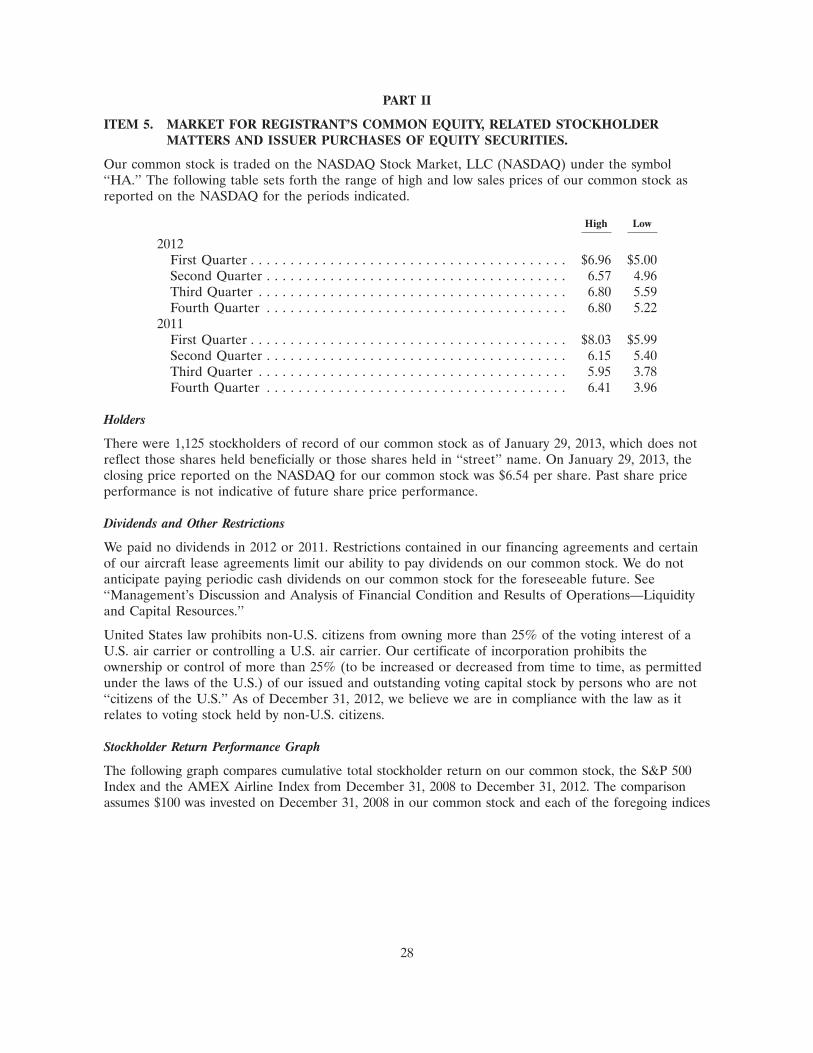
PART II
ITEM 5. MARKET FOR REGISTRANT’S COMMON EQUITY, RELATED STOCKHOLDERMATTERS AND ISSUER PURCHASES OF EQUITY SECURITIES.
Our common stock is traded on the NASDAQ Stock Market, LLC (NASDAQ) under the symbol‘‘HA.’’ The following table sets forth the range of high and low sales prices of our common stock asreported on the NASDAQ for the periods indicated.
High Low
2012First Quarter . . . . . . . . . . . . . . . . . . . . . . . . . . . . . . . . . . . . . . . . $6.96 $5.00Second Quarter . . . . . . . . . . . . . . . . . . . . . . . . . . . . . . . . . . . . . . 6.57 4.96Third Quarter . . . . . . . . . . . . . . . . . . . . . . . . . . . . . . . . . . . . . . . 6.80 5.59Fourth Quarter . . . . . . . . . . . . . . . . . . . . . . . . . . . . . . . . . . . . . . 6.80 5.22
2011First Quarter . . . . . . . . . . . . . . . . . . . . . . . . . . . . . . . . . . . . . . . . $8.03 $5.99Second Quarter . . . . . . . . . . . . . . . . . . . . . . . . . . . . . . . . . . . . . . 6.15 5.40Third Quarter . . . . . . . . . . . . . . . . . . . . . . . . . . . . . . . . . . . . . . . 5.95 3.78Fourth Quarter . . . . . . . . . . . . . . . . . . . . . . . . . . . . . . . . . . . . . . 6.41 3.96
Holders
There were 1,125 stockholders of record of our common stock as of January 29, 2013, which does notreflect those shares held beneficially or those shares held in ‘‘street’’ name. On January 29, 2013, theclosing price reported on the NASDAQ for our common stock was $6.54 per share. Past share priceperformance is not indicative of future share price performance.
Dividends and Other Restrictions
We paid no dividends in 2012 or 2011. Restrictions contained in our financing agreements and certainof our aircraft lease agreements limit our ability to pay dividends on our common stock. We do notanticipate paying periodic cash dividends on our common stock for the foreseeable future. See‘‘Management’s Discussion and Analysis of Financial Condition and Results of Operations—Liquidityand Capital Resources.’’
United States law prohibits non-U.S. citizens from owning more than 25% of the voting interest of aU.S. air carrier or controlling a U.S. air carrier. Our certificate of incorporation prohibits theownership or control of more than 25% (to be increased or decreased from time to time, as permittedunder the laws of the U.S.) of our issued and outstanding voting capital stock by persons who are not‘‘citizens of the U.S.’’ As of December 31, 2012, we believe we are in compliance with the law as itrelates to voting stock held by non-U.S. citizens.
Stockholder Return Performance Graph
The following graph compares cumulative total stockholder return on our common stock, the S&P 500Index and the AMEX Airline Index from December 31, 2008 to December 31, 2012. The comparisonassumes $100 was invested on December 31, 2008 in our common stock and each of the foregoing indices
28

2FEB201303394661
and assumes reinvestment of dividends before consideration of income taxes. We have paid no dividendson our common stock.
$-
$50
$100
$150
$250
$200
2008 2009 201220112010
Hawaiian Holdings Common StockS & P 500 IndexAMEX Airline Index
12/31/2008 12/31/2009 12/31/2010 12/31/2011 12/31/2012
Hawaiian Holdings Common Stock . . . . . . . . . . $100.00 $109.72 $122.88 $ 90.91 $102.98S & P 500 Index . . . . . . . . . . . . . . . . . . . . . . . 100.00 126.46 145.51 148.59 172.37AMEX Airline Index(1) . . . . . . . . . . . . . . . . . . 100.00 139.32 193.82 133.72 182.40
(1) As of December 31, 2012, the AMEX Airline Index consisted of Alaska Air Group, Inc., CopaHoldings SA, Delta Air Lines Inc., GOL Linhas A, Hawaiian Holdings Inc., jetBlue AirwaysCorporation, US Airways Group, Inc., LATAM Airlines Group S.A., Southwest Airlines Co.,Republic Airways Holdings Inc., Ryanair Holdings plc, Spirit Airlines, Inc., SkyWest Inc., andUnited Continental Holdings, Inc.
The stock performance depicted in the graph above is not to be relied upon as indicative of futureperformance. The stock performance graph shall not be deemed to be incorporated by reference intoany of our filings under the Securities Act or the Exchange Act, except to the extent that wespecifically incorporate the same by reference, nor shall it be deemed to be ‘‘soliciting material’’ or tobe ‘‘filed’’ with the SEC or subject to Regulations 14A or 14C or to the liabilities of Section 18 of theExchange Act.
29
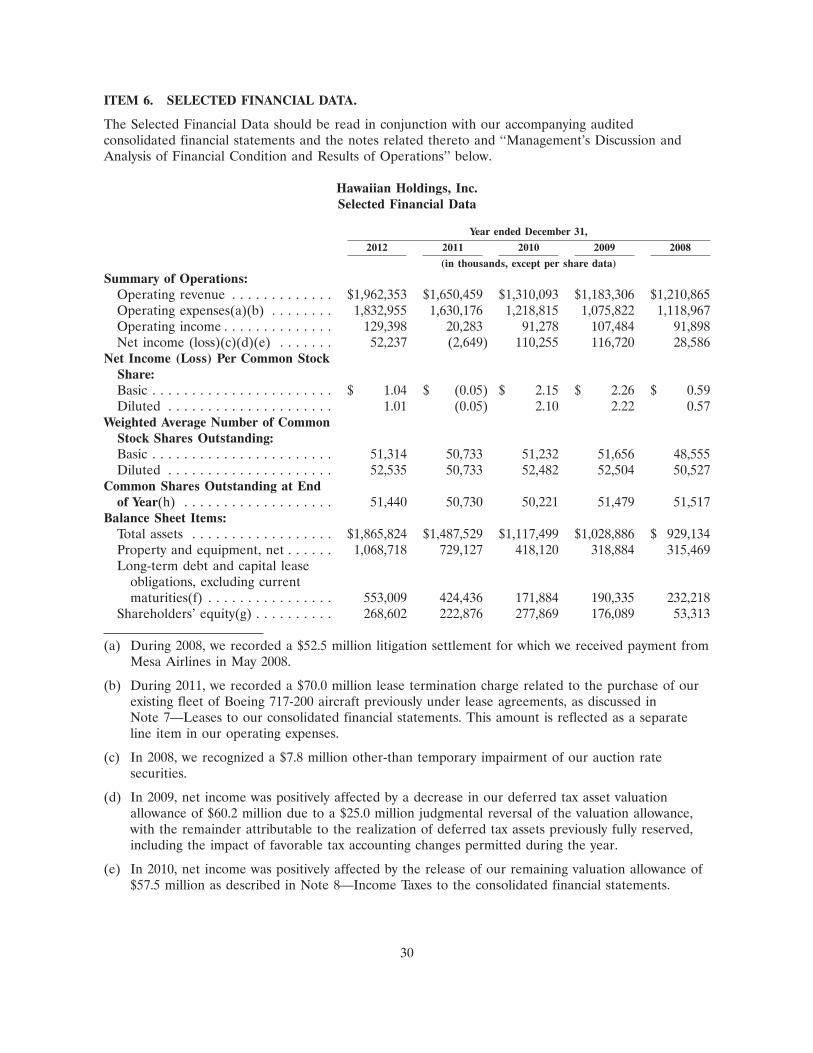
ITEM 6. SELECTED FINANCIAL DATA.
The Selected Financial Data should be read in conjunction with our accompanying auditedconsolidated financial statements and the notes related thereto and ‘‘Management’s Discussion andAnalysis of Financial Condition and Results of Operations’’ below.
Hawaiian Holdings, Inc.Selected Financial Data
Year ended December 31,
2012 2011 2010 2009 2008
(in thousands, except per share data)
Summary of Operations:Operating revenue . . . . . . . . . . . . . $1,962,353 $1,650,459 $1,310,093 $1,183,306 $1,210,865Operating expenses(a)(b) . . . . . . . . 1,832,955 1,630,176 1,218,815 1,075,822 1,118,967Operating income . . . . . . . . . . . . . . 129,398 20,283 91,278 107,484 91,898Net income (loss)(c)(d)(e) . . . . . . . 52,237 (2,649) 110,255 116,720 28,586
Net Income (Loss) Per Common StockShare:Basic . . . . . . . . . . . . . . . . . . . . . . . $ 1.04 $ (0.05) $ 2.15 $ 2.26 $ 0.59Diluted . . . . . . . . . . . . . . . . . . . . . 1.01 (0.05) 2.10 2.22 0.57
Weighted Average Number of CommonStock Shares Outstanding:Basic . . . . . . . . . . . . . . . . . . . . . . . 51,314 50,733 51,232 51,656 48,555Diluted . . . . . . . . . . . . . . . . . . . . . 52,535 50,733 52,482 52,504 50,527
Common Shares Outstanding at Endof Year(h) . . . . . . . . . . . . . . . . . . . 51,440 50,730 50,221 51,479 51,517
Balance Sheet Items:Total assets . . . . . . . . . . . . . . . . . . $1,865,824 $1,487,529 $1,117,499 $1,028,886 $ 929,134Property and equipment, net . . . . . . 1,068,718 729,127 418,120 318,884 315,469Long-term debt and capital lease
obligations, excluding currentmaturities(f) . . . . . . . . . . . . . . . . 553,009 424,436 171,884 190,335 232,218
Shareholders’ equity(g) . . . . . . . . . . 268,602 222,876 277,869 176,089 53,313
(a) During 2008, we recorded a $52.5 million litigation settlement for which we received payment fromMesa Airlines in May 2008.
(b) During 2011, we recorded a $70.0 million lease termination charge related to the purchase of ourexisting fleet of Boeing 717-200 aircraft previously under lease agreements, as discussed inNote 7—Leases to our consolidated financial statements. This amount is reflected as a separateline item in our operating expenses.
(c) In 2008, we recognized a $7.8 million other-than temporary impairment of our auction ratesecurities.
(d) In 2009, net income was positively affected by a decrease in our deferred tax asset valuationallowance of $60.2 million due to a $25.0 million judgmental reversal of the valuation allowance,with the remainder attributable to the realization of deferred tax assets previously fully reserved,including the impact of favorable tax accounting changes permitted during the year.
(e) In 2010, net income was positively affected by the release of our remaining valuation allowance of$57.5 million as described in Note 8—Income Taxes to the consolidated financial statements.
30
(f) In 2012, we borrowed $133.0 million to finance a portion of the purchase price of two AirbusA330-200 aircraft delivered in 2012 and took delivery of three aircraft (two Boeing 717 aircraft andone Airbus A330-200 aircraft) under capital leases. In 2011, we issued $86.25 million principalamount of convertible senior notes (the Convertible Notes) due March 2016 and used the proceedsto pay off our outstanding secured revolving credit facility, borrowed $192.8 million throughsecured loan agreements to finance a portion of the purchase price of fifteen Boeing 717-200aircraft and borrowed $132 million to finance a portion of the purchase price of two AirbusA330-200 aircraft delivered in 2011. See further discussion at Note 6—Debt to the consolidatedfinancial statements.
(g) Shareholders’ equity amounts include significant changes in our pension liability recorded inaccumulated other comprehensive loss shown in the Consolidated Statements of Shareholders’Equity and Comprehensive Loss.
(h) During 2010, we repurchased an aggregate of 1,868,563 common shares for approximately$10.0 million under our Stock Repurchase Program. During 2011, we retired those shares.
ITEM 7. MANAGEMENT’S DISCUSSION AND ANALYSIS OF FINANCIAL CONDITION ANDRESULTS OF OPERATIONS.
Overview
The following Management’s Discussion and Analysis of Financial Condition and Results of Operations(MD&A) is intended to help the reader understand the Company and our operations. This discussionand analysis of our financial condition and results of operations contains forward-looking statementsthat involve risks and uncertainties. We have based these forward-looking statements on our currentexpectations and projections of future events. However, our actual results could differ materially fromthose discussed herein as a result of the risks that we face, including but not limited to those risksstated in ‘‘Risk Factors.’’ See ‘‘Cautionary Note Regarding Forward-Looking Statements,’’ above. Inaddition, the following discussion should be read in conjunction with the audited consolidated financialstatements and the related notes thereto included elsewhere in this report.
Our Business
Our goal is to be the number one destination carrier serving Hawaii. We are a leisure airline devotedto the travel needs of the residents and visitors of Hawaii and offer a unique travel experience. We arestrongly rooted in the culture and people of Hawaii and seek to provide quality service to ourcustomers which exemplifies the spirit of aloha. We currently operate a fleet of 18 Boeing 717-200aircraft, 16 Boeing 767-300 aircraft, and nine Airbus A330-200 aircraft serving 25 domestic andinternational destinations. The Company also has two ATR42 turboprop aircraft for pending service tonew Neighbor Island destinations in 2013. We are the state’s longest-serving airline, as well as thelargest provider of passenger air service within Hawaii (Neighbor Island) and to Hawaii from the state’sprimary visitor markets in the U.S. mainland (North America). We offer non-stop service to Hawaiifrom more U.S. gateway cities (11) than any other airline, as well as service to Japan, South Korea, thePhilippines, Australia, American Samoa, and Tahiti, and also provide approximately 170 daily flightsbetween the Hawaiian Islands.
Our revenue is derived primarily from transporting passengers on our aircraft. Revenue is recognizedwhen either the transportation is provided or when the related ticket expires unused. We measurecapacity in terms of available seat miles (ASMs), which represent the number of seats available forpassengers multiplied by the number of miles the seats are flown. Yield, or the average amount onepassenger pays to fly one mile, is calculated by dividing passenger revenue by revenue passenger miles(RPMs). We strive to increase passenger revenue primarily by increasing our yield per flight or byfilling a higher proportion of available seats, which produces higher revenue per available seat mile
31

(RASM). Other revenue primarily consists of baggage fees, cargo revenue, ticket change andcancellation fees, incidental services revenue, sale of frequent flyer miles, revenue earned on reducedrate passengers, inflight revenue, contract services and charter services revenue.
The largest components of our operating expenses are aircraft fuel (including taxes and oil), wages andbenefits provided to our employees and aircraft maintenance materials and repairs. The price andavailability of aircraft fuel is extremely volatile due to global economic and geopolitical factors that wecan neither control nor accurately predict. Maintenance and repair costs are expensed when incurredunless covered by third-party power-by-the-hour services contracts.
Year in Review
2012 Financial Highlights
• GAAP net income of $53.2 million or $1.01 per diluted share. Adjusted net income, reflectingeconomic fuel expense, of $55.6 million or $1.06 per diluted share, an increase of 28.7%year-over-year.
• Passenger revenue increased 19.3% year-over-year.
• Operating cost per available seat mile (CASM), decrease of 7.8% year-over-year and CASMexcluding fuel and lease termination costs, decrease of 6.0% year-over-year.
• Operating margin of 6.6% and adjusted operating margin of 7.0%, reflecting economic fuelexpense in 2012.
• Unrestricted cash and cash equivalents increase of 33.5% year-over-year.
See ‘‘Results of Operations’’ below for further discussion of changes in revenues and operatingexpenses and our reconciliation of non-GAAP measures.
Highlights and Accomplishments
Our highlights and accomplishments in 2012 are as follows:
• Operational Excellence
• Ranked #1 nationally for on-time performance, for 10 out of the 11 months reported in2012, by the U.S. Department of Transportation Air Travel Consumer Report.
• First airline to receive carbon credits for reducing carbon dioxide emissions.
• Customer Focus
• Ranked second overall in the 2012 Airline Quality Rating Report.
• Executing our plan for profitability and growth
• Added four Airbus A330-200 aircraft for our International and North America routes andtwo Boeing 717-200 for our Neighbor Island routes to our fleet during 2012.
• Launched new non-stop service on our International routes from Honolulu to Fukuoka,Japan (April 2012), Sapporo, Japan (October 2012), and Brisbane, Australia (November2012).
• Launched new non-stop service on our North America routes from Honolulu to New YorkCity, New York (June 2012).
32

• Announced three-times-weekly non-stop service to Auckland, New Zealand (beginning inMarch 2013) and Taipei, Taiwan (beginning in July 2013).
• Expanded our operations at Hawaii’s second largest airport to create a new Maui huboffering improved connections between Maui and Neighbor Island destinations, as well asflights to and from the West Coast.
In 2012, we focused on our International expansion with the addition of new non-stop Internationalroutes from Honolulu to Fukuoka, Japan, Brisbane, Australia and Sapporo, Japan and increasedfrequency to daily on our routes to Sydney, Australia (May 2012) and Seoul, South Korea (July 2012).We continue to diversify our mix of passenger revenue and have increased our international revenue by56.1% to 29.8% of total passenger revenue compared to 2011.
In 2012, we launched new non-stop service from Honolulu to New York City, New York. Also, weimplemented a new inflight hospitality program on our North America routes that embraces thecelebration of the culture, people and spirit of Hawaii and continued to provide a complimentary islandinspired hot meal.
In 2012, we introduced our new Maui hub offering improved connections between Maui and NeighborIsland destinations, as well as flights to and from the West Coast, and launched a Neighbor Islandtravel program offering a specialized fare structure designed to stimulate increased travel for theresidents of Hawaii. We continue to search for ways to provide value to both our customers and ourbusiness on our Neighbor Island routes as we maintain a significant presence and market share onthese routes.
We took delivery and placed into revenue service four Airbus A330-200 aircraft for service on ourNorth America and International routes and two Boeing 717-200 aircraft for service on our NeighborIsland routes. The Company also took delivery of two ATR42 turboprop aircraft with service on ourNeighbor Island routes previously unserved by us to begin in 2013. We financed two of the AirbusA330-200 aircraft under secured debt and two Airbus A330-200 aircraft under lease agreements, andboth Boeing 717-200 aircraft under lease agreements, and did not finance our ATR42 turbopropaircraft which resulted in a decrease in our unrestricted cash.
In January 2013, we signed a memorandum of understanding for the purchase of 16 new AirbusA321neo aircraft scheduled for delivery between 2017 and 2020, with rights to purchase an additionalnine aircraft. We plan to execute a purchase agreement in the first quarter of 2013. The A321neoaircraft will be used to complement Hawaiian’s existing fleet of wide-body aircraft for travel to theWest Coast on our North America routes. These aircraft are excluded from the table below.
The table below summarizes our total fleet as of December 31, 2011, 2012 and expected 2013 (basedon existing agreements):
December 31, 2011 December 31, 2012 December 31, 2013
Aircraft Type Leased(5) Owned Total Leased(5) Owned Total Leased(5) Owned Total
A330-200(4) . . . . . . . . . . . 3 2 5 5 4 9 7 7 14767-300ER(2)(3) . . . . . . . . 9 7 16 9 7 16 6 6 12717-200 . . . . . . . . . . . . . . 1 15 16 3 15 18 3 15 18ATR42(1) . . . . . . . . . . . . . — — — — 2 2 — 2 2
Total . . . . . . . . . . . . . . . . 13 24 37 17 28 45 16 30 46
(1) The ATR42 turboprop aircraft are owned by Hawaiian Holdings, Inc.’s subsidiary and are expectedto begin operations on Neighbor Island routes previously unserved by us in 2013.
33

(2) The decrease in the number of leased 767-300ER aircraft from 2012 to 2013 is due to the returnof leased aircraft at the end of their lease terms.
(3) The decrease in the number of owned 767-300ER aircraft from 2012 to 2013 is due to the plannedretirement of one aircraft at the end of its estimated useful life.
(4) In 2011, we entered into a commitment to assign the purchase of two A330-200 aircraft at deliveryand simultaneously enter into lease agreements for the respective aircraft with scheduled deliverydates in 2013. Currently these two aircraft are reported as leased in the 2013 table above. SeeNote 11—Commitments and Contingencies for further discussion on the Purchase Aircraft andLease Financing Agreement.
(5) Leased aircraft include both aircraft under capital and operating leases. See Note 7—Leases forfurther discussion of our aircraft leases.
Outlook
Our mission every year is to grow a profitable airline with a passion for excellence, our customers, ourpeople and the spirit of Hawaii. For 2013, we will focus on managing our growth strategy, controllingour costs, integrating new aircraft into our fleet, growing into new and existing markets and operatingan innovative business to meet the needs of our new and existing customers.
Results of Operations
Our consolidated net income for 2012 was $53.2 million, or $1.01 per diluted share, compared to a netloss of $2.6 million, or $0.05 per diluted share, in 2011 and net income of $110.3 million, or $2.10 perdiluted share, in 2010. Significant items impacting the comparability between the periods are as follows:
• All periods include adjustments to reflect the timing of unrealized mark-to-market gains orlosses related to our outstanding fuel hedge positions.
• Our 2011 results reflect a $70.0 million non-recurring, pre-tax lease termination charge relatedto the purchase of fifteen Boeing 717-200 aircraft previously under lease agreements.
• Our 2010 results reflect a tax benefit of $28.3 million from the release of our entire remainingtax valuation allowance of $57.5 million.
Adjusted (non-GAAP) results and per-share amounts
We believe the disclosure of non-GAAP financial measures is useful information to readers of ourfinancial statements because:
• We believe it is the basis by which we are evaluated by industry analysts and investors;
• Our results excluding these items are often used in management and board of director’s decisionmaking analysis;
• It is useful to monitor performance without these items as it improves a reader’s ability tocompare our results to other airlines; and
• It is consistent with how we present information in our quarterly earnings press releases.
34

See table below for reconciliation between GAAP consolidated net income to adjusted consolidated netincome, including per share amounts for the year ended December 31, 2012, 2011 and 2010 (inthousands unless otherwise indicated).
Year ended December 31,
2012 2011 2010
DilutedDiluted Net earnings Diluted
earnings income (loss) earningsNet income per share (loss) per share Net income per share
As reported—GAAP . . . . . . . . . . . . . $53,237 $ 1.01 $(2,649) $(0.05) $110,255 $2.10Add: lease termination expenses
related to Boeing 717-200 aircraftpurchase, net of tax . . . . . . . . . . . . — — 42,008 0.83 — —
Reflecting lease termination costsadjustment . . . . . . . . . . . . . . . . . . . $53,237 $ 1.01 $39,359 $ 0.78 $110,255 $2.10
Less: unrealized (losses) gains on fuelderivative contracts, net of tax . . . . . (2,375) (0.05) (3,859) (0.07) 2,304 0.04
Less: Non-recurring tax benefits . . . . . — — — — 62,546 1.19
Reflecting economic fuel expense andexcluding non-recurring tax benefitsand lease termination charges . . . . . $55,612 $ 1.06 $43,218 $ 0.85 $ 45,405 $0.87
Selected Consolidated Statistical Data (unaudited)
Below are the operating statistics we use to measure our operating performance.
Year ended December 31,
2012 2011 2010
(in thousands, except as otherwise indicated)
Scheduled Operations:Revenue passengers flown . . . . . . . . . . . . . . . . . . . . . . . . . . . 9,476 8,659 8,418Revenue passenger miles (RPM) . . . . . . . . . . . . . . . . . . . . . . 12,195,875 10,139,949 8,665,869Available seat miles (ASM) . . . . . . . . . . . . . . . . . . . . . . . . . . 14,660,030 12,022,194 10,134,601Passenger revenue per RPM (Yield) . . . . . . . . . . . . . . . . . . . 14.49¢ 14.60¢ 13.33¢Passenger load factor (RPM/ASM) . . . . . . . . . . . . . . . . . . . . 83.2% 84.3% 85.5%Passenger revenue per ASM (PRASM) . . . . . . . . . . . . . . . . . 12.05¢ 12.32¢ 11.40¢
Total Operations:Revenue passengers flown . . . . . . . . . . . . . . . . . . . . . . . . . . . 9,484 8,666 8,424RPM . . . . . . . . . . . . . . . . . . . . . . . . . . . . . . . . . . . . . . . . . . 12,217,635 10,151,218 8,675,427ASM . . . . . . . . . . . . . . . . . . . . . . . . . . . . . . . . . . . . . . . . . . 14,687,472 12,039,933 10,150,659Operating revenue per ASM (RASM) . . . . . . . . . . . . . . . . . . 13.36¢ 13.71¢ 12.91¢Operating cost per ASM (CASM)(b) . . . . . . . . . . . . . . . . . . . 12.48¢ 13.54¢ 12.01¢CASM excluding aircraft fuel(b)(c) . . . . . . . . . . . . . . . . . . . . 8.18¢ 9.28¢ 8.83¢CASM excluding lease termination costs and aircraft fuel(c) . . 8.18¢ 8.70¢ 8.83¢Aircraft fuel expense per ASM . . . . . . . . . . . . . . . . . . . . . . . 4.30¢ 4.26¢ 3.18¢Revenue block hours operated (actual) . . . . . . . . . . . . . . . . . 147,810 125,375 113,158Gallons of jet fuel consumed . . . . . . . . . . . . . . . . . . . . . . . . . 199,465 164,002 140,995Average cost per gallon of jet fuel (actual)(a) . . . . . . . . . . . . $ 3.17 $ 3.13 $ 2.29
(a) Includes applicable taxes and fees.
35
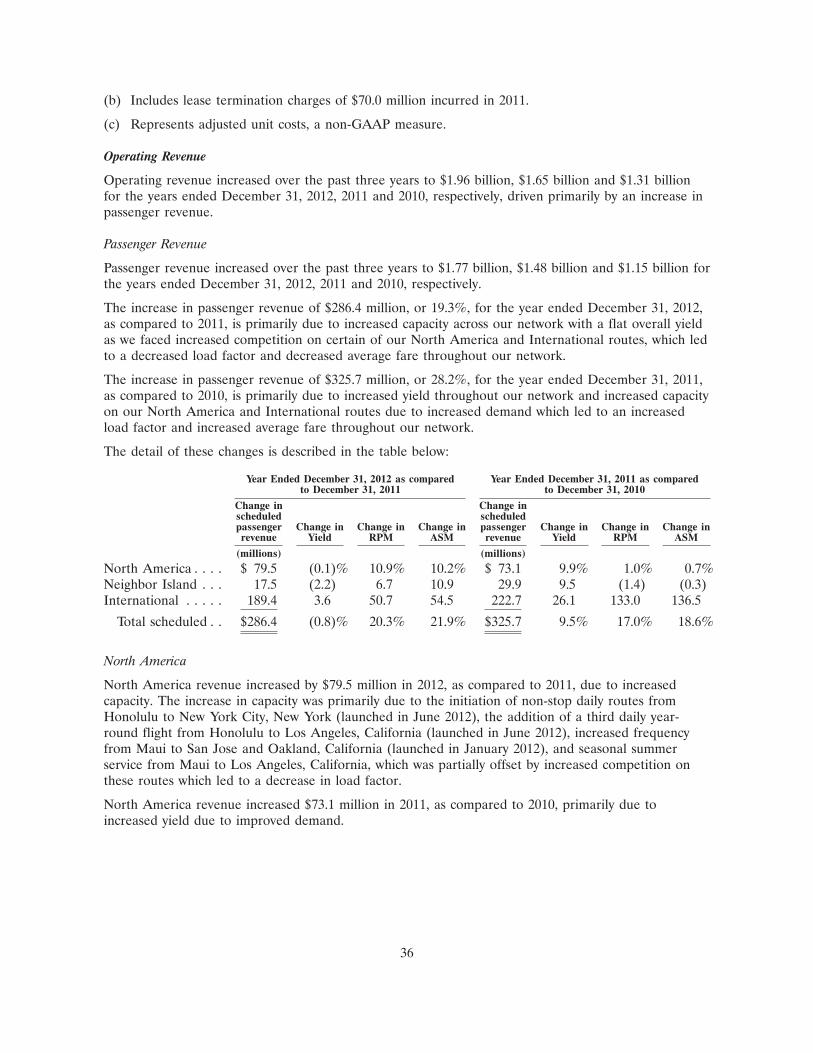
(b) Includes lease termination charges of $70.0 million incurred in 2011.
(c) Represents adjusted unit costs, a non-GAAP measure.
Operating Revenue
Operating revenue increased over the past three years to $1.96 billion, $1.65 billion and $1.31 billionfor the years ended December 31, 2012, 2011 and 2010, respectively, driven primarily by an increase inpassenger revenue.
Passenger Revenue
Passenger revenue increased over the past three years to $1.77 billion, $1.48 billion and $1.15 billion forthe years ended December 31, 2012, 2011 and 2010, respectively.
The increase in passenger revenue of $286.4 million, or 19.3%, for the year ended December 31, 2012,as compared to 2011, is primarily due to increased capacity across our network with a flat overall yieldas we faced increased competition on certain of our North America and International routes, which ledto a decreased load factor and decreased average fare throughout our network.
The increase in passenger revenue of $325.7 million, or 28.2%, for the year ended December 31, 2011,as compared to 2010, is primarily due to increased yield throughout our network and increased capacityon our North America and International routes due to increased demand which led to an increasedload factor and increased average fare throughout our network.
The detail of these changes is described in the table below:
Year Ended December 31, 2012 as compared Year Ended December 31, 2011 as comparedto December 31, 2011 to December 31, 2010
Change in Change inscheduled scheduledpassenger Change in Change in Change in passenger Change in Change in Change inrevenue Yield RPM ASM revenue Yield RPM ASM
(millions) (millions)
North America . . . . $ 79.5 (0.1)% 10.9% 10.2% $ 73.1 9.9% 1.0% 0.7%Neighbor Island . . . 17.5 (2.2) 6.7 10.9 29.9 9.5 (1.4) (0.3)International . . . . . 189.4 3.6 50.7 54.5 222.7 26.1 133.0 136.5
Total scheduled . . $286.4 (0.8)% 20.3% 21.9% $325.7 9.5% 17.0% 18.6%
North America
North America revenue increased by $79.5 million in 2012, as compared to 2011, due to increasedcapacity. The increase in capacity was primarily due to the initiation of non-stop daily routes fromHonolulu to New York City, New York (launched in June 2012), the addition of a third daily year-round flight from Honolulu to Los Angeles, California (launched in June 2012), increased frequencyfrom Maui to San Jose and Oakland, California (launched in January 2012), and seasonal summerservice from Maui to Los Angeles, California, which was partially offset by increased competition onthese routes which led to a decrease in load factor.
North America revenue increased $73.1 million in 2011, as compared to 2010, primarily due toincreased yield due to improved demand.
36

Neighbor Island
Neighbor Island revenue increased by $17.5 million in 2012, as compared to 2011, primarily due toincreased capacity provided by three Boeing 717-200 aircraft that entered the fleet in the fourth quarterof 2011 and first quarter of 2012, partially offset by decreased yield.
The $29.9 million increase in 2011, as compared to 2010, was due to increased yield and was partiallyoffset by decreases in capacity.
International
International revenue increased by $189.4 million in 2012, as compared to 2011, primarily due toincreased capacity and yield. The increase in capacity was primarily due to the delivery of new AirbusA330-200 aircraft that entered the fleet during 2011 and 2012 and the initiation of non-stop dailyroutes from Fukuoka, Japan (April 2012), the initiation of three-times weekly service to Sapporo, Japanand Brisbane, Australia (November 2012), the increase in our Seoul, Korea service to daily from fourtimes per week (launched in August 2012), the increase in our Sydney, Australia service to daily fromfour times weekly (launched in December 2011) and the effects of the full year results from routesinitiated in 2011.
The $222.7 million increase in 2011, as compared to 2010, was primarily due to increases in both yieldand capacity with the initiation of new routes to Tokyo, Japan in the fourth quarter 2010, and Seoul,South Korea and Osaka, Japan in 2011, and increased frequency on our Sydney, Australia routes in2011.
Other Operating Revenue
Other operating revenue increased over the past three years to $195.3 million, $169.8 million and$155.1 million for the years ended December 31, 2012, 2011 and 2010, respectively.
The increase in other operating revenue for 2012, as compared to 2011, is primarily due to increasedbaggage revenue and increased cargo revenue due to the additional cargo capacity provided by theAirbus A330-200 and the expansion of our network.
The increase in other operating revenue for 2011, as compared to 2010, is primarily due to increasedbaggage revenue, increased cargo revenue due to the additional cargo capacity provided by the AirbusA330-200 aircraft and the expansion of our network and increased charter revenue, which was partiallyoffset by decreases in our cancellation penalties revenue and the marketing component of our frequentflyer revenue.
37

Operating Expenses
Operating expenses were $1.83 billion, $1.63 billion and $1.22 billion, for the years ended December 31,2012, 2011, and 2010, respectively. Increases (decreases) in operating expenses from 2011 to 2012 and2010 to 2011 are detailed below.
Changes in operating Changes in operatingexpenses for the Year expenses for the YearEnded December 31, Ended December 31,2012 as compared to 2011 as compared toDecember 31, 2011 December 31, 2010
$ % $ %
(in thousands) (in thousands)
Operating expense:Aircraft fuel, including taxes and oil . . . . . . . . . . . . . . . . $118,457 23.1% $190,285 58.9%Wages and benefits . . . . . . . . . . . . . . . . . . . . . . . . . . . . . 55,333 17.2 23,674 8.0Aircraft rent . . . . . . . . . . . . . . . . . . . . . . . . . . . . . . . . . (14,097) (12.5) 162 0.1Maintenance materials and repairs . . . . . . . . . . . . . . . . . 13,701 8.1 45,876 37.0Aircraft and passenger servicing . . . . . . . . . . . . . . . . . . . 21,575 26.2 20,090 32.3Commissions and other selling . . . . . . . . . . . . . . . . . . . . 18,060 18.8 18,067 23.1Depreciation and amortization . . . . . . . . . . . . . . . . . . . . 19,337 29.2 8,550 14.8Other rentals and landing fees . . . . . . . . . . . . . . . . . . . . 13,178 18.2 14,612 25.3Other . . . . . . . . . . . . . . . . . . . . . . . . . . . . . . . . . . . . . . 27,249 21.7 20,031 19.0Lease termination charges(1) . . . . . . . . . . . . . . . . . . . . . (70,014) NM 70,014 NM
Total . . . . . . . . . . . . . . . . . . . . . . . . . . . . . . . . . . . . . $202,779 12.4% $411,361 33.8%
NM Not Meaningful
(1) Amount reflects the impact of a non-recurring and non-cash pre-tax lease termination expense of$70.0 million related to the purchase of fifteen Boeing 717-200 aircraft previously under leaseagreements recorded during the second quarter of 2011.
Our operations have expanded by approximately 22.0% (measured in ASMs) in 2012, as compared to2011. As a result of this expansion, we have experienced corresponding increases in our variableexpenses such as aircraft fuel, wages and benefits, maintenance materials and repairs, aircraft andpassenger servicing, commissions and other selling expenses, other rentals and landing fees and otherexpenses (which primarily consists of purchased services, personnel and communication expenses).
We expect operating expenses to increase with the continued expansion of our services and the increasein the number of aircraft in our fleet.
Aircraft Fuel
Aircraft fuel expense increased during each of the past three years due to a combination of an increasein fuel price and an increase in consumption as illustrated in the following table:
% Change fromYear Ended December 31, Year Ended
2012 2011 2010 2011 2010
(in thousands, exceptper-gallon amounts)
Fuel gallons consumed . . . . . . . . . . . . . . . . . . . . . 199,465 164,002 140,995 21.6% 16.3%Fuel price per gallon, including taxes and delivery . . $ 3.17 $ 3.13 $ 2.29 1.3% 36.7%
Aircraft fuel expense . . . . . . . . . . . . . . . . . . . . . . . $631,741 $513,284 $322,999 23.1% 58.9%
38

The increase in fuel expense from 2011 to 2012 is primarily due to an increase in fuel consumption dueto the additional aircraft in the fleet (four additional A330-200 and two additional B717-200 aircraft).
The increase in fuel expense from 2010 to 2011 is due to an increase in fuel price and an increase inconsumption of fuel due to the additional aircraft in the fleet (four additional A330-200 aircraft andone additional B717-200 partially offset by two B767 returned at the end of their lease terms).
During 2012, 2011 and 2010, our fuel derivatives were not designated for hedge accounting underASC 815 and were marked to fair value through nonoperating income (expense) in the ConsolidatedStatements of Operations. We recorded losses on fuel derivatives of $11.3 million and $6.9 million forthe years ended December 31, 2012 and 2011, respectively, compared to gains of $0.6 million recordedfor the year ended December 31, 2010.
We believe economic fuel expense is the best measure of the effect of fuel prices on our business as itmost closely approximates the net cash outflow associated with the purchase of fuel for our operationsin a period and is consistent with how management manages our business and assesses our operatingperformance. We define economic fuel expense as raw fuel expense plus (gains)/losses realized throughactual cash payments to/(receipts from) hedge counterparties for fuel derivatives settled in the periodinclusive of costs related to hedging premiums. Economic fuel expense for the year-ended 2012, 2011and 2010 is calculated as follows:
% Change fromYear Ended December 31, Year Ended
2012 2011 2010 2011 2010
(in thousands, exceptper-gallon amounts)
Aircraft fuel expense, including taxes and oil . . . . . $631,741 $513,284 $322,999 23.1% 58.9%Realized (gains) losses on settlement of fuel
derivative contracts . . . . . . . . . . . . . . . . . . . . . . 7,372 430 3,199 1,614.4% (86.6)%
Economic fuel expense . . . . . . . . . . . . . . . . . . . . . $639,113 $513,714 $326,198 24.4% 57.5%Gallons of jet fuel consumed . . . . . . . . . . . . . . . . . 199,465 164,002 140,995 21.6% 16.3%
Economic fuel costs per gallon . . . . . . . . . . . . . . . . $ 3.20 $ 3.13 $ 2.31 2.2% 35.5%
See Item 7A, Quantitative and Qualitative Disclosures about Market Risk, for additional discussion ofour jet fuel costs and related derivative program.
Wages and Benefits
Wages and benefits expense increased by $55.3 million, or 17.2%, in 2012, as compared to 2011,primarily due to an increase in the number of employees as we continue to expand our operations withadditional aircraft and new routes as well as an increase in our pension and other post-retirementexpenses due to a decrease in the discount rate used to determine net periodic benefit expense, adecrease in the long-term expected rate of return of assets and an increase in claims costs.
There were no significant changes to wages and benefits expense from 2010 to 2011.
We expect wages and benefits expense to increase in future periods as we continue to add additionalemployees for the expansion of our operations.
Aircraft Rent
Aircraft rent expense decreased by $14.1 million, or 12.5%, in 2012, as compared to 2011, due to thefull year impact of aircraft leases that ended in 2011; the purchase of our existing fleet of Boeing717-200 aircraft in June 2011 of which the majority were previously under operating lease agreementsand the return of two Boeing 767-300ER aircraft at the end of their lease terms in May and October
39
2011. The aircraft leases that ended in 2011 were partially offset by the addition of two aircraft underoperating lease agreements (one B717-200 aircraft in December 2011 and one A330 aircraft in May2012).
Aircraft rent expense increased by $0.2 million, or 0.1%, in 2011, as compared to 2010, primarily due tothe entire year-to-date recognition of aircraft rent expense for three leased Airbus A330-200 aircraft(leases commenced in April, May and November 2010) and lease return costs incurred with the returnof the two leased Boeing 767-300 aircraft in May and October 2011. This increase was offset by thepurchase of our fleet of Boeing 717-200 aircraft in June 2011, of which the majority were previouslyunder operating lease agreements.
We expect rent expense to increase in future periods as we expand our fleet and the potential additionof aircraft under operating leases.
Maintenance Materials and Repairs
Maintenance materials and repairs expense increased by $13.7 million, or 8.1%, in 2012, as comparedto 2011, primarily due to increased power-by-the-hour (PBH) expenses for the A330-200 aircraft andB717-200 aircraft fleet additions during 2012, partially offset by decreased maintenance expense for ourB767-300 due to the non-recurrence of 10-year airframe checks incurred in 2011 and decreasedmaintenance expense for our B717-200 aircraft due to the non-recurrence of several heavy maintenancechecks incurred in 2011.
Maintenance materials and repairs expense increased by $45.9 million, or 37.0%, in 2011, as comparedto 2010, primarily due to increased PBH expenses for the Airbus A330-200 fleet additions during 2011,increases in our PBH rates for our Boeing 717-200 and Boeing 767-300 aircraft, increased maintenanceexpense on our Boeing 767-300 aircraft and engines and increased heavy maintenance expense on ourBoeing 717-200 aircraft due to the continuation of 10-year airframe checks on this fleet.
We expect maintenance materials and repairs expense to increase in future periods as we continue tointegrate additional aircraft into revenue service, and as a result of price escalation imposed in certainof our PBH contracts.
Aircraft and Passenger Servicing
Aircraft and passenger servicing expense increased by $21.6 million, or 26.2%, in 2012, as compared to2011, and $20.1 million, or 32.3%, in 2011, as compared to 2010, primarily due to volume-relatedincreases as well as increased service costs on our International routes.
We expect aircraft and passenger servicing expense to increase in future periods as we continue toexpand our fleet and add additional routes.
Commissions and Other Selling Expenses
Commissions and other selling expense increased by $18.1 million, or 18.8%, in 2012, as compared to2011, and $18.1 million, or 23.1%, in 2011, as compared to 2010, primarily due to increases in volume-related selling expenses, which include increased travel agency commissions and increases in the volumeof tickets purchased through credit cards and global distribution systems.
We expect commissions and other selling expenses to increase in future periods as we continue toexpand our fleet and add additional routes.
40

Depreciation and Amortization
Depreciation and amortization expense increased by $19.3 million, or 29.2%, in 2012, as compared to2011, primarily due to the increase in the number of owned aircraft and aircraft under capital leasesfrom 2011.
There were no significant changes to depreciation and amortization expense from 2010 to 2011.
Other Rentals and Landing Fees
Other rentals and landing fee expense increased by $13.2 million, or 18.2%, in 2012, as compared to2011, primarily due to increased rent expense and landing fees with the addition of new routes andincreased frequencies on our existing routes since 2011 and increased rent expense at several of ourexisting locations.
Other rentals and landing fee expense increased by $14.6 million, or 25.3%, in 2011 as compared to2010, primarily due to increases in joint use and space rent at our Hawaii airports and increases in rentexpense and landing fees due to the addition of new routes in 2010 and 2011.
We expect expenses for other rentals and landing fees to increase in future periods as we continue toadd additional routes and increase frequency on our existing routes.
Lease Termination
During 2011, we entered into a purchase agreement with the lessor for the purchase of fifteen Boeing717-200 aircraft, each such aircraft including two Rolls-Royce BR700-715 engines, previously heldthrough four capital and eleven operating lease agreements. The purchase price for the fifteen Boeing717-200 aircraft was $230 million, comprised of financing of $192.8 million through secured loanagreements, cash payment of $25.0 million, and non-cash application of maintenance and securitydeposits held by the previous lessor and current debt financier of $12.2 million. We recognized theexcess of the purchase price paid over the fair value of the aircraft under operating leases as a cost ofterminating the leases under ASC 840—Leases and elected to apply the same accounting policy to theaircraft under capital leases. We recorded the fifteen Boeing 717-200 aircraft at its fair value of$135 million on the December 31, 2011 Consolidated Balance Sheets and reflected lease terminationcharges of $70.0 million on the December 31, 2011 Consolidated Statements of Operations.
The purchase of the fifteen Boeing 717-200 aircraft resulted in lower aircraft rent expense in 2012 and2011, which was partially offset by increases in depreciation and amortization and interest expense.
Operating Costs per Available seat Mile (CASM)
We have listed separately in the table below our fuel costs per ASM and our non-GAAP unit costs,excluding fuel and the non-recurring lease termination charge in 2011. These amounts are included inCASM, but for internal purposes we consistently use unit cost metrics that exclude fuel andnon-recurring items to measure and monitor our costs.
41
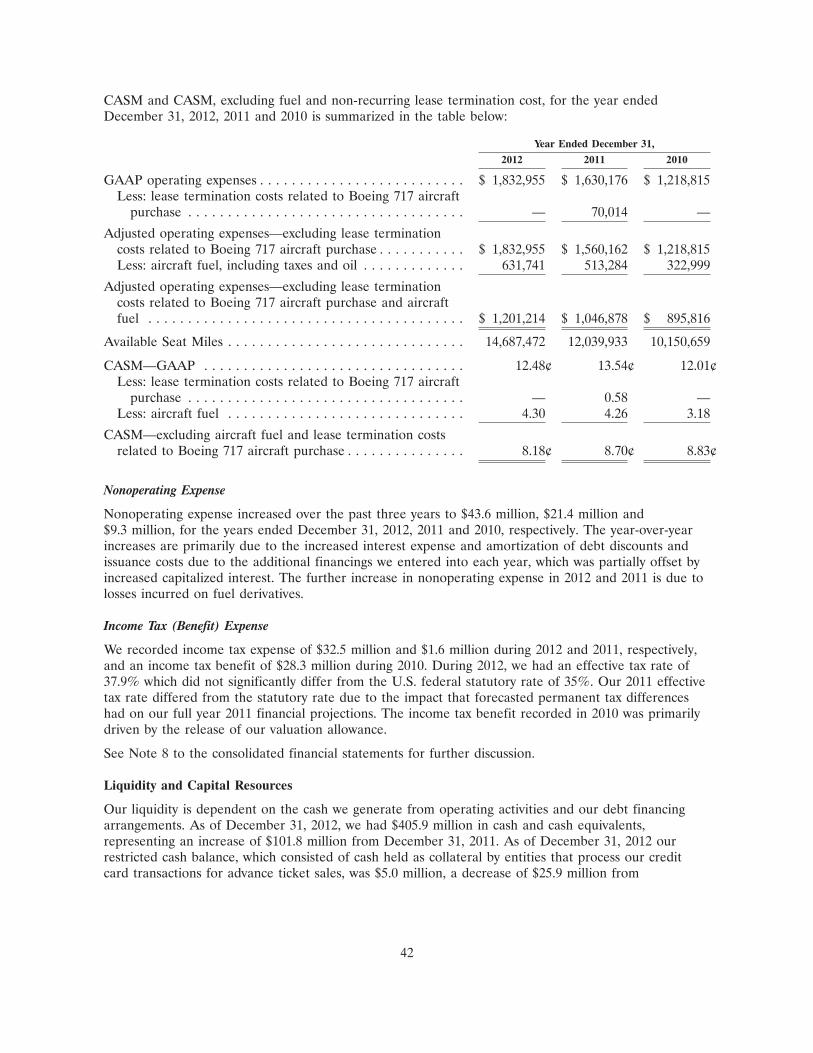
CASM and CASM, excluding fuel and non-recurring lease termination cost, for the year endedDecember 31, 2012, 2011 and 2010 is summarized in the table below:
Year Ended December 31,
2012 2011 2010
GAAP operating expenses . . . . . . . . . . . . . . . . . . . . . . . . . . $ 1,832,955 $ 1,630,176 $ 1,218,815Less: lease termination costs related to Boeing 717 aircraft
purchase . . . . . . . . . . . . . . . . . . . . . . . . . . . . . . . . . . . — 70,014 —
Adjusted operating expenses—excluding lease terminationcosts related to Boeing 717 aircraft purchase . . . . . . . . . . . $ 1,832,955 $ 1,560,162 $ 1,218,815Less: aircraft fuel, including taxes and oil . . . . . . . . . . . . . 631,741 513,284 322,999
Adjusted operating expenses—excluding lease terminationcosts related to Boeing 717 aircraft purchase and aircraftfuel . . . . . . . . . . . . . . . . . . . . . . . . . . . . . . . . . . . . . . . . $ 1,201,214 $ 1,046,878 $ 895,816
Available Seat Miles . . . . . . . . . . . . . . . . . . . . . . . . . . . . . . 14,687,472 12,039,933 10,150,659
CASM—GAAP . . . . . . . . . . . . . . . . . . . . . . . . . . . . . . . . . 12.48¢ 13.54¢ 12.01¢Less: lease termination costs related to Boeing 717 aircraft
purchase . . . . . . . . . . . . . . . . . . . . . . . . . . . . . . . . . . . — 0.58 —Less: aircraft fuel . . . . . . . . . . . . . . . . . . . . . . . . . . . . . . 4.30 4.26 3.18
CASM—excluding aircraft fuel and lease termination costsrelated to Boeing 717 aircraft purchase . . . . . . . . . . . . . . . 8.18¢ 8.70¢ 8.83¢
Nonoperating Expense
Nonoperating expense increased over the past three years to $43.6 million, $21.4 million and$9.3 million, for the years ended December 31, 2012, 2011 and 2010, respectively. The year-over-yearincreases are primarily due to the increased interest expense and amortization of debt discounts andissuance costs due to the additional financings we entered into each year, which was partially offset byincreased capitalized interest. The further increase in nonoperating expense in 2012 and 2011 is due tolosses incurred on fuel derivatives.
Income Tax (Benefit) Expense
We recorded income tax expense of $32.5 million and $1.6 million during 2012 and 2011, respectively,and an income tax benefit of $28.3 million during 2010. During 2012, we had an effective tax rate of37.9% which did not significantly differ from the U.S. federal statutory rate of 35%. Our 2011 effectivetax rate differed from the statutory rate due to the impact that forecasted permanent tax differenceshad on our full year 2011 financial projections. The income tax benefit recorded in 2010 was primarilydriven by the release of our valuation allowance.
See Note 8 to the consolidated financial statements for further discussion.
Liquidity and Capital Resources
Our liquidity is dependent on the cash we generate from operating activities and our debt financingarrangements. As of December 31, 2012, we had $405.9 million in cash and cash equivalents,representing an increase of $101.8 million from December 31, 2011. As of December 31, 2012 ourrestricted cash balance, which consisted of cash held as collateral by entities that process our creditcard transactions for advance ticket sales, was $5.0 million, a decrease of $25.9 million from
42

December 31, 2011, due to a decrease in the cash holdback on our primary credit card processingagreement.
We have been able to generate sufficient funds from our operations to meet our working capitalrequirements and typically finance our aircraft through secured debt and lease financings. AtDecember 31, 2012, Hawaiian had approximately $661.2 million of debt and capital lease obligations,including approximately $108.2 million that will become due in the next 12 months. Hawaiian has asecured revolving credit facility (the Revolving Credit Facility) in an amount of up to $75.0 million, andas of December 31, 2012, we had no outstanding borrowings under the Revolving Credit Facility and$68.9 million available (net of various outstanding letters of credit).
Cash Flows
Net cash provided by operating activities increased to $311.0 million, $178.8 million and $150.3 millionin 2012, 2011 and 2010, respectively. The increase from 2011 to 2012 in cash provided was primarilydue to an increase in our air traffic liability balance for increased future bookings related to advanceticket sales, increases in accounts payable and increases in other accrued liabilities and partially offsetby an increase in accounts receivable and long-term prepayments and other. The increase from 2010 to2011 is primarily due to increases in our air traffic liability balance for increased future bookingsrelated to advance ticket sales and a decrease in contributions to our pension and disability plans thatwas partially offset by increases in accounts receivable.
Net cash used in investing activities increased in the past three years to $290.7 million, $281.9 millionand $108.7 million for 2012, 2011 and 2010, respectively. The increase from 2011 to 2012 is primarilydue to an increase in purchases of property and equipment partially offset by decreases in pre-deliverydeposits for upcoming aircraft and engine deliveries. The increase from 2010 to 2011 is primarily due toan increase in purchases of property and equipment which was partially offset by the net sale ofinvestments in 2010 of $31.8 million, including $26.7 million for the sale of our auction rate securities.
Net cash provided by (used in) financing activities was $81.4 million, $122.2 million and ($57.3) millionfor 2012, 2011 and 2010, respectively. The decrease in the net cash provided by financing activities from2011 to 2012 is primarily due to decreases in cash repayments for debt and capital lease obligations anddecreases in the proceeds received from debt issuances. The change from 2010 to 2011 was due to anincrease in proceeds received from debt issuances including Aircraft Facility Agreements and theConvertible Notes, decreases in cash repayments for debt and capital lease obligations and the$10.0 million repurchase of treasury stock in 2010.
Capital Commitments
As of December 31, 2012, the Company had capital commitments for aircraft and aircraft relatedequipment which included firm aircraft orders for thirteen Airbus A330-200 aircraft for deliverybetween 2013 and 2015, six Airbus A350XWB-800 aircraft for delivery beginning in 2017 and four RollsRoyce spare engines scheduled for delivery through 2020. In addition, Hawaiian has purchase rights foran additional three A330-200 aircraft and six A350-XWB aircraft. Committed expenditures for theseaircraft, engines and related flight equipment is approximately $452 million in 2013, $431 million in2014, $243 million in 2015, $80 million in 2016 $265 million in 2017 and $457 million thereafter.
For 2013, we expect our other non-aircraft related capital expenditures, which include software,improvements, ramp and maintenance equipment to total approximately $20 million to $25 million.
In order to complete the purchase of these aircraft and fund related costs, we must secure acceptablefinancing. We are currently exploring various financing alternatives and, while we believe that suchfinancing will be available to us, there can be no assurance that financing will be available whenrequired, or on acceptable terms, or at all. The inability to secure such financing could have a material
43
adverse effect on us. We have secured financing commitments of $312 million for a portion of thepurchase price of four upcoming A330-200 aircraft deliveries, with delivery dates in the first half of2013. See Note—11 to our audited financial statements for further detail regarding our aircraft facilityand lease commitments.
Stock Repurchase Program
On July 1, 2010, the Executive Committee of our Board of Directors approved a stock repurchaseprogram (Program) under which we could purchase up to $10 million of our outstanding commonstock. Stock purchases under the Program could be made through the open market, established plansor through privately negotiated transactions, as market conditions permitted. The stock repurchaseprogram was substantially completed in September 2010; we repurchased an aggregate of 1,868,563shares at an aggregate cost of $10.0 million. The shares were subsequently retired in 2011.
Covenants under our Financing Arrangements
The terms of certain of our financing agreements restrict our ability to, among other things, incuradditional indebtedness, grant liens, merge or consolidate, dispose of assets, prepay indebtedness, makeinvestments, make acquisitions, enter into certain transactions with affiliates, pay dividends or makedistributions to our parent company and repurchase stock. These agreements also require us to meetcertain financial covenants. These financial tests include maintaining a minimum amount of unrestrictedcash and achieving certain levels of fixed charge coverage. As of December 31, 2012, we were incompliance with these covenants. If we are not able to comply with these covenants in the future, ouroutstanding obligations under these facilities could be accelerated and become due and payableimmediately.
Under our bank-issued credit card processing agreements, certain proceeds from advance ticket salesare held back to serve as collateral to cover any possible chargebacks or other disputed charges thatmay occur. These holdbacks, which are included in restricted cash in our Consolidated Balance Sheets,totaled $5.0 million at December 31, 2012 and $30.9 million at December 31, 2011. There were noamounts subject to this holdback at December 31, 2012. As of December 31, 2011, the holdback was25% of the applicable credit card air traffic liability.
In 2012, we entered into an amendment with our largest credit card processor that eliminates thefinancial triggers for additional holdbacks. In the event of a material adverse change in the business,the holdback could increase to an amount up to 100% of the applicable credit card air traffic liability,which could also cause an increase in the level of restricted cash. There were no amounts subject tothis holdback at December 31, 2012. If we are unable to obtain a waiver of, or otherwise mitigate theincrease in the amount of restricted cash, it could also cause a covenant violation under our other debtor lease obligations and have a material adverse impact on us.
Pension and Other-Postretirement Benefit Plan Funding
As of December 31, 2012, the excess of the projected benefit obligations over the fair value of planassets was approximately $355.3 million. We contributed $19.4 million, $12.9 million and $37.9 million,to our defined benefit pension plans and disability plan during 2012, 2011 and 2010, respectively,satisfying our minimum required 2012 plan year contributions. Future funding requirements for ourdefined benefit and other postretirement plans are dependent upon many factors such as interest rates,funded status, applicable regulatory requirements and the level and timing of asset returns. In 2013, ourminimum required contribution to our defined benefit pension plans and disability plan is $14.7 million.
44
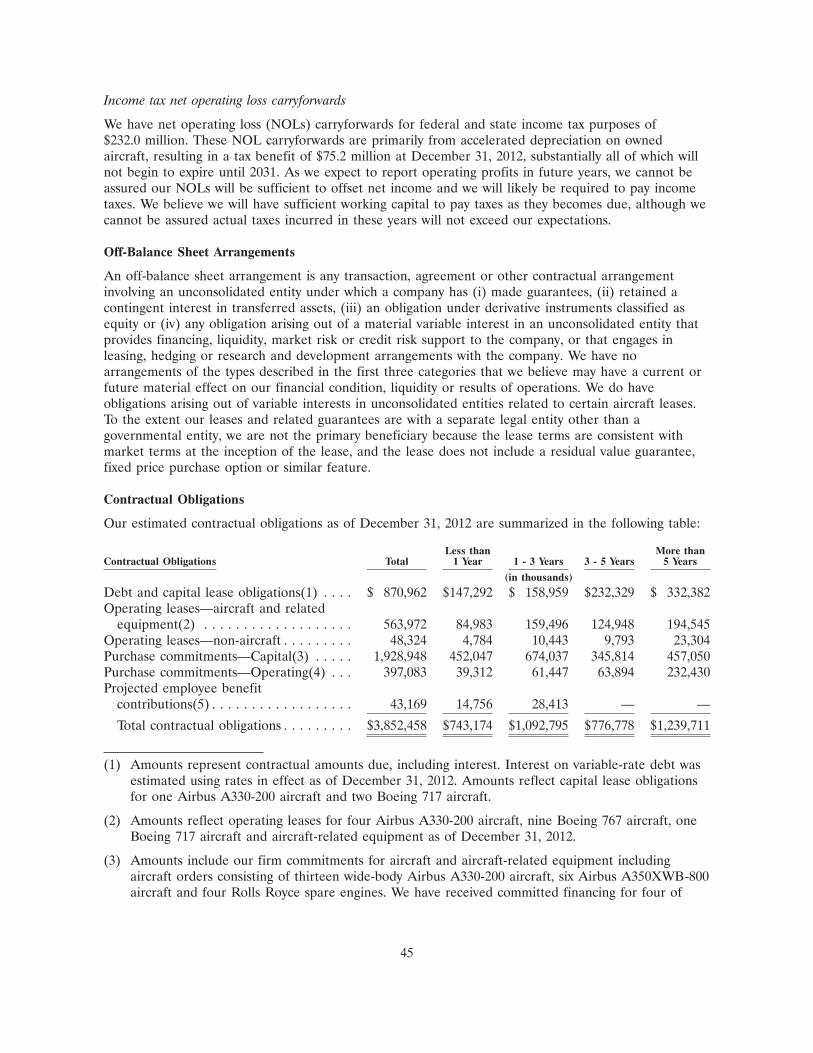
Income tax net operating loss carryforwards
We have net operating loss (NOLs) carryforwards for federal and state income tax purposes of$232.0 million. These NOL carryforwards are primarily from accelerated depreciation on ownedaircraft, resulting in a tax benefit of $75.2 million at December 31, 2012, substantially all of which willnot begin to expire until 2031. As we expect to report operating profits in future years, we cannot beassured our NOLs will be sufficient to offset net income and we will likely be required to pay incometaxes. We believe we will have sufficient working capital to pay taxes as they becomes due, although wecannot be assured actual taxes incurred in these years will not exceed our expectations.
Off-Balance Sheet Arrangements
An off-balance sheet arrangement is any transaction, agreement or other contractual arrangementinvolving an unconsolidated entity under which a company has (i) made guarantees, (ii) retained acontingent interest in transferred assets, (iii) an obligation under derivative instruments classified asequity or (iv) any obligation arising out of a material variable interest in an unconsolidated entity thatprovides financing, liquidity, market risk or credit risk support to the company, or that engages inleasing, hedging or research and development arrangements with the company. We have noarrangements of the types described in the first three categories that we believe may have a current orfuture material effect on our financial condition, liquidity or results of operations. We do haveobligations arising out of variable interests in unconsolidated entities related to certain aircraft leases.To the extent our leases and related guarantees are with a separate legal entity other than agovernmental entity, we are not the primary beneficiary because the lease terms are consistent withmarket terms at the inception of the lease, and the lease does not include a residual value guarantee,fixed price purchase option or similar feature.
Contractual Obligations
Our estimated contractual obligations as of December 31, 2012 are summarized in the following table:
Less than More thanContractual Obligations Total 1 Year 1 - 3 Years 3 - 5 Years 5 Years
(in thousands)
Debt and capital lease obligations(1) . . . . $ 870,962 $147,292 $ 158,959 $232,329 $ 332,382Operating leases—aircraft and related
equipment(2) . . . . . . . . . . . . . . . . . . . 563,972 84,983 159,496 124,948 194,545Operating leases—non-aircraft . . . . . . . . . 48,324 4,784 10,443 9,793 23,304Purchase commitments—Capital(3) . . . . . 1,928,948 452,047 674,037 345,814 457,050Purchase commitments—Operating(4) . . . 397,083 39,312 61,447 63,894 232,430Projected employee benefit
contributions(5) . . . . . . . . . . . . . . . . . . 43,169 14,756 28,413 — —
Total contractual obligations . . . . . . . . . $3,852,458 $743,174 $1,092,795 $776,778 $1,239,711
(1) Amounts represent contractual amounts due, including interest. Interest on variable-rate debt wasestimated using rates in effect as of December 31, 2012. Amounts reflect capital lease obligationsfor one Airbus A330-200 aircraft and two Boeing 717 aircraft.
(2) Amounts reflect operating leases for four Airbus A330-200 aircraft, nine Boeing 767 aircraft, oneBoeing 717 aircraft and aircraft-related equipment as of December 31, 2012.
(3) Amounts include our firm commitments for aircraft and aircraft-related equipment includingaircraft orders consisting of thirteen wide-body Airbus A330-200 aircraft, six Airbus A350XWB-800aircraft and four Rolls Royce spare engines. We have received committed financing for four of
45
these upcoming A330-200 deliveries in 2013 of $312 million. The amounts in the table aboveexclude our memorandum of understanding for the purchase of 16 Airbus A321neo aircraft,
(4) Amounts include commitments for services provided by third-parties for aircraft maintenance forour Airbus fleet, accounting, IT and reservations. Total contractual obligations do not includelong-term contracts where the commitment is variable in nature (with no minimum guarantee),such as aircraft maintenance deposits due under operating leases and fees due under otheragreements such as aircraft maintenance power-by-the-hour, computer reservation systems andcredit card processing agreements, or when the agreements contain short-term cancellationprovisions.
(5) Amounts include our estimated contributions to our pension plans (based on actuariallydetermined estimates) and our pilots’ disability plan. Amounts are subject to change based onnumerous factors, including interest rate levels, the amount and timing of asset returns and theimpact of future legislation. We are currently unable to estimate the projected contributionsbeyond 2015.
Critical Accounting Policies and Estimates
The discussion and analysis of our financial condition and results of operations are based uponfinancial statements that have been prepared in accordance with U.S. generally accepted accountingprinciples. The preparation of these financial statements requires management to make estimates andjudgments that affect the reported amount of assets and liabilities, revenue and expenses, and relateddisclosure of contingent assets and liabilities as of the date of the financial statements. Actual resultsmay differ from these estimates under different assumptions or conditions.
Critical accounting policies and estimates are defined as those accounting policies and accountingestimates that are reflective of significant judgments and uncertainties, and that potentially result inmaterially different results under different assumptions and conditions. For a detailed discussion of theapplication of these and other accounting policies, see Note 2 to the consolidated financial statements.
Frequent Flyer Accounting
HawaiianMiles, Hawaiian’s frequent flyer travel award program, provides a variety of awards toprogram members based on accumulated mileage. We utilize the incremental cost method ofaccounting for free travel awards earned in connection with the purchase of passenger tickets whichutilizes a number of estimates including the incremental cost per mile and breakage. We record aliability for the estimated incremental cost of providing travel awards that are expected to be redeemedon Hawaiian or the contractual rate of expected redemption on partner airlines. We estimate theincremental cost of travel awards based on periodic studies of actual costs and apply these costestimates to all issued miles, less an appropriate breakage factor for estimated miles that will not beredeemed. Incremental cost includes the costs of fuel, meals and beverages, insurance and certain otherpassenger traffic-related costs, but does not include any costs for aircraft ownership and maintenance.The breakage factor is estimated based on an analysis of historical expirations.
We also sell mileage credits to companies participating in our frequent flyer program. These sales areaccounted for as multiple-element arrangements, with one element representing the travel that willultimately be provided when the mileage credits are redeemed and the other consisting of marketingrelated activities that we conduct with the participating company. The estimated fair value of thetransportation portion of these mileage credits is deferred and recognized as passenger revenue overthe period when transportation is expected to be provided (currently estimated at 22 months). Amountsreceived in excess of the expected transportation’s fair value are recognized immediately as otherrevenue at the time of sale as compensation for marketing services performed. The estimated fair value
46
of the air transportation component is based on several factors, including the equivalent ticket value ofsimilar Company fares and customer habits in redeeming free travel awards.
Under the programs of certain participating companies, credits are accumulated in accounts maintainedby the participating company, then transferred into a member’s HawaiianMiles account for immediateredemption of free travel awards. For those transactions, revenue is amortized over the period duringwhich the mileage is projected to be used (currently estimated at five months).
On a periodic basis, we review and update the assumptions used in our frequent flyer accounting. Onan annual basis, we update the deferral period and deferral rate for mileage credits sold toparticipating companies. We also update the incremental cost assumption quarterly and the breakagerate assumption annually for free travel awards earned in connection with the purchase of passengertickets.
In the fourth quarter of 2012, we recorded a net frequent flyer pre-tax adjustment of $7.3 million tocorrect an error in the accounting for our sale of mileage credits to companies participating in ourfrequent flyer program that are deferred and recognized as passenger revenue. The correction resultedin a change in the deferral period from 19 to 22 months. The error primarily relates to prior periodsand the impact of the error was not material to any prior period or the 2012 fiscal year.
Pension and Other Postretirement and Postemployment Benefits
We account for our defined benefit pension and other postretirement and postemployment plans inaccordance with ASC 715, Compensation—Retirement Benefits (ASC 715). ASC 715 requires companiesto measure their plans’ assets and obligations to determine the funded status at fiscal year-end, reflectthe funded status in the statement of financial position as an asset or liability, and recognize changes inthe funded status of the plans in comprehensive income during the year in which the changes occur.ASC 715 does not change the amount of net periodic benefit expense recognized in our results ofoperations. Pension and other postretirement and postemployment benefit expenses are recognized onan accrual basis over each employee’s service periods. Pension expense is generally independent offunding decisions or requirements.
We have elected temporary Airline Relief with regard to applying the funding rules for our qualifiedpension plans. This relief allows cash contribution requirements to be developed using rules thatcurrently produce lower and more stable contribution requirements than available without this relief;however, this may not be the case throughout the relief period. This relief expires in 2023 for theSalaried and IAM Pension Plans and 2018 for the Pilots Pension Plan.
The calculation of pension and other postretirement and postemployment benefit expenses and itscorresponding liabilities require the use of significant assumptions, including the expected long-termrate of return on plan assets, the assumed discount rate and the expected health care cost trend rate.Changes in these assumptions will impact the expense and liability amounts, and future actual
47
experience may differ from these assumptions. The assumptions as of December 31, 2012 are asfollows:
2012 2011 2010
Pension:Discount rate to determine projected benefit
obligation . . . . . . . . . . . . . . . . . . . . . . . . . . . . . . . 4.10% 4.94% 5.71%Expected return on plan assets . . . . . . . . . . . . . . . . . 7.30%+ 7.90% 7.90%Pilot retirement age . . . . . . . . . . . . . . . . . . . . . . . . . 63.5 63.5 63.5
Postretirement:Discount rate to determine projected benefit
obligation . . . . . . . . . . . . . . . . . . . . . . . . . . . . . . . 4.24% 5.14% 5.81%Expected return on plan assets . . . . . . . . . . . . . . . . . N/A N/A N/AExpected health care cost trend rate:
Initial . . . . . . . . . . . . . . . . . . . . . . . . . . . . . . . . . . 8.00%++ 9.00% 9.00%Ultimate . . . . . . . . . . . . . . . . . . . . . . . . . . . . . . . . 4.75% 4.75% 4.75%Years to reach ultimate trend rate . . . . . . . . . . . . . 7 7 8
Disability:Discount rate to determine projected benefit
obligation . . . . . . . . . . . . . . . . . . . . . . . . . . . . . . . 4.06% 4.91% 5.59%Expected return on plan assets . . . . . . . . . . . . . . . . . 6.90%+ 7.50% 7.50%
N/A Not Applicable
+ Expected return on plan assets used to determine the net periodic benefit expense for2013 changed to 6.55% for the pension plans and 6.15% for the disability plan.
++ Represents the expected health care cost trend rate to determine the projected benefitobligation. The health care cost trend rate used to determine the projected benefitexpense was assumed to be 9.0% and to decrease gradually to 4.75% in 2019.
The expected long-term rate of return assumption is developed by evaluating input from the trusteemanaging the plans’ assets, including the trustee’s review of asset class return expectations by severalconsultants and economists, as well as long-term inflation assumptions. Our expected long-term rate ofreturn on plan assets is based on a target allocation of assets, which is based on our goal of earning thehighest rate of return while maintaining risk at acceptable levels. The plan strives to sufficientlydiversify assets so that adverse or unexpected results from one security class will not have an undulydetrimental impact on the entire portfolio. Our expected long-term rate of return (by category) atDecember 31, 2012 is as follows:
ExpectedLong-Term
Rate of Return
Equity securities—Domestic . . . . . . . . . . . . . . . . . . . . . . . . . . . . . . . 7.53%Equity securities—Foreign . . . . . . . . . . . . . . . . . . . . . . . . . . . . . . . . . 7.50%Fixed income securities . . . . . . . . . . . . . . . . . . . . . . . . . . . . . . . . . . . 2.50%
We believe that our long-term asset allocation on average will approximate the targeted allocation. Weperiodically review our actual asset allocation and will rebalance the pension plan’s investments to ourtargeted allocation when considered appropriate. Pension expense increases as the expected rate ofreturn on plan assets decreases. Lowering the expected long-term rate of return on our pension planassets by one percent (from 6.55% to 5.55%) and on our disability benefit plan assets (from 6.15% to
48
5.15%) would increase our estimated 2013 pension and disability benefit expense by approximately$2.3 million and $0.1 million, respectively.
We determine the appropriate discount rate for each of our plans based on current rates on highquality corporate bonds that would generate the cash flow necessary to pay plan benefits when due.The pension and other postretirement benefit liabilities and future expense both increase as thediscount rate is reduced. Lowering the discount rate by one percent would increase our pension andother postretirement benefit liabilities at December 31, 2012 by approximately $57.0 million and$35.2 million, respectively, and would increase our estimated 2013 pension and other postretirementbenefit expense by approximately $2.2 million and $4.7 million, respectively.
The health care cost trend rate is based upon an evaluation of the Company’s historical trends andexperience taking into account current and expected market conditions. A one percent increase in theassumed health care cost trend rate would increase the other postretirement benefit obligation as ofDecember 31, 2012 by approximately $30.7 million and our estimated 2013 other postretirement benefitexpense by approximately $6.2 million. A one percent decrease in the assumed health care cost trendrate would decrease the other postretirement benefit obligation as of December 31, 2012 byapproximately $24.4 million and our estimated 2013 other postretirement benefit expense byapproximately $4.8 million.
Future changes in plan asset returns, plan provisions, assumed discount rates, pilot estimatedretirement age, pension funding legislation and various other factors related to the participants in ourpension plans will impact our future retirement benefit expense and liabilities. We cannot predict withcertainty what these factors will be in the future.
Aircraft Maintenance and Repair Costs
Maintenance and repair costs for owned and leased flight equipment, including the overhaul of aircraftcomponents, are charged to operating expenses as incurred. Engine overhaul costs covered bypower-by-the-hour arrangements are paid and expensed as incurred and are based on the amount ofhours flown per contract. Under the terms of our power-by-the-hour agreements, we pay a set dollaramount per engine hour flown on a monthly basis and the third-party vendor assumes the obligation torepair the engines at no additional cost to us, subject to certain specified exclusions.
Additionally, although our aircraft lease agreements specifically provide that we, as lessee, areresponsible for maintenance of the leased aircraft, we do, under our existing aircraft lease agreements,pay maintenance reserves to aircraft lessors that are applied towards the cost of future maintenanceevents. These reserves are calculated based on a performance measure, such as flight hours, and areavailable for reimbursement to us upon the completion of the maintenance of the leased aircraft. Ifthere are sufficient funds on deposit to reimburse us for the invoices initially paid by us and thensubmitted to the lessor, they are reimbursed to us. However, reimbursements are limited to theavailable deposits associated with the specific maintenance activity for which we are requestingreimbursement. Under certain of our existing aircraft lease agreements, if there are excess amounts ondeposit at the expiration of the lease, the lessor is entitled to retain any excess amounts; whereas at theexpiration of certain other of our existing aircraft lease agreements any such excess amounts arereturned to us, provided that we have fulfilled all of our obligations under the lease agreements. Themaintenance reserves paid under our lease agreements do not transfer either the obligation to maintainthe aircraft or the cost risk associated with the maintenance activities to the aircraft lessor. In addition,we maintain the right to select any third-party maintenance provider. Therefore, we record theseamounts as a deposit on our balance sheet and then recognize maintenance expense when theunderlying maintenance is performed, in accordance with our maintenance accounting policy.
In accordance with ASC 840-10, on a quarterly basis we complete a forecast of maintenance costs forthe next scheduled event on applicable leased aircraft and compare these estimates to our forecasted
49

nonrefundable deposits to identify costs not expected to be recoverable. Any costs not expected to berecoverable are considered to be not ‘‘substantially and contractually related to maintenance of theleased asset.’’ Therefore, we bifurcate and expense the proportionate share that is estimated to not berecoverable from existing and future nonrefundable deposits. In determining whether it is probable thatmaintenance deposits will be used to fund the cost of the maintenance events, we conduct the followinganalysis:
• We evaluate the aircraft’s condition, including the airframe, the engines, the auxiliary power unitand the landing gear.
• We then project future usage of the aircraft during the term of the lease based on our businessand fleet plan.
• We estimate the cost of performing the next scheduled maintenance event. These estimates arebased on the experience of our maintenance personnel and available industry data, includinghistorical fleet operating statistic reports published by the aircraft and engine manufacturers.
• We compare the forecasted maintenance deposits to be paid at the time of the next scheduledmaintenance event to the estimated cost of the next scheduled maintenance event. Those costsnot expected to be recoverable are considered to be not ‘‘substantially and contractually relatedto maintenance of the leased asset.’’
• We prospectively account for any changes in estimates.
Our assessment of the recoverability of our maintenance deposits is subject to change in the event thatkey estimates and assumptions change over time. Those key estimates and assumptions include ourfleet plan and the projected total cost and, to a lesser extent, anticipated timing of the majormaintenance activities covered by the maintenance reserves.
Based on current market conditions, we believe that further significant changes in our fleet plan areunlikely. Furthermore, based on historical trends and future projections, including those published bythe manufacturers of our aircraft and engines, we believe it is unlikely that future maintenance costsfor our aircraft will decline to such an extent that the maintenance deposits currently recorded on ourConsolidated Balance Sheets would not be used to fund the cost of future maintenance events and,therefore, not be recoverable.
Tax Valuation Allowance
In assessing the realizability of deferred tax assets, management considers whether it is more likely thannot that some portion or all of Hawaiian’s deferred tax assets will not be realized. The ultimaterealization of Hawaiian’s deferred tax assets is dependent upon our ability to generate future taxableincome during the periods in which those temporary differences become deductible. We continue tobelieve our projections of future taxable income are sufficient to support recognition of our deferredtax assets. As of December 31, 2012, we do not have a tax valuation allowance. For additionalinformation on income taxes, see Note 8 to the consolidated financial statements.
50

ITEM 7A. QUANTITATIVE AND QUALITATIVE DISCLOSURES ABOUT MARKET RISK.
We are subject to certain market risks, including commodity price risk (i.e., jet fuel prices) and interestrate risk. We have market-sensitive instruments in the form of financial derivatives used to hedgeHawaiian’s exposure to increases in jet fuel prices and variable-rate debt. The fair value of ourfixed-rate debt is subject to market risk due to the variability of interest rates. The adverse effects ofpotential changes in these market risks are discussed below. The sensitivity analyses presented does notconsider the effects of such adverse changes on the overall economy nor does it consider additionalactions we may undertake to mitigate exposure to such adverse changes. Actual results may differ. Seediscussion of critical accounting policies above for additional information over these financialinstruments.
Aircraft Fuel Costs
Aircraft fuel costs constitute a significant portion of our operating expense. Fuel costs represented34.5%, 31.5% and 26.5% of our operating expenses for the years ended December 31, 2012, 2011 and2010, respectively. Based on gallons expected to be consumed in 2013, for every one cent increase inthe cost of jet fuel, our annual fuel expense would increase by approximately $2.3 million.
We periodically enter into derivative financial instruments to manage our exposure to changes in theprices of jet fuel. During 2012, our fuel hedge program primarily consisted of heating oil, WTI andBrent crude oil call options and collars. Call option contracts provide for a settlement in favor of theholder, while put option contracts provide settlement in favor of the owner in the event that pricesexceed a predetermined contractual level during a particular time period. We have combined some ofour call option contracts with put option contract sales to create ‘‘collars’’ whereby a settlement mayoccur in our favor in the event prices for the underlying commodity exceed a predeterminedcontractual level (the call option strike price) during a particular time period or a settlement may berequired from us in favor of our counterparty in the event that prices of the commodity fall below apredetermined contractual level (the put option strike price).
The aforementioned fuel derivative financial instruments were not designated as hedges underASC 815. As of December 31, 2012, the fair value of these fuel derivatives reflected a net asset of$12.7 million, and is reflected in prepaid expenses and other assets in the Consolidated Balance Sheets.
51
Our future contracts and other fuel derivative agreements as of January 18, 2013 is outlined in thetable below:
Percentage ofWeighted Average Projected FuelContract Price Requirements Fuel BarrelsCap Floor Hedged Hedged
First Quarter 2013Crude Oil (per barrel)
Brent Call Options . . . . . . . . . . . . . . . . . . . . . . . . . . $115.57 N/A 63% 814,000
Total . . . . . . . . . . . . . . . . . . . . . . . . . . . . . . . . . . . . . . 63% 814,000
Second Quarter 2013Crude Oil (per barrel)
Brent Call Options . . . . . . . . . . . . . . . . . . . . . . . . . . $113.84 N/A 56% 752,000
Total . . . . . . . . . . . . . . . . . . . . . . . . . . . . . . . . . . . . . . 56% 752,000
Third Quarter 2013Crude Oil (per barrel)
Brent Call Options . . . . . . . . . . . . . . . . . . . . . . . . . . $114.69 N/A 47% 657,000
Total . . . . . . . . . . . . . . . . . . . . . . . . . . . . . . . . . . . . . . 47% 657,000
Fourth Quarter 2013Crude Oil (per barrel)
Brent Call Options . . . . . . . . . . . . . . . . . . . . . . . . . . $115.22 N/A 34% 477,000
Total . . . . . . . . . . . . . . . . . . . . . . . . . . . . . . . . . . . . . . 34% 477,000
First Quarter 2014Crude Oil (per barrel)
Brent Call Options . . . . . . . . . . . . . . . . . . . . . . . . . . $117.59 N/A 19% 273,000Brent Collars . . . . . . . . . . . . . . . . . . . . . . . . . . . . . . . $116.10 $80.00 3% 45,000
Total . . . . . . . . . . . . . . . . . . . . . . . . . . . . . . . . . . . . . . 22% 318,000
Second Quarter 2014Crude Oil (per barrel)
Brent Call Options . . . . . . . . . . . . . . . . . . . . . . . . . . $115.56 N/A 5% 80,000Brent Collars . . . . . . . . . . . . . . . . . . . . . . . . . . . . . . . $116.41 $80.00 5% 70,000
Total . . . . . . . . . . . . . . . . . . . . . . . . . . . . . . . . . . . . . . 10% 150,000
We expect to continue our program of hedging a portion of our future fuel consumption with acombination of futures contracts, swaps, caps, collars, or other option-based structures.
We do not hold or issue derivative financial instruments for trading purposes. We are exposed to creditrisks in the event our counterparties fail to meet their obligations; however, we do not expect thesecounterparties to fail to meet their obligations.
Interest Rates
Our results of operations are affected by fluctuations in interest rates due to our variable-rate debt andinterest income earned on our cash deposits. Our variable-rate debt agreements include the RevolvingCredit Facility (we had no outstanding borrowings under the Revolving Credit Facility at December 31,2012 and 2011) and a secured loan agreement, the terms of which are discussed in Note 6—Debt tothe consolidated financial statements.
52

At December 31, 2012, we had $64.7 million of variable-rate debt indexed to the following interest rate:
Index Rate
One-Month LIBOR . . . . . . . . . . . . . . . . . . . . . . . . . . . . . . . . . . . . . . . . . 0.2108%
Changes in market interest rates have a direct and corresponding effect on our pre-tax earnings andcash flows associated with our variable-rate debt and interest-bearing cash accounts. Based on thebalances of our cash and cash equivalents, restricted cash, and variable-rate debt as of December 31,2012, a change in interest rates is unlikely to have a material impact on our results of operations.
As of December 31, 2012 and 2011, we did not have any interest rate hedges.
At December 31, 2012, we had $489.8 million of fixed-rate debt including aircraft capital leaseobligations, convertible notes and facility agreements for aircraft purchases, as further discussed inNote 6 to the consolidated financial statements. Market risk for fixed-rate long-term debt is estimatedas the potential increase in fair value resulting from a hypothetical 10 percent decrease in interestrates, and amounted to approximately $3.0 million as of December 31, 2012.
Foreign Currency
We generate revenues and incur expenses in foreign currencies. Changes in foreign currency exchangerates impact our results of operations through changes in the dollar value of foreign currency-denominated operating revenues and expenses. Our most significant foreign currency exposure is theJapanese yen. Based on expected 2013 revenues and expenses denominated in Japanese yen, a 10%strengthening in value of the U.S. dollar, relative to the Japanese yen, would result in a decrease inoperating income of approximately $30.2 million, net of gain relizable from yen hedges discussed below.The variance is due to our Japanese yen denominated revenues exceeding our Japanese yendenominated expenses.
At December 31, 2012 and 2011, we did not have any foreign currency hedges. In January 2013, weentered into forward contracts for the purchase of Japanese yen. As of February 1, 2013, we hadforward contracts covering approximately 16% of our anticipated yen sales in 2013 at an average rateof 89.50 yen per U.S. Dollar.
53

ITEM 8. FINANCIAL STATEMENTS AND SUPPLEMENTARY DATA.
INDEX TO FINANCIAL STATEMENTS
Page
Hawaiian Holdings, Inc.Report of Independent Registered Public Accounting Firm . . . . . . . . . . . . . . . . . . . . . . . . . . . . 55Consolidated Statements of Operations for the years ended December 31, 2012, 2011 and 2010 . . 56Consolidated Statements of Comprehensive Income (Loss) for the years ended December 31,
2012, 2011 and 2010 . . . . . . . . . . . . . . . . . . . . . . . . . . . . . . . . . . . . . . . . . . . . . . . . . . . . . . . 57Consolidated Balance Sheets as of December 31, 2012 and 2011 . . . . . . . . . . . . . . . . . . . . . . . . 58Consolidated Statements of Shareholders’ Equity for the years ended December 31, 2012, 2011
and 2010 . . . . . . . . . . . . . . . . . . . . . . . . . . . . . . . . . . . . . . . . . . . . . . . . . . . . . . . . . . . . . . . 59Consolidated Statements of Cash Flows for the years ended December 31, 2012, 2011 and 2010 . 60Notes to Consolidated Financial Statements . . . . . . . . . . . . . . . . . . . . . . . . . . . . . . . . . . . . . . . 61
54
REPORT OF INDEPENDENT REGISTERED PUBLIC ACCOUNTING FIRM
The Board of Directors and ShareholdersHawaiian Holdings, Inc.
We have audited the accompanying consolidated balance sheets of Hawaiian Holdings, Inc. as ofDecember 31, 2012 and 2011, and the related consolidated statements of operations, comprehensiveincome (loss), shareholders’ equity, and cash flows for each of the three years in the period endedDecember 31, 2012. Our audits also included the financial statement schedule listed in the Index atItem 15(a). These financial statements and schedule are the responsibility of the Company’smanagement. Our responsibility is to express an opinion on these financial statements and schedulebased on our audits.
We conducted our audits in accordance with the standards of the Public Company AccountingOversight Board (United States). Those standards require that we plan and perform the audit to obtainreasonable assurance about whether the financial statements are free of material misstatement. Anaudit includes examining, on a test basis, evidence supporting the amounts and disclosures in thefinancial statements. An audit also includes assessing the accounting principles used and significantestimates made by management, as well as evaluating the overall financial statement presentation. Webelieve that our audits provide a reasonable basis for our opinion.
In our opinion, the financial statements referred to above present fairly, in all material respects, theconsolidated financial position of Hawaiian Holdings, Inc. at December 31, 2012 and 2011, and theconsolidated results of its operations and its cash flows for each of the three years in the period endedDecember 31, 2012, in conformity with U.S. generally accepted accounting principles. Also, in ouropinion, the related financial statement schedule, when considered in relation to the basic financialstatements taken as a whole, presents fairly in all material respects the information set forth therein.
We also have audited, in accordance with the standards of the Public Company Accounting OversightBoard (United States), Hawaiian Holdings, Inc.’s internal control over financial reporting as ofDecember 31, 2012, based on criteria established in Internal Control—Integrated Framework issued bythe Committee of Sponsoring Organizations of the Treadway Commission and our report datedFebruary 8, 2013, expressed an unqualified opinion thereon.
/s/ ERNST & YOUNG LLP
Honolulu, HawaiiFebruary 8, 2013
55

Hawaiian Holdings, Inc.
Consolidated Statements of Operations
For the Years ended December 31, 2012, 2011 and 2010
2012 2011 2010
(in thousands, except per share data)
Operating Revenue:Passenger . . . . . . . . . . . . . . . . . . . . . . . . . . . . . . . . . . . . . . . $1,767,041 $1,480,663 $1,154,972Other . . . . . . . . . . . . . . . . . . . . . . . . . . . . . . . . . . . . . . . . . 195,312 169,796 155,121
Total . . . . . . . . . . . . . . . . . . . . . . . . . . . . . . . . . . . . . . . . 1,962,353 1,650,459 1,310,093
Operating Expenses:Aircraft fuel, including taxes and oil . . . . . . . . . . . . . . . . . . . 631,741 513,284 322,999Wages and benefits . . . . . . . . . . . . . . . . . . . . . . . . . . . . . . . . 376,574 321,241 297,567Aircraft rent . . . . . . . . . . . . . . . . . . . . . . . . . . . . . . . . . . . . 98,786 112,883 112,721Maintenance materials and repairs . . . . . . . . . . . . . . . . . . . . 183,552 169,851 123,975Aircraft and passenger servicing . . . . . . . . . . . . . . . . . . . . . . 103,825 82,250 62,160Commissions and other selling . . . . . . . . . . . . . . . . . . . . . . . 114,324 96,264 78,197Depreciation and amortization . . . . . . . . . . . . . . . . . . . . . . . 85,599 66,262 57,712Other rentals and landing fees . . . . . . . . . . . . . . . . . . . . . . . 85,623 72,445 57,833Other . . . . . . . . . . . . . . . . . . . . . . . . . . . . . . . . . . . . . . . . . 152,931 125,682 105,651Lease termination charges . . . . . . . . . . . . . . . . . . . . . . . . . . — 70,014 —
Total . . . . . . . . . . . . . . . . . . . . . . . . . . . . . . . . . . . . . . . . 1,832,955 1,630,176 1,218,815
Operating Income . . . . . . . . . . . . . . . . . . . . . . . . . . . . . . . . . . 129,398 20,283 91,278
Nonoperating Income (Expense):Interest expense and amortization of debt discounts and
issuance costs . . . . . . . . . . . . . . . . . . . . . . . . . . . . . . . . . . (43,522) (24,521) (16,835)Interest income . . . . . . . . . . . . . . . . . . . . . . . . . . . . . . . . . . 580 1,514 3,634Capitalized interest . . . . . . . . . . . . . . . . . . . . . . . . . . . . . . . . 10,524 7,771 2,665Gains (losses) on fuel derivatives . . . . . . . . . . . . . . . . . . . . . . (11,330) (6,862) 641Gains on investments . . . . . . . . . . . . . . . . . . . . . . . . . . . . . . — — 1,168Other, net . . . . . . . . . . . . . . . . . . . . . . . . . . . . . . . . . . . . . . 136 733 (562)
Total . . . . . . . . . . . . . . . . . . . . . . . . . . . . . . . . . . . . . . . . (43,612) (21,365) (9,289)
Income (Loss) Before Income Taxes . . . . . . . . . . . . . . . . . . . . . 85,786 (1,082) 81,989Income tax (benefit) expense . . . . . . . . . . . . . . . . . . . . . . . . 32,549 1,567 (28,266)
Net Income (Loss) . . . . . . . . . . . . . . . . . . . . . . . . . . . . . . . . . . $ 53,237 $ (2,649) $ 110,255
Net Income (Loss) Per Common Stock Share:Basic . . . . . . . . . . . . . . . . . . . . . . . . . . . . . . . . . . . . . . . . . . $ 1.04 $ (0.05) $ 2.15
Diluted . . . . . . . . . . . . . . . . . . . . . . . . . . . . . . . . . . . . . . . . $ 1.01 $ (0.05) $ 2.10
Weighted Average Number of Common Stock SharesOutstanding:Basic . . . . . . . . . . . . . . . . . . . . . . . . . . . . . . . . . . . . . . . . . . 51,314 50,733 51,232
Diluted . . . . . . . . . . . . . . . . . . . . . . . . . . . . . . . . . . . . . . . . 52,535 50,733 52,482
See accompanying Notes to Consolidated Financial Statements.
56

Hawaiian Holdings, Inc.
Consolidated Statements of Comprehensive Income (Loss)
For the Years ended December 31, 2012, 2011 and 2010
Year Ended December 31,
2012 2011 2010
(in thousands)
Net Income (Loss) . . . . . . . . . . . . . . . . . . . . . . . . . . . . . . . . . . . . . . $ 53,237 $ (2,649) $110,255Other comprehensive loss, net:Net change related to employee benefit plans, net of tax of $9,224,
$38,822 and $2,040 for 2012, 2011 and 2010, respectively . . . . . . . . . (11,714) (67,061) (3,105)Unrealized loss on short-term and long-term investments, net of tax of
$468 for 2010 . . . . . . . . . . . . . . . . . . . . . . . . . . . . . . . . . . . . . . . . — — (717)
Total other comprehensive loss, net . . . . . . . . . . . . . . . . . . . . . . . . . . (11,714) (67,061) (3,822)
Total comprehensive income (loss), net . . . . . . . . . . . . . . . . . . . . . . . $ 41,523 $(69,710) $106,433
See accompanying Notes to Consolidated Financial Statements.
57
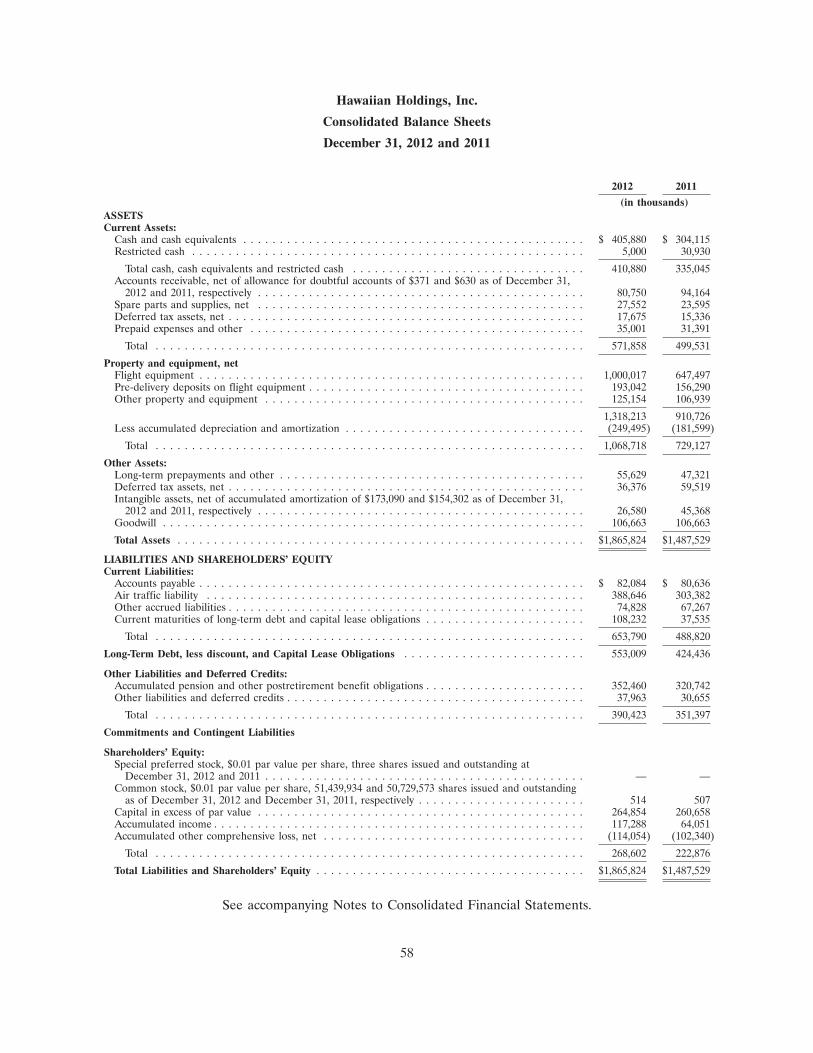
Hawaiian Holdings, Inc.
Consolidated Balance Sheets
December 31, 2012 and 2011
2012 2011
(in thousands)ASSETSCurrent Assets:
Cash and cash equivalents . . . . . . . . . . . . . . . . . . . . . . . . . . . . . . . . . . . . . . . . . . . . . . . $ 405,880 $ 304,115Restricted cash . . . . . . . . . . . . . . . . . . . . . . . . . . . . . . . . . . . . . . . . . . . . . . . . . . . . . . 5,000 30,930
Total cash, cash equivalents and restricted cash . . . . . . . . . . . . . . . . . . . . . . . . . . . . . . . . 410,880 335,045Accounts receivable, net of allowance for doubtful accounts of $371 and $630 as of December 31,
2012 and 2011, respectively . . . . . . . . . . . . . . . . . . . . . . . . . . . . . . . . . . . . . . . . . . . . . 80,750 94,164Spare parts and supplies, net . . . . . . . . . . . . . . . . . . . . . . . . . . . . . . . . . . . . . . . . . . . . . 27,552 23,595Deferred tax assets, net . . . . . . . . . . . . . . . . . . . . . . . . . . . . . . . . . . . . . . . . . . . . . . . . . 17,675 15,336Prepaid expenses and other . . . . . . . . . . . . . . . . . . . . . . . . . . . . . . . . . . . . . . . . . . . . . . 35,001 31,391
Total . . . . . . . . . . . . . . . . . . . . . . . . . . . . . . . . . . . . . . . . . . . . . . . . . . . . . . . . . . . 571,858 499,531
Property and equipment, netFlight equipment . . . . . . . . . . . . . . . . . . . . . . . . . . . . . . . . . . . . . . . . . . . . . . . . . . . . . 1,000,017 647,497Pre-delivery deposits on flight equipment . . . . . . . . . . . . . . . . . . . . . . . . . . . . . . . . . . . . . . 193,042 156,290Other property and equipment . . . . . . . . . . . . . . . . . . . . . . . . . . . . . . . . . . . . . . . . . . . . 125,154 106,939
1,318,213 910,726Less accumulated depreciation and amortization . . . . . . . . . . . . . . . . . . . . . . . . . . . . . . . . . (249,495) (181,599)
Total . . . . . . . . . . . . . . . . . . . . . . . . . . . . . . . . . . . . . . . . . . . . . . . . . . . . . . . . . . . 1,068,718 729,127
Other Assets:Long-term prepayments and other . . . . . . . . . . . . . . . . . . . . . . . . . . . . . . . . . . . . . . . . . . 55,629 47,321Deferred tax assets, net . . . . . . . . . . . . . . . . . . . . . . . . . . . . . . . . . . . . . . . . . . . . . . . . . 36,376 59,519Intangible assets, net of accumulated amortization of $173,090 and $154,302 as of December 31,
2012 and 2011, respectively . . . . . . . . . . . . . . . . . . . . . . . . . . . . . . . . . . . . . . . . . . . . . 26,580 45,368Goodwill . . . . . . . . . . . . . . . . . . . . . . . . . . . . . . . . . . . . . . . . . . . . . . . . . . . . . . . . . . 106,663 106,663
Total Assets . . . . . . . . . . . . . . . . . . . . . . . . . . . . . . . . . . . . . . . . . . . . . . . . . . . . . . . . $1,865,824 $1,487,529
LIABILITIES AND SHAREHOLDERS’ EQUITYCurrent Liabilities:
Accounts payable . . . . . . . . . . . . . . . . . . . . . . . . . . . . . . . . . . . . . . . . . . . . . . . . . . . . . $ 82,084 $ 80,636Air traffic liability . . . . . . . . . . . . . . . . . . . . . . . . . . . . . . . . . . . . . . . . . . . . . . . . . . . . 388,646 303,382Other accrued liabilities . . . . . . . . . . . . . . . . . . . . . . . . . . . . . . . . . . . . . . . . . . . . . . . . . 74,828 67,267Current maturities of long-term debt and capital lease obligations . . . . . . . . . . . . . . . . . . . . . . 108,232 37,535
Total . . . . . . . . . . . . . . . . . . . . . . . . . . . . . . . . . . . . . . . . . . . . . . . . . . . . . . . . . . . 653,790 488,820
Long-Term Debt, less discount, and Capital Lease Obligations . . . . . . . . . . . . . . . . . . . . . . . . . 553,009 424,436
Other Liabilities and Deferred Credits:Accumulated pension and other postretirement benefit obligations . . . . . . . . . . . . . . . . . . . . . . 352,460 320,742Other liabilities and deferred credits . . . . . . . . . . . . . . . . . . . . . . . . . . . . . . . . . . . . . . . . . 37,963 30,655
Total . . . . . . . . . . . . . . . . . . . . . . . . . . . . . . . . . . . . . . . . . . . . . . . . . . . . . . . . . . . 390,423 351,397
Commitments and Contingent Liabilities
Shareholders’ Equity:Special preferred stock, $0.01 par value per share, three shares issued and outstanding at
December 31, 2012 and 2011 . . . . . . . . . . . . . . . . . . . . . . . . . . . . . . . . . . . . . . . . . . . . — —Common stock, $0.01 par value per share, 51,439,934 and 50,729,573 shares issued and outstanding
as of December 31, 2012 and December 31, 2011, respectively . . . . . . . . . . . . . . . . . . . . . . . 514 507Capital in excess of par value . . . . . . . . . . . . . . . . . . . . . . . . . . . . . . . . . . . . . . . . . . . . . 264,854 260,658Accumulated income . . . . . . . . . . . . . . . . . . . . . . . . . . . . . . . . . . . . . . . . . . . . . . . . . . . 117,288 64,051Accumulated other comprehensive loss, net . . . . . . . . . . . . . . . . . . . . . . . . . . . . . . . . . . . . (114,054) (102,340)
Total . . . . . . . . . . . . . . . . . . . . . . . . . . . . . . . . . . . . . . . . . . . . . . . . . . . . . . . . . . . 268,602 222,876
Total Liabilities and Shareholders’ Equity . . . . . . . . . . . . . . . . . . . . . . . . . . . . . . . . . . . . . $1,865,824 $1,487,529
See accompanying Notes to Consolidated Financial Statements.
58

Hawaiian Holdings, Inc.
Consolidated Statements of Shareholders’ Equity
For the Years ended December 31, 2012, 2011 and 2010
AccumulatedSpecial Capital In Accumulated Other
Common Preferred Treasury Excess of Income ComprehensiveStock(*) Stock(**) Stock Par Value (Deficit) Income (Loss) Total
(in thousands, except share data)Balance at December 31, 2009 . . . . . . . . . . . . . . . . . . $516 $— $ (754) $240,608 $(32,824) $ (31,457) $176,089Net income . . . . . . . . . . . . . . . . . . . . . . . . . . . . . — — — — 110,255 — 110,255Other comprehensive loss . . . . . . . . . . . . . . . . . . . . — — — — — (3,822) (3,822)Issuance of 609,187 shares of common stock related to stock
awards . . . . . . . . . . . . . . . . . . . . . . . . . . . . . . 6 — — (132) — — (126)Exercise of warrants to acquire 1,000 shares of common
stock . . . . . . . . . . . . . . . . . . . . . . . . . . . . . . . — — — 7 — — 7Share-based compensation expense . . . . . . . . . . . . . . . — — — 5,001 — — 5,001Treasury stock buy-back to acquire 1,868,563 shares . . . . . — — (9,998) — — — (9,998)Excess tax benefits from exercise of stock options . . . . . . . — — — 463 — — 463
Balance at December 31, 2010 . . . . . . . . . . . . . . . . . . $522 $— $(10,752) $245,947 $ 77,431 $ (35,279) $277,869
Net loss . . . . . . . . . . . . . . . . . . . . . . . . . . . . . . . — — — — (2,649) — (2,649)Other comprehensive loss . . . . . . . . . . . . . . . . . . . . (67,061) (67,061)Issuance of 508,696 shares of common stock related to stock
awards . . . . . . . . . . . . . . . . . . . . . . . . . . . . . . 6 — — (1,122) — — (1,116)Share-based compensation expense . . . . . . . . . . . . . . . — — — 4,302 — — 4,302Convertible note . . . . . . . . . . . . . . . . . . . . . . . . . . — — — 19,504 — — 19,504Purchase of convertible note hedges . . . . . . . . . . . . . . — — — (19,504) — — (19,504)Convertible note issuance costs net of deferred tax benefit
of $302 . . . . . . . . . . . . . . . . . . . . . . . . . . . . . . — — — (463) — — (463)Sale of common stock warrants . . . . . . . . . . . . . . . . . — — — 11,948 — — 11,948Treasury stock retirement of 2,070,214 shares . . . . . . . . . (21) — 10,752 — (10,731) — —Excess tax benefits from exercise of stock options . . . . . . . — — — 46 — — 46
Balance at December 31, 2011 . . . . . . . . . . . . . . . . . . $507 $— $ — $260,658 $ 64,051 $(102,340) $222,876
Net Income . . . . . . . . . . . . . . . . . . . . . . . . . . . . . — — — — 53,237 — 53,237Other comprehensive loss . . . . . . . . . . . . . . . . . . . . (11,714) (11,714)Issuance of 710,361 shares of common stockrelated to stock
awards . . . . . . . . . . . . . . . . . . . . . . . . . . . . . . 7 — — 763 — — 770Share-based compensation expense . . . . . . . . . . . . . . . — — — 3,433 — — 3,433
Balance at December 31, 2012 . . . . . . . . . . . . . . . . . . $514 $— $ — $264,854 $117,288 $(114,054) $268,602
(*) Common Stock—$0.01 par value; 118,000,000 authorized as of December 31, 2012 and 2011.
(**) Special Preferred Stock—$0.01 par value; 2,000,000 shares authorized as of December 31, 2012 and 2011.
See accompanying Notes to Consolidated Financial Statements.
59

Hawaiian Holdings, Inc.
Consolidated Statements of Cash Flows
For the Years ended December 31, 2012, 2011 and 2010
2012 2011 2010
(in thousands)Cash Flows From Operating Activities:Net income (Loss) . . . . . . . . . . . . . . . . . . . . . . . . . . . . . . . . . . . . . . $ 53,237 $ (2,649) $ 110,255Adjustments to reconcile net income (loss) to net cash provided by
operating activities:Amortization of intangible assets . . . . . . . . . . . . . . . . . . . . . . . . . . 18,788 23,352 23,486Depreciation and amortization of property and equipment . . . . . . . . 69,521 48,875 40,325Deferred income taxes . . . . . . . . . . . . . . . . . . . . . . . . . . . . . . . . . 31,333 43,768 (51,990)Stock compensation . . . . . . . . . . . . . . . . . . . . . . . . . . . . . . . . . . . 3,516 4,302 5,001Lease termination charges . . . . . . . . . . . . . . . . . . . . . . . . . . . . . . . — 70,014 —Amortization of debt discounts and issuance costs . . . . . . . . . . . . . . 5,599 3,932 2,713Gain on sale of investments . . . . . . . . . . . . . . . . . . . . . . . . . . . . . — — (1,168)Pension and postretirement benefit cost, net . . . . . . . . . . . . . . . . . . 11,627 1,676 (22,425)Issuance of forward sold miles . . . . . . . . . . . . . . . . . . . . . . . . . . . . — (8,747) (12,463)Other, net . . . . . . . . . . . . . . . . . . . . . . . . . . . . . . . . . . . . . . . . . . (10,039) (7,530) (5,615)Changes in operating assets and liabilities:
Restricted cash . . . . . . . . . . . . . . . . . . . . . . . . . . . . . . . . . . . . . 25,930 (25,706) 20,507Accounts receivable . . . . . . . . . . . . . . . . . . . . . . . . . . . . . . . . . 12,698 (35,408) (11,326)Spare parts and supplies . . . . . . . . . . . . . . . . . . . . . . . . . . . . . . (6,660) (7,181) (1,777)Prepaid expenses and other current assets . . . . . . . . . . . . . . . . . . (2,373) (7,033) (3,607)Accounts payable . . . . . . . . . . . . . . . . . . . . . . . . . . . . . . . . . . . 1,447 11,336 22,953Air traffic liability . . . . . . . . . . . . . . . . . . . . . . . . . . . . . . . . . . . 85,264 61,268 32,729Other accrued liabilities . . . . . . . . . . . . . . . . . . . . . . . . . . . . . . . 7,459 3,240 2,117Other assets and liabilities, net . . . . . . . . . . . . . . . . . . . . . . . . . . 3,670 1,255 582
Net cash provided by operating activities . . . . . . . . . . . . . . . . . . . 311,017 178,764 150,297
Cash Flows From Investing Activities:Additions to property and equipment, including pre-delivery deposits (290,699) (281,903) (140,460)Purchases of short-term investments . . . . . . . . . . . . . . . . . . . . . . . . — — (109,623)Sales of short and long-term investments . . . . . . . . . . . . . . . . . . . . — — 141,410
Net cash used in investing activities . . . . . . . . . . . . . . . . . . . . . . (290,699) (281,903) (108,673)
Cash Flows From Financing Activities:Proceeds from exercise of stock options . . . . . . . . . . . . . . . . . . . . . 1,488 226 1,477Convertible Notes:
Issuance of convertible notes . . . . . . . . . . . . . . . . . . . . . . . . . . . — 86,250 —Purchase of call options and sale of common stock warrants, net . . — (19,504) —Proceeds from issuance of warrants . . . . . . . . . . . . . . . . . . . . . . — 11,948 —
Long-term borrowings . . . . . . . . . . . . . . . . . . . . . . . . . . . . . . . . . 133,000 132,000 54,746Treasury stock repurchase . . . . . . . . . . . . . . . . . . . . . . . . . . . . . . . — — (9,998)Repayments of long-term debt and capital lease obligations . . . . . . . (49,129) (80,023) (101,176)Debt issuance costs . . . . . . . . . . . . . . . . . . . . . . . . . . . . . . . . . . . (3,828) (8,726) (2,837)Other . . . . . . . . . . . . . . . . . . . . . . . . . . . . . . . . . . . . . . . . . . . . . (84) 46 463
Net cash provided by (used in) financing activities . . . . . . . . . . . . 81,447 122,217 (57,325)
Net increase (decrease) in cash and cash equivalents . . . . . . . . . . . . . 101,765 19,078 (15,701)Cash and cash equivalents—Beginning of Year . . . . . . . . . . . . . . . . . 304,115 285,037 300,738
Cash and cash equivalents—End of Year . . . . . . . . . . . . . . . . . . . . . . $ 405,880 $ 304,115 $ 285,037
See accompanying Notes to Consolidated Financial Statements.
60

Hawaiian Holdings, Inc.
Notes to Consolidated Financial Statements
1. Business and Organization
Hawaiian Holdings, Inc. (the ‘‘Company,’’ ‘‘Holdings,’’ ‘‘we,’’ ‘‘us’’ and ‘‘our’’) and its direct wholly-owned subsidiary, Hawaiian Airlines, Inc. (Hawaiian), are incorporated in the State of Delaware. TheCompany’s primary asset is its sole ownership of all issued and outstanding shares of common stock ofHawaiian.
Hawaiian is engaged in the scheduled air transportation of passengers and cargo amongst the HawaiianIslands (the Neighbor Island routes), between the Hawaiian Islands and certain cities in the UnitedStates (the North America routes), and between the Hawaiian Islands and the South Pacific, Australiaand Asia (the International routes), collectively referred to as our Scheduled Operations. In addition,Hawaiian also operates various charter flights. Hawaiian is the largest airline headquartered in Hawaiiand the eleventh largest domestic airline in the United States based on revenue passenger milesreported by the Research and Innovative Technology Administration Bureau of Transportation Servicesas of October 31, 2012, latest data available. As of December 31, 2012, Hawaiian’s fleet consisted of 18Boeing 717-200 aircraft for its Neighbor Island routes, and 16 Boeing 767-300 and nine AirbusA330-200 aircraft for its North America, International and charter routes. The Company also has twoATR42 turboprop aircraft for pending service to new Neighbor Island destinations in 2013.
2. Summary of Significant Accounting Policies
Basis of Presentation
The consolidated financial statements include the accounts of the Company and its wholly-ownedsubsidiaries, including its principal subsidiary, Hawaiian, through which the Company conductssubstantially all of its operations. All significant intercompany balances and transactions have beeneliminated upon consolidation.
Cash Equivalents
The Company considers all investments with an original maturity of three months or less at the date ofpurchase to be cash equivalents.
Restricted Cash
At December 31, 2012 and 2011, restricted cash primarily consist of cash deposits held by institutionsthat process credit card transactions.
Spare Parts and Supplies
Spare parts and supplies are valued at average cost, and primarily consist of expendable parts for flightequipment and other supplies. An allowance for obsolescence of expendable parts is provided over theestimated useful lives of the related aircraft and engines for spare parts expected to be on hand at thedate the aircraft are retired from service. An allowance is also provided to reduce the carrying amountof excess spare parts to the lower of cost or net realizable value. These allowances are based onmanagement’s estimates and are subject to change.
61

Hawaiian Holdings, Inc.
Notes to Consolidated Financial Statements (Continued)
2. Summary of Significant Accounting Policies (Continued)
Property, Equipment and Depreciation
Property and equipment are stated at cost and depreciated on a straight-line basis to its estimatedresidual value over the asset’s estimated useful life. Depreciation begins when the asset is placed intoservice. Aircraft and related parts begin depreciating on the aircraft’s first revenue flight.
Estimated useful lives and residual values of property and equipment are as follows:
Boeing 717-200 aircraft and engines . . . . . . . . . . . 7 - 11 years, 7 - 34% residual valueBoeing 767-300 aircraft and engines . . . . . . . . . . . 7 - 20 years, 0 - 10% residual valueAirbus A330-200 aircraft and engines . . . . . . . . . . 25 years, 10% residual valueAircraft under capital leases . . . . . . . . . . . . . . . . 8 - 12 years, no residual valueMajor rotable parts . . . . . . . . . . . . . . . . . . . . . . . Average lease term or useful life for related
aircraft, 10% - 15% residual valueImprovements to leased flight equipment . . . . . . . Shorter of lease term or useful lifeFacility leasehold improvements . . . . . . . . . . . . . . Shorter of lease term, including assumed lease
renewals when renewal is economically compelledat key airports or useful life
Furniture, fixtures and other equipment . . . . . . . . 3 - 7 years, no residual valueCapitalized software . . . . . . . . . . . . . . . . . . . . . . 3 - 7 years, no residual value
Additions and modifications that significantly enhance the operating performance and/or extend theuseful lives of property and equipment are capitalized and depreciated over the lesser of the remaininguseful life of the asset or the remaining lease term, as applicable. Expenditures that do not improve orextend asset lives are charged to expense as incurred. Pre-delivery deposits are capitalized when paid.
Aircraft under capital leases are recorded at an amount equal to the present value of minimum leasepayments utilizing our incremental borrowing rate at lease inception and amortized on a straight-linebasis over the lesser of the remaining useful life of the aircraft or the lease term. The amortization isrecorded in depreciation and amortization expense on the Consolidated Statement of Operations.
The Company capitalizes certain costs related to the acquisition and development of computer softwareand amortizes these costs using the straight-line method over the estimated useful life of the software.The net book value of computer software, which is included in Other property and equipment on ourconsolidated balance sheets, was $15.4 million and $16.0 million at December 31, 2012 and 2011,respectively. Amortization expense related to computer software was $7.7 million, $5.9 million and$6.7 million for the years ended December 31, 2012, 2011 and 2010, respectively.
Aircraft Maintenance and Repair Costs
Aircraft maintenance and repairs are charged to expense as incurred, except for charges formaintenance and repairs under power-by-the-hour maintenance contracts which are accrued andexpensed when a contractual obligation exists, generally on the basis of hours flown.
The Company accounts for nonrefundable maintenance deposits as an asset until any portion of theestimated total amount of the deposit is less than probable of being returned on leased aircraft. Inaddition, payments of maintenance deposits that are not ‘‘substantially and contractually related to themaintenance of the lease assets’’ are expensed as incurred. Any costs not expected to be recoverableare considered to be not ‘‘substantially and contractually related to maintenance of the lease asset.’’
62
Hawaiian Holdings, Inc.
Notes to Consolidated Financial Statements (Continued)
2. Summary of Significant Accounting Policies (Continued)
Therefore, the Company bifurcates deposit payments and expenses the proportionate share that isestimated to not be recoverable from existing and future nonrefundable deposits.
Goodwill and Indefinite-lived Intangible Assets
Goodwill and intangible assets with indefinite lives are not amortized, but are tested for impairment atleast annually using a ‘‘two-step process’’ under Accounting Standard Codification (ASC) Intangibles—Goodwill and Other (ASC 350). In the first step, the fair value of the Company’s reporting unit iscompared to its carrying value. If the fair value of the Company’s reporting unit exceeds the carryingvalue of its net assets, goodwill is not impaired and no further testing is required. If the carrying valueof the net assets of the Company’s reporting unit exceeds its fair value, then the second step of theimpairment test must be performed in order to determine the implied fair value of the Company’sreporting unit. If the carrying value of the goodwill exceeds its implied fair value, then an impairmentloss for the difference is recorded.
For its annual goodwill impairment test, the Company performed the first step under ASC 350 andconcluded that as of October 1, 2012, the carrying value of its Goodwill was not impaired.
For its annual intangible asset impairment test, the Company adopted the provisions of ASU 2012-02,Intangibles—Goodwill and Other: Testing Indefinite—Lived Intangible Assets for Impairment, whichamends ASC 350 and allows a Company to first assess qualitative factors, to determine whether or notit is necessary to perform the quantitative test for testing indefinite-lived intangible assets forimpairment outlined in ASC 350. Management has concluded that as of October 1, 2012, there was noimpairment of its indefinite-lived intangible asset.
In the event that the Company determines that the values of goodwill or indefinite-lived intangibleassets have become impaired, the Company will incur an accounting charge during the period in whichsuch determination is made. There were no impairments recorded in 2012, 2011 and 2010.
Impairment of Long-Lived Assets and Finite-lived Intangible Assets
Long-lived assets used in operations, consisting principally of property and equipment and finite-livedintangible assets, are tested for impairment when events or changes in circumstances indicate, inmanagement’s judgment, that the assets might be impaired and the undiscounted cash flows estimatedto be generated by those assets are less than its carrying amount. When testing for impairment,management considers market trends, the expected useful lives of the assets, changes in economicconditions, recent transactions involving sales of similar assets and, if necessary, estimates of futurediscounted cash flows. If, at any time, management determines the net carrying value of an asset is notrecoverable, the amount is reduced to its fair value during the period in which such determination ismade. Any changes in the estimated useful lives of these assets will be accounted for prospectively.There were no impairments to long-lived and finite-lived intangible assets, nor was there a need toadjust the remaining useful lives of these assets in 2012, 2011 and 2010.
Leased Aircraft Return Costs
Costs associated with returning leased aircraft are accrued when it is probable that a cash payment willbe made and that amount is reasonably estimable. Any accrual is based on the time remaining on the
63

Hawaiian Holdings, Inc.
Notes to Consolidated Financial Statements (Continued)
2. Summary of Significant Accounting Policies (Continued)
lease, planned aircraft usage and the provisions included in the lease agreement, although the actualamount due to any lessor upon return will not be known with certainty until lease termination.
Revenue Recognition
Passenger revenue is recognized either when the transportation is provided or when tickets expireunused. The value of passenger tickets for future travel is included as air traffic liability.
Various taxes and fees assessed on the sale of tickets to end customers are collected by the Company asan agent and remitted to taxing authorities. These taxes and fees have been presented on a net basis inthe accompanying Consolidated Statements of Operations and recorded as a liability until remitted tothe appropriate taxing authority.
Other operating revenue include checked baggage revenue, cargo revenue, ticket change andcancellation fees, charter revenue, ground handling fees, commissions and fees earned under certainjoint marketing agreements with other companies, inflight revenue and other incidental sales.
Baggage fees, cargo and charter revenue are recognized when the transportation is provided. Ticketchange and cancellation fees are recognized at the time the fees are assessed. All other revenue isrecognized as revenue when the related goods and services are provided.
Frequent Flyer Program
HawaiianMiles, Hawaiian’s frequent flyer travel award program, provides a variety of awards toprogram members based on accumulated mileage. The Company utilizes the incremental cost methodof accounting for free travel awards issued from the HawaiianMiles program. The Company records aliability for the estimated incremental cost of providing travel awards that are expected to be redeemedon Hawaiian or the contractual rate of expected redemption on partner airlines. The Companyestimates the incremental cost of travel awards based on periodic studies of actual costs and appliesthese cost estimates to all issued miles, less an appropriate breakage factor for estimated miles that willnot be redeemed. Incremental cost includes the costs of fuel, meals and beverages, insurance andcertain other passenger traffic-related costs, but does not include any costs for aircraft ownership andmaintenance. The breakage factor is estimated based on an analysis of historical expirations.
The Company also sells mileage credits to companies participating in our frequent flyer program. Thesesales are accounted for as multiple-element arrangements, with one element representing the travel thatwill ultimately be provided when the mileage credits are redeemed and the other consisting ofmarketing related activities that we conduct with the participating company. The estimated fair value ofthe transportation portion of these mileage credits is deferred and recognized as passenger revenueover the period when transportation is expected to be provided (currently estimated at 22 months).Amounts received in excess of the expected transportation’s fair value are recognized immediately asother revenue at the time of sale as compensation for marketing services performed. The estimated fairvalue of the air transportation component is based on several factors, including the equivalent ticketvalue of similar Company fares and customer habits in redeeming free travel awards.
Under the programs of certain participating companies, credits are accumulated in accounts maintainedby the participating company and then transferred into a member’s HawaiianMiles account forimmediate redemption of free travel awards. For those transactions, revenue is amortized over theperiod during which the mileage is projected to be used (currently estimated at five months).
64
Hawaiian Holdings, Inc.
Notes to Consolidated Financial Statements (Continued)
2. Summary of Significant Accounting Policies (Continued)
On a periodic basis, we review and update the assumptions used in our frequent flyer accounting. Onan annual basis, we update the deferral period and deferral rate for mileage credits sold toparticipating companies. We also update the incremental cost assumption quarterly and the breakagerate assumption annually for free travel awards earned in connection with the purchase of passengertickets.
Commissions and Other Selling Expenses
Commissions and other selling expenses include credit card commissions, the costs incurred to provideflights and other awards provided by HawaiianMiles, advertising and promotional expenses andcomputer reservation system charges, as well as commissions paid to outside agents for the sales ofpassenger and cargo traffic. Sales commissions are deferred when paid and are subsequently recognizedas expense when the related revenue is recognized. Prepaid sales commissions are included in prepaidexpenses and other current assets in the accompanying Consolidated Balance Sheets. All othercomponents of commissions and other selling expenses, including advertising costs, are expensed whenincurred. Advertising expense was $11.2 million, $9.2 million and $11.0 million for the years endedDecember 31, 2012, 2011, and 2010, respectively.
Capitalized Interest
Interest is capitalized upon acquisition of aircraft and engines, which include any interest related topredelivery deposits and interest incurred for significant modifications made to the aircraft, and isdepreciated over the estimated useful life of the asset from service inception date. The rate at whichinterest is capitalized is based on the Company’s weighted-average borrowing rate, which was 7.0%,6.6% and 7.0% during 2012, 2011 and 2010, respectively.
Earnings (Loss) Per Share
Basic earnings (loss) per share, which excludes dilution, is computed by dividing net income or lossavailable to common shareholders by the weighted average number of common shares outstanding forthe period.
65

Hawaiian Holdings, Inc.
Notes to Consolidated Financial Statements (Continued)
2. Summary of Significant Accounting Policies (Continued)
Diluted earnings (loss) per share reflects the potential dilution that could occur if securities or othercontracts to issue common stock were exercised or converted into common stock.
Year Ended December 31,
2012 2011 2010
(in thousands,except for per share data)
Numerator:Net income (loss) . . . . . . . . . . . . . . . . . . . . . . . . . . . . . . . . . . . . . . . . $53,237 $(2,649) $110,255
Denominator:Weighted average common shares outstanding—Basic . . . . . . . . . . . . . . 51,314 50,733 51,232
Assumed exercise of equity awards and warrants . . . . . . . . . . . . . . . . 1,221 — 1,250
Weighted average common shares outstanding—Diluted . . . . . . . . . . . . 52,535 50,733 52,482
Net income (loss) per common shareBasic . . . . . . . . . . . . . . . . . . . . . . . . . . . . . . . . . . . . . . . . . . . . . . . . . $ 1.04 $ (0.05) $ 2.15
Diluted . . . . . . . . . . . . . . . . . . . . . . . . . . . . . . . . . . . . . . . . . . . . . . . $ 1.01 $ (0.05) $ 2.10
The table below approximates those shares excluded from the computation of diluted earnings pershare because the awards would be antidilutive.
Year Ended December 31,
2012 2011 2010
(in thousands)
Stock Options . . . . . . . . . . . . . . . . . . . . . . . . . . . . . . . . . . 89 527 187Deferred Stock . . . . . . . . . . . . . . . . . . . . . . . . . . . . . . . . . — 1 123Restricted Stock . . . . . . . . . . . . . . . . . . . . . . . . . . . . . . . . . 717 339 308Convertible notes(2) . . . . . . . . . . . . . . . . . . . . . . . . . . . . . 10,943 8,450 —Warrants(1)(2) . . . . . . . . . . . . . . . . . . . . . . . . . . . . . . . . . . 10,943 8,450 1,493
(1) In 2010, 1.5 million outstanding warrants expired unexercised.
(2) In March 2011, the Company entered into a Convertible Note transaction which includedthe sale of convertible notes, purchase of convertible note hedges and the sale ofwarrants. See Note 6—Debt for further discussion. These weighted common stockequivalents were excluded because their conversion price of $7.88 per share for theconvertible notes and $10.00 for the warrants exceeded the average market price of ourcommon stock during these periods, and the effect of their inclusion would beantidilutive. These securities could be dilutive in future periods. The convertible notehedges will always be antidilutive and, therefore, will have no effect on diluted earningsper share.
Stock Compensation Plans
The Company has a stock compensation plan for it and its subsidiaries’ officers, consultants andnon-employee directors. The Company accounts for stock compensation awards under ASC 718,
66

Hawaiian Holdings, Inc.
Notes to Consolidated Financial Statements (Continued)
2. Summary of Significant Accounting Policies (Continued)
Compensation—Stock Compensation, which requires companies to measure the cost of employeeservices received in exchange for an award of equity instruments based on the fair value of such awardson the dates they are granted. The fair value of the awards are estimated using the following:(1) option-pricing models for grants of stock options, (2) Monte Carlo simulations for restricted stockunits with a market condition, or (3) fair value at the measurement date (usually the grant date) forawards of stock subject to time and / or performance-based vesting. The resultant cost is recognized ascompensation expense over the period of time during which an employee is required to provide servicesto the Company (the service period) in exchange for the award, the service period generally being thevesting period of the award.
In accordance with ASC 718, the Company records benefits of tax deductions in excess of recognizedstock compensation expense as financing cash flows.
Use of Estimates in the Preparation of Financial Statements
The preparation of financial statements in conformity with U.S. generally accepted accountingprinciples requires management to make estimates and assumptions that affect the amounts reported inthe financial statements and accompanying notes. Actual results could differ significantly from thoseestimates.
Recently Adopted Accounting Pronouncements
In June 2011, the Financial Accounting Standards Bureau (FASB) issued Accounting StandardsUpdate 2011-05, Comprehensive Income—Presentation of Comprehensive Income (ASU 2011-05). Thisupdate changes the requirements for the presentation of other comprehensive income, eliminating theoption to present components of other comprehensive income as part of the statement of changes instockholders’ equity, amongst other things. ASU 2011-05 requires that all nonowner changes instockholders’ equity be presented in a single continuous statement of comprehensive income or in twoseparate but consecutive statements. These amendments are effective for fiscal years and interim periodbeginning after December 15, 2011 and should be applied retrospectively. The Company adopted thisguidance during the quarter ended March 31, 2012 and the two-statement approach is presented withinthis report.
In May 2011, the FASB issued Accounting Standards Update 2011-04, Amendments to Achieve CommonFair Value Measurements and Disclosure Requirements in U.S. GAAP and IFRSs (ASU 2011-04).ASU 2011-04 amended Accounting ASC Topic 820, Fair Value Measurements and Disclosures (ASC 820),to converge the fair value measurement guidance in U.S. generally accepted accounting principles andthe International Financial Reporting Standards (IFRSs). Some of the amendments clarify theapplication of existing fair value measurement requirements, while other amendments change aparticular principle in ASC 820. In addition, ASU 2011-04 requires additional fair value disclosures.The amendments are to be applied prospectively and are effective for annual periods beginning afterDecember 15, 2011. The Company adopted this guidance during the quarter ended March 31, 2012.
In July 2012, the FASB issued Accounting Standards Update 2012-02, Intangibles—Goodwill and OtherTesting Indefinite—Lived Intangible Assets for Impairment (ASU 2012-02). ASU 2012-02 amendedASC 350, Intangibles—Goodwill and Other, to allow an entity the option to first assess the qualitativefactors in testing indefinite-lived intangible assets for impairment, to determine whether or not it isnecessary to perform the quantitative impairment test originally outlined in ASC 350. This amendment
67
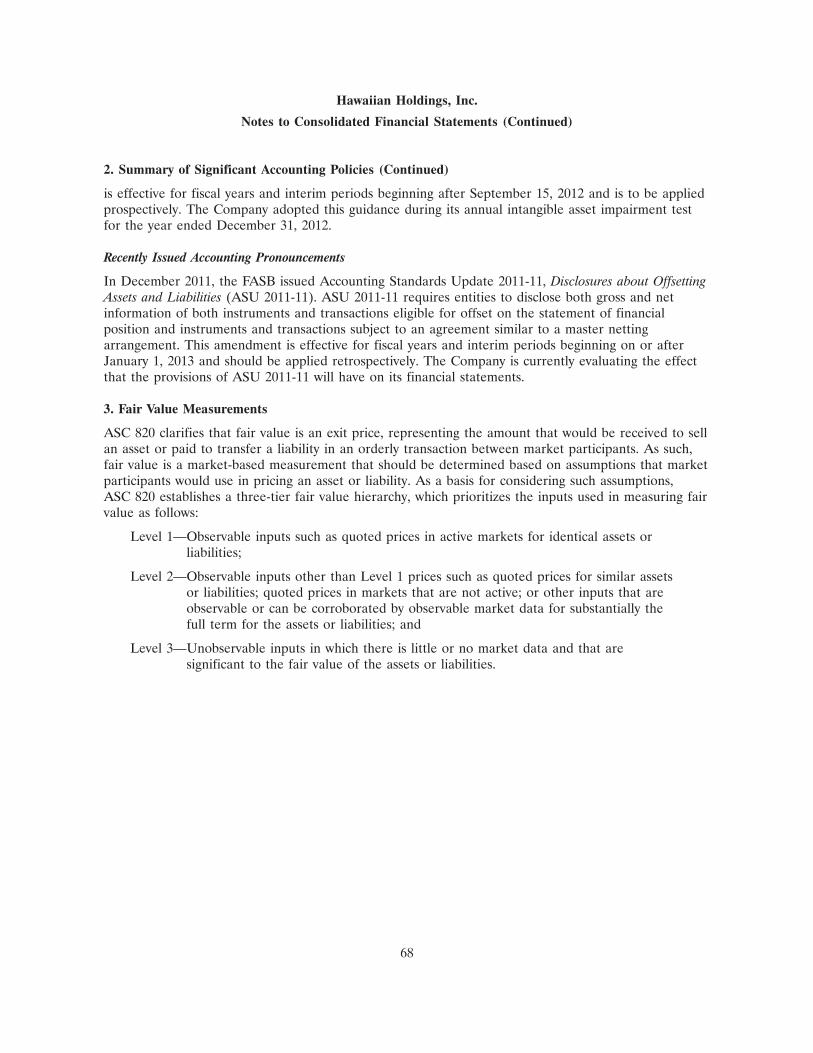
Hawaiian Holdings, Inc.
Notes to Consolidated Financial Statements (Continued)
2. Summary of Significant Accounting Policies (Continued)
is effective for fiscal years and interim periods beginning after September 15, 2012 and is to be appliedprospectively. The Company adopted this guidance during its annual intangible asset impairment testfor the year ended December 31, 2012.
Recently Issued Accounting Pronouncements
In December 2011, the FASB issued Accounting Standards Update 2011-11, Disclosures about OffsettingAssets and Liabilities (ASU 2011-11). ASU 2011-11 requires entities to disclose both gross and netinformation of both instruments and transactions eligible for offset on the statement of financialposition and instruments and transactions subject to an agreement similar to a master nettingarrangement. This amendment is effective for fiscal years and interim periods beginning on or afterJanuary 1, 2013 and should be applied retrospectively. The Company is currently evaluating the effectthat the provisions of ASU 2011-11 will have on its financial statements.
3. Fair Value Measurements
ASC 820 clarifies that fair value is an exit price, representing the amount that would be received to sellan asset or paid to transfer a liability in an orderly transaction between market participants. As such,fair value is a market-based measurement that should be determined based on assumptions that marketparticipants would use in pricing an asset or liability. As a basis for considering such assumptions,ASC 820 establishes a three-tier fair value hierarchy, which prioritizes the inputs used in measuring fairvalue as follows:
Level 1—Observable inputs such as quoted prices in active markets for identical assets orliabilities;
Level 2—Observable inputs other than Level 1 prices such as quoted prices for similar assetsor liabilities; quoted prices in markets that are not active; or other inputs that areobservable or can be corroborated by observable market data for substantially thefull term for the assets or liabilities; and
Level 3—Unobservable inputs in which there is little or no market data and that aresignificant to the fair value of the assets or liabilities.
68
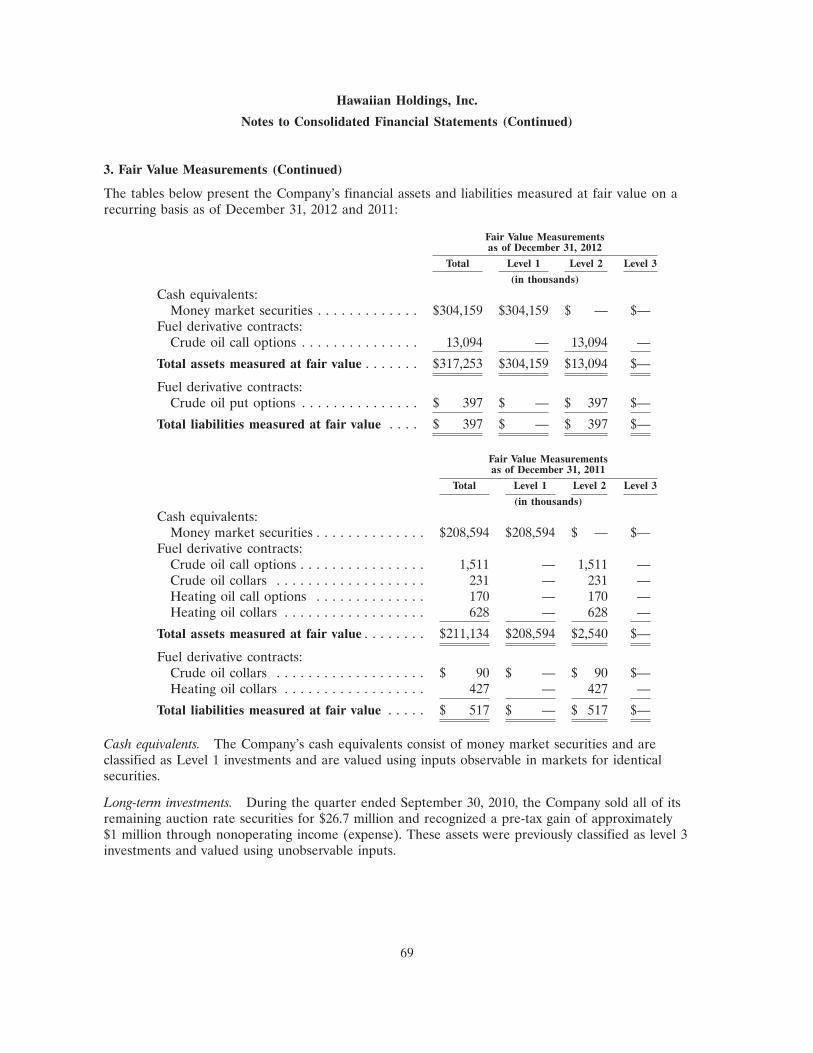
Hawaiian Holdings, Inc.
Notes to Consolidated Financial Statements (Continued)
3. Fair Value Measurements (Continued)
The tables below present the Company’s financial assets and liabilities measured at fair value on arecurring basis as of December 31, 2012 and 2011:
Fair Value Measurementsas of December 31, 2012
Total Level 1 Level 2 Level 3
(in thousands)
Cash equivalents:Money market securities . . . . . . . . . . . . . $304,159 $304,159 $ — $—
Fuel derivative contracts:Crude oil call options . . . . . . . . . . . . . . . 13,094 — 13,094 —
Total assets measured at fair value . . . . . . . $317,253 $304,159 $13,094 $—
Fuel derivative contracts:Crude oil put options . . . . . . . . . . . . . . . $ 397 $ — $ 397 $—
Total liabilities measured at fair value . . . . $ 397 $ — $ 397 $—
Fair Value Measurementsas of December 31, 2011
Total Level 1 Level 2 Level 3
(in thousands)
Cash equivalents:Money market securities . . . . . . . . . . . . . . $208,594 $208,594 $ — $—
Fuel derivative contracts:Crude oil call options . . . . . . . . . . . . . . . . 1,511 — 1,511 —Crude oil collars . . . . . . . . . . . . . . . . . . . 231 — 231 —Heating oil call options . . . . . . . . . . . . . . 170 — 170 —Heating oil collars . . . . . . . . . . . . . . . . . . 628 — 628 —
Total assets measured at fair value . . . . . . . . $211,134 $208,594 $2,540 $—
Fuel derivative contracts:Crude oil collars . . . . . . . . . . . . . . . . . . . $ 90 $ — $ 90 $—Heating oil collars . . . . . . . . . . . . . . . . . . 427 — 427 —
Total liabilities measured at fair value . . . . . $ 517 $ — $ 517 $—
Cash equivalents. The Company’s cash equivalents consist of money market securities and areclassified as Level 1 investments and are valued using inputs observable in markets for identicalsecurities.
Long-term investments. During the quarter ended September 30, 2010, the Company sold all of itsremaining auction rate securities for $26.7 million and recognized a pre-tax gain of approximately$1 million through nonoperating income (expense). These assets were previously classified as level 3investments and valued using unobservable inputs.
69
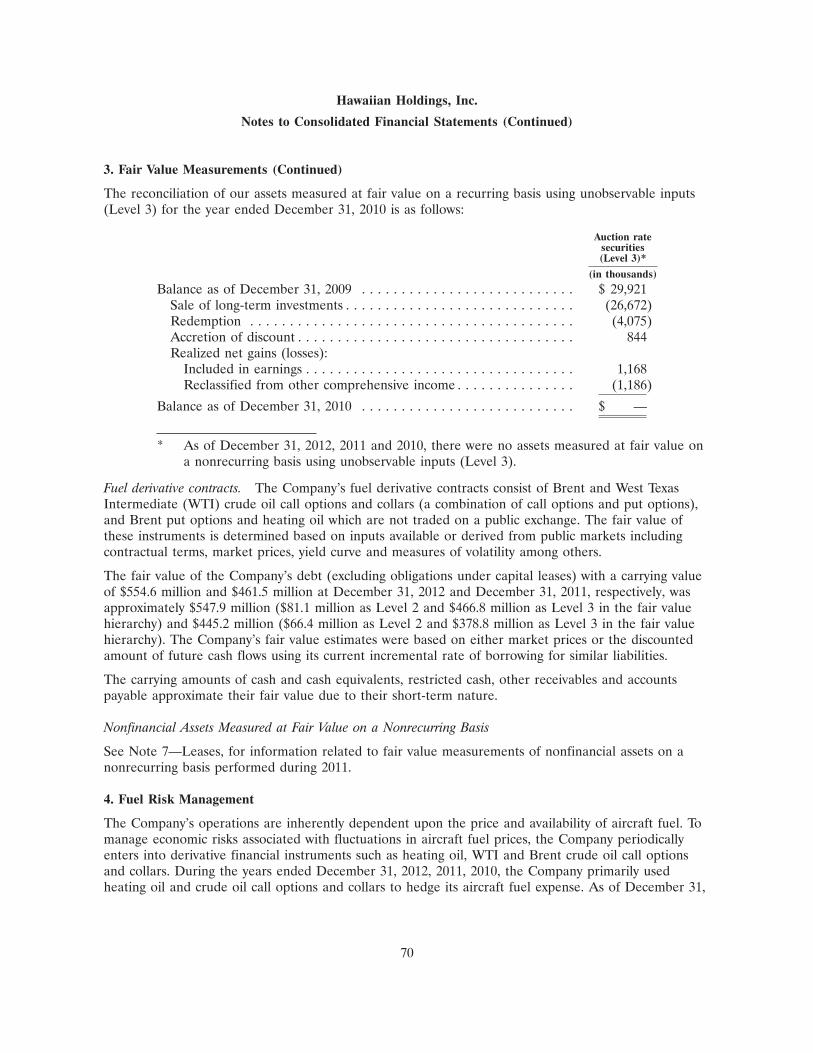
Hawaiian Holdings, Inc.
Notes to Consolidated Financial Statements (Continued)
3. Fair Value Measurements (Continued)
The reconciliation of our assets measured at fair value on a recurring basis using unobservable inputs(Level 3) for the year ended December 31, 2010 is as follows:
Auction ratesecurities(Level 3)*
(in thousands)
Balance as of December 31, 2009 . . . . . . . . . . . . . . . . . . . . . . . . . . . $ 29,921Sale of long-term investments . . . . . . . . . . . . . . . . . . . . . . . . . . . . . (26,672)Redemption . . . . . . . . . . . . . . . . . . . . . . . . . . . . . . . . . . . . . . . . . (4,075)Accretion of discount . . . . . . . . . . . . . . . . . . . . . . . . . . . . . . . . . . . 844Realized net gains (losses):
Included in earnings . . . . . . . . . . . . . . . . . . . . . . . . . . . . . . . . . . 1,168Reclassified from other comprehensive income . . . . . . . . . . . . . . . (1,186)
Balance as of December 31, 2010 . . . . . . . . . . . . . . . . . . . . . . . . . . . $ —
* As of December 31, 2012, 2011 and 2010, there were no assets measured at fair value ona nonrecurring basis using unobservable inputs (Level 3).
Fuel derivative contracts. The Company’s fuel derivative contracts consist of Brent and West TexasIntermediate (WTI) crude oil call options and collars (a combination of call options and put options),and Brent put options and heating oil which are not traded on a public exchange. The fair value ofthese instruments is determined based on inputs available or derived from public markets includingcontractual terms, market prices, yield curve and measures of volatility among others.
The fair value of the Company’s debt (excluding obligations under capital leases) with a carrying valueof $554.6 million and $461.5 million at December 31, 2012 and December 31, 2011, respectively, wasapproximately $547.9 million ($81.1 million as Level 2 and $466.8 million as Level 3 in the fair valuehierarchy) and $445.2 million ($66.4 million as Level 2 and $378.8 million as Level 3 in the fair valuehierarchy). The Company’s fair value estimates were based on either market prices or the discountedamount of future cash flows using its current incremental rate of borrowing for similar liabilities.
The carrying amounts of cash and cash equivalents, restricted cash, other receivables and accountspayable approximate their fair value due to their short-term nature.
Nonfinancial Assets Measured at Fair Value on a Nonrecurring Basis
See Note 7—Leases, for information related to fair value measurements of nonfinancial assets on anonrecurring basis performed during 2011.
4. Fuel Risk Management
The Company’s operations are inherently dependent upon the price and availability of aircraft fuel. Tomanage economic risks associated with fluctuations in aircraft fuel prices, the Company periodicallyenters into derivative financial instruments such as heating oil, WTI and Brent crude oil call optionsand collars. During the years ended December 31, 2012, 2011, 2010, the Company primarily usedheating oil and crude oil call options and collars to hedge its aircraft fuel expense. As of December 31,
70
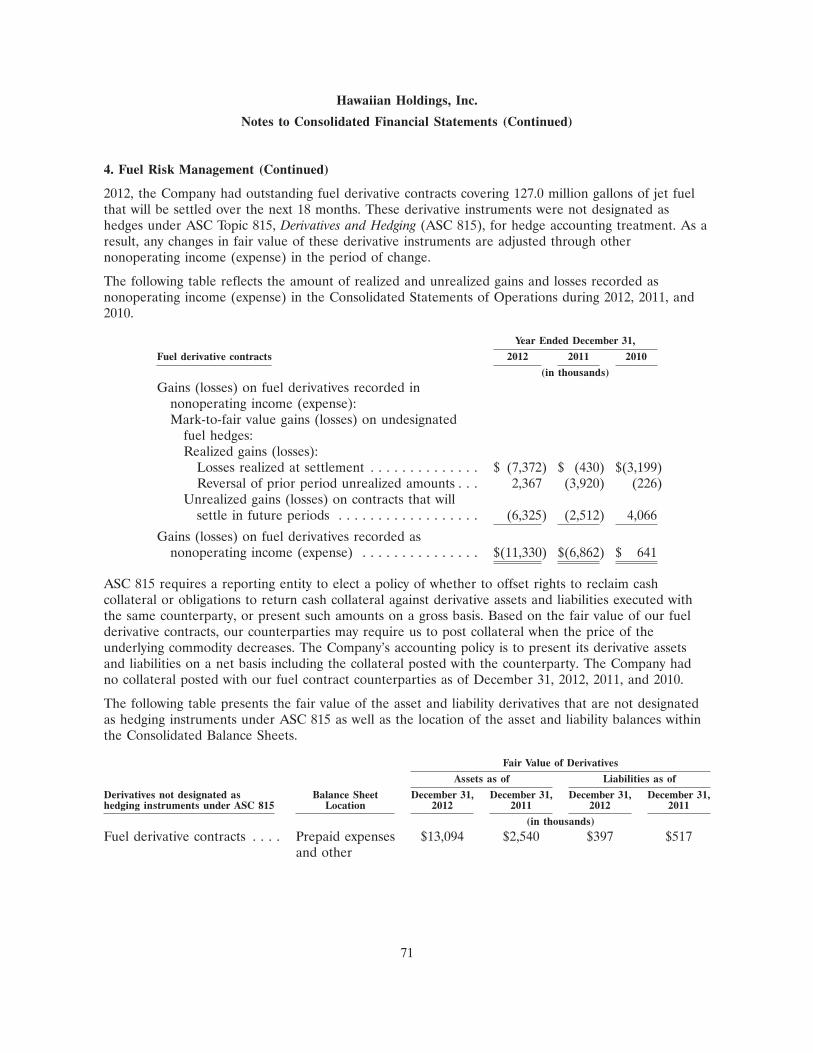
Hawaiian Holdings, Inc.
Notes to Consolidated Financial Statements (Continued)
4. Fuel Risk Management (Continued)
2012, the Company had outstanding fuel derivative contracts covering 127.0 million gallons of jet fuelthat will be settled over the next 18 months. These derivative instruments were not designated ashedges under ASC Topic 815, Derivatives and Hedging (ASC 815), for hedge accounting treatment. As aresult, any changes in fair value of these derivative instruments are adjusted through othernonoperating income (expense) in the period of change.
The following table reflects the amount of realized and unrealized gains and losses recorded asnonoperating income (expense) in the Consolidated Statements of Operations during 2012, 2011, and2010.
Year Ended December 31,
Fuel derivative contracts 2012 2011 2010
(in thousands)
Gains (losses) on fuel derivatives recorded innonoperating income (expense):Mark-to-fair value gains (losses) on undesignated
fuel hedges:Realized gains (losses):
Losses realized at settlement . . . . . . . . . . . . . . $ (7,372) $ (430) $(3,199)Reversal of prior period unrealized amounts . . . 2,367 (3,920) (226)
Unrealized gains (losses) on contracts that willsettle in future periods . . . . . . . . . . . . . . . . . . (6,325) (2,512) 4,066
Gains (losses) on fuel derivatives recorded asnonoperating income (expense) . . . . . . . . . . . . . . . $(11,330) $(6,862) $ 641
ASC 815 requires a reporting entity to elect a policy of whether to offset rights to reclaim cashcollateral or obligations to return cash collateral against derivative assets and liabilities executed withthe same counterparty, or present such amounts on a gross basis. Based on the fair value of our fuelderivative contracts, our counterparties may require us to post collateral when the price of theunderlying commodity decreases. The Company’s accounting policy is to present its derivative assetsand liabilities on a net basis including the collateral posted with the counterparty. The Company hadno collateral posted with our fuel contract counterparties as of December 31, 2012, 2011, and 2010.
The following table presents the fair value of the asset and liability derivatives that are not designatedas hedging instruments under ASC 815 as well as the location of the asset and liability balances withinthe Consolidated Balance Sheets.
Fair Value of Derivatives
Assets as of Liabilities as of
Derivatives not designated as Balance Sheet December 31, December 31, December 31, December 31,hedging instruments under ASC 815 Location 2012 2011 2012 2011
(in thousands)
Fuel derivative contracts . . . . Prepaid expenses $13,094 $2,540 $397 $517and other
71
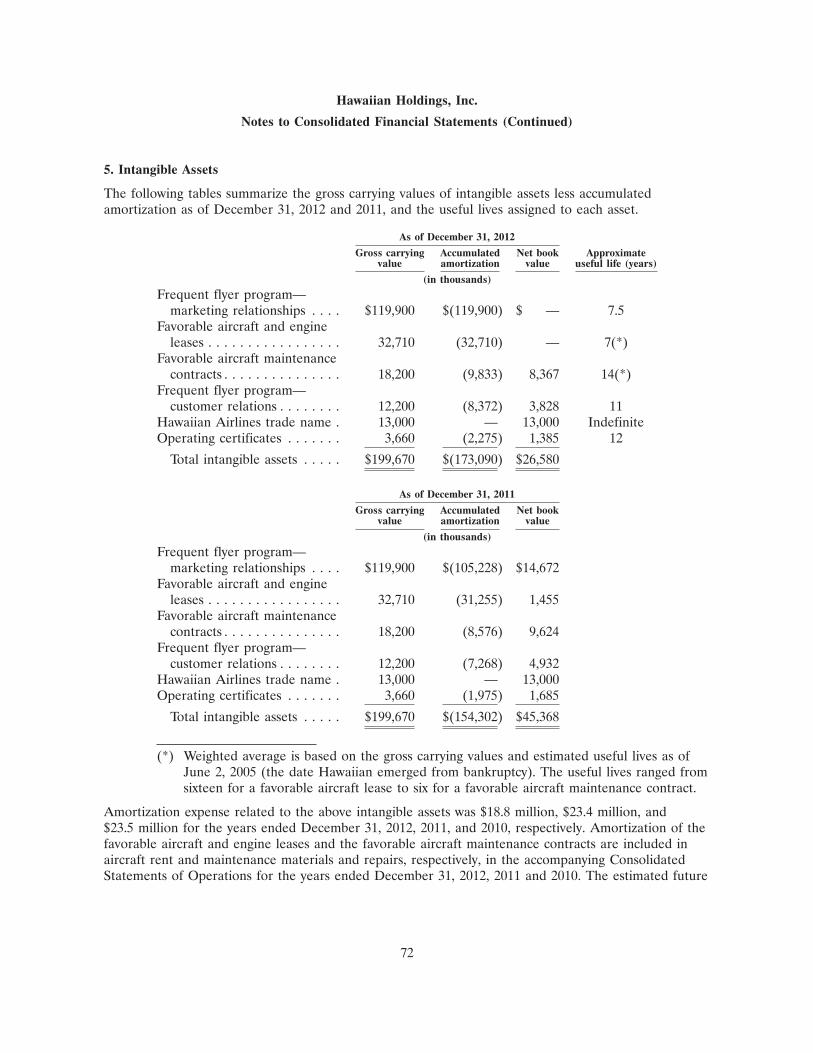
Hawaiian Holdings, Inc.
Notes to Consolidated Financial Statements (Continued)
5. Intangible Assets
The following tables summarize the gross carrying values of intangible assets less accumulatedamortization as of December 31, 2012 and 2011, and the useful lives assigned to each asset.
As of December 31, 2012
Gross carrying Accumulated Net book Approximatevalue amortization value useful life (years)
(in thousands)
Frequent flyer program—marketing relationships . . . . $119,900 $(119,900) $ — 7.5
Favorable aircraft and engineleases . . . . . . . . . . . . . . . . . 32,710 (32,710) — 7(*)
Favorable aircraft maintenancecontracts . . . . . . . . . . . . . . . 18,200 (9,833) 8,367 14(*)
Frequent flyer program—customer relations . . . . . . . . 12,200 (8,372) 3,828 11
Hawaiian Airlines trade name . 13,000 — 13,000 IndefiniteOperating certificates . . . . . . . 3,660 (2,275) 1,385 12
Total intangible assets . . . . . $199,670 $(173,090) $26,580
As of December 31, 2011
Gross carrying Accumulated Net bookvalue amortization value
(in thousands)
Frequent flyer program—marketing relationships . . . . $119,900 $(105,228) $14,672
Favorable aircraft and engineleases . . . . . . . . . . . . . . . . . 32,710 (31,255) 1,455
Favorable aircraft maintenancecontracts . . . . . . . . . . . . . . . 18,200 (8,576) 9,624
Frequent flyer program—customer relations . . . . . . . . 12,200 (7,268) 4,932
Hawaiian Airlines trade name . 13,000 — 13,000Operating certificates . . . . . . . 3,660 (1,975) 1,685
Total intangible assets . . . . . $199,670 $(154,302) $45,368
(*) Weighted average is based on the gross carrying values and estimated useful lives as ofJune 2, 2005 (the date Hawaiian emerged from bankruptcy). The useful lives ranged fromsixteen for a favorable aircraft lease to six for a favorable aircraft maintenance contract.
Amortization expense related to the above intangible assets was $18.8 million, $23.4 million, and$23.5 million for the years ended December 31, 2012, 2011, and 2010, respectively. Amortization of thefavorable aircraft and engine leases and the favorable aircraft maintenance contracts are included inaircraft rent and maintenance materials and repairs, respectively, in the accompanying ConsolidatedStatements of Operations for the years ended December 31, 2012, 2011 and 2010. The estimated future
72

Hawaiian Holdings, Inc.
Notes to Consolidated Financial Statements (Continued)
5. Intangible Assets (Continued)
amortization expense as of December 31, 2012 of the intangible assets subject to amortization is asfollows (in thousands):
2013 . . . . . . . . . . . . . . . . . . . . . . . . . . . . . . . . . . . . . . . . . . . . . . . . . . . . $ 2,6402014 . . . . . . . . . . . . . . . . . . . . . . . . . . . . . . . . . . . . . . . . . . . . . . . . . . . . 2,6402015 . . . . . . . . . . . . . . . . . . . . . . . . . . . . . . . . . . . . . . . . . . . . . . . . . . . . 2,6402016 . . . . . . . . . . . . . . . . . . . . . . . . . . . . . . . . . . . . . . . . . . . . . . . . . . . . 2,0522017 . . . . . . . . . . . . . . . . . . . . . . . . . . . . . . . . . . . . . . . . . . . . . . . . . . . . 1,421Thereafter . . . . . . . . . . . . . . . . . . . . . . . . . . . . . . . . . . . . . . . . . . . . . . . 2,187
$13,580
6. Debt
Long-term debt (including capital lease obligations) net of unamortized discounts as of December 31,2012 and 2011 is outlined as follows:
2012 2011
(in thousands)
Airbus A330-200 Aircraft Facility Agreements, fixed interestrates of 5.31% - 6.46%, quarterly principal and interestpayments, payable from 2023 - 2024(1) . . . . . . . . . . . . . . . $ 246,443 $129,292
Boeing 717-200 Aircraft Facility Agreements, fixed interestrate of 8%, monthly principal and interest payments, theremaining balance of $39.7 million due at maturity on June2019(1) . . . . . . . . . . . . . . . . . . . . . . . . . . . . . . . . . . . . . . 170,701 185,730
Five year 5% unsecured convertible notes, with interest onlysemi-annual payments, and $86.25 million due at maturityon March 15, 2016 . . . . . . . . . . . . . . . . . . . . . . . . . . . . . . 86,250 86,250
Secured loan, variable interest rate of 3.58% at December 31,2012, monthly interest only payments, the remainingbalance of $52.2 million due at maturity on December2013(1) . . . . . . . . . . . . . . . . . . . . . . . . . . . . . . . . . . . . . . 64,748 77,318
Capital lease obligations (see Note 7) . . . . . . . . . . . . . . . . . . 106,672 435
Total long-term debt and capital lease obligations . . . . . . . . . $ 674,814 $479,025Less unamortized discounts on debt:
Convertible note due March 2016(2) . . . . . . . . . . . . . . . . . (13,573) (17,054)
(13,573) (17,054)Less current maturities . . . . . . . . . . . . . . . . . . . . . . . . . . . (108,232) (37,535)
$ 553,009 $424,436
(1) The Airbus A330-200 Aircraft Facility Agreements, Boeing 717-200 Aircraft FacilityAgreements and the Secured loan borrowings are secured by aircraft.
(2) As of December 31, 2012, the Convertible Note discount is being amortized to interestexpense over the remaining term of 3.25 years.
73

Hawaiian Holdings, Inc.
Notes to Consolidated Financial Statements (Continued)
6. Debt (Continued)
Convertible Notes
On March 23, 2011, the Company issued $86.25 million principal amount of convertible senior notes(the Convertible Notes) due March 15, 2016. The Convertible Notes were issued at par and bearinterest at a rate of 5.00% per annum. Interest is paid semi-annually, in arrears, on March 15 andSeptember 15 each year.
Each $1,000 of principal of the Convertible Notes is convertible under certain circumstances, at aninitial conversion rate of 126.8730 shares of the Company’s common stock (or a total of approximately10.9 million shares), which is the equivalent of approximately $7.8819 per share, subject to adjustmentupon the occurrence of certain specified events as set forth in the indenture governing the terms of theConvertible Notes. Upon conversion, the Company will have the right, at the Company’s election, topay or deliver cash, shares of the Company’s common stock or a combination thereof. Holders mayconvert their Convertible Notes at their option at any time prior to November 15, 2015, only if one ofthe following conditions has been met (during 2012, none of the conditions permitting conversion weremet):
• During any calendar quarter after the calendar quarter ending June 30, 2011, and only duringsuch calendar quarter, if the closing price of the Company’s common stock for at least 20trading days in the period of 30 consecutive trading days ending on the last trading day of thepreceding calendar quarter exceeds 130% of the conversion price per share of common stock ineffect on the last day of such preceding calendar quarter;
• During the five consecutive business days immediately after any 10 consecutive trading dayperiod in which the average trading price per $1,000 principal amount of the Convertible Notesduring such period was less than 97% of the product of the closing sale price of the commonstock and the conversion rate on such trading day;
• The Company makes specified distributions to holders of the Company’s common stock orspecified corporate transactions occur.
On or after November 15, 2015, and up through and including the second business day immediatelypreceding March 15, 2016, the Holders may convert their Convertible Notes into common stock.
Holders may require the Company to repurchase all or a portion of their Convertible Notes upon afundamental change, primarily a change in control or termination of trading, at a cash repurchase priceequal to 100% of the principal amount of the Convertible Notes plus accrued and unpaid interest, ifany. The Company may not redeem the Convertible Notes prior to their maturity date.
When accounting for the Convertible Notes, the Company applied accounting guidance related to theaccounting for convertible debt instruments that may be settled in cash upon conversion. This guidancerequired the Company to separately account for the liability and equity components of the ConvertibleNotes in a manner that reflects our nonconvertible debt borrowing rate when interest cost is recognizedin subsequent periods. This guidance required bifurcation of a component of the debt, classification ofthat component in equity, and then accretion of the resulting discount on the debt as part of interestexpense reflected in the Consolidated Statements of Operations.
Accordingly, the Company recorded an adjustment to reduce the carrying value of the ConvertibleNotes by $19.5 million and recorded this amount in Shareholders’ Equity. This adjustment was basedon the calculated fair value of a similar debt instrument that did not have an associated equity
74

Hawaiian Holdings, Inc.
Notes to Consolidated Financial Statements (Continued)
6. Debt (Continued)
component. The annual interest rate calculated for a similar debt instrument was 11.00%. During 2012,the carrying amount of the equity component and the effective interest rate applied to the liabilitycomponent remaining unchanged from 2011.
The total issuance costs for the Convertible Notes was $3.3 million, of which $2.5 million was allocatedto the debt component and $0.8 million was allocated to the equity component during 2011. Theissuance costs allocated to debt were capitalized and are being amortized to interest expense over theterm of the Convertible Notes. The issuance costs allocated to equity were recorded as a reduction ofadditional paid-in-capital.
Non-cash interest expense relating to the amortization of the discount allocated to the debt componentof the Convertible Notes for the years ended December 31, 2012 and 2011 was $3.5 million and$2.4 million, respectively, and interest expense over for the years ended December 31, 2012 and 2011was $4.8 million and 3.8 million, respectively.
Convertible Note Hedges and Warrants
In connection with the issuance of the Convertible Notes, the Company entered into separateconvertible note hedge transactions (the Convertible Note Hedges) and separate warrant transactions(the Warrants) with certain financial investors to reduce the potential dilution of the Company’scommon stock and to offset potential payments by the Company to holders of the Convertible Notes inexcess of the principal of the Convertible Notes upon conversion. The Convertible Note Hedges andWarrants are separate transactions, entered into by the Company with the financial institutions, and arenot part of the Convertible Notes described above.
The Company paid $19.5 million for the Convertible Note Hedges. Under the terms of the ConvertibleNote Hedges, the counterparties to the Convertible Note Hedges will generally deliver to the Companyamounts in excess of the principal amount of the Convertible Notes delivered upon conversion by theCompany to the holders of the Convertible Notes in the same form of consideration elected to bedelivered by the Company to the holders of the Convertible Notes under the indenture for theConvertible Notes. The Company may elect to settle the conversion feature of the Convertible Notes incash or shares of common stock or in any combination of cash or shares of common stock asdetermined in accordance with the provisions of the indenture. The Convertible Note Hedges arecurrently exercisable and expire on March 15, 2016.
Concurrent with the issuance of the Convertible Notes, the Company sold Warrants to certain financialinstitutions that permit such financial institutions to acquire shares of the Company’s common stock.The Warrants are exercisable by the financial institutions for 10.9 million shares of the Company’scommon stock at a current exercise price of $10.00 per share. The Company received $11.9 million inproceeds from the sale of the Warrants. The Warrants expire at various dates beginning in June 2016and ending in September 2016. The Warrants provide for net share settlement by the Company, subjectto the option of the Company to deliver cash in lieu of shares if certain conditions under the Warrantshave been met.
The Company determined that the Convertible Note Hedges and Warrants meet the requirements ofthe FASB’s accounting guidance for accounting for derivative financial instruments indexed to, andpotentially settled in, a Company’s own stock and other relevant guidance and, therefore, are classifiedas equity transactions. As a result, the Company recorded the purchase of the Convertible Note Hedges
75
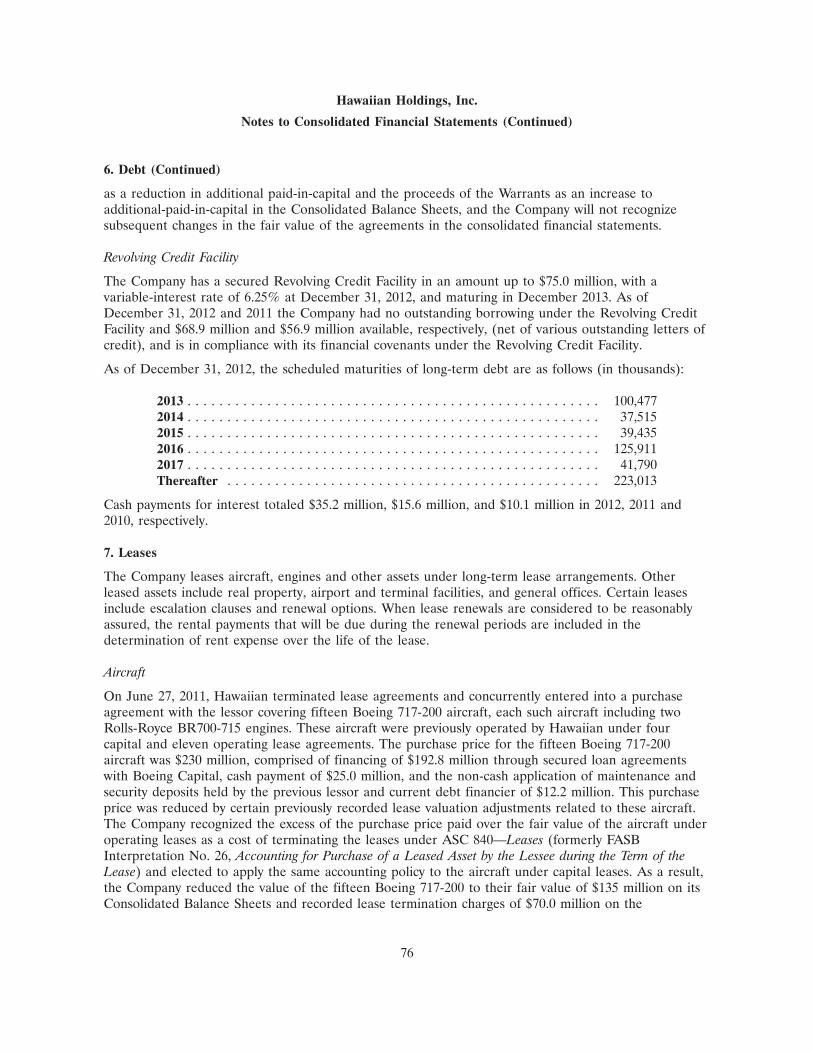
Hawaiian Holdings, Inc.
Notes to Consolidated Financial Statements (Continued)
6. Debt (Continued)
as a reduction in additional paid-in-capital and the proceeds of the Warrants as an increase toadditional-paid-in-capital in the Consolidated Balance Sheets, and the Company will not recognizesubsequent changes in the fair value of the agreements in the consolidated financial statements.
Revolving Credit Facility
The Company has a secured Revolving Credit Facility in an amount up to $75.0 million, with avariable-interest rate of 6.25% at December 31, 2012, and maturing in December 2013. As ofDecember 31, 2012 and 2011 the Company had no outstanding borrowing under the Revolving CreditFacility and $68.9 million and $56.9 million available, respectively, (net of various outstanding letters ofcredit), and is in compliance with its financial covenants under the Revolving Credit Facility.
As of December 31, 2012, the scheduled maturities of long-term debt are as follows (in thousands):
2013 . . . . . . . . . . . . . . . . . . . . . . . . . . . . . . . . . . . . . . . . . . . . . . . . . . . . 100,4772014 . . . . . . . . . . . . . . . . . . . . . . . . . . . . . . . . . . . . . . . . . . . . . . . . . . . . 37,5152015 . . . . . . . . . . . . . . . . . . . . . . . . . . . . . . . . . . . . . . . . . . . . . . . . . . . . 39,4352016 . . . . . . . . . . . . . . . . . . . . . . . . . . . . . . . . . . . . . . . . . . . . . . . . . . . . 125,9112017 . . . . . . . . . . . . . . . . . . . . . . . . . . . . . . . . . . . . . . . . . . . . . . . . . . . . 41,790Thereafter . . . . . . . . . . . . . . . . . . . . . . . . . . . . . . . . . . . . . . . . . . . . . . . 223,013
Cash payments for interest totaled $35.2 million, $15.6 million, and $10.1 million in 2012, 2011 and2010, respectively.
7. Leases
The Company leases aircraft, engines and other assets under long-term lease arrangements. Otherleased assets include real property, airport and terminal facilities, and general offices. Certain leasesinclude escalation clauses and renewal options. When lease renewals are considered to be reasonablyassured, the rental payments that will be due during the renewal periods are included in thedetermination of rent expense over the life of the lease.
Aircraft
On June 27, 2011, Hawaiian terminated lease agreements and concurrently entered into a purchaseagreement with the lessor covering fifteen Boeing 717-200 aircraft, each such aircraft including twoRolls-Royce BR700-715 engines. These aircraft were previously operated by Hawaiian under fourcapital and eleven operating lease agreements. The purchase price for the fifteen Boeing 717-200aircraft was $230 million, comprised of financing of $192.8 million through secured loan agreementswith Boeing Capital, cash payment of $25.0 million, and the non-cash application of maintenance andsecurity deposits held by the previous lessor and current debt financier of $12.2 million. This purchaseprice was reduced by certain previously recorded lease valuation adjustments related to these aircraft.The Company recognized the excess of the purchase price paid over the fair value of the aircraft underoperating leases as a cost of terminating the leases under ASC 840—Leases (formerly FASBInterpretation No. 26, Accounting for Purchase of a Leased Asset by the Lessee during the Term of theLease) and elected to apply the same accounting policy to the aircraft under capital leases. As a result,the Company reduced the value of the fifteen Boeing 717-200 to their fair value of $135 million on itsConsolidated Balance Sheets and recorded lease termination charges of $70.0 million on the
76
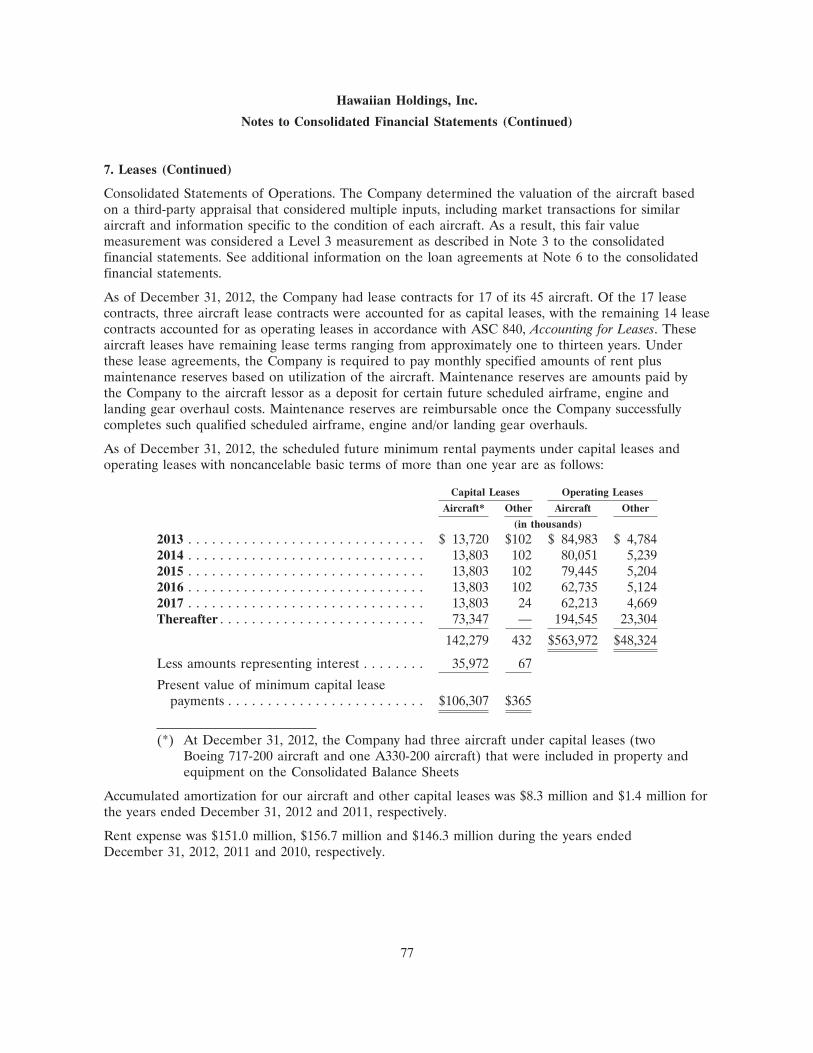
Hawaiian Holdings, Inc.
Notes to Consolidated Financial Statements (Continued)
7. Leases (Continued)
Consolidated Statements of Operations. The Company determined the valuation of the aircraft basedon a third-party appraisal that considered multiple inputs, including market transactions for similaraircraft and information specific to the condition of each aircraft. As a result, this fair valuemeasurement was considered a Level 3 measurement as described in Note 3 to the consolidatedfinancial statements. See additional information on the loan agreements at Note 6 to the consolidatedfinancial statements.
As of December 31, 2012, the Company had lease contracts for 17 of its 45 aircraft. Of the 17 leasecontracts, three aircraft lease contracts were accounted for as capital leases, with the remaining 14 leasecontracts accounted for as operating leases in accordance with ASC 840, Accounting for Leases. Theseaircraft leases have remaining lease terms ranging from approximately one to thirteen years. Underthese lease agreements, the Company is required to pay monthly specified amounts of rent plusmaintenance reserves based on utilization of the aircraft. Maintenance reserves are amounts paid bythe Company to the aircraft lessor as a deposit for certain future scheduled airframe, engine andlanding gear overhaul costs. Maintenance reserves are reimbursable once the Company successfullycompletes such qualified scheduled airframe, engine and/or landing gear overhauls.
As of December 31, 2012, the scheduled future minimum rental payments under capital leases andoperating leases with noncancelable basic terms of more than one year are as follows:
Capital Leases Operating Leases
Aircraft* Other Aircraft Other
(in thousands)
2013 . . . . . . . . . . . . . . . . . . . . . . . . . . . . . . $ 13,720 $102 $ 84,983 $ 4,7842014 . . . . . . . . . . . . . . . . . . . . . . . . . . . . . . 13,803 102 80,051 5,2392015 . . . . . . . . . . . . . . . . . . . . . . . . . . . . . . 13,803 102 79,445 5,2042016 . . . . . . . . . . . . . . . . . . . . . . . . . . . . . . 13,803 102 62,735 5,1242017 . . . . . . . . . . . . . . . . . . . . . . . . . . . . . . 13,803 24 62,213 4,669Thereafter . . . . . . . . . . . . . . . . . . . . . . . . . . 73,347 — 194,545 23,304
142,279 432 $563,972 $48,324
Less amounts representing interest . . . . . . . . 35,972 67
Present value of minimum capital leasepayments . . . . . . . . . . . . . . . . . . . . . . . . . $106,307 $365
(*) At December 31, 2012, the Company had three aircraft under capital leases (twoBoeing 717-200 aircraft and one A330-200 aircraft) that were included in property andequipment on the Consolidated Balance Sheets
Accumulated amortization for our aircraft and other capital leases was $8.3 million and $1.4 million forthe years ended December 31, 2012 and 2011, respectively.
Rent expense was $151.0 million, $156.7 million and $146.3 million during the years endedDecember 31, 2012, 2011 and 2010, respectively.
77

Hawaiian Holdings, Inc.
Notes to Consolidated Financial Statements (Continued)
8. Income Taxes
The significant components of income tax expense (benefit) are as follows:
Year Ended December 31,
2012 2011 2010
(in thousands)
CurrentFederal . . . . . . . . . . . . . . . . . . . . . . . . . . . . . . . . $ — $(36,515) $ 18,364State . . . . . . . . . . . . . . . . . . . . . . . . . . . . . . . . . . 1,216 (5,686) 5,360
1,216 (42,201) 23,724
DeferredFederal . . . . . . . . . . . . . . . . . . . . . . . . . . . . . . . . $27,936 $ 37,150 $(44,158)State . . . . . . . . . . . . . . . . . . . . . . . . . . . . . . . . . . 3,397 6,618 (7,832)
31,333 43,768 (51,990)
Income tax expense (benefit) . . . . . . . . . . . . . . . . . . $32,549 $ 1,567 $(28,266)
Cash payments (refunds) for income taxes were ($16.9) million, ($21.3) million and $26.0 million forthe years ended December 31, 2012, 2011 and 2010, respectively. As of December 31, 2012 and 2011,the Company recorded income taxes receivable of $4.0 and $23.5 million respectively, for overpaymentsand net operating loss carrybacks.
The income tax expense (benefit) differed from amounts computed at the statutory federal income taxrate as follows:
Year Ended December 31,
2012 2011 2010
(in thousands)
Income tax expense (benefit) computed at thestatutory federal rate . . . . . . . . . . . . . . . . . . . . . . . $30,025 $ (368) $ 28,696
Increase (decrease) resulting from:State income taxes, net of federal tax effect . . . . . . 2,999 132 5,033Nondeductible meals . . . . . . . . . . . . . . . . . . . . . . . 910 538 436Change in tax law—Medicare Part D Subsidy . . . . . — — 1,341Change in valuation allowance . . . . . . . . . . . . . . . . — — (57,530)Change in uncertain tax positions . . . . . . . . . . . . . . — (1,983) (5,980)Effect of change in state apportionment rates and
tax rates . . . . . . . . . . . . . . . . . . . . . . . . . . . . . . — 2,624 —Settlement of prior year tax matters . . . . . . . . . . . . — 618 —Other . . . . . . . . . . . . . . . . . . . . . . . . . . . . . . . . . . (1,385) 6 (262)
Income tax expense (benefit) . . . . . . . . . . . . . . . . . . . $32,549 $ 1,567 $(28,266)
During 2010, as a result of its continued positive earnings, as well as positive forecasted earnings in thefuture, and certain tax planning strategies, management concluded that it was more likely than not thatthe Company would realize its deferred tax assets, and therefore, the Company released its remainingvaluation allowance which amounted to approximately $57.5 million.
78

Hawaiian Holdings, Inc.
Notes to Consolidated Financial Statements (Continued)
8. Income Taxes (Continued)
The ultimate realization of deferred tax assets is dependent upon the generation of future taxableincome (including the reversals of deferred tax liabilities) during the periods in which those deferredtax assets will become deductible. The Company’s management assesses the realizability of its deferredtax assets, and records a valuation allowance when it is more likely than not that a portion, or all, ofthe deferred tax assets will not be realized. As result of positive forecasted earnings in the future andcertain tax planning strategies, management concluded that it was more likely than not that theCompany will realize its deferred tax assets, and therefore, the Company has not recorded a valuationallowance as of December 31, 2012.
The components of the Company’s deferred tax assets and liabilities as of December 31, 2012 and 2011were as follows:
December 31,
2012 2011
(in thousands)
Deferred tax assets:Accumulated pension and other postretirement benefits . . $ 135,922 $ 120,958Leases . . . . . . . . . . . . . . . . . . . . . . . . . . . . . . . . . . . . . . 5,610 6,491Air traffic liability . . . . . . . . . . . . . . . . . . . . . . . . . . . . . . 10,745 9,745Federal and state net operating loss carryforwards . . . . . . . 75,223 39,271Alternative minimum tax credit carryforwards . . . . . . . . . . 5,909 4,563Other assets . . . . . . . . . . . . . . . . . . . . . . . . . . . . . . . . . . 25,814 22,466
Total deferred tax assets . . . . . . . . . . . . . . . . . . . . . . . . . $ 259,223 $ 203,494
Deferred tax liabilities:Intangible assets . . . . . . . . . . . . . . . . . . . . . . . . . . . . . . . $ (10,169) $ (16,429)Plant and equipment, principally accelerated depreciation . (187,222) (104,754)Other liabilities . . . . . . . . . . . . . . . . . . . . . . . . . . . . . . . . (7,781) (7,456)
Total deferred tax liabilities . . . . . . . . . . . . . . . . . . . . . . . (205,172) (128,639)
Net deferred tax asset . . . . . . . . . . . . . . . . . . . . . . . . . . . . . $ 54,051 $ 74,855
At December 31, 2012, the Company had available for federal income tax purposes an alternativeminimum tax credit carryforward of approximately $5.9 million, which is available for an indefiniteperiod, and federal and a state net operating loss carryforward of $232.0 million. The tax benefit of thenet operating loss carryforwards as of December 31, 2012 is $75.2 million, substantially all of which willnot begin to expire until 2031.
In accordance with ASC 740, the Company reviews its uncertain tax positions on an ongoing basis. TheCompany may be required to adjust its liability as these matters are finalized, which could increase ordecrease its income tax expense and effective income tax rates or result in an adjustment to thevaluation allowance. The Company does not expect that the unrecognized tax benefit related touncertain tax positions will significantly change within the next twelve months.
79

Hawaiian Holdings, Inc.
Notes to Consolidated Financial Statements (Continued)
8. Income Taxes (Continued)
The table below reconciles beginning and ending amounts of unrecognized tax benefits related touncertain tax positions:
2012 2011 2010
(in thousands)
Balance at January 1 . . . . . . . . . . . . . . . . . . . . . . . . . . . . $— $ 1,983 $ 8,577Increases related to prior year tax positions . . . . . . . . . . . . — — 686Decreases related to prior year tax positions . . . . . . . . . . . — (367) —Settlements with taxing authority . . . . . . . . . . . . . . . . . . . — (490) (1,133)Effect of the expiration of statutes of limitation . . . . . . . . . — (1,126) (6,147)
Balance at December 31 . . . . . . . . . . . . . . . . . . . . . . . . . $— $ — $ 1,983
The Company records interest and penalties relating to unrecognized tax benefits in other nonoperatingexpense in its Consolidated Statements of Operations. Interest and penalties amounted to none, noneand $0.3 million for the years ended December 31, 2012, 2011 and 2010, respectively. The Companyrecorded an offset to interest expense of none, $0.6 million and $1.4 million during the years endedDecember 31, 2012, 2011 and 2010, respectively. The Company had no accrued interest and penaltiesat December 31, 2012 and 2011, respectively.
The Company files its tax returns as prescribed by the tax laws of the jurisdictions in which it operates.The Company’s federal income tax returns for tax years 2010 and beyond remain subject toexamination by the Internal Revenue Service (‘‘IRS’’). The IRS commenced examination of theCompany’s federal income tax return for 2010 in the third quarter of 2012. As of December 31, 2012,the IRS had not proposed any adjustments to the Company’s return. The IRS concluded itsexamination of the Company’s federal income tax returns for the 2009 tax year in the third quarter of2012. The Company is not currently under audit in any other taxing jurisdiction in which it operatesand the related state and local income tax returns remain open to examination. The Company believes,however, that any potential assessment in these jurisdictions would be immaterial.
9. Employee Benefit Plans
Defined Benefit Plans
Hawaiian sponsors various defined benefit pension plans covering the Air Line Pilots Association,International Association of Machinists and Aerospace Workers (AFL-CIO) (IAM) and otherpersonnel (salaried, Transport Workers Union, Network Engineering Group). The plans for the IAMand other employees were frozen in exchange for defined contribution plans in prior years. EffectiveJanuary 1, 2008, benefit accruals for pilots under age 50 as of July 1, 2005 were frozen and Hawaiianbegan making contributions to an alternate defined contribution retirement program for pilots. All ofthe pilots’ accrued benefits under their defined benefit plan at the date of the freeze were preserved,but there are no further benefit accruals subsequent to the date of the freeze (with the exception ofcertain pilots who were both age 50 and older and participants of the plan on July 1, 2005). Inaddition, Hawaiian sponsors four unfunded defined benefit postretirement medical and life insuranceplans and a separate plan to administer the pilots’ disability benefits.
80

Hawaiian Holdings, Inc.
Notes to Consolidated Financial Statements (Continued)
9. Employee Benefit Plans (Continued)
The following tables summarize changes to projected benefit obligations, plan assets, funded status andapplicable amounts included in the Consolidated Balance Sheets as of December 31, 2012 and 2011:
2012 2011
Pension Other Pension Other
(in thousands)
Change in benefit obligationBenefit obligation, beginning of period . . . . . . . . . . . . $ 391,287 $ 156,197 $ 347,592 $ 108,834Service cost . . . . . . . . . . . . . . . . . . . . . . . . . . . . . . . . 2,723 11,152 2,833 6,342Interest cost . . . . . . . . . . . . . . . . . . . . . . . . . . . . . . . 18,993 8,548 19,426 6,657Actuarial (gains) losses . . . . . . . . . . . . . . . . . . . . . . . 26,450 11,196 38,747 37,380Benefits paid . . . . . . . . . . . . . . . . . . . . . . . . . . . . . . . (17,569) (3,188) (17,311) (3,016)
less: federal subsidy on benefits paid . . . . . . . . . . . . N/A 39 N/A —
Benefit obligation at end of year(a) . . . . . . . . . . . . . . $ 421,884 $ 183,944 $ 391,287 $ 156,197
Change in plan assetsFair value of assets, beginning of period . . . . . . . . . . . $ 214,159 $ 9,870 $ 231,824 $ 8,684Actual return on plan assets . . . . . . . . . . . . . . . . . . . . 24,525 899 (11,283) (113)Employer contribution . . . . . . . . . . . . . . . . . . . . . . . . 17,019 4,837 10,929 4,315Benefits paid . . . . . . . . . . . . . . . . . . . . . . . . . . . . . . . (17,569) (3,188) (17,311) (3,016)
Fair value of assets at end of year . . . . . . . . . . . . . . . . $ 238,134 $ 12,418 $ 214,159 $ 9,870
Funded status at December 31, . . . . . . . . . . . . . . . . . $(183,750) $(171,526) $(177,128) $(146,327)
Amounts recognized in the statement of financial positionconsist of:
Current benefit liability . . . . . . . . . . . . . . . . . . . . . . . $ (17) $ (2,799) $ (17) $ (2,696)Noncurrent benefit liability . . . . . . . . . . . . . . . . . . . . . (183,733) (168,727) (177,111) (143,631)
$(183,750) $(171,526) $(177,128) $(146,327)
Amounts recognized in other comprehensive lossUnamortized actuarial loss . . . . . . . . . . . . . . . . . . . . . $ 108,719 $ 55,991 $ 96,195 $ 47,560Prior service credit . . . . . . . . . . . . . . . . . . . . . . . . . . (57) (23) (59) (25)
$ 108,662 $ 55,968 $ 96,136 $ 47,535
(a) The accumulated pension benefit obligation as of December 31, 2012 and 2011 was $413.4 millionand $381.9 million, respectively.
81

Hawaiian Holdings, Inc.
Notes to Consolidated Financial Statements (Continued)
9. Employee Benefit Plans (Continued)
The following table sets forth the net periodic benefit cost for the years ended December 31, 2012,2011 and 2010:
2012 2011 2010
Pension Other Pension Other Pension Other
(in thousands)
Components of Net Periodic Benefit CostService cost . . . . . . . . . . . . . . . . . . . . . $ 2,723 $11,152 $ 2,833 $ 6,342 $ 3,271 $ 5,705Interest cost . . . . . . . . . . . . . . . . . . . . 18,993 8,548 19,426 6,657 19,338 5,607Expected return on plan assets . . . . . . . (15,253) (819) (18,015) (774) (16,017) (624)Recognized net actuarial loss . . . . . . . . 4,653 2,717 184 278 165 40Prior service credit . . . . . . . . . . . . . . . . (2) (2) (2) (2) (2) (2)
Net periodic benefit cost . . . . . . . . . . . $ 11,114 $21,596 $ 4,426 $12,501 $ 6,755 $10,726
Other Changes in Plan Assets and BenefitObligations Recognized in OtherComprehensive Loss
Current year actuarial (gain) loss . . . . . $ 17,178 $11,148 $ 68,045 $38,297 $ (1,799) $ 7,143Amortization of actuarial loss . . . . . . . . (4,653) (2,717) (184) (278) (165) (40)Amortization of prior service credit . . . . 2 2 2 2 2 2
Total recognized in other comprehensiveloss . . . . . . . . . . . . . . . . . . . . . . . . . $ 12,527 $ 8,433 $ 67,863 $38,021 $ (1,962) $ 7,105
Total recognized in net periodic benefitcost and other comprehensive loss . . . $ 23,641 $30,029 $ 72,289 $50,522 $ 4,793 $17,831
The following actuarial assumptions were used to determine the net periodic benefit expense and theprojected benefit obligation at December 31:
Pension Postretirement Disability
2012 2011 2012 2011 2012 2011
Weighted average assumption used to determine netperiodic benefit expense and projected benefitobligations:
Discount rate to determine net periodic benefitexpense . . . . . . . . . . . . . . . . . . . . . . . . . . 4.94% 5.71% 5.14% 5.81% 4.91% 5.59%
Discount rate to determine projected benefitobligation . . . . . . . . . . . . . . . . . . . . . . . . . 4.10% 4.94% 4.24% 5.14% 4.06% 4.91%
Expected return on plan assets . . . . . . . . . . . . 7.30%++ 7.90% N/A N/A 6.90%++ 7.50%Rate of compensation increase . . . . . . . . . . . . Various+ Various+ N/A N/A Various+ Various+
+ Differs for each pilot based on current fleet and seat position on the aircraft and seniority service. Negotiatedsalary increases and expected changes in fleet and seat positions on the aircraft are included in the assumedrate of compensation increase which range from 1.5% to 7.50% in 2012 and 2.0% to 7.5% in 2011.
++ Expected return on plan assets used to determine the net periodic benefit expense for 2013 will be 6.55% forPension and 6.15% for Disability.
82
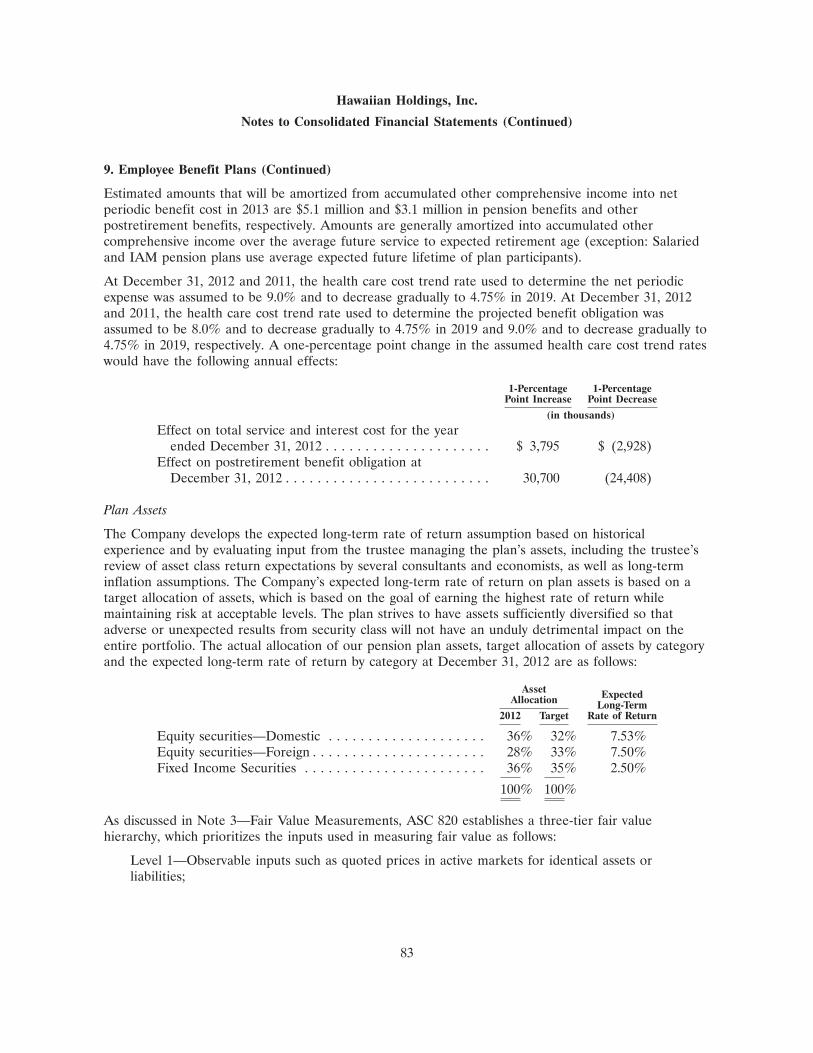
Hawaiian Holdings, Inc.
Notes to Consolidated Financial Statements (Continued)
9. Employee Benefit Plans (Continued)
Estimated amounts that will be amortized from accumulated other comprehensive income into netperiodic benefit cost in 2013 are $5.1 million and $3.1 million in pension benefits and otherpostretirement benefits, respectively. Amounts are generally amortized into accumulated othercomprehensive income over the average future service to expected retirement age (exception: Salariedand IAM pension plans use average expected future lifetime of plan participants).
At December 31, 2012 and 2011, the health care cost trend rate used to determine the net periodicexpense was assumed to be 9.0% and to decrease gradually to 4.75% in 2019. At December 31, 2012and 2011, the health care cost trend rate used to determine the projected benefit obligation wasassumed to be 8.0% and to decrease gradually to 4.75% in 2019 and 9.0% and to decrease gradually to4.75% in 2019, respectively. A one-percentage point change in the assumed health care cost trend rateswould have the following annual effects:
1-Percentage 1-PercentagePoint Increase Point Decrease
(in thousands)
Effect on total service and interest cost for the yearended December 31, 2012 . . . . . . . . . . . . . . . . . . . . . $ 3,795 $ (2,928)
Effect on postretirement benefit obligation atDecember 31, 2012 . . . . . . . . . . . . . . . . . . . . . . . . . . 30,700 (24,408)
Plan Assets
The Company develops the expected long-term rate of return assumption based on historicalexperience and by evaluating input from the trustee managing the plan’s assets, including the trustee’sreview of asset class return expectations by several consultants and economists, as well as long-terminflation assumptions. The Company’s expected long-term rate of return on plan assets is based on atarget allocation of assets, which is based on the goal of earning the highest rate of return whilemaintaining risk at acceptable levels. The plan strives to have assets sufficiently diversified so thatadverse or unexpected results from security class will not have an unduly detrimental impact on theentire portfolio. The actual allocation of our pension plan assets, target allocation of assets by categoryand the expected long-term rate of return by category at December 31, 2012 are as follows:
Asset ExpectedAllocation Long-Term2012 Target Rate of Return
Equity securities—Domestic . . . . . . . . . . . . . . . . . . . . 36% 32% 7.53%Equity securities—Foreign . . . . . . . . . . . . . . . . . . . . . . 28% 33% 7.50%Fixed Income Securities . . . . . . . . . . . . . . . . . . . . . . . 36% 35% 2.50%
100% 100%
As discussed in Note 3—Fair Value Measurements, ASC 820 establishes a three-tier fair valuehierarchy, which prioritizes the inputs used in measuring fair value as follows:
Level 1—Observable inputs such as quoted prices in active markets for identical assets orliabilities;
83

Hawaiian Holdings, Inc.
Notes to Consolidated Financial Statements (Continued)
9. Employee Benefit Plans (Continued)
Level 2—Observable inputs other than Level 1 prices such as quoted prices for similar assets orliabilities; quoted prices in markets that are not active; or other inputs that are observable or canbe corroborated by observable market data for substantially the full term for the assets orliabilities; and
Level 3—Unobservable inputs in which there is little or no market data and that are significant tothe fair value of the assets or liabilities.
The table below presents the Company’s pension plan and other postretirement plan investments(excluding cash) as of December 31, 2012 and 2011:
Fair Value Measurementsas of December 31, 2012
Total Level 1 Level 2 Level 3
(in thousands)
Pension Plan Assets:Cash equivalents . . . . . . . . . . . . . . . . . . . . $ 1,419 $ 1,419 $ — $—Equity securities:
Common stock—Domestic . . . . . . . . . . . 42,140 42,140 — —Common stock—Foreign . . . . . . . . . . . . . 26,284 26,284 — —Real estate investment trusts—Domestic . 4,222 — 4,222 —Real estate investment trusts—Foreign . . . 3,743 — 3,743 —Preferred stock—Domestic . . . . . . . . . . . 496 496 — —Preferred stock—Foreign . . . . . . . . . . . . 322 322 — —Other equities—Domestic . . . . . . . . . . . . 220 220 — —Equity Index Funds . . . . . . . . . . . . . . . . 66,388 — 66,388 —
Fixed income securities:Government bonds—Domestic . . . . . . . . 3,960 — 3,960 —Government bonds—Foreign . . . . . . . . . . 18,313 — 18,313 —Mortgage-based securities . . . . . . . . . . . . 2,625 — 2,625 —Corporate bonds—Domestic . . . . . . . . . . 7,577 — 7,577 —Corporate bonds—Foreign . . . . . . . . . . . 3,444 — 3,444 —State and Local bonds . . . . . . . . . . . . . . 150 — 150 —Fixed Income Fund . . . . . . . . . . . . . . . . 43,952 — 43,952 —
Common collective trust fund . . . . . . . . . . . 2,902 — 2,902 —Forward contracts . . . . . . . . . . . . . . . . . . . (6) — (6) —Insurance company pooled separate account 4,478 — 4,478 —
Total . . . . . . . . . . . . . . . . . . . . . . . . . . . $232,629 $70,881 $161,748 $—
Postretirement Assets:Common collective trust fund . . . . . . . . . . . $ 12,356 $ — $ 12,356 $—
84

Hawaiian Holdings, Inc.
Notes to Consolidated Financial Statements (Continued)
9. Employee Benefit Plans (Continued)
Fair Value Measurementsas of December 31, 2011
Total Level 1 Level 2 Level 3
(in thousands)
Pension Plan Assets:Cash equivalents . . . . . . . . . . . . . . . . . . . . $ 25 $ 25 $ — $—Equity securities:
Common stock—Domestic . . . . . . . . . . . 38,860 38,860 — —Common stock—Foreign . . . . . . . . . . . . . 28,105 28,105 — —Real estate investment trusts—Domestic . 3,450 — 3,450 —Real estate investment trusts—Foreign . . . 1,488 — 1,488 —Preferred stock—Foreign . . . . . . . . . . . . 236 236 — —Other equities—Domestic . . . . . . . . . . . . 253 253 — —Other equities—Foreign . . . . . . . . . . . . . 88 88 — —Equity Index Funds . . . . . . . . . . . . . . . . 57,148 — 57,148 —
Fixed income securities:Government bonds—Domestic . . . . . . . . 4,848 — 4,848 —Government bonds—Foreign . . . . . . . . . . 14,539 — 14,539 —Mortgage-based securities . . . . . . . . . . . . 3,556 — 3,556 —Corporate bonds—Domestic . . . . . . . . . . 6,713 — 6,713 —Corporate bonds—Foreign . . . . . . . . . . . 5,270 — 5,270 —State and Local bonds . . . . . . . . . . . . . . 448 — 448 —Fixed Income Fund . . . . . . . . . . . . . . . . 40,517 — 40,517 —
Common collective trust fund . . . . . . . . . . . 2,395 — 2,395 —Forward contracts . . . . . . . . . . . . . . . . . . . (85) — (85) —Insurance company pooled separate account 4,640 — 4,640 —
Total . . . . . . . . . . . . . . . . . . . . . . . . . . . $212,494 $67,567 $144,927 $—
Postretirement Assets:Common collective trust fund . . . . . . . . . . . $ 9,809 $ — $ 9,809 $—
Common stocks, preferred stock and other equities. These investments are valued at the closing pricereported on the active market on which the individual securities are traded.
Equity. The Company invests in the Blackrock S&P 500 Fund and Thornburg International EquityFund. The investment objective is to obtain a reasonable rate of return while investing principally orentirely in foreign or domestic equity securities. There are currently no redemption restrictions onthese investments. The fair value of the investments in this category has been estimated using the netasset value per share.
Fixed income fund. The investment objective of the PIMCO Total Return Fund is to obtain areasonable rate of return while principally investing in foreign or domestic bonds. There are currentlyno redemption restrictions on these investments. The fair value of the investments in this category hasbeen estimated using the net asset value per share.
85
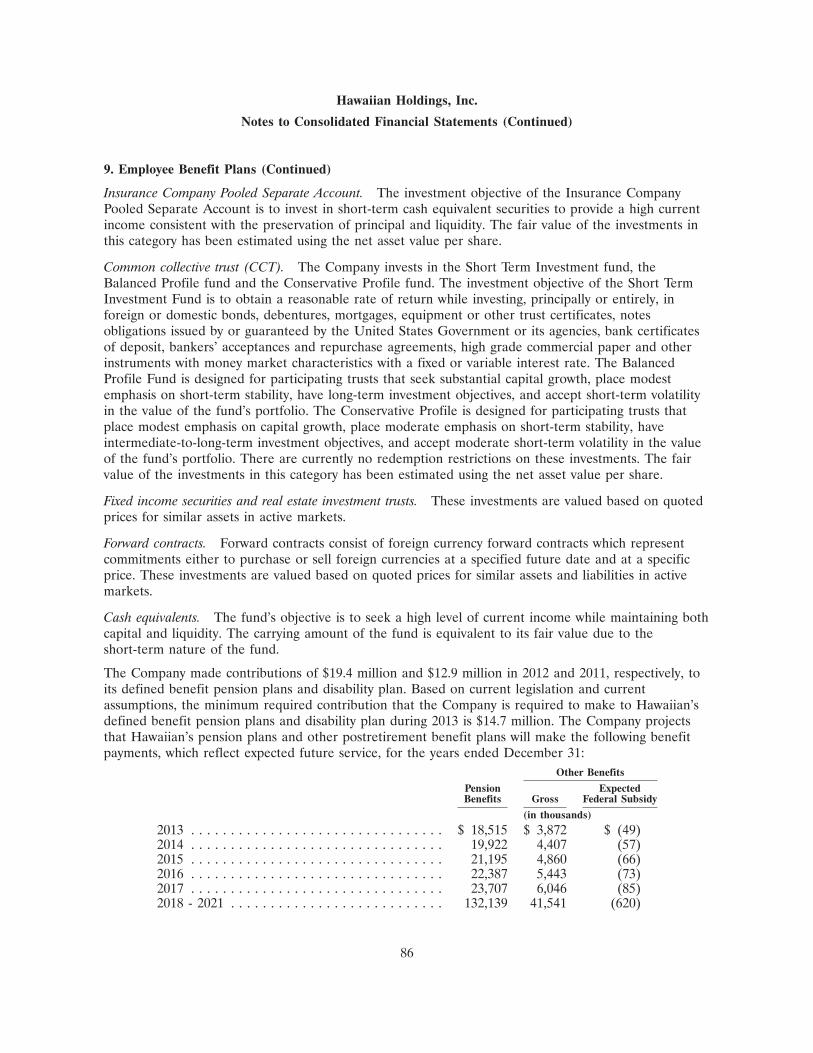
Hawaiian Holdings, Inc.
Notes to Consolidated Financial Statements (Continued)
9. Employee Benefit Plans (Continued)
Insurance Company Pooled Separate Account. The investment objective of the Insurance CompanyPooled Separate Account is to invest in short-term cash equivalent securities to provide a high currentincome consistent with the preservation of principal and liquidity. The fair value of the investments inthis category has been estimated using the net asset value per share.
Common collective trust (CCT). The Company invests in the Short Term Investment fund, theBalanced Profile fund and the Conservative Profile fund. The investment objective of the Short TermInvestment Fund is to obtain a reasonable rate of return while investing, principally or entirely, inforeign or domestic bonds, debentures, mortgages, equipment or other trust certificates, notesobligations issued by or guaranteed by the United States Government or its agencies, bank certificatesof deposit, bankers’ acceptances and repurchase agreements, high grade commercial paper and otherinstruments with money market characteristics with a fixed or variable interest rate. The BalancedProfile Fund is designed for participating trusts that seek substantial capital growth, place modestemphasis on short-term stability, have long-term investment objectives, and accept short-term volatilityin the value of the fund’s portfolio. The Conservative Profile is designed for participating trusts thatplace modest emphasis on capital growth, place moderate emphasis on short-term stability, haveintermediate-to-long-term investment objectives, and accept moderate short-term volatility in the valueof the fund’s portfolio. There are currently no redemption restrictions on these investments. The fairvalue of the investments in this category has been estimated using the net asset value per share.
Fixed income securities and real estate investment trusts. These investments are valued based on quotedprices for similar assets in active markets.
Forward contracts. Forward contracts consist of foreign currency forward contracts which representcommitments either to purchase or sell foreign currencies at a specified future date and at a specificprice. These investments are valued based on quoted prices for similar assets and liabilities in activemarkets.
Cash equivalents. The fund’s objective is to seek a high level of current income while maintaining bothcapital and liquidity. The carrying amount of the fund is equivalent to its fair value due to theshort-term nature of the fund.
The Company made contributions of $19.4 million and $12.9 million in 2012 and 2011, respectively, toits defined benefit pension plans and disability plan. Based on current legislation and currentassumptions, the minimum required contribution that the Company is required to make to Hawaiian’sdefined benefit pension plans and disability plan during 2013 is $14.7 million. The Company projectsthat Hawaiian’s pension plans and other postretirement benefit plans will make the following benefitpayments, which reflect expected future service, for the years ended December 31:
Other Benefits
Pension ExpectedBenefits Gross Federal Subsidy
(in thousands)
2013 . . . . . . . . . . . . . . . . . . . . . . . . . . . . . . . . $ 18,515 $ 3,872 $ (49)2014 . . . . . . . . . . . . . . . . . . . . . . . . . . . . . . . . 19,922 4,407 (57)2015 . . . . . . . . . . . . . . . . . . . . . . . . . . . . . . . . 21,195 4,860 (66)2016 . . . . . . . . . . . . . . . . . . . . . . . . . . . . . . . . 22,387 5,443 (73)2017 . . . . . . . . . . . . . . . . . . . . . . . . . . . . . . . . 23,707 6,046 (85)2018 - 2021 . . . . . . . . . . . . . . . . . . . . . . . . . . . 132,139 41,541 (620)
86
Hawaiian Holdings, Inc.
Notes to Consolidated Financial Statements (Continued)
9. Employee Benefit Plans (Continued)
Defined Contribution Plans
The Company also sponsors separate defined contribution plans (401(k)) for its pilots, flight attendantsand ground and salaried personnel. Depending upon the employee group, employer contributionsconsist of matching contributions based on percentages ranging from 2% to 5.04% for employercontributions and 0% to 5% for matching contributions (excludes pilots which are awarded based ontarget benefit contributions) of eligible earnings or participant contributions depending on the terms ofeach plan. Contributions to the Company’s defined contribution plans were $21.3 million, $18.5 million,and $16.5 million for the years ended December 31, 2012, 2011 and 2010, respectively.
10. Capital Stock and Share-based Compensation
Common Stock
The Company has one class of common stock issued and outstanding. Each share of common stock isentitled to one vote per share.
No dividends were paid by the Company during the years ended December 31, 2012, 2011 and 2010.Provisions in certain of the Company’s aircraft lease agreements restrict the Company’s ability to paydividends.
Special Preferred Stock
The IAM, AFA, and ALPA each hold one share of Special Preferred Stock, which entitles each unionto nominate one director to the Company’s Board of Directors. In addition, each series of the SpecialPreferred Stock, unless otherwise specified: (i) ranks senior to the Company’s common stock and rankspari passu with such series of Special Preferred Stock with respect to liquidation, dissolution andwinding up of the Company and will be entitled to receive $0.01 per share before any payments aremade, or assets distributed to holders of any stock ranking junior to the Special Preferred Stock;(ii) has no dividend rights unless a dividend is declared and paid on the Company’s common stock, inwhich case the Special Preferred Stock would be entitled to receive a dividend in an amount per shareequal to two times the dividend per share paid on the common stock; (iii) is entitled to one vote pershare of such series and votes with the common stock as a single class on all matters submitted toholders of the Company’s common stock; and (iv) automatically converts into the Company’s commonstock on a 1:1 basis, at such time as such shares are transferred or such holders are no longer entitledto nominate a representative to the Company’s Board of Directors pursuant to their respectivecollective bargaining agreements.
Share-Based Compensation
The Company has a stock compensation plan for its and its subsidiaries’ officers, other employees,contractors, consultants and non-employee directors. Total share-based compensation expenserecognized by the Company under ASC 718 was $3.4 million, $4.3 million and $5.0 million for the yearsended December 31, 2012, 2011 and 2010, respectively. As of December 31, 2012, $4.6 million of share-based compensation expense related to unvested stock options and other awards (inclusive of$0.3 million for stock options and other awards granted to non-employee directors) is attributable tofuture performance and has not yet been recognized. The related expense will be recognized over aweighted average period of approximately 1.3 years.
87

Hawaiian Holdings, Inc.
Notes to Consolidated Financial Statements (Continued)
10. Capital Stock and Share-based Compensation (Continued)
Performance and Market-Based Stock Awards
During 2012, the Company granted performance-based and market-based awards covering 507,817shares of Company Common Stock (the Target Award) with a maximum payout of 755,175 shares ofCommon Stock (the Maximum Award) to employees pursuant to the Company’s 2005 Stock IncentivePlan. These awards vest over a period of three years. The Company valued the performance-basedawards using grant date fair values equal to the Company’s share price on the measurement date andthe market-based awards using a lattice model.
The following table summarizes information about performance and market-based stock awards:
Weightedaverage
grant dateNumber of units fair value
Non-vested at December 31, 2011 . . . . . . . . . . . . . . . . . . 734,563 $6.34Granted during the period . . . . . . . . . . . . . . . . . . . . . . 507,817 6.00Vested during the period . . . . . . . . . . . . . . . . . . . . . . . (139,845) 6.96Forfeited during the period . . . . . . . . . . . . . . . . . . . . . (32,646) 6.73
Non-vested at December 31, 2012 . . . . . . . . . . . . . . . . . . 1,069,889 $6.09
Time-Based Stock Awards
During 2012, the Company awarded 350,300 time-based stock awards to employees and non-employeedirectors, pursuant to the Company’s 2005 Stock Incentive Plan. These awards vest over a period ofone to three years and have a grant date fair value equal to the Company’s share price on themeasurement date.
The following table summarizes information about outstanding time-based stock awards:
Weightedaverage
grant dateNumber of units fair value
Non-vested at December 31, 2011 . . . . . . . . . . . . . . . . . . 546,543 $6.11Granted during the period . . . . . . . . . . . . . . . . . . . . . . 350,300 6.07Vested during the period . . . . . . . . . . . . . . . . . . . . . . . (289,966) 5.86Forfeited during the period . . . . . . . . . . . . . . . . . . . . . (58,595) 6.41
Non-vested at December 31, 2012 . . . . . . . . . . . . . . . . . . 548,282 $6.19
11. Commitments and Contingent Liabilities
Commitments
As of December 31, 2012, the Company had capital commitments consisting of firm aircraft orders forthirteen wide-body Airbus A330-200 aircraft, six Airbus A350XWB-800 aircraft and four Rolls Roycespare engines scheduled for delivery through 2020. The Company has purchase rights for an additionalthree A330-200 aircraft and six A350XWB-800 aircraft and can utilize these rights subject to
88
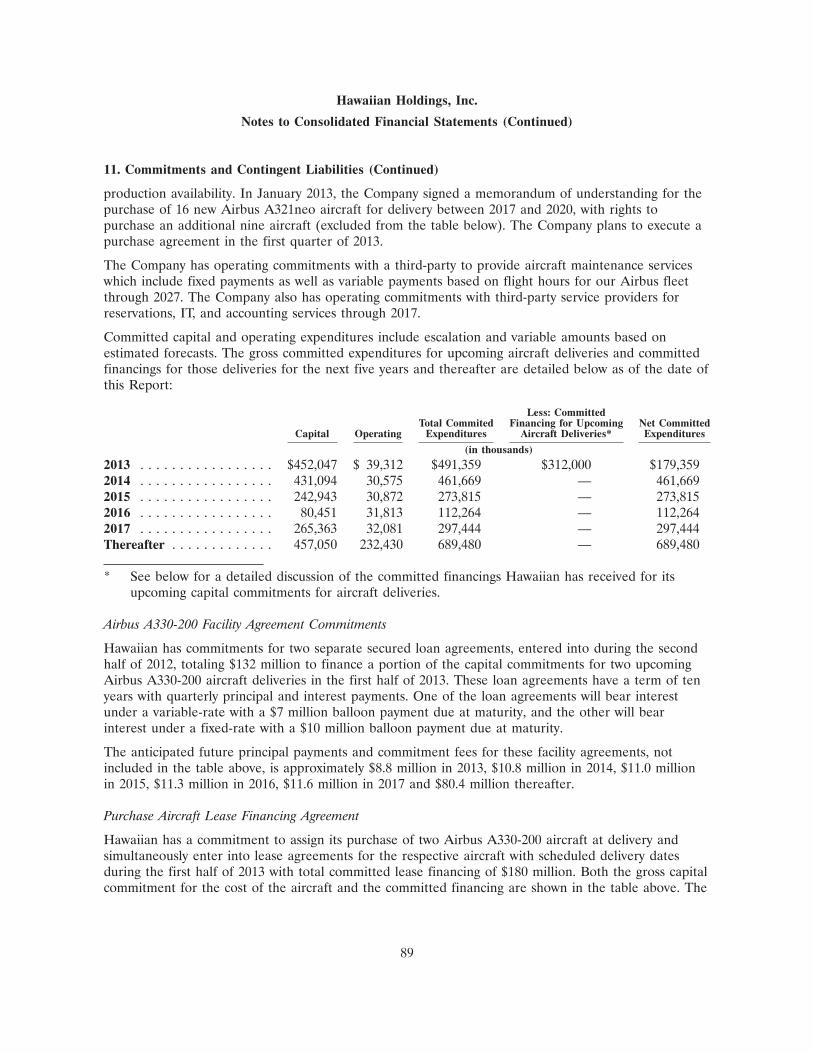
Hawaiian Holdings, Inc.
Notes to Consolidated Financial Statements (Continued)
11. Commitments and Contingent Liabilities (Continued)
production availability. In January 2013, the Company signed a memorandum of understanding for thepurchase of 16 new Airbus A321neo aircraft for delivery between 2017 and 2020, with rights topurchase an additional nine aircraft (excluded from the table below). The Company plans to execute apurchase agreement in the first quarter of 2013.
The Company has operating commitments with a third-party to provide aircraft maintenance serviceswhich include fixed payments as well as variable payments based on flight hours for our Airbus fleetthrough 2027. The Company also has operating commitments with third-party service providers forreservations, IT, and accounting services through 2017.
Committed capital and operating expenditures include escalation and variable amounts based onestimated forecasts. The gross committed expenditures for upcoming aircraft deliveries and committedfinancings for those deliveries for the next five years and thereafter are detailed below as of the date ofthis Report:
Less: CommittedTotal Commited Financing for Upcoming Net Committed
Capital Operating Expenditures Aircraft Deliveries* Expenditures
(in thousands)
2013 . . . . . . . . . . . . . . . . . $452,047 $ 39,312 $491,359 $312,000 $179,3592014 . . . . . . . . . . . . . . . . . 431,094 30,575 461,669 — 461,6692015 . . . . . . . . . . . . . . . . . 242,943 30,872 273,815 — 273,8152016 . . . . . . . . . . . . . . . . . 80,451 31,813 112,264 — 112,2642017 . . . . . . . . . . . . . . . . . 265,363 32,081 297,444 — 297,444Thereafter . . . . . . . . . . . . . 457,050 232,430 689,480 — 689,480
* See below for a detailed discussion of the committed financings Hawaiian has received for itsupcoming capital commitments for aircraft deliveries.
Airbus A330-200 Facility Agreement Commitments
Hawaiian has commitments for two separate secured loan agreements, entered into during the secondhalf of 2012, totaling $132 million to finance a portion of the capital commitments for two upcomingAirbus A330-200 aircraft deliveries in the first half of 2013. These loan agreements have a term of tenyears with quarterly principal and interest payments. One of the loan agreements will bear interestunder a variable-rate with a $7 million balloon payment due at maturity, and the other will bearinterest under a fixed-rate with a $10 million balloon payment due at maturity.
The anticipated future principal payments and commitment fees for these facility agreements, notincluded in the table above, is approximately $8.8 million in 2013, $10.8 million in 2014, $11.0 millionin 2015, $11.3 million in 2016, $11.6 million in 2017 and $80.4 million thereafter.
Purchase Aircraft Lease Financing Agreement
Hawaiian has a commitment to assign its purchase of two Airbus A330-200 aircraft at delivery andsimultaneously enter into lease agreements for the respective aircraft with scheduled delivery datesduring the first half of 2013 with total committed lease financing of $180 million. Both the gross capitalcommitment for the cost of the aircraft and the committed financing are shown in the table above. The
89

Hawaiian Holdings, Inc.
Notes to Consolidated Financial Statements (Continued)
11. Commitments and Contingent Liabilities (Continued)
lease agreements have initial lease terms of twelve years with the option to extend an additional twoyears. Rent under each lease is payable monthly at a fixed rate to be determined at delivery of eachaircraft. The Company will determine whether these leases will be classified as capital or operatingleases in the period it takes delivery of each aircraft.
The anticipated future payments for these leases, not included in the table above, is approximately$15.3 million for 2013, $18.4 million in 2014, $18.4 million in 2015, $18.4 million in 2016, $18.4 millionin 2017 and $131.6 million thereafter.
Litigation and Contingencies
The Company is subject to legal proceedings arising in the normal course of its operations.Management does not anticipate that the disposition of any currently pending proceeding will have amaterial effect on the Company’s operations, business or financial condition.
General Guarantees and Indemnifications
In the normal course of business, the Company enters into numerous aircraft financing and real estateleasing arrangements that have various guarantees included in the contract. It is common in such leasetransactions for the lessee to agree to indemnify the lessor and other related third-parties for tortliabilities that arise out of or relate to the lessee’s use of the leased aircraft or occupancy of the leasedpremises. In some cases, this indemnity extends to related liabilities arising from the negligence of theindemnified parties, but usually excludes any liabilities caused by their gross negligence or willfulmisconduct. Additionally, the lessee typically indemnifies such parties for any environmental liabilitythat arises out of or relates to its use of the real estate leased premises. The Company believes that itis covered by insurance (subject to deductibles) for most tort liabilities and related indemnitiesdescribed above with respect to the aircraft and real estate that it leases. The Company cannot estimatethe potential amount of future payments, if any, under the foregoing indemnities and agreements.
Credit Card Holdback
Under the Company’s bank-issued credit card processing agreements, certain proceeds from advanceticket sales may be held back to serve as collateral to cover any possible chargebacks or other disputedcharges that may occur. These holdbacks, which are included in restricted cash in the Company’sConsolidated Balance Sheets, totaled $5.0 million at December 31, 2012 and $30.9 million atDecember 31, 2011. There were no amounts subject to this holdback at December 31, 2012. As ofDecember 31, 2011, the holdback was 25% of the applicable credit card air traffic liability.
In October 2012, the Company entered into an amendment with its largest credit card processor thateliminates the financial triggers for additional holdbacks. In the event of a material adverse change inthe business, the holdback could increase to an amount up to 100% of the applicable credit card airtraffic liability, which would also cause an increase in the level of restricted cash. If the Company isunable to obtain a waiver of, or otherwise mitigate the increase in restriction of cash, it could alsocause a covenant violation under other debt or lease obligations and have a material adverse impact onthe Company.
90
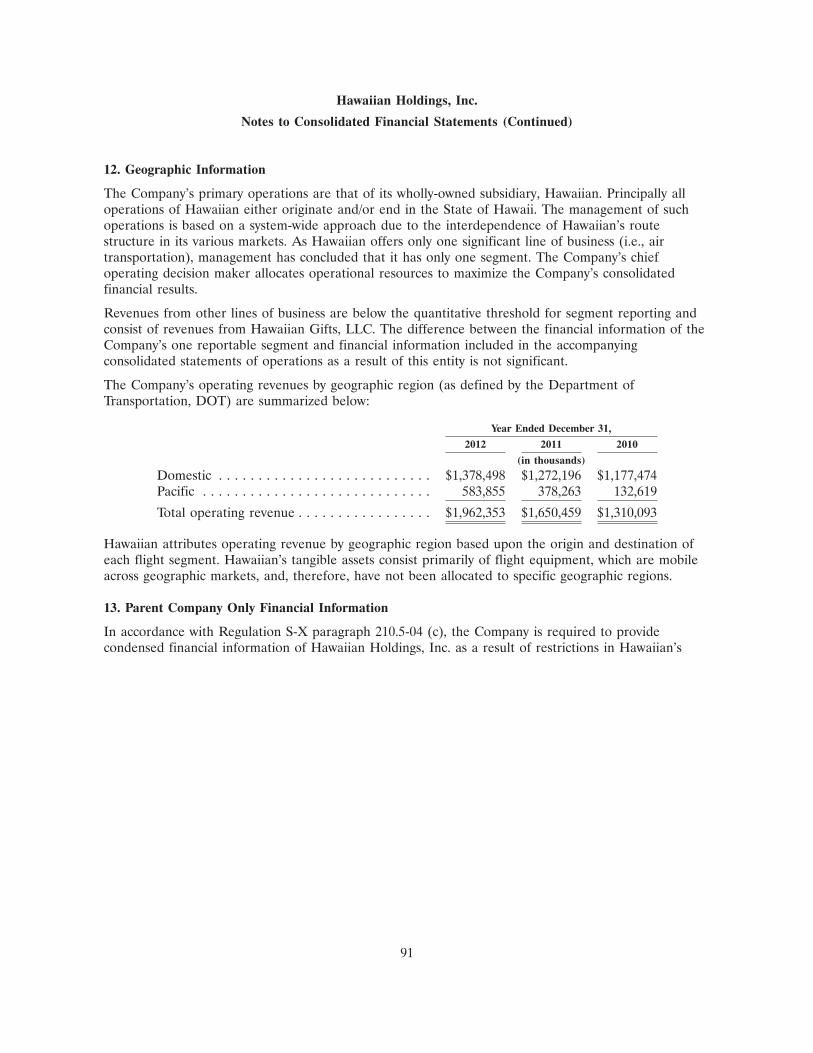
Hawaiian Holdings, Inc.
Notes to Consolidated Financial Statements (Continued)
12. Geographic Information
The Company’s primary operations are that of its wholly-owned subsidiary, Hawaiian. Principally alloperations of Hawaiian either originate and/or end in the State of Hawaii. The management of suchoperations is based on a system-wide approach due to the interdependence of Hawaiian’s routestructure in its various markets. As Hawaiian offers only one significant line of business (i.e., airtransportation), management has concluded that it has only one segment. The Company’s chiefoperating decision maker allocates operational resources to maximize the Company’s consolidatedfinancial results.
Revenues from other lines of business are below the quantitative threshold for segment reporting andconsist of revenues from Hawaiian Gifts, LLC. The difference between the financial information of theCompany’s one reportable segment and financial information included in the accompanyingconsolidated statements of operations as a result of this entity is not significant.
The Company’s operating revenues by geographic region (as defined by the Department ofTransportation, DOT) are summarized below:
Year Ended December 31,
2012 2011 2010
(in thousands)
Domestic . . . . . . . . . . . . . . . . . . . . . . . . . . . $1,378,498 $1,272,196 $1,177,474Pacific . . . . . . . . . . . . . . . . . . . . . . . . . . . . . 583,855 378,263 132,619
Total operating revenue . . . . . . . . . . . . . . . . . $1,962,353 $1,650,459 $1,310,093
Hawaiian attributes operating revenue by geographic region based upon the origin and destination ofeach flight segment. Hawaiian’s tangible assets consist primarily of flight equipment, which are mobileacross geographic markets, and, therefore, have not been allocated to specific geographic regions.
13. Parent Company Only Financial Information
In accordance with Regulation S-X paragraph 210.5-04 (c), the Company is required to providecondensed financial information of Hawaiian Holdings, Inc. as a result of restrictions in Hawaiian’s
91

Hawaiian Holdings, Inc.
Notes to Consolidated Financial Statements (Continued)
13. Parent Company Only Financial Information (Continued)
debt agreements. Following is the condensed financial information of Hawaiian Holdings, Inc.,presented on a parent company only basis, for the years ended December 31, 2012, 2011 and 2010:
Condensed Statements of OperationsYears ended December 31, 2012, 2011 and 2010
Year ended December 31,
2012 2011 2010
(in thousands)
Operating expenses . . . . . . . . . . . . . . . . . . . . . . . . . . . . . . . . . . . . . $ 4,712 $ 4,467 $ 4,098
Operating loss . . . . . . . . . . . . . . . . . . . . . . . . . . . . . . . . . . . . . . . (4,712) (4,467) (4,098)Nonoperating income (loss) . . . . . . . . . . . . . . . . . . . . . . . . . . . . . . . (8,216) (6,081) 98
Loss before undistributed earnings of Hawaiian Airlines, Inc. . . . . . (12,928) (10,548) (4,000)Undistributed net income of Hawaiian Airlines, Inc. and subsidiaries . 66,165 7,899 114,255
Net income (loss) . . . . . . . . . . . . . . . . . . . . . . . . . . . . . . . . . . . . . $ 53,237 $ (2,649) $110,255
Condensed Balance SheetsDecember 31, 2012 and 2011
December 31,
2012 2011
(in thousands)
ASSETSCurrent Assets:
Cash . . . . . . . . . . . . . . . . . . . . . . . . . . . . . . . . . . . . . . . . . . . . . . . . . . . . . . $ 83,626 $ 97,219Other . . . . . . . . . . . . . . . . . . . . . . . . . . . . . . . . . . . . . . . . . . . . . . . . . . . . . 32 48
Total . . . . . . . . . . . . . . . . . . . . . . . . . . . . . . . . . . . . . . . . . . . . . . . . . . . . 83,658 97,267
Investment in Hawaiian Airlines, Inc., and subsidiaries . . . . . . . . . . . . . . . . . . 242,290 149,406Due from Hawaiian Airlines, Inc . . . . . . . . . . . . . . . . . . . . . . . . . . . . . . . . . . 14,936 44,383Deferred tax assets, net . . . . . . . . . . . . . . . . . . . . . . . . . . . . . . . . . . . . . . . . 302 302Other noncurrent assets . . . . . . . . . . . . . . . . . . . . . . . . . . . . . . . . . . . . . . . . 1,695 2,211
Total assets . . . . . . . . . . . . . . . . . . . . . . . . . . . . . . . . . . . . . . . . . . . . . . . . . . . $342,881 $293,569
LIABILITIES AND SHAREHOLDERS’ EQUITYCurrent Liabilities:
Accounts payable . . . . . . . . . . . . . . . . . . . . . . . . . . . . . . . . . . . . . . . . . . . . . $ 292 $ 202Other . . . . . . . . . . . . . . . . . . . . . . . . . . . . . . . . . . . . . . . . . . . . . . . . . . . . . 1,310 1,295
Total . . . . . . . . . . . . . . . . . . . . . . . . . . . . . . . . . . . . . . . . . . . . . . . . . . . . 1,602 1,497
Long-term debt . . . . . . . . . . . . . . . . . . . . . . . . . . . . . . . . . . . . . . . . . . . . . . 72,677 69,196Shareholders’ equity . . . . . . . . . . . . . . . . . . . . . . . . . . . . . . . . . . . . . . . . . . . 268,602 222,876
Total liabilities and shareholders’ equity . . . . . . . . . . . . . . . . . . . . . . . . . . . . . . $342,881 $293,569
92

Hawaiian Holdings, Inc.
Notes to Consolidated Financial Statements (Continued)
13. Parent Company Only Financial Information (Continued)
Condensed Statements of Cash FlowsYears ended December 31, 2012, 2011 and 2010
Year ended December 31,
2012 2011 2010
(in thousands)
Operating Activities:Net income (loss) . . . . . . . . . . . . . . . . . . . . . . . . . . . . . . . . . . . . . . $ 53,237 $ (2,649) $ 110,255Adjustments to reconcile net income (loss) to net cash used in
operating activities:Equity in undistributed net income of Hawaiian Airlines, Inc. and
Subsidiaries . . . . . . . . . . . . . . . . . . . . . . . . . . . . . . . . . . . . . . . (66,165) (7,899) (114,255)Other operating activities, net . . . . . . . . . . . . . . . . . . . . . . . . . . . 4,102 4,026 (48)
Net cash used in operating activities . . . . . . . . . . . . . . . . . . . . . (8,826) (6,522) (4,048)
Investing Activities:Net payments from Hawaiian Airlines . . . . . . . . . . . . . . . . . . . . . 28,745 8,244 4,507
Net cash provided by investing activities . . . . . . . . . . . . . . . . . . 28,745 8,244 4,507
Financing Activities:Long-term borrowings . . . . . . . . . . . . . . . . . . . . . . . . . . . . . . . . . — 86,250 —Debt issuance costs . . . . . . . . . . . . . . . . . . . . . . . . . . . . . . . . . . . — (3,390) —Proceeds from exercise of stock options . . . . . . . . . . . . . . . . . . . . 1,488 226 1,477Proceeds from issuance of warrants . . . . . . . . . . . . . . . . . . . . . . . — 11,948 —Treasury stock repurchase . . . . . . . . . . . . . . . . . . . . . . . . . . . . . . — — (9,998)Purchase of call options related to convertible debt . . . . . . . . . . . . — (19,504) —Investment in Subsidiary . . . . . . . . . . . . . . . . . . . . . . . . . . . . . . . (35,000) — —
Net cash (used in) provided by financing activities . . . . . . . . . . . (33,512) 75,530 (8,521)
Net (decrease) increase in cash . . . . . . . . . . . . . . . . . . . . . . . . . . . . (13,593) 77,252 (8,062)
Cash—Beginning of Period . . . . . . . . . . . . . . . . . . . . . . . . . . . . . . . 97,219 19,967 28,029
Cash—End of period . . . . . . . . . . . . . . . . . . . . . . . . . . . . . . . . . . . $ 83,626 $ 97,219 $ 19,967
Long-Term Debt
During 2011, the Company issued $86.25 million principal amount of convertible senior notes (theConvertible Notes) due March 15, 2016. In connection with the issuance of the Convertible Notes, theCompany entered into separate convertible note hedge transactions (the Convertible Note Hedges) andseparate warrant transactions (the Warrants) with certain financial investors to reduce the potentialdilution of the Company’s common stock and to offset potential payments by the Company to holdersof the Convertible Notes in excess of the principal of the Convertible Notes upon conversion. TheConvertible Note Hedges and Warrants are separate transactions, entered into by the Company withthe financial institutions, and are not part of the Convertible Notes.
For further discussion on the Convertible Notes and Convertible Noted Hedges and Warrants, seeNote 6 to the consolidated financial statements.
93

Hawaiian Holdings, Inc.
Notes to Consolidated Financial Statements (Continued)
14. Supplemental Financial Information (unaudited)
Unaudited Quarterly Financial Information:
Supplementary Financial Information
First Second Third FourthQuarter Quarter Quarter Quarter
(in thousands)
2012:Operating revenue . . . . . . . . . . . . . . . . . . . . . . . . . . . . $435,494 $484,551 $549,322 $492,986Operating income . . . . . . . . . . . . . . . . . . . . . . . . . . . . 12,900 29,328 74,933 12,237Nonoperating loss . . . . . . . . . . . . . . . . . . . . . . . . . . . . (1,041) (23,019) (1,130) (18,422)Net income (loss) . . . . . . . . . . . . . . . . . . . . . . . . . . . . 7,258 3,904 45,483 (3,408)Net income (loss) per common stock share:
Basic . . . . . . . . . . . . . . . . . . . . . . . . . . . . . . . . . . . . 0.14 0.08 0.88 (0.07)Diluted . . . . . . . . . . . . . . . . . . . . . . . . . . . . . . . . . . 0.14 0.07 0.86 (0.07)
2011:Operating revenue . . . . . . . . . . . . . . . . . . . . . . . . . . . . $365,609 $395,015 $455,859 $433,975Operating income (loss) . . . . . . . . . . . . . . . . . . . . . . . . (4,945) (70,181) 60,947 34,462Nonoperating income (loss) . . . . . . . . . . . . . . . . . . . . . 6,431 (12,392) (13,621) (1,783)Net income (loss) . . . . . . . . . . . . . . . . . . . . . . . . . . . . 855 (50,042) 25,617 20,921Net income (loss) per common stock share:
Basic . . . . . . . . . . . . . . . . . . . . . . . . . . . . . . . . . . . . 0.02 (0.99) 0.50 0.41Diluted . . . . . . . . . . . . . . . . . . . . . . . . . . . . . . . . . . 0.02 (0.99) 0.50 0.40
In the fourth quarter of 2012, the Company recorded a net frequent flyer pre-tax adjustment of$7.3 million to correct an error in the Company’s accounting for its sale of mileage credits tocompanies participating in the Company’s frequent flyer program that are deferred and recognized aspassenger revenue. The correction resulted in a change in the deferral period from 19 to 22 months.The error primarily relates to prior periods and the impact of the error was not material to any priorperiod or the 2012 fiscal year.
In the second quarter of 2011, the Company entered into a purchase agreement with the lessor for thepurchase of fifteen Boeing 717-200 aircraft. The excess of the purchase price paid over the fair value ofthe aircraft, which was $70.0 million, was recognized as a cost of terminating the leases and recordedon the Consolidated Statements of Operations.
The sum of the quarterly earnings per share amounts does not equal the annual amount reported sinceper share amounts are computed independently for each quarter and for the full year based onrespective weighted-average common shares outstanding and other dilutive potential common shares.
94

ITEM 9. CHANGES IN AND DISAGREEMENTS WITH ACCOUNTANTS ON ACCOUNTING ANDFINANCIAL DISCLOSURE.
None.
ITEM 9A. CONTROLS AND PROCEDURES.
Management’s Evaluation of Disclosure Controls and Procedures
Our management, including our Chief Executive Officer (CEO) and Chief Financial Officer (CFO),performed an evaluation of our disclosure controls and procedures (as defined in Rules 13a-15(e) and15d-15(e) under the Exchange Act). Based on that evaluation, our management, including our CEOand CFO, concluded that our disclosure controls and procedures were effective as of December 31,2012, and provide reasonable assurance that the information required to be disclosed by the Companyin reports it files under the Securities Exchange Act of 1934, as amended (the Exchange Act), isrecorded, processed, summarized and reported within the time periods specified in the rules and formsof the SEC, and is accumulated and communicated to our management, including our CEO and CFO,to allow timely decisions regarding required disclosure.
Management’s Report on Internal Control over Financial Reporting
Our management is responsible for establishing and maintaining effective internal control over financialreporting as defined in Rules 13a-15(f) and 15d-15(f) under the Exchange Act. Our internal controlover financial reporting is designed to provide reasonable assurance regarding the reliability of financialreporting and the preparation of financial statements for external purposes in accordance with U.S.generally accepted accounting principles.
Under the supervision and with the participation of our management, including our CEO and CFO, anassessment of the effectiveness of our internal control over financial reporting as of December 31, 2012was conducted. In making this assessment, management used the criteria set forth by the Committee ofSponsoring Organizations of the Treadway Commission (COSO) in Internal Control—IntegratedFramework. Based on their assessment, we concluded that, as of December 31, 2012, the Company’sinternal control over financial reporting was effective to provide reasonable assurance regarding thereliability of financial reporting and the preparation of financial statements for external purposes inaccordance with U.S. generally accepted accounting principles. We reviewed the results ofmanagement’s assessment with the Audit Committee of our Board of Directors.
The effectiveness of our internal control over financial reporting as of December 31, 2012, has beenaudited by Ernst & Young LLP, the independent registered public accounting firm who also has auditedthe Company’s consolidated financial statements included in this Annual Report on Form 10-K.Ernst & Young’s report on the Company’s internal control over financial reporting appears below.
Changes in Internal Control over Financial Reporting
There were no changes in our internal control over financial reporting during the quarter endedDecember 31, 2012 that materially affected, or are reasonably likely to materially affect, our internalcontrol over financial reporting.
Inherent Limitations on Effectiveness of Controls
Our management, including our CEO and CFO, does not expect that our disclosure controls or ourinternal control over financial reporting will prevent or detect all error and all fraud. A control system,no matter how well designed and operated, can provide only reasonable, not absolute, assurance thatthe control system’s objectives will be met. The design of a control system must reflect the fact thatthere are resource constraints, and the benefits of controls must be considered relative to their costs.
95

Further, because of the inherent limitations in all control systems, no evaluation of controls can provideabsolute assurance that misstatements due to error or fraud will not occur or that all control issues andinstances of fraud, if any, have been detected. These inherent limitations include the realities thatjudgments in decision-making can be faulty and that breakdowns can occur because of simple error ormistake. Controls can also be circumvented by the individual acts of some persons, by collusion of twoor more people, or by management override of the controls. The design of any system of controls isbased in part on certain assumptions about the likelihood of future events, and there can be noassurance that any design will succeed in achieving its stated goals under all potential future conditions.Projections of any evaluation of controls effectiveness to future periods are subject to risks. Over time,controls may become inadequate because of changes in conditions or deterioration in the degree ofcompliance with policies or procedures.
96

Report of Independent Registered Public Accounting Firm
The Board of Directors and StockholdersHawaiian Holdings, Inc.
We have audited Hawaiian Holdings, Inc.’s internal control over financial reporting as of December 31,2012, based on criteria established in Internal Control—Integrated Framework issued by the Committeeof Sponsoring Organizations of the Treadway Commission (the COSO criteria). Hawaiian Holdings,Inc.’s management is responsible for maintaining effective internal control over financial reporting, andfor its assessment of the effectiveness of internal control over financial reporting included in theaccompanying Management’s Report on Internal Control over Financial Reporting. Our responsibility isto express an opinion on the company’s internal control over financial reporting based on our audit.
We conducted our audit in accordance with the standards of the Public Company Accounting OversightBoard (United States). Those standards require that we plan and perform the audit to obtainreasonable assurance about whether effective internal control over financial reporting was maintainedin all material respects. Our audit included obtaining an understanding of internal control overfinancial reporting, assessing the risk that a material weakness exists, testing and evaluating the designand operating effectiveness of internal control based on the assessed risk, and performing such otherprocedures as we considered necessary in the circumstances. We believe that our audit provides areasonable basis for our opinion.
A company’s internal control over financial reporting is a process designed to provide reasonableassurance regarding the reliability of financial reporting and the preparation of financial statements forexternal purposes in accordance with generally accepted accounting principles. A company’s internalcontrol over financial reporting includes those policies and procedures that (1) pertain to themaintenance of records that, in reasonable detail, accurately and fairly reflect the transactions anddispositions of the assets of the company; (2) provide reasonable assurance that transactions arerecorded as necessary to permit preparation of financial statements in accordance with generallyaccepted accounting principles, and that receipts and expenditures of the company are being made onlyin accordance with authorizations of management and directors of the company; and (3) providereasonable assurance regarding prevention or timely detection of unauthorized acquisition, use ordisposition of the company’s assets that could have a material effect on the financial statements.
Because of its inherent limitations, internal control over financial reporting may not prevent or detectmisstatements. Also, projections of any evaluation of effectiveness to future periods are subject to therisk that controls may become inadequate because of changes in conditions, or that the degree ofcompliance with the policies or procedures may deteriorate.
In our opinion, Hawaiian Holdings, Inc. maintained, in all material respects, effective internal controlover financial reporting as of December 31, 2012, based on the COSO criteria.
We also have audited, in accordance with the standards of the Public Company Accounting OversightBoard (United States), the consolidated balance sheets of Hawaiian Holdings, Inc. as of December 31,2012 and 2011 and the related consolidated statements of operations, comprehensive income (loss),shareholders’ equity, and cash flows for each of the three years in the period ended December 31, 2012of Hawaiian Holdings, Inc. and our report dated February 8, 2013 expressed an unqualified opinionthereon.
/s/ ERNST & YOUNG LLP
Honolulu, HawaiiFebruary 8, 2013
97
ITEM 9B. OTHER INFORMATION.
None.
PART III
ITEM 10. DIRECTORS, EXECUTIVE OFFICERS AND CORPORATE GOVERNANCE.
The information required by this item is incorporated herein by reference from our definitive proxystatement relating to our 2013 Annual Meeting of Stockholders.
ITEM 11. EXECUTIVE COMPENSATION.
The information required by this item is incorporated herein by reference from our definitive proxystatement relating to our 2013 Annual Meeting of Stockholders.
ITEM 12. SECURITY OWNERSHIP OF CERTAIN BENEFICIAL OWNERS AND MANAGEMENTAND RELATED STOCKHOLDER MATTERS.
The information required by this item is incorporated herein by reference from our definitive proxystatement relating to our 2013 Annual Meeting of Stockholders.
ITEM 13. CERTAIN RELATIONSHIPS AND RELATED TRANSACTIONS, AND DIRECTORINDEPENDENCE.
The information required by this item is incorporated herein by reference from our definitive proxystatement relating to our 2013 Annual Meeting of Stockholders.
ITEM 14. PRINCIPAL ACCOUNTANT FEES AND SERVICES.
The information required by this item is incorporated herein by reference from our definitive proxystatement relating to our 2013 Annual Meeting of Stockholders.
PART IV
ITEM 15. EXHIBITS, FINANCIAL STATEMENT SCHEDULES.
(a) Financial Statements and Financial Statement Schedules:
(1) Financial Statements of Hawaiian Holdings, Inc.
i. Report of Ernst & Young LLP, Independent Registered Public Accounting Firm.
ii. Consolidated Statements of Operations for the Years ended December 31, 2012, 2011 and2010.
iii. Consolidated Statements of Comprehensive Income (Loss), December 31, 2012, 2011 and2010.
iv. Consolidated Balance Sheets, December 31, 2012 and 2011.
v. Consolidated Statements of Shareholders’ Equity Years ended December 31, 2012, 2011and 2010.
vi. Consolidated Statements of Cash Flows for the Years ended December 31, 2012, 2011and 2010.
vii. Notes to Consolidated Financial Statements.
98
(2) Schedule of Valuation and Qualifying Accounts of Hawaiian Holdings, Inc.
The information required by Schedule I, ‘‘Condensed Financial Information of Registrant’’ has beenprovided in Note 14 to the consolidated financial statements. All other schedules have been omittedbecause they are not required.
(b) Exhibits:
2.1 Third Amended Joint Plan of Reorganization of Joshua Gotbaum, as Chapter 11 Trusteefor Hawaiian Airlines, Inc., the Official Committee of Unsecured Creditors, HHIC, Inc.,Hawaiian Holdings, Inc., and RC Aviation, LLC, dated as of March 11, 2005 (filed asExhibit 2.01 to the Form 8-K filed by Hawaiian Holdings, Inc. on June 7, 2005).*
2.2 Order Confirming Third Amended Joint Plan of Joshua Gotbaum, as Chapter 11 Trusteefor Hawaiian Airlines, The Official Committee of Unsecured Creditors, HHIC, Inc., theCompany and RC Aviation, dated as of March 11, 2005, as amended (filed as Exhibit 2.02to the Form 8-K filed by Hawaiian Holdings, Inc. on June 7, 2005).*
3.1 Amended and Restated Certificate of Incorporation of Hawaiian Holdings, Inc. (filed asExhibit 3.1 to the Form S-1, File No. 333-129503, filed by Hawaiian Holdings, Inc. onNovember 7, 2005).*
4.1 Indenture, dated March 23, 2011, between Hawaiian Holdings, Inc. and U.S. Bank NationalAssociation, as trustee (filed as Exhibit 4.1 to the Form 8-K filed by HawaiianHoldings, Inc. on March 23, 2011).*
4.2 Supplemental Indenture, dated March 23, 2011, between Hawaiian Holdings, Inc. and U.S.Bank National Association, as trustee (filed as Exhibit 4.2 to the Form 8-K filed byHawaiian Holdings, Inc. on March 23, 2011).*
4.3 Form of 5.00% Senior Convertible Note due 2016 (filed as Exhibit 4.3 to the Form 8-Kfiled by Hawaiian Holdings, Inc. on March 23, 2011 and incorporated by reference toExhibit 4.2 thereto).*
10.1 Amendment No. 2 to Lease Agreement N475HA, dated September 30, 2004, between WellsFargo Bank Northwest, National Association and Hawaiian Airlines, Inc. (filed asExhibit 10.2 to the Form 10-Q/A filed by Hawaiian Holdings, Inc. on October 14, 2005).Hawaiian Airlines, Inc. also entered into Amendment No. 2 to Lease Agreement N476HA,dated September 30, 2004, Amendment No. 2 to Lease Agreement N477HA, datedSeptember 30, 2004, Amendment No. 2 to Lease Agreement N478HA, dated September 30,2004, Amendment No. 2 to Lease Agreement N479HA, dated September 30, 2004,Amendment No. 2 to Lease Agreement N480HA, dated September 30, 2004, AmendmentNo. 2 to Lease Agreement N481HA, dated September 30, 2004, Amendment No. 2 toLease Agreement N484HA, dated September 30, 2004, Amendment No. 2 to LeaseAgreement N485HA, dated September 30, 2004, Amendment No. 2 to Lease AgreementN486HA, dated September 30, 2004, and Amendment No. 2 to Lease Agreement N487HA,dated September 30, 2004, between Wells Fargo Bank, Northwest, National Association andHawaiian Airlines, Inc. The amended leases are substantially identical to Amendment No. 2to Lease Agreement N475HA, except with respect to the aircraft information and deliverydates. Pursuant to Regulation S-K Item 601, Instruction 2, these amendments were notfiled.*
99
10.2 Lease Agreement, dated as of September 20, 2001, between AWMS I and HawaiianAirlines, Inc. for one Boeing Model 767-33AER aircraft, Manufacturer’s SerialNumber 33421 (filed as Exhibit 1.5 to the Form 10-Q filed by Hawaiian Airlines, Inc. onNovember 14, 2001, in redacted form since confidential treatment has been granted forcertain provisions thereof pursuant to Rule 24b-2 of the Securities Exchange Act of 1934, asamended). Hawaiian Airlines, Inc. has also entered into a Lease Agreement, dated as ofSeptember 20, 2001, between AWMS I and Hawaiian Airlines, Inc. for one Boeing Model767-33AER aircraft, Manufacturer’s Serial Number 33422, a Lease Agreement, dated as ofSeptember 20, 2001, between AWMS I and Hawaiian Airlines, Inc. for one Boeing Model767-33AER aircraft, Manufacturer’s Serial Number 33423, and a Lease Agreement, datedas of September 20, 2001, between AWMS I and Hawaiian Airlines, Inc. for one BoeingModel 767-33AER aircraft, Manufacturer’s Serial Number 33424, which lease agreementsare substantially identical to Lease Agreement 33421, except with respect to aircraftinformation, delivery date and certain other information as to which Hawaiian Airlines, Inc.has been granted confidential treatment, and pursuant to Regulation S-K Item 601,Instruction 2, these lease agreements were not filed).*‡
10.3 Amendment No. 1 to Lease Agreement, dated November 6, 2002, by and between AWMS Iand Hawaiian Airlines, Inc., Manufacturer’s Serial Number 33421 (filed as Exhibit 10.4 tothe Form 10-Q/A filed by Hawaiian Holdings, Inc. on October 14, 2005). HawaiianAirlines, Inc. has also entered into Amendment No. 1 to Lease Agreement, dated as ofNovember 6, 2002, Manufacturer’s Serial Number 33422, Amendment No. 1 to LeaseAgreement, dated as of November 6, 2002, Manufacturer’s Serial Number 33423, andAmendment No. 1 to Lease Agreement, dated as of November 6, 2002, Manufacturer’sSerial Number 33424, which amended lease agreements are substantially identical toAmendment No. 1 to Lease Agreement 33421, except with respect to aircraft informationand delivery date, and pursuant to Regulation S-K Item 601, Instruction 2, these amendedlease agreements were not filed.*
10.4 Amendment No. 2 to Lease Agreement, dated as of May 7, 2003, by and between AWMS Iand Hawaiian Airlines, Inc., Manufacturer’s Serial Number 33421 (filed as Exhibit 10.5 tothe Form 10-Q/A filed by Hawaiian Holdings, Inc. on December 22, 2005 in redacted formsince confidential treatment has been granted for certain provision thereof pursuant toRule 24b-2 of the Securities Exchange Act of 1934, as amended). Hawaiian Airlines, Inc.has also entered into Amendment No. 2 to Lease Agreement, dated as of May 7, 2003,Manufacturer’s Serial Number 33422, Amendment No. 2 to Lease Agreement, dated as ofMay 7, 2003, Manufacturer’s Serial Number 33423, and Amendment No. 2 to LeaseAgreement, dated as of May 7, 2003, Manufacturer’s Serial Number 33424, which amendedlease agreements are substantially identical to Amendment No. 2 to Lease Agreement33421, except with respect to aircraft information, delivery date and certain otherinformation as to which the Company has been granted confidential treatment, andpursuant to Regulation S-K Item 601, Instruction 2, these amended lease agreements werenot filed.*‡
100
10.5 Amendment No. 3 to Lease Agreement, dated as of December 15, 2006, by and betweenAWMS I and Hawaiian Airlines, Inc., Manufacturer’s Serial Number 33421 (filed asExhibit 10.9 to the Form 10-K filed by Hawaiian Holdings, Inc. on March 16, 2007).Hawaiian Airlines, Inc. has also entered into Amendment No. 3 to Lease Agreement, datedas of December 15, 2006, Manufacturer’s Serial Number 33422, Amendment No. 3 to LeaseAgreement, dated as of December 15, 2006, Manufacturer’s Serial Number 33423, andAmendment No. 3 to Lease Agreement, dated as of December 15, 2006, Manufacturer’sSerial Number 33424, which amended lease agreements are substantially identical toAmendment No. 3 to Lease Agreement 33421, and pursuant to Regulation S-K Item 601,Instruction 2, these amended lease agreements were not filed.*
10.6 Lease Agreement, dated as of July 16, 2001, between International Lease FinanceCorporation and Hawaiian Airlines, Inc. for one Boeing Model 767-33AER aircraft,Manufacturer’s Serial Number 24257 (filed as Exhibit 1.4 to the Form 10-Q filed byHawaiian Airlines, Inc. on November 14, 2001, in redacted form since confidentialtreatment has been granted for certain provisions thereof pursuant to Rule 24b-2 of theSecurities Exchange Act of 1934, as amended). Hawaiian Airlines, Inc. has also entered intoa Lease Agreement, dated as of July 16, 2001, between International Lease FinanceCorporation and Hawaiian Airlines, Inc. for one Boeing Model 767-33AER aircraft,Manufacturer’s Serial Number 24258, a Lease Agreement, dated as of July 16, 2001,between International Lease Finance Corporation and Hawaiian Airlines, Inc. for oneBoeing Model 767-33AER aircraft, Manufacturer’s Serial Number 25531, and a LeaseAgreement, dated as of July 16, 2001, between International Lease Finance Corporationand Hawaiian Airlines, Inc. for one Boeing Model 767-33AER aircraft, Manufacturer’sSerial Number 24259, which lease agreements are substantially identical to LeaseAgreement 24257, except with respect to aircraft information, delivery date and certainother information as to which Hawaiian Airlines, Inc. has been granted confidentialtreatment, and pursuant to Regulation S-K Item 601, Instruction 2, these lease agreementswere not filed.*‡
10.7 Amendment No. 1 to Lease Agreement, dated as of August 2003, between InternationalLease Finance Corporation and Hawaiian Airlines, Inc., Manufacturer’s SerialNumber 24257 (filed as Exhibit 10.6 to the Form 10-Q/A filed by Hawaiian Holdings, Inc.on December 22, 2005 in redacted form since confidential treatment has been granted forcertain provisions thereof pursuant to Rule 24b-2 of the Securities Exchange Act of 1934, asamended). Hawaiian Airlines, Inc. has also entered into Amendment No. 1 to LeaseAgreement, dated as of August 2003, Manufacturer’s Serial Number 24258, AmendmentNo. 1 to Lease Agreement, dated as of August 2003, Manufacturer’s Serial Number 25531,and Amendment No. 1 to Lease Agreement, dated as of August 2003, Manufacturer’s SerialNumber 24259, which amended lease agreements are substantially identical to AmendmentNo. 1 to Lease Agreement 24257, except with respect to aircraft information, delivery dateand certain other information as to which the Company has been granted confidentialtreatment, and pursuant to Regulation S-K Item 601, Instruction 2, these amended leaseagreements were not filed.*‡
101
10.8 Lease Agreement, dated as of September 20, 2001, between BCC Equipment LeasingCorporation and Hawaiian Airlines, Inc. for one Boeing Model 767-33AER aircraft,Manufacturer’s Serial Number 33426 (filed as Exhibit 1.6 to the Form 10-Q filed byHawaiian Airlines, Inc. on November 14, 2001, in redacted form since confidentialtreatment has been granted for certain provisions thereof pursuant to Rule 24b-2 of theSecurities Exchange Act of 1934, as amended). Hawaiian Airlines, Inc. has also entered intoa Lease Agreement, dated as of September 20, 2001, between BCC Equipment LeasingCorporation and Hawaiian Airlines, Inc. for one Boeing Model 767-33AER aircraft,Manufacturer’s Serial Number 33427, a Lease Agreement, dated as of September 20, 2001,between BCC Equipment Leasing Corporation and Hawaiian Airlines, Inc. for one BoeingModel 767-33AER aircraft, Manufacturer’s Serial Number 33428, and a Lease Agreement,dated as of September 20, 2001, between BCC Equipment Leasing Corporation andHawaiian Airlines, Inc. for one Boeing Model 767-33AER aircraft, Manufacturer’s SerialNumber 33429, which lease agreements are substantially identical to Lease Agreement33426, except with respect to aircraft information, delivery date and certain otherinformation as to which Hawaiian Airlines, Inc. has been granted confidential treatment,and pursuant to Regulation S-K Item 601, Instruction 2, these lease agreements were notfiled.*‡
10.9 Amendment No. 1 to Lease Agreement, dated as of October 24, 2002, by and betweenBCC Equipment Leasing Corporation and Hawaiian Airlines, Inc., Manufacturer’s SerialNumber 33466 (originally 33426) (filed as Exhibit 10.7 to the Form 10-Q/A filed byHawaiian Holdings, Inc. on October 14, 2005). Hawaiian Airlines, Inc. has also entered intoAmendment No. 1 to Lease Agreement, dated as of October 24, 2002, Manufacturer’sSerial Number 33427 (originally 33467) and Amendment No. 1 to Lease Agreement, datedas of October 24, 2002, Manufacturer’s Serial Number 33428 (originally 33468), whichamended lease agreements are substantially identical to Amendment No. 1 to LeaseAgreement 33466 (originally 33426), except with respect to aircraft information and deliverydates, and pursuant to Regulation S-K Item 601, Instruction 2, these amended leaseagreements were not filed.*
10.10 Amendment No. 2 to Lease Agreement, dated as of September 30, 2004, by and betweenBCC Equipment Leasing Corporation and Hawaiian Airlines, Inc., Manufacturer’s SerialNumber 33466 (originally 33426) (filed as Exhibit 10.8 to the Form 10-Q/A filed byHawaiian Holdings, Inc. on December 22, 2005 in redacted form since confidentialtreatment has been granted for certain provisions thereof pursuant to Rule 24b-2 of theSecurities Exchange Act of 1934, as amended). Hawaiian Airlines, Inc. has also entered intoAmendment No. 2 to Lease Agreement, dated as of September 30, 2004, Manufacturer’sSerial Number 33427 (originally 33467) and Amendment No. 2 to Lease Agreement, datedas of September 30, 2004, Manufacturer’s Serial Number 33428 (originally 33468), whichamended lease agreements are substantially identical to Amendment No. 2 to LeaseAgreement 33466, except with respect to aircraft information, delivery dates and certainother information as to which the Company has been granted confidential treatment, andpursuant to Regulation S-K Item 601, Instruction 2, these amended lease agreements werenot filed.*
102

10.11 Amendment No. 3 to Lease Agreement, dated as of September 30, 2004, by and betweenBCC Equipment Leasing Corporation and Hawaiian Airlines, Inc., Manufacturer’s SerialNumber 33466 (originally 33426) (filed as Exhibit 10.9 to the Form 10-Q/A filed byHawaiian Holdings, Inc. on October 14, 2005). Hawaiian Airlines, Inc. has also entered intoAmendment No. 3 to Lease Agreement, dated as of September 30, 2004, Manufacturer’sSerial Number 33427 (originally 33467) and Amendment No. 3 to Lease Agreement, datedas of September 30, 2004, Manufacturer’s Serial Number 33428 (originally 33468), whichamended lease agreements are substantially identical to Amendment No. 3 to LeaseAgreement 33466 (originally 33426), except with respect to aircraft information and deliverydate, and pursuant to Regulation S-K Item 601, Instruction 2, these amended leaseagreements were not filed.*
10.12 Form of Hawaiian Holdings, Inc. Stock Option Agreement for certain employees andexecutive officers (filed as Exhibit 10.14 to the Form 10-K filed by Hawaiian Holdings, Inc.on February 25, 2009).*+
10.13 Form of Hawaiian Holdings, Inc. Restricted Stock Agreement for certain employees andexecutive officers (filed as Exhibit 10.15 to the Form 10-K filed by Hawaiian Holdings, Inc.on February 25, 2009).*+
10.13.1 Form of Hawaiian Holdings, Inc. Restricted Stock Unit Award Agreement for certainemployees and executive officers (filed as Exhibit 10.15.2 to the Form 10-K filed byHawaiian Holdings, Inc. on February 11, 2011).*+
10.13.2 Form of Hawaiian Holdings, Inc. Performance-Based Restricted Stock Unit AwardAgreement for certain employees and executive officers (filed as Exhibit 10.15.3 to theForm 10-K filed by Hawaiian Holdings, Inc. on February 11, 2011).*+
10.14 Form of Hawaiian Holdings, Inc. Deferred Stock Unit Agreement for certain employeesand executive officers (filed as Exhibit 10.16 to the Form 10-K filed by HawaiianHoldings, Inc. on February 25, 2009).*+
10.15 Form of Hawaiian Holdings, Inc. Award Agreement for directors (filed as Exhibit 10.17 tothe Form 10-K filed by Hawaiian Holdings, Inc. on February 25, 2009).*+
10.16 Hawaiian Holdings, Inc. 2005 Stock Incentive Plan (filed as Exhibit 10.1 to the Form 8-Kfiled by Hawaiian Holdings, Inc. on July 14, 2005).*+
10.17 Hawaiian Holdings, Inc. 2006 Management Incentive Plan (filed as Exhibit 10.1 to theForm 8-K filed by Hawaiian Holdings, Inc. on June 6, 2006.*+
10.18 Employment Agreement, dated as of May 25, 2010, by and between Mark B. Dunkerleyand each of Hawaiian Holdings, Inc. and its wholly-owned subsidiary Hawaiian Airlines, Inc.(filed as Exhibit 10.1 to the Form 8-K filed by Hawaiian Holdings, Inc. on June 1, 2010).*+
10.18.1 Amended and Restated Mark B. Dunkerley Employment Agreement, dated as ofNovember 15, 2012, by and between Mark B. Dunkerley and each of HawaiianHoldings, Inc. and its wholly-owned subsidiary Hawaiian Airlines, Inc. (filed as Exhibit 10.1to the Form 8-K filed by Hawaiian Holdings, Inc. on November 21, 2012).*+
10.18.2 Type A Restricted Stock Award Agreement, dated as of May 25, 2010, by and betweenMark B. Dunkerley and Hawaiian Holdings, Inc. (filed as Exhibit 10.2 to the Form 8-K filedby Hawaiian Holdings, Inc. on June 1, 2010).*+
10.18.3 Type A Restricted Stock Unit Award Agreement, dated as of November 15, 2012, by andbetween Mark B. Dunkerley and Hawaiian Holdings, Inc. (filed as Exhibit 10.2 to theForm 8-K filed by Hawaiian Holdings, Inc. on November 21, 2012).*+
103

10.18.4 Type B Restricted Stock Award Agreement, dated as of May 25, 2010, by and betweenMark B. Dunkerley and Hawaiian Holdings, Inc. (filed as Exhibit 10.3 to the Form 8-K filedby Hawaiian Holdings, Inc. on June 1, 2010).*+
10.18.5 Type B Restricted Stock Unit Award Agreement, dated as of November 15, 2012, by andbetween Mark B. Dunkerley and Hawaiian Holdings, Inc. (filed as Exhibit 10.3 to theForm 8-K filed by Hawaiian Holdings, Inc. on November 21, 2012).*+
10.19 Employment Agreement, dated as of November 18, 2005, between Hawaiian Airlines, Inc.and Peter R. Ingram (filed as Exhibit 10.24 to the Form 10-K filed by HawaiianHoldings, Inc. on March 23, 2006).*+
10.19.1 First Amendment to Employment Agreement, dated as of November 2008, by and betweenPeter R. Ingram and Hawaiian Airlines, Inc. (filed as Exhibit 10.23 to the Form 10-K filedby Hawaiian Holdings, Inc. on February 26, 2009).*+
10.19.2 Second Amendment to Employment Agreement, dated as of April 6, 2009, by and betweenPeter R. Ingram and Hawaiian Airlines, Inc. (filed as Exhibit 10.1 to the Form 10-Q filedby Hawaiian Holdings, Inc. on April 30, 2009).*+
10.20 Employment Agreement, dated as of July 11, 2005, between Hawaiian Airlines, Inc. andBarbara Falvey (filed as Exhibit 10.1 to the Form 10-Q filed by Hawaiian Holdings, Inc. onMay 9, 2007).*+
10.20.1 First Amendment to Employment Agreement, dated as of April 6, 2009, between HawaiianAirlines, Inc. and Barbara Falvey (filed as Exhibit 10.2 to the Form 10-Q filed by HawaiianHoldings, Inc. on April 30, 2009).*+
10.21 Form of Hawaiian Holdings, Inc. Indemnification Agreement for directors and executiveofficers (filed as Exhibit 10.25 to the Form 10-K filed by Hawaiian Holdings, Inc. onFebruary 2, 2011).*+
10.22 Form of Executive Severance Agreement entered into with each of Scott E. Topping(November 12, 2012), Ronald Anderson-Lehman (November 7, 2012), Barbara D. Falvey(November 7, 2012), Charles R. Nardello (November 7, 2012), Glenn G. Taniguchi(November 19, 2012) and Hoyt H. Zia (November 7, 2012) (filed as Exhibit 10.1 to theForm 10-Q filed by Hawaiian Holdings, Inc. on October 25, 2012).*+
10.23 Amended and Restated Credit Agreement, dated as of December 10, 2010, by and amongHawaiian Holdings, Inc., Hawaiian Airlines, Inc., each of the lenders party thereto (the‘‘Lenders’’) and Wells Fargo Capital Finance, Inc., as agent for the Lenders (filed asExhibit 10.26 to the Form 10-K filed by Hawaiian Holdings, Inc. on February 11, 2011 inredacted form since confidential treatment has been granted for certain provisions thereofpursuant to Rule 24b-2 of the Securities Exchange Act of 1934, as amended).*‡
10.23.1 Amendment Number Two to Amended and Restated Credit Agreement, dated as ofMarch 16, 2011, entered into by and among Hawaiian Holdings, Inc., HawaiianAirlines, Inc., each of the lenders party thereto (‘‘the Lenders’’) and Wells Fargo CapitalFinance, Inc., as agent for the Lenders (filed as Exhibit 10.1 to the Form 8-K filed byHawaiian Holdings, Inc. on March 17, 2011).*
10.23.2 Amendment Number Three to Amended and Restated Credit Agreement, Waiver andExtension, dated as of June 28, 2011, entered into by and among Hawaiian Holdings, Inc.,Hawaiian Airlines, Inc., each of the lenders party thereto (the ‘‘Lenders’’) and Wells FargoCapital Finance, Inc., as agent for the Lenders (filed as Exhibit 10.4 to the Form 10-Q filedby Hawaiian Holdings, Inc. on July 27, 2011).*
104

10.23.3 Amendment Number Four to Amended and Restated Credit Agreement and AmendmentNumber One to Amended and Restated Security Agreement, dated as of October 13, 2011,by and among Hawaiian Holdings, Inc., Hawaiian Airlines, Inc., Airline ContractMaintenance and Equipment, Inc. and each of the lenders party thereto (the ‘‘Lenders’’)and Wells Fargo Capital Finance, Inc., as agent for the Lenders (filed as Exhibit 10.26.3 tothe Form 10-K filed by Hawaiian Holdings, Inc. on February 9, 2012).*
10.23.4 Amendment Number Five to Amended and Restated Credit Agreement and Waiver andAmendment Number Two to Amended and Restated Security Agreement, dated as ofJuly 9, 2012, by and among Hawaiian Holdings, Inc., Hawaiian Airlines, Inc., AirlineContract Maintenance and Equipment, Inc. and each of the lenders party thereto (the‘‘Lenders’’) and Wells Fargo Capital Finance, Inc., as agent for the Lenders (filed asExhibit 10.1 to the Form 10-Q filed by Hawaiian Holdings, Inc. on July 26, 2012).*
10.23.5 Amendment Number Six to Amended and Restated Credit Agreement, dated as ofJanuary 31, 2013, by and among Hawaiian Holdings, Inc., Hawaiian Airlines, Inc., each ofthe lenders party thereto (the ‘‘Lenders’’) and Wells Fargo Capital Finance, Inc., as agentfor the Lenders.
10.24 Amended and Restated General Continuing Guaranty, dated as of December 10, 2010, byHawaiian Holdings, Inc. in favor of Wells Fargo Capital Finance, Inc., in its capacity asagent for the Lender Group and the Bank Product Providers (each as defined therein)(filed as Exhibit 10.27 to the Form 10-K filed by Hawaiian Holdings, Inc. on February 2,2011 in redacted form since confidential treatment has been granted for certain provisionsthereof pursuant to Rule 24b-2 of the Securities Exchange Act of 1934, as amended).*‡
10.25 Amended and Restated Security Agreement, dated as of December 10, 2010, by and amongHawaiian Holdings, Inc., Hawaiian Airlines, Inc., those additional entities party theretofrom time to time and Wells Fargo Capital Finance, Inc., in its capacity as agent for theLender Group and the Bank Product Providers (each as defined therein) (filed asExhibit 10.28 to the Form 10-K filed by Hawaiian Holdings, Inc. on February 2, 2011 inredacted form since confidential treatment has been granted for certain provisions thereofpursuant to Rule 24b-2 of the Securities Exchange Act of 1934, as amended).*‡
10.26 Amended and Restated Engine and Spare Parts Security Agreement, dated as ofDecember 10, 2010, by and between Hawaiian Airlines, Inc. and Wells Fargo CapitalFinance, Inc., in its capacity as agent for the Lender Group and the Bank Product Providers(each as defined therein) (filed as Exhibit 10.29 to the Form 10-K filed by HawaiianHoldings, Inc. on February 2, 2011 in redacted form since confidential treatment has beengranted for certain provisions thereof pursuant to Rule 24b-2 of the Securities ExchangeAct of 1934, as amended).*‡
10.27 Consolidated, Supplemented, Amended and Restated Aircraft Security Agreement, dated asof December 10, 2010, by and between Hawaiian Airlines, Inc. and Wells Fargo CapitalFinance, Inc., in its capacity as agent for the Lender Group and the Bank Product Providers(each as defined therein) (filed as Exhibit 10.30 to the Form 10-K filed by HawaiianHoldings, Inc. on February 2, 2011 in redacted form since confidential treatment has beengranted for certain provisions thereof pursuant to Rule 24b-2 of the Securities ExchangeAct of 1934, as amended).*‡
105
10.28 Waiver, Extension, and Amendment under Credit Agreement, dated as of January 24, 2011,by and among Hawaiian Holdings, Inc., Hawaiian Airlines, Inc., each of the lenders partythereto (the ‘‘Lenders’’) and Wells Fargo Capital Finance, Inc., as agent for the Lenders(filed as Exhibit 10.31 to the Form 10-K filed by Hawaiian Holdings, Inc. on February 2,2011 in redacted form since confidential treatment has been granted for certain provisionsthereof pursuant to Rule 24b-2 of the Securities Exchange Act of 1934, as amended).*‡
10.29 Registration Rights Agreement, dated as of June 1, 2005, by and between HawaiianHoldings, Inc. and RC Aviation, LLC (filed as Exhibit 10.12 to the Form 8-K filed byHawaiian Holdings, Inc. on June 7, 2005).*
10.30 Warrant, dated November 17, 2005, granted to RC Aviation, LLC (and subsequentlydistributed to its members) to purchase the Common Stock of Hawaiian Holdings, Inc.(filed as Exhibit 10.44 to the Form 10-K filed by Hawaiian Holdings, Inc. on March 23,2006).*
10.31 Aircraft Purchase Agreement, dated as of February 16, 2006, by and among WilmingtonTrust Company, not in its individual capacity but solely as owner trustee, MarathonStructured Finance Fund, L.P., and Hawaiian Airlines, Inc., relating to the purchase of threeBoeing 767-332 aircraft bearing manufacturer’s serial numbers 23275, 23277 and 23278 andFAA registration numbers N116DL, N118DL, and N119DL (filed as Exhibit 10.45 to theForm 10-K filed by Hawaiian Holdings, Inc. on March 23, 2006).*
10.32 Aircraft Purchase and Sale Agreement, dated as of February 24, 2006, by and betweenWilmington Trust Company, not in its individual capacity but solely as owner trustee, andHawaiian Airlines, Inc., relating to the purchase of one Boeing 767-332 aircraft bearingmanufacturer’s serial number 23276 and FAA registration number N117DL (filed asExhibit 10.46 to the Form 10-K filed by Hawaiian Holdings, Inc. on March 23, 2006).*
10.33 Purchase Agreement, dated as of December 21, 2006, by and between AWMS I, a Delawarestatutory trust, and Hawaiian Airlines, Inc., relating to the purchase of one Boeing767-300ER aircraft bearing manufacturer’s serial number 28139 (filed as Exhibit 10.48 tothe Form 10-K filed by Hawaiian Holdings, Inc. on March 16, 2007). Hawaiian Airlines, Inc.also entered into purchase agreements with AWMS I relating to the purchase of two Boeing767-300ER aircraft bearing manufacturer’s serial numbers 28140 and 28141, which purchaseagreements are substantially identical to the purchase agreement related to the aircraftbearing manufacturer’s serial number 28139, except with respect to the aircraft information,and pursuant to Regulation S-K Item 601, Instruction 2, these purchase agreements werenot filed.*
10.34 Loan Agreement No. 28139, dated as of December 21, 2006, by and among HawaiianAirlines, Inc., C.I.T. Leasing Corporation and such other lenders as may from time to timebe party thereto. Hawaiian Airlines, Inc. also entered into Loan Agreement No. 28140 andLoan Agreement No. 28141 (filed as Exhibit 10.49 to the Form 10-K filed by HawaiianHoldings, Inc. on March 16, 2007), which loan agreements are substantially identical toLoan Agreement No. 28139, and pursuant to Regulation S-K Item 601, Instruction 2, theseloan agreements were not filed.*
10.35 Security Agreement No. 28139, dated as of December 21, 2006, by and between HawaiianAirlines, Inc. and C.I.T. Leasing Corporation (filed as Exhibit 10.50 to the Form 10-K filedby Hawaiian Holdings, Inc. on March 16, 2007). Hawaiian Airlines, Inc. also entered intoSecurity Agreement 28140 and Security Agreement 28141, which security agreements aresubstantially identical to Security Agreement 28139, and pursuant to Regulation S-KItem 601, Instruction 2, these security agreements were not filed.*
106

10.36 Airbus A330/A350XWB Purchase Agreement, dated as of January 31, 2008, betweenAirbus S.A.S. and Hawaiian Airlines, Inc. (filed as Exhibit 10.52 to the Form 10-K filed byHawaiian Holdings, Inc. on March 3, 2008 in redacted form since confidential treatment hasbeen granted for certain provisions thereof pursuant to Rule 24b-2 of the SecuritiesExchange Act of 1934, as amended).*‡
10.36.1 Amendment No. 1 to the Airbus A330/A350XWB Purchase Agreement dated as ofJanuary 31, 2008 between Airbus S.A.S. and Hawaiian Airlines, Inc. (filed as Exhibit 10.1 tothe Form 10-Q filed by Hawaiian Holdings, Inc. on August 6, 2008 in redacted form sinceconfidential treatment has been granted for certain provisions thereof pursuant toRule 24b-2 of the Securities Exchange Act of 1934, as amended).*‡
10.36.2 Amendment No. 2 to the Airbus A330/A350XWB Purchase Agreement dated as ofJanuary 31, 2008 between Airbus S.A.S. and Hawaiian Airlines, Inc. (filed as Exhibit 10.2 tothe Form 10-Q filed by Hawaiian Holdings, Inc. on April 27, 2010).*
10.36.3 Amendment No. 3 to the Airbus A330/A350XWB Purchase Agreement dated as ofJanuary 31, 2008 between Airbus S.A.S. and Hawaiian Airlines, Inc. (filed as Exhibit 10.3 tothe Form 10-Q filed by Hawaiian Holdings, Inc. on April 27, 2010 in redacted form sinceconfidential treatment has been granted for certain provisions thereof pursuant toRule 24b-2 of the Securities Exchange Act of 1934, as amended).*‡.
10.36.4 Amendment No. 4 to the Airbus A330/A350XWB Purchase Agreement dated as ofJanuary 31, 2008 between Airbus S.A.S. and Hawaiian Airlines, Inc. (filed as Exhibit 10.44.3to the Form 10-K filed by Hawaiian Holdings, Inc. on February 2, 2011 in redacted formsince confidential treatment has been granted for certain provisions thereof pursuant toRule 24b-2 of the Securities Exchange Act of 1934, as amended).*‡
10.36.5 Amendment No. 5 to the Airbus A330/A350XWB Purchase Agreement dated as ofJanuary 31, 2008 between Airbus S.A.S. and Hawaiian Airlines, Inc. (filed as Exhibit 10.44.4to the Form 10-K filed by Hawaiian Holdings, Inc. on February 2, 2011 in redacted formsince confidential treatment has been granted for certain provisions thereof pursuant toRule 24b-2 of the Securities Exchange Act of 1934, as amended).*‡
10.36.6 Amendment No. 6 to the Airbus A330/A350XWB Purchase Agreement dated as ofJanuary 31, 2008 between Airbus S.A.S. and Hawaiian Airlines, Inc. (filed as Exhibit 10.44.5to the Form 10-K filed by Hawaiian Holdings, Inc. on February 9, 2012 in redacted formsince confidential treatment has been granted for certain provisions thereof pursuant toRule 24b-2 of the Securities Exchange Act of 1934, as amended).*‡
10.36.7 Amendment No. 7 to the Airbus A330/A350XWB Purchase Agreement dated as ofJanuary 31, 2008 between Airbus S.A.S. and Hawaiian Airlines, Inc. (filed as Exhibit 10.2 tothe Form 10-Q filed by Hawaiian Holdings, Inc. on July 26, 2012 in redacted form sinceconfidential treatment has been granted for certain provisions thereof pursuant toRule 24b-2 of the Securities Exchange Act of 1934, as amended).*‡
10.36.8 Amended and Restated Letter Agreement No. 3 to the Airbus A330/A350XWB PurchaseAgreement dated as of January 31, 2008 between Airbus S.A.S. and Hawaiian Airlines, Inc.(filed as Exhibit 10.44.5 to the Form 10-K filed by Hawaiian Holdings, Inc. on February 2,2011 in redacted form since confidential treatment has been granted for certain provisionsthereof pursuant to Rule 24b-2 of the Securities Exchange Act of 1934, as amended).*‡
107

10.37 Lease Agreement N483HA, dated as of August 29, 2008, between Wells Fargo BankNorthwest, National Association, and Hawaiian Airlines, Inc. for one Boeing 717-200aircraft (filed as Exhibit 10.45 to the Form 10-K filed by Hawaiian Holdings, Inc. onFebruary 26, 2009 in redacted form pursuant to a request for confidential treatment forcertain provisions thereof pursuant to Rule 24b-2 of the Securities Exchange Act of 1934, asamended). Hawaiian Airlines, Inc. also entered into a Lease Agreement N489HA, datedOctober 9, 2008, with Wells Fargo Bank Northwest, National Association, a LeaseAgreement N490HA, dated December 1, 2008, with Wells Fargo Bank Northwest, NationalAssociation, and a Lease Agreement N488HA, dated December 22, 2008, with Wells FargoBank Northwest, National Association, each for one Boeing 717-200 aircraft, which leasesare substantially identical to Lease Agreement N483HA, except with respect to aircraftidentification information, delivery dates and certain other information as to whichHawaiian Airlines, Inc. has requested confidential treatment, and pursuant toRegulation S-K Item 601, Instruction 2, these lease agreements were not filed.*‡
10.38 Lease Agreement (Aircraft No. 2), dated as of October 21, 2008, between Pegasus AviationFinance Company and Hawaiian Airlines, Inc. for one Airbus A330-200 aircraft (the‘‘Pegasus Lease Agreement’’) (filed as Exhibit 10.46 to the Form 10-K filed by HawaiianHoldings, Inc. on February 26, 2009 in redacted form pursuant to a request for confidentialtreatment for certain provisions thereof pursuant to Rule 24b-2 of the Securities ExchangeAct of 1934, as amended) (Aircraft No. 2). Hawaiian Airlines, Inc. also entered into aLease Agreement (Aircraft No. 1), dated as of October 21, 2008, with Pegasus AviationFinance Company relating to the lease of a second Airbus A330-220 aircraft, the terms ofwhich are substantially identical to the terms contained in the Pegasus Lease Agreement,except with respect to aircraft identification information, delivery dates and certain otherinformation as to which Hawaiian Airlines, Inc. has requested confidential treatment, andpursuant to Regulation S-K Item 601, Instruction 2, this lease agreement was not filed.*‡
10.39 General Terms Agreement, dated as of October 27, 2008, between Rolls-Royce PLC, Rolls-Royce TotalCare Services Limited and Hawaiian Airlines, Inc., relating to the purchase ofTrent 772B engines (the ‘‘Rolls-Royce Agreement’’) (filed as Exhibit 10.47 to the Form 10-Kfiled by Hawaiian Holdings, Inc. on February 26, 2009 in redacted form pursuant to arequest for confidential treatment for certain provisions thereof pursuant to Rule 24b-2 ofthe Securities Exchange Act of 1934, as amended). Hawaiian Airlines, Inc. also entered intoan Agreement, dated as of October 27, 2008, between Rolls- Royce PLC, Rolls-RoyceTotalCare Services Limited and Hawaiian Airlines, Inc. relating to the purchase of TrentXWB engines, the terms of which are substantially identical to the terms contained in theRolls-Royce Agreement, except with respect to engine identification information andspecifications, delivery dates and certain other information as to which HawaiianAirlines, Inc. has requested confidential treatment and pursuant to Regulation S-KItem 601, Instruction 2, this agreement was not filed.*‡
10.39.1 Amendment #1 to General Terms Agreement by and between Rolls-Royce PLC, Rolls-Royce TotalCare Services Limited and Hawaiian Airlines, Inc. dated October 27, 2008 (filedas Exhibit 10.10 to the Form 10-Q filed by Hawaiian Holdings, Inc. on April 26, 2011 inredacted form since confidential treatment has been granted for certain provisions thereofpursuant to Rule 24b-2 of the Securities Exchange Act of 1934, as amended).*‡
10.39.2 Amendment #2 to General Terms Agreement by and between Rolls-Royce PLC, Rolls-Royce TotalCare Services Limited and Hawaiian Airlines, Inc. dated October 27, 2008 (filedas Exhibit 10.11 to the Form 10-Q filed by Hawaiian Holdings, Inc. on April 26, 2011 inredacted form since confidential treatment has been granted for certain provisions thereofpursuant to Rule 24b-2 of the Securities Exchange Act of 1934, as amended).*‡
108

10.39.3 Amendment #3 to General Terms Agreement by and between Rolls-Royce PLC, Rolls-Royce TotalCare Services Limited and Hawaiian Airlines, Inc. dated October 27, 2008 (filedas Exhibit 10.48.2 to the Form 10-K filed by Hawaiian Holdings, Inc. on February 9, 2012 inredacted form since confidential treatment has been granted for certain provisions thereofpursuant to Rule 24b-2 of the Securities Exchange Act of 1934, as amended).*‡
10.40 Amendment #1 to the Side Letter Agreement Number One to General Terms Agreementby and between Rolls-Royce PLC, Rolls-Royce TotalCare Services Limited and HawaiianAirlines, Inc. dated October 27, 2008 (filed as Exhibit 10.12 to the Form 10-Q/A filed byHawaiian Holdings, Inc. on July 21, 2011).*‡
10.40.1 Amendment #2 to the Side Letter Agreement Number One to General Terms Agreementby and between Rolls-Royce PLC, Rolls-Royce TotalCare Services Limited and HawaiianAirlines, Inc. dated October 27, 2008 (filed as Exhibit 10.49.1 to the Form 10-K filed byHawaiian Holdings, Inc. on February 9, 2012 in redacted form since confidential treatmenthas been granted for certain provisions thereof pursuant to Rule 24b-2 of the SecuritiesExchange Act of 1934, as amended).*‡
10.41 Aircraft Lease Agreement, dated as of October 31, 2008, between C.I.T. LeasingCorporation and Hawaiian Airlines, Inc. for one Airbus A330-200 aircraft (filed asExhibit 10.48 to the Form 10-K filed by Hawaiian Holdings, Inc. on February 26, 2009 inredacted form pursuant to a request for confidential treatment for certain provisionsthereof pursuant to Rule 24b-2 of the Securities Exchange Act of 1934, as amended).*‡
10.42 Amendment No. 1 to Lease Agreement (Aircraft No. 2), dated as of November 10, 2008,between Pegasus Aviation Finance Company and Hawaiian Airlines, Inc. (filed asExhibit 10.49 to the Form 10-K filed by Hawaiian Holdings, Inc. on February 26, 2009 inredacted form pursuant to a request for confidential treatment for certain provisionsthereof pursuant to Rule 24b-2 of the Securities Exchange Act of 1934, as amended).*‡
10.43 Amendment Number One to Aircraft Lease Agreement, dated as of November 10, 2008,between C.I.T. Leasing Corporation and Hawaiian Airlines, Inc. (filed as Exhibit 10.50 tothe Form 10-K filed by Hawaiian Holdings, Inc. on February 26, 2009 in redacted formpursuant to a request for confidential treatment for certain provisions thereof pursuant toRule 24b-2 of the Securities Exchange Act of 1934, as amended).*‡
10.44 Complete Fleet Services Agreement, dated as of December 14, 2009, between Delta AirLines, Inc. and Hawaiian Airlines, Inc. (filed as Exhibit 10.1 to the Form 10-Q filed byHawaiian Holdings, Inc. on April 27, 2010).*
10.45 Base Call Option Transaction Confirmation, dated as of March 18, 2011, by and amongHawaiian Holdings, Inc., UBS AG, London Branch and UBS Securities LLC, solely asagent of UBS AG, London Branch (filed as Exhibit 10.1 to the Form 8-K filed by HawaiianHoldings, Inc. on March 21, 2011).*
10.46 Base Call Option Transaction Confirmation, dated as of March 18, 2011, by and betweenHawaiian Holdings, Inc. and JPMorgan Chase Bank, National Association (filed asExhibit 10.2 to the Form 8-K filed by Hawaiian Holdings, Inc. on March 21, 2011).*
10.47 Base Warrants Transaction Confirmation, dated as of March 18, 2011, by and amongHawaiian Holdings, Inc., UBS AG, London Branch and UBS Securities LLC, solely asagent of UBS AG, London Branch (filed as Exhibit 10.3 to the Form 8-K filed by HawaiianHoldings, Inc. on March 21, 2011).*
109

10.48 Base Warrants Transaction Confirmation, dated as of March 18, 2011, by and betweenHawaiian Holdings, Inc. and JPMorgan Chase Bank, National Association (filed asExhibit 10.4 to the Form 8-K filed by Hawaiian Holdings, Inc. on March 21, 2011).*
10.49 Additional Call Option Transaction, dated as of March 18, 2011, by and among HawaiianHoldings, Inc., UBS AG, London Branch and UBS Securities LLC, solely as agent of UBSAG, London Branch (filed as Exhibit 10.1 to the Form 8-K filed by Hawaiian Holdings, Inc.on March 23, 2011).*
10.50 Additional Call Option Transaction, dated as of March 18, 2011, by and between HawaiianHoldings, Inc. and JPMorgan Chase Bank, National Association (filed as Exhibit 10.2 to theForm 8-K filed by Hawaiian Holdings, Inc. on March 23, 2011).*
10.51 Additional Warrants Transaction, dated as of March 18, 2011, by and among HawaiianHoldings, Inc., UBS AG, London Branch and UBS Securities LLC, solely as agent of UBSAG, London Branch (filed as Exhibit 10.3 to the Form 8-K filed by Hawaiian Holdings, Inc.on March 23, 2011).*
10.52 Additional Warrants Transaction, dated as of March 18, 2011, by and between HawaiianHoldings, Inc. and JPMorgan Chase Bank, National Association (filed as Exhibit 10.4 to theForm 8-K filed by Hawaiian Holdings, Inc. on March 23, 2011).*
10.53 Loan Agreement [1217], dated as of April 6, 2011, by and among Hawaiian Airlines, Inc.;Natixis as administrative agent; Wells Fargo Bank Northwest, National Association, not inits individual capacity, except as expressly stated therein, as security trustee; LandesbankHessen-Thuringen Girozentrale, KfW IPEX-Bank GmbH and Natixis Transport Finance, asjoint lead arrangers; and any additional lenders from time to time party thereto (filed asExhibit 10.1 to the Form 10-Q filed by Hawaiian Holdings, Inc. on July 27, 2011 in redactedform since confidential treatment has been granted for certain provisions thereof pursuantto Rule 24b-2 of the Securities Exchange Act of 1934, as amended). Hawaiian Airlines, Inc.also entered into Loan Agreement [1295], dated as of June 29, 2011 by and amongLandesbank Hessen-Thuringen Girozentrale, as administrative agent; Wells Fargo BankNorthwest, National Association, not in its individual capacity, except as expressly statedtherein, as security trustee; Landesbank Hessen-Thuringen Girozentrale, KfW IPEX-Bank GmbH and Natixis Transport Finance, as lenders; and any additional lenders fromtime to time party thereto, which loan agreement is substantially identical to LoanAgreement [1217], except with respect to total principal amount and certain otherinformation as to which Hawaiian Airlines, Inc. has been granted confidential treatment,and pursuant to Regulation S-K Item 601, Instruction 2, this loan agreement was notfiled.*‡
10.54 Purchase Agreement, dated as of June 27, 2011, by and among Wells Fargo BankNorthwest, National Association, solely as owner trustee of trusts beneficially owned byBCC Equipment Leasing Corporation and MDFC Spring Company, and HawaiianAirlines, Inc. (filed as Exhibit 10.2 to the Form 10-Q filed by Hawaiian Holdings, Inc. onJuly 27, 2011 in redacted form since confidential treatment has been granted for certainprovisions thereof pursuant to Rule 24b-2 of the Securities Exchange Act of 1934, asamended).*‡
110
10.55 Facility Agreement [Hawaiian 717-200 [55001]], dated as of June 27, 2011 by and betweenHawaiian Airlines, Inc. and Boeing Capital Loan Corporation (filed as Exhibit 10.3 to theForm 10-Q/A filed by Hawaiian Holdings, Inc. on December 14, 2011 in redacted formsince confidential treatment has been granted for certain provisions thereof pursuant toRule 24b-2 of the Securities Exchange Act of 1934, as amended). Hawaiian Airlines, Inc.also entered into Facility Agreement [Hawaiian 717-200 [55002]], dated as of June 27, 2011;Facility Agreement [Hawaiian 717-200 [55118]], dated as of June 27, 2011; FacilityAgreement [Hawaiian 717-200 [55121]], dated as of June 27, 2011; Facility Agreement[Hawaiian 717-200 [55122]], dated as of June 27, 2011; Facility Agreement [Hawaiian717-200 [55123]], dated as of June 27, 2011; Facility Agreement [Hawaiian 717-200 [55124]],dated as of June 27, 2011; Facility Agreement [Hawaiian 717-200 [55125]], dated as ofJune 27, 2011; Facility Agreement [Hawaiian 717-200 [55126]], dated as of June 27, 2011;Facility Agreement [Hawaiian 717-200 [55128]], dated as of June 27, 2011; FacilityAgreement [Hawaiian 717-200 [55129]], dated as of June 27, 2011; Facility Agreement[Hawaiian 717-200 [55130]], dated as of June 27, 2011; Facility Agreement [Hawaiian717-200 [55131]], dated as of June 27, 2011; Facility Agreement [Hawaiian 717-200 [55132]],dated as of June 27, 2011; and Facility Agreement [Hawaiian 717-200 [55151]], dated as ofJune 27, 2011, which facility agreements are substantially identical to Facility Agreement55001, and pursuant to Regulation S-K Item 601, Instruction 2, these facility agreementswere not filed.*‡
10.56 Lease Agreement 491HA, dated as of June 28, 2011, by and between Wells Fargo BankNorthwest, National Association, a national banking association organized under the laws ofthe United States of America, not in its individual capacity, but solely as owner trustee of atrust beneficially owned by BCC Equipment Leasing Corporation, and HawaiianAirlines, Inc. (filed as Exhibit 10.5 to Form 10-Q/A filed by Hawaiian Holdings, Inc. onDecember 14, 2011 in redacted form since confidential treatment has been granted forcertain provisions thereof pursuant to Rule 24b-2 of the Securities Exchange Act of 1934, asamended). Hawaiian Airlines, Inc. also entered into Lease Agreement 492HA, dated as ofJune 28, 2011; and Lease Agreement 493HA, dated as of June 28, 2011, which leaseagreements are substantially identical to Lease Agreement 491HA, and pursuant toRegulation S-K Item 601, Instruction 2, these lease agreements were not filed.*‡
10.57 Facility Agreement [Hawaiian A330 [1259]], dated as of June 29, 2011, by and amongHawaiian Airlines, Inc.; Bank of Utah, as security trustee; and each of NorddeutscheLandesbank Girozentrale and BNP Paribas, as loan participants (filed as Exhibit 10.6 to theForm 10-Q/A filed by Hawaiian Holdings, Inc. on December 14, 2011 in redacted formsince confidential treatment has been granted for certain provisions thereof pursuant toRule 24b-2 of the Securities Exchange Act of 1934, as amended). Hawaiian Airlines, Inc.also entered into Facility Agreement [Hawaiian A330 [1302]], dated as of June 29, 2011,which facility agreement is substantially identical to Facility Agreement [Hawaiian A330[1259]], except with respect to certain information as to which Hawaiian Airlines, Inc. hasbeen granted confidential treatment, and pursuant to Regulation S-K Item 601,Instruction 2, this facility agreement was not filed.*‡
10.58 Contract Services Agreement, dated as of June 29, 2011, by and between HawaiianAirlines, Inc. and Airline Contract Maintenance and Equipment, Inc. (filed as Exhibit 10.7to the Form 10-Q filed by Hawaiian Holdings, Inc. on July 27, 2011 in redacted form sinceconfidential treatment has been granted for certain provisions thereof pursuant toRule 24b-2 of the Securities Exchange Act of 1934, as amended).*‡
111

10.59 Purchase Agreement (Aircraft No.1), dated as of October 14, 2011, by and amongWilmington Trust Company, a Delaware trust company, not in its individual capacity, butsolely as Owner Trustee for the benefit of HKAC Leasing Limited, a private Irish limitedcompany; HKAC Leasing Limited; and Hawaiian Airlines, Inc., a Delaware corporation(filed as Exhibit 10.68 to Form 10-K/A filed by Hawaiian Holdings, Inc. on May 30, 2012 inredacted form pursuant to a request for confidential treatment for certain provisionsthereof pursuant to Rule 24b-2 of the Securities Exchange Act of 1934, as amended).Hawaiian Airlines, Inc. also entered into Purchase Agreement (Aircraft No. 2) dated as ofOctober 14, 2011 and Purchase Agreement (Aircraft No. 3) dated as of October 14, 2011,the terms of which are substantially identical to the terms of Purchase Agreement (AircraftNo 1), except with respect to aircraft identification information, delivery dates and certainother information as to which Hawaiian Airlines, Inc. had requested confidential treatment,and pursuant to Regulation S-K Item 601, Instruction 2, these purchase agreements werenot filed.*‡
12 Computation of ratio of earnings to fixed charges for the years ended December 31, 2012,2011, 2010, 2009, and 2008.
14.1 Code of Ethics (filed as Exhibit 14.1 to the Form 10-K filed by Hawaiian Holdings, Inc. onMarch 23, 2006).*
21.1 List of Subsidiaries of Hawaiian Holdings, Inc.
23.1 Consent of Ernst & Young LLP.
31.1 Rule 13a-14(a) Certification of Chief Executive Officer.
31.2 Rule 13a-14(a) Certification of Chief Financial Officer.
32.1 Certification of Chief Executive Officer pursuant to 18 U.S.C. Section 1350, as adoptedpursuant to Section 906 of the Sarbanes-Oxley Act of 2002.
32.2 Certification of Chief Financial Officer pursuant to 18 U.S.C. Section 1350, as adoptedpursuant to Section 906 of the Sarbanes-Oxley Act of 2002.
101.INS XBRL Instance Document.
101.SCH XBRL Taxonomy Extension Schema Document
101.CAL XBRL Taxonomy Extension Valuation Linkbase Document.
101.DEF XBRL Taxonomy Extension Definition Linkbase Document.
101.LAB XBRL Taxonomy Extension Label Linkbase Document.
101.PRE XBRL Taxonomy Extension Presentation Linkbase Document.
+ These exhibits relate to management contracts or compensatory plans or arrangements.
* Previously filed; incorporated herein by reference.
‡ Confidential treatment has been requested for a portion of this exhibit.
112
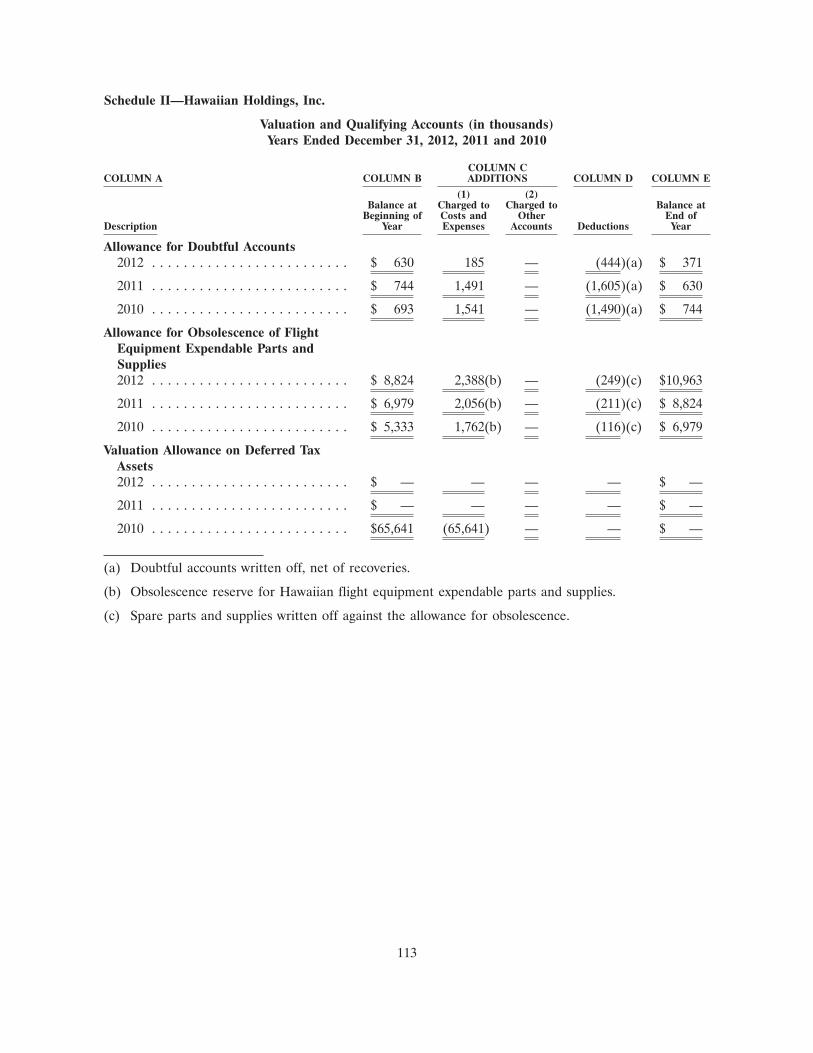
Schedule II—Hawaiian Holdings, Inc.
Valuation and Qualifying Accounts (in thousands)Years Ended December 31, 2012, 2011 and 2010
COLUMN CCOLUMN A COLUMN B ADDITIONS COLUMN D COLUMN E
(1) (2)Balance at Charged to Charged to Balance at
Beginning of Costs and Other End ofDescription Year Expenses Accounts Deductions Year
Allowance for Doubtful Accounts2012 . . . . . . . . . . . . . . . . . . . . . . . . . $ 630 185 — (444)(a) $ 371
2011 . . . . . . . . . . . . . . . . . . . . . . . . . $ 744 1,491 — (1,605)(a) $ 630
2010 . . . . . . . . . . . . . . . . . . . . . . . . . $ 693 1,541 — (1,490)(a) $ 744
Allowance for Obsolescence of FlightEquipment Expendable Parts andSupplies2012 . . . . . . . . . . . . . . . . . . . . . . . . . $ 8,824 2,388(b) — (249)(c) $10,963
2011 . . . . . . . . . . . . . . . . . . . . . . . . . $ 6,979 2,056(b) — (211)(c) $ 8,824
2010 . . . . . . . . . . . . . . . . . . . . . . . . . $ 5,333 1,762(b) — (116)(c) $ 6,979
Valuation Allowance on Deferred TaxAssets2012 . . . . . . . . . . . . . . . . . . . . . . . . . $ — — — — $ —
2011 . . . . . . . . . . . . . . . . . . . . . . . . . $ — — — — $ —
2010 . . . . . . . . . . . . . . . . . . . . . . . . . $65,641 (65,641) — — $ —
(a) Doubtful accounts written off, net of recoveries.
(b) Obsolescence reserve for Hawaiian flight equipment expendable parts and supplies.
(c) Spare parts and supplies written off against the allowance for obsolescence.
113
SIGNATURES
Pursuant to the requirements of Section 13 or 15(d) of the Securities Exchange Act of 1934, asamended, the Registrant has duly caused this report to be signed on its behalf by the undersigned,thereunto duly authorized.
HAWAIIAN HOLDINGS, INC.
February 8, 2013 By /s/ SCOTT E. TOPPING
Scott E. ToppingExecutive Vice President,
Chief Financial Officer and Treasurer(Principal Financial and Accounting Officer)
Pursuant to the requirements of the Securities Exchange Act of 1934, as amended, this report has beensigned below by the following persons on behalf of the Registrant and in the capacities indicated onFebruary 8, 2013.
Signature Title
/s/ MARK B. DUNKERLEY President and Chief Executive Officer, andDirector (Principal Executive Officer)Mark B. Dunkerley
Executive Vice President, Chief Financial Officer/s/ SCOTT E. TOPPINGand Treasurer (Principal Financial and Accounting
Scott E. Topping Officer)
/s/ LAWRENCE S. HERSHFIELDChair of the Board of Directors
Lawrence S. Hershfield
/s/ GREGORY S. ANDERSONDirector
Gregory S. Anderson
/s/ TOMOYUKI MORIIZUMIDirector
Tomoyuki Moriizumi
/s/ RANDALL L. JENSONDirector
Randall L. Jenson
/s/ SAMSON POOMAIHEALANIDirector
Samson Poomaihealani
114

Signature Title
/s/ BERT T. KOBAYASHI, JR.Director
Bert T. Kobayashi, Jr.
/s/ CRYSTAL K. ROSEDirector
Crystal K. Rose
/s/ WILLIAM S. SWELBARDirector
William S. Swelbar
/s/ BRIAN E. BOYERDirector
Brian E. Boyer
/s/ RICHARD N. ZWERNDirector
Richard N. Zwern
115

Exhibit 12
Hawaiian Holdings, Inc.Computation of Ratio of Earnings to Fixed Charges
Year ended December 31,
2008 2009 2010 2011 2012
(in thousands, except for ratio)
EarningsIncome (loss) before income taxes . . . . . . . . . $ 53,209 $ 97,196 $ 81,989 $(1,082) $ 85,786
Additions:Total fixed charges (see below) . . . . . . . . . . . 63,574 66,147 68,034 71,536 88,836
Subtractions:Interest capitalized . . . . . . . . . . . . . . . . . . . . — — 2,665 7,771 10,524
Earnings as adjusted . . . . . . . . . . . . . . . . . . . . $116,783 $163,343 $147,358 $62,683 $164,098
Fixed Charges:Interest on indebtedness, expensed or
capitalized . . . . . . . . . . . . . . . . . . . . . . . . $ 19,289 $ 19,378 $ 15,703 $20,991 $ 38,447Amortization of debt discount and accretion
of convertible debt . . . . . . . . . . . . . . . . . . 1,367 1,275 1,132 3,530 5,075Portion of rental expense representative of
the interest factor(1) . . . . . . . . . . . . . . . . . 42,918 45,494 51,199 47,015 45,314
Total fixed charges . . . . . . . . . . . . . . . . . . . . . . $ 63,574 $ 66,147 $ 68,034 $71,536 $ 88,836
Ratio of earnings to fixed charges . . . . . . . . . . . 1.84 2.47 2.17 — 1.85
Coverage deficiency . . . . . . . . . . . . . . . . . . . . . $ — $ — $ — $ 8,853 $ —
(1) Represents a percentage of total rent expense. We used 35% for the years 2008 through 2010 and30% for 2011 and 2012, which we believe is a reasonable estimate of the interest component ofrent expense.

Exhibit 21.1
LIST OF SUBSIDIARIES OF HAWAIIAN HOLDINGS, INC.
Hawaiian Airlines, Inc.
Hawaiian Gifts, LLC
Airline Contract Maintenance and Equipment, Inc.

Exhibit 23.1
CONSENT OF INDEPENDENT REGISTERED PUBLIC ACCOUNTING FIRM
We consent to the incorporation by reference in the following Registration Statements:
(1) Registration Statement (Form S-3 No. 333-162891),
(2) Registration Statement (Form S-8 No. 333-172356),
(3) Registration Statement (Form S-8 No. 333-127732),
(4) Registration Statement (Form S-8 No. 333-127731),
(5) Registration Statement (Form S-8 No. 333-09671),
(6) Registration Statement (Form S-8 No. 333-09669),
(7) Registration Statement (Form S-8 No. 333-61244), and
(8) Registration Statement (Form S-8 No. 333-09667);
of our reports dated February 8, 2013, with respect to the consolidated financial statements andschedule of Hawaiian Holdings, Inc. and the effectiveness of internal control over financial reporting ofHawaiian Holdings, Inc., included in this Annual Report (Form 10-K) of Hawaiian Holdings, Inc. forthe year ended December 31, 2012.
/s/ ERNST & YOUNG LLP
Honolulu, HawaiiFebruary 8, 2013
Exhibit 31.1
CERTIFICATION
I, Mark B. Dunkerley, certify that:
1. I have reviewed this Annual Report on Form 10-K of Hawaiian Holdings, Inc. for the year endedDecember 31, 2012;
2. Based on my knowledge, this report does not contain any untrue statement of a material fact oromit to state a material fact necessary to make the statements made, in light of the circumstancesunder which such statements were made, not misleading with respect to the period covered by thisreport;
3. Based on my knowledge, the financial statements, and other financial information included in thisreport, fairly present in all material respects the financial condition, results of operations and cashflows of the registrant as of, and for, the periods presented in this report;
4. The registrant’s other certifying officer(s) and I are responsible for establishing and maintainingdisclosure controls and procedures (as defined in Exchange Act Rules 13a-15(e) and 15d-15(e))and internal control over financial reporting (as defined in Exchange Act Rules 13a-15(f) and15d-15(f)) for the registrant and have:
(a) Designed such disclosure controls and procedures, or caused such disclosure controls andprocedures to be designed under our supervision, to ensure that material information relatingto the registrant, including its consolidated subsidiaries, is made known to us by others withinthose entities, particularly during the period in which this report is being prepared;
(b) Designed such internal control over financial reporting, or caused such internal control overfinancial reporting to be designed under our supervision, to provide reasonable assuranceregarding the reliability of financial reporting and the preparation of financial statements forexternal purposes in accordance with generally accepted accounting principles;
(c) Evaluated the effectiveness of the registrant’s disclosure controls and procedures andpresented in this report our conclusions about the effectiveness of the disclosure controls andprocedures, as of the end of the period covered by this report based on such evaluation; and
(d) Disclosed in this report any change in the registrant’s internal control over financial reportingthat occurred during the registrant’s most recent fiscal quarter (the registrant’s fourth fiscalquarter in the case of an annual report) that has materially affected, or is reasonably likely tomaterially affect, the registrant’s internal control over financial reporting; and
5. The registrant’s other certifying officer(s) and I have disclosed, based on our most recentevaluation of internal control over financial reporting, to the registrant’s auditors and the auditcommittee of the registrant’s board of directors (or persons performing the equivalent functions):
(a) All significant deficiencies and material weaknesses in the design or operation of internalcontrol over financial reporting which are reasonably likely to adversely affect the registrant’sability to record, process, summarize and report financial information; and
(b) Any fraud, whether or not material, that involves management or other employees who have asignificant role in the registrant’s internal control over financial reporting.
Date: February 8, 2013 By: /s/ MARK B. DUNKERLEY
Mark B. DunkerleyPresident and Chief Executive Officer
Exhibit 31.2
CERTIFICATION
I, Scott E. Topping, certify that:
1. I have reviewed this Annual Report on Form 10-K of Hawaiian Holdings, Inc. for the year endedDecember 31, 2012;
2. Based on my knowledge, this report does not contain any untrue statement of a material fact oromit to state a material fact necessary to make the statements made, in light of the circumstancesunder which such statements were made, not misleading with respect to the period covered by thisreport;
3. Based on my knowledge, the financial statements, and other financial information included in thisreport, fairly present in all material respects the financial condition, results of operations and cashflows of the registrant as of, and for, the periods presented in this report;
4. The registrant’s other certifying officer(s) and I are responsible for establishing and maintainingdisclosure controls and procedures (as defined in Exchange Act Rules 13a-15(e) and 15d-15(e))and internal control over financial reporting (as defined in Exchange Act Rules 13a-15(f) and15d-15(f)) for the registrant and have:
(a) Designed such disclosure controls and procedures, or caused such disclosure controls andprocedures to be designed under our supervision, to ensure that material information relatingto the registrant, including its consolidated subsidiaries, is made known to us by others withinthose entities, particularly during the period in which this report is being prepared;
(b) Designed such internal control over financial reporting, or caused such internal control overfinancial reporting to be designed under our supervision, to provide reasonable assuranceregarding the reliability of financial reporting and the preparation of financial statements forexternal purposes in accordance with generally accepted accounting principles;
(c) Evaluated the effectiveness of the registrant’s disclosure controls and procedures andpresented in this report our conclusions about the effectiveness of the disclosure controls andprocedures, as of the end of the period covered by this report based on such evaluation; and
(d) Disclosed in this report any change in the registrant’s internal control over financial reportingthat occurred during the registrant’s most recent fiscal quarter (the registrant’s fourth fiscalquarter in the case of an annual report) that has materially affected, or is reasonably likely tomaterially affect, the registrant’s internal control over financial reporting; and
5. The registrant’s other certifying officer(s) and I have disclosed, based on our most recentevaluation of internal control over financial reporting, to the registrant’s auditors and the auditcommittee of the registrant’s board of directors (or persons performing the equivalent functions):
(a) All significant deficiencies and material weaknesses in the design or operation of internalcontrol over financial reporting which are reasonably likely to adversely affect the registrant’sability to record, process, summarize and report financial information; and
(b) Any fraud, whether or not material, that involves management or other employees who have asignificant role in the registrant’s internal control over financial reporting.
Date: February 8, 2013 By: /s/ SCOTT E. TOPPING
Scott E. ToppingExecutive Vice President,Chief Financial Officer and Treasurer

Exhibit 32.1
CERTIFICATION PURSUANT TO 18 U.S.C. SECTION 1350,AS ADOPTED PURSUANT TO
SECTION 906 OF THE SARBANES-OXLEY ACT OF 2002
In connection with the Annual Report on Form 10-K of Hawaiian Holdings, Inc. (the Company) forthe period ended December 31, 2012 as filed with the Securities and Exchange Commission on thedate hereof (the Report), I, Mark B. Dunkerley, President and Chief Executive Officer of theCompany, certify pursuant to 18 U.S.C. Section 1350, as adopted pursuant to Section 906 of theSarbanes-Oxley Act of 2002, that:
(1) The Report fully complies with the requirements of Section 13(a) or 15(d) of the SecuritiesExchange Act of 1934, as amended; and
(2) The information contained in the Report fairly presents, in all material respects, the financialcondition and results of operations of the Company.
Date: February 8, 2013 By: /s/ MARK B. DUNKERLEY
Mark B. DunkerleyPresident and Chief Executive Officer

Exhibit 32.2
CERTIFICATION PURSUANT TO 18 U.S.C. SECTION 1350,AS ADOPTED PURSUANT TO
SECTION 906 OF THE SARBANES-OXLEY ACT OF 2002
In connection with the Annual Report on Form 10-K of Hawaiian Holdings, Inc. (the Company) forthe period ended December 31, 2012 as filed with the Securities and Exchange Commission on thedate hereof (the Report), I, Scott E. Topping, Executive Vice President, Chief Financial Officer andTreasurer of the Company, certify pursuant to 18 U.S.C. Section 1350, as adopted pursuant toSection 906 of the Sarbanes-Oxley Act of 2002, that:
(1) The Report fully complies with the requirements of Section 13(a) or 15(d) of the SecuritiesExchange Act of 1934, as amended; and
(2) The information contained in the Report fairly presents, in all material respects, the financialcondition and results of operations of the Company.
Date: February 8, 2013 By: /s/ SCOTT E. TOPPING
Scott E. ToppingExecutive Vice President, Chief Financial Officerand Treasurer


SOUTHKOREA
PHILIPPINESVIETNAM
MALAYSIA
THAILAND
CHINA
AUSTRALIA
INDONESIA
PAPUANEW GUINEA
NEWZEALAND
AMERICANSAMOA
TAHITI
JAPAN
NORTH AMERICA
MEXICO
HAWAI‘I
CANADA
TAIWAN
Tokyo (Haneda)
Osaka (Kansai)
Fukuoka
Manila
Pago Pago
Papeete
Seoul (Incheon)
Taipei
Sapporo (New Chitose)
Sydney
Brisbane
Auckland
San Francisco
San Diego
Sacramento
Portland
Phoenix
Oakland
Las VegasLos Angeles
Seattle
New York City (JFK)
San Jose
Kahului
Okinawa
Kagoshima
Beijing
Shanghai
Busan Osaka (Itami)
Oita
Sendai
Bangkok
Perth
Canberra
Gladstone
Rockhampton
Townsville
Mackay
Adelaide
Melbourne
Cairns
MontereySanta Barbara
Fresno
Dallas/Fort Worth
Chicago (ORD)
PortlandBurlington
Boston
Raleigh-DurhamCharlotte
Orlando
West Palm BeachFort Lauderdale
Tampa
Fort Myers
PhiladelphiaWashington (IAD)
RochesterBuffalo
Syracuse
Honolulu
BOARD OF DIRECTORS
Ronald Anderson-LehmanSenior Vice PresidentChief Information OfficerHawaiian Airlines, Inc.
Ann BotticelliSenior Vice PresidentCorporate Communications and Public AffairsHawaiian Airlines, Inc.
Barbara D. FalveySenior Vice President Human ResourcesHawaiian Airlines, Inc.
Charles R. NardelloSenior Vice PresidentOperationsHawaiian Airlines, Inc.
Glenn G. TaniguchiSenior Vice PresidentMarketing and SalesHawaiian Airlines, Inc.
Karen A. BerryVice President Labor and Employee RelationsHawaiian Airlines, Inc.
Monisa ClineVice President Sales and AlliancesHawaiian Airlines, Inc.
Christian V. ForbesVice President Financial Planning and AnalysisHawaiian Airlines, Inc.
Doreen M. LawrenceVice President Inflight ServicesHawaiian Airlines, Inc.
Avi A. MannisVice PresidentMarketing Hawaiian Airlines, Inc.
Blaine J. MiyasatoVice PresidentProduct Development Hawaiian Airlines, Inc.
Shannon L. OkinakaVice President ControllerHawaiian Airlines, Inc.
Kenneth E. RewickVice President Flight Operations Hawaiian Airlines, Inc.
Louis D. Saint-CyrVice PresidentCustomer Services Hawaiian Airlines, Inc.
Lorrin L. M. SardinhaVice PresidentMaintenance and EngineeringHawaiian Airlines, Inc.
Donald A. E. SealeyVice PresidentCorporate Audit Hawaiian Airlines, Inc.
John R. WagnerVice PresidentPublic AffairsHawaiian Airlines, Inc.
Andrew M. WattersonVice PresidentPlanning and Revenue ManagementHawaiian Airlines, Inc.
Tom E. WessnerVice PresidentStrategic ProcurementHawaiian Airlines, Inc.
CORPORATE INFORMATION
HEADQUARTERSHawaiian Airlines, Inc.3375 Koapaka Street, Suite G350Honolulu, Hawai‘i 96819
Telephone: (808) 835-3700Facsimile: (808) 835-3690
MAILING ADDRESSP. O. Box 30008Honolulu, Hawai‘i 96820
INTERNET ADDRESSwww.HawaiianAirlines.com
INVESTOR RELATIONSSusan [email protected]
STOCK TRANSFER AGENT AND REGISTRARAmerican Stock Transfer & Trust Company6201 15th Avenue Brooklyn, New York 11219
Telephone: (800) [email protected]
STOCK EXCHANGE LISTINGSymbol – HANASDAQ Stock Market, LLCNew York, New York
INDEPENDENT AUDITORSErnst & Young, LLPHonolulu, Hawai‘i
CORPORATE COUNSELWilson Sonsini Goodrich & Rosati, P.C.Palo Alto, California
The 2013 Annual Meeting of Stockholders of Hawaiian Holdings, Inc. will be held on Wednesday, May 22, 2013 at 10:00 a.m.
Hilton Hawaiian Village Beach Resort and SpaKalia Executive Conference Center2005 Kalia RoadHonolulu, Hawai‘i 96815
ANNUAL MEETING
Lawrence S. HershfieldChairman of the BoardHawaiian Holdings, Inc. and Hawaiian Airlines, Inc.
Chief Executive OfficerRanch Capital, LLC
Mark B. DunkerleyPresident and Chief Executive OfficerHawaiian Holdings, Inc. and Hawaiian Airlines, Inc.
Gregory S. AndersonChief Executive OfficerLegacy Senior Housing andDevelopment Company
Brian E. BoyerChairman of the BoardPlanes of Fame Air Museum
Randall L. JensonPresidentRanch Capital, LLC
President and Chief Financial OfficerBerkadia
Bert T. Kobayashi, Jr.Senior PartnerKobayashi, Sugita & Goda
Tomoyuki MoriizumiFormer President and Chief Executive Officer Jupiter Telecommunications Co., Ltd.
Samson PoomaihealaniGrand Lodge Representative (Retired)International Association of Machinists and Aerospace Workers
Crystal K. RosePartnerBays Lung Rose & Holma
William S. SwelbarResearch EngineerMassachusetts Institute of Technology
Richard N. ZwernWorldwide Director – Executive DevelopmentWPP
CORPORATE OFFICERS
Mark B. DunkerleyPresident and Chief Executive OfficerHawaiian Holdings, Inc. and Hawaiian Airlines, Inc.
Scott E. ToppingExecutive Vice PresidentChief Financial Officer and TreasurerHawaiian Holdings, Inc. and Hawaiian Airlines, Inc.
Hoyt H. ZiaSecretaryHawaiian Holdings, Inc.
Senior Vice PresidentGeneral Counsel and Corporate SecretaryHawaiian Airlines, Inc.
Peter R. IngramExecutive Vice PresidentChief Commercial OfficerHawaiian Airlines, Inc.
Map not drawn to scale.
*Subject to government approval
JOB#: HACA-36333
If you have questions concerning this file, please contact our Production Manager immediately at 808.539.3487
CLIENT: Hawaiian AirlinesDESCRIPTION: 2-SidedOutside and Inside Covers
COLLATERAL: Annual ReportCover 2012
COLOR: 4C
BLEED: .125”FLAT: w 16.5” x h 10.75”FOLDED: w 8.25” x h 10.75”
HACA-36333-2012AnnualReportCvr.indd 2 4/3/13 1:57 PM

JOB#: HACA-36333
If you have questions concerning this file, please contact our Production Manager immediately at 808.539.3487
CLIENT: Hawaiian AirlinesDESCRIPTION: 2-SidedOutside and Inside Covers
COLLATERAL: Annual ReportCover 2012
COLOR: 4C
BLEED: .125”FLAT: w 16.5” x h 10.75”FOLDED: w 8.25” x h 10.75”
ANNUAL REPORT 2012 H A W A I I A N H O L D I N G S , I N C .
HACA-36333-2012AnnualReportCvr.indd 1 4/3/13 1:57 PM


![Accelya's Cargo Revenue Accounting solution selected by Hawaiian Airlines [Company Update]](https://img.pdfslide.net/doc/110x75/577cb4111a28aba7118c4915/accelyas-cargo-revenue-accounting-solution-selected-by-hawaiian-airlines.jpg)