Embed Size (px)
Citation preview
A prediction model for the loading-wetting volumetric behavior of unsaturated granular materials
This is the Published version of the following publication
Yaghoubi, Ehsan, M. Disfani, M, Arulrajah, Arul and Al-Taie, Asmaa (2021) A prediction model for the loading-wetting volumetric behavior of unsaturated granular materials. Soils and Foundations. ISSN 0038-0806
The publisher’s official version can be found at https://www.sciencedirect.com/science/article/pii/S0038080621000330Note that access to this version may require subscription.
Downloaded from VU Research Repository https://vuir.vu.edu.au/42001/
Available online at www.sciencedirect.comH O S T E D B Y
www.elsevier.com/locate/sandf
ScienceDirect
Soils and Foundations xxx (xxxx) xxx
Technical Paper
A prediction model for the loading-wetting volumetric behaviorof unsaturated granular materialsq
Ehsan Yaghoubi a,⇑, Mahdi M. Disfani b, Arul Arulrajah c, Asmaa Al-Taie b
aCollege of Engineering and Science, Victoria University, Melbourne, AustraliabDepartment of Infrastructure Engineering, The University of Melbourne, Melbourne, Australia
cDepartment of Civil and Construction Engineering, Swinburne University of Technology, Melbourne, Australia
Received 28 February 2020; received in revised form 22 December 2020; accepted 20 January 2021
Abstract
Geotechnical structures made of granular material tend to be unsaturated during their service life. However, there is presently a lackof sufficient research and studies on their volumetric behavior under unsaturated conditions. In this study, loading and wetting inducedvolumetric behavior of granular materials in the unsaturated state was studied within a moisture content-based framework. Recycledcrushed brick (CB) and excavation waste rock (WR) were the granular materials used in this research to promote sustainable construc-tion. Several loading, unloading, and wetting state paths were investigated with respect to virgin compaction surfaces (VCS) developedusing groups of compaction curves. The obtained experimental data was utilized to develop a constitutive model capable of predictingwetting-induced volume changes of granular materials in a net stress range of 100–4000 kPa and gravimetric moisture content range of3.6% for WR, and 7.5% for CB to saturation. The model was verified by undertaking several independent state paths on independentmaterials and comparing the experimental responses with those predicted using the model. The proposed model is featured with simplic-ity in acquiring the model input parameters with the aim of filling the existing gap between the theoretical and real-life application ofunsaturated soil mechanics. An application of the model can be the basis for the prediction of the settlement of a granular geotechnicalstructure that is being externally loaded and is subject to changes in moisture content due to climatic effects.� 2021 Production and hosting by Elsevier B.V. on behalf of The Japanese Geotechnical Society. This is an open access article under the CC BY-NC-ND license (http://creativecommons.org/licenses/by-nc-nd/4.0/).
Keywords: Loading-wetting path; Recycled materials; Unsaturated granular material; Volume change; Virgin compaction surface; MPK framework
1. Introduction
Unsaturated geomaterials are known to exhibit compli-cated behaviors, and the misinterpretation of their volu-metric responses may cause damage to the infrastructuresthey support. In unsaturated geomechanics, it is wellaccepted that matric suction influences the behavior of soilssimilar to how the stress functions (Islam and Kodikara,
https://doi.org/10.1016/j.sandf.2021.01.012
0038-0806/� 2021 Production and hosting by Elsevier B.V. on behalf of The
This is an open access article under the CC BY-NC-ND license (http://creativec
Peer review under responsibility of The Japanese Geotechnical Society.⇑ Corresponding author at: College of Engineering and Science, Victoria
University, PO Box 14428, Footscray, Melbourne, Vic 8001, Australia.E-mail addresses: [email protected] (E. Yaghoubi), mahdi.
[email protected] (M. M. Disfani), [email protected] (A.Arulrajah), [email protected] (A. Al-Taie).
Please cite this article as: E. Yaghoubi, M. M. Disfani, A. Arulrajah et al., A prgranular materials, Soils and Foundations, https://doi.org/10.1016/j.sandf.202
2015). Granular materials used in the construction ofgeotechnical structures, such as unbound pavement layers,structural fills or embankments are typically in an unsatu-rated state. However, fewer studies have been conducted todevelop unsaturated constitutive models for unboundgranular materials. This is partly due to relatively low mag-nitudes of suction in granular soils that do not justify thecost and complexities associated with specialized unsatu-rated testing procedures. The impact of suction is typicallyconsidered just for fine-grained soils, which exhibit signifi-cant suction values. In spite of that, Cary and Zapata(2011), Ba et al. (2013), Azam et al. (2013), andYaghoubi et al. (2016) among others, demonstrated theimportance of incorporating the unsaturated geomechanics
Japanese Geotechnical Society.
ommons.org/licenses/by-nc-nd/4.0/).
ediction model for the loading-wetting volumetric behavior of unsaturated1.01.012

Nomenclature
e void ratioed void ratio at the dry ended0 void ratio at the dry end under plowepini initial void ratios corresponding to ewini under
constant pes void ratio at saturationes0 void ratio at saturation under plowew moisture ratio (Gs
x MC)ewa average of ewm and ewsewd moisture ratio at the dry endewi moisture ratio of interestewini initial moisture ratioewm moisture ratio at MDDews moisture ratio at saturationf(ewi) a function that gives De due to wetting from
ewini to ewig(ewi) a function that gives De due to wetting from ewd
to ewiGs specific gravityLOO line of optimumMC moisture contentMDD maximum dry density
p net stress (=total stress - ua)plow the lowest net stress used in the frameworkpL the net stress at the end of loadingpU the net stress after unloadingSr degree of saturationua pore air pressureuw pore water pressureVCS virgin compaction surfacea hydric coefficientDepmax maximum achievable De due to wetting from ewd
under the constant pðDemaxÞpini maximum achievable De due to wetting from
ewini under the constant pDeWT the change in void ratio due to wettingDeU the change in void ratio due to unloadingDew the change in moisture ratiof ratio of ewm/ewsj unloading coefficientkd slope of compression line at ewdks slope of compression line at saturationw suction (ua-uw)
E. Yaghoubi et al. Soils and Foundations xxx (xxxx) xxx
in interpreting the resilient behavior and permanent vol-ume change characteristics of granular materials.
Constitutive models are frequently developed to predictthe behavior of soils by proposing relationships betweenstate variables through single-valued expressions(Fredlund and Rahardjo, 1993). The relationship betweendeformation state variables and stress state variables isexpressed through volume change constitutive models. Tra-ditionally, in unsaturated conditions, deformations due toloading and wetting are presented in the form of voidratio-net stress (e-p) and void ratio-suction (e-w) curves.Presentation of the constitutive models can be donethrough a constitutive (or state) surface within a 3D plotwith two axes representing stress state variables and thethird axis representing the deformation state variable.
The concept of unsaturated constitutive surfaces wasfirst proposed by Matyas and Radhakrishna (1968), inwhich the developed surface related the void ratio anddegree of saturation with matric suction and net stress.The state surface approach (SSA) incorporating suctionwas utilized by several researchers, and was significantlyimproved by Fredlund and Rahardjo (1993). However,since SSA models were based on an elastic analysis, theylacked the ability to fully explain the behavior of unsatu-rated soils that typically exhibit plastic behavior as well(Zhang and Li, 2011). As a result, researchers tended toprefer elasto-plastic models over SSA models. Alonsoet al. (1990) proposed a comprehensive elasto-plastic model
2
capable of interpreting several aspects of unsaturated soilsbehavior. This model, termed as the Barcelona BasicModel (BBM), became the basis of several well-knownfuture models, such as Cui and Delage (1996), Wheeleret al. (2003), and Vassallo et al. (2007). The BBM can beconsidered as the first elasto-plastic model that is mainlyused to describe the volumetric response of unsaturatedsoils using suction as a constitutive parameter. The BBMframework developed a model and proposed a space todescribe the isotropic stress states, being net mean stressand suction. In the BBM type models, a constitutive sur-face can be achieved using a group of loading-collapsecurves, each corresponding to a constant suction. Eachpoint at a loading-collapse contour on the surface repre-sents a yield point obtained from suction-controlledoedometer testing. Using BBM type constitutive surfaces,if a sample is loaded to a certain yield stress under constantsuction and then wetted to reach the suction equivalent tozero (saturation state), the sample would achieve maximumachievable collapse due to suction change. The minimumcollapse is achieved if the sample is wetted under a constantstress equal or less than the yield stress corresponding tosaturation state (w = 0).
BBM type models however have a few limitations(Zhang and Li, 2011). The first limitation in developingthe loading-collapse and suction increase (drying) curvesis an implicit, and arguably unrealistic, assumption that‘‘identical” specimens have identical stress histories. The

E. Yaghoubi et al. Soils and Foundations xxx (xxxx) xxx
next limitation is associated with the determination ofmodel parameters. Even with the availability of suctioncontrolled testing equipment and specialized testing staff,BBM type models use a limited number of test results withthe aim of developing a model that is capable of interpret-ing soil behavior under any conditions. Another limitationwith the BBM models is the uncertainty in the distinctionbetween the elastic and plastic behavior of unsaturatedsoils. As a result, some researchers became willing to returnto the constitutive surfaces and attempted to resolve theSSA limitations through development of a modified statesurface approach (MSSA). An example of a successfullyverified MSSA model was proposed by Zhang andLytton (2009), and Zhang and Lytton (2012). In their mod-ified state surface, Zhang and Lytton introduced a loading-unloading surface along the loading-collapse and suctionincrease curves to incorporate both elastic and plasticzones on the constitutive surface.
The development of a volume change model for unsatu-rated geomaterials requires applying at least one of thecontrolling state variables, being moisture content and suc-tion (Gould et al., 2011). The state variable is defined asany ‘‘non-material variable required for characterizing amaterial system” (Fredlund and Rahardjo, 1993, Lu andLikos, 2004). Lu (2008) believes that any variable withthe potential of substantial impact on the mechanicalbehavior can be taken as a stress state variable. As a result,both suction and moisture content could be considered asstress state variables. Although, accepting the moisturecontent as a state variable could be debatable, as moisturecontent does not incorporate stress units.
Some researchers have focused on developing moisturecontent (MC)-based frameworks, with the goal of develop-ing a practical and cost-effective framework that workedwith conventional testing methods, backed by a robust the-oretical basis. Heath et al. (2004) developed a model tointerpret the behavior of unsaturated granular materialsthat did not require the measurement of suction. Theirmodel required void ratio, MC, and model parametersachievable through conventional triaxial tests. Kodikara(2012) proposed the most extensive MC-based frameworkbeing Monash-Peradeniya-Kodikara (MPK). In the MPKframework, a derivative of MC was incorporated in placeof suction, based on the work input equation proposedby Houlsby (1997) in order to explain the volumetricbehavior of compacted unsaturated fine soils. Kodikara(2012) incorporated ‘‘suction” indirectly, by stating thatat a constant net stress, the soil water characteristic curverelates MC and suction. Experimental results of Gouldet al. (2011) and Fleureau et al. (2002) show that in con-trast to suction, in a condition that is environmentally sta-bilized, moisture ratio and void ratio do not exhibithydraulic hysteresis. A similar conclusion can be drawnfrom experimental results presented by Raveendiraraj(2009) through comparing the hysteresis effect in voidratio-suction and void ratio-moisture ratio plots obtainedfrom the behavior of kaolin. Kodikara (2012) concluded
3
that the significant void ratio-suction and moisture ratio-suction hysteresis may be minimized, if not eliminated, bycoupling void ratio and moisture ratio. In the currentresearch, the insignificant hysteresis between moisture con-tent and void ratio was the rationale behind selecting aMC-based framework over conventional suction-basedapproaches. This was to meet an important objective ofthis research being the development of a prediction modelwith simplicity in achieving input parameters of the modelthrough non-complex testing procedures available in typi-cal geotechnical testing facilities.
The outcome of the MPK framework was a constitutivesurface in the void ratio, moisture ratio (product of thespecific gravity and MC) and net stress (e-ew-p) space,formed by a number of compaction curves at various com-paction pressures. The surface was named Loading-Wetting State Boundary Surface (LWSBS) and representedthe loosest state of a compacted soil at any specific netstress and moisture ratio (Islam and Kodikara, 2015). Sim-ilar to BBM type constitutive surfaces, each point onLWSBS represents a yield point, therefore, if a sample ata certain ew and e is loaded to a stress equivalent to theyield stress, then wetted to saturation, the maximum col-lapse would be achieved and the amount of the collapsecould be predicted by following the e-ew curve correspond-ing to the yield stress contour. The yield stress contour is infact, the compaction curve of the yield (net) stress startingfrom (e, ew) of interest to (eopt, ewopt), where eopt and ewoptrepresent void ratio and moisture ratio at optimum mois-ture content, respectively. Minimum collapse could beobtained if the same sample was loaded to a stress equalor less than the yield stress of the saturated sample.
The uniqueness of the LWSBS for unsaturated finesoils has been verified through several investigationsincluding Islam and Kodikara (2015). Since its develop-ment, a few researchers have focused on expanding theapplication of the MPK framework application.Abeyrathne (2017) extended the application of the MPKframework to explain the deviatoric behavior of com-pacted clay, by developing a unique state surface in aspace of specific volume, specific water volume(=1 + ew) and net stress. Al-Taie et al. (2018) andAl-Taie et al. (2019) utilized the MPK framework in orderto explain the collapse and swelling potential of lime trea-ted highly expansive basaltic clay. They reported that asignificant collapse and swelling potential existed whenthe lime-treated specimens were prepared at a high suc-tion value and wetted under low net stresses even withspecimens being stabilized with lime at optimum lime con-tent. Kieu and Mahler (2018) incorporated suction in aLWSBS developed for a type of Hungarian high plasticityclay using the MPK framework and investigated thevolumetric behavior of the soil with respect to changesin p, ew, and w. They concluded that the MPK frameworkwas able to explain not only the volumetric behavior ofsoils but also the shearing and tensile behavior of unsatu-rated soils. Jayasundara et al. (2019) advanced the MPK

100 kPa
1000 kPa
500 kPa
200 kPa
2000 kPa
4000 kPa
Stress contour of pConstant Sr
Sr=1LOOSr=0.5
Sr=0.2
VCS
Compaction test data points
Fig. 1. The VCS developed for CB showing the stress contours in thespace of e-ew–p.
Table 1Model parameters used for the development of VCS for CB and WR.
Model Parameter CB WR
ewd 0.2 0.1es0 0.65 0.682ed0 0.755 0.793plow 100 kPa 100 kPaf 0.81 0.84ks 0.065 0.069kd 0.091 0.087
E. Yaghoubi et al. Soils and Foundations xxx (xxxx) xxx
framework by undertaking drying stress paths and verify-ing the uniqueness of the LWSBS during drying paths.
The MPK framework and the studies that have furtherverified or expanded the application of this frameworkhave all been proven to be valid for fine-grained materials.However, the research work for expanding the applicationof the framework to unsaturated granular material is lim-ited to Yaghoubi et al. (2019). The virgin compaction sur-face (VCS) developed by Yaghoubi et al. (2019) waspartially capable of explaining the volumetric behavior ofthe granular material and was investigated through a lim-ited number of the state paths and stress levels. Additionalstate paths through an extended experimental program wasrequired for further investigation of the VCS which werecarried out and presented in the current article.
In this paper, for the first time, a moisture content-basedloading-wetting predictive model is presented and verifiedthat is capable of providing an accurate interpretation ofthe volumetric behavior of unsaturated granular materialsin a wide range of stress levels and moisture contents. Previ-ous models of unsaturated granular materials may or maynot give more accurate results compared to the currentmodel; they, however, share a drawback from the geotechni-cal industry’s perspective which is the need for specializedequipment for the determination of suction-based modelparameters. For instance, Pham and Fredlund (2011) pro-posed ameticulous constitutivemodel, capable of predictingthe volumetric responses of granular soils. Despite offeringaccurate volume change predictions and e-MCrelationships,the model input parameters required unsaturated testingequipment, not readily available in many testing facilities.
The importance of a realistic interpretation of theloading-wetting volumetric response of granular materialis clearly evident in climatic events. Precipitation or flood-ing can transform geotechnical structures, such as founda-tions of infrastructures, from a more stable unsaturatedcondition to a saturated condition. Understanding the vol-umetric response of granular geostructures to changes inthe stress states caused by loading or wetting is crucial.
2. Background
Virgin compaction surfaces (VCS) for CB and WR werepreviously developed in a moisture content-based schemeusing the experimental data obtained from a group of com-paction curves (Yaghoubi et al., 2019). The VCS was devel-oped by utilizing volume-mass relationship equations toconvert the traditional compaction curves into e-ew curvescorresponding to net stresses of p (hereafter referred to as‘‘stress contours”). Fig. 1 presents the VCS generated forCB in the (e-ew-p) space in which the LOO represents theboundary between the dry and the wet sides of the devel-oped surface. On the dry side, air can easily exit the soil,whereas on the wet side, the air could get trapped if the soilif loaded rapidly. Yaghoubi et al. (2019) proposed a predic-tive model for developing the VCS, as presented in Eqs.(1)–(4).
4
e ¼ ed � es2
� �cos
pewa � ewd
� �ew � ewdð Þ
� �
þ ed þ es2
� �ð1Þ
es ¼ es0 � kslnð pplow
Þ ð2Þ
ed ¼ ed0 � kd lnð pplow
Þ ð3Þ
ewa ¼ 0:5 1þ fð Þes ð4ÞModel parameters used in Eqs. (1)–(4) for developing
the VCS of CB and WR are presented in Table 1 anddefined in Notations.
Previously, a limited number of loading and wettingstate paths were undertaken to investigate the applicabilityof developed VCSs, and the following outcomes wereconcluded:
� The VCSs were unique in incremental monotonic load-ing for the whole range of stress levels applied in theresearch (100–4000 kPa).

E. Yaghoubi et al. Soils and Foundations xxx (xxxx) xxx
� The uniqueness of the VCSs with respect to wetting wasonly verified for stress levels greater than 2000 kPa.
In the abovementioned model, the loading and wettinginduced volumetric behavior of the material was not fullyaddressed. Also, the unloading state paths were not inves-tigated with respect to VCS. In this paper, the focus wasplaced on undertaking more loading and wetting statepaths in order to further evaluate the uniqueness of devel-oped surfaces, as well as investigating unloading statepaths, and the ultimate goal was to develop a more accu-rate constitutive model for interpreting the volumetricbehavior of the unsaturated granular material in a widerrange of stress levels compared to the previous model.
CB
WR
D>9.5 mm D<2.36 mm 9.5 mm>D>2.36 mm
2.36 mm sieve 9.5 mm sieve
Fig. 2. CB and WR samples split into three portions for samplereconstitution.
3. Experimental program
3.1. Materials
The recycled granular materials used in this researchwere Crushed Brick (CB), and Waste Rock (WR) sourcedfrom recycling industries in the state of Victoria, Australia.The reuse of waste granular materials was aimed to pro-mote sustainable design and construction. Table 2 presentsthe geotechnical properties of CB and WR that were usedfor the development of the model proposed in this research.In preparation of the granular samples for the state pathtests, as a measure to achieve maximum consistency, twocontrol sieves were used to split the materials into threeportions as presented in Fig. 2. These three portions weremixed in specific percentages, achieved from the particlesize distribution (PSD) of the as-received material.
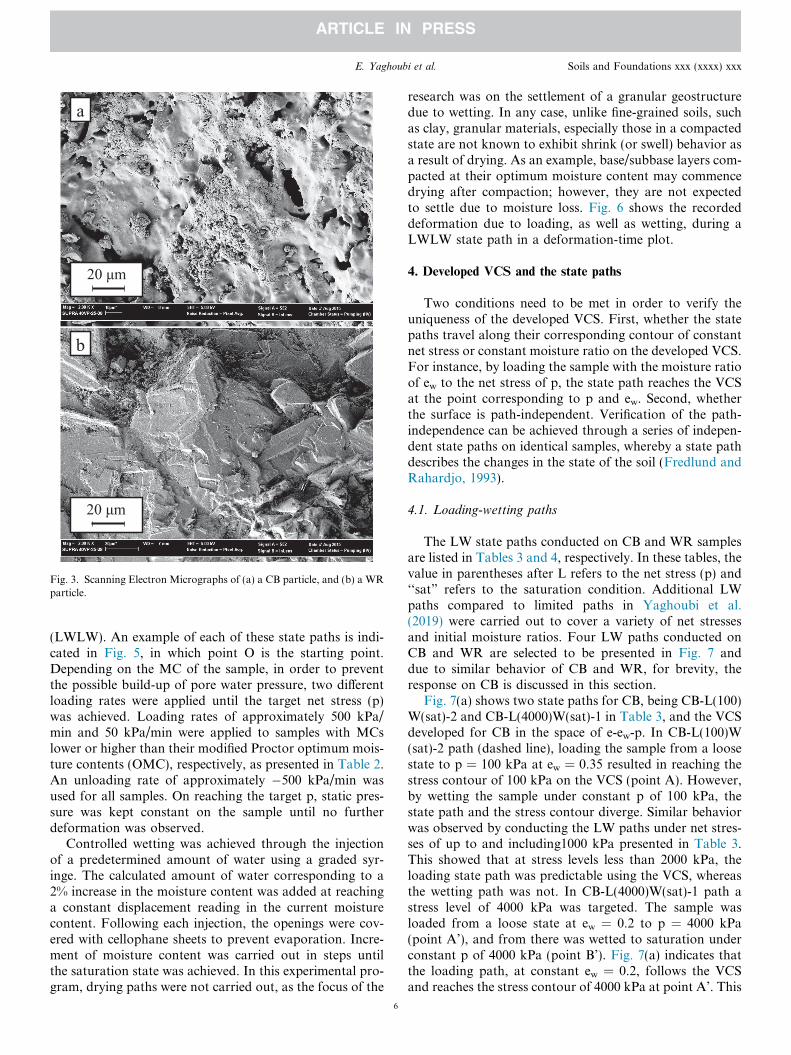
The tactile assessment, together with scanning electronmicrographs presented in Fig. 3 (2000 times magnified)indicate that CB particles (Fig. 3(a)) have a rougher surfacecompared to WR particles (Fig. 3(b)) and hence, greaterinternal friction. Fig. 3 also shows the presence of microp-ores in the CB particle, which could result in CB sampleshaving dual porosity. However, reviewing soil water char-acteristics curves (SWCC) of CB blends available in the lit-erature (Azam et al. (2013) and Azam et al. (2014) amongothers) does not show similarities with SWCC of the gran-ular material with dual porosity. A CB sample compactedto the modified Proctor MDD at moisture content of 7.5%(the driest state of CB in this research) will have a range of
Table 2Geotechnical properties of CB and WR.
Material Specificgravity, Gs
Fine content (%)[particles finerthan 0.075 mm]
Maximumparticle size(mm)
CrushedBrick(CB)
2.64 6 19
WasteRock(WR)
2.82 4 19
5
suction between 1 and 5 kPa estimated using Aubertin et al.(2003) and Perera et al. (2005) predictive models. Thisrange for WR at the driest state of WR in this research(3.6%) is 0.7 to 1.5 kPa. CB and WR have estimated suc-tion of less than 1 kPa and 0.5 kPa at close-to-saturationstates, respectively.
3.2. Testing equipment
The testing equipment consisted of a loading system, thetesting mold, and accessories. The loading system was aUTM-100 machine (100 kN capacity) equipped with a loadcell and Linear Variable Differential Transformer (LVDT)connected to a data logger in order to record the stress anddeformations during the tests. Three openings in the wall ofthe mold and three openings on the loading plate allowedfor the controlled injection of water (wetting) from thetop and sides of the sample during the tests. The testingequipment are presented in Fig. 4. During the tests, drai-nage was allowed from the top of the sample. Lubricatinggrease was used on the internal wall of the mold to reducethe influence of friction between soil and mold.
3.3. Loading, unloading and wetting procedures
The state paths conducted in this research includedLoading-Wetting (LW), Loading-Unloading–Wetting(LUW) and Loading-Wetting-(greater) Loading-Wetting
Maximum DryDensity (kg/m3)
Optimummoisture content(%)
Waterabsorption(%)
Hydraulicconductivity(m/s)
1990 10.8 6.6 1.16 � 10�6
2220 5.7 4.1 2.45 � 10�6
a
b
20 μm
20 μm
Fig. 3. Scanning Electron Micrographs of (a) a CB particle, and (b) a WRparticle.
E. Yaghoubi et al. Soils and Foundations xxx (xxxx) xxx
(LWLW). An example of each of these state paths is indi-cated in Fig. 5, in which point O is the starting point.Depending on the MC of the sample, in order to preventthe possible build-up of pore water pressure, two differentloading rates were applied until the target net stress (p)was achieved. Loading rates of approximately 500 kPa/min and 50 kPa/min were applied to samples with MCslower or higher than their modified Proctor optimum mois-ture contents (OMC), respectively, as presented in Table 2.An unloading rate of approximately �500 kPa/min wasused for all samples. On reaching the target p, static pres-sure was kept constant on the sample until no furtherdeformation was observed.
Controlled wetting was achieved through the injectionof a predetermined amount of water using a graded syr-inge. The calculated amount of water corresponding to a2% increase in the moisture content was added at reachinga constant displacement reading in the current moisturecontent. Following each injection, the openings were cov-ered with cellophane sheets to prevent evaporation. Incre-ment of moisture content was carried out in steps untilthe saturation state was achieved. In this experimental pro-gram, drying paths were not carried out, as the focus of the
6
research was on the settlement of a granular geostructuredue to wetting. In any case, unlike fine-grained soils, suchas clay, granular materials, especially those in a compactedstate are not known to exhibit shrink (or swell) behavior asa result of drying. As an example, base/subbase layers com-pacted at their optimum moisture content may commencedrying after compaction; however, they are not expectedto settle due to moisture loss. Fig. 6 shows the recordeddeformation due to loading, as well as wetting, during aLWLW state path in a deformation-time plot.
4. Developed VCS and the state paths
Two conditions need to be met in order to verify theuniqueness of the developed VCS. First, whether the statepaths travel along their corresponding contour of constantnet stress or constant moisture ratio on the developed VCS.For instance, by loading the sample with the moisture ratioof ew to the net stress of p, the state path reaches the VCSat the point corresponding to p and ew. Second, whetherthe surface is path-independent. Verification of the path-independence can be achieved through a series of indepen-dent state paths on identical samples, whereby a state pathdescribes the changes in the state of the soil (Fredlund andRahardjo, 1993).
4.1. Loading-wetting paths
The LW state paths conducted on CB and WR samplesare listed in Tables 3 and 4, respectively. In these tables, thevalue in parentheses after L refers to the net stress (p) and‘‘sat” refers to the saturation condition. Additional LWpaths compared to limited paths in Yaghoubi et al.(2019) were carried out to cover a variety of net stressesand initial moisture ratios. Four LW paths conducted onCB and WR are selected to be presented in Fig. 7 anddue to similar behavior of CB and WR, for brevity, theresponse on CB is discussed in this section.
Fig. 7(a) shows two state paths for CB, being CB-L(100)W(sat)-2 and CB-L(4000)W(sat)-1 in Table 3, and the VCSdeveloped for CB in the space of e-ew-p. In CB-L(100)W(sat)-2 path (dashed line), loading the sample from a loosestate to p = 100 kPa at ew = 0.35 resulted in reaching thestress contour of 100 kPa on the VCS (point A). However,by wetting the sample under constant p of 100 kPa, thestate path and the stress contour diverge. Similar behaviorwas observed by conducting the LW paths under net stres-ses of up to and including1000 kPa presented in Table 3.This showed that at stress levels less than 2000 kPa, theloading state path was predictable using the VCS, whereasthe wetting path was not. In CB-L(4000)W(sat)-1 path astress level of 4000 kPa was targeted. The sample wasloaded from a loose state at ew = 0.2 to p = 4000 kPa(point A’), and from there was wetted to saturation underconstant p of 4000 kPa (point B’). Fig. 7(a) indicates thatthe loading path, at constant ew = 0.2, follows the VCSand reaches the stress contour of 4000 kPa at point A’. This

a b
Load Cell & LVDT
Loading Plate
Testing Mold and Base
Test
ing
Mol
d an
d B
ase
Top
View
Te
stin
g M
old
and
Acc
esso
ries
Sec
tion
A-A
Te
stin
g M
old
To
p Vi
ew
Fig. 4. Testing equipment: (a) image of the compaction mold, loading frame and the accessories, (b) detailed drawings of the mold, base and loading plate.
E. Yaghoubi et al. Soils and Foundations xxx (xxxx) xxx
was expected since the VCS is defined as the loosest state ofthe sample at any specific p and ew of interest. Interestingly,the wetting path followed the stress contour of 4000 kPa.Similar behavior was observed when specimens were pre-pared at different moisture ratios and loaded to the stressesof 2000 kPa and 4000 kPa and then wetted to saturation.This showed that both loading and wetting-induced defor-mations were predictable using the VCS, provided that thewetting path was undertaken under stress levels greaterthan 2000 kPa. Undertaking several more LW paths onWR samples, such as those presented in Fig. 7(b) with dif-ferent initial ew and p, further supported the conclusionsmade based on LW paths on CB.
The state paths listed in Tables 3 and 4, also indicatedthat the deformation through wetting was to a great extentlower when the initial ew was shifted towards the wet endon the surface. This can be explained by the typical SWCCshape for granular materials, although the focus of the cur-rent research is working within a moisture content-basedframework. Changes in moisture content close to the dryend of the SWCC result in greater changes in suction com-pared to those resulted by the same moisture variation clo-ser to the wet end of the SWCC. For instance, while thechange of Sr from 80% to 90% results in 0.06 kPa reductionof suction for WR, following Perera et al. (2005) predic-tion, increasing Sr from 10% to 20% results in 9.7 kPareduction of suction, which is about 160 times greater. A
7
greater change in suction, as an internal stress, due to thechange in MC allows for greater deformation comparedto a lower suction change caused by the same change inMC.
4.2. Loading-unloading-wetting paths
The LUW state paths conducted on CB and WR arelisted in Table 5. In Table 5, the value in parentheses afterL and U refers to the net stress (p) and ‘‘sat” refers to thesaturation condition. The paths were selected to cover sev-eral net stresses and difference between stress levels, as wellas several initial moisture ratios. Two of the LUW pathswere selected to be presented and discussed in this section(Fig. 8).
Fig. 8(a) shows CB-L(1000)U(500)W(sat) path and theVCS developed for CB. In this figure, the sample wasloaded from a loose state (point O) at ew = 0.23 top = 1000 kPa (point A), unloaded to p = 500 kPa (pointB) at the same ew, and finally wetted to saturation underp = 500 kPa (point C). The loading path (OA) reachedthe stress contour of 1000 kPa while closely following theew contour of 0.23. By unloading the sample, the state pathmoved away from the VCS to the space under the surface.This was due to the fact that VCS represents the looseststate of the sample at any p and ew while the sample atpoint B had experienced a net stress greater than

Fig. 5. An example of state paths of (a) LW, (b) LUW, and (c) LWLW.
80
130
180
230
280
330
380
430
480
530
2
3
4
5
6
7
8
9
10
11
0 20 40 60 80 100 120 140 160 180 200
Net
stre
ss (k
Pa)
Def
orm
atio
n (m
m)
Time (min)
DeformationNet stressp = 100 kPa
p = 500 kPa
1st injection
2nd injection
3rdin
ject
ion
5thin
ject
ion
4thin
ject
ion
Fig. 6. An example of deformation-time plot during a LWLW state path.
E. Yaghoubi et al. Soils and Foundations xxx (xxxx) xxx
500 kPa, i.e. 1000 kPa at point A. By wetting the sampleunder p = 500 kPa, the state path moved towards the
8
Sr = 1 line. However, the path did not reach the stress con-tour corresponding to p = 500 kPa. Therefore, the statepath remained under the surface from its driest to its wet-test condition. A similar pattern was observed in otherLUW paths carried out on CB samples listed in Table 5.
Fig. 8(b) demonstrates the WR-L(4000)U(100)W(sat)path and the VCS developed for WR. In this path, theWR sample was loaded from a loose state at ew = 0.14to p = 4000 kPa (point A), unloaded to p = 100 kPa (pointB), and finally wetted to saturation under p = 100 kPa(point C). By unloading the sample to a lower stress level,the state path moved to the space under the VCS. By wet-ting the unloaded sample to the saturation condition underp = 100 kPa, the state path did not reach the stress contourof 100 kPa, as it had experienced a significantly denser stateunder p = 4000 kPa. Experimental results of LUW pathslisted in Table 5 revealed the uniqueness of the VCS withrespect to loading. However, wetting the sample under aconstant stress that was lower that the compaction stresscould not be interpreted using the developed VCS.
LUW paths presented in Table 5 were further investi-gated by calculating the unloading coefficient (j) and hyd-ric coefficient (a) obtained from the LUW state paths. Theunloading coefficient is the gradient of changes in e due tounloading at a constant ew. The hydric coefficient is thegradient of changes in the e due to changes in ew under con-stant p. Coefficients of j and a for each ew or p were calcu-lated using Eqs. (5) and (6) and presented in Table 6.
a ¼ DeWTDew
ð5Þ
j ¼ DeUln pU
pL
ð6Þ
where DeWT is the change in void ratio due to wetting fromthe initial ew to the final ew (B-C paths in Fig. 8), DeU is thechange in void ratio due to unloading, Dew is the change inmoisture ratio, pL is the net stress at the end of loading,and pU is the net stress after unloading.
It is revealed that the values of DeWT are close to zero. Inother words, samples that had undergone a higher load of pLdo not show a considerable volume change through wettingunder a lower load of pU. The results in Table 6 also indicatethat a coefficients are generally lower than j coefficients andboth a and j are very close to zero. A hydric coefficient (a) of0.222 was reported for kaolin sample loaded to pL = 1000-kPa, unloaded to pU = 500 kPa and wetted under the samepU in Islam (2015). Under the same stress levels of load-ing–unloading, a significantly lower a coefficient of 0.002was obtained for CB (and correspondingly for WR).
In LUW paths presented by Islam and Kodikara (2015),the kaolin sample unloaded to the net stress of p initiallyexpanded during wetting until reaching the VCS and fromthere followed the surface. In other words, the void ratio ofthe unloaded sample initially increased through wetting.This could be due to the reduction of inter-particle suctionpressure during wetting. In compacted samples of CB and

Table 3A summary of the LW state paths carried out on CB.
Path ID Initial ew Test Description
CB-L(100)W(sat)-1 0.20 Loading from a loose state at MC = 7.6% to p = 100 kPa and wetting under p = 100 kPa to saturationCB-L(100)W(sat)-2 0.35 Loading from a loose state at MC = 13.4% to p = 100 kPa and wetting under p = 100 kPa to saturationCB-L(200)W(sat) 0.34 Loading from a loose state at MC = 12.7% to p = 200 kPa and wetting under p = 200 kPa to saturationCB-L(500)W(sat)-1 0.20 Loading from a loose state at MC = 7.6% to p = 500 kPa and wetting under p = 500 kPa to saturationCB-L(500)W(sat)-2 0.31 Loading from a loose state at MC = 11.7% to p = 500 kPa and wetting under p = 500 kPa to saturationCB-L(1000)W(sat)-1 0.20 Loading from a loose state at MC = 7.6% to p = 1000 kPa and wetting under p = 1000 kPa to saturationCB-L(1000)W(sat)-2 0.27 Loading from a loose state at MC = 10.2% to p = 1000 kPa and wetting under p = 1000 kPa to saturationCB-L(2000)W(sat) 0.25 Loading from a loose state at MC = 9.5% to p = 2000 kPa and wetting under p = 2000 kPa to saturationCB-L(4000)W(sat)-1 0.20 Loading from a loose state at MC = 7.6% to p = 4000 kPa and wetting under p = 4000 kPa to saturationCB-L(4000)W(sat)-2 0.23 Loading from a loose state at MC = 8.7% to p = 4000 kPa and wetting under p = 4000 kPa to saturation
Table 4A summary of the LW state paths carried out on WR.
Path ID Initial ew Test Description
WR-L(100)W(sat)-1 0.10 Loading from a loose state at MC = 3.6% to p = 100 kPa and wetting under p = 100 kPa to saturationWR-L(100)W(sat)-2 0.13 Loading from a loose state at MC = 4.5% to p = 100 kPa and wetting under p = 100 kPa to saturationWR-L(100)W(sat)-3 0.17 Loading from a loose state at MC = 6% to p = 100 kPa and wetting under p = 100 kPa to saturationWR-L(200)W(sat) 0.17 Loading from a loose state at MC = 6.1% to p = 200 kPa and wetting under p = 200 kPa to saturationWR-L(500)W(sat)-1 0.10 Loading from a loose state at MC = 3.6% to p = 500 kPa and wetting under p = 500 kPa to saturationWR-L(500)W(sat)-2 0.14 Loading from a loose state at MC = 5% to p = 500 kPa and wetting under p = 500 kPa to saturationWR-L(500)W(sat)-3 0.17 Loading from a loose state at MC = 6% to p = 500 kPa and wetting under p = 500 kPa to saturationWR-L(1000)W(sat)-1 0.10 Loading from a loose state at MC = 3.6% to p = 1000 kPa and wetting under p = 1000 kPa to saturationWR-L(1000)W(sat)-2 0.14 Loading from a loose state at MC = 5% to p = 1000 kPa and wetting under p = 1000 kPa to saturationWR-L(2000)W(sat) 0.17 Loading from a loose state at MC = 6.1% to p = 2000 kPa and wetting under p = 2000 kPa to saturationWR-L(4000)W(sat)-1 0.10 Loading from a loose state at MC = 3.8% to p = 4000 kPa and wetting under p = 4000 kPa to saturationWR-L(4000)W(sat)-2 0.17 Loading from a loose state at MC = 6.1% to p = 4000 kPa and wetting under p = 4000 kPa to saturation
(a) (b)
Fig. 7. The state paths of (a) CB-L(100)W(sat)-2 and CB-L(4000)W(sat)-1, and (b) WR-L(500)W(sat)-2 and WR-L(2000)W(sat), and their correspondingVCS, in the space of e-ew-p.
E. Yaghoubi et al. Soils and Foundations xxx (xxxx) xxx
WR, changes in suction before and after wetting was lim-ited to a maximum of 10 kPa (Yaghoubi et al., 2017). Thus,unlike the non-swelling kaolin sample, the reduction of suc-tion did not have a significant influence on the volume
9
change of the compacted sample. The interlock due tointernal friction between the relatively rough CB and WRparticles prevented the sample from expansion due to wet-ting. Hence, the hydric coefficient was close to zero.

Table 5A summary of the LUW state paths carried out on CB and WR.
Path ID Initial ew Test Description
CB-L(500)U(100)W(sat) 0.20 Loading CB sample from a loose state at MC = 7.7% to p = 500 kPa, unloading to p = 100 kPa wettingunder p = 100 kPa to saturation
CB-L(1000)U(500)W(sat) 0.23 Loading CB sample from a loose state at MC = 8.9% to p = 1000 kPa, unloading to p = 500 kPa wettingunder p = 500 kPa to saturation
CB-L(4000)U(100)W(sat) 0.27 Loading CB sample from a loose state at MC = 10.1% to p = 4000 kPa, unloading to p = 100 kPa wettingunder p = 100 kPa to saturation
WR-L(200)U(100)W(sat) 0.12 Loading WR sample from a loose state at MC = 4.1% to p = 200 kPa, unloading to p = 100 kPa wettingunder p = 100 kPa to saturation
WR-L(500)U(200)W(sat) 0.10 Loading WR sample from a loose state at MC = 3.6% to p = 500 kPa, unloading to p = 200 kPa wettingunder p = 200 kPa to saturation
WR-L(4000)U(100)W(sat) 0.14 Loading WR sample from a loose state at MC = 5% to p = 4000 kPa, unloading to p = 100 kPa wettingunder p = 100 kPa to saturation
(a) (b)
Fig. 8. The state paths of (a) CB-L(1000)U(500)W(sat), and (b) WR-L(4000)U(100)W(sat), and their corresponding VCS, in the space of e-ew-p.
E. Yaghoubi et al. Soils and Foundations xxx (xxxx) xxx
4.3. Loading-wetting-loading-wetting paths
The LWLW state paths are a combination of two LWpaths starting from two different moisture ratios. TheLWLW state paths conducted on CB and WR samplesare listed in Table 7. The LWLW paths were selected inorder to cover different stress levels, as well as several initialmoisture ratios. Two of the LWLW paths were selected tobe presented in Fig. 9 and due to similar behavior of CBand WR, for brevity, the response on CB samples is dis-cussed in this section.
Fig. 9(a) shows the CB-L(100)W(0.36)L(500)W(sat)path and the VCS developed for CB. In this path, the CBsample was loaded from a loose state (point O) atew = 0.23 to p = 100 kPa (point A), wetted to ew = 0.36(point B), then loaded to p = 500 kPa (point C), and finallywetted to saturation under p = 500 kPa (point D). Theloading paths (OA and BC) reached their correspondingstress contours. Wetting paths (AB and CD), however,did not closely follow their corresponding stress contours.
10
This is in agreement with the conclusion made before,based on the LW paths that the wetting path under lowstress levels, such as 200 kPa and 500 kPa cannot be inter-preted accurately by the VCS.
As demonstrated in Fig. 9(b) both loading paths of OAand BC reached their corresponding stress contours on theVCS of WR. While the wetting path of CD closely fol-lowed, although not as closely as CB samples, the corre-sponding e-ew curve for p = 4000 kPa, the curve forp = 100 kPa was not followed by the AB path. This furtherverified the previously made conclusion that the wettingpaths follow the VCS provided that the stress level isgreater than 2000 kPa. In Fig. 9, BC paths only indicatethe beginning and end-point of the loading path and nodata were collected between A and B.
4.4. Discussion on the uniqueness of the developed VCS
Conducting several LW state paths with initial moisturecontents ranging from 3.9% to 13.4% under constant net

Table 7A summary of the LWLW state paths carried out on CB and WR.
Path ID Initial ew Test Description
CB-L(200)W(0.28)L(4000)W(sat) 0.20 Loading CB sample from a loose state at MC = 7.6% to p = 200 kPa, wetting to MC = 10.6%under p = 200 kPa, then loading to p = 4000 kPa and wetting under p = 4000 kPa to saturation
CB-L(100)W(0.36)L(500)W(sat) 0.23 Loading CB sample from a loose state at MC = 8.8% to p = 100 kPa, wetting to MC = 13.8%under p = 100 kPa, then loading to p = 500 kPa and wetting under p = 500 kPa to saturation
CB-L(500)W(0.31)L(1000)W(sat) 0.20 Loading CB sample from a loose state at MC = 7.7% to p = 500 kPa, wetting to MC = 11.7%under p = 500 kPa, then loading to p = 1000 kPa and wetting under p = 1000 kPa to saturation
WR-L(100)W(0.22)L(4000)W(sat) 0.13 Loading WR sample from a loose state at MC = 4.7% to p = 100 kPa, wetting to MC = 7.7%under p = 100 kPa, then loading to p = 4000 kPa and wetting under p = 4000 kPa to saturation
WR-L(100)W(0.26)L(500)W(sat) 0.12 Loading WR sample from a loose state at MC = 4.3% to p = 100 kPa, wetting to MC = 9.3%under p = 100 kPa, then loading to p = 500 kPa and wetting under p = 500 kPa to saturation
WR-L(500)W(0.22)L(1000)W(sat) 0.10 Loading WR sample from a loose state at MC = 3.7% to p = 500 kPa, wetting to MC = 7.7%under p = 500 kPa, then loading to p = 1000 kPa and wetting under p = 1000 kPa to saturation
Table 6Unloading and hydric coefficients of CB and WR.
Path ID Dew DeWT DeU a j
CB-L(500)U(100)W(sat) 0.294 0.0001 0.004 0.000 �0.002CB-L(1000)U(500)W(sat) 0.169 �0.0003 0.003 �0.002 �0.004CB-L(4000)U(100)W(sat) 0.068 0.0002 0.023 0.003 �0.006WR-L(200)U(100)W(sat) 0.421 �0.0002 0.001 �0.001 �0.002WR-L(500)U(200)W(sat) 0.405 0.0000 0.002 0.000 �0.003WR-L(4000)U(100)W(sat) 0.209 0.0003 0.024 0.001 �0.006
E. Yaghoubi et al. Soils and Foundations xxx (xxxx) xxx
stresses of 100–4000 kPa showed that the developed VCSswere unique with respect to loading. However, in wettingpaths, the surface was only unique under net stresses higherthan 2000 kPa. Comparison of the measured and predictedvoid ratios during wetting paths under stress levels greaterthan 2000 kPa, following Witczak et al. (2002) criteriashowed ‘‘Excellent” and ‘‘Good” accuracy. The accuracyof the predicted data is presented in Table 8. In this table,R2 is the coefficient of determination, Se is the standard
(a) (b
Fig. 9. The state paths of (a) CB-L(100)W(0.36)L(500)W(sat) and (b) WR-L(1ew-p.
11
error of estimate and Sy is the standard deviation. Evi-dently, the predicted response of CB samples showed a bet-ter correlation with the experimental data compared to thatof WR. Also, the LWLW state paths carried out for severalstress levels and initial moisture ratios were in agreementwith the results of individual LW state paths.
The path-independence of the developed VCS was previ-ously verified by Yaghoubi et al. (2019). They showed thatfor CB and WR, both Loading-Wetting (LW) and
)
00)W(0.22)L(4000)W(sat), and their corresponding VCS, in the space of e-

Table 8Evaluation of the accuracy of predicted data.
Material State Path No. of data points (n) R2 Se/Sy Witczak et al. (2002) criteria
CB Wetting under p � 2000 kPa 13 0.97 0.19 ExcellentWR Wetting under p � 2000 kPa 16 0.72 0.53 Good
E. Yaghoubi et al. Soils and Foundations xxx (xxxx) xxx
Wetting-Loading (WL) state paths with the same initialand final moisture and net stress conditions reached a closelocation on their corresponding VCS, provided that thefinal net stress level was equal or greater than 2000 kPa.
The LUW state paths revealed three points. Firstly, theuniqueness of the surface with respect to loading was fur-ther verified. In all the LUW paths, loading a sample tothe net stress of p, took the path to the corresponding stresscontour on the VCS. Secondly, when the sample wasunloaded to a lower net stress, the path was directed fromthe surface to underneath the surface, confirming that theVCS is a set of all points that represent the loosest stateat a given net stress and void ratio. Thirdly, if the sampleunloaded to the net stress of p and wetted under constantp until it intercepted the stress contour of p, the surfacewould not have been followed afterwards (e.g. Fig. 8). Thisshowed that the uniqueness of the surface due to changes inthe state variable of net stress was limited to monotonicloading. In other words, the VCS is only followed in incre-mental monotonic loading (increasing p), and monotonicwetting (increasing ew).
4.5. Limitations of the developed VCS
The developed VCSs are applicable to stress levelsbetween 100 kPa and 4000 kPa. Therefore, the initial load-ing paths from a loose state to sample compacted to100 kPa cannot be interpreted using the surface. The selec-tion of the lower limit, i.e. 100 kPa, was through a basicestimation of the vertical stress at a depth of 250 mmcaused by a vehicle with approximately 500 kPa pressureat the pavement-tire interface, using Foster and Ahlvin(1954) chart for the distribution of vertical stress due to cir-cular area loading. The selection of the upper limit, i.e.4000 kPa was due to the capacity of the testing tools andequipment.
The proposed VCSs that generate a direct relationshipbetween the traditional compaction curves and the consti-tutive deformation response of soils aim to provide a sim-ple approach for practical engineering applications asexplained in Section 7 of this article. However, even thoughpartially, as discussed in Sections 4.1–4.3, VCSs cannotfully illustrate the complex behavior of unsaturated granu-lar materials such as loading-unloading-reloading andwetting-drying paths.
Advocating the use of moisture ratio does not under-mine the work that can be done on hysteresis with suction.The lack of directly incorporating suction in the moisturecontent-based framework is not theoretically incorrect;rather, it makes this approach a partial theory with the
12
goal of developing a method in which some difficultiesand complexities with previous models can be resolved.Incorporating suction is required as a state variable inthe water flow equation. Nevertheless, moisture diffusivitycan also be used to model the water flow and hence, theequation can be developed using moisture content alone(Al-Taie et al., 2019). Although, this approach is limitedto modelling a single material layered system. In two ormore layered systems, the suction in the interface betweenthe two materials is the same, but the moisture contents ofthe two materials can be different, and hence, the SWCC isneeded to relate the suction to the corresponding moisturecontents.
4.6. The need for an accurate model to predict the volume
changes
The wetting part of the LW paths presented in Tables 3and 4 showed relatively smaller volume changes comparedto those of fine materials, especially when the sample wasunder higher net stresses. In granular geostructures suchas unbound pavement base and subbase courses whichare normally well compacted and contain low fine contents,relatively small volume changes occur through wetting(Heath et al., 2004). Based on the estimation of suction val-ues using Aubertin et al. (2003) and Perera et al. (2005)models, reduction of suction (Dw) for CB wetted fromSr = 0.48 to Sr = 1 under p � 200kpa was less than2 kPa (1% of p) and 10 kPa (5% of p), respectively. Inthe same wetting and loading regime, Dw of approximately150 kPa (75% of p) for pearl clay in Sun et al. (2007) and500 kPa (250% p) in Islam (2015) for kaolin was achieved.
In spite of low volume changes of the compacted gran-ular material through wetting, accumulation of small vol-ume changes eventually results in major distresses such asrutting. The investigation of the state paths, revealed thatthe VCS is incapable of accurately predicting the wettinginduced deformations under net stresses lower than2000 kPa. Granular materials are known to show notablydifferent volumetric behavior under low net stresses com-pared to higher pressure conditions (Macari-Pasqualinoet al., 1994). High internal frictions between rough-surfaced particles of granular materials and low suctionpressure in these materials could result in a differentresponse in LW state paths, leading to the wetting pathsnot following the developed VCS in low stress levels. Inthe case of WR, even at stress levels greater than2000 kPa, the accuracy of the predicted paths was ‘‘Good”and not ‘‘Excellent”. These observations necessitate thedevelopment and validation of a more accurate model to

E. Yaghoubi et al. Soils and Foundations xxx (xxxx) xxx
interpret the volumetric behavior of the loaded samplesduring the wetting state paths.
5. Development of the wetting path model
In order to develop the wetting path model, the e-ewcurves of the wetting part of the LW paths were carefullyobserved. The wetting paths under any specific constantnet stress, starting from different void ratios dependingon their initial moisture condition, generally formed nearlyparallel curves, based on observing experimental results of22 LW paths (a total of 53 and 84 data points for CB andWR, respectively). More experimental results could furtherverify this conclusion. Fig. 10, shows two wetting curvesunder the constant p of 500 kPa for WR, as an example.The wetting path of the continuous curve started at initialmoisture ratio (ewini) of 0.1 and the path of the dashedcurve started from a greater ewini of 0.14. Even though,the values of initial void ratios corresponding to ewini underconstant net stress of p (epini) were not the same, both curvesfollowed a nearly parallel trend. The curves tended tochange to a linear shape as the sample became wetter thanthe moisture ratio of 0.2. The same behavior was observedin all wetting paths presented in Tables 3 and 4. This indi-cated that the void ratio of interest under the net stress of pðepi Þ corresponding to a moisture ratio of interest (ewi)could be achieved using Eq. (7).
epi ¼ epini � f ðewiÞ ð7Þwhere f(ewi) is a function of ew that gives the reduction of edue to wetting from ewini to ewi.
Two sets of information were required for predicting thevolume change due to wetting. First, a wetting path fromthe driest point of interest (ewd) to saturation, which wasachievable by conducting a single wetting state path test.This gave the maximum achievable reduction of void ratiodue to wetting under the constant net stress of p (Depmax).Second, the state where the wetting started (ewini, epini).Value of epini could be achieved from Eq. (1).
Fig. 10. Close-up images of two wetting paths under the same net stress(500 kPa), but starting from different initial moisture ratios for WR.
13
In order to propose an equation for f(ewi), the reductionof e due to wetting from ewini to ewi under the net stress of p(Depi ) was obtained using the experimental data and Eq. (8).Evidently, if ewini = ewd, then Depi = Depmax.
Depi ¼ epi � epini ð8Þ
Using the obtained values of Depi , plots of ew-De couldbe drawn. Fig. 11(a) shows schematic ew-e (the continuouscurve) and the corresponding ew-De plots (the dashedcurve) in which the initial condition was the driest pointof interest (points A or A’). In this case, ewini was equalto ewd, hence, e
pini was equal to epd . The equation that defined
the dashed curve in Fig. 11(a) was, in fact, the f(ewi) term inEq. (7).
The dashed curve in Fig. 11(a) resembles the top half ofa logistic function. A typical logistic function is shown inFig. 11(b) with its top half presented in dashed line. Thetrend of the top half of this function shows that increasingthe value of x initially causes a rapid increase in the valueof f(x). However, the rate of increase leans towards zeroafter a specific value of x. This behavior could clearly beseen in Fig. 11(a) (the ew-De curve) considering De as f(x)and ew as x. A standard logistic function is presented inEq. (9).
f xð Þ ¼ L1þ Exp½�k x� x0ð Þ� þ C ð9Þ
where L is the curve’s maximum value, x0 is the x value ofthe curve’s midpoint, k is a parameter that determines thesteepness of the curve, Exp(x) is the exponential function,and C is a constant value.
In order to develop the logistic equation that fits the ew-De curve presented in Fig. 11(a), standard logistic func-tion’s parameters were defined as the following:
� x: ewi� x0: ewd� L: 2Depmax
The maximum achievable value was, in fact, Depmax; how-ever, since only half of the standard logistic function wasused to fit the experimental data, Depmax was multiplied by2 to be taken as L. Accordingly, Eq. (9) could be convertedinto Eq. (10).
g ewið Þ ¼ 2Depmax
1þ expð�k ewi � ewdð ÞÞ þ C ð10Þ
where g(ewi) is a function that gives the reduction of voidratio due to wetting from ewd to ewi under the constant p.
Considering the fact that g(ewi) = 0 where ewi = ewd, Cequals Depmax. Hence, Eq. (10) could be rewritten in theform of Eq. (11).
g ewið Þ ¼ Depi ¼ Depmaxð2
1þ exp �k ewi � ewdð Þð Þ � 1Þ ð11Þ
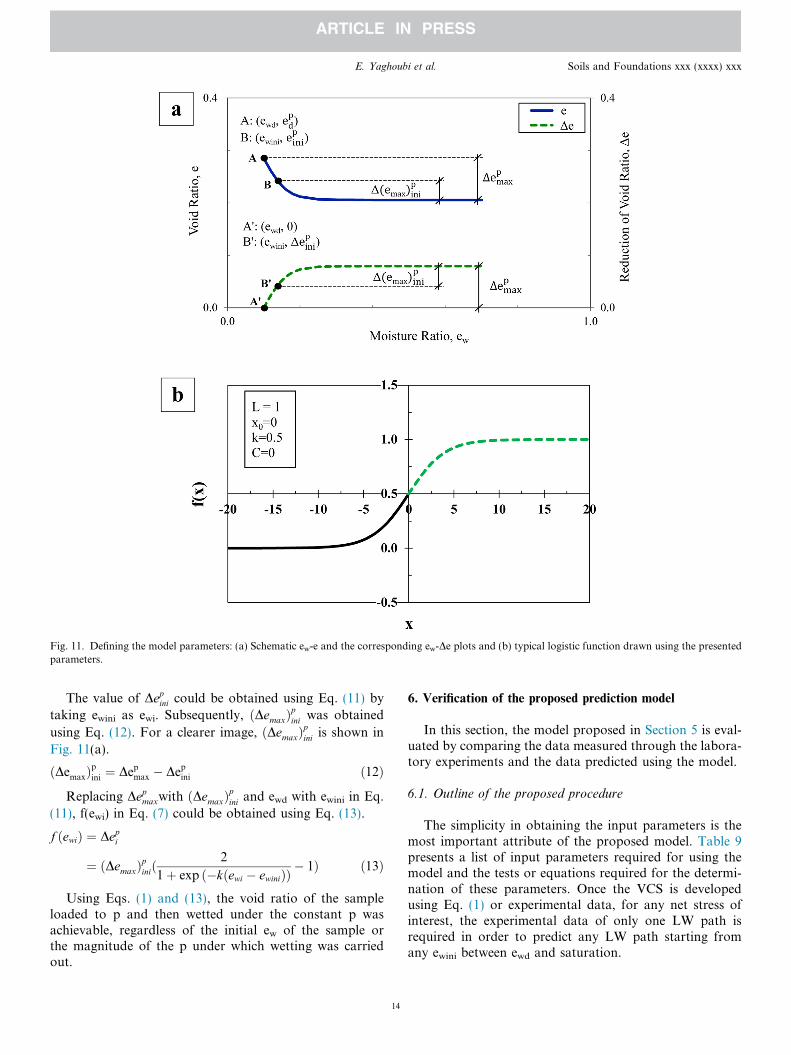
Fig. 11. Defining the model parameters: (a) Schematic ew-e and the corresponding ew-De plots and (b) typical logistic function drawn using the presentedparameters.
E. Yaghoubi et al. Soils and Foundations xxx (xxxx) xxx
The value of Depini could be obtained using Eq. (11) bytaking ewini as ewi. Subsequently, ðDemaxÞpini was obtained
using Eq. (12). For a clearer image, ðDemaxÞpini is shown in
Fig. 11(a).
ðDemaxÞpini ¼ Depmax � Depini ð12ÞReplacing Depmaxwith ðDemaxÞpini and ewd with ewini in Eq.
(11), f(ewi) in Eq. (7) could be obtained using Eq. (13).
f ewið Þ ¼ Depi
¼ ðDemaxÞpinið2
1þ exp �k ewi � ewinið Þð Þ � 1Þ ð13Þ
Using Eqs. (1) and (13), the void ratio of the sampleloaded to p and then wetted under the constant p wasachievable, regardless of the initial ew of the sample orthe magnitude of the p under which wetting was carriedout.
14
6. Verification of the proposed prediction model
In this section, the model proposed in Section 5 is eval-uated by comparing the data measured through the labora-tory experiments and the data predicted using the model.
6.1. Outline of the proposed procedure
The simplicity in obtaining the input parameters is themost important attribute of the proposed model. Table 9presents a list of input parameters required for using themodel and the tests or equations required for the determi-nation of these parameters. Once the VCS is developedusing Eq. (1) or experimental data, for any net stress ofinterest, the experimental data of only one LW path isrequired in order to predict any LW path starting fromany ewini between ewd and saturation.

Table 9Input parameters of the proposed model for LW state paths.
Input parameter Required test/equation No. Required No. of tests
epini Eq. (1) NADepmax LW path from driest condition to saturation condition under p 1 for each p of interestðDemaxÞpini Eq. (9) NAk Fitting the data achieved from LW path (conducted for obtaining Depmax) to Eq. (8) NA
E. Yaghoubi et al. Soils and Foundations xxx (xxxx) xxx
In order to use the model the procedure described belowis proposed:
1) Determine epini before starting the wetting under con-stant p using Eq. (1).
2) Carry out a LW state path test from the driest pointof interest (ewd) to saturation condition (ews) underthe p of interest to obtain epd and epsand the differencebetween these two values (Depmax).
3) Obtain the value of k by fitting Eq. (11) to the dataachieved from the LW state path carried out in Step2.
4) Use Eq. (11) and input ewini for ewi to obtain Depini.5) Use Eq. (12) to obtain ðDemaxÞpini.6) Input ðDemaxÞpini in Eq. (13) to obtainf ewið Þ or Depi .7) Input f(ewi) in Eq. (7) to obtain epi which is the void
ratio of the sample, wetted from ewini to ewi of interestunder constant p of interest.
The value of k depends on the type of material and thestress level in LW paths. The higher the volume change dueto wetting and the lower the constant net stress during wet-ting, the greater the value of k would be. Values of kparameter achieved for LW paths for CB and WR sub-jected to different stress levels are presented in Table 10.The value of k for CB ranged between 5 and 10, whereasthis range for WR extended between 12 and 17.8. Compar-ing the plots of LW state paths for WR and CB showedgreater settlement (steeper curve in the e-ew plane) forWR due to wetting; hence, higher k values. Interestingly,values of k and p showed a linear relationship for bothCB and WR, with the reduction of k as the net stressincreases for both CB and WR. The coefficient of determi-nation (R2) of 0.97 for CB and 0.99 for WR showed that kparameter could be estimated for any p between 100 kPaand 4000 kPa with a high accuracy. Thus, by obtaining kfor the highest and lowest stress levels of interest, k param-eters for any stress level in between can simply beinterpolated.
Table 10Values of k obtained in LW paths under differentstress levels.
p (kPa) CB WR
100 10.0 17.8500 9.2 17.31000 8.0 16.94000 5.0 12.0
15
6.2. Verification using independent loading-wetting paths
In this section, two LW paths for CB and two for WRwere selected to be presented. The LW paths cover differentstress levels and different initial moisture ratios. Fig. 12shows the predicted and measured CB-L(100)W(sat)-2and CB-L(4000)W(sat)-2 state paths in the e-ew and e-logp planes. In the CB-L(100)W(sat)-2 (Fig. 12(a) and (b)),ewini = 0.35, epini=0.720, ðDemaxÞpini = 0.023 andDepmax = 0.063.For the net stress of 100 kPa, the value of k was 10. Thepredicted and measured paths were sufficiently close toeach other verifying the model for predicting the LW statepath under low net stress of 100 kPa.
In another attempt, a LW path obtained under the highnet stress of 4000 kPa was selected to evaluate the model athigh stress levels. Fig. 12(c) and (d) show the measured andpredicted LW path for CB-L(4000)W(sat)-2. In this path,ewini = 0.23, epini= 0.419, ðDemaxÞpini = 0.008, Depmax= 0.009,
and k = 5. Comparing the measured and predicted pathsshowed that the model was capable of predicting the LWstate paths under high net stress of 4000 kPa. The low valueof ðDemaxÞpini might seem negligible at the first glance. How-
ever, it is equivalent to the deformation of approximately1.1 mm for a geotechnical layer with a thickness of200 mm. In terms of pavements, the build-up of such asmall deformation could result in significant deformations,such as rutting, in the long term.
Fig. 13(a) and (b) show the measured LW paths of WR-(100)W(sat)-2 and WR-L(1000)W(sat)-2 (Table 4) in com-parison with those predicted by the model. The modelparameters used for WR-(100)W(sat)-2 path includedewini = 0.13, epini= 0.793, ðDemaxÞpini = 0.062, Depmax=0.079,and k= 17.8. Oncemore, the predicted path closely followedthe path obtained from the experiment. To evaluate the abil-ity of the model under different stress levels, a higher netstress of 1000 kPa was also selected. Fig. 13(c) and (d) com-pare the predicted and experimentally obtained LW statepath for WR under p = 1000 kPa, starting from ewini = 0.14.Other model parameters included epini = 0.591,ðDemaxÞpini = 0.038, Depmax=0.054, and k = 16.9. Alike the pre-
vious observations, the predicted LW path closely followedthemeasured path further verifying the capability of the pro-posed model in predicting the LW-induced deformations.
6.3. Verification using a combination of loading and wetting
paths
In this section, two experimentally obtained combina-tions of loading and wetting paths (LWLW) starting from

Fig. 12. Predicted vs measured state paths of (a and b) CB-L(100)W(sat)-2 in e-ew plane and e-log p planes, respectively and (c and d) CB-L(4000)W(sat)-2in e-ew plane and e-log p planes, respectively.
E. Yaghoubi et al. Soils and Foundations xxx (xxxx) xxx
different initial conditions were selected to be presented andcompared with their corresponding model-predicted pathsin the e-ew and e-log p planes (Fig. 14).
In the first attempt the LWLW state path carried out ona CB sample loaded and wetted under two net stresses of500 kPa and 1000 kPa was compared with the path pre-dicted using the model (Fig. 14(a)). This was carried outthrough a double application of the model. In the first appli-cation, p = 500 kPa, ewini = 0.2, epini=0.609, ðDemaxÞpini=Depmax = 0.028, and k = 10. The wetting path for this sam-ple under the net stress of 500 kPa continued up to moistureratio of 0.31. In the second application of the model,p = 1000 kPa, ewini = 0.31, epini=0.528, ðDemaxÞpini = 0.007,
Depmax = 0.012, and k = 9.2. Fig. 14(a) indicates that the pre-dicted LWLW path closely follows the measured LWLWpath verifying that the model was capable of predicting acombination of the loading and wetting paths.
In another attempt, the LWLW state path for a WRsample loaded to and wetted under two net stresses of100 kPa and 500 kPa was predicted (Fig. 14(b)). Modelparameters for the first LW path under p = 100 kPaincluded ewini = 0.12, epini= 0.793, ðDemaxÞpini= 0.66,Depmax = 0.079, and k = 17.8. The sample was wetted underp = 100 kPa up to moisture ratio of 0.26 and the loadingincreased to the net stress of p = 500 kPa. In this part ofthe path, ewini = 0.26, epini=0.628, ðDemaxÞpini = 0.009,
16
Depmax=0.081, and k = 17.3. Fig. 14(b) shows that the pre-dicted and measured LWLW paths were very close.
In the BC paths of Fig. 14, the initial moisture conditionof samples at the start of the second wetting paths wasgreater than the OMC of the material. In such moistureratios, wetting path was more similar to a straight linerather than a curve. In spite of this, the model was devel-oped such that this semi-linear trend was also well pre-dicted which was an improvement compared to theprevious model (Eq. (1)).
7. Discussion on the real-life application of the proposed
model
The model developed in this research aims to provide arelationship between the moisture content, stress and theresultant deformation state in a granular geotechnicallayer. External factors such as wetting through precipita-tion can cause further densification in compacted geostruc-tures and hence, greater deformation than expected. TheVCS and prediction model developed in this research aimto address two matters: a) to predict the ultimate deforma-tion state (or density) of the granular material compactedusing a known compaction effort at a determined moisturecontent and, and b) to predict the further deformation that

Fig. 13. Predicted vs measured state paths of (a and b) WR-(100)W(sat)-2 in e-ew plane and e-log p planes, respectively and (c and d) WR-L(1000)W(sat)-2in e-ew plane and e-log p planes, respectively.
(a) (b)
Fig. 14. Predicted vs measured state paths of (a) CB-L(500)W(0.31)L(1000)W(sat) and (b) WR-L(100)W(0.26)L(500)W(sat) in the space of e-ew-p.
E. Yaghoubi et al. Soils and Foundations xxx (xxxx) xxx
a compacted granular geostructure may exhibit due to amoisture content increase.
The LW state paths of this research were selected to sim-ulate a geotechnical structure that is supporting a super-
17
structure and is currently subjected to wetting. A real-lifeexample of such a state path is a granular foundationunderneath the footing of a structure which is being wettedthrough precipitation or the leak in the water utilities of the

E. Yaghoubi et al. Soils and Foundations xxx (xxxx) xxx
structure. In such a case, using Eq. (1), the initial deforma-tion state of the compacted geostructure on the VCS can bedetermined. Next, by determining the input parameterspresented in Table 9 through basic geotechnical tests, andfollowing the steps outlined in Section 6.1, the final defor-mation state of the geostructure after wetting can beinterpreted.
An instance of LUW state paths could be a lower layer ofa road embankment compacted by a compaction roller, sup-ported the weight of the embankment fill or pavement layerslater placed on top of it and hence unloaded to a lower stresslevel compared to the compaction pressure, and is nowbeing wetted as a result of flooding. Although, Eq. (1) canbe utilized to predict the density of the geotechnical layerafter being compacted at a determined moisture content,the VCS cannot fully interpret the state of the geostructureunder unloading and wetting while being unloaded. In spietof this, Eqs. (5) and (6) can be used to determine the hydricand the unloading coefficients in order to estimate the vol-ume change due to unloading and wetting.
A real-life example of the LWLW path could be a gran-ular foundation that was supporting the load of a footingand was next partially wetted through precipitation to aspecific moisture content. Subsequently, the stress levelon the foundation was increased by constructing a struc-ture over the footing, and another precipitation occurredto increase the moisture content of the foundation. Oncemore, Eq. (1) and the procedure summarized in Section 6.1can be used to predict the deformation state of thegeostructure at any load or moisture conditions.
8. Conclusions
In this research, first, by extending the investigation on apreviously developed virgin compaction surface (VCS)through several combinations of state paths the followingconclusions were made:
� The developed VCS were unique in loading state paths;� The uniqueness of the VCS with respect to wetting wasonly verified for the paths under constant net stressesincluding and greater than 2000 kPa.
� The Loading-Unloading-Wetting paths could partiallybe explained using the developed VCS. However, thesurface could not predict the behavior of a completepath of LUW;
� The VCS were proved to be path-independent, at leastwith respect to incremental monotonic loading and wet-ting; and
� An application of the developed VCS could be the pre-diction of the density of the unbound granular geotech-nical layer with a determined moisture content,compacted under different compaction energy and loadlevels.
Next, a moisture content-based volume change modelwas developed to predict the LW paths for the complete
18
range of net stresses and moisture ratios used in the frame-work of this research. The model was verified for CB andWR in net stresses between 100 kPa and 4000 kPa withan initial moisture ratio within the driest condition andthe wettest condition (saturation). In this research, the dri-est condition for CB (with ew of 0.29 at its OMC) and WR(with ew of 0.16 at its OMC) were respectively, 0.2 and 0.1.Model verification was done by comparing several LWpaths predicted using the model with those obtained exper-imentally. The capability of the model in predicting a com-bination of LW paths was also shown in plots of measured-predicted LWLW state paths. These plots verified that themodel is capable of predicting the volume change of the CBand WR samples regardless of the number of LW statepath or the initial moisture condition. This excludes thewetting paths under a constant stress after unloading to alower than the compaction (yield) stress in which the com-pacted sample is being wetted while being constantlyloaded under a ‘‘lower than compaction” stress.
An example of the real-life application of this modelcould be the estimation of the settlement of a granulargeotechnical layer due to changes in its moisture contentduring precipitation or flooding. This estimation wouldusually be very difficult to achieve due to the complicationassociated with conventional unsaturated volume changemodels. In the current model, however, using a straightfor-ward procedure, the volumetric behavior of the unsatu-rated granular materials can be more simply interpretedand widely incorporated in the design and analysis ofgeotechnical structures.
It should be noted that the equations of the proposedmodel are obtained using the data from non-swelling mate-rials that do not contain cementitious contents. Therefore,the model may not be applicable to the granular materialswith the potential of swelling, such as clayey gravel andgranular materials that contain cementitious particles intheir matrix, such as recycled concrete aggregates.
The VCS and the prediction model are developed basedon wetting paths, while unbound geostructures can be sub-ject to both wetting and drying. Compacted granular mate-rials are not expected to show volume change as a result ofdrying, and hence, the current research has focused on thewetting paths. Nevertheless, potential future research isproposed to investigate the behavior of the granular mate-rials in drying paths as well as wetting. Also, the experi-ments in this research were carried out under staticloading. Potential research proposed for the future canhence be the investigation of the volumetric behavior ofcompacted unsaturated granular materials under cyclicloading, vibration and/or creep loading conditions.
Acknowledgment
The authors wish to thank Professor Jayantha Kodikara(Monash University, Australia) for providing helpful tech-nical comments and feedback.

E. Yaghoubi et al. Soils and Foundations xxx (xxxx) xxx
References
Abeyrathne, A., 2017. A new modelling approach for compacted clayeysoils using specific water volume as a state variable. MonashUniversity. PhD.
Al-Taie, A., Disfani, M., Evans, R., Arulrajah, A., 2019. Collapse andswell of lime stabilized expansive clays in void ratio-moisture ratio–netstress space. Int. J. Geomech. 19 (9), 04019105.
Al-Taie, A., Disfani, M., Evans, R., Arulrajah, A., Horpibulsuk, S., 2018.Volumetric behavior and soil water characteristic curve of untreatedand lime-stabilized reactive clay. Int. J. Geomech. 19 (2), 04018192.
Alonso, E.E., Gens, A., Josa, A., 1990. A constitutive model for partiallysaturated soils. Geotechnique 40 (3), 405–430.
Aubertin, M., Mbonimpa, M., Bussiere, B., Chapuis, R.P., 2003. A modelto predict the water retention curve from basic geotechnical properties.Can. Geotech. J. 40 (6), 1104–1122.
Azam, A., Cameron, D., Gabr, A., Rahman, M., 2014. Matric Suction inRecycled Unbound Granular Materials. Geo-Congress 2014: Geo-characterization and Modeling for Sustainability.
Azam, A., Cameron, D., Rahman, M., 2013. Model for prediction ofresilient modulus incorporating matric suction for recycled unboundgranular materials. Can. Geotech. J. 50 (11), 1143–1158.
Ba, M., Nokkaew, K., Fall, M., Tinjum, J.M., 2013. Effect of matricsuction on resilient modulus of compacted aggregate base courses.Geotech. Geol. Eng. 31 (5), 1497–1510.
Cary, C.E., Zapata, C.E., 2011. Resilient modulus for unsaturatedunbound materials. Road Mater. Pavement Des. 12 (3), 615–638.
Cui, Y., Delage, P., 1996. Yielding and plastic behaviour of anunsaturated compacted silt. Geotechnique 46 (2), 291–311.
Fleureau, J.M., Verbrugge, J.C., Huergo, P.J., Gomes Correia, A.,Kheirbek-Saoud, S., 2002. Aspects of the behaviour of compactedclayey soils on drying and wetting paths. Can. Geotech. J. 39 (6), 1341–1357.
Foster, C., Ahlvin, R., 1954. Stresses and deflections induced by a uniformcircular load. Highway Research Board Proceedings.
Fredlund, D.G., Rahardjo, H., 1993. Soil Mechanics for UnsaturatedSoils. John Wiley & Sons.
Gould, S.J.F., Kodikara, J., Rajeev, P., Zhao, X.L., Burn, S., 2011. A voidratio - water content - net stress model for environmentally stabilizedexpansive soils. Can. Geotech. J. 48 (6), 867–877.
Heath, A.C., Pestana, J.M., Harvey, J.T., Bejerano, M.O., 2004.Normalizing behavior of unsaturated granular pavement materials.J. Geotech. Geoenviron. Eng. 130 (9), 896–904.
Houlsby, G., 1997. The work input to an unsaturated granular material.Geotechnique 47 (1), 193–196.
Islam, T., 2015. A study of volumetric behaviour of compacted clayey soilsin the void ratio, moisture ratio and net stress space, MonashUniversity. Faculty of Engineering. Department of Civil Engineering.
Islam, T., Kodikara, J., 2015. Interpretation of the loading–wettingbehaviour of compacted soils within the ‘‘MPK” framework. Part I:Static compaction 1. Can. Geotech. J. 53 (5), 783–805.
Jayasundara, C., Kodikara, J., Zhou, A., 2019. A volumetric yield surfacefor compacted soils based on constant water content testing. E3S Webof Conferences. EDP Sci.
19
Kieu, M., Mahler, A., 2018. A study on the relationship between matricsuction and the void ratio and moisture content of a compactedunsaturated soil. Periodica Polytech. Civil Eng. 62 (3), 709–716.
Kodikara, J., 2012. New framework for volumetric constitutive behaviourof compacted unsaturated soils. Can. Geotech. J. 49 (11), 1227–1243.
Lu, N., 2008. Is matric suction a stress variable? J. Geotech. Geoenviron.Eng. 134 (7), 899–905.
Lu, N., Likos, W.J., 2004. Unsaturated Soil Mechanics. Hoboken, NewJersey, Wiley.
Macari-Pasqualino, E.J., Runesson, K., Sture, S., 1994. Responseprediction of granular materials at low effective stresses. J. Geotech.Eng. 120 (7), 1252–1268.
Matyas, E.L., Radhakrishna, H., 1968. Volume change characteristics ofpartially saturated soils. Geotechnique 18 (4), 432–448.
Perera, Y., Zapata, C., Houston, W., Houston, S., 2005. Prediction of thesoil water characteristic curve based on grain-size-distribution andindex properties. In: Rathje, E.M. (Ed.), Advances in PavementEngineering. Geotechnical Special Publication 130, pp. 49–60.
Pham, H.Q., Fredlund, D.G., 2011. Volume–mass unsaturated soilconstitutive model for drying–wetting under isotropic loading–unload-ing conditions. Can. Geotech. J. 48 (2), 280–313.
Raveendiraraj, A., 2009. Coupling of Mechanical Behaviour and WaterRetention Behaviour in Unsaturated Soils. University of Glasgow.
Sun, D.A., Sheng, D., Xu, Y., 2007. Collapse behaviour of unsaturatedcompacted soil with different initial densities. Can. Geotech. J. 44(6),673–686.
Vassallo, R., Mancuso, C., Vinale, F., 2007. Effects of net stress andsuction history on the small strain stiffness of a compacted clayey silt.Can. Geotech. J. 44 (4), 447–462.
Wheeler, S., Sharma, R., Buisson, M., 2003. Coupling of hydraulichysteresis and stress–strain behaviour in unsaturated soils. Geotech-nique 53 (1), 41–54.
Witczak, M., Kaloush, K., Pellinen, T., El-Basyouny, M., Von Quintus,H., 2002. NCHRP Report 465: Simple Performance Test for Super-pave Mix Design, TRB, National Research Council, Washington, D.C.
Yaghoubi, E., Disfani, M.M., Arulrajah, A., Kodikara, J., 2016. Impactof compaction methods on resilient response of unsaturated granularpavement material. Proc. Eng. 143, 323–330.
Yaghoubi, E., Disfani, M.M., Arulrajah, A., Kodikara, J., 2017. Impactof compaction method on mechanical characteristics of unboundgranular recycled materials. Road Mater. Pavement Des., 1–23
Yaghoubi, E., Disfani, M.M., Arulrajah, A., Kodikara, J., 2019. Devel-opment of a void ratio-moisture ratio-net stress framework for theprediction of the volumetric behavior of unsaturated granular mate-rials. Soils Found. 59 (2), 443–457.
Zhang, X., Li, L., 2011. Limitations in the constitutive modeling ofunsaturated soils and solutions. Int. J. Geomech. 11 (3), 174–185.
Zhang, X., Lytton, R.L., 2009. Modified state-surface approach to thestudy of unsaturated soil behavior. Part I: Basic concept. Can.Geotech. J. 46 (5), 536–552.
Zhang, X., Lytton, R.L., 2012. Modified state-surface approach to thestudy of unsaturated soil behavior. Part III: Modeling of coupledhydromechanical effect. Can. Geotech. J. 49 (1), 98–120.