Embed Size (px)
Citation preview
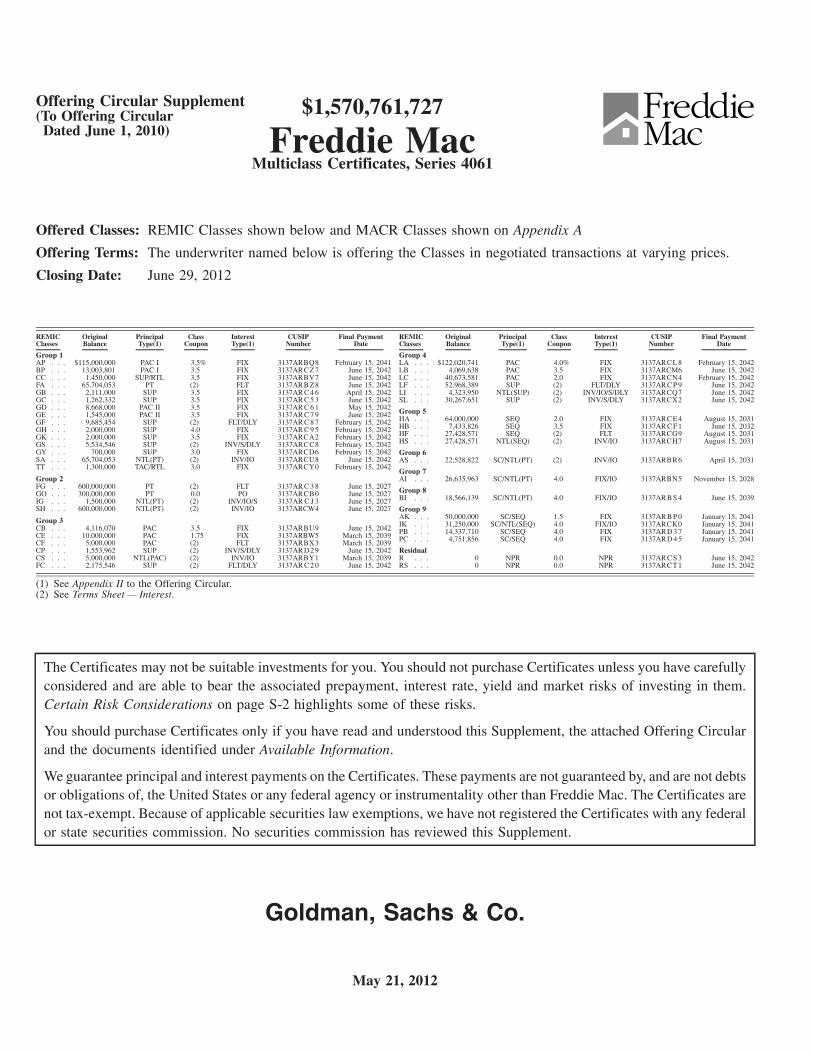
Offering Circular Supplement(To Offering CircularDated June 1, 2010)
$1,570,761,727
Freddie MacMulticlass Certificates, Series 4061
Offered Classes: REMIC Classes shown below and MACR Classes shown on Appendix A
Offering Terms: The underwriter named below is offering the Classes in negotiated transactions at varying prices.
Closing Date: June 29, 2012
REMICClasses
OriginalBalance
PrincipalType(1)
ClassCoupon
InterestType(1)
CUSIPNumber
Final PaymentDate
Group 1AP . . . $115,000,000 PAC I 3.5% FIX 3137ARBQ8 February 15, 2041BP . . . 13,003,801 PAC I 3.5 FIX 3137ARCZ7 June 15, 2042CC . . . 1,450,000 SUP/RTL 3.5 FIX 3137ARBV7 June 15, 2042FA . . . 65,704,053 PT (2) FLT 3137ARBZ8 June 15, 2042GB . . . 2,111,000 SUP 3.5 FIX 3137AR C 4 6 April 15, 2042GC . . . 1,262,332 SUP 3.5 FIX 3137AR C 5 3 June 15, 2042GD . . . 8,668,000 PAC II 3.5 FIX 3137AR C 6 1 May 15, 2042GE . . . 1,545,000 PAC II 3.5 FIX 3137AR C 7 9 June 15, 2042GF . . . 9,685,454 SUP (2) FLT/DLY 3137AR C 8 7 February 15, 2042GH . . . 2,000,000 SUP 4.0 FIX 3137AR C 9 5 February 15, 2042GK . . . 2,000,000 SUP 3.5 FIX 3137ARCA2 February 15, 2042GS . . . 5,534,546 SUP (2) INV/S/DLY 3137ARCC8 February 15, 2042GY . . . 700,000 SUP 3.0 FIX 3137ARCD6 February 15, 2042SA . . . 65,704,053 NTL(PT) (2) INV/IO 3137ARCU8 June 15, 2042TT . . . 1,300,000 TAC/RTL 3.0 FIX 3137ARCY0 February 15, 2042
Group 2FG . . . 600,000,000 PT (2) FLT 3137AR C 3 8 June 15, 2027GO . . . 300,000,000 PT 0.0 PO 3137ARCB0 June 15, 2027IG . . . 1,500,000 NTL(PT) (2) INV/IO/S 3137AR C J 3 June 15, 2027SH . . . 600,000,000 NTL(PT) (2) INV/IO 3137ARCW4 June 15, 2027
Group 3CB . . . 4,116,070 PAC 3.5 FIX 3137ARBU9 June 15, 2042CE . . . 10,000,000 PAC 1.75 FIX 3137ARBW5 March 15, 2039CF . . . 5,000,000 PAC (2) FLT 3137ARBX3 March 15, 2039CP . . . 1,553,962 SUP (2) INV/S/DLY 3137AR D 2 9 June 15, 2042CS . . . 5,000,000 NTL(PAC) (2) INV/IO 3137ARBY1 March 15, 2039FC . . . 2,175,546 SUP (2) FLT/DLY 3137AR C 2 0 June 15, 2042
REMICClasses
OriginalBalance
PrincipalType(1)
ClassCoupon
InterestType(1)
CUSIPNumber
Final PaymentDate
Group 4LA . . . $122,020,741 PAC 4.0% FIX 3137ARCL8 February 15, 2042LB . . . 4,069,638 PAC 3.5 FIX 3137ARCM6 June 15, 2042LC . . . 40,673,581 PAC 2.0 FIX 3137ARCN4 February 15, 2042LF . . . 52,968,389 SUP (2) FLT/DLY 3137ARC P 9 June 15, 2042LI . . . 4,323,950 NTL(SUP) (2) INV/IO/S/DLY 3137ARCQ7 June 15, 2042SL . . . 30,267,651 SUP (2) INV/S/DLY 3137ARCX2 June 15, 2042
Group 5HA . . . 64,000,000 SEQ 2.0 FIX 3137ARCE4 August 15, 2031HB . . . 7,433,826 SEQ 3.5 FIX 3137ARC F 1 June 15, 2032HF . . . 27,428,571 SEQ (2) FLT 3137ARCG9 August 15, 2031HS . . . 27,428,571 NTL(SEQ) (2) INV/IO 3137ARCH7 August 15, 2031
Group 6AS . . . 22,528,822 SC/NTL(PT) (2) INV/IO 3137ARBR6 April 15, 2031
Group 7AI . . . 26,635,963 SC/NTL(PT) 4.0 FIX/IO 3137ARBN5 November 15, 2028
Group 8BI . . . 18,566,139 SC/NTL(PT) 4.0 FIX/IO 3137ARB S 4 June 15, 2039
Group 9AK . . . 50,000,000 SC/SEQ 1.5 FIX 3137ARB P 0 January 15, 2041IK . . . 31,250,000 SC/NTL(SEQ) 4.0 FIX/IO 3137ARCK0 January 15, 2041PB . . . 14,337,710 SC/SEQ 4.0 FIX 3137ARD 3 7 January 15, 2041PC . . . 4,751,856 SC/SEQ 4.0 FIX 3137ARD 4 5 January 15, 2041
ResidualR . . . 0 NPR 0.0 NPR 3137ARC S 3 June 15, 2042RS . . . 0 NPR 0.0 NPR 3137ARCT1 June 15, 2042
(1) See Appendix II to the Offering Circular.(2) See Terms Sheet — Interest.
The Certificates may not be suitable investments for you. You should not purchase Certificates unless you have carefullyconsidered and are able to bear the associated prepayment, interest rate, yield and market risks of investing in them.Certain Risk Considerations on page S-2 highlights some of these risks.
You should purchase Certificates only if you have read and understood this Supplement, the attached Offering Circularand the documents identified under Available Information.
We guarantee principal and interest payments on the Certificates. These payments are not guaranteed by, and are not debtsor obligations of, the United States or any federal agency or instrumentality other than Freddie Mac. The Certificates arenot tax-exempt. Because of applicable securities law exemptions, we have not registered the Certificates with any federalor state securities commission. No securities commission has reviewed this Supplement.
Goldman, Sachs & Co.
May 21, 2012
CERTAIN RISK CONSIDERATIONS
Although we guarantee the payments on the Certificates, and so bear the associated credit risk, as aninvestor you will bear the other risks of owning mortgage securities. This section highlights some of theserisks. You should also read Risk Factors and Prepayment, Yield and Suitability Considerations in theOffering Circular for further discussions of these risks.
The Certificates May Not be Suitable Investments for You. The Certificates are complexsecurities. You should not purchase Certificates unless you are able to understand and bear the associatedprepayment, interest rate, yield and market risks.
In particular, the Interest Only, Principal Only, Inverse Floating Rate, Support, Retail and ResidualClasses have special risks and are not suitable for all investors.
Prepayments Can Reduce Your Yield. The yield on your Certificates could be lower than youexpect if:
• You buy your Certificates at a premium over their principal amount and principal paymentsare faster than you expect.
• You buy your Certificates at a discount to their principal amount and principal payments areslower than you expect. This is especially true for the Principal Only Class.
If you buy an Interest Only Class and prepayments are fast, you may not even recover your investment.
LIBOR Levels Can Reduce Your Yield if You Own a Floating Rate or Inverse Floating RateClass. The yield on your Certificates could be lower than you expect if:
• You buy a Floating Rate Class and LIBOR levels are lower than you expect.
• You buy an Inverse Floating Rate Class and LIBOR levels are higher than you expect.
If you buy an Interest Only Inverse Floating Rate Class, you may not even recover your investment ifLIBOR levels are high or prepayments are fast.
Retail Classes Have Special Payment Rules. If you invest in a Retail Class, you will receiveprincipal payments in $1,000 increments called “Retail Class Units,” subject to the priorities andlimitations described in Appendix IV to the Offering Circular. The weighted average lives and yields ofindividual Retail Class Units will vary among different investors.
The Certificates are Subject to Market Risks. You will bear all of the market risks of yourinvestment. The market value of your Certificates will vary over time, primarily in response to changes inprevailing interest rates. If you sell your Certificates when their market value is low, you may experiencesignificant losses. The underwriter named on the front cover (the “Underwriter”) intends to make amarket for the purchase and sale of the Certificates after they are issued, but has no obligation to do so. Asecondary market may not develop. Even if one does develop, it may not be liquid enough to allow you tosell your Certificates easily or at your desired price.
Our Multiclass Certificates Offering Circular dated June 1, 2010 (the “Offering Circular”),attached to this Supplement, defines many of the terms we use in this Supplement.
S-2
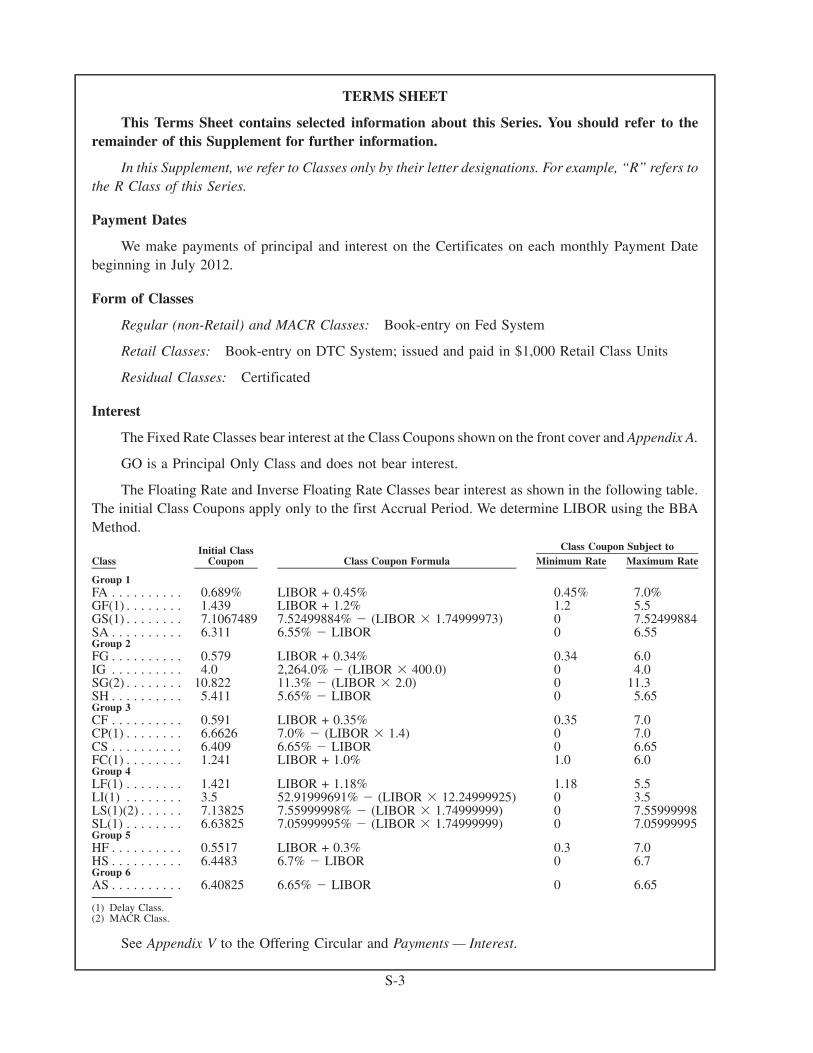
TERMS SHEET
This Terms Sheet contains selected information about this Series. You should refer to theremainder of this Supplement for further information.
In this Supplement, we refer to Classes only by their letter designations. For example, “R” refers tothe R Class of this Series.
Payment Dates
We make payments of principal and interest on the Certificates on each monthly Payment Datebeginning in July 2012.
Form of Classes
Regular (non-Retail) and MACR Classes: Book-entry on Fed System
Retail Classes: Book-entry on DTC System; issued and paid in $1,000 Retail Class Units
Residual Classes: Certificated
Interest
The Fixed Rate Classes bear interest at the Class Coupons shown on the front cover and Appendix A.
GO is a Principal Only Class and does not bear interest.
The Floating Rate and Inverse Floating Rate Classes bear interest as shown in the following table.The initial Class Coupons apply only to the first Accrual Period. We determine LIBOR using the BBAMethod.
ClassInitial Class
Coupon Class Coupon Formula Minimum Rate Maximum RateClass Coupon Subject to
Group 1FA . . . . . . . . . . 0.689% LIBOR + 0.45% 0.45% 7.0%GF(1) . . . . . . . . 1.439 LIBOR + 1.2% 1.2 5.5GS(1) . . . . . . . . 7.1067489 7.52499884% � (LIBOR � 1.74999973) 0 7.52499884SA . . . . . . . . . . 6.311 6.55% � LIBOR 0 6.55Group 2FG . . . . . . . . . . 0.579 LIBOR + 0.34% 0.34 6.0IG . . . . . . . . . . 4.0 2,264.0% � (LIBOR � 400.0) 0 4.0SG(2) . . . . . . . . 10.822 11.3% � (LIBOR � 2.0) 0 11.3SH . . . . . . . . . . 5.411 5.65% � LIBOR 0 5.65Group 3CF . . . . . . . . . . 0.591 LIBOR + 0.35% 0.35 7.0CP(1) . . . . . . . . 6.6626 7.0% � (LIBOR � 1.4) 0 7.0CS . . . . . . . . . . 6.409 6.65% � LIBOR 0 6.65FC(1) . . . . . . . . 1.241 LIBOR + 1.0% 1.0 6.0Group 4LF(1) . . . . . . . . 1.421 LIBOR + 1.18% 1.18 5.5LI(1) . . . . . . . . 3.5 52.91999691% � (LIBOR � 12.24999925) 0 3.5LS(1)(2) . . . . . . 7.13825 7.55999998% � (LIBOR � 1.74999999) 0 7.55999998SL(1) . . . . . . . . 6.63825 7.05999995% � (LIBOR � 1.74999999) 0 7.05999995Group 5HF . . . . . . . . . . 0.5517 LIBOR + 0.3% 0.3 7.0HS . . . . . . . . . . 6.4483 6.7% � LIBOR 0 6.7Group 6AS . . . . . . . . . . 6.40825 6.65% � LIBOR 0 6.65
(1) Delay Class.(2) MACR Class.
See Appendix V to the Offering Circular and Payments — Interest.
S-3
Notional Classes
ClassOriginal NotionalPrincipal Amount Reduces Proportionately With
Group 1SA $ 65,704,053 FA (PT)
Group 2IG $ 1,500,000 FG (PT)SH 600,000,000 FG (PT)
Group 3CS $ 5,000,000 CF (PAC)
Group 4LI $ 4,323,950 SL (SUP)
Group 5HS $ 27,428,571 HF (SEQ)
Group 6AS $ 22,528,822 Group 6 Assets
Group 7AI $ 26,635,963 Group 7 Assets
Group 8BI $ 18,566,139 Group 8 Assets
Group 9IK $ 31,250,000 AK (SC/SEQ)
See Payments — Interest — Notional Classes.
MACR Classes
This Series includes MACR Classes. Appendix A shows the characteristics of the MACR Classesand the Combinations of REMIC and MACR Classes.
See Appendix III to the Offering Circular for a description of MACR Certificates and exchangeprocedures and fees.
Principal
REMIC Classes
On each Payment Date, we pay:
Group 1
• 28.5714285093% of the Group 1 Asset Principal Amount to FA, until retiredPass-Through
• 71.4285714907% of the Group 1 Asset Principal Amount in the following order of priority:
1. To AP and BP, in that order, until reduced to their Aggregate Targeted BalanceType I PAC
2. To GD and GE, in that order, until reduced to their Aggregate Targeted BalanceType II PAC
3. Concurrently:
a. 90.574929312% to GF, GH, GK and GS, pro rata, until retiredSupport
b. 9.425070688% as follows:
i. To TT, until reduced to its Targeted BalanceTAC
ii. To GY, until retiredSupport
Notional Classes
ClassOriginal NotionalPrincipal Amount Reduces Proportionately With
Group 1SA $ 65,704,053 FA (PT)
Group 2IG $ 1,500,000 FG (PT)SH 600,000,000 FG (PT)
Group 3CS $ 5,000,000 CF (PAC)
Group 4LI $ 4,323,950 SL (SUP)
Group 5HS $ 27,428,571 HF (SEQ)
Group 6AS $ 22,528,822 Group 6 Assets
Group 7AI $ 26,635,963 Group 7 Assets
Group 8BI $ 18,566,139 Group 8 Assets
Group 9IK $ 31,250,000 AK (SC/SEQ)
See Payments — Interest — Notional Classes.
MACR Classes
This Series includes MACR Classes. Appendix A shows the characteristics of the MACR Classesand the Combinations of REMIC and MACR Classes.
See Appendix III to the Offering Circular for a description of MACR Certificates and exchangeprocedures and fees.
Principal
REMIC Classes
On each Payment Date, we pay:
Group 1
• 28.5714285093% of the Group 1 Asset Principal Amount to FA, until retired�����
Pass-Through
• 71.4285714907% of the Group 1 Asset Principal Amount in the following order of priority:
1. To AP and BP, in that order, until reduced to their Aggregate Targeted Balance�����Type I PAC
2. To GD and GE, in that order, until reduced to their Aggregate Targeted Balance�����Type II PAC
3. Concurrently:
a. 90.574929312% to GF, GH, GK and GS, pro rata, until retired�����Support
b. 9.425070688% as follows:
i. To TT, until reduced to its Targeted Balance�����TAC
ii. To GY, until retired�����Support
S-4
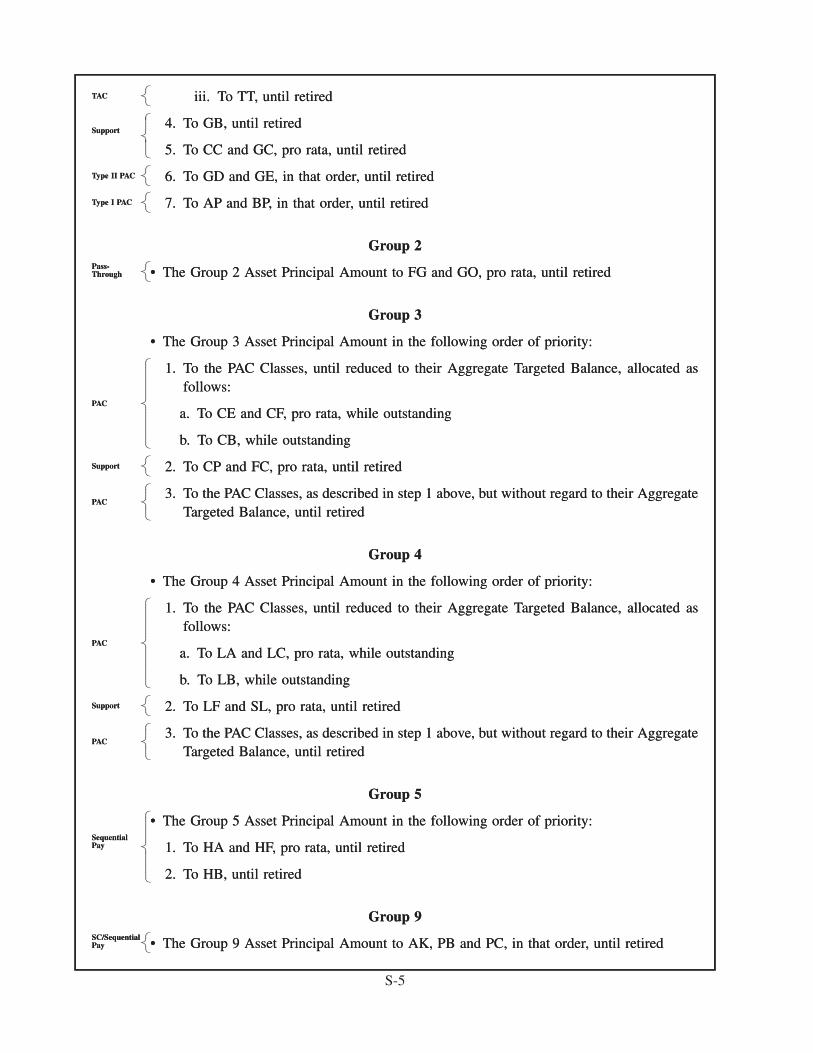
iii. To TT, until retiredTAC
4. To GB, until retired
5. To CC and GC, pro rata, until retired
Support
6. To GD and GE, in that order, until retiredType II PAC
7. To AP and BP, in that order, until retiredType I PAC
Group 2
• The Group 2 Asset Principal Amount to FG and GO, pro rata, until retiredPass-Through
Group 3
• The Group 3 Asset Principal Amount in the following order of priority:
1. To the PAC Classes, until reduced to their Aggregate Targeted Balance, allocated asfollows:
a. To CE and CF, pro rata, while outstanding
b. To CB, while outstanding
PAC
2. To CP and FC, pro rata, until retiredSupport
3. To the PAC Classes, as described in step 1 above, but without regard to their AggregateTargeted Balance, until retired
PAC
Group 4
• The Group 4 Asset Principal Amount in the following order of priority:
1. To the PAC Classes, until reduced to their Aggregate Targeted Balance, allocated asfollows:
a. To LA and LC, pro rata, while outstanding
b. To LB, while outstanding
PAC
2. To LF and SL, pro rata, until retiredSupport
3. To the PAC Classes, as described in step 1 above, but without regard to their AggregateTargeted Balance, until retired
PAC
Group 5
• The Group 5 Asset Principal Amount in the following order of priority:
1. To HA and HF, pro rata, until retired
2. To HB, until retired
SequentialPay
Group 9
• The Group 9 Asset Principal Amount to AK, PB and PC, in that order, until retiredSC/SequentialPay
iii. To TT, until retired�����TAC
4. To GB, until retired
5. To CC and GC, pro rata, until retired
���������������
Support
6. To GD and GE, in that order, until retired�����Type II PAC
7. To AP and BP, in that order, until retired�����Type I PAC
Group 2
• The Group 2 Asset Principal Amount to FG and GO, pro rata, until retired�����
Pass-Through
Group 3
• The Group 3 Asset Principal Amount in the following order of priority:
1. To the PAC Classes, until reduced to their Aggregate Targeted Balance, allocated asfollows:
a. To CE and CF, pro rata, while outstanding
b. To CB, while outstanding
�����������������������������
PAC
2. To CP and FC, pro rata, until retired�����Support
3. To the PAC Classes, as described in step 1 above, but without regard to their AggregateTargeted Balance, until retired
�����������
PAC
Group 4
• The Group 4 Asset Principal Amount in the following order of priority:
1. To the PAC Classes, until reduced to their Aggregate Targeted Balance, allocated asfollows:
a. To LA and LC, pro rata, while outstanding
b. To LB, while outstanding
�����������������������������
PAC
2. To LF and SL, pro rata, until retired�����Support
3. To the PAC Classes, as described in step 1 above, but without regard to their AggregateTargeted Balance, until retired
�����������
PAC
Group 5
• The Group 5 Asset Principal Amount in the following order of priority:
1. To HA and HF, pro rata, until retired
2. To HB, until retired
�����������������������
SequentialPay
Group 9
• The Group 9 Asset Principal Amount to AK, PB and PC, in that order, until retired�����
SC/SequentialPay
S-5
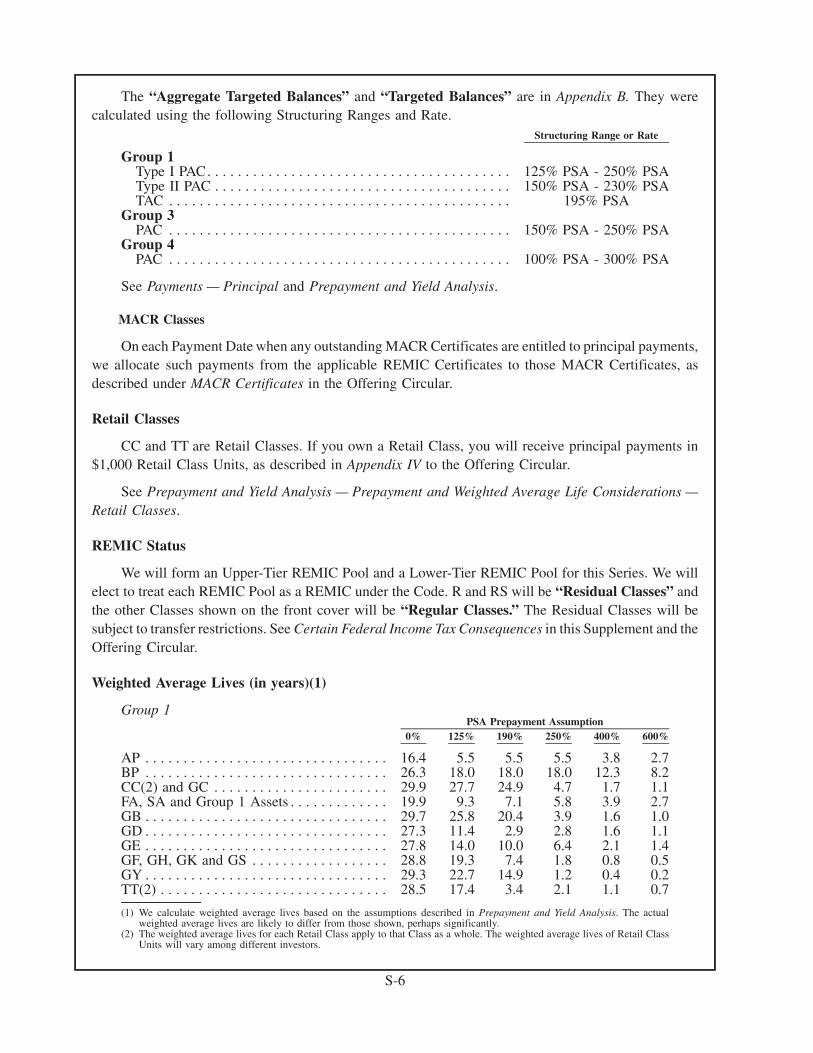
The “Aggregate Targeted Balances” and “Targeted Balances” are in Appendix B. They werecalculated using the following Structuring Ranges and Rate.
Structuring Range or Rate
Group 1Type I PAC. . . . . . . . . . . . . . . . . . . . . . . . . . . . . . . . . . . . . . . . 125% PSA - 250% PSAType II PAC . . . . . . . . . . . . . . . . . . . . . . . . . . . . . . . . . . . . . . . 150% PSA - 230% PSATAC . . . . . . . . . . . . . . . . . . . . . . . . . . . . . . . . . . . . . . . . . . . . . 195% PSA
Group 3PAC . . . . . . . . . . . . . . . . . . . . . . . . . . . . . . . . . . . . . . . . . . . . . 150% PSA - 250% PSA
Group 4PAC . . . . . . . . . . . . . . . . . . . . . . . . . . . . . . . . . . . . . . . . . . . . . 100% PSA - 300% PSA
See Payments — Principal and Prepayment and Yield Analysis.
MACR Classes
On each Payment Date when any outstanding MACR Certificates are entitled to principal payments,we allocate such payments from the applicable REMIC Certificates to those MACR Certificates, asdescribed under MACR Certificates in the Offering Circular.
Retail Classes
CC and TT are Retail Classes. If you own a Retail Class, you will receive principal payments in$1,000 Retail Class Units, as described in Appendix IV to the Offering Circular.
See Prepayment and Yield Analysis — Prepayment and Weighted Average Life Considerations —Retail Classes.
REMIC Status
We will form an Upper-Tier REMIC Pool and a Lower-Tier REMIC Pool for this Series. We willelect to treat each REMIC Pool as a REMIC under the Code. R and RS will be “Residual Classes” andthe other Classes shown on the front cover will be “Regular Classes.” The Residual Classes will besubject to transfer restrictions. See Certain Federal Income Tax Consequences in this Supplement and theOffering Circular.
Weighted Average Lives (in years)(1)
Group 1
0% 125% 190% 250% 400% 600%PSA Prepayment Assumption
AP . . . . . . . . . . . . . . . . . . . . . . . . . . . . . . . . 16.4 5.5 5.5 5.5 3.8 2.7BP . . . . . . . . . . . . . . . . . . . . . . . . . . . . . . . . 26.3 18.0 18.0 18.0 12.3 8.2CC(2) and GC . . . . . . . . . . . . . . . . . . . . . . . 29.9 27.7 24.9 4.7 1.7 1.1FA, SA and Group 1 Assets . . . . . . . . . . . . . 19.9 9.3 7.1 5.8 3.9 2.7GB . . . . . . . . . . . . . . . . . . . . . . . . . . . . . . . . 29.7 25.8 20.4 3.9 1.6 1.0GD . . . . . . . . . . . . . . . . . . . . . . . . . . . . . . . . 27.3 11.4 2.9 2.8 1.6 1.1GE . . . . . . . . . . . . . . . . . . . . . . . . . . . . . . . . 27.8 14.0 10.0 6.4 2.1 1.4GF, GH, GK and GS . . . . . . . . . . . . . . . . . . 28.8 19.3 7.4 1.8 0.8 0.5GY . . . . . . . . . . . . . . . . . . . . . . . . . . . . . . . . 29.3 22.7 14.9 1.2 0.4 0.2TT(2) . . . . . . . . . . . . . . . . . . . . . . . . . . . . . . 28.5 17.4 3.4 2.1 1.1 0.7
(1) We calculate weighted average lives based on the assumptions described in Prepayment and Yield Analysis. The actualweighted average lives are likely to differ from those shown, perhaps significantly.
(2) The weighted average lives for each Retail Class apply to that Class as a whole. The weighted average lives of Retail ClassUnits will vary among different investors.
S-6
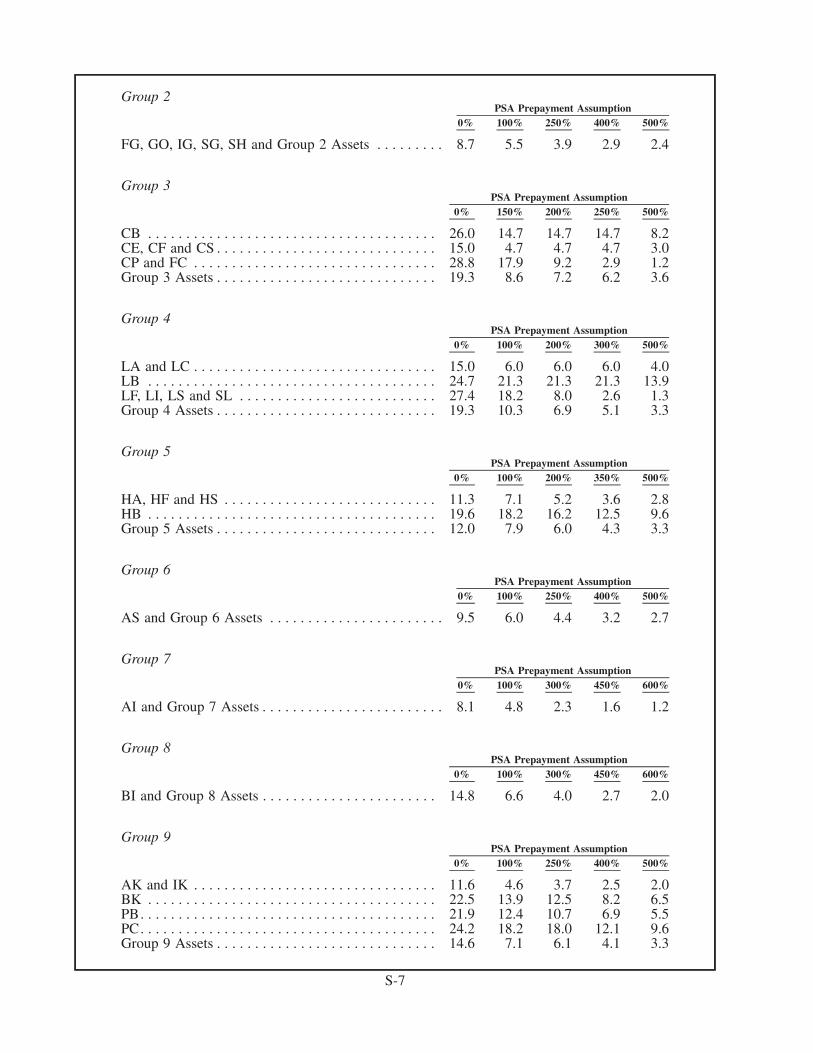
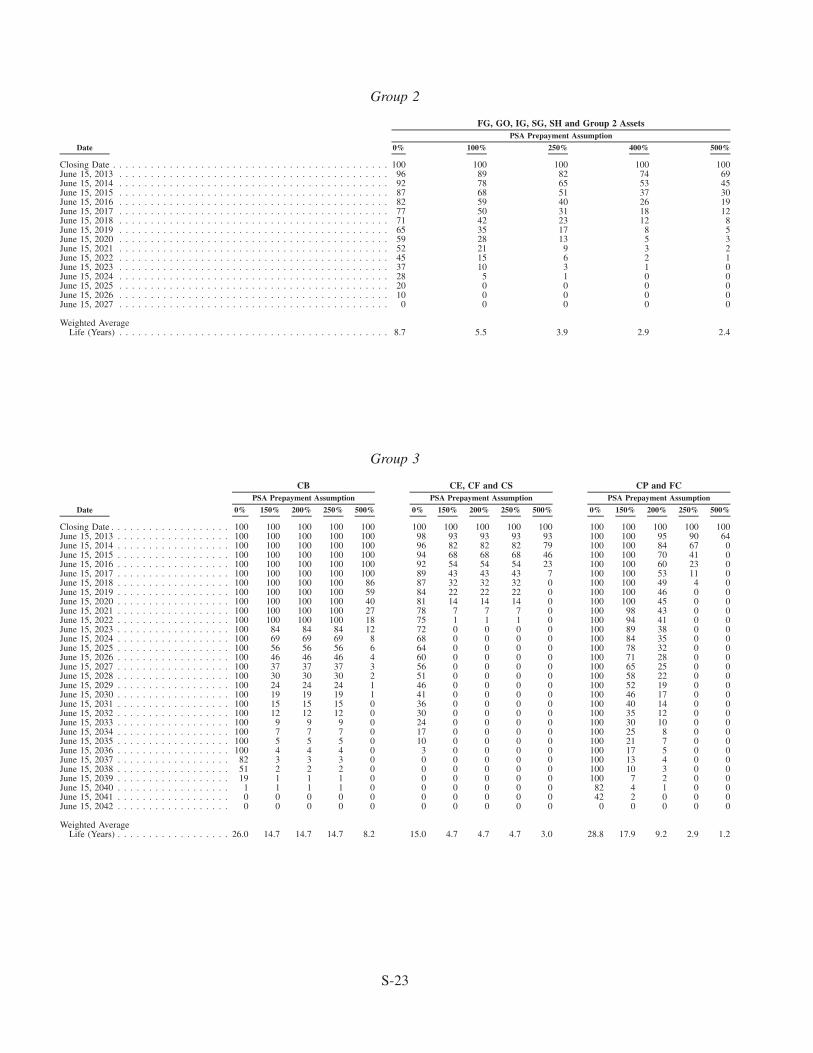
Group 2
0% 100% 250% 400% 500%PSA Prepayment Assumption
FG, GO, IG, SG, SH and Group 2 Assets . . . . . . . . . 8.7 5.5 3.9 2.9 2.4
Group 3
0% 150% 200% 250% 500%PSA Prepayment Assumption
CB . . . . . . . . . . . . . . . . . . . . . . . . . . . . . . . . . . . . . . 26.0 14.7 14.7 14.7 8.2CE, CF and CS . . . . . . . . . . . . . . . . . . . . . . . . . . . . . 15.0 4.7 4.7 4.7 3.0CP and FC . . . . . . . . . . . . . . . . . . . . . . . . . . . . . . . . 28.8 17.9 9.2 2.9 1.2Group 3 Assets . . . . . . . . . . . . . . . . . . . . . . . . . . . . . 19.3 8.6 7.2 6.2 3.6
Group 4
0% 100% 200% 300% 500%PSA Prepayment Assumption
LA and LC . . . . . . . . . . . . . . . . . . . . . . . . . . . . . . . . 15.0 6.0 6.0 6.0 4.0LB . . . . . . . . . . . . . . . . . . . . . . . . . . . . . . . . . . . . . . 24.7 21.3 21.3 21.3 13.9LF, LI, LS and SL . . . . . . . . . . . . . . . . . . . . . . . . . . 27.4 18.2 8.0 2.6 1.3Group 4 Assets . . . . . . . . . . . . . . . . . . . . . . . . . . . . . 19.3 10.3 6.9 5.1 3.3
Group 5
0% 100% 200% 350% 500%PSA Prepayment Assumption
HA, HF and HS . . . . . . . . . . . . . . . . . . . . . . . . . . . . 11.3 7.1 5.2 3.6 2.8HB . . . . . . . . . . . . . . . . . . . . . . . . . . . . . . . . . . . . . . 19.6 18.2 16.2 12.5 9.6Group 5 Assets . . . . . . . . . . . . . . . . . . . . . . . . . . . . . 12.0 7.9 6.0 4.3 3.3
Group 6
0% 100% 250% 400% 500%PSA Prepayment Assumption
AS and Group 6 Assets . . . . . . . . . . . . . . . . . . . . . . . 9.5 6.0 4.4 3.2 2.7
Group 7
0% 100% 300% 450% 600%PSA Prepayment Assumption
AI and Group 7 Assets . . . . . . . . . . . . . . . . . . . . . . . . 8.1 4.8 2.3 1.6 1.2
Group 8
0% 100% 300% 450% 600%PSA Prepayment Assumption
BI and Group 8 Assets . . . . . . . . . . . . . . . . . . . . . . . 14.8 6.6 4.0 2.7 2.0
Group 9
0% 100% 250% 400% 500%PSA Prepayment Assumption
AK and IK . . . . . . . . . . . . . . . . . . . . . . . . . . . . . . . . 11.6 4.6 3.7 2.5 2.0BK . . . . . . . . . . . . . . . . . . . . . . . . . . . . . . . . . . . . . . 22.5 13.9 12.5 8.2 6.5PB. . . . . . . . . . . . . . . . . . . . . . . . . . . . . . . . . . . . . . . 21.9 12.4 10.7 6.9 5.5PC. . . . . . . . . . . . . . . . . . . . . . . . . . . . . . . . . . . . . . . 24.2 18.2 18.0 12.1 9.6Group 9 Assets . . . . . . . . . . . . . . . . . . . . . . . . . . . . . 14.6 7.1 6.1 4.1 3.3
S-7
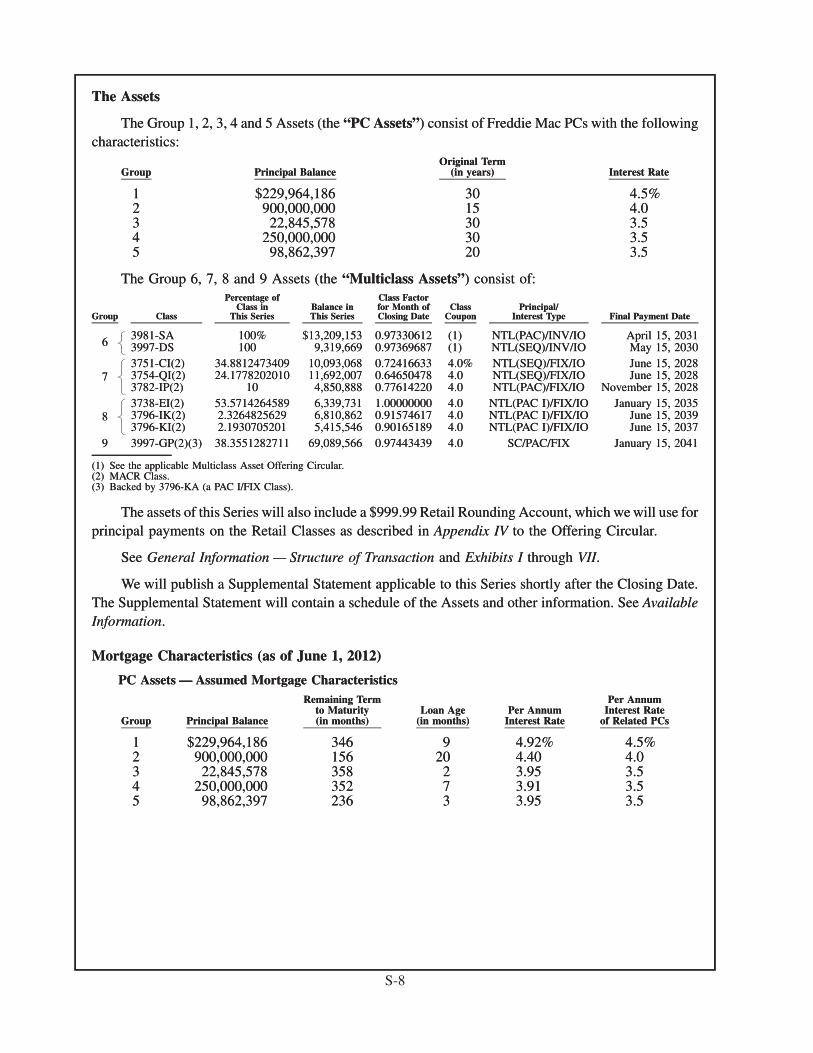
The Assets
The Group 1, 2, 3, 4 and 5 Assets (the “PC Assets”) consist of Freddie Mac PCs with the followingcharacteristics:
Group Principal BalanceOriginal Term
(in years) Interest Rate
1 $229,964,186 30 4.5%2 900,000,000 15 4.03 22,845,578 30 3.54 250,000,000 30 3.55 98,862,397 20 3.5
The Group 6, 7, 8 and 9 Assets (the “Multiclass Assets”) consist of:
Group Class
Percentage ofClass in
This SeriesBalance inThis Series
Class Factorfor Month ofClosing Date
ClassCoupon
Principal/Interest Type Final Payment Date
6 3981-SA 100% $13,209,153 0.97330612 (1) NTL(PAC)/INV/IO April 15, 20313997-DS 100 9,319,669 0.97369687 (1) NTL(SEQ)/INV/IO May 15, 2030
73751-CI(2) 34.8812473409 10,093,068 0.72416633 4.0% NTL(SEQ)/FIX/IO June 15, 20283754-QI(2) 24.1778202010 11,692,007 0.64650478 4.0 NTL(SEQ)/FIX/IO June 15, 20283782-IP(2) 10 4,850,888 0.77614220 4.0 NTL(PAC)/FIX/IO November 15, 2028
83738-EI(2) 53.5714264589 6,339,731 1.00000000 4.0 NTL(PAC I)/FIX/IO January 15, 20353796-IK(2) 2.3264825629 6,810,862 0.91574617 4.0 NTL(PAC I)/FIX/IO June 15, 20393796-KI(2) 2.1930705201 5,415,546 0.90165189 4.0 NTL(PAC I)/FIX/IO June 15, 2037
9 3997-GP(2)(3) 38.3551282711 69,089,566 0.97443439 4.0 SC/PAC/FIX January 15, 2041
(1) See the applicable Multiclass Asset Offering Circular.(2) MACR Class.(3) Backed by 3796-KA (a PAC I/FIX Class).
The assets of this Series will also include a $999.99 Retail Rounding Account, which we will use forprincipal payments on the Retail Classes as described in Appendix IV to the Offering Circular.
See General Information — Structure of Transaction and Exhibits I through VII.
We will publish a Supplemental Statement applicable to this Series shortly after the Closing Date.The Supplemental Statement will contain a schedule of the Assets and other information. See AvailableInformation.
Mortgage Characteristics (as of June 1, 2012)
PC Assets — Assumed Mortgage Characteristics
Group Principal Balance
Remaining Termto Maturity(in months)
Loan Age(in months)
Per AnnumInterest Rate
Per AnnumInterest Rate
of Related PCs
1 $229,964,186 346 9 4.92% 4.5%2 900,000,000 156 20 4.40 4.03 22,845,578 358 2 3.95 3.54 250,000,000 352 7 3.91 3.55 98,862,397 236 3 3.95 3.5
The Assets
The Group 1, 2, 3, 4 and 5 Assets (the “PC Assets”) consist of Freddie Mac PCs with the followingcharacteristics:
Group Principal BalanceOriginal Term
(in years) Interest Rate
1 $229,964,186 30 4.5%2 900,000,000 15 4.03 22,845,578 30 3.54 250,000,000 30 3.55 98,862,397 20 3.5
The Group 6, 7, 8 and 9 Assets (the “Multiclass Assets”) consist of:
Group Class
Percentage ofClass in
This SeriesBalance inThis Series
Class Factorfor Month ofClosing Date
ClassCoupon
Principal/Interest Type Final Payment Date
6 3981-SA 100% $13,209,153 0.97330612 (1) NTL(PAC)/INV/IO April 15, 20313997-DS 100 9,319,669 0.97369687 (1) NTL(SEQ)/INV/IO May 15, 2030
���������
73751-CI(2) 34.8812473409 10,093,068 0.72416633 4.0% NTL(SEQ)/FIX/IO June 15, 20283754-QI(2) 24.1778202010 11,692,007 0.64650478 4.0 NTL(SEQ)/FIX/IO June 15, 20283782-IP(2) 10 4,850,888 0.77614220 4.0 NTL(PAC)/FIX/IO November 15, 2028
�������������
83738-EI(2) 53.5714264589 6,339,731 1.00000000 4.0 NTL(PAC I)/FIX/IO January 15, 20353796-IK(2) 2.3264825629 6,810,862 0.91574617 4.0 NTL(PAC I)/FIX/IO June 15, 20393796-KI(2) 2.1930705201 5,415,546 0.90165189 4.0 NTL(PAC I)/FIX/IO June 15, 2037
�������������
9 3997-GP(2)(3) 38.3551282711 69,089,566 0.97443439 4.0 SC/PAC/FIX January 15, 2041
(1) See the applicable Multiclass Asset Offering Circular.(2) MACR Class.(3) Backed by 3796-KA (a PAC I/FIX Class).
The assets of this Series will also include a $999.99 Retail Rounding Account, which we will use forprincipal payments on the Retail Classes as described in Appendix IV to the Offering Circular.
See General Information — Structure of Transaction and Exhibits I through VII.
We will publish a Supplemental Statement applicable to this Series shortly after the Closing Date.The Supplemental Statement will contain a schedule of the Assets and other information. See AvailableInformation.
Mortgage Characteristics (as of June 1, 2012)
PC Assets — Assumed Mortgage Characteristics
Group Principal Balance
Remaining Termto Maturity(in months)
Loan Age(in months)
Per AnnumInterest Rate
Per AnnumInterest Rate
of Related PCs
1 $229,964,186 346 9 4.92% 4.5%2 900,000,000 156 20 4.40 4.03 22,845,578 358 2 3.95 3.54 250,000,000 352 7 3.91 3.55 98,862,397 236 3 3.95 3.5
S-8
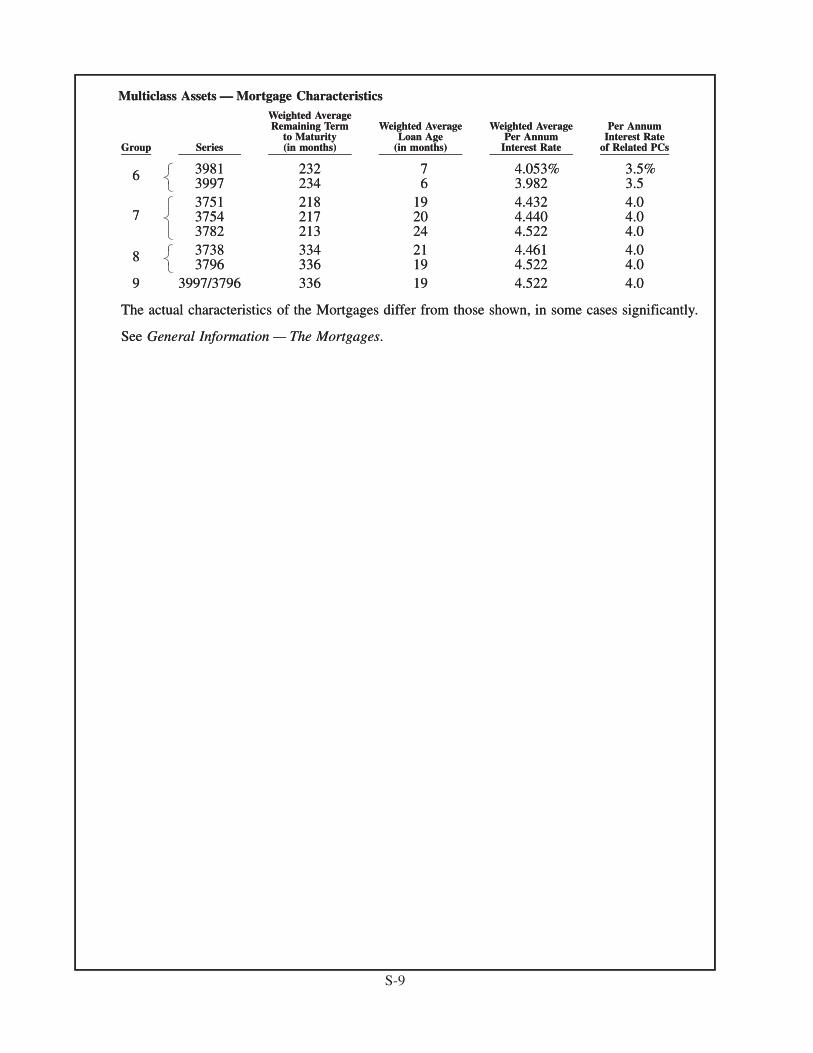
Multiclass Assets — Mortgage Characteristics
Group Series
Weighted AverageRemaining Term
to Maturity(in months)
Weighted AverageLoan Age
(in months)
Weighted AveragePer Annum
Interest Rate
Per AnnumInterest Rate
of Related PCs
6 3981 232 7 4.053% 3.5%3997 234 6 3.982 3.5
73751 218 19 4.432 4.03754 217 20 4.440 4.03782 213 24 4.522 4.0
8 3738 334 21 4.461 4.03796 336 19 4.522 4.0
9 3997/3796 336 19 4.522 4.0
The actual characteristics of the Mortgages differ from those shown, in some cases significantly.
See General Information — The Mortgages.
Multiclass Assets — Mortgage Characteristics
Group Series
Weighted AverageRemaining Term
to Maturity(in months)
Weighted AverageLoan Age
(in months)
Weighted AveragePer Annum
Interest Rate
Per AnnumInterest Rate
of Related PCs
6 3981 232 7 4.053% 3.5%3997 234 6 3.982 3.5
���������
73751 218 19 4.432 4.03754 217 20 4.440 4.03782 213 24 4.522 4.0
�������������
8 3738 334 21 4.461 4.03796 336 19 4.522 4.0
���������
9 3997/3796 336 19 4.522 4.0
The actual characteristics of the Mortgages differ from those shown, in some cases significantly.
See General Information — The Mortgages.
S-9
AVAILABLE INFORMATION
We incorporate by reference in this Supplement the Incorporated Documents listed under AdditionalInformation in the Offering Circular. For purposes of this Supplement, the “Incorporated Documents”also include, if you are investing in a Group 6, 7, 8 or 9 Class, our Offering Circular Supplements for therelated Multiclass Assets (each, a “Multiclass Asset Offering Circular”), the front covers, TermsSheets and, if applicable, MACR tables from which are in Exhibits I through VII.
When we incorporate documents by reference, that means we are disclosing information to you byreferring to those documents rather than by providing you with separate copies. The IncorporatedDocuments are considered part of this Supplement. You should purchase Certificates only if you haveread and understood this Supplement, the Offering Circular and the Incorporated Documents. Infor-mation that we incorporate by reference will automatically update information in this Supplement. Wewill also publish a Supplemental Statement applicable to this Series shortly after the Closing Date. TheSupplemental Statement will contain a schedule of the Assets and other information. You should relyonly on the most current information provided or incorporated by reference in this Supplement and anyapplicable Supplemental Statement.
You may read and copy any document we file with the SEC at the SEC’s public reference room at100 F Street, N.E., Washington, D.C. 20549. Please call the SEC at 1-800-SEC-0330 for furtherinformation on the public reference room. The SEC also maintains a website at http://www.sec.gov thatcontains reports, proxy and information statements, and other information regarding companies that fileelectronically with the SEC.
You can obtain, without charge, copies of the Incorporated Documents, any documents wesubsequently file with the SEC, the Trust Agreement and current information concerning the Assetsand Certificates, as well as the disclosure documents and current information for any other securities weissue, from our Investor Inquiry Department or our internet website as described on page 7 of the OfferingCircular. You can also obtain the documents listed above from the Underwriter at:
Goldman, Sachs & Co.Global Operations
Mortgage Backed Securities30 Hudson Street, 36th Floor
Jersey City, New Jersey 07302(212) 902-3089
GENERAL INFORMATION
The Trust Agreement
We will form a trust fund to hold the Assets and to issue the Certificates, each pursuant to theMulticlass Certificates Master Trust Agreement dated June 1, 2010 and a Terms Supplement dated theClosing Date (together, the “Trust Agreement”). We will act as Trustee and Administrator under theTrust Agreement.
You should refer to the Trust Agreement for a complete description of your rights and obligationsand those of Freddie Mac. You will acquire your Certificates subject to the terms and conditions of theTrust Agreement, including the Terms Supplement.
S-10
Form of Certificates
The non-Retail Regular and MACR Classes are issued, held and transferable on the Fed System. TheRetail Classes are issued, held and transferable on the DTC System in $1,000 Retail Class Units. TheResidual Classes are issued and held in certificated form and are transferable at the office of the Registrar.
Only a Fed Participant can be a Holder of a non-Retail Regular or MACR Class. DTC or its nomineeis the Holder of each Retail Class. As an investor in Certificates, you are not necessarily the Holder.
See Description of Certificates — Form, Holders and Payment Procedures in the Offering Circular.
Denominations of Certificates
See Description of Certificates — Form, Holders and Payment Procedures in the Offering Circularfor the minimum denominations of the Classes.
Structure of Transaction
General
This Series is a Double-Tier Series, structured as follows:
REMIC Pool Classes Issued from REMIC Pool REMIC Pool Assets
Upper-Tier All Regular Classes and R All Lower-Tier regular interests andRetail Rounding Account
Lower-Tier RS The Assets
See Description of Certificates — REMIC Pool Structures in the Offering Circular.
The PC Assets
The PC Assets are Gold PCs and/or Gold Giant PCs.
The Multiclass Assets
The Multiclass Assets consist of previously issued Freddie Mac REMIC and MACR Certificates,which represent interests in their underlying PCs.
For additional information about the Multiclass Assets, see the Multiclass Asset Offering Circularsand other related information on our internet website. We have attached the front covers, Terms Sheetsand, if applicable, MACR tables from the Multiclass Asset Offering Circulars as Exhibits to thisSupplement.
There may have been material changes since we prepared the Multiclass Asset Offering Circulars,including changes in prepayment rates, prevailing interest rates and other economic factors. Thesechanges may limit the usefulness of, and be inconsistent with the assumptions used in preparing, theMulticlass Asset Offering Circulars.
The Mortgages
The Mortgages underlying the Assets (the “Mortgages”) are fixed-rate, first lien residentialmortgages and mortgage participations.
For purposes of this Supplement, we have made certain assumptions regarding the Mortgagesunderlying the PC Assets, as shown under Terms Sheet — Mortgage Characteristics. The weighted
S-11
average remaining terms to maturity, weighted average loan ages and weighted average interest rates ofthe Mortgages underlying the Multiclass Assets, as of June 1, 2012, are shown under Terms Sheet —Mortgage Characteristics. However, the actual characteristics of most of the Mortgages differ from thoseassumed or shown, perhaps significantly. This is the case even if the weighted average characteristics ofthe Mortgages are the same as those of mortgages having the characteristics assumed or shown.
We may furnish some or all of the Assets from our own portfolio. Assets from our portfolio, or fromother sources, may emphasize specific Mortgage characteristics, such as loan purpose, source oforigination, geographic distribution or loan size, or specific borrower characteristics, such as creditscore or equity in the property. You can obtain information about the underlying Mortgage characteristicsfor the Assets from our internet website.
PAYMENTS
Payment Dates; Record Dates
We make payments of principal and interest on the Certificates on each Payment Date, beginning inthe month following the Closing Date. A “Payment Date” is the 15th of each month or, if the 15th is not aBusiness Day, the next Business Day.
On each Payment Date, any payment on a Certificate is made to the Holder of record as of the end ofthe preceding calendar month.
On each Payment Date, DTC remits payments on the Retail Classes to those DTC participants thatheld Retail Class Units of record as of the end of the preceding calendar month.
Method of Payment
You will receive payments on your Certificates in the manner described under Description ofCertificates — Form, Holders and Payment Procedures in the Offering Circular.
Categories of Classes
For purposes of principal and interest payments, we have categorized the Classes as shown under“Principal Type” and “Interest Type” on the front cover and Appendix A. Appendix II to the OfferingCircular explains the abbreviations used for categories of Classes.
Interest
We pay 30 days’ interest on each Payment Date to the Holders of each Class on which interest hasaccrued. We calculate each interest payment on the outstanding balance of the Class immediately beforethe Payment Date and on the basis of a 360-day year of twelve 30-day months.
Accrual Period
The “Accrual Period” for each Payment Date is:
• For Fixed Rate and Delay Classes — the preceding calendar month.
• For Floating Rate and Inverse Floating Rate Classes other than Delay Classes — from the15th of the preceding month to the 15th of the month of that Payment Date.
S-12
Fixed Rate Classes
The Fixed Rate Classes bear interest at the Class Coupons shown on the front cover and Appendix A.
Principal Only Class
The Principal Only Class is shown under Terms Sheet — Interest. It does not bear interest.
Notional Classes
The Notional Classes do not receive principal payments. For calculating interest payments, theNotional Classes have notional principal amounts that will reduce as shown under Terms Sheet —Notional Classes.
Floating Rate and Inverse Floating Rate Classes
The Floating Rate and Inverse Floating Rate Classes bear interest as shown under Terms Sheet —Interest. Their Class Coupons are based on one-month LIBOR.
We determine LIBOR and calculate the Class Coupons for the Floating Rate and Inverse FloatingRate Classes as described in Appendix V to the Offering Circular.
Principal
We pay principal on each Payment Date to the Holders of the Classes on which principal is then due.Holders receive principal payments on a pro rata basis among the Certificates of their Class, subject tospecial allocation procedures for investors in a Retail Class.
Amount of Payments
The principal payments on the Certificates on each Payment Date equal the amount of principalrequired to be paid in the same month on the Assets of each applicable Group (the “Group 1 AssetPrincipal Amount,” the “Group 2 Asset Principal Amount” and so forth).
Allocation of Payments
On each Payment Date, we pay the Asset Principal Amounts for that Payment Date as describedunder Terms Sheet — Principal. Principal allocable to the Classes receiving payments from a particularAsset Group will be allocated only to those Classes and will not be available for Classes receivingpayments from the other Asset Groups.
Retail Classes
Appendix IV to the Offering Circular describes how we make principal payments on the RetailClasses.
Class Factors
General
We make Class Factors available on or about the fifth business day of each month after the ClosingDate. See Description of Certificates — Payments — Class Factors in the Offering Circular.
S-13
Use of Factors
You can calculate principal and interest payments by using the Class Factors.
For example, the reduction in the balance of a Certificate in February will equal its original balancetimes the difference between its January and February Class Factors. (The Class Factor for each RetailClass applies to that Class as a whole, not to individual Retail Class Units, and disregards any rounding ofprincipal payments.) The amount of interest to be paid on a Certificate in February will equal 30 days’interest at its Class Coupon, accrued during the related Accrual Period, on the balance of that Certificatedetermined by its January Class Factor. (The interest payable on each outstanding Retail Class Unit inFebruary will be based on its $1,000 balance, without regard to the January Class Factor.)
Guarantees
We guarantee to each Holder of a Certificate the timely payment of interest at its Class Coupon andthe payment of its principal amount as described in this Supplement. See Description of Certificates —Payments — Guarantees in the Offering Circular.
1% Clean-up Call
We have a 1% Clean-up Call Right. If we exercise this right, all of the Classes then outstanding willbe paid in full and will retire. 3751-CI, 3997-DS and 3997-GP may, and the other Multiclass Assets willnot, become subject to the similar 1% Clean-up Call Rights in their Series. See Description ofCertificates — Payments — 1% Clean-up Call in the Offering Circular.
Residual Proceeds
Upon surrender of their Certificates to the Registrar, the Holders of each Residual Class will receivethe proceeds of any remaining assets of the related REMIC Pool after all required principal and interestpayments on the Classes have been made. Any remaining assets are likely to be insignificant. For R, theywill include the Retail Rounding Account. See Description of Certificates — Payments — ResidualClasses in the Offering Circular.
PREPAYMENT AND YIELD ANALYSIS
General
Mortgage Prepayments
The rates of principal payments on the Assets and the Certificates will depend on the rates ofprincipal payments, including prepayments, on the underlying Mortgages. The Mortgages are subject toprepayment at any time without penalty. Mortgage prepayment rates fluctuate continuously and, in somemarket conditions, substantially. See Prepayment, Yield and Suitability Considerations — Prepaymentsin the Offering Circular for a discussion of Mortgage prepayment considerations and risks.
Yield
As an investor in the Certificates, your yield will depend on:
• Your purchase price.
• The rate of principal payments on the underlying Mortgages.
S-14
• The actual characteristics of the underlying Mortgages.
• If you own a Floating Rate or Inverse Floating Rate Class, the level of LIBOR.
• If you own a Fixed Rate or Delay Class, the delay between its Accrual Period and the relatedPayment Date.
• If you own a Group 6, 7, 8 or 9 Class, the payment characteristics of the related MulticlassAssets in their own Series, as described in the Terms Sheets of the related Multiclass AssetOffering Circulars.
• If you own Retail Class Units, when they retire as a result of the special Retail Class principalpayment rules described in Appendix IV to the Offering Circular.
See Prepayment, Yield and Suitability Considerations — Yields in the Offering Circular for adiscussion of yield considerations and risks.
Suitability
The Certificates may not be suitable investments for you. See Prepayment, Yield and SuitabilityConsiderations — Suitability in the Offering Circular for a discussion of suitability considerations andrisks.
Modeling Assumptions
To prepare the tables in this Supplement, we have made several assumptions. Unless otherwisenoted, each table employs the following assumptions (the “Modeling Assumptions”), among others:
• The Mortgages underlying the PC Assets have the characteristics shown under TermsSheet — Mortgage Characteristics.
• As of June 1, 2012, each Mortgage underlying the Multiclass Assets has a remaining term tomaturity equal to the weighted average remaining term to maturity, a loan age equal to theweighted average loan age, and an interest rate equal to the weighted average interest rate, ofall the Mortgages underlying the same PC.
• As of the Closing Date, the Assets have the balances shown under Terms Sheet — The Assets.
• The Multiclass Assets receive payments as described in the Multiclass Asset OfferingCirculars.
• The Classes and Assets always receive payments on the 15th of the month, whether or not aBusiness Day.
• We do not exercise our 1% Clean-up Call Right.
• We do not round Retail Class principal payments to multiples of $1,000.
• Each Class is outstanding from the Closing Date to retirement and no exchanges occur.
The Modeling Assumptions, like any other stated assumptions, are likely to differ from actualexperience in many cases. For example, the Mortgages have characteristics more diverse than thoseassumed, many Payment Dates will occur on a Business Day after the dates assumed and we may exerciseour 1% Clean-up Call Right. Moreover, Mortgage prepayment rates will differ from the percentages of
S-15
PSA shown in the tables. These differences will affect the actual payment behavior, weighted averagelives and yields of the Classes, perhaps significantly.
See Prepayment, Yield and Suitability Considerations — Tabular Information in Supplements in theOffering Circular for descriptions of weighted average life and yield calculations and the PSA prepay-ment model.
Prepayment and Weighted Average Life Considerations
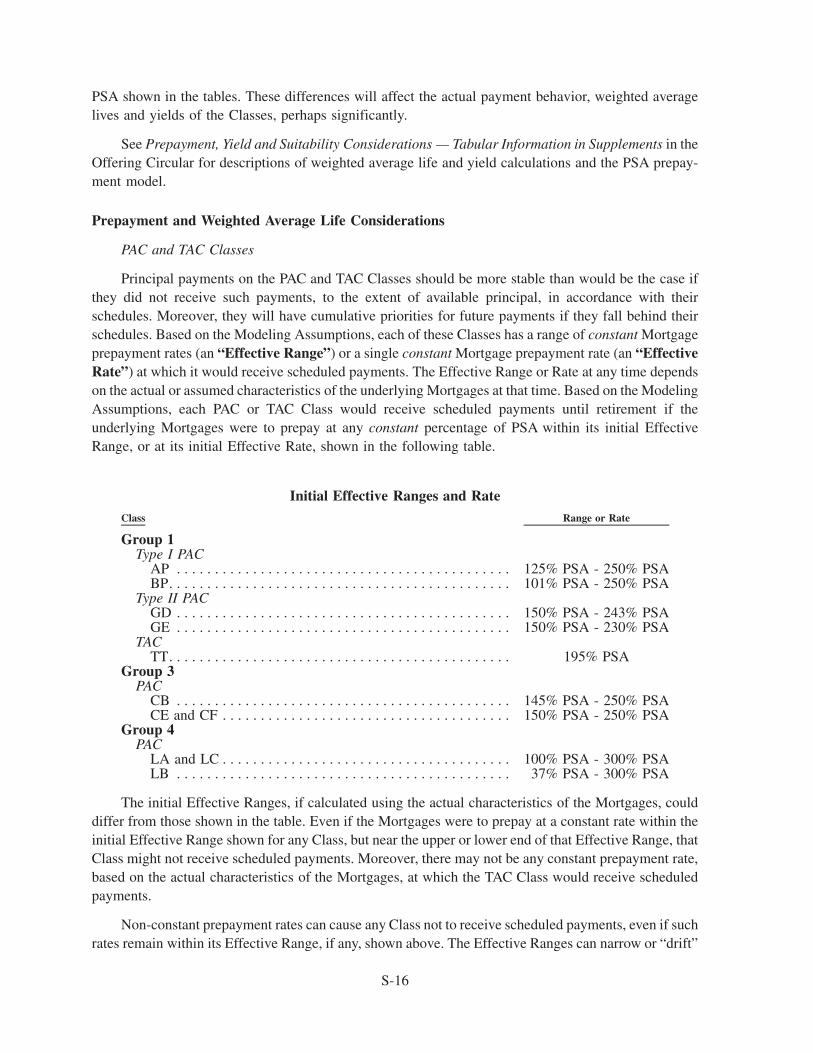
PAC and TAC Classes
Principal payments on the PAC and TAC Classes should be more stable than would be the case ifthey did not receive such payments, to the extent of available principal, in accordance with theirschedules. Moreover, they will have cumulative priorities for future payments if they fall behind theirschedules. Based on the Modeling Assumptions, each of these Classes has a range of constant Mortgageprepayment rates (an “Effective Range”) or a single constant Mortgage prepayment rate (an “EffectiveRate”) at which it would receive scheduled payments. The Effective Range or Rate at any time dependson the actual or assumed characteristics of the underlying Mortgages at that time. Based on the ModelingAssumptions, each PAC or TAC Class would receive scheduled payments until retirement if theunderlying Mortgages were to prepay at any constant percentage of PSA within its initial EffectiveRange, or at its initial Effective Rate, shown in the following table.
Initial Effective Ranges and RateClass Range or Rate
Group 1Type I PAC
AP . . . . . . . . . . . . . . . . . . . . . . . . . . . . . . . . . . . . . . . . . . . . 125% PSA - 250% PSABP. . . . . . . . . . . . . . . . . . . . . . . . . . . . . . . . . . . . . . . . . . . . . 101% PSA - 250% PSA
Type II PACGD . . . . . . . . . . . . . . . . . . . . . . . . . . . . . . . . . . . . . . . . . . . . 150% PSA - 243% PSAGE . . . . . . . . . . . . . . . . . . . . . . . . . . . . . . . . . . . . . . . . . . . . 150% PSA - 230% PSA
TACTT. . . . . . . . . . . . . . . . . . . . . . . . . . . . . . . . . . . . . . . . . . . . . 195% PSA
Group 3PAC
CB . . . . . . . . . . . . . . . . . . . . . . . . . . . . . . . . . . . . . . . . . . . . 145% PSA - 250% PSACE and CF . . . . . . . . . . . . . . . . . . . . . . . . . . . . . . . . . . . . . . 150% PSA - 250% PSA
Group 4PAC
LA and LC . . . . . . . . . . . . . . . . . . . . . . . . . . . . . . . . . . . . . . 100% PSA - 300% PSALB . . . . . . . . . . . . . . . . . . . . . . . . . . . . . . . . . . . . . . . . . . . . 37% PSA - 300% PSA
The initial Effective Ranges, if calculated using the actual characteristics of the Mortgages, coulddiffer from those shown in the table. Even if the Mortgages were to prepay at a constant rate within theinitial Effective Range shown for any Class, but near the upper or lower end of that Effective Range, thatClass might not receive scheduled payments. Moreover, there may not be any constant prepayment rate,based on the actual characteristics of the Mortgages, at which the TAC Class would receive scheduledpayments.
Non-constant prepayment rates can cause any Class not to receive scheduled payments, even if suchrates remain within its Effective Range, if any, shown above. The Effective Ranges can narrow or “drift”
S-16
upward or downward over time. Under many scenarios the Classes shown in the table, especially theType II PAC and TAC Classes, would not receive scheduled payments.
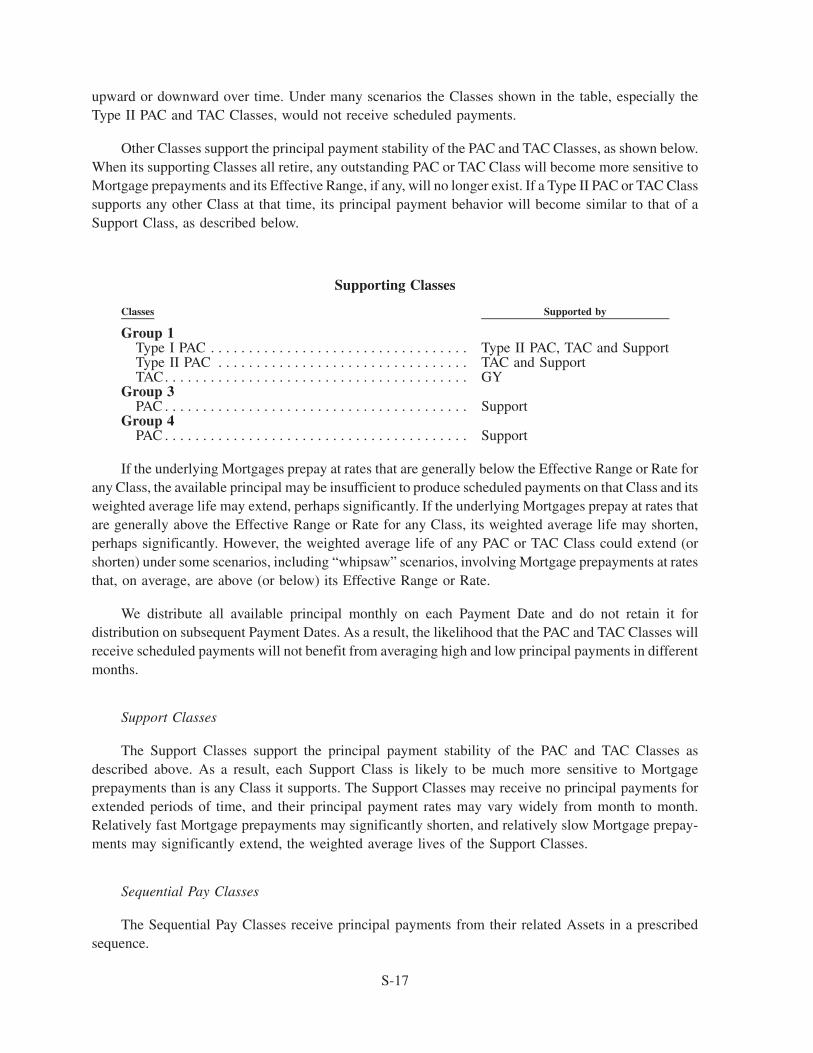
Other Classes support the principal payment stability of the PAC and TAC Classes, as shown below.When its supporting Classes all retire, any outstanding PAC or TAC Class will become more sensitive toMortgage prepayments and its Effective Range, if any, will no longer exist. If a Type II PAC or TAC Classsupports any other Class at that time, its principal payment behavior will become similar to that of aSupport Class, as described below.
Supporting Classes
Classes Supported by
Group 1Type I PAC . . . . . . . . . . . . . . . . . . . . . . . . . . . . . . . . . . Type II PAC, TAC and SupportType II PAC . . . . . . . . . . . . . . . . . . . . . . . . . . . . . . . . . TAC and SupportTAC. . . . . . . . . . . . . . . . . . . . . . . . . . . . . . . . . . . . . . . . GY
Group 3PAC . . . . . . . . . . . . . . . . . . . . . . . . . . . . . . . . . . . . . . . . Support
Group 4PAC . . . . . . . . . . . . . . . . . . . . . . . . . . . . . . . . . . . . . . . . Support
If the underlying Mortgages prepay at rates that are generally below the Effective Range or Rate forany Class, the available principal may be insufficient to produce scheduled payments on that Class and itsweighted average life may extend, perhaps significantly. If the underlying Mortgages prepay at rates thatare generally above the Effective Range or Rate for any Class, its weighted average life may shorten,perhaps significantly. However, the weighted average life of any PAC or TAC Class could extend (orshorten) under some scenarios, including “whipsaw” scenarios, involving Mortgage prepayments at ratesthat, on average, are above (or below) its Effective Range or Rate.
We distribute all available principal monthly on each Payment Date and do not retain it fordistribution on subsequent Payment Dates. As a result, the likelihood that the PAC and TAC Classes willreceive scheduled payments will not benefit from averaging high and low principal payments in differentmonths.
Support Classes
The Support Classes support the principal payment stability of the PAC and TAC Classes asdescribed above. As a result, each Support Class is likely to be much more sensitive to Mortgageprepayments than is any Class it supports. The Support Classes may receive no principal payments forextended periods of time, and their principal payment rates may vary widely from month to month.Relatively fast Mortgage prepayments may significantly shorten, and relatively slow Mortgage prepay-ments may significantly extend, the weighted average lives of the Support Classes.
Sequential Pay Classes
The Sequential Pay Classes receive principal payments from their related Assets in a prescribedsequence.
S-17
Pass-Through Classes
Each Pass-Through Class receives a specified portion of the principal payments made on its relatedAssets. The sensitivity of each Pass-Through Class to prepayments on the underlying Mortgages is thesame as that of its related Assets.
The Multiclass Assets
The Group 6 and 7 Assets include Notional (Sequential Pay) Classes that reduce with their relatedSequential Pay Classes. These Sequential Pay Classes receive principal payments from their relatedAssets in a prescribed sequence with other Classes in their Series.
The Group 6 and 7 Assets also include, and the Group 8 Assets consist of, Notional (PAC) Classesthat reduce with their related PAC Classes. The Group 9 Assets consist of a PAC Class. These PACClasses were structured to receive principal payments in accordance with schedules. Based on theModeling Assumptions for this Series, the Group 6, 7 and 8 Assets, in each case taken as a whole, and theGroup 9 Assets, currently have no Effective Ranges. We cannot predict whether or for how long thesePAC Classes might receive scheduled payments.
See Prepayment and Yield Analysis in the Multiclass Asset Offering Circulars.
MACR Classes
The payment characteristics of the MACR Classes reflect the payment characteristics of theirrelated REMIC Classes.
Retail Classes
Principal payments on each Retail Class will depend on the prepayment rate on the underlyingMortgages. As a result, it is uncertain when principal payments on the Retail Classes will begin, how fastthey will occur and when the Retail Classes will retire. Under some prepayment scenarios, your RetailClass Units could retire on the first Payment Date, especially if you invest in TT. On the other hand, theycould retire as late as the Final Payment Date for your Retail Class.
The amount of principal available for payment on a Retail Class on any given Payment Date will belimited. As a result, if you request a Retail Class principal payment, your request may not be honoreduntil long after you submit it. The likelihood that your request will be honored at any particular time willdepend in part on the number of Retail Class Units owned by Deceased Owners who have a prior right ofpayment and on the number of Retail Class Units owned by other Living Owners who have submittedrequests. On the other hand, the amount of principal available for payment on your Retail Class on anygiven Payment Date could exceed the amount necessary to honor all requests. In that case, you mayreceive principal payments you did not request.
When prevailing interest rates are higher than the Class Coupon of a Retail Class, a greater numberof investors in that Class are likely to request Retail Class principal payments. At the same time, however,Mortgage prepayment rates are likely to decline, reducing the funds available for Retail Class principalpayments. By contrast, Mortgage prepayment rates are likely to accelerate when prevailing interest ratesdecline, while investors may be less likely to request Retail Class principal payments. If your RetailClass Units are selected for payment under such conditions, you may not be able to reinvest yourpayments in comparable securities at as high a yield.
S-18
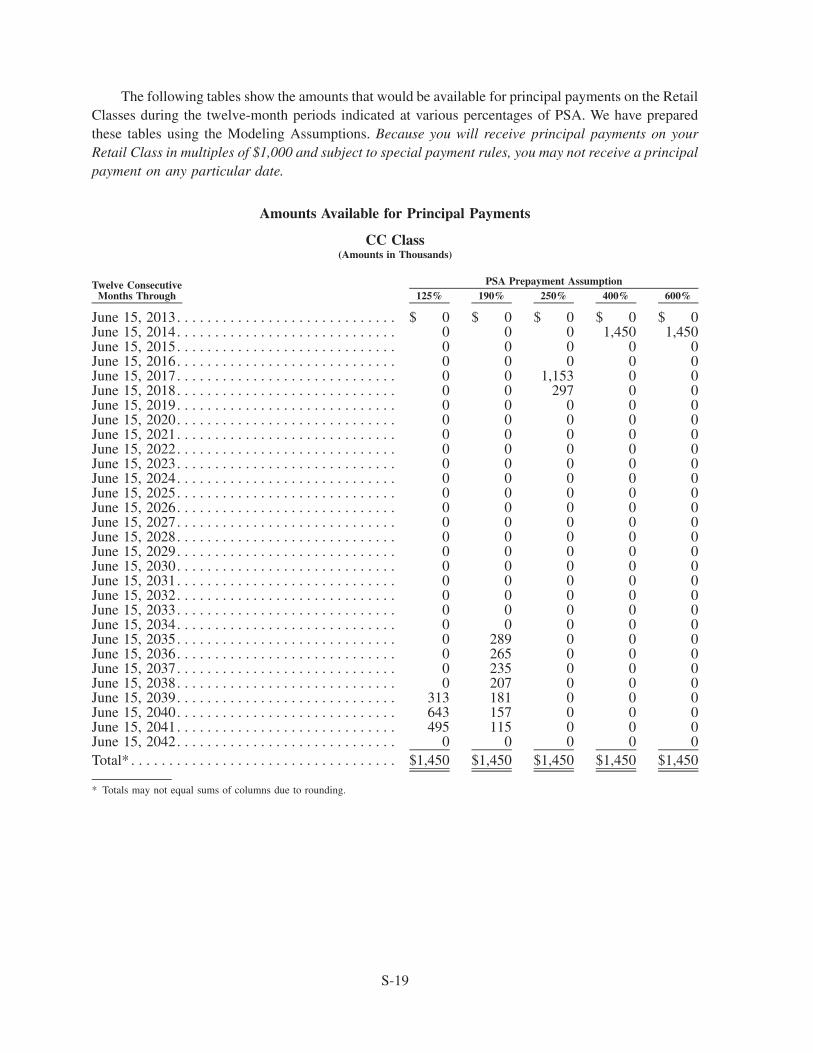
The following tables show the amounts that would be available for principal payments on the RetailClasses during the twelve-month periods indicated at various percentages of PSA. We have preparedthese tables using the Modeling Assumptions. Because you will receive principal payments on yourRetail Class in multiples of $1,000 and subject to special payment rules, you may not receive a principalpayment on any particular date.
Amounts Available for Principal Payments
CC Class(Amounts in Thousands)
Twelve ConsecutiveMonths Through 125% 190% 250% 400% 600%
PSA Prepayment Assumption
June 15, 2013. . . . . . . . . . . . . . . . . . . . . . . . . . . . . $ 0 $ 0 $ 0 $ 0 $ 0June 15, 2014. . . . . . . . . . . . . . . . . . . . . . . . . . . . . 0 0 0 1,450 1,450June 15, 2015. . . . . . . . . . . . . . . . . . . . . . . . . . . . . 0 0 0 0 0June 15, 2016. . . . . . . . . . . . . . . . . . . . . . . . . . . . . 0 0 0 0 0June 15, 2017. . . . . . . . . . . . . . . . . . . . . . . . . . . . . 0 0 1,153 0 0June 15, 2018. . . . . . . . . . . . . . . . . . . . . . . . . . . . . 0 0 297 0 0June 15, 2019. . . . . . . . . . . . . . . . . . . . . . . . . . . . . 0 0 0 0 0June 15, 2020. . . . . . . . . . . . . . . . . . . . . . . . . . . . . 0 0 0 0 0June 15, 2021. . . . . . . . . . . . . . . . . . . . . . . . . . . . . 0 0 0 0 0June 15, 2022. . . . . . . . . . . . . . . . . . . . . . . . . . . . . 0 0 0 0 0June 15, 2023. . . . . . . . . . . . . . . . . . . . . . . . . . . . . 0 0 0 0 0June 15, 2024. . . . . . . . . . . . . . . . . . . . . . . . . . . . . 0 0 0 0 0June 15, 2025. . . . . . . . . . . . . . . . . . . . . . . . . . . . . 0 0 0 0 0June 15, 2026. . . . . . . . . . . . . . . . . . . . . . . . . . . . . 0 0 0 0 0June 15, 2027. . . . . . . . . . . . . . . . . . . . . . . . . . . . . 0 0 0 0 0June 15, 2028. . . . . . . . . . . . . . . . . . . . . . . . . . . . . 0 0 0 0 0June 15, 2029. . . . . . . . . . . . . . . . . . . . . . . . . . . . . 0 0 0 0 0June 15, 2030. . . . . . . . . . . . . . . . . . . . . . . . . . . . . 0 0 0 0 0June 15, 2031. . . . . . . . . . . . . . . . . . . . . . . . . . . . . 0 0 0 0 0June 15, 2032. . . . . . . . . . . . . . . . . . . . . . . . . . . . . 0 0 0 0 0June 15, 2033. . . . . . . . . . . . . . . . . . . . . . . . . . . . . 0 0 0 0 0June 15, 2034. . . . . . . . . . . . . . . . . . . . . . . . . . . . . 0 0 0 0 0June 15, 2035. . . . . . . . . . . . . . . . . . . . . . . . . . . . . 0 289 0 0 0June 15, 2036. . . . . . . . . . . . . . . . . . . . . . . . . . . . . 0 265 0 0 0June 15, 2037. . . . . . . . . . . . . . . . . . . . . . . . . . . . . 0 235 0 0 0June 15, 2038. . . . . . . . . . . . . . . . . . . . . . . . . . . . . 0 207 0 0 0June 15, 2039. . . . . . . . . . . . . . . . . . . . . . . . . . . . . 313 181 0 0 0June 15, 2040. . . . . . . . . . . . . . . . . . . . . . . . . . . . . 643 157 0 0 0June 15, 2041. . . . . . . . . . . . . . . . . . . . . . . . . . . . . 495 115 0 0 0June 15, 2042. . . . . . . . . . . . . . . . . . . . . . . . . . . . . 0 0 0 0 0Total* . . . . . . . . . . . . . . . . . . . . . . . . . . . . . . . . . . . $1,450 $1,450 $1,450 $1,450 $1,450
* Totals may not equal sums of columns due to rounding.
S-19
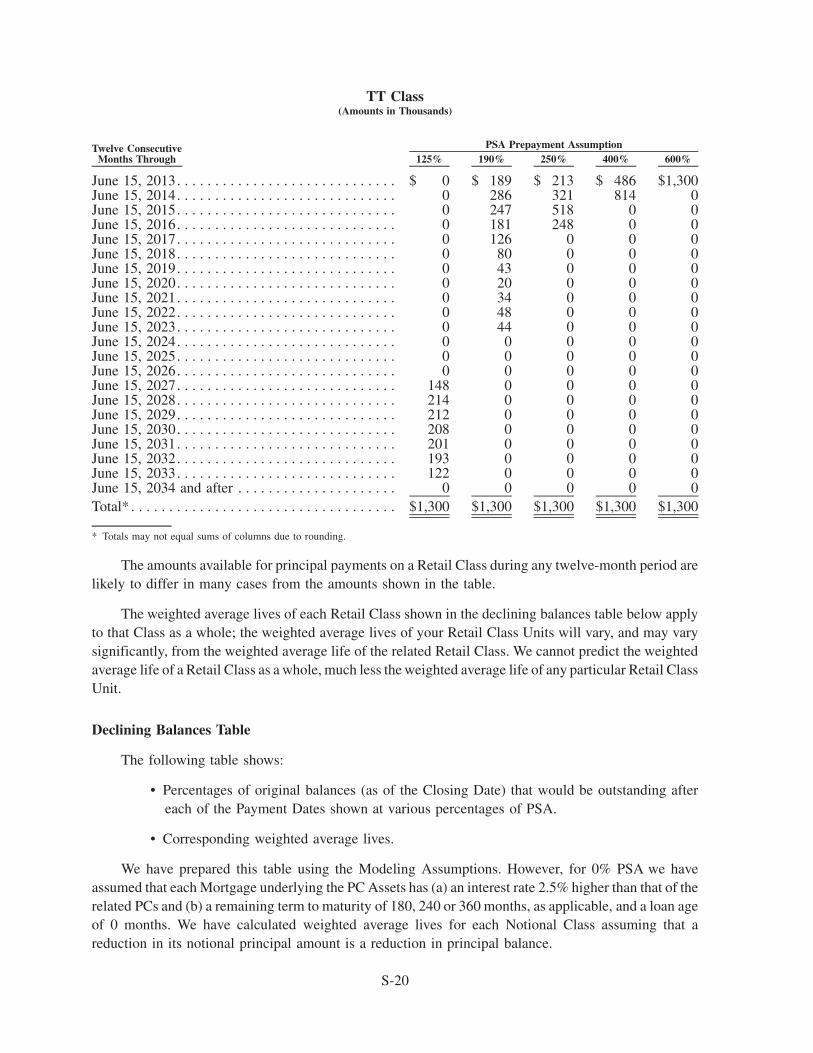
TT Class(Amounts in Thousands)
Twelve ConsecutiveMonths Through 125% 190% 250% 400% 600%
PSA Prepayment Assumption
June 15, 2013. . . . . . . . . . . . . . . . . . . . . . . . . . . . . $ 0 $ 189 $ 213 $ 486 $1,300June 15, 2014. . . . . . . . . . . . . . . . . . . . . . . . . . . . . 0 286 321 814 0June 15, 2015. . . . . . . . . . . . . . . . . . . . . . . . . . . . . 0 247 518 0 0June 15, 2016. . . . . . . . . . . . . . . . . . . . . . . . . . . . . 0 181 248 0 0June 15, 2017. . . . . . . . . . . . . . . . . . . . . . . . . . . . . 0 126 0 0 0June 15, 2018. . . . . . . . . . . . . . . . . . . . . . . . . . . . . 0 80 0 0 0June 15, 2019. . . . . . . . . . . . . . . . . . . . . . . . . . . . . 0 43 0 0 0June 15, 2020. . . . . . . . . . . . . . . . . . . . . . . . . . . . . 0 20 0 0 0June 15, 2021. . . . . . . . . . . . . . . . . . . . . . . . . . . . . 0 34 0 0 0June 15, 2022. . . . . . . . . . . . . . . . . . . . . . . . . . . . . 0 48 0 0 0June 15, 2023. . . . . . . . . . . . . . . . . . . . . . . . . . . . . 0 44 0 0 0June 15, 2024. . . . . . . . . . . . . . . . . . . . . . . . . . . . . 0 0 0 0 0June 15, 2025. . . . . . . . . . . . . . . . . . . . . . . . . . . . . 0 0 0 0 0June 15, 2026. . . . . . . . . . . . . . . . . . . . . . . . . . . . . 0 0 0 0 0June 15, 2027. . . . . . . . . . . . . . . . . . . . . . . . . . . . . 148 0 0 0 0June 15, 2028. . . . . . . . . . . . . . . . . . . . . . . . . . . . . 214 0 0 0 0June 15, 2029. . . . . . . . . . . . . . . . . . . . . . . . . . . . . 212 0 0 0 0June 15, 2030. . . . . . . . . . . . . . . . . . . . . . . . . . . . . 208 0 0 0 0June 15, 2031. . . . . . . . . . . . . . . . . . . . . . . . . . . . . 201 0 0 0 0June 15, 2032. . . . . . . . . . . . . . . . . . . . . . . . . . . . . 193 0 0 0 0June 15, 2033. . . . . . . . . . . . . . . . . . . . . . . . . . . . . 122 0 0 0 0June 15, 2034 and after . . . . . . . . . . . . . . . . . . . . . 0 0 0 0 0Total* . . . . . . . . . . . . . . . . . . . . . . . . . . . . . . . . . . . $1,300 $1,300 $1,300 $1,300 $1,300
* Totals may not equal sums of columns due to rounding.
The amounts available for principal payments on a Retail Class during any twelve-month period arelikely to differ in many cases from the amounts shown in the table.
The weighted average lives of each Retail Class shown in the declining balances table below applyto that Class as a whole; the weighted average lives of your Retail Class Units will vary, and may varysignificantly, from the weighted average life of the related Retail Class. We cannot predict the weightedaverage life of a Retail Class as a whole, much less the weighted average life of any particular Retail ClassUnit.
Declining Balances Table
The following table shows:
• Percentages of original balances (as of the Closing Date) that would be outstanding aftereach of the Payment Dates shown at various percentages of PSA.
• Corresponding weighted average lives.
We have prepared this table using the Modeling Assumptions. However, for 0% PSA we haveassumed that each Mortgage underlying the PC Assets has (a) an interest rate 2.5% higher than that of therelated PCs and (b) a remaining term to maturity of 180, 240 or 360 months, as applicable, and a loan ageof 0 months. We have calculated weighted average lives for each Notional Class assuming that areduction in its notional principal amount is a reduction in principal balance.
S-20
Percentages of Original Balances Outstanding(1) and Weighted Average Lives
Group 1
Date 0% 125% 190% 250% 400% 600% 0% 125% 190% 250% 400% 600% 0% 125% 190% 250% 400% 600%
PSA Prepayment AssumptionPSA Prepayment AssumptionPSA Prepayment Assumption
CC(2) and GCBPAP
Closing Date . . . . . . . . . . . . . . . . . . . 100 100 100 100 100 100 100 100 100 100 100 100 100 100 100 100 100 100June 15, 2013 . . . . . . . . . . . . . . . . . . 99 92 92 92 92 92 100 100 100 100 100 100 100 100 100 100 100 100June 15, 2014 . . . . . . . . . . . . . . . . . . 97 81 81 81 81 64 100 100 100 100 100 100 100 100 100 100 0 0June 15, 2015 . . . . . . . . . . . . . . . . . . 95 70 70 70 59 36 100 100 100 100 100 100 100 100 100 100 0 0June 15, 2016 . . . . . . . . . . . . . . . . . . 94 59 59 59 41 19 100 100 100 100 100 100 100 100 100 100 0 0June 15, 2017 . . . . . . . . . . . . . . . . . . 92 49 49 49 28 7 100 100 100 100 100 100 100 100 100 20 0 0June 15, 2018 . . . . . . . . . . . . . . . . . . 90 41 41 41 18 0 100 100 100 100 100 100 100 100 100 0 0 0June 15, 2019 . . . . . . . . . . . . . . . . . . 87 32 32 32 10 0 100 100 100 100 100 65 100 100 100 0 0 0June 15, 2020 . . . . . . . . . . . . . . . . . . 85 25 25 25 5 0 100 100 100 100 100 40 100 100 100 0 0 0June 15, 2021 . . . . . . . . . . . . . . . . . . 82 19 19 19 0 0 100 100 100 100 100 25 100 100 100 0 0 0June 15, 2022 . . . . . . . . . . . . . . . . . . 80 13 13 13 0 0 100 100 100 100 77 16 100 100 100 0 0 0June 15, 2023 . . . . . . . . . . . . . . . . . . 77 9 9 9 0 0 100 100 100 100 56 10 100 100 100 0 0 0June 15, 2024 . . . . . . . . . . . . . . . . . . 74 5 5 5 0 0 100 100 100 100 41 6 100 100 100 0 0 0June 15, 2025 . . . . . . . . . . . . . . . . . . 70 2 2 2 0 0 100 100 100 100 30 4 100 100 100 0 0 0June 15, 2026 . . . . . . . . . . . . . . . . . . 67 0 0 0 0 0 100 98 98 98 22 2 100 100 100 0 0 0June 15, 2027 . . . . . . . . . . . . . . . . . . 63 0 0 0 0 0 100 79 79 79 16 1 100 100 100 0 0 0June 15, 2028 . . . . . . . . . . . . . . . . . . 59 0 0 0 0 0 100 64 64 64 11 1 100 100 100 0 0 0June 15, 2029 . . . . . . . . . . . . . . . . . . 54 0 0 0 0 0 100 51 51 51 8 0 100 100 100 0 0 0June 15, 2030 . . . . . . . . . . . . . . . . . . 50 0 0 0 0 0 100 41 41 41 6 0 100 100 100 0 0 0June 15, 2031 . . . . . . . . . . . . . . . . . . 44 0 0 0 0 0 100 32 32 32 4 0 100 100 100 0 0 0June 15, 2032 . . . . . . . . . . . . . . . . . . 39 0 0 0 0 0 100 25 25 25 3 0 100 100 100 0 0 0June 15, 2033 . . . . . . . . . . . . . . . . . . 33 0 0 0 0 0 100 19 19 19 2 0 100 100 100 0 0 0June 15, 2034 . . . . . . . . . . . . . . . . . . 27 0 0 0 0 0 100 15 15 15 1 0 100 100 100 0 0 0June 15, 2035 . . . . . . . . . . . . . . . . . . 20 0 0 0 0 0 100 11 11 11 1 0 100 100 80 0 0 0June 15, 2036 . . . . . . . . . . . . . . . . . . 13 0 0 0 0 0 100 8 8 8 1 0 100 100 62 0 0 0June 15, 2037 . . . . . . . . . . . . . . . . . . 5 0 0 0 0 0 100 5 5 5 0 0 100 100 46 0 0 0June 15, 2038 . . . . . . . . . . . . . . . . . . 0 0 0 0 0 0 72 3 3 3 0 0 100 100 31 0 0 0June 15, 2039 . . . . . . . . . . . . . . . . . . 0 0 0 0 0 0 2 2 2 2 0 0 100 78 19 0 0 0June 15, 2040 . . . . . . . . . . . . . . . . . . 0 0 0 0 0 0 1 1 1 1 0 0 100 34 8 0 0 0June 15, 2041 . . . . . . . . . . . . . . . . . . 0 0 0 0 0 0 0 0 0 0 0 0 100 0 0 0 0 0June 15, 2042 . . . . . . . . . . . . . . . . . . 0 0 0 0 0 0 0 0 0 0 0 0 0 0 0 0 0 0
Weighted AverageLife (Years) . . . . . . . . . . . . . . . . . . 16.4 5.5 5.5 5.5 3.8 2.7 26.3 18.0 18.0 18.0 12.3 8.2 29.9 27.7 24.9 4.7 1.7 1.1
Date 0% 125% 190% 250% 400% 600% 0% 125% 190% 250% 400% 600% 0% 125% 190% 250% 400% 600%
PSA Prepayment AssumptionPSA Prepayment AssumptionPSA Prepayment Assumption
GDGBFA, SA and Group 1 Assets
Closing Date . . . . . . . . . . . . . . . . . . . 100 100 100 100 100 100 100 100 100 100 100 100 100 100 100 100 100 100June 15, 2013 . . . . . . . . . . . . . . . . . . 99 95 93 91 86 80 100 100 100 100 100 30 100 100 86 86 86 86June 15, 2014 . . . . . . . . . . . . . . . . . . 98 87 82 77 66 53 100 100 100 100 0 0 100 100 63 63 15 0June 15, 2015 . . . . . . . . . . . . . . . . . . 97 79 71 64 49 33 100 100 100 100 0 0 100 100 43 43 0 0June 15, 2016 . . . . . . . . . . . . . . . . . . 95 71 62 54 37 21 100 100 100 25 0 0 100 100 27 27 0 0June 15, 2017 . . . . . . . . . . . . . . . . . . 94 65 53 45 27 13 100 100 100 0 0 0 100 100 15 15 0 0June 15, 2018 . . . . . . . . . . . . . . . . . . 93 58 46 37 20 8 100 100 100 0 0 0 100 100 7 0 0 0June 15, 2019 . . . . . . . . . . . . . . . . . . 91 53 40 31 15 5 100 100 100 0 0 0 100 100 1 0 0 0June 15, 2020 . . . . . . . . . . . . . . . . . . 89 47 35 25 11 3 100 100 100 0 0 0 100 99 0 0 0 0June 15, 2021 . . . . . . . . . . . . . . . . . . 88 43 30 21 8 2 100 100 100 0 0 0 100 92 0 0 0 0June 15, 2022 . . . . . . . . . . . . . . . . . . 86 38 26 17 6 1 100 100 100 0 0 0 100 79 0 0 0 0June 15, 2023 . . . . . . . . . . . . . . . . . . 84 34 22 14 4 1 100 100 100 0 0 0 100 61 0 0 0 0June 15, 2024 . . . . . . . . . . . . . . . . . . 82 31 19 12 3 0 100 100 100 0 0 0 100 39 0 0 0 0June 15, 2025 . . . . . . . . . . . . . . . . . . 79 27 16 10 2 0 100 100 100 0 0 0 100 15 0 0 0 0June 15, 2026 . . . . . . . . . . . . . . . . . . 77 24 13 8 2 0 100 100 100 0 0 0 100 0 0 0 0 0June 15, 2027 . . . . . . . . . . . . . . . . . . 74 21 11 6 1 0 100 100 100 0 0 0 100 0 0 0 0 0June 15, 2028 . . . . . . . . . . . . . . . . . . 71 19 10 5 1 0 100 100 100 0 0 0 100 0 0 0 0 0June 15, 2029 . . . . . . . . . . . . . . . . . . 68 16 8 4 1 0 100 100 100 0 0 0 100 0 0 0 0 0June 15, 2030 . . . . . . . . . . . . . . . . . . 65 14 7 3 0 0 100 100 100 0 0 0 100 0 0 0 0 0June 15, 2031 . . . . . . . . . . . . . . . . . . 61 12 5 3 0 0 100 100 98 0 0 0 100 0 0 0 0 0June 15, 2032 . . . . . . . . . . . . . . . . . . 57 10 4 2 0 0 100 100 62 0 0 0 100 0 0 0 0 0June 15, 2033 . . . . . . . . . . . . . . . . . . 53 9 4 2 0 0 100 100 30 0 0 0 100 0 0 0 0 0June 15, 2034 . . . . . . . . . . . . . . . . . . 49 7 3 1 0 0 100 100 1 0 0 0 100 0 0 0 0 0June 15, 2035 . . . . . . . . . . . . . . . . . . 44 6 2 1 0 0 100 100 0 0 0 0 100 0 0 0 0 0June 15, 2036 . . . . . . . . . . . . . . . . . . 39 4 2 1 0 0 100 100 0 0 0 0 100 0 0 0 0 0June 15, 2037 . . . . . . . . . . . . . . . . . . 34 3 1 0 0 0 100 100 0 0 0 0 100 0 0 0 0 0June 15, 2038 . . . . . . . . . . . . . . . . . . 28 2 1 0 0 0 100 34 0 0 0 0 100 0 0 0 0 0June 15, 2039 . . . . . . . . . . . . . . . . . . 22 1 0 0 0 0 100 0 0 0 0 0 87 0 0 0 0 0June 15, 2040 . . . . . . . . . . . . . . . . . . 15 1 0 0 0 0 100 0 0 0 0 0 0 0 0 0 0 0June 15, 2041 . . . . . . . . . . . . . . . . . . 8 0 0 0 0 0 100 0 0 0 0 0 0 0 0 0 0 0June 15, 2042 . . . . . . . . . . . . . . . . . . 0 0 0 0 0 0 0 0 0 0 0 0 0 0 0 0 0 0
Weighted AverageLife (Years) . . . . . . . . . . . . . . . . . . 19.9 9.3 7.1 5.8 3.9 2.7 29.7 25.8 20.4 3.9 1.6 1.0 27.3 11.4 2.9 2.8 1.6 1.1
(1) Rounded to nearest whole percentage.(2) The figures for each Retail Class apply to that Class as a whole. The prepayment behavior and weighted average lives of Retail Class Units will vary among
different investors.
S-21
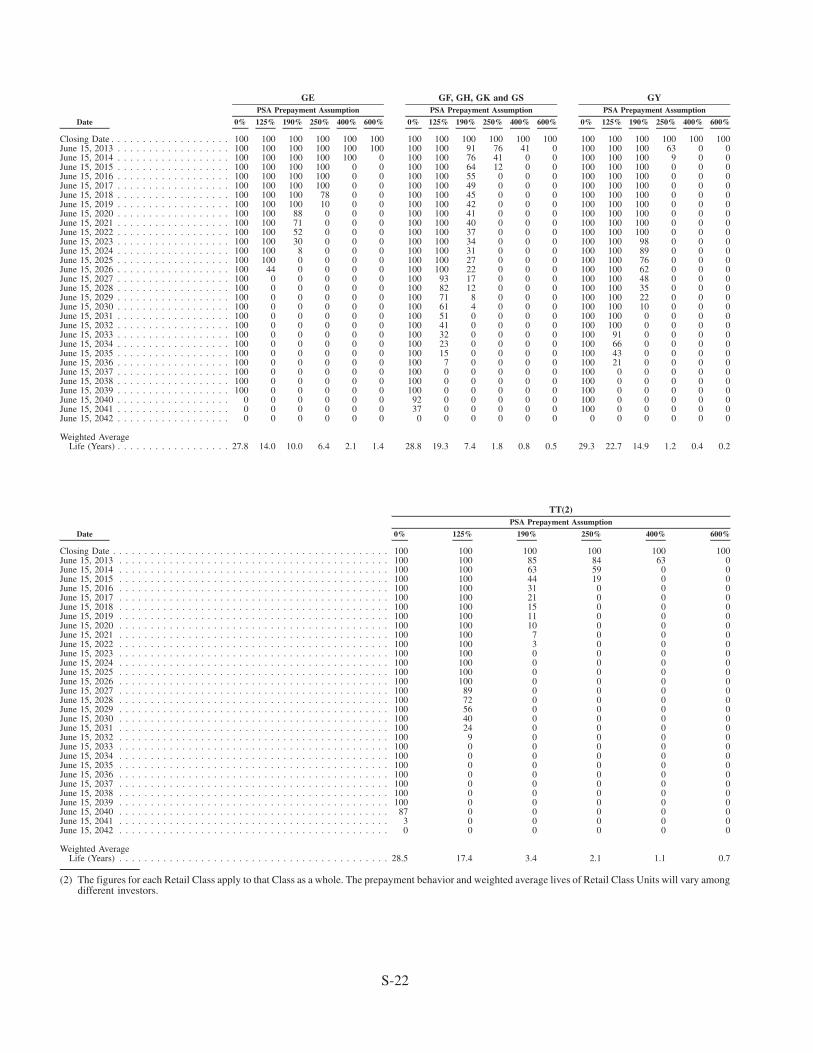
Date 0% 125% 190% 250% 400% 600% 0% 125% 190% 250% 400% 600% 0% 125% 190% 250% 400% 600%
PSA Prepayment AssumptionPSA Prepayment AssumptionPSA Prepayment Assumption
GYGF, GH, GK and GSGE
Closing Date . . . . . . . . . . . . . . . . . . . 100 100 100 100 100 100 100 100 100 100 100 100 100 100 100 100 100 100June 15, 2013 . . . . . . . . . . . . . . . . . . 100 100 100 100 100 100 100 100 91 76 41 0 100 100 100 63 0 0June 15, 2014 . . . . . . . . . . . . . . . . . . 100 100 100 100 100 0 100 100 76 41 0 0 100 100 100 9 0 0June 15, 2015 . . . . . . . . . . . . . . . . . . 100 100 100 100 0 0 100 100 64 12 0 0 100 100 100 0 0 0June 15, 2016 . . . . . . . . . . . . . . . . . . 100 100 100 100 0 0 100 100 55 0 0 0 100 100 100 0 0 0June 15, 2017 . . . . . . . . . . . . . . . . . . 100 100 100 100 0 0 100 100 49 0 0 0 100 100 100 0 0 0June 15, 2018 . . . . . . . . . . . . . . . . . . 100 100 100 78 0 0 100 100 45 0 0 0 100 100 100 0 0 0June 15, 2019 . . . . . . . . . . . . . . . . . . 100 100 100 10 0 0 100 100 42 0 0 0 100 100 100 0 0 0June 15, 2020 . . . . . . . . . . . . . . . . . . 100 100 88 0 0 0 100 100 41 0 0 0 100 100 100 0 0 0June 15, 2021 . . . . . . . . . . . . . . . . . . 100 100 71 0 0 0 100 100 40 0 0 0 100 100 100 0 0 0June 15, 2022 . . . . . . . . . . . . . . . . . . 100 100 52 0 0 0 100 100 37 0 0 0 100 100 100 0 0 0June 15, 2023 . . . . . . . . . . . . . . . . . . 100 100 30 0 0 0 100 100 34 0 0 0 100 100 98 0 0 0June 15, 2024 . . . . . . . . . . . . . . . . . . 100 100 8 0 0 0 100 100 31 0 0 0 100 100 89 0 0 0June 15, 2025 . . . . . . . . . . . . . . . . . . 100 100 0 0 0 0 100 100 27 0 0 0 100 100 76 0 0 0June 15, 2026 . . . . . . . . . . . . . . . . . . 100 44 0 0 0 0 100 100 22 0 0 0 100 100 62 0 0 0June 15, 2027 . . . . . . . . . . . . . . . . . . 100 0 0 0 0 0 100 93 17 0 0 0 100 100 48 0 0 0June 15, 2028 . . . . . . . . . . . . . . . . . . 100 0 0 0 0 0 100 82 12 0 0 0 100 100 35 0 0 0June 15, 2029 . . . . . . . . . . . . . . . . . . 100 0 0 0 0 0 100 71 8 0 0 0 100 100 22 0 0 0June 15, 2030 . . . . . . . . . . . . . . . . . . 100 0 0 0 0 0 100 61 4 0 0 0 100 100 10 0 0 0June 15, 2031 . . . . . . . . . . . . . . . . . . 100 0 0 0 0 0 100 51 0 0 0 0 100 100 0 0 0 0June 15, 2032 . . . . . . . . . . . . . . . . . . 100 0 0 0 0 0 100 41 0 0 0 0 100 100 0 0 0 0June 15, 2033 . . . . . . . . . . . . . . . . . . 100 0 0 0 0 0 100 32 0 0 0 0 100 91 0 0 0 0June 15, 2034 . . . . . . . . . . . . . . . . . . 100 0 0 0 0 0 100 23 0 0 0 0 100 66 0 0 0 0June 15, 2035 . . . . . . . . . . . . . . . . . . 100 0 0 0 0 0 100 15 0 0 0 0 100 43 0 0 0 0June 15, 2036 . . . . . . . . . . . . . . . . . . 100 0 0 0 0 0 100 7 0 0 0 0 100 21 0 0 0 0June 15, 2037 . . . . . . . . . . . . . . . . . . 100 0 0 0 0 0 100 0 0 0 0 0 100 0 0 0 0 0June 15, 2038 . . . . . . . . . . . . . . . . . . 100 0 0 0 0 0 100 0 0 0 0 0 100 0 0 0 0 0June 15, 2039 . . . . . . . . . . . . . . . . . . 100 0 0 0 0 0 100 0 0 0 0 0 100 0 0 0 0 0June 15, 2040 . . . . . . . . . . . . . . . . . . 0 0 0 0 0 0 92 0 0 0 0 0 100 0 0 0 0 0June 15, 2041 . . . . . . . . . . . . . . . . . . 0 0 0 0 0 0 37 0 0 0 0 0 100 0 0 0 0 0June 15, 2042 . . . . . . . . . . . . . . . . . . 0 0 0 0 0 0 0 0 0 0 0 0 0 0 0 0 0 0
Weighted AverageLife (Years) . . . . . . . . . . . . . . . . . . 27.8 14.0 10.0 6.4 2.1 1.4 28.8 19.3 7.4 1.8 0.8 0.5 29.3 22.7 14.9 1.2 0.4 0.2
Date 0% 125% 190% 250% 400% 600%
PSA Prepayment Assumption
TT(2)
Closing Date . . . . . . . . . . . . . . . . . . . . . . . . . . . . . . . . . . . . . . . . . . . . 100 100 100 100 100 100June 15, 2013 . . . . . . . . . . . . . . . . . . . . . . . . . . . . . . . . . . . . . . . . . . . 100 100 85 84 63 0June 15, 2014 . . . . . . . . . . . . . . . . . . . . . . . . . . . . . . . . . . . . . . . . . . . 100 100 63 59 0 0June 15, 2015 . . . . . . . . . . . . . . . . . . . . . . . . . . . . . . . . . . . . . . . . . . . 100 100 44 19 0 0June 15, 2016 . . . . . . . . . . . . . . . . . . . . . . . . . . . . . . . . . . . . . . . . . . . 100 100 31 0 0 0June 15, 2017 . . . . . . . . . . . . . . . . . . . . . . . . . . . . . . . . . . . . . . . . . . . 100 100 21 0 0 0June 15, 2018 . . . . . . . . . . . . . . . . . . . . . . . . . . . . . . . . . . . . . . . . . . . 100 100 15 0 0 0June 15, 2019 . . . . . . . . . . . . . . . . . . . . . . . . . . . . . . . . . . . . . . . . . . . 100 100 11 0 0 0June 15, 2020 . . . . . . . . . . . . . . . . . . . . . . . . . . . . . . . . . . . . . . . . . . . 100 100 10 0 0 0June 15, 2021 . . . . . . . . . . . . . . . . . . . . . . . . . . . . . . . . . . . . . . . . . . . 100 100 7 0 0 0June 15, 2022 . . . . . . . . . . . . . . . . . . . . . . . . . . . . . . . . . . . . . . . . . . . 100 100 3 0 0 0June 15, 2023 . . . . . . . . . . . . . . . . . . . . . . . . . . . . . . . . . . . . . . . . . . . 100 100 0 0 0 0June 15, 2024 . . . . . . . . . . . . . . . . . . . . . . . . . . . . . . . . . . . . . . . . . . . 100 100 0 0 0 0June 15, 2025 . . . . . . . . . . . . . . . . . . . . . . . . . . . . . . . . . . . . . . . . . . . 100 100 0 0 0 0June 15, 2026 . . . . . . . . . . . . . . . . . . . . . . . . . . . . . . . . . . . . . . . . . . . 100 100 0 0 0 0June 15, 2027 . . . . . . . . . . . . . . . . . . . . . . . . . . . . . . . . . . . . . . . . . . . 100 89 0 0 0 0June 15, 2028 . . . . . . . . . . . . . . . . . . . . . . . . . . . . . . . . . . . . . . . . . . . 100 72 0 0 0 0June 15, 2029 . . . . . . . . . . . . . . . . . . . . . . . . . . . . . . . . . . . . . . . . . . . 100 56 0 0 0 0June 15, 2030 . . . . . . . . . . . . . . . . . . . . . . . . . . . . . . . . . . . . . . . . . . . 100 40 0 0 0 0June 15, 2031 . . . . . . . . . . . . . . . . . . . . . . . . . . . . . . . . . . . . . . . . . . . 100 24 0 0 0 0June 15, 2032 . . . . . . . . . . . . . . . . . . . . . . . . . . . . . . . . . . . . . . . . . . . 100 9 0 0 0 0June 15, 2033 . . . . . . . . . . . . . . . . . . . . . . . . . . . . . . . . . . . . . . . . . . . 100 0 0 0 0 0June 15, 2034 . . . . . . . . . . . . . . . . . . . . . . . . . . . . . . . . . . . . . . . . . . . 100 0 0 0 0 0June 15, 2035 . . . . . . . . . . . . . . . . . . . . . . . . . . . . . . . . . . . . . . . . . . . 100 0 0 0 0 0June 15, 2036 . . . . . . . . . . . . . . . . . . . . . . . . . . . . . . . . . . . . . . . . . . . 100 0 0 0 0 0June 15, 2037 . . . . . . . . . . . . . . . . . . . . . . . . . . . . . . . . . . . . . . . . . . . 100 0 0 0 0 0June 15, 2038 . . . . . . . . . . . . . . . . . . . . . . . . . . . . . . . . . . . . . . . . . . . 100 0 0 0 0 0June 15, 2039 . . . . . . . . . . . . . . . . . . . . . . . . . . . . . . . . . . . . . . . . . . . 100 0 0 0 0 0June 15, 2040 . . . . . . . . . . . . . . . . . . . . . . . . . . . . . . . . . . . . . . . . . . . 87 0 0 0 0 0June 15, 2041 . . . . . . . . . . . . . . . . . . . . . . . . . . . . . . . . . . . . . . . . . . . 3 0 0 0 0 0June 15, 2042 . . . . . . . . . . . . . . . . . . . . . . . . . . . . . . . . . . . . . . . . . . . 0 0 0 0 0 0
Weighted AverageLife (Years) . . . . . . . . . . . . . . . . . . . . . . . . . . . . . . . . . . . . . . . . . . . 28.5 17.4 3.4 2.1 1.1 0.7
(2) The figures for each Retail Class apply to that Class as a whole. The prepayment behavior and weighted average lives of Retail Class Units will vary amongdifferent investors.
S-22
Group 2
Date 0% 100% 250% 400% 500%
PSA Prepayment Assumption
FG, GO, IG, SG, SH and Group 2 Assets
Closing Date . . . . . . . . . . . . . . . . . . . . . . . . . . . . . . . . . . . . . . . . . . . . 100 100 100 100 100June 15, 2013 . . . . . . . . . . . . . . . . . . . . . . . . . . . . . . . . . . . . . . . . . . . 96 89 82 74 69June 15, 2014 . . . . . . . . . . . . . . . . . . . . . . . . . . . . . . . . . . . . . . . . . . . 92 78 65 53 45June 15, 2015 . . . . . . . . . . . . . . . . . . . . . . . . . . . . . . . . . . . . . . . . . . . 87 68 51 37 30June 15, 2016 . . . . . . . . . . . . . . . . . . . . . . . . . . . . . . . . . . . . . . . . . . . 82 59 40 26 19June 15, 2017 . . . . . . . . . . . . . . . . . . . . . . . . . . . . . . . . . . . . . . . . . . . 77 50 31 18 12June 15, 2018 . . . . . . . . . . . . . . . . . . . . . . . . . . . . . . . . . . . . . . . . . . . 71 42 23 12 8June 15, 2019 . . . . . . . . . . . . . . . . . . . . . . . . . . . . . . . . . . . . . . . . . . . 65 35 17 8 5June 15, 2020 . . . . . . . . . . . . . . . . . . . . . . . . . . . . . . . . . . . . . . . . . . . 59 28 13 5 3June 15, 2021 . . . . . . . . . . . . . . . . . . . . . . . . . . . . . . . . . . . . . . . . . . . 52 21 9 3 2June 15, 2022 . . . . . . . . . . . . . . . . . . . . . . . . . . . . . . . . . . . . . . . . . . . 45 15 6 2 1June 15, 2023 . . . . . . . . . . . . . . . . . . . . . . . . . . . . . . . . . . . . . . . . . . . 37 10 3 1 0June 15, 2024 . . . . . . . . . . . . . . . . . . . . . . . . . . . . . . . . . . . . . . . . . . . 28 5 1 0 0June 15, 2025 . . . . . . . . . . . . . . . . . . . . . . . . . . . . . . . . . . . . . . . . . . . 20 0 0 0 0June 15, 2026 . . . . . . . . . . . . . . . . . . . . . . . . . . . . . . . . . . . . . . . . . . . 10 0 0 0 0June 15, 2027 . . . . . . . . . . . . . . . . . . . . . . . . . . . . . . . . . . . . . . . . . . . 0 0 0 0 0
Weighted AverageLife (Years) . . . . . . . . . . . . . . . . . . . . . . . . . . . . . . . . . . . . . . . . . . . 8.7 5.5 3.9 2.9 2.4
Group 3
Date 0% 150% 200% 250% 500% 0% 150% 200% 250% 500% 0% 150% 200% 250% 500%
PSA Prepayment AssumptionPSA Prepayment AssumptionPSA Prepayment Assumption
CP and FCCE, CF and CSCB
Closing Date . . . . . . . . . . . . . . . . . . . 100 100 100 100 100 100 100 100 100 100 100 100 100 100 100June 15, 2013 . . . . . . . . . . . . . . . . . . 100 100 100 100 100 98 93 93 93 93 100 100 95 90 64June 15, 2014 . . . . . . . . . . . . . . . . . . 100 100 100 100 100 96 82 82 82 79 100 100 84 67 0June 15, 2015 . . . . . . . . . . . . . . . . . . 100 100 100 100 100 94 68 68 68 46 100 100 70 41 0June 15, 2016 . . . . . . . . . . . . . . . . . . 100 100 100 100 100 92 54 54 54 23 100 100 60 23 0June 15, 2017 . . . . . . . . . . . . . . . . . . 100 100 100 100 100 89 43 43 43 7 100 100 53 11 0June 15, 2018 . . . . . . . . . . . . . . . . . . 100 100 100 100 86 87 32 32 32 0 100 100 49 4 0June 15, 2019 . . . . . . . . . . . . . . . . . . 100 100 100 100 59 84 22 22 22 0 100 100 46 0 0June 15, 2020 . . . . . . . . . . . . . . . . . . 100 100 100 100 40 81 14 14 14 0 100 100 45 0 0June 15, 2021 . . . . . . . . . . . . . . . . . . 100 100 100 100 27 78 7 7 7 0 100 98 43 0 0June 15, 2022 . . . . . . . . . . . . . . . . . . 100 100 100 100 18 75 1 1 1 0 100 94 41 0 0June 15, 2023 . . . . . . . . . . . . . . . . . . 100 84 84 84 12 72 0 0 0 0 100 89 38 0 0June 15, 2024 . . . . . . . . . . . . . . . . . . 100 69 69 69 8 68 0 0 0 0 100 84 35 0 0June 15, 2025 . . . . . . . . . . . . . . . . . . 100 56 56 56 6 64 0 0 0 0 100 78 32 0 0June 15, 2026 . . . . . . . . . . . . . . . . . . 100 46 46 46 4 60 0 0 0 0 100 71 28 0 0June 15, 2027 . . . . . . . . . . . . . . . . . . 100 37 37 37 3 56 0 0 0 0 100 65 25 0 0June 15, 2028 . . . . . . . . . . . . . . . . . . 100 30 30 30 2 51 0 0 0 0 100 58 22 0 0June 15, 2029 . . . . . . . . . . . . . . . . . . 100 24 24 24 1 46 0 0 0 0 100 52 19 0 0June 15, 2030 . . . . . . . . . . . . . . . . . . 100 19 19 19 1 41 0 0 0 0 100 46 17 0 0June 15, 2031 . . . . . . . . . . . . . . . . . . 100 15 15 15 0 36 0 0 0 0 100 40 14 0 0June 15, 2032 . . . . . . . . . . . . . . . . . . 100 12 12 12 0 30 0 0 0 0 100 35 12 0 0June 15, 2033 . . . . . . . . . . . . . . . . . . 100 9 9 9 0 24 0 0 0 0 100 30 10 0 0June 15, 2034 . . . . . . . . . . . . . . . . . . 100 7 7 7 0 17 0 0 0 0 100 25 8 0 0June 15, 2035 . . . . . . . . . . . . . . . . . . 100 5 5 5 0 10 0 0 0 0 100 21 7 0 0June 15, 2036 . . . . . . . . . . . . . . . . . . 100 4 4 4 0 3 0 0 0 0 100 17 5 0 0June 15, 2037 . . . . . . . . . . . . . . . . . . 82 3 3 3 0 0 0 0 0 0 100 13 4 0 0June 15, 2038 . . . . . . . . . . . . . . . . . . 51 2 2 2 0 0 0 0 0 0 100 10 3 0 0June 15, 2039 . . . . . . . . . . . . . . . . . . 19 1 1 1 0 0 0 0 0 0 100 7 2 0 0June 15, 2040 . . . . . . . . . . . . . . . . . . 1 1 1 1 0 0 0 0 0 0 82 4 1 0 0June 15, 2041 . . . . . . . . . . . . . . . . . . 0 0 0 0 0 0 0 0 0 0 42 2 0 0 0June 15, 2042 . . . . . . . . . . . . . . . . . . 0 0 0 0 0 0 0 0 0 0 0 0 0 0 0
Weighted AverageLife (Years) . . . . . . . . . . . . . . . . . . 26.0 14.7 14.7 14.7 8.2 15.0 4.7 4.7 4.7 3.0 28.8 17.9 9.2 2.9 1.2
S-23
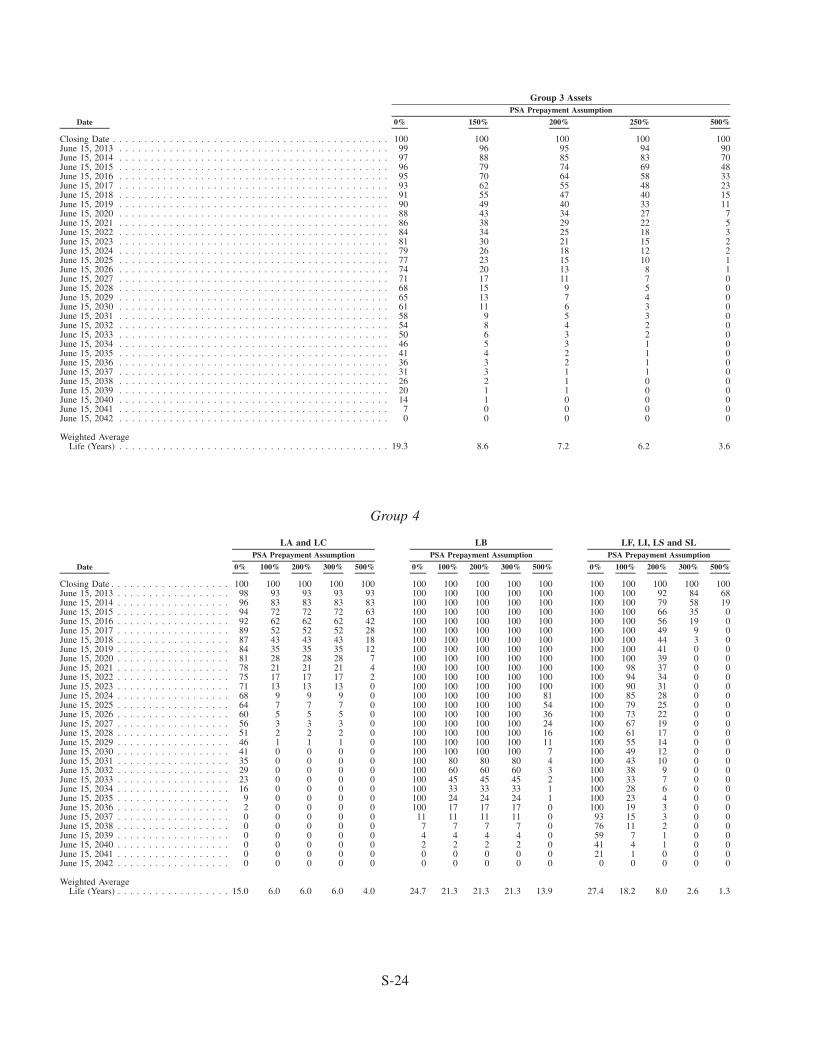
Date 0% 150% 200% 250% 500%
PSA Prepayment Assumption
Group 3 Assets
Closing Date . . . . . . . . . . . . . . . . . . . . . . . . . . . . . . . . . . . . . . . . . . . . 100 100 100 100 100June 15, 2013 . . . . . . . . . . . . . . . . . . . . . . . . . . . . . . . . . . . . . . . . . . . 99 96 95 94 90June 15, 2014 . . . . . . . . . . . . . . . . . . . . . . . . . . . . . . . . . . . . . . . . . . . 97 88 85 83 70June 15, 2015 . . . . . . . . . . . . . . . . . . . . . . . . . . . . . . . . . . . . . . . . . . . 96 79 74 69 48June 15, 2016 . . . . . . . . . . . . . . . . . . . . . . . . . . . . . . . . . . . . . . . . . . . 95 70 64 58 33June 15, 2017 . . . . . . . . . . . . . . . . . . . . . . . . . . . . . . . . . . . . . . . . . . . 93 62 55 48 23June 15, 2018 . . . . . . . . . . . . . . . . . . . . . . . . . . . . . . . . . . . . . . . . . . . 91 55 47 40 15June 15, 2019 . . . . . . . . . . . . . . . . . . . . . . . . . . . . . . . . . . . . . . . . . . . 90 49 40 33 11June 15, 2020 . . . . . . . . . . . . . . . . . . . . . . . . . . . . . . . . . . . . . . . . . . . 88 43 34 27 7June 15, 2021 . . . . . . . . . . . . . . . . . . . . . . . . . . . . . . . . . . . . . . . . . . . 86 38 29 22 5June 15, 2022 . . . . . . . . . . . . . . . . . . . . . . . . . . . . . . . . . . . . . . . . . . . 84 34 25 18 3June 15, 2023 . . . . . . . . . . . . . . . . . . . . . . . . . . . . . . . . . . . . . . . . . . . 81 30 21 15 2June 15, 2024 . . . . . . . . . . . . . . . . . . . . . . . . . . . . . . . . . . . . . . . . . . . 79 26 18 12 2June 15, 2025 . . . . . . . . . . . . . . . . . . . . . . . . . . . . . . . . . . . . . . . . . . . 77 23 15 10 1June 15, 2026 . . . . . . . . . . . . . . . . . . . . . . . . . . . . . . . . . . . . . . . . . . . 74 20 13 8 1June 15, 2027 . . . . . . . . . . . . . . . . . . . . . . . . . . . . . . . . . . . . . . . . . . . 71 17 11 7 0June 15, 2028 . . . . . . . . . . . . . . . . . . . . . . . . . . . . . . . . . . . . . . . . . . . 68 15 9 5 0June 15, 2029 . . . . . . . . . . . . . . . . . . . . . . . . . . . . . . . . . . . . . . . . . . . 65 13 7 4 0June 15, 2030 . . . . . . . . . . . . . . . . . . . . . . . . . . . . . . . . . . . . . . . . . . . 61 11 6 3 0June 15, 2031 . . . . . . . . . . . . . . . . . . . . . . . . . . . . . . . . . . . . . . . . . . . 58 9 5 3 0June 15, 2032 . . . . . . . . . . . . . . . . . . . . . . . . . . . . . . . . . . . . . . . . . . . 54 8 4 2 0June 15, 2033 . . . . . . . . . . . . . . . . . . . . . . . . . . . . . . . . . . . . . . . . . . . 50 6 3 2 0June 15, 2034 . . . . . . . . . . . . . . . . . . . . . . . . . . . . . . . . . . . . . . . . . . . 46 5 3 1 0June 15, 2035 . . . . . . . . . . . . . . . . . . . . . . . . . . . . . . . . . . . . . . . . . . . 41 4 2 1 0June 15, 2036 . . . . . . . . . . . . . . . . . . . . . . . . . . . . . . . . . . . . . . . . . . . 36 3 2 1 0June 15, 2037 . . . . . . . . . . . . . . . . . . . . . . . . . . . . . . . . . . . . . . . . . . . 31 3 1 1 0June 15, 2038 . . . . . . . . . . . . . . . . . . . . . . . . . . . . . . . . . . . . . . . . . . . 26 2 1 0 0June 15, 2039 . . . . . . . . . . . . . . . . . . . . . . . . . . . . . . . . . . . . . . . . . . . 20 1 1 0 0June 15, 2040 . . . . . . . . . . . . . . . . . . . . . . . . . . . . . . . . . . . . . . . . . . . 14 1 0 0 0June 15, 2041 . . . . . . . . . . . . . . . . . . . . . . . . . . . . . . . . . . . . . . . . . . . 7 0 0 0 0June 15, 2042 . . . . . . . . . . . . . . . . . . . . . . . . . . . . . . . . . . . . . . . . . . . 0 0 0 0 0
Weighted AverageLife (Years) . . . . . . . . . . . . . . . . . . . . . . . . . . . . . . . . . . . . . . . . . . . 19.3 8.6 7.2 6.2 3.6
Group 4
Date 0% 100% 200% 300% 500% 0% 100% 200% 300% 500% 0% 100% 200% 300% 500%
PSA Prepayment AssumptionPSA Prepayment AssumptionPSA Prepayment Assumption
LF, LI, LS and SLLBLA and LC
Closing Date . . . . . . . . . . . . . . . . . . . 100 100 100 100 100 100 100 100 100 100 100 100 100 100 100June 15, 2013 . . . . . . . . . . . . . . . . . . 98 93 93 93 93 100 100 100 100 100 100 100 92 84 68June 15, 2014 . . . . . . . . . . . . . . . . . . 96 83 83 83 83 100 100 100 100 100 100 100 79 58 19June 15, 2015 . . . . . . . . . . . . . . . . . . 94 72 72 72 63 100 100 100 100 100 100 100 66 35 0June 15, 2016 . . . . . . . . . . . . . . . . . . 92 62 62 62 42 100 100 100 100 100 100 100 56 19 0June 15, 2017 . . . . . . . . . . . . . . . . . . 89 52 52 52 28 100 100 100 100 100 100 100 49 9 0June 15, 2018 . . . . . . . . . . . . . . . . . . 87 43 43 43 18 100 100 100 100 100 100 100 44 3 0June 15, 2019 . . . . . . . . . . . . . . . . . . 84 35 35 35 12 100 100 100 100 100 100 100 41 0 0June 15, 2020 . . . . . . . . . . . . . . . . . . 81 28 28 28 7 100 100 100 100 100 100 100 39 0 0June 15, 2021 . . . . . . . . . . . . . . . . . . 78 21 21 21 4 100 100 100 100 100 100 98 37 0 0June 15, 2022 . . . . . . . . . . . . . . . . . . 75 17 17 17 2 100 100 100 100 100 100 94 34 0 0June 15, 2023 . . . . . . . . . . . . . . . . . . 71 13 13 13 0 100 100 100 100 100 100 90 31 0 0June 15, 2024 . . . . . . . . . . . . . . . . . . 68 9 9 9 0 100 100 100 100 81 100 85 28 0 0June 15, 2025 . . . . . . . . . . . . . . . . . . 64 7 7 7 0 100 100 100 100 54 100 79 25 0 0June 15, 2026 . . . . . . . . . . . . . . . . . . 60 5 5 5 0 100 100 100 100 36 100 73 22 0 0June 15, 2027 . . . . . . . . . . . . . . . . . . 56 3 3 3 0 100 100 100 100 24 100 67 19 0 0June 15, 2028 . . . . . . . . . . . . . . . . . . 51 2 2 2 0 100 100 100 100 16 100 61 17 0 0June 15, 2029 . . . . . . . . . . . . . . . . . . 46 1 1 1 0 100 100 100 100 11 100 55 14 0 0June 15, 2030 . . . . . . . . . . . . . . . . . . 41 0 0 0 0 100 100 100 100 7 100 49 12 0 0June 15, 2031 . . . . . . . . . . . . . . . . . . 35 0 0 0 0 100 80 80 80 4 100 43 10 0 0June 15, 2032 . . . . . . . . . . . . . . . . . . 29 0 0 0 0 100 60 60 60 3 100 38 9 0 0June 15, 2033 . . . . . . . . . . . . . . . . . . 23 0 0 0 0 100 45 45 45 2 100 33 7 0 0June 15, 2034 . . . . . . . . . . . . . . . . . . 16 0 0 0 0 100 33 33 33 1 100 28 6 0 0June 15, 2035 . . . . . . . . . . . . . . . . . . 9 0 0 0 0 100 24 24 24 1 100 23 4 0 0June 15, 2036 . . . . . . . . . . . . . . . . . . 2 0 0 0 0 100 17 17 17 0 100 19 3 0 0June 15, 2037 . . . . . . . . . . . . . . . . . . 0 0 0 0 0 11 11 11 11 0 93 15 3 0 0June 15, 2038 . . . . . . . . . . . . . . . . . . 0 0 0 0 0 7 7 7 7 0 76 11 2 0 0June 15, 2039 . . . . . . . . . . . . . . . . . . 0 0 0 0 0 4 4 4 4 0 59 7 1 0 0June 15, 2040 . . . . . . . . . . . . . . . . . . 0 0 0 0 0 2 2 2 2 0 41 4 1 0 0June 15, 2041 . . . . . . . . . . . . . . . . . . 0 0 0 0 0 0 0 0 0 0 21 1 0 0 0June 15, 2042 . . . . . . . . . . . . . . . . . . 0 0 0 0 0 0 0 0 0 0 0 0 0 0 0
Weighted AverageLife (Years) . . . . . . . . . . . . . . . . . . 15.0 6.0 6.0 6.0 4.0 24.7 21.3 21.3 21.3 13.9 27.4 18.2 8.0 2.6 1.3
S-24
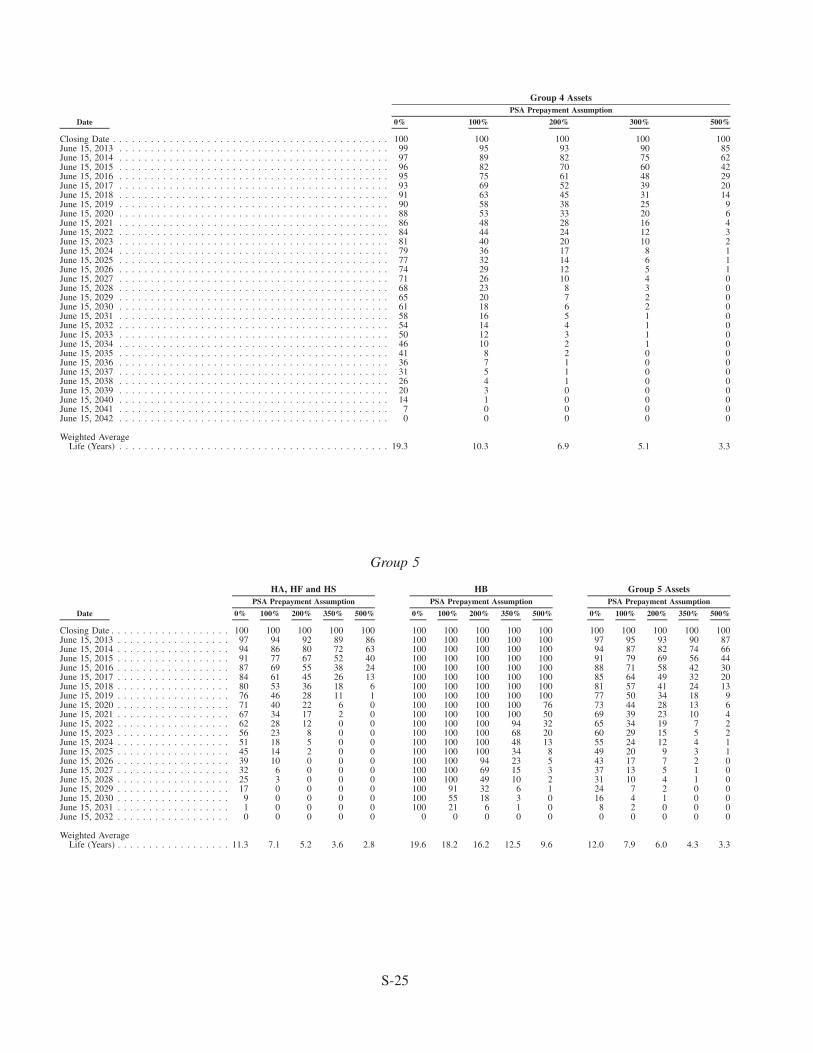
Date 0% 100% 200% 300% 500%
PSA Prepayment Assumption
Group 4 Assets
Closing Date . . . . . . . . . . . . . . . . . . . . . . . . . . . . . . . . . . . . . . . . . . . . 100 100 100 100 100June 15, 2013 . . . . . . . . . . . . . . . . . . . . . . . . . . . . . . . . . . . . . . . . . . . 99 95 93 90 85June 15, 2014 . . . . . . . . . . . . . . . . . . . . . . . . . . . . . . . . . . . . . . . . . . . 97 89 82 75 62June 15, 2015 . . . . . . . . . . . . . . . . . . . . . . . . . . . . . . . . . . . . . . . . . . . 96 82 70 60 42June 15, 2016 . . . . . . . . . . . . . . . . . . . . . . . . . . . . . . . . . . . . . . . . . . . 95 75 61 48 29June 15, 2017 . . . . . . . . . . . . . . . . . . . . . . . . . . . . . . . . . . . . . . . . . . . 93 69 52 39 20June 15, 2018 . . . . . . . . . . . . . . . . . . . . . . . . . . . . . . . . . . . . . . . . . . . 91 63 45 31 14June 15, 2019 . . . . . . . . . . . . . . . . . . . . . . . . . . . . . . . . . . . . . . . . . . . 90 58 38 25 9June 15, 2020 . . . . . . . . . . . . . . . . . . . . . . . . . . . . . . . . . . . . . . . . . . . 88 53 33 20 6June 15, 2021 . . . . . . . . . . . . . . . . . . . . . . . . . . . . . . . . . . . . . . . . . . . 86 48 28 16 4June 15, 2022 . . . . . . . . . . . . . . . . . . . . . . . . . . . . . . . . . . . . . . . . . . . 84 44 24 12 3June 15, 2023 . . . . . . . . . . . . . . . . . . . . . . . . . . . . . . . . . . . . . . . . . . . 81 40 20 10 2June 15, 2024 . . . . . . . . . . . . . . . . . . . . . . . . . . . . . . . . . . . . . . . . . . . 79 36 17 8 1June 15, 2025 . . . . . . . . . . . . . . . . . . . . . . . . . . . . . . . . . . . . . . . . . . . 77 32 14 6 1June 15, 2026 . . . . . . . . . . . . . . . . . . . . . . . . . . . . . . . . . . . . . . . . . . . 74 29 12 5 1June 15, 2027 . . . . . . . . . . . . . . . . . . . . . . . . . . . . . . . . . . . . . . . . . . . 71 26 10 4 0June 15, 2028 . . . . . . . . . . . . . . . . . . . . . . . . . . . . . . . . . . . . . . . . . . . 68 23 8 3 0June 15, 2029 . . . . . . . . . . . . . . . . . . . . . . . . . . . . . . . . . . . . . . . . . . . 65 20 7 2 0June 15, 2030 . . . . . . . . . . . . . . . . . . . . . . . . . . . . . . . . . . . . . . . . . . . 61 18 6 2 0June 15, 2031 . . . . . . . . . . . . . . . . . . . . . . . . . . . . . . . . . . . . . . . . . . . 58 16 5 1 0June 15, 2032 . . . . . . . . . . . . . . . . . . . . . . . . . . . . . . . . . . . . . . . . . . . 54 14 4 1 0June 15, 2033 . . . . . . . . . . . . . . . . . . . . . . . . . . . . . . . . . . . . . . . . . . . 50 12 3 1 0June 15, 2034 . . . . . . . . . . . . . . . . . . . . . . . . . . . . . . . . . . . . . . . . . . . 46 10 2 1 0June 15, 2035 . . . . . . . . . . . . . . . . . . . . . . . . . . . . . . . . . . . . . . . . . . . 41 8 2 0 0June 15, 2036 . . . . . . . . . . . . . . . . . . . . . . . . . . . . . . . . . . . . . . . . . . . 36 7 1 0 0June 15, 2037 . . . . . . . . . . . . . . . . . . . . . . . . . . . . . . . . . . . . . . . . . . . 31 5 1 0 0June 15, 2038 . . . . . . . . . . . . . . . . . . . . . . . . . . . . . . . . . . . . . . . . . . . 26 4 1 0 0June 15, 2039 . . . . . . . . . . . . . . . . . . . . . . . . . . . . . . . . . . . . . . . . . . . 20 3 0 0 0June 15, 2040 . . . . . . . . . . . . . . . . . . . . . . . . . . . . . . . . . . . . . . . . . . . 14 1 0 0 0June 15, 2041 . . . . . . . . . . . . . . . . . . . . . . . . . . . . . . . . . . . . . . . . . . . 7 0 0 0 0June 15, 2042 . . . . . . . . . . . . . . . . . . . . . . . . . . . . . . . . . . . . . . . . . . . 0 0 0 0 0
Weighted AverageLife (Years) . . . . . . . . . . . . . . . . . . . . . . . . . . . . . . . . . . . . . . . . . . . 19.3 10.3 6.9 5.1 3.3
Group 5
Date 0% 100% 200% 350% 500% 0% 100% 200% 350% 500% 0% 100% 200% 350% 500%
PSA Prepayment AssumptionPSA Prepayment AssumptionPSA Prepayment Assumption
Group 5 AssetsHBHA, HF and HS
Closing Date . . . . . . . . . . . . . . . . . . . 100 100 100 100 100 100 100 100 100 100 100 100 100 100 100June 15, 2013 . . . . . . . . . . . . . . . . . . 97 94 92 89 86 100 100 100 100 100 97 95 93 90 87June 15, 2014 . . . . . . . . . . . . . . . . . . 94 86 80 72 63 100 100 100 100 100 94 87 82 74 66June 15, 2015 . . . . . . . . . . . . . . . . . . 91 77 67 52 40 100 100 100 100 100 91 79 69 56 44June 15, 2016 . . . . . . . . . . . . . . . . . . 87 69 55 38 24 100 100 100 100 100 88 71 58 42 30June 15, 2017 . . . . . . . . . . . . . . . . . . 84 61 45 26 13 100 100 100 100 100 85 64 49 32 20June 15, 2018 . . . . . . . . . . . . . . . . . . 80 53 36 18 6 100 100 100 100 100 81 57 41 24 13June 15, 2019 . . . . . . . . . . . . . . . . . . 76 46 28 11 1 100 100 100 100 100 77 50 34 18 9June 15, 2020 . . . . . . . . . . . . . . . . . . 71 40 22 6 0 100 100 100 100 76 73 44 28 13 6June 15, 2021 . . . . . . . . . . . . . . . . . . 67 34 17 2 0 100 100 100 100 50 69 39 23 10 4June 15, 2022 . . . . . . . . . . . . . . . . . . 62 28 12 0 0 100 100 100 94 32 65 34 19 7 2June 15, 2023 . . . . . . . . . . . . . . . . . . 56 23 8 0 0 100 100 100 68 20 60 29 15 5 2June 15, 2024 . . . . . . . . . . . . . . . . . . 51 18 5 0 0 100 100 100 48 13 55 24 12 4 1June 15, 2025 . . . . . . . . . . . . . . . . . . 45 14 2 0 0 100 100 100 34 8 49 20 9 3 1June 15, 2026 . . . . . . . . . . . . . . . . . . 39 10 0 0 0 100 100 94 23 5 43 17 7 2 0June 15, 2027 . . . . . . . . . . . . . . . . . . 32 6 0 0 0 100 100 69 15 3 37 13 5 1 0June 15, 2028 . . . . . . . . . . . . . . . . . . 25 3 0 0 0 100 100 49 10 2 31 10 4 1 0June 15, 2029 . . . . . . . . . . . . . . . . . . 17 0 0 0 0 100 91 32 6 1 24 7 2 0 0June 15, 2030 . . . . . . . . . . . . . . . . . . 9 0 0 0 0 100 55 18 3 0 16 4 1 0 0June 15, 2031 . . . . . . . . . . . . . . . . . . 1 0 0 0 0 100 21 6 1 0 8 2 0 0 0June 15, 2032 . . . . . . . . . . . . . . . . . . 0 0 0 0 0 0 0 0 0 0 0 0 0 0 0
Weighted AverageLife (Years) . . . . . . . . . . . . . . . . . . 11.3 7.1 5.2 3.6 2.8 19.6 18.2 16.2 12.5 9.6 12.0 7.9 6.0 4.3 3.3
S-25
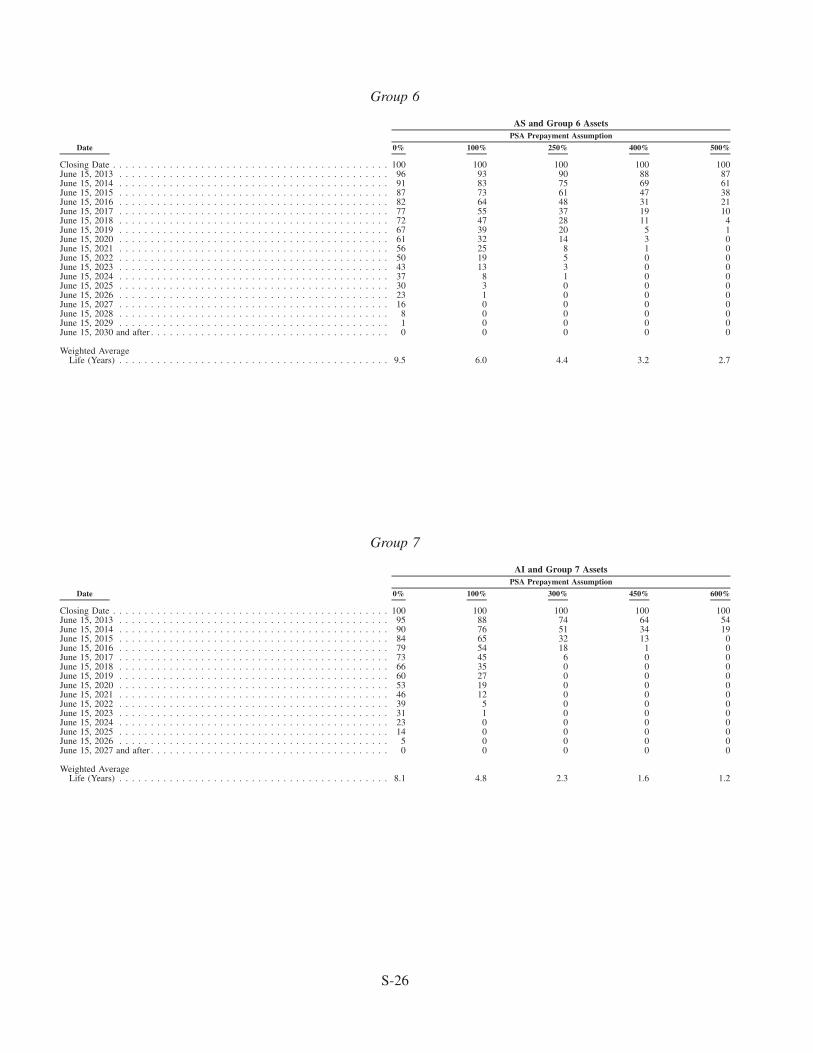
Group 6
Date 0% 100% 250% 400% 500%
PSA Prepayment Assumption
AS and Group 6 Assets
Closing Date . . . . . . . . . . . . . . . . . . . . . . . . . . . . . . . . . . . . . . . . . . . . 100 100 100 100 100June 15, 2013 . . . . . . . . . . . . . . . . . . . . . . . . . . . . . . . . . . . . . . . . . . . 96 93 90 88 87June 15, 2014 . . . . . . . . . . . . . . . . . . . . . . . . . . . . . . . . . . . . . . . . . . . 91 83 75 69 61June 15, 2015 . . . . . . . . . . . . . . . . . . . . . . . . . . . . . . . . . . . . . . . . . . . 87 73 61 47 38June 15, 2016 . . . . . . . . . . . . . . . . . . . . . . . . . . . . . . . . . . . . . . . . . . . 82 64 48 31 21June 15, 2017 . . . . . . . . . . . . . . . . . . . . . . . . . . . . . . . . . . . . . . . . . . . 77 55 37 19 10June 15, 2018 . . . . . . . . . . . . . . . . . . . . . . . . . . . . . . . . . . . . . . . . . . . 72 47 28 11 4June 15, 2019 . . . . . . . . . . . . . . . . . . . . . . . . . . . . . . . . . . . . . . . . . . . 67 39 20 5 1June 15, 2020 . . . . . . . . . . . . . . . . . . . . . . . . . . . . . . . . . . . . . . . . . . . 61 32 14 3 0June 15, 2021 . . . . . . . . . . . . . . . . . . . . . . . . . . . . . . . . . . . . . . . . . . . 56 25 8 1 0June 15, 2022 . . . . . . . . . . . . . . . . . . . . . . . . . . . . . . . . . . . . . . . . . . . 50 19 5 0 0June 15, 2023 . . . . . . . . . . . . . . . . . . . . . . . . . . . . . . . . . . . . . . . . . . . 43 13 3 0 0June 15, 2024 . . . . . . . . . . . . . . . . . . . . . . . . . . . . . . . . . . . . . . . . . . . 37 8 1 0 0June 15, 2025 . . . . . . . . . . . . . . . . . . . . . . . . . . . . . . . . . . . . . . . . . . . 30 3 0 0 0June 15, 2026 . . . . . . . . . . . . . . . . . . . . . . . . . . . . . . . . . . . . . . . . . . . 23 1 0 0 0June 15, 2027 . . . . . . . . . . . . . . . . . . . . . . . . . . . . . . . . . . . . . . . . . . . 16 0 0 0 0June 15, 2028 . . . . . . . . . . . . . . . . . . . . . . . . . . . . . . . . . . . . . . . . . . . 8 0 0 0 0June 15, 2029 . . . . . . . . . . . . . . . . . . . . . . . . . . . . . . . . . . . . . . . . . . . 1 0 0 0 0June 15, 2030 and after . . . . . . . . . . . . . . . . . . . . . . . . . . . . . . . . . . . . . . 0 0 0 0 0
Weighted AverageLife (Years) . . . . . . . . . . . . . . . . . . . . . . . . . . . . . . . . . . . . . . . . . . . 9.5 6.0 4.4 3.2 2.7
Group 7
Date 0% 100% 300% 450% 600%
PSA Prepayment Assumption
AI and Group 7 Assets
Closing Date . . . . . . . . . . . . . . . . . . . . . . . . . . . . . . . . . . . . . . . . . . . . 100 100 100 100 100June 15, 2013 . . . . . . . . . . . . . . . . . . . . . . . . . . . . . . . . . . . . . . . . . . . 95 88 74 64 54June 15, 2014 . . . . . . . . . . . . . . . . . . . . . . . . . . . . . . . . . . . . . . . . . . . 90 76 51 34 19June 15, 2015 . . . . . . . . . . . . . . . . . . . . . . . . . . . . . . . . . . . . . . . . . . . 84 65 32 13 0June 15, 2016 . . . . . . . . . . . . . . . . . . . . . . . . . . . . . . . . . . . . . . . . . . . 79 54 18 1 0June 15, 2017 . . . . . . . . . . . . . . . . . . . . . . . . . . . . . . . . . . . . . . . . . . . 73 45 6 0 0June 15, 2018 . . . . . . . . . . . . . . . . . . . . . . . . . . . . . . . . . . . . . . . . . . . 66 35 0 0 0June 15, 2019 . . . . . . . . . . . . . . . . . . . . . . . . . . . . . . . . . . . . . . . . . . . 60 27 0 0 0June 15, 2020 . . . . . . . . . . . . . . . . . . . . . . . . . . . . . . . . . . . . . . . . . . . 53 19 0 0 0June 15, 2021 . . . . . . . . . . . . . . . . . . . . . . . . . . . . . . . . . . . . . . . . . . . 46 12 0 0 0June 15, 2022 . . . . . . . . . . . . . . . . . . . . . . . . . . . . . . . . . . . . . . . . . . . 39 5 0 0 0June 15, 2023 . . . . . . . . . . . . . . . . . . . . . . . . . . . . . . . . . . . . . . . . . . . 31 1 0 0 0June 15, 2024 . . . . . . . . . . . . . . . . . . . . . . . . . . . . . . . . . . . . . . . . . . . 23 0 0 0 0June 15, 2025 . . . . . . . . . . . . . . . . . . . . . . . . . . . . . . . . . . . . . . . . . . . 14 0 0 0 0June 15, 2026 . . . . . . . . . . . . . . . . . . . . . . . . . . . . . . . . . . . . . . . . . . . 5 0 0 0 0June 15, 2027 and after . . . . . . . . . . . . . . . . . . . . . . . . . . . . . . . . . . . . . . 0 0 0 0 0
Weighted AverageLife (Years) . . . . . . . . . . . . . . . . . . . . . . . . . . . . . . . . . . . . . . . . . . . 8.1 4.8 2.3 1.6 1.2
S-26
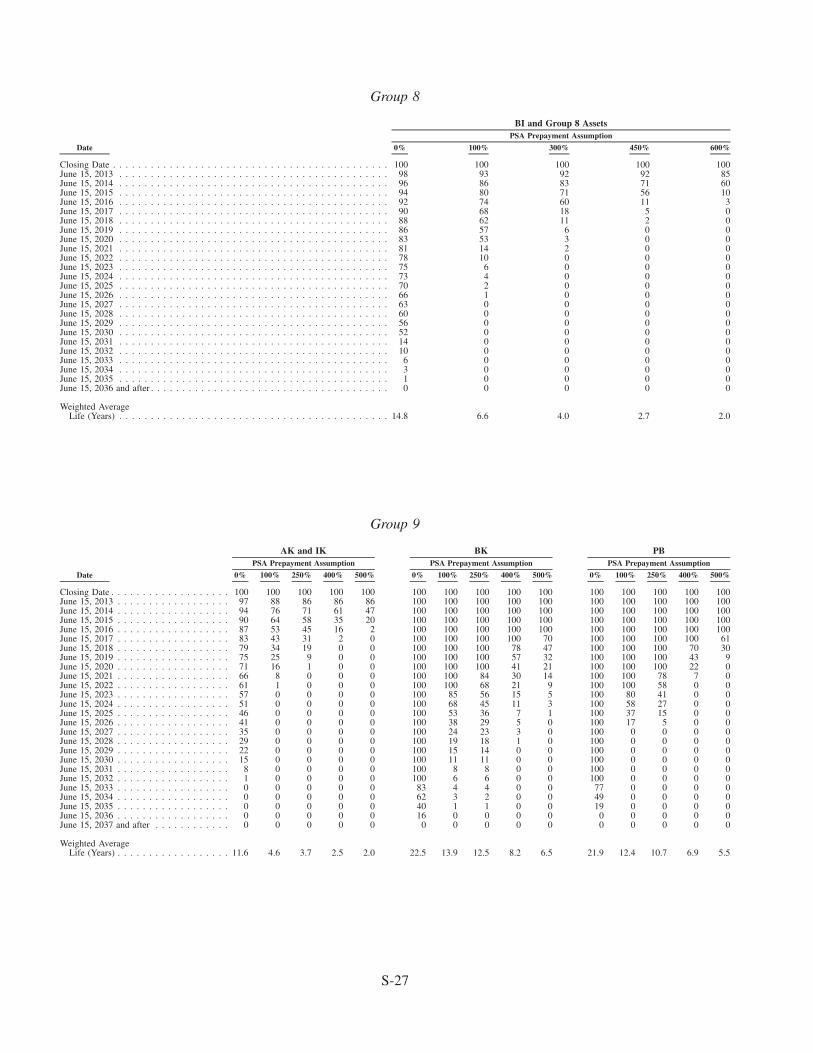
Group 8
Date 0% 100% 300% 450% 600%
PSA Prepayment Assumption
BI and Group 8 Assets
Closing Date . . . . . . . . . . . . . . . . . . . . . . . . . . . . . . . . . . . . . . . . . . . . 100 100 100 100 100June 15, 2013 . . . . . . . . . . . . . . . . . . . . . . . . . . . . . . . . . . . . . . . . . . . 98 93 92 92 85June 15, 2014 . . . . . . . . . . . . . . . . . . . . . . . . . . . . . . . . . . . . . . . . . . . 96 86 83 71 60June 15, 2015 . . . . . . . . . . . . . . . . . . . . . . . . . . . . . . . . . . . . . . . . . . . 94 80 71 56 10June 15, 2016 . . . . . . . . . . . . . . . . . . . . . . . . . . . . . . . . . . . . . . . . . . . 92 74 60 11 3June 15, 2017 . . . . . . . . . . . . . . . . . . . . . . . . . . . . . . . . . . . . . . . . . . . 90 68 18 5 0June 15, 2018 . . . . . . . . . . . . . . . . . . . . . . . . . . . . . . . . . . . . . . . . . . . 88 62 11 2 0June 15, 2019 . . . . . . . . . . . . . . . . . . . . . . . . . . . . . . . . . . . . . . . . . . . 86 57 6 0 0June 15, 2020 . . . . . . . . . . . . . . . . . . . . . . . . . . . . . . . . . . . . . . . . . . . 83 53 3 0 0June 15, 2021 . . . . . . . . . . . . . . . . . . . . . . . . . . . . . . . . . . . . . . . . . . . 81 14 2 0 0June 15, 2022 . . . . . . . . . . . . . . . . . . . . . . . . . . . . . . . . . . . . . . . . . . . 78 10 0 0 0June 15, 2023 . . . . . . . . . . . . . . . . . . . . . . . . . . . . . . . . . . . . . . . . . . . 75 6 0 0 0June 15, 2024 . . . . . . . . . . . . . . . . . . . . . . . . . . . . . . . . . . . . . . . . . . . 73 4 0 0 0June 15, 2025 . . . . . . . . . . . . . . . . . . . . . . . . . . . . . . . . . . . . . . . . . . . 70 2 0 0 0June 15, 2026 . . . . . . . . . . . . . . . . . . . . . . . . . . . . . . . . . . . . . . . . . . . 66 1 0 0 0June 15, 2027 . . . . . . . . . . . . . . . . . . . . . . . . . . . . . . . . . . . . . . . . . . . 63 0 0 0 0June 15, 2028 . . . . . . . . . . . . . . . . . . . . . . . . . . . . . . . . . . . . . . . . . . . 60 0 0 0 0June 15, 2029 . . . . . . . . . . . . . . . . . . . . . . . . . . . . . . . . . . . . . . . . . . . 56 0 0 0 0June 15, 2030 . . . . . . . . . . . . . . . . . . . . . . . . . . . . . . . . . . . . . . . . . . . 52 0 0 0 0June 15, 2031 . . . . . . . . . . . . . . . . . . . . . . . . . . . . . . . . . . . . . . . . . . . 14 0 0 0 0June 15, 2032 . . . . . . . . . . . . . . . . . . . . . . . . . . . . . . . . . . . . . . . . . . . 10 0 0 0 0June 15, 2033 . . . . . . . . . . . . . . . . . . . . . . . . . . . . . . . . . . . . . . . . . . . 6 0 0 0 0June 15, 2034 . . . . . . . . . . . . . . . . . . . . . . . . . . . . . . . . . . . . . . . . . . . 3 0 0 0 0June 15, 2035 . . . . . . . . . . . . . . . . . . . . . . . . . . . . . . . . . . . . . . . . . . . 1 0 0 0 0June 15, 2036 and after . . . . . . . . . . . . . . . . . . . . . . . . . . . . . . . . . . . . . . 0 0 0 0 0
Weighted AverageLife (Years) . . . . . . . . . . . . . . . . . . . . . . . . . . . . . . . . . . . . . . . . . . . 14.8 6.6 4.0 2.7 2.0
Group 9
Date 0% 100% 250% 400% 500% 0% 100% 250% 400% 500% 0% 100% 250% 400% 500%
PSA Prepayment AssumptionPSA Prepayment AssumptionPSA Prepayment Assumption
PBBKAK and IK
Closing Date . . . . . . . . . . . . . . . . . . . 100 100 100 100 100 100 100 100 100 100 100 100 100 100 100June 15, 2013 . . . . . . . . . . . . . . . . . . 97 88 86 86 86 100 100 100 100 100 100 100 100 100 100June 15, 2014 . . . . . . . . . . . . . . . . . . 94 76 71 61 47 100 100 100 100 100 100 100 100 100 100June 15, 2015 . . . . . . . . . . . . . . . . . . 90 64 58 35 20 100 100 100 100 100 100 100 100 100 100June 15, 2016 . . . . . . . . . . . . . . . . . . 87 53 45 16 2 100 100 100 100 100 100 100 100 100 100June 15, 2017 . . . . . . . . . . . . . . . . . . 83 43 31 2 0 100 100 100 100 70 100 100 100 100 61June 15, 2018 . . . . . . . . . . . . . . . . . . 79 34 19 0 0 100 100 100 78 47 100 100 100 70 30June 15, 2019 . . . . . . . . . . . . . . . . . . 75 25 9 0 0 100 100 100 57 32 100 100 100 43 9June 15, 2020 . . . . . . . . . . . . . . . . . . 71 16 1 0 0 100 100 100 41 21 100 100 100 22 0June 15, 2021 . . . . . . . . . . . . . . . . . . 66 8 0 0 0 100 100 84 30 14 100 100 78 7 0June 15, 2022 . . . . . . . . . . . . . . . . . . 61 1 0 0 0 100 100 68 21 9 100 100 58 0 0June 15, 2023 . . . . . . . . . . . . . . . . . . 57 0 0 0 0 100 85 56 15 5 100 80 41 0 0June 15, 2024 . . . . . . . . . . . . . . . . . . 51 0 0 0 0 100 68 45 11 3 100 58 27 0 0June 15, 2025 . . . . . . . . . . . . . . . . . . 46 0 0 0 0 100 53 36 7 1 100 37 15 0 0June 15, 2026 . . . . . . . . . . . . . . . . . . 41 0 0 0 0 100 38 29 5 0 100 17 5 0 0June 15, 2027 . . . . . . . . . . . . . . . . . . 35 0 0 0 0 100 24 23 3 0 100 0 0 0 0June 15, 2028 . . . . . . . . . . . . . . . . . . 29 0 0 0 0 100 19 18 1 0 100 0 0 0 0June 15, 2029 . . . . . . . . . . . . . . . . . . 22 0 0 0 0 100 15 14 0 0 100 0 0 0 0June 15, 2030 . . . . . . . . . . . . . . . . . . 15 0 0 0 0 100 11 11 0 0 100 0 0 0 0June 15, 2031 . . . . . . . . . . . . . . . . . . 8 0 0 0 0 100 8 8 0 0 100 0 0 0 0June 15, 2032 . . . . . . . . . . . . . . . . . . 1 0 0 0 0 100 6 6 0 0 100 0 0 0 0June 15, 2033 . . . . . . . . . . . . . . . . . . 0 0 0 0 0 83 4 4 0 0 77 0 0 0 0June 15, 2034 . . . . . . . . . . . . . . . . . . 0 0 0 0 0 62 3 2 0 0 49 0 0 0 0June 15, 2035 . . . . . . . . . . . . . . . . . . 0 0 0 0 0 40 1 1 0 0 19 0 0 0 0June 15, 2036 . . . . . . . . . . . . . . . . . . 0 0 0 0 0 16 0 0 0 0 0 0 0 0 0June 15, 2037 and after . . . . . . . . . . . . 0 0 0 0 0 0 0 0 0 0 0 0 0 0 0
Weighted AverageLife (Years) . . . . . . . . . . . . . . . . . . 11.6 4.6 3.7 2.5 2.0 22.5 13.9 12.5 8.2 6.5 21.9 12.4 10.7 6.9 5.5
S-27
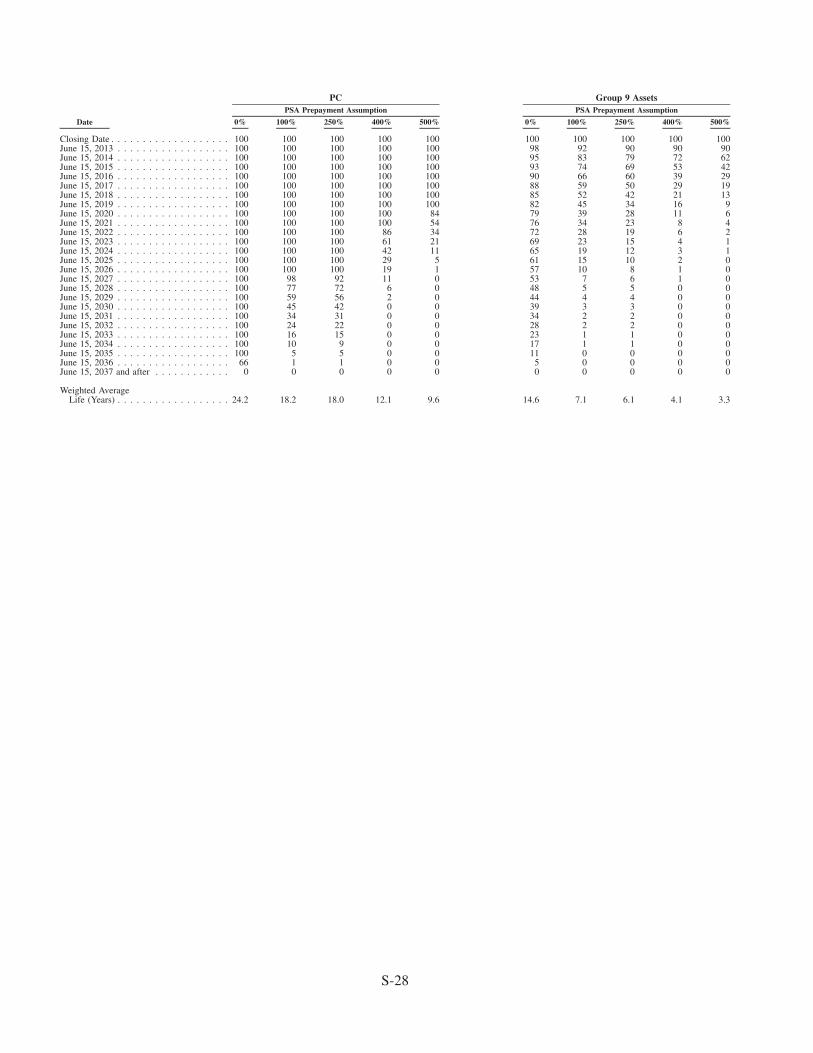
Date 0% 100% 250% 400% 500% 0% 100% 250% 400% 500%
PSA Prepayment AssumptionPSA Prepayment Assumption
Group 9 AssetsPC
Closing Date . . . . . . . . . . . . . . . . . . . 100 100 100 100 100 100 100 100 100 100June 15, 2013 . . . . . . . . . . . . . . . . . . 100 100 100 100 100 98 92 90 90 90June 15, 2014 . . . . . . . . . . . . . . . . . . 100 100 100 100 100 95 83 79 72 62June 15, 2015 . . . . . . . . . . . . . . . . . . 100 100 100 100 100 93 74 69 53 42June 15, 2016 . . . . . . . . . . . . . . . . . . 100 100 100 100 100 90 66 60 39 29June 15, 2017 . . . . . . . . . . . . . . . . . . 100 100 100 100 100 88 59 50 29 19June 15, 2018 . . . . . . . . . . . . . . . . . . 100 100 100 100 100 85 52 42 21 13June 15, 2019 . . . . . . . . . . . . . . . . . . 100 100 100 100 100 82 45 34 16 9June 15, 2020 . . . . . . . . . . . . . . . . . . 100 100 100 100 84 79 39 28 11 6June 15, 2021 . . . . . . . . . . . . . . . . . . 100 100 100 100 54 76 34 23 8 4June 15, 2022 . . . . . . . . . . . . . . . . . . 100 100 100 86 34 72 28 19 6 2June 15, 2023 . . . . . . . . . . . . . . . . . . 100 100 100 61 21 69 23 15 4 1June 15, 2024 . . . . . . . . . . . . . . . . . . 100 100 100 42 11 65 19 12 3 1June 15, 2025 . . . . . . . . . . . . . . . . . . 100 100 100 29 5 61 15 10 2 0June 15, 2026 . . . . . . . . . . . . . . . . . . 100 100 100 19 1 57 10 8 1 0June 15, 2027 . . . . . . . . . . . . . . . . . . 100 98 92 11 0 53 7 6 1 0June 15, 2028 . . . . . . . . . . . . . . . . . . 100 77 72 6 0 48 5 5 0 0June 15, 2029 . . . . . . . . . . . . . . . . . . 100 59 56 2 0 44 4 4 0 0June 15, 2030 . . . . . . . . . . . . . . . . . . 100 45 42 0 0 39 3 3 0 0June 15, 2031 . . . . . . . . . . . . . . . . . . 100 34 31 0 0 34 2 2 0 0June 15, 2032 . . . . . . . . . . . . . . . . . . 100 24 22 0 0 28 2 2 0 0June 15, 2033 . . . . . . . . . . . . . . . . . . 100 16 15 0 0 23 1 1 0 0June 15, 2034 . . . . . . . . . . . . . . . . . . 100 10 9 0 0 17 1 1 0 0June 15, 2035 . . . . . . . . . . . . . . . . . . 100 5 5 0 0 11 0 0 0 0June 15, 2036 . . . . . . . . . . . . . . . . . . 66 1 1 0 0 5 0 0 0 0June 15, 2037 and after . . . . . . . . . . . . 0 0 0 0 0 0 0 0 0 0
Weighted AverageLife (Years) . . . . . . . . . . . . . . . . . . 24.2 18.2 18.0 12.1 9.6 14.6 7.1 6.1 4.1 3.3
S-28
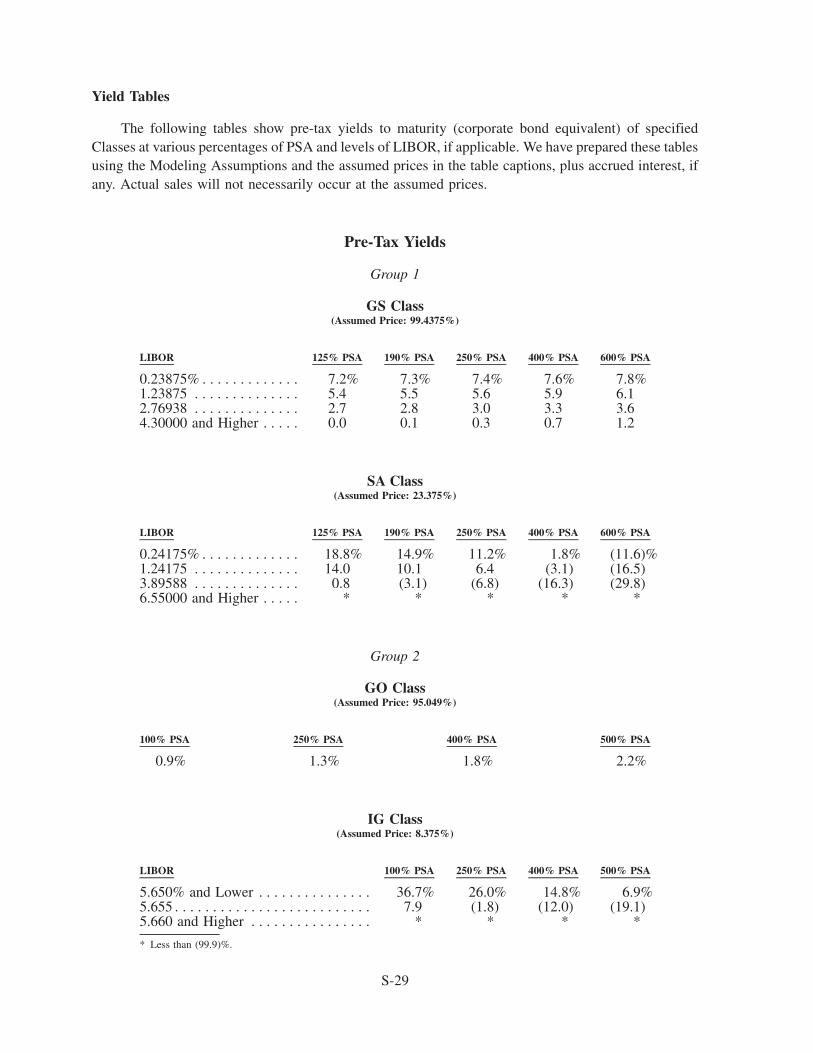
Yield Tables
The following tables show pre-tax yields to maturity (corporate bond equivalent) of specifiedClasses at various percentages of PSA and levels of LIBOR, if applicable. We have prepared these tablesusing the Modeling Assumptions and the assumed prices in the table captions, plus accrued interest, ifany. Actual sales will not necessarily occur at the assumed prices.
Pre-Tax Yields
Group 1
GS Class(Assumed Price: 99.4375%)
LIBOR 125% PSA 190% PSA 250% PSA 400% PSA 600% PSA
0.23875% . . . . . . . . . . . . . 7.2% 7.3% 7.4% 7.6% 7.8%1.23875 . . . . . . . . . . . . . . 5.4 5.5 5.6 5.9 6.12.76938 . . . . . . . . . . . . . . 2.7 2.8 3.0 3.3 3.64.30000 and Higher . . . . . 0.0 0.1 0.3 0.7 1.2
SA Class(Assumed Price: 23.375%)
LIBOR 125% PSA 190% PSA 250% PSA 400% PSA 600% PSA
0.24175% . . . . . . . . . . . . . 18.8% 14.9% 11.2% 1.8% (11.6)%1.24175 . . . . . . . . . . . . . . 14.0 10.1 6.4 (3.1) (16.5)3.89588 . . . . . . . . . . . . . . 0.8 (3.1) (6.8) (16.3) (29.8)6.55000 and Higher . . . . . * * * * *
Group 2
GO Class(Assumed Price: 95.049%)
100% PSA 250% PSA 400% PSA 500% PSA
0.9% 1.3% 1.8% 2.2%
IG Class(Assumed Price: 8.375%)
LIBOR 100% PSA 250% PSA 400% PSA 500% PSA
5.650% and Lower . . . . . . . . . . . . . . . 36.7% 26.0% 14.8% 6.9%5.655 . . . . . . . . . . . . . . . . . . . . . . . . . . 7.9 (1.8) (12.0) (19.1)5.660 and Higher . . . . . . . . . . . . . . . . * * * *
* Less than (99.9)%.
S-29
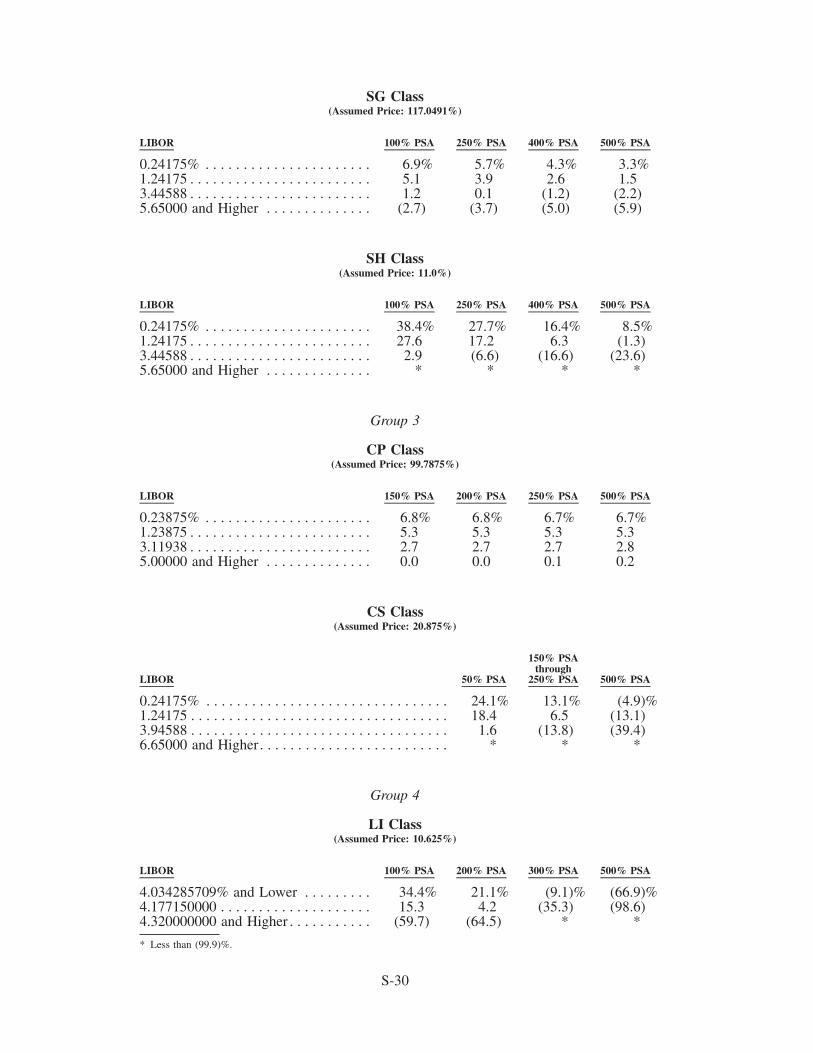
SG Class(Assumed Price: 117.0491%)
LIBOR 100% PSA 250% PSA 400% PSA 500% PSA
0.24175% . . . . . . . . . . . . . . . . . . . . . . 6.9% 5.7% 4.3% 3.3%1.24175 . . . . . . . . . . . . . . . . . . . . . . . . 5.1 3.9 2.6 1.53.44588 . . . . . . . . . . . . . . . . . . . . . . . . 1.2 0.1 (1.2) (2.2)5.65000 and Higher . . . . . . . . . . . . . . (2.7) (3.7) (5.0) (5.9)
SH Class(Assumed Price: 11.0%)
LIBOR 100% PSA 250% PSA 400% PSA 500% PSA
0.24175% . . . . . . . . . . . . . . . . . . . . . . 38.4% 27.7% 16.4% 8.5%1.24175 . . . . . . . . . . . . . . . . . . . . . . . . 27.6 17.2 6.3 (1.3)3.44588 . . . . . . . . . . . . . . . . . . . . . . . . 2.9 (6.6) (16.6) (23.6)5.65000 and Higher . . . . . . . . . . . . . . * * * *
Group 3
CP Class(Assumed Price: 99.7875%)
LIBOR 150% PSA 200% PSA 250% PSA 500% PSA
0.23875% . . . . . . . . . . . . . . . . . . . . . . 6.8% 6.8% 6.7% 6.7%1.23875 . . . . . . . . . . . . . . . . . . . . . . . . 5.3 5.3 5.3 5.33.11938 . . . . . . . . . . . . . . . . . . . . . . . . 2.7 2.7 2.7 2.85.00000 and Higher . . . . . . . . . . . . . . 0.0 0.0 0.1 0.2
CS Class(Assumed Price: 20.875%)
LIBOR 50% PSA
150% PSAthrough
250% PSA 500% PSA
0.24175% . . . . . . . . . . . . . . . . . . . . . . . . . . . . . . . . 24.1% 13.1% (4.9)%1.24175 . . . . . . . . . . . . . . . . . . . . . . . . . . . . . . . . . . 18.4 6.5 (13.1)3.94588 . . . . . . . . . . . . . . . . . . . . . . . . . . . . . . . . . . 1.6 (13.8) (39.4)6.65000 and Higher. . . . . . . . . . . . . . . . . . . . . . . . . * * *
Group 4
LI Class(Assumed Price: 10.625%)
LIBOR 100% PSA 200% PSA 300% PSA 500% PSA
4.034285709% and Lower . . . . . . . . . 34.4% 21.1% (9.1)% (66.9)%4.177150000 . . . . . . . . . . . . . . . . . . . . 15.3 4.2 (35.3) (98.6)4.320000000 and Higher . . . . . . . . . . . (59.7) (64.5) * *
* Less than (99.9)%.
S-30
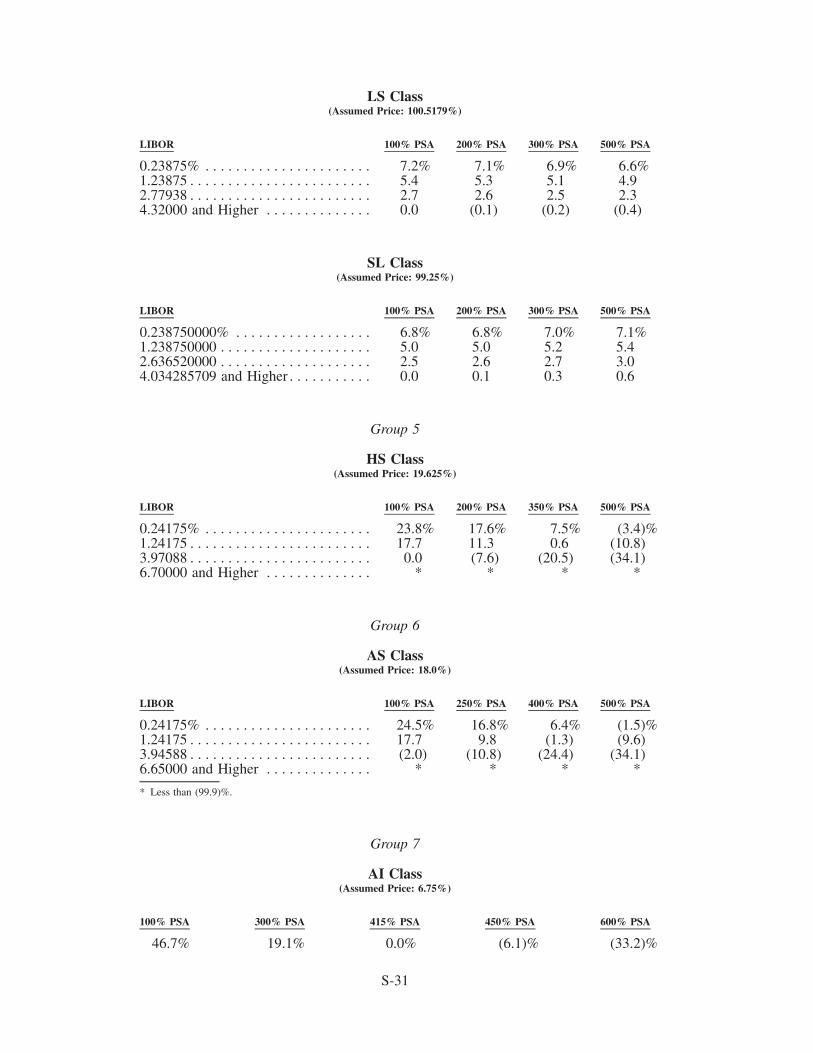
LS Class(Assumed Price: 100.5179%)
LIBOR 100% PSA 200% PSA 300% PSA 500% PSA
0.23875% . . . . . . . . . . . . . . . . . . . . . . 7.2% 7.1% 6.9% 6.6%1.23875 . . . . . . . . . . . . . . . . . . . . . . . . 5.4 5.3 5.1 4.92.77938 . . . . . . . . . . . . . . . . . . . . . . . . 2.7 2.6 2.5 2.34.32000 and Higher . . . . . . . . . . . . . . 0.0 (0.1) (0.2) (0.4)
SL Class(Assumed Price: 99.25%)
LIBOR 100% PSA 200% PSA 300% PSA 500% PSA
0.238750000% . . . . . . . . . . . . . . . . . . 6.8% 6.8% 7.0% 7.1%1.238750000 . . . . . . . . . . . . . . . . . . . . 5.0 5.0 5.2 5.42.636520000 . . . . . . . . . . . . . . . . . . . . 2.5 2.6 2.7 3.04.034285709 and Higher . . . . . . . . . . . 0.0 0.1 0.3 0.6
Group 5
HS Class(Assumed Price: 19.625%)
LIBOR 100% PSA 200% PSA 350% PSA 500% PSA
0.24175% . . . . . . . . . . . . . . . . . . . . . . 23.8% 17.6% 7.5% (3.4)%1.24175 . . . . . . . . . . . . . . . . . . . . . . . . 17.7 11.3 0.6 (10.8)3.97088 . . . . . . . . . . . . . . . . . . . . . . . . 0.0 (7.6) (20.5) (34.1)6.70000 and Higher . . . . . . . . . . . . . . * * * *
Group 6
AS Class(Assumed Price: 18.0%)
LIBOR 100% PSA 250% PSA 400% PSA 500% PSA
0.24175% . . . . . . . . . . . . . . . . . . . . . . 24.5% 16.8% 6.4% (1.5)%1.24175 . . . . . . . . . . . . . . . . . . . . . . . . 17.7 9.8 (1.3) (9.6)3.94588 . . . . . . . . . . . . . . . . . . . . . . . . (2.0) (10.8) (24.4) (34.1)6.65000 and Higher . . . . . . . . . . . . . . * * * *
* Less than (99.9)%.
Group 7
AI Class(Assumed Price: 6.75%)
100% PSA 300% PSA 415% PSA 450% PSA 600% PSA
46.7% 19.1% 0.0% (6.1)% (33.2)%
S-31
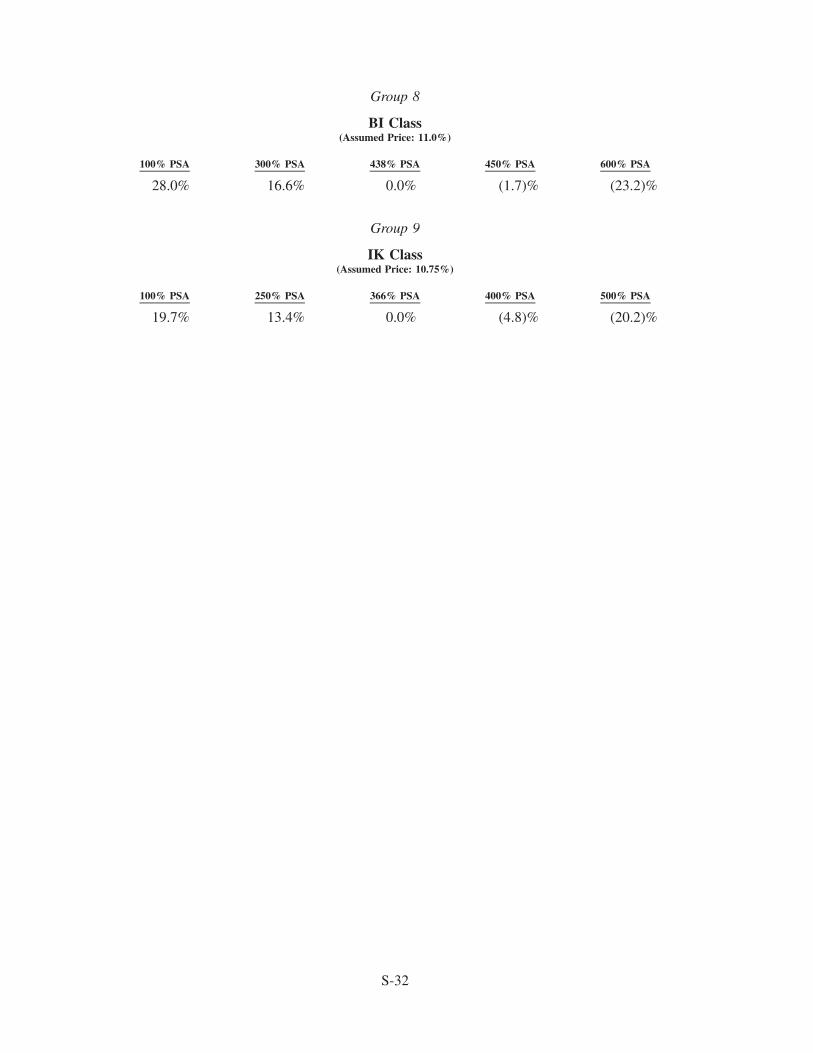
Group 8
BI Class(Assumed Price: 11.0%)
100% PSA 300% PSA 438% PSA 450% PSA 600% PSA
28.0% 16.6% 0.0% (1.7)% (23.2)%
Group 9
IK Class(Assumed Price: 10.75%)
100% PSA 250% PSA 366% PSA 400% PSA 500% PSA
19.7% 13.4% 0.0% (4.8)% (20.2)%
S-32
FINAL PAYMENT DATES
The Final Payment Date for each Class is the latest date by which it will be paid in full and willretire. We calculate Final Payment Dates using highly conservative assumptions. The actual retirement ofeach Class may occur earlier than its Final Payment Date.
CERTAIN FEDERAL INCOME TAX CONSEQUENCES
General
Any discussion of tax matters herein and in the Offering Circular was not intended or written to beused, and cannot be used, by any person for the purpose of avoiding tax penalties that may be imposed onsuch person. Such discussion was written to support the promotion and marketing of the Certificates.Investors should consult their own independent tax advisors regarding the Certificates and each investor’sparticular circumstances.
Subject to the assumptions described under Certain Federal Income Tax Consequences — REMICElection in the Offering Circular, the Upper-Tier REMIC Pool and the Lower-Tier REMIC Pool will eachqualify as a REMIC for federal income tax purposes.
Regular Classes
The Regular Classes are “regular interests” in the Upper-Tier REMIC Pool. See General Informa-tion — Structure of Transaction. They are treated as debt instruments for federal income tax purposes andmay be issued with original issue discount (“OID”) or at a premium. Based in part on (a) the level ofLIBOR on the date of this Supplement and (b) information provided by the Underwriter regarding theinitial prices at which it would have expected to sell or will sell substantial portions of the RegularClasses, we expect to report income to the Internal Revenue Service and to Holders of the RegularClasses assuming they are issued as follows:
• OID: AI, AS, BI, CS, GO, HS, IG, IK, LI, SA and SH.
• De Minimis OID: CE, FC, GB, GC, GE, GF, GK, GS, GY and SL.
• Premium: AK, AP, BP, CB, CC, CP, GD, GH, HA, HB, LA, LB, LC, LF, PB, PC and TT.
OID generally results in recognition of taxable income in advance of the receipt of cash attributableto that income. The Pricing Speeds used for OID and premium calculations are:
• Group 1 — 190% PSA
• Groups 2, 6 and 9 — 250% PSA
• Groups 3, 4 and 5 — 200% PSA
• Groups 7 and 8 — 300% PSA
See Certain Federal Income Tax Consequences — Taxation of Regular Classes — Original Issue Dis-count and — Premium in the Offering Circular. Mortgage prepayment rates will differ, perhaps signif-icantly, from the Pricing Speeds shown above.
S-33
Residual Classes
Each Residual Class is the “residual interest” in its related REMIC Pool. See General Informa-tion — Structure of Transaction. Special tax considerations apply to the Residual Classes. The taxation ofthe Residual Classes can produce a significantly less favorable after-tax return than if (a) the ResidualClasses were taxable as debt instruments or (b) no portion of the taxable income on the Residual Classeswere treated as “excess inclusions.” In certain periods, taxable income and the resulting tax liability on aResidual Class may exceed any payments on that Class. See Certain Federal Income Tax Consequen-ces — Taxation of Residual Classes in the Offering Circular.
A substantial tax may be imposed on certain transferors of a Residual Class and certain beneficialowners of a Residual Class that are “pass-through entities.” See Certain Federal Income Tax Con-sequences — Transfers of Interests in a Residual Class — Disqualified Organizations in the OfferingCircular. You should not purchase a Residual Class before consulting your tax advisor.
We intend to report accruals of OID and market discount and to amortize premium with respect tothe Multiclass Assets using the applicable Pricing Speeds shown above, regardless of the Pricing Speedsused in their Series.
Certain Transfers of Residual Classes
The REMIC Regulations disregard:
1. A transfer of a “noneconomic residual interest” unless no significant purpose of the transfer is toimpede the assessment or collection of tax.
2. Except in certain cases, a transfer of a residual interest to a foreign investor or a transfer of aresidual interest from a foreign investor to a U.S. investor. Accordingly, the Trust Agreementprohibits the transfer of an interest in a Residual Class to or from a foreign investor without ourwritten consent.
See Certain Federal Income Tax Consequences — Transfers of Interests in a Residual Class — Addi-tional Transfer Restrictions in the Offering Circular. In the case of a transfer that is disregarded, thetransferor would continue to be treated as the owner of the residual interest and thus would continue to besubject to tax on its allocable portion of the net income of the REMIC.
MACR Classes
The arrangement under which the MACR Classes are created (the “MACR Pool”) will be classifiedas a grantor trust under subpart E, part I of subchapter J of the Code. The interests in the Regular Classesthat have been exchanged for the MACR Classes, including any exchanges effective on the Closing Date,will be the assets of the MACR Pool and the MACR Classes will represent beneficial ownership of theseassets.
For a discussion of certain federal income tax consequences applicable to the MACR Classes, seeCertain Federal Income Tax Consequences — Taxation of MACR Classes, — Exchanges of MACRClasses and Regular Classes and — Taxation of Certain Foreign Investors in the Offering Circular.
ERISA CONSIDERATIONS
Fiduciaries of employee benefit plans should review ERISA Considerations in the Offering Circular.
S-34
ACCOUNTING CONSIDERATIONS
You should consult your accountant for advice on the appropriate accounting treatment for yourCertificates. See Accounting Considerations in the Offering Circular.
LEGAL INVESTMENT CONSIDERATIONS
You should consult your legal advisor to determine whether the Certificates are a legal investmentfor you and whether you can use the Certificates as collateral for borrowings. See Legal InvestmentConsiderations in the Offering Circular.
PLAN OF DISTRIBUTION
Under an agreement with the Underwriter, we have agreed to sell all of the REMIC Certificates tothe Underwriter in exchange for the Assets.
The Underwriter is offering the Certificates to the public in negotiated transactions at varying pricesto be determined at the time of sale, plus accrued interest on each interest-bearing Class from the first dayof its initial Accrual Period. The Underwriter is offering the Certificates subject to their issuance by usand subject to the Underwriter’s right to reject any order. The Underwriter may make sales to or throughsecurities dealers. The dealers may receive compensation in the form of discounts, concessions orcommissions from the Underwriter and commissions from any purchasers for which they act as agents.
The sales commission charged to a retail investor is likely to be a higher percentage of the sales pricethan the commission charged to an institutional investor in any Class.
Our agreement with the Underwriter provides that we will indemnify it against certain liabilities.
LEGAL MATTERS
Our General Counsel or one of our Deputy General Counsels will render an opinion on the legalityof the Certificates. Bingham McCutchen LLP is representing the Underwriter on legal matters con-cerning the Certificates.
S-35
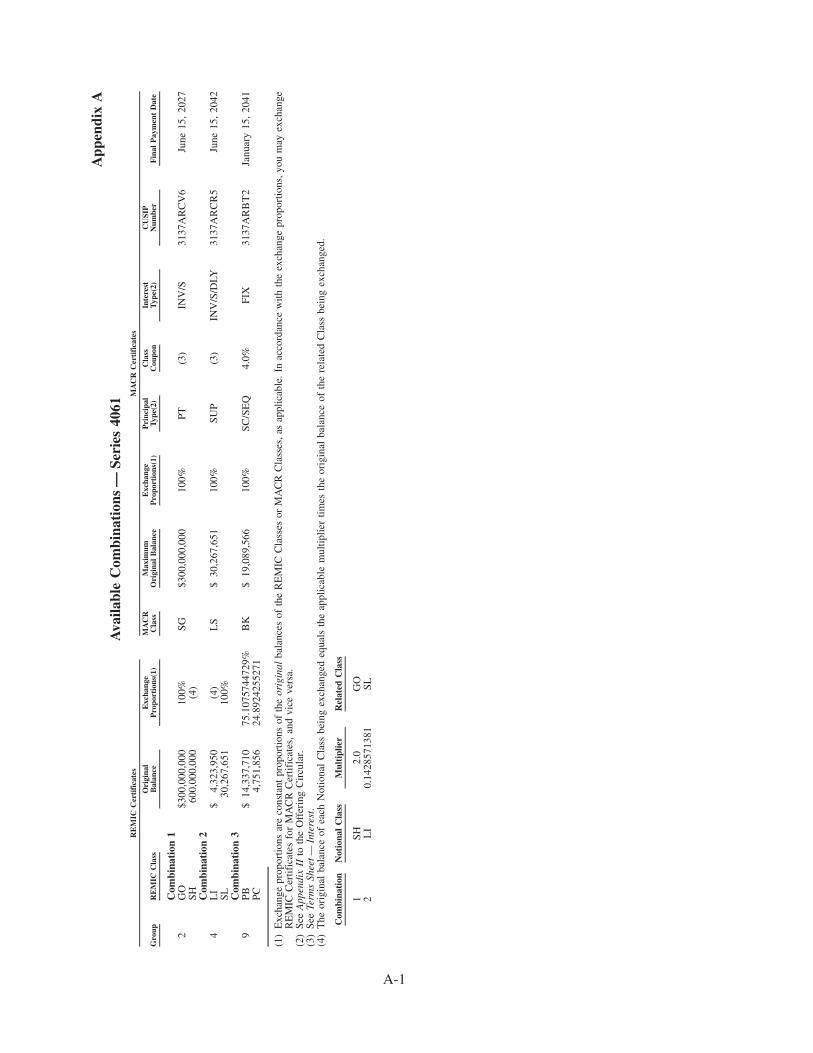
App
endi
xA
Ava
ilabl
eC
ombi
nati
ons
—Se
ries
4061
Gro
upR
EM
ICC
lass
Ori
gina
lB
alan
ceE
xcha
nge
Pro
port
ions
(1)
MA
CR
Cla
ssM
axim
umO
rigi
nal
Bal
ance
Exc
hang
eP
ropo
rtio
ns(1
)P
rinc
ipal
Typ
e(2)
Cla
ssC
oupo
nIn
tere
stT
ype(
2)C
USI
PN
umbe
rF
inal
Pay
men
tD
ate
RE
MIC
Cer
tifi
cate
sM
AC
RC
erti
fica
tes
Com
bina
tion
12
GO
$300
,000
,000
100%
SG$3
00,0
00,0
0010
0%PT
(3)
INV
/S31
37A
RC
V6
June
15,
2027
SH60
0,00
0,00
0(4
)C
ombi
nati
on2
4L
I$
4,32
3,95
0(4
)L
S$
30,2
67,6
5110
0%SU
P(3
)IN
V/S
/DLY
3137
AR
CR
5Ju
ne15
,20
42SL
30,2
67,6
5110
0%C
ombi
nati
on3
9PB
$14
,337
,710
75.1
0757
4472
9%B
K$
19,0
89,5
6610
0%SC
/SE
Q4.
0%FI
X31
37A
RB
T2
Janu
ary
15,
2041
PC4,
751,
856
24.8
9242
5527
1
(1)
Exc
hang
epr
opor
tions
are
cons
tant
prop
ortio
nsof
the
orig
inal
bala
nces
ofth
eR
EM
ICC
lass
esor
MA
CR
Cla
sses
,as
appl
icab
le.
Inac
cord
ance
with
the
exch
ange
prop
ortio
ns,y
oum
ayex
chan
geR
EM
ICC
ertif
icat
esfo
rM
AC
RC
ertif
icat
es,
and
vice
vers
a.(2
)Se
eA
ppen
dix
IIto
the
Off
erin
gC
ircu
lar.
(3)
See
Term
sSh
eet—
Inte
rest
.(4
)T
heor
igin
alba
lanc
eof
each
Not
iona
lC
lass
bein
gex
chan
ged
equa
lsth
eap
plic
able
mul
tiplie
rtim
esth
eor
igin
alba
lanc
eof
the
rela
ted
Cla
ssbe
ing
exch
ange
d.
Com
bina
tion
Not
iona
lC
lass
Mul
tipl
ier
Rel
ated
Cla
ss
1SH
2.0
GO
2L
I0.
1428
5713
81SL
A-1
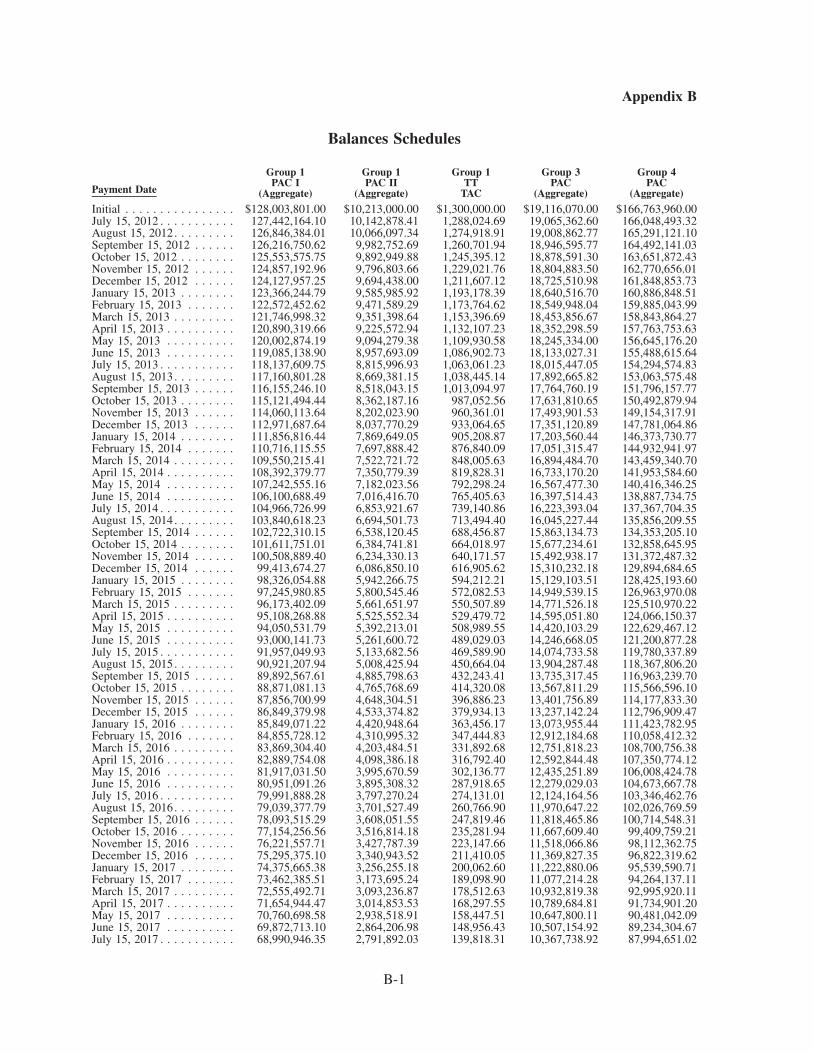
Appendix B
Balances Schedules
Payment Date
Group 1PAC I
(Aggregate)
Group 1PAC II
(Aggregate)
Group 1TT
TAC
Group 3PAC
(Aggregate)
Group 4PAC
(Aggregate)
Initial . . . . . . . . . . . . . . . . $128,003,801.00 $10,213,000.00 $1,300,000.00 $19,116,070.00 $166,763,960.00July 15, 2012 . . . . . . . . . . . 127,442,164.10 10,142,878.41 1,288,024.69 19,065,362.60 166,048,493.32August 15, 2012. . . . . . . . . 126,846,384.01 10,066,097.34 1,274,918.91 19,008,862.77 165,291,121.10September 15, 2012 . . . . . . 126,216,750.62 9,982,752.69 1,260,701.94 18,946,595.77 164,492,141.03October 15, 2012 . . . . . . . . 125,553,575.75 9,892,949.88 1,245,395.12 18,878,591.30 163,651,872.43November 15, 2012 . . . . . . 124,857,192.96 9,796,803.66 1,229,021.76 18,804,883.50 162,770,656.01December 15, 2012 . . . . . . 124,127,957.25 9,694,438.00 1,211,607.12 18,725,510.98 161,848,853.73January 15, 2013 . . . . . . . . 123,366,244.79 9,585,985.92 1,193,178.39 18,640,516.70 160,886,848.51February 15, 2013 . . . . . . . 122,572,452.62 9,471,589.29 1,173,764.62 18,549,948.04 159,885,043.99March 15, 2013 . . . . . . . . . 121,746,998.32 9,351,398.64 1,153,396.69 18,453,856.67 158,843,864.27April 15, 2013 . . . . . . . . . . 120,890,319.66 9,225,572.94 1,132,107.23 18,352,298.59 157,763,753.63May 15, 2013 . . . . . . . . . . 120,002,874.19 9,094,279.38 1,109,930.58 18,245,334.00 156,645,176.20June 15, 2013 . . . . . . . . . . 119,085,138.90 8,957,693.09 1,086,902.73 18,133,027.31 155,488,615.64July 15, 2013 . . . . . . . . . . . 118,137,609.75 8,815,996.93 1,063,061.23 18,015,447.05 154,294,574.83August 15, 2013. . . . . . . . . 117,160,801.28 8,669,381.15 1,038,445.14 17,892,665.82 153,063,575.48September 15, 2013 . . . . . . 116,155,246.10 8,518,043.15 1,013,094.97 17,764,760.19 151,796,157.77October 15, 2013 . . . . . . . . 115,121,494.44 8,362,187.16 987,052.56 17,631,810.65 150,492,879.94November 15, 2013 . . . . . . 114,060,113.64 8,202,023.90 960,361.01 17,493,901.53 149,154,317.91December 15, 2013 . . . . . . 112,971,687.64 8,037,770.29 933,064.65 17,351,120.89 147,781,064.86January 15, 2014 . . . . . . . . 111,856,816.44 7,869,649.05 905,208.87 17,203,560.44 146,373,730.77February 15, 2014 . . . . . . . 110,716,115.55 7,697,888.42 876,840.09 17,051,315.47 144,932,941.97March 15, 2014 . . . . . . . . . 109,550,215.41 7,522,721.72 848,005.63 16,894,484.70 143,459,340.70April 15, 2014 . . . . . . . . . . 108,392,379.77 7,350,779.39 819,828.31 16,733,170.20 141,953,584.60May 15, 2014 . . . . . . . . . . 107,242,555.16 7,182,023.56 792,298.24 16,567,477.30 140,416,346.25June 15, 2014 . . . . . . . . . . 106,100,688.49 7,016,416.70 765,405.63 16,397,514.43 138,887,734.75July 15, 2014 . . . . . . . . . . . 104,966,726.99 6,853,921.67 739,140.86 16,223,393.04 137,367,704.35August 15, 2014. . . . . . . . . 103,840,618.23 6,694,501.73 713,494.40 16,045,227.44 135,856,209.55September 15, 2014 . . . . . . 102,722,310.15 6,538,120.45 688,456.87 15,863,134.73 134,353,205.10October 15, 2014 . . . . . . . . 101,611,751.01 6,384,741.81 664,018.97 15,677,234.61 132,858,645.95November 15, 2014 . . . . . . 100,508,889.40 6,234,330.13 640,171.57 15,492,938.17 131,372,487.32December 15, 2014 . . . . . . 99,413,674.27 6,086,850.10 616,905.62 15,310,232.18 129,894,684.65January 15, 2015 . . . . . . . . 98,326,054.88 5,942,266.75 594,212.21 15,129,103.51 128,425,193.60February 15, 2015 . . . . . . . 97,245,980.85 5,800,545.46 572,082.53 14,949,539.15 126,963,970.08March 15, 2015 . . . . . . . . . 96,173,402.09 5,661,651.97 550,507.89 14,771,526.18 125,510,970.22April 15, 2015 . . . . . . . . . . 95,108,268.88 5,525,552.34 529,479.72 14,595,051.80 124,066,150.37May 15, 2015 . . . . . . . . . . 94,050,531.79 5,392,213.01 508,989.55 14,420,103.29 122,629,467.12June 15, 2015 . . . . . . . . . . 93,000,141.73 5,261,600.72 489,029.03 14,246,668.05 121,200,877.28July 15, 2015 . . . . . . . . . . . 91,957,049.93 5,133,682.56 469,589.90 14,074,733.58 119,780,337.89August 15, 2015. . . . . . . . . 90,921,207.94 5,008,425.94 450,664.04 13,904,287.48 118,367,806.20September 15, 2015 . . . . . . 89,892,567.61 4,885,798.63 432,243.41 13,735,317.45 116,963,239.70October 15, 2015 . . . . . . . . 88,871,081.13 4,765,768.69 414,320.08 13,567,811.29 115,566,596.10November 15, 2015 . . . . . . 87,856,700.99 4,648,304.51 396,886.23 13,401,756.89 114,177,833.30December 15, 2015 . . . . . . 86,849,379.98 4,533,374.82 379,934.13 13,237,142.24 112,796,909.47January 15, 2016 . . . . . . . . 85,849,071.22 4,420,948.64 363,456.17 13,073,955.44 111,423,782.95February 15, 2016 . . . . . . . 84,855,728.12 4,310,995.32 347,444.83 12,912,184.68 110,058,412.32March 15, 2016 . . . . . . . . . 83,869,304.40 4,203,484.51 331,892.68 12,751,818.23 108,700,756.38April 15, 2016 . . . . . . . . . . 82,889,754.08 4,098,386.18 316,792.40 12,592,844.48 107,350,774.12May 15, 2016 . . . . . . . . . . 81,917,031.50 3,995,670.59 302,136.77 12,435,251.89 106,008,424.78June 15, 2016 . . . . . . . . . . 80,951,091.26 3,895,308.32 287,918.65 12,279,029.03 104,673,667.78July 15, 2016 . . . . . . . . . . . 79,991,888.28 3,797,270.24 274,131.01 12,124,164.56 103,346,462.76August 15, 2016. . . . . . . . . 79,039,377.79 3,701,527.49 260,766.90 11,970,647.22 102,026,769.59September 15, 2016 . . . . . . 78,093,515.29 3,608,051.55 247,819.46 11,818,465.86 100,714,548.31October 15, 2016 . . . . . . . . 77,154,256.56 3,516,814.18 235,281.94 11,667,609.40 99,409,759.21November 15, 2016 . . . . . . 76,221,557.71 3,427,787.39 223,147.66 11,518,066.86 98,112,362.75December 15, 2016 . . . . . . 75,295,375.10 3,340,943.52 211,410.05 11,369,827.35 96,822,319.62January 15, 2017 . . . . . . . . 74,375,665.38 3,256,255.18 200,062.60 11,222,880.06 95,539,590.71February 15, 2017 . . . . . . . 73,462,385.51 3,173,695.24 189,098.90 11,077,214.28 94,264,137.11March 15, 2017 . . . . . . . . . 72,555,492.71 3,093,236.87 178,512.63 10,932,819.38 92,995,920.11April 15, 2017 . . . . . . . . . . 71,654,944.47 3,014,853.53 168,297.55 10,789,684.81 91,734,901.20May 15, 2017 . . . . . . . . . . 70,760,698.58 2,938,518.91 158,447.51 10,647,800.11 90,481,042.09June 15, 2017 . . . . . . . . . . 69,872,713.10 2,864,206.98 148,956.43 10,507,154.92 89,234,304.67July 15, 2017 . . . . . . . . . . . 68,990,946.35 2,791,892.03 139,818.31 10,367,738.92 87,994,651.02
B-1
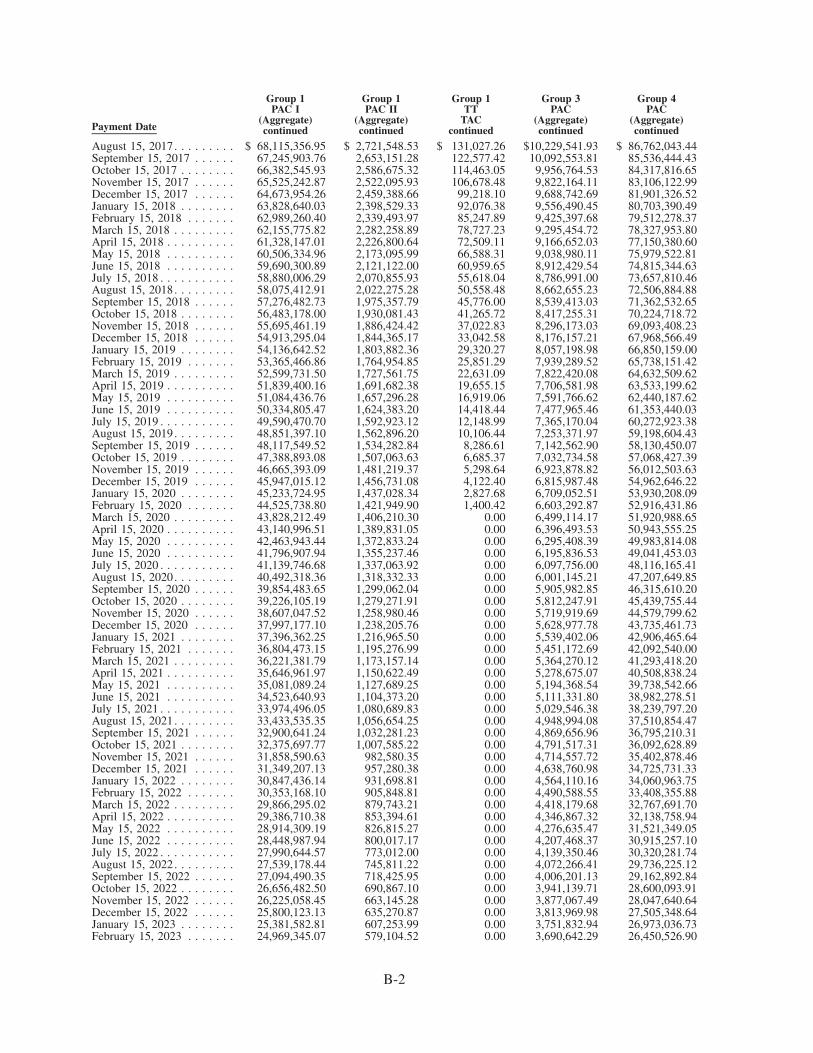
Payment Date
Group 1PAC I
(Aggregate)continued
Group 1PAC II
(Aggregate)continued
Group 1TT
TACcontinued
Group 3PAC
(Aggregate)continued
Group 4PAC
(Aggregate)continued
August 15, 2017. . . . . . . . . $ 68,115,356.95 $ 2,721,548.53 $ 131,027.26 $10,229,541.93 $ 86,762,043.44September 15, 2017 . . . . . . 67,245,903.76 2,653,151.28 122,577.42 10,092,553.81 85,536,444.43October 15, 2017 . . . . . . . . 66,382,545.93 2,586,675.32 114,463.05 9,956,764.53 84,317,816.65November 15, 2017 . . . . . . 65,525,242.87 2,522,095.93 106,678.48 9,822,164.11 83,106,122.99December 15, 2017 . . . . . . 64,673,954.26 2,459,388.66 99,218.10 9,688,742.69 81,901,326.52January 15, 2018 . . . . . . . . 63,828,640.03 2,398,529.33 92,076.38 9,556,490.45 80,703,390.49February 15, 2018 . . . . . . . 62,989,260.40 2,339,493.97 85,247.89 9,425,397.68 79,512,278.37March 15, 2018 . . . . . . . . . 62,155,775.82 2,282,258.89 78,727.23 9,295,454.72 78,327,953.80April 15, 2018 . . . . . . . . . . 61,328,147.01 2,226,800.64 72,509.11 9,166,652.03 77,150,380.60May 15, 2018 . . . . . . . . . . 60,506,334.96 2,173,095.99 66,588.31 9,038,980.11 75,979,522.81June 15, 2018 . . . . . . . . . . 59,690,300.89 2,121,122.00 60,959.65 8,912,429.54 74,815,344.63July 15, 2018 . . . . . . . . . . . 58,880,006.29 2,070,855.93 55,618.04 8,786,991.00 73,657,810.46August 15, 2018. . . . . . . . . 58,075,412.91 2,022,275.28 50,558.48 8,662,655.23 72,506,884.88September 15, 2018 . . . . . . 57,276,482.73 1,975,357.79 45,776.00 8,539,413.03 71,362,532.65October 15, 2018 . . . . . . . . 56,483,178.00 1,930,081.43 41,265.72 8,417,255.31 70,224,718.72November 15, 2018 . . . . . . 55,695,461.19 1,886,424.42 37,022.83 8,296,173.03 69,093,408.23December 15, 2018 . . . . . . 54,913,295.04 1,844,365.17 33,042.58 8,176,157.21 67,968,566.49January 15, 2019 . . . . . . . . 54,136,642.52 1,803,882.36 29,320.27 8,057,198.98 66,850,159.00February 15, 2019 . . . . . . . 53,365,466.86 1,764,954.85 25,851.29 7,939,289.52 65,738,151.42March 15, 2019 . . . . . . . . . 52,599,731.50 1,727,561.75 22,631.09 7,822,420.08 64,632,509.62April 15, 2019 . . . . . . . . . . 51,839,400.16 1,691,682.38 19,655.15 7,706,581.98 63,533,199.62May 15, 2019 . . . . . . . . . . 51,084,436.76 1,657,296.28 16,919.06 7,591,766.62 62,440,187.62June 15, 2019 . . . . . . . . . . 50,334,805.47 1,624,383.20 14,418.44 7,477,965.46 61,353,440.03July 15, 2019 . . . . . . . . . . . 49,590,470.70 1,592,923.12 12,148.99 7,365,170.04 60,272,923.38August 15, 2019. . . . . . . . . 48,851,397.10 1,562,896.20 10,106.44 7,253,371.97 59,198,604.43September 15, 2019 . . . . . . 48,117,549.52 1,534,282.84 8,286.61 7,142,562.90 58,130,450.07October 15, 2019 . . . . . . . . 47,388,893.08 1,507,063.63 6,685.37 7,032,734.58 57,068,427.39November 15, 2019 . . . . . . 46,665,393.09 1,481,219.37 5,298.64 6,923,878.82 56,012,503.63December 15, 2019 . . . . . . 45,947,015.12 1,456,731.08 4,122.40 6,815,987.48 54,962,646.22January 15, 2020 . . . . . . . . 45,233,724.95 1,437,028.34 2,827.68 6,709,052.51 53,930,208.09February 15, 2020 . . . . . . . 44,525,738.80 1,421,949.90 1,400.42 6,603,292.87 52,916,431.86March 15, 2020 . . . . . . . . . 43,828,212.49 1,406,210.30 0.00 6,499,114.17 51,920,988.65April 15, 2020 . . . . . . . . . . 43,140,996.51 1,389,831.05 0.00 6,396,493.53 50,943,555.25May 15, 2020 . . . . . . . . . . 42,463,943.44 1,372,833.24 0.00 6,295,408.39 49,983,814.08June 15, 2020 . . . . . . . . . . 41,796,907.94 1,355,237.46 0.00 6,195,836.53 49,041,453.03July 15, 2020 . . . . . . . . . . . 41,139,746.68 1,337,063.92 0.00 6,097,756.00 48,116,165.41August 15, 2020. . . . . . . . . 40,492,318.36 1,318,332.33 0.00 6,001,145.21 47,207,649.85September 15, 2020 . . . . . . 39,854,483.65 1,299,062.04 0.00 5,905,982.85 46,315,610.20October 15, 2020 . . . . . . . . 39,226,105.19 1,279,271.91 0.00 5,812,247.91 45,439,755.44November 15, 2020 . . . . . . 38,607,047.52 1,258,980.46 0.00 5,719,919.69 44,579,799.62December 15, 2020 . . . . . . 37,997,177.10 1,238,205.76 0.00 5,628,977.78 43,735,461.73January 15, 2021 . . . . . . . . 37,396,362.25 1,216,965.50 0.00 5,539,402.06 42,906,465.64February 15, 2021 . . . . . . . 36,804,473.15 1,195,276.99 0.00 5,451,172.69 42,092,540.00March 15, 2021 . . . . . . . . . 36,221,381.79 1,173,157.14 0.00 5,364,270.12 41,293,418.20April 15, 2021 . . . . . . . . . . 35,646,961.97 1,150,622.49 0.00 5,278,675.07 40,508,838.24May 15, 2021 . . . . . . . . . . 35,081,089.24 1,127,689.25 0.00 5,194,368.54 39,738,542.66June 15, 2021 . . . . . . . . . . 34,523,640.93 1,104,373.20 0.00 5,111,331.80 38,982,278.51July 15, 2021 . . . . . . . . . . . 33,974,496.05 1,080,689.83 0.00 5,029,546.38 38,239,797.20August 15, 2021. . . . . . . . . 33,433,535.35 1,056,654.25 0.00 4,948,994.08 37,510,854.47September 15, 2021 . . . . . . 32,900,641.24 1,032,281.23 0.00 4,869,656.96 36,795,210.31October 15, 2021 . . . . . . . . 32,375,697.77 1,007,585.22 0.00 4,791,517.31 36,092,628.89November 15, 2021 . . . . . . 31,858,590.63 982,580.35 0.00 4,714,557.72 35,402,878.46December 15, 2021 . . . . . . 31,349,207.13 957,280.38 0.00 4,638,760.98 34,725,731.33January 15, 2022 . . . . . . . . 30,847,436.14 931,698.81 0.00 4,564,110.16 34,060,963.75February 15, 2022 . . . . . . . 30,353,168.10 905,848.81 0.00 4,490,588.55 33,408,355.88March 15, 2022 . . . . . . . . . 29,866,295.02 879,743.21 0.00 4,418,179.68 32,767,691.70April 15, 2022 . . . . . . . . . . 29,386,710.38 853,394.61 0.00 4,346,867.32 32,138,758.94May 15, 2022 . . . . . . . . . . 28,914,309.19 826,815.27 0.00 4,276,635.47 31,521,349.05June 15, 2022 . . . . . . . . . . 28,448,987.94 800,017.17 0.00 4,207,468.37 30,915,257.10July 15, 2022 . . . . . . . . . . . 27,990,644.57 773,012.00 0.00 4,139,350.46 30,320,281.74August 15, 2022. . . . . . . . . 27,539,178.44 745,811.22 0.00 4,072,266.41 29,736,225.12September 15, 2022 . . . . . . 27,094,490.35 718,425.95 0.00 4,006,201.13 29,162,892.84October 15, 2022 . . . . . . . . 26,656,482.50 690,867.10 0.00 3,941,139.71 28,600,093.91November 15, 2022 . . . . . . 26,225,058.45 663,145.28 0.00 3,877,067.49 28,047,640.64December 15, 2022 . . . . . . 25,800,123.13 635,270.87 0.00 3,813,969.98 27,505,348.64January 15, 2023 . . . . . . . . 25,381,582.81 607,253.99 0.00 3,751,832.94 26,973,036.73February 15, 2023 . . . . . . . 24,969,345.07 579,104.52 0.00 3,690,642.29 26,450,526.90
B-2
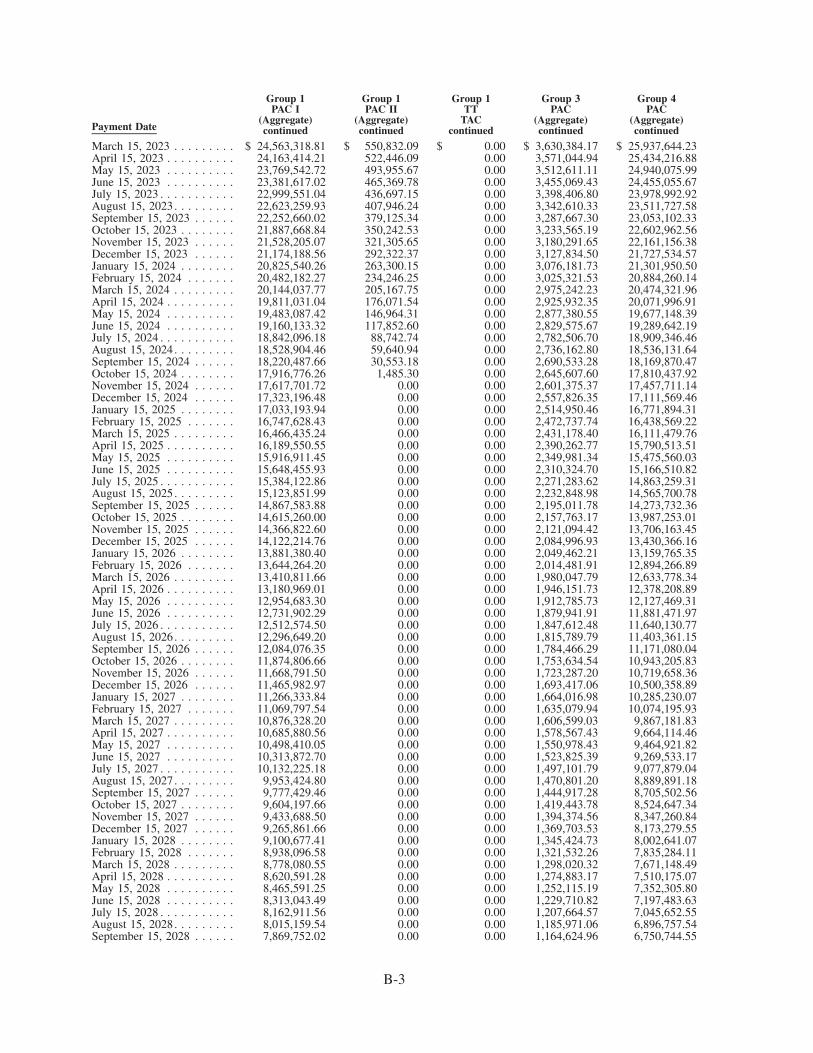
Payment Date
Group 1PAC I
(Aggregate)continued
Group 1PAC II
(Aggregate)continued
Group 1TT
TACcontinued
Group 3PAC
(Aggregate)continued
Group 4PAC
(Aggregate)continued
March 15, 2023 . . . . . . . . . $ 24,563,318.81 $ 550,832.09 $ 0.00 $ 3,630,384.17 $ 25,937,644.23April 15, 2023 . . . . . . . . . . 24,163,414.21 522,446.09 0.00 3,571,044.94 25,434,216.88May 15, 2023 . . . . . . . . . . 23,769,542.72 493,955.67 0.00 3,512,611.11 24,940,075.99June 15, 2023 . . . . . . . . . . 23,381,617.02 465,369.78 0.00 3,455,069.43 24,455,055.67July 15, 2023 . . . . . . . . . . . 22,999,551.04 436,697.15 0.00 3,398,406.80 23,978,992.92August 15, 2023. . . . . . . . . 22,623,259.93 407,946.24 0.00 3,342,610.33 23,511,727.58September 15, 2023 . . . . . . 22,252,660.02 379,125.34 0.00 3,287,667.30 23,053,102.33October 15, 2023 . . . . . . . . 21,887,668.84 350,242.53 0.00 3,233,565.19 22,602,962.56November 15, 2023 . . . . . . 21,528,205.07 321,305.65 0.00 3,180,291.65 22,161,156.38December 15, 2023 . . . . . . 21,174,188.56 292,322.37 0.00 3,127,834.50 21,727,534.57January 15, 2024 . . . . . . . . 20,825,540.26 263,300.15 0.00 3,076,181.73 21,301,950.50February 15, 2024 . . . . . . . 20,482,182.27 234,246.25 0.00 3,025,321.53 20,884,260.14March 15, 2024 . . . . . . . . . 20,144,037.77 205,167.75 0.00 2,975,242.23 20,474,321.96April 15, 2024 . . . . . . . . . . 19,811,031.04 176,071.54 0.00 2,925,932.35 20,071,996.91May 15, 2024 . . . . . . . . . . 19,483,087.42 146,964.31 0.00 2,877,380.55 19,677,148.39June 15, 2024 . . . . . . . . . . 19,160,133.32 117,852.60 0.00 2,829,575.67 19,289,642.19July 15, 2024 . . . . . . . . . . . 18,842,096.18 88,742.74 0.00 2,782,506.70 18,909,346.46August 15, 2024. . . . . . . . . 18,528,904.46 59,640.94 0.00 2,736,162.80 18,536,131.64September 15, 2024 . . . . . . 18,220,487.66 30,553.18 0.00 2,690,533.28 18,169,870.47October 15, 2024 . . . . . . . . 17,916,776.26 1,485.30 0.00 2,645,607.60 17,810,437.92November 15, 2024 . . . . . . 17,617,701.72 0.00 0.00 2,601,375.37 17,457,711.14December 15, 2024 . . . . . . 17,323,196.48 0.00 0.00 2,557,826.35 17,111,569.46January 15, 2025 . . . . . . . . 17,033,193.94 0.00 0.00 2,514,950.46 16,771,894.31February 15, 2025 . . . . . . . 16,747,628.43 0.00 0.00 2,472,737.74 16,438,569.22March 15, 2025 . . . . . . . . . 16,466,435.24 0.00 0.00 2,431,178.40 16,111,479.76April 15, 2025 . . . . . . . . . . 16,189,550.55 0.00 0.00 2,390,262.77 15,790,513.51May 15, 2025 . . . . . . . . . . 15,916,911.45 0.00 0.00 2,349,981.34 15,475,560.03June 15, 2025 . . . . . . . . . . 15,648,455.93 0.00 0.00 2,310,324.70 15,166,510.82July 15, 2025 . . . . . . . . . . . 15,384,122.86 0.00 0.00 2,271,283.62 14,863,259.31August 15, 2025. . . . . . . . . 15,123,851.99 0.00 0.00 2,232,848.98 14,565,700.78September 15, 2025 . . . . . . 14,867,583.88 0.00 0.00 2,195,011.78 14,273,732.36October 15, 2025 . . . . . . . . 14,615,260.00 0.00 0.00 2,157,763.17 13,987,253.01November 15, 2025 . . . . . . 14,366,822.60 0.00 0.00 2,121,094.42 13,706,163.45December 15, 2025 . . . . . . 14,122,214.76 0.00 0.00 2,084,996.93 13,430,366.16January 15, 2026 . . . . . . . . 13,881,380.40 0.00 0.00 2,049,462.21 13,159,765.35February 15, 2026 . . . . . . . 13,644,264.20 0.00 0.00 2,014,481.91 12,894,266.89March 15, 2026 . . . . . . . . . 13,410,811.66 0.00 0.00 1,980,047.79 12,633,778.34April 15, 2026 . . . . . . . . . . 13,180,969.01 0.00 0.00 1,946,151.73 12,378,208.89May 15, 2026 . . . . . . . . . . 12,954,683.30 0.00 0.00 1,912,785.73 12,127,469.31June 15, 2026 . . . . . . . . . . 12,731,902.29 0.00 0.00 1,879,941.91 11,881,471.97July 15, 2026 . . . . . . . . . . . 12,512,574.50 0.00 0.00 1,847,612.48 11,640,130.77August 15, 2026. . . . . . . . . 12,296,649.20 0.00 0.00 1,815,789.79 11,403,361.15September 15, 2026 . . . . . . 12,084,076.35 0.00 0.00 1,784,466.29 11,171,080.04October 15, 2026 . . . . . . . . 11,874,806.66 0.00 0.00 1,753,634.54 10,943,205.83November 15, 2026 . . . . . . 11,668,791.50 0.00 0.00 1,723,287.20 10,719,658.36December 15, 2026 . . . . . . 11,465,982.97 0.00 0.00 1,693,417.06 10,500,358.89January 15, 2027 . . . . . . . . 11,266,333.84 0.00 0.00 1,664,016.98 10,285,230.07February 15, 2027 . . . . . . . 11,069,797.54 0.00 0.00 1,635,079.94 10,074,195.93March 15, 2027 . . . . . . . . . 10,876,328.20 0.00 0.00 1,606,599.03 9,867,181.83April 15, 2027 . . . . . . . . . . 10,685,880.56 0.00 0.00 1,578,567.43 9,664,114.46May 15, 2027 . . . . . . . . . . 10,498,410.05 0.00 0.00 1,550,978.43 9,464,921.82June 15, 2027 . . . . . . . . . . 10,313,872.70 0.00 0.00 1,523,825.39 9,269,533.17July 15, 2027 . . . . . . . . . . . 10,132,225.18 0.00 0.00 1,497,101.79 9,077,879.04August 15, 2027. . . . . . . . . 9,953,424.80 0.00 0.00 1,470,801.20 8,889,891.18September 15, 2027 . . . . . . 9,777,429.46 0.00 0.00 1,444,917.28 8,705,502.56October 15, 2027 . . . . . . . . 9,604,197.66 0.00 0.00 1,419,443.78 8,524,647.34November 15, 2027 . . . . . . 9,433,688.50 0.00 0.00 1,394,374.56 8,347,260.84December 15, 2027 . . . . . . 9,265,861.66 0.00 0.00 1,369,703.53 8,173,279.55January 15, 2028 . . . . . . . . 9,100,677.41 0.00 0.00 1,345,424.73 8,002,641.07February 15, 2028 . . . . . . . 8,938,096.58 0.00 0.00 1,321,532.26 7,835,284.11March 15, 2028 . . . . . . . . . 8,778,080.55 0.00 0.00 1,298,020.32 7,671,148.49April 15, 2028 . . . . . . . . . . 8,620,591.28 0.00 0.00 1,274,883.17 7,510,175.07May 15, 2028 . . . . . . . . . . 8,465,591.25 0.00 0.00 1,252,115.19 7,352,305.80June 15, 2028 . . . . . . . . . . 8,313,043.49 0.00 0.00 1,229,710.82 7,197,483.63July 15, 2028 . . . . . . . . . . . 8,162,911.56 0.00 0.00 1,207,664.57 7,045,652.55August 15, 2028. . . . . . . . . 8,015,159.54 0.00 0.00 1,185,971.06 6,896,757.54September 15, 2028 . . . . . . 7,869,752.02 0.00 0.00 1,164,624.96 6,750,744.55
B-3
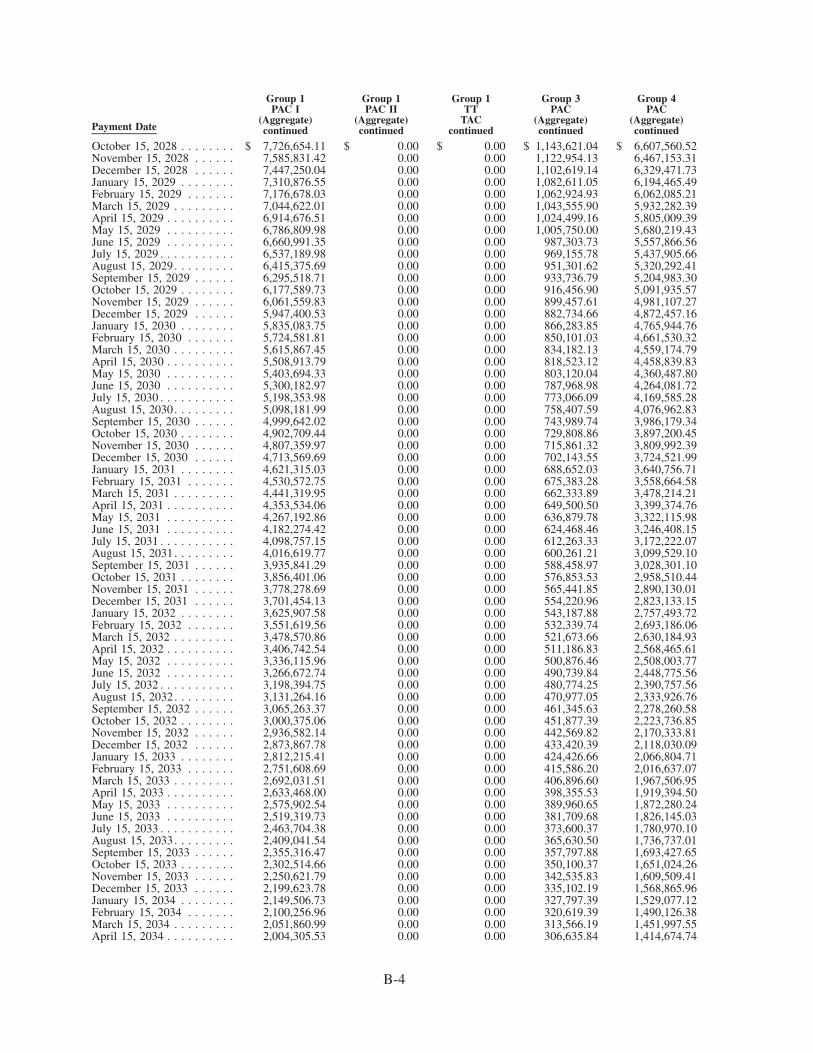
Payment Date
Group 1PAC I
(Aggregate)continued
Group 1PAC II
(Aggregate)continued
Group 1TT
TACcontinued
Group 3PAC
(Aggregate)continued
Group 4PAC
(Aggregate)continued
October 15, 2028 . . . . . . . . $ 7,726,654.11 $ 0.00 $ 0.00 $ 1,143,621.04 $ 6,607,560.52November 15, 2028 . . . . . . 7,585,831.42 0.00 0.00 1,122,954.13 6,467,153.31December 15, 2028 . . . . . . 7,447,250.04 0.00 0.00 1,102,619.14 6,329,471.73January 15, 2029 . . . . . . . . 7,310,876.55 0.00 0.00 1,082,611.05 6,194,465.49February 15, 2029 . . . . . . . 7,176,678.03 0.00 0.00 1,062,924.93 6,062,085.21March 15, 2029 . . . . . . . . . 7,044,622.01 0.00 0.00 1,043,555.90 5,932,282.39April 15, 2029 . . . . . . . . . . 6,914,676.51 0.00 0.00 1,024,499.16 5,805,009.39May 15, 2029 . . . . . . . . . . 6,786,809.98 0.00 0.00 1,005,750.00 5,680,219.43June 15, 2029 . . . . . . . . . . 6,660,991.35 0.00 0.00 987,303.73 5,557,866.56July 15, 2029 . . . . . . . . . . . 6,537,189.98 0.00 0.00 969,155.78 5,437,905.66August 15, 2029. . . . . . . . . 6,415,375.69 0.00 0.00 951,301.62 5,320,292.41September 15, 2029 . . . . . . 6,295,518.71 0.00 0.00 933,736.79 5,204,983.30October 15, 2029 . . . . . . . . 6,177,589.73 0.00 0.00 916,456.90 5,091,935.57November 15, 2029 . . . . . . 6,061,559.83 0.00 0.00 899,457.61 4,981,107.27December 15, 2029 . . . . . . 5,947,400.53 0.00 0.00 882,734.66 4,872,457.16January 15, 2030 . . . . . . . . 5,835,083.75 0.00 0.00 866,283.85 4,765,944.76February 15, 2030 . . . . . . . 5,724,581.81 0.00 0.00 850,101.03 4,661,530.32March 15, 2030 . . . . . . . . . 5,615,867.45 0.00 0.00 834,182.13 4,559,174.79April 15, 2030 . . . . . . . . . . 5,508,913.79 0.00 0.00 818,523.12 4,458,839.83May 15, 2030 . . . . . . . . . . 5,403,694.33 0.00 0.00 803,120.04 4,360,487.80June 15, 2030 . . . . . . . . . . 5,300,182.97 0.00 0.00 787,968.98 4,264,081.72July 15, 2030 . . . . . . . . . . . 5,198,353.98 0.00 0.00 773,066.09 4,169,585.28August 15, 2030. . . . . . . . . 5,098,181.99 0.00 0.00 758,407.59 4,076,962.83September 15, 2030 . . . . . . 4,999,642.02 0.00 0.00 743,989.74 3,986,179.34October 15, 2030 . . . . . . . . 4,902,709.44 0.00 0.00 729,808.86 3,897,200.45November 15, 2030 . . . . . . 4,807,359.97 0.00 0.00 715,861.32 3,809,992.39December 15, 2030 . . . . . . 4,713,569.69 0.00 0.00 702,143.55 3,724,521.99January 15, 2031 . . . . . . . . 4,621,315.03 0.00 0.00 688,652.03 3,640,756.71February 15, 2031 . . . . . . . 4,530,572.75 0.00 0.00 675,383.28 3,558,664.58March 15, 2031 . . . . . . . . . 4,441,319.95 0.00 0.00 662,333.89 3,478,214.21April 15, 2031 . . . . . . . . . . 4,353,534.06 0.00 0.00 649,500.50 3,399,374.76May 15, 2031 . . . . . . . . . . 4,267,192.86 0.00 0.00 636,879.78 3,322,115.98June 15, 2031 . . . . . . . . . . 4,182,274.42 0.00 0.00 624,468.46 3,246,408.15July 15, 2031 . . . . . . . . . . . 4,098,757.15 0.00 0.00 612,263.33 3,172,222.07August 15, 2031. . . . . . . . . 4,016,619.77 0.00 0.00 600,261.21 3,099,529.10September 15, 2031 . . . . . . 3,935,841.29 0.00 0.00 588,458.97 3,028,301.10October 15, 2031 . . . . . . . . 3,856,401.06 0.00 0.00 576,853.53 2,958,510.44November 15, 2031 . . . . . . 3,778,278.69 0.00 0.00 565,441.85 2,890,130.01December 15, 2031 . . . . . . 3,701,454.13 0.00 0.00 554,220.96 2,823,133.15January 15, 2032 . . . . . . . . 3,625,907.58 0.00 0.00 543,187.88 2,757,493.72February 15, 2032 . . . . . . . 3,551,619.56 0.00 0.00 532,339.74 2,693,186.06March 15, 2032 . . . . . . . . . 3,478,570.86 0.00 0.00 521,673.66 2,630,184.93April 15, 2032 . . . . . . . . . . 3,406,742.54 0.00 0.00 511,186.83 2,568,465.61May 15, 2032 . . . . . . . . . . 3,336,115.96 0.00 0.00 500,876.46 2,508,003.77June 15, 2032 . . . . . . . . . . 3,266,672.74 0.00 0.00 490,739.84 2,448,775.56July 15, 2032 . . . . . . . . . . . 3,198,394.75 0.00 0.00 480,774.25 2,390,757.56August 15, 2032. . . . . . . . . 3,131,264.16 0.00 0.00 470,977.05 2,333,926.76September 15, 2032 . . . . . . 3,065,263.37 0.00 0.00 461,345.63 2,278,260.58October 15, 2032 . . . . . . . . 3,000,375.06 0.00 0.00 451,877.39 2,223,736.85November 15, 2032 . . . . . . 2,936,582.14 0.00 0.00 442,569.82 2,170,333.81December 15, 2032 . . . . . . 2,873,867.78 0.00 0.00 433,420.39 2,118,030.09January 15, 2033 . . . . . . . . 2,812,215.41 0.00 0.00 424,426.66 2,066,804.71February 15, 2033 . . . . . . . 2,751,608.69 0.00 0.00 415,586.20 2,016,637.07March 15, 2033 . . . . . . . . . 2,692,031.51 0.00 0.00 406,896.60 1,967,506.95April 15, 2033 . . . . . . . . . . 2,633,468.00 0.00 0.00 398,355.53 1,919,394.50May 15, 2033 . . . . . . . . . . 2,575,902.54 0.00 0.00 389,960.65 1,872,280.24June 15, 2033 . . . . . . . . . . 2,519,319.73 0.00 0.00 381,709.68 1,826,145.03July 15, 2033 . . . . . . . . . . . 2,463,704.38 0.00 0.00 373,600.37 1,780,970.10August 15, 2033. . . . . . . . . 2,409,041.54 0.00 0.00 365,630.50 1,736,737.01September 15, 2033 . . . . . . 2,355,316.47 0.00 0.00 357,797.88 1,693,427.65October 15, 2033 . . . . . . . . 2,302,514.66 0.00 0.00 350,100.37 1,651,024.26November 15, 2033 . . . . . . 2,250,621.79 0.00 0.00 342,535.83 1,609,509.41December 15, 2033 . . . . . . 2,199,623.78 0.00 0.00 335,102.19 1,568,865.96January 15, 2034 . . . . . . . . 2,149,506.73 0.00 0.00 327,797.39 1,529,077.12February 15, 2034 . . . . . . . 2,100,256.96 0.00 0.00 320,619.39 1,490,126.38March 15, 2034 . . . . . . . . . 2,051,860.99 0.00 0.00 313,566.19 1,451,997.55April 15, 2034 . . . . . . . . . . 2,004,305.53 0.00 0.00 306,635.84 1,414,674.74
B-4
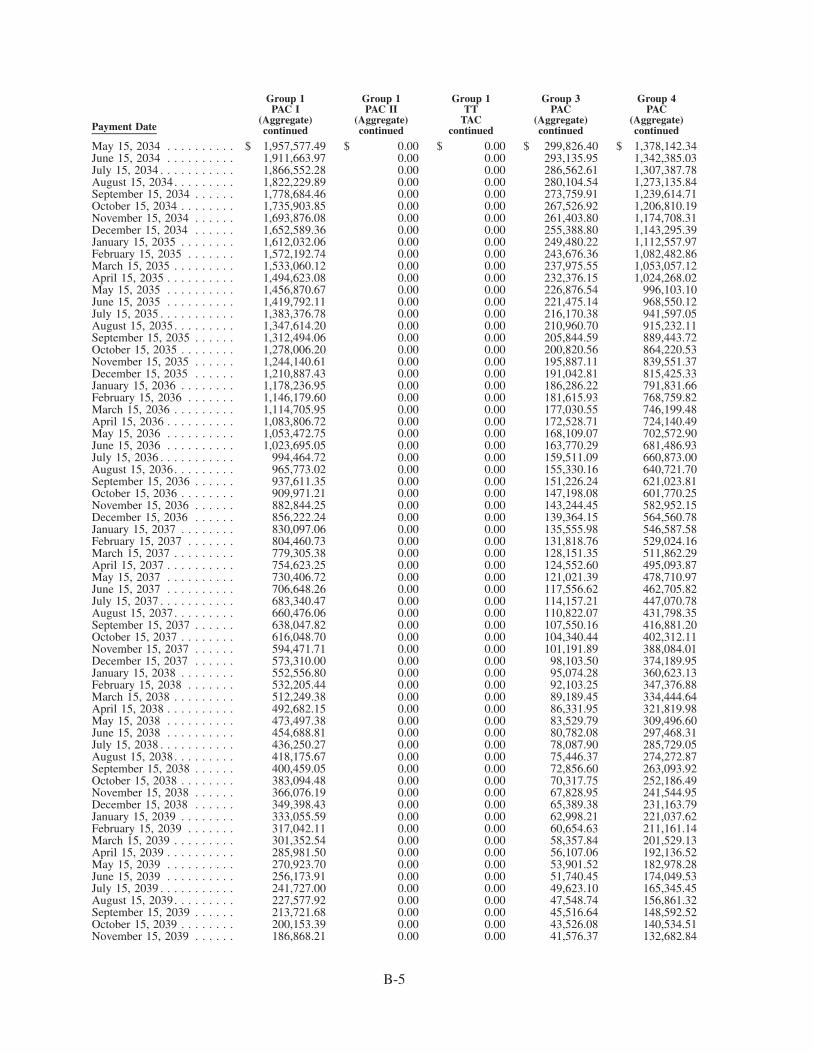
Payment Date
Group 1PAC I
(Aggregate)continued
Group 1PAC II
(Aggregate)continued
Group 1TT
TACcontinued
Group 3PAC
(Aggregate)continued
Group 4PAC
(Aggregate)continued
May 15, 2034 . . . . . . . . . . $ 1,957,577.49 $ 0.00 $ 0.00 $ 299,826.40 $ 1,378,142.34June 15, 2034 . . . . . . . . . . 1,911,663.97 0.00 0.00 293,135.95 1,342,385.03July 15, 2034 . . . . . . . . . . . 1,866,552.28 0.00 0.00 286,562.61 1,307,387.78August 15, 2034. . . . . . . . . 1,822,229.89 0.00 0.00 280,104.54 1,273,135.84September 15, 2034 . . . . . . 1,778,684.46 0.00 0.00 273,759.91 1,239,614.71October 15, 2034 . . . . . . . . 1,735,903.85 0.00 0.00 267,526.92 1,206,810.19November 15, 2034 . . . . . . 1,693,876.08 0.00 0.00 261,403.80 1,174,708.31December 15, 2034 . . . . . . 1,652,589.36 0.00 0.00 255,388.80 1,143,295.39January 15, 2035 . . . . . . . . 1,612,032.06 0.00 0.00 249,480.22 1,112,557.97February 15, 2035 . . . . . . . 1,572,192.74 0.00 0.00 243,676.36 1,082,482.86March 15, 2035 . . . . . . . . . 1,533,060.12 0.00 0.00 237,975.55 1,053,057.12April 15, 2035 . . . . . . . . . . 1,494,623.08 0.00 0.00 232,376.15 1,024,268.02May 15, 2035 . . . . . . . . . . 1,456,870.67 0.00 0.00 226,876.54 996,103.10June 15, 2035 . . . . . . . . . . 1,419,792.11 0.00 0.00 221,475.14 968,550.12July 15, 2035 . . . . . . . . . . . 1,383,376.78 0.00 0.00 216,170.38 941,597.05August 15, 2035. . . . . . . . . 1,347,614.20 0.00 0.00 210,960.70 915,232.11September 15, 2035 . . . . . . 1,312,494.06 0.00 0.00 205,844.59 889,443.72October 15, 2035 . . . . . . . . 1,278,006.20 0.00 0.00 200,820.56 864,220.53November 15, 2035 . . . . . . 1,244,140.61 0.00 0.00 195,887.11 839,551.37December 15, 2035 . . . . . . 1,210,887.43 0.00 0.00 191,042.81 815,425.33January 15, 2036 . . . . . . . . 1,178,236.95 0.00 0.00 186,286.22 791,831.66February 15, 2036 . . . . . . . 1,146,179.60 0.00 0.00 181,615.93 768,759.82March 15, 2036 . . . . . . . . . 1,114,705.95 0.00 0.00 177,030.55 746,199.48April 15, 2036 . . . . . . . . . . 1,083,806.72 0.00 0.00 172,528.71 724,140.49May 15, 2036 . . . . . . . . . . 1,053,472.75 0.00 0.00 168,109.07 702,572.90June 15, 2036 . . . . . . . . . . 1,023,695.05 0.00 0.00 163,770.29 681,486.93July 15, 2036 . . . . . . . . . . . 994,464.72 0.00 0.00 159,511.09 660,873.00August 15, 2036. . . . . . . . . 965,773.02 0.00 0.00 155,330.16 640,721.70September 15, 2036 . . . . . . 937,611.35 0.00 0.00 151,226.24 621,023.81October 15, 2036 . . . . . . . . 909,971.21 0.00 0.00 147,198.08 601,770.25November 15, 2036 . . . . . . 882,844.25 0.00 0.00 143,244.45 582,952.15December 15, 2036 . . . . . . 856,222.24 0.00 0.00 139,364.15 564,560.78January 15, 2037 . . . . . . . . 830,097.06 0.00 0.00 135,555.98 546,587.58February 15, 2037 . . . . . . . 804,460.73 0.00 0.00 131,818.76 529,024.16March 15, 2037 . . . . . . . . . 779,305.38 0.00 0.00 128,151.35 511,862.29April 15, 2037 . . . . . . . . . . 754,623.25 0.00 0.00 124,552.60 495,093.87May 15, 2037 . . . . . . . . . . 730,406.72 0.00 0.00 121,021.39 478,710.97June 15, 2037 . . . . . . . . . . 706,648.26 0.00 0.00 117,556.62 462,705.82July 15, 2037 . . . . . . . . . . . 683,340.47 0.00 0.00 114,157.21 447,070.78August 15, 2037. . . . . . . . . 660,476.06 0.00 0.00 110,822.07 431,798.35September 15, 2037 . . . . . . 638,047.82 0.00 0.00 107,550.16 416,881.20October 15, 2037 . . . . . . . . 616,048.70 0.00 0.00 104,340.44 402,312.11November 15, 2037 . . . . . . 594,471.71 0.00 0.00 101,191.89 388,084.01December 15, 2037 . . . . . . 573,310.00 0.00 0.00 98,103.50 374,189.95January 15, 2038 . . . . . . . . 552,556.80 0.00 0.00 95,074.28 360,623.13February 15, 2038 . . . . . . . 532,205.44 0.00 0.00 92,103.25 347,376.88March 15, 2038 . . . . . . . . . 512,249.38 0.00 0.00 89,189.45 334,444.64April 15, 2038 . . . . . . . . . . 492,682.15 0.00 0.00 86,331.95 321,819.98May 15, 2038 . . . . . . . . . . 473,497.38 0.00 0.00 83,529.79 309,496.60June 15, 2038 . . . . . . . . . . 454,688.81 0.00 0.00 80,782.08 297,468.31July 15, 2038 . . . . . . . . . . . 436,250.27 0.00 0.00 78,087.90 285,729.05August 15, 2038. . . . . . . . . 418,175.67 0.00 0.00 75,446.37 274,272.87September 15, 2038 . . . . . . 400,459.05 0.00 0.00 72,856.60 263,093.92October 15, 2038 . . . . . . . . 383,094.48 0.00 0.00 70,317.75 252,186.49November 15, 2038 . . . . . . 366,076.19 0.00 0.00 67,828.95 241,544.95December 15, 2038 . . . . . . 349,398.43 0.00 0.00 65,389.38 231,163.79January 15, 2039 . . . . . . . . 333,055.59 0.00 0.00 62,998.21 221,037.62February 15, 2039 . . . . . . . 317,042.11 0.00 0.00 60,654.63 211,161.14March 15, 2039 . . . . . . . . . 301,352.54 0.00 0.00 58,357.84 201,529.13April 15, 2039 . . . . . . . . . . 285,981.50 0.00 0.00 56,107.06 192,136.52May 15, 2039 . . . . . . . . . . 270,923.70 0.00 0.00 53,901.52 182,978.28June 15, 2039 . . . . . . . . . . 256,173.91 0.00 0.00 51,740.45 174,049.53July 15, 2039 . . . . . . . . . . . 241,727.00 0.00 0.00 49,623.10 165,345.45August 15, 2039. . . . . . . . . 227,577.92 0.00 0.00 47,548.74 156,861.32September 15, 2039 . . . . . . 213,721.68 0.00 0.00 45,516.64 148,592.52October 15, 2039 . . . . . . . . 200,153.39 0.00 0.00 43,526.08 140,534.51November 15, 2039 . . . . . . 186,868.21 0.00 0.00 41,576.37 132,682.84
B-5
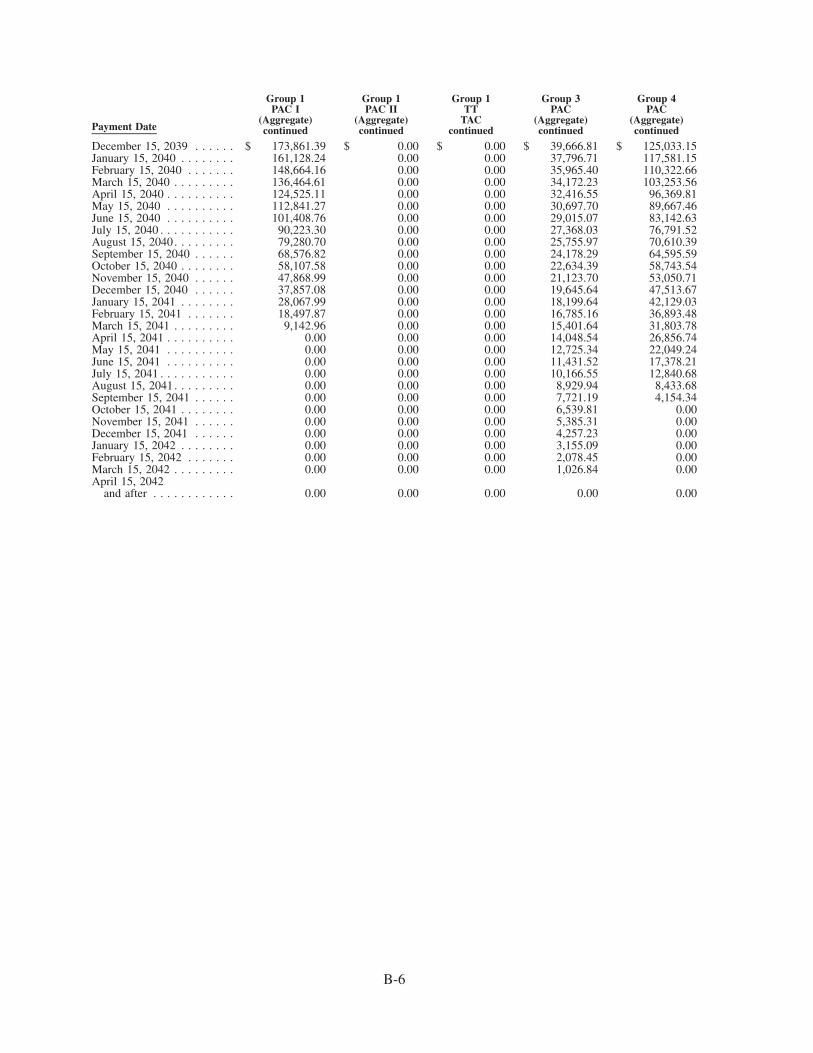
Payment Date
Group 1PAC I
(Aggregate)continued
Group 1PAC II
(Aggregate)continued
Group 1TT
TACcontinued
Group 3PAC
(Aggregate)continued
Group 4PAC
(Aggregate)continued
December 15, 2039 . . . . . . $ 173,861.39 $ 0.00 $ 0.00 $ 39,666.81 $ 125,033.15January 15, 2040 . . . . . . . . 161,128.24 0.00 0.00 37,796.71 117,581.15February 15, 2040 . . . . . . . 148,664.16 0.00 0.00 35,965.40 110,322.66March 15, 2040 . . . . . . . . . 136,464.61 0.00 0.00 34,172.23 103,253.56April 15, 2040 . . . . . . . . . . 124,525.11 0.00 0.00 32,416.55 96,369.81May 15, 2040 . . . . . . . . . . 112,841.27 0.00 0.00 30,697.70 89,667.46June 15, 2040 . . . . . . . . . . 101,408.76 0.00 0.00 29,015.07 83,142.63July 15, 2040 . . . . . . . . . . . 90,223.30 0.00 0.00 27,368.03 76,791.52August 15, 2040. . . . . . . . . 79,280.70 0.00 0.00 25,755.97 70,610.39September 15, 2040 . . . . . . 68,576.82 0.00 0.00 24,178.29 64,595.59October 15, 2040 . . . . . . . . 58,107.58 0.00 0.00 22,634.39 58,743.54November 15, 2040 . . . . . . 47,868.99 0.00 0.00 21,123.70 53,050.71December 15, 2040 . . . . . . 37,857.08 0.00 0.00 19,645.64 47,513.67January 15, 2041 . . . . . . . . 28,067.99 0.00 0.00 18,199.64 42,129.03February 15, 2041 . . . . . . . 18,497.87 0.00 0.00 16,785.16 36,893.48March 15, 2041 . . . . . . . . . 9,142.96 0.00 0.00 15,401.64 31,803.78April 15, 2041 . . . . . . . . . . 0.00 0.00 0.00 14,048.54 26,856.74May 15, 2041 . . . . . . . . . . 0.00 0.00 0.00 12,725.34 22,049.24June 15, 2041 . . . . . . . . . . 0.00 0.00 0.00 11,431.52 17,378.21July 15, 2041 . . . . . . . . . . . 0.00 0.00 0.00 10,166.55 12,840.68August 15, 2041. . . . . . . . . 0.00 0.00 0.00 8,929.94 8,433.68September 15, 2041 . . . . . . 0.00 0.00 0.00 7,721.19 4,154.34October 15, 2041 . . . . . . . . 0.00 0.00 0.00 6,539.81 0.00November 15, 2041 . . . . . . 0.00 0.00 0.00 5,385.31 0.00December 15, 2041 . . . . . . 0.00 0.00 0.00 4,257.23 0.00January 15, 2042 . . . . . . . . 0.00 0.00 0.00 3,155.09 0.00February 15, 2042 . . . . . . . 0.00 0.00 0.00 2,078.45 0.00March 15, 2042 . . . . . . . . . 0.00 0.00 0.00 1,026.84 0.00April 15, 2042
and after . . . . . . . . . . . . 0.00 0.00 0.00 0.00 0.00
B-6
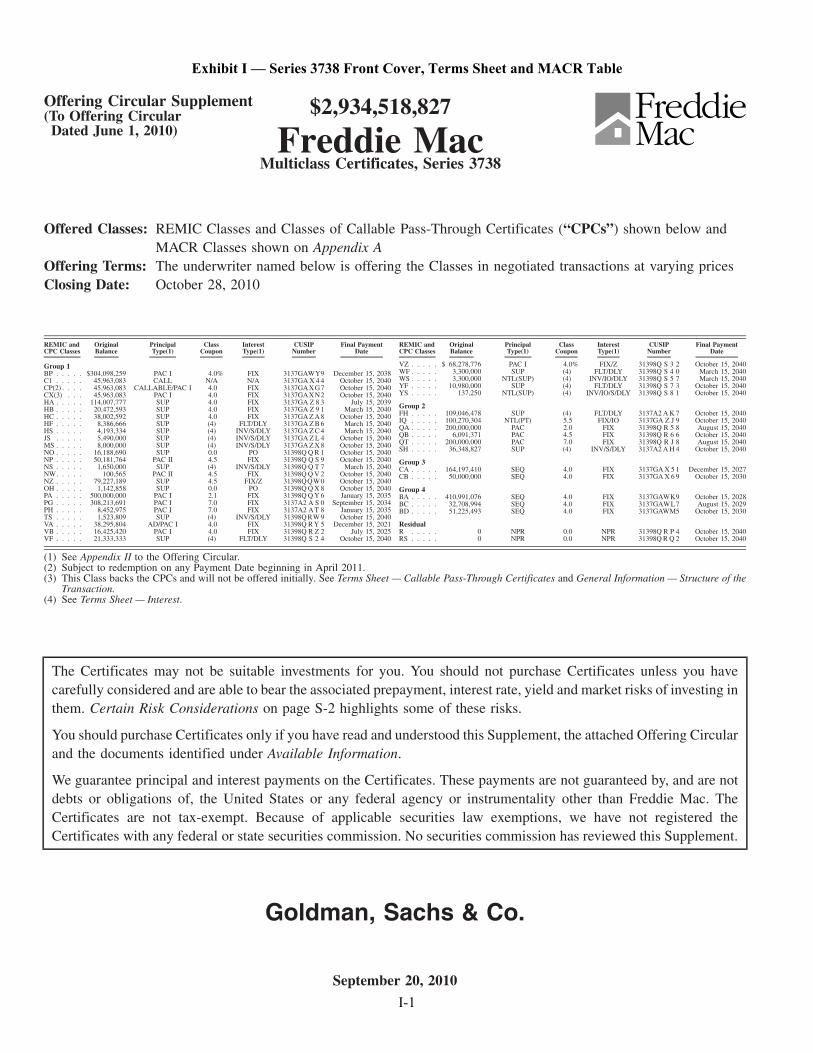
Offering Circular Supplement(To Offering Circular
Dated June 1, 2010)
$2,934,518,827
Freddie MacMulticlass Certificates, Series 3738
Offered Classes: REMIC Classes and Classes of Callable Pass-Through Certificates (“CPCs”) shown below andMACR Classes shown on Appendix A
Offering Terms: The underwriter named below is offering the Classes in negotiated transactions at varying pricesClosing Date: October 28, 2010
REMIC andCPC Classes
OriginalBalance
PrincipalType(1)
ClassCoupon
InterestType(1)
CUSIPNumber
Final PaymentDate
Group 1BP . . . . . $304,098,259 PAC I 4.0% FIX 3137GAWY9 December 15, 2038C1 . . . . . 45,963,083 CALL N/A N/A 3137GA X 4 4 October 15, 2040CP(2) . . . . 45,963,083 CALLABLE/PAC I 4.0 FIX 3137GAXG7 October 15, 2040CX(3) . . . 45,963,083 PAC I 4.0 FIX 3137GAXN2 October 15, 2040HA . . . . . 114,007,777 SUP 4.0 FIX 3137GA Z 8 3 July 15, 2039HB . . . . . 20,472,593 SUP 4.0 FIX 3137GA Z 9 1 March 15, 2040HC . . . . . 38,002,592 SUP 4.0 FIX 3137GA Z A 8 October 15, 2040HF . . . . . 8,386,666 SUP (4) FLT/DLY 3137GA Z B 6 March 15, 2040HS . . . . . 4,193,334 SUP (4) INV/S/DLY 3137GA Z C 4 March 15, 2040JS . . . . . 5,490,000 SUP (4) INV/S/DLY 3137GA Z L 4 October 15, 2040MS . . . . . 8,000,000 SUP (4) INV/S/DLY 3137GA Z X 8 October 15, 2040NO . . . . . 16,188,690 SUP 0.0 PO 31398Q Q R 1 October 15, 2040NP . . . . . 50,181,764 PAC II 4.5 FIX 31398Q Q S 9 October 15, 2040NS . . . . . 1,650,000 SUP (4) INV/S/DLY 31398Q Q T 7 March 15, 2040NW. . . . . 100,565 PAC II 4.5 FIX 31398Q Q V 2 October 15, 2040NZ . . . . . 79,227,189 SUP 4.5 FIX/Z 31398QQW0 October 15, 2040OH . . . . . 1,142,858 SUP 0.0 PO 31398Q Q X 8 October 15, 2040PA . . . . . 500,000,000 PAC I 2.1 FIX 31398Q Q Y 6 January 15, 2035PG . . . . . 308,213,691 PAC I 7.0 FIX 3137A2 A S 0 September 15, 2034PH . . . . . 8,452,975 PAC I 7.0 FIX 3137A2 A T 8 January 15, 2035TS . . . . . 1,523,809 SUP (4) INV/S/DLY 31398Q RW 9 October 15, 2040VA . . . . . 38,295,804 AD/PAC I 4.0 FIX 31398Q R Y 5 December 15, 2021VB . . . . . 16,425,420 PAC I 4.0 FIX 31398Q R Z 2 July 15, 2025VF . . . . . 21,333,333 SUP (4) FLT/DLY 31398Q S 2 4 October 15, 2040
REMIC andCPC Classes
OriginalBalance
PrincipalType(1)
ClassCoupon
InterestType(1)
CUSIPNumber
Final PaymentDate
VZ . . . . . $ 68,278,776 PAC I 4.0% FIX/Z 31398Q S 3 2 October 15, 2040WF . . . . . 3,300,000 SUP (4) FLT/DLY 31398Q S 4 0 March 15, 2040WS . . . . . 3,300,000 NTL(SUP) (4) INV/IO/DLY 31398Q S 5 7 March 15, 2040YF . . . . . 10,980,000 SUP (4) FLT/DLY 31398Q S 7 3 October 15, 2040YS . . . . . 137,250 NTL(SUP) (4) INV/IO/S/DLY 31398Q S 8 1 October 15, 2040
Group 2FH . . . . . 109,046,478 SUP (4) FLT/DLY 3137A2 A K 7 October 15, 2040IQ . . . . . 100,270,304 NTL(PT) 5.5 FIX/IO 3137GA Z J 9 October 15, 2040QA . . . . . 200,000,000 PAC 2.0 FIX 31398Q R 5 8 August 15, 2040QB . . . . . 6,091,371 PAC 4.5 FIX 31398Q R 6 6 October 15, 2040QT . . . . . 200,000,000 PAC 7.0 FIX 31398Q R J 8 August 15, 2040SH . . . . . 36,348,827 SUP (4) INV/S/DLY 3137A2 A H 4 October 15, 2040
Group 3CA . . . . . 164,197,410 SEQ 4.0 FIX 3137GA X 5 1 December 15, 2027CB . . . . . 50,000,000 SEQ 4.0 FIX 3137GA X 6 9 October 15, 2030
Group 4BA . . . . . 410,991,076 SEQ 4.0 FIX 3137GAWK9 October 15, 2028BC . . . . . 32,708,994 SEQ 4.0 FIX 3137GAWL7 August 15, 2029BD . . . . . 51,225,493 SEQ 4.0 FIX 3137GAWM5 October 15, 2030
ResidualR . . . . . 0 NPR 0.0 NPR 31398Q R P 4 October 15, 2040RS . . . . . 0 NPR 0.0 NPR 31398Q R Q 2 October 15, 2040
(1) See Appendix II to the Offering Circular.(2) Subject to redemption on any Payment Date beginning in April 2011.(3) This Class backs the CPCs and will not be offered initially. See Terms Sheet — Callable Pass-Through Certificates and General Information — Structure of the
Transaction.(4) See Terms Sheet — Interest.
The Certificates may not be suitable investments for you. You should not purchase Certificates unless you havecarefully considered and are able to bear the associated prepayment, interest rate, yield and market risks of investing inthem. Certain Risk Considerations on page S-2 highlights some of these risks.
You should purchase Certificates only if you have read and understood this Supplement, the attached Offering Circularand the documents identified under Available Information.
We guarantee principal and interest payments on the Certificates. These payments are not guaranteed by, and are notdebts or obligations of, the United States or any federal agency or instrumentality other than Freddie Mac. TheCertificates are not tax-exempt. Because of applicable securities law exemptions, we have not registered theCertificates with any federal or state securities commission. No securities commission has reviewed this Supplement.
Goldman, Sachs & Co.
September 20, 2010
Exhibit I — Series 3738 Front Cover, Terms Sheet and MACR Table
I-1
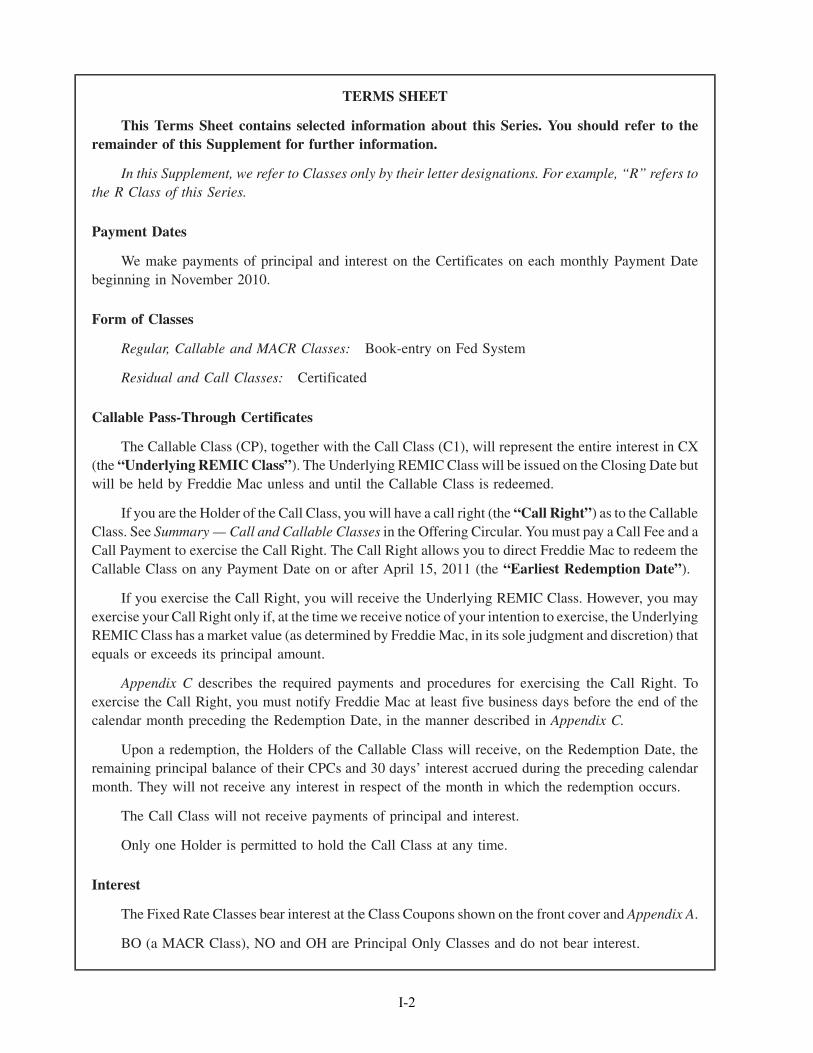
TERMS SHEET
This Terms Sheet contains selected information about this Series. You should refer to theremainder of this Supplement for further information.
In this Supplement, we refer to Classes only by their letter designations. For example, “R” refers tothe R Class of this Series.
Payment Dates
We make payments of principal and interest on the Certificates on each monthly Payment Datebeginning in November 2010.
Form of Classes
Regular, Callable and MACR Classes: Book-entry on Fed System
Residual and Call Classes: Certificated
Callable Pass-Through Certificates
The Callable Class (CP), together with the Call Class (C1), will represent the entire interest in CX(the “Underlying REMIC Class”). The Underlying REMIC Class will be issued on the Closing Date butwill be held by Freddie Mac unless and until the Callable Class is redeemed.
If you are the Holder of the Call Class, you will have a call right (the “Call Right”) as to the CallableClass. See Summary — Call and Callable Classes in the Offering Circular. You must pay a Call Fee and aCall Payment to exercise the Call Right. The Call Right allows you to direct Freddie Mac to redeem theCallable Class on any Payment Date on or after April 15, 2011 (the “Earliest Redemption Date”).
If you exercise the Call Right, you will receive the Underlying REMIC Class. However, you mayexercise your Call Right only if, at the time we receive notice of your intention to exercise, the UnderlyingREMIC Class has a market value (as determined by Freddie Mac, in its sole judgment and discretion) thatequals or exceeds its principal amount.
Appendix C describes the required payments and procedures for exercising the Call Right. Toexercise the Call Right, you must notify Freddie Mac at least five business days before the end of thecalendar month preceding the Redemption Date, in the manner described in Appendix C.
Upon a redemption, the Holders of the Callable Class will receive, on the Redemption Date, theremaining principal balance of their CPCs and 30 days’ interest accrued during the preceding calendarmonth. They will not receive any interest in respect of the month in which the redemption occurs.
The Call Class will not receive payments of principal and interest.
Only one Holder is permitted to hold the Call Class at any time.
Interest
The Fixed Rate Classes bear interest at the Class Coupons shown on the front cover and Appendix A.
BO (a MACR Class), NO and OH are Principal Only Classes and do not bear interest.
I-2
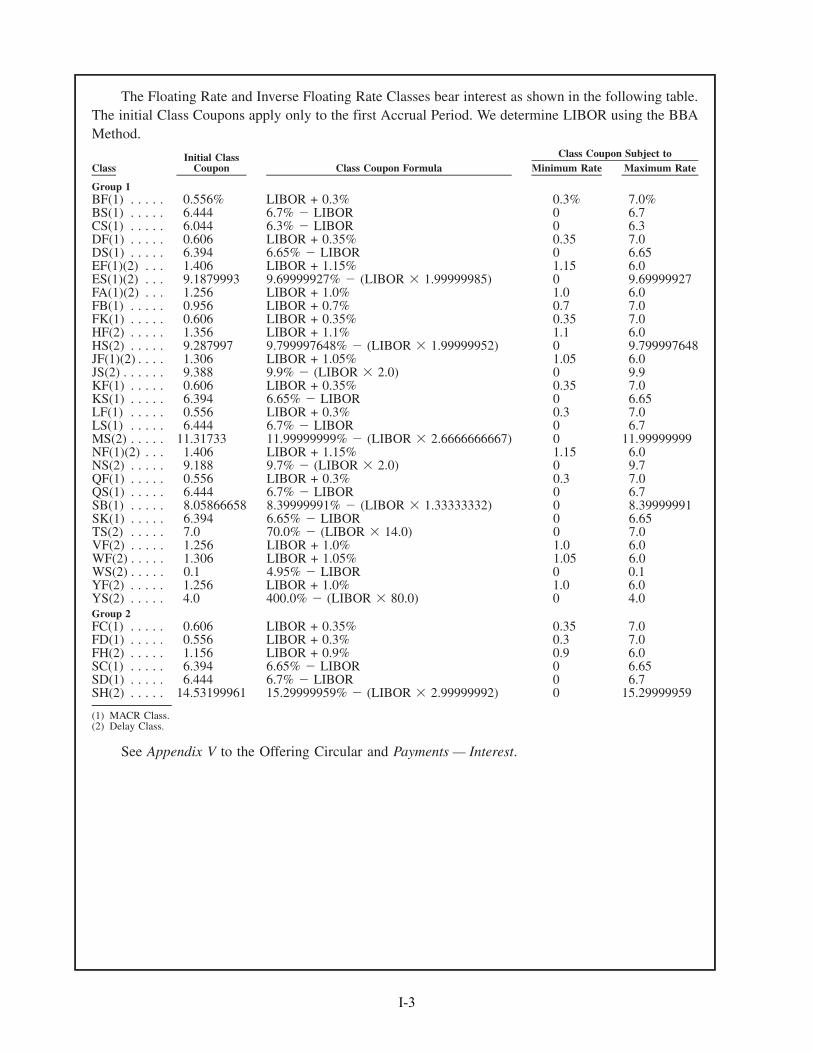
The Floating Rate and Inverse Floating Rate Classes bear interest as shown in the following table.The initial Class Coupons apply only to the first Accrual Period. We determine LIBOR using the BBAMethod.
ClassInitial Class
Coupon Class Coupon Formula Minimum Rate Maximum RateClass Coupon Subject to
Group 1BF(1) . . . . . 0.556% LIBOR + 0.3% 0.3% 7.0%BS(1) . . . . . 6.444 6.7% � LIBOR 0 6.7CS(1) . . . . . 6.044 6.3% � LIBOR 0 6.3DF(1) . . . . . 0.606 LIBOR + 0.35% 0.35 7.0DS(1) . . . . . 6.394 6.65% � LIBOR 0 6.65EF(1)(2) . . . 1.406 LIBOR + 1.15% 1.15 6.0ES(1)(2) . . . 9.1879993 9.69999927% � (LIBOR � 1.99999985) 0 9.69999927FA(1)(2) . . . 1.256 LIBOR + 1.0% 1.0 6.0FB(1) . . . . . 0.956 LIBOR + 0.7% 0.7 7.0FK(1) . . . . . 0.606 LIBOR + 0.35% 0.35 7.0HF(2) . . . . . 1.356 LIBOR + 1.1% 1.1 6.0HS(2) . . . . . 9.287997 9.799997648% � (LIBOR � 1.99999952) 0 9.799997648JF(1)(2) . . . . 1.306 LIBOR + 1.05% 1.05 6.0JS(2) . . . . . . 9.388 9.9% � (LIBOR � 2.0) 0 9.9KF(1) . . . . . 0.606 LIBOR + 0.35% 0.35 7.0KS(1) . . . . . 6.394 6.65% � LIBOR 0 6.65LF(1) . . . . . 0.556 LIBOR + 0.3% 0.3 7.0LS(1) . . . . . 6.444 6.7% � LIBOR 0 6.7MS(2) . . . . . 11.31733 11.99999999% � (LIBOR � 2.6666666667) 0 11.99999999NF(1)(2) . . . 1.406 LIBOR + 1.15% 1.15 6.0NS(2) . . . . . 9.188 9.7% � (LIBOR � 2.0) 0 9.7QF(1) . . . . . 0.556 LIBOR + 0.3% 0.3 7.0QS(1) . . . . . 6.444 6.7% � LIBOR 0 6.7SB(1) . . . . . 8.05866658 8.39999991% � (LIBOR � 1.33333332) 0 8.39999991SK(1) . . . . . 6.394 6.65% � LIBOR 0 6.65TS(2) . . . . . 7.0 70.0% � (LIBOR � 14.0) 0 7.0VF(2) . . . . . 1.256 LIBOR + 1.0% 1.0 6.0WF(2) . . . . . 1.306 LIBOR + 1.05% 1.05 6.0WS(2) . . . . . 0.1 4.95% � LIBOR 0 0.1YF(2) . . . . . 1.256 LIBOR + 1.0% 1.0 6.0YS(2) . . . . . 4.0 400.0% � (LIBOR � 80.0) 0 4.0Group 2FC(1) . . . . . 0.606 LIBOR + 0.35% 0.35 7.0FD(1) . . . . . 0.556 LIBOR + 0.3% 0.3 7.0FH(2) . . . . . 1.156 LIBOR + 0.9% 0.9 6.0SC(1) . . . . . 6.394 6.65% � LIBOR 0 6.65SD(1) . . . . . 6.444 6.7% � LIBOR 0 6.7SH(2) . . . . . 14.53199961 15.29999959% � (LIBOR � 2.99999992) 0 15.29999959
(1) MACR Class.(2) Delay Class.
See Appendix V to the Offering Circular and Payments — Interest.
I-3
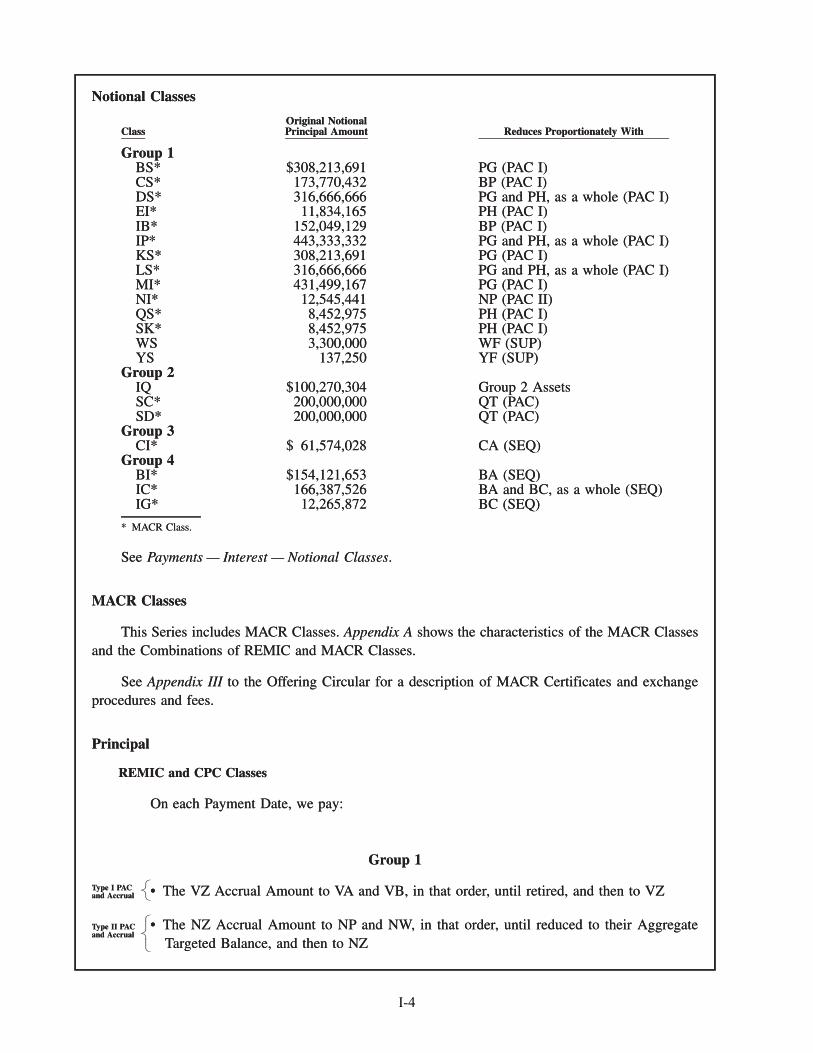
Notional Classes
ClassOriginal NotionalPrincipal Amount Reduces Proportionately With
Group 1BS* $308,213,691 PG (PAC I)CS* 173,770,432 BP (PAC I)DS* 316,666,666 PG and PH, as a whole (PAC I)EI* 11,834,165 PH (PAC I)IB* 152,049,129 BP (PAC I)IP* 443,333,332 PG and PH, as a whole (PAC I)KS* 308,213,691 PG (PAC I)LS* 316,666,666 PG and PH, as a whole (PAC I)MI* 431,499,167 PG (PAC I)NI* 12,545,441 NP (PAC II)QS* 8,452,975 PH (PAC I)SK* 8,452,975 PH (PAC I)WS 3,300,000 WF (SUP)YS 137,250 YF (SUP)
Group 2IQ $100,270,304 Group 2 AssetsSC* 200,000,000 QT (PAC)SD* 200,000,000 QT (PAC)
Group 3CI* $ 61,574,028 CA (SEQ)
Group 4BI* $154,121,653 BA (SEQ)IC* 166,387,526 BA and BC, as a whole (SEQ)IG* 12,265,872 BC (SEQ)
* MACR Class.
See Payments — Interest — Notional Classes.
MACR Classes
This Series includes MACR Classes. Appendix A shows the characteristics of the MACR Classesand the Combinations of REMIC and MACR Classes.
See Appendix III to the Offering Circular for a description of MACR Certificates and exchangeprocedures and fees.
Principal
REMIC and CPC Classes
On each Payment Date, we pay:
Group 1
• The VZ Accrual Amount to VA and VB, in that order, until retired, and then to VZType I PACand Accrual
• The NZ Accrual Amount to NP and NW, in that order, until reduced to their AggregateTargeted Balance, and then to NZ
Type II PACand Accrual
Notional Classes
ClassOriginal NotionalPrincipal Amount Reduces Proportionately With
Group 1BS* $308,213,691 PG (PAC I)CS* 173,770,432 BP (PAC I)DS* 316,666,666 PG and PH, as a whole (PAC I)EI* 11,834,165 PH (PAC I)IB* 152,049,129 BP (PAC I)IP* 443,333,332 PG and PH, as a whole (PAC I)KS* 308,213,691 PG (PAC I)LS* 316,666,666 PG and PH, as a whole (PAC I)MI* 431,499,167 PG (PAC I)NI* 12,545,441 NP (PAC II)QS* 8,452,975 PH (PAC I)SK* 8,452,975 PH (PAC I)WS 3,300,000 WF (SUP)YS 137,250 YF (SUP)
Group 2IQ $100,270,304 Group 2 AssetsSC* 200,000,000 QT (PAC)SD* 200,000,000 QT (PAC)
Group 3CI* $ 61,574,028 CA (SEQ)
Group 4BI* $154,121,653 BA (SEQ)IC* 166,387,526 BA and BC, as a whole (SEQ)IG* 12,265,872 BC (SEQ)
* MACR Class.
See Payments — Interest — Notional Classes.
MACR Classes
This Series includes MACR Classes. Appendix A shows the characteristics of the MACR Classesand the Combinations of REMIC and MACR Classes.
See Appendix III to the Offering Circular for a description of MACR Certificates and exchangeprocedures and fees.
Principal
REMIC and CPC Classes
On each Payment Date, we pay:
Group 1
• The VZ Accrual Amount to VA and VB, in that order, until retired, and then to VZ�����
Type I PACand Accrual
• The NZ Accrual Amount to NP and NW, in that order, until reduced to their AggregateTargeted Balance, and then to NZ
�����������
Type II PACand Accrual
I-4
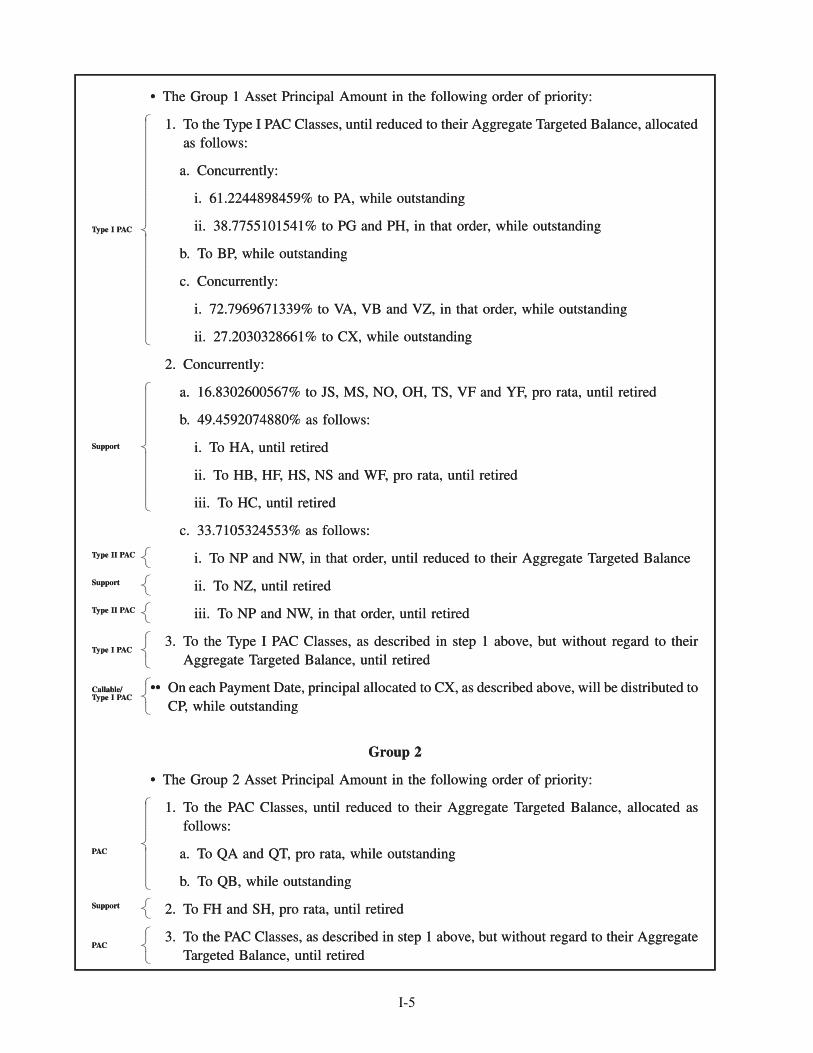
• The Group 1 Asset Principal Amount in the following order of priority:
1. To the Type I PAC Classes, until reduced to their Aggregate Targeted Balance, allocatedas follows:
a. Concurrently:
i. 61.2244898459% to PA, while outstanding
ii. 38.7755101541% to PG and PH, in that order, while outstanding
b. To BP, while outstanding
c. Concurrently:
i. 72.7969671339% to VA, VB and VZ, in that order, while outstanding
ii. 27.2030328661% to CX, while outstanding
Type I PAC
2. Concurrently:
a. 16.8302600567% to JS, MS, NO, OH, TS, VF and YF, pro rata, until retired
b. 49.4592074880% as follows:
i. To HA, until retired
ii. To HB, HF, HS, NS and WF, pro rata, until retired
iii. To HC, until retired
Support
c. 33.7105324553% as follows:
i. To NP and NW, in that order, until reduced to their Aggregate Targeted BalanceType II PAC
ii. To NZ, until retiredSupport
iii. To NP and NW, in that order, until retiredType II PAC
3. To the Type I PAC Classes, as described in step 1 above, but without regard to theirAggregate Targeted Balance, until retired
Type I PAC
•• On each Payment Date, principal allocated to CX, as described above, will be distributed toCP, while outstanding
Callable/Type I PAC
Group 2
• The Group 2 Asset Principal Amount in the following order of priority:
1. To the PAC Classes, until reduced to their Aggregate Targeted Balance, allocated asfollows:
a. To QA and QT, pro rata, while outstanding
b. To QB, while outstanding
PAC
2. To FH and SH, pro rata, until retiredSupport
3. To the PAC Classes, as described in step 1 above, but without regard to their AggregateTargeted Balance, until retired
PAC
• The Group 1 Asset Principal Amount in the following order of priority:
1. To the Type I PAC Classes, until reduced to their Aggregate Targeted Balance, allocatedas follows:
a. Concurrently:
i. 61.2244898459% to PA, while outstanding
ii. 38.7755101541% to PG and PH, in that order, while outstanding
b. To BP, while outstanding
c. Concurrently:
i. 72.7969671339% to VA, VB and VZ, in that order, while outstanding
ii. 27.2030328661% to CX, while outstanding
�������������������������������������������������������������������������������
Type I PAC
2. Concurrently:
a. 16.8302600567% to JS, MS, NO, OH, TS, VF and YF, pro rata, until retired
b. 49.4592074880% as follows:
i. To HA, until retired
ii. To HB, HF, HS, NS and WF, pro rata, until retired
iii. To HC, until retired
�������������������������������������������
Support
c. 33.7105324553% as follows:
i. To NP and NW, in that order, until reduced to their Aggregate Targeted Balance�����
Type II PAC
ii. To NZ, until retired�����
Support
iii. To NP and NW, in that order, until retired�����
Type II PAC
3. To the Type I PAC Classes, as described in step 1 above, but without regard to theirAggregate Targeted Balance, until retired
�����������
Type I PAC
•• On each Payment Date, principal allocated to CX, as described above, will be distributed toCP, while outstanding
�����������
Callable/Type I PAC
Group 2
• The Group 2 Asset Principal Amount in the following order of priority:
1. To the PAC Classes, until reduced to their Aggregate Targeted Balance, allocated asfollows:
a. To QA and QT, pro rata, while outstanding
b. To QB, while outstanding
�������������������������������
PAC
2. To FH and SH, pro rata, until retired�����
Support
3. To the PAC Classes, as described in step 1 above, but without regard to their AggregateTargeted Balance, until retired
�����������
PAC
I-5
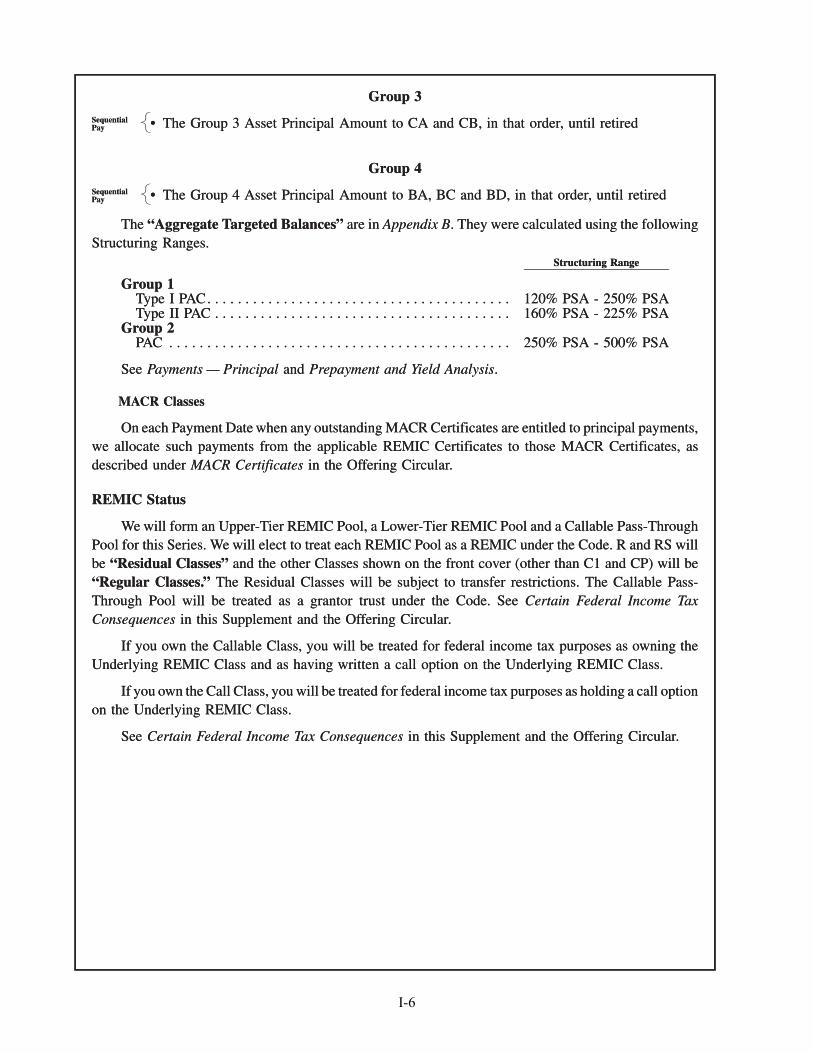
Group 3
• The Group 3 Asset Principal Amount to CA and CB, in that order, until retiredSequentialPay
Group 4
• The Group 4 Asset Principal Amount to BA, BC and BD, in that order, until retiredSequentialPay
The “Aggregate Targeted Balances” are in Appendix B. They were calculated using the followingStructuring Ranges.
Structuring Range
Group 1Type I PAC. . . . . . . . . . . . . . . . . . . . . . . . . . . . . . . . . . . . . . . . 120% PSA - 250% PSAType II PAC . . . . . . . . . . . . . . . . . . . . . . . . . . . . . . . . . . . . . . . 160% PSA - 225% PSA
Group 2PAC . . . . . . . . . . . . . . . . . . . . . . . . . . . . . . . . . . . . . . . . . . . . . 250% PSA - 500% PSA
See Payments — Principal and Prepayment and Yield Analysis.
MACR Classes
On each Payment Date when any outstanding MACR Certificates are entitled to principal payments,we allocate such payments from the applicable REMIC Certificates to those MACR Certificates, asdescribed under MACR Certificates in the Offering Circular.
REMIC Status
We will form an Upper-Tier REMIC Pool, a Lower-Tier REMIC Pool and a Callable Pass-ThroughPool for this Series. We will elect to treat each REMIC Pool as a REMIC under the Code. R and RS willbe “Residual Classes” and the other Classes shown on the front cover (other than C1 and CP) will be“Regular Classes.” The Residual Classes will be subject to transfer restrictions. The Callable Pass-Through Pool will be treated as a grantor trust under the Code. See Certain Federal Income TaxConsequences in this Supplement and the Offering Circular.
If you own the Callable Class, you will be treated for federal income tax purposes as owning theUnderlying REMIC Class and as having written a call option on the Underlying REMIC Class.
If you own the Call Class, you will be treated for federal income tax purposes as holding a call optionon the Underlying REMIC Class.
See Certain Federal Income Tax Consequences in this Supplement and the Offering Circular.
Group 3
• The Group 3 Asset Principal Amount to CA and CB, in that order, until retired�����
SequentialPay
Group 4
• The Group 4 Asset Principal Amount to BA, BC and BD, in that order, until retired�����
SequentialPay
The “Aggregate Targeted Balances” are in Appendix B. They were calculated using the followingStructuring Ranges.
Structuring Range
Group 1Type I PAC. . . . . . . . . . . . . . . . . . . . . . . . . . . . . . . . . . . . . . . . 120% PSA - 250% PSAType II PAC . . . . . . . . . . . . . . . . . . . . . . . . . . . . . . . . . . . . . . . 160% PSA - 225% PSA
Group 2PAC . . . . . . . . . . . . . . . . . . . . . . . . . . . . . . . . . . . . . . . . . . . . . 250% PSA - 500% PSA
See Payments — Principal and Prepayment and Yield Analysis.
MACR Classes
On each Payment Date when any outstanding MACR Certificates are entitled to principal payments,we allocate such payments from the applicable REMIC Certificates to those MACR Certificates, asdescribed under MACR Certificates in the Offering Circular.
REMIC Status
We will form an Upper-Tier REMIC Pool, a Lower-Tier REMIC Pool and a Callable Pass-ThroughPool for this Series. We will elect to treat each REMIC Pool as a REMIC under the Code. R and RS willbe “Residual Classes” and the other Classes shown on the front cover (other than C1 and CP) will be“Regular Classes.” The Residual Classes will be subject to transfer restrictions. The Callable Pass-Through Pool will be treated as a grantor trust under the Code. See Certain Federal Income TaxConsequences in this Supplement and the Offering Circular.
If you own the Callable Class, you will be treated for federal income tax purposes as owning theUnderlying REMIC Class and as having written a call option on the Underlying REMIC Class.
If you own the Call Class, you will be treated for federal income tax purposes as holding a call optionon the Underlying REMIC Class.
See Certain Federal Income Tax Consequences in this Supplement and the Offering Circular.
I-6
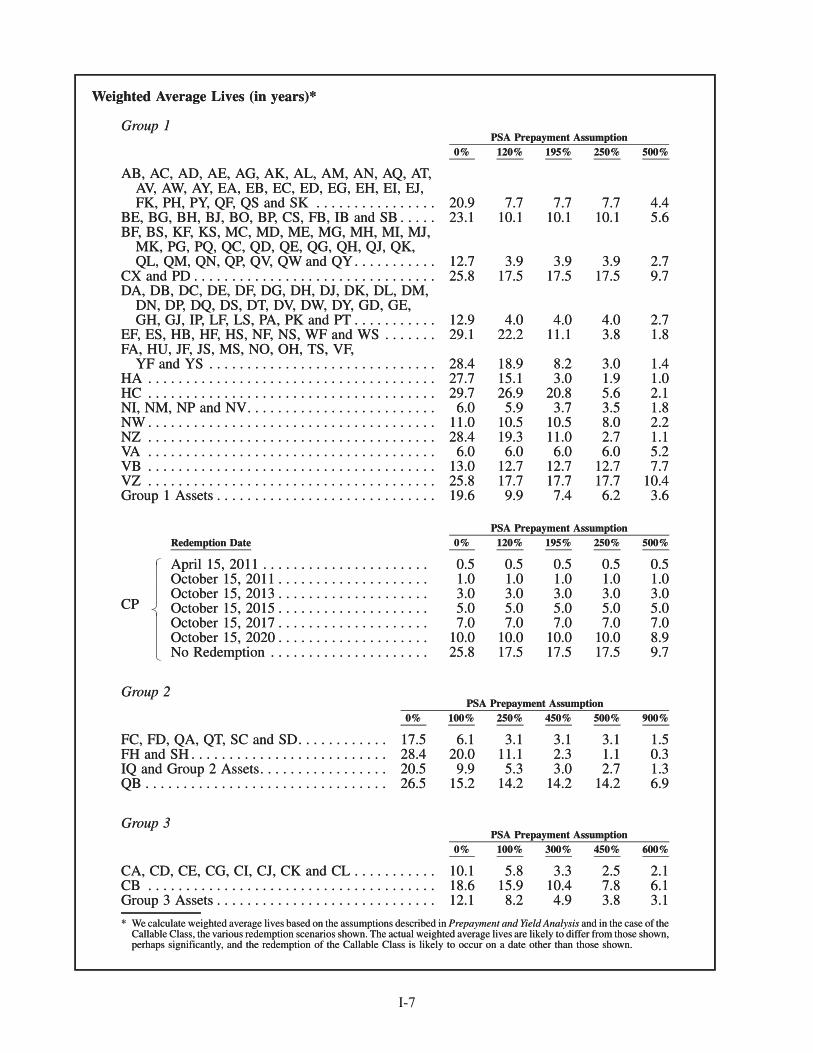
Weighted Average Lives (in years)*
Group 1
0% 120% 195% 250% 500%PSA Prepayment Assumption
AB, AC, AD, AE, AG, AK, AL, AM, AN, AQ, AT,AV, AW, AY, EA, EB, EC, ED, EG, EH, EI, EJ,FK, PH, PY, QF, QS and SK . . . . . . . . . . . . . . . . 20.9 7.7 7.7 7.7 4.4
BE, BG, BH, BJ, BO, BP, CS, FB, IB and SB . . . . . 23.1 10.1 10.1 10.1 5.6BF, BS, KF, KS, MC, MD, ME, MG, MH, MI, MJ,
MK, PG, PQ, QC, QD, QE, QG, QH, QJ, QK,QL, QM, QN, QP, QV, QW and QY. . . . . . . . . . . 12.7 3.9 3.9 3.9 2.7
CX and PD . . . . . . . . . . . . . . . . . . . . . . . . . . . . . . . . 25.8 17.5 17.5 17.5 9.7DA, DB, DC, DE, DF, DG, DH, DJ, DK, DL, DM,
DN, DP, DQ, DS, DT, DV, DW, DY, GD, GE,GH, GJ, IP, LF, LS, PA, PK and PT . . . . . . . . . . . 12.9 4.0 4.0 4.0 2.7
EF, ES, HB, HF, HS, NF, NS, WF and WS . . . . . . . 29.1 22.2 11.1 3.8 1.8FA, HU, JF, JS, MS, NO, OH, TS, VF,
YF and YS . . . . . . . . . . . . . . . . . . . . . . . . . . . . . . 28.4 18.9 8.2 3.0 1.4HA . . . . . . . . . . . . . . . . . . . . . . . . . . . . . . . . . . . . . . 27.7 15.1 3.0 1.9 1.0HC . . . . . . . . . . . . . . . . . . . . . . . . . . . . . . . . . . . . . . 29.7 26.9 20.8 5.6 2.1NI, NM, NP and NV. . . . . . . . . . . . . . . . . . . . . . . . . 6.0 5.9 3.7 3.5 1.8NW . . . . . . . . . . . . . . . . . . . . . . . . . . . . . . . . . . . . . . 11.0 10.5 10.5 8.0 2.2NZ . . . . . . . . . . . . . . . . . . . . . . . . . . . . . . . . . . . . . . 28.4 19.3 11.0 2.7 1.1VA . . . . . . . . . . . . . . . . . . . . . . . . . . . . . . . . . . . . . . 6.0 6.0 6.0 6.0 5.2VB . . . . . . . . . . . . . . . . . . . . . . . . . . . . . . . . . . . . . . 13.0 12.7 12.7 12.7 7.7VZ . . . . . . . . . . . . . . . . . . . . . . . . . . . . . . . . . . . . . . 25.8 17.7 17.7 17.7 10.4Group 1 Assets . . . . . . . . . . . . . . . . . . . . . . . . . . . . . 19.6 9.9 7.4 6.2 3.6
Redemption Date 0% 120% 195% 250% 500%PSA Prepayment Assumption
CP
April 15, 2011 . . . . . . . . . . . . . . . . . . . . . . 0.5 0.5 0.5 0.5 0.5October 15, 2011 . . . . . . . . . . . . . . . . . . . . 1.0 1.0 1.0 1.0 1.0October 15, 2013 . . . . . . . . . . . . . . . . . . . . 3.0 3.0 3.0 3.0 3.0October 15, 2015 . . . . . . . . . . . . . . . . . . . . 5.0 5.0 5.0 5.0 5.0October 15, 2017 . . . . . . . . . . . . . . . . . . . . 7.0 7.0 7.0 7.0 7.0October 15, 2020 . . . . . . . . . . . . . . . . . . . . 10.0 10.0 10.0 10.0 8.9No Redemption . . . . . . . . . . . . . . . . . . . . . 25.8 17.5 17.5 17.5 9.7
Group 2
0% 100% 250% 450% 500% 900%PSA Prepayment Assumption
FC, FD, QA, QT, SC and SD. . . . . . . . . . . . 17.5 6.1 3.1 3.1 3.1 1.5FH and SH . . . . . . . . . . . . . . . . . . . . . . . . . . 28.4 20.0 11.1 2.3 1.1 0.3IQ and Group 2 Assets. . . . . . . . . . . . . . . . . 20.5 9.9 5.3 3.0 2.7 1.3QB . . . . . . . . . . . . . . . . . . . . . . . . . . . . . . . . 26.5 15.2 14.2 14.2 14.2 6.9
Group 3
0% 100% 300% 450% 600%PSA Prepayment Assumption
CA, CD, CE, CG, CI, CJ, CK and CL . . . . . . . . . . . 10.1 5.8 3.3 2.5 2.1CB . . . . . . . . . . . . . . . . . . . . . . . . . . . . . . . . . . . . . . 18.6 15.9 10.4 7.8 6.1Group 3 Assets . . . . . . . . . . . . . . . . . . . . . . . . . . . . . 12.1 8.2 4.9 3.8 3.1
* We calculate weighted average lives based on the assumptions described in Prepayment and Yield Analysis and in the case of theCallable Class, the various redemption scenarios shown. The actual weighted average lives are likely to differ from those shown,perhaps significantly, and the redemption of the Callable Class is likely to occur on a date other than those shown.
Weighted Average Lives (in years)*
Group 1
0% 120% 195% 250% 500%PSA Prepayment Assumption
AB, AC, AD, AE, AG, AK, AL, AM, AN, AQ, AT,AV, AW, AY, EA, EB, EC, ED, EG, EH, EI, EJ,FK, PH, PY, QF, QS and SK . . . . . . . . . . . . . . . . 20.9 7.7 7.7 7.7 4.4
BE, BG, BH, BJ, BO, BP, CS, FB, IB and SB . . . . . 23.1 10.1 10.1 10.1 5.6BF, BS, KF, KS, MC, MD, ME, MG, MH, MI, MJ,
MK, PG, PQ, QC, QD, QE, QG, QH, QJ, QK,QL, QM, QN, QP, QV, QW and QY. . . . . . . . . . . 12.7 3.9 3.9 3.9 2.7
CX and PD . . . . . . . . . . . . . . . . . . . . . . . . . . . . . . . . 25.8 17.5 17.5 17.5 9.7DA, DB, DC, DE, DF, DG, DH, DJ, DK, DL, DM,
DN, DP, DQ, DS, DT, DV, DW, DY, GD, GE,GH, GJ, IP, LF, LS, PA, PK and PT . . . . . . . . . . . 12.9 4.0 4.0 4.0 2.7
EF, ES, HB, HF, HS, NF, NS, WF and WS . . . . . . . 29.1 22.2 11.1 3.8 1.8FA, HU, JF, JS, MS, NO, OH, TS, VF,
YF and YS . . . . . . . . . . . . . . . . . . . . . . . . . . . . . . 28.4 18.9 8.2 3.0 1.4HA . . . . . . . . . . . . . . . . . . . . . . . . . . . . . . . . . . . . . . 27.7 15.1 3.0 1.9 1.0HC . . . . . . . . . . . . . . . . . . . . . . . . . . . . . . . . . . . . . . 29.7 26.9 20.8 5.6 2.1NI, NM, NP and NV. . . . . . . . . . . . . . . . . . . . . . . . . 6.0 5.9 3.7 3.5 1.8NW . . . . . . . . . . . . . . . . . . . . . . . . . . . . . . . . . . . . . . 11.0 10.5 10.5 8.0 2.2NZ . . . . . . . . . . . . . . . . . . . . . . . . . . . . . . . . . . . . . . 28.4 19.3 11.0 2.7 1.1VA . . . . . . . . . . . . . . . . . . . . . . . . . . . . . . . . . . . . . . 6.0 6.0 6.0 6.0 5.2VB . . . . . . . . . . . . . . . . . . . . . . . . . . . . . . . . . . . . . . 13.0 12.7 12.7 12.7 7.7VZ . . . . . . . . . . . . . . . . . . . . . . . . . . . . . . . . . . . . . . 25.8 17.7 17.7 17.7 10.4Group 1 Assets . . . . . . . . . . . . . . . . . . . . . . . . . . . . . 19.6 9.9 7.4 6.2 3.6
Redemption Date 0% 120% 195% 250% 500%PSA Prepayment Assumption
CP
April 15, 2011 . . . . . . . . . . . . . . . . . . . . . . 0.5 0.5 0.5 0.5 0.5October 15, 2011 . . . . . . . . . . . . . . . . . . . . 1.0 1.0 1.0 1.0 1.0October 15, 2013 . . . . . . . . . . . . . . . . . . . . 3.0 3.0 3.0 3.0 3.0October 15, 2015 . . . . . . . . . . . . . . . . . . . . 5.0 5.0 5.0 5.0 5.0October 15, 2017 . . . . . . . . . . . . . . . . . . . . 7.0 7.0 7.0 7.0 7.0October 15, 2020 . . . . . . . . . . . . . . . . . . . . 10.0 10.0 10.0 10.0 8.9No Redemption . . . . . . . . . . . . . . . . . . . . . 25.8 17.5 17.5 17.5 9.7
�����������������������������������
Group 2
0% 100% 250% 450% 500% 900%PSA Prepayment Assumption
FC, FD, QA, QT, SC and SD. . . . . . . . . . . . 17.5 6.1 3.1 3.1 3.1 1.5FH and SH . . . . . . . . . . . . . . . . . . . . . . . . . . 28.4 20.0 11.1 2.3 1.1 0.3IQ and Group 2 Assets. . . . . . . . . . . . . . . . . 20.5 9.9 5.3 3.0 2.7 1.3QB . . . . . . . . . . . . . . . . . . . . . . . . . . . . . . . . 26.5 15.2 14.2 14.2 14.2 6.9
Group 3
0% 100% 300% 450% 600%PSA Prepayment Assumption
CA, CD, CE, CG, CI, CJ, CK and CL . . . . . . . . . . . 10.1 5.8 3.3 2.5 2.1CB . . . . . . . . . . . . . . . . . . . . . . . . . . . . . . . . . . . . . . 18.6 15.9 10.4 7.8 6.1Group 3 Assets . . . . . . . . . . . . . . . . . . . . . . . . . . . . . 12.1 8.2 4.9 3.8 3.1
* We calculate weighted average lives based on the assumptions described in Prepayment and Yield Analysis and in the case of theCallable Class, the various redemption scenarios shown. The actual weighted average lives are likely to differ from those shown,perhaps significantly, and the redemption of the Callable Class is likely to occur on a date other than those shown.
I-7
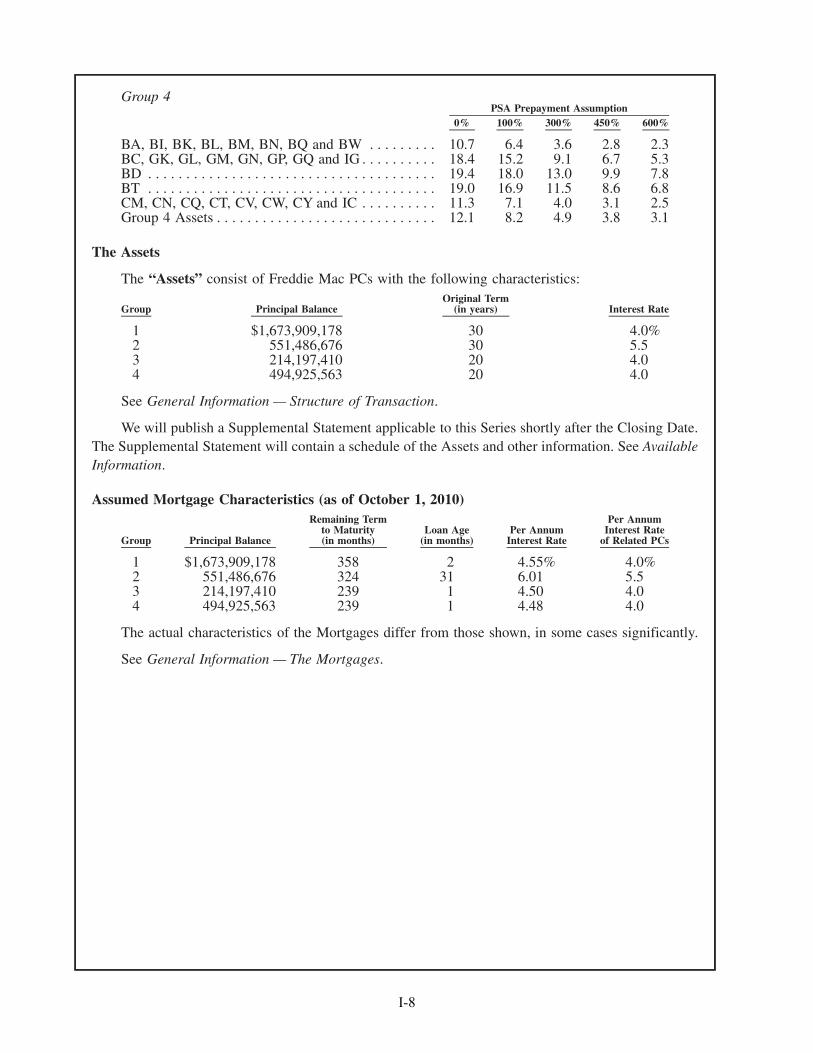
Group 4
0% 100% 300% 450% 600%PSA Prepayment Assumption
BA, BI, BK, BL, BM, BN, BQ and BW . . . . . . . . . 10.7 6.4 3.6 2.8 2.3BC, GK, GL, GM, GN, GP, GQ and IG . . . . . . . . . . 18.4 15.2 9.1 6.7 5.3BD . . . . . . . . . . . . . . . . . . . . . . . . . . . . . . . . . . . . . . 19.4 18.0 13.0 9.9 7.8BT . . . . . . . . . . . . . . . . . . . . . . . . . . . . . . . . . . . . . . 19.0 16.9 11.5 8.6 6.8CM, CN, CQ, CT, CV, CW, CY and IC . . . . . . . . . . 11.3 7.1 4.0 3.1 2.5Group 4 Assets . . . . . . . . . . . . . . . . . . . . . . . . . . . . . 12.1 8.2 4.9 3.8 3.1
The Assets
The “Assets” consist of Freddie Mac PCs with the following characteristics:
Group Principal BalanceOriginal Term
(in years) Interest Rate
1 $1,673,909,178 30 4.0%2 551,486,676 30 5.53 214,197,410 20 4.04 494,925,563 20 4.0
See General Information — Structure of Transaction.
We will publish a Supplemental Statement applicable to this Series shortly after the Closing Date.The Supplemental Statement will contain a schedule of the Assets and other information. See AvailableInformation.
Assumed Mortgage Characteristics (as of October 1, 2010)
Group Principal Balance
Remaining Termto Maturity(in months)
Loan Age(in months)
Per AnnumInterest Rate
Per AnnumInterest Rate
of Related PCs
1 $1,673,909,178 358 2 4.55% 4.0%2 551,486,676 324 31 6.01 5.53 214,197,410 239 1 4.50 4.04 494,925,563 239 1 4.48 4.0
The actual characteristics of the Mortgages differ from those shown, in some cases significantly.
See General Information — The Mortgages.
I-8
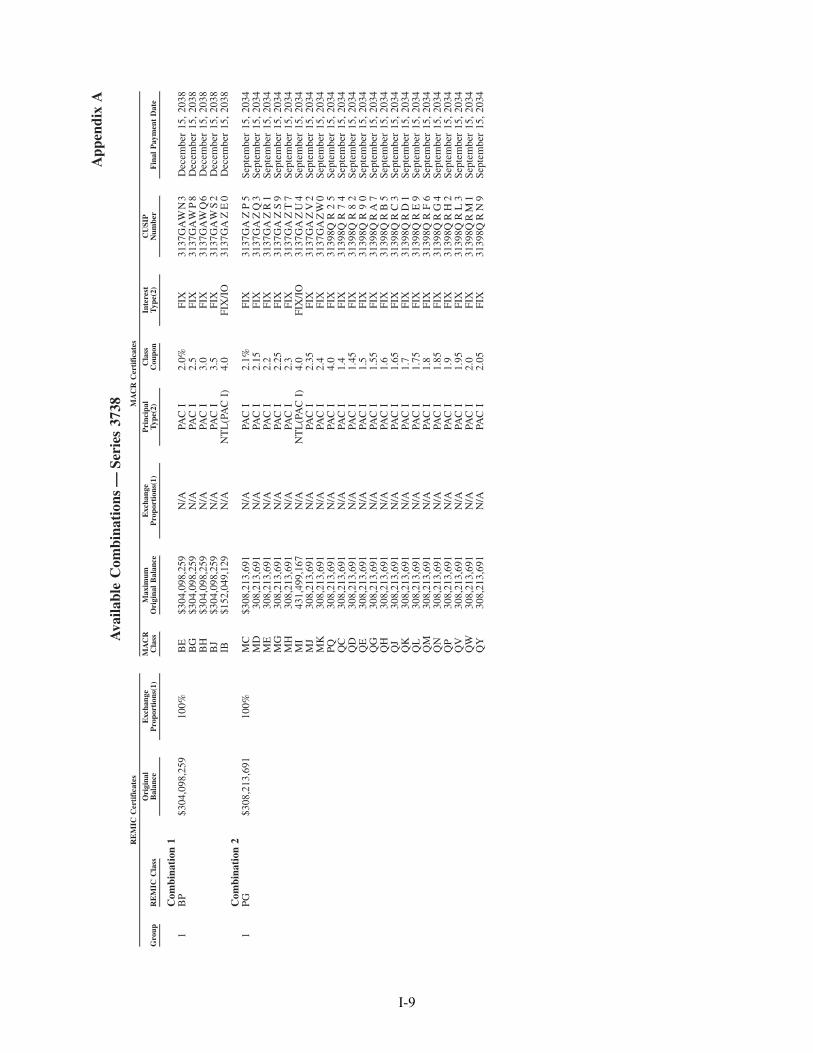
App
endi
xA
Ava
ilabl
eC
ombi
nati
ons
—Se
ries
3738
Gro
upR
EM
ICC
lass
Ori
gina
lB
alan
ceE
xcha
nge
Pro
port
ions
(1)
MA
CR
Cla
ssM
axim
umO
rigi
nal
Bal
ance
Exc
hang
eP
ropo
rtio
ns(1
)P
rinc
ipal
Typ
e(2)
Cla
ssC
oupo
nIn
tere
stT
ype(
2)C
USI
PN
umbe
rF
inal
Pay
men
tD
ate
RE
MIC
Cer
tifi
cate
sM
AC
RC
erti
fica
tes
Com
bina
tion
11
BP
$304
,098
,259
100%
BE
$304
,098
,259
N/A
PAC
I2.
0%FI
X31
37G
AW
N3
Dec
embe
r15
,20
38B
G$3
04,0
98,2
59N
/APA
CI
2.5
FIX
3137
GA
WP
8D
ecem
ber
15,
2038
BH
$304
,098
,259
N/A
PAC
I3.
0FI
X31
37G
AW
Q6
Dec
embe
r15
,20
38B
J$3
04,0
98,2
59N
/APA
CI
3.5
FIX
3137
GA
WS
2D
ecem
ber
15,
2038
IB$1
52,0
49,1
29N
/AN
TL
(PA
CI)
4.0
FIX
/IO
3137
GA
ZE
0D
ecem
ber
15,
2038
Com
bina
tion
21
PG$3
08,2
13,6
9110
0%M
C$3
08,2
13,6
91N
/APA
CI
2.1%
FIX
3137
GA
ZP
5Se
ptem
ber
15,
2034
MD
308,
213,
691
N/A
PAC
I2.
15FI
X31
37G
AZ
Q3
Sept
embe
r15
,20
34M
E30
8,21
3,69
1N
/APA
CI
2.2
FIX
3137
GA
ZR
1Se
ptem
ber
15,
2034
MG
308,
213,
691
N/A
PAC
I2.
25FI
X31
37G
AZ
S9
Sept
embe
r15
,20
34M
H30
8,21
3,69
1N
/APA
CI
2.3
FIX
3137
GA
ZT
7Se
ptem
ber
15,
2034
MI
431,
499,
167
N/A
NT
L(P
AC
I)4.
0FI
X/I
O31
37G
AZ
U4
Sept
embe
r15
,20
34M
J30
8,21
3,69
1N
/APA
CI
2.35
FIX
3137
GA
ZV
2Se
ptem
ber
15,
2034
MK
308,
213,
691
N/A
PAC
I2.
4FI
X31
37G
AZ
W0
Sept
embe
r15
,20
34PQ
308,
213,
691
N/A
PAC
I4.
0FI
X31
398Q
R2
5Se
ptem
ber
15,
2034
QC
308,
213,
691
N/A
PAC
I1.
4FI
X31
398Q
R7
4Se
ptem
ber
15,
2034
QD
308,
213,
691
N/A
PAC
I1.
45FI
X31
398Q
R8
2Se
ptem
ber
15,
2034
QE
308,
213,
691
N/A
PAC
I1.
5FI
X31
398Q
R9
0Se
ptem
ber
15,
2034
QG
308,
213,
691
N/A
PAC
I1.
55FI
X31
398Q
RA
7Se
ptem
ber
15,
2034
QH
308,
213,
691
N/A
PAC
I1.
6FI
X31
398Q
RB
5Se
ptem
ber
15,
2034
QJ
308,
213,
691
N/A
PAC
I1.
65FI
X31
398Q
RC
3Se
ptem
ber
15,
2034
QK
308,
213,
691
N/A
PAC
I1.
7FI
X31
398Q
RD
1Se
ptem
ber
15,
2034
QL
308,
213,
691
N/A
PAC
I1.
75FI
X31
398Q
RE
9Se
ptem
ber
15,
2034
QM
308,
213,
691
N/A
PAC
I1.
8FI
X31
398Q
RF
6Se
ptem
ber
15,
2034
QN
308,
213,
691
N/A
PAC
I1.
85FI
X31
398Q
RG
4Se
ptem
ber
15,
2034
QP
308,
213,
691
N/A
PAC
I1.
9FI
X31
398Q
RH
2Se
ptem
ber
15,
2034
QV
308,
213,
691
N/A
PAC
I1.
95FI
X31
398Q
RL
3Se
ptem
ber
15,
2034
QW
308,
213,
691
N/A
PAC
I2.
0FI
X31
398Q
RM
1Se
ptem
ber
15,
2034
QY
308,
213,
691
N/A
PAC
I2.
05FI
X31
398Q
RN
9Se
ptem
ber
15,
2034
I-9
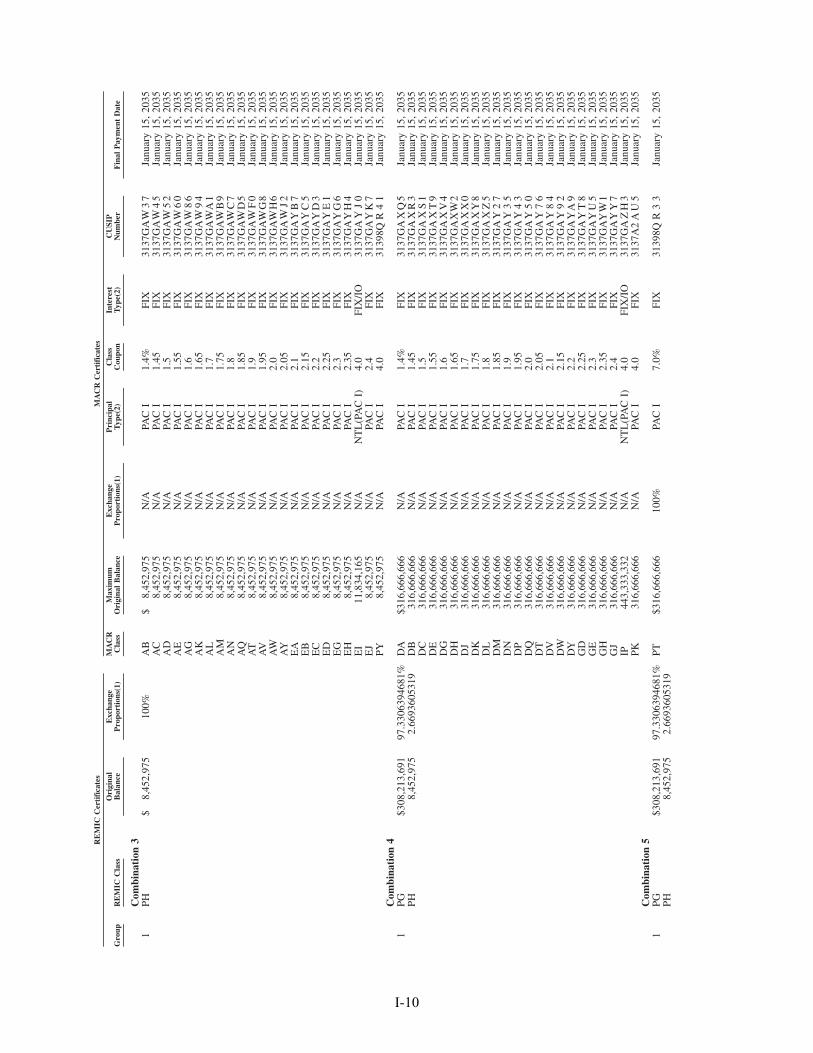
Gro
upR
EM
ICC
lass
Ori
gina
lB
alan
ceE
xcha
nge
Pro
port
ions
(1)
MA
CR
Cla
ssM
axim
umO
rigi
nal
Bal
ance
Exc
hang
eP
ropo
rtio
ns(1
)P
rinc
ipal
Typ
e(2)
Cla
ssC
oupo
nIn
tere
stT
ype(
2)C
USI
PN
umbe
rF
inal
Pay
men
tD
ate
RE
MIC
Cer
tifi
cate
sM
AC
RC
erti
fica
tes
Com
bina
tion
31
PH$
8,45
2,97
510
0%A
B$
8,45
2,97
5N
/APA
CI
1.4%
FIX
3137
GA
W3
7Ja
nuar
y15
,20
35A
C8,
452,
975
N/A
PAC
I1.
45FI
X31
37G
AW
45
Janu
ary
15,
2035
AD
8,45
2,97
5N
/APA
CI
1.5
FIX
3137
GA
W5
2Ja
nuar
y15
,20
35A
E8,
452,
975
N/A
PAC
I1.
55FI
X31
37G
AW
60
Janu
ary
15,
2035
AG
8,45
2,97
5N
/APA
CI
1.6
FIX
3137
GA
W8
6Ja
nuar
y15
,20
35A
K8,
452,
975
N/A
PAC
I1.
65FI
X31
37G
AW
94
Janu
ary
15,
2035
AL
8,45
2,97
5N
/APA
CI
1.7
FIX
3137
GA
WA
1Ja
nuar
y15
,20
35A
M8,
452,
975
N/A
PAC
I1.
75FI
X31
37G
AW
B9
Janu
ary
15,
2035
AN
8,45
2,97
5N
/APA
CI
1.8
FIX
3137
GA
WC
7Ja
nuar
y15
,20
35A
Q8,
452,
975
N/A
PAC
I1.
85FI
X31
37G
AW
D5
Janu
ary
15,
2035
AT
8,45
2,97
5N
/APA
CI
1.9
FIX
3137
GA
WF
0Ja
nuar
y15
,20
35A
V8,
452,
975
N/A
PAC
I1.
95FI
X31
37G
AW
G8
Janu
ary
15,
2035
AW
8,45
2,97
5N
/APA
CI
2.0
FIX
3137
GA
WH
6Ja
nuar
y15
,20
35A
Y8,
452,
975
N/A
PAC
I2.
05FI
X31
37G
AW
J2
Janu
ary
15,
2035
EA
8,45
2,97
5N
/APA
CI
2.1
FIX
3137
GA
YB
7Ja
nuar
y15
,20
35E
B8,
452,
975
N/A
PAC
I2.
15FI
X31
37G
AY
C5
Janu
ary
15,
2035
EC
8,45
2,97
5N
/APA
CI
2.2
FIX
3137
GA
YD
3Ja
nuar
y15
,20
35E
D8,
452,
975
N/A
PAC
I2.
25FI
X31
37G
AY
E1
Janu
ary
15,
2035
EG
8,45
2,97
5N
/APA
CI
2.3
FIX
3137
GA
YG
6Ja
nuar
y15
,20
35E
H8,
452,
975
N/A
PAC
I2.
35FI
X31
37G
AY
H4
Janu
ary
15,
2035
EI
11,8
34,1
65N
/AN
TL
(PA
CI)
4.0
FIX
/IO
3137
GA
YJ
0Ja
nuar
y15
,20
35E
J8,
452,
975
N/A
PAC
I2.
4FI
X31
37G
AY
K7
Janu
ary
15,
2035
PY8,
452,
975
N/A
PAC
I4.
0FI
X31
398Q
R4
1Ja
nuar
y15
,20
35C
ombi
nati
on4
1PG
$308
,213
,691
97.3
3063
9468
1%D
A$3
16,6
66,6
66N
/APA
CI
1.4%
FIX
3137
GA
XQ
5Ja
nuar
y15
,20
35PH
8,45
2,97
52.
6693
6053
19D
B31
6,66
6,66
6N
/APA
CI
1.45
FIX
3137
GA
XR
3Ja
nuar
y15
,20
35D
C31
6,66
6,66
6N
/APA
CI
1.5
FIX
3137
GA
XS
1Ja
nuar
y15
,20
35D
E31
6,66
6,66
6N
/APA
CI
1.55
FIX
3137
GA
XT
9Ja
nuar
y15
,20
35D
G31
6,66
6,66
6N
/APA
CI
1.6
FIX
3137
GA
XV
4Ja
nuar
y15
,20
35D
H31
6,66
6,66
6N
/APA
CI
1.65
FIX
3137
GA
XW
2Ja
nuar
y15
,20
35D
J31
6,66
6,66
6N
/APA
CI
1.7
FIX
3137
GA
XX
0Ja
nuar
y15
,20
35D
K31
6,66
6,66
6N
/APA
CI
1.75
FIX
3137
GA
XY
8Ja
nuar
y15
,20
35D
L31
6,66
6,66
6N
/APA
CI
1.8
FIX
3137
GA
XZ
5Ja
nuar
y15
,20
35D
M31
6,66
6,66
6N
/APA
CI
1.85
FIX
3137
GA
Y2
7Ja
nuar
y15
,20
35D
N31
6,66
6,66
6N
/APA
CI
1.9
FIX
3137
GA
Y3
5Ja
nuar
y15
,20
35D
P31
6,66
6,66
6N
/APA
CI
1.95
FIX
3137
GA
Y4
3Ja
nuar
y15
,20
35D
Q31
6,66
6,66
6N
/APA
CI
2.0
FIX
3137
GA
Y5
0Ja
nuar
y15
,20
35D
T31
6,66
6,66
6N
/APA
CI
2.05
FIX
3137
GA
Y7
6Ja
nuar
y15
,20
35D
V31
6,66
6,66
6N
/APA
CI
2.1
FIX
3137
GA
Y8
4Ja
nuar
y15
,20
35D
W31
6,66
6,66
6N
/APA
CI
2.15
FIX
3137
GA
Y9
2Ja
nuar
y15
,20
35D
Y31
6,66
6,66
6N
/APA
CI
2.2
FIX
3137
GA
YA
9Ja
nuar
y15
,20
35G
D31
6,66
6,66
6N
/APA
CI
2.25
FIX
3137
GA
YT
8Ja
nuar
y15
,20
35G
E31
6,66
6,66
6N
/APA
CI
2.3
FIX
3137
GA
YU
5Ja
nuar
y15
,20
35G
H31
6,66
6,66
6N
/APA
CI
2.35
FIX
3137
GA
YW
1Ja
nuar
y15
,20
35G
J31
6,66
6,66
6N
/APA
CI
2.4
FIX
3137
GA
YY
7Ja
nuar
y15
,20
35IP
443,
333,
332
N/A
NT
L(P
AC
I)4.
0FI
X/I
O31
37G
AZ
H3
Janu
ary
15,
2035
PK31
6,66
6,66
6N
/APA
CI
4.0
FIX
3137
A2
AU
5Ja
nuar
y15
,20
35C
ombi
nati
on5
1PG
$308
,213
,691
97.3
3063
9468
1%PT
$316
,666
,666
100%
PAC
I7.
0%FI
X31
398Q
R3
3Ja
nuar
y15
,20
35PH
8,45
2,97
52.
6693
6053
19
I-10
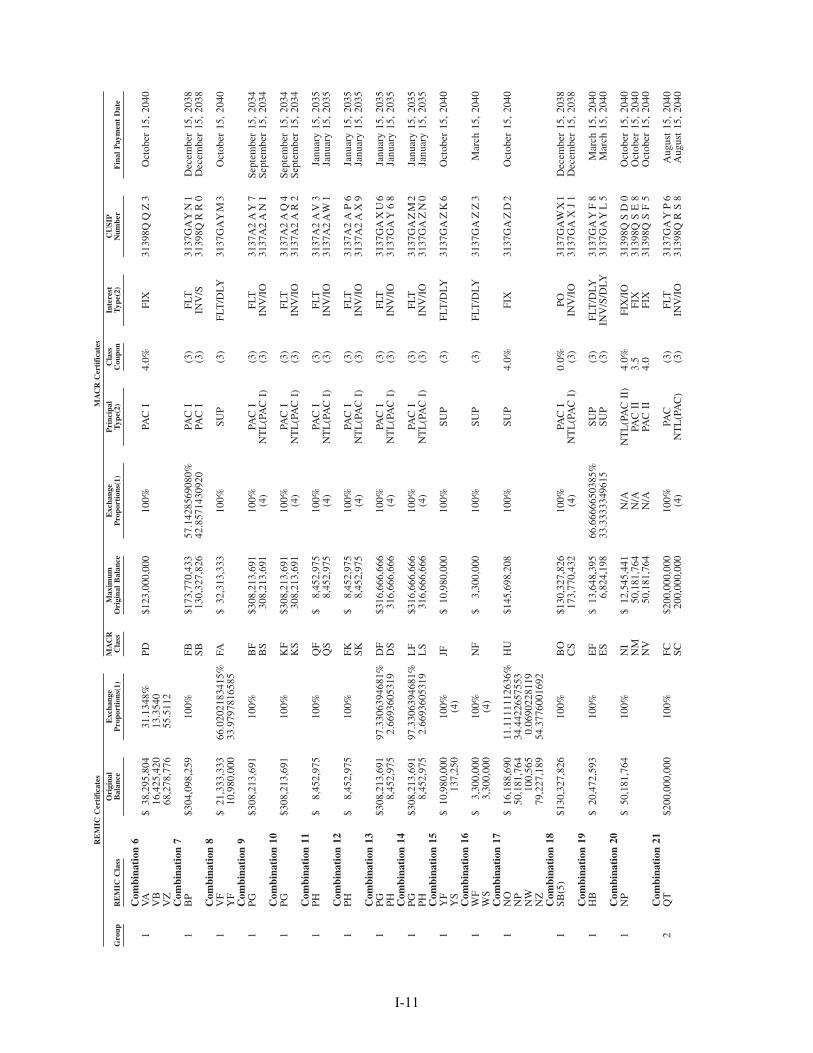
Gro
upR
EM
ICC
lass
Ori
gina
lB
alan
ceE
xcha
nge
Pro
port
ions
(1)
MA
CR
Cla
ssM
axim
umO
rigi
nal
Bal
ance
Exc
hang
eP
ropo
rtio
ns(1
)P
rinc
ipal
Typ
e(2)
Cla
ssC
oupo
nIn
tere
stT
ype(
2)C
USI
PN
umbe
rF
inal
Pay
men
tD
ate
RE
MIC
Cer
tifi
cate
sM
AC
RC
erti
fica
tes
Com
bina
tion
61
VA
$38
,295
,804
31.1
348%
PD$1
23,0
00,0
0010
0%PA
CI
4.0%
FIX
3139
8QQ
Z3
Oct
ober
15,
2040
VB
16,4
25,4
2013
.354
0V
Z68
,278
,776
55.5
112
Com
bina
tion
71
BP
$304
,098
,259
100%
FB$1
73,7
70,4
3357
.142
8569
080%
PAC
I(3
)FL
T31
37G
AY
N1
Dec
embe
r15
,20
38SB
130,
327,
826
42.8
5714
3092
0PA
CI
(3)
INV
/S31
398Q
RR
0D
ecem
ber
15,
2038
Com
bina
tion
81
VF
$21
,333
,333
66.0
2021
8341
5%FA
$32
,313
,333
100%
SUP
(3)
FLT
/DLY
3137
GA
YM
3O
ctob
er15
,20
40Y
F10
,980
,000
33.9
7978
1658
5C
ombi
nati
on9
1PG
$308
,213
,691
100%
BF
$308
,213
,691
100%
PAC
I(3
)FL
T31
37A
2A
Y7
Sept
embe
r15
,20
34B
S30
8,21
3,69
1(4
)N
TL
(PA
CI)
(3)
INV
/IO
3137
A2
AN
1Se
ptem
ber
15,
2034
Com
bina
tion
101
PG$3
08,2
13,6
9110
0%K
F$3
08,2
13,6
9110
0%PA
CI
(3)
FLT
3137
A2
AQ
4Se
ptem
ber
15,
2034
KS
308,
213,
691
(4)
NT
L(P
AC
I)(3
)IN
V/I
O31
37A
2A
R2
Sept
embe
r15
,20
34C
ombi
nati
on11
1PH
$8,
452,
975
100%
QF
$8,
452,
975
100%
PAC
I(3
)FL
T31
37A
2A
V3
Janu
ary
15,
2035
QS
8,45
2,97
5(4
)N
TL
(PA
CI)
(3)
INV
/IO
3137
A2
AW
1Ja
nuar
y15
,20
35C
ombi
nati
on12
1PH
$8,
452,
975
100%
FK$
8,45
2,97
510
0%PA
CI
(3)
FLT
3137
A2
AP
6Ja
nuar
y15
,20
35SK
8,45
2,97
5(4
)N
TL
(PA
CI)
(3)
INV
/IO
3137
A2
AX
9Ja
nuar
y15
,20
35C
ombi
nati
on13
1PG
$308
,213
,691
97.3
3063
9468
1%D
F$3
16,6
66,6
6610
0%PA
CI
(3)
FLT
3137
GA
XU
6Ja
nuar
y15
,20
35PH
8,45
2,97
52.
6693
6053
19D
S31
6,66
6,66
6(4
)N
TL
(PA
CI)
(3)
INV
/IO
3137
GA
Y6
8Ja
nuar
y15
,20
35C
ombi
nati
on14
1PG
$308
,213
,691
97.3
3063
9468
1%L
F$3
16,6
66,6
6610
0%PA
CI
(3)
FLT
3137
GA
ZM
2Ja
nuar
y15
,20
35PH
8,45
2,97
52.
6693
6053
19L
S31
6,66
6,66
6(4
)N
TL
(PA
CI)
(3)
INV
/IO
3137
GA
ZN
0Ja
nuar
y15
,20
35C
ombi
nati
on15
1Y
F$
10,9
80,0
0010
0%JF
$10
,980
,000
100%
SUP
(3)
FLT
/DLY
3137
GA
ZK
6O
ctob
er15
,20
40Y
S13
7,25
0(4
)C
ombi
nati
on16
1W
F$
3,30
0,00
010
0%N
F$
3,30
0,00
010
0%SU
P(3
)FL
T/D
LY31
37G
AZ
Z3
Mar
ch15
,20
40W
S3,
300,
000
(4)
Com
bina
tion
171
NO
$16
,188
,690
11.1
1111
1263
6%H
U$1
45,6
98,2
0810
0%SU
P4.
0%FI
X31
37G
AZ
D2
Oct
ober
15,
2040
NP
50,1
81,7
6434
.442
2657
553
NW
100,
565
0.06
9022
8119
NZ
79,2
27,1
8954
.377
6001
692
Com
bina
tion
181
SB(5
)$1
30,3
27,8
2610
0%B
O$1
30,3
27,8
2610
0%PA
CI
0.0%
PO31
37G
AW
X1
Dec
embe
r15
,20
38C
S17
3,77
0,43
2(4
)N
TL
(PA
CI)
(3)
INV
/IO
3137
GA
XJ
1D
ecem
ber
15,
2038
Com
bina
tion
191
HB
$20
,472
,593
100%
EF
$13
,648
,395
66.6
6666
5038
5%SU
P(3
)FL
T/D
LY31
37G
AY
F8
Mar
ch15
,20
40E
S6,
824,
198
33.3
3333
4961
5SU
P(3
)IN
V/S
/DLY
3137
GA
YL
5M
arch
15,
2040
Com
bina
tion
201
NP
$50
,181
,764
100%
NI
$12
,545
,441
N/A
NT
L(P
AC
II)
4.0%
FIX
/IO
3139
8QS
D0
Oct
ober
15,
2040
NM
50,1
81,7
64N
/APA
CII
3.5
FIX
3139
8QS
E8
Oct
ober
15,
2040
NV
50,1
81,7
64N
/APA
CII
4.0
FIX
3139
8QS
F5
Oct
ober
15,
2040
Com
bina
tion
212
QT
$200
,000
,000
100%
FC$2
00,0
00,0
0010
0%PA
C(3
)FL
T31
37G
AY
P6
Aug
ust
15,
2040
SC20
0,00
0,00
0(4
)N
TL
(PA
C)
(3)
INV
/IO
3139
8QR
S8
Aug
ust
15,
2040
I-11
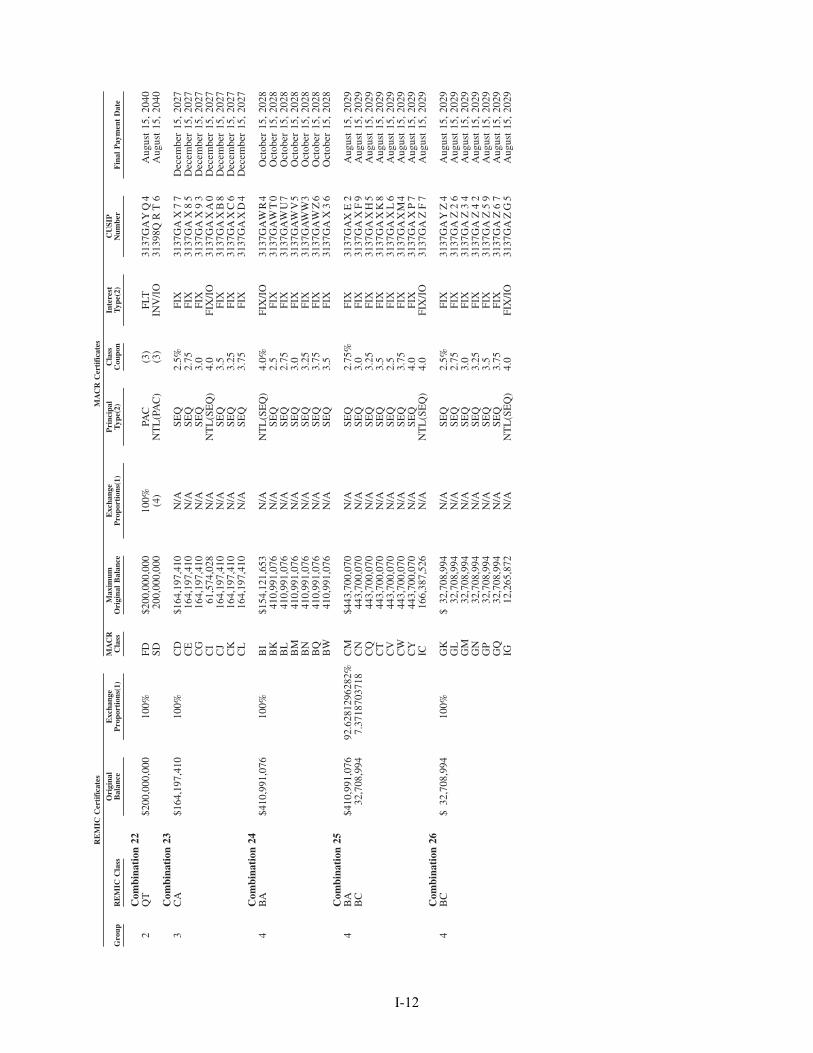
Gro
upR
EM
ICC
lass
Ori
gina
lB
alan
ceE
xcha
nge
Pro
port
ions
(1)
MA
CR
Cla
ssM
axim
umO
rigi
nal
Bal
ance
Exc
hang
eP
ropo
rtio
ns(1
)P
rinc
ipal
Typ
e(2)
Cla
ssC
oupo
nIn
tere
stT
ype(
2)C
USI
PN
umbe
rF
inal
Pay
men
tD
ate
RE
MIC
Cer
tifi
cate
sM
AC
RC
erti
fica
tes
Com
bina
tion
222
QT
$200
,000
,000
100%
FD$2
00,0
00,0
0010
0%PA
C(3
)FL
T31
37G
AY
Q4
Aug
ust
15,
2040
SD20
0,00
0,00
0(4
)N
TL
(PA
C)
(3)
INV
/IO
3139
8QR
T6
Aug
ust
15,
2040
Com
bina
tion
233
CA
$164
,197
,410
100%
CD
$164
,197
,410
N/A
SEQ
2.5%
FIX
3137
GA
X7
7D
ecem
ber
15,
2027
CE
164,
197,
410
N/A
SEQ
2.75
FIX
3137
GA
X8
5D
ecem
ber
15,
2027
CG
164,
197,
410
N/A
SEQ
3.0
FIX
3137
GA
X9
3D
ecem
ber
15,
2027
CI
61,5
74,0
28N
/AN
TL
(SE
Q)
4.0
FIX
/IO
3137
GA
XA
0D
ecem
ber
15,
2027
CJ
164,
197,
410
N/A
SEQ
3.5
FIX
3137
GA
XB
8D
ecem
ber
15,
2027
CK
164,
197,
410
N/A
SEQ
3.25
FIX
3137
GA
XC
6D
ecem
ber
15,
2027
CL
164,
197,
410
N/A
SEQ
3.75
FIX
3137
GA
XD
4D
ecem
ber
15,
2027
Com
bina
tion
244
BA
$410
,991
,076
100%
BI
$154
,121
,653
N/A
NT
L(S
EQ
)4.
0%FI
X/I
O31
37G
AW
R4
Oct
ober
15,
2028
BK
410,
991,
076
N/A
SEQ
2.5
FIX
3137
GA
WT
0O
ctob
er15
,20
28B
L41
0,99
1,07
6N
/ASE
Q2.
75FI
X31
37G
AW
U7
Oct
ober
15,
2028
BM
410,
991,
076
N/A
SEQ
3.0
FIX
3137
GA
WV
5O
ctob
er15
,20
28B
N41
0,99
1,07
6N
/ASE
Q3.
25FI
X31
37G
AW
W3
Oct
ober
15,
2028
BQ
410,
991,
076
N/A
SEQ
3.75
FIX
3137
GA
WZ
6O
ctob
er15
,20
28B
W41
0,99
1,07
6N
/ASE
Q3.
5FI
X31
37G
AX
36
Oct
ober
15,
2028
Com
bina
tion
254
BA
$410
,991
,076
92.6
2812
9628
2%C
M$4
43,7
00,0
70N
/ASE
Q2.
75%
FIX
3137
GA
XE
2A
ugus
t15
,20
29B
C32
,708
,994
7.37
1870
3718
CN
443,
700,
070
N/A
SEQ
3.0
FIX
3137
GA
XF
9A
ugus
t15
,20
29C
Q44
3,70
0,07
0N
/ASE
Q3.
25FI
X31
37G
AX
H5
Aug
ust
15,
2029
CT
443,
700,
070
N/A
SEQ
3.5
FIX
3137
GA
XK
8A
ugus
t15
,20
29C
V44
3,70
0,07
0N
/ASE
Q2.
5FI
X31
37G
AX
L6
Aug
ust
15,
2029
CW
443,
700,
070
N/A
SEQ
3.75
FIX
3137
GA
XM
4A
ugus
t15
,20
29C
Y44
3,70
0,07
0N
/ASE
Q4.
0FI
X31
37G
AX
P7
Aug
ust
15,
2029
IC16
6,38
7,52
6N
/AN
TL
(SE
Q)
4.0
FIX
/IO
3137
GA
ZF
7A
ugus
t15
,20
29C
ombi
nati
on26
4B
C$
32,7
08,9
9410
0%G
K$
32,7
08,9
94N
/ASE
Q2.
5%FI
X31
37G
AY
Z4
Aug
ust
15,
2029
GL
32,7
08,9
94N
/ASE
Q2.
75FI
X31
37G
AZ
26
Aug
ust
15,
2029
GM
32,7
08,9
94N
/ASE
Q3.
0FI
X31
37G
AZ
34
Aug
ust
15,
2029
GN
32,7
08,9
94N
/ASE
Q3.
25FI
X31
37G
AZ
42
Aug
ust
15,
2029
GP
32,7
08,9
94N
/ASE
Q3.
5FI
X31
37G
AZ
59
Aug
ust
15,
2029
GQ
32,7
08,9
94N
/ASE
Q3.
75FI
X31
37G
AZ
67
Aug
ust
15,
2029
IG12
,265
,872
N/A
NT
L(S
EQ
)4.
0FI
X/I
O31
37G
AZ
G5
Aug
ust
15,
2029
I-12
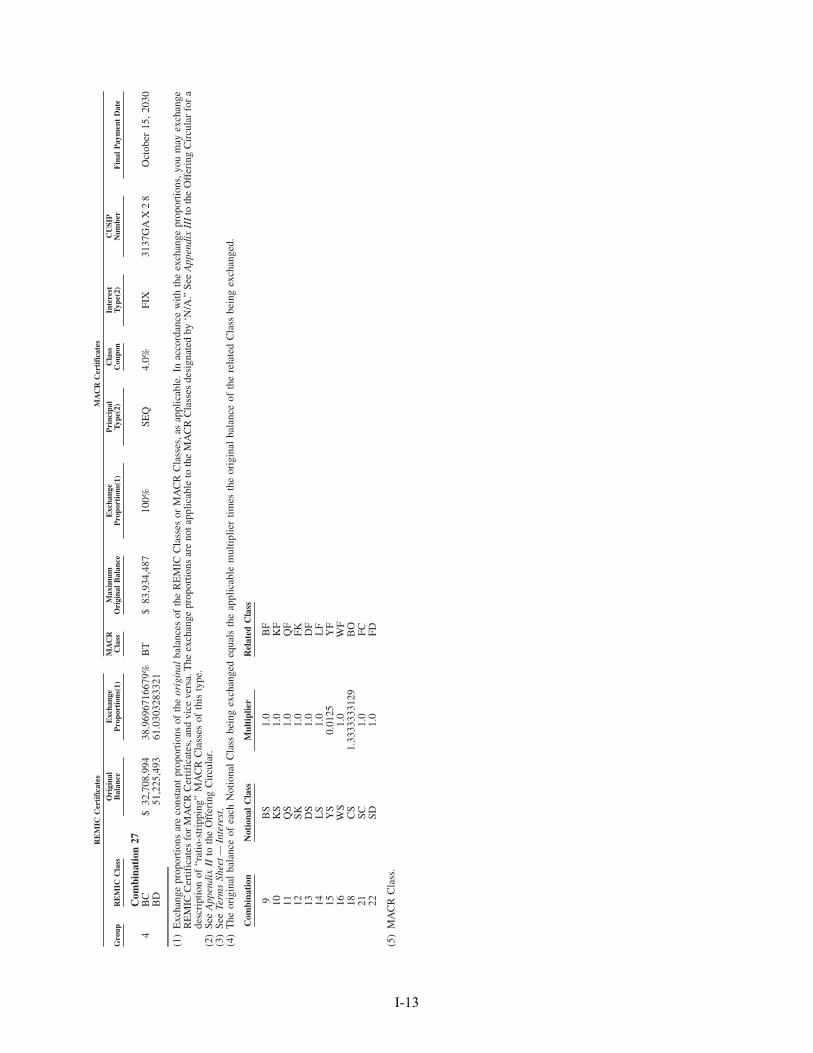
Gro
upR
EM
ICC
lass
Ori
gina
lB
alan
ceE
xcha
nge
Pro
port
ions
(1)
MA
CR
Cla
ssM
axim
umO
rigi
nal
Bal
ance
Exc
hang
eP
ropo
rtio
ns(1
)P
rinc
ipal
Typ
e(2)
Cla
ssC
oupo
nIn
tere
stT
ype(
2)C
USI
PN
umbe
rF
inal
Pay
men
tD
ate
RE
MIC
Cer
tifi
cate
sM
AC
RC
erti
fica
tes
Com
bina
tion
274
BC
$32
,708
,994
38.9
6967
1667
9%B
T$
83,9
34,4
8710
0%SE
Q4.
0%FI
X31
37G
AX
28
Oct
ober
15,
2030
BD
51,2
25,4
9361
.030
3283
321
(1)
Exc
hang
epr
opor
tions
are
cons
tant
prop
ortio
nsof
the
orig
inal
bala
nces
ofth
eR
EM
ICC
lass
esor
MA
CR
Cla
sses
,as
appl
icab
le.
Inac
cord
ance
with
the
exch
ange
prop
ortio
ns,y
oum
ayex
chan
geR
EM
ICC
ertif
icat
esfo
rM
AC
RC
ertif
icat
es,a
ndvi
ceve
rsa.
The
exch
ange
prop
ortio
nsar
eno
tapp
licab
leto
the
MA
CR
Cla
sses
desi
gnat
edby
‘N/A
.”Se
eA
ppen
dix
III
toth
eO
ffer
ing
Cir
cula
rfo
ra
desc
ript
ion
of“r
atio
-str
ippi
ng”
MA
CR
Cla
sses
ofth
isty
pe.
(2)
See
App
endi
xII
toth
eO
ffer
ing
Cir
cula
r.(3
)Se
eTe
rms
Shee
t—In
tere
st.
(4)
The
orig
inal
bala
nce
ofea
chN
otio
nal
Cla
ssbe
ing
exch
ange
deq
uals
the
appl
icab
lem
ultip
lier
times
the
orig
inal
bala
nce
ofth
ere
late
dC
lass
bein
gex
chan
ged.
Com
bina
tion
Not
iona
lC
lass
Mul
tipl
ier
Rel
ated
Cla
ss
9B
S1.
0B
F10
KS
1.0
KF
11Q
S1.
0Q
F12
SK1.
0FK
13D
S1.
0D
F14
LS
1.0
LF
15Y
S0.
0125
YF
16W
S1.
0W
F18
CS
1.33
3333
3129
BO
21SC
1.0
FC22
SD1.
0FD
(5)
MA
CR
Cla
ss.
I-13
Offering Circular Supplement(To Offering Circular
Dated June 1, 2010)
$2,215,830,471
Freddie MacMulticlass Certificates, Series 3751
Offered Classes: REMIC Classes shown below and MACR Classes shown on Appendix A
Offering Terms: The underwriter named below is offering the Classes in negotiated transactions at varying prices; wehave agreed to purchase all of AM
Closing Date: November 30, 2010
REMICClasses
OriginalBalance
PrincipalType(1)
ClassCoupon
InterestType(1)
CUSIPNumber
Final PaymentDate
Group 1AO . . . . $ 4,590,081 PT 0.0% PO 3137A3GK9 November 15, 2040FA . . . . 55,080,967 PT (2) FLT 3137A3 H 2 8 November 15, 2040SA . . . . 55,080,967 NTL(PT) (2) INV/IO 3137A3 J 3 4 November 15, 2040
Group 2FB . . . . 257,692,765 PAC (2) FLT 3137A3 H 3 6 May 15, 2039PB . . . . 229,060,235 PAC 2.25 FIX 3137A3HX0 May 15, 2039PE . . . . 62,597,000 PAC 4.5 FIX 3137A3HY8 November 15, 2040SB . . . . 257,692,765 NTL(PAC) (2) INV/IO 3137A3 J 4 2 May 15, 2039ZA . . . . 95,699,328 SUP 4.5 FIX/Z 3137A3 J Q 3 November 15, 2040
Group 3LA . . . . 50,000,000 SEQ 3.5 FIX 3137A3 H P 7 April 15, 2025LU . . . . 3,200,000 SEQ 3.5 FIX 3137A3HR3 November 15, 2025
Group 4AA . . . . 4,400,000 SUP/RTL 4.0 FIX 3137A3GH6 November 15, 2039DD . . . . 8,970,000 SUP/RTL 4.0 FIX 3137A3GY9 June 15, 2040HH . . . . 2,418,000 SUP/RTL 4.0 FIX 3137A3HC6 November 15, 2040MC . . . . 81,184,000 PAC 4.0 FIX 3137A3 H S 1 July 15, 2037MD . . . . 42,995,000 PAC 4.0 FIX 3137A3HT9 January 15, 2039ME . . . . 57,454,000 PAC 4.0 FIX 3137A3HU6 November 15, 2040MI . . . . 127,499,000 NTL(PAC) 4.0 FIX/IO 3137A3HV4 February 15, 2034MP . . . . 254,998,000 PAC 2.0 FIX 3137A3HW2 February 15, 2034WA . . . . 20,555,000 SUP 4.0 FIX 3137A3 J H 3 November 15, 2039WB . . . . 5,889,000 SUP 4.0 FIX 3137A3 J J 9 January 15, 2040WC . . . . 6,460,000 SUP 4.0 FIX 3137A3 J K 6 March 15, 2040WD . . . . 40,000 SUP 4.0 FIX 3137A3 J L 4 June 15, 2040WG . . . . 6,013,000 SUP 4.0 FIX 3137A3 J M 2 October 15, 2040WH . . . . 3,492,000 SUP 4.0 FIX 3137A3 J N 0 November 15, 2040WW. . . . 5,132,000 SUP/RTL 4.0 FIX 3137A3 J P 5 August 15, 2040
Group 5HA . . . . 90,000,000 SEQ 3.5 FIX 3137A3 H 6 9 November 15, 2024HB . . . . 10,000,000 SEQ 3.5 FIX 3137A3 H 7 7 November 15, 2025
REMICClasses
OriginalBalance
PrincipalType(1)
ClassCoupon
InterestType(1)
CUSIPNumber
Final PaymentDate
Group 6AM . . . . $542,911,000 PAC I 4.0% FIX 3137A3 G J 2 November 15, 2040BB . . . . 4,500,000 SUP/RTL 4.0 FIX 3137A3GM5 April 15, 2040CC . . . . 2,000,000 SUP/RTL 4.0 FIX 3137A3GQ6 April 15, 2040EE . . . . 1,231,000 SUP/RTL 4.0 FIX 3137A3GZ6 August 15, 2040GG . . . . 4,000,000 PAC II/RTL 4.0 FIX 3137A3 H 5 1 July 15, 2040JA . . . . 34,414,000 PAC II 4.0 FIX 3137A3HG7 April 15, 2040JB . . . . 2,929,000 PAC II 4.0 FIX 3137A3HH5 May 15, 2040JC . . . . 5,044,000 PAC II 4.0 FIX 3137A3 H J 1 July 15, 2040JD . . . . 2,925,000 PAC II 4.0 FIX 3137A3HK8 September 15, 2040JE . . . . 4,244,000 PAC II 4.0 FIX 3137A3HL6 November 15, 2040JJ . . . . 1,060,000 PAC II/RTL 4.0 FIX 3137A3HM4 April 15, 2040KK . . . . 4,000,000 PAC II/RTL 4.0 FIX 3137A3HN2 September 15, 2040LL . . . . 4,000,000 PAC II/RTL 4.0 FIX 3137A3HQ5 November 15, 2040UA . . . . 45,220,000 SUP 4.0 FIX 3137A3 J 6 7 February 15, 2040UB . . . . 3,982,000 SUP 4.0 FIX 3137A3 J 7 5 April 15, 2040UC . . . . 2,283,000 SUP 4.0 FIX 3137A3 J 8 3 April 15, 2040UD . . . . 8,076,000 SUP 4.0 FIX 3137A3 J 9 1 June 15, 2040UE . . . . 4,400,000 SUP 4.0 FIX 3137A3 J A 8 August 15, 2040UF . . . . 10,700,000 SUP (2) FLT/DLY 3137A3 J B 6 February 15, 2040UG . . . . 6,058,000 SUP 4.0 FIX 3137A3 J C 4 September 15, 2040UH . . . . 7,570,000 SUP 4.0 FIX 3137A3 J D 2 October 15, 2040UJ . . . . 5,041,000 SUP 4.0 FIX 3137A3 J E 0 November 15, 2040US . . . . 5,350,000 SUP (2) INV/S/DLY 3137A3 J F 7 February 15, 2040UU . . . . 38,062,000 SUP/RTL 4.0 FIX 3137A3 J G 5 February 15, 2040
Group 7FG . . . . 7,910,095 PT (2) FLT 3137A3 H 4 4 November 15, 2050SG . . . . 7,910,095 NTL(PT) (2) INV/IO 3137A3 J 5 9 November 15, 2050
Group 8A . . . . 79,914,000 SEQ 4.0 FIX 3137A3GG8 June 15, 2028B . . . . 20,086,000 SEQ 4.0 FIX 3137A3GL7 November 15, 2030
ResidualR . . . . 0 NPR 0.0 NPR 3137A3HZ5 November 15, 2050RS . . . . 0 NPR 0.0 NPR 3137A3 J 2 6 November 15, 2050
(1) See Appendix II to the Offering Circular.(2) See Terms Sheet — Interest.
The Certificates may not be suitable investments for you. You should not purchase Certificates unless you have carefullyconsidered and are able to bear the associated prepayment, interest rate, yield and market risks of investing in them.Certain Risk Considerations on page S-2 highlights some of these risks.
You should purchase Certificates only if you have read and understood this Supplement, the attached Offering Circularand the documents identified under Available Information.
We guarantee principal and interest payments on the Certificates. These payments are not guaranteed by, and are not debtsor obligations of, the United States or any federal agency or instrumentality other than Freddie Mac. The Certificates arenot tax-exempt. Because of applicable securities law exemptions, we have not registered the Certificates with any federalor state securities commission. No securities commission has reviewed this Supplement.
Barclays Capital
October 14, 2010
Exhibit II — Series 3751 Front Cover, Terms Sheet and MACR Table
II-1
TERMS SHEET
This Terms Sheet contains selected information about this Series. You should refer to theremainder of this Supplement for further information.
In this Supplement, we refer to Classes only by their letter designations. For example, “R” refers tothe R Class of this Series.
Payment Dates
We make payments of principal and interest on the Certificates on each monthly Payment Datebeginning in December 2010.
Form of Classes
Regular (non-Retail) and MACR Classes: Book-entry on Fed System
Retail Classes: Book-entry on DTC System; issued and paid in $1,000 Retail Class Units
Residual Classes: Certificated
Interest
The Fixed Rate Classes bear interest at the Class Coupons shown on the front cover and Appendix A.
AO is a Principal Only Class and does not bear interest.
The Floating Rate and Inverse Floating Rate Classes bear interest as shown in the following table.The initial Class Coupons apply only to the first Accrual Period. We determine LIBOR using the BBAMethod.
ClassInitial Class
Coupon Class Coupon Formula Minimum Rate Maximum RateClass Coupon Subject to
Group 1FA. . . . . . . . . . . . . . . . . . . . . 0.707% LIBOR + 0.45% 0.45% 6.5%SA . . . . . . . . . . . . . . . . . . . . 5.793 6.05% � LIBOR 0 6.05Group 2FB. . . . . . . . . . . . . . . . . . . . . 0.72 LIBOR + 0.46% 0.46 6.5SB. . . . . . . . . . . . . . . . . . . . . 5.78 6.04% � LIBOR 0 6.04Group 6UF* . . . . . . . . . . . . . . . . . . . 1.25 LIBOR + 1.0% 1.0 6.0US* . . . . . . . . . . . . . . . . . . . 9.5 10.0% � (LIBOR � 2.0) 0 10.0Group 7FG . . . . . . . . . . . . . . . . . . . . 0.76 LIBOR + 0.5% 0.5 6.5SG . . . . . . . . . . . . . . . . . . . . 5.74 6.0% � LIBOR 0 6.0
* Delay Class.
See Appendix V to the Offering Circular and Payments — Interest.
II-2
Notional Classes
ClassOriginal NotionalPrincipal Amount Reduces Proportionately With
Group 1SA $ 55,080,967 FA (PT)
Group 2SB $257,692,765 FB (PAC)
Group 4MI $127,499,000 MP (PAC)
Group 5HI* $ 38,571,428 HA (SEQ)
Group 7SG $ 7,910,095 FG (PT)
Group 8CI* $ 39,957,000 A (SEQ)
* MACR Class.
See Payments — Interest — Notional Classes.
MACR Classes
This Series includes MACR Classes. Appendix A shows the characteristics of the MACR Classesand the Combinations of REMIC and MACR Classes.
See Appendix III to the Offering Circular for a description of MACR Certificates and exchangeprocedures and fees.
Principal
REMIC Classes
On each Payment Date, we pay:
Group 1
• The Group 1 Asset Principal Amount to AO and FA, pro rata, until retiredPass-Through
Group 2
• The Accrual Amount and the Group 2 Asset Principal Amount in the following order ofpriority:
1. To the PAC Classes, until reduced to their Aggregate Targeted Balance, allocated asfollows:
a. To FB and PB, pro rata, while outstanding
b. To PE, while outstanding
PAC
2. To ZA, until retiredSupport
3. To the PAC Classes, as described in step 1 above, but without regard to their AggregateTargeted Balance, until retiredPAC
Notional Classes
ClassOriginal NotionalPrincipal Amount Reduces Proportionately With
Group 1SA $ 55,080,967 FA (PT)
Group 2SB $257,692,765 FB (PAC)
Group 4MI $127,499,000 MP (PAC)
Group 5HI* $ 38,571,428 HA (SEQ)
Group 7SG $ 7,910,095 FG (PT)
Group 8CI* $ 39,957,000 A (SEQ)
* MACR Class.
See Payments — Interest — Notional Classes.
MACR Classes
This Series includes MACR Classes. Appendix A shows the characteristics of the MACR Classesand the Combinations of REMIC and MACR Classes.
See Appendix III to the Offering Circular for a description of MACR Certificates and exchangeprocedures and fees.
Principal
REMIC Classes
On each Payment Date, we pay:
Group 1
• The Group 1 Asset Principal Amount to AO and FA, pro rata, until retired�����
Pass-Through
Group 2
• The Accrual Amount and the Group 2 Asset Principal Amount in the following order ofpriority:
1. To the PAC Classes, until reduced to their Aggregate Targeted Balance, allocated asfollows:
a. To FB and PB, pro rata, while outstanding
b. To PE, while outstanding
�������������������������������
PAC
2. To ZA, until retired�����Support
3. To the PAC Classes, as described in step 1 above, but without regard to their AggregateTargeted Balance, until retired
�����������
PAC
II-3
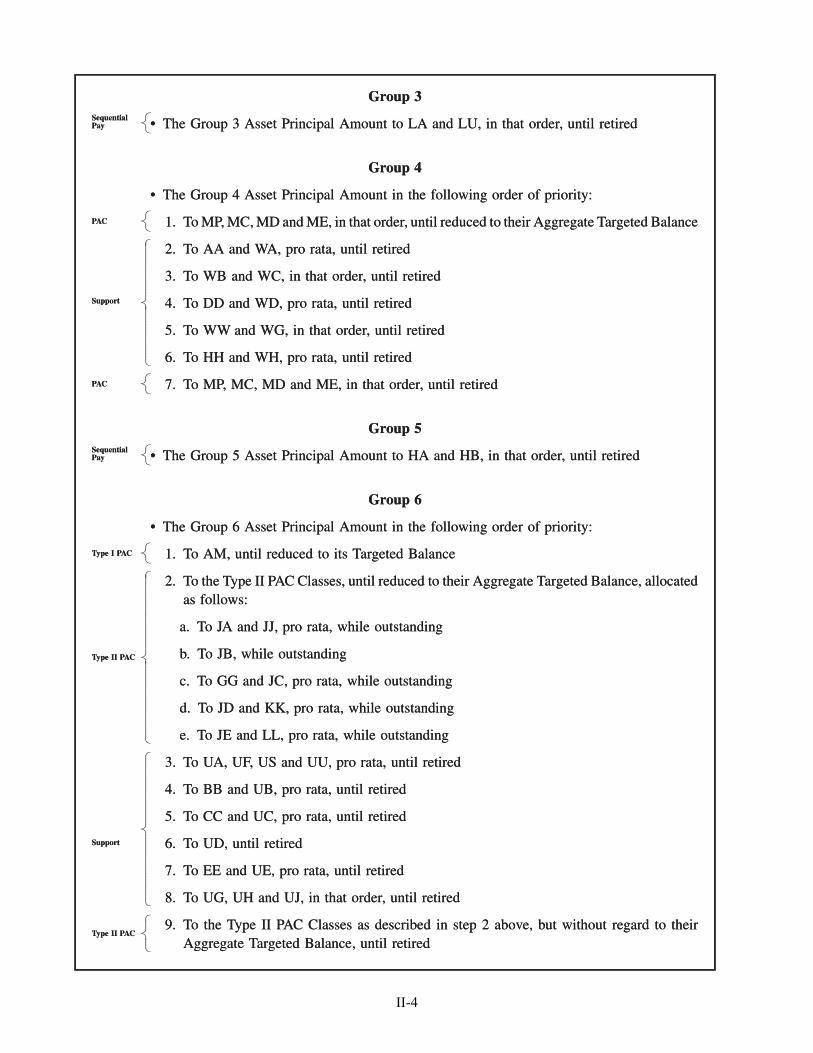
Group 3
• The Group 3 Asset Principal Amount to LA and LU, in that order, until retiredSequentialPay
Group 4
• The Group 4 Asset Principal Amount in the following order of priority:
1. To MP, MC, MD and ME, in that order, until reduced to their Aggregate Targeted BalancePAC
2. To AA and WA, pro rata, until retired
3. To WB and WC, in that order, until retired
4. To DD and WD, pro rata, until retired
5. To WW and WG, in that order, until retired
6. To HH and WH, pro rata, until retired
Support
7. To MP, MC, MD and ME, in that order, until retiredPAC
Group 5
• The Group 5 Asset Principal Amount to HA and HB, in that order, until retiredSequentialPay
Group 6
• The Group 6 Asset Principal Amount in the following order of priority:
1. To AM, until reduced to its Targeted BalanceType I PAC
2. To the Type II PAC Classes, until reduced to their Aggregate Targeted Balance, allocatedas follows:
a. To JA and JJ, pro rata, while outstanding
b. To JB, while outstanding
c. To GG and JC, pro rata, while outstanding
d. To JD and KK, pro rata, while outstanding
e. To JE and LL, pro rata, while outstanding
Type II PAC
3. To UA, UF, US and UU, pro rata, until retired
4. To BB and UB, pro rata, until retired
5. To CC and UC, pro rata, until retired
6. To UD, until retired
7. To EE and UE, pro rata, until retired
8. To UG, UH and UJ, in that order, until retired
Support
9. To the Type II PAC Classes as described in step 2 above, but without regard to theirAggregate Targeted Balance, until retired
Type II PAC
Group 3
• The Group 3 Asset Principal Amount to LA and LU, in that order, until retired�����
SequentialPay
Group 4
• The Group 4 Asset Principal Amount in the following order of priority:
1. To MP, MC, MD and ME, in that order, until reduced to their Aggregate Targeted Balance�����PAC
2. To AA and WA, pro rata, until retired
3. To WB and WC, in that order, until retired
4. To DD and WD, pro rata, until retired
5. To WW and WG, in that order, until retired
6. To HH and WH, pro rata, until retired
�������������������������������������������
Support
7. To MP, MC, MD and ME, in that order, until retired�����PAC
Group 5
• The Group 5 Asset Principal Amount to HA and HB, in that order, until retired�����
SequentialPay
Group 6
• The Group 6 Asset Principal Amount in the following order of priority:
1. To AM, until reduced to its Targeted Balance�����Type I PAC
2. To the Type II PAC Classes, until reduced to their Aggregate Targeted Balance, allocatedas follows:
a. To JA and JJ, pro rata, while outstanding
b. To JB, while outstanding
c. To GG and JC, pro rata, while outstanding
d. To JD and KK, pro rata, while outstanding
e. To JE and LL, pro rata, while outstanding
�����������������������������������������������������������
Type II PAC
3. To UA, UF, US and UU, pro rata, until retired
4. To BB and UB, pro rata, until retired
5. To CC and UC, pro rata, until retired
6. To UD, until retired
7. To EE and UE, pro rata, until retired
8. To UG, UH and UJ, in that order, until retired
���������������������������������������������������
Support
9. To the Type II PAC Classes as described in step 2 above, but without regard to theirAggregate Targeted Balance, until retired
�����������
Type II PAC
II-4
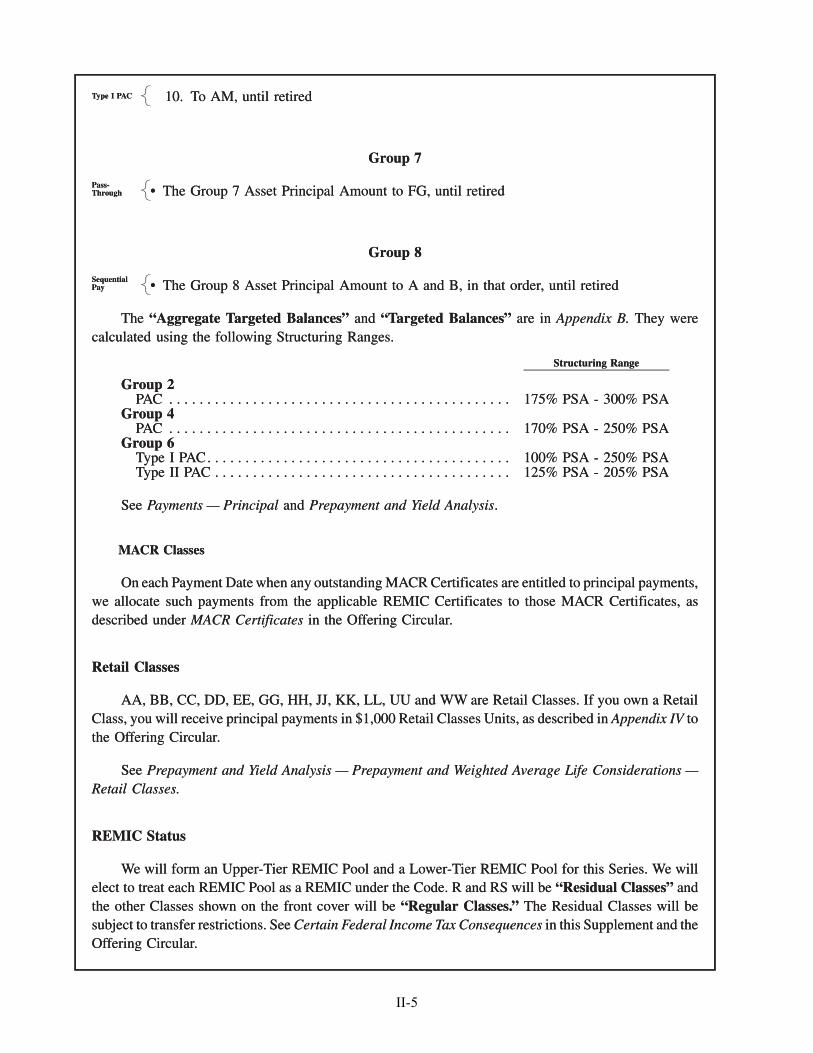
10. To AM, until retiredType I PAC
Group 7
• The Group 7 Asset Principal Amount to FG, until retiredPass-Through
Group 8
• The Group 8 Asset Principal Amount to A and B, in that order, until retiredSequentialPay
The “Aggregate Targeted Balances” and “Targeted Balances” are in Appendix B. They werecalculated using the following Structuring Ranges.
Structuring Range
Group 2PAC . . . . . . . . . . . . . . . . . . . . . . . . . . . . . . . . . . . . . . . . . . . . . 175% PSA - 300% PSA
Group 4PAC . . . . . . . . . . . . . . . . . . . . . . . . . . . . . . . . . . . . . . . . . . . . . 170% PSA - 250% PSA
Group 6Type I PAC. . . . . . . . . . . . . . . . . . . . . . . . . . . . . . . . . . . . . . . . 100% PSA - 250% PSAType II PAC . . . . . . . . . . . . . . . . . . . . . . . . . . . . . . . . . . . . . . . 125% PSA - 205% PSA
See Payments — Principal and Prepayment and Yield Analysis.
MACR Classes
On each Payment Date when any outstanding MACR Certificates are entitled to principal payments,we allocate such payments from the applicable REMIC Certificates to those MACR Certificates, asdescribed under MACR Certificates in the Offering Circular.
Retail Classes
AA, BB, CC, DD, EE, GG, HH, JJ, KK, LL, UU and WW are Retail Classes. If you own a RetailClass, you will receive principal payments in $1,000 Retail Classes Units, as described in Appendix IV tothe Offering Circular.
See Prepayment and Yield Analysis — Prepayment and Weighted Average Life Considerations —Retail Classes.
REMIC Status
We will form an Upper-Tier REMIC Pool and a Lower-Tier REMIC Pool for this Series. We willelect to treat each REMIC Pool as a REMIC under the Code. R and RS will be “Residual Classes” andthe other Classes shown on the front cover will be “Regular Classes.” The Residual Classes will besubject to transfer restrictions. See Certain Federal Income Tax Consequences in this Supplement and theOffering Circular.
10. To AM, until retired�����Type I PAC
Group 7
• The Group 7 Asset Principal Amount to FG, until retired�����
Pass-Through
Group 8
• The Group 8 Asset Principal Amount to A and B, in that order, until retired�����
SequentialPay
The “Aggregate Targeted Balances” and “Targeted Balances” are in Appendix B. They werecalculated using the following Structuring Ranges.
Structuring Range
Group 2PAC . . . . . . . . . . . . . . . . . . . . . . . . . . . . . . . . . . . . . . . . . . . . . 175% PSA - 300% PSA
Group 4PAC . . . . . . . . . . . . . . . . . . . . . . . . . . . . . . . . . . . . . . . . . . . . . 170% PSA - 250% PSA
Group 6Type I PAC. . . . . . . . . . . . . . . . . . . . . . . . . . . . . . . . . . . . . . . . 100% PSA - 250% PSAType II PAC . . . . . . . . . . . . . . . . . . . . . . . . . . . . . . . . . . . . . . . 125% PSA - 205% PSA
See Payments — Principal and Prepayment and Yield Analysis.
MACR Classes
On each Payment Date when any outstanding MACR Certificates are entitled to principal payments,we allocate such payments from the applicable REMIC Certificates to those MACR Certificates, asdescribed under MACR Certificates in the Offering Circular.
Retail Classes
AA, BB, CC, DD, EE, GG, HH, JJ, KK, LL, UU and WW are Retail Classes. If you own a RetailClass, you will receive principal payments in $1,000 Retail Classes Units, as described in Appendix IV tothe Offering Circular.
See Prepayment and Yield Analysis — Prepayment and Weighted Average Life Considerations —Retail Classes.
REMIC Status
We will form an Upper-Tier REMIC Pool and a Lower-Tier REMIC Pool for this Series. We willelect to treat each REMIC Pool as a REMIC under the Code. R and RS will be “Residual Classes” andthe other Classes shown on the front cover will be “Regular Classes.” The Residual Classes will besubject to transfer restrictions. See Certain Federal Income Tax Consequences in this Supplement and theOffering Circular.
II-5
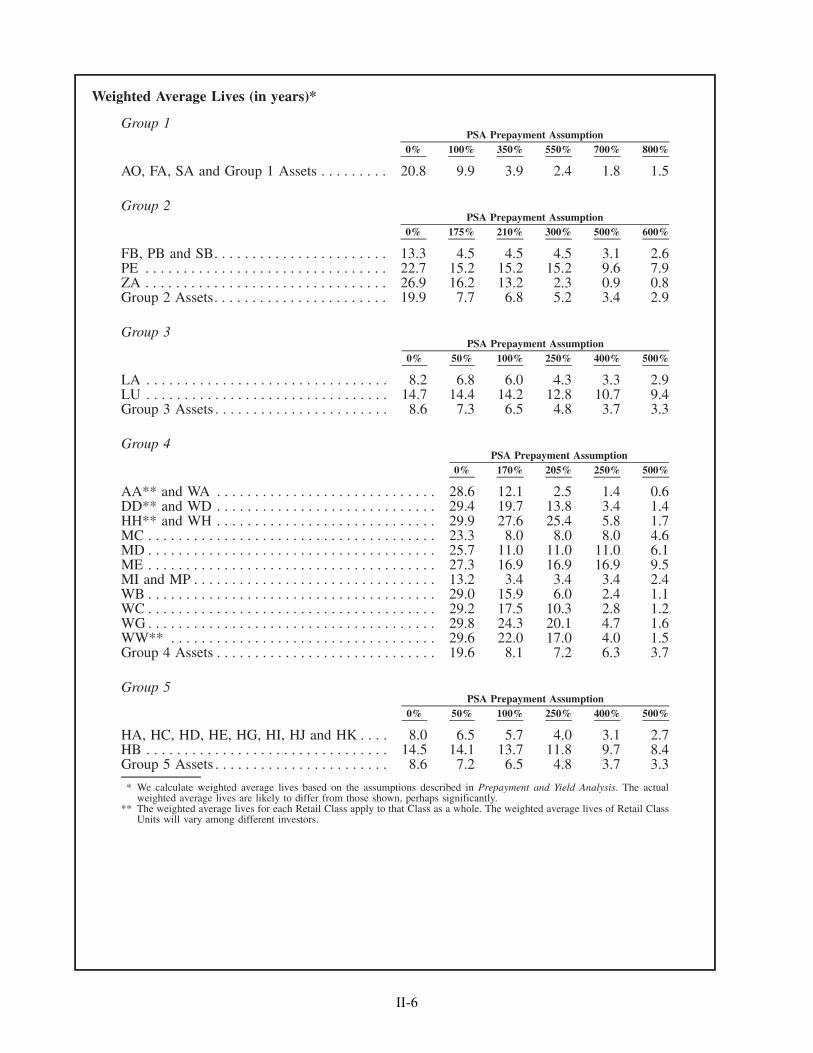
Weighted Average Lives (in years)*
Group 1
0% 100% 350% 550% 700% 800%PSA Prepayment Assumption
AO, FA, SA and Group 1 Assets . . . . . . . . . 20.8 9.9 3.9 2.4 1.8 1.5
Group 2
0% 175% 210% 300% 500% 600%PSA Prepayment Assumption
FB, PB and SB. . . . . . . . . . . . . . . . . . . . . . . 13.3 4.5 4.5 4.5 3.1 2.6PE . . . . . . . . . . . . . . . . . . . . . . . . . . . . . . . . 22.7 15.2 15.2 15.2 9.6 7.9ZA . . . . . . . . . . . . . . . . . . . . . . . . . . . . . . . . 26.9 16.2 13.2 2.3 0.9 0.8Group 2 Assets. . . . . . . . . . . . . . . . . . . . . . . 19.9 7.7 6.8 5.2 3.4 2.9
Group 3
0% 50% 100% 250% 400% 500%PSA Prepayment Assumption
LA . . . . . . . . . . . . . . . . . . . . . . . . . . . . . . . . 8.2 6.8 6.0 4.3 3.3 2.9LU . . . . . . . . . . . . . . . . . . . . . . . . . . . . . . . . 14.7 14.4 14.2 12.8 10.7 9.4Group 3 Assets . . . . . . . . . . . . . . . . . . . . . . . 8.6 7.3 6.5 4.8 3.7 3.3
Group 4
0% 170% 205% 250% 500%PSA Prepayment Assumption
AA** and WA . . . . . . . . . . . . . . . . . . . . . . . . . . . . . 28.6 12.1 2.5 1.4 0.6DD** and WD . . . . . . . . . . . . . . . . . . . . . . . . . . . . . 29.4 19.7 13.8 3.4 1.4HH** and WH . . . . . . . . . . . . . . . . . . . . . . . . . . . . . 29.9 27.6 25.4 5.8 1.7MC . . . . . . . . . . . . . . . . . . . . . . . . . . . . . . . . . . . . . . 23.3 8.0 8.0 8.0 4.6MD . . . . . . . . . . . . . . . . . . . . . . . . . . . . . . . . . . . . . . 25.7 11.0 11.0 11.0 6.1ME . . . . . . . . . . . . . . . . . . . . . . . . . . . . . . . . . . . . . . 27.3 16.9 16.9 16.9 9.5MI and MP . . . . . . . . . . . . . . . . . . . . . . . . . . . . . . . . 13.2 3.4 3.4 3.4 2.4WB . . . . . . . . . . . . . . . . . . . . . . . . . . . . . . . . . . . . . . 29.0 15.9 6.0 2.4 1.1WC . . . . . . . . . . . . . . . . . . . . . . . . . . . . . . . . . . . . . . 29.2 17.5 10.3 2.8 1.2WG . . . . . . . . . . . . . . . . . . . . . . . . . . . . . . . . . . . . . . 29.8 24.3 20.1 4.7 1.6WW** . . . . . . . . . . . . . . . . . . . . . . . . . . . . . . . . . . . 29.6 22.0 17.0 4.0 1.5Group 4 Assets . . . . . . . . . . . . . . . . . . . . . . . . . . . . . 19.6 8.1 7.2 6.3 3.7
Group 5
0% 50% 100% 250% 400% 500%PSA Prepayment Assumption
HA, HC, HD, HE, HG, HI, HJ and HK . . . . 8.0 6.5 5.7 4.0 3.1 2.7HB . . . . . . . . . . . . . . . . . . . . . . . . . . . . . . . . 14.5 14.1 13.7 11.8 9.7 8.4Group 5 Assets . . . . . . . . . . . . . . . . . . . . . . . 8.6 7.2 6.5 4.8 3.7 3.3
* We calculate weighted average lives based on the assumptions described in Prepayment and Yield Analysis. The actualweighted average lives are likely to differ from those shown, perhaps significantly.
** The weighted average lives for each Retail Class apply to that Class as a whole. The weighted average lives of Retail ClassUnits will vary among different investors.
II-6
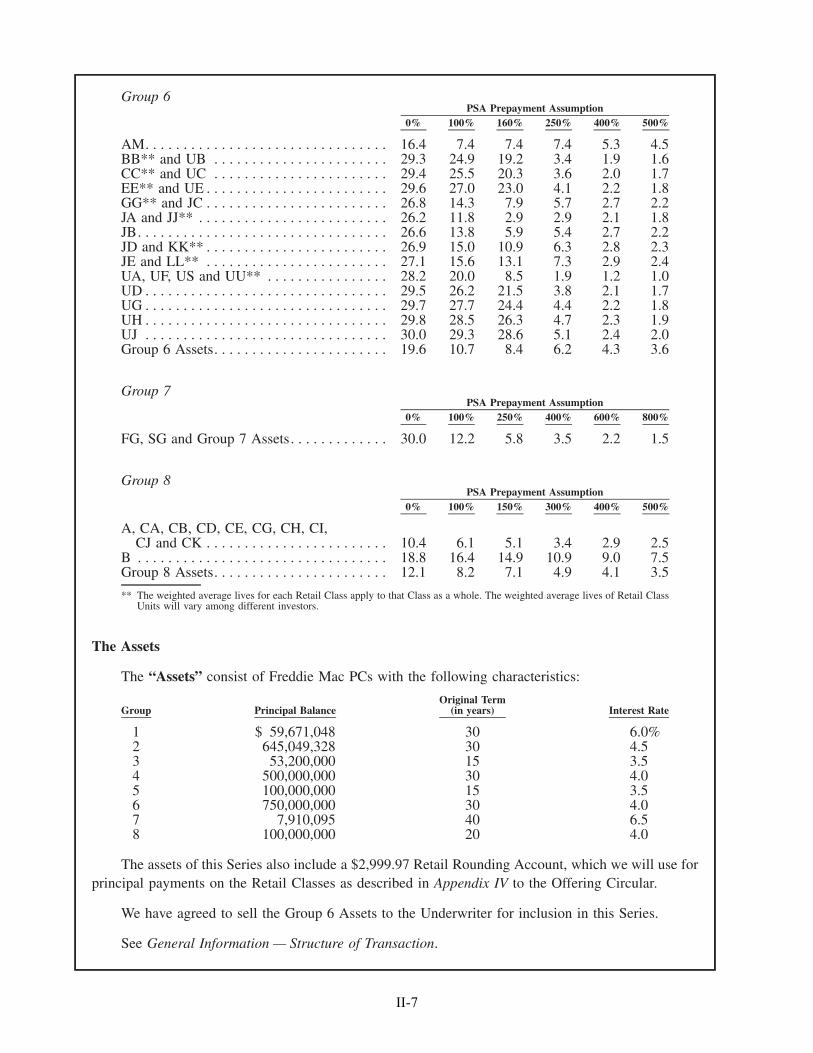
Group 6
0% 100% 160% 250% 400% 500%PSA Prepayment Assumption
AM. . . . . . . . . . . . . . . . . . . . . . . . . . . . . . . . 16.4 7.4 7.4 7.4 5.3 4.5BB** and UB . . . . . . . . . . . . . . . . . . . . . . . 29.3 24.9 19.2 3.4 1.9 1.6CC** and UC . . . . . . . . . . . . . . . . . . . . . . . 29.4 25.5 20.3 3.6 2.0 1.7EE** and UE . . . . . . . . . . . . . . . . . . . . . . . . 29.6 27.0 23.0 4.1 2.2 1.8GG** and JC . . . . . . . . . . . . . . . . . . . . . . . . 26.8 14.3 7.9 5.7 2.7 2.2JA and JJ** . . . . . . . . . . . . . . . . . . . . . . . . . 26.2 11.8 2.9 2.9 2.1 1.8JB. . . . . . . . . . . . . . . . . . . . . . . . . . . . . . . . . 26.6 13.8 5.9 5.4 2.7 2.2JD and KK** . . . . . . . . . . . . . . . . . . . . . . . . 26.9 15.0 10.9 6.3 2.8 2.3JE and LL** . . . . . . . . . . . . . . . . . . . . . . . . 27.1 15.6 13.1 7.3 2.9 2.4UA, UF, US and UU** . . . . . . . . . . . . . . . . 28.2 20.0 8.5 1.9 1.2 1.0UD . . . . . . . . . . . . . . . . . . . . . . . . . . . . . . . . 29.5 26.2 21.5 3.8 2.1 1.7UG . . . . . . . . . . . . . . . . . . . . . . . . . . . . . . . . 29.7 27.7 24.4 4.4 2.2 1.8UH . . . . . . . . . . . . . . . . . . . . . . . . . . . . . . . . 29.8 28.5 26.3 4.7 2.3 1.9UJ . . . . . . . . . . . . . . . . . . . . . . . . . . . . . . . . 30.0 29.3 28.6 5.1 2.4 2.0Group 6 Assets. . . . . . . . . . . . . . . . . . . . . . . 19.6 10.7 8.4 6.2 4.3 3.6
Group 7
0% 100% 250% 400% 600% 800%PSA Prepayment Assumption
FG, SG and Group 7 Assets. . . . . . . . . . . . . 30.0 12.2 5.8 3.5 2.2 1.5
Group 8
0% 100% 150% 300% 400% 500%PSA Prepayment Assumption
A, CA, CB, CD, CE, CG, CH, CI,CJ and CK . . . . . . . . . . . . . . . . . . . . . . . . 10.4 6.1 5.1 3.4 2.9 2.5
B . . . . . . . . . . . . . . . . . . . . . . . . . . . . . . . . . 18.8 16.4 14.9 10.9 9.0 7.5Group 8 Assets. . . . . . . . . . . . . . . . . . . . . . . 12.1 8.2 7.1 4.9 4.1 3.5
** The weighted average lives for each Retail Class apply to that Class as a whole. The weighted average lives of Retail ClassUnits will vary among different investors.
The Assets
The “Assets” consist of Freddie Mac PCs with the following characteristics:
Group Principal BalanceOriginal Term
(in years) Interest Rate
1 $ 59,671,048 30 6.0%2 645,049,328 30 4.53 53,200,000 15 3.54 500,000,000 30 4.05 100,000,000 15 3.56 750,000,000 30 4.07 7,910,095 40 6.58 100,000,000 20 4.0
The assets of this Series also include a $2,999.97 Retail Rounding Account, which we will use forprincipal payments on the Retail Classes as described in Appendix IV to the Offering Circular.
We have agreed to sell the Group 6 Assets to the Underwriter for inclusion in this Series.
See General Information — Structure of Transaction.
II-7
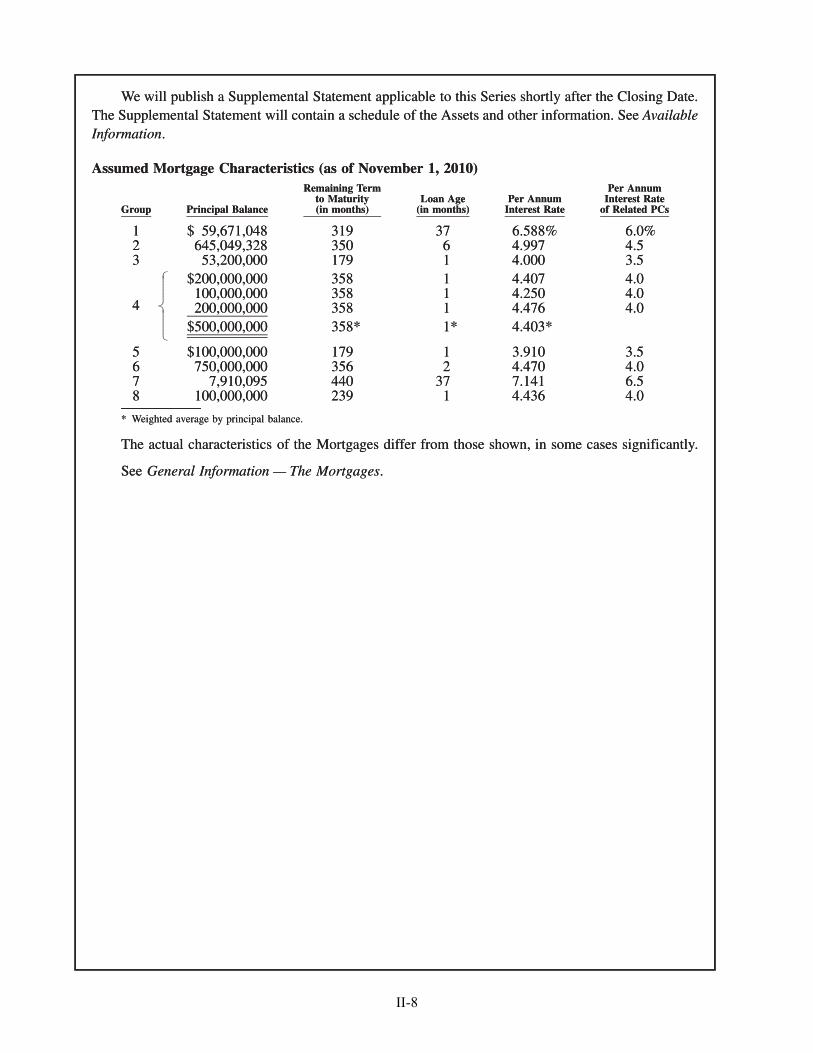
We will publish a Supplemental Statement applicable to this Series shortly after the Closing Date.The Supplemental Statement will contain a schedule of the Assets and other information. See AvailableInformation.
Assumed Mortgage Characteristics (as of November 1, 2010)
Group Principal Balance
Remaining Termto Maturity(in months)
Loan Age(in months)
Per AnnumInterest Rate
Per AnnumInterest Rate
of Related PCs
1 $ 59,671,048 319 37 6.588% 6.0%2 645,049,328 350 6 4.997 4.53 53,200,000 179 1 4.000 3.5
4
$200,000,000 358 1 4.407 4.0100,000,000 358 1 4.250 4.0200,000,000 358 1 4.476 4.0
$500,000,000 358* 1* 4.403*
5 $100,000,000 179 1 3.910 3.56 750,000,000 356 2 4.470 4.07 7,910,095 440 37 7.141 6.58 100,000,000 239 1 4.436 4.0
* Weighted average by principal balance.
The actual characteristics of the Mortgages differ from those shown, in some cases significantly.
See General Information — The Mortgages.
We will publish a Supplemental Statement applicable to this Series shortly after the Closing Date.The Supplemental Statement will contain a schedule of the Assets and other information. See AvailableInformation.
Assumed Mortgage Characteristics (as of November 1, 2010)
Group Principal Balance
Remaining Termto Maturity(in months)
Loan Age(in months)
Per AnnumInterest Rate
Per AnnumInterest Rate
of Related PCs
1 $ 59,671,048 319 37 6.588% 6.0%2 645,049,328 350 6 4.997 4.53 53,200,000 179 1 4.000 3.5
4
$200,000,000 358 1 4.407 4.0100,000,000 358 1 4.250 4.0200,000,000 358 1 4.476 4.0
$500,000,000 358* 1* 4.403*
�����������������������
5 $100,000,000 179 1 3.910 3.56 750,000,000 356 2 4.470 4.07 7,910,095 440 37 7.141 6.58 100,000,000 239 1 4.436 4.0
* Weighted average by principal balance.
The actual characteristics of the Mortgages differ from those shown, in some cases significantly.
See General Information — The Mortgages.
II-8
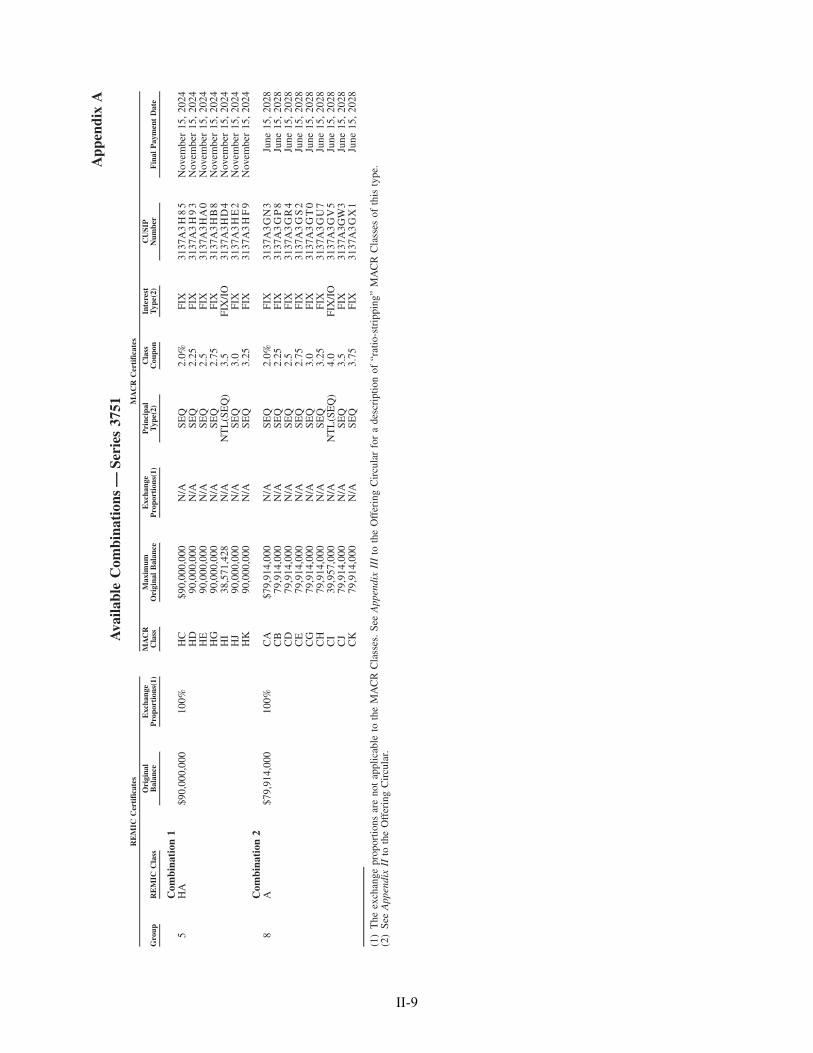
App
endi
xA
Ava
ilabl
eC
ombi
nati
ons
—Se
ries
3751
Gro
upR
EM
ICC
lass
Ori
gina
lB
alan
ceE
xcha
nge
Pro
port
ions
(1)
MA
CR
Cla
ssM
axim
umO
rigi
nal
Bal
ance
Exc
hang
eP
ropo
rtio
ns(1
)P
rinc
ipal
Typ
e(2)
Cla
ssC
oupo
nIn
tere
stT
ype(
2)C
USI
PN
umbe
rF
inal
Pay
men
tD
ate
RE
MIC
Cer
tifi
cate
sM
AC
RC
erti
fica
tes
Com
bina
tion
15
HA
$90,
000,
000
100%
HC
$90,
000,
000
N/A
SEQ
2.0%
FIX
3137
A3
H8
5N
ovem
ber
15,
2024
HD
90,0
00,0
00N
/ASE
Q2.
25FI
X31
37A
3H
93
Nov
embe
r15
,20
24H
E90
,000
,000
N/A
SEQ
2.5
FIX
3137
A3
HA
0N
ovem
ber
15,
2024
HG
90,0
00,0
00N
/ASE
Q2.
75FI
X31
37A
3H
B8
Nov
embe
r15
,20
24H
I38
,571
,428
N/A
NT
L(S
EQ
)3.
5FI
X/I
O31
37A
3H
D4
Nov
embe
r15
,20
24H
J90
,000
,000
N/A
SEQ
3.0
FIX
3137
A3
HE
2N
ovem
ber
15,
2024
HK
90,0
00,0
00N
/ASE
Q3.
25FI
X31
37A
3H
F9
Nov
embe
r15
,20
24C
ombi
nati
on2
8A
$79,
914,
000
100%
CA
$79,
914,
000
N/A
SEQ
2.0%
FIX
3137
A3
GN
3Ju
ne15
,20
28C
B79
,914
,000
N/A
SEQ
2.25
FIX
3137
A3
GP
8Ju
ne15
,20
28C
D79
,914
,000
N/A
SEQ
2.5
FIX
3137
A3
GR
4Ju
ne15
,20
28C
E79
,914
,000
N/A
SEQ
2.75
FIX
3137
A3
GS
2Ju
ne15
,20
28C
G79
,914
,000
N/A
SEQ
3.0
FIX
3137
A3
GT
0Ju
ne15
,20
28C
H79
,914
,000
N/A
SEQ
3.25
FIX
3137
A3
GU
7Ju
ne15
,20
28C
I39
,957
,000
N/A
NT
L(S
EQ
)4.
0FI
X/I
O31
37A
3G
V5
June
15,
2028
CJ
79,9
14,0
00N
/ASE
Q3.
5FI
X31
37A
3GW
3Ju
ne15
,20
28C
K79
,914
,000
N/A
SEQ
3.75
FIX
3137
A3
GX
1Ju
ne15
,20
28
(1)
The
exch
ange
prop
ortio
nsar
eno
tap
plic
able
toth
eM
AC
RC
lass
es.
See
App
endi
xII
Ito
the
Off
erin
gC
ircu
lar
for
ade
scri
ptio
nof
“rat
io-s
trip
ping
”M
AC
RC
lass
esof
this
type
.(2
)Se
eA
ppen
dix
IIto
the
Off
erin
gC
ircu
lar.
II-9
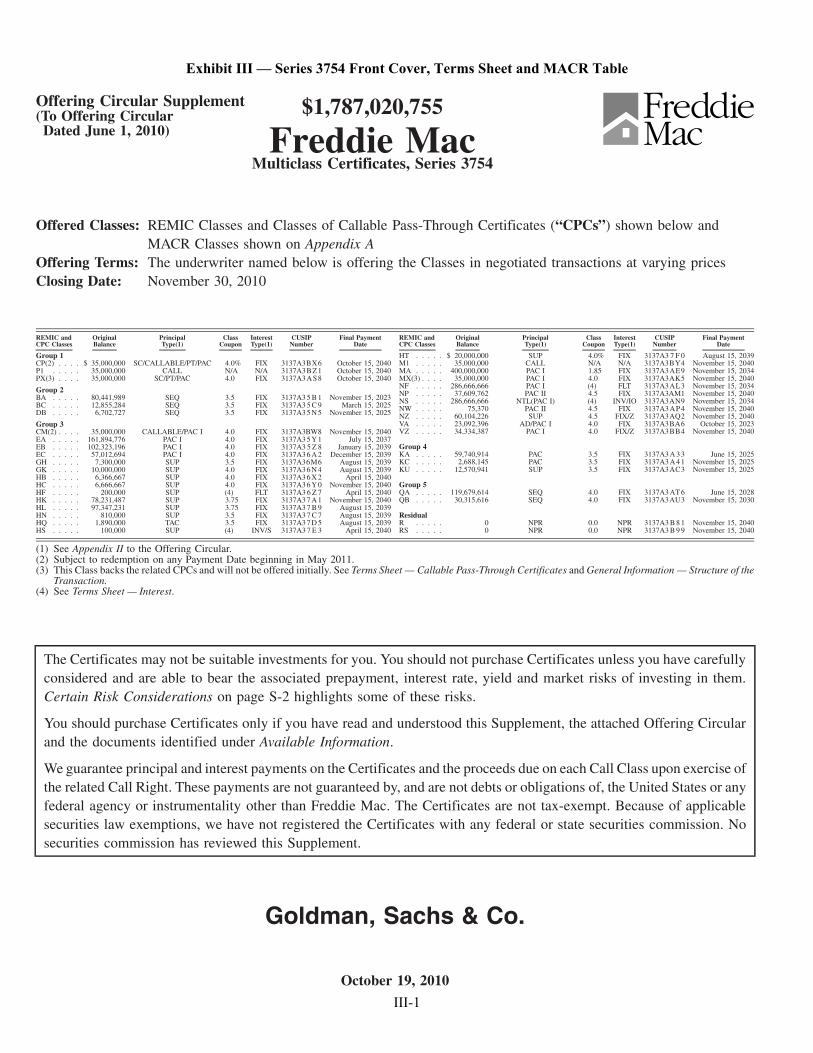
Offering Circular Supplement(To Offering Circular
Dated June 1, 2010)
$1,787,020,755
Freddie MacMulticlass Certificates, Series 3754
Offered Classes: REMIC Classes and Classes of Callable Pass-Through Certificates (“CPCs”) shown below andMACR Classes shown on Appendix A
Offering Terms: The underwriter named below is offering the Classes in negotiated transactions at varying pricesClosing Date: November 30, 2010
REMIC andCPC Classes
OriginalBalance
PrincipalType(1)
ClassCoupon
InterestType(1)
CUSIPNumber
Final PaymentDate
Group 1CP(2) . . . . $ 35,000,000 SC/CALLABLE/PT/PAC 4.0% FIX 3137A3BX6 October 15, 2040P1 . . . . . 35,000,000 CALL N/A N/A 3137A3BZ1 October 15, 2040PX(3) . . . . 35,000,000 SC/PT/PAC 4.0 FIX 3137A3AS8 October 15, 2040
Group 2BA . . . . . 80,441,989 SEQ 3.5 FIX 3137A3 5 B 1 November 15, 2023BC . . . . . 12,855,284 SEQ 3.5 FIX 3137A3 5 C 9 March 15, 2025DB . . . . . 6,702,727 SEQ 3.5 FIX 3137A3 5 N 5 November 15, 2025
Group 3CM(2) . . . . 35,000,000 CALLABLE/PAC I 4.0 FIX 3137A3BW8 November 15, 2040EA . . . . . 161,894,776 PAC I 4.0 FIX 3137A3 5 Y 1 July 15, 2037EB . . . . . 102,323,196 PAC I 4.0 FIX 3137A3 5 Z 8 January 15, 2039EC . . . . . 57,012,694 PAC I 4.0 FIX 3137A3 6 A 2 December 15, 2039GH . . . . . 7,300,000 SUP 3.5 FIX 3137A36M6 August 15, 2039GK . . . . . 10,000,000 SUP 4.0 FIX 3137A3 6 N 4 August 15, 2039HB . . . . . 6,366,667 SUP 4.0 FIX 3137A3 6 X 2 April 15, 2040HC . . . . . 6,666,667 SUP 4.0 FIX 3137A3 6 Y 0 November 15, 2040HF . . . . . 200,000 SUP (4) FLT 3137A3 6 Z 7 April 15, 2040HK . . . . . 78,231,487 SUP 3.75 FIX 3137A3 7 A 1 November 15, 2040HL . . . . . 97,347,231 SUP 3.75 FIX 3137A3 7 B 9 August 15, 2039HN . . . . . 810,000 SUP 3.5 FIX 3137A3 7 C 7 August 15, 2039HQ . . . . . 1,890,000 TAC 3.5 FIX 3137A3 7 D 5 August 15, 2039HS . . . . . 100,000 SUP (4) INV/S 3137A3 7 E 3 April 15, 2040
REMIC andCPC Classes
OriginalBalance
PrincipalType(1)
ClassCoupon
InterestType(1)
CUSIPNumber
Final PaymentDate
HT . . . . . $ 20,000,000 SUP 4.0% FIX 3137A3 7 F 0 August 15, 2039M1 . . . . . 35,000,000 CALL N/A N/A 3137A3BY4 November 15, 2040MA . . . . . 400,000,000 PAC I 1.85 FIX 3137A3AE9 November 15, 2034MX(3) . . . . 35,000,000 PAC I 4.0 FIX 3137A3AK5 November 15, 2040NF . . . . . 286,666,666 PAC I (4) FLT 3137A3AL3 November 15, 2034NP . . . . . 37,609,762 PAC II 4.5 FIX 3137A3AM1 November 15, 2040NS . . . . . 286,666,666 NTL(PAC I) (4) INV/IO 3137A3AN9 November 15, 2034NW . . . . . 75,370 PAC II 4.5 FIX 3137A3AP4 November 15, 2040NZ . . . . . 60,104,226 SUP 4.5 FIX/Z 3137A3AQ2 November 15, 2040VA . . . . . 23,092,396 AD/PAC I 4.0 FIX 3137A3BA6 October 15, 2023VZ . . . . . 34,334,387 PAC I 4.0 FIX/Z 3137A3BB4 November 15, 2040
Group 4KA . . . . . 59,740,914 PAC 3.5 FIX 3137A3 A 3 3 June 15, 2025KC . . . . . 2,688,145 PAC 3.5 FIX 3137A3 A 4 1 November 15, 2025KU . . . . . 12,570,941 SUP 3.5 FIX 3137A3AC3 November 15, 2025
Group 5QA . . . . . 119,679,614 SEQ 4.0 FIX 3137A3 AT6 June 15, 2028QB . . . . . 30,315,616 SEQ 4.0 FIX 3137A3AU3 November 15, 2030
ResidualR . . . . . 0 NPR 0.0 NPR 3137A3 B 8 1 November 15, 2040RS . . . . . 0 NPR 0.0 NPR 3137A3 B 9 9 November 15, 2040
(1) See Appendix II to the Offering Circular.(2) Subject to redemption on any Payment Date beginning in May 2011.(3) This Class backs the related CPCs and will not be offered initially. See Terms Sheet — Callable Pass-Through Certificates and General Information — Structure of the
Transaction.(4) See Terms Sheet — Interest.
The Certificates may not be suitable investments for you. You should not purchase Certificates unless you have carefullyconsidered and are able to bear the associated prepayment, interest rate, yield and market risks of investing in them.Certain Risk Considerations on page S-2 highlights some of these risks.
You should purchase Certificates only if you have read and understood this Supplement, the attached Offering Circularand the documents identified under Available Information.
We guarantee principal and interest payments on the Certificates and the proceeds due on each Call Class upon exercise ofthe related Call Right. These payments are not guaranteed by, and are not debts or obligations of, the United States or anyfederal agency or instrumentality other than Freddie Mac. The Certificates are not tax-exempt. Because of applicablesecurities law exemptions, we have not registered the Certificates with any federal or state securities commission. Nosecurities commission has reviewed this Supplement.
Goldman, Sachs & Co.
October 19, 2010
Exhibit III — Series 3754 Front Cover, Terms Sheet and MACR Table
III-1
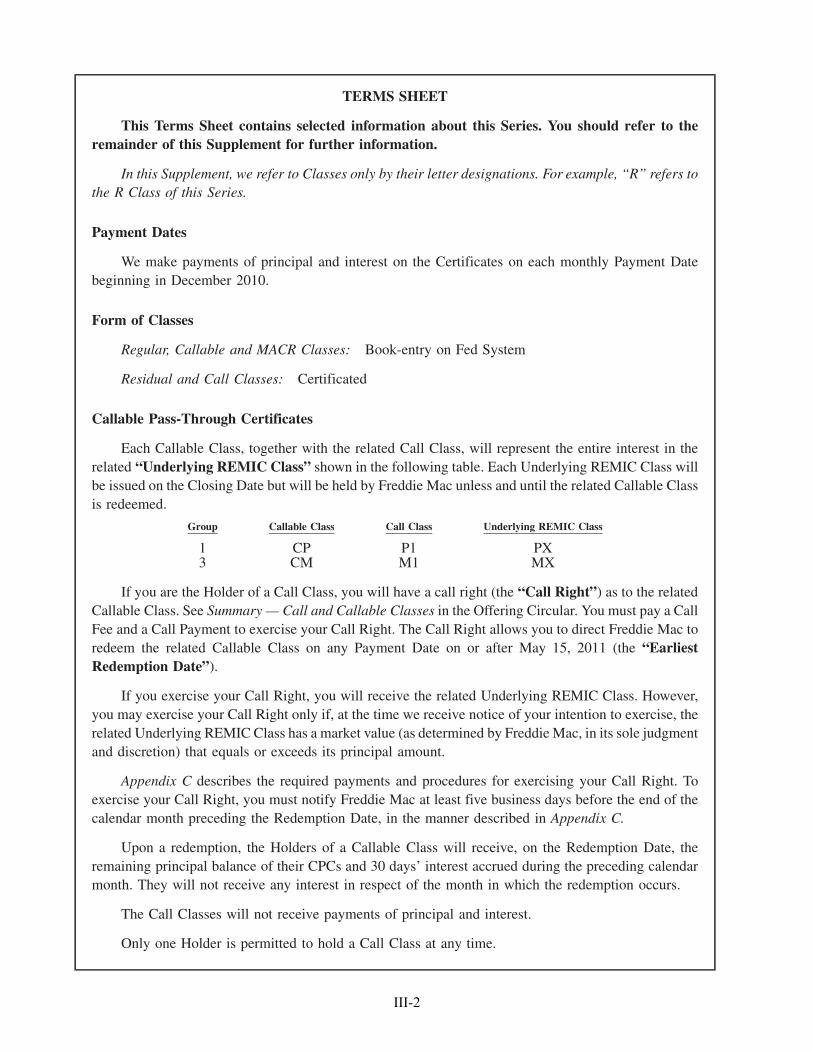
TERMS SHEET
This Terms Sheet contains selected information about this Series. You should refer to theremainder of this Supplement for further information.
In this Supplement, we refer to Classes only by their letter designations. For example, “R” refers tothe R Class of this Series.
Payment Dates
We make payments of principal and interest on the Certificates on each monthly Payment Datebeginning in December 2010.
Form of Classes
Regular, Callable and MACR Classes: Book-entry on Fed System
Residual and Call Classes: Certificated
Callable Pass-Through Certificates
Each Callable Class, together with the related Call Class, will represent the entire interest in therelated “Underlying REMIC Class” shown in the following table. Each Underlying REMIC Class willbe issued on the Closing Date but will be held by Freddie Mac unless and until the related Callable Classis redeemed.
Group Callable Class Call Class Underlying REMIC Class
1 CP P1 PX3 CM M1 MX
If you are the Holder of a Call Class, you will have a call right (the “Call Right”) as to the relatedCallable Class. See Summary — Call and Callable Classes in the Offering Circular. You must pay a CallFee and a Call Payment to exercise your Call Right. The Call Right allows you to direct Freddie Mac toredeem the related Callable Class on any Payment Date on or after May 15, 2011 (the “EarliestRedemption Date”).
If you exercise your Call Right, you will receive the related Underlying REMIC Class. However,you may exercise your Call Right only if, at the time we receive notice of your intention to exercise, therelated Underlying REMIC Class has a market value (as determined by Freddie Mac, in its sole judgmentand discretion) that equals or exceeds its principal amount.
Appendix C describes the required payments and procedures for exercising your Call Right. Toexercise your Call Right, you must notify Freddie Mac at least five business days before the end of thecalendar month preceding the Redemption Date, in the manner described in Appendix C.
Upon a redemption, the Holders of a Callable Class will receive, on the Redemption Date, theremaining principal balance of their CPCs and 30 days’ interest accrued during the preceding calendarmonth. They will not receive any interest in respect of the month in which the redemption occurs.
The Call Classes will not receive payments of principal and interest.
Only one Holder is permitted to hold a Call Class at any time.
III-2
Interest
The Fixed Rate Classes bear interest at the Class Coupons shown on the front cover and Appendix A.
OG (a MACR Class) is a Principal Only Class and does not bear interest.
The Floating Rate and Inverse Floating Rate Classes bear interest as shown in the following table.The initial Class Coupons apply only to the first Accrual Period. We determine LIBOR using the BBAMethod.
ClassInitial Class
Coupon Class Coupon Formula Minimum Rate Maximum RateClass Coupon Subject to
AF* . . . . . . . . . . . . . . . . . . . . 0.55% LIBOR + 0.3% 0.3% 7.0%AS* . . . . . . . . . . . . . . . . . . . . 0.05 6.7% � LIBOR 0 0.05HF . . . . . . . . . . . . . . . . . . . . . 1.35 LIBOR + 1.1% 1.1 6.0HS . . . . . . . . . . . . . . . . . . . . . 9.3 9.8% � (LIBOR � 2.0) 0 9.8MF* . . . . . . . . . . . . . . . . . . . . 0.55 LIBOR + 0.3% 0.3 7.0MS* . . . . . . . . . . . . . . . . . . . . 6.45 6.7% � LIBOR 0 6.7NF . . . . . . . . . . . . . . . . . . . . . 0.6 LIBOR + 0.35% 0.35 7.0NS . . . . . . . . . . . . . . . . . . . . . 6.4 6.65% � LIBOR 0 6.65
* MACR Class.
See Appendix V to the Offering Circular and Payments — Interest.
Notional Classes
ClassOriginal NotionalPrincipal Amount Reduces Proportionately With
Group 2DI* $ 53,312,727 BA and BC, as a whole (SEQ)IB* 45,966,850 BA (SEQ)YI* 7,345,876 BC (SEQ)
Group 3AS* $286,666,666 NF (PAC I)IA* 80,947,388 EA (PAC I)IE* 132,108,986 EA and EB, as a whole (PAC I)IG* 91,263,029 HL (SUP)IQ* 23,506,101 NP (PAC II)IY* 51,161,598 EB (PAC I)MS* 286,666,666 NF (PAC I)NS 286,666,666 NF (PAC I)
Group 4IK* $ 34,137,665 KA (PAC)
Group 5QI* $ 74,799,758 QA (SEQ)
* MACR Class.
See Payments — Interest — Notional Classes.
III-3
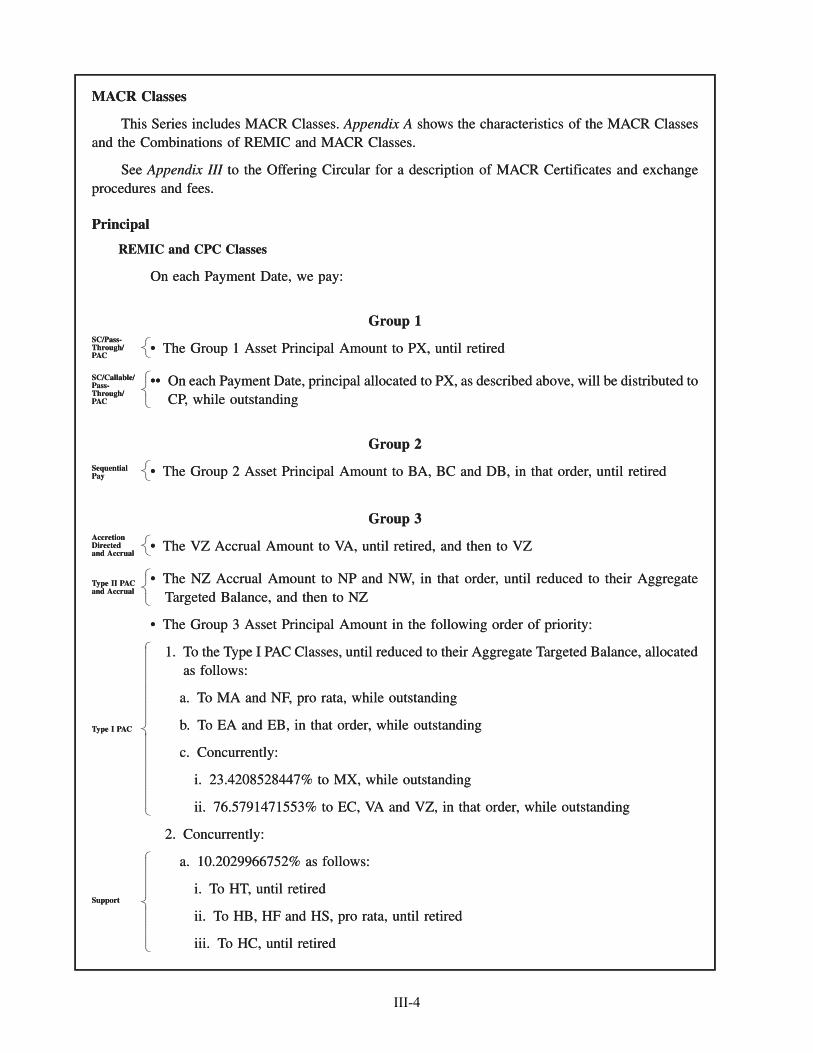
MACR Classes
This Series includes MACR Classes. Appendix A shows the characteristics of the MACR Classesand the Combinations of REMIC and MACR Classes.
See Appendix III to the Offering Circular for a description of MACR Certificates and exchangeprocedures and fees.
Principal
REMIC and CPC Classes
On each Payment Date, we pay:
Group 1
• The Group 1 Asset Principal Amount to PX, until retiredSC/Pass-Through/PAC
•• On each Payment Date, principal allocated to PX, as described above, will be distributed toCP, while outstanding
SC/Callable/Pass-Through/PAC
Group 2
• The Group 2 Asset Principal Amount to BA, BC and DB, in that order, until retiredSequentialPay
Group 3
• The VZ Accrual Amount to VA, until retired, and then to VZAccretionDirectedand Accrual
• The NZ Accrual Amount to NP and NW, in that order, until reduced to their AggregateTargeted Balance, and then to NZ
Type II PACand Accrual
• The Group 3 Asset Principal Amount in the following order of priority:
1. To the Type I PAC Classes, until reduced to their Aggregate Targeted Balance, allocatedas follows:
a. To MA and NF, pro rata, while outstanding
b. To EA and EB, in that order, while outstanding
c. Concurrently:
i. 23.4208528447% to MX, while outstanding
ii. 76.5791471553% to EC, VA and VZ, in that order, while outstanding
Type I PAC
2. Concurrently:
a. 10.2029966752% as follows:
i. To HT, until retired
ii. To HB, HF and HS, pro rata, until retired
iii. To HC, until retired
Support
MACR Classes
This Series includes MACR Classes. Appendix A shows the characteristics of the MACR Classesand the Combinations of REMIC and MACR Classes.
See Appendix III to the Offering Circular for a description of MACR Certificates and exchangeprocedures and fees.
Principal
REMIC and CPC Classes
On each Payment Date, we pay:
Group 1
• The Group 1 Asset Principal Amount to PX, until retired�����
SC/Pass-Through/PAC
•• On each Payment Date, principal allocated to PX, as described above, will be distributed toCP, while outstanding
�����������
SC/Callable/Pass-Through/PAC
Group 2
• The Group 2 Asset Principal Amount to BA, BC and DB, in that order, until retired�����
SequentialPay
Group 3
• The VZ Accrual Amount to VA, until retired, and then to VZ�����
AccretionDirectedand Accrual
• The NZ Accrual Amount to NP and NW, in that order, until reduced to their AggregateTargeted Balance, and then to NZ
�����������
Type II PACand Accrual
• The Group 3 Asset Principal Amount in the following order of priority:
1. To the Type I PAC Classes, until reduced to their Aggregate Targeted Balance, allocatedas follows:
a. To MA and NF, pro rata, while outstanding
b. To EA and EB, in that order, while outstanding
c. Concurrently:
i. 23.4208528447% to MX, while outstanding
ii. 76.5791471553% to EC, VA and VZ, in that order, while outstanding
�����������������������������������������������������������
Type I PAC
2. Concurrently:
a. 10.2029966752% as follows:
i. To HT, until retired
ii. To HB, HF and HS, pro rata, until retired
iii. To HC, until retired
���������������������������������
Support
III-4
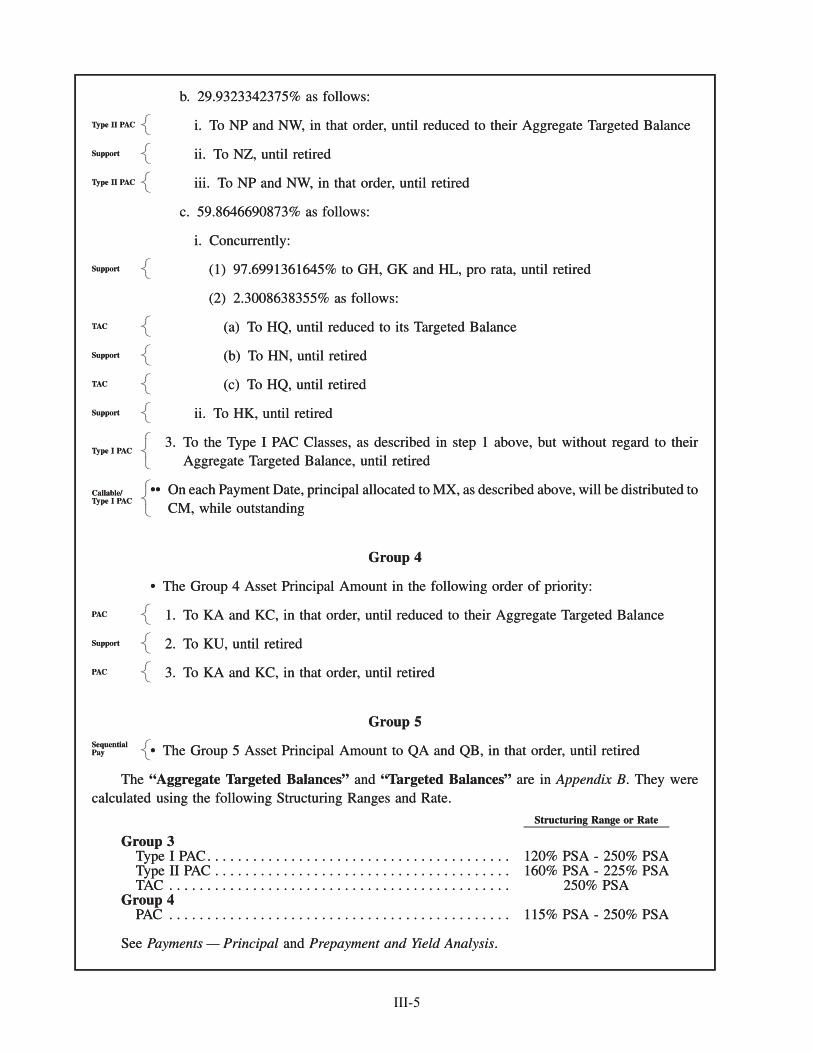
b. 29.9323342375% as follows:
i. To NP and NW, in that order, until reduced to their Aggregate Targeted BalanceType II PAC
ii. To NZ, until retiredSupport
iii. To NP and NW, in that order, until retiredType II PAC
c. 59.8646690873% as follows:
i. Concurrently:
(1) 97.6991361645% to GH, GK and HL, pro rata, until retiredSupport
(2) 2.3008638355% as follows:
(a) To HQ, until reduced to its Targeted BalanceTAC
(b) To HN, until retiredSupport
(c) To HQ, until retiredTAC
ii. To HK, until retiredSupport
3. To the Type I PAC Classes, as described in step 1 above, but without regard to theirAggregate Targeted Balance, until retired
Type I PAC
•• On each Payment Date, principal allocated to MX, as described above, will be distributed toCM, while outstanding
Callable/Type I PAC
Group 4
• The Group 4 Asset Principal Amount in the following order of priority:
1. To KA and KC, in that order, until reduced to their Aggregate Targeted BalancePAC
2. To KU, until retiredSupport
3. To KA and KC, in that order, until retiredPAC
Group 5
• The Group 5 Asset Principal Amount to QA and QB, in that order, until retiredSequentialPay
The “Aggregate Targeted Balances” and “Targeted Balances” are in Appendix B. They werecalculated using the following Structuring Ranges and Rate.
Structuring Range or Rate
Group 3Type I PAC. . . . . . . . . . . . . . . . . . . . . . . . . . . . . . . . . . . . . . . . 120% PSA - 250% PSAType II PAC . . . . . . . . . . . . . . . . . . . . . . . . . . . . . . . . . . . . . . . 160% PSA - 225% PSATAC . . . . . . . . . . . . . . . . . . . . . . . . . . . . . . . . . . . . . . . . . . . . . 250% PSA
Group 4PAC . . . . . . . . . . . . . . . . . . . . . . . . . . . . . . . . . . . . . . . . . . . . . 115% PSA - 250% PSA
See Payments — Principal and Prepayment and Yield Analysis.
b. 29.9323342375% as follows:
i. To NP and NW, in that order, until reduced to their Aggregate Targeted Balance�����Type II PAC
ii. To NZ, until retired�����Support
iii. To NP and NW, in that order, until retired�����Type II PAC
c. 59.8646690873% as follows:
i. Concurrently:
(1) 97.6991361645% to GH, GK and HL, pro rata, until retired�����Support
(2) 2.3008638355% as follows:
(a) To HQ, until reduced to its Targeted Balance�����TAC
(b) To HN, until retired�����Support
(c) To HQ, until retired�����TAC
ii. To HK, until retired�����Support
3. To the Type I PAC Classes, as described in step 1 above, but without regard to theirAggregate Targeted Balance, until retired
�����������
Type I PAC
•• On each Payment Date, principal allocated to MX, as described above, will be distributed toCM, while outstanding
�����������
Callable/Type I PAC
Group 4
• The Group 4 Asset Principal Amount in the following order of priority:
1. To KA and KC, in that order, until reduced to their Aggregate Targeted Balance�����PAC
2. To KU, until retired�����Support
3. To KA and KC, in that order, until retired�����PAC
Group 5
• The Group 5 Asset Principal Amount to QA and QB, in that order, until retired�����
SequentialPay
The “Aggregate Targeted Balances” and “Targeted Balances” are in Appendix B. They werecalculated using the following Structuring Ranges and Rate.
Structuring Range or Rate
Group 3Type I PAC. . . . . . . . . . . . . . . . . . . . . . . . . . . . . . . . . . . . . . . . 120% PSA - 250% PSAType II PAC . . . . . . . . . . . . . . . . . . . . . . . . . . . . . . . . . . . . . . . 160% PSA - 225% PSATAC . . . . . . . . . . . . . . . . . . . . . . . . . . . . . . . . . . . . . . . . . . . . . 250% PSA
Group 4PAC . . . . . . . . . . . . . . . . . . . . . . . . . . . . . . . . . . . . . . . . . . . . . 115% PSA - 250% PSA
See Payments — Principal and Prepayment and Yield Analysis.
III-5
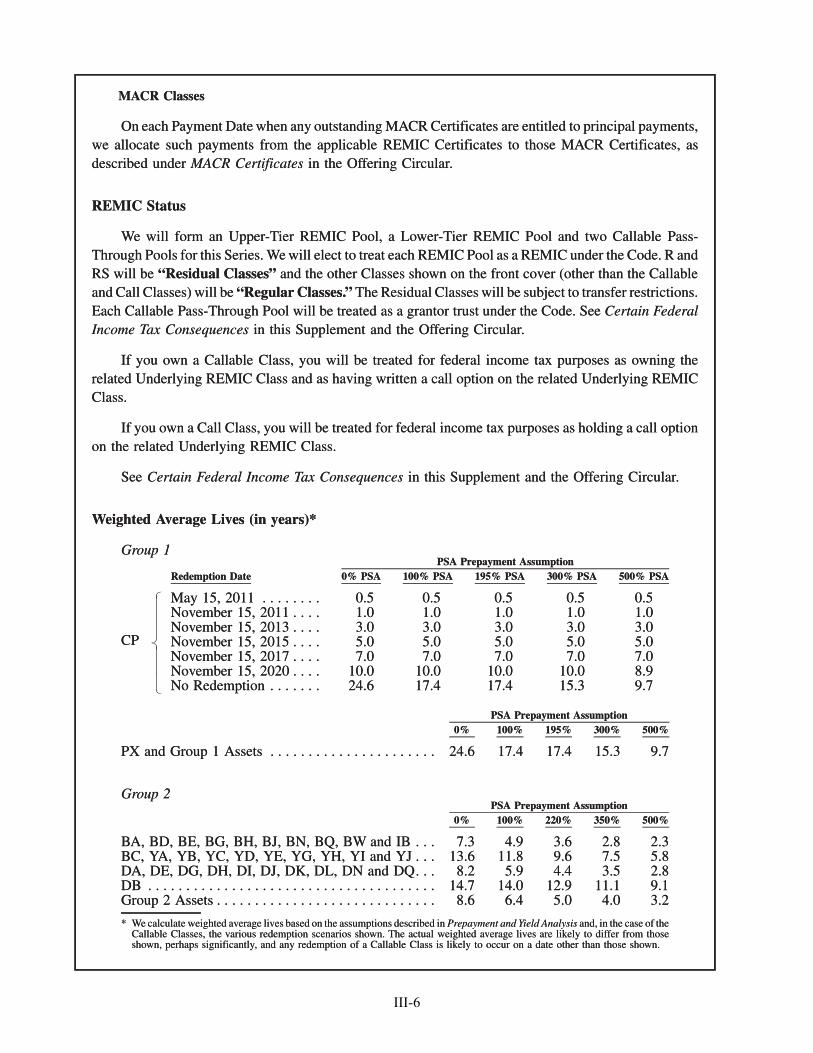
MACR Classes
On each Payment Date when any outstanding MACR Certificates are entitled to principal payments,we allocate such payments from the applicable REMIC Certificates to those MACR Certificates, asdescribed under MACR Certificates in the Offering Circular.
REMIC Status
We will form an Upper-Tier REMIC Pool, a Lower-Tier REMIC Pool and two Callable Pass-Through Pools for this Series. We will elect to treat each REMIC Pool as a REMIC under the Code. R andRS will be “Residual Classes” and the other Classes shown on the front cover (other than the Callableand Call Classes) will be “Regular Classes.” The Residual Classes will be subject to transfer restrictions.Each Callable Pass-Through Pool will be treated as a grantor trust under the Code. See Certain FederalIncome Tax Consequences in this Supplement and the Offering Circular.
If you own a Callable Class, you will be treated for federal income tax purposes as owning therelated Underlying REMIC Class and as having written a call option on the related Underlying REMICClass.
If you own a Call Class, you will be treated for federal income tax purposes as holding a call optionon the related Underlying REMIC Class.
See Certain Federal Income Tax Consequences in this Supplement and the Offering Circular.
Weighted Average Lives (in years)*
Group 1
Redemption Date 0% PSA 100% PSA 195% PSA 300% PSA 500% PSAPSA Prepayment Assumption
CP
May 15, 2011 . . . . . . . . 0.5 0.5 0.5 0.5 0.5November 15, 2011 . . . . 1.0 1.0 1.0 1.0 1.0November 15, 2013 . . . . 3.0 3.0 3.0 3.0 3.0November 15, 2015 . . . . 5.0 5.0 5.0 5.0 5.0November 15, 2017 . . . . 7.0 7.0 7.0 7.0 7.0November 15, 2020 . . . . 10.0 10.0 10.0 10.0 8.9No Redemption . . . . . . . 24.6 17.4 17.4 15.3 9.7
0% 100% 195% 300% 500%PSA Prepayment Assumption
PX and Group 1 Assets . . . . . . . . . . . . . . . . . . . . . . 24.6 17.4 17.4 15.3 9.7
Group 2
0% 100% 220% 350% 500%PSA Prepayment Assumption
BA, BD, BE, BG, BH, BJ, BN, BQ, BW and IB . . . 7.3 4.9 3.6 2.8 2.3BC, YA, YB, YC, YD, YE, YG, YH, YI and YJ . . . 13.6 11.8 9.6 7.5 5.8DA, DE, DG, DH, DI, DJ, DK, DL, DN and DQ. . . 8.2 5.9 4.4 3.5 2.8DB . . . . . . . . . . . . . . . . . . . . . . . . . . . . . . . . . . . . . . 14.7 14.0 12.9 11.1 9.1Group 2 Assets . . . . . . . . . . . . . . . . . . . . . . . . . . . . . 8.6 6.4 5.0 4.0 3.2
* We calculate weighted average lives based on the assumptions described in Prepayment and Yield Analysis and, in the case of theCallable Classes, the various redemption scenarios shown. The actual weighted average lives are likely to differ from thoseshown, perhaps significantly, and any redemption of a Callable Class is likely to occur on a date other than those shown.
MACR Classes
On each Payment Date when any outstanding MACR Certificates are entitled to principal payments,we allocate such payments from the applicable REMIC Certificates to those MACR Certificates, asdescribed under MACR Certificates in the Offering Circular.
REMIC Status
We will form an Upper-Tier REMIC Pool, a Lower-Tier REMIC Pool and two Callable Pass-Through Pools for this Series. We will elect to treat each REMIC Pool as a REMIC under the Code. R andRS will be “Residual Classes” and the other Classes shown on the front cover (other than the Callableand Call Classes) will be “Regular Classes.” The Residual Classes will be subject to transfer restrictions.Each Callable Pass-Through Pool will be treated as a grantor trust under the Code. See Certain FederalIncome Tax Consequences in this Supplement and the Offering Circular.
If you own a Callable Class, you will be treated for federal income tax purposes as owning therelated Underlying REMIC Class and as having written a call option on the related Underlying REMICClass.
If you own a Call Class, you will be treated for federal income tax purposes as holding a call optionon the related Underlying REMIC Class.
See Certain Federal Income Tax Consequences in this Supplement and the Offering Circular.
Weighted Average Lives (in years)*
Group 1
Redemption Date 0% PSA 100% PSA 195% PSA 300% PSA 500% PSAPSA Prepayment Assumption
CP
May 15, 2011 . . . . . . . . 0.5 0.5 0.5 0.5 0.5November 15, 2011 . . . . 1.0 1.0 1.0 1.0 1.0November 15, 2013 . . . . 3.0 3.0 3.0 3.0 3.0November 15, 2015 . . . . 5.0 5.0 5.0 5.0 5.0November 15, 2017 . . . . 7.0 7.0 7.0 7.0 7.0November 15, 2020 . . . . 10.0 10.0 10.0 10.0 8.9No Redemption . . . . . . . 24.6 17.4 17.4 15.3 9.7
�����������������������������������
0% 100% 195% 300% 500%PSA Prepayment Assumption
PX and Group 1 Assets . . . . . . . . . . . . . . . . . . . . . . 24.6 17.4 17.4 15.3 9.7
Group 2
0% 100% 220% 350% 500%PSA Prepayment Assumption
BA, BD, BE, BG, BH, BJ, BN, BQ, BW and IB . . . 7.3 4.9 3.6 2.8 2.3BC, YA, YB, YC, YD, YE, YG, YH, YI and YJ . . . 13.6 11.8 9.6 7.5 5.8DA, DE, DG, DH, DI, DJ, DK, DL, DN and DQ. . . 8.2 5.9 4.4 3.5 2.8DB . . . . . . . . . . . . . . . . . . . . . . . . . . . . . . . . . . . . . . 14.7 14.0 12.9 11.1 9.1Group 2 Assets . . . . . . . . . . . . . . . . . . . . . . . . . . . . . 8.6 6.4 5.0 4.0 3.2
* We calculate weighted average lives based on the assumptions described in Prepayment and Yield Analysis and, in the case of theCallable Classes, the various redemption scenarios shown. The actual weighted average lives are likely to differ from thoseshown, perhaps significantly, and any redemption of a Callable Class is likely to occur on a date other than those shown.
III-6
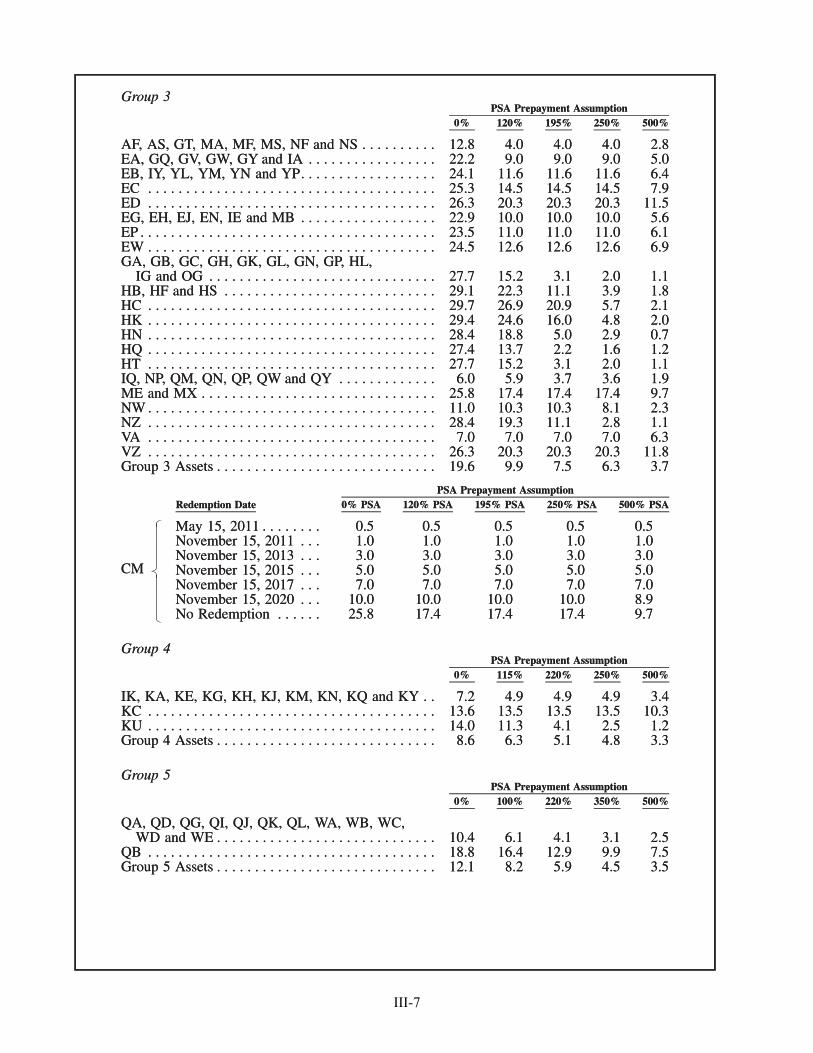
Group 3
0% 120% 195% 250% 500%PSA Prepayment Assumption
AF, AS, GT, MA, MF, MS, NF and NS . . . . . . . . . . 12.8 4.0 4.0 4.0 2.8EA, GQ, GV, GW, GY and IA . . . . . . . . . . . . . . . . . 22.2 9.0 9.0 9.0 5.0EB, IY, YL, YM, YN and YP. . . . . . . . . . . . . . . . . . 24.1 11.6 11.6 11.6 6.4EC . . . . . . . . . . . . . . . . . . . . . . . . . . . . . . . . . . . . . . 25.3 14.5 14.5 14.5 7.9ED . . . . . . . . . . . . . . . . . . . . . . . . . . . . . . . . . . . . . . 26.3 20.3 20.3 20.3 11.5EG, EH, EJ, EN, IE and MB . . . . . . . . . . . . . . . . . . 22.9 10.0 10.0 10.0 5.6EP . . . . . . . . . . . . . . . . . . . . . . . . . . . . . . . . . . . . . . . 23.5 11.0 11.0 11.0 6.1EW . . . . . . . . . . . . . . . . . . . . . . . . . . . . . . . . . . . . . . 24.5 12.6 12.6 12.6 6.9GA, GB, GC, GH, GK, GL, GN, GP, HL,
IG and OG . . . . . . . . . . . . . . . . . . . . . . . . . . . . . . 27.7 15.2 3.1 2.0 1.1HB, HF and HS . . . . . . . . . . . . . . . . . . . . . . . . . . . . 29.1 22.3 11.1 3.9 1.8HC . . . . . . . . . . . . . . . . . . . . . . . . . . . . . . . . . . . . . . 29.7 26.9 20.9 5.7 2.1HK . . . . . . . . . . . . . . . . . . . . . . . . . . . . . . . . . . . . . . 29.4 24.6 16.0 4.8 2.0HN . . . . . . . . . . . . . . . . . . . . . . . . . . . . . . . . . . . . . . 28.4 18.8 5.0 2.9 0.7HQ . . . . . . . . . . . . . . . . . . . . . . . . . . . . . . . . . . . . . . 27.4 13.7 2.2 1.6 1.2HT . . . . . . . . . . . . . . . . . . . . . . . . . . . . . . . . . . . . . . 27.7 15.2 3.1 2.0 1.1IQ, NP, QM, QN, QP, QW and QY . . . . . . . . . . . . . 6.0 5.9 3.7 3.6 1.9ME and MX . . . . . . . . . . . . . . . . . . . . . . . . . . . . . . . 25.8 17.4 17.4 17.4 9.7NW . . . . . . . . . . . . . . . . . . . . . . . . . . . . . . . . . . . . . . 11.0 10.3 10.3 8.1 2.3NZ . . . . . . . . . . . . . . . . . . . . . . . . . . . . . . . . . . . . . . 28.4 19.3 11.1 2.8 1.1VA . . . . . . . . . . . . . . . . . . . . . . . . . . . . . . . . . . . . . . 7.0 7.0 7.0 7.0 6.3VZ . . . . . . . . . . . . . . . . . . . . . . . . . . . . . . . . . . . . . . 26.3 20.3 20.3 20.3 11.8Group 3 Assets . . . . . . . . . . . . . . . . . . . . . . . . . . . . . 19.6 9.9 7.5 6.3 3.7
Redemption Date 0% PSA 120% PSA 195% PSA 250% PSA 500% PSAPSA Prepayment Assumption
CM
May 15, 2011 . . . . . . . . 0.5 0.5 0.5 0.5 0.5November 15, 2011 . . . 1.0 1.0 1.0 1.0 1.0November 15, 2013 . . . 3.0 3.0 3.0 3.0 3.0November 15, 2015 . . . 5.0 5.0 5.0 5.0 5.0November 15, 2017 . . . 7.0 7.0 7.0 7.0 7.0November 15, 2020 . . . 10.0 10.0 10.0 10.0 8.9No Redemption . . . . . . 25.8 17.4 17.4 17.4 9.7
Group 4
0% 115% 220% 250% 500%PSA Prepayment Assumption
IK, KA, KE, KG, KH, KJ, KM, KN, KQ and KY . . 7.2 4.9 4.9 4.9 3.4KC . . . . . . . . . . . . . . . . . . . . . . . . . . . . . . . . . . . . . . 13.6 13.5 13.5 13.5 10.3KU . . . . . . . . . . . . . . . . . . . . . . . . . . . . . . . . . . . . . . 14.0 11.3 4.1 2.5 1.2Group 4 Assets . . . . . . . . . . . . . . . . . . . . . . . . . . . . . 8.6 6.3 5.1 4.8 3.3
Group 5
0% 100% 220% 350% 500%PSA Prepayment Assumption
QA, QD, QG, QI, QJ, QK, QL, WA, WB, WC,WD and WE . . . . . . . . . . . . . . . . . . . . . . . . . . . . . 10.4 6.1 4.1 3.1 2.5
QB . . . . . . . . . . . . . . . . . . . . . . . . . . . . . . . . . . . . . . 18.8 16.4 12.9 9.9 7.5Group 5 Assets . . . . . . . . . . . . . . . . . . . . . . . . . . . . . 12.1 8.2 5.9 4.5 3.5
Group 3
0% 120% 195% 250% 500%PSA Prepayment Assumption
AF, AS, GT, MA, MF, MS, NF and NS . . . . . . . . . . 12.8 4.0 4.0 4.0 2.8EA, GQ, GV, GW, GY and IA . . . . . . . . . . . . . . . . . 22.2 9.0 9.0 9.0 5.0EB, IY, YL, YM, YN and YP. . . . . . . . . . . . . . . . . . 24.1 11.6 11.6 11.6 6.4EC . . . . . . . . . . . . . . . . . . . . . . . . . . . . . . . . . . . . . . 25.3 14.5 14.5 14.5 7.9ED . . . . . . . . . . . . . . . . . . . . . . . . . . . . . . . . . . . . . . 26.3 20.3 20.3 20.3 11.5EG, EH, EJ, EN, IE and MB . . . . . . . . . . . . . . . . . . 22.9 10.0 10.0 10.0 5.6EP . . . . . . . . . . . . . . . . . . . . . . . . . . . . . . . . . . . . . . . 23.5 11.0 11.0 11.0 6.1EW . . . . . . . . . . . . . . . . . . . . . . . . . . . . . . . . . . . . . . 24.5 12.6 12.6 12.6 6.9GA, GB, GC, GH, GK, GL, GN, GP, HL,
IG and OG . . . . . . . . . . . . . . . . . . . . . . . . . . . . . . 27.7 15.2 3.1 2.0 1.1HB, HF and HS . . . . . . . . . . . . . . . . . . . . . . . . . . . . 29.1 22.3 11.1 3.9 1.8HC . . . . . . . . . . . . . . . . . . . . . . . . . . . . . . . . . . . . . . 29.7 26.9 20.9 5.7 2.1HK . . . . . . . . . . . . . . . . . . . . . . . . . . . . . . . . . . . . . . 29.4 24.6 16.0 4.8 2.0HN . . . . . . . . . . . . . . . . . . . . . . . . . . . . . . . . . . . . . . 28.4 18.8 5.0 2.9 0.7HQ . . . . . . . . . . . . . . . . . . . . . . . . . . . . . . . . . . . . . . 27.4 13.7 2.2 1.6 1.2HT . . . . . . . . . . . . . . . . . . . . . . . . . . . . . . . . . . . . . . 27.7 15.2 3.1 2.0 1.1IQ, NP, QM, QN, QP, QW and QY . . . . . . . . . . . . . 6.0 5.9 3.7 3.6 1.9ME and MX . . . . . . . . . . . . . . . . . . . . . . . . . . . . . . . 25.8 17.4 17.4 17.4 9.7NW . . . . . . . . . . . . . . . . . . . . . . . . . . . . . . . . . . . . . . 11.0 10.3 10.3 8.1 2.3NZ . . . . . . . . . . . . . . . . . . . . . . . . . . . . . . . . . . . . . . 28.4 19.3 11.1 2.8 1.1VA . . . . . . . . . . . . . . . . . . . . . . . . . . . . . . . . . . . . . . 7.0 7.0 7.0 7.0 6.3VZ . . . . . . . . . . . . . . . . . . . . . . . . . . . . . . . . . . . . . . 26.3 20.3 20.3 20.3 11.8Group 3 Assets . . . . . . . . . . . . . . . . . . . . . . . . . . . . . 19.6 9.9 7.5 6.3 3.7
Redemption Date 0% PSA 120% PSA 195% PSA 250% PSA 500% PSAPSA Prepayment Assumption
CM
May 15, 2011 . . . . . . . . 0.5 0.5 0.5 0.5 0.5November 15, 2011 . . . 1.0 1.0 1.0 1.0 1.0November 15, 2013 . . . 3.0 3.0 3.0 3.0 3.0November 15, 2015 . . . 5.0 5.0 5.0 5.0 5.0November 15, 2017 . . . 7.0 7.0 7.0 7.0 7.0November 15, 2020 . . . 10.0 10.0 10.0 10.0 8.9No Redemption . . . . . . 25.8 17.4 17.4 17.4 9.7
�����������������������������������
Group 4
0% 115% 220% 250% 500%PSA Prepayment Assumption
IK, KA, KE, KG, KH, KJ, KM, KN, KQ and KY . . 7.2 4.9 4.9 4.9 3.4KC . . . . . . . . . . . . . . . . . . . . . . . . . . . . . . . . . . . . . . 13.6 13.5 13.5 13.5 10.3KU . . . . . . . . . . . . . . . . . . . . . . . . . . . . . . . . . . . . . . 14.0 11.3 4.1 2.5 1.2Group 4 Assets . . . . . . . . . . . . . . . . . . . . . . . . . . . . . 8.6 6.3 5.1 4.8 3.3
Group 5
0% 100% 220% 350% 500%PSA Prepayment Assumption
QA, QD, QG, QI, QJ, QK, QL, WA, WB, WC,WD and WE . . . . . . . . . . . . . . . . . . . . . . . . . . . . . 10.4 6.1 4.1 3.1 2.5
QB . . . . . . . . . . . . . . . . . . . . . . . . . . . . . . . . . . . . . . 18.8 16.4 12.9 9.9 7.5Group 5 Assets . . . . . . . . . . . . . . . . . . . . . . . . . . . . . 12.1 8.2 5.9 4.5 3.5
III-7
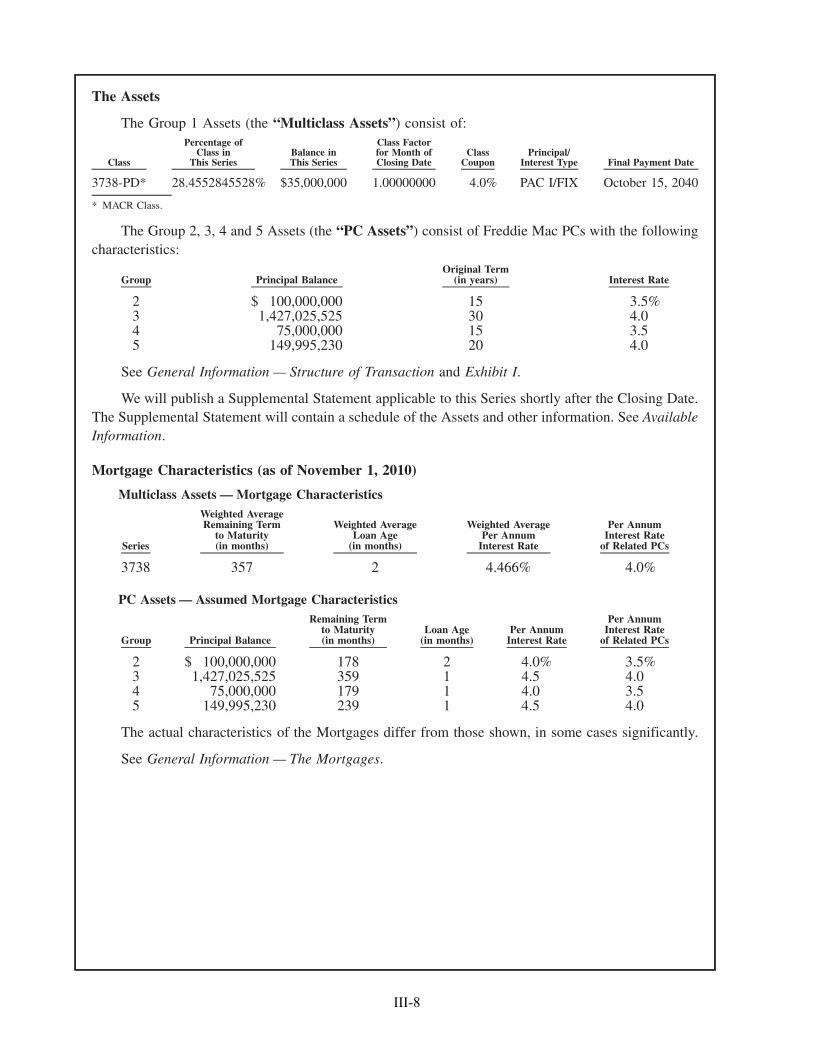
The Assets
The Group 1 Assets (the “Multiclass Assets”) consist of:
Class
Percentage ofClass in
This SeriesBalance inThis Series
Class Factorfor Month ofClosing Date
ClassCoupon
Principal/Interest Type Final Payment Date
3738-PD* 28.4552845528% $35,000,000 1.00000000 4.0% PAC I/FIX October 15, 2040
* MACR Class.
The Group 2, 3, 4 and 5 Assets (the “PC Assets”) consist of Freddie Mac PCs with the followingcharacteristics:
Group Principal BalanceOriginal Term
(in years) Interest Rate
2 $ 100,000,000 15 3.5%3 1,427,025,525 30 4.04 75,000,000 15 3.55 149,995,230 20 4.0
See General Information — Structure of Transaction and Exhibit I.
We will publish a Supplemental Statement applicable to this Series shortly after the Closing Date.The Supplemental Statement will contain a schedule of the Assets and other information. See AvailableInformation.
Mortgage Characteristics (as of November 1, 2010)
Multiclass Assets — Mortgage Characteristics
Series
Weighted AverageRemaining Term
to Maturity(in months)
Weighted AverageLoan Age
(in months)
Weighted AveragePer Annum
Interest Rate
Per AnnumInterest Rate
of Related PCs
3738 357 2 4.466% 4.0%
PC Assets — Assumed Mortgage Characteristics
Group Principal Balance
Remaining Termto Maturity(in months)
Loan Age(in months)
Per AnnumInterest Rate
Per AnnumInterest Rate
of Related PCs
2 $ 100,000,000 178 2 4.0% 3.5%3 1,427,025,525 359 1 4.5 4.04 75,000,000 179 1 4.0 3.55 149,995,230 239 1 4.5 4.0
The actual characteristics of the Mortgages differ from those shown, in some cases significantly.
See General Information — The Mortgages.
III-8
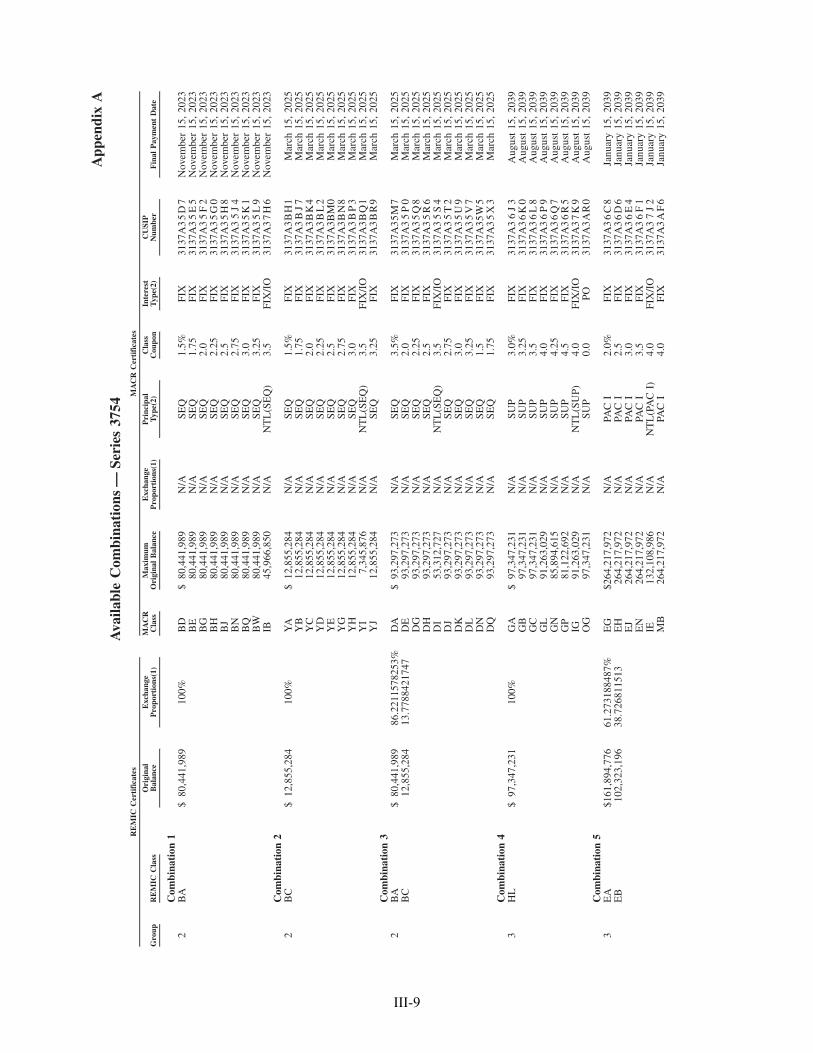
App
endi
xA
Ava
ilabl
eC
ombi
nati
ons
—Se
ries
3754
Gro
upR
EM
ICC
lass
Ori
gina
lB
alan
ceE
xcha
nge
Pro
port
ions
(1)
MA
CR
Cla
ssM
axim
umO
rigi
nal
Bal
ance
Exc
hang
eP
ropo
rtio
ns(1
)P
rinc
ipal
Typ
e(2)
Cla
ssC
oupo
nIn
tere
stT
ype(
2)C
USI
PN
umbe
rF
inal
Pay
men
tD
ate
RE
MIC
Cer
tifi
cate
sM
AC
RC
erti
fica
tes
Com
bina
tion
12
BA
$80
,441
,989
100%
BD
$80
,441
,989
N/A
SEQ
1.5%
FIX
3137
A3
5D
7N
ovem
ber
15,
2023
BE
80,4
41,9
89N
/ASE
Q1.
75FI
X31
37A
35
E5
Nov
embe
r15
,20
23B
G80
,441
,989
N/A
SEQ
2.0
FIX
3137
A3
5F
2N
ovem
ber
15,
2023
BH
80,4
41,9
89N
/ASE
Q2.
25FI
X31
37A
35
G0
Nov
embe
r15
,20
23B
J80
,441
,989
N/A
SEQ
2.5
FIX
3137
A3
5H
8N
ovem
ber
15,
2023
BN
80,4
41,9
89N
/ASE
Q2.
75FI
X31
37A
35
J4
Nov
embe
r15
,20
23B
Q80
,441
,989
N/A
SEQ
3.0
FIX
3137
A3
5K
1N
ovem
ber
15,
2023
BW
80,4
41,9
89N
/ASE
Q3.
25FI
X31
37A
35
L9
Nov
embe
r15
,20
23IB
45,9
66,8
50N
/AN
TL
(SE
Q)
3.5
FIX
/IO
3137
A3
7H
6N
ovem
ber
15,
2023
Com
bina
tion
22
BC
$12
,855
,284
100%
YA
$12
,855
,284
N/A
SEQ
1.5%
FIX
3137
A3
BH
1M
arch
15,
2025
YB
12,8
55,2
84N
/ASE
Q1.
75FI
X31
37A
3B
J7
Mar
ch15
,20
25Y
C12
,855
,284
N/A
SEQ
2.0
FIX
3137
A3
BK
4M
arch
15,
2025
YD
12,8
55,2
84N
/ASE
Q2.
25FI
X31
37A
3B
L2
Mar
ch15
,20
25Y
E12
,855
,284
N/A
SEQ
2.5
FIX
3137
A3B
M0
Mar
ch15
,20
25Y
G12
,855
,284
N/A
SEQ
2.75
FIX
3137
A3
BN
8M
arch
15,
2025
YH
12,8
55,2
84N
/ASE
Q3.
0FI
X31
37A
3B
P3
Mar
ch15
,20
25Y
I7,
345,
876
N/A
NT
L(S
EQ
)3.
5FI
X/I
O31
37A
3B
Q1
Mar
ch15
,20
25Y
J12
,855
,284
N/A
SEQ
3.25
FIX
3137
A3
BR
9M
arch
15,
2025
Com
bina
tion
32
BA
$80
,441
,989
86.2
2115
7825
3%D
A$
93,2
97,2
73N
/ASE
Q3.
5%FI
X31
37A
35
M7
Mar
ch15
,20
25B
C12
,855
,284
13.7
7884
2174
7D
E93
,297
,273
N/A
SEQ
2.0
FIX
3137
A3
5P
0M
arch
15,
2025
DG
93,2
97,2
73N
/ASE
Q2.
25FI
X31
37A
35
Q8
Mar
ch15
,20
25D
H93
,297
,273
N/A
SEQ
2.5
FIX
3137
A3
5R
6M
arch
15,
2025
DI
53,3
12,7
27N
/AN
TL
(SE
Q)
3.5
FIX
/IO
3137
A3
5S
4M
arch
15,
2025
DJ
93,2
97,2
73N
/ASE
Q2.
75FI
X31
37A
35
T2
Mar
ch15
,20
25D
K93
,297
,273
N/A
SEQ
3.0
FIX
3137
A3
5U
9M
arch
15,
2025
DL
93,2
97,2
73N
/ASE
Q3.
25FI
X31
37A
35
V7
Mar
ch15
,20
25D
N93
,297
,273
N/A
SEQ
1.5
FIX
3137
A35
W5
Mar
ch15
,20
25D
Q93
,297
,273
N/A
SEQ
1.75
FIX
3137
A3
5X
3M
arch
15,
2025
Com
bina
tion
43
HL
$97
,347
,231
100%
GA
$97
,347
,231
N/A
SUP
3.0%
FIX
3137
A3
6J
3A
ugus
t15
,20
39G
B97
,347
,231
N/A
SUP
3.25
FIX
3137
A3
6K
0A
ugus
t15
,20
39G
C97
,347
,231
N/A
SUP
3.5
FIX
3137
A3
6L
8A
ugus
t15
,20
39G
L91
,263
,029
N/A
SUP
4.0
FIX
3137
A3
6P
9A
ugus
t15
,20
39G
N85
,894
,615
N/A
SUP
4.25
FIX
3137
A3
6Q
7A
ugus
t15
,20
39G
P81
,122
,692
N/A
SUP
4.5
FIX
3137
A3
6R
5A
ugus
t15
,20
39IG
91,2
63,0
29N
/AN
TL
(SU
P)4.
0FI
X/I
O31
37A
37
K9
Aug
ust
15,
2039
OG
97,3
47,2
31N
/ASU
P0.
0PO
3137
A3
AR
0A
ugus
t15
,20
39C
ombi
nati
on5
3E
A$1
61,8
94,7
7661
.273
1884
87%
EG
$264
,217
,972
N/A
PAC
I2.
0%FI
X31
37A
36
C8
Janu
ary
15,
2039
EB
102,
323,
196
38.7
2681
1513
EH
264,
217,
972
N/A
PAC
I2.
5FI
X31
37A
36
D6
Janu
ary
15,
2039
EJ
264,
217,
972
N/A
PAC
I3.
0FI
X31
37A
36
E4
Janu
ary
15,
2039
EN
264,
217,
972
N/A
PAC
I3.
5FI
X31
37A
36
F1
Janu
ary
15,
2039
IE13
2,10
8,98
6N
/AN
TL
(PA
CI)
4.0
FIX
/IO
3137
A3
7J
2Ja
nuar
y15
,20
39M
B26
4,21
7,97
2N
/APA
CI
4.0
FIX
3137
A3
AF
6Ja
nuar
y15
,20
39
III-9
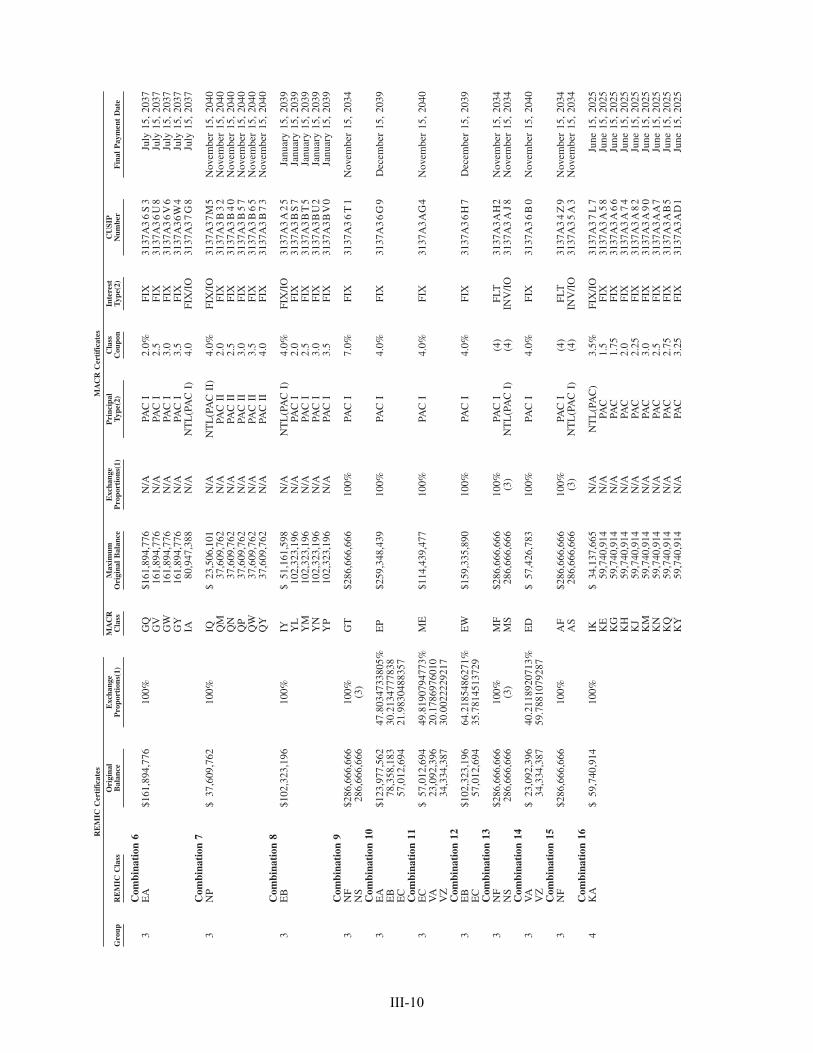
Gro
upR
EM
ICC
lass
Ori
gina
lB
alan
ceE
xcha
nge
Pro
port
ions
(1)
MA
CR
Cla
ssM
axim
umO
rigi
nal
Bal
ance
Exc
hang
eP
ropo
rtio
ns(1
)P
rinc
ipal
Typ
e(2)
Cla
ssC
oupo
nIn
tere
stT
ype(
2)C
USI
PN
umbe
rF
inal
Pay
men
tD
ate
RE
MIC
Cer
tifi
cate
sM
AC
RC
erti
fica
tes
Com
bina
tion
63
EA
$161
,894
,776
100%
GQ
$161
,894
,776
N/A
PAC
I2.
0%FI
X31
37A
36
S3
July
15,
2037
GV
161,
894,
776
N/A
PAC
I2.
5FI
X31
37A
36
U8
July
15,
2037
GW
161,
894,
776
N/A
PAC
I3.
0FI
X31
37A
36
V6
July
15,
2037
GY
161,
894,
776
N/A
PAC
I3.
5FI
X31
37A
36W
4Ju
ly15
,20
37IA
80,9
47,3
88N
/AN
TL
(PA
CI)
4.0
FIX
/IO
3137
A3
7G
8Ju
ly15
,20
37C
ombi
nati
on7
3N
P$
37,6
09,7
6210
0%IQ
$23
,506
,101
N/A
NT
L(P
AC
II)
4.0%
FIX
/IO
3137
A3
7M
5N
ovem
ber
15,
2040
QM
37,6
09,7
62N
/APA
CII
2.0
FIX
3137
A3
B3
2N
ovem
ber
15,
2040
QN
37,6
09,7
62N
/APA
CII
2.5
FIX
3137
A3
B4
0N
ovem
ber
15,
2040
QP
37,6
09,7
62N
/APA
CII
3.0
FIX
3137
A3
B5
7N
ovem
ber
15,
2040
QW
37,6
09,7
62N
/APA
CII
3.5
FIX
3137
A3
B6
5N
ovem
ber
15,
2040
QY
37,6
09,7
62N
/APA
CII
4.0
FIX
3137
A3
B7
3N
ovem
ber
15,
2040
Com
bina
tion
83
EB
$102
,323
,196
100%
IY$
51,1
61,5
98N
/AN
TL
(PA
CI)
4.0%
FIX
/IO
3137
A3
A2
5Ja
nuar
y15
,20
39Y
L10
2,32
3,19
6N
/APA
CI
2.0
FIX
3137
A3
BS
7Ja
nuar
y15
,20
39Y
M10
2,32
3,19
6N
/APA
CI
2.5
FIX
3137
A3
BT
5Ja
nuar
y15
,20
39Y
N10
2,32
3,19
6N
/APA
CI
3.0
FIX
3137
A3
BU
2Ja
nuar
y15
,20
39Y
P10
2,32
3,19
6N
/APA
CI
3.5
FIX
3137
A3
BV
0Ja
nuar
y15
,20
39C
ombi
nati
on9
3N
F$2
86,6
66,6
6610
0%G
T$2
86,6
66,6
6610
0%PA
CI
7.0%
FIX
3137
A3
6T
1N
ovem
ber
15,
2034
NS
286,
666,
666
(3)
Com
bina
tion
103
EA
$123
,977
,562
47.8
0347
3380
5%E
P$2
59,3
48,4
3910
0%PA
CI
4.0%
FIX
3137
A3
6G
9D
ecem
ber
15,
2039
EB
78,3
58,1
8330
.213
4777
838
EC
57,0
12,6
9421
.983
0488
357
Com
bina
tion
113
EC
$57
,012
,694
49.8
1907
9477
3%M
E$1
14,4
39,4
7710
0%PA
CI
4.0%
FIX
3137
A3A
G4
Nov
embe
r15
,20
40V
A23
,092
,396
20.1
7869
7601
0V
Z34
,334
,387
30.0
0222
2921
7C
ombi
nati
on12
3E
B$1
02,3
23,1
9664
.218
5486
271%
EW
$159
,335
,890
100%
PAC
I4.
0%FI
X31
37A
36
H7
Dec
embe
r15
,20
39E
C57
,012
,694
35.7
8145
1372
9C
ombi
nati
on13
3N
F$2
86,6
66,6
6610
0%M
F$2
86,6
66,6
6610
0%PA
CI
(4)
FLT
3137
A3A
H2
Nov
embe
r15
,20
34N
S28
6,66
6,66
6(3
)M
S28
6,66
6,66
6(3
)N
TL
(PA
CI)
(4)
INV
/IO
3137
A3
AJ8
Nov
embe
r15
,20
34C
ombi
nati
on14
3V
A$
23,0
92,3
9640
.211
8920
713%
ED
$57
,426
,783
100%
PAC
I4.
0%FI
X31
37A
36
B0
Nov
embe
r15
,20
40V
Z34
,334
,387
59.7
8810
7928
7C
ombi
nati
on15
3N
F$2
86,6
66,6
6610
0%A
F$2
86,6
66,6
6610
0%PA
CI
(4)
FLT
3137
A3
4Z
9N
ovem
ber
15,
2034
AS
286,
666,
666
(3)
NT
L(P
AC
I)(4
)IN
V/I
O31
37A
35
A3
Nov
embe
r15
,20
34C
ombi
nati
on16
4K
A$
59,7
40,9
1410
0%IK
$34
,137
,665
N/A
NT
L(P
AC
)3.
5%FI
X/I
O31
37A
37
L7
June
15,
2025
KE
59,7
40,9
14N
/APA
C1.
5FI
X31
37A
3A
58
June
15,
2025
KG
59,7
40,9
14N
/APA
C1.
75FI
X31
37A
3A
66
June
15,
2025
KH
59,7
40,9
14N
/APA
C2.
0FI
X31
37A
3A
74
June
15,
2025
KJ
59,7
40,9
14N
/APA
C2.
25FI
X31
37A
3A
82
June
15,
2025
KM
59,7
40,9
14N
/APA
C3.
0FI
X31
37A
3A
90
June
15,
2025
KN
59,7
40,9
14N
/APA
C2.
5FI
X31
37A
3AA
7Ju
ne15
,20
25K
Q59
,740
,914
N/A
PAC
2.75
FIX
3137
A3
AB
5Ju
ne15
,20
25K
Y59
,740
,914
N/A
PAC
3.25
FIX
3137
A3A
D1
June
15,
2025
III-10
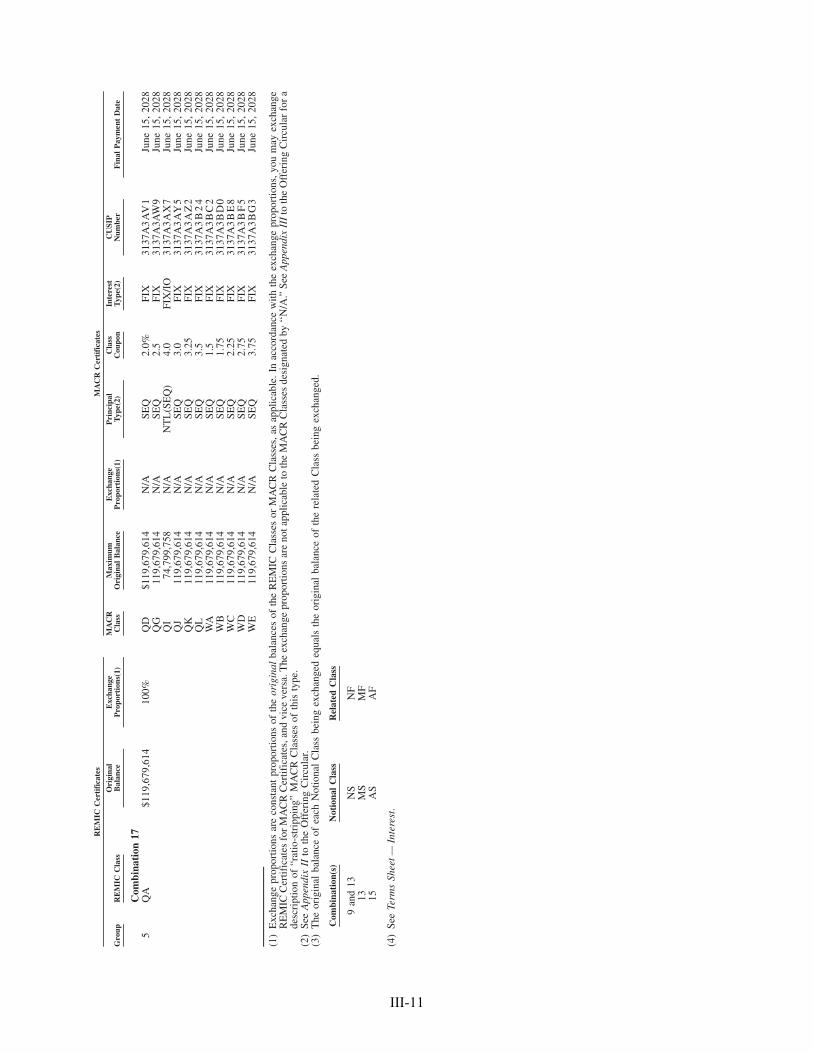
Gro
upR
EM
ICC
lass
Ori
gina
lB
alan
ceE
xcha
nge
Pro
port
ions
(1)
MA
CR
Cla
ssM
axim
umO
rigi
nal
Bal
ance
Exc
hang
eP
ropo
rtio
ns(1
)P
rinc
ipal
Typ
e(2)
Cla
ssC
oupo
nIn
tere
stT
ype(
2)C
USI
PN
umbe
rF
inal
Pay
men
tD
ate
RE
MIC
Cer
tifi
cate
sM
AC
RC
erti
fica
tes
Com
bina
tion
175
QA
$119
,679
,614
100%
QD
$119
,679
,614
N/A
SEQ
2.0%
FIX
3137
A3
AV
1Ju
ne15
,20
28Q
G11
9,67
9,61
4N
/ASE
Q2.
5FI
X31
37A
3AW
9Ju
ne15
,20
28Q
I74
,799
,758
N/A
NT
L(S
EQ
)4.
0FI
X/I
O31
37A
3AX
7Ju
ne15
,20
28Q
J11
9,67
9,61
4N
/ASE
Q3.
0FI
X31
37A
3A
Y5
June
15,
2028
QK
119,
679,
614
N/A
SEQ
3.25
FIX
3137
A3
AZ
2Ju
ne15
,20
28Q
L11
9,67
9,61
4N
/ASE
Q3.
5FI
X31
37A
3B
24
June
15,
2028
WA
119,
679,
614
N/A
SEQ
1.5
FIX
3137
A3
BC
2Ju
ne15
,20
28W
B11
9,67
9,61
4N
/ASE
Q1.
75FI
X31
37A
3B
D0
June
15,
2028
WC
119,
679,
614
N/A
SEQ
2.25
FIX
3137
A3
BE
8Ju
ne15
,20
28W
D11
9,67
9,61
4N
/ASE
Q2.
75FI
X31
37A
3B
F5
June
15,
2028
WE
119,
679,
614
N/A
SEQ
3.75
FIX
3137
A3
BG
3Ju
ne15
,20
28
(1)
Exc
hang
epr
opor
tions
are
cons
tant
prop
ortio
nsof
the
orig
inal
bala
nces
ofth
eR
EM
ICC
lass
esor
MA
CR
Cla
sses
,as
appl
icab
le.
Inac
cord
ance
with
the
exch
ange
prop
ortio
ns,y
oum
ayex
chan
geR
EM
ICC
ertif
icat
esfo
rM
AC
RC
ertif
icat
es,a
ndvi
ceve
rsa.
The
exch
ange
prop
ortio
nsar
eno
tapp
licab
leto
the
MA
CR
Cla
sses
desi
gnat
edby
‘‘N
/A.”
See
App
endi
xII
Ito
the
Off
erin
gC
ircu
lar
for
ade
scri
ptio
nof
“rat
io-s
trip
ping
”M
AC
RC
lass
esof
this
type
.(2
)Se
eA
ppen
dix
IIto
the
Off
erin
gC
ircu
lar.
(3)
The
orig
inal
bala
nce
ofea
chN
otio
nal
Cla
ssbe
ing
exch
ange
deq
uals
the
orig
inal
bala
nce
ofth
ere
late
dC
lass
bein
gex
chan
ged.
Com
bina
tion
(s)
Not
iona
lC
lass
Rel
ated
Cla
ss
9an
d13
NS
NF
13M
SM
F15
AS
AF
(4)
See
Term
sSh
eet—
Inte
rest
.
III-11
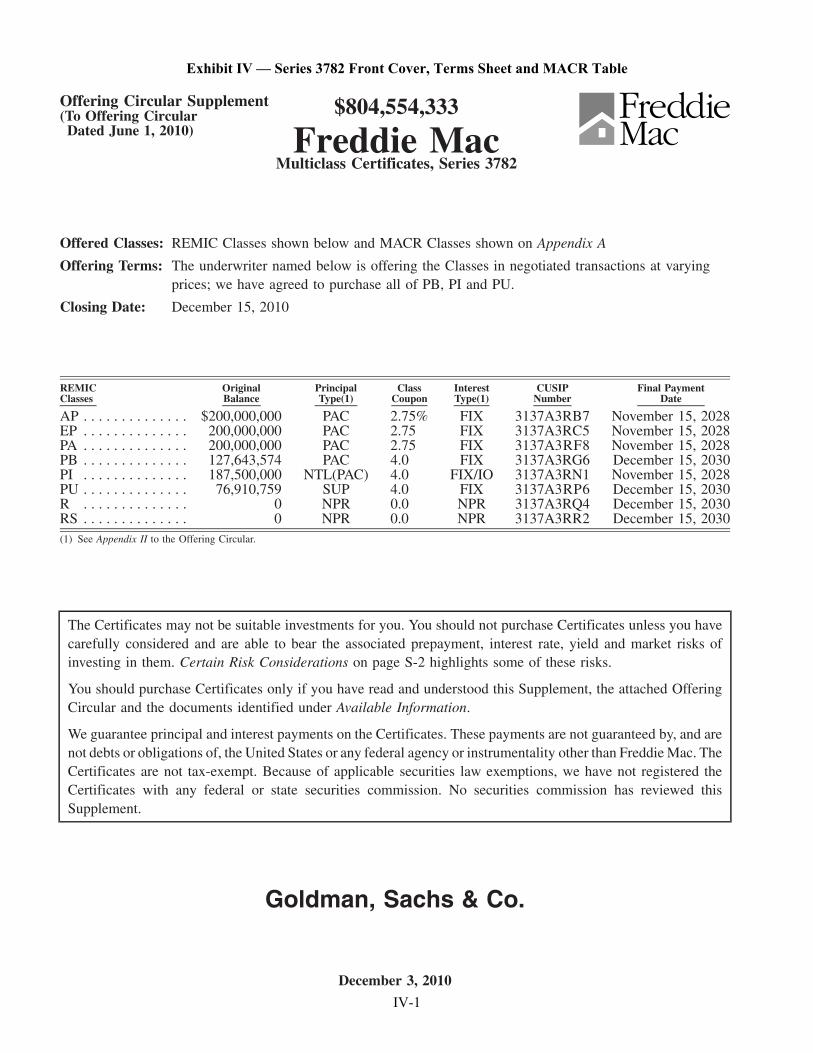
Offering Circular Supplement(To Offering Circular
Dated June 1, 2010)
$804,554,333
Freddie MacMulticlass Certificates, Series 3782
Offered Classes: REMIC Classes shown below and MACR Classes shown on Appendix A
Offering Terms: The underwriter named below is offering the Classes in negotiated transactions at varyingprices; we have agreed to purchase all of PB, PI and PU.
Closing Date: December 15, 2010
REMICClasses
OriginalBalance
PrincipalType(1)
ClassCoupon
InterestType(1)
CUSIPNumber
Final PaymentDate
AP . . . . . . . . . . . . . . $200,000,000 PAC 2.75% FIX 3137A3RB7 November 15, 2028EP . . . . . . . . . . . . . . 200,000,000 PAC 2.75 FIX 3137A3RC5 November 15, 2028PA . . . . . . . . . . . . . . 200,000,000 PAC 2.75 FIX 3137A3RF8 November 15, 2028PB . . . . . . . . . . . . . . 127,643,574 PAC 4.0 FIX 3137A3RG6 December 15, 2030PI . . . . . . . . . . . . . . 187,500,000 NTL(PAC) 4.0 FIX/IO 3137A3RN1 November 15, 2028PU . . . . . . . . . . . . . . 76,910,759 SUP 4.0 FIX 3137A3RP6 December 15, 2030R . . . . . . . . . . . . . . 0 NPR 0.0 NPR 3137A3RQ4 December 15, 2030RS . . . . . . . . . . . . . . 0 NPR 0.0 NPR 3137A3RR2 December 15, 2030(1) See Appendix II to the Offering Circular.
The Certificates may not be suitable investments for you. You should not purchase Certificates unless you havecarefully considered and are able to bear the associated prepayment, interest rate, yield and market risks ofinvesting in them. Certain Risk Considerations on page S-2 highlights some of these risks.
You should purchase Certificates only if you have read and understood this Supplement, the attached OfferingCircular and the documents identified under Available Information.
We guarantee principal and interest payments on the Certificates. These payments are not guaranteed by, and arenot debts or obligations of, the United States or any federal agency or instrumentality other than Freddie Mac. TheCertificates are not tax-exempt. Because of applicable securities law exemptions, we have not registered theCertificates with any federal or state securities commission. No securities commission has reviewed thisSupplement.
Goldman, Sachs & Co.
December 3, 2010
Exhibit IV — Series 3782 Front Cover, Terms Sheet and MACR Table
IV-1
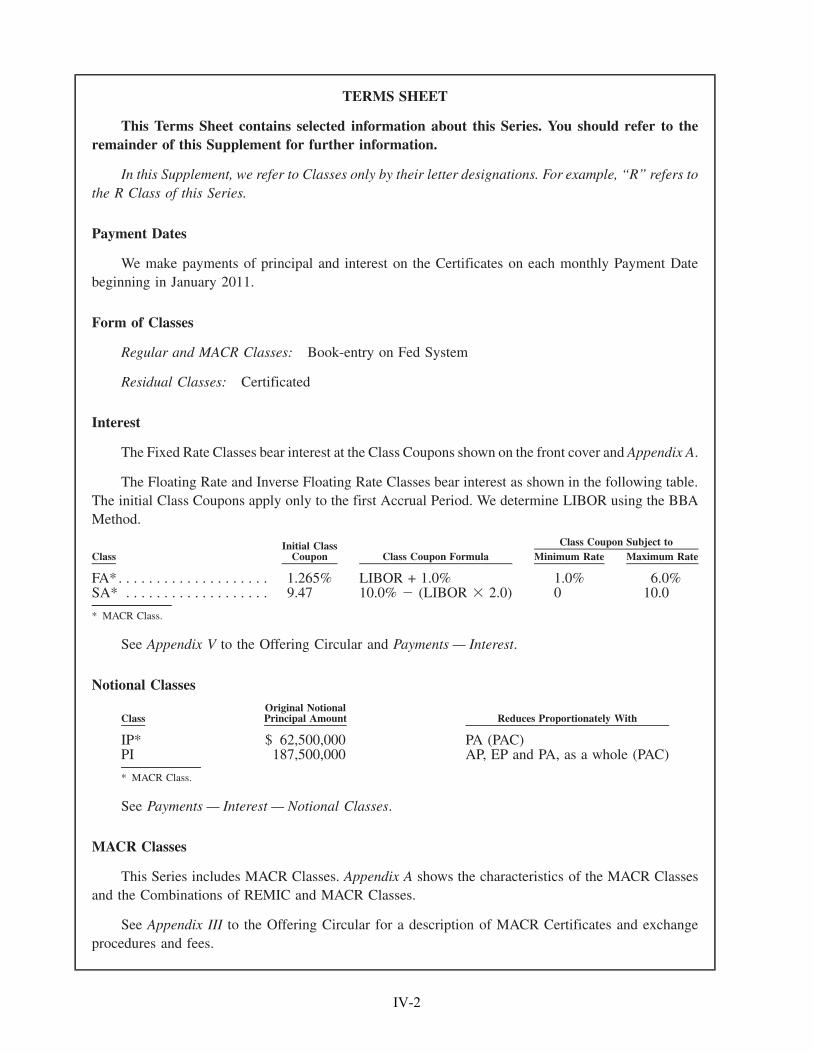
TERMS SHEET
This Terms Sheet contains selected information about this Series. You should refer to theremainder of this Supplement for further information.
In this Supplement, we refer to Classes only by their letter designations. For example, “R” refers tothe R Class of this Series.
Payment Dates
We make payments of principal and interest on the Certificates on each monthly Payment Datebeginning in January 2011.
Form of Classes
Regular and MACR Classes: Book-entry on Fed System
Residual Classes: Certificated
Interest
The Fixed Rate Classes bear interest at the Class Coupons shown on the front cover and Appendix A.
The Floating Rate and Inverse Floating Rate Classes bear interest as shown in the following table.The initial Class Coupons apply only to the first Accrual Period. We determine LIBOR using the BBAMethod.
ClassInitial Class
Coupon Class Coupon Formula Minimum Rate Maximum RateClass Coupon Subject to
FA*. . . . . . . . . . . . . . . . . . . . 1.265% LIBOR + 1.0% 1.0% 6.0%SA* . . . . . . . . . . . . . . . . . . . 9.47 10.0% � (LIBOR � 2.0) 0 10.0
* MACR Class.
See Appendix V to the Offering Circular and Payments — Interest.
Notional Classes
ClassOriginal NotionalPrincipal Amount Reduces Proportionately With
IP* $ 62,500,000 PA (PAC)PI 187,500,000 AP, EP and PA, as a whole (PAC)
* MACR Class.
See Payments — Interest — Notional Classes.
MACR Classes
This Series includes MACR Classes. Appendix A shows the characteristics of the MACR Classesand the Combinations of REMIC and MACR Classes.
See Appendix III to the Offering Circular for a description of MACR Certificates and exchangeprocedures and fees.
IV-2
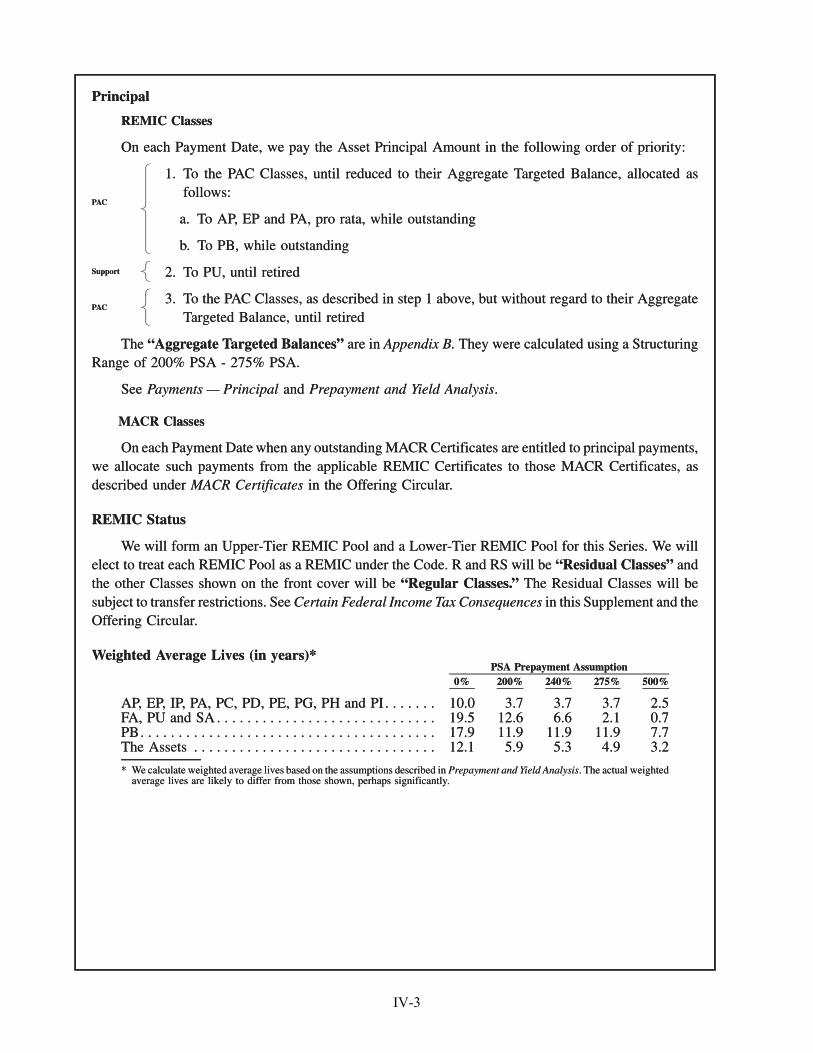
Principal
REMIC Classes
On each Payment Date, we pay the Asset Principal Amount in the following order of priority:
1. To the PAC Classes, until reduced to their Aggregate Targeted Balance, allocated asfollows:
a. To AP, EP and PA, pro rata, while outstanding
b. To PB, while outstanding
PAC
2. To PU, until retiredSupport
3. To the PAC Classes, as described in step 1 above, but without regard to their AggregateTargeted Balance, until retired
PAC
The “Aggregate Targeted Balances” are in Appendix B. They were calculated using a StructuringRange of 200% PSA - 275% PSA.
See Payments — Principal and Prepayment and Yield Analysis.
MACR Classes
On each Payment Date when any outstanding MACR Certificates are entitled to principal payments,we allocate such payments from the applicable REMIC Certificates to those MACR Certificates, asdescribed under MACR Certificates in the Offering Circular.
REMIC Status
We will form an Upper-Tier REMIC Pool and a Lower-Tier REMIC Pool for this Series. We willelect to treat each REMIC Pool as a REMIC under the Code. R and RS will be “Residual Classes” andthe other Classes shown on the front cover will be “Regular Classes.” The Residual Classes will besubject to transfer restrictions. See Certain Federal Income Tax Consequences in this Supplement and theOffering Circular.
Weighted Average Lives (in years)*
0% 200% 240% 275% 500%PSA Prepayment Assumption
AP, EP, IP, PA, PC, PD, PE, PG, PH and PI . . . . . . . 10.0 3.7 3.7 3.7 2.5FA, PU and SA . . . . . . . . . . . . . . . . . . . . . . . . . . . . . 19.5 12.6 6.6 2.1 0.7PB. . . . . . . . . . . . . . . . . . . . . . . . . . . . . . . . . . . . . . . 17.9 11.9 11.9 11.9 7.7The Assets . . . . . . . . . . . . . . . . . . . . . . . . . . . . . . . . 12.1 5.9 5.3 4.9 3.2
* We calculate weighted average lives based on the assumptions described in Prepayment and Yield Analysis. The actual weightedaverage lives are likely to differ from those shown, perhaps significantly.
Principal
REMIC Classes
On each Payment Date, we pay the Asset Principal Amount in the following order of priority:
1. To the PAC Classes, until reduced to their Aggregate Targeted Balance, allocated asfollows:
a. To AP, EP and PA, pro rata, while outstanding
b. To PB, while outstanding
�����������������������������
PAC
2. To PU, until retired�����Support
3. To the PAC Classes, as described in step 1 above, but without regard to their AggregateTargeted Balance, until retired
�����������
PAC
The “Aggregate Targeted Balances” are in Appendix B. They were calculated using a StructuringRange of 200% PSA - 275% PSA.
See Payments — Principal and Prepayment and Yield Analysis.
MACR Classes
On each Payment Date when any outstanding MACR Certificates are entitled to principal payments,we allocate such payments from the applicable REMIC Certificates to those MACR Certificates, asdescribed under MACR Certificates in the Offering Circular.
REMIC Status
We will form an Upper-Tier REMIC Pool and a Lower-Tier REMIC Pool for this Series. We willelect to treat each REMIC Pool as a REMIC under the Code. R and RS will be “Residual Classes” andthe other Classes shown on the front cover will be “Regular Classes.” The Residual Classes will besubject to transfer restrictions. See Certain Federal Income Tax Consequences in this Supplement and theOffering Circular.
Weighted Average Lives (in years)*
0% 200% 240% 275% 500%PSA Prepayment Assumption
AP, EP, IP, PA, PC, PD, PE, PG, PH and PI . . . . . . . 10.0 3.7 3.7 3.7 2.5FA, PU and SA . . . . . . . . . . . . . . . . . . . . . . . . . . . . . 19.5 12.6 6.6 2.1 0.7PB. . . . . . . . . . . . . . . . . . . . . . . . . . . . . . . . . . . . . . . 17.9 11.9 11.9 11.9 7.7The Assets . . . . . . . . . . . . . . . . . . . . . . . . . . . . . . . . 12.1 5.9 5.3 4.9 3.2
* We calculate weighted average lives based on the assumptions described in Prepayment and Yield Analysis. The actual weightedaverage lives are likely to differ from those shown, perhaps significantly.
IV-3
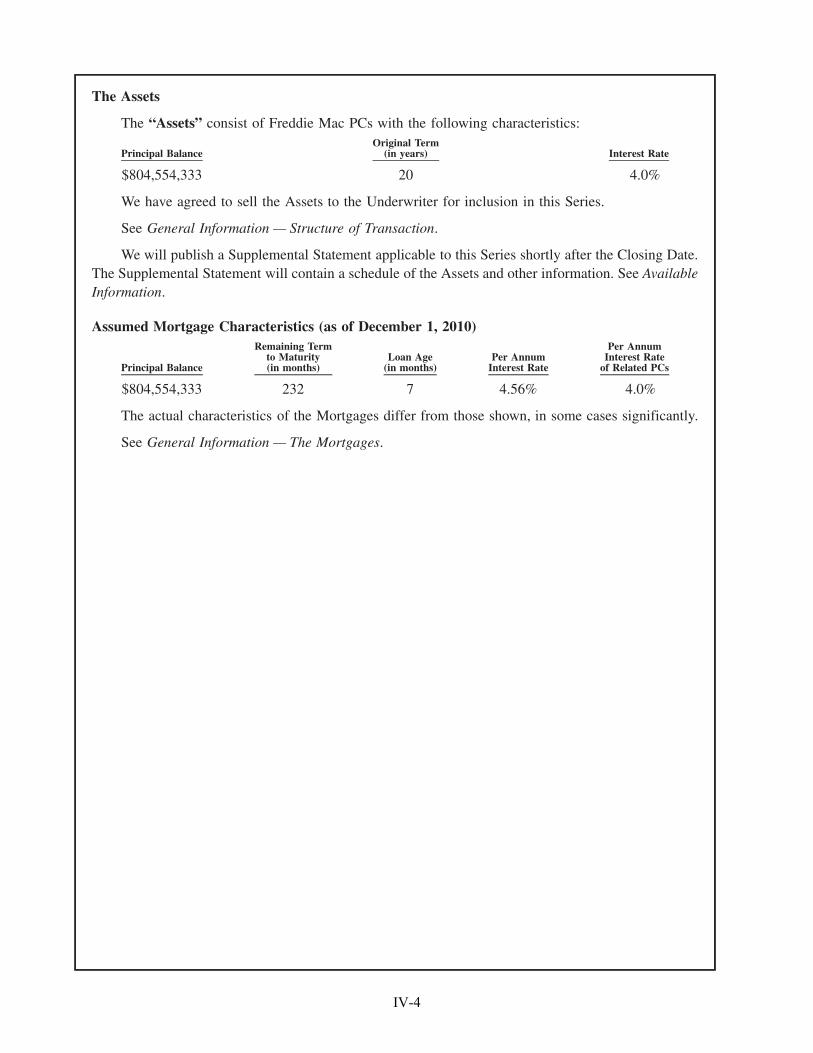
The Assets
The “Assets” consist of Freddie Mac PCs with the following characteristics:
Principal BalanceOriginal Term
(in years) Interest Rate
$804,554,333 20 4.0%
We have agreed to sell the Assets to the Underwriter for inclusion in this Series.
See General Information — Structure of Transaction.
We will publish a Supplemental Statement applicable to this Series shortly after the Closing Date.The Supplemental Statement will contain a schedule of the Assets and other information. See AvailableInformation.
Assumed Mortgage Characteristics (as of December 1, 2010)
Principal Balance
Remaining Termto Maturity(in months)
Loan Age(in months)
Per AnnumInterest Rate
Per AnnumInterest Rate
of Related PCs
$804,554,333 232 7 4.56% 4.0%
The actual characteristics of the Mortgages differ from those shown, in some cases significantly.
See General Information — The Mortgages.
IV-4
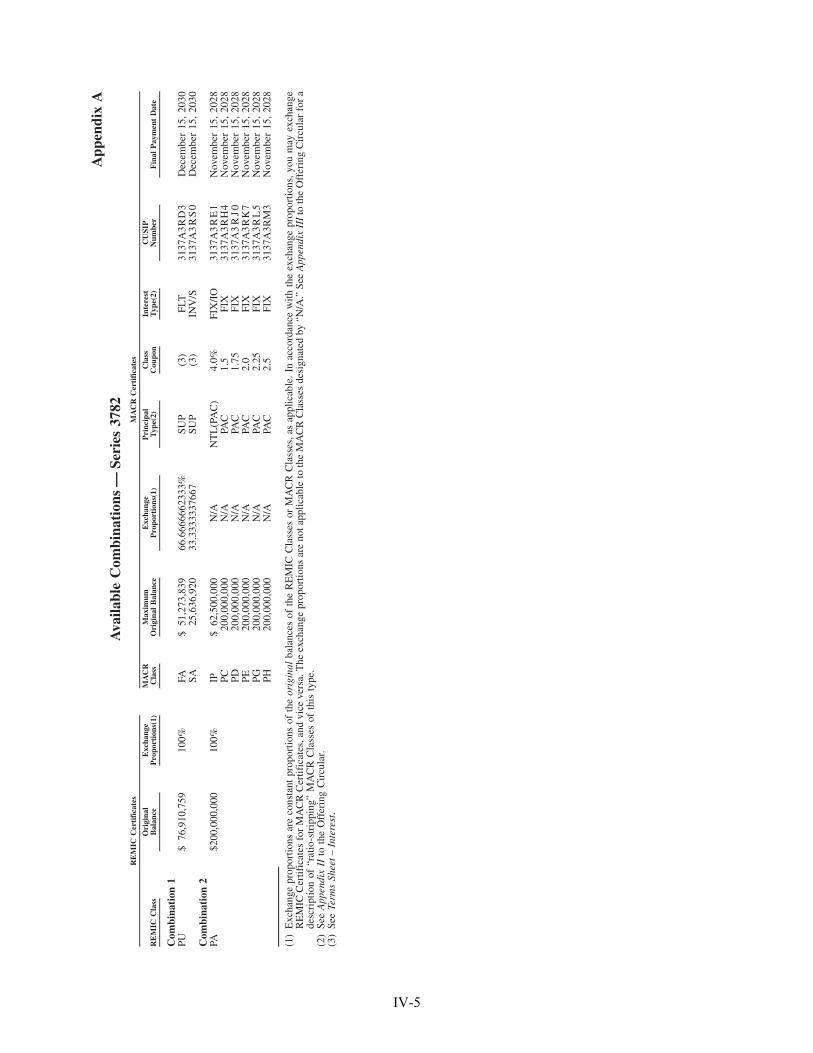
App
endi
xA
Ava
ilabl
eC
ombi
nati
ons
—Se
ries
3782
RE
MIC
Cla
ssO
rigi
nal
Bal
ance
Exc
hang
eP
ropo
rtio
ns(1
)M
AC
RC
lass
Max
imum
Ori
gina
lB
alan
ceE
xcha
nge
Pro
port
ions
(1)
Pri
ncip
alT
ype(
2)C
lass
Cou
pon
Inte
rest
Typ
e(2)
CU
SIP
Num
ber
Fin
alP
aym
ent
Dat
e
RE
MIC
Cer
tifi
cate
sM
AC
RC
erti
fica
tes
Com
bina
tion
1PU
$76
,910
,759
100%
FA$
51,2
73,8
3966
.666
6662
333%
SUP
(3)
FLT
3137
A3R
D3
Dec
embe
r15
,20
30SA
25,6
36,9
2033
.333
3337
667
SUP
(3)
INV
/S31
37A
3R
S0
Dec
embe
r15
,20
30C
ombi
nati
on2
PA$2
00,0
00,0
0010
0%IP
$62
,500
,000
N/A
NT
L(P
AC
)4.
0%FI
X/I
O31
37A
3R
E1
Nov
embe
r15
,20
28PC
200,
000,
000
N/A
PAC
1.5
FIX
3137
A3R
H4
Nov
embe
r15
,20
28PD
200,
000,
000
N/A
PAC
1.75
FIX
3137
A3
RJ0
Nov
embe
r15
,20
28PE
200,
000,
000
N/A
PAC
2.0
FIX
3137
A3R
K7
Nov
embe
r15
,20
28PG
200,
000,
000
N/A
PAC
2.25
FIX
3137
A3
RL
5N
ovem
ber
15,
2028
PH20
0,00
0,00
0N
/APA
C2.
5FI
X31
37A
3RM
3N
ovem
ber
15,
2028
(1)
Exc
hang
epr
opor
tions
are
cons
tant
prop
ortio
nsof
the
orig
inal
bala
nces
ofth
eR
EM
ICC
lass
esor
MA
CR
Cla
sses
,as
appl
icab
le.
Inac
cord
ance
with
the
exch
ange
prop
ortio
ns,y
oum
ayex
chan
geR
EM
ICC
ertif
icat
esfo
rM
AC
RC
ertif
icat
es,a
ndvi
ceve
rsa.
The
exch
ange
prop
ortio
nsar
eno
tapp
licab
leto
the
MA
CR
Cla
sses
desi
gnat
edby
“N/A
.”Se
eA
ppen
dix
III
toth
eO
ffer
ing
Cir
cula
rfo
ra
desc
ript
ion
of“r
atio
-str
ippi
ng”
MA
CR
Cla
sses
ofth
isty
pe.
(2)
See
App
endi
xII
toth
eO
ffer
ing
Cir
cula
r.(3
)Se
eTe
rms
Shee
t–In
tere
st.
IV-5
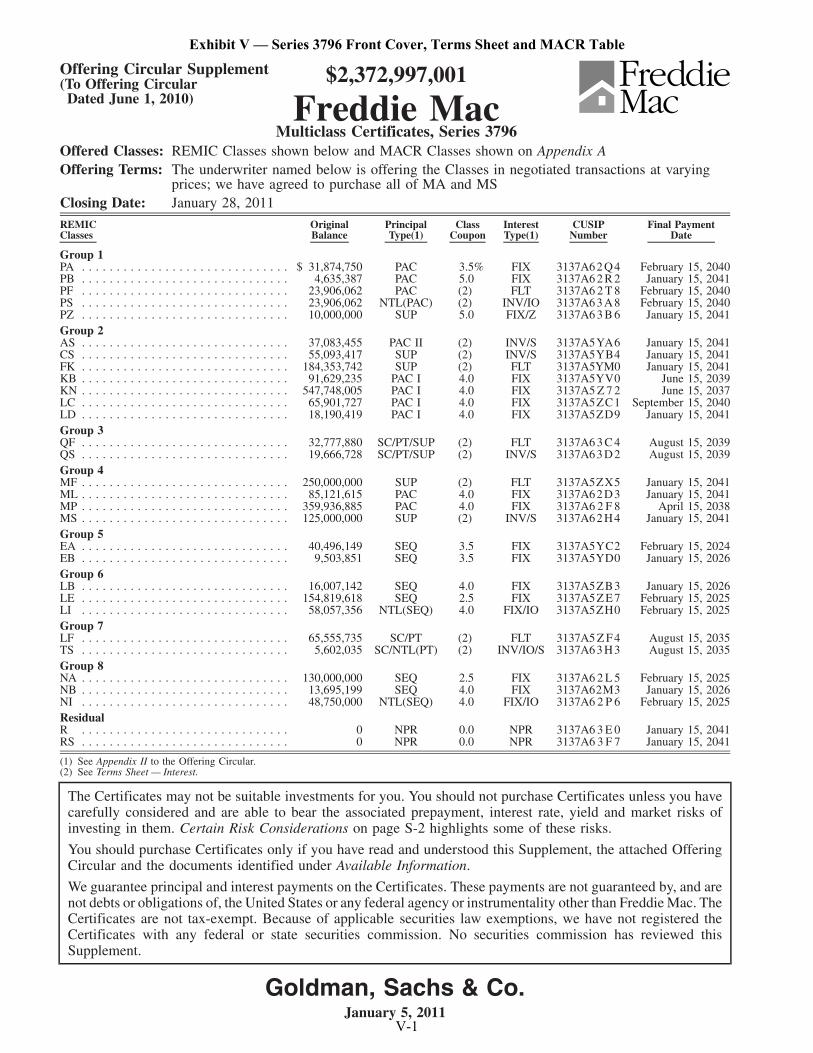
Offering Circular Supplement(To Offering Circular
Dated June 1, 2010)
$2,372,997,001
Freddie MacMulticlass Certificates, Series 3796
Offered Classes: REMIC Classes shown below and MACR Classes shown on Appendix AOffering Terms: The underwriter named below is offering the Classes in negotiated transactions at varying
prices; we have agreed to purchase all of MA and MSClosing Date: January 28, 2011
REMICClasses
OriginalBalance
PrincipalType(1)
ClassCoupon
InterestType(1)
CUSIPNumber
Final PaymentDate
Group 1PA . . . . . . . . . . . . . . . . . . . . . . . . . . . . . . $ 31,874,750 PAC 3.5% FIX 3137A62 Q4 February 15, 2040PB . . . . . . . . . . . . . . . . . . . . . . . . . . . . . . 4,635,387 PAC 5.0 FIX 3137A6 2 R 2 January 15, 2041PF . . . . . . . . . . . . . . . . . . . . . . . . . . . . . . 23,906,062 PAC (2) FLT 3137A6 2 T 8 February 15, 2040PS . . . . . . . . . . . . . . . . . . . . . . . . . . . . . . 23,906,062 NTL(PAC) (2) INV/IO 3137A63 A8 February 15, 2040PZ . . . . . . . . . . . . . . . . . . . . . . . . . . . . . . 10,000,000 SUP 5.0 FIX/Z 3137A6 3 B 6 January 15, 2041Group 2AS . . . . . . . . . . . . . . . . . . . . . . . . . . . . . . 37,083,455 PAC II (2) INV/S 3137A5YA6 January 15, 2041CS . . . . . . . . . . . . . . . . . . . . . . . . . . . . . . 55,093,417 SUP (2) INV/S 3137A5YB4 January 15, 2041FK . . . . . . . . . . . . . . . . . . . . . . . . . . . . . . 184,353,742 SUP (2) FLT 3137A5YM0 January 15, 2041KB . . . . . . . . . . . . . . . . . . . . . . . . . . . . . . 91,629,235 PAC I 4.0 FIX 3137A5YV0 June 15, 2039KN . . . . . . . . . . . . . . . . . . . . . . . . . . . . . . 547,748,005 PAC I 4.0 FIX 3137A5 Z 7 2 June 15, 2037LC . . . . . . . . . . . . . . . . . . . . . . . . . . . . . . 65,901,727 PAC I 4.0 FIX 3137A5ZC1 September 15, 2040LD . . . . . . . . . . . . . . . . . . . . . . . . . . . . . . 18,190,419 PAC I 4.0 FIX 3137A5ZD9 January 15, 2041Group 3QF . . . . . . . . . . . . . . . . . . . . . . . . . . . . . . 32,777,880 SC/PT/SUP (2) FLT 3137A6 3 C 4 August 15, 2039QS . . . . . . . . . . . . . . . . . . . . . . . . . . . . . . 19,666,728 SC/PT/SUP (2) INV/S 3137A63 D2 August 15, 2039Group 4MF . . . . . . . . . . . . . . . . . . . . . . . . . . . . . . 250,000,000 SUP (2) FLT 3137A5ZX5 January 15, 2041ML . . . . . . . . . . . . . . . . . . . . . . . . . . . . . . 85,121,615 PAC 4.0 FIX 3137A62 D3 January 15, 2041MP . . . . . . . . . . . . . . . . . . . . . . . . . . . . . . 359,936,885 PAC 4.0 FIX 3137A6 2 F 8 April 15, 2038MS . . . . . . . . . . . . . . . . . . . . . . . . . . . . . . 125,000,000 SUP (2) INV/S 3137A62 H4 January 15, 2041Group 5EA . . . . . . . . . . . . . . . . . . . . . . . . . . . . . . 40,496,149 SEQ 3.5 FIX 3137A5YC2 February 15, 2024EB . . . . . . . . . . . . . . . . . . . . . . . . . . . . . . 9,503,851 SEQ 3.5 FIX 3137A5YD0 January 15, 2026Group 6LB . . . . . . . . . . . . . . . . . . . . . . . . . . . . . . 16,007,142 SEQ 4.0 FIX 3137A5ZB3 January 15, 2026LE . . . . . . . . . . . . . . . . . . . . . . . . . . . . . . 154,819,618 SEQ 2.5 FIX 3137A5Z E 7 February 15, 2025LI . . . . . . . . . . . . . . . . . . . . . . . . . . . . . . 58,057,356 NTL(SEQ) 4.0 FIX/IO 3137A5ZH0 February 15, 2025Group 7LF . . . . . . . . . . . . . . . . . . . . . . . . . . . . . . 65,555,735 SC/PT (2) FLT 3137A5 Z F 4 August 15, 2035TS . . . . . . . . . . . . . . . . . . . . . . . . . . . . . . 5,602,035 SC/NTL(PT) (2) INV/IO/S 3137A63 H3 August 15, 2035Group 8NA . . . . . . . . . . . . . . . . . . . . . . . . . . . . . . 130,000,000 SEQ 2.5 FIX 3137A6 2 L 5 February 15, 2025NB . . . . . . . . . . . . . . . . . . . . . . . . . . . . . . 13,695,199 SEQ 4.0 FIX 3137A62M3 January 15, 2026NI . . . . . . . . . . . . . . . . . . . . . . . . . . . . . . 48,750,000 NTL(SEQ) 4.0 FIX/IO 3137A6 2 P 6 February 15, 2025ResidualR . . . . . . . . . . . . . . . . . . . . . . . . . . . . . . 0 NPR 0.0 NPR 3137A6 3 E 0 January 15, 2041RS . . . . . . . . . . . . . . . . . . . . . . . . . . . . . . 0 NPR 0.0 NPR 3137A6 3 F 7 January 15, 2041
(1) See Appendix II to the Offering Circular.(2) See Terms Sheet — Interest.
The Certificates may not be suitable investments for you. You should not purchase Certificates unless you havecarefully considered and are able to bear the associated prepayment, interest rate, yield and market risks ofinvesting in them. Certain Risk Considerations on page S-2 highlights some of these risks.
You should purchase Certificates only if you have read and understood this Supplement, the attached OfferingCircular and the documents identified under Available Information.
We guarantee principal and interest payments on the Certificates. These payments are not guaranteed by, and arenot debts or obligations of, the United States or any federal agency or instrumentality other than Freddie Mac. TheCertificates are not tax-exempt. Because of applicable securities law exemptions, we have not registered theCertificates with any federal or state securities commission. No securities commission has reviewed thisSupplement.
Goldman, Sachs & Co.January 5, 2011
Exhibit V — Series 3796 Front Cover, Terms Sheet and MACR Table
V-1
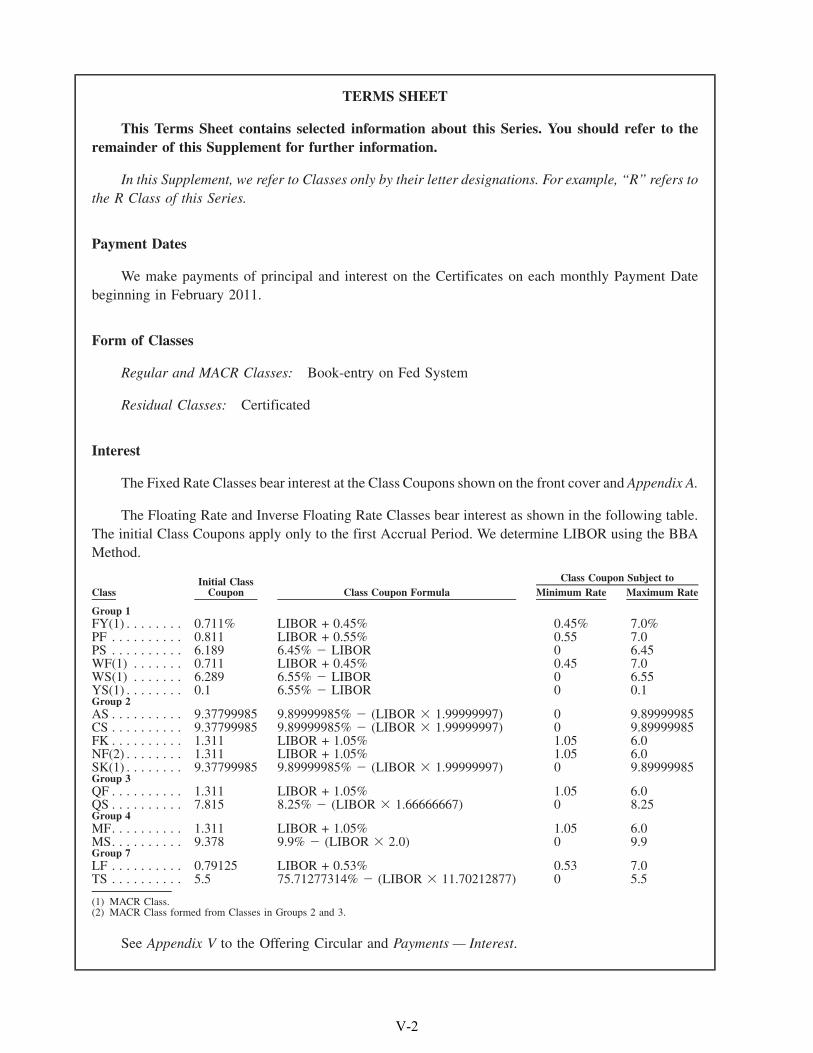
TERMS SHEET
This Terms Sheet contains selected information about this Series. You should refer to theremainder of this Supplement for further information.
In this Supplement, we refer to Classes only by their letter designations. For example, “R” refers tothe R Class of this Series.
Payment Dates
We make payments of principal and interest on the Certificates on each monthly Payment Datebeginning in February 2011.
Form of Classes
Regular and MACR Classes: Book-entry on Fed System
Residual Classes: Certificated
Interest
The Fixed Rate Classes bear interest at the Class Coupons shown on the front cover and Appendix A.
The Floating Rate and Inverse Floating Rate Classes bear interest as shown in the following table.The initial Class Coupons apply only to the first Accrual Period. We determine LIBOR using the BBAMethod.
ClassInitial Class
Coupon Class Coupon Formula Minimum Rate Maximum RateClass Coupon Subject to
Group 1FY(1) . . . . . . . . 0.711% LIBOR + 0.45% 0.45% 7.0%PF . . . . . . . . . . 0.811 LIBOR + 0.55% 0.55 7.0PS . . . . . . . . . . 6.189 6.45% � LIBOR 0 6.45WF(1) . . . . . . . 0.711 LIBOR + 0.45% 0.45 7.0WS(1) . . . . . . . 6.289 6.55% � LIBOR 0 6.55YS(1) . . . . . . . . 0.1 6.55% � LIBOR 0 0.1Group 2AS . . . . . . . . . . 9.37799985 9.89999985% � (LIBOR � 1.99999997) 0 9.89999985CS . . . . . . . . . . 9.37799985 9.89999985% � (LIBOR � 1.99999997) 0 9.89999985FK . . . . . . . . . . 1.311 LIBOR + 1.05% 1.05 6.0NF(2) . . . . . . . . 1.311 LIBOR + 1.05% 1.05 6.0SK(1) . . . . . . . . 9.37799985 9.89999985% � (LIBOR � 1.99999997) 0 9.89999985Group 3QF . . . . . . . . . . 1.311 LIBOR + 1.05% 1.05 6.0QS . . . . . . . . . . 7.815 8.25% � (LIBOR � 1.66666667) 0 8.25Group 4MF. . . . . . . . . . 1.311 LIBOR + 1.05% 1.05 6.0MS. . . . . . . . . . 9.378 9.9% � (LIBOR � 2.0) 0 9.9Group 7LF . . . . . . . . . . 0.79125 LIBOR + 0.53% 0.53 7.0TS . . . . . . . . . . 5.5 75.71277314% � (LIBOR � 11.70212877) 0 5.5
(1) MACR Class.(2) MACR Class formed from Classes in Groups 2 and 3.
See Appendix V to the Offering Circular and Payments — Interest.
V-2
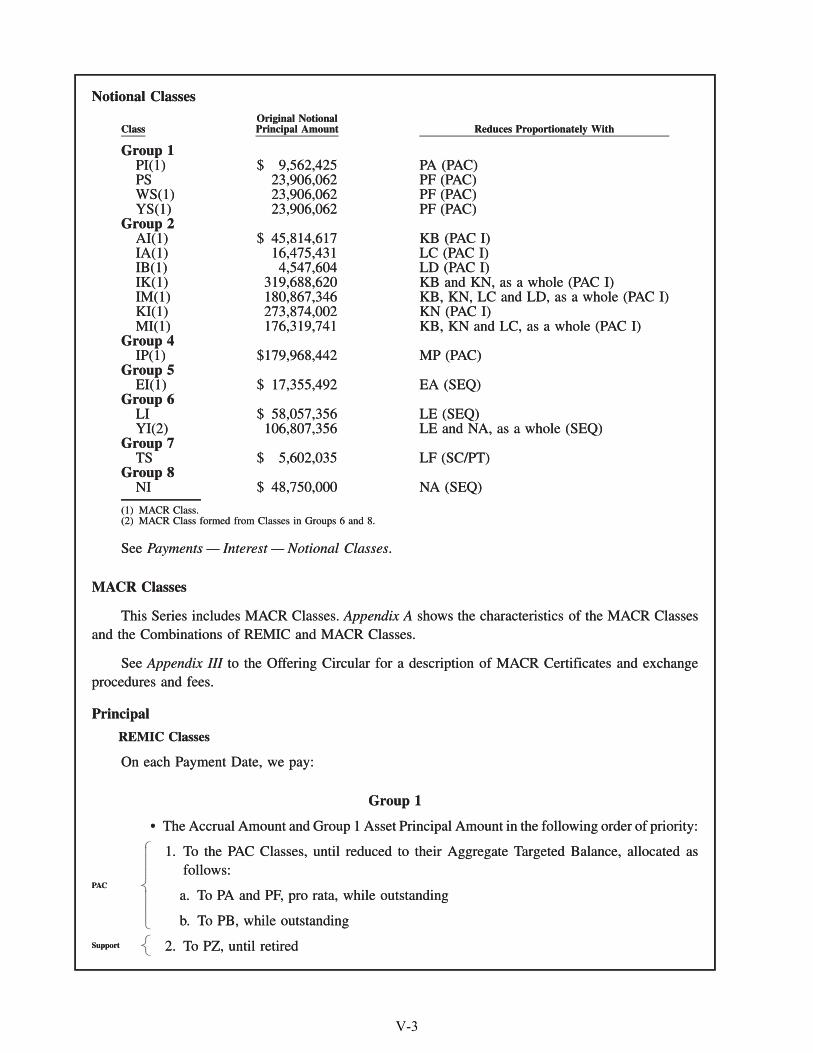
Notional Classes
ClassOriginal NotionalPrincipal Amount Reduces Proportionately With
Group 1PI(1) $ 9,562,425 PA (PAC)PS 23,906,062 PF (PAC)WS(1) 23,906,062 PF (PAC)YS(1) 23,906,062 PF (PAC)
Group 2AI(1) $ 45,814,617 KB (PAC I)IA(1) 16,475,431 LC (PAC I)IB(1) 4,547,604 LD (PAC I)IK(1) 319,688,620 KB and KN, as a whole (PAC I)IM(1) 180,867,346 KB, KN, LC and LD, as a whole (PAC I)KI(1) 273,874,002 KN (PAC I)MI(1) 176,319,741 KB, KN and LC, as a whole (PAC I)
Group 4IP(1) $179,968,442 MP (PAC)
Group 5EI(1) $ 17,355,492 EA (SEQ)
Group 6LI $ 58,057,356 LE (SEQ)YI(2) 106,807,356 LE and NA, as a whole (SEQ)
Group 7TS $ 5,602,035 LF (SC/PT)
Group 8NI $ 48,750,000 NA (SEQ)
(1) MACR Class.(2) MACR Class formed from Classes in Groups 6 and 8.
See Payments — Interest — Notional Classes.
MACR Classes
This Series includes MACR Classes. Appendix A shows the characteristics of the MACR Classesand the Combinations of REMIC and MACR Classes.
See Appendix III to the Offering Circular for a description of MACR Certificates and exchangeprocedures and fees.
Principal
REMIC Classes
On each Payment Date, we pay:
Group 1
• The Accrual Amount and Group 1 Asset Principal Amount in the following order of priority:
1. To the PAC Classes, until reduced to their Aggregate Targeted Balance, allocated asfollows:
a. To PA and PF, pro rata, while outstanding
b. To PB, while outstanding
PAC
2. To PZ, until retiredSupport
Notional Classes
ClassOriginal NotionalPrincipal Amount Reduces Proportionately With
Group 1PI(1) $ 9,562,425 PA (PAC)PS 23,906,062 PF (PAC)WS(1) 23,906,062 PF (PAC)YS(1) 23,906,062 PF (PAC)
Group 2AI(1) $ 45,814,617 KB (PAC I)IA(1) 16,475,431 LC (PAC I)IB(1) 4,547,604 LD (PAC I)IK(1) 319,688,620 KB and KN, as a whole (PAC I)IM(1) 180,867,346 KB, KN, LC and LD, as a whole (PAC I)KI(1) 273,874,002 KN (PAC I)MI(1) 176,319,741 KB, KN and LC, as a whole (PAC I)
Group 4IP(1) $179,968,442 MP (PAC)
Group 5EI(1) $ 17,355,492 EA (SEQ)
Group 6LI $ 58,057,356 LE (SEQ)YI(2) 106,807,356 LE and NA, as a whole (SEQ)
Group 7TS $ 5,602,035 LF (SC/PT)
Group 8NI $ 48,750,000 NA (SEQ)
(1) MACR Class.(2) MACR Class formed from Classes in Groups 6 and 8.
See Payments — Interest — Notional Classes.
MACR Classes
This Series includes MACR Classes. Appendix A shows the characteristics of the MACR Classesand the Combinations of REMIC and MACR Classes.
See Appendix III to the Offering Circular for a description of MACR Certificates and exchangeprocedures and fees.
Principal
REMIC Classes
On each Payment Date, we pay:
Group 1
• The Accrual Amount and Group 1 Asset Principal Amount in the following order of priority:
1. To the PAC Classes, until reduced to their Aggregate Targeted Balance, allocated asfollows:
a. To PA and PF, pro rata, while outstanding
b. To PB, while outstanding
�����������������������������
PAC
2. To PZ, until retired�����Support
V-3
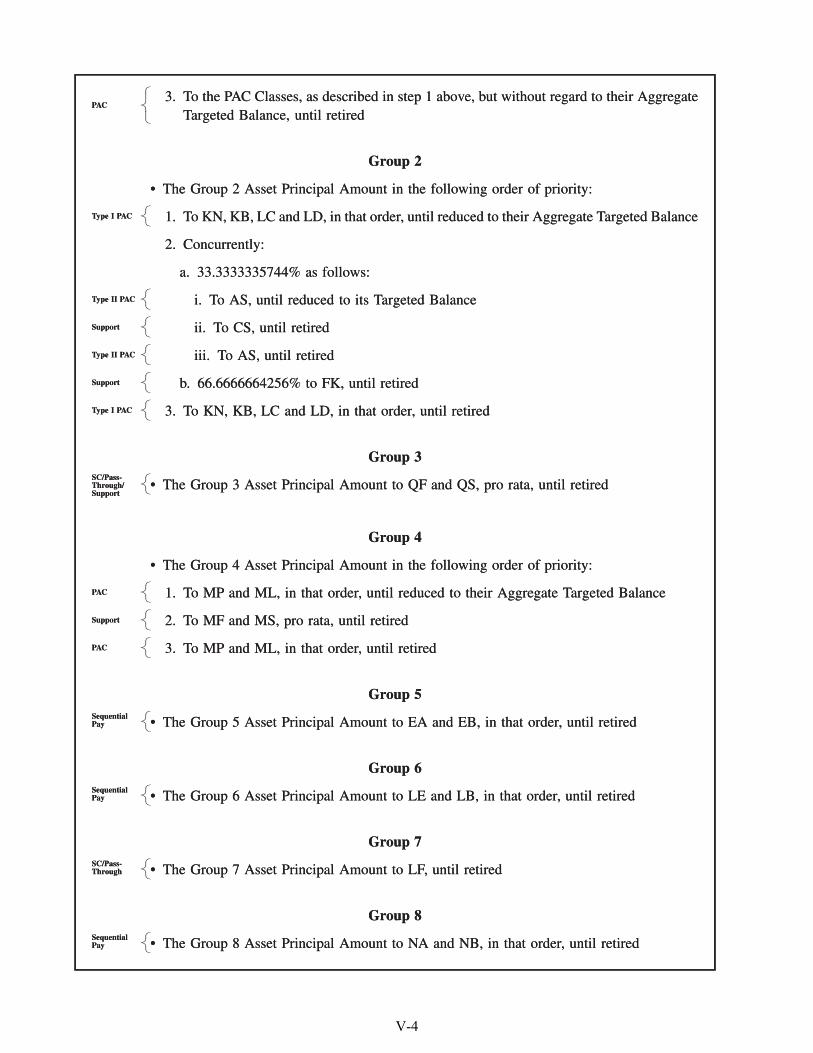
3. To the PAC Classes, as described in step 1 above, but without regard to their AggregateTargeted Balance, until retired
PAC
Group 2
• The Group 2 Asset Principal Amount in the following order of priority:
1. To KN, KB, LC and LD, in that order, until reduced to their Aggregate Targeted BalanceType I PAC
2. Concurrently:
a. 33.3333335744% as follows:
i. To AS, until reduced to its Targeted BalanceType II PAC
ii. To CS, until retiredSupport
iii. To AS, until retiredType II PAC
b. 66.6666664256% to FK, until retiredSupport
3. To KN, KB, LC and LD, in that order, until retiredType I PAC
Group 3
• The Group 3 Asset Principal Amount to QF and QS, pro rata, until retiredSC/Pass-Through/Support
Group 4
• The Group 4 Asset Principal Amount in the following order of priority:
1. To MP and ML, in that order, until reduced to their Aggregate Targeted BalancePAC
2. To MF and MS, pro rata, until retiredSupport
3. To MP and ML, in that order, until retiredPAC
Group 5
• The Group 5 Asset Principal Amount to EA and EB, in that order, until retiredSequentialPay
Group 6
• The Group 6 Asset Principal Amount to LE and LB, in that order, until retiredSequentialPay
Group 7
• The Group 7 Asset Principal Amount to LF, until retiredSC/Pass-Through
Group 8
• The Group 8 Asset Principal Amount to NA and NB, in that order, until retiredSequentialPay
3. To the PAC Classes, as described in step 1 above, but without regard to their AggregateTargeted Balance, until retired
�����������
PAC
Group 2
• The Group 2 Asset Principal Amount in the following order of priority:
1. To KN, KB, LC and LD, in that order, until reduced to their Aggregate Targeted Balance�����Type I PAC
2. Concurrently:
a. 33.3333335744% as follows:
i. To AS, until reduced to its Targeted Balance�����Type II PAC
ii. To CS, until retired�����Support
iii. To AS, until retired�����Type II PAC
b. 66.6666664256% to FK, until retired�����Support
3. To KN, KB, LC and LD, in that order, until retired�����Type I PAC
Group 3
• The Group 3 Asset Principal Amount to QF and QS, pro rata, until retired�����
SC/Pass-Through/Support
Group 4
• The Group 4 Asset Principal Amount in the following order of priority:
1. To MP and ML, in that order, until reduced to their Aggregate Targeted Balance�����PAC
2. To MF and MS, pro rata, until retired�����Support
3. To MP and ML, in that order, until retired�����PAC
Group 5
• The Group 5 Asset Principal Amount to EA and EB, in that order, until retired�����
SequentialPay
Group 6
• The Group 6 Asset Principal Amount to LE and LB, in that order, until retired�����
SequentialPay
Group 7
• The Group 7 Asset Principal Amount to LF, until retired�����
SC/Pass-Through
Group 8
• The Group 8 Asset Principal Amount to NA and NB, in that order, until retired�����
SequentialPay
V-4
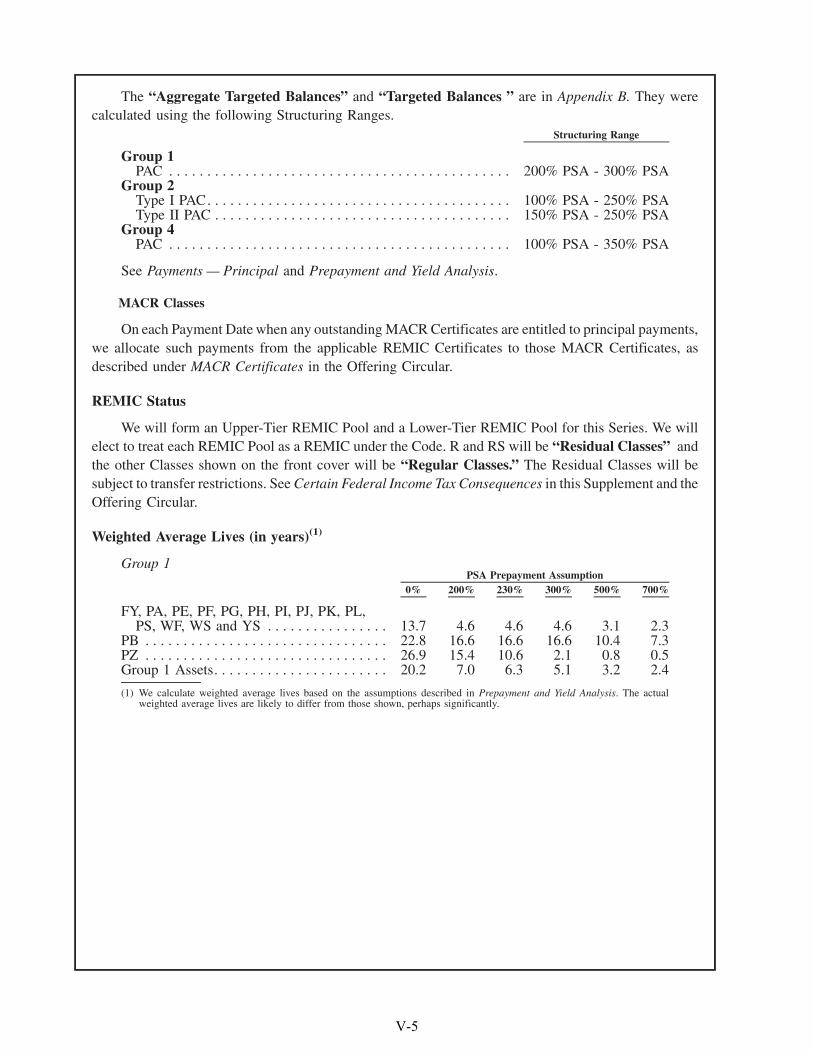
The “Aggregate Targeted Balances” and “Targeted Balances ” are in Appendix B. They werecalculated using the following Structuring Ranges.
Structuring Range
Group 1PAC . . . . . . . . . . . . . . . . . . . . . . . . . . . . . . . . . . . . . . . . . . . . . 200% PSA - 300% PSA
Group 2Type I PAC. . . . . . . . . . . . . . . . . . . . . . . . . . . . . . . . . . . . . . . . 100% PSA - 250% PSAType II PAC . . . . . . . . . . . . . . . . . . . . . . . . . . . . . . . . . . . . . . . 150% PSA - 250% PSA
Group 4PAC . . . . . . . . . . . . . . . . . . . . . . . . . . . . . . . . . . . . . . . . . . . . . 100% PSA - 350% PSA
See Payments — Principal and Prepayment and Yield Analysis.
MACR Classes
On each Payment Date when any outstanding MACR Certificates are entitled to principal payments,we allocate such payments from the applicable REMIC Certificates to those MACR Certificates, asdescribed under MACR Certificates in the Offering Circular.
REMIC Status
We will form an Upper-Tier REMIC Pool and a Lower-Tier REMIC Pool for this Series. We willelect to treat each REMIC Pool as a REMIC under the Code. R and RS will be “Residual Classes” andthe other Classes shown on the front cover will be “Regular Classes.” The Residual Classes will besubject to transfer restrictions. See Certain Federal Income Tax Consequences in this Supplement and theOffering Circular.
Weighted Average Lives (in years)(1)
Group 1
0% 200% 230% 300% 500% 700%PSA Prepayment Assumption
FY, PA, PE, PF, PG, PH, PI, PJ, PK, PL,PS, WF, WS and YS . . . . . . . . . . . . . . . . 13.7 4.6 4.6 4.6 3.1 2.3
PB . . . . . . . . . . . . . . . . . . . . . . . . . . . . . . . . 22.8 16.6 16.6 16.6 10.4 7.3PZ . . . . . . . . . . . . . . . . . . . . . . . . . . . . . . . . 26.9 15.4 10.6 2.1 0.8 0.5Group 1 Assets. . . . . . . . . . . . . . . . . . . . . . . 20.2 7.0 6.3 5.1 3.2 2.4
(1) We calculate weighted average lives based on the assumptions described in Prepayment and Yield Analysis. The actualweighted average lives are likely to differ from those shown, perhaps significantly.
V-5
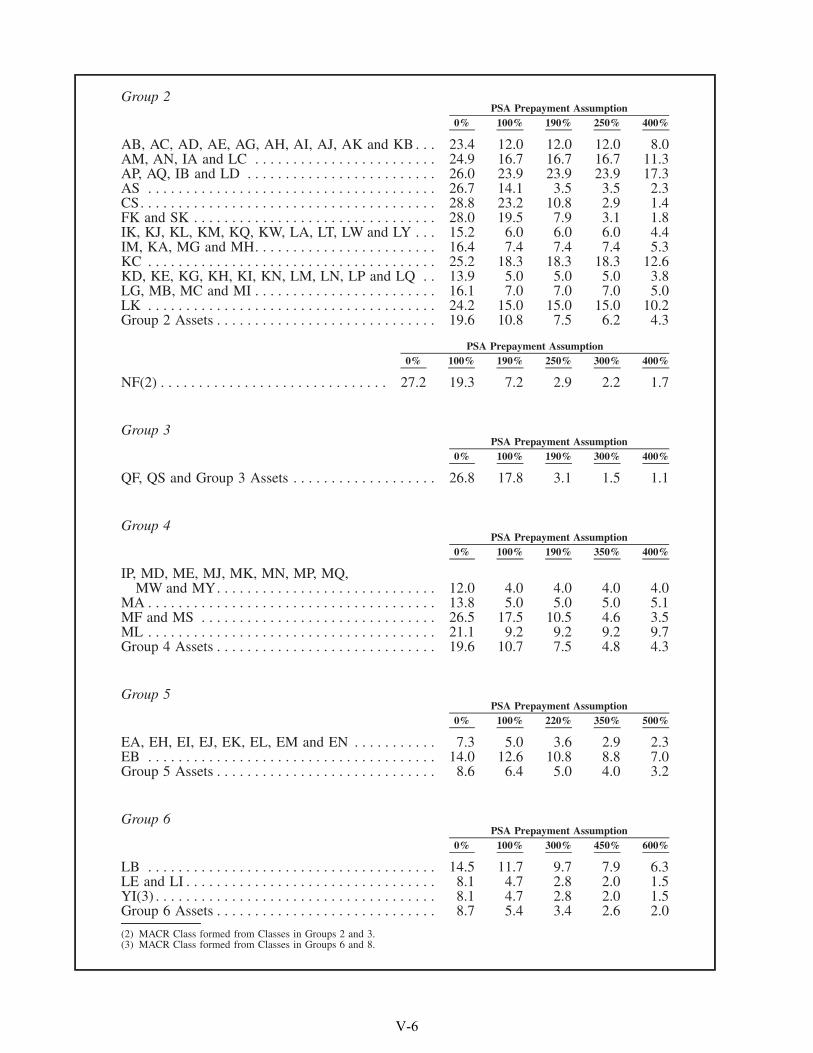
Group 2
0% 100% 190% 250% 400%PSA Prepayment Assumption
AB, AC, AD, AE, AG, AH, AI, AJ, AK and KB . . . 23.4 12.0 12.0 12.0 8.0AM, AN, IA and LC . . . . . . . . . . . . . . . . . . . . . . . . 24.9 16.7 16.7 16.7 11.3AP, AQ, IB and LD . . . . . . . . . . . . . . . . . . . . . . . . . 26.0 23.9 23.9 23.9 17.3AS . . . . . . . . . . . . . . . . . . . . . . . . . . . . . . . . . . . . . . 26.7 14.1 3.5 3.5 2.3CS. . . . . . . . . . . . . . . . . . . . . . . . . . . . . . . . . . . . . . . 28.8 23.2 10.8 2.9 1.4FK and SK . . . . . . . . . . . . . . . . . . . . . . . . . . . . . . . . 28.0 19.5 7.9 3.1 1.8IK, KJ, KL, KM, KQ, KW, LA, LT, LW and LY . . . 15.2 6.0 6.0 6.0 4.4IM, KA, MG and MH. . . . . . . . . . . . . . . . . . . . . . . . 16.4 7.4 7.4 7.4 5.3KC . . . . . . . . . . . . . . . . . . . . . . . . . . . . . . . . . . . . . . 25.2 18.3 18.3 18.3 12.6KD, KE, KG, KH, KI, KN, LM, LN, LP and LQ . . 13.9 5.0 5.0 5.0 3.8LG, MB, MC and MI . . . . . . . . . . . . . . . . . . . . . . . . 16.1 7.0 7.0 7.0 5.0LK . . . . . . . . . . . . . . . . . . . . . . . . . . . . . . . . . . . . . . 24.2 15.0 15.0 15.0 10.2Group 2 Assets . . . . . . . . . . . . . . . . . . . . . . . . . . . . . 19.6 10.8 7.5 6.2 4.3
0% 100% 190% 250% 300% 400%PSA Prepayment Assumption
NF(2) . . . . . . . . . . . . . . . . . . . . . . . . . . . . . . 27.2 19.3 7.2 2.9 2.2 1.7
Group 3
0% 100% 190% 300% 400%PSA Prepayment Assumption
QF, QS and Group 3 Assets . . . . . . . . . . . . . . . . . . . 26.8 17.8 3.1 1.5 1.1
Group 4
0% 100% 190% 350% 400%PSA Prepayment Assumption
IP, MD, ME, MJ, MK, MN, MP, MQ,MW and MY. . . . . . . . . . . . . . . . . . . . . . . . . . . . . 12.0 4.0 4.0 4.0 4.0
MA . . . . . . . . . . . . . . . . . . . . . . . . . . . . . . . . . . . . . . 13.8 5.0 5.0 5.0 5.1MF and MS . . . . . . . . . . . . . . . . . . . . . . . . . . . . . . . 26.5 17.5 10.5 4.6 3.5ML . . . . . . . . . . . . . . . . . . . . . . . . . . . . . . . . . . . . . . 21.1 9.2 9.2 9.2 9.7Group 4 Assets . . . . . . . . . . . . . . . . . . . . . . . . . . . . . 19.6 10.7 7.5 4.8 4.3
Group 5
0% 100% 220% 350% 500%PSA Prepayment Assumption
EA, EH, EI, EJ, EK, EL, EM and EN . . . . . . . . . . . 7.3 5.0 3.6 2.9 2.3EB . . . . . . . . . . . . . . . . . . . . . . . . . . . . . . . . . . . . . . 14.0 12.6 10.8 8.8 7.0Group 5 Assets . . . . . . . . . . . . . . . . . . . . . . . . . . . . . 8.6 6.4 5.0 4.0 3.2
Group 6
0% 100% 300% 450% 600%PSA Prepayment Assumption
LB . . . . . . . . . . . . . . . . . . . . . . . . . . . . . . . . . . . . . . 14.5 11.7 9.7 7.9 6.3LE and LI . . . . . . . . . . . . . . . . . . . . . . . . . . . . . . . . . 8.1 4.7 2.8 2.0 1.5YI(3) . . . . . . . . . . . . . . . . . . . . . . . . . . . . . . . . . . . . . 8.1 4.7 2.8 2.0 1.5Group 6 Assets . . . . . . . . . . . . . . . . . . . . . . . . . . . . . 8.7 5.4 3.4 2.6 2.0
(2) MACR Class formed from Classes in Groups 2 and 3.(3) MACR Class formed from Classes in Groups 6 and 8.
V-6
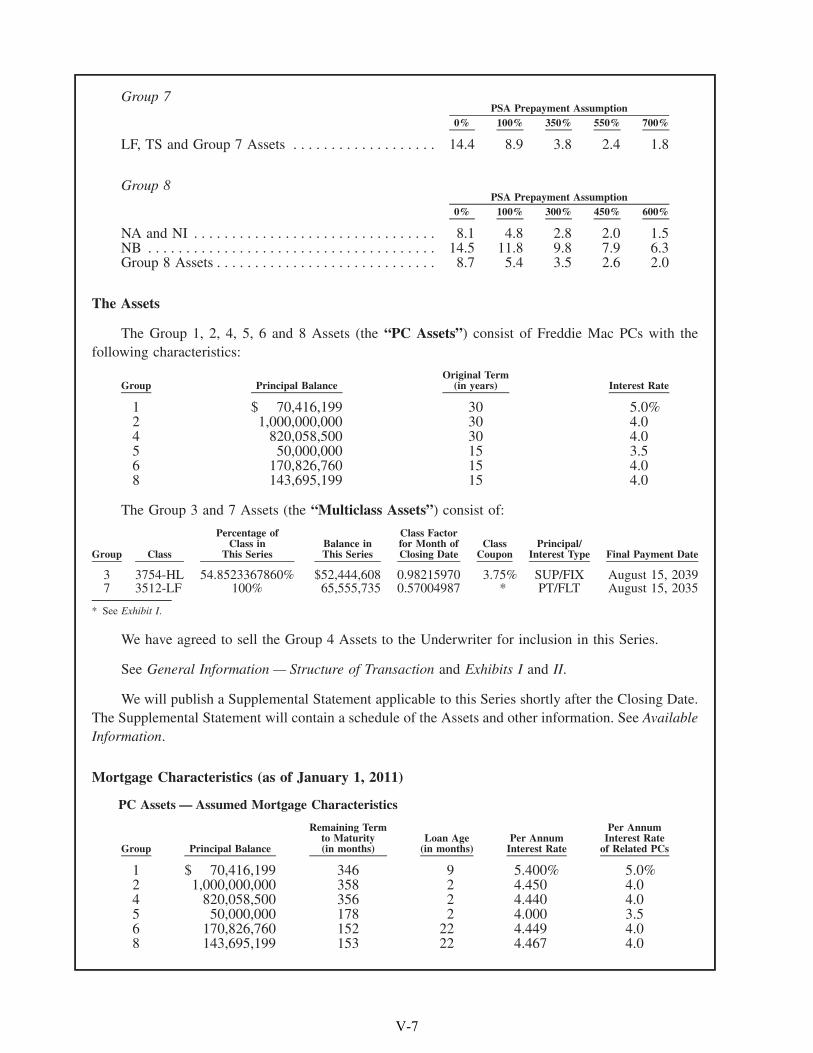
Group 7
0% 100% 350% 550% 700%PSA Prepayment Assumption
LF, TS and Group 7 Assets . . . . . . . . . . . . . . . . . . . 14.4 8.9 3.8 2.4 1.8
Group 8
0% 100% 300% 450% 600%PSA Prepayment Assumption
NA and NI . . . . . . . . . . . . . . . . . . . . . . . . . . . . . . . . 8.1 4.8 2.8 2.0 1.5NB . . . . . . . . . . . . . . . . . . . . . . . . . . . . . . . . . . . . . . 14.5 11.8 9.8 7.9 6.3Group 8 Assets . . . . . . . . . . . . . . . . . . . . . . . . . . . . . 8.7 5.4 3.5 2.6 2.0
The Assets
The Group 1, 2, 4, 5, 6 and 8 Assets (the “PC Assets”) consist of Freddie Mac PCs with thefollowing characteristics:
Group Principal BalanceOriginal Term
(in years) Interest Rate
1 $ 70,416,199 30 5.0%2 1,000,000,000 30 4.04 820,058,500 30 4.05 50,000,000 15 3.56 170,826,760 15 4.08 143,695,199 15 4.0
The Group 3 and 7 Assets (the “Multiclass Assets”) consist of:
Group Class
Percentage ofClass in
This SeriesBalance inThis Series
Class Factorfor Month ofClosing Date
ClassCoupon
Principal/Interest Type Final Payment Date
3 3754-HL 54.8523367860% $52,444,608 0.98215970 3.75% SUP/FIX August 15, 20397 3512-LF 100% 65,555,735 0.57004987 * PT/FLT August 15, 2035
* See Exhibit I.
We have agreed to sell the Group 4 Assets to the Underwriter for inclusion in this Series.
See General Information — Structure of Transaction and Exhibits I and II.
We will publish a Supplemental Statement applicable to this Series shortly after the Closing Date.The Supplemental Statement will contain a schedule of the Assets and other information. See AvailableInformation.
Mortgage Characteristics (as of January 1, 2011)
PC Assets — Assumed Mortgage Characteristics
Group Principal Balance
Remaining Termto Maturity(in months)
Loan Age(in months)
Per AnnumInterest Rate
Per AnnumInterest Rate
of Related PCs
1 $ 70,416,199 346 9 5.400% 5.0%2 1,000,000,000 358 2 4.450 4.04 820,058,500 356 2 4.440 4.05 50,000,000 178 2 4.000 3.56 170,826,760 152 22 4.449 4.08 143,695,199 153 22 4.467 4.0
V-7

Multiclass Assets — Mortgage Characteristics
Group Series
Weighted AverageRemaining Term
to Maturity(in months)
Weighted AverageLoan Age
(in months)
Weighted AveragePer Annum
Interest Rate
Per AnnumInterest Rate
of Related PCs
3 3754 356 3 4.430% 4.0%7 3512 282 70 5.929 5.5
The actual characteristics of the Mortgages differ from those shown, in some cases significantly.
See General Information — The Mortgages.
V-8
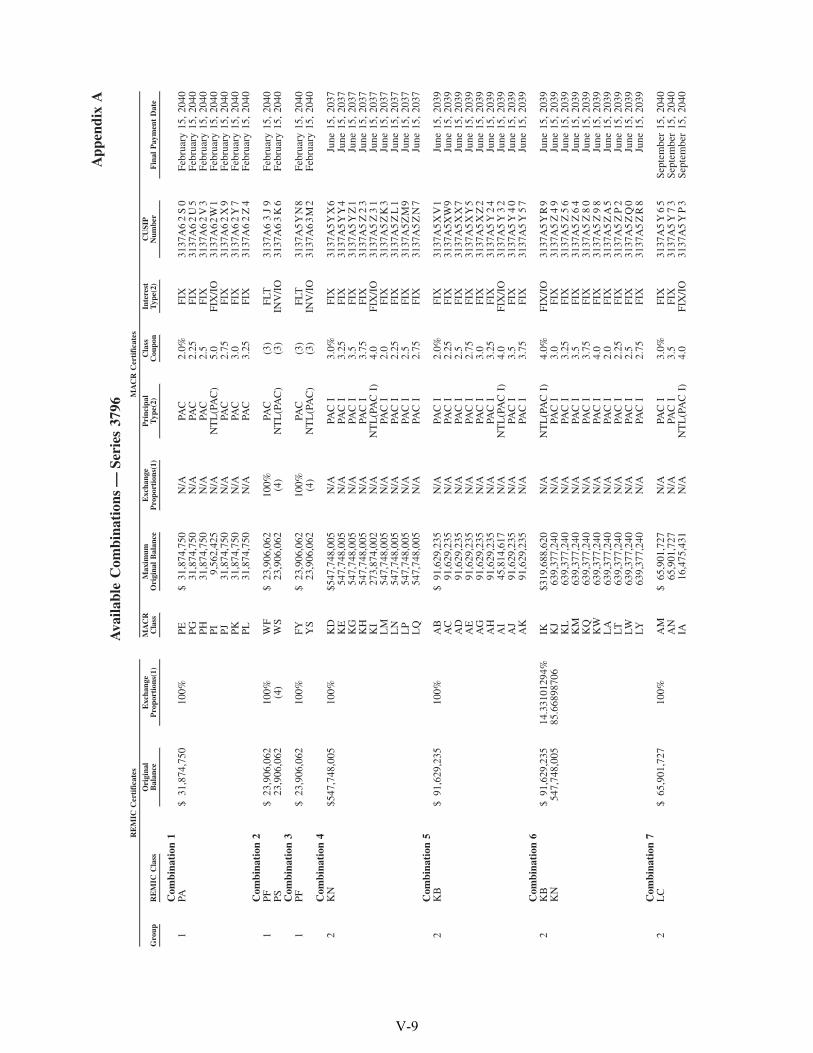
App
endi
xA
Ava
ilabl
eC
ombi
nati
ons
—Se
ries
3796
Gro
upR
EM
ICC
lass
Ori
gina
lB
alan
ceE
xcha
nge
Pro
port
ions
(1)
MA
CR
Cla
ssM
axim
umO
rigi
nal
Bal
ance
Exc
hang
eP
ropo
rtio
ns(1
)P
rinc
ipal
Typ
e(2)
Cla
ssC
oupo
nIn
tere
stT
ype(
2)C
USI
PN
umbe
rF
inal
Pay
men
tD
ate
RE
MIC
Cer
tifi
cate
sM
AC
RC
erti
fica
tes
Com
bina
tion
11
PA$
31,8
74,7
5010
0%PE
$31
,874
,750
N/A
PAC
2.0%
FIX
3137
A6
2S
0Fe
brua
ry15
,20
40PG
31,8
74,7
50N
/APA
C2.
25FI
X31
37A
62
U5
Febr
uary
15,
2040
PH31
,874
,750
N/A
PAC
2.5
FIX
3137
A6
2V
3Fe
brua
ry15
,20
40PI
9,56
2,42
5N
/AN
TL
(PA
C)
5.0
FIX
/IO
3137
A6
2W
1Fe
brua
ry15
,20
40PJ
31,8
74,7
50N
/APA
C2.
75FI
X31
37A
62
X9
Febr
uary
15,
2040
PK31
,874
,750
N/A
PAC
3.0
FIX
3137
A6
2Y
7Fe
brua
ry15
,20
40PL
31,8
74,7
50N
/APA
C3.
25FI
X31
37A
62
Z4
Febr
uary
15,
2040
Com
bina
tion
21
PF$
23,9
06,0
6210
0%W
F$
23,9
06,0
6210
0%PA
C(3
)FL
T31
37A
63
J9
Febr
uary
15,
2040
PS23
,906
,062
(4)
WS
23,9
06,0
62(4
)N
TL
(PA
C)
(3)
INV
/IO
3137
A6
3K
6Fe
brua
ry15
,20
40C
ombi
nati
on3
1PF
$23
,906
,062
100%
FY$
23,9
06,0
6210
0%PA
C(3
)FL
T31
37A
5Y
N8
Febr
uary
15,
2040
YS
23,9
06,0
62(4
)N
TL
(PA
C)
(3)
INV
/IO
3137
A6
3M
2Fe
brua
ry15
,20
40C
ombi
nati
on4
2K
N$5
47,7
48,0
0510
0%K
D$5
47,7
48,0
05N
/APA
CI
3.0%
FIX
3137
A5
YX
6Ju
ne15
,20
37K
E54
7,74
8,00
5N
/APA
CI
3.25
FIX
3137
A5
YY
4Ju
ne15
,20
37K
G54
7,74
8,00
5N
/APA
CI
3.5
FIX
3137
A5
YZ
1Ju
ne15
,20
37K
H54
7,74
8,00
5N
/APA
CI
3.75
FIX
3137
A5
Z2
3Ju
ne15
,20
37K
I27
3,87
4,00
2N
/AN
TL
(PA
CI)
4.0
FIX
/IO
3137
A5
Z3
1Ju
ne15
,20
37L
M54
7,74
8,00
5N
/APA
CI
2.0
FIX
3137
A5
ZK
3Ju
ne15
,20
37L
N54
7,74
8,00
5N
/APA
CI
2.25
FIX
3137
A5
ZL
1Ju
ne15
,20
37L
P54
7,74
8,00
5N
/APA
CI
2.5
FIX
3137
A5Z
M9
June
15,
2037
LQ
547,
748,
005
N/A
PAC
I2.
75FI
X31
37A
5Z
N7
June
15,
2037
Com
bina
tion
52
KB
$91
,629
,235
100%
AB
$91
,629
,235
N/A
PAC
I2.
0%FI
X31
37A
5X
V1
June
15,
2039
AC
91,6
29,2
35N
/APA
CI
2.25
FIX
3137
A5X
W9
June
15,
2039
AD
91,6
29,2
35N
/APA
CI
2.5
FIX
3137
A5
XX
7Ju
ne15
,20
39A
E91
,629
,235
N/A
PAC
I2.
75FI
X31
37A
5X
Y5
June
15,
2039
AG
91,6
29,2
35N
/APA
CI
3.0
FIX
3137
A5
XZ
2Ju
ne15
,20
39A
H91
,629
,235
N/A
PAC
I3.
25FI
X31
37A
5Y
24
June
15,
2039
AI
45,8
14,6
17N
/AN
TL
(PA
CI)
4.0
FIX
/IO
3137
A5
Y3
2Ju
ne15
,20
39A
J91
,629
,235
N/A
PAC
I3.
5FI
X31
37A
5Y
40
June
15,
2039
AK
91,6
29,2
35N
/APA
CI
3.75
FIX
3137
A5
Y5
7Ju
ne15
,20
39C
ombi
nati
on6
2K
B$
91,6
29,2
3514
.331
0129
4%IK
$319
,688
,620
N/A
NT
L(P
AC
I)4.
0%FI
X/I
O31
37A
5Y
R9
June
15,
2039
KN
547,
748,
005
85.6
6898
706
KJ
639,
377,
240
N/A
PAC
I3.
0FI
X31
37A
5Z
49
June
15,
2039
KL
639,
377,
240
N/A
PAC
I3.
25FI
X31
37A
5Z
56
June
15,
2039
KM
639,
377,
240
N/A
PAC
I3.
5FI
X31
37A
5Z
64
June
15,
2039
KQ
639,
377,
240
N/A
PAC
I3.
75FI
X31
37A
5Z
80
June
15,
2039
KW
639,
377,
240
N/A
PAC
I4.
0FI
X31
37A
5Z
98
June
15,
2039
LA
639,
377,
240
N/A
PAC
I2.
0FI
X31
37A
5Z
A5
June
15,
2039
LT63
9,37
7,24
0N
/APA
CI
2.25
FIX
3137
A5
ZP
2Ju
ne15
,20
39LW
639,
377,
240
N/A
PAC
I2.
5FI
X31
37A
5Z
Q0
June
15,
2039
LY63
9,37
7,24
0N
/APA
CI
2.75
FIX
3137
A5
ZR
8Ju
ne15
,20
39C
ombi
nati
on7
2L
C$
65,9
01,7
2710
0%A
M$
65,9
01,7
27N
/APA
CI
3.0%
FIX
3137
A5
Y6
5Se
ptem
ber
15,
2040
AN
65,9
01,7
27N
/APA
CI
3.5
FIX
3137
A5
Y7
3Se
ptem
ber
15,
2040
IA16
,475
,431
N/A
NT
L(P
AC
I)4.
0FI
X/I
O31
37A
5Y
P3
Sept
embe
r15
,20
40
V-9
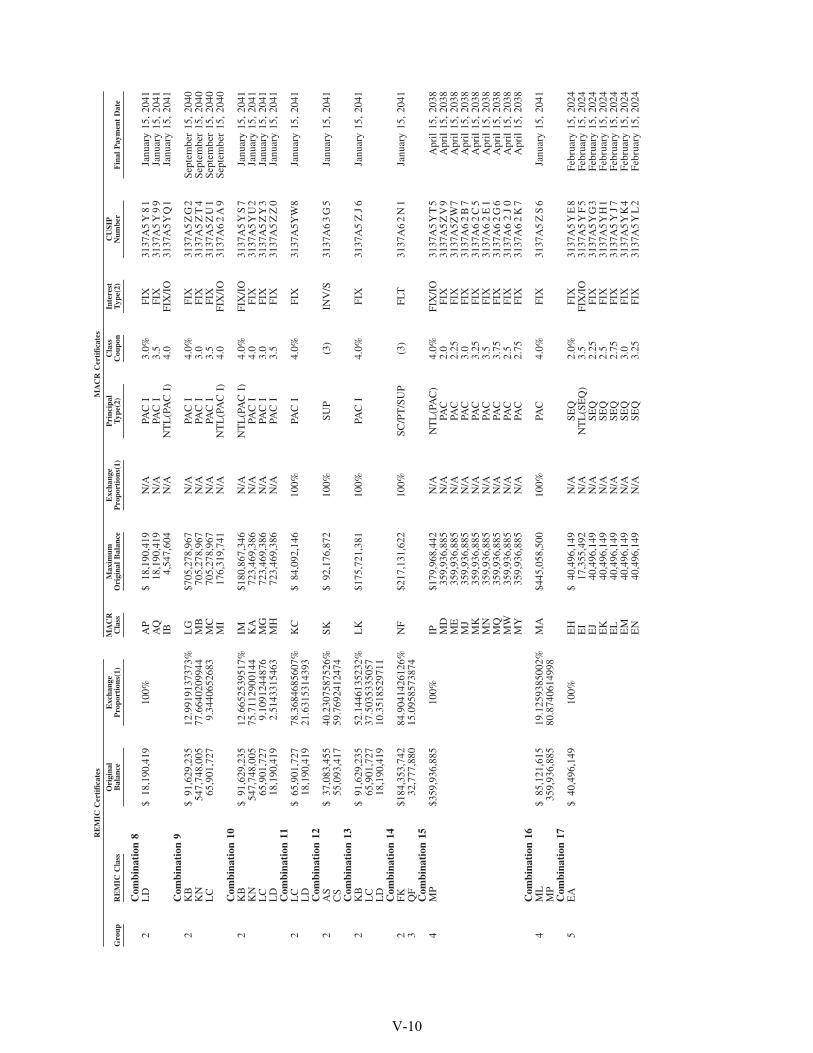
Gro
upR
EM
ICC
lass
Ori
gina
lB
alan
ceE
xcha
nge
Pro
port
ions
(1)
MA
CR
Cla
ssM
axim
umO
rigi
nal
Bal
ance
Exc
hang
eP
ropo
rtio
ns(1
)P
rinc
ipal
Typ
e(2)
Cla
ssC
oupo
nIn
tere
stT
ype(
2)C
USI
PN
umbe
rF
inal
Pay
men
tD
ate
RE
MIC
Cer
tifi
cate
sM
AC
RC
erti
fica
tes
Com
bina
tion
82
LD
$18
,190
,419
100%
AP
$18
,190
,419
N/A
PAC
I3.
0%FI
X31
37A
5Y
81
Janu
ary
15,
2041
AQ
18,1
90,4
19N
/APA
CI
3.5
FIX
3137
A5
Y9
9Ja
nuar
y15
,20
41IB
4,54
7,60
4N
/AN
TL
(PA
CI)
4.0
FIX
/IO
3137
A5
YQ
1Ja
nuar
y15
,20
41C
ombi
nati
on9
2K
B$
91,6
29,2
3512
.991
9137
373%
LG
$705
,278
,967
N/A
PAC
I4.
0%FI
X31
37A
5Z
G2
Sept
embe
r15
,20
40K
N54
7,74
8,00
577
.664
0209
944
MB
705,
278,
967
N/A
PAC
I3.
0FI
X31
37A
5Z
T4
Sept
embe
r15
,20
40L
C65
,901
,727
9.34
4065
2683
MC
705,
278,
967
N/A
PAC
I3.
5FI
X31
37A
5Z
U1
Sept
embe
r15
,20
40M
I17
6,31
9,74
1N
/AN
TL
(PA
CI)
4.0
FIX
/IO
3137
A6
2A
9Se
ptem
ber
15,
2040
Com
bina
tion
102
KB
$91
,629
,235
12.6
6525
3951
7%IM
$180
,867
,346
N/A
NT
L(P
AC
I)4.
0%FI
X/I
O31
37A
5Y
S7
Janu
ary
15,
2041
KN
547,
748,
005
75.7
1129
0014
4K
A72
3,46
9,38
6N
/APA
CI
4.0
FIX
3137
A5
YU
2Ja
nuar
y15
,20
41L
C65
,901
,727
9.10
9124
4876
MG
723,
469,
386
N/A
PAC
I3.
0FI
X31
37A
5Z
Y3
Janu
ary
15,
2041
LD
18,1
90,4
192.
5143
3154
63M
H72
3,46
9,38
6N
/APA
CI
3.5
FIX
3137
A5
ZZ
0Ja
nuar
y15
,20
41C
ombi
nati
on11
2L
C$
65,9
01,7
2778
.368
4685
607%
KC
$84
,092
,146
100%
PAC
I4.
0%FI
X31
37A
5YW
8Ja
nuar
y15
,20
41L
D18
,190
,419
21.6
3153
1439
3C
ombi
nati
on12
2A
S$
37,0
83,4
5540
.230
7587
526%
SK$
92,1
76,8
7210
0%SU
P(3
)IN
V/S
3137
A6
3G
5Ja
nuar
y15
,20
41C
S55
,093
,417
59.7
6924
1247
4C
ombi
nati
on13
2K
B$
91,6
29,2
3552
.144
6135
232%
LK
$175
,721
,381
100%
PAC
I4.
0%FI
X31
37A
5Z
J6
Janu
ary
15,
2041
LC
65,9
01,7
2737
.503
5335
057
LD
18,1
90,4
1910
.351
8529
711
Com
bina
tion
142
FK$1
84,3
53,7
4284
.904
1426
126%
NF
$217
,131
,622
100%
SC/P
T/S
UP
(3)
FLT
3137
A6
2N
1Ja
nuar
y15
,20
413
QF
32,7
77,8
8015
.095
8573
874
Com
bina
tion
154
MP
$359
,936
,885
100%
IP$1
79,9
68,4
42N
/AN
TL
(PA
C)
4.0%
FIX
/IO
3137
A5
YT
5A
pril
15,
2038
MD
359,
936,
885
N/A
PAC
2.0
FIX
3137
A5
ZV
9A
pril
15,
2038
ME
359,
936,
885
N/A
PAC
2.25
FIX
3137
A5Z
W7
Apr
il15
,20
38M
J35
9,93
6,88
5N
/APA
C3.
0FI
X31
37A
62
B7
Apr
il15
,20
38M
K35
9,93
6,88
5N
/APA
C3.
25FI
X31
37A
62
C5
Apr
il15
,20
38M
N35
9,93
6,88
5N
/APA
C3.
5FI
X31
37A
62
E1
Apr
il15
,20
38M
Q35
9,93
6,88
5N
/APA
C3.
75FI
X31
37A
62
G6
Apr
il15
,20
38M
W35
9,93
6,88
5N
/APA
C2.
5FI
X31
37A
62
J0
Apr
il15
,20
38M
Y35
9,93
6,88
5N
/APA
C2.
75FI
X31
37A
62
K7
Apr
il15
,20
38C
ombi
nati
on16
4M
L$
85,1
21,6
1519
.125
9385
002%
MA
$445
,058
,500
100%
PAC
4.0%
FIX
3137
A5
ZS
6Ja
nuar
y15
,20
41M
P35
9,93
6,88
580
.874
0614
998
Com
bina
tion
175
EA
$40
,496
,149
100%
EH
$40
,496
,149
N/A
SEQ
2.0%
FIX
3137
A5
YE
8Fe
brua
ry15
,20
24E
I17
,355
,492
N/A
NT
L(S
EQ
)3.
5FI
X/I
O31
37A
5Y
F5
Febr
uary
15,
2024
EJ
40,4
96,1
49N
/ASE
Q2.
25FI
X31
37A
5Y
G3
Febr
uary
15,
2024
EK
40,4
96,1
49N
/ASE
Q2.
5FI
X31
37A
5Y
H1
Febr
uary
15,
2024
EL
40,4
96,1
49N
/ASE
Q2.
75FI
X31
37A
5Y
J7
Febr
uary
15,
2024
EM
40,4
96,1
49N
/ASE
Q3.
0FI
X31
37A
5Y
K4
Febr
uary
15,
2024
EN
40,4
96,1
49N
/ASE
Q3.
25FI
X31
37A
5Y
L2
Febr
uary
15,
2024
V-10
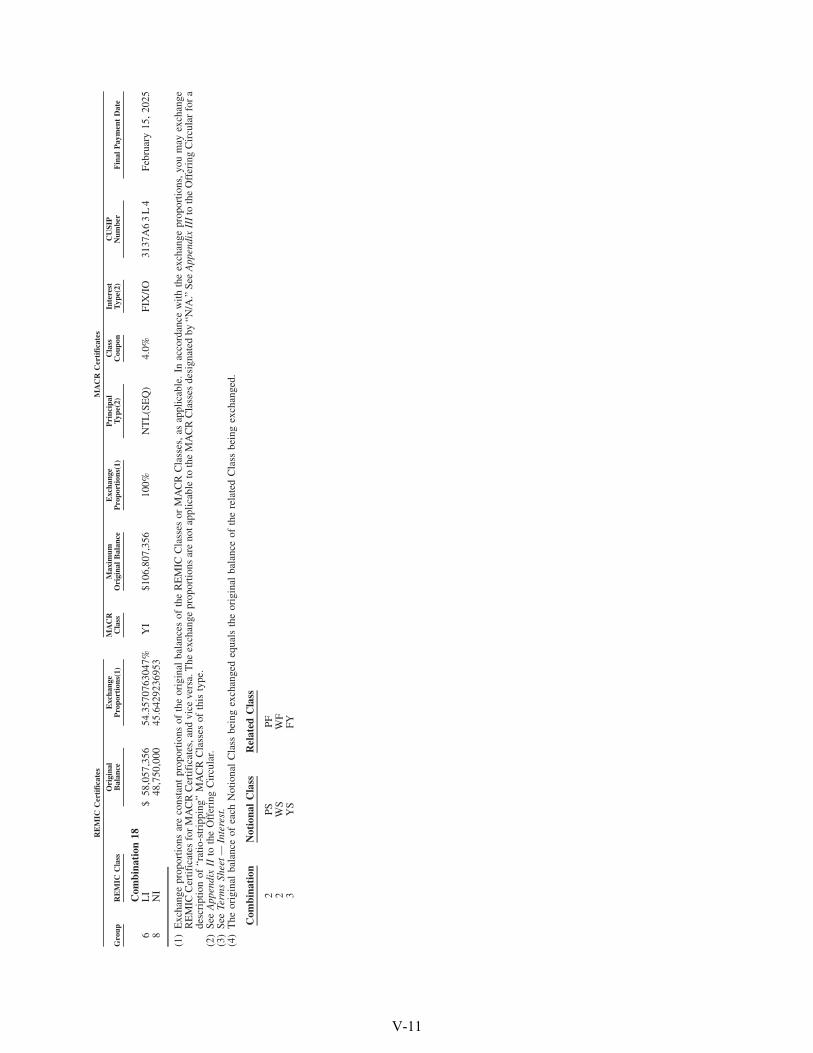
Gro
upR
EM
ICC
lass
Ori
gina
lB
alan
ceE
xcha
nge
Pro
port
ions
(1)
MA
CR
Cla
ssM
axim
umO
rigi
nal
Bal
ance
Exc
hang
eP
ropo
rtio
ns(1
)P
rinc
ipal
Typ
e(2)
Cla
ssC
oupo
nIn
tere
stT
ype(
2)C
USI
PN
umbe
rF
inal
Pay
men
tD
ate
RE
MIC
Cer
tifi
cate
sM
AC
RC
erti
fica
tes
Com
bina
tion
186
LI
$58
,057
,356
54.3
5707
6304
7%Y
I$1
06,8
07,3
5610
0%N
TL
(SE
Q)
4.0%
FIX
/IO
3137
A6
3L
4Fe
brua
ry15
,20
258
NI
48,7
50,0
0045
.642
9236
953
(1)
Exc
hang
epr
opor
tions
are
cons
tant
prop
ortio
nsof
the
orig
inal
bala
nces
ofth
eR
EM
ICC
lass
esor
MA
CR
Cla
sses
,as
appl
icab
le.
Inac
cord
ance
with
the
exch
ange
prop
ortio
ns,y
oum
ayex
chan
geR
EM
ICC
ertif
icat
esfo
rM
AC
RC
ertif
icat
es,a
ndvi
ceve
rsa.
The
exch
ange
prop
ortio
nsar
eno
tapp
licab
leto
the
MA
CR
Cla
sses
desi
gnat
edby
“N/A
.”Se
eA
ppen
dix
III
toth
eO
ffer
ing
Cir
cula
rfo
ra
desc
ript
ion
of“r
atio
-str
ippi
ng”
MA
CR
Cla
sses
ofth
isty
pe.
(2)
See
App
endi
xII
toth
eO
ffer
ing
Cir
cula
r.(3
)Se
eTe
rms
Shee
t—In
tere
st.
(4)
The
orig
inal
bala
nce
ofea
chN
otio
nal
Cla
ssbe
ing
exch
ange
deq
uals
the
orig
inal
bala
nce
ofth
ere
late
dC
lass
bein
gex
chan
ged.
Com
bina
tion
Not
iona
lC
lass
Rel
ated
Cla
ss
2PS
PF2
WS
WF
3Y
SFY
V-11
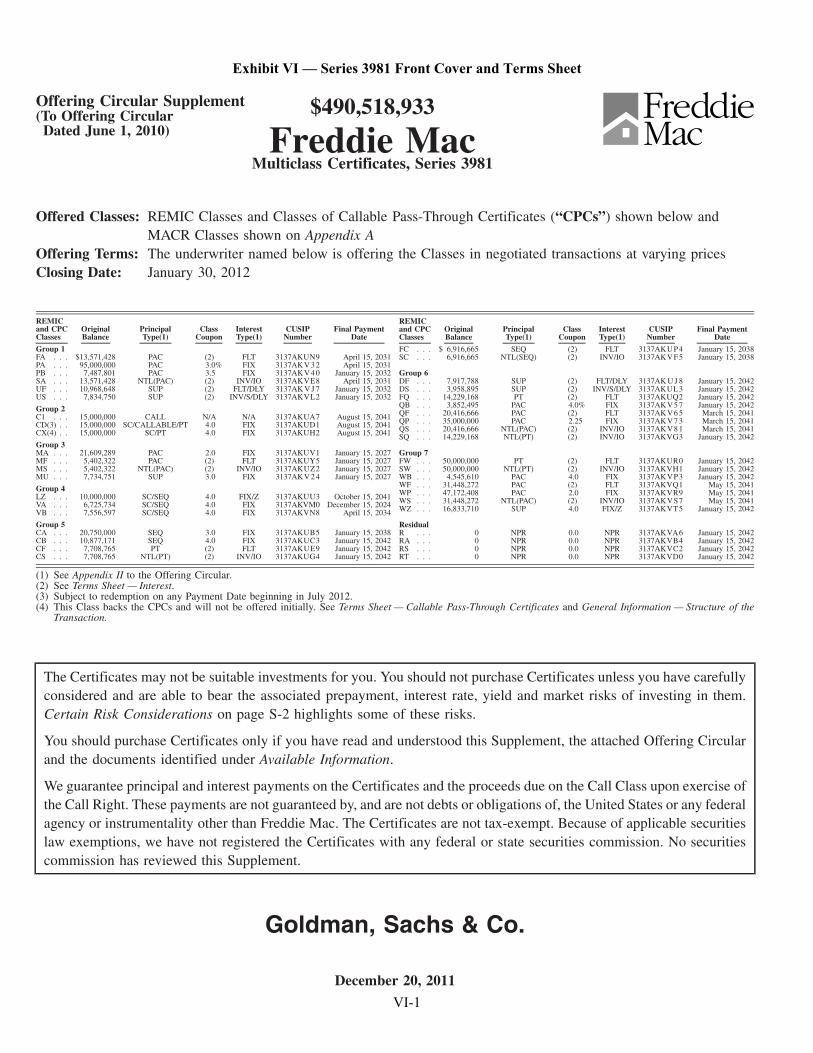
Offering Circular Supplement(To Offering Circular
Dated June 1, 2010)
$490,518,933
Freddie MacMulticlass Certificates, Series 3981
Offered Classes: REMIC Classes and Classes of Callable Pass-Through Certificates (“CPCs”) shown below andMACR Classes shown on Appendix A
Offering Terms: The underwriter named below is offering the Classes in negotiated transactions at varying pricesClosing Date: January 30, 2012
REMICand CPCClasses
OriginalBalance
PrincipalType(1)
ClassCoupon
InterestType(1)
CUSIPNumber
Final PaymentDate
Group 1FA . . . $13,571,428 PAC (2) FLT 3137AKUN9 April 15, 2031PA . . . 95,000,000 PAC 3.0% FIX 3137AKV 32 April 15, 2031PB . . . 7,487,801 PAC 3.5 FIX 3137AKV 40 January 15, 2032SA . . . 13,571,428 NTL(PAC) (2) INV/IO 3137AKVE8 April 15, 2031UF . . . 10,968,648 SUP (2) FLT/DLY 3137AK V J 7 January 15, 2032US . . . 7,834,750 SUP (2) INV/S/DLY 3137AKVL2 January 15, 2032
Group 2C1 . . . 15,000,000 CALL N/A N/A 3137AKUA7 August 15, 2041CD(3) . . 15,000,000 SC/CALLABLE/PT 4.0 FIX 3137AKUD1 August 15, 2041CX(4) . . 15,000,000 SC/PT 4.0 FIX 3137AKUH2 August 15, 2041
Group 3MA . . . 21,609,289 PAC 2.0 FIX 3137AKUV1 January 15, 2027MF . . . 5,402,322 PAC (2) FLT 3137AKUY5 January 15, 2027MS . . . 5,402,322 NTL(PAC) (2) INV/IO 3137AKUZ2 January 15, 2027MU . . . 7,734,751 SUP 3.0 FIX 3137AKV 24 January 15, 2027
Group 4LZ . . . 10,000,000 SC/SEQ 4.0 FIX/Z 3137AKUU3 October 15, 2041VA . . . 6,725,734 SC/SEQ 4.0 FIX 3137AKVM0 December 15, 2024VB . . . 7,556,597 SC/SEQ 4.0 FIX 3137AKVN8 April 15, 2034
Group 5CA . . . 20,750,000 SEQ 3.0 FIX 3137AKUB5 January 15, 2038CB . . . 10,877,171 SEQ 4.0 FIX 3137AKUC3 January 15, 2042CF . . . 7,708,765 PT (2) FLT 3137AKUE9 January 15, 2042CS . . . 7,708,765 NTL(PT) (2) INV/IO 3137AKUG4 January 15, 2042
REMICand CPCClasses
OriginalBalance
PrincipalType(1)
ClassCoupon
InterestType(1)
CUSIPNumber
Final PaymentDate
FC . . . $ 6,916,665 SEQ (2) FLT 3137AKUP4 January 15, 2038SC . . . 6,916,665 NTL(SEQ) (2) INV/IO 3137AKVF5 January 15, 2038
Group 6DF . . . 7,917,788 SUP (2) FLT/DLY 3137AK U J 8 January 15, 2042DS . . . 3,958,895 SUP (2) INV/S/DLY 3137AKUL3 January 15, 2042FQ . . . 14,229,168 PT (2) FLT 3137AKUQ2 January 15, 2042QB . . . 3,852,495 PAC 4.0% FIX 3137AK V5 7 January 15, 2042QF . . . 20,416,666 PAC (2) FLT 3137AK V6 5 March 15, 2041QP . . . 35,000,000 PAC 2.25 FIX 3137AK V7 3 March 15, 2041QS . . . 20,416,666 NTL(PAC) (2) INV/IO 3137AK V8 1 March 15, 2041SQ . . . 14,229,168 NTL(PT) (2) INV/IO 3137AKVG3 January 15, 2042
Group 7FW . . . 50,000,000 PT (2) FLT 3137AKUR0 January 15, 2042SW . . . 50,000,000 NTL(PT) (2) INV/IO 3137AKVH1 January 15, 2042WB . . . 4,545,610 PAC 4.0 FIX 3137AKVP3 January 15, 2042WF . . . 31,448,272 PAC (2) FLT 3137AKVQ1 May 15, 2041WP . . . 47,172,408 PAC 2.0 FIX 3137AKVR9 May 15, 2041WS . . . 31,448,272 NTL(PAC) (2) INV/IO 3137AKVS7 May 15, 2041WZ . . . 16,833,710 SUP 4.0 FIX/Z 3137AKVT5 January 15, 2042
ResidualR . . . 0 NPR 0.0 NPR 3137AKVA6 January 15, 2042RA . . . 0 NPR 0.0 NPR 3137AKVB4 January 15, 2042RS . . . 0 NPR 0.0 NPR 3137AKVC2 January 15, 2042RT . . . 0 NPR 0.0 NPR 3137AKVD0 January 15, 2042
(1) See Appendix II to the Offering Circular.(2) See Terms Sheet — Interest.(3) Subject to redemption on any Payment Date beginning in July 2012.(4) This Class backs the CPCs and will not be offered initially. See Terms Sheet — Callable Pass-Through Certificates and General Information — Structure of the
Transaction.
The Certificates may not be suitable investments for you. You should not purchase Certificates unless you have carefullyconsidered and are able to bear the associated prepayment, interest rate, yield and market risks of investing in them.Certain Risk Considerations on page S-2 highlights some of these risks.
You should purchase Certificates only if you have read and understood this Supplement, the attached Offering Circularand the documents identified under Available Information.
We guarantee principal and interest payments on the Certificates and the proceeds due on the Call Class upon exercise ofthe Call Right. These payments are not guaranteed by, and are not debts or obligations of, the United States or any federalagency or instrumentality other than Freddie Mac. The Certificates are not tax-exempt. Because of applicable securitieslaw exemptions, we have not registered the Certificates with any federal or state securities commission. No securitiescommission has reviewed this Supplement.
Goldman, Sachs & Co.
December 20, 2011
Exhibit VI — Series 3981 Front Cover and Terms Sheet
VI-1
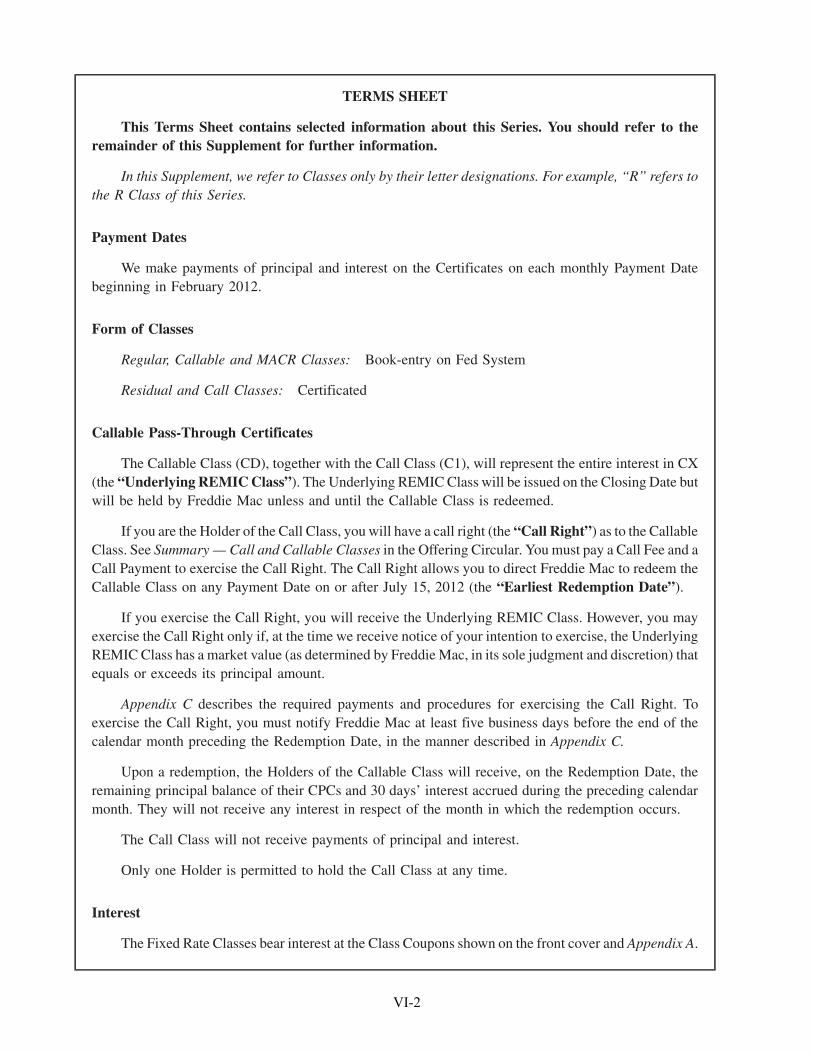
TERMS SHEET
This Terms Sheet contains selected information about this Series. You should refer to theremainder of this Supplement for further information.
In this Supplement, we refer to Classes only by their letter designations. For example, “R” refers tothe R Class of this Series.
Payment Dates
We make payments of principal and interest on the Certificates on each monthly Payment Datebeginning in February 2012.
Form of Classes
Regular, Callable and MACR Classes: Book-entry on Fed System
Residual and Call Classes: Certificated
Callable Pass-Through Certificates
The Callable Class (CD), together with the Call Class (C1), will represent the entire interest in CX(the “Underlying REMIC Class”). The Underlying REMIC Class will be issued on the Closing Date butwill be held by Freddie Mac unless and until the Callable Class is redeemed.
If you are the Holder of the Call Class, you will have a call right (the “Call Right”) as to the CallableClass. See Summary — Call and Callable Classes in the Offering Circular. You must pay a Call Fee and aCall Payment to exercise the Call Right. The Call Right allows you to direct Freddie Mac to redeem theCallable Class on any Payment Date on or after July 15, 2012 (the “Earliest Redemption Date”).
If you exercise the Call Right, you will receive the Underlying REMIC Class. However, you mayexercise the Call Right only if, at the time we receive notice of your intention to exercise, the UnderlyingREMIC Class has a market value (as determined by Freddie Mac, in its sole judgment and discretion) thatequals or exceeds its principal amount.
Appendix C describes the required payments and procedures for exercising the Call Right. Toexercise the Call Right, you must notify Freddie Mac at least five business days before the end of thecalendar month preceding the Redemption Date, in the manner described in Appendix C.
Upon a redemption, the Holders of the Callable Class will receive, on the Redemption Date, theremaining principal balance of their CPCs and 30 days’ interest accrued during the preceding calendarmonth. They will not receive any interest in respect of the month in which the redemption occurs.
The Call Class will not receive payments of principal and interest.
Only one Holder is permitted to hold the Call Class at any time.
Interest
The Fixed Rate Classes bear interest at the Class Coupons shown on the front cover and Appendix A.
VI-2
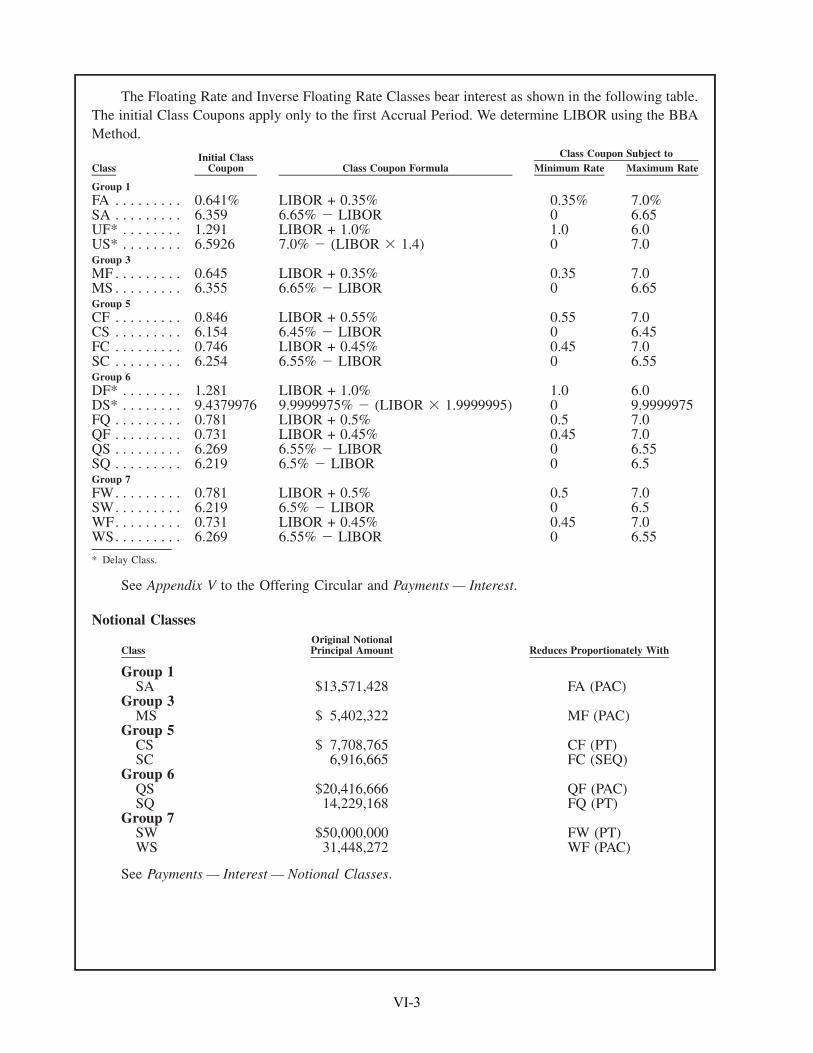
The Floating Rate and Inverse Floating Rate Classes bear interest as shown in the following table.The initial Class Coupons apply only to the first Accrual Period. We determine LIBOR using the BBAMethod.
ClassInitial Class
Coupon Class Coupon Formula Minimum Rate Maximum RateClass Coupon Subject to
Group 1FA . . . . . . . . . 0.641% LIBOR + 0.35% 0.35% 7.0%SA . . . . . . . . . 6.359 6.65% � LIBOR 0 6.65UF* . . . . . . . . 1.291 LIBOR + 1.0% 1.0 6.0US* . . . . . . . . 6.5926 7.0% � (LIBOR � 1.4) 0 7.0Group 3MF . . . . . . . . . 0.645 LIBOR + 0.35% 0.35 7.0MS . . . . . . . . . 6.355 6.65% � LIBOR 0 6.65Group 5CF . . . . . . . . . 0.846 LIBOR + 0.55% 0.55 7.0CS . . . . . . . . . 6.154 6.45% � LIBOR 0 6.45FC . . . . . . . . . 0.746 LIBOR + 0.45% 0.45 7.0SC . . . . . . . . . 6.254 6.55% � LIBOR 0 6.55Group 6DF* . . . . . . . . 1.281 LIBOR + 1.0% 1.0 6.0DS* . . . . . . . . 9.4379976 9.9999975% � (LIBOR � 1.9999995) 0 9.9999975FQ . . . . . . . . . 0.781 LIBOR + 0.5% 0.5 7.0QF . . . . . . . . . 0.731 LIBOR + 0.45% 0.45 7.0QS . . . . . . . . . 6.269 6.55% � LIBOR 0 6.55SQ . . . . . . . . . 6.219 6.5% � LIBOR 0 6.5Group 7FW. . . . . . . . . 0.781 LIBOR + 0.5% 0.5 7.0SW. . . . . . . . . 6.219 6.5% � LIBOR 0 6.5WF. . . . . . . . . 0.731 LIBOR + 0.45% 0.45 7.0WS. . . . . . . . . 6.269 6.55% � LIBOR 0 6.55
* Delay Class.
See Appendix V to the Offering Circular and Payments — Interest.
Notional Classes
ClassOriginal NotionalPrincipal Amount Reduces Proportionately With
Group 1SA $13,571,428 FA (PAC)
Group 3MS $ 5,402,322 MF (PAC)
Group 5CS $ 7,708,765 CF (PT)SC 6,916,665 FC (SEQ)
Group 6QS $20,416,666 QF (PAC)SQ 14,229,168 FQ (PT)
Group 7SW $50,000,000 FW (PT)WS 31,448,272 WF (PAC)
See Payments — Interest — Notional Classes.
VI-3
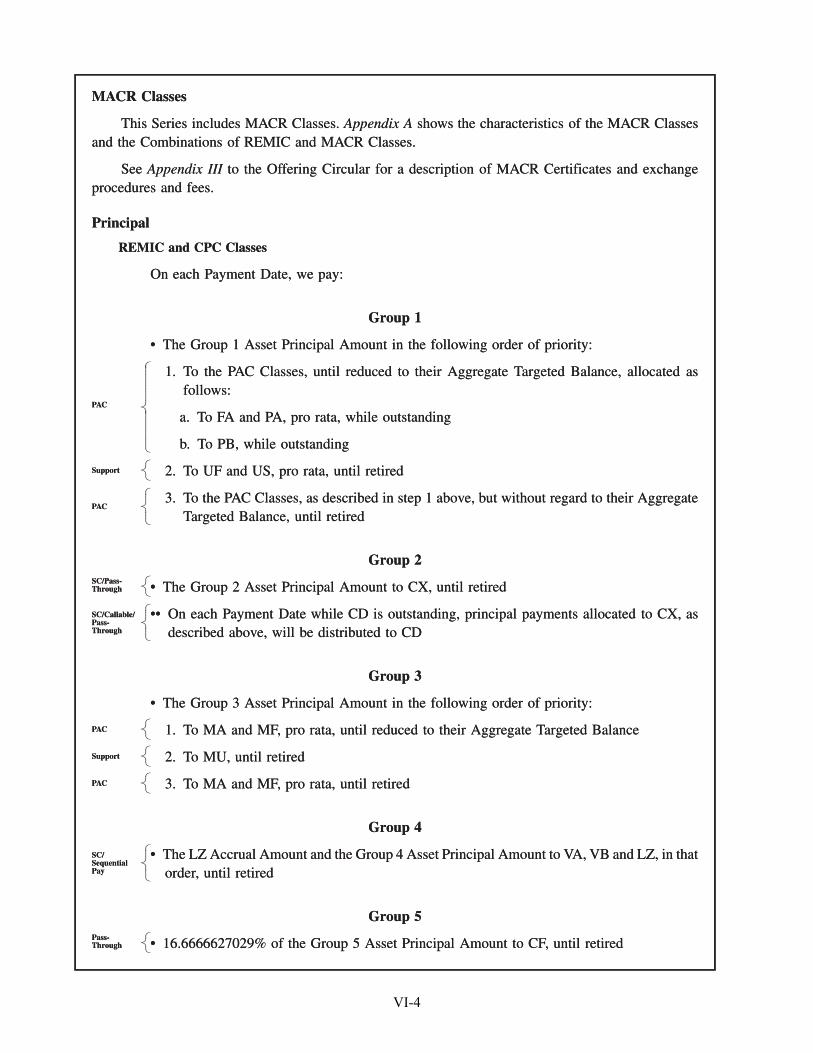
MACR Classes
This Series includes MACR Classes. Appendix A shows the characteristics of the MACR Classesand the Combinations of REMIC and MACR Classes.
See Appendix III to the Offering Circular for a description of MACR Certificates and exchangeprocedures and fees.
Principal
REMIC and CPC Classes
On each Payment Date, we pay:
Group 1
• The Group 1 Asset Principal Amount in the following order of priority:
1. To the PAC Classes, until reduced to their Aggregate Targeted Balance, allocated asfollows:
a. To FA and PA, pro rata, while outstanding
b. To PB, while outstanding
PAC
2. To UF and US, pro rata, until retiredSupport
3. To the PAC Classes, as described in step 1 above, but without regard to their AggregateTargeted Balance, until retired
PAC
Group 2
• The Group 2 Asset Principal Amount to CX, until retiredSC/Pass-Through
•• On each Payment Date while CD is outstanding, principal payments allocated to CX, asdescribed above, will be distributed to CD
SC/Callable/Pass-Through
Group 3
• The Group 3 Asset Principal Amount in the following order of priority:
1. To MA and MF, pro rata, until reduced to their Aggregate Targeted BalancePAC
2. To MU, until retiredSupport
3. To MA and MF, pro rata, until retiredPAC
Group 4
• The LZ Accrual Amount and the Group 4 Asset Principal Amount to VA, VB and LZ, in thatorder, until retired
SC/SequentialPay
Group 5
• 16.6666627029% of the Group 5 Asset Principal Amount to CF, until retiredPass-Through
MACR Classes
This Series includes MACR Classes. Appendix A shows the characteristics of the MACR Classesand the Combinations of REMIC and MACR Classes.
See Appendix III to the Offering Circular for a description of MACR Certificates and exchangeprocedures and fees.
Principal
REMIC and CPC Classes
On each Payment Date, we pay:
Group 1
• The Group 1 Asset Principal Amount in the following order of priority:
1. To the PAC Classes, until reduced to their Aggregate Targeted Balance, allocated asfollows:
a. To FA and PA, pro rata, while outstanding
b. To PB, while outstanding
�������������������������������
PAC
2. To UF and US, pro rata, until retired�����Support
3. To the PAC Classes, as described in step 1 above, but without regard to their AggregateTargeted Balance, until retired
�����������
PAC
Group 2
• The Group 2 Asset Principal Amount to CX, until retired�����
SC/Pass-Through
•• On each Payment Date while CD is outstanding, principal payments allocated to CX, asdescribed above, will be distributed to CD
�����������
SC/Callable/Pass-Through
Group 3
• The Group 3 Asset Principal Amount in the following order of priority:
1. To MA and MF, pro rata, until reduced to their Aggregate Targeted Balance�����PAC
2. To MU, until retired�����Support
3. To MA and MF, pro rata, until retired�����PAC
Group 4
• The LZ Accrual Amount and the Group 4 Asset Principal Amount to VA, VB and LZ, in thatorder, until retired
�����������
SC/SequentialPay
Group 5
• 16.6666627029% of the Group 5 Asset Principal Amount to CF, until retired�����
Pass-Through
VI-4
• 83.3333372971% of the Group 5 Asset Principal Amount in the following order of priority:
1. To CA and FC, pro rata, until retired
2. To CB, until retired
SequentialPay
Group 6
• 16.6666658858% of the Group 6 Asset Principal Amount to FQ, until retiredPass-Through
• 83.3333341142% of the Group 6 Asset Principal Amount in the following order of priority:
1. To the PAC Classes, until reduced to their Aggregate Targeted Balance, allocated asfollows:
a. To QF and QP, pro rata, while outstanding
b. To QB, while outstanding
PAC
2. To DF and DS, pro rata, until retiredSupport
3. To the PAC Classes, as described in step 1 above, but without regard to their AggregateTargeted Balance, until retired
PAC
Group 7
• 1/3 of the Group 7 Asset Principal Amount to FW, until retiredPass-Through
• The WZ Accrual Amount and 2/3 of the Group 7 Asset Principal Amount in the followingorder of priority:
1. To the PAC Classes, until reduced to their Aggregate Targeted Balance, allocated asfollows:
a. To WF and WP, pro rata, while outstanding
b. To WB, while outstanding
PAC
2. To WZ, until retiredSupport
3. To the PAC Classes, as described in step 1 above, but without regard to their AggregateTargeted Balance, until retired
PAC
The “Aggregate Targeted Balances” are in Appendix B. They were calculated using the followingStructuring Ranges.
Structuring Range
Group 1PAC . . . . . . . . . . . . . . . . . . . . . . . . . . . . . . . . . . . . . . . . . . . . . 150% PSA - 250% PSA
Group 3PAC . . . . . . . . . . . . . . . . . . . . . . . . . . . . . . . . . . . . . . . . . . . . . 100% PSA - 285% PSA
Group 6PAC . . . . . . . . . . . . . . . . . . . . . . . . . . . . . . . . . . . . . . . . . . . . . 150% PSA - 250% PSA
Group 7PAC . . . . . . . . . . . . . . . . . . . . . . . . . . . . . . . . . . . . . . . . . . . . . 150% PSA - 250% PSA
See Payments — Principal and Prepayment and Yield Analysis.
• 83.3333372971% of the Group 5 Asset Principal Amount in the following order of priority:
1. To CA and FC, pro rata, until retired
2. To CB, until retired
�������������������������
SequentialPay
Group 6
• 16.6666658858% of the Group 6 Asset Principal Amount to FQ, until retired�����
Pass-Through
• 83.3333341142% of the Group 6 Asset Principal Amount in the following order of priority:
1. To the PAC Classes, until reduced to their Aggregate Targeted Balance, allocated asfollows:
a. To QF and QP, pro rata, while outstanding
b. To QB, while outstanding
�������������������������������
PAC
2. To DF and DS, pro rata, until retired�����Support
3. To the PAC Classes, as described in step 1 above, but without regard to their AggregateTargeted Balance, until retired
�����������
PAC
Group 7
• 1/3 of the Group 7 Asset Principal Amount to FW, until retired�����
Pass-Through
• The WZ Accrual Amount and 2/3 of the Group 7 Asset Principal Amount in the followingorder of priority:
1. To the PAC Classes, until reduced to their Aggregate Targeted Balance, allocated asfollows:
a. To WF and WP, pro rata, while outstanding
b. To WB, while outstanding
�������������������������������
PAC
2. To WZ, until retired�����Support
3. To the PAC Classes, as described in step 1 above, but without regard to their AggregateTargeted Balance, until retired
�����������
PAC
The “Aggregate Targeted Balances” are in Appendix B. They were calculated using the followingStructuring Ranges.
Structuring Range
Group 1PAC . . . . . . . . . . . . . . . . . . . . . . . . . . . . . . . . . . . . . . . . . . . . . 150% PSA - 250% PSA
Group 3PAC . . . . . . . . . . . . . . . . . . . . . . . . . . . . . . . . . . . . . . . . . . . . . 100% PSA - 285% PSA
Group 6PAC . . . . . . . . . . . . . . . . . . . . . . . . . . . . . . . . . . . . . . . . . . . . . 150% PSA - 250% PSA
Group 7PAC . . . . . . . . . . . . . . . . . . . . . . . . . . . . . . . . . . . . . . . . . . . . . 150% PSA - 250% PSA
See Payments — Principal and Prepayment and Yield Analysis.
VI-5
MACR Classes
On each Payment Date when any outstanding MACR Certificates are entitled to principal payments,we allocate such payments from the applicable REMIC Certificates to those MACR Certificates, asdescribed under MACR Certificates in the Offering Circular.
REMIC Status
We will form two Upper-Tier REMIC Pools, two Lower-Tier REMIC Pools and a Callable Pass-Through Pool for this Series. We will elect to treat each REMIC Pool as a REMIC under the Code. R, RA,RS and RTwill be “Residual Classes” and the other Classes shown on the front cover (other than CD andC1) will be “Regular Classes.” The Residual Classes will be subject to transfer restrictions. The CallablePass-Through Pool will be treated as a grantor trust under the Code. See Certain Federal Income TaxConsequences in this Supplement and the Offering Circular.
If you own the Callable Class, you will be treated for federal income tax purposes as owning theUnderlying REMIC Class and as having written a call option on the Underlying REMIC Class.
If you own the Call Class, you will be treated for federal income tax purposes as holding a call optionon the related REMIC Class.
See Certain Federal Income Tax Consequences in this Supplement and the Offering Circular.
Weighted Average Lives (in years)*
Group 1
0% 150% 220% 250% 500%PSA Prepayment Assumption
FA, PA and SA . . . . . . . . . . . . . . . . . . . . . . . . . . . . . 10.3 5.1 5.1 5.1 3.3PB. . . . . . . . . . . . . . . . . . . . . . . . . . . . . . . . . . . . . . . 18.0 15.8 15.8 15.8 10.3UF, UP and US . . . . . . . . . . . . . . . . . . . . . . . . . . . . . 19.1 13.6 5.3 2.5 1.0Group 1 Assets . . . . . . . . . . . . . . . . . . . . . . . . . . . . . 11.9 6.9 5.7 5.3 3.3
Group 2
Redemption Date 0% 100% 200% 300% 400%PSA Prepayment Assumption
CD
July 15, 2012. . . . . . . . . . . . . . . . . . . . . . . 0.5 0.5 0.5 0.5 0.5January 15, 2013 . . . . . . . . . . . . . . . . . . . . 1.0 1.0 1.0 1.0 1.0January 15, 2015 . . . . . . . . . . . . . . . . . . . . 3.0 3.0 3.0 3.0 3.0January 15, 2017 . . . . . . . . . . . . . . . . . . . . 5.0 5.0 5.0 5.0 4.9January 15, 2019 . . . . . . . . . . . . . . . . . . . . 7.0 7.0 7.0 6.8 6.3January 15, 2022 . . . . . . . . . . . . . . . . . . . . 10.0 10.0 9.7 8.5 7.2No Redemption . . . . . . . . . . . . . . . . . . . . . 26.3 19.8 13.8 10.1 7.8
0% 100% 200% 300% 400%PSA Prepayment Assumption
CX and Group 2 Assets . . . . . . . . . . . . . . . . . . . . . . 26.3 19.8 13.8 10.1 7.8
* We calculate weighted average lives based on the assumptions described in Prepayment and Yield Analysis and, in the case of theCallable Class, the various redemption scenarios shown. The actual weighted average lives are likely to differ from those shown,perhaps significantly, and any redemption of the Callable Class is likely to occur on a date other than those shown.
MACR Classes
On each Payment Date when any outstanding MACR Certificates are entitled to principal payments,we allocate such payments from the applicable REMIC Certificates to those MACR Certificates, asdescribed under MACR Certificates in the Offering Circular.
REMIC Status
We will form two Upper-Tier REMIC Pools, two Lower-Tier REMIC Pools and a Callable Pass-Through Pool for this Series. We will elect to treat each REMIC Pool as a REMIC under the Code. R, RA,RS and RTwill be “Residual Classes” and the other Classes shown on the front cover (other than CD andC1) will be “Regular Classes.” The Residual Classes will be subject to transfer restrictions. The CallablePass-Through Pool will be treated as a grantor trust under the Code. See Certain Federal Income TaxConsequences in this Supplement and the Offering Circular.
If you own the Callable Class, you will be treated for federal income tax purposes as owning theUnderlying REMIC Class and as having written a call option on the Underlying REMIC Class.
If you own the Call Class, you will be treated for federal income tax purposes as holding a call optionon the related REMIC Class.
See Certain Federal Income Tax Consequences in this Supplement and the Offering Circular.
Weighted Average Lives (in years)*
Group 1
0% 150% 220% 250% 500%PSA Prepayment Assumption
FA, PA and SA . . . . . . . . . . . . . . . . . . . . . . . . . . . . . 10.3 5.1 5.1 5.1 3.3PB. . . . . . . . . . . . . . . . . . . . . . . . . . . . . . . . . . . . . . . 18.0 15.8 15.8 15.8 10.3UF, UP and US . . . . . . . . . . . . . . . . . . . . . . . . . . . . . 19.1 13.6 5.3 2.5 1.0Group 1 Assets . . . . . . . . . . . . . . . . . . . . . . . . . . . . . 11.9 6.9 5.7 5.3 3.3
Group 2
Redemption Date 0% 100% 200% 300% 400%PSA Prepayment Assumption
CD
July 15, 2012. . . . . . . . . . . . . . . . . . . . . . . 0.5 0.5 0.5 0.5 0.5January 15, 2013 . . . . . . . . . . . . . . . . . . . . 1.0 1.0 1.0 1.0 1.0January 15, 2015 . . . . . . . . . . . . . . . . . . . . 3.0 3.0 3.0 3.0 3.0January 15, 2017 . . . . . . . . . . . . . . . . . . . . 5.0 5.0 5.0 5.0 4.9January 15, 2019 . . . . . . . . . . . . . . . . . . . . 7.0 7.0 7.0 6.8 6.3January 15, 2022 . . . . . . . . . . . . . . . . . . . . 10.0 10.0 9.7 8.5 7.2No Redemption . . . . . . . . . . . . . . . . . . . . . 26.3 19.8 13.8 10.1 7.8
�����������������������������������
0% 100% 200% 300% 400%PSA Prepayment Assumption
CX and Group 2 Assets . . . . . . . . . . . . . . . . . . . . . . 26.3 19.8 13.8 10.1 7.8
* We calculate weighted average lives based on the assumptions described in Prepayment and Yield Analysis and, in the case of theCallable Class, the various redemption scenarios shown. The actual weighted average lives are likely to differ from those shown,perhaps significantly, and any redemption of the Callable Class is likely to occur on a date other than those shown.
VI-6
Group 3
0% 100% 225% 285% 500%PSA Prepayment Assumption
MA, MD, ME, MF and MS . . . . . . . . . . . . . . . . . . . 7.0 5.0 5.0 5.0 3.7MU . . . . . . . . . . . . . . . . . . . . . . . . . . . . . . . . . . . . . . 13.7 11.1 4.6 2.4 1.3Group 3 Assets . . . . . . . . . . . . . . . . . . . . . . . . . . . . . 8.5 6.4 4.9 4.4 3.2
Group 4
0% 100% 200% 300% 400%PSA Prepayment Assumption
LV. . . . . . . . . . . . . . . . . . . . . . . . . . . . . . . . . . . . . . . 12.7 11.1 8.3 6.5 5.3LZ. . . . . . . . . . . . . . . . . . . . . . . . . . . . . . . . . . . . . . . 26.7 22.6 17.7 13.7 10.9VA . . . . . . . . . . . . . . . . . . . . . . . . . . . . . . . . . . . . . . 7.0 7.0 6.1 5.0 4.2VB . . . . . . . . . . . . . . . . . . . . . . . . . . . . . . . . . . . . . . 17.8 14.7 10.3 7.8 6.3Group 4 Assets . . . . . . . . . . . . . . . . . . . . . . . . . . . . . 26.7 20.9 15.0 11.0 8.6
Group 5
0% 100% 190% 300% 400%PSA Prepayment Assumption
CA, FC and SC. . . . . . . . . . . . . . . . . . . . . . . . . . . . . 16.7 6.9 4.6 3.3 2.7CB . . . . . . . . . . . . . . . . . . . . . . . . . . . . . . . . . . . . . . 28.1 21.3 15.6 11.2 8.8CF, CS and Group 5 Assets . . . . . . . . . . . . . . . . . . . 19.9 11.0 7.7 5.5 4.4
Group 6
0% 150% 200% 250% 400%PSA Prepayment Assumption
DF, DS and QU . . . . . . . . . . . . . . . . . . . . . . . . . . . . 28.9 17.6 9.0 2.6 1.2FQ, SQ and Group 6 Assets . . . . . . . . . . . . . . . . . . . 19.9 8.5 7.1 6.0 4.1QB . . . . . . . . . . . . . . . . . . . . . . . . . . . . . . . . . . . . . . 27.3 19.7 19.7 19.7 13.7QF, QP and QS . . . . . . . . . . . . . . . . . . . . . . . . . . . . . 17.4 5.8 5.8 5.8 4.1
Group 7
0% 150% 200% 250% 400% 700%PSA Prepayment Assumption
CP, DP, EP, GP, WF, WP and WS . . . . . . . . 14.1 5.9 5.9 5.9 4.1 2.5FW, SW and Group 7 Assets . . . . . . . . . . . . 20.2 8.5 7.1 6.0 4.1 2.5WB . . . . . . . . . . . . . . . . . . . . . . . . . . . . . . . 23.6 20.5 20.5 20.5 14.2 8.0WZ. . . . . . . . . . . . . . . . . . . . . . . . . . . . . . . . 27.0 17.7 9.0 2.6 1.1 0.6
The Assets
The Group 1, 3, 5, 6 and 7 Assets (the “PC Assets”) consist of Freddie Mac PCs with the followingcharacteristics:
Group Principal BalanceOriginal Term
(in years) Interest Rate
1 $134,862,627 20 3.5%3 34,746,362 15 3.05* 46,252,601 30 4.56 85,375,012 30 4.57 150,000,000 30 5.0
* Backed by High LTV Mortgages. See General Information — The Mortgages.
VI-7
The Group 2 and 4 Assets (the “Multiclass Assets”) consist of:
Group Class
Percentage ofClass in
This SeriesBalance inThis Series
Class Factorfor Month ofClosing Date
ClassCoupon
Principal/Interest Type Final Payment Date
2 3907-LB(1)(2) 13.8196054486% $15,000,000 1.00000000 4.0% SEQ/FIX August 15, 2041
4 3907-LB(1)(2) 17.7649471033 19,282,331 1.00000000 4.0 SEQ/FIX August 15, 20413936-EB(1)(2) 19.6692613701 5,000,000 1.00000000 4.0 SEQ/FIX October 15, 2041
(1) MACR Class.(2) Backed by High LTV Mortgages. See General Information — The Mortgages.
See General Information — Structure of Transaction and Exhibits I and II.
We will publish a Supplemental Statement applicable to this Series shortly after the Closing Date.The Supplemental Statement will contain a schedule of the Assets and other information. See AvailableInformation.
Mortgage Characteristics (as of January 1, 2012)
PC Assets — Assumed Mortgage Characteristics
Group Principal Balance
Remaining Termto Maturity(in months)
Loan Age(in months)
Per AnnumInterest Rate
Per AnnumInterest Rate
of Related PCs
1 $134,862,627 237 3 3.950% 3.5%3 34,746,362 178 2 3.500 3.05 46,252,601 359 1 4.950 4.56 85,375,012 349 6 4.875 4.57 150,000,000 348 7 5.370 5.0
Multiclass Assets — Mortgage Characteristics
Group Series
Weighted AverageRemaining Term
to Maturity(in months)
Weighted AverageLoan Age
(in months)
Weighted AveragePer Annum
Interest Rate
Per AnnumInterest Rate
of Related PCs
2 3907 347 7 5.408% 5.0%
4 3907 347 7 5.408 5.03936 349 7 5.386 5.0
The actual characteristics of the Mortgages differ from those shown, in some cases significantly.
See General Information — The Mortgages.
The Group 2 and 4 Assets (the “Multiclass Assets”) consist of:
Group Class
Percentage ofClass in
This SeriesBalance inThis Series
Class Factorfor Month ofClosing Date
ClassCoupon
Principal/Interest Type Final Payment Date
2 3907-LB(1)(2) 13.8196054486% $15,000,000 1.00000000 4.0% SEQ/FIX August 15, 2041
4 3907-LB(1)(2) 17.7649471033 19,282,331 1.00000000 4.0 SEQ/FIX August 15, 20413936-EB(1)(2) 19.6692613701 5,000,000 1.00000000 4.0 SEQ/FIX October 15, 2041
���������
(1) MACR Class.(2) Backed by High LTV Mortgages. See General Information — The Mortgages.
See General Information — Structure of Transaction and Exhibits I and II.
We will publish a Supplemental Statement applicable to this Series shortly after the Closing Date.The Supplemental Statement will contain a schedule of the Assets and other information. See AvailableInformation.
Mortgage Characteristics (as of January 1, 2012)
PC Assets — Assumed Mortgage Characteristics
Group Principal Balance
Remaining Termto Maturity(in months)
Loan Age(in months)
Per AnnumInterest Rate
Per AnnumInterest Rate
of Related PCs
1 $134,862,627 237 3 3.950% 3.5%3 34,746,362 178 2 3.500 3.05 46,252,601 359 1 4.950 4.56 85,375,012 349 6 4.875 4.57 150,000,000 348 7 5.370 5.0
Multiclass Assets — Mortgage Characteristics
Group Series
Weighted AverageRemaining Term
to Maturity(in months)
Weighted AverageLoan Age
(in months)
Weighted AveragePer Annum
Interest Rate
Per AnnumInterest Rate
of Related PCs
2 3907 347 7 5.408% 5.0%
4 3907 347 7 5.408 5.03936 349 7 5.386 5.0
���������
The actual characteristics of the Mortgages differ from those shown, in some cases significantly.
See General Information — The Mortgages.
VI-8
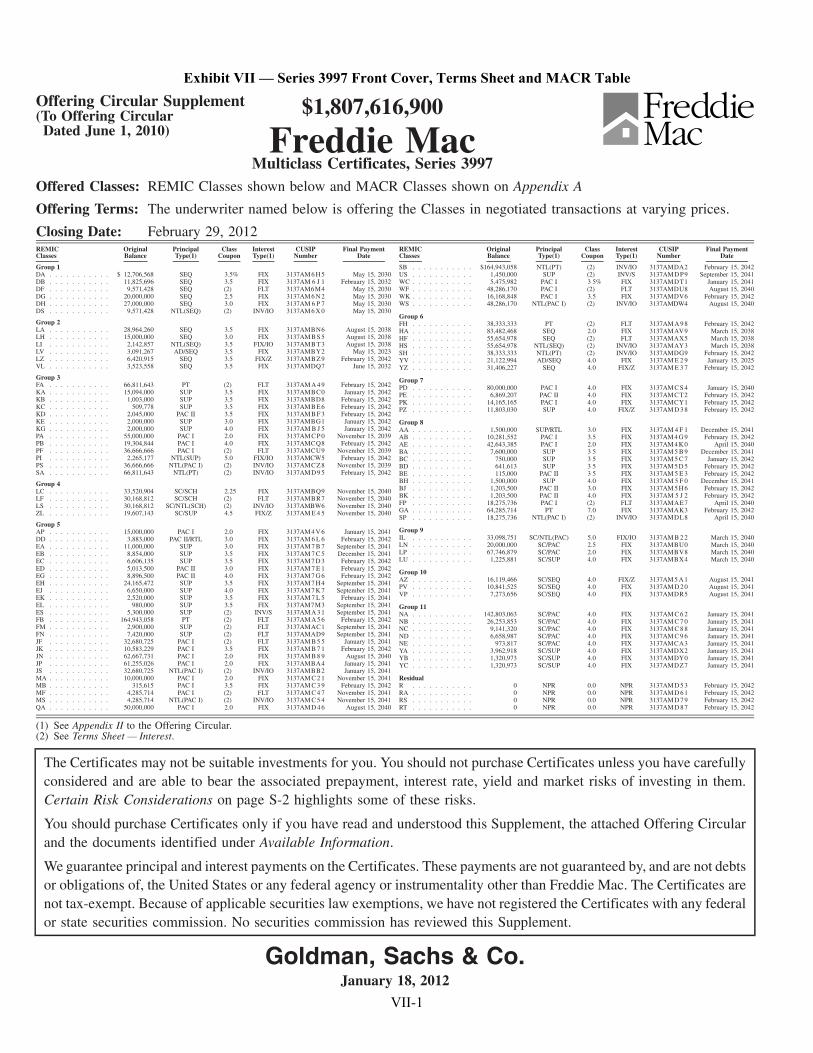
Offering Circular Supplement(To Offering Circular
Dated June 1, 2010)
$1,807,616,900
Freddie MacMulticlass Certificates, Series 3997
Offered Classes: REMIC Classes shown below and MACR Classes shown on Appendix A
Offering Terms: The underwriter named below is offering the Classes in negotiated transactions at varying prices.
Closing Date: February 29, 2012REMICClasses
OriginalBalance
PrincipalType(1)
ClassCoupon
InterestType(1)
CUSIPNumber
Final PaymentDate
Group 1DA . . . . . . . . . . . $ 12,706,568 SEQ 3.5% FIX 3137AM 6 H 5 May 15, 2030DB . . . . . . . . . . . 11,825,696 SEQ 3.5 FIX 3137AM 6 J 1 February 15, 2032DF . . . . . . . . . . . 9,571,428 SEQ (2) FLT 3137AM6M4 May 15, 2030DG . . . . . . . . . . . 20,000,000 SEQ 2.5 FIX 3137AM 6 N 2 May 15, 2030DH . . . . . . . . . . . 27,000,000 SEQ 3.0 FIX 3137AM 6 P 7 May 15, 2030DS . . . . . . . . . . . 9,571,428 NTL(SEQ) (2) INV/IO 3137AM 6 X 0 May 15, 2030
Group 2LA . . . . . . . . . . . 28,964,260 SEQ 3.5 FIX 3137AMBN6 August 15, 2038LH . . . . . . . . . . . 15,000,000 SEQ 3.0 FIX 3137AM B S 5 August 15, 2038LI . . . . . . . . . . . 2,142,857 NTL(SEQ) 3.5 FIX/IO 3137AMB T 3 August 15, 2038LV . . . . . . . . . . . 3,091,267 AD/SEQ 3.5 FIX 3137AMBY2 May 15, 2023LZ . . . . . . . . . . . 6,420,915 SEQ 3.5 FIX/Z 3137AMB Z 9 February 15, 2042VL . . . . . . . . . . . 3,523,558 SEQ 3.5 FIX 3137AMDQ7 June 15, 2032
Group 3FA . . . . . . . . . . . 66,811,643 PT (2) FLT 3137AM A 4 9 February 15, 2042KA . . . . . . . . . . . 15,094,000 SUP 3.5 FIX 3137AMBC0 January 15, 2042KB . . . . . . . . . . . 1,003,000 SUP 3.5 FIX 3137AMBD8 February 15, 2042KC . . . . . . . . . . . 509,778 SUP 3.5 FIX 3137AMB E 6 February 15, 2042KD . . . . . . . . . . . 2,045,000 PAC II 3.5 FIX 3137AM B F 3 February 15, 2042KE . . . . . . . . . . . 2,000,000 SUP 3.0 FIX 3137AMBG1 January 15, 2042KG . . . . . . . . . . . 2,000,000 SUP 4.0 FIX 3137AM B J 5 January 15, 2042PA . . . . . . . . . . . 55,000,000 PAC I 2.0 FIX 3137AM C P 0 November 15, 2039PB . . . . . . . . . . . 19,304,844 PAC I 4.0 FIX 3137AMCQ8 February 15, 2042PF . . . . . . . . . . . 36,666,666 PAC I (2) FLT 3137AMCU9 November 15, 2039PI . . . . . . . . . . . 2,265,177 NTL(SUP) 5.0 FIX/IO 3137AMCW5 February 15, 2042PS . . . . . . . . . . . 36,666,666 NTL(PAC I) (2) INV/IO 3137AMC Z 8 November 15, 2039SA . . . . . . . . . . . 66,811,643 NTL(PT) (2) INV/IO 3137AM D 9 5 February 15, 2042
Group 4LC . . . . . . . . . . . 33,520,904 SC/SCH 2.25 FIX 3137AMBQ9 November 15, 2040LF . . . . . . . . . . . 30,168,812 SC/SCH (2) FLT 3137AMBR7 November 15, 2040LS . . . . . . . . . . . 30,168,812 SC/NTL(SCH) (2) INV/IO 3137AMBW6 November 15, 2040ZL . . . . . . . . . . . 19,607,143 SC/SUP 4.5 FIX/Z 3137AM E 4 5 November 15, 2040
Group 5AP . . . . . . . . . . . 15,000,000 PAC I 2.0 FIX 3137AM 4 V 6 January 15, 2041DD . . . . . . . . . . . 3,883,000 PAC II/RTL 3.0 FIX 3137AM 6 L 6 February 15, 2042EA . . . . . . . . . . . 11,000,000 SUP 3.0 FIX 3137AM 7 B 7 September 15, 2041EB . . . . . . . . . . . 8,854,000 SUP 3.5 FIX 3137AM 7 C 5 December 15, 2041EC . . . . . . . . . . . 6,606,135 SUP 3.5 FIX 3137AM 7 D 3 February 15, 2042ED . . . . . . . . . . . 5,013,500 PAC II 3.0 FIX 3137AM 7 E 1 February 15, 2042EG . . . . . . . . . . . 8,896,500 PAC II 4.0 FIX 3137AM 7 G 6 February 15, 2042EH . . . . . . . . . . . 24,165,472 SUP 3.5 FIX 3137AM 7 H 4 September 15, 2041EJ . . . . . . . . . . . 6,650,000 SUP 4.0 FIX 3137AM 7 K 7 September 15, 2041EK . . . . . . . . . . . 2,520,000 SUP 3.5 FIX 3137AM 7 L 5 February 15, 2041EL . . . . . . . . . . . 980,000 SUP 3.5 FIX 3137AM7M3 September 15, 2041ES . . . . . . . . . . . 5,300,000 SUP (2) INV/S 3137AM A 3 1 September 15, 2041FB . . . . . . . . . . . 164,943,058 PT (2) FLT 3137AM A 5 6 February 15, 2042FM . . . . . . . . . . . 2,900,000 SUP (2) FLT 3137AMAC1 September 15, 2041FN . . . . . . . . . . . 7,420,000 SUP (2) FLT 3137AMAD9 September 15, 2041JF . . . . . . . . . . . 32,680,725 PAC I (2) FLT 3137AM B 5 5 January 15, 2041JK . . . . . . . . . . . 10,583,229 PAC I 3.5 FIX 3137AM B 7 1 February 15, 2042JN . . . . . . . . . . . 62,667,731 PAC I 2.0 FIX 3137AM B 8 9 August 15, 2040JP . . . . . . . . . . . 61,255,026 PAC I 2.0 FIX 3137AMBA4 January 15, 2041JS . . . . . . . . . . . 32,680,725 NTL(PAC I) (2) INV/IO 3137AMBB2 January 15, 2041MA . . . . . . . . . . . 10,000,000 PAC I 2.0 FIX 3137AM C 2 1 November 15, 2041MB . . . . . . . . . . . 315,615 PAC I 3.5 FIX 3137AM C 3 9 February 15, 2042MF . . . . . . . . . . . 4,285,714 PAC I (2) FLT 3137AM C 4 7 November 15, 2041MS . . . . . . . . . . . 4,285,714 NTL(PAC I) (2) INV/IO 3137AM C 5 4 November 15, 2041QA . . . . . . . . . . . 50,000,000 PAC I 2.0 FIX 3137AM D 4 6 August 15, 2040
REMICClasses
OriginalBalance
PrincipalType(1)
ClassCoupon
InterestType(1)
CUSIPNumber
Final PaymentDate
SB . . . . . . . . . . . $164,943,058 NTL(PT) (2) INV/IO 3137AMDA2 February 15, 2042US . . . . . . . . . . . 1,450,000 SUP (2) INV/S 3137AMD P9 September 15, 2041WC . . . . . . . . . . . 5,475,982 PAC I 3 5% FIX 3137AMDT1 January 15, 2041WF . . . . . . . . . . . 48,286,170 PAC I (2) FLT 3137AMDU8 August 15, 2040WK . . . . . . . . . . . 16,168,848 PAC I 3.5 FIX 3137AMDV6 February 15, 2042WS . . . . . . . . . . . 48,286,170 NTL(PAC I) (2) INV/IO 3137AMDW4 August 15, 2040
Group 6FH . . . . . . . . . . . 38,333,333 PT (2) FLT 3137AM A 9 8 February 15, 2042HA . . . . . . . . . . . 83,482,468 SEQ 2.0 FIX 3137AMAV9 March 15, 2038HF . . . . . . . . . . . 55,654,978 SEQ (2) FLT 3137AMAX5 March 15, 2038HS . . . . . . . . . . . 55,654,978 NTL(SEQ) (2) INV/IO 3137AMAY3 March 15, 2038SH . . . . . . . . . . . 38,333,333 NTL(PT) (2) INV/IO 3137AMDG9 February 15, 2042YV . . . . . . . . . . . 21,122,994 AD/SEQ 4.0 FIX 3137AM E 2 9 January 15, 2025YZ . . . . . . . . . . . 31,406,227 SEQ 4.0 FIX/Z 3137AM E 3 7 February 15, 2042
Group 7PD . . . . . . . . . . . 80,000,000 PAC I 4.0 FIX 3137AM C S 4 January 15, 2040PE . . . . . . . . . . . 6,869,207 PAC II 4.0 FIX 3137AMCT 2 February 15, 2042PK . . . . . . . . . . . 14,165,165 PAC I 4.0 FIX 3137AMCY1 February 15, 2042PZ . . . . . . . . . . . 11,803,030 SUP 4.0 FIX/Z 3137AM D 3 8 February 15, 2042
Group 8AA . . . . . . . . . . . 1,500,000 SUP/RTL 3.0 FIX 3137AM 4 F 1 December 15, 2041AB . . . . . . . . . . . 10,281,552 PAC I 3.5 FIX 3137AM 4 G 9 February 15, 2042AE . . . . . . . . . . . 42,643,385 PAC I 2.0 FIX 3137AM 4 K 0 April 15, 2040BA . . . . . . . . . . . 7,600,000 SUP 3 5 FIX 3137AM 5 B 9 December 15, 2041BC . . . . . . . . . . . 750,000 SUP 3 5 FIX 3137AM 5 C 7 January 15, 2042BD . . . . . . . . . . . 641,613 SUP 3 5 FIX 3137AM 5 D 5 February 15, 2042BE . . . . . . . . . . . 115,000 PAC II 3 5 FIX 3137AM 5 E 3 February 15, 2042BH . . . . . . . . . . . 1,500,000 SUP 4.0 FIX 3137AM 5 F 0 December 15, 2041BJ . . . . . . . . . . . 1,203,500 PAC II 3.0 FIX 3137AM 5 H 6 February 15, 2042BK . . . . . . . . . . . 1,203,500 PAC II 4.0 FIX 3137AM 5 J 2 February 15, 2042FP . . . . . . . . . . . 18,275,736 PAC I (2) FLT 3137AMAE7 April 15, 2040GA . . . . . . . . . . . 64,285,714 PT 7.0 FIX 3137AMAK3 February 15, 2042SP . . . . . . . . . . . 18,275,736 NTL(PAC I) (2) INV/IO 3137AMDL8 April 15, 2040
Group 9IL . . . . . . . . . . . 33,098,751 SC/NTL(PAC) 5.0 FIX/IO 3137AM B 2 2 March 15, 2040LN . . . . . . . . . . . 20,000,000 SC/PAC 2.5 FIX 3137AMBU0 March 15, 2040LP . . . . . . . . . . . 67,746,879 SC/PAC 2.0 FIX 3137AMBV8 March 15, 2040LU . . . . . . . . . . . 1,225,881 SC/SUP 4.0 FIX 3137AMBX4 March 15, 2040
Group 10AZ . . . . . . . . . . . 16,119,466 SC/SEQ 4.0 FIX/Z 3137AM 5 A 1 August 15, 2041PV . . . . . . . . . . . 10,841,525 SC/SEQ 4.0 FIX 3137AM D 2 0 August 15, 2041VP . . . . . . . . . . . 7,273,656 SC/SEQ 4.0 FIX 3137AMDR5 August 15, 2041
Group 11NA . . . . . . . . . . . 142,803,063 SC/PAC 4.0 FIX 3137AM C 6 2 January 15, 2041NB . . . . . . . . . . . 26,253,853 SC/PAC 4.0 FIX 3137AM C 7 0 January 15, 2041NC . . . . . . . . . . . 9,141,320 SC/PAC 4.0 FIX 3137AM C 8 8 January 15, 2041ND . . . . . . . . . . . 6,658,987 SC/PAC 4.0 FIX 3137AM C 9 6 January 15, 2041NE . . . . . . . . . . . 973,817 SC/PAC 4.0 FIX 3137AMCA3 January 15, 2041YA . . . . . . . . . . . 3,962,918 SC/SUP 4.0 FIX 3137AMDX2 January 15, 2041YB . . . . . . . . . . . 1,320,973 SC/SUP 4.0 FIX 3137AMDY0 January 15, 2041YC . . . . . . . . . . . 1,320,973 SC/SUP 4.0 FIX 3137AMDZ7 January 15, 2041
ResidualR . . . . . . . . . . . 0 NPR 0.0 NPR 3137AM D 5 3 February 15, 2042RA . . . . . . . . . . . 0 NPR 0.0 NPR 3137AM D 6 1 February 15, 2042RS . . . . . . . . . . . 0 NPR 0.0 NPR 3137AM D 7 9 February 15, 2042RT . . . . . . . . . . . 0 NPR 0.0 NPR 3137AM D 8 7 February 15, 2042
(1) See Appendix II to the Offering Circular.(2) See Terms Sheet — Interest.
The Certificates may not be suitable investments for you. You should not purchase Certificates unless you have carefullyconsidered and are able to bear the associated prepayment, interest rate, yield and market risks of investing in them.Certain Risk Considerations on page S-2 highlights some of these risks.
You should purchase Certificates only if you have read and understood this Supplement, the attached Offering Circularand the documents identified under Available Information.
We guarantee principal and interest payments on the Certificates. These payments are not guaranteed by, and are not debtsor obligations of, the United States or any federal agency or instrumentality other than Freddie Mac. The Certificates arenot tax-exempt. Because of applicable securities law exemptions, we have not registered the Certificates with any federalor state securities commission. No securities commission has reviewed this Supplement.
Goldman, Sachs & Co.January 18, 2012
Exhibit VII — Series 3997 Front Cover, Terms Sheet and MACR Table
VII-1
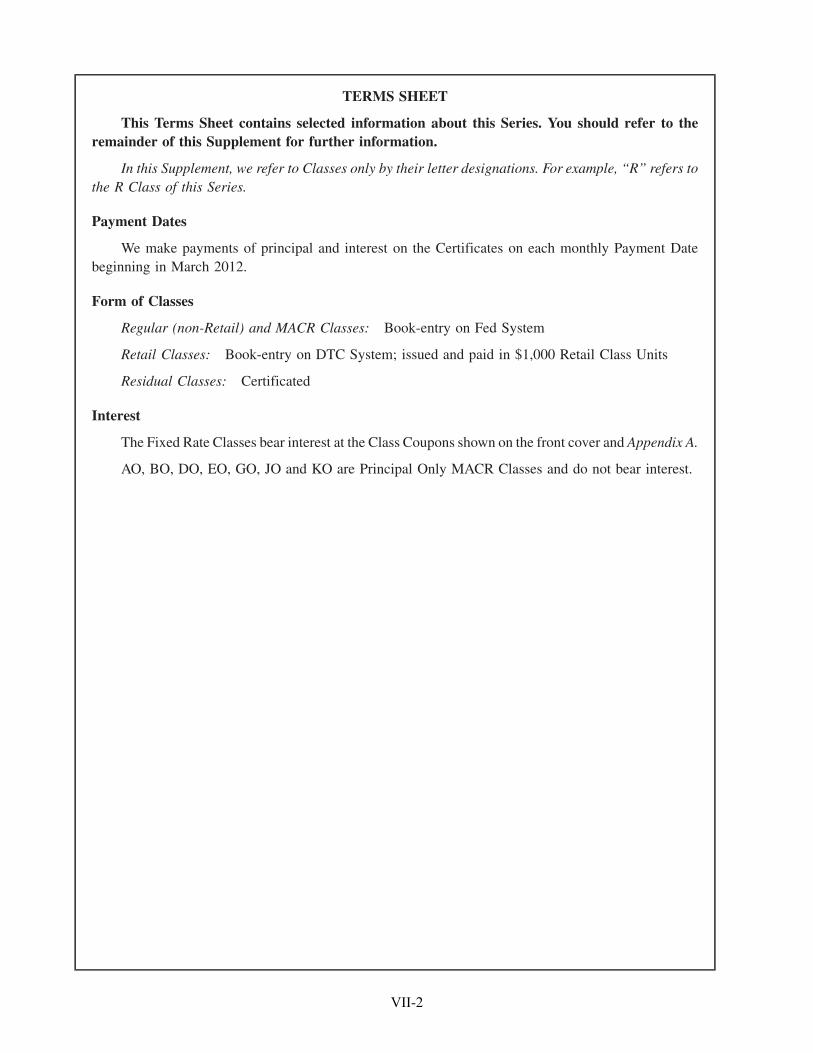
TERMS SHEET
This Terms Sheet contains selected information about this Series. You should refer to theremainder of this Supplement for further information.
In this Supplement, we refer to Classes only by their letter designations. For example, “R” refers tothe R Class of this Series.
Payment Dates
We make payments of principal and interest on the Certificates on each monthly Payment Datebeginning in March 2012.
Form of Classes
Regular (non-Retail) and MACR Classes: Book-entry on Fed System
Retail Classes: Book-entry on DTC System; issued and paid in $1,000 Retail Class Units
Residual Classes: Certificated
Interest
The Fixed Rate Classes bear interest at the Class Coupons shown on the front cover and Appendix A.
AO, BO, DO, EO, GO, JO and KO are Principal Only MACR Classes and do not bear interest.
VII-2
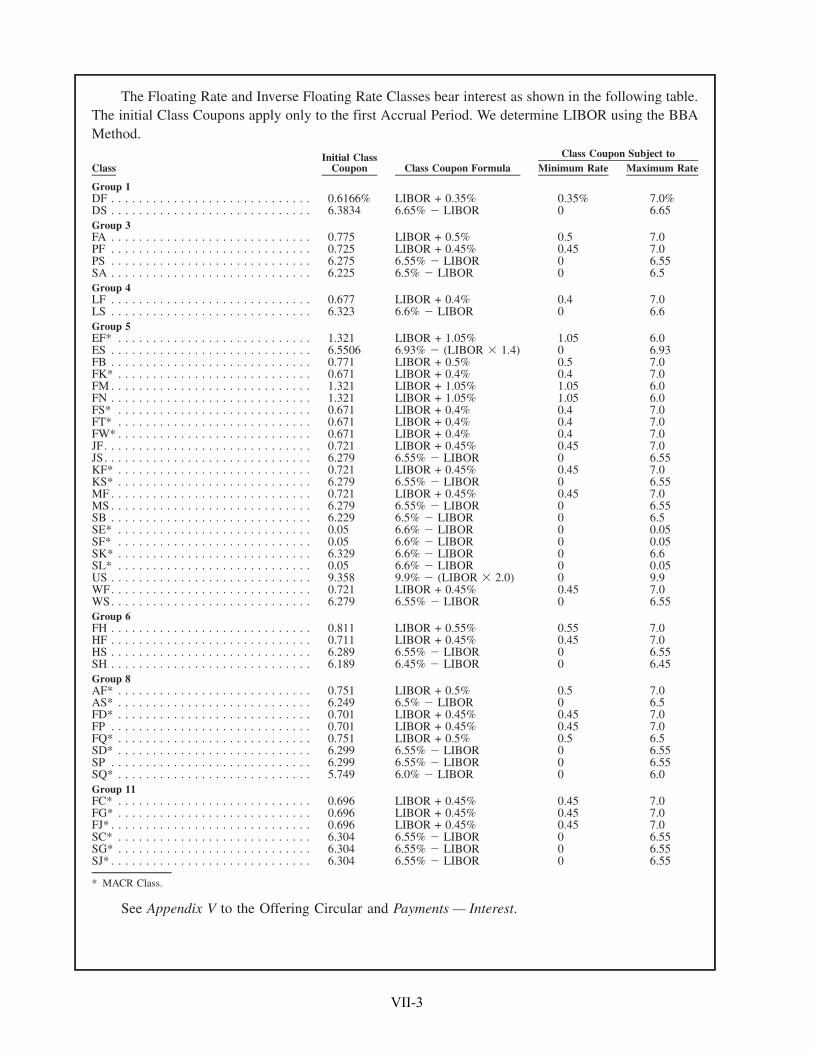
The Floating Rate and Inverse Floating Rate Classes bear interest as shown in the following table.The initial Class Coupons apply only to the first Accrual Period. We determine LIBOR using the BBAMethod.
ClassInitial Class
Coupon Class Coupon Formula Minimum Rate Maximum RateClass Coupon Subject to
Group 1DF . . . . . . . . . . . . . . . . . . . . . . . . . . . . . 0.6166% LIBOR + 0.35% 0.35% 7.0%DS . . . . . . . . . . . . . . . . . . . . . . . . . . . . . 6.3834 6.65% � LIBOR 0 6.65Group 3FA . . . . . . . . . . . . . . . . . . . . . . . . . . . . . 0.775 LIBOR + 0.5% 0.5 7.0PF . . . . . . . . . . . . . . . . . . . . . . . . . . . . . 0.725 LIBOR + 0.45% 0.45 7.0PS . . . . . . . . . . . . . . . . . . . . . . . . . . . . . 6.275 6.55% � LIBOR 0 6.55SA . . . . . . . . . . . . . . . . . . . . . . . . . . . . . 6.225 6.5% � LIBOR 0 6.5Group 4LF . . . . . . . . . . . . . . . . . . . . . . . . . . . . . 0.677 LIBOR + 0.4% 0.4 7.0LS . . . . . . . . . . . . . . . . . . . . . . . . . . . . . 6.323 6.6% � LIBOR 0 6.6Group 5EF* . . . . . . . . . . . . . . . . . . . . . . . . . . . . 1.321 LIBOR + 1.05% 1.05 6.0ES . . . . . . . . . . . . . . . . . . . . . . . . . . . . . 6.5506 6.93% � (LIBOR � 1.4) 0 6.93FB . . . . . . . . . . . . . . . . . . . . . . . . . . . . . 0.771 LIBOR + 0.5% 0.5 7.0FK* . . . . . . . . . . . . . . . . . . . . . . . . . . . . 0.671 LIBOR + 0.4% 0.4 7.0FM . . . . . . . . . . . . . . . . . . . . . . . . . . . . . 1.321 LIBOR + 1.05% 1.05 6.0FN . . . . . . . . . . . . . . . . . . . . . . . . . . . . . 1.321 LIBOR + 1.05% 1.05 6.0FS* . . . . . . . . . . . . . . . . . . . . . . . . . . . . 0.671 LIBOR + 0.4% 0.4 7.0FT* . . . . . . . . . . . . . . . . . . . . . . . . . . . . 0.671 LIBOR + 0.4% 0.4 7.0FW* . . . . . . . . . . . . . . . . . . . . . . . . . . . . 0.671 LIBOR + 0.4% 0.4 7.0JF. . . . . . . . . . . . . . . . . . . . . . . . . . . . . . 0.721 LIBOR + 0.45% 0.45 7.0JS. . . . . . . . . . . . . . . . . . . . . . . . . . . . . . 6.279 6.55% � LIBOR 0 6.55KF* . . . . . . . . . . . . . . . . . . . . . . . . . . . . 0.721 LIBOR + 0.45% 0.45 7.0KS* . . . . . . . . . . . . . . . . . . . . . . . . . . . . 6.279 6.55% � LIBOR 0 6.55MF . . . . . . . . . . . . . . . . . . . . . . . . . . . . . 0.721 LIBOR + 0.45% 0.45 7.0MS . . . . . . . . . . . . . . . . . . . . . . . . . . . . . 6.279 6.55% � LIBOR 0 6.55SB . . . . . . . . . . . . . . . . . . . . . . . . . . . . . 6.229 6.5% � LIBOR 0 6.5SE* . . . . . . . . . . . . . . . . . . . . . . . . . . . . 0.05 6.6% � LIBOR 0 0.05SF* . . . . . . . . . . . . . . . . . . . . . . . . . . . . 0.05 6.6% � LIBOR 0 0.05SK* . . . . . . . . . . . . . . . . . . . . . . . . . . . . 6.329 6.6% � LIBOR 0 6.6SL* . . . . . . . . . . . . . . . . . . . . . . . . . . . . 0.05 6.6% � LIBOR 0 0.05US . . . . . . . . . . . . . . . . . . . . . . . . . . . . . 9.358 9.9% � (LIBOR � 2.0) 0 9.9WF. . . . . . . . . . . . . . . . . . . . . . . . . . . . . 0.721 LIBOR + 0.45% 0.45 7.0WS. . . . . . . . . . . . . . . . . . . . . . . . . . . . . 6.279 6.55% � LIBOR 0 6.55Group 6FH . . . . . . . . . . . . . . . . . . . . . . . . . . . . . 0.811 LIBOR + 0.55% 0.55 7.0HF . . . . . . . . . . . . . . . . . . . . . . . . . . . . . 0.711 LIBOR + 0.45% 0.45 7.0HS . . . . . . . . . . . . . . . . . . . . . . . . . . . . . 6.289 6.55% � LIBOR 0 6.55SH . . . . . . . . . . . . . . . . . . . . . . . . . . . . . 6.189 6.45% � LIBOR 0 6.45Group 8AF* . . . . . . . . . . . . . . . . . . . . . . . . . . . . 0.751 LIBOR + 0.5% 0.5 7.0AS* . . . . . . . . . . . . . . . . . . . . . . . . . . . . 6.249 6.5% � LIBOR 0 6.5FD* . . . . . . . . . . . . . . . . . . . . . . . . . . . . 0.701 LIBOR + 0.45% 0.45 7.0FP . . . . . . . . . . . . . . . . . . . . . . . . . . . . . 0.701 LIBOR + 0.45% 0.45 7.0FQ* . . . . . . . . . . . . . . . . . . . . . . . . . . . . 0.751 LIBOR + 0.5% 0.5 6.5SD* . . . . . . . . . . . . . . . . . . . . . . . . . . . . 6.299 6.55% � LIBOR 0 6.55SP . . . . . . . . . . . . . . . . . . . . . . . . . . . . . 6.299 6.55% � LIBOR 0 6.55SQ* . . . . . . . . . . . . . . . . . . . . . . . . . . . . 5.749 6.0% � LIBOR 0 6.0Group 11FC* . . . . . . . . . . . . . . . . . . . . . . . . . . . . 0.696 LIBOR + 0.45% 0.45 7.0FG* . . . . . . . . . . . . . . . . . . . . . . . . . . . . 0.696 LIBOR + 0.45% 0.45 7.0FJ* . . . . . . . . . . . . . . . . . . . . . . . . . . . . . 0.696 LIBOR + 0.45% 0.45 7.0SC* . . . . . . . . . . . . . . . . . . . . . . . . . . . . 6.304 6.55% � LIBOR 0 6.55SG* . . . . . . . . . . . . . . . . . . . . . . . . . . . . 6.304 6.55% � LIBOR 0 6.55SJ* . . . . . . . . . . . . . . . . . . . . . . . . . . . . . 6.304 6.55% � LIBOR 0 6.55
* MACR Class.
See Appendix V to the Offering Circular and Payments — Interest.
VII-3
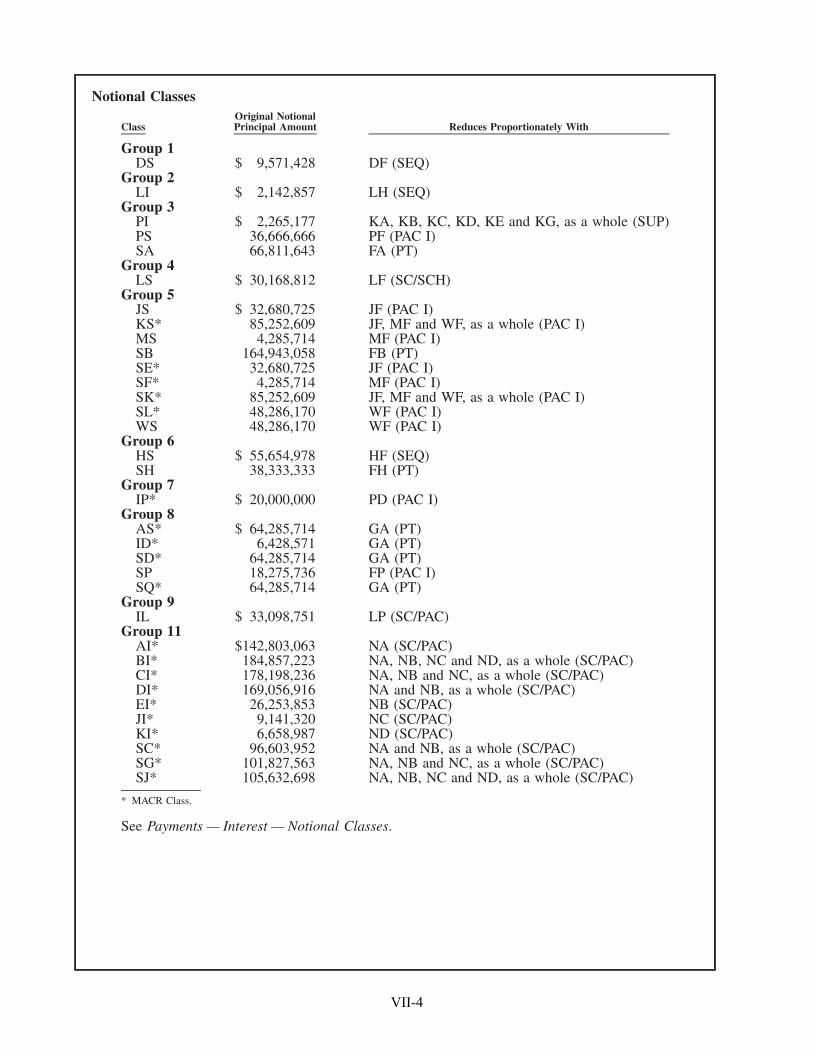
Notional Classes
ClassOriginal NotionalPrincipal Amount Reduces Proportionately With
Group 1DS $ 9,571,428 DF (SEQ)
Group 2LI $ 2,142,857 LH (SEQ)
Group 3PI $ 2,265,177 KA, KB, KC, KD, KE and KG, as a whole (SUP)PS 36,666,666 PF (PAC I)SA 66,811,643 FA (PT)
Group 4LS $ 30,168,812 LF (SC/SCH)
Group 5JS $ 32,680,725 JF (PAC I)KS* 85,252,609 JF, MF and WF, as a whole (PAC I)MS 4,285,714 MF (PAC I)SB 164,943,058 FB (PT)SE* 32,680,725 JF (PAC I)SF* 4,285,714 MF (PAC I)SK* 85,252,609 JF, MF and WF, as a whole (PAC I)SL* 48,286,170 WF (PAC I)WS 48,286,170 WF (PAC I)
Group 6HS $ 55,654,978 HF (SEQ)SH 38,333,333 FH (PT)
Group 7IP* $ 20,000,000 PD (PAC I)
Group 8AS* $ 64,285,714 GA (PT)ID* 6,428,571 GA (PT)SD* 64,285,714 GA (PT)SP 18,275,736 FP (PAC I)SQ* 64,285,714 GA (PT)
Group 9IL $ 33,098,751 LP (SC/PAC)
Group 11AI* $142,803,063 NA (SC/PAC)BI* 184,857,223 NA, NB, NC and ND, as a whole (SC/PAC)CI* 178,198,236 NA, NB and NC, as a whole (SC/PAC)DI* 169,056,916 NA and NB, as a whole (SC/PAC)EI* 26,253,853 NB (SC/PAC)JI* 9,141,320 NC (SC/PAC)KI* 6,658,987 ND (SC/PAC)SC* 96,603,952 NA and NB, as a whole (SC/PAC)SG* 101,827,563 NA, NB and NC, as a whole (SC/PAC)SJ* 105,632,698 NA, NB, NC and ND, as a whole (SC/PAC)
* MACR Class.
See Payments — Interest — Notional Classes.
VII-4
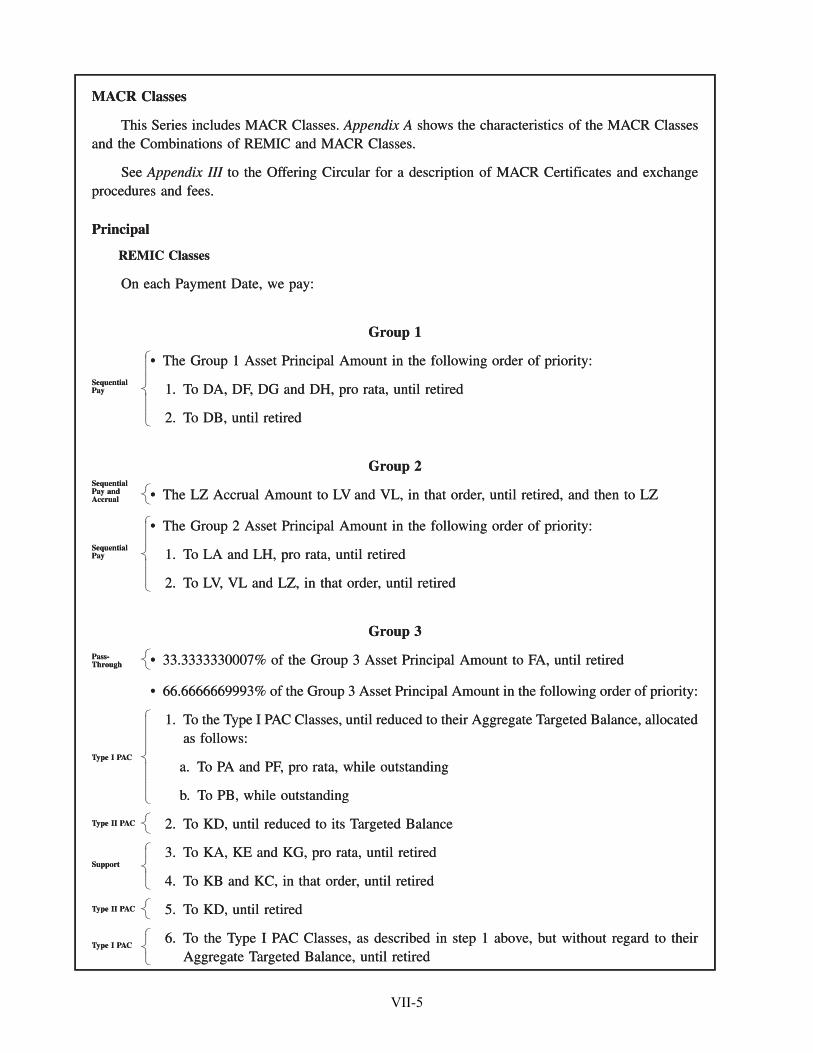
MACR Classes
This Series includes MACR Classes. Appendix A shows the characteristics of the MACR Classesand the Combinations of REMIC and MACR Classes.
See Appendix III to the Offering Circular for a description of MACR Certificates and exchangeprocedures and fees.
Principal
REMIC Classes
On each Payment Date, we pay:
Group 1
• The Group 1 Asset Principal Amount in the following order of priority:
1. To DA, DF, DG and DH, pro rata, until retired
2. To DB, until retired
SequentialPay
Group 2
• The LZ Accrual Amount to LV and VL, in that order, until retired, and then to LZSequentialPay andAccrual
• The Group 2 Asset Principal Amount in the following order of priority:
1. To LA and LH, pro rata, until retired
2. To LV, VL and LZ, in that order, until retired
SequentialPay
Group 3
• 33.3333330007% of the Group 3 Asset Principal Amount to FA, until retiredPass-Through
• 66.6666669993% of the Group 3 Asset Principal Amount in the following order of priority:
1. To the Type I PAC Classes, until reduced to their Aggregate Targeted Balance, allocatedas follows:
a. To PA and PF, pro rata, while outstanding
b. To PB, while outstanding
Type I PAC
2. To KD, until reduced to its Targeted BalanceType II PAC
3. To KA, KE and KG, pro rata, until retired
4. To KB and KC, in that order, until retiredSupport
5. To KD, until retiredType II PAC
6. To the Type I PAC Classes, as described in step 1 above, but without regard to theirAggregate Targeted Balance, until retired
Type I PAC
MACR Classes
This Series includes MACR Classes. Appendix A shows the characteristics of the MACR Classesand the Combinations of REMIC and MACR Classes.
See Appendix III to the Offering Circular for a description of MACR Certificates and exchangeprocedures and fees.
Principal
REMIC Classes
On each Payment Date, we pay:
Group 1
• The Group 1 Asset Principal Amount in the following order of priority:
1. To DA, DF, DG and DH, pro rata, until retired
2. To DB, until retired
�������������������������
SequentialPay
Group 2
• The LZ Accrual Amount to LV and VL, in that order, until retired, and then to LZ�����
SequentialPay andAccrual
• The Group 2 Asset Principal Amount in the following order of priority:
1. To LA and LH, pro rata, until retired
2. To LV, VL and LZ, in that order, until retired
�������������������������
SequentialPay
Group 3
• 33.3333330007% of the Group 3 Asset Principal Amount to FA, until retired�����
Pass-Through
• 66.6666669993% of the Group 3 Asset Principal Amount in the following order of priority:
1. To the Type I PAC Classes, until reduced to their Aggregate Targeted Balance, allocatedas follows:
a. To PA and PF, pro rata, while outstanding
b. To PB, while outstanding
�������������������������������
Type I PAC
2. To KD, until reduced to its Targeted Balance�����Type II PAC
3. To KA, KE and KG, pro rata, until retired
4. To KB and KC, in that order, until retired
���������������
Support
5. To KD, until retired�����Type II PAC
6. To the Type I PAC Classes, as described in step 1 above, but without regard to theirAggregate Targeted Balance, until retired
�����������
Type I PAC
VII-5
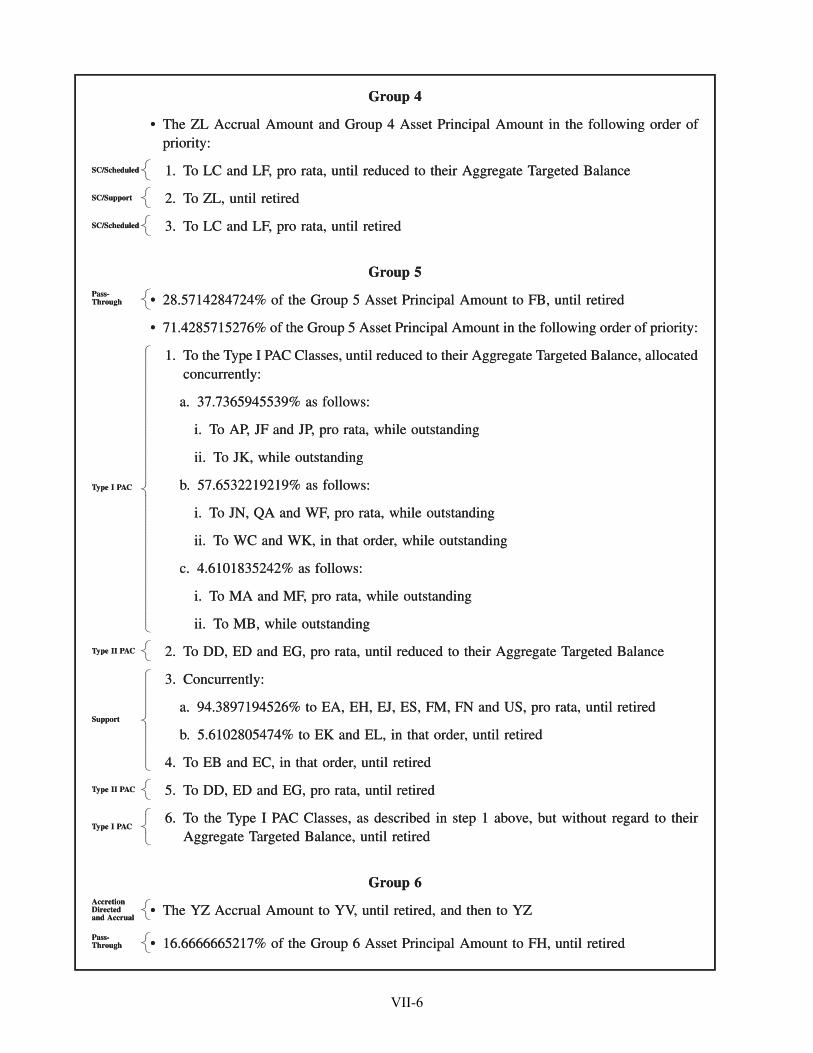
Group 4
• The ZL Accrual Amount and Group 4 Asset Principal Amount in the following order ofpriority:
1. To LC and LF, pro rata, until reduced to their Aggregate Targeted BalanceSC/Scheduled
2. To ZL, until retiredSC/Support
3. To LC and LF, pro rata, until retiredSC/Scheduled
Group 5
• 28.5714284724% of the Group 5 Asset Principal Amount to FB, until retiredPass-Through
• 71.4285715276% of the Group 5 Asset Principal Amount in the following order of priority:
1. To the Type I PAC Classes, until reduced to their Aggregate Targeted Balance, allocatedconcurrently:
a. 37.7365945539% as follows:
i. To AP, JF and JP, pro rata, while outstanding
ii. To JK, while outstanding
b. 57.6532219219% as follows:
i. To JN, QA and WF, pro rata, while outstanding
ii. To WC and WK, in that order, while outstanding
c. 4.6101835242% as follows:
i. To MA and MF, pro rata, while outstanding
ii. To MB, while outstanding
Type I PAC
2. To DD, ED and EG, pro rata, until reduced to their Aggregate Targeted BalanceType II PAC
3. Concurrently:
a. 94.3897194526% to EA, EH, EJ, ES, FM, FN and US, pro rata, until retired
b. 5.6102805474% to EK and EL, in that order, until retired
4. To EB and EC, in that order, until retired
Support
5. To DD, ED and EG, pro rata, until retiredType II PAC
6. To the Type I PAC Classes, as described in step 1 above, but without regard to theirAggregate Targeted Balance, until retired
Type I PAC
Group 6
• The YZ Accrual Amount to YV, until retired, and then to YZAccretionDirectedand Accrual
• 16.6666665217% of the Group 6 Asset Principal Amount to FH, until retiredPass-Through
Group 4
• The ZL Accrual Amount and Group 4 Asset Principal Amount in the following order ofpriority:
1. To LC and LF, pro rata, until reduced to their Aggregate Targeted Balance�����SC/Scheduled
2. To ZL, until retired�����SC/Support
3. To LC and LF, pro rata, until retired�����SC/Scheduled
Group 5
• 28.5714284724% of the Group 5 Asset Principal Amount to FB, until retired�����
Pass-Through
• 71.4285715276% of the Group 5 Asset Principal Amount in the following order of priority:
1. To the Type I PAC Classes, until reduced to their Aggregate Targeted Balance, allocatedconcurrently:
a. 37.7365945539% as follows:
i. To AP, JF and JP, pro rata, while outstanding
ii. To JK, while outstanding
b. 57.6532219219% as follows:
i. To JN, QA and WF, pro rata, while outstanding
ii. To WC and WK, in that order, while outstanding
c. 4.6101835242% as follows:
i. To MA and MF, pro rata, while outstanding
ii. To MB, while outstanding
�������������������������������������������������������������������������������������������������
Type I PAC
2. To DD, ED and EG, pro rata, until reduced to their Aggregate Targeted Balance�����Type II PAC
3. Concurrently:
a. 94.3897194526% to EA, EH, EJ, ES, FM, FN and US, pro rata, until retired
b. 5.6102805474% to EK and EL, in that order, until retired
4. To EB and EC, in that order, until retired
���������������������������������
Support
5. To DD, ED and EG, pro rata, until retired�����Type II PAC
6. To the Type I PAC Classes, as described in step 1 above, but without regard to theirAggregate Targeted Balance, until retired
�����������
Type I PAC
Group 6
• The YZ Accrual Amount to YV, until retired, and then to YZ�����
AccretionDirectedand Accrual
• 16.6666665217% of the Group 6 Asset Principal Amount to FH, until retired�����
Pass-Through
VII-6
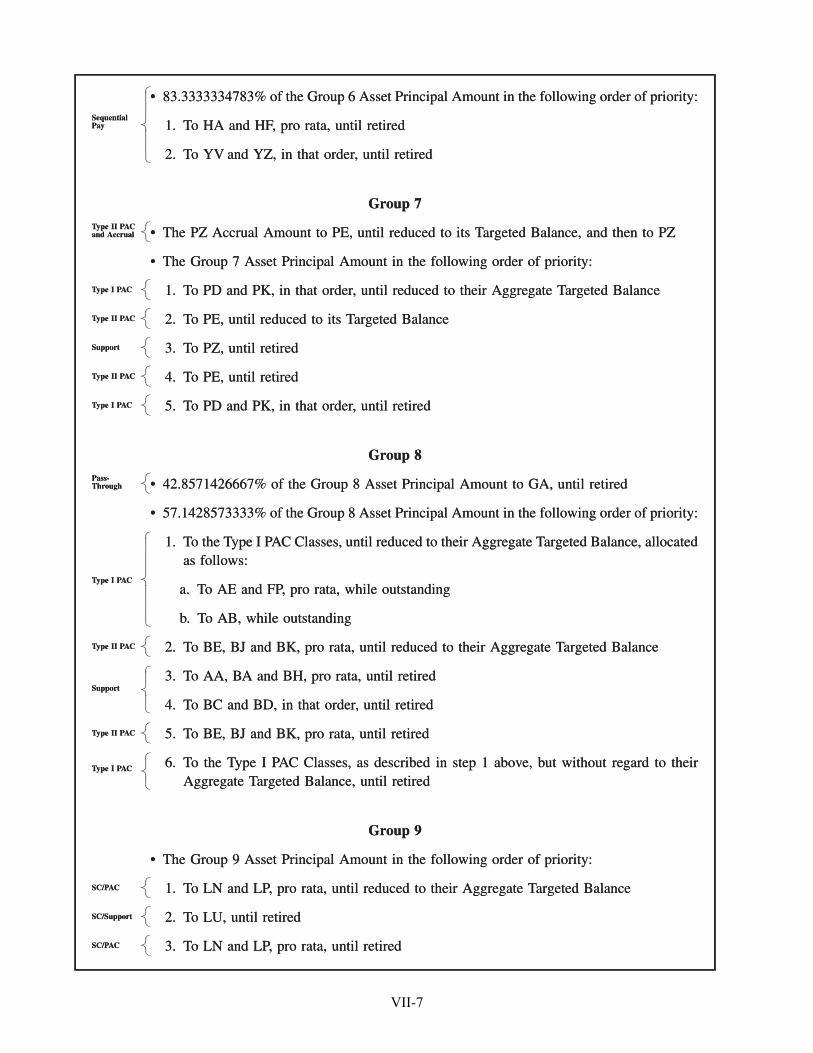
• 83.3333334783% of the Group 6 Asset Principal Amount in the following order of priority:
1. To HA and HF, pro rata, until retired
2. To YV and YZ, in that order, until retired
SequentialPay
Group 7
• The PZ Accrual Amount to PE, until reduced to its Targeted Balance, and then to PZType II PACand Accrual
• The Group 7 Asset Principal Amount in the following order of priority:
1. To PD and PK, in that order, until reduced to their Aggregate Targeted BalanceType I PAC
2. To PE, until reduced to its Targeted BalanceType II PAC
3. To PZ, until retiredSupport
4. To PE, until retiredType II PAC
5. To PD and PK, in that order, until retiredType I PAC
Group 8
• 42.8571426667% of the Group 8 Asset Principal Amount to GA, until retiredPass-Through
• 57.1428573333% of the Group 8 Asset Principal Amount in the following order of priority:
1. To the Type I PAC Classes, until reduced to their Aggregate Targeted Balance, allocatedas follows:
a. To AE and FP, pro rata, while outstanding
b. To AB, while outstanding
Type I PAC
2. To BE, BJ and BK, pro rata, until reduced to their Aggregate Targeted BalanceType II PAC
3. To AA, BA and BH, pro rata, until retired
4. To BC and BD, in that order, until retiredSupport
5. To BE, BJ and BK, pro rata, until retiredType II PAC
6. To the Type I PAC Classes, as described in step 1 above, but without regard to theirAggregate Targeted Balance, until retired
Type I PAC
Group 9
• The Group 9 Asset Principal Amount in the following order of priority:
1. To LN and LP, pro rata, until reduced to their Aggregate Targeted BalanceSC/PAC
2. To LU, until retiredSC/Support
3. To LN and LP, pro rata, until retiredSC/PAC
• 83.3333334783% of the Group 6 Asset Principal Amount in the following order of priority:
1. To HA and HF, pro rata, until retired
2. To YV and YZ, in that order, until retired
�������������������������
SequentialPay
Group 7
• The PZ Accrual Amount to PE, until reduced to its Targeted Balance, and then to PZ�����
Type II PACand Accrual
• The Group 7 Asset Principal Amount in the following order of priority:
1. To PD and PK, in that order, until reduced to their Aggregate Targeted Balance�����Type I PAC
2. To PE, until reduced to its Targeted Balance�����Type II PAC
3. To PZ, until retired�����Support
4. To PE, until retired�����Type II PAC
5. To PD and PK, in that order, until retired�����Type I PAC
Group 8
• 42.8571426667% of the Group 8 Asset Principal Amount to GA, until retired�����
Pass-Through
• 57.1428573333% of the Group 8 Asset Principal Amount in the following order of priority:
1. To the Type I PAC Classes, until reduced to their Aggregate Targeted Balance, allocatedas follows:
a. To AE and FP, pro rata, while outstanding
b. To AB, while outstanding
�������������������������������
Type I PAC
2. To BE, BJ and BK, pro rata, until reduced to their Aggregate Targeted Balance�����Type II PAC
3. To AA, BA and BH, pro rata, until retired
4. To BC and BD, in that order, until retired
���������������
Support
5. To BE, BJ and BK, pro rata, until retired�����Type II PAC
6. To the Type I PAC Classes, as described in step 1 above, but without regard to theirAggregate Targeted Balance, until retired
�����������
Type I PAC
Group 9
• The Group 9 Asset Principal Amount in the following order of priority:
1. To LN and LP, pro rata, until reduced to their Aggregate Targeted Balance�����SC/PAC
2. To LU, until retired�����SC/Support
3. To LN and LP, pro rata, until retired�����SC/PAC
VII-7
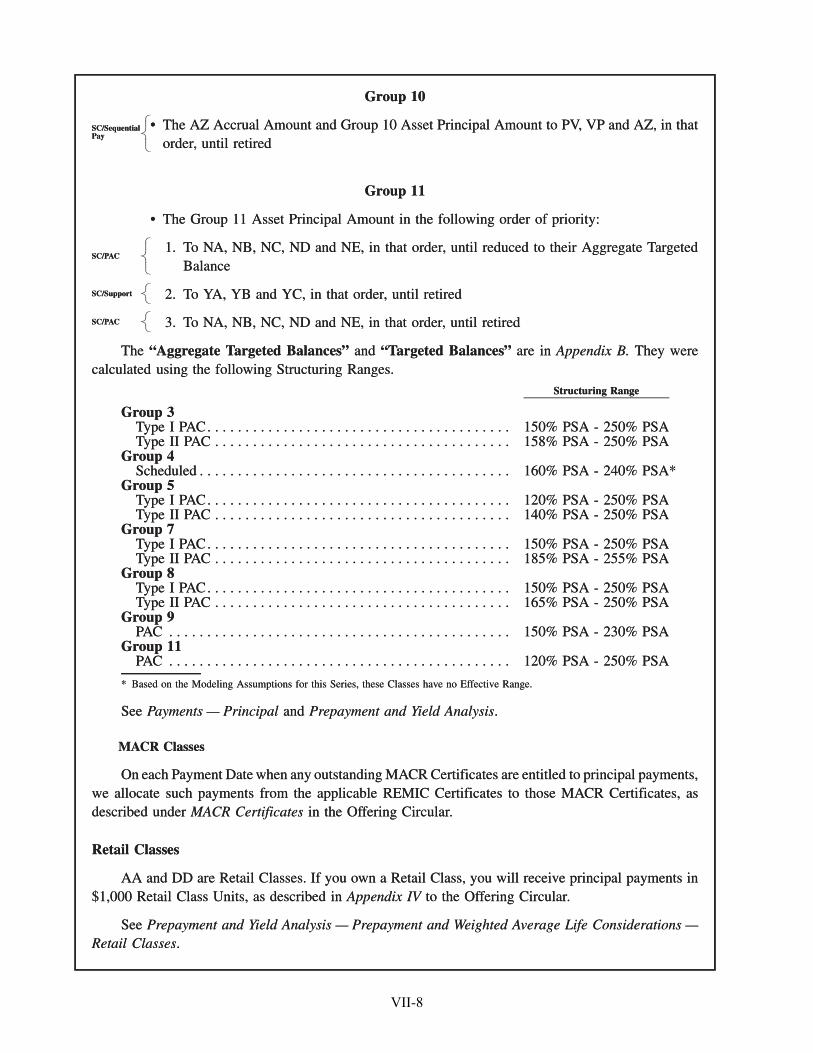
Group 10
• The AZ Accrual Amount and Group 10 Asset Principal Amount to PV, VP and AZ, in thatorder, until retired
SC/SequentialPay
Group 11
• The Group 11 Asset Principal Amount in the following order of priority:
1. To NA, NB, NC, ND and NE, in that order, until reduced to their Aggregate TargetedBalance
SC/PAC
2. To YA, YB and YC, in that order, until retiredSC/Support
3. To NA, NB, NC, ND and NE, in that order, until retiredSC/PAC
The “Aggregate Targeted Balances” and “Targeted Balances” are in Appendix B. They werecalculated using the following Structuring Ranges.
Structuring Range
Group 3Type I PAC. . . . . . . . . . . . . . . . . . . . . . . . . . . . . . . . . . . . . . . . 150% PSA - 250% PSAType II PAC . . . . . . . . . . . . . . . . . . . . . . . . . . . . . . . . . . . . . . . 158% PSA - 250% PSA
Group 4Scheduled . . . . . . . . . . . . . . . . . . . . . . . . . . . . . . . . . . . . . . . . . 160% PSA - 240% PSA*
Group 5Type I PAC. . . . . . . . . . . . . . . . . . . . . . . . . . . . . . . . . . . . . . . . 120% PSA - 250% PSAType II PAC . . . . . . . . . . . . . . . . . . . . . . . . . . . . . . . . . . . . . . . 140% PSA - 250% PSA
Group 7Type I PAC. . . . . . . . . . . . . . . . . . . . . . . . . . . . . . . . . . . . . . . . 150% PSA - 250% PSAType II PAC . . . . . . . . . . . . . . . . . . . . . . . . . . . . . . . . . . . . . . . 185% PSA - 255% PSA
Group 8Type I PAC. . . . . . . . . . . . . . . . . . . . . . . . . . . . . . . . . . . . . . . . 150% PSA - 250% PSAType II PAC . . . . . . . . . . . . . . . . . . . . . . . . . . . . . . . . . . . . . . . 165% PSA - 250% PSA
Group 9PAC . . . . . . . . . . . . . . . . . . . . . . . . . . . . . . . . . . . . . . . . . . . . . 150% PSA - 230% PSA
Group 11PAC . . . . . . . . . . . . . . . . . . . . . . . . . . . . . . . . . . . . . . . . . . . . . 120% PSA - 250% PSA
* Based on the Modeling Assumptions for this Series, these Classes have no Effective Range.
See Payments — Principal and Prepayment and Yield Analysis.
MACR Classes
On each Payment Date when any outstanding MACR Certificates are entitled to principal payments,we allocate such payments from the applicable REMIC Certificates to those MACR Certificates, asdescribed under MACR Certificates in the Offering Circular.
Retail Classes
AA and DD are Retail Classes. If you own a Retail Class, you will receive principal payments in$1,000 Retail Class Units, as described in Appendix IV to the Offering Circular.
See Prepayment and Yield Analysis — Prepayment and Weighted Average Life Considerations —Retail Classes.
Group 10
• The AZ Accrual Amount and Group 10 Asset Principal Amount to PV, VP and AZ, in thatorder, until retired
�����������
SC/SequentialPay
Group 11
• The Group 11 Asset Principal Amount in the following order of priority:
1. To NA, NB, NC, ND and NE, in that order, until reduced to their Aggregate TargetedBalance
�����������
SC/PAC
2. To YA, YB and YC, in that order, until retired�����SC/Support
3. To NA, NB, NC, ND and NE, in that order, until retired�����SC/PAC
The “Aggregate Targeted Balances” and “Targeted Balances” are in Appendix B. They werecalculated using the following Structuring Ranges.
Structuring Range
Group 3Type I PAC. . . . . . . . . . . . . . . . . . . . . . . . . . . . . . . . . . . . . . . . 150% PSA - 250% PSAType II PAC . . . . . . . . . . . . . . . . . . . . . . . . . . . . . . . . . . . . . . . 158% PSA - 250% PSA
Group 4Scheduled . . . . . . . . . . . . . . . . . . . . . . . . . . . . . . . . . . . . . . . . . 160% PSA - 240% PSA*
Group 5Type I PAC. . . . . . . . . . . . . . . . . . . . . . . . . . . . . . . . . . . . . . . . 120% PSA - 250% PSAType II PAC . . . . . . . . . . . . . . . . . . . . . . . . . . . . . . . . . . . . . . . 140% PSA - 250% PSA
Group 7Type I PAC. . . . . . . . . . . . . . . . . . . . . . . . . . . . . . . . . . . . . . . . 150% PSA - 250% PSAType II PAC . . . . . . . . . . . . . . . . . . . . . . . . . . . . . . . . . . . . . . . 185% PSA - 255% PSA
Group 8Type I PAC. . . . . . . . . . . . . . . . . . . . . . . . . . . . . . . . . . . . . . . . 150% PSA - 250% PSAType II PAC . . . . . . . . . . . . . . . . . . . . . . . . . . . . . . . . . . . . . . . 165% PSA - 250% PSA
Group 9PAC . . . . . . . . . . . . . . . . . . . . . . . . . . . . . . . . . . . . . . . . . . . . . 150% PSA - 230% PSA
Group 11PAC . . . . . . . . . . . . . . . . . . . . . . . . . . . . . . . . . . . . . . . . . . . . . 120% PSA - 250% PSA
* Based on the Modeling Assumptions for this Series, these Classes have no Effective Range.
See Payments — Principal and Prepayment and Yield Analysis.
MACR Classes
On each Payment Date when any outstanding MACR Certificates are entitled to principal payments,we allocate such payments from the applicable REMIC Certificates to those MACR Certificates, asdescribed under MACR Certificates in the Offering Circular.
Retail Classes
AA and DD are Retail Classes. If you own a Retail Class, you will receive principal payments in$1,000 Retail Class Units, as described in Appendix IV to the Offering Circular.
See Prepayment and Yield Analysis — Prepayment and Weighted Average Life Considerations —Retail Classes.
VII-8
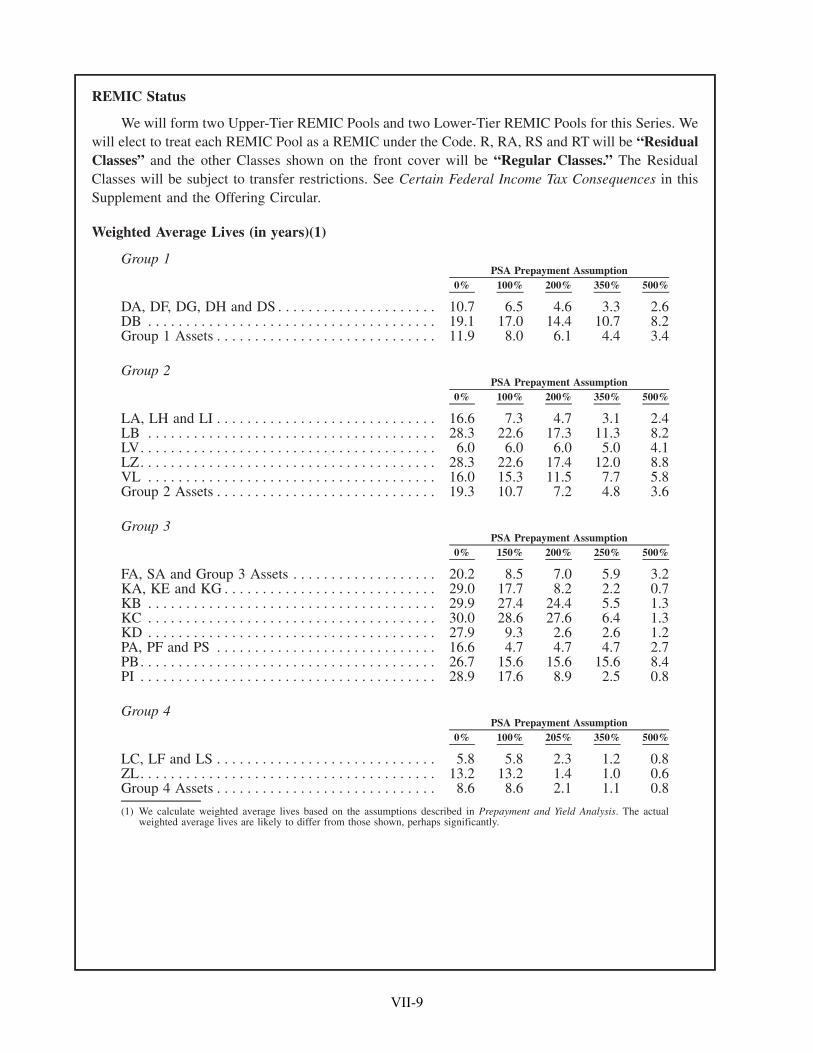
REMIC Status
We will form two Upper-Tier REMIC Pools and two Lower-Tier REMIC Pools for this Series. Wewill elect to treat each REMIC Pool as a REMIC under the Code. R, RA, RS and RT will be “ResidualClasses” and the other Classes shown on the front cover will be “Regular Classes.” The ResidualClasses will be subject to transfer restrictions. See Certain Federal Income Tax Consequences in thisSupplement and the Offering Circular.
Weighted Average Lives (in years)(1)
Group 1
0% 100% 200% 350% 500%PSA Prepayment Assumption
DA, DF, DG, DH and DS . . . . . . . . . . . . . . . . . . . . . 10.7 6.5 4.6 3.3 2.6DB . . . . . . . . . . . . . . . . . . . . . . . . . . . . . . . . . . . . . . 19.1 17.0 14.4 10.7 8.2Group 1 Assets . . . . . . . . . . . . . . . . . . . . . . . . . . . . . 11.9 8.0 6.1 4.4 3.4
Group 2
0% 100% 200% 350% 500%PSA Prepayment Assumption
LA, LH and LI . . . . . . . . . . . . . . . . . . . . . . . . . . . . . 16.6 7.3 4.7 3.1 2.4LB . . . . . . . . . . . . . . . . . . . . . . . . . . . . . . . . . . . . . . 28.3 22.6 17.3 11.3 8.2LV. . . . . . . . . . . . . . . . . . . . . . . . . . . . . . . . . . . . . . . 6.0 6.0 6.0 5.0 4.1LZ. . . . . . . . . . . . . . . . . . . . . . . . . . . . . . . . . . . . . . . 28.3 22.6 17.4 12.0 8.8VL . . . . . . . . . . . . . . . . . . . . . . . . . . . . . . . . . . . . . . 16.0 15.3 11.5 7.7 5.8Group 2 Assets . . . . . . . . . . . . . . . . . . . . . . . . . . . . . 19.3 10.7 7.2 4.8 3.6
Group 3
0% 150% 200% 250% 500%PSA Prepayment Assumption
FA, SA and Group 3 Assets . . . . . . . . . . . . . . . . . . . 20.2 8.5 7.0 5.9 3.2KA, KE and KG . . . . . . . . . . . . . . . . . . . . . . . . . . . . 29.0 17.7 8.2 2.2 0.7KB . . . . . . . . . . . . . . . . . . . . . . . . . . . . . . . . . . . . . . 29.9 27.4 24.4 5.5 1.3KC . . . . . . . . . . . . . . . . . . . . . . . . . . . . . . . . . . . . . . 30.0 28.6 27.6 6.4 1.3KD . . . . . . . . . . . . . . . . . . . . . . . . . . . . . . . . . . . . . . 27.9 9.3 2.6 2.6 1.2PA, PF and PS . . . . . . . . . . . . . . . . . . . . . . . . . . . . . 16.6 4.7 4.7 4.7 2.7PB. . . . . . . . . . . . . . . . . . . . . . . . . . . . . . . . . . . . . . . 26.7 15.6 15.6 15.6 8.4PI . . . . . . . . . . . . . . . . . . . . . . . . . . . . . . . . . . . . . . . 28.9 17.6 8.9 2.5 0.8
Group 4
0% 100% 205% 350% 500%PSA Prepayment Assumption
LC, LF and LS . . . . . . . . . . . . . . . . . . . . . . . . . . . . . 5.8 5.8 2.3 1.2 0.8ZL. . . . . . . . . . . . . . . . . . . . . . . . . . . . . . . . . . . . . . . 13.2 13.2 1.4 1.0 0.6Group 4 Assets . . . . . . . . . . . . . . . . . . . . . . . . . . . . . 8.6 8.6 2.1 1.1 0.8
(1) We calculate weighted average lives based on the assumptions described in Prepayment and Yield Analysis. The actualweighted average lives are likely to differ from those shown, perhaps significantly.
VII-9
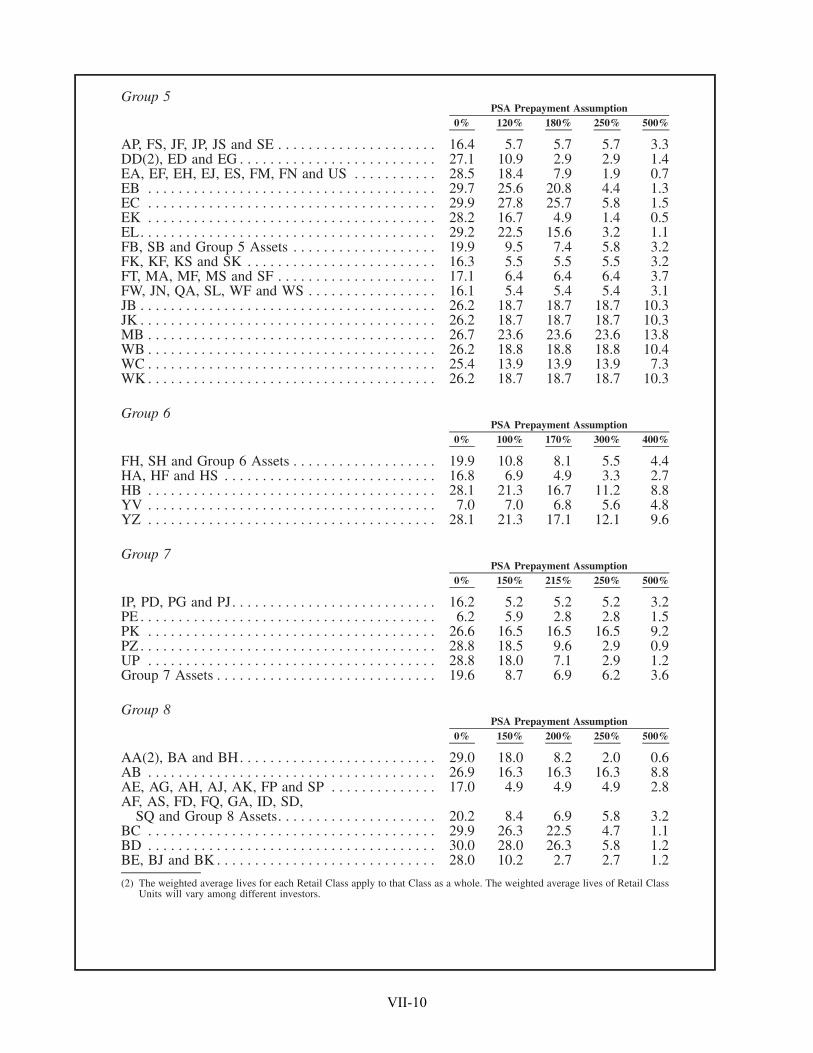
Group 5
0% 120% 180% 250% 500%PSA Prepayment Assumption
AP, FS, JF, JP, JS and SE . . . . . . . . . . . . . . . . . . . . . 16.4 5.7 5.7 5.7 3.3DD(2), ED and EG . . . . . . . . . . . . . . . . . . . . . . . . . . 27.1 10.9 2.9 2.9 1.4EA, EF, EH, EJ, ES, FM, FN and US . . . . . . . . . . . 28.5 18.4 7.9 1.9 0.7EB . . . . . . . . . . . . . . . . . . . . . . . . . . . . . . . . . . . . . . 29.7 25.6 20.8 4.4 1.3EC . . . . . . . . . . . . . . . . . . . . . . . . . . . . . . . . . . . . . . 29.9 27.8 25.7 5.8 1.5EK . . . . . . . . . . . . . . . . . . . . . . . . . . . . . . . . . . . . . . 28.2 16.7 4.9 1.4 0.5EL. . . . . . . . . . . . . . . . . . . . . . . . . . . . . . . . . . . . . . . 29.2 22.5 15.6 3.2 1.1FB, SB and Group 5 Assets . . . . . . . . . . . . . . . . . . . 19.9 9.5 7.4 5.8 3.2FK, KF, KS and SK . . . . . . . . . . . . . . . . . . . . . . . . . 16.3 5.5 5.5 5.5 3.2FT, MA, MF, MS and SF . . . . . . . . . . . . . . . . . . . . . 17.1 6.4 6.4 6.4 3.7FW, JN, QA, SL, WF and WS . . . . . . . . . . . . . . . . . 16.1 5.4 5.4 5.4 3.1JB . . . . . . . . . . . . . . . . . . . . . . . . . . . . . . . . . . . . . . . 26.2 18.7 18.7 18.7 10.3JK . . . . . . . . . . . . . . . . . . . . . . . . . . . . . . . . . . . . . . . 26.2 18.7 18.7 18.7 10.3MB . . . . . . . . . . . . . . . . . . . . . . . . . . . . . . . . . . . . . . 26.7 23.6 23.6 23.6 13.8WB . . . . . . . . . . . . . . . . . . . . . . . . . . . . . . . . . . . . . . 26.2 18.8 18.8 18.8 10.4WC . . . . . . . . . . . . . . . . . . . . . . . . . . . . . . . . . . . . . . 25.4 13.9 13.9 13.9 7.3WK . . . . . . . . . . . . . . . . . . . . . . . . . . . . . . . . . . . . . . 26.2 18.7 18.7 18.7 10.3
Group 6
0% 100% 170% 300% 400%PSA Prepayment Assumption
FH, SH and Group 6 Assets . . . . . . . . . . . . . . . . . . . 19.9 10.8 8.1 5.5 4.4HA, HF and HS . . . . . . . . . . . . . . . . . . . . . . . . . . . . 16.8 6.9 4.9 3.3 2.7HB . . . . . . . . . . . . . . . . . . . . . . . . . . . . . . . . . . . . . . 28.1 21.3 16.7 11.2 8.8YV . . . . . . . . . . . . . . . . . . . . . . . . . . . . . . . . . . . . . . 7.0 7.0 6.8 5.6 4.8YZ . . . . . . . . . . . . . . . . . . . . . . . . . . . . . . . . . . . . . . 28.1 21.3 17.1 12.1 9.6
Group 7
0% 150% 215% 250% 500%PSA Prepayment Assumption
IP, PD, PG and PJ. . . . . . . . . . . . . . . . . . . . . . . . . . . 16.2 5.2 5.2 5.2 3.2PE . . . . . . . . . . . . . . . . . . . . . . . . . . . . . . . . . . . . . . . 6.2 5.9 2.8 2.8 1.5PK . . . . . . . . . . . . . . . . . . . . . . . . . . . . . . . . . . . . . . 26.6 16.5 16.5 16.5 9.2PZ . . . . . . . . . . . . . . . . . . . . . . . . . . . . . . . . . . . . . . . 28.8 18.5 9.6 2.9 0.9UP . . . . . . . . . . . . . . . . . . . . . . . . . . . . . . . . . . . . . . 28.8 18.0 7.1 2.9 1.2Group 7 Assets . . . . . . . . . . . . . . . . . . . . . . . . . . . . . 19.6 8.7 6.9 6.2 3.6
Group 8
0% 150% 200% 250% 500%PSA Prepayment Assumption
AA(2), BA and BH. . . . . . . . . . . . . . . . . . . . . . . . . . 29.0 18.0 8.2 2.0 0.6AB . . . . . . . . . . . . . . . . . . . . . . . . . . . . . . . . . . . . . . 26.9 16.3 16.3 16.3 8.8AE, AG, AH, AJ, AK, FP and SP . . . . . . . . . . . . . . 17.0 4.9 4.9 4.9 2.8AF, AS, FD, FQ, GA, ID, SD,
SQ and Group 8 Assets. . . . . . . . . . . . . . . . . . . . . 20.2 8.4 6.9 5.8 3.2BC . . . . . . . . . . . . . . . . . . . . . . . . . . . . . . . . . . . . . . 29.9 26.3 22.5 4.7 1.1BD . . . . . . . . . . . . . . . . . . . . . . . . . . . . . . . . . . . . . . 30.0 28.0 26.3 5.8 1.2BE, BJ and BK . . . . . . . . . . . . . . . . . . . . . . . . . . . . . 28.0 10.2 2.7 2.7 1.2
(2) The weighted average lives for each Retail Class apply to that Class as a whole. The weighted average lives of Retail ClassUnits will vary among different investors.
VII-10
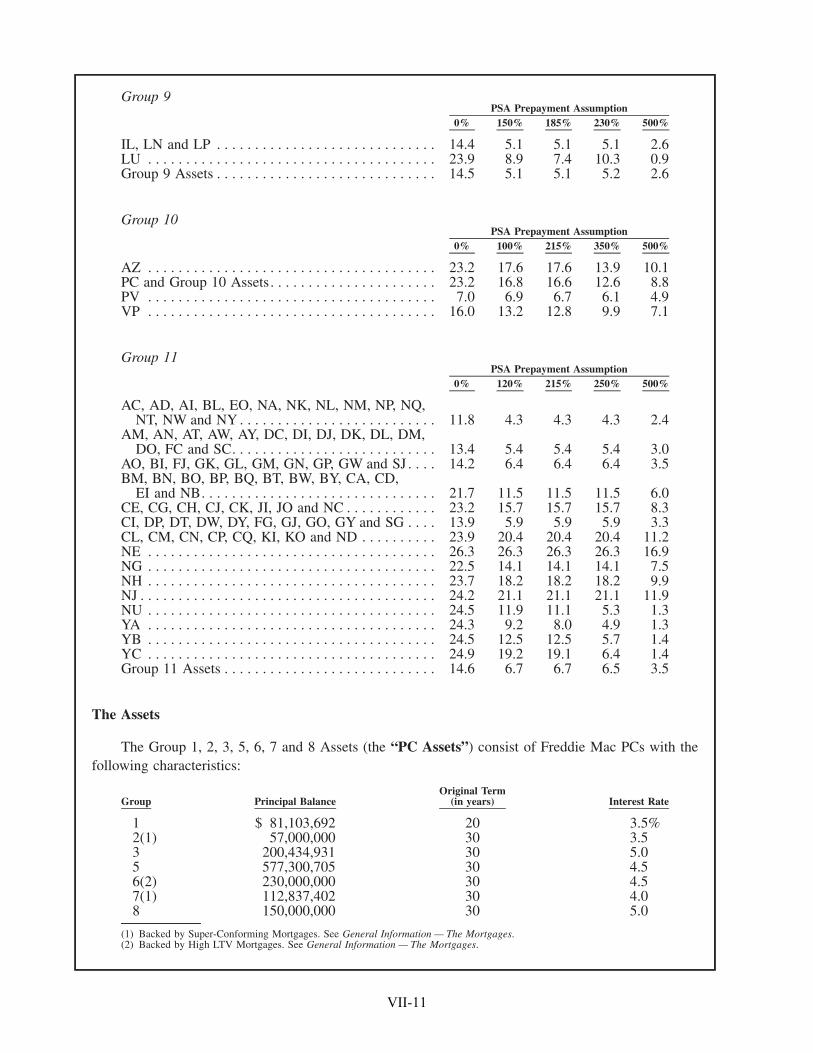
Group 9
0% 150% 185% 230% 500%PSA Prepayment Assumption
IL, LN and LP . . . . . . . . . . . . . . . . . . . . . . . . . . . . . 14.4 5.1 5.1 5.1 2.6LU . . . . . . . . . . . . . . . . . . . . . . . . . . . . . . . . . . . . . . 23.9 8.9 7.4 10.3 0.9Group 9 Assets . . . . . . . . . . . . . . . . . . . . . . . . . . . . . 14.5 5.1 5.1 5.2 2.6
Group 10
0% 100% 215% 350% 500%PSA Prepayment Assumption
AZ . . . . . . . . . . . . . . . . . . . . . . . . . . . . . . . . . . . . . . 23.2 17.6 17.6 13.9 10.1PC and Group 10 Assets. . . . . . . . . . . . . . . . . . . . . . 23.2 16.8 16.6 12.6 8.8PV . . . . . . . . . . . . . . . . . . . . . . . . . . . . . . . . . . . . . . 7.0 6.9 6.7 6.1 4.9VP . . . . . . . . . . . . . . . . . . . . . . . . . . . . . . . . . . . . . . 16.0 13.2 12.8 9.9 7.1
Group 11
0% 120% 215% 250% 500%PSA Prepayment Assumption
AC, AD, AI, BL, EO, NA, NK, NL, NM, NP, NQ,NT, NW and NY . . . . . . . . . . . . . . . . . . . . . . . . . . 11.8 4.3 4.3 4.3 2.4
AM, AN, AT, AW, AY, DC, DI, DJ, DK, DL, DM,DO, FC and SC. . . . . . . . . . . . . . . . . . . . . . . . . . . 13.4 5.4 5.4 5.4 3.0
AO, BI, FJ, GK, GL, GM, GN, GP, GW and SJ . . . . 14.2 6.4 6.4 6.4 3.5BM, BN, BO, BP, BQ, BT, BW, BY, CA, CD,
EI and NB. . . . . . . . . . . . . . . . . . . . . . . . . . . . . . . 21.7 11.5 11.5 11.5 6.0CE, CG, CH, CJ, CK, JI, JO and NC . . . . . . . . . . . . 23.2 15.7 15.7 15.7 8.3CI, DP, DT, DW, DY, FG, GJ, GO, GY and SG . . . . 13.9 5.9 5.9 5.9 3.3CL, CM, CN, CP, CQ, KI, KO and ND . . . . . . . . . . 23.9 20.4 20.4 20.4 11.2NE . . . . . . . . . . . . . . . . . . . . . . . . . . . . . . . . . . . . . . 26.3 26.3 26.3 26.3 16.9NG . . . . . . . . . . . . . . . . . . . . . . . . . . . . . . . . . . . . . . 22.5 14.1 14.1 14.1 7.5NH . . . . . . . . . . . . . . . . . . . . . . . . . . . . . . . . . . . . . . 23.7 18.2 18.2 18.2 9.9NJ . . . . . . . . . . . . . . . . . . . . . . . . . . . . . . . . . . . . . . . 24.2 21.1 21.1 21.1 11.9NU . . . . . . . . . . . . . . . . . . . . . . . . . . . . . . . . . . . . . . 24.5 11.9 11.1 5.3 1.3YA . . . . . . . . . . . . . . . . . . . . . . . . . . . . . . . . . . . . . . 24.3 9.2 8.0 4.9 1.3YB . . . . . . . . . . . . . . . . . . . . . . . . . . . . . . . . . . . . . . 24.5 12.5 12.5 5.7 1.4YC . . . . . . . . . . . . . . . . . . . . . . . . . . . . . . . . . . . . . . 24.9 19.2 19.1 6.4 1.4Group 11 Assets . . . . . . . . . . . . . . . . . . . . . . . . . . . . 14.6 6.7 6.7 6.5 3.5
The Assets
The Group 1, 2, 3, 5, 6, 7 and 8 Assets (the “PC Assets”) consist of Freddie Mac PCs with thefollowing characteristics:
Group Principal BalanceOriginal Term
(in years) Interest Rate
1 $ 81,103,692 20 3.5%2(1) 57,000,000 30 3.53 200,434,931 30 5.05 577,300,705 30 4.56(2) 230,000,000 30 4.57(1) 112,837,402 30 4.08 150,000,000 30 5.0
(1) Backed by Super-Conforming Mortgages. See General Information — The Mortgages.(2) Backed by High LTV Mortgages. See General Information — The Mortgages.
VII-11
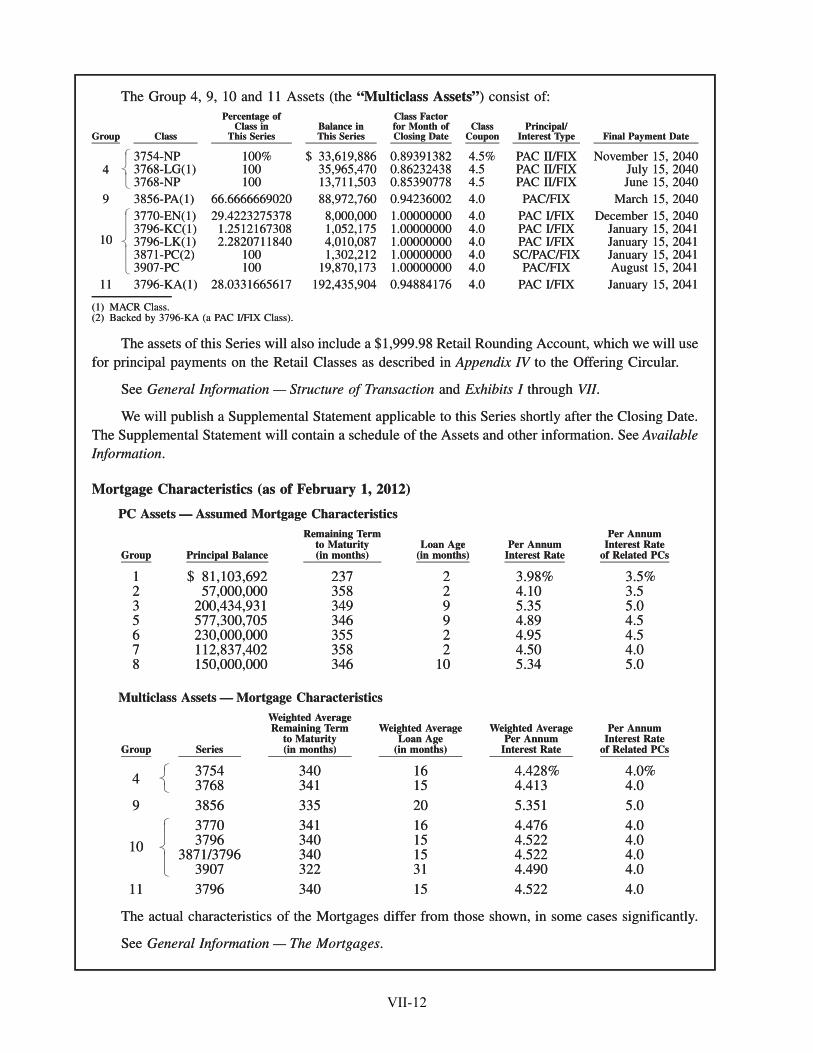
The Group 4, 9, 10 and 11 Assets (the “Multiclass Assets”) consist of:
Group Class
Percentage ofClass in
This SeriesBalance inThis Series
Class Factorfor Month ofClosing Date
ClassCoupon
Principal/Interest Type Final Payment Date
43754-NP 100% $ 33,619,886 0.89391382 4.5% PAC II/FIX November 15, 20403768-LG(1) 100 35,965,470 0.86232438 4.5 PAC II/FIX July 15, 20403768-NP 100 13,711,503 0.85390778 4.5 PAC II/FIX June 15, 2040
9 3856-PA(1) 66.6666669020 88,972,760 0.94236002 4.0 PAC/FIX March 15, 2040
10
3770-EN(1) 29.4223275378 8,000,000 1.00000000 4.0 PAC I/FIX December 15, 20403796-KC(1) 1.2512167308 1,052,175 1.00000000 4.0 PAC I/FIX January 15, 20413796-LK(1) 2.2820711840 4,010,087 1.00000000 4.0 PAC I/FIX January 15, 20413871-PC(2) 100 1,302,212 1.00000000 4.0 SC/PAC/FIX January 15, 20413907-PC 100 19,870,173 1.00000000 4.0 PAC/FIX August 15, 2041
11 3796-KA(1) 28.0331665617 192,435,904 0.94884176 4.0 PAC I/FIX January 15, 2041
(1) MACR Class.(2) Backed by 3796-KA (a PAC I/FIX Class).
The assets of this Series will also include a $1,999.98 Retail Rounding Account, which we will usefor principal payments on the Retail Classes as described in Appendix IV to the Offering Circular.
See General Information — Structure of Transaction and Exhibits I through VII.
We will publish a Supplemental Statement applicable to this Series shortly after the Closing Date.The Supplemental Statement will contain a schedule of the Assets and other information. See AvailableInformation.
Mortgage Characteristics (as of February 1, 2012)
PC Assets — Assumed Mortgage Characteristics
Group Principal Balance
Remaining Termto Maturity(in months)
Loan Age(in months)
Per AnnumInterest Rate
Per AnnumInterest Rate
of Related PCs
1 $ 81,103,692 237 2 3.98% 3.5%2 57,000,000 358 2 4.10 3.53 200,434,931 349 9 5.35 5.05 577,300,705 346 9 4.89 4.56 230,000,000 355 2 4.95 4.57 112,837,402 358 2 4.50 4.08 150,000,000 346 10 5.34 5.0
Multiclass Assets — Mortgage Characteristics
Group Series
Weighted AverageRemaining Term
to Maturity(in months)
Weighted AverageLoan Age
(in months)
Weighted AveragePer Annum
Interest Rate
Per AnnumInterest Rate
of Related PCs
4 3754 340 16 4.428% 4.0%3768 341 15 4.413 4.0
9 3856 335 20 5.351 5.0
10
3770 341 16 4.476 4.03796 340 15 4.522 4.0
3871/3796 340 15 4.522 4.03907 322 31 4.490 4.0
11 3796 340 15 4.522 4.0
The actual characteristics of the Mortgages differ from those shown, in some cases significantly.
See General Information — The Mortgages.
The Group 4, 9, 10 and 11 Assets (the “Multiclass Assets”) consist of:
Group Class
Percentage ofClass in
This SeriesBalance inThis Series
Class Factorfor Month ofClosing Date
ClassCoupon
Principal/Interest Type Final Payment Date
43754-NP 100% $ 33,619,886 0.89391382 4.5% PAC II/FIX November 15, 20403768-LG(1) 100 35,965,470 0.86232438 4.5 PAC II/FIX July 15, 20403768-NP 100 13,711,503 0.85390778 4.5 PAC II/FIX June 15, 2040
���������������
9 3856-PA(1) 66.6666669020 88,972,760 0.94236002 4.0 PAC/FIX March 15, 2040
10
3770-EN(1) 29.4223275378 8,000,000 1.00000000 4.0 PAC I/FIX December 15, 20403796-KC(1) 1.2512167308 1,052,175 1.00000000 4.0 PAC I/FIX January 15, 20413796-LK(1) 2.2820711840 4,010,087 1.00000000 4.0 PAC I/FIX January 15, 20413871-PC(2) 100 1,302,212 1.00000000 4.0 SC/PAC/FIX January 15, 20413907-PC 100 19,870,173 1.00000000 4.0 PAC/FIX August 15, 2041
�������������������������
11 3796-KA(1) 28.0331665617 192,435,904 0.94884176 4.0 PAC I/FIX January 15, 2041
(1) MACR Class.(2) Backed by 3796-KA (a PAC I/FIX Class).
The assets of this Series will also include a $1,999.98 Retail Rounding Account, which we will usefor principal payments on the Retail Classes as described in Appendix IV to the Offering Circular.
See General Information — Structure of Transaction and Exhibits I through VII.
We will publish a Supplemental Statement applicable to this Series shortly after the Closing Date.The Supplemental Statement will contain a schedule of the Assets and other information. See AvailableInformation.
Mortgage Characteristics (as of February 1, 2012)
PC Assets — Assumed Mortgage Characteristics
Group Principal Balance
Remaining Termto Maturity(in months)
Loan Age(in months)
Per AnnumInterest Rate
Per AnnumInterest Rate
of Related PCs
1 $ 81,103,692 237 2 3.98% 3.5%2 57,000,000 358 2 4.10 3.53 200,434,931 349 9 5.35 5.05 577,300,705 346 9 4.89 4.56 230,000,000 355 2 4.95 4.57 112,837,402 358 2 4.50 4.08 150,000,000 346 10 5.34 5.0
Multiclass Assets — Mortgage Characteristics
Group Series
Weighted AverageRemaining Term
to Maturity(in months)
Weighted AverageLoan Age
(in months)
Weighted AveragePer Annum
Interest Rate
Per AnnumInterest Rate
of Related PCs
4 3754 340 16 4.428% 4.0%3768 341 15 4.413 4.0
���������
9 3856 335 20 5.351 5.0
10
3770 341 16 4.476 4.03796 340 15 4.522 4.0
3871/3796 340 15 4.522 4.03907 322 31 4.490 4.0
�������������������
11 3796 340 15 4.522 4.0
The actual characteristics of the Mortgages differ from those shown, in some cases significantly.
See General Information — The Mortgages.
VII-12

App
endi
xA
Ava
ilabl
eC
ombi
nati
ons
—Se
ries
3997
Gro
upR
EM
ICC
lass
Ori
gina
lB
alan
ceE
xcha
nge
Pro
port
ions
(1)
MA
CR
Cla
ssM
axim
umO
rigi
nal
Bal
ance
Exc
hang
eP
ropo
rtio
ns(1
)P
rinc
ipal
Typ
e(2)
Cla
ssC
oupo
nIn
tere
stT
ype(
2)C
USI
PN
umbe
rF
inal
Pay
men
tD
ate
RE
MIC
Cer
tifi
cate
sM
AC
RC
erti
fica
tes
Com
bina
tion
12
LV$
3,09
1,26
732
.497
9799
588%
LB
$9,
512,
182
100%
SEQ
3.5%
FIX
/PZ
3137
AM
BP
1Fe
brua
ry15
,20
42L
Z6,
420,
915
67.5
0202
0041
2C
ombi
nati
on2
5JK
$10
,583
,229
39.5
6040
1235
4%JB
$26
,752
,077
100%
PAC
I3.
5%FI
X31
37A
MB
48
Febr
uary
15,
2042
WK
16,1
68,8
4860
.439
5987
646
Com
bina
tion
35
FM$
2,90
0,00
028
.100
7751
938%
EF
$10
,320
,000
100%
SUP
(3)
FLT
3137
AM
7F
8Se
ptem
ber
15,
2041
FN7,
420,
000
71.8
9922
4806
2C
ombi
nati
on4
5JK
$5,
283,
159
38.6
4704
3074
5%W
B$
13,6
70,2
8010
0%PA
CI
3.5%
FIX
3137
AM
DS
3Fe
brua
ry15
,20
42M
B31
5,61
52.
3087
6763
31W
K8,
071,
506
59.0
4418
9292
4C
ombi
nati
on5
5JF
$32
,680
,725
38.3
3398
8112
9%K
F$
85,2
52,6
0910
0%PA
CI
(3)
FLT
3137
AM
BH
9N
ovem
ber
15,
2041
MF
4,28
5,71
45.
0270
7664
93W
F48
,286
,170
56.6
3893
5237
8C
ombi
nati
on6
5JS
$32
,680
,725
38.3
3398
8112
9%K
S$
85,2
52,6
0910
0%N
TL
(PA
CI)
(3)
INV
/IO
3137
AM
BM
8N
ovem
ber
15,
2041
MS
4,28
5,71
45.
0270
7664
93W
S48
,286
,170
56.6
3893
5237
8C
ombi
nati
on7
5JF
$32
,680
,725
38.3
3398
8112
9%FK
$85
,252
,609
100%
PAC
I(3
)FL
T31
37A
MA
B3
Nov
embe
r15
,20
41JS
32,6
80,7
25(4
)SK
85,2
52,6
09(4
)N
TL
(PA
CI)
(3)
INV
/IO
3137
AM
DJ3
Nov
embe
r15
,20
41M
F4,
285,
714
5.02
7076
6493
MS
4,28
5,71
4(4
)W
F48
,286
,170
56.6
3893
5237
8W
S48
,286
,170
(4)
Com
bina
tion
85
JF$
32,6
80,7
2510
0%FS
$32
,680
,725
100%
PAC
I(3
)FL
T31
37A
MA
G2
Janu
ary
15,
2041
SE32
,680
,725
(4)
NT
L(P
AC
I)(3
)IN
V/I
O31
37A
MD
D6
Janu
ary
15,
2041
Com
bina
tion
95
MF
$4,
285,
714
100%
FT$
4,28
5,71
410
0%PA
CI
(3)
FLT
3137
AM
AH
0N
ovem
ber
15,
2041
SF4,
285,
714
(4)
NT
L(P
AC
I)(3
)IN
V/I
O31
37A
MD
E4
Nov
embe
r15
,20
41C
ombi
nati
on10
5W
F$
48,2
86,1
7010
0%FW
$48
,286
,170
100%
PAC
I(3
)FL
T31
37A
MA
J6A
ugus
t15
,20
40SL
48,2
86,1
70(4
)N
TL
(PA
CI)
(3)
INV
/IO
3137
AM
DK
0A
ugus
t15
,20
40C
ombi
nati
on11
6Y
V$
21,1
22,9
9440
.211
8927
292%
HB
$52
,529
,221
100%
SEQ
4.0%
FIX
3137
AM
AW
7Fe
brua
ry15
,20
42Y
Z31
,406
,227
59.7
8810
7270
8C
ombi
nati
on12
7PE
$6,
869,
207
36.7
8834
5177
9%U
P$
18,6
72,2
3710
0%SU
P4.
0%FI
X31
37A
MD
N4
Febr
uary
15,
2042
PZ11
,803
,030
63.2
1165
4822
1C
ombi
nati
on13
7PD
$80
,000
,000
100%
IP$
20,0
00,0
00N
/AN
TL
(PA
CI)
4.0%
FIX
/IO
3137
AM
B3
0Ja
nuar
y15
,20
40PG
80,0
00,0
00N
/APA
CI
3.5
FIX
3137
AM
CV
7Ja
nuar
y15
,20
40PJ
80,0
00,0
00N
/APA
CI
3.0
FIX
3137
AM
CX
3Ja
nuar
y15
,20
40
VII-13
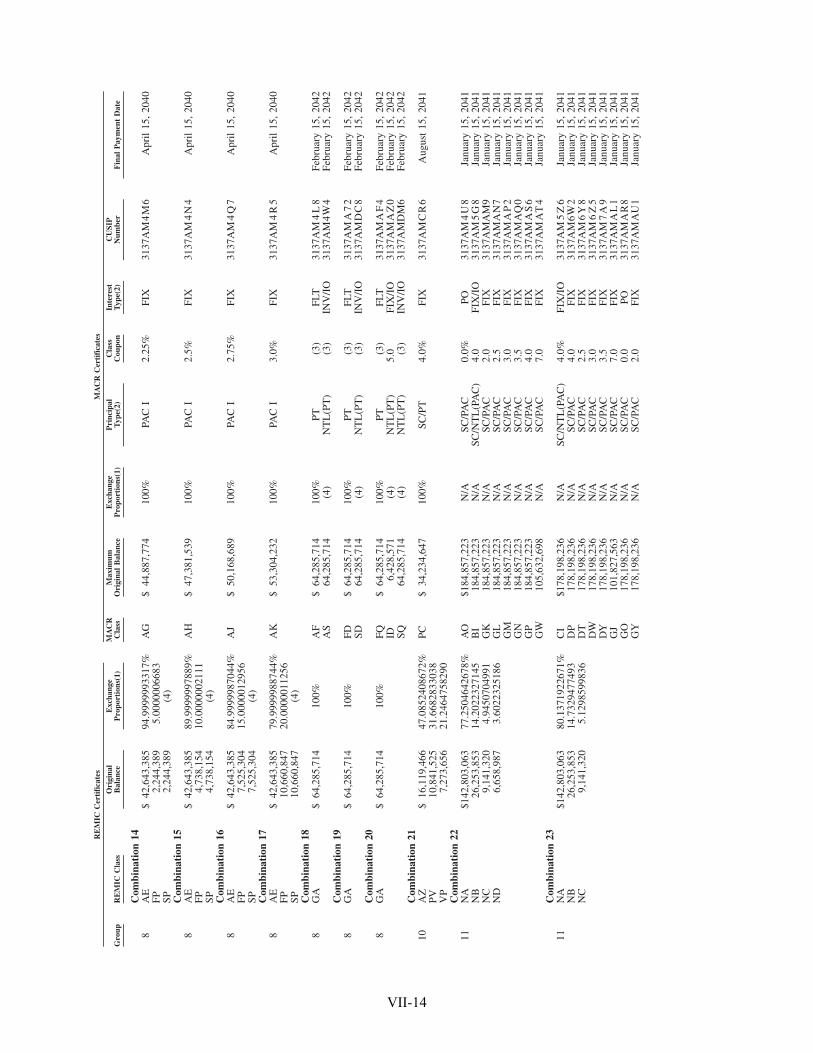
Gro
upR
EM
ICC
lass
Ori
gina
lB
alan
ceE
xcha
nge
Pro
port
ions
(1)
MA
CR
Cla
ssM
axim
umO
rigi
nal
Bal
ance
Exc
hang
eP
ropo
rtio
ns(1
)P
rinc
ipal
Typ
e(2)
Cla
ssC
oupo
nIn
tere
stT
ype(
2)C
USI
PN
umbe
rF
inal
Pay
men
tD
ate
RE
MIC
Cer
tifi
cate
sM
AC
RC
erti
fica
tes
Com
bina
tion
148
AE
$42
,643
,385
94.9
9999
9331
7%A
G$
44,8
87,7
7410
0%PA
CI
2.25
%FI
X31
37A
M4
M6
Apr
il15
,20
40FP
2,24
4,38
95.
0000
0066
83SP
2,24
4,38
9(4
)C
ombi
nati
on15
8A
E$
42,6
43,3
8589
.999
9997
889%
AH
$47
,381
,539
100%
PAC
I2.
5%FI
X31
37A
M4
N4
Apr
il15
,20
40FP
4,73
8,15
410
.000
0002
111
SP4,
738,
154
(4)
Com
bina
tion
168
AE
$42
,643
,385
84.9
9999
8704
4%A
J$
50,1
68,6
8910
0%PA
CI
2.75
%FI
X31
37A
M4
Q7
Apr
il15
,20
40FP
7,52
5,30
415
.000
0012
956
SP7,
525,
304
(4)
Com
bina
tion
178
AE
$42
,643
,385
79.9
9999
8874
4%A
K$
53,3
04,2
3210
0%PA
CI
3.0%
FIX
3137
AM
4R
5A
pril
15,
2040
FP10
,660
,847
20.0
0000
1125
6SP
10,6
60,8
47(4
)C
ombi
nati
on18
8G
A$
64,2
85,7
1410
0%A
F$
64,2
85,7
1410
0%PT
(3)
FLT
3137
AM
4L
8Fe
brua
ry15
,20
42A
S64
,285
,714
(4)
NT
L(P
T)
(3)
INV
/IO
3137
AM
4W4
Febr
uary
15,
2042
Com
bina
tion
198
GA
$64
,285
,714
100%
FD$
64,2
85,7
1410
0%PT
(3)
FLT
3137
AM
A7
2Fe
brua
ry15
,20
42SD
64,2
85,7
14(4
)N
TL
(PT
)(3
)IN
V/I
O31
37A
MD
C8
Febr
uary
15,
2042
Com
bina
tion
208
GA
$64
,285
,714
100%
FQ$
64,2
85,7
1410
0%PT
(3)
FLT
3137
AM
AF
4Fe
brua
ry15
,20
42ID
6,42
8,57
1(4
)N
TL
(PT
)5.
0FI
X/I
O31
37A
MA
Z0
Febr
uary
15,
2042
SQ64
,285
,714
(4)
NT
L(P
T)
(3)
INV
/IO
3137
AM
DM
6Fe
brua
ry15
,20
42C
ombi
nati
on21
10A
Z$
16,1
19,4
6647
.085
2408
672%
PC$
34,2
34,6
4710
0%SC
/PT
4.0%
FIX
3137
AM
CR
6A
ugus
t15
,20
41PV
10,8
41,5
2531
.668
2833
038
VP
7,27
3,65
621
.246
4758
290
Com
bina
tion
2211
NA
$142
,803
,063
77.2
5046
4267
8%A
O$1
84,8
57,2
23N
/ASC
/PA
C0.
0%PO
3137
AM
4U
8Ja
nuar
y15
,20
41N
B26
,253
,853
14.2
0223
2714
5B
I18
4,85
7,22
3N
/ASC
/NT
L(P
AC
)4.
0FI
X/I
O31
37A
M5
G8
Janu
ary
15,
2041
NC
9,14
1,32
04.
9450
7049
91G
K18
4,85
7,22
3N
/ASC
/PA
C2.
0FI
X31
37A
MA
M9
Janu
ary
15,
2041
ND
6,65
8,98
73.
6022
3251
86G
L18
4,85
7,22
3N
/ASC
/PA
C2.
5FI
X31
37A
MA
N7
Janu
ary
15,
2041
GM
184,
857,
223
N/A
SC/P
AC
3.0
FIX
3137
AM
AP
2Ja
nuar
y15
,20
41G
N18
4,85
7,22
3N
/ASC
/PA
C3.
5FI
X31
37A
MA
Q0
Janu
ary
15,
2041
GP
184,
857,
223
N/A
SC/P
AC
4.0
FIX
3137
AM
AS
6Ja
nuar
y15
,20
41G
W10
5,63
2,69
8N
/ASC
/PA
C7.
0FI
X31
37A
MA
T4
Janu
ary
15,
2041
Com
bina
tion
2311
NA
$142
,803
,063
80.1
3719
2267
1%C
I$1
78,1
98,2
36N
/ASC
/NT
L(P
AC
)4.
0%FI
X/I
O31
37A
M5
Z6
Janu
ary
15,
2041
NB
26,2
53,8
5314
.732
9477
493
DP
178,
198,
236
N/A
SC/P
AC
4.0
FIX
3137
AM
6W2
Janu
ary
15,
2041
NC
9,14
1,32
05.
1298
5998
36D
T17
8,19
8,23
6N
/ASC
/PA
C2.
5FI
X31
37A
M6
Y8
Janu
ary
15,
2041
DW
178,
198,
236
N/A
SC/P
AC
3.0
FIX
3137
AM
6Z
5Ja
nuar
y15
,20
41D
Y17
8,19
8,23
6N
/ASC
/PA
C3.
5FI
X31
37A
M7
A9
Janu
ary
15,
2041
GJ
101,
827,
563
N/A
SC/P
AC
7.0
FIX
3137
AM
AL
1Ja
nuar
y15
,20
41G
O17
8,19
8,23
6N
/ASC
/PA
C0.
0PO
3137
AM
AR
8Ja
nuar
y15
,20
41G
Y17
8,19
8,23
6N
/ASC
/PA
C2.
0FI
X31
37A
MA
U1
Janu
ary
15,
2041
VII-14
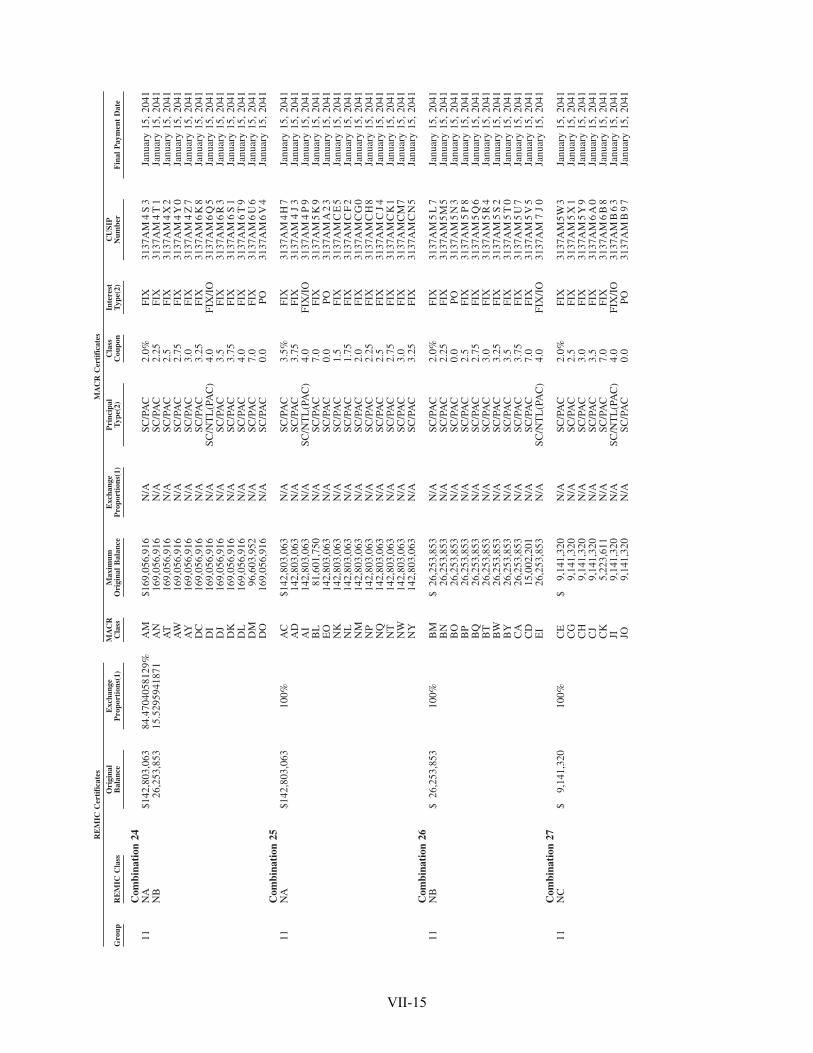
Gro
upR
EM
ICC
lass
Ori
gina
lB
alan
ceE
xcha
nge
Pro
port
ions
(1)
MA
CR
Cla
ssM
axim
umO
rigi
nal
Bal
ance
Exc
hang
eP
ropo
rtio
ns(1
)P
rinc
ipal
Typ
e(2)
Cla
ssC
oupo
nIn
tere
stT
ype(
2)C
USI
PN
umbe
rF
inal
Pay
men
tD
ate
RE
MIC
Cer
tifi
cate
sM
AC
RC
erti
fica
tes
Com
bina
tion
2411
NA
$142
,803
,063
84.4
7040
5812
9%A
M$1
69,0
56,9
16N
/ASC
/PA
C2.
0%FI
X31
37A
M4
S3
Janu
ary
15,
2041
NB
26,2
53,8
5315
.529
5941
871
AN
169,
056,
916
N/A
SC/P
AC
2.25
FIX
3137
AM
4T
1Ja
nuar
y15
,20
41A
T16
9,05
6,91
6N
/ASC
/PA
C2.
5FI
X31
37A
M4
X2
Janu
ary
15,
2041
AW
169,
056,
916
N/A
SC/P
AC
2.75
FIX
3137
AM
4Y
0Ja
nuar
y15
,20
41A
Y16
9,05
6,91
6N
/ASC
/PA
C3.
0FI
X31
37A
M4
Z7
Janu
ary
15,
2041
DC
169,
056,
916
N/A
SC/P
AC
3.25
FIX
3137
AM
6K
8Ja
nuar
y15
,20
41D
I16
9,05
6,91
6N
/ASC
/NT
L(P
AC
)4.
0FI
X/I
O31
37A
M6
Q5
Janu
ary
15,
2041
DJ
169,
056,
916
N/A
SC/P
AC
3.5
FIX
3137
AM
6R
3Ja
nuar
y15
,20
41D
K16
9,05
6,91
6N
/ASC
/PA
C3.
75FI
X31
37A
M6
S1
Janu
ary
15,
2041
DL
169,
056,
916
N/A
SC/P
AC
4.0
FIX
3137
AM
6T
9Ja
nuar
y15
,20
41D
M96
,603
,952
N/A
SC/P
AC
7.0
FIX
3137
AM
6U
6Ja
nuar
y15
,20
41D
O16
9,05
6,91
6N
/ASC
/PA
C0.
0PO
3137
AM
6V
4Ja
nuar
y15
,20
41C
ombi
nati
on25
11N
A$1
42,8
03,0
6310
0%A
C$1
42,8
03,0
63N
/ASC
/PA
C3.
5%FI
X31
37A
M4
H7
Janu
ary
15,
2041
AD
142,
803,
063
N/A
SC/P
AC
3.75
FIX
3137
AM
4J
3Ja
nuar
y15
,20
41A
I14
2,80
3,06
3N
/ASC
/NT
L(P
AC
)4.
0FI
X/I
O31
37A
M4
P9
Janu
ary
15,
2041
BL
81,6
01,7
50N
/ASC
/PA
C7.
0FI
X31
37A
M5
K9
Janu
ary
15,
2041
EO
142,
803,
063
N/A
SC/P
AC
0.0
PO31
37A
MA
23
Janu
ary
15,
2041
NK
142,
803,
063
N/A
SC/P
AC
1.5
FIX
3137
AM
CE
5Ja
nuar
y15
,20
41N
L14
2,80
3,06
3N
/ASC
/PA
C1.
75FI
X31
37A
MC
F2
Janu
ary
15,
2041
NM
142,
803,
063
N/A
SC/P
AC
2.0
FIX
3137
AM
CG
0Ja
nuar
y15
,20
41N
P14
2,80
3,06
3N
/ASC
/PA
C2.
25FI
X31
37A
MC
H8
Janu
ary
15,
2041
NQ
142,
803,
063
N/A
SC/P
AC
2.5
FIX
3137
AM
CJ
4Ja
nuar
y15
,20
41N
T14
2,80
3,06
3N
/ASC
/PA
C2.
75FI
X31
37A
MC
K1
Janu
ary
15,
2041
NW
142,
803,
063
N/A
SC/P
AC
3.0
FIX
3137
AM
CM
7Ja
nuar
y15
,20
41N
Y14
2,80
3,06
3N
/ASC
/PA
C3.
25FI
X31
37A
MC
N5
Janu
ary
15,
2041
Com
bina
tion
2611
NB
$26
,253
,853
100%
BM
$26
,253
,853
N/A
SC/P
AC
2.0%
FIX
3137
AM
5L
7Ja
nuar
y15
,20
41B
N26
,253
,853
N/A
SC/P
AC
2.25
FIX
3137
AM
5M
5Ja
nuar
y15
,20
41B
O26
,253
,853
N/A
SC/P
AC
0.0
PO31
37A
M5
N3
Janu
ary
15,
2041
BP
26,2
53,8
53N
/ASC
/PA
C2.
5FI
X31
37A
M5
P8
Janu
ary
15,
2041
BQ
26,2
53,8
53N
/ASC
/PA
C2.
75FI
X31
37A
M5
Q6
Janu
ary
15,
2041
BT
26,2
53,8
53N
/ASC
/PA
C3.
0FI
X31
37A
M5
R4
Janu
ary
15,
2041
BW
26,2
53,8
53N
/ASC
/PA
C3.
25FI
X31
37A
M5
S2
Janu
ary
15,
2041
BY
26,2
53,8
53N
/ASC
/PA
C3.
5FI
X31
37A
M5
T0
Janu
ary
15,
2041
CA
26,2
53,8
53N
/ASC
/PA
C3.
75FI
X31
37A
M5
U7
Janu
ary
15,
2041
CD
15,0
02,2
01N
/ASC
/PA
C7.
0FI
X31
37A
M5
V5
Janu
ary
15,
2041
EI
26,2
53,8
53N
/ASC
/NT
L(P
AC
)4.
0FI
X/I
O31
37A
M7
J0
Janu
ary
15,
2041
Com
bina
tion
2711
NC
$9,
141,
320
100%
CE
$9,
141,
320
N/A
SC/P
AC
2.0%
FIX
3137
AM
5W3
Janu
ary
15,
2041
CG
9,14
1,32
0N
/ASC
/PA
C2.
5FI
X31
37A
M5
X1
Janu
ary
15,
2041
CH
9,14
1,32
0N
/ASC
/PA
C3.
0FI
X31
37A
M5
Y9
Janu
ary
15,
2041
CJ
9,14
1,32
0N
/ASC
/PA
C3.
5FI
X31
37A
M6
A0
Janu
ary
15,
2041
CK
5,22
3,61
1N
/ASC
/PA
C7.
0FI
X31
37A
M6
B8
Janu
ary
15,
2041
JI9,
141,
320
N/A
SC/N
TL
(PA
C)
4.0
FIX
/IO
3137
AM
B6
3Ja
nuar
y15
,20
41JO
9,14
1,32
0N
/ASC
/PA
C0.
0PO
3137
AM
B9
7Ja
nuar
y15
,20
41
VII-15
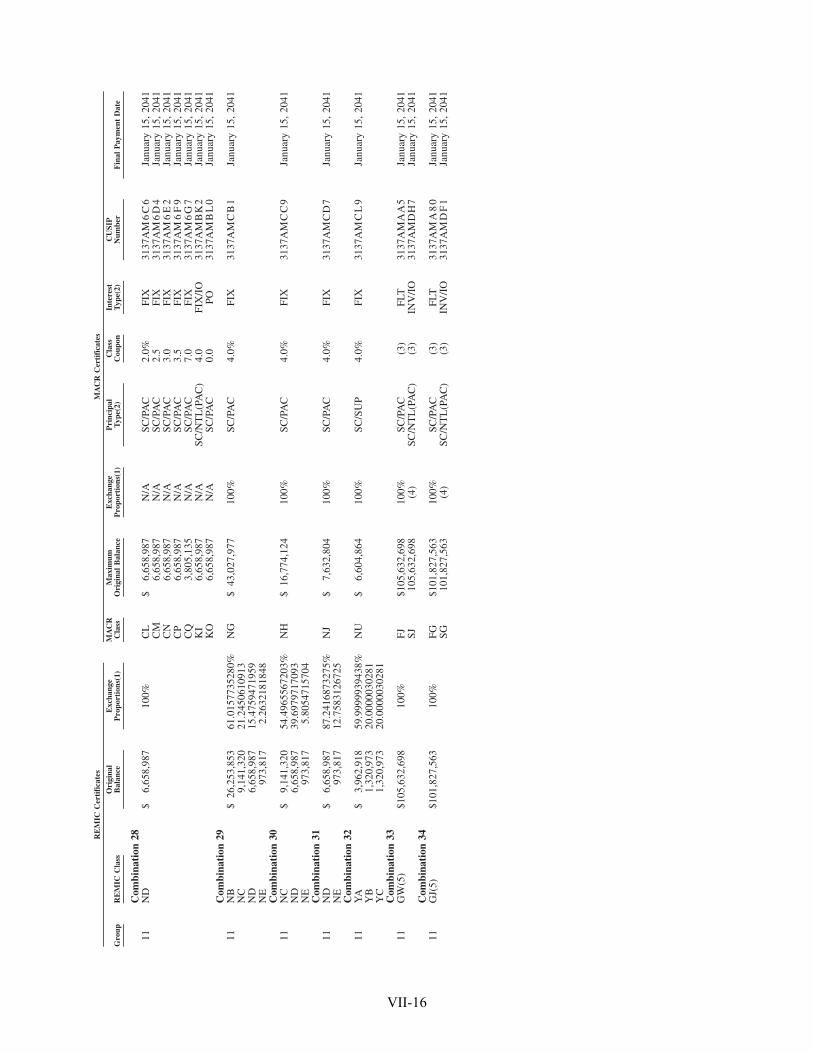
Gro
upR
EM
ICC
lass
Ori
gina
lB
alan
ceE
xcha
nge
Pro
port
ions
(1)
MA
CR
Cla
ssM
axim
umO
rigi
nal
Bal
ance
Exc
hang
eP
ropo
rtio
ns(1
)P
rinc
ipal
Typ
e(2)
Cla
ssC
oupo
nIn
tere
stT
ype(
2)C
USI
PN
umbe
rF
inal
Pay
men
tD
ate
RE
MIC
Cer
tifi
cate
sM
AC
RC
erti
fica
tes
Com
bina
tion
2811
ND
$6,
658,
987
100%
CL
$6,
658,
987
N/A
SC/P
AC
2.0%
FIX
3137
AM
6C
6Ja
nuar
y15
,20
41C
M6,
658,
987
N/A
SC/P
AC
2.5
FIX
3137
AM
6D
4Ja
nuar
y15
,20
41C
N6,
658,
987
N/A
SC/P
AC
3.0
FIX
3137
AM
6E
2Ja
nuar
y15
,20
41C
P6,
658,
987
N/A
SC/P
AC
3.5
FIX
3137
AM
6F
9Ja
nuar
y15
,20
41C
Q3,
805,
135
N/A
SC/P
AC
7.0
FIX
3137
AM
6G
7Ja
nuar
y15
,20
41K
I6,
658,
987
N/A
SC/N
TL
(PA
C)
4.0
FIX
/IO
3137
AM
BK
2Ja
nuar
y15
,20
41K
O6,
658,
987
N/A
SC/P
AC
0.0
PO31
37A
MB
L0
Janu
ary
15,
2041
Com
bina
tion
2911
NB
$26
,253
,853
61.0
1577
3528
0%N
G$
43,0
27,9
7710
0%SC
/PA
C4.
0%FI
X31
37A
MC
B1
Janu
ary
15,
2041
NC
9,14
1,32
021
.245
0610
913
ND
6,65
8,98
715
.475
9471
959
NE
973,
817
2.26
3218
1848
Com
bina
tion
3011
NC
$9,
141,
320
54.4
9655
6720
3%N
H$
16,7
74,1
2410
0%SC
/PA
C4.
0%FI
X31
37A
MC
C9
Janu
ary
15,
2041
ND
6,65
8,98
739
.697
9717
093
NE
973,
817
5.80
5471
5704
Com
bina
tion
3111
ND
$6,
658,
987
87.2
4168
7327
5%N
J$
7,63
2,80
410
0%SC
/PA
C4.
0%FI
X31
37A
MC
D7
Janu
ary
15,
2041
NE
973,
817
12.7
5831
2672
5C
ombi
nati
on32
11Y
A$
3,96
2,91
859
.999
9939
438%
NU
$6,
604,
864
100%
SC/S
UP
4.0%
FIX
3137
AM
CL
9Ja
nuar
y15
,20
41Y
B1,
320,
973
20.0
0000
3028
1Y
C1,
320,
973
20.0
0000
3028
1C
ombi
nati
on33
11G
W(5
)$1
05,6
32,6
9810
0%FJ
$105
,632
,698
100%
SC/P
AC
(3)
FLT
3137
AM
AA
5Ja
nuar
y15
,20
41SJ
105,
632,
698
(4)
SC/N
TL
(PA
C)
(3)
INV
/IO
3137
AM
DH
7Ja
nuar
y15
,20
41C
ombi
nati
on34
11G
J(5)
$101
,827
,563
100%
FG$1
01,8
27,5
6310
0%SC
/PA
C(3
)FL
T31
37A
MA
80
Janu
ary
15,
2041
SG10
1,82
7,56
3(4
)SC
/NT
L(P
AC
)(3
)IN
V/I
O31
37A
MD
F1
Janu
ary
15,
2041
VII-16
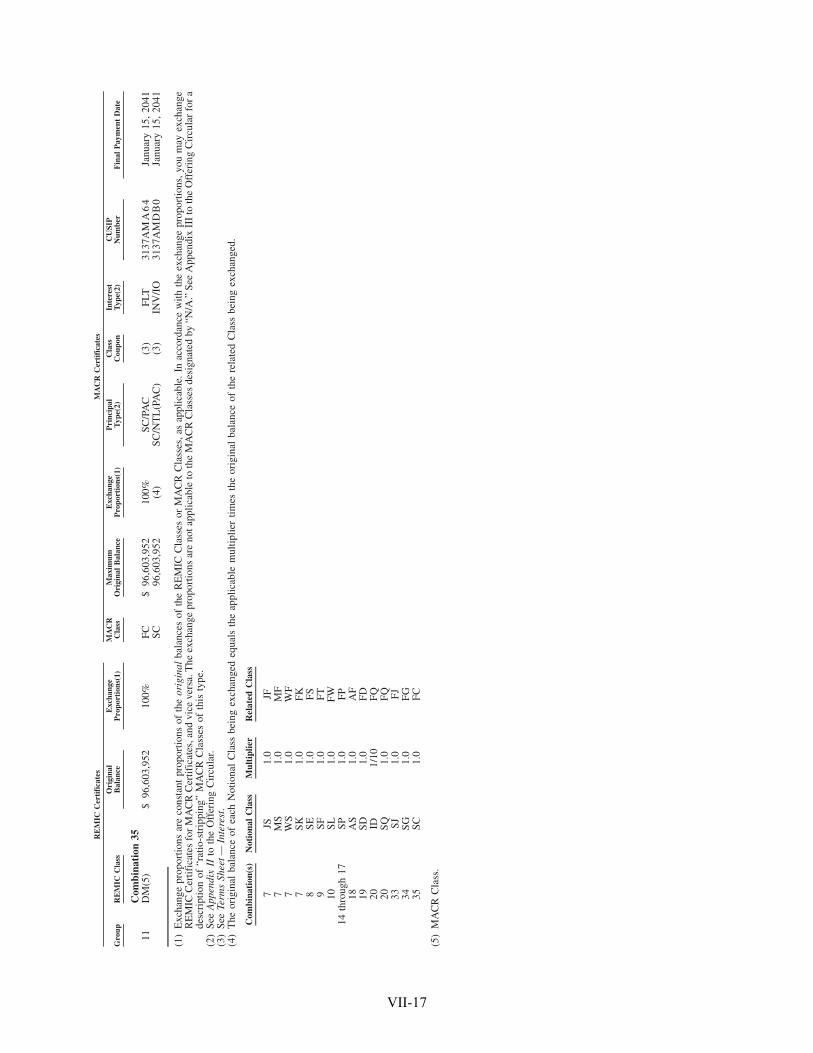
Gro
upR
EM
ICC
lass
Ori
gina
lB
alan
ceE
xcha
nge
Pro
port
ions
(1)
MA
CR
Cla
ssM
axim
umO
rigi
nal
Bal
ance
Exc
hang
eP
ropo
rtio
ns(1
)P
rinc
ipal
Typ
e(2)
Cla
ssC
oupo
nIn
tere
stT
ype(
2)C
USI
PN
umbe
rF
inal
Pay
men
tD
ate
RE
MIC
Cer
tifi
cate
sM
AC
RC
erti
fica
tes
Com
bina
tion
3511
DM
(5)
$96
,603
,952
100%
FC$
96,6
03,9
5210
0%SC
/PA
C(3
)FL
T31
37A
MA
64
Janu
ary
15,
2041
SC96
,603
,952
(4)
SC/N
TL
(PA
C)
(3)
INV
/IO
3137
AM
DB
0Ja
nuar
y15
,20
41
(1)
Exc
hang
epr
opor
tions
are
cons
tant
prop
ortio
nsof
the
orig
inal
bala
nces
ofth
eR
EM
ICC
lass
esor
MA
CR
Cla
sses
,as
appl
icab
le.
Inac
cord
ance
with
the
exch
ange
prop
ortio
ns,y
oum
ayex
chan
geR
EM
ICC
ertif
icat
esfo
rM
AC
RC
ertif
icat
es,a
ndvi
ceve
rsa.
The
exch
ange
prop
ortio
nsar
eno
tapp
licab
leto
the
MA
CR
Cla
sses
desi
gnat
edby
“N/A
.”Se
eA
ppen
dix
III
toth
eO
ffer
ing
Cir
cula
rfo
ra
desc
ript
ion
of“r
atio
-str
ippi
ng”
MA
CR
Cla
sses
ofth
isty
pe.
(2)
See
App
endi
xII
toth
eO
ffer
ing
Cir
cula
r.(3
)Se
eTe
rms
Shee
t—In
tere
st.
(4)
The
orig
inal
bala
nce
ofea
chN
otio
nal
Cla
ssbe
ing
exch
ange
deq
uals
the
appl
icab
lem
ultip
lier
times
the
orig
inal
bala
nce
ofth
ere
late
dC
lass
bein
gex
chan
ged.
Com
bina
tion
(s)
Not
iona
lC
lass
Mul
tipl
ier
Rel
ated
Cla
ss
7JS
1.0
JF7
MS
1.0
MF
7W
S1.
0W
F7
SK1.
0FK
8SE
1.0
FS9
SF1.
0FT
10SL
1.0
FW14
thro
ugh
17SP
1.0
FP18
AS
1.0
AF
19SD
1.0
FD20
ID1/
10FQ
20SQ
1.0
FQ33
SJ1.
0FJ
34SG
1.0
FG35
SC1.
0FC
(5)
MA
CR
Cla
ss.
VII-17

If you intend to purchase Certificates, you shouldrely only on the information in this Supplementand the Offering Circular, including the informa-tion in the Incorporated Documents. We have notauthorized anyone to provide you with differentinformation.
This Supplement, the Offering Circular and theIncorporated Documents may not be correct aftertheir dates.
We are not offering the Certificates in any juris-diction that prohibits their offer.
TABLE OF CONTENTS
Description Page
Offering Circular SupplementCertain Risk Considerations . . . . . . . . . . . . . . . . . . . . . . . . . . . . S-2Terms Sheet . . . . . . . . . . . . . . . . . . . . . . . . . . . . . . . . . . . . . S-3Available Information . . . . . . . . . . . . . . . . . . . . . . . . . . . . . . . S-10General Information . . . . . . . . . . . . . . . . . . . . . . . . . . . . . . . . S-10
The Trust Agreement . . . . . . . . . . . . . . . . . . . . . . . . . . . . . S-10Form of Certificates . . . . . . . . . . . . . . . . . . . . . . . . . . . . . S-11Denominations of Certificates . . . . . . . . . . . . . . . . . . . . . . . . S-11Structure of Transaction . . . . . . . . . . . . . . . . . . . . . . . . . . . S-11The Mortgages. . . . . . . . . . . . . . . . . . . . . . . . . . . . . . . . . S-11
Payments . . . . . . . . . . . . . . . . . . . . . . . . . . . . . . . . . . . . . . . S-12Payment Dates; Record Dates . . . . . . . . . . . . . . . . . . . . . . . . S-12Method of Payment . . . . . . . . . . . . . . . . . . . . . . . . . . . . . . S-12Categories of Classes . . . . . . . . . . . . . . . . . . . . . . . . . . . . . S-12Interest . . . . . . . . . . . . . . . . . . . . . . . . . . . . . . . . . . . . . S-12Principal . . . . . . . . . . . . . . . . . . . . . . . . . . . . . . . . . . . . S-13Class Factors . . . . . . . . . . . . . . . . . . . . . . . . . . . . . . . . . . S-13Guarantees . . . . . . . . . . . . . . . . . . . . . . . . . . . . . . . . . . . S-141% Clean-up Call . . . . . . . . . . . . . . . . . . . . . . . . . . . . . . . S-14Residual Proceeds . . . . . . . . . . . . . . . . . . . . . . . . . . . . . . . S-14
Prepayment and Yield Analysis . . . . . . . . . . . . . . . . . . . . . . . . . . S-14General . . . . . . . . . . . . . . . . . . . . . . . . . . . . . . . . . . . . . S-14Prepayment and Weighted Average Life Considerations . . . . . . . . . S-16Declining Balances Table . . . . . . . . . . . . . . . . . . . . . . . . . . S-20Yield Tables . . . . . . . . . . . . . . . . . . . . . . . . . . . . . . . . . . S-29
Final Payment Dates . . . . . . . . . . . . . . . . . . . . . . . . . . . . . . . . S-33Certain Federal Income Tax Consequences . . . . . . . . . . . . . . . . . . . S-33
General . . . . . . . . . . . . . . . . . . . . . . . . . . . . . . . . . . . . . S-33Regular Classes . . . . . . . . . . . . . . . . . . . . . . . . . . . . . . . . S-33Residual Classes. . . . . . . . . . . . . . . . . . . . . . . . . . . . . . . . S-34MACR Classes . . . . . . . . . . . . . . . . . . . . . . . . . . . . . . . . S-34
ERISA Considerations . . . . . . . . . . . . . . . . . . . . . . . . . . . . . . . S-34Accounting Considerations . . . . . . . . . . . . . . . . . . . . . . . . . . . . S-35Legal Investment Considerations . . . . . . . . . . . . . . . . . . . . . . . . . S-35Plan of Distribution . . . . . . . . . . . . . . . . . . . . . . . . . . . . . . . . . S-35Legal Matters . . . . . . . . . . . . . . . . . . . . . . . . . . . . . . . . . . . . S-35Appendix A — Available Combinations — Series 4061 . . . . . . . . . . . A-1Appendix B — Balances Schedules . . . . . . . . . . . . . . . . . . . . . . . B-1Exhibit I — Series 3738 Front Cover, Terms Sheet and MACR Table . . . I-1Exhibit II — Series 3751 Front Cover, Terms Sheet and MACR Table. . . II-1Exhibit III — Series 3754 Front Cover, Terms Sheet and MACR Table . . III-1Exhibit IV — Series 3782 Front Cover, Terms Sheet and MACR Table . . IV-1Exhibit V — Series 3796 Front Cover, Terms Sheet and MACR Table . . V-1Exhibit VI — Series 3981 Front Cover and Terms Sheet . . . . . . . . . . . VI-1Exhibit VII — Series 3997 Front Cover, Terms Sheet and MACR
Table . . . . . . . . . . . . . . . . . . . . . . . . . . . . . . . . . . . . . . . . VII-1
Offering CircularFreddie Mac . . . . . . . . . . . . . . . . . . . . . . . . . . . . . . . . . . . . . 3Additional Information . . . . . . . . . . . . . . . . . . . . . . . . . . . . . . . 6Summary . . . . . . . . . . . . . . . . . . . . . . . . . . . . . . . . . . . . . . . 8Risk Factors . . . . . . . . . . . . . . . . . . . . . . . . . . . . . . . . . . . . . 13Application of Proceeds . . . . . . . . . . . . . . . . . . . . . . . . . . . . . . 20Description of Certificates . . . . . . . . . . . . . . . . . . . . . . . . . . . . . 20MACR Certificates . . . . . . . . . . . . . . . . . . . . . . . . . . . . . . . . . 33Prepayment, Yield and Suitability Considerations . . . . . . . . . . . . . . . 33The Trust Agreement . . . . . . . . . . . . . . . . . . . . . . . . . . . . . . . . 40Certain Federal Income Tax Consequences . . . . . . . . . . . . . . . . . . . 44ERISA Considerations . . . . . . . . . . . . . . . . . . . . . . . . . . . . . . . 60Accounting Considerations . . . . . . . . . . . . . . . . . . . . . . . . . . . . 61Legal Investment Considerations . . . . . . . . . . . . . . . . . . . . . . . . . 61Plan of Distribution . . . . . . . . . . . . . . . . . . . . . . . . . . . . . . . . . 61Increase in Size . . . . . . . . . . . . . . . . . . . . . . . . . . . . . . . . . . . 62Appendix I — Index of Terms . . . . . . . . . . . . . . . . . . . . . . . . . . I-1Appendix II — Standard Definitions and Abbreviations for Classes . . . . II-1Appendix III — MACR Certificate Exchanges . . . . . . . . . . . . . . . . . III-1Appendix IV — Retail Class Principal Payments . . . . . . . . . . . . . . . IV-1Appendix V — Interest Rate Indices . . . . . . . . . . . . . . . . . . . . . . . V-1
$1,570,761,727
Freddie Mac
Multiclass Certificates,Series 4061
Goldman, Sachs & Co.
May 21, 2012