Embed Size (px)
Citation preview

Office of Developmental Programs
Provider Profiles
2019

2
Introduction
Welcome!
After much anticipation and planning, ODP is launching Online Provider Profiles as a key component of our efforts to continuously improve quality for individuals and families we support.
In this first phase, ODP’s Provider Profiles consist of two parts—a Provider Summary, generated by each Provider, and a Provider Data Display, produced by ODP and its partner, Temple’s Institute on Disabilities. Provider Profiles for 84 ODP Providers of Residential Services are included.
While one Provider Summary may be posted for each Provider, multiple Provider Data Displays may be generated for a Provider depending on the number of survey participants in the 2017 IM4Q Data File and their locations. Where a sufficient number of surveys are available, a Data Display may be generated comparing the Provider’s performance with performance across the State, the relevant region, and an Administrative Entity (AE). Similarly, if the Provider serves primarily one region, but not any one AE, a comparison may be generated showing the Provider’s performance compared to the relevant region and the state. Over time, ODP plans to add additional data to each of these Provider Profiles. We also plan to post Provider Profiles for additional ODP Providers. We hope this effort assists individuals and families to make informed decisions when choosing Providers.
3
Table of Contents
Introduction ............................................................................................................................................................................................................................................. 2
Provider Profile Summary: A&E Home Care ............................................................................................................................................................................................ 9
Provider Profile Summary: Abilities Behavioral Health LLC ................................................................................................................................................................... 10
Provider Profile Summary: Access Services ........................................................................................................................................................................................... 11
Provider Profile Summary: ACHIEVA ...................................................................................................................................................................................................... 13
Provider Profile Summary: Adult Enrichment (Accessing Independence) ............................................................................................................................................. 16
Provider Profile Summary: Advocates Outreach, Inc............................................................................................................................................................................. 17
Provider Profile Summary: Alleghenies Unlimited Care Providers, Inc. ................................................................................................................................................ 18
Provider Profile Summary: Allied Health Care Services ......................................................................................................................................................................... 19
Provider Profile Summary: Allied Services/Burnley Workshop of the Poconos .................................................................................................................................... 22
Provider Profile Summary: Alternative Living Concepts ........................................................................................................................................................................ 23
Provider Profile Summary: Amada Senior Care Central PA ................................................................................................................................................................... 24
Provider Profile Summary: AMA Support Services ................................................................................................................................................................................ 25
Provider Profile Summary: Apex Healthcare Services LLC ..................................................................................................................................................................... 26
Provider Profile Summary: Arc Human Services .................................................................................................................................................................................... 27
Provider Profile Summary: Atlas Home Care Services LLC ..................................................................................................................................................................... 30
Provider Profile Summary: Austin's Place .............................................................................................................................................................................................. 31
Provider Profile Summary: Autism Diagnostic Evaluations Resources Services (ADERS) ...................................................................................................................... 32
Provider Profile Summary: Avenues ...................................................................................................................................................................................................... 33
Provider Profile Summary: BARC Developmental Services .................................................................................................................................................................... 34
Provider Profile Summary: Beaver County Rehabilitation Center ......................................................................................................................................................... 37
Provider Profile Summary: Better Home Care Agency LLC .................................................................................................................................................................... 38
Provider Profile Summary: Binty Nurses Inc. ......................................................................................................................................................................................... 39
Provider Profile Summary: Bradley Biedermann (Music Therapy Services) .......................................................................................................................................... 40
Provider Profile Summary: Brian's House .............................................................................................................................................................................................. 41

4
Provider Profile Summary: Bucks County Transport, Inc. ...................................................................................................................................................................... 44
Provider Profile Summary: Cambria Residential Services ...................................................................................................................................................................... 45
Provider Profile Summary: CareLink Community Support Services, Inc ................................................................................................................................................ 47
Provider Profile Summary: Cares of Western PA (C.A.R.E.S) ................................................................................................................................................................. 48
Provider Profile Summary: Casmir Care Services Inc ............................................................................................................................................................................. 49
Provider Profile Summary: Chadds Ford Alternacare ............................................................................................................................................................................ 50
Provider Profile Summary: Child Guidance Resource Centers, Inc ........................................................................................................................................................ 51
Provider Profile Summary: Children and Adult Disability and Educational Services ............................................................................................................................. 52
Provider Profile Summary: Citizen Care ................................................................................................................................................................................................. 55
Provider Profile Summary: Clarion Vocational Services ........................................................................................................................................................................ 56
Provider Profile Summary: COMHAR ..................................................................................................................................................................................................... 59
Provider Profile Summary: Community Interactions ............................................................................................................................................................................. 62
Provider Profile Summary: Community Links ........................................................................................................................................................................................ 65
Provider Profile Summary: Community Living and Support Services (CLASS) ....................................................................................................................................... 66
Provider Profile Summary: Community Living Care ............................................................................................................................................................................... 68
Provider Profile Summary: Community Options.................................................................................................................................................................................... 71
Provider Profile Summary: Community Services Group ........................................................................................................................................................................ 75
Provider Profile Summary: Compass Rose Care, Ltd ............................................................................................................................................................................. 79
Provider Profile Summary: Continuum Pediatrics ................................................................................................................................................................................. 80
Provider Profile Summary: Creating Unlimited Possibilities, Inc. .......................................................................................................................................................... 81
Provider Profile Summary: CROSS, Inc. .................................................................................................................................................................................................. 82
Provider Profile Summary: CT Home Care Services, LLC ........................................................................................................................................................................ 83
Provider Profile Summary: Delta Community Supports ........................................................................................................................................................................ 84
Provider Profile Summary: Developmental Enterprises Corporation (DEC) .......................................................................................................................................... 87
Provider Profile Summary: Developmental Fitness Company, LLC ....................................................................................................................................................... 89
Provider Profile Summary: Devereux ..................................................................................................................................................................................................... 90
Provider Profile Summary: Divine Supports Services, LLC ..................................................................................................................................................................... 95

5
Provider Profile Summary: Do Moore, LLC ............................................................................................................................................................................................ 96
Provider Profile Summary: Down to Earth Community Homes (DTE) ................................................................................................................................................... 97
Provider Profile Summary: Dr. Gertrude A. Barber Center .................................................................................................................................................................... 98
Provider Profile Summary: Eagle Valley Community Home Services .................................................................................................................................................. 102
Provider Profile Summary: Eastern Christian Children's Retreat (ECCR) ............................................................................................................................................. 103
Provider Profile Summary: Elwyn ........................................................................................................................................................................................................ 104
Provider Profile Summary: Emmaus Community of Pittsburgh, Inc .................................................................................................................................................... 108
Provider Profile Summary: Epic Health Services of PA LLC .................................................................................................................................................................. 109
Provider Profile Summary: Erie Homes for Children and Adults ......................................................................................................................................................... 110
Provider Profile Summary: Ewing House, LLC ...................................................................................................................................................................................... 113
Provider Profile Summary: Evergreen Homes ..................................................................................................................................................................................... 114
Provider Profile Summary: EXCENTIA .................................................................................................................................................................................................. 116
Provider Profile Summary: Excel Home Care ....................................................................................................................................................................................... 118
Provider Profile Summary: Faithful Homes LLC ................................................................................................................................................................................... 119
Provider Profile Summary: Family Care Services ................................................................................................................................................................................. 120
Provider Profile Summary: Fayette Resources .................................................................................................................................................................................... 121
Provider Profile Summary: Firely Adult Homes ................................................................................................................................................................................... 126
Provider Profile Summary: Fitzmaurice Community Services (FCS) .................................................................................................................................................... 127
Provider Profile Summary: Friendship Community ............................................................................................................................................................................. 128
Provider Profile Summary: Goodwill Industries of North Central PA .................................................................................................................................................. 130
Provider Profile Summary: Goodwill of the Southern Alleghenies ...................................................................................................................................................... 131
Provider Profile Summary: Growth Horizons ....................................................................................................................................................................................... 132
Provider Profile Summary: GSI Home Care Solutions LLC ................................................................................................................................................................... 136
Provider Profile Summary: Handi-Crafters, Inc. ................................................................................................................................................................................... 137
Provider Profile Summary: HAP Enterprises ........................................................................................................................................................................................ 138
Provider Profile Summary: Harmony Companion Home Care Inc ....................................................................................................................................................... 141
Provider Profile Summary: Helping Individuals Succeed (HIS) ............................................................................................................................................................ 142
6
Provider Profile Summary: Home Care Associates (HCA) .................................................................................................................................................................... 143
Provider Profile Summary: Home Nursing Agency (UPMC) ................................................................................................................................................................. 144
Provider Profile Summary: Home to Stay, Inc ..................................................................................................................................................................................... 145
Provider Profile Summary: HOPE Enterprises ...................................................................................................................................................................................... 146
Provider Profile Summary: Horizon House .......................................................................................................................................................................................... 150
Provider Profile Summary: Inclusive Employment Program (I.E.P) ..................................................................................................................................................... 153
Provider Profile Summary: Indian Creek Foundation .......................................................................................................................................................................... 154
Provider Profile Summary: Institute for Human Resources & Services ............................................................................................................................................... 157
Provider Profile Summary: Integrity Home Health .............................................................................................................................................................................. 159
Provider Profile Summary: Interim HealthCare of Pittsburgh, Inc....................................................................................................................................................... 160
Provider Profile Summary: InVision Customized Services ................................................................................................................................................................... 161
Provider Profile Summary: J-30 Solutions ............................................................................................................................................................................................ 163
Provider Profile Summary: Jennifer Menichini .................................................................................................................................................................................... 164
Provider Profile Summary: JEVS Human Services ................................................................................................................................................................................ 165
Provider Profile Summary: Just Life, Inc. ............................................................................................................................................................................................. 168
Provider Profile Summary: K&K Healthcare Services (KKHC) .............................................................................................................................................................. 169
Provider Profile Summary: Kabernet Assist, LLC .................................................................................................................................................................................. 170
Provider Profile Summary: Keller Wheelchair Lifts .............................................................................................................................................................................. 171
Provider Profile Summary: Kelsch Associates ...................................................................................................................................................................................... 172
Provider Profile Summary: KenCrest Services ..................................................................................................................................................................................... 174
Provider Profile Summary: Kensington Community Corporation for Individual Dignity (KenCCID) .................................................................................................... 180
Provider Profile Summary: Keystone Community Resources .............................................................................................................................................................. 182
Provider Profile Summary: Keystone Human Services ........................................................................................................................................................................ 185
Provider Profile Summary: King Family Enterprise .............................................................................................................................................................................. 192
Provider Profile Summary: Lakeshore Community Services ................................................................................................................................................................ 193
Provider Profile Summary: Landis Adult Day Services ......................................................................................................................................................................... 195
Provider Profile Summary: Laurel House ............................................................................................................................................................................................. 196

7
Provider Profile Summary: Lawrence County ARC .............................................................................................................................................................................. 198
Provider Profile Summary: LifePath ..................................................................................................................................................................................................... 200
Provider Profile Summary: Life’s New Beginning ................................................................................................................................................................................ 205
Provider Profile Summary: Lifesteps .................................................................................................................................................................................................... 206
Provider Profile Summary: Lifestyle Support Services ......................................................................................................................................................................... 208
Provider Profile Summary: Links to Everyday Lives ............................................................................................................................................................................. 210
Provider Profile Summary: Mainstay Life Services .............................................................................................................................................................................. 211
Provider Profile Summary: Maplewood Adult Day Center .................................................................................................................................................................. 214
Provider Profile Summary: Martha Lloyd Community Residential Facility .......................................................................................................................................... 215
Provider Profile Summary: McGuire Memorial ................................................................................................................................................................................... 218
Provider Profile Summary: Melmark ................................................................................................................................................................................................... 221
Provider Profile Summary: Merakey .................................................................................................................................................................................................... 223
Provider Profile Summary: Milestone Centers .................................................................................................................................................................................... 231
Provider Profile Summary: Mon Yough Community Services .............................................................................................................................................................. 234
Provider Profile Summary: National Mentor HealthCare .................................................................................................................................................................... 236
Provider Profile Summary: New Horizon Care Services ....................................................................................................................................................................... 238
Provider Profile Summary: Oak Manor ................................................................................................................................................................................................ 239
Provider Profile Summary: Overbrook Friedlander Programs ............................................................................................................................................................. 241
Provider Profile Summary: Passavant Memorial Homes Family of Services ....................................................................................................................................... 243
Provider Profile Summary: PATH ......................................................................................................................................................................................................... 247
Provider Profile Summary: Penn-Mar Human Services ....................................................................................................................................................................... 249
Provider Profile Summary: Person Directed Supports ......................................................................................................................................................................... 251
Provider Profile Summary: Pittsburgh Mercy Health System .............................................................................................................................................................. 253
Provider Profile Summary: Prospectus Berco ...................................................................................................................................................................................... 255
Provider Profile Summary: Resources for Human Development (RHD) .............................................................................................................................................. 257
Provider Profile Summary: Salvation Army .......................................................................................................................................................................................... 262
Provider Profile Summary: Shared Support ......................................................................................................................................................................................... 264

8
Provider Profile Summary: Skills of Central PA .................................................................................................................................................................................... 266
Provider Profile Summary: Southwinds ............................................................................................................................................................................................... 269
Provider Profile Summary: Spectrum Community Services ................................................................................................................................................................. 271
Provider Profile Summary: SPIN........................................................................................................................................................................................................... 273
Provider Profile Summary: St. Joseph's Center .................................................................................................................................................................................... 276
Provider Profile Summary: Step By Step .............................................................................................................................................................................................. 279
Provider Profile Summary: Strawberry Fields ...................................................................................................................................................................................... 285
Provider Profile Summary: Supportive Concepts for Families ............................................................................................................................................................. 287
Provider Profile Summary: The Arc of Clarion and Venango Counties Inc. ......................................................................................................................................... 292
Provider Profile Summary: The Arc of Butler County .......................................................................................................................................................................... 293
Provider Profile Summary: The Arc of Cumberland & Perry (CPARC) ................................................................................................................................................. 295
Provider Profile Summary: The Communities of Don Guanella and Divine Providence ..................................................................................................................... 298
Provider Profile Summary: The Cornerstone Agency of Pa Inc. .......................................................................................................................................................... 301
Provider Profile Summary: The ReDCo Group ..................................................................................................................................................................................... 302
Provider Profile Summary: Threshold Rehabilitation Services ............................................................................................................................................................ 306
Provider Profile Summary: Training Toward Self-Reliance .................................................................................................................................................................. 308
Provider Profile Summary: UNITED COMMUNITY INDEPENDENCE PROGRAMS................................................................................................................................. 310
Provider Profile Summary: Valley Special Needs Program .................................................................................................................................................................. 312
Provider Profile Summary: Verland ..................................................................................................................................................................................................... 315
Provider Profile Summary: Washington-Greene Alternative Residential Services .............................................................................................................................. 318
Provider Profile Summary: Weiblinger’s Residential Care ................................................................................................................................................................... 321
Provider Profile Summary: Wesley Family Services (Formerly Family Services of Western PA) ......................................................................................................... 323
Provider Profile Summary: Woods Services ......................................................................................................................................................................................... 326
9
Provider Profile Summary: A&E Home Care
A&E Home Care was created for the purpose of providing loving care to the daughter of the Co-founder. It is our mission to provide compassionate, competent,
respectful, altruistic, care to all clients, but particularly those with physical and intellectual disabilities. Our vision is to promote as much independence as possible,
regardless of limitations set by a diagnosis.
A&E is a 'non-traditional' Home Care Agency in that we are small and owned and operated by an RN with over 30 years of experience. Our values are simple.
Kindness. Caring. Responsibility. Trust. Honesty. Most importantly, Reliability. We at A&E Home Care understand the importance of 'showing up'. Families count
on us to be there and we understand how important that is.
A&E Home Care has been supporting people with intellectual disabilities and Autism since its inception in 2009. The owner of A&E Home Care has over 35 years
of experience serving people with intellectual disabilities and Autism.
A&E Home Care provides Home Health Aide, Personal Assistant, and Nursing Services in your home and at school. We can assist with every day care and activities
of daily living such as feeding, bathing, grooming, dressing, toileting, and respite care. We can also provide Nursing services such as medication administration,
enteral tube feedings, seizure management, and care to clients who have a tracheostomy, may be on a ventilator, or who may require non-invasive ventilation
such as BiPap or Cpap.
A&E Home Care provides services to people of all ages and needs. While our specialty is Pediatric special needs, we are also able to serve clients with complex
medical needs such as those who are on a ventilator and require Nurses with an additional skill level.
A&E Home Care recognizes that each person is an individual with different needs and goals. Many of our clients are nonverbal, which requires a specific skill set.
Our staff receive extensive training before providing care to the clients they serve. Whenever possible, new staff spend time with current staff who are familiar
with a client's particular needs. With new clients, staff will orient with parents, other caregivers, or school staff to gain insight into a client’s preferences, care
needs, and communication techniques.
We engage our clients by listening to them and their caregivers. We pay attention to their desires and goals, and follow the plan created to ensure consistency.
We support and engage families by being reliable, providing excellent care, following the plan of care and goals created for the client, and listening.
We are currently working on a project to improve employee compliance with regards to following deadlines for timely completion of ongoing trainings.
The staff and clients at A&E Home Care are like a family. Each client, family, and caregiver team are cohesive, and have reciprocal respect. We foster kindness,
open communication, honesty, and yes, Love.

10
Provider Profile Summary: Abilities Behavioral Health LLC
Our mission is to empower individuals to be as independent as possible in all areas of their life, and to encourage choice and self-direction. We believe that positive approaches promote growth and that natural support structures are necessary to maintain and support that growth.
We value informed choice and decision making, honesty, respect, and responsibility.
We have been supporting individuals with intellectual disabilities/autism for almost 5 years. Leadership has over 40 years of cumulative experience.
We offer Behavior Support, which is a clinical service that assists the individual and their team in learning how to decrease concerning or unwanted behaviors and increase positive or wanted behaviors. We also offer In-Home and Community Supports, which provides support to an individual in their home or out in the community to learn skills for daily living.
With Behavior Support services, we work specifically with individuals who have complex behavioral needs and psychological needs.
Staff become aware of any special communication needs through information found in the ISP and/or by communicating with an individual's natural supports and other team members. For individuals with more complex communication needs, we seek out trainings to assist us in learning/implementing communication plans.
In general, people are more engaged when they feel needed, wanted, or feel like they are producing/creating something of value. Individuals that we support have an endless number of skills and interests that can benefit their individual communities. As a support agency, it is our job to assist our individuals in discovering or developing those talents to facilitate increased and fulfilling community engagement.
Families are the framework on which our supports rest; they are a necessary piece to the puzzle for every individual with whom we work. When working with an individual, we try to work within the family system by continually communicating with the family and checking in, being flexible and adaptive, and being supportive of the family structure and routine.

11
Provider Profile Summary: Access Services www.accessservices.org
Our mission is to empower and serve people in need of specialized supports by providing innovative services that improve their ability to live fulfilling lives in the
community. Our philosophy of care values all people and their uniqueness. It emphasizes the whole person – physical, emotional, social and spiritual, as well as
focuses on the key helping relationships between staff and the people we serve.
Our core values inform our actions and guide us in our day-to-day relationships. Our core values are: integrity, leadership, innovation & change, commitment &
determination, passion for service, teamwork, results, excellence, stewardship, open communication, competence and love for each other.
We have been serving people since 1976.
We provide a number of community-based supports for individuals with Intellectual Disabilities and Autism. These services include In-Home Supports, an
individualized in-home care and support program for adults and children. Our day programs help adults with developmental disabilities develop functional skills
and discover their talents through volunteer work and engaging social activities. We provide housing through our community homes where special emphasis is
placed on community participation. Finally, we support individuals through our Host Family Program, including Lifesharing and Respite Services. Through these
programs, qualified host families welcome individuals into their homes and lives while offering support and guidance.
Access Services is uniquely qualified to provide support to individuals dually diagnosed with Intellectual Disability and Mental Health needs.
All staff are trained on the individualized communication needs for those they support.
Each of the services we provide for children and adults with Intellectual Disabilities and Autism have a special emphasis on community participation and personal
growth within the community. Through our Life Day Programs individuals volunteer alongside other members of the community on a regular basis in a variety of
settings including animal shelters and nature centers. Through In-Home Supports individuals are encouraged to pursue opportunities based on personal goals,
including volunteering and joining community centers such as the YMCA. Our Host Families integrate the individuals they support into their families, providing a
variety of opportunities.
We understand that all people need to have social relationships through which they can share their lives with others. These social relationships include the natural
family. Some ways we work to engage these families include regular phone calls, communication around advocacy and regular team meetings.
Access Services engages in a robust quality management process including data analysis, development of a quality management plan, and an IDD/A Quality Team.

12
Interpreting the Data
These data will allow you to compare the average response
from this provider to the average response from all people
sampled in the state, region, and AE (when applicable).
Some differences are less meaningful than others,
depending on things like the size of the sample and the range
of answers provided for that particular scale. “Confidence
intervals” are used to determine whether differences are
statistically significant, or meaningful. Confidence intervals
are reported in parentheses.
To determine whether the average score of the provider is
meaningfully different from the averages of the state,
region, or AE, you can look at whether these scores fall
outside or inside the provider’s confidence interval.
Meaningful differences are marked with an asterisk “*”.
Summary of Findings
• The provider scores significantly above average for the
state on Individual Inclusion
Provider Profiles Data Display: Access Services (Statewide) 2016-2017
Of the 5,328 individuals in the 2017 IM4Q data file, 20 individuals registered in Pennsylvania received residential services from Access. The data in this profile are
for the provider’s community-based residential services. This report presents the scale scores for the State of Pennsylvania and Access (Statewide). There must
be data for 10 or more individuals to meet our selection criteria for reporting. If the number of respondents for any item falls below 5, a dash (-) is shown. For all
of the scale scores, a higher score is better and the scores can range from 0 to 100. Confidence intervals for provider scores are given. Link to explanation of items
in scales is below.
* indicates meaningful difference
Link to explanation of the questions in each scale Above average marked by
SCALES State Access
Individual Satisfaction 85.87 86.25 (76.45 – 96.05)
Individual Choice 46.90 55.65 (42.87 – 68.43)
Individual Inclusion 43.72* 53.51 (44.93 – 62.10)
Individual Dignity 82.28 78.65 (71.08 – 86.21)
Physical Quality 96.92 95.37 (89.58 – 100.00)
Family Satisfaction 90.54 -
86
47 44
82
9791
86
56 54
79
95
0
20
40
60
80
100
120
SATISFACTION CHOICE INCLUSION DIGNITY PHYS QUAL FAM SAT
Scale Scores for State and Provider
State Access

13
Provider Profile Summary: ACHIEVA www.achieva.info
Mission: ACHIEVA supports and empowers individuals with disabilities and their families. Vision: ACHIEVA envisions a community where disability is a distinction
that makes no difference.
Respect: Respect, value and celebrate everyone. Change: Embrace and drive change toward innovation and inclusive practices. Ethics: Infuse integrity, ethics and
best practices in everything we do. Team: Inspire, challenge and support each other. Passion: Demonstrate passion about ACHIEVA’s mission and vision.
Formerly known as The Arc of Allegheny County, ACHIEVA began in 1951 by parents who wanted more for their children with a disability than placement in a state
institution.
ACHIEVA provides lifelong support services: ACHIEVA Family Trust- Planning for the future and enhancing lives through special needs trusts and social service
supports. Advocacy & Family Supports- Aiding in the navigation of educational, medical, government and adult service systems. Early Intervention- Providing a
Strong Start to children ages birth - three by our dedicated team of well-trained therapists. Employment Supports- Matching a job seekers’ skills and interests to
employment and community participation opportunities. Home & Residential Supports- Offering safe person-centered care in the home of one’s choice.
Recreation- Serving opportunities for fun and learning in a safe environment outside of the home. Representative payee- Granting peace of mind through a secure
approach to money management.
ACHIEVA is a leader in advocacy, high-quality inclusive supports, and innovations including customized employment supports and unique housing options.
Each staff person is required to become familiar with a person’s ISP and be trained and demonstrate proficiency in utilizing a person’s preferred mode of
communication.
Person-centered planning helps the people we support determine where they would like to live, work, and have fun, with support from ACHIEVA staff.
ACHIEVA offers families of children and adults with intellectual and developmental disabilities advocacy and family support services at no cost. Experienced
advocates, who are also family members of people with disabilities, provide individual advocacy and information about early intervention, special education,
housing, employment, government benefits, and long-term planning. Our advocates attend hundreds of meeting with families and school districts every year to
resolve educational issues. In addition, ACHIEVA distributes a weekly electronic newsletter to inform families about disability-related information and events.
ACHIEVA’s Quality Management Plan promotes opportunities for people to exercise self-direction, choice and control over their lives.
ACHIEVA has an exceptional corporate culture and is able to attract and retain strong leaders in the disability field.

14
Interpreting the Data
These data will allow you to compare the average response
from this provider to the average response from all people
sampled in the state, region, and AE (when applicable).
Some differences are less meaningful than others,
depending on things like the size of the sample and the range
of answers provided for that particular scale. “Confidence
intervals” are used to determine whether differences are
statistically significant, or meaningful. Confidence intervals
are reported in parentheses.
To determine whether the average score of the provider is
meaningfully different from the averages of the state,
region, or AE, you can look at whether these scores fall
outside or inside the provider’s confidence interval.
Meaningful differences are marked with an asterisk “*”.
Summary of Findings
• The provider scores significantly below average for the
state and region on Individual Dignity
• The provider scores significantly above average for the
state and region on Physical Quality
Provider Profiles Data Display: ACHIEVA (Statewide) 2016-2017
Of the 5,328 individuals in the 2017 IM4Q data file, 13 individuals registered in Pennsylvania received residential services from Achieva. The data in this profile are
for the provider’s community-based residential services. This report presents the scale scores for the State, the Western Region and Achieva (Statewide). There
must be data for 10 or more individuals to meet our selection criteria for reporting. If the number of respondents for any item falls below 5, a dash (-) is shown.
For all of the scale scores, a higher score is better and the scores can range from 0 to 100. Confidence intervals for provider scores are given. Link to explanation
of items in scales is below.
* indicates meaningful difference
Link to explanation of the questions in each scale Above average marked by
SCALES State West Achieva
Individual Satisfaction 85.87 85.05 90.83 (80.96 – 100.00)
Individual Choice 46.90 49.35 48.78 (42.63 – 54.92)
Individual Inclusion 43.72 43.58 47.69 (40.86 – 54.51)
Individual Dignity 82.28* 80.22* 74.17 (72.53 – 75.80)
Physical Quality 96.92* 97.13* 100.00 (100.00 – 100.00)
Family Satisfaction 90.54 91.79 -
86
47 44
82
9791
85
4944
80
979291
49 48
74
100
0
20
40
60
80
100
120
SATISFACTION CHOICE INCLUSION DIGNITY PHYS QUAL FAM SAT
Scale Scores for State, Region, Provider
State West Achieva

15
Interpreting the Data
These data will allow you to compare the average response
from this provider to the average response from all people
sampled in the state, region, and AE (when applicable).
Some differences are less meaningful than others,
depending on things like the size of the sample and the range
of answers provided for that particular scale. “Confidence
intervals” are used to determine whether differences are
statistically significant, or meaningful. Confidence intervals
are reported in parentheses.
To determine whether the average score of the provider is
meaningfully different from the averages of the state,
region, or AE, you can look at whether these scores fall
outside or inside the provider’s confidence interval.
Meaningful differences are marked with an asterisk “*”.
Summary of Findings
• The provider scores significantly below average for the
state and region on Individual Dignity
• The provider scores significantly above average for the
state, region and AE on Physical Quality
Provider Profiles Data Display: ACHIEVA (Allegheny AE) 2016-2017
Of the 5,328 individuals in the 2017 IM4Q data file, 12 individuals registered in Allegheny Administrative Entity received residential services from Achieva. The
data in this profile are for the provider’s community-based residential services. This report presents the scale scores for the State, the Western Region, Allegheny
AE and Achieva (Allegheny). There must be data for 10 or more individuals to meet our selection criteria for reporting. If the number of respondents for any item
falls below 5, a dash (-) is shown. For all of the scale scores, a higher score is better and the scores can range from 0 to 100. Confidence intervals for provider
scores are given. Link to explanation of items in scales is below.
* indicates meaningful difference
Link to explanation of the questions in each scale Above average marked by
SCALES State West Allegheny Achieva (Allegheny)
Individual Satisfaction 85.87 85.05 82.82 89.81 (79.00 – 100.00)
Individual Choice 46.90 49.35 46.36 49.77 (43.44 – 56.10)
Individual Inclusion 43.72 43.58 41.23 46.61 (39.50 – 53.72)
Individual Dignity 82.28* 80.22* 71.61 74.07 (72.26 – 75.89)
Physical Quality 96.92* 97.13* 97.86* 100.00 (100.00 – 100.00)
Family Satisfaction 90.54 91.79 80.03 -
86
47 44
82
9791
85
4944
80
9792
83
4641
72
98
80
90
50 47
74
100
0
20
40
60
80
100
120
SATISFACTION CHOICE INCLUSION DIGNITY PHYS QUAL FAM SAT
Scale Scores for State, Region, County, Provider
State West Allegheny Achieva (Allegheny)

16
Provider Profile Summary: Adult Enrichment (Accessing Independence) www.adultenrichment.com
Adult Enrichment (AE) is a Life Skills Day Program for adults with physical and/or intellectual disabilities. Our Mission is to provide personal care and support services for people with disabilities that enhance their independence and enrich their lives. We encourage people to find focus and use their gifts and talents in the community.
At AE we empower individuals with disabilities to make their own choices and decisions with the goal to control their own lives, heighten society’s consciousness about the potential that each of its citizens with a disability has, and to promote full inclusion of individuals with disabilities into all aspects of life and areas of our society.
AE was founded in 1965. At first, only offering Saturday recreational programming to individuals with cerebral palsy, AE now proudly provides programming 5 days a week to individuals with both physical and intellectual disabilities.
Our programming provides individuals opportunities to socialize, learn, share their gifts and talents, gain valuable life skills and explore their community. Activities are focused around each individual’s choices, interests and goals. Current areas of focus include: Socialization, Health & Wellness, Independent Living Skills, Arts, Music, Science, History, News, Volunteerism and Community Integration. Additionally, AE has a program Chorus that rehearses weekly and performs biannually.
All staff members undergo an extensive orientation process which reviews the needs of each individual that we serve; including communication needs. Non-verbal individuals will be communicated with by using adaptive technologies or methods. In addition to adaptive technologies and methods, interpretation services will be provided to further support non-English speakers and those who are deaf.
AE’s community-based programming is formulated around individual and group preferences. Staff assists individuals to identify these interests and then work collaboratively to find opportunities that meet these criteria. Adult Enrichment Staff provide supervision at a ratio of 1:3 in the community. Staff provides constant support and encouragement by observing and participating in each individual’s or group’s chosen activity.
In addition to our participants, it is important to us that families and caregivers also feel comfortable with the program being chosen. At AE, we do our best to ensure this by including family and caregivers in the enrollment and orientation process for new attendees. Additionally, we host various events throughout the year that enable family and caregivers the opportunity to see our program in action, all while being able to engage with program staff and their loved ones.
AE serves individuals ages 18 – 59 with an intellectual and/or physical disability. Individuals must be able to indicate choice, participate in programming, administer their own medications and make personal care needs known. While the activities offered as part of our programming experience build important skills and contribute to lifelong learning, the benefits of AE go much deeper. Above everything else, we are a community of friends who have fun together, support one another and share in each other’s challenges and triumphs!
17
Provider Profile Summary: Advocates Outreach, Inc.
AOI's mission is to advocate for individuals with intellectual disabilities. We will empower them towards independence through positive job experiences, stimulating life activities and daily life skills training, all striving towards the participant's personal goals in their everyday lives.
Our vision is making a positive difference in the lives of our participants allowing for and introducing experiences as they travel through their everyday life.
We have been serving people since March 2017.
AOI supports our participants in their homes and in the community by providing life skills lessons. Depending on the individual’s personal goals, we may teach them cooking or laundry skills, promote healthy living (food/exercise), personal growth (self-confidence), or hygiene skills. AOI also provides supported employment for those participants working in the community. We make sure they are successful at what they do and are treated with respect. For those that desire a job in the community, we also provide a service called Job Finding. We learn about their skills and interests and try to match a job that best fits that person. This might include creating a resume, providing a role play interview, researching jobs in their area of interest, and selecting an option for possible employment.
AOI communicates directly to the participant to make a plan for the day’s goals. We are also in verbal contact with most parents as they are very involved in their child's life, setting schedules, and helping to plan the time.
We vocally communicate with them to make a plan for the day or at the end of time together, a new plan might be discussed for the following week. Our guys have choices of which we try to offer many for their time with us so that their day ends successfully.
We openly communicate via face to face, phone, or text.
Quality improvement projects: Develop and support qualified staff. Provide training to staff throughout the year. Promote health, wellness and safety for our participants. Seek more stable and supportive employment for those currently employed and for those desiring employment, provide job finding to fulfill that need.
AOI is dedicated to helping our participants, find success, and to support their families however we can.

18
Provider Profile Summary: Alleghenies Unlimited Care Providers, Inc. www.alucp.org
Mission statement and philosophy: 'Helping people live independently every day with quality care'. The goal of Alleghenies Unlimited Care Providers is to assist individuals with disabilities in meeting basic needs, enhancing quality of life, and promoting independence, while also allowing individuals to be an active participant in decision making and direction of service.
Guiding values: Consumer Choice and Individual Empowerment, Quality Care and Exceeding Expectations, Community Inclusion and Collaboration, Promoting Respect and Dignity, Transparency in Design and Delivery.
For over 60 years, Alleghenies Unlimited Care Providers (AUCP) has helped to enhance the quality of life and promote independence for individuals of all abilities.
Alleghenies Unlimited Care Providers offers Home and Community supports services, group living arrangements, and accessible transportation.
Alleghenies Unlimited Care Providers has extensive experience providing services and programming to individuals with any disability throughout a broad geographic region.
All staff receive extensive training in each individual ISP or Individual person-centered plan.
Community integration is an essential component of all programs and activities are designed around individual preferences.
Families are encouraged to be heavily involved in the lives of the individuals we support. In addition to regular phone contact and visits, families also receive annual surveys regarding satisfaction.
Current critical areas of focus for AUCP quality improvement: measure effectiveness of service delivery and quality assurance for both the individuals served and for the administration of services provided • Consumer Satisfaction and Consumer Complaint Management • Critical Incident, Risk Management, and Risk Mitigation • Staff Training • Recruitment and retention of qualified staff • Regulation Compliance.
Alleghenies Unlimited Care Providers approach to service delivery has been guided by the shared vision of consumers, Board of Directors, and AUCP staff to meet the goals of continuity, quality service, accessibility, independence, and community inclusion for all individuals.

19
Provider Profile Summary: Allied Health Care Services www.allied-services.org
Allied Services is a leading provider of healthcare and human services for Northeastern Pennsylvanians with disabilities and chronic illness. Our mission is to provide
comprehensive care in a responsible manner and to be continuously recognized for our superior quality, safety, service and innovation. Our approach is a hands-
on people-oriented style which places the physical and emotional needs of those in our care at the center of all we do. Specific to the Vocational Division, it is our
goal to make every effort to help all of our consumers reach their maximum vocational potential. In accordance with ODP’s mission, along with the principles of
Everyday Lives.
Allied Services is committed to the people of our community, to help them overcome challenges and reach their greatest potential by providing quality care,
people-oriented-service and comfort. The values that help us achieve that are Everyday Lives: Values in Action. Included in these values are Control, Choice,
Freedom, Success, Employment/Meaningful Contribution, Individuality, and advocacy. Some other values that are followed when providing support to individuals
are Transparency, Excellence, accountability and Collaboration. Allied Services has been supporting individuals with disabilities for over 59 years.
Allied Services offers an array of services that includes vocational training/community participation support, community employment, small group employment,
residential, community living, behavioral health, and other healthcare services. In the vocational training program, individuals are provided with a pleasant work
environment that strives for meaningful employment opportunities. Individuals are given the choice of participating in the community participation support
program which supports their involvement within the community. Staff support individuals with making the connection with places of interest to them such as
libraries, volunteer work etc. Once an individual obtains community employment, Allied services provides long term support for the individual to secure and
maintain a competitive job. Small group services are offered in custodial and landscaping settings. This service is designed to train individuals on relative skills in
these professions. In the area of residential services, Allied offers both community living with support and supervision of staff, along with residential living for
individuals with complex medical/behavioral needs. Behavioral health services include both residential and outpatient services.
Our areas of expertise include Vocational, Community Participation Support, small group employment, Residential. Community Living, Behavioral Health and
Autism Services. We would ensure that staff are trained on all means of communication in accordance to their ISP.
We network with local organizations that offer opportunities of growth for our individuals. The resources we locate, such as libraries, businesses, volunteer centers,
and recreational centers are a building piece to ensure that our individuals develop comfort when interacting with others who do not have disabilities. Gaining
independence through life-skill experiences within the community allows for preparation of possible work opportunities.
Allied Health Care Services promotes open communication with the families of those we support. Allied welcomes family members and other support team
members to tour our facility and meet our staff.
Our Quality Plan identifies select areas to measure consumer satisfaction along with ensuring our quality of services.

20
Interpreting the Data
These data will allow you to compare the average response
from this provider to the average response from all people
sampled in the state, region, and AE (when applicable).
Some differences are less meaningful than others,
depending on things like the size of the sample and the range
of answers provided for that particular scale. “Confidence
intervals” are used to determine whether differences are
statistically significant, or meaningful. Confidence intervals
are reported in parentheses.
To determine whether the average score of the provider is
meaningfully different from the averages of the state,
region, or AE, you can look at whether these scores fall
outside or inside the provider’s confidence interval.
Meaningful differences are marked with an asterisk “*”.
Summary of Findings
• The provider scores significantly below average for the
state and region on Individual Choice
• The provider scores significantly below average for the
state and region on Individual Inclusion
• The provider scores significantly above average for the
state and region on Physical Quality
Provider Profiles Data Display: Allied Health Care Services (Statewide) 2016-2017
Of the 5,328 individuals in the 2017 IM4Q data file, 28 individuals registered in Pennsylvania received residential services from Allied Services. The data in this
profile are for the provider’s private ICF 16+ and community-based residential services. This report presents the scale scores for the State, the Northeast Region
and Allied Services (Statewide). There must be data for 10 or more individuals to meet our selection criteria for reporting. If the number of respondents for any
item falls below 5, a dash (-) is shown. For all of the scale scores, a higher score is better and the scores can range from 0 to 100. Confidence intervals for provider
scores are given. Link to explanation of items in scales is below.
* indicates meaningful difference
Link to explanation of the questions in each scale Above average marked by
SCALES State NE Allied Services
Individual Satisfaction 85.87 89.11 92.14 (82.69 – 100.00)
Individual Choice 46.90* 54.66* 40.02 (33.67 – 46.38)
Individual Inclusion 43.72* 48.05* 35.81 (28.92 – 42.71)
Individual Dignity 82.28 88.82 86.22 (77.67 – 94.76)
Physical Quality 96.92* 96.97* 100.00 (100.00 – 100.00)
Family Satisfaction 90.54 92.50 -
86
47 44
82
979189
5548
8997 9392
40 36
86
100
0
20
40
60
80
100
120
SATISFACTION CHOICE INCLUSION DIGNITY PHYS QUAL FAM SAT
Scale Scores for State, Region, Provider
State NE Allied Services
21
Interpreting the Data
These data will allow you to compare the average response
from this provider to the average response from all people
sampled in the state, region, and AE (when applicable).
Some differences are less meaningful than others,
depending on things like the size of the sample and the range
of answers provided for that particular scale. “Confidence
intervals” are used to determine whether differences are
statistically significant, or meaningful. Confidence intervals
are reported in parentheses.
To determine whether the average score of the provider is
meaningfully different from the averages of the state,
region, or AE, you can look at whether these scores fall
outside or inside the provider’s confidence interval.
Meaningful differences are marked with an asterisk “*”.
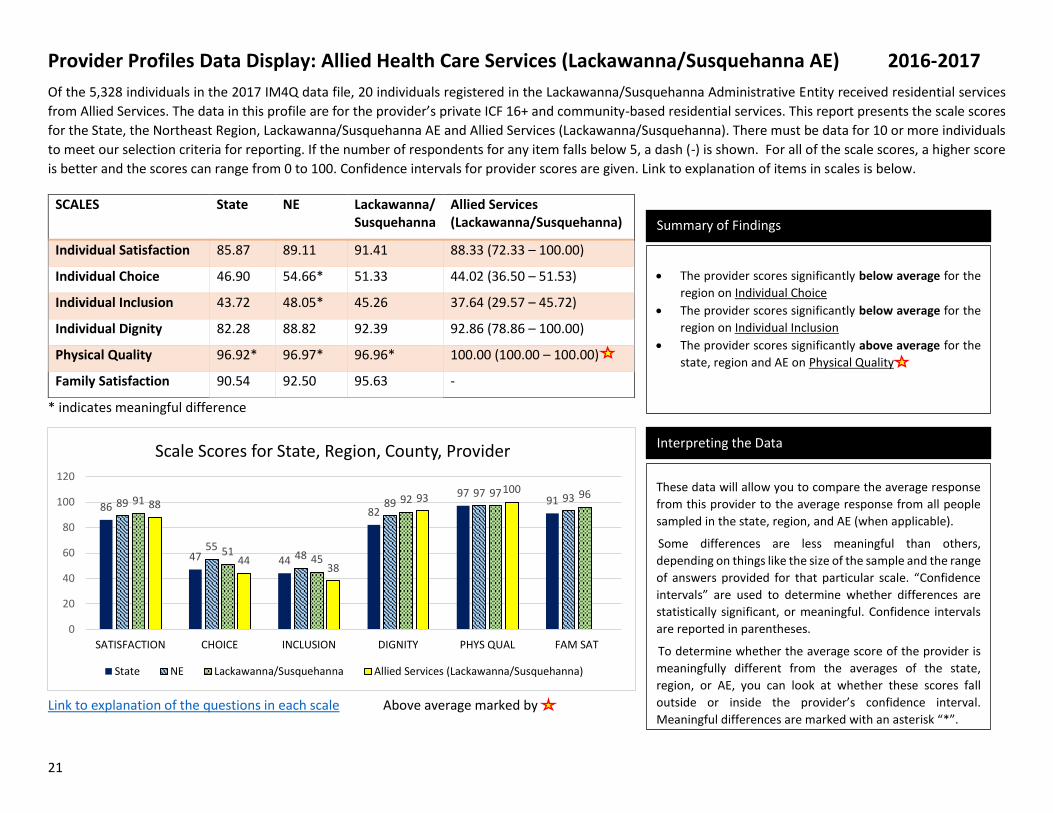
Summary of Findings
• The provider scores significantly below average for the
region on Individual Choice
• The provider scores significantly below average for the
region on Individual Inclusion
• The provider scores significantly above average for the
state, region and AE on Physical Quality
Provider Profiles Data Display: Allied Health Care Services (Lackawanna/Susquehanna AE) 2016-2017
Of the 5,328 individuals in the 2017 IM4Q data file, 20 individuals registered in the Lackawanna/Susquehanna Administrative Entity received residential services
from Allied Services. The data in this profile are for the provider’s private ICF 16+ and community-based residential services. This report presents the scale scores
for the State, the Northeast Region, Lackawanna/Susquehanna AE and Allied Services (Lackawanna/Susquehanna). There must be data for 10 or more individuals
to meet our selection criteria for reporting. If the number of respondents for any item falls below 5, a dash (-) is shown. For all of the scale scores, a higher score
is better and the scores can range from 0 to 100. Confidence intervals for provider scores are given. Link to explanation of items in scales is below.
* indicates meaningful difference
Link to explanation of the questions in each scale Above average marked by
SCALES State NE Lackawanna/ Susquehanna
Allied Services (Lackawanna/Susquehanna)
Individual Satisfaction 85.87 89.11 91.41 88.33 (72.33 – 100.00)
Individual Choice 46.90 54.66* 51.33 44.02 (36.50 – 51.53)
Individual Inclusion 43.72 48.05* 45.26 37.64 (29.57 – 45.72)
Individual Dignity 82.28 88.82 92.39 92.86 (78.86 – 100.00)
Physical Quality 96.92* 96.97* 96.96* 100.00 (100.00 – 100.00)
Family Satisfaction 90.54 92.50 95.63 -
86
47 44
82
979189
5548
8997 9391
5145
9297 96
88
4438
93100
0
20
40
60
80
100
120
SATISFACTION CHOICE INCLUSION DIGNITY PHYS QUAL FAM SAT
Scale Scores for State, Region, County, Provider
State NE Lackawanna/Susquehanna Allied Services (Lackawanna/Susquehanna)

22
Provider Profile Summary: Allied Services/Burnley Workshop of the Poconos www.allied-services.org
Burnley is organized for charitable and educational purposes, and to carry out programs of habilitation or rehabilitation for adults with disabilities. The program furthers community integration and empowers participants to achieve the fullest physical, mental, social, vocational, and economic development possible, including but not limited to employment, employment training, occupational advice, and placement.
Burnley’s guiding value is to provide the highest quality of service to adults with disabilities.
We have been serving people since 1964.
We offer Community Participation Support for the individuals in order to achieve community integration.
Our area of expertise is Community Participation Support, while offering full time employment Behavioral support needs.
We are a small program that can give all individuals the attention they need and deserve on a daily basis. Our direct support professionals work side by side with the individuals we serve, and we have an open dialogue with all.
The individuals that choose to be in the community are given choices every day on where they would like to go in the community. We bring them to malls, movies, parks, fishing, museums, nature preserves, local government facilities, volunteer opportunities, shopping, libraries, hobby shops, escape rooms, walking trails, bowling, etc.
Families are engaged through open dialogue, meetings, conversations, and phone calls.
We continue to improve community participation through asking the individuals who don't participate in Community Participation Services (CPS) several times per year, and making sure they have the same opportunities everyone else has.
We serve adults with intellectual disabilities here in the CPS program. We also serve adults with disabilities in the community with contracts we hold with local, state, and federal government agencies.
23
Provider Profile Summary: Alternative Living Concepts www.alternativelivingc.com
Alternative Living Concepts’ mission is to provide a comfortable and safe residential haven for adults with intellectual disabilities. Our goal is to treat all residents with dignity and respect. Alternative Living Concepts will provide an atmosphere that promotes growth and opportunity, to enhance each individual’s quality of life. Alternative Living Concepts believes that each individual has a divine purpose in life. By providing compassionate partnerships with individuals and their families, they will have the opportunity to experience all aspects of life, while realizing their own gifts and virtues to share with the world.
Alternative Living Concepts has been serving people for almost 4 years.
Alternative Living Concepts offers Community Residential group home—A group home serving individuals, 18 and older with an intellectual disability.
The staff must be trained on the ISP before working with the individuals. This ensures that the staff is knowledgeable in the individuals’ needs, wants, and preferences, as well as safety and health, and the method of communication that is used. This ensures the staff can effectively communicate with the people they support, while delivering quality care to support them.
Individuals are offered various community integration opportunities including, but not limited to, dining out, gyms and club houses, movies, community dances, church, etc.
ALC has an open-door policy, in which families are welcomed at any time. In addition, families are invited to various events, including but not limited to, holiday dances, dinners, community events, etc. In addition, families are part of the planning team of the individual, if willing to be. This ensures that families remain current with information pertaining to their individual we are serving.
We are currently working on getting the parking lot paved as an improvement project.

24
Provider Profile Summary: Amada Senior Care Central PA (Happy Helpers) www.amadaseniorcare.com
Amada’s Mission is to enrich the lives of the people we serve and their families by creating opportunities for choice, independence, and happiness within their community.
Amada’s guiding value is to become the leader in innovative care by creating customized person-centered support through teamwork, respect for others, and positive attitude.
Amada has over 4 years of experience as a company, and staff experience of more than 20 years.
Amada offers Companion Care which provides supervision and assistance focused on health and safety of the individual. Limited to 24 hours per day per individual, based on approval by the service coordinator.
When a need for communication assistance is identified, the individual will be provided with an opportunity to request the type of communication assistance of their choice, and primary consideration will be given to the choice expressed by the individual.
Each individual has the opportunity to direct their own community engagement plan which will be supported by our team of staff.
We work with families to engage them in the process, helping to provide support while giving each individual choice to direct their lives and achieve fulfillment and purpose.

25
Provider Profile Summary: AMA Support Services www.amasupports.com
At AMA Support Services we envision a world where people with disabilities are not just included but are wholeheartedly embraced.
We believe that all people have the right to be safe, healthy, and happy, and that every person has the ability to learn, grow, and live life to its fullest capacity. We believe that all people have the right not only to make choices, but also to expect that others will respect and support those choices. We believe that everyone dreams, aspires and strives to achieve, and that citizens with disabilities are no exception. At AMA, these principles and values guide our decisions, define our organization’s character, and provide our company with strategic direction. The day to day actions of each AMA employee are shaped by our agency’s commitment to Choice, Safety, Individuality, Freedom, Equality, Accountability, Integrity, Honesty, and Transparency.
AMA Support Service has been supporting adults with Intellectual disabilities and autism since 2017.
We provide beautiful one and two-person homes in lovely neighborhoods in the north and south hills of Pittsburgh. Our exceptionally trained professional caregivers strive to make sure that each person has a safe, happy and healthy day, every day. And because every person deserves to live a meaningful, engaged and fulfilling life, we also offer an array of other types of supports and services tailored to the unique needs, aspirations and desires of each person.
AMA Support Services specializes in serving people with unique challenges. Often, the men and women who choose AMA have had some previous unsuccessful placements or negative experiences with community living and are looking for a provider who will use a different, more flexible and more accepting approach.
We do not believe our purpose is to change, improve or mold a person by admitting them to a “program,” but to help them find and use their own inner strengths, desires and talents so they can live their best life every day. We believe that with enough time, patience, and love anyone can thrive.
We believe that citizens with disabilities deserve not just to reside, but also to belong in the communities where they work and live. Our outreach efforts help us engage community members and educate members of the public to further awareness not only of our agency’s services, but also the benefits of embracing people with disabilities in our culture.
Loved ones and families are central to building and sustaining a support system for those we serve. At AMA we strive to be the agency that WE would want for our own sons and daughters.
AMA Support Services is only as good as the care and service that each participant receives on a daily basis. Therefore, we are committed to continuous quality improvement. Our internal Quality and Performance Improvement team systematically assesses the effectiveness and efficiency of all services and departments on an ongoing basis, gathers stakeholder feedback, identifies areas for improvement, and collectively collaborates in efforts to make ongoing positive change.
26
Provider Profile Summary: Apex Healthcare Services LLC www.apexhealthcareservicesllc.com
The mission of Apex is to support Individuals with developmental disabilities to achieve greater independence and enhance their quality of life. Apex’s vision is to continue the quality services and supports delivered in a respectful, all-encompassing environment, to offer competent, evidence-based practice, and to extend our reach to all Individuals with developmental disabilities who need our services.
We value what is important to people with both physical and intellectual disabilities.
We have supported people since 2015.
We offer: In-Home & Community Supports, In-Home Respite Services, Shift Nursing, Transportation and Residential Habilitation.
Staff is trained on the consumer’s method of communication for effectiveness.
We engage people we support in the community through using auxiliary aides and reasonable accommodations to meet their needs.
We support families by listening to them and encouraging them to participate in the in planning of services for the participant.
We enjoy what we do.

27
Provider Profile Summary: Arc Human Services www.archumanservices.org
Our mission and vision is to serve people with Intellectual and Developmental Disabilities (IDD) and Mental Illness in a manner that allows them to fulfill their
ambitions, protect their rights, and foster meaningful relationships in life, becoming fully integrated members of the community.
Our guiding values: Listening to those we serve; Advocating for the protection of individual rights; A culture of honesty and transparency; Respecting and
recognizing our employees; and Pursuing community partnerships.
AHS has been providing services since 1952.
We offer: Community Residential Homes, Semi-Independent Living, Community Employment Services, and Transitional Services allowing students to move from
their childhood/school life to their adult/everyday life. Community Participation Services, Behavioral Supports, and In-Home programs assist our individuals in
making safe and appropriate choices. Mental Health Supportive Housing, Camp Laugh-a-lot, and Advocacy/Mentorship programs ensure individuals experience
their lives to the fullest.
Trauma Informed Care is used to assist individuals exposed to violence/victimization cope with these experiences. Advanced Supported Employment (Customized
Employment) builds upon an individual’s life experiences, preferences, interests, and routines in their lives to enable them to obtain meaningful employment.
Staff receives specialized training to gain a better understanding of our individuals’ specific communication skills, methods of expression, and needs. Up-to-date
technology is used as well as a variety of other communication tools – boards, pictures. Staff is trained on ‘SET Communication’ explaining communication is more
than just words; it is awareness of body language, voice tones and understanding surroundings when speaking.
We engage people in the community by participating in local events/activities; arts/crafts; drama shows; sports; summer swimming, and community field trips
(Pittsburgh Pirates, Zoo & Aquarium, Meadowcroft Village, Little Lake Theater, Planet Bounce, Community Awareness Day, etc.).
We support families through a variety of advocacy/educational programs. Providing materials assisting them to navigate the human services system ensuring their
loved ones receive the services/supports they need. Our Connecting Families Group meets monthly.
AHS has received grants from several organizations (Edith Trees, Richard King Mellon, Washington Financial Foundation, Northwest Savings Bank) allowing
facilities/technology modernization and the purchasing of new vehicles with modern accessibility enhancements to improve the quality of services.
We are the largest provider of IDD services based in Washington County and one that has a footprint throughout Western PA. AHS is uniquely positioned to ensure
that all of our individuals enjoy the highest quality of life. Firm proponents of the Everyday Lives initiative, we actively engage our individuals to achieve greater
independence, exercise significant choice, and discover exceptional opportunity in their lives. We find unique, creative ways to improve the services and supports
we offer to ensure we remain person-centered, effective, flexible, and innovative while enhancing the lives of those we serve.

28
Interpreting the Data
These data will allow you to compare the average response
from this provider to the average response from all people
sampled in the state, region, and AE (when applicable).
Some differences are less meaningful than others,
depending on things like the size of the sample and the range
of answers provided for that particular scale. “Confidence
intervals” are used to determine whether differences are
statistically significant, or meaningful. Confidence intervals
are reported in parentheses.
To determine whether the average score of the provider is
meaningfully different from the averages of the state,
region, or AE, you can look at whether these scores fall
outside or inside the provider’s confidence interval.
Meaningful differences are marked with an asterisk “*”.
Summary of Findings
• The provider scores significantly above average for the
state and region on Physical Quality
Provider Profiles Data Display: Arc Human Services (Statewide) 2016-2017
Of the 5,328 individuals in the 2017 IM4Q data file, 21 individuals registered in Pennsylvania received residential services from ARC Human Services. The data in
this profile are for the provider’s community-based residential services. This report presents the scale scores for the State, the Western Region and ARC Human
Services (Statewide). There must be data for 10 or more individuals to meet our selection criteria for reporting. If the number of respondents for any item falls
below 5, a dash (-) is shown. For all of the scale scores, a higher score is better and the scores can range from 0 to 100. Confidence intervals for provider scores
are given. Link to explanation of items in scales is below.
* indicates meaningful difference
Link to explanation of the questions in each scale Above average marked by
SCALES State West ARC Human Services
Individual Satisfaction 85.87 85.05 76.67 (63.10 – 90.24)
Individual Choice 46.90 49.35 45.49 (35.49 – 55.48)
Individual Inclusion 43.72 43.58 42.51 (36.06 – 48.95)
Individual Dignity 82.28 80.22 75.30 (66.89 – 83.71)
Physical Quality 96.92* 97.13* 100.00 (100.00 – 100.00)
Family Satisfaction 90.54 91.79 -
86
47 44
82
9791
85
4944
80
9792
77
45 43
75
100
0
20
40
60
80
100
120
SATISFACTION CHOICE INCLUSION DIGNITY PHYS QUAL FAM SAT
Scale Scores for State, Region, Provider
State West ARC Human Services

29
Interpreting the Data
These data will allow you to compare the average response
from this provider to the average response from all people
sampled in the state, region, and AE (when applicable).
Some differences are less meaningful than others,
depending on things like the size of the sample and the range
of answers provided for that particular scale. “Confidence
intervals” are used to determine whether differences are
statistically significant, or meaningful. Confidence intervals
are reported in parentheses.
To determine whether the average score of the provider is
meaningfully different from the averages of the state,
region, or AE, you can look at whether these scores fall
outside or inside the provider’s confidence interval.
Meaningful differences are marked with an asterisk “*”.
Summary of Findings
• The provider scores significantly below average for the
state and region on Individual Dignity
• The provider scores significantly above average for the
state, region and AE on Physical Quality
Provider Profiles Data Display: Arc Human Services (Allegheny AE) 2016-2017
Of the 5,328 individuals in the 2017 IM4Q data file, 13 individuals registered in Allegheny Administrative Entity received residential services from ARC Human
Services. The data in this profile are for the provider’s community-based residential services. This report presents the scale scores for the State, the Western
Region, Allegheny AE and ARC Human Services (Allegheny). There must be data for 10 or more individuals to meet our selection criteria for reporting. If the
number of respondents for any item falls below 5, a dash (-) is shown. For all of the scale scores, a higher score is better and the scores can range from 0 to 100.
Confidence intervals for provider scores are given. Link to explanation of items in scales is below.
* indicates meaningful difference
Link to explanation of the questions in each scale Above average marked by
SCALES State West Allegheny ARC Human Services (Allegheny)
Individual Satisfaction 85.87 85.05 82.82 77.41 (62.55 – 92.27)
Individual Choice 46.90 49.35 46.36 47.00 (34.22 – 59.77)
Individual Inclusion 43.72 43.58 41.23 38.29 (31.39 – 45.20)
Individual Dignity 82.28* 80.22* 71.61 68.06 (60.85 – 75.26)
Physical Quality 96.92* 97.13* 97.86* 100.00 (100.00 – 100.00)
Family Satisfaction 90.54 91.79 80.03 -
86
47 44
82
9791
85
4944
80
9792
83
4641
72
98
8077
4738
68
100
0
20
40
60
80
100
120
SATISFACTION CHOICE INCLUSION DIGNITY PHYS QUAL FAM SAT
Scale Scores for State, Region, County, Provider
State West Allegheny ARC Human Services (Allegheny)

30
Provider Profile Summary: Atlas Home Care Services LLC www.atlashomecareservices.com
At Atlas Home Care, our mission is to advance the quality of care and life of people with intellectual disabilities through care and empathy. We achieve this mission
by hiring hardworking, competent, trustworthy, and sympathetic caregivers, to assist our client in maintaining their independence and dignity in the comfort of
their homes.
Atlas Home Care guiding values are Quality, Stability, and safety.
Atlas Home Care has been serving people for three years.
Atlas Home Care offers Companionship, Home & Community Habilitation, Homemaker/Chores, Respite in Home, Nursing, and Supported Employment Services.
Our area of expertise is Community Participation.
Atlas Home Care ensures staff can effectively communicate with people they support through following the guidelines on the individual's Service Plan (ISP).
Atlas Home Care Services engages the individuals we serve, by taking them out in the community and helping them to attend different activities of their choice.
All care plans are discussed with the families and we get them involved also. And the quality of the individual's progression is valued together with the family.
Quality improvement projects: Making sure that all our individuals maintain a quality standard of living and in a safe environment at all times.
We are a Compassionate Agency with the capability of sustaining and extending quality care services to all intellectually disabled individuals particularly in
Pennsylvania.

31
Provider Profile Summary: Austin's Place www.austinsplace.org
Austin's Place Mission is “To provide specialized, intensive, transitionally-focused training for young adults graduating from traditional school systems who are diagnosed with autism spectrum, developmental and intellectual disabilities and who are moderately to significantly “impaired.”
Our guiding values are Integrity and Customer focus - The best way to model effective work and social skills to our consumers is to embody these values in our own day to day operations. Therefore, the operation of Austin’s Place from admission and daily programming through community integration will be done with integrity, a focus on delivering quality instruction to all consumers, and courteous and timely service to families, community, and business partners.
Austin's Place has been serving people for 4 years.
Clients attending Austin’s Place participate in daily routines and training opportunities to develop optimal levels of independence, while still accounting for their own capacities and limitations. Programming incorporates the interests and strengths of clients so that there is true motivation on the part of clients to learn and progress. Instructional priorities are placed on developing independence in self-care, community engagement and developing usable vocational skills in future settings. We offer one-to-one staffing ratios, but also incorporate small group activities to encourage socialization. Austin’s Place 22-acre campus provides plenty of outdoor walking trails, an outdoor heated swimming pool, a therapeutic center, both indoor and outdoor basketball and an outdoor zip line. We have two full kitchens with plenty of opportunities for cooking activities, two high tech sensory rooms that offer both calming and stimulating sensory activities, and an extensive craft room.
Austin’s Place was started by the parents of a young adult born with multiple disabilities, so simply put--their child would have a safe place to go to each day to continue to refine the life skills necessary to become a contributing member in their local community. At Austin’s place we offer one-to-one and two-to-one staffing ratios to meet the behavioral and sensory needs of these specific types of learners who are often limited from effectively participating in traditional adult vocational support programs. We also offer one-to-one Enhanced Nursing Services for the more complex medical needs clients.
The majority of our non- verbal clients use iPads, eye-gazers and picture symbols to communicate. Many of them also use their own gestures. By offering a one- to-one staffing ratio, our nonverbal participants have the opportunity to get to know each staff member that works with them and are able to build a trust with them to encourage communication.
Due to the complex medical, sensory, and behavioral supports needed by the clients we serve, community participation is encouraged, but is often limited. We are adapting to each client’s needs and working with the local communities to have more meaningful community engagement opportunities for them.
We utilize daily communication logs, newsletters, and our official Facebook page regularly to share information and photos.

32
Provider Profile Summary: Autism Diagnostic Evaluations Resources Services (ADERS) www.adersinc.org
Our mission is to provide comprehensive diagnostics, evaluations, resources, and services to drive treatment and intervention planning to enrich the quality of life for individuals with autism spectrum disorder and their families across all domains. Autism Diagnostic Evaluations Resources & Services (ADERS, Inc.) is a nonprofit agency formed by four individuals with personal and professional experience with Autism Spectrum Disorders (ASD): a Board Certified Behavior Analyst and mother of a son with ASD; a Psychologist and mother of a son with ASD; a Master of Social Work and brother of a young man with ASD; and an Autism advocate with a Master’s of Education in curriculum and instruction. We started ADERS because we feel autism services in Central, PA should be more of a “one stop shop” for better early diagnosis, early intervention with Applied Behavior Analysis, IEP/ advocacy assistance, and adult services by certified professionals.
ADERS as an organization run by families with personal experience with Autism Spectrum Disorders (ASD). We value the provision of quality services. We are responsive to the communities we serve and we strive to uphold the consumer’s rights to safety, choice, and control of their lives.
Since forming in 2010 and beginning to provide services in 2013, ADERS has grown to 33 employees and 12 different services.
We provide the following services under the Adult Autism Waiver: Community Support, Systemic Skill Building, Vocational Services, Behavior Specialist, Family Living Provider, Assistive Technology, and Respite. Under the Consolidated and PFDS Waivers, we provide Behavioral Support Service. For children, we provide Applied Behavior Analysis (ABA) with Therapeutic Staff Support (TSS) and Behavior Specialist Consultant (BSC). ADERS is also able to provide diagnostic evaluations to determine whether or not your child has autism.
ADERS specializes in work with autism spectrum disorders (ASD).
Our staff communicate via the preferred method given to us by our families— e-mail, phone, or text. At ADERS we encourage our families to communicate with whichever mode they are most comfortable.
ADERS has a free monthly social group which is open to the public. We encourage our consumers to network with others so that they can build meaningful connections outside of our agency. We also regularly provide information on local events, advocacy, and happenings in the ASD/disability community in Central Pennsylvania via our social network pages.
Our staff work to build a trusting relationship with our consumers and their families in order to ensure the provision of the best services possible. We also offer several opportunities for consumers and families to participate in free social groups and community events as a way to network and find resources.
ADERS is expanding into a new location in the fall of 2019 which will offer more group activities, a clinic for ABA services and more space for consumers and community members to meet and collaborate!
33
Provider Profile Summary: Avenues www.avenuesofpa.org
Avenues provides quality services that enhance the lives of individuals with disabilities.
Our core values are ingrained in our culture and guide us in our day to day support of individuals and families. Our core values are honesty, integrity, compassion, efficiency, devotion, dedication, respect, sincerity, ethics, individuality, dignity, trustworthiness, dependability, appreciation, safety consciousness, morality, service orientation, and competency.
Avenues was founded as United Cerebral Palsy of Schuylkill County in 1952 by a group of parents lead by Mal Weaver Bartram.
We offer infants and children’s programs and services include Early Intervention and Summer Day Camp. Early Intervention services are available to children from birth to the day before their third birthday. Summer Day Camp provides access for children to socialize and grow throughout the summer in an environment where they have the opportunity to learn, play, and create in a group or on their own. The camp runs 10 weeks during the summer. Adult services and supports include a variety of options in varied settings. For individuals interested in vocational and employment services, we have many options available including Skill Development at one of our community work centers or retail outlets, Job Finding, Job Support and Supported Employment. Current community work centers include two locations in Pottsville and one location in Hazleton. Retail outlets are located in Pottsville, Valley View, and Shenandoah. For individuals not interested in vocational or employment services, we can offer individualized services based on needs in the community or at our PossAbilities locations. Current locations include East Side of Pottsville, West Side of Pottsville, Mahanoy City, Milton, and Hazleton. PossAbilities and Adult Day Activities, embodies the mission of Avenues by providing year-round day support designed specifically for adults of 18 years of age and older, with moderate to profound intellectual, developmental and/or physical disabilities. PossAbilities provides a variety of services based on an individual's specific needs and abilities. Other Adult services include Home and Community, Adult Socialization Recreation, and Transportation. For Older Adults, Eldercare Day Services is available in Lebanon, Palmyra, and Pottsville.
Employees of Avenues are required to be familiar with the ISPs of the individuals they support. Employees receive training to ensure proficiency in individuals’ preferred mode of communication.
Individuals are engaged in the community in a variety of ways. Avenues takes a person-centered approach to connect people and support the development of valued relationships.
Families are an integral part of Avenues success. Employees interact with families on a regular basis through phone calls and scheduled meetings. Family Forums have been used to disseminate information and provide opportunity to ask questions. Families’ satisfaction surveys are conducted on an annual basis.
Avenues Quality Management Plan focuses on continuous improvement in these four areas: Individual-Centered Services and Planning, Safety, Health, and Individual Satisfaction.
To become more familiar with Avenues, please visit our website or our Facebook page. Feel free to contact us with any questions.

34
Provider Profile Summary: BARC Developmental Services www.barcprograms.org
BARC Developmental Services (BARC) is a private, non-profit agency in Bucks County. BARC’s mission is to serve and advocate for people with intellectual disabilities
and autism. BARC offers Early Intervention, Vocational and Residential services in the least restrictive, most-inclusive manner that encourages independence and
community integration.
BARC’s support philosophy is based on the concept of Person-Centered Planning, which holds that all individuals are unique and should be treated with dignity
and respect, and that all people have the right to choose their own future (self-determination). BARC has provided quality supports to adults and children with
intellectual disabilities and autism since 1951.
Early Intervention Services are designed to build upon the natural learning that occurs in a child’s early years. Home-based services are provided for children from
birth through two years of age throughout the county by qualified therapists. Residential Services provides four levels of support for men and women. Placement
is based on the needs of each individual served. Programs include Community Living Arrangements (CLA), Intermediate Care Facilities (ICF), Life Sharing, and
Supported Living. The programs encourage and promote the development of independence, citizenship, and community participation.
Vocational Services offers several programs for adults in two modern facilities located in Warminster and Quakertown. Programs include a Workshop program,
Adult Training Facility (ATF), Seniors Program and a specialized program for adults with Autism Spectrum Disorder. For those who wish to participate, we offer
community outings as part of the various day programs. Staff who provide supports in the community complete specialized training to attain the required
certification.
The Residential Department includes a dedicated nursing team and care for individuals with various conditions such as: Cerebral Palsy, Down Syndrome, RETTs
syndrome, Fragile X and Alzheimer's / Dementia. We support individuals with complex medical needs including feeding tubes, oxygen, wound care and modified
diets. Collaboration with outside agencies, such as Philadelphia Coordinated Health Care (PCHC) and Bayada Home Health, ensures optimal medical care.
BARC is committed to hiring and retaining competent and compassionate associates. All associates that support an individual who communicates with any type of
limited verbal ability are oriented and trained in the individual's specific communication modes.
Individuals are encouraged to be active members of their communities. Some examples of community relationships include libraries, churches, social clubs,
vacation groups, volunteer efforts, cultural venues, and sporting events.
BARC endorses a team approach that encourages family involvement. Family members are invited to be members of Board of Director Advisory Committees that
meet monthly to share information pertinent to each department and process issues and concerns. A satisfaction survey is distributed to families annually.
Several licensing entities regularly inspect the programs and maintaining full licensure in the three program departments has provided BARC with a competitive
edge.
The agency invites you to view their website at www.barcprograms.org or visit their Facebook page for more details about their many programs, events and other
information.

35
Interpreting the Data
These data will allow you to compare the average response
from this provider to the average response from all people
sampled in the state, region, and AE (when applicable).
Some differences are less meaningful than others,
depending on things like the size of the sample and the range
of answers provided for that particular scale. “Confidence
intervals” are used to determine whether differences are
statistically significant, or meaningful. Confidence intervals
are reported in parentheses.
To determine whether the average score of the provider is
meaningfully different from the averages of the state,
region, or AE, you can look at whether these scores fall
outside or inside the provider’s confidence interval.
Meaningful differences are marked with an asterisk “*”.
Summary of Findings
• The provider scores significantly above average for the
state and region on Individual Satisfaction
• The provider scores significantly below average for the
state and region on Individual Choice
• The provider scores significantly below average for the
state on Individual Inclusion
• The provider scores significantly above average for the
state and region on Individual Dignity
• The provider scores significantly above average for the
state and region on Physical Quality
• The provider scores significantly above average for the
region on Family Satisfaction
Provider Profiles Data Display: BARC Developmental Services (Statewide) 2016-2017
Of the 5,328 individuals in the 2017 IM4Q data file, 20 individuals registered in Pennsylvania received residential services from BARC. The data in this profile are
for the provider’s community-based residential services. This report presents the scale scores for the State, the Southeast Region and BARC (Statewide). There
must be data for 10 or more individuals to meet our selection criteria for reporting. If the number of respondents for any item falls below 5, a dash (-) is shown.
For all of the scale scores, a higher score is better and the scores can range from 0 to 100. Confidence intervals for provider scores are given. Link to explanation
of items in scales is below.
* indicates meaningful difference
Link to explanation of the questions in each scale Above average marked by
SCALES State Southeast BARC
Individual Satisfaction 85.87* 82.83* 98.61 (95.89 – 100.00)
Individual Choice 46.90* 37.62* 32.21 (27.94 – 36.48)
Individual Inclusion 43.72* 39.99 37.32 (31.51 – 43.13)
Individual Dignity 82.28* 79.12* 93.75 (85.73 – 100.00)
Physical Quality 96.92* 96.57* 100.00 (100.00 – 100.00)
Family Satisfaction 90.54 87.82* 95.22 (89.87 – 100.00)
86
47 44
82
9791
83
38 40
79
9788
99
3237
94100
95
0
20
40
60
80
100
120
SATISFACTION CHOICE INCLUSION DIGNITY PHYS QUAL FAM SAT
Scale Scores for State, Region, Provider
State SE BARC
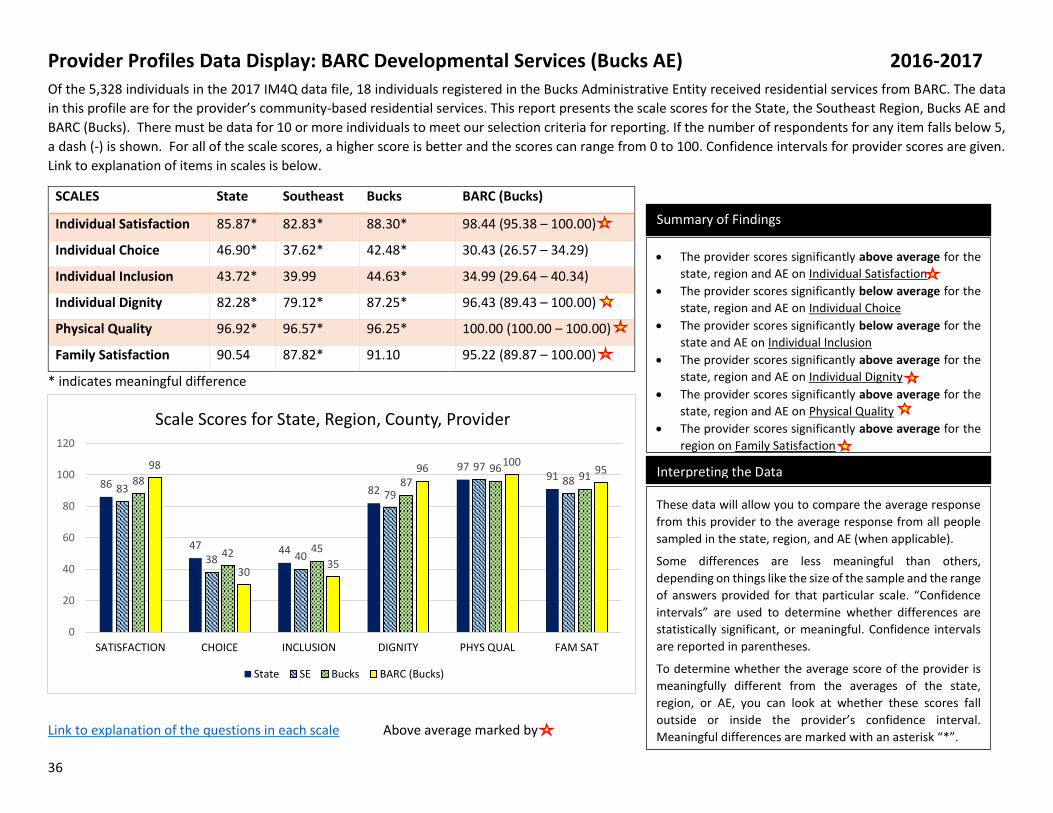
36
Interpreting the Data
These data will allow you to compare the average response
from this provider to the average response from all people
sampled in the state, region, and AE (when applicable).
Some differences are less meaningful than others,
depending on things like the size of the sample and the range
of answers provided for that particular scale. “Confidence
intervals” are used to determine whether differences are
statistically significant, or meaningful. Confidence intervals
are reported in parentheses.
To determine whether the average score of the provider is
meaningfully different from the averages of the state,
region, or AE, you can look at whether these scores fall
outside or inside the provider’s confidence interval.
Meaningful differences are marked with an asterisk “*”.
Summary of Findings
• The provider scores significantly above average for the
state, region and AE on Individual Satisfaction
• The provider scores significantly below average for the
state, region and AE on Individual Choice
• The provider scores significantly below average for the
state and AE on Individual Inclusion
• The provider scores significantly above average for the
state, region and AE on Individual Dignity
• The provider scores significantly above average for the
state, region and AE on Physical Quality
• The provider scores significantly above average for the
region on Family Satisfaction
Provider Profiles Data Display: BARC Developmental Services (Bucks AE) 2016-2017
Of the 5,328 individuals in the 2017 IM4Q data file, 18 individuals registered in the Bucks Administrative Entity received residential services from BARC. The data
in this profile are for the provider’s community-based residential services. This report presents the scale scores for the State, the Southeast Region, Bucks AE and
BARC (Bucks). There must be data for 10 or more individuals to meet our selection criteria for reporting. If the number of respondents for any item falls below 5,
a dash (-) is shown. For all of the scale scores, a higher score is better and the scores can range from 0 to 100. Confidence intervals for provider scores are given.
Link to explanation of items in scales is below.
* indicates meaningful difference
Link to explanation of the questions in each scale Above average marked by
SCALES State Southeast Bucks BARC (Bucks)
Individual Satisfaction 85.87* 82.83* 88.30* 98.44 (95.38 – 100.00)
Individual Choice 46.90* 37.62* 42.48* 30.43 (26.57 – 34.29)
Individual Inclusion 43.72* 39.99 44.63* 34.99 (29.64 – 40.34)
Individual Dignity 82.28* 79.12* 87.25* 96.43 (89.43 – 100.00)
Physical Quality 96.92* 96.57* 96.25* 100.00 (100.00 – 100.00)
Family Satisfaction 90.54 87.82* 91.10 95.22 (89.87 – 100.00)
86
47 44
82
9791
83
38 40
79
978888
42 45
8796
9198
3035
96100
95
0
20
40
60
80
100
120
SATISFACTION CHOICE INCLUSION DIGNITY PHYS QUAL FAM SAT
Scale Scores for State, Region, County, Provider
State SE Bucks BARC (Bucks)

37
Provider Profile Summary: Beaver County Rehabilitation Center (BCRC) www.bcrc.net
It is the mission of the Beaver County Rehabilitation Center, Inc. to provide the opportunity for growth and independence, while respecting the dignity and uniqueness of each individual. Our vision is to ensure that everyone has the opportunity to participate fully in employment and community life.
Our programs are guided by values of promoting growth and community membership through person-centered, strength-based, and innovative approaches. BCRC provides opportunity to experience growth and be part of something.
For over 57 years, BCRC has provided support to adults with intellectual disabilities.
BCRC offers habilitation, employment and mental health services. Employment services support individuals in finding and retaining competitive employment—Vocational Preparation, Small Group Employment, Mental Health Transformation, Community Employment, Supported Employment, Paid Work Training, Work-Ready. Community services provide community-based activities to assist in achieving independence and community membership—Community Participation, In-Home and Community Supports. Recovery services support individuals in developing skills and resources necessary to be successful in environments of their choosing—Psychiatric Rehabilitation, Peer Support. Youth services assist students in preparing for life after high school—School to Work Transition, Supported Education. BCRC also provides Benefits Counseling, Parent Coaching, Youth Advocate Programs (YAP), Youth/Young Adult Employment Training, and Agency with Choice.
BCRC provides services to help people with intellectual, developmental, psychiatric and co-occurring disabilities secure employment, work toward recovery, achieve increased independence, and participate in their communities. Services are customized to the unique needs and goals of each individual. Additional programming assists those transitioning after incarceration and to self-sufficiency, and individuals experiencing chronic homelessness.
BCRC interacts with each person through their preferred means of communication. Staff have been trained in sign language and we engage an interpreting agency for those who prefer to communicate in their native language.
BCRC supports over 500 people in accessing, enjoying, participating, and working in their communities through our Community Participation Support, Small Group Employment, In-Home and Community Supports, Supported Employment, and School to Work Transition programs. Participants are involved with activities including volunteering, touring businesses, utilizing public services, and developing social and recreational skills.
BCRC engages families through their preferred communication style including emails, phone calls, and face-to-face meetings. Families may suggest community experiences, provide meal preferences, and modify health status, etc. BCRC employs two certified parent coaches and a certified benefits counselor who are available to support families. Our AWC program partners with families in employing support service professionals, and ensures that supports are delivered as documented in the ISP.
BCRC operates under a QM Plan that is monitored regularly. In consideration of past performance, BCRC has elected to focus on Provider Capabilities, Participant Safeguards, Rights, Satisfaction, HR, and Information Management. Participant-centered and system-centered focus areas allow a comprehensive plan that ensures quality of care, and also that our agency’s overall functioning is efficient and effective.
38
Provider Profile Summary: Better Home Care Agency LLC www.betterhomecare.org/
Our goal at Better Home Care Agency LLC is simple, extraordinary product quality and customer service. We accomplish this by observing a common set of values and by partnering with organizations that have the finest reputation for quality. There are no shortcuts. we believe our goals are accomplished only with a real commitment from every employee.
Our primary goal is to live our mission statement and continue to perform as an industry leader. We believe that the only way to achieve this, is through hard work and commitment at all levels. Our desire as management is organizational and individual success. We are committed to achieving this success by acknowledging employees and clients as investors in our agency and treating them as such. Our values and beliefs require that we treat each employee fairly, with respect and not tolerate any discrimination of any kind. We encourage creative problem solving with an understanding how to avoid them in the future. We provide effective and efficient corrective action to resolve customer service issues, ensure complete customer satisfaction, and avoid recurrence of those issues. We strive to deliver competitive outstanding service to our consumers, and partner with vendors who share that goal. We make 'Do it Right the First Time' our team attitude to ensure continued satisfaction of our consumers and employees.
We have been serving people for seven years.
We offer companion services, home health aides, enhanced support of behavioral concerns, nursing, physical therapy, occupational therapy and speech therapy to individuals to help them live their everyday lives and remain in the community.
All of our staff are highly trained in the specialty that they are assigned. Our professional employees have earned degrees and/or licenses in their respective areas.
Each employee is oriented to the individual that they will be working with, to all of the nuances and individual needs that they have specifically detailed by their Individual Service Plan.
Our clients and coordinators speak often to ensure that the services they are receiving are the services that they need to remain in the community.
Our coordinators and supervisors touch base with the families of our clients on scheduled times to ensure the client and family are comfortable and happy with the services provided. The families are offered support for their roles in the lives of our consumers.
We quarterly check our client satisfaction and monitor the needs of our consumers that were not met. We strive to be a support for the consumer and their families. One example is that we have made changes in our phone answering system based on data collected, and now have changed from a mechanical answering message to a live person answering the phone.
Better Home Care is committed to helping you gain access to all of the home care services necessary to maintain your independence and comfort at home. The staff is committed to providing services to individuals whose medical needs can be treated effectively and safely in their homes, insuring continuity of professionally coordinated care, and offering services which meet the highest quality standards.
39
Provider Profile Summary: Binty Nurses Inc. www.bintynurses.com
Binty Nurses believes that aging and disabilities are part of the life process therefore, it is an individual right to receive the care and treatment they deserve in an ethical, and professional way. Binty Nurses Inc also believes in dedication to serve, satisfy and promote daily lives.
Binty Nurses guiding values are, to provide services with compassion, education, and dedication according to the individual's needs, and comply with federal, local, and state health requirements.
Binty Nurses has been serving people for over ten years.
We Provide services for individuals with Autism, Intellectual disabilities, and behavioral health problems, by providing experienced staff and other professionals whose sole purpose is to uplift the current condition of participants needing health care services. We also provide, Total Nursing Care, Home Care Services, Personal and In-home Support Services, Companion Services, Homecare Services, Respite 24-hours, Homemaker Chores, Home and Community Habilitation, Behavioral Health Rehab, Adult Community Residential Habilitation Services, and Adult Behavioral Services and Residential Services.
Binty Nurses areas of expertise include:
• Adult Residential Habilitation;
• Home Care Services;
• Home and Community Habilitation;
• Companionship.
We ensure staff can effectively communicate with people they support, by providing regular training on IDD/Autism, a daily documentation of services provided every shift, and everyday assessment by team leads.
People we support are engaged in the community through partnering with the individual, encouragement, constant reminders, assistance with problem-solving, and Build a connection.
Binty Nurses engages families by, encouraging parents, communicate, understanding and accepting parental ascendance through the stages of adjustment, empathize, and Respect.
Binty Nurses is working on Electronic data entering. We are planning to go digital instead paper record:
• To minimize errors from staff;
• For efficiency;
• For accuracy.
At Binty Nurse, it is our goal that the individuals who are in the community living arrangement homes, get the opportunity to live the fullest life possible. We want them to function as an active member of the community. The individuals that reside with us get the opportunity to participate in many community activities, such as local festivals, museums, aquariums, the zoo, and amusement parks. Community participation is essential to Binty Nurses. The individuals are part of everyday living, when it comes to living in the community, such as doing the grocery shopping for the house, cleaning the house, and decorating the home. We believe that skills are not only taught at a desk but also in the community. Community participation is an integral part of anyone’s life, and therefore, the individuals at Binty Nurses go on community outings at least once a week, and volunteer in the community when available.

40
Provider Profile Summary: Bradley Biedermann (Music Therapy Services)
Bradley Biedermann’s mission is to provide services for persons with intellectual disabilities to achieve greater independence & enhance quality of life. Our staff have board certification in Music Therapy and focus on music-based interventions for therapeutic growth.
Our service is based on individual’s choice, and developing each person’s individuality and success. Music therapy is used to support relationships, self-expression, successful involvement, relaxation, motivation, and creative responses to therapeutic needs.
We have been providing Music Therapy Services in the community since 1983.
Music therapy is an established health profession in which music is used within a therapeutic relationship to address the physical, emotional, cognitive, and social needs of individuals. Music therapy also provides avenues for communication that can be helpful to those who find it difficult to express themselves in words. (Description from the American Massage Therapy Association (AMTA))
Our agency works with individuals who have intellectual disabilities, autism, multiple disabilities, memory loss, behavioral issues, and other conditions.
Our staff use verbal and non-verbal means of communication. For non-verbal individuals, music therapy provides a context for social interaction and self-expression that does not require spoken language.
Music therapy is used to engage and motivate individuals of all ages, backgrounds, and levels of functioning.
Families are welcome to participate in the music therapy session. Sessions occur within the individual’s home.
Music therapy goals and objectives are used to focus and refine individual success within the music therapy environment. Individual preferences and responses are used to guide ongoing music therapy experiences.
Our music therapists are board-certified, with master’s level training.

41
Provider Profile Summary: Brian's House www.brianshouse.org
We provide an environment that embraces, enriches and empowers all people. Compassion, Empathy, Quality and Teamwork are our guiding values.
We have been supporting people since 1979.
We offer: Residential- we have 1, 2, 3, 4-person homes or apartments. We also do LifeSharing where we match an individual with a loving and nurturing family.
We also do day services, adult training facility, vocational program, community participation, supportive employment and transportation.
Our goal is to have everyone in the vocational program and the Adult training program who chooses to be involved in community participation go out at least 25%
of the time this fiscal year. We have had employment services for over 15 years. We also work with the Office of Vocational Rehabilitation to find jobs that meet
the needs and desires of our individuals. We have three program nurses that meet the medical needs of our residential individuals and we have been very successful
with transitioning individuals from campus-based settings to residential homes.
Of course, all of our staff read and understand each individual’s Individual support plan before they can work with any individual. We also have client profiles
which explain in more detail how to best work with an individual. This is where individual communication techniques would be described, whether or not the
person is verbal and what signs or motions mean for that individual. Some of our individuals have picture schedules to let them know what is coming up during
the day.
First, we offer community participation to everyone in our day services. Each individual is asked what kinds of activities they would like to learn about in the
community. During each activity we describe what tasks are involved to do certain jobs related to that activity. This will help them to decide what type of job they
may want when they are ready to work. In the residential homes they are involved in many recreational activities geared to each individual’s interests. Our clients
also go out to the community for haircuts and styles, doctor visits, grocery shopping, to get nails done, etc.
Families are welcome at our homes whenever the person that we serve would like them there. We do many tours for the families and consumers to see what we
do and encourage multiple visits to make sure that it is a good fit. We offer to transport our consumers for visits with family and also will offer to stay if needed
while the visits take place. Many of our homes have holiday parties where families are invited. Every year we have a recognition dinner dance for consumers, staff
and families to attend. We also encourage families to be involved in the ISP process for their loved one. Families are also welcome at doctors’ appointments.
We have been working for the last several years installing generators at all of our homes to avoid relocation to hotels during power outages from storms. We have
reduced relocations by more than 50%. Another goal is to provider community employment to all consumers that want to participate. We currently have about
33%.
We are an agency that plans for each individual according to their needs, desires and preferences. We are very committed to each individual's success. If a person
is having difficulty, we try to figure it out whether it is medical, environmental, and make changes where necessary.

42
Interpreting the Data
These data will allow you to compare the average response
from this provider to the average response from all people
sampled in the state, region, and AE (when applicable).
Some differences are less meaningful than others,
depending on things like the size of the sample and the range
of answers provided for that particular scale. “Confidence
intervals” are used to determine whether differences are
statistically significant, or meaningful. Confidence intervals
are reported in parentheses.
To determine whether the average score of the provider is
meaningfully different from the averages of the state,
region, or AE, you can look at whether these scores fall
outside or inside the provider’s confidence interval.
Meaningful differences are marked with an asterisk “*”.
Summary of Findings
• The provider scores significantly below average for the
state on Individual Choice
• The provider scores significantly above average for the
state and region on Physical Quality
• The provider scores significantly above average for the
state and region on Family Satisfaction
Provider Profiles Data Display: Brian's House (Statewide) 2016-2017
Of the 5,328 individuals in the 2017 IM4Q data file, 25 individuals registered in Pennsylvania received residential services from Brian’s House. The data in this
profile are for the provider’s community-based residential services. This report presents the scale scores for the State, the Southeast Region, and Brian’s House
(Statewide). There must be data for 10 or more individuals to meet our selection criteria for reporting. If the number of respondents for any item falls below 5, a
dash (-) is shown. For all of the scale scores, a higher score is better and the scores can range from 0 to 100. Confidence intervals for provider scores are given.
Link to explanation of items in scales is below.
* indicates meaningful difference
Link to explanation of the questions in each scale Above average marked by
SCALES State SE Brian’s House
Individual Satisfaction 85.87 82.83 79.38 (67.49 – 91.26)
Individual Choice 46.90* 37.62 33.54 (24.95 – 42.13)
Individual Inclusion 43.72 39.99 38.51 (33.21 – 43.80)
Individual Dignity 82.28 79.12 77.22 (70.19 – 84.25)
Physical Quality 96.92* 96.57* 100.00 (100.00 – 100.00)
Family Satisfaction 90.54* 87.82* 95.54 (91.34 – 99.73)
86
47 44
82
9791
83
38 40
79
9788
79
3439
77
10096
0
20
40
60
80
100
120
SATISFACTION CHOICE INCLUSION DIGNITY PHYS QUAL FAM SAT
Scale Scores for State, Region, and Provider
State SE Brian's House

43
Interpreting the Data
These data will allow you to compare the average response
from this provider to the average response from all people
sampled in the state, region, and AE (when applicable).
Some differences are less meaningful than others,
depending on things like the size of the sample and the range
of answers provided for that particular scale. “Confidence
intervals” are used to determine whether differences are
statistically significant, or meaningful. Confidence intervals
are reported in parentheses.
To determine whether the average score of the provider is
meaningfully different from the averages of the state,
region, or AE, you can look at whether these scores fall
outside or inside the provider’s confidence interval.
Meaningful differences are marked with an asterisk “*”.
Summary of Findings
• The provider scores significantly below average for the
state and AE on Individual Choice
• The provider scores significantly below average for the
state and AE on Individual Inclusion
• The provider scores significantly above average for the
state, region and AE on Physical Quality
• The provider scores significantly above average for the
state, region and AE on Family Satisfaction
Provider Profiles Data Display: Brian's House (Chester AE) 2016-2017
Of the 5,328 individuals in the 2017 IM4Q data file, 16 individuals registered in Chester Administrative Entity received residential services from Brian’s House. The
data in this profile are for the provider’s community-based residential services. This report presents the scale scores for the State, the Southeast Region, Chester
AE and Brian’s House (Chester). There must be data for 10 or more individuals to meet our selection criteria for reporting. If the number of respondents for any
item falls below 5, a dash (-) is shown. For all of the scale scores, a higher score is better and the scores can range from 0 to 100. Confidence intervals for provider
scores are given. Link to explanation of items in scales is below.
* indicates meaningful difference
Link to explanation of the questions in each scale Above average marked by
SCALES State Southeast Chester Brian’s House (Chester)
Individual Satisfaction 85.87 82.83 85.41 81.00 (62.73 – 99.27)
Individual Choice 46.90* 37.62 43.27* 28.38 (18.25 – 38.50)
Individual Inclusion 43.72* 39.99 43.52* 34.23 (27.57 – 40.89)
Individual Dignity 82.28 79.12 80.36 77.78 (69.17 – 86.39)
Physical Quality 96.92* 96.57* 97.36* 100.00 (100.00 – 100.00)
Family Satisfaction 90.54* 87.82* 90.79* 95.54 (91.34 – 99.73)
86
47 44
82
9791
83
38 40
79
978885
43 44
80
9791
81
2834
78
10096
0
20
40
60
80
100
120
SATISFACTION CHOICE INCLUSION DIGNITY PHYS QUAL FAM SAT
Scale Scores for State, Region, County, Provider
State SE Chester Brian's House (Chester)

44
Provider Profile Summary: Bucks County Transport, Inc. www.bctransport.org
Bucks County Transport is a private nonprofit organization that provides shared rides transportation services for Bucks County residents. Residents can take part in Senior Citizen Shared Ride Program, Medical Assistance Transportation Program, Persons with Disabilities Program, and transportation services for individuals enrolled in ODP’s Consolidated, Person/Family Directed Support (P/FDS) or Community Living (CL) Waivers.
We provide safe and dependable transportation to get clients to desired destination and home when needed.
We have been serving people for 34 years.
Bucks County Transport provides transportation to individuals to enable them to work in the community and attend day programs.
Our expertise is providing safe and reliable Paratransit services to the disabled community of Bucks County.
Our staff works closely with the support staff and family members to ensure that the proper messages are being communicated and understood by the individuals we support.
We attend several meetings throughout the year for organizations that support the disability community. We also hold semiannual meetings with representatives from the community, to get a better understanding on how we can provide our services to better support the disabled community.
We work closely with Support Coordinators and family members to understand specific needs and requirements their disabled family member requires to be transported safely.
To improve better communication and reduce no shows, we installed an interactive voice recognition system. On a nightly basis, the disabled client will receive a call to remind them of their trip for the following day. On the day of the trip, the disabled client will receive another call to notify them when his or her vehicle will arrive.

45
Provider Profile Summary: Cambria Residential Services www.cambriaresidentialservices.org
Cambria Residential Services Inc. works with persons with disabilities, their families and other organizations to achieve outcomes that will allow a person to fully
realize a life that is purposeful and rewarding.
Our guiding values are: To conduct business according to the highest standard of honesty & fairness. To provide fair and expeditious resolution of individual
grievances or complaints. To promote health, safety and wellness. To maintain a system of supervision, support and review that is designed for an individual to
achieve greater independence. To provide positive support, outstanding service and guidance to every individual. To always show deep respect of the individuals
that we serve. To be good citizens in the communities where we live and work.
We have been supporting people 38 years.
We offer Community homes for people with developmental disabilities, In Home Community Services for people with developmental disabilities who live
independently and only need a little support, and Family Living for people with developmental disabilities who live with a chosen family in the community.
We are able to provide services to individuals who are deaf or hard of hearing as well as people who require behavioral support. Simple medical needs can easily
be accommodated. We focus on the importance of community participation and encourage all of our employees and individuals receiving services to be good
citizens in the community.
Staff are trained as needed to provide effective communication with the people they support, whether it be unspoken communication, hard of hearing or deaf or
communication that is difficult to understand. The training is designed to meet their needs of a specific communication deficiency.
We provide support for many community activities. Individuals are made aware of opportunities and events of interest through different sources, the newspaper,
television, radio or word of mouth. If an individual expresses interest about a community event, staff assist in any way that they can to make it happen.
Families are included in yearly reviews as well as quarterly reviews. Staff are accessible to families and are available to answer questions at any time.
Our Quality Management Plan is focused on reduction and elimination of medication errors, reduction and elimination of any form of abuse or exploitation and
elimination of accidental injuries. The plan is reviewed on a quarterly basis by the Management Team. The data is collected each month by the Incident Manager(s)
and trends or problem areas identified for remediation when possible.
We are a well-established Human Service Provider that provides outstanding community living to individuals with developmental disabilities. We exist for the
purpose of making living in the community a positive, rewarding experience for these individuals. We believe that all individuals deserve both compassion and
dignity and deliver services and supports that reflect our beliefs.

46
Interpreting the Data
These data will allow you to compare the average response
from this provider to the average response from all people
sampled in the state, region, and AE (when applicable).
Some differences are less meaningful than others,
depending on things like the size of the sample and the range
of answers provided for that particular scale. “Confidence
intervals” are used to determine whether differences are
statistically significant, or meaningful. Confidence intervals
are reported in parentheses.
To determine whether the average score of the provider is
meaningfully different from the averages of the state,
region, or AE, you can look at whether these scores fall
outside or inside the provider’s confidence interval.
Meaningful differences are marked with an asterisk “*”.
Summary of Findings
• The provider scores significantly above average for the
state, region, and AE on Physical Quality
Provider Profiles Data Display: Cambria Residential Services (Cambria AE) 2016-2017
Of the 5,328 individuals in the 2017 IM4Q data file, 14 individuals registered in Cambria Administrative Entity received residential services from Cambria Residential
Services. The data in this profile are for the provider’s community-based residential services. This report presents the scale scores for the State, the Central Region,
Cambria AE and Cambria Residential Services (Cambria). There must be data for 10 or more individuals to meet our selection criteria for reporting. If the number
of respondents for any item falls below 5, a dash (-) is shown. For all of the scale scores, a higher score is better and the scores can range from 0 to 100. Confidence
intervals for provider scores are given. Link to explanation of items in scales is below.
* indicates meaningful difference **Statewide and AE specific data is the same for this provider
Link to explanation of the questions in each scale Above average marked by
SCALES State Central Cambria Cambria Residential Services (Cambria)**
Individual Satisfaction 85.87 87.85 87.75 88.21 (73.31 – 100.00)
Individual Choice 46.90 50.49 49.56 52.02 (36.27 – 67.77)
Individual Inclusion 43.72 45.96 48.14 49.80 (42.00 – 57.60)
Individual Dignity 82.28 83.59 92.73 88.54 (77.48 – 99.61)
Physical Quality 96.92* 97.07* 97.58* 100.00 (100.00 – 100.00)
Family Satisfaction 90.54 91.74 94.59 86.79 (66.45 – 100.00)
86
47 44
82
979188
5046
84
9792
88
50 48
9398 95
88
52 50
89
100
87
0
20
40
60
80
100
120
SATISFACTION CHOICE INCLUSION DIGNITY PHYS QUAL FAM SAT
Scale Scores for State, Region, County, Provider
State Central Cambria Cambria Residential Services (Cambria)
47
Provider Profile Summary: CareLink Community Support Services, Inc www.carelinkservices.org
Since 1959, CareLink’s mission has been to assist adults living with disabilities in acquiring the tools necessary to live healthy and fulfilling lives. We do this by investing unconditionally in the success of every individual who walks through our doors.
CareLink supports full integration and inclusion of all people into their communities as active and equal members, where they can exercise their rights of citizenship, as well as to accept the responsibility and explore the opportunities that come with being a member of a community and a larger society. We seek to create opportunities for people in services to be active, involved, contributing members of their communities, just like everyone else.
CareLink has been supporting individuals with intellectual disabilities for over 25 years.
Residential services are provided in two or three person homes in local neighborhoods in the suburbs of Philadelphia. With a focus on self-sufficiency, there are varied levels of supervision based on individual needs. Services are individualized and may include support and skills training in the areas of housekeeping and household tasks, health care coordination, medication management, self-care, nutrition, meal preparation, shopping, budgeting, constructive use of leisure time, public transportation, strategies for obtaining educational and vocational opportunities, engagement in social and recreational activities, relationship skills and self-advocacy. Activity schedules are driven by individual preference. Individuals are supported to attend religious services, participate in community events and activities of their choosing, volunteer, and pursue employment and education opportunities.
We primarily serve men with co-occurring mental illness, intellectual disability and a history of problem sexual behavior. This includes people with criminal justice involvement.
Employees are educated on individual communication preferences and to meet the communication needs of people served.
Engagement begins with a face-to-face meeting and a visit to the site location where the person might live and receive services. Efforts are made to transparently describe the agency and services to the individual and involved family members. Individualized planning is intended to center around individual hopes and preferences, so they have the chance to do the things they want to do in the context of a safe, responsible plan.
Families are invited to team meetings and are welcome to be a presence in the homes of their loved ones. We schedule family visits within the context of the person’s plan and support visits by transporting individuals to the homes of family members and providing support in the home of the family as is necessary and appropriate. Family contacts are updated on progress and areas of concern with permission from the individual.
Currently the agency has quality management goals designed to help reduce medication errors, increase satisfaction related to cultural preferences and improve
the training program for all staff.
48
Provider Profile Summary: Cares of Western PA (C.A.R.E.S) www.cares4u.org
Our Mission is to provide high quality services and supports that maximize potential, opportunities, relationships, community involvement, and health and wellness. Our Vision is to create community-based services to empower individuals by creating an environment where the individual’s rights and culture are recognized and respected, with services that are self-determined, person-centered, and family-focused.
Our guiding values: • Caring • Respectful • Outcome based • Family focused and family first • Self-determination • Ethical • Equitable • Dedicated • Appreciation • Team-oriented • Take pride in our efforts • Holistic • Customer service oriented.
We have been operating since December 17, 2015.
We provide a community-based day program where individuals spend approximately 75% of their time with us in the community enjoying recreational or physical exercise activities or engaging in meaningful volunteer activities. Our services include transportation to and from our day program. We also provide Lifesharing services, Respite, and Home and Community Habilitation, which is 1 on 1 services in the community.
Our area of expertise is Community Participation.
Staff are trained on the individual's ISP. Team meetings are held to ensure the teams are most up to date with ongoing communication methods, and that the communication is successful.
Our individuals spend most of their time in the community. We support them in a 1:3 ratio and encourage connections with their local community members through our volunteer opportunities and enjoying local recreational venues and activities.
We have regular team meetings, which include the families, to ensure the families' voices are being heard. We engage the families to provide us with meaningful information and request feedback often, as they typically know the individual better than anyone else on the team.
One of our quality improvement goals is to increase the number of our participants employed competitively. We have become qualified to provide Employment Services and hope to be doing so in the very near future.
We are a small, family-owned agency. We have 4 locations currently in western PA: Mars, Chippewa, Cheswick, and Hopewell. Our primary service is Community Participation in a 1:3 ratio. This service is all inclusive, meaning no one gets left behind for being unable to afford admission to zoos, games, bowling, etc. We also provide door-to-door transportation, easing the burden on families to have to arrange transportation.

49
Provider Profile Summary: Casmir Care Services Inc www.casmircares.com
Casmir Care Service’s mission is to improve the quality of life for people with intellectual and developmental disabilities through care, comfort and compassion. We believe each Individual should be treated with utmost dignity and provided with the opportunity to grow, be fulfilled, as well as become capable, independent and a valued member of our society. This is what we model at Casmir Care Services.
Our guiding values are Respect, Choice, Flexibility, Continuous Improvement, Openness, and Compassion.
We have been supporting people since 2007. These people have now become members of our family.
We support people to achieve their best potential in Community Residential Homes with varying capacities (1, 2, 3-person capacity homes), where they are treated with dignity and respect. In these Community Residential homes, we also provide short time support (Respite) and Behavior Supports. We also provide a peace of mind to families by supporting their loved ones in the comfort of their homes through Companion Services, In-Home Respite and Chore Services; as well as provide learning-based services in the home and in the community through In-Home and Community Supports and Community Participation Supports. We assist our individuals to successfully integrate into their communities through obtaining meaningful employment, building quality relationships and opportunities for personal and professional growth in an employment context.
Our staff are carefully selected, screened and effectively trained in the support plan of the people they support. Thus, they thoroughly understand the needs of the people they support and are able to communicate with them, as well as anticipate and navigate any challenges the people may encounter.
We provide the platform for our people to achieve their full potential in the community. We assess and understand our individual's goals, likes, dislikes, and preferences. They are supported to participate in activities of their choice and preference. We also strive to liaise with community resources to provide access to our individuals to a wide variety of activities in the community to improve their social skills, self-esteem and independence. Games, concerts, festivals, shopping, leisure and recreation are just a few.
Over time, our families have become an intrinsic part of everything we do. They are fully involved in all facets of the planning and implementation of programs and activities for the people we support. They accompany the people we support on group outings and company events throughout the year. There is an open communication between us and our families and they are also encouraged to voice any issues or concerns.
Our quality improvement projects include ensuring that our people have timely access to needed services and supports. It also includes ensuring that our people and /their families are satisfied with the services they are receiving.
50
Provider Profile Summary: Chadds Ford Alternacare (Criticare Home Health and Nursing) www.criticareplus.com
Criticare is committed to delivering the highest quality client-driven home care services provided by a well-trained and competent nurse supervised staff, committed to working closely with the client, their family, and their medical professionals in a comprehensive and coordinated team approach.
What separates Criticare Home Health and Nursing from many of its competitors is that we pride ourselves on being a small boutique agency, which fosters and maintains personal relationships with each of our clients as we are committed to treating them as if they are our own family members.
Criticare has been serving people for 15 years.
We offer: Personal Care Companion Care, Home Support Respite Care, and Skilled Nursing/School Nursing.
We specialize in all categories of skilled home care (pediatric to adult) including but not limited to IV infusion, wound care, PT/OT, and all areas of school nursing.
Our staff are trained based on the ISP including but not limited to a meet and greet and/or an orientation with a current caregiver.
Based on the ISP, our caregivers will encourage the clients to engage in activities outside the home like going to the library, shopping, religious services, community days, and a variety of other activities if applicable.
We support and engage families through attending regular ISP meetings and discussing future goals with family members. We also include families in company appreciation events honoring the outstanding service of our employees.
Based on an onsite survey, we improved the communication tool in which the caregivers record the progress of the client on their shift. For example, if our client reads a book or watches a movie, we account for the time per activity, which is then tracked quarterly to ultimately provide more knowledge on the progress of the client.
Quotes from actual clients include: “I want to thank your staffing coordinator for working so hard to find good people to bring regular help to our home. She made sure we knew who was coming and let us know of the absences and worked hard to find substitutes. I appreciated her regular communication”—Maureen D. “Each of our nurses were kind, professional and well-trained in nursing skills. We are very grateful for their help”—Terry M. “The caring and dedication from your staff with my mother during such a difficult time will never be forgotten”—Linda B.

51
Provider Profile Summary: Child Guidance Resource Centers, Inc www.cgrc.org/
Child Guidance Resource Centers is a private, non-profit community behavioral healthcare organization. We are dedicated to providing quality care and educational services that assess, treat, and empower children, adolescents, and families with behavioral challenges, developmental disabilities, or residential needs in the Delaware Valley. With 63 years of service, Child Guidance is committed to creating and sustaining healthy, secure communities through highly qualified clinical services. Our work advocates for, and maintains the health and well-being of the clients we serve. Vital to this commitment is an outstanding clinical and support staff that provides services of unparalleled value.
Our treatment philosophy is based on our core belief that healthcare needs are best served in the presence of secure and safe environments, which include responsive and nurturing support systems. Our treatment delivery system is knowledgeable, collaborative, evidence-based, trauma informed, recovery/resiliency focused, culturally aware, and community-based.
We have been serving people since 1956.
Please refer to our website to learn about what we offer.
Socialization and recreation groups will be provided to teach pro-socialization skills building which will assist individuals in taking advantage of generic recreation and socialization community-based opportunities. Focus will be on developing the skills and comfort necessary for individuals to actively participate in community-based activities.
To ensure staff can effectively communicate with people they support, our focus will be on developing the skills and comfort necessary for individuals to actively participate in community-based activities.
Special needs, such as health and behavioral issues, will be assessed individually to ascertain if the individual can utilize the service safely, or if appropriate and reasonable accommodations can be made. Individuals can choose the activity they wish to attend as well as assist with the planning and selection of activities.
We attend ISP meetings and maintain contact with families via telephone and email.

52
Provider Profile Summary: Children and Adult Disability and Educational Services www.cades.org
CADES is a nonprofit human services organization dedicated to improving the lives of children and adults with intellectual and physical disabilities, using a family-
centered approach to care. A regional center recognized for excellence, we work every day empowering people with special needs to achieve their highest
potential.
We believe that independence, dignity and individuality are the cornerstone for building a meaningful life.
CADES was founded in 1951 as United Cerebral Palsy. December 18, 2002 the agency changed its name to Children and Adult Disability and Educational Services.
This was the culmination of a year of planning and research by staff to capture a name that better reflects the services we provide.
CADES serves individuals with disabilities across the life span. Our youngest are served through early intervention, which provides coaching and supports to parents
and caretakers in their home or child care settings. Our private inclusive preschool is open to children from 2 years through kindergarten, with and without
disabilities. CADES Approved Private School program is a licensed special education setting for students with mild to significant intellectual, physical and/or medical
needs. Our Adult Day Program is designed to provide supports to individuals starting at the age of 21. We are open daily from 8:30am-3:00pm promoting active
programing and community experiences for adults with disabilities. Our residential program offers a comprehensive range of services for individuals with
disabilities in 33 homes throughout Bucks, Delaware and Chester Counties. Nursing, program specialists, and direct care staff coordinate the best possible care for
each individual allowing them to live their best everyday lives.
Our areas of expertise are Multiple Disabilities and Complex Medical needs.
Individuals are provided a range of high- and low-tech communication aids. Speech Pathologists work directly in our early intervention and school-based programs
and provide consultation and assistive technology support to adults as well.
Our Community Engagement Director is committed to develop and implement CADES Community Engagement Program that includes 'a life surrounded by richness
and diversity of community. A collective life, a common life. An every Day life that gains joy from the creativity and connectedness that comes when we join in
association as citizens to create an inclusive world'.
Program Managers communicate with families often regarding individual health needs, IFSP’s, IEP’s & ISP’s to identify and develop plans, and to ensure progress
is reached. Families hold valuable historical information and share important information about things that are important to those that we serve, educate and
care for each day.
Projects for 2019 include the installation of MITC agency workforce management. This project will result in improved scheduling, productivity and accountability
of staff. CADES Residential Program has also implemented the Health Risk Screening Tool. HRST is a web-based instrument developed to detect health
destabilization in vulnerable populations such as the ones that we serve.

53
Interpreting the Data
These data will allow you to compare the average response
from this provider to the average response from all people
sampled in the state, region, and AE (when applicable).
Some differences are less meaningful than others,
depending on things like the size of the sample and the range
of answers provided for that particular scale. “Confidence
intervals” are used to determine whether differences are
statistically significant, or meaningful. Confidence intervals
are reported in parentheses.
To determine whether the average score of the provider is
meaningfully different from the averages of the state,
region, or AE, you can look at whether these scores fall
outside or inside the provider’s confidence interval.
Meaningful differences are marked with an asterisk “*”.
Summary of Findings
• The provider scores significantly above average for the
state and region on Individual Satisfaction
• The provider scores significantly below average for the
state and region on Individual Choice
• The provider scores significantly below average for the
state and region on Individual Inclusion
Provider Profiles Data Display: CADES (Statewide) 2016-2017
Of the 5,328 individuals in the 2017 IM4Q data file, 26 individuals registered in Pennsylvania received residential services from CADES. The data in this profile are
for the provider’s community-based residential services. This report presents the scale scores for the State, the Southeast Region and CADES (Statewide). There
must be data for 10 or more individuals to meet our selection criteria for reporting. If the number of respondents for any item falls below 5, a dash (-) is shown.
For all of the scale scores, a higher score is better and the scores can range from 0 to 100. Confidence intervals for provider scores are given. Link to explanation
of items in scales is below.
* indicates meaningful difference
Link to explanation of the questions in each scale Above average marked by
SCALES State Southeast CADES
Individual Satisfaction 85.87* 82.83* 96.30 (89.04 – 100.00)
Individual Choice 46.90* 37.62* 23.57 (16.52 – 30.63)
Individual Inclusion 43.72* 39.99* 30.27 (24.23 – 36.32)
Individual Dignity 82.28 79.12 86.67 (69.85 – 100.00)
Physical Quality 96.92 96.57 96.15 (91.98 – 100.00)
Family Satisfaction 90.54 87.82 90.74 (83.74 – 97.75)
86
47 44
82
9791
83
38 40
79
9788
96
2430
8796
91
0
20
40
60
80
100
120
SATISFACTION CHOICE INCLUSION DIGNITY PHYS QUAL FAM SAT
Scale Scores for State, Region, Provider
State SE CADES

54
Interpreting the Data
These data will allow you to compare the average response
from this provider to the average response from all people
sampled in the state, region, and AE (when applicable).
Some differences are less meaningful than others,
depending on things like the size of the sample and the range
of answers provided for that particular scale. “Confidence
intervals” are used to determine whether differences are
statistically significant, or meaningful. Confidence intervals
are reported in parentheses.
To determine whether the average score of the provider is
meaningfully different from the averages of the state,
region, or AE, you can look at whether these scores fall
outside or inside the provider’s confidence interval.
Meaningful differences are marked with an asterisk “*”.
Summary of Findings
• The provider scores significantly below average for the
state, region and the AE on Individual Choice
• The provider scores significantly below average for the
state, region and AE on Individual Inclusion
Provider Profiles Data Display: CADES (Delaware AE) 2016-2017
Of the 5,328 individuals in the 2017 IM4Q data file, 21 individuals registered in Delaware Administrative Entity received residential services from CADES. The data
in this profile are for the provider’s community-based residential services. This report presents the scale scores for the State, the Southeast Region, Delaware AE
and CADES (Delaware). There must be data for 10 or more individuals to meet our selection criteria for reporting. If the number of respondents for any item falls
below 5, a dash (-) is shown. For all of the scale scores, a higher score is better and the scores can range from 0 to 100. Confidence intervals for provider scores
are given. Link to explanation of items in scales is below.
* indicates meaningful difference
Link to explanation of the questions in each scale Above average marked by
SCALES State Southeast Delaware CADES (Delaware)
Individual Satisfaction 85.87 82.83 85.90 93.33 (80.27 – 100.00)
Individual Choice 46.90* 37.62* 31.93* 20.81 (12.79 – 28.83)
Individual Inclusion 43.72* 39.99* 35.43* 27.12 (21.33 – 32.91)
Individual Dignity 82.28 79.12 82.56 -
Physical Quality 96.92 96.57 96.98 96.83 (92.54 – 100.00)
Family Satisfaction 90.54 87.82 86.86 92.04 (85.92 – 98.16)
86
47 44
82
9791
83
38 40
79
978886
32 35
83
9787
93
2127
9792
0
20
40
60
80
100
120
SATISFACTION CHOICE INCLUSION DIGNITY PHYS QUAL FAM SAT
Scale Scores for State, Region, County, Provider
State SE Delaware CADES (Delaware)
55
Provider Profile Summary: Citizen Care www.pfq.org
Based upon a person-centered philosophy that people have the opportunity to experience and fully participate in all aspects of a community-based life, the mission
of Citizen Care, Inc. is to support people by providing services that promote choice, personal satisfaction and the realization of their hopes and dreams.
Our guiding values are: Assurances of rights protection and promotion, life-long learning, person-first thinking, dignity, respect and sensitivity to the unique
characteristics of each person, opportunities to connect to natural supports.
Citizen Care, Inc. began providing services and supports to adults having intellectual and developmental disabilities in 1975.
Our service array now includes residential living, regular recreational / leisure activities at day services locations as well as at community-based locations and
employment training / paid-work opportunities. Full compliments of in-house nursing and behavioral support personnel provide specialized supports required to
successfully address complex needs.
As part of the overall training in the services provided to people as per their Individual Support Plans, staff focus on the strategies in place to promote effective
communication; a number of staff are also trained in American Sign Language and customized communication strategies designed by a Communication Specialist.
The agency has established and strengthened a wide variety of community partnerships over the years. Through these community connections people are able to
participate in the life of their community on a regular basis and they are recognized as friends, neighbors, volunteers, consumers and workers. In addition, every
effort is made to assist people in establishing and maintaining natural support networks involving family members and close friends.
Every effort is made to assist people in establishing and maintaining natural support networks involving family members and close friends. A family support group
and annual family satisfaction surveys are examples of family engagement activities.
We have many Q.I. initiatives. These include regular gathering and monitoring of customer feedback, a phone and online compliance system that provides 100%
confidentiality to report compliance issues, a full training and development department for our employees, regular audits of our internal fiscal and program
processes, measurable quality objectives, and management reviews of audit results and stakeholder feedback.
Citizen Care, Inc. holds the longest continuous accreditation by the Council on Quality and Leadership, an international organization that promotes standards of
excellence in services and supports for people having intellectual and developmental disabilities, with a focus on person-centered community quality of life. This
accreditation status, coupled with a high level of regulatory compliance on a regular basis, illustrates the agency’s commitment to the provision of quality services
and supports. Contact us for additional information or with any questions you may have regarding services provided by Citizen Care, Inc.
56
Provider Profile Summary: Clarion Vocational Services
Clarion Vocational Services and its programs were developed on the premise that there is dignity in work. It is believed that individuals who have been traditionally difficult to employ can gain self-worth, self-motivation, and become contributing members to our society by having the opportunity to hold legitimate employment. Clarion Vocational Services is interested in serving its workers, corporation, community and county by providing assisted employment and training programs to individuals with disabilities. These programs offer constructive and legitimate employment to capable individuals who may be developmentally disabled, and/or have a psychiatric disability.
We have been serving people for 30 years.
We provide small group employment in a snack shop that is open to the public and in a public building. Individuals receive training and employment and get paid at least minimum wage. We also have a janitorial service and a bakery where individuals can work and get training and employment.
We serve mainly individuals with IDD and Mental health disabilities.
We ensure staff can effectively communicate with people they support through yearly training, making sure they know what means of communication each individual uses.
We work alongside the people we support every day. They are involved in every aspect of the food and janitorial services.
We support and engage families through quarterly meetings, phone calls when necessary, and making sure they always know how to contact us.
We are currently working on improving the quality of our daily service notes.
We all love what we do!
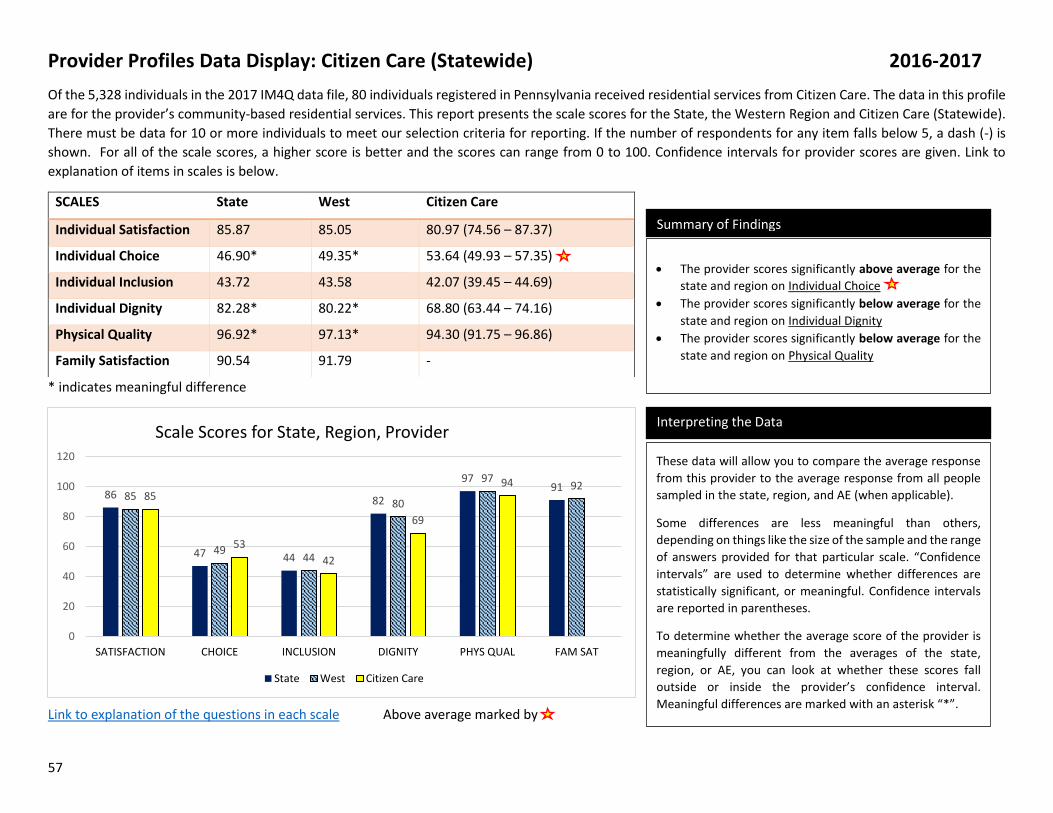
57
Interpreting the Data
These data will allow you to compare the average response
from this provider to the average response from all people
sampled in the state, region, and AE (when applicable).
Some differences are less meaningful than others,
depending on things like the size of the sample and the range
of answers provided for that particular scale. “Confidence
intervals” are used to determine whether differences are
statistically significant, or meaningful. Confidence intervals
are reported in parentheses.
To determine whether the average score of the provider is
meaningfully different from the averages of the state,
region, or AE, you can look at whether these scores fall
outside or inside the provider’s confidence interval.
Meaningful differences are marked with an asterisk “*”.
Summary of Findings
• The provider scores significantly above average for the
state and region on Individual Choice
• The provider scores significantly below average for the
state and region on Individual Dignity
• The provider scores significantly below average for the
state and region on Physical Quality
Provider Profiles Data Display: Citizen Care (Statewide) 2016-2017
Of the 5,328 individuals in the 2017 IM4Q data file, 80 individuals registered in Pennsylvania received residential services from Citizen Care. The data in this profile
are for the provider’s community-based residential services. This report presents the scale scores for the State, the Western Region and Citizen Care (Statewide).
There must be data for 10 or more individuals to meet our selection criteria for reporting. If the number of respondents for any item falls below 5, a dash (-) is
shown. For all of the scale scores, a higher score is better and the scores can range from 0 to 100. Confidence intervals for provider scores are given. Link to
explanation of items in scales is below.
* indicates meaningful difference
Link to explanation of the questions in each scale Above average marked by
SCALES State West Citizen Care
Individual Satisfaction 85.87 85.05 80.97 (74.56 – 87.37)
Individual Choice 46.90* 49.35* 53.64 (49.93 – 57.35)
Individual Inclusion 43.72 43.58 42.07 (39.45 – 44.69)
Individual Dignity 82.28* 80.22* 68.80 (63.44 – 74.16)
Physical Quality 96.92* 97.13* 94.30 (91.75 – 96.86)
Family Satisfaction 90.54 91.79 -
86
47 44
82
9791
85
4944
80
9792
85
53
42
69
94
0
20
40
60
80
100
120
SATISFACTION CHOICE INCLUSION DIGNITY PHYS QUAL FAM SAT
Scale Scores for State, Region, Provider
State West Citizen Care

58
Interpreting the Data
These data will allow you to compare the average response
from this provider to the average response from all people
sampled in the state, region, and AE (when applicable).
Some differences are less meaningful than others,
depending on things like the size of the sample and the range
of answers provided for that particular scale. “Confidence
intervals” are used to determine whether differences are
statistically significant, or meaningful. Confidence intervals
are reported in parentheses.
To determine whether the average score of the provider is
meaningfully different from the averages of the state,
region, or AE, you can look at whether these scores fall
outside or inside the provider’s confidence interval.
Meaningful differences are marked with an asterisk “*”.
Summary of Findings
• The provider scores significantly above average for the
state, region and AE on Individual Choice
• The provider scores significantly below average for the
state and region on Individual Dignity
• The provider scores significantly below average for the
AE on Physical Quality
Provider Profiles Data Display: Citizen Care (Allegheny AE) 2016-2017
Of the 5,328 individuals in the 2017 IM4Q data file, 78 individuals registered in Allegheny Administrative Entity received residential services from Citizen Care. The
data in this profile are for the provider’s community-based residential services. This report presents the scale scores for the State, the Western Region, Allegheny
AE and Citizen Care (Allegheny). There must be data for 10 or more individuals to meet our selection criteria for reporting. If the number of respondents for any
item falls below 5, a dash (-) is shown. For all of the scale scores, a higher score is better and the scores can range from 0 to 100. Confidence intervals for provider
scores are given. Link to explanation of items in scales is below.
* indicates meaningful difference
Link to explanation of the questions in each scale Above average marked by
SCALES State West Allegheny Citizen Care (Allegheny)
Individual Satisfaction 85.87 85.05 82.82 82.53 (76.44 – 88.63)
Individual Choice 46.90* 49.35* 46.36* 53.91 (50.21 – 57.61)
Individual Inclusion 43.72 43.58 41.23 41.65 (39.07 – 44.23)
Individual Dignity 82.28* 80.22* 71.61 69.05 (63.58 – 74.52)
Physical Quality 96.92 97.13 97.86* 94.16 (91.54 – 96.77)
Family Satisfaction 90.54 91.79 80.03 -
86
47 44
82
9791
85
4944
80
9792
83
4641
72
98
8083
54
42
69
94
0
20
40
60
80
100
120
SATISFACTION CHOICE INCLUSION DIGNITY PHYS QUAL FAM SAT
Scale Scores for State, Region, County, Provider
State West Allegheny Citizen Care (Allegheny)

59
Provider Profile Summary: COMHAR www.comhar.org
COMHAR’s mission is to provide health and human services that empower individuals, families, and communities to live healthier, self-determined lives.
COMHAR’s Intellectual & Developmental Disabilities Services Guiding Values are: • Everyone has the ability to change and grow. • Individuals are more than their diagnosis or disability-they are people first. • Every individual is a valuable person with unique capabilities-our differences enrich who we are. • We make sure to build trust and a sense of partnership with each person we work with. • We help every person recognize the strengths they can build upon and dreams they can pursue. • Individuals make their own choices and goals for their growth and ongoing development- we guide, coach, support, encourage, and create opportunity.
COMHAR has been serving people for 45 years.
COMHAR’s Residential Services offer small group community homes supported by highly skilled professionals providing individuals with skill training, assistance
with daily living activities, and fostering engagement with community experiences. Our Community-Based Instruction Services exposes individuals to opportunities
that enable them to make informed choices in the community. Behavior Support Services provide clinical services, including: behavioral intervention, alternative
modes of communication, sensory motor integration, and sexual education. Through our Companion Services, dedicated and friendly staff work closely with
individuals and families, providing support in personal health and safety. COMHAR’s Day Program helps individuals increase self-care and independence skills, as
well as vocational training opportunities through customized training offered in our facility and in the community. Our Supported Employment Program offers
one-to-one employment support.
COMHAR uses evidence-based methods to help individuals on the autism spectrum acquire skills which promote their independence and inclusion in the community. Our Older Adult Services provide support to individuals 60 years and older in activities, including physical fitness, tolerance, mental acuity, self-image, and self-worth. COMHAR staff are trained in supporting individuals with diabetes and epilepsy, as well as individuals who use aids such as wheelchair, colostomy bag, and feeding tubes.
Support staff are trained to understand that all communication is not necessarily through verbal means. They understand that all behaviors are the individual’s attempt to communicate a need. Staff receive training on reading body language and in engaging in active listening when communicating with our individuals.
Our Training and Employment Programs support individuals in the community by providing opportunities for volunteer activities, pre-vocational training, and social activities. Our Supported Employment Program provides individualized pre-placement assessments through volunteer activities and job shadowing, job search, and on-the-job support services.
Families of our programs’ participants are key to making it all work. They are considered team leads who are the experts for their family members and as such, provide invaluable information that is used to determine the services their loved one needs to succeed.
COMHAR is working with individuals on increasing and improving their health by implementing a variety of activities that promote health, wellness, and safety.
Walking programs have been developed which promote travel awareness and community interaction. Alternative exercise programs, such as Zumba, are open to
all with participation coming across the full spectrum of our individuals.

60
Interpreting the Data
These data will allow you to compare the average response
from this provider to the average response from all people
sampled in the state, region, and AE (when applicable).
Some differences are less meaningful than others,
depending on things like the size of the sample and the range
of answers provided for that particular scale. “Confidence
intervals” are used to determine whether differences are
statistically significant, or meaningful. Confidence intervals
are reported in parentheses.
To determine whether the average score of the provider is
meaningfully different from the averages of the state,
region, or AE, you can look at whether these scores fall
outside or inside the provider’s confidence interval.
Meaningful differences are marked with an asterisk “*”.
Summary of Findings
• The provider scores significantly above average for the
state and region on Individual Satisfaction
• The provider scores significantly below average for the
state on Individual Choice
• The provider scores significantly below average for the
state on Individual Inclusion
• The provider scores significantly below average for the
state and region on Individual Dignity
Provider Profiles Data Display: COMHAR (Statewide) 2016-2017
Of the 5,328 individuals in the 2017 IM4Q data file, 18 individuals registered in Pennsylvania received residential services from COMHAR. The data in this profile
are for the provider’s community-based residential services. This report presents the scale scores for the State, the Southeast Region and COMHAR (Statewide).
There must be data for 10 or more individuals to meet our selection criteria for reporting. If the number of respondents for any item falls below 5, a dash (-) is
shown. For all of the scale scores, a higher score is better and the scores can range from 0 to 100. Confidence intervals for provider scores are given. Link to
explanation of items in scales is below.
* indicates meaningful difference
Link to explanation of the questions in each scale Above average marked by
SCALES State SE COMHAR
Individual Satisfaction 85.87* 82.83* 96.00 (88.16 – 100.00)
Individual Choice 46.90* 37.62 29.53 (17.78 – 41.29)
Individual Inclusion 43.72* 39.99 37.93 (33.59 – 42.26)
Individual Dignity 82.28* 79.12* 75.00 (75.00 – 75.00)
Physical Quality 96.92 96.57 97.22 (94.27 – 100.00)
Family Satisfaction 90.54 87.82 -
86
47 44
82
9791
83
38 40
79
9788
96
3038
75
97
0
20
40
60
80
100
120
SATISFACTION CHOICE INCLUSION DIGNITY PHYS QUAL FAM SAT
Scale Scores for State, Region, Provider
State SE COMHAR

61
Interpreting the Data
These data will allow you to compare the average response
from this provider to the average response from all people
sampled in the state, region, and AE (when applicable).
Some differences are less meaningful than others,
depending on things like the size of the sample and the range
of answers provided for that particular scale. “Confidence
intervals” are used to determine whether differences are
statistically significant, or meaningful. Confidence intervals
are reported in parentheses.
To determine whether the average score of the provider is
meaningfully different from the averages of the state,
region, or AE, you can look at whether these scores fall
outside or inside the provider’s confidence interval.
Meaningful differences are marked with an asterisk “*”.
Summary of Findings
• The provider scores significantly below average for the
state on Individual Choice
• The provider scores significantly below average for the
state on Individual Inclusion
Provider Profiles Data Display: COMHAR (Philadelphia AE) 2016-2017
Of the 5,328 individuals in the 2017 IM4Q data file, 14 individuals registered in Philadelphia Administrative Entity received residential services from COMHAR. The
data in this profile are for the provider’s community-based residential services. This report presents the scale scores for the State, the Southeast Region,
Philadelphia AE and COMHAR (Philadelphia). There must be data for 10 or more individuals to meet our selection criteria for reporting. If the number of
respondents for any item falls below 5, a dash (-) is shown. For all of the scale scores, a higher score is better and the scores can range from 0 to 100. Confidence
intervals for provider scores are given. Link to explanation of items in scales is below.
* indicates meaningful difference
Link to explanation of the questions in each scale Above average marked by
SCALES State SE Philadelphia COMHAR (Philadelphia)
Individual Satisfaction 85.87 82.83 80.53 -
Individual Choice 46.90* 37.62 39.13 28.68 (17.40 – 39.96)
Individual Inclusion 43.72* 39.99 39.85 38.10 (33.43 – 42.76)
Individual Dignity 82.28 79.12 75.18 -
Physical Quality 96.92 96.57 96.97 97.62 (94.45 – 100.00)
Family Satisfaction 90.54 87.82 86.91 -
86
47 44
82
9791
83
38 40
79
9788
81
39 40
75
9787
2938
98
0
20
40
60
80
100
120
SATISFACTION CHOICE INCLUSION DIGNITY PHYS QUAL FAM SAT
Scale Scores for State, Region, County, Provider
State SE Philadelphia COMHAR (Philadelphia)

62
Provider Profile Summary: Community Interactions www.ciinc.org
The mission of Community Interactions, Inc. (CI) is to provide quality services for people with intellectual, physical and behavioral health challenges; to create
lifestyles consistent with their communities respecting individual choice, self-determination and culture. Community Interaction’s vision is to empower the people
we support by creating an environment where they are recognized and respected. This is accomplished by providing innovative programs and services affording
opportunities to live full and productive lives with families, friends and the community.
CI was founded in 1973 by families who wanted folks with intellectual disabilities to have the life that we all want; one full of love, kindness, purpose, and as much
independence as possible. Today, Community Interactions serves individuals with intellectual, physical, and behavioral health challenges in PA and DE, by
providing an array of services tailored to the needs of the individual, such as:
❖ Residential programs, which provide residential supports to individuals living in apartments or single-family homes as they develop their potential and
maximize their independence.
❖ Day programs, which provide social skills and life skills development through volunteerism, vocational training, and a variety of other activities.
❖ In-home supports, which offer assistance to individuals living at home with household chores, cooking, daily living and social skills and more.
❖ Supported employment, comprised of a variety of programs designed to assist clients in finding and maintaining employment in today’s workplace.
Reflecting the values & principles of the organization, CI provides a foundation, structure and vision that support excellence in all we do. The “CI Way” begins with
our commitment to a “Holistic Approach to a Quality of Life” that integrates elements of a quality of life (health and wellness, learning, social relationships,
communication, etc.) for the persons we support. CI has extensive experience supporting persons who are deaf, and/or who are on the autism spectrum. CI
provides communication supports to all individuals and the staff who support them. All staff are also trained in the CI CARES model, which highlights quality of
engagement.
CI highly values community engagement in all its programs. Persons we support spend considerable time in the community attending classes, concerts, music
lessons, as well as regular shopping, banking, and recreation. CI also values families as essential support to the individual we support. We learn from families about
the types of support their family members need, and we collaborate with families to tailor services to the needs and wants of their family member.
CI has developed an innovative integrated model for providing Clinical Supports (health care, behavioral health, communication, sensory-motor) using a holistic
model that can address challenges within our programs more efficiently and effectively. We have also invested in staff development resources to better assure
that staff have all the resources they need to provide exceptional supports. Self-Advocacy is a cornerstone element of the Community Interactions mission. Self-
Advocates, individuals who receive services from our organization, meet once a month to develop good leadership skills and explore new opportunities through
self-directed services.

63
Interpreting the Data
These data will allow you to compare the average response
from this provider to the average response from all people
sampled in the state, region, and AE (when applicable).
Some differences are less meaningful than others,
depending on things like the size of the sample and the range
of answers provided for that particular scale. “Confidence
intervals” are used to determine whether differences are
statistically significant, or meaningful. Confidence intervals
are reported in parentheses.
To determine whether the average score of the provider is
meaningfully different from the averages of the state,
region, or AE, you can look at whether these scores fall
outside or inside the provider’s confidence interval.
Meaningful differences are marked with an asterisk “*”.
Summary of Findings
• The provider scores significantly below average for the
state on Individual Inclusion
Provider Profiles Data Display: Community Interactions (Statewide) 2016-2017
Of the 5,328 individuals in the 2017 IM4Q data file, 22 individuals registered in Pennsylvania received residential services from Community Interactions. The data
in this profile are for the provider’s community-based residential services. This report presents the scale scores for the State and Community Interactions
(Statewide). There must be data for 10 or more individuals to meet our selection criteria for reporting. If the number of respondents for any item falls below 5, a
dash (-) is shown. For all of the scale scores, a higher score is better and the scores can range from 0 to 100. Confidence intervals for provider scores are given.
Link to explanation of items in scales is below.
* indicates meaningful difference
Link to explanation of the questions in each scale Above average marked by
SCALES State Community Interactions
Individual Satisfaction 85.87 81.07 (67.47 – 94.67)
Individual Choice 46.90 47.24 (37.45 – 57.03)
Individual Inclusion 43.72* 38.28 (34.50 – 42.05)
Individual Dignity 82.28 77.92 (68.97 – 86.87)
Physical Quality 96.92 97.73 (93.27 – 100.00)
Family Satisfaction 90.54 88.10 (81.63 – 94.56)
86
47 44
82
9791
81
4738
78
98
88
0
20
40
60
80
100
120
SATISFACTION CHOICE INCLUSION DIGNITY PHYS QUAL FAM SAT
Scale Scores for State and Provider
State Community Interactions

64
Interpreting the Data
These data will allow you to compare the average response
from this provider to the average response from all people
sampled in the state, region, and AE (when applicable).
Some differences are less meaningful than others,
depending on things like the size of the sample and the range
of answers provided for that particular scale. “Confidence
intervals” are used to determine whether differences are
statistically significant, or meaningful. Confidence intervals
are reported in parentheses.
To determine whether the average score of the provider is
meaningfully different from the averages of the state,
region, or AE, you can look at whether these scores fall
outside or inside the provider’s confidence interval.
Meaningful differences are marked with an asterisk “*”.
Summary of Findings
• The provider scores significantly above average for the
AE on Individual Choice
• The provider scores significantly below average for the
state on Individual Inclusion
Provider Profiles Data Display: Community Interactions (Delaware AE) 2016-2017
Of the 5,328 individuals in the 2017 IM4Q data file, 19 individuals registered in the Delaware Administrative Entity received residential services from Community
Interactions. The data in this profile are for the provider’s community-based residential services. This report presents the scale scores for the State, the Southeast
Region, Delaware AE and Community Interactions (Delaware). There must be data for 10 or more individuals to meet our selection criteria for reporting. If the
number of respondents for any item falls below 5, a dash (-) is shown. For all of the scale scores, a higher score is better and the scores can range from 0 to 100.
Confidence intervals for provider scores are given. Link to explanation of items in scales is below.
* indicates meaningful difference
Link to explanation of the questions in each scale Above average marked by
SCALES State Southeast Delaware Community Interactions (Delaware)
Individual Satisfaction 85.87 82.83 85.90 81.67 (65.74 – 97.59)
Individual Choice 46.90 37.62 31.93* 44.09 (33.93 – 54.25)
Individual Inclusion 43.72* 39.99 35.43 38.12 (33.98 – 42.25)
Individual Dignity 82.28 79.12 82.56 78.65 (67.79 – 89.50)
Physical Quality 96.92 96.57 96.98 99.37 (92.21 – 100.00)
Family Satisfaction 90.54 87.82 86.86 88.10 (81.63 – 94.56)
86
47 44
82
9791
83
38 40
79
978886
32 35
83
9787
82
4438
79
9788
0
20
40
60
80
100
120
SATISFACTION CHOICE INCLUSION DIGNITY PHYS QUAL FAM SAT
Scale Scores for State, Region, County, Provider
State SE Delaware Community Interactions (Delaware)

65
Provider Profile Summary: Community Links www.communitylinks.co
Community Links is a private, non-profit organization providing direct support services to citizens with intellectual disabilities in McKean, Elk, and Cameron counties. Community Links incorporates the Core Values or Principles of “Everyday Lives” and the concept of Positive Approaches in the standards for planning, policy development, and service design. Community Links supports the mission of the Office of Developmental Programs to support Pennsylvanians with developmental disabilities to achieve greater independence, choice and opportunity in their lives.
Community Links has been serving people since 2003.
In-Home and Community Support Services is a direct (face-to-face) service that can be rendered in your home or out and about in your community. This service is designed to help individuals acquire, maintain, and improve self-help, domestic, socialization, and adaptive skills that are necessary to live successfully in home and community-based settings. Services consist of supporting individuals in the general areas of self-care, communication, motor skills, mobility, personal adjustment, developing relationships, socialization, and accessing community resources. Respite Care Services either in the consumer’s home or away from their home is provided to supervise and support individuals living in the community on a short-term basis. This service provides relief for families and care givers of individuals with special needs. Community Participation Support Services provide opportunities and support for community inclusion and building interest in and developing skills and potential for competitive integrated employment. Behavior Support Services include the functional assessment; the development of strategies to support an individual based upon their assessment, and training to individuals, staff, relatives and caregivers. The individual’s family members, staff or others involved in the individual’s life may be included in the service. Supported Employment Services consist of job finding and job support.
Community Links is an expert in providing In-Home and Community Support Services, supporting the promise and potential of citizens with intellectual disabilities in Elk, Cameron and McKean counties—in their homes, communities and where they work since 2003.
Community Links insures that staff will be trained in the individual's preferred mode of communication.
Community Links supports individuals to be active members of our community. Services are designed to develop a spirit of personal reliance and to become contributing members of the community. Community Links invites the community to our website and Facebook pages to follow our involvement in the community.
Historically, Community Links has asked families and care givers for their input and direction on services. Community Links invites families to recommend candidates to provide services to their family members.
Community Links continually develops and evaluates strategies and resources to effectively deliver services to meet the specific needs and desires of each individual. Community Links supports individuals efficiently. We strive for improvement.
Community Links affirms that as a participant in services through our agency, you will be continually supported to exercise your individual rights. Community Links will educate, assist and provide the accommodations necessary for you to make choices and understand your rights.
66
Provider Profile Summary: Community Living and Support Services (CLASS) www.classcommunity.org
The mission of Community Living and Support Services, Inc. (CLASS) is to support people with disabilities as they explore options, participate in the community and
strive toward equality... we are 'Working Toward a Community Where Each Belongs'.
We support the uniqueness, wholeness and dignity of each person. CLASS strives to respond to the individual needs and preferences of each person we support
and serve; while enthusiastically advocating for the rights of people with disabilities so they may fully participate in and contribute to community life. This includes
enjoying a secure home, family, friends, education, services, and work they find meaningful. We view all human life as having equal and unconditional value. Each
life should be nurtured, respected, celebrated, and fulfilled. We support the life-long process of personal growth and development of all people. We will take every
opportunity to educate others and to advocate for the basic civil rights of people with disabilities. We emphasize cooperation in getting things done through and
with the people we serve.
CLASS was founded in 1951 by family members interested in seeing their sons/daughters who had disabilities have more options and community opportunities.
Over the years the organization has grown and developed, but that basic goal, people with disabilities living full lives in their communities, still remains.
CLASS’s programs include community skill building, residential services, community partners, attendant care, and Pennsylvania Initiative on Assistive Technologies
(PIAT). Community Skill Building is a licensed adult training facility that provides opportunities for individuals to increase interdependence through participation
in classes and the community. Residential services provide assistance to adults with disabilities that live in their own homes and apartments. Community Partners
is a non-traditional case management service, working to assist with problem solving, exploring community resources, or managing one’s own life. Attendant Care
works with individuals needing help with personal assistance and daily living activities and provides support to enhance their ability to live in their own homes and
communities. CLASS offers several assistive technology services, through the PIAT program, to help connect individuals with disabilities with the technology that
is vital for their independence.
CLASS has a long history of supporting people with complex medical needs and ensuring community participation by actively pursuing opportunities for community
engagement.
Prior to individuals being supported by CLASS an extensive assessment and profile is completed. Staff receive training to ensure they have a full understanding of
how-to best support and communicate with the individual.
People are best engaged in the community when participating in an activity of their choice. CLASS strives to provide opportunities based on individual interests
for community engagement.
Families and loved ones are informed on a regular basis, participate in meetings, and are included in social activities sponsored by the agency.
CLASS has a Quality Management committee and oversight board that meet on a quarterly basis to evaluate staff and family satisfaction, assess trends related to
supporting individuals, to ensure safety and quality of services.

67
Interpreting the Data
These data will allow you to compare the average response
from this provider to the average response from all people
sampled in the state, region, and AE (when applicable).
Some differences are less meaningful than others,
depending on things like the size of the sample and the range
of answers provided for that particular scale. “Confidence
intervals” are used to determine whether differences are
statistically significant, or meaningful. Confidence intervals
are reported in parentheses.
To determine whether the average score of the provider is
meaningfully different from the averages of the state,
region, or AE, you can look at whether these scores fall
outside or inside the provider’s confidence interval.
Meaningful differences are marked with an asterisk “*”.
Summary of Findings
• The provider scores significantly below average for the
state, region and AE on Individual Inclusion
• The provider scores significantly below average for the
state and region on Individual Dignity
Provider Profiles Data Display: CLASS (Allegheny AE) 2016-2017
Of the 5,328 individuals in the 2017 IM4Q data file, 13 individuals registered in Allegheny Administrative Entity received residential services from CLASS. The data
in this profile are for the provider’s community-based residential services. This report presents the scale scores for the State, the Western Region, Allegheny AE
and CLASS (Allegheny). There must be data for 10 or more individuals to meet our selection criteria for reporting. If the number of respondents for any item falls
below 5, a dash (-) is shown. For all of the scale scores, a higher score is better and the scores can range from 0 to 100. Confidence intervals for provider scores
are given. Link to explanation of items in scales is below.
* indicates meaningful difference **Statewide and AE specific data is the same for this provider
Link to explanation of the questions in each scale Above average marked by
SCALES State West Allegheny CLASS (Allegheny)**
Individual Satisfaction 85.87 85.05 82.82 83.46 (73.44 – 93.48)
Individual Choice 46.90 49.35 46.36 53.57 (46.13 – 61.01)
Individual Inclusion 43.72* 43.58* 41.23* 32.51 (26.08 – 38.93)
Individual Dignity 82.28* 80.22* 71.61 72.73 (69.74 – 75.72)
Physical Quality 96.92 97.13 97.86 98.72 (96.21 – 100.00)
Family Satisfaction 90.54 91.79 80.03 -
86
47 44
82
9791
85
4944
80
9792
83
4641
72
98
8083
54
33
73
99
0
20
40
60
80
100
120
SATISFACTION CHOICE INCLUSION DIGNITY PHYS QUAL FAM SAT
Scale Scores for State, Region, County, Provider
State West Allegheny CLASS (Allegheny)
68
Provider Profile Summary: Community Living Care www.communitylivingcare.com
It is our Mission, to provide services to persons with intellectual disabilities in variety of settings. Community Living Care Inc. (CLC) is committed to providing the
highest quality of service designed to promote and support each person to maximize their own potential. CLC will provide the individual the support necessary to
establish and continually expand a lifestyle that promotes individual growth, independence, autonomy, and community integration. It is our Vision that we are
one company for growth, passionate about the success of the people we serve, and our employees. Through innovation by design, our services will continue to
meet the needs of the surrounding community. Our team of program workers, program specialists, and managers promote a culture of empowerment through
strength-based self-fulfillment.
At Community Living Care, we value a person-centered approach to deliver quality services through open communication, employee diversity and community
fellowship.
Hayes E. Treasure founded Community Living Care (CLC) in 1987. He envisioned a long-term dedication to promoting and enabling community membership for
those with intellectual disabilities. Since its founding and official incorporation in 1991, this organization has continued to expand and respond to community need.
CLC provides a variety of service options dependent on your preferred lifestyle and interests. We offer provision of care at your place of residence as needed,
facility-based care at one of our community living homes or day programs, and transportation to and from some services. No matter which model you choose we
provide services focused on a fully enriched life of family, friends, and community. Our variety of services are available throughout a person’s life span.
CLC has a professional on staff who helps teams foster ideas that help increase the success of their loved one. Through education, modeling, and implementation
we are there to assist each team in navigating the challenges a person may encounter.
We support people with communication needs by providing our staff with the education necessary to communicate with the person and the skill to assist the
person in minimizing barriers that they may encounter.
Community is a key piece of each person’s life that is supported by CLC, each person participates in activities of their choosing and preferences. CLC promotes
diversity, cultural experiences, clubs / organizations and many other community functions.
Many of the people we support have very close ties to their families. We encourage, promote, and welcome family involvement through our team process. This
process helps generate ideas for success and overcoming challenges. All involved should celebrate each step in a person’s life.
CLC promotes an environment that is conducive to embracing each person's vision of success. We invite you to contact us for further information.

69
Interpreting the Data
These data will allow you to compare the average response
from this provider to the average response from all people
sampled in the state, region, and AE (when applicable).
Some differences are less meaningful than others,
depending on things like the size of the sample and the range
of answers provided for that particular scale. “Confidence
intervals” are used to determine whether differences are
statistically significant, or meaningful. Confidence intervals
are reported in parentheses.
To determine whether the average score of the provider is
meaningfully different from the averages of the state,
region, or AE, you can look at whether these scores fall
outside or inside the provider’s confidence interval.
Meaningful differences are marked with an asterisk “*”.
Summary of Findings
• The provider’s scores were not significantly different
from the average scores for the state or region
Provider Profiles Data Display: Community Living Care (Statewide) 2016-2017
Of the 5,328 individuals in the 2017 IM4Q data file, 11 individuals registered in Pennsylvania received residential services from Community Living Care. The data
in this profile are for the provider’s community-based residential services. This report presents the scale scores for the State, the West Region and Community
Living Care (Statewide). There must be data for 10 or more individuals to meet our selection criteria for reporting. If the number of respondents for any item falls
below 5, a dash (-) is shown. For all of the scale scores, a higher score is better and the scores can range from 0 to 100. Confidence intervals for provider scores
are given. Link to explanation of items in scales is below.
* indicates meaningful difference
Link to explanation of the questions in each scale Above average marked by
SCALES State West Community Living Care
Individual Satisfaction 85.87 85.05 84.52 (56.82 – 100.00)
Individual Choice 46.90 49.35 42.20 (33.00 – 51.40)
Individual Inclusion 43.72 43.58 47.19 (40.47 – 53.90)
Individual Dignity 82.28 80.22 85.42 (72.46 – 98.37)
Physical Quality 96.92 97.13 95.45 (86.55 – 100.00)
Family Satisfaction 90.54 91.79 93.52 (89.58 – 97.45)
86
47 44
82
9791
85
4944
80
9792
85
4247
85
95 94
0
20
40
60
80
100
120
SATISFACTION CHOICE INCLUSION DIGNITY PHYS QUAL FAM SAT
Scale Scores for State, Region, Provider
State West Community Living Care

70
Interpreting the Data
These data will allow you to compare the average response
from this provider to the average response from all people
sampled in the state, region, and AE (when applicable).
Some differences are less meaningful than others,
depending on things like the size of the sample and the range
of answers provided for that particular scale. “Confidence
intervals” are used to determine whether differences are
statistically significant, or meaningful. Confidence intervals
are reported in parentheses.
To determine whether the average score of the provider is
meaningfully different from the averages of the state,
region, or AE, you can look at whether these scores fall
outside or inside the provider’s confidence interval.
Meaningful differences are marked with an asterisk “*”.
Summary of Findings
• The provider scores significantly above average for the
AE on Individual Inclusion
Provider Profiles Data Display: Community Living Care (Westmoreland AE) 2016-2017
Of the 5,328 individuals in the 2017 IM4Q data file, 10 individuals registered in Westmoreland Administrative Entity received residential services from Community
Living Care. The data in this profile are for the provider’s community-based residential services. This report presents the scale scores for the State, the West Region,
Westmoreland AE and Community Living Care (Westmoreland). There must be data for 10 or more individuals to meet our selection criteria for reporting. If the
number of respondents for any item falls below 5, a dash (-) is shown. For all of the scale scores, a higher score is better and the scores can range from 0 to 100.
Confidence intervals for provider scores are given. Link to explanation of items in scales is below.
* indicates meaningful difference
Link to explanation of the questions in each scale Above average marked by
SCALES State West Westmoreland Community Living Care (Westmoreland)
Individual Satisfaction 85.87 85.05 87.98 84.52 (56.82 – 100.00)
Individual Choice 46.90 49.35 48.58 43.26 (33.35 – 53.17)
Individual Inclusion 43.72 43.58 35.24* 46.19 (39.09 – 53.29)
Individual Dignity 82.28 80.22 79.71 85.42 (72.46 – 98.37)
Physical Quality 96.92 97.13 97.01 95.00 (85.20 – 100.00)
Family Satisfaction 90.54 91.79 92.70 92.71 (88.63 – 96.79)
86
47 44
82
9791
85
4944
80
9792
88
49
35
80
9793
85
43 46
85
95 93
0
20
40
60
80
100
120
SATISFACTION CHOICE INCLUSION DIGNITY PHYS QUAL FAM SAT
Scale Scores for State, Region, County, Provider
State West Westmoreland Community Living Care (Westmoreland)

71
Provider Profile Summary: Community Options www.comop.org
Community Options’ mission is to develop housing and employment supports for persons with disabilities. Community Options believes in the dignity of every
person, and in the freedom of all people to experience the highest degree of self-determination. As a national agency, Community Options seeks to promote the
inclusion of people with disabilities in the community through person centered and natural supports, and collaboration with community partners to increase
accessibility to services.
Community Options is guided by the values of choice & control, individual freedom & safety, individuality & relationships, success, stability & the recognition that
comes from integrating and contributing to the community. In addition, Community Options believes the values and principles of accountability; mentoring and
collaboration should guide the relationship between Community Options and the individual’s support team as a whole.
Community Options, Inc. was incorporated in 1989 to establish and develop homes and employment for people with disabilities.
Community Options offers: Residential Habilitation Services, Respite Services, Community Participation Supports, Employment Services, Supported Employment
Services, School to Work Transitional Services, Vocational Supports, Pre-vocational Training, Behavioral Supports. Staff meet with the individual and their family
and other team members to ensure that an individual’s plans are person-centered, incorporating the person’s preferences accordingly. Residential supports are
designed to assist people with disabilities moving from their family home, nursing homes and state schools, or who are on waiting lists for community services, to
find housing in the community. Employment programs focus on individual competitive jobs or community volunteer placements.
Community Options provides the personalized evaluations, job development, job coaching, supports, and follow-up services required to assist individuals with
pursuing community-based employment, taking into consideration the special needs of each individual. Our CPS program, Option Quest, provides individuals with
a variety of options to individualize their personal work schedules. This can include paid employment, volunteer work, attending classes, advocacy work and
involvement in the community and civic activities.
All Community Options employees must have the ability to communicate with the individuals they serve as a base employment requirement. For individuals with
unique and specialized communication needs, including but not limited to, sign language and communication devices, staff receive comprehensive training based
on that person’s individual communication preferences and needs.
Community Options developed and utilizes Meaningful Day as a guide to engage individuals in their community. This curriculum will fill the resource gap and set
the standard for day program staff in developing meaningful and engaging activities, which will positively impact people with disabilities by providing a
comprehensive, participant driven guide for those supporting them to pursue their individual interests and develop the skills needed to do so.
Through frequent, open communication and collaboration Community Options strives to maintain strong family bonds. Visits by family and friends are welcomed,
and Community Options is supportive of individuals who desire to visit others.
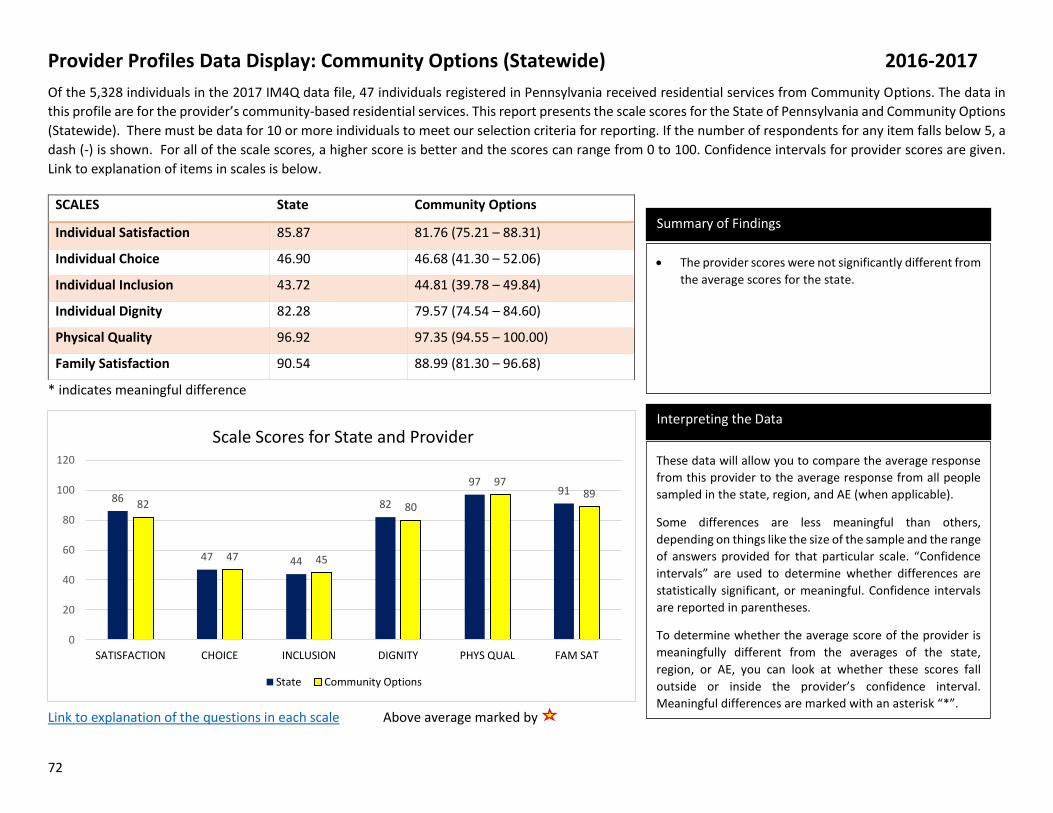
72
Interpreting the Data
These data will allow you to compare the average response
from this provider to the average response from all people
sampled in the state, region, and AE (when applicable).
Some differences are less meaningful than others,
depending on things like the size of the sample and the range
of answers provided for that particular scale. “Confidence
intervals” are used to determine whether differences are
statistically significant, or meaningful. Confidence intervals
are reported in parentheses.
To determine whether the average score of the provider is
meaningfully different from the averages of the state,
region, or AE, you can look at whether these scores fall
outside or inside the provider’s confidence interval.
Meaningful differences are marked with an asterisk “*”.
Summary of Findings
• The provider scores were not significantly different from
the average scores for the state.
Provider Profiles Data Display: Community Options (Statewide) 2016-2017
Of the 5,328 individuals in the 2017 IM4Q data file, 47 individuals registered in Pennsylvania received residential services from Community Options. The data in
this profile are for the provider’s community-based residential services. This report presents the scale scores for the State of Pennsylvania and Community Options
(Statewide). There must be data for 10 or more individuals to meet our selection criteria for reporting. If the number of respondents for any item falls below 5, a
dash (-) is shown. For all of the scale scores, a higher score is better and the scores can range from 0 to 100. Confidence intervals for provider scores are given.
Link to explanation of items in scales is below.
* indicates meaningful difference
Link to explanation of the questions in each scale Above average marked by
SCALES State Community Options
Individual Satisfaction 85.87 81.76 (75.21 – 88.31)
Individual Choice 46.90 46.68 (41.30 – 52.06)
Individual Inclusion 43.72 44.81 (39.78 – 49.84)
Individual Dignity 82.28 79.57 (74.54 – 84.60)
Physical Quality 96.92 97.35 (94.55 – 100.00)
Family Satisfaction 90.54 88.99 (81.30 – 96.68)
86
47 44
82
9791
82
47 45
80
9789
0
20
40
60
80
100
120
SATISFACTION CHOICE INCLUSION DIGNITY PHYS QUAL FAM SAT
Scale Scores for State and Provider
State Community Options
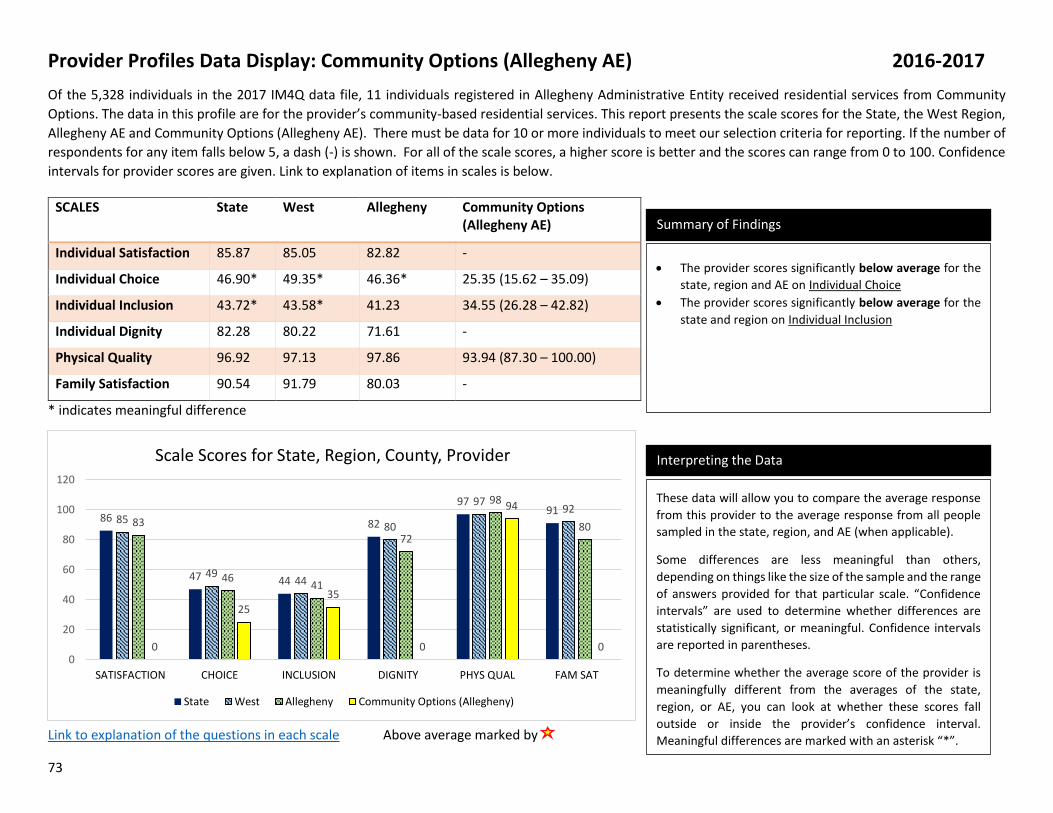
73
Interpreting the Data
These data will allow you to compare the average response
from this provider to the average response from all people
sampled in the state, region, and AE (when applicable).
Some differences are less meaningful than others,
depending on things like the size of the sample and the range
of answers provided for that particular scale. “Confidence
intervals” are used to determine whether differences are
statistically significant, or meaningful. Confidence intervals
are reported in parentheses.
To determine whether the average score of the provider is
meaningfully different from the averages of the state,
region, or AE, you can look at whether these scores fall
outside or inside the provider’s confidence interval.
Meaningful differences are marked with an asterisk “*”.
Summary of Findings
• The provider scores significantly below average for the
state, region and AE on Individual Choice
• The provider scores significantly below average for the
state and region on Individual Inclusion
Provider Profiles Data Display: Community Options (Allegheny AE) 2016-2017
Of the 5,328 individuals in the 2017 IM4Q data file, 11 individuals registered in Allegheny Administrative Entity received residential services from Community
Options. The data in this profile are for the provider’s community-based residential services. This report presents the scale scores for the State, the West Region,
Allegheny AE and Community Options (Allegheny AE). There must be data for 10 or more individuals to meet our selection criteria for reporting. If the number of
respondents for any item falls below 5, a dash (-) is shown. For all of the scale scores, a higher score is better and the scores can range from 0 to 100. Confidence
intervals for provider scores are given. Link to explanation of items in scales is below.
* indicates meaningful difference
Link to explanation of the questions in each scale Above average marked by
SCALES State West Allegheny Community Options (Allegheny AE)
Individual Satisfaction 85.87 85.05 82.82 -
Individual Choice 46.90* 49.35* 46.36* 25.35 (15.62 – 35.09)
Individual Inclusion 43.72* 43.58* 41.23 34.55 (26.28 – 42.82)
Individual Dignity 82.28 80.22 71.61 -
Physical Quality 96.92 97.13 97.86 93.94 (87.30 – 100.00)
Family Satisfaction 90.54 91.79 80.03 -
86
47 44
82
9791
85
4944
80
9792
83
4641
72
98
80
0
25
35
0
94
00
20
40
60
80
100
120
SATISFACTION CHOICE INCLUSION DIGNITY PHYS QUAL FAM SAT
Scale Scores for State, Region, County, Provider
State West Allegheny Community Options (Allegheny)

74
Interpreting the Data
These data will allow you to compare the average response
from this provider to the average response from all people
sampled in the state, region, and AE (when applicable).
Some differences are less meaningful than others,
depending on things like the size of the sample and the range
of answers provided for that particular scale. “Confidence
intervals” are used to determine whether differences are
statistically significant, or meaningful. Confidence intervals
are reported in parentheses.
To determine whether the average score of the provider is
meaningfully different from the averages of the state,
region, or AE, you can look at whether these scores fall
outside or inside the provider’s confidence interval.
Meaningful differences are marked with an asterisk “*”.
Summary of Findings
• The provider scores significantly above average for the
region and AE on Individual Choice
• The provider scores significantly above average for the
state, region and AE on Physical Quality
Provider Profiles Data Display: Community Options (Philadelphia AE) 2016-2017
Of the 5,328 individuals in the 2017 IM4Q data file, 11 individuals registered in Philadelphia Administrative Entity received residential services from Community
Options. The data in this profile are for the provider’s community-based residential services. This report presents the scale scores for the State, the Southeast
Region, Philadelphia AE and Community Options (Philadelphia). There must be data for 10 or more individuals to meet our selection criteria for reporting. If the
number of respondents for any item falls below 5, a dash (-) is shown. For all of the scale scores, a higher score is better and the scores can range from 0 to 100.
Confidence intervals for provider scores are given. Link to explanation of items in scales is below.
* indicates meaningful difference
Link to explanation of the questions in each scale Above average marked by
SCALES State SE Philadelphia Community Options (Philadelphia)
Individual Satisfaction 85.87 82.83 80.53 78.33 (62.47 – 94.20)
Individual Choice 46.90 37.62* 39.13* 47.15 (39.94 – 54.37)
Individual Inclusion 43.72 39.99 39.85 42.17 (31.96 – 52.39)
Individual Dignity 82.28 79.12 75.18 77.38 (68.15 – 86.62)
Physical Quality 96.92* 96.57* 96.97* 100.00 (100.00 – 100.00)
Family Satisfaction 90.54 87.82 86.91 -
86
47 44
82
9791
83
38 40
79
9788
81
39 40
75
97
8778
4742
77
100
0
20
40
60
80
100
120
SATISFACTION CHOICE INCLUSION DIGNITY PHYS QUAL FAM SAT
Scale Scores for State, Region, County, Provider
State SE Philadelphia Community Options (Philadelphia)

75
Provider Profile Summary: Community Services Group www.csgonline.org
Community Services Group’s (CSG) mission is to promote the growth and enhancement of human potential through an effective, efficient and innovative system
of care. We want people to achieve greater independence and make decisions about their own lives, in ways that work for them. We strongly uphold Everyday
Lives values and principles. CSG provides services focused on individual needs, so each person receives the care and support to meet their goals and interests. We
want to be the provider families and individuals choose when looking for services.
Our core values are dignity, diversity, respect, responsibility and excellence. These values, with our mission, shape the CSG culture and set the expectations for
how everyone who works at CSG is expected to behave. Our core values say who we are as an organization and help us attract employees who share those values.
We strive to ensure that our staff live our core values on a daily basis.
CSG has been providing ID services since 1972, beginning with one home in Lancaster County; over the years, we have expanded our services to individuals in
multiple counties. Although we have always supported individuals with autism and an intellectual disability, we began providing more specialized autism services
in 2008.
We provide services to people in a variety of ways and locations. We support people in their own homes or in the home of their family member; in community
homes that CSG owns or rents; and in structured day program settings. We help people get involved in community activities, instead of being in a physical location
during the day. We also help people find a job, get temporary services like respite, or find a family with whom they can live (called LifeSharing.) The amount of
staff time and attention provided depends on what services they want and their specific needs.
We have special expertise in several areas, including supporting individuals with challenging behaviors, autism, and mental health issues in addition to an
intellectual and developmental disability. Staff are trained in the best ways to support someone with communication needs, including sign language or use of
special technology devices. We employ a behavior specialist who completes communication assessments and helps people develop plans to get what they need.
We provide training to staff and talk about getting people involved in their community on a regular basis. Our staff introduce different experiences and
opportunities, working with each individual to determine what he or she enjoys.
We want families to feel part of their family member’s life and experiences at CSG. Families play an important role in orienting new staff to their family member’s
background and other important information. Family members are invited to special events, such as picnics and holiday parties. Families can request, at any time,
regular meetings or phone calls with key staff to discuss any concerns and answer questions. We formally ask for family input through an annual satisfaction survey
and use those results to make improvements.

76
Interpreting the Data
These data will allow you to compare the average response
from this provider to the average response from all people
sampled in the state, region, and AE (when applicable).
Some differences are less meaningful than others,
depending on things like the size of the sample and the range
of answers provided for that particular scale. “Confidence
intervals” are used to determine whether differences are
statistically significant, or meaningful. Confidence intervals
are reported in parentheses.
To determine whether the average score of the provider is
meaningfully different from the averages of the state,
region, or AE, you can look at whether these scores fall
outside or inside the provider’s confidence interval.
Meaningful differences are marked with an asterisk “*”.
Summary of Findings
• The provider scores significantly below average for the
state on Individual Choice
• The provider scores significantly above average for the
state on Physical Quality
Provider Profiles Data Display: Community Services Group (Statewide) 2016-2017
Of the 5,328 individuals in the 2017 IM4Q data file, 81 individuals registered in Pennsylvania received residential services from Community Services Group. The
data in this profile are for the provider’s community-based residential services. This report presents the scale scores for the State of Pennsylvania and Community
Services Group (Statewide). There must be data for 10 or more individuals to meet our selection criteria for reporting. If the number of respondents for any item
falls below 5, a dash (-) is shown. For all of the scale scores, a higher score is better and the scores can range from 0 to 100. Confidence intervals for provider
scores are given. Link to explanation of items in scales is below.
* indicates meaningful difference
Link to explanation of the questions in each scale Above average marked by
SCALES State Community Services Group
Individual Satisfaction 85.87 89.90 (85.59 – 94.21)
Individual Choice 46.90* 39.20 (34.04 – 44.36)
Individual Inclusion 43.72 41.80 (38.52 – 45.07)
Individual Dignity 82.28 79.92 (76.23 – 83.60)
Physical Quality 96.92* 98.70 (97.53 – 99.87)
Family Satisfaction 90.54 90.80 (86.03 – 95.56)
86
47 44
82
979190
39 42
80
9991
0
20
40
60
80
100
120
SATISFACTION CHOICE INCLUSION DIGNITY PHYS QUAL FAM SAT
Scale Scores for State and Provider
State Community Services Group

77
Interpreting the Data
These data will allow you to compare the average response
from this provider to the average response from all people
sampled in the state, region, and AE (when applicable).
Some differences are less meaningful than others,
depending on things like the size of the sample and the range
of answers provided for that particular scale. “Confidence
intervals” are used to determine whether differences are
statistically significant, or meaningful. Confidence intervals
are reported in parentheses.
To determine whether the average score of the provider is
meaningfully different from the averages of the state,
region, or AE, you can look at whether these scores fall
outside or inside the provider’s confidence interval.
Meaningful differences are marked with an asterisk “*”.
Summary of Findings
• The provider scores significantly below average for the
state, region and AE on Individual Choice
• The provider scores significantly below average for the
state, region and AE on Individual Inclusion
• The provider scores significantly above average for the
state, region and AE on Physical Quality
Provider Profiles Data Display: Community Services Group (Columbia/Montour/Snyder/Union AE) 2016-2017
Of the 5,328 individuals in the 2017 IM4Q data file, 12 individuals registered in Columbia/Montour/Snyder/Union (CMSU) Administrative Entity received residential
services from Community Services Group. The data in this profile are for the provider’s community-based residential services. This report presents the scale scores
for the State, the Central Region, CMSU AE and Community Services Group (CMSU). There must be data for 10 or more individuals to meet our selection criteria
for reporting. If the number of respondents for any item falls below 5, a dash (-) is shown. For all of the scale scores, a higher score is better and the scores can
range from 0 to 100. Confidence intervals for provider scores are given. Link to explanation of items in scales is below.
* indicates meaningful difference
Link to explanation of the questions in each scale Above average marked by
SCALES State Central CMSU Community Services Group (CMSU)
Individual Satisfaction 85.87 87.85 82.29 -
Individual Choice 46.90* 50.49* 41.53* 20.72 (16.61 – 24.84)
Individual Inclusion 43.72 * 45.96* 44.00* 30.75 (23.06 – 38.45)
Individual Dignity 82.28 83.59 79.03 -
Physical Quality 96.92* 97.07* 95.50* 100.00 (100.00 – 100.00)
Family Satisfaction 90.54 91.74 91.51 -
86
47 44
82
979188
50 46
84
9792
82
42 44
79
96 92
0
2131
0
100
00
20
40
60
80
100
120
SATISFACTION CHOICE INCLUSION DIGNITY PHYS QUAL FAM SAT
Scale Scores for State, Region, County, Provider
State Central CMSU Community Services Group (CMSU)

78
Interpreting the Data
These data will allow you to compare the average response
from this provider to the average response from all people
sampled in the state, region, and AE (when applicable).
Some differences are less meaningful than others,
depending on things like the size of the sample and the range
of answers provided for that particular scale. “Confidence
intervals” are used to determine whether differences are
statistically significant, or meaningful. Confidence intervals
are reported in parentheses.
To determine whether the average score of the provider is
meaningfully different from the averages of the state,
region, or AE, you can look at whether these scores fall
outside or inside the provider’s confidence interval.
Meaningful differences are marked with an asterisk “*”.
Summary of Findings
• The provider scores were not significantly different from
the average scores for the state, region, or AE
Provider Profiles Data Display: Community Services Group (Lancaster AE) 2016-2017
Of the 5,328 individuals in the 2017 IM4Q data file, 36 individuals registered in Lancaster Administrative Entity received residential services from Community
Services Group. The data in this profile are for the provider’s community-based residential services. This report presents the scale scores for the State, the Central
Region, Lancaster AE and Community Services Group (Lancaster). There must be data for 10 or more individuals to meet our selection criteria for reporting. If the
number of respondents for any item falls below 5, a dash (-) is shown. For all of the scale scores, a higher score is better and the scores can range from 0 to 100.
Confidence intervals for provider scores are given. Link to explanation of items in scales is below.
* indicates meaningful difference
Link to explanation of the questions in each scale Above average marked by
SCALES State Central Lancaster Community Services Group (Lancaster)
Individual Satisfaction 85.87 87.85 86.55 90.03 (84.50 – 95.55)
Individual Choice 46.90 50.49 49.52 45.59 (37.72 – 53.47)
Individual Inclusion 43.72 45.96 45.17 44.32 (40.13 – 48.51)
Individual Dignity 82.28 83.59 80.22 79.70 (75.10 – 84.31)
Physical Quality 96.92 97.07 96.92 97.69 (95.37 – 100.00)
Family Satisfaction 90.54 91.74 89.31 -
86
47 44
82
979188
50 46
84
9792
87
5045
80
978990
46 44
80
9890
0
20
40
60
80
100
120
SATISFACTION CHOICE INCLUSION DIGNITY PHYS QUAL FAM SAT
Scale Scores for State, Region, County, Provider
State Central Lancaster Community Services Group (Lancaster)
79
Provider Profile Summary: Compass Rose Care, Ltd
Compass Rose Care, Ltd’s mission: We are here to help the elderly and physically challenged live each day to the fullest, with assistance with their daily activities of living, and helping restore independence where needed. Making a positive change to our community.
Compass Rose Care, Ltd’s guiding value: Helping those in need.
We have been serving people since 2000.
We help individuals with their daily activities of living: emotionally, socially, physically, and mentally. We help restore independence where ever possible.
We have no special expertise, we help all those in need with no discrimination of needs or challenges.
Our staff is required to do 12 hours of in-services training yearly. We also provide literature to our staff that is helpful in cases our staff supports.
We engage people in the community through shopping, going to doctor appointments, and walking in the neighborhoods. Some consumers we take bowling for a change of atmosphere.
We have open communication with all involved with any particular cases.
We strive to make a positive difference for each person we work with. We pride ourselves on dependability and offering peace of mind to you and your loved ones.

80
Provider Profile Summary: Continuum Pediatrics
Continuum Pediatric’s mission is to deliver the highest quality of nursing care with compassion and kindness to our patients in their homes, while respecting the unique needs of each patient and their family and to also encourage a professional and supportive environment for employees that promotes competency expansion through education and training.
Continuum Pediatric’s guiding value is to improve the patients’ and their families’ quality of life. This is maintained by training and supporting our team of caregivers.
Continuum Pediatrics as a company has been supporting our clients and families for over 25 years.
Continuum Pediatrics provides Skilled Nursing Care (RNs/LPNs), Home Health Aide Services, Companion Services, and Respite Care.
We care for those patient's with complex medical needs.
Our staff is educated through skills fairs, client orientations, monthly newsletters, and office correspondence that reflect the individuals’ specific needs.
Our staff is encouraged to participate in the organizations that host or provide services to our clients.
Continuum Pediatrics supports and engages families through providing a supportive environment, led by clinical leaders who understand their needs through communication and education.

81
Provider Profile Summary: Creating Unlimited Possibilities, Inc. (CUP) www.creatingunlimitedpossibilities.org
Our mission statement is, “To provide a safe environment that respects, nurtures, supports, and challenges each individual to reach their maximum potential by making individual choices about where they want to live, work, and socialize.”
Creating Unlimited Possibilities guiding values are to respect all individuals and treat others as you want to be treated.
Creating Unlimited Possibilities has been supporting our special needs community for more than 70 years.
We offer: Adult Rehabilitation and Community Participation. Creating Unlimited Possibilities promotes trips into the community (restaurants, community affairs, parks and recreation, and cultural events). Transportation is provided to/from our program and on all out trips.
Creating Unlimited Possibilities specializes in Community Participation.
All staff are trained to work with different levels of communication, including some American Sign Language (ASL) and Spanish.
We attend cultural events, local festivals, Knoebels and Bloomsburg Fair; as well as baseball games and the circus.
Creating Unlimited Possibilities has always had good rapport with our families and the community living arrangements.
We are constantly striving to get our special needs people into the community between 25-50% of their time.
Creating Unlimited Possibilities has a Family Auxiliary that sponsors a picnic in the summer and a wonderful Christmas party at Genetti’s, at no cost to the individuals.

82
Provider Profile Summary: CROSS, Inc.
CROSS, Inc. seeks to provide residential and social services to persons with developmental disabilities and their families. Opportunities for intellectual, spiritual and emotional growth are provided in a developmental environment based on Christian values.
CROSS, Inc. is committed to providing residential services to adults with developmental disabilities. The primary goal of these services is to allow each individual to achieve his/her optimal level of functioning in an atmosphere of mutual respect and trust between staff and residents. These services are based in a Christ-centered, home-like environment that insures residents experience, as closely as possible, the normal routines of life. The program acknowledges the uniqueness of each person and strives to meet the individual’s needs using methods that encourage continual growth. As is possible, the staff provides supervision to each resident in a developmental model rather than assuming a care-giving role. Recognizing that a single program cannot meet the total needs of its residents, CROSS encourages regular interaction with family and friends. Active participation in a day program and in a local church is also part of the program. Residents are encouraged to participate in the mainstream of society and staff seek to provide opportunities for new experiences.
CROSS, Inc. has been serving people for 34 Years.
We have three personal care homes for adults with IDD.
We ensure staff can effectively communicate with people they support through training as required by DHS.
People are engaged in the community through attending a day program at OSI, attending ARC Socials, Camping, Night to Shine, etc.
We encourage weekend and holiday visits with families.

83
Provider Profile Summary: CT Home Care Services, LLC www.cthcservices.com
Our mission is to promote the expansion of opportunities for individuals with disabilities to participate fully in their community.
We believe that each individual deserves to be treated with dignity and respect, regardless of their disability.
We have been serving people for 3 years.
We provide individuals with opportunities to learn vocational skills through volunteering, life skills through participating in classes and learning to gain independent living skills, and socialization skills through participating in a variety of community activities. In the future, we intend to support individuals with transportation needs and behavioral supports.
Our area of special expertise is community participation. Individuals we support are provided with opportunities to integrate into their communities more than 25% of the time they attend the program.
Each individual has a communication plan and staff are being trained on the plan. Each staff is being trained to be respectful and do active listening when communicating with the people they support.
We ensure that individuals we support are given the opportunity to participate in activities of their choice. We ensure that they are not just attending a community program but participating in the program. We encourage them to socialize with others and participate in the activities.
There is open and constant communication with the families. We ensure that they receive constant feedback on what activities their family members are participating in and how their day went.
We are working on supporting our participants in their communication goals. We are working on supporting our individuals in volunteering in more community projects.
For us, it is more than a business, it is fulfilling our purpose. We believe we have a purpose to play in the lives of the people we support. We strive to give the
participants the best possible support by being focused on the individual as opposed to a group.

84
Provider Profile Summary: Delta Community Supports www.deltaweb.org
Our Mission: To enrich the lives of individuals and families through outstanding community-based supports and mutually rewarding relationships. Our Vision: To
consistently represent “excellence” in the minds of those we serve by “creating richer lives from within.”
We believe we will best fulfill our mission and reach our vision by aligning ourselves with these core values:
Customer Focus: We recognize that the people we support are our primary “customers,” including family members, advocates, state agencies, and all interested
stakeholders.
Operational Excellence: We understand that to continue to be successful in the delivery of services we must maintain our focus on continuous improvement.
Learning & Growth: We recognize that our biggest assets are our employees. We value supporting one another as a team so that every person may achieve their
full potential and contribute to offering the highest standard of care.
Stewardship: Practicing sound resource management will provide organizational stability and a foundation for fully achieving our mission.
Since 1977. Delta provides community homes for people with intellectual disabilities in the Southeast Region of PA. We also offer a community center that
provides both in house and community activities for people with intellectual disabilities. We also offer supported employment services for adults looking for
assistance in getting work in their community.
Supported employment has become one of our fastest growing services for adults looking for work in their community.
Many of the people we support use alternative means of communication (iPads, picture books, etc.) Delta recognizes that behavior is communication and responds
accordingly.
People that we support engage in their community through their churches, civic groups (Kiwanis Club, for example) and recreational resources. Engagement is
individualized based on the interests of the individual.
Families are integral to the success and happiness of their family members. Families are regularly kept informed of developments in their family members’ progress.
Family members are invited to monthly meetings at the homes. Delta has developed a social media presence on Facebook and Twitter in an effort to involve all
stakeholders in Delta's work.
Delta has been using a continuous performance improvement approach to our services and processes. In Community Living we have a project to increase the
number of independent activities in the community. There are also projects to reduce the time needed to admit new individuals so that this valuable resource is
available as soon as possible. Finally, an ongoing project is to review our incident reports, identify trends, train and inform staff in order to reduce the likelihood
of recurrence.
Delta is committed to being a leader in the field of human services. This committed and steadfast approach to performance improvement has led to Delta being
the recipient of the 2005 Keystone Award for Proficiency in Performance Excellence. Performance Improvement is a way of life at Delta. It runs deep through every
aspect of our services and guides our vision and values.

85
Interpreting the Data
These data will allow you to compare the average response
from this provider to the average response from all people
sampled in the state, region, and AE (when applicable).
Some differences are less meaningful than others,
depending on things like the size of the sample and the range
of answers provided for that particular scale. “Confidence
intervals” are used to determine whether differences are
statistically significant, or meaningful. Confidence intervals
are reported in parentheses.
To determine whether the average score of the provider is
meaningfully different from the averages of the state,
region, or AE, you can look at whether these scores fall
outside or inside the provider’s confidence interval.
Meaningful differences are marked with an asterisk “*”.
Summary of Findings
• The provider scores significantly above average for the
state and region on Individual Inclusion
• The provider scores significantly below average for the
state and region on Physical Quality
Provider Profiles Data Display: Delta Community Supports (Statewide) 2016-2017
Of the 5,328 individuals in the 2017 IM4Q data file, 34 individuals registered in Pennsylvania received residential services from Delta. The data in this profile are
for the provider’s community-based residential services. This report presents the scale scores for the State, the Southeast Region and Delta (Statewide). There
must be data for 10 or more individuals to meet our selection criteria for reporting. If the number of respondents for any item falls below 5, a dash (-) is shown.
For all of the scale scores, a higher score is better and the scores can range from 0 to 100. Confidence intervals for provider scores are given. Link to explanation
of items in scales is below.
* indicates meaningful difference
Link to explanation of the questions in each scale Above average marked by
SCALES State Southeast Delta
Individual Satisfaction 85.87 82.83 83.97 (74.24 – 93.70)
Individual Choice 46.90 37.62 45.05 (38.21 – 51.90)
Individual Inclusion 43.72* 39.99* 51.50 (44.93 – 58.06)
Individual Dignity 82.28 79.12 76.52 (70.45 – 82.58)
Physical Quality 96.92* 96.57* 92.16 (87.97 – 96.35)
Family Satisfaction 90.54 87.82 92.13 (87.66 – 96.60)
86
47 44
82
9791
83
38 40
79
9788
84
4552
77
92 92
0
20
40
60
80
100
120
SATISFACTION CHOICE INCLUSION DIGNITY PHYS QUAL FAM SAT
Scale Scores for State, Region, Provider
State SE Delta

86
Interpreting the Data
These data will allow you to compare the average response
from this provider to the average response from all people
sampled in the state, region, and AE (when applicable).
Some differences are less meaningful than others,
depending on things like the size of the sample and the range
of answers provided for that particular scale. “Confidence
intervals” are used to determine whether differences are
statistically significant, or meaningful. Confidence intervals
are reported in parentheses.
To determine whether the average score of the provider is
meaningfully different from the averages of the state,
region, or AE, you can look at whether these scores fall
outside or inside the provider’s confidence interval.
Meaningful differences are marked with an asterisk “*”.
Summary of Findings
• The provider scores significantly above average for the
state, region and AE on Individual Inclusion
• The provider scores significantly below average for the
AE on Individual Dignity
• The provider scores significantly below average for the
state and region on Physical Quality
Provider Profiles Data Display: Delta Community Supports (Bucks AE) 2016-2017
Of the 5,328 individuals in the 2017 IM4Q data file, 31 individuals registered in Bucks Administrative Entity received residential services from Delta. The data in
this profile are for the provider’s community-based residential services. This report presents the scale scores for the State, the Southeast Region, Bucks AE and
Delta (Bucks). There must be data for 10 or more individuals to meet our selection criteria for reporting. If the number of respondents for any item falls below 5,
a dash (-) is shown. For all of the scale scores, a higher score is better and the scores can range from 0 to 100. Confidence intervals for provider scores are given.
Link to explanation of items in scales is below.
* indicates meaningful difference
Link to explanation of the questions in each scale Above average marked by
SCALES State Southeast Bucks Delta (Bucks)
Individual Satisfaction 85.87 82.83 88.30 85.69 (75.43 – 95.95)
Individual Choice 46.90 37.62 42.48 44.13 (37.29 – 50.97)
Individual Inclusion 43.72* 39.99* 44.63* 51.88 (45.08 – 58.69)
Individual Dignity 82.28 79.12 87.25* 76.67 (69.98 – 83.35)
Physical Quality 96.92* 96.57* 96.25 91.94 (87.42 – 96.45)
Family Satisfaction 90.54 87.82 91.10 92.09 (87.37 – 96.81)
86
47 44
82
9791
83
38 40
79
978888
42 45
8796
9186
4452
77
92 92
0
20
40
60
80
100
120
SATISFACTION CHOICE INCLUSION DIGNITY PHYS QUAL FAM SAT
Scale Scores for State, Region, County, Provider
State SE Bucks Delta (Bucks)

87
Provider Profile Summary: Developmental Enterprises Corporation (DEC) www.decmc.org
DEC is passionately committed to supporting developmentally disabled individuals to reach their fullest potential. We provide a dignified and safe environment
for all individuals, to encourage value, hope, self-esteem, independence and responsibility.
Our guiding values: Safety, Integrity, Respect, Welfare, Stability, Contributing to the community, Care
DEC has been supporting people for 48 years.
We have five-day programs that focus on building employment and socialization skills to help our individuals become more integrated into the community and
work on goals towards meaningful employment. Job coaching, independent and residential living, in home and community supports.
Staff can effectively communicate with people they support via: Regular training onsite and offsite, team meetings, agency meetings, and assessing the needs of
our individuals are tools we use to ensure staff can effectively communicate with people they support.
We engage people we support in the community through training, weekend activities, interest inventory, socialization, volunteer opportunities and career
exploration.
We support and engage families through communication via e-mail, social media, telephone, team meetings.
We are currently working a Quality Improvement Project to Increase the number of individuals who attend and participate in community integration activities; we
are also working on creating individual safety plans to best support each person in the community.
We offer some onsite additional therapies by contracted professionals with music therapy, tai chi/movement, and yoga.
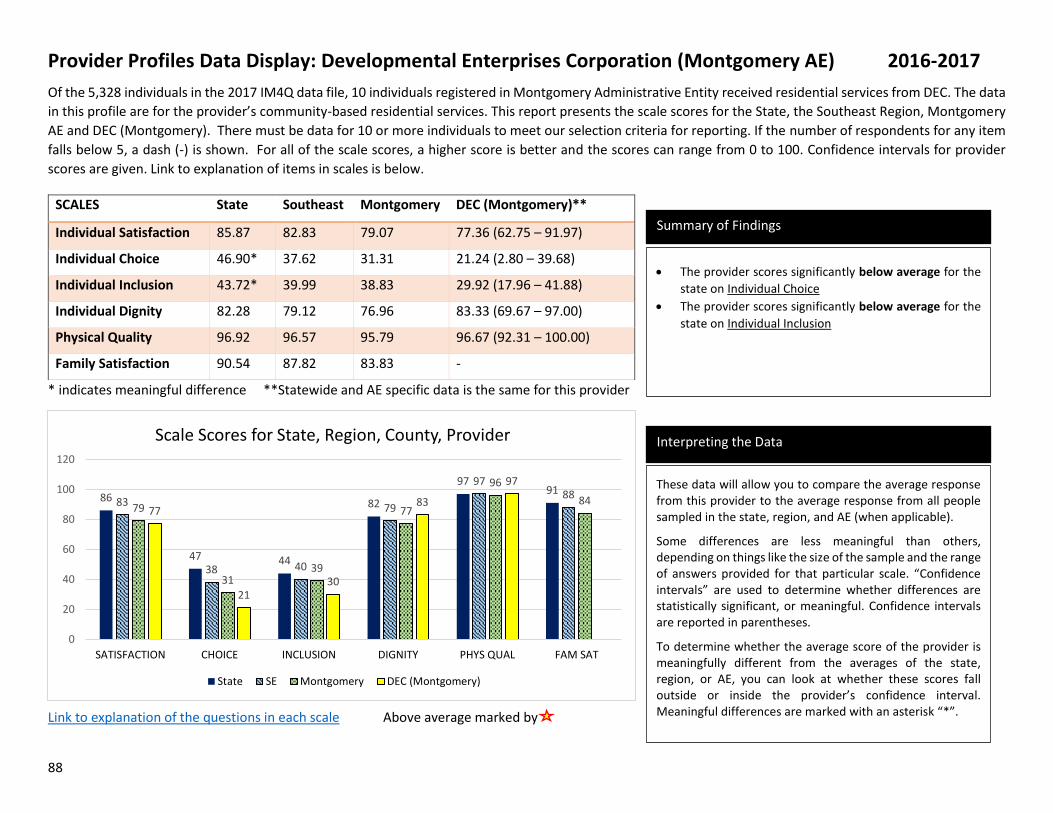
88
Interpreting the Data
These data will allow you to compare the average response from this provider to the average response from all people sampled in the state, region, and AE (when applicable).
Some differences are less meaningful than others, depending on things like the size of the sample and the range of answers provided for that particular scale. “Confidence intervals” are used to determine whether differences are statistically significant, or meaningful. Confidence intervals are reported in parentheses.
To determine whether the average score of the provider is meaningfully different from the averages of the state, region, or AE, you can look at whether these scores fall outside or inside the provider’s confidence interval. Meaningful differences are marked with an asterisk “*”.
Summary of Findings
• The provider scores significantly below average for the
state on Individual Choice
• The provider scores significantly below average for the
state on Individual Inclusion
Provider Profiles Data Display: Developmental Enterprises Corporation (Montgomery AE) 2016-2017
Of the 5,328 individuals in the 2017 IM4Q data file, 10 individuals registered in Montgomery Administrative Entity received residential services from DEC. The data
in this profile are for the provider’s community-based residential services. This report presents the scale scores for the State, the Southeast Region, Montgomery
AE and DEC (Montgomery). There must be data for 10 or more individuals to meet our selection criteria for reporting. If the number of respondents for any item
falls below 5, a dash (-) is shown. For all of the scale scores, a higher score is better and the scores can range from 0 to 100. Confidence intervals for provider
scores are given. Link to explanation of items in scales is below.
* indicates meaningful difference **Statewide and AE specific data is the same for this provider
Link to explanation of the questions in each scale Above average marked by
SCALES State Southeast Montgomery DEC (Montgomery)**
Individual Satisfaction 85.87 82.83 79.07 77.36 (62.75 – 91.97)
Individual Choice 46.90* 37.62 31.31 21.24 (2.80 – 39.68)
Individual Inclusion 43.72* 39.99 38.83 29.92 (17.96 – 41.88)
Individual Dignity 82.28 79.12 76.96 83.33 (69.67 – 97.00)
Physical Quality 96.92 96.57 95.79 96.67 (92.31 – 100.00)
Family Satisfaction 90.54 87.82 83.83 -
86
47 44
82
9791
83
38 40
79
9788
79
3139
77
96
8477
2130
83
97
0
20
40
60
80
100
120
SATISFACTION CHOICE INCLUSION DIGNITY PHYS QUAL FAM SAT
Scale Scores for State, Region, County, Provider
State SE Montgomery DEC (Montgomery)
89
Provider Profile Summary: Developmental Fitness Company, LLC www.developmentalfitness.com
Developmental Fitness Company, LLC was founded with the vision that those with developmental disabilities and special needs can and will benefit from quality, supervised therapeutic exercise programs under the direction of certified and compassionate exercise personnel. The overall mission is to support those with developmental disabilities to achieve independence and enhanced quality of life through enriched person-centered exercise programming that facilitates and fosters inclusive environments.
Our vision and values statement is as follows: “We attempt to provide the best quality service by placing the customer first and placing their needs above our own. We strive to include the client in all aspects of programming under the direction of us, the compassionate trainer, to provide true therapeutic challenge that will aid in progressing themselves as an exercising individual.” Our company greatly values the use of evidence-based practice to administer programs that allow consumers to express choices for their desired outcomes.
We have been serving people for 22 years.
We offer: In-Home and Community Habilitation (W7061), Community Participation Supports (W5997), Physical Therapy, and Occupational Therapy Dietetics.
Our areas of expertise: Physical and Occupational Therapy, Athletic Training, and Community Participation Supports.
Written, oral and other forms of communication with the individual, and persons designated by the individual, shall occur in a language and means of communication understood by the individual or a person designated by the individual. Staff are routinely trained on ISPs per each individual, and are integrated with the individual’s team.
We shall provide the individual with the support necessary to access the community in accordance with their plan. We will seek to provide ongoing opportunities and support necessary to participate in community activities of the individual's choice. We pride ourselves on affording the same degree of community access and choice as an individual who is similarly situated in the community, who does not have a disability. Our policy ensures that all individuals receiving this service are allowed the freedom to move about their home and community consistent with non-Medicaid recipients in same and/or similar settings. Our policy ensures that all individuals receiving this service have access to food if necessary at any time during the provision of services consistent with non-Medicaid recipients in the same and/or similar settings. Our policy ensures that all individuals receiving this service are afforded the opportunity to regularly update their activities, consistent with non-Medicaid recipients in a similar or same setting. Our policy seeks to ensure, where applicable, that our service is provided in an integrated service location. We seek out integrated settings to provide our supports in the community. We seek to provide the individual the same degree of community access and choice as an individual who is similarly situated in the community who does not have a disability.
We facilitate and make the accommodations necessary to support an individual's visits with family, friends and others, at the direction of the individual. The provider shall facilitate and make the accommodations necessary to involve the individual's family, friends and others in decision making, planning and other activities, at the direction of the individual.
All of our services are provided both in home and in the gym. We have and continue to provide services that integrate individuals into the community.
We have recently been accepted by both Independence Blue Cross/Blue Shield and Medicare (Part B) to provide formal physical and occupational therapy services. For more information, please contact www.developmentalfitness.com [email protected].
90
Provider Profile Summary: Devereux www.devereux.org
Devereux Advanced Behavioral Health changes lives-by unlocking and nurturing human potential for people living with emotional, behavioral or cognitive
differences. Devereux's Advanced Philosophy of Care represents an organizational commitment to the clients and families who are served by Devereux. Our guiding
values are: Compassion: We have a deep and abiding understanding of, and respect for, our individuals and their families. Knowledge: We rely on data and evidence
to inform our care. Our work requires a marriage of science and art. Collaboration: We require an integrated team approach based on respect, shared goals and
altruism. Dedication: We maintain relentless optimism and perseverance to support the lifelong journey of those we serve. Learning: We pursue continuous
personal improvement, professional development and expanding impact. Progress: We are Always en Route, continually incorporating new innovations to advance
our services, our industry and the lives of those we serve.
Devereux Advanced Behavioral Health was founded in 1912.
Devereux supports individuals with autism, intellectual and developmental disabilities, emotional disorders, and brain injuries. Devereux provides services in a
variety of settings including outpatient services, wrap around, school and family consultation, residential and day schools, community-based living, therapeutic
foster care, assessment services, employment services and vocational services.
Our areas of expertise include individuals with behavioral support needs, CARF Accredited Brain Injury Program, OBRA and Vocational Services. Upon admission,
assessments are conducted to determine communication needs of individuals and staff are trained on effective communication and the use of assistive technology.
At Devereux, we provide opportunities for individuals to participate in the community through partnerships with various businesses and community members
including: food shelters, Chamber of Commerce, churches, Meals on Wheels, senior centers and other organizations.
Devereux has many opportunities for families to be involved, provide input and receive support including family engagement group, annual Family Day event,
annual open house events, annual satisfaction surveys, social media and with ongoing communication from members of the interdisciplinary teams. Devereux is
committed to improving the quality of our services and supports.
Devereux is focused on improving the level of community participation, family engagement, implementation of D-PBIS (Positive Behavioral Interventions and
Supports) and developing strategies to minimize health concerns for individuals in our care. Devereux Advanced Behavioral Health is working to incorporate
Servant Leadership values and practices into its organizational culture and framework.
Servant Leadership is a philosophy and set of practices that enriches the lives of individuals, build better organizations and ultimately creates a more just and
caring world. From an organizational standpoint, servant leaders: -Devote themselves to meeting the needs of others, including the people, organizations and
communities they serve -Engage others to identify innovative approaches and solutions -Facilitate personal growth; help develop employees/colleagues to bring
out the best in them -Coach others and provide ongoing feedback.
By embedding Servant Leadership into our daily work, we'll create an environment where employees feel empowered to voice ideas that will benefit our
individuals, staff, and the overall organization. Engaged staff will better support one another and, most importantly, better support our individuals and families.
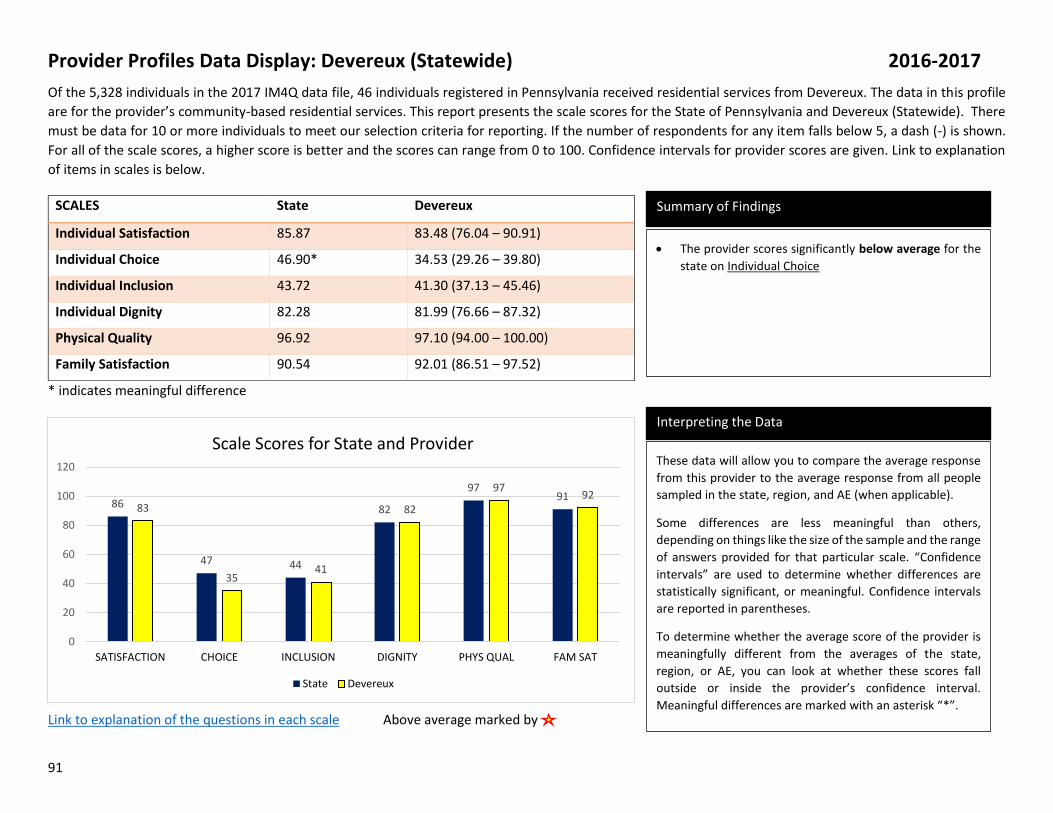
91
Interpreting the Data
These data will allow you to compare the average response
from this provider to the average response from all people
sampled in the state, region, and AE (when applicable).
Some differences are less meaningful than others,
depending on things like the size of the sample and the range
of answers provided for that particular scale. “Confidence
intervals” are used to determine whether differences are
statistically significant, or meaningful. Confidence intervals
are reported in parentheses.
To determine whether the average score of the provider is
meaningfully different from the averages of the state,
region, or AE, you can look at whether these scores fall
outside or inside the provider’s confidence interval.
Meaningful differences are marked with an asterisk “*”.
Summary of Findings
• The provider scores significantly below average for the
state on Individual Choice
Provider Profiles Data Display: Devereux (Statewide) 2016-2017
Of the 5,328 individuals in the 2017 IM4Q data file, 46 individuals registered in Pennsylvania received residential services from Devereux. The data in this profile
are for the provider’s community-based residential services. This report presents the scale scores for the State of Pennsylvania and Devereux (Statewide). There
must be data for 10 or more individuals to meet our selection criteria for reporting. If the number of respondents for any item falls below 5, a dash (-) is shown.
For all of the scale scores, a higher score is better and the scores can range from 0 to 100. Confidence intervals for provider scores are given. Link to explanation
of items in scales is below.
* indicates meaningful difference
Link to explanation of the questions in each scale Above average marked by
SCALES State Devereux
Individual Satisfaction 85.87 83.48 (76.04 – 90.91)
Individual Choice 46.90* 34.53 (29.26 – 39.80)
Individual Inclusion 43.72 41.30 (37.13 – 45.46)
Individual Dignity 82.28 81.99 (76.66 – 87.32)
Physical Quality 96.92 97.10 (94.00 – 100.00)
Family Satisfaction 90.54 92.01 (86.51 – 97.52)
86
47 44
82
9791
83
3541
82
9792
0
20
40
60
80
100
120
SATISFACTION CHOICE INCLUSION DIGNITY PHYS QUAL FAM SAT
Scale Scores for State and Provider
State Devereux

92
Interpreting the Data
These data will allow you to compare the average response from this provider to the average response from all people sampled in the state, region, and AE (when applicable).
Some differences are less meaningful than others, depending on things like the size of the sample and the range of answers provided for that particular scale. “Confidence intervals” are used to determine whether differences are statistically significant, or meaningful. Confidence intervals are reported in parentheses.
To determine whether the average score of the provider is meaningfully different from the averages of the state, region, or AE, you can look at whether these scores fall outside or inside the provider’s confidence interval. Meaningful differences are marked with an asterisk “*”.
Summary of Findings
• The provider scores significantly below average for the
region and AE on Individual Choice
Provider Profiles Data Display: Devereux (Carbon/Monroe/Pike AE) 2016-2017
Of the 5,328 individuals in the 2017 IM4Q data file, 10 individuals registered in the Carbon/Monroe/Pike Administrative Entity received residential services from
Devereux. The data in this profile are for the provider’s community-based residential services. This report presents the scale scores for the State, the Northeast
Region, Carbon/Monroe/Pike AE and Devereux (Carbon/Monroe/Pike). There must be data for 10 or more individuals to meet our selection criteria for reporting.
If the number of respondents for any item falls below 5, a dash (-) is shown. For all of the scale scores, a higher score is better and the scores can range from 0 to
100. Confidence intervals for provider scores are given. Link to explanation of items in scales is below.
* indicates meaningful difference
Link to explanation of the questions in each scale Above average marked by
SCALES State NE Carbon/ Monroe/Pike
Devereux (Carbon/Monroe/Pike)
Individual Satisfaction 85.87 89.11 90.57 -
Individual Choice 46.90 54.66* 65.22* 40.95 (31.46 – 50.44)
Individual Inclusion 43.72 48.05 50.21 42.24 (30.44 – 54.04)
Individual Dignity 82.28 88.82 91.83 -
Physical Quality 96.92 96.97 99.07 98.33 (95.07 – 100.00)
Family Satisfaction 90.54 92.50 89.05 -
86
47 44
82
979189
5548
8997
9391
65
50
9299
89
0
41 42
0
98
00
20
40
60
80
100
120
SATISFACTION CHOICE INCLUSION DIGNITY PHYS QUAL FAM SAT
Scale Scores for State, Region, County, Provider
State NE Carbon/Monroe/Pike Devereux (Carbon/Monroe/Pike)

93
Interpreting the Data
These data will allow you to compare the average response
from this provider to the average response from all people
sampled in the state, region, and AE (when applicable).
Some differences are less meaningful than others,
depending on things like the size of the sample and the range
of answers provided for that particular scale. “Confidence
intervals” are used to determine whether differences are
statistically significant, or meaningful. Confidence intervals
are reported in parentheses.
To determine whether the average score of the provider is
meaningfully different from the averages of the state,
region, or AE, you can look at whether these scores fall
outside or inside the provider’s confidence interval.
Meaningful differences are marked with an asterisk “*”.
Summary of Findings
• The provider scores significantly below average for the
state and AE on Individual Choice
• The provider scores significantly above average for the
state, region and AE on Family Satisfaction
Provider Profiles Data Display: Devereux (Chester AE) 2016-2017
Of the 5,328 individuals in the 2017 IM4Q data file, 15 individuals registered in Chester Administrative Entity received residential services from Devereux. The data
in this profile are for the provider’s community-based residential services. This report presents the scale scores for the State, the Southeast Region, Chester AE
and Devereux (Chester). There must be data for 10 or more individuals to meet our selection criteria for reporting. If the number of respondents for any item falls
below 5, a dash (-) is shown. For all of the scale scores, a higher score is better and the scores can range from 0 to 100. Confidence intervals for provider scores
are given. Link to explanation of items in scales is below.
* indicates meaningful difference
Link to explanation of the questions in each scale Above average marked by
SCALES State Southeast Chester Devereux (Chester)
Individual Satisfaction 85.87 82.83 85.41 80.21 (67.53 – 92.89)
Individual Choice 46.90* 37.62 43.27* 33.82 (27.43 – 40.22)
Individual Inclusion 43.72 39.99 43.52 41.47 (35.39 – 47.56)
Individual Dignity 82.28 79.12 80.36 78.03 (71.32 – 84.74)
Physical Quality 96.92 96.57 97.36 97.78 (94.81 – 100.00)
Family Satisfaction 90.54* 87.82* 90.79* 94.79 (91.03 – 98.56)
86
47 44
82
9791
83
38 40
79
978885
43 44
80
9791
80
3441
78
98 95
0
20
40
60
80
100
120
SATISFACTION CHOICE INCLUSION DIGNITY PHYS QUAL FAM SAT
Scale Scores for State, Region, County, Provider
State SE Chester Devereux (Chester)
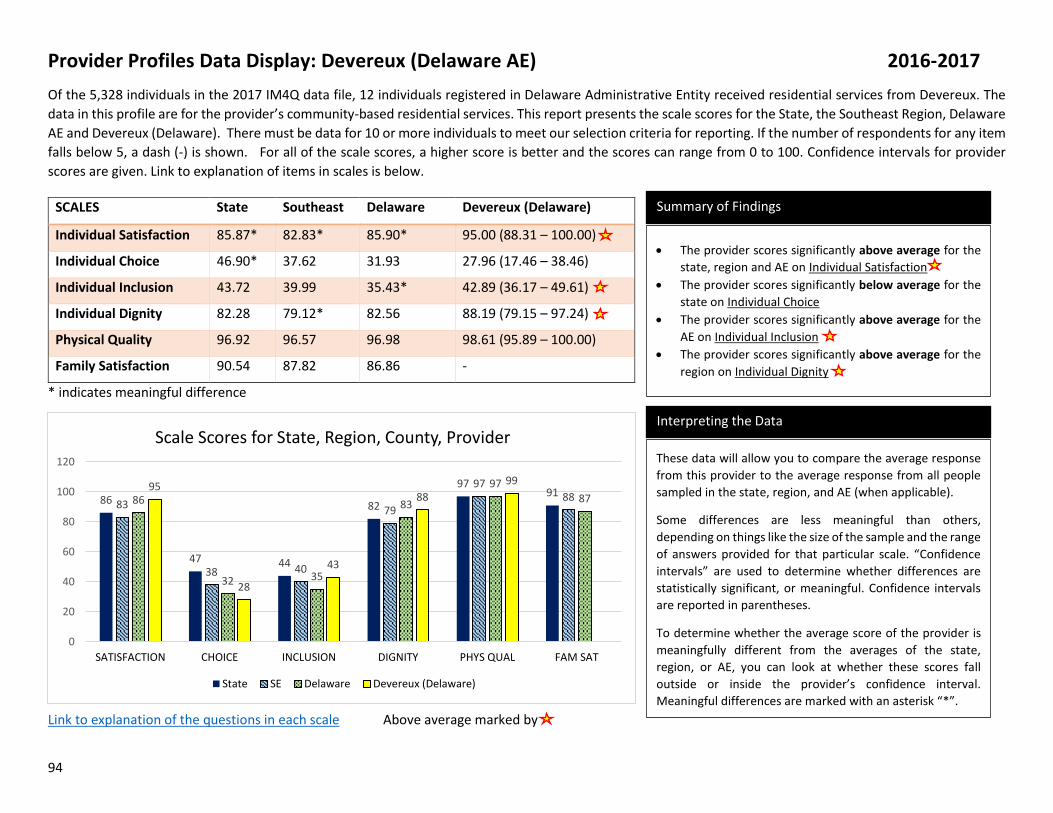
94
Interpreting the Data
These data will allow you to compare the average response
from this provider to the average response from all people
sampled in the state, region, and AE (when applicable).
Some differences are less meaningful than others,
depending on things like the size of the sample and the range
of answers provided for that particular scale. “Confidence
intervals” are used to determine whether differences are
statistically significant, or meaningful. Confidence intervals
are reported in parentheses.
To determine whether the average score of the provider is
meaningfully different from the averages of the state,
region, or AE, you can look at whether these scores fall
outside or inside the provider’s confidence interval.
Meaningful differences are marked with an asterisk “*”.
Summary of Findings
• The provider scores significantly above average for the
state, region and AE on Individual Satisfaction
• The provider scores significantly below average for the
state on Individual Choice
• The provider scores significantly above average for the
AE on Individual Inclusion
• The provider scores significantly above average for the
region on Individual Dignity
Provider Profiles Data Display: Devereux (Delaware AE) 2016-2017
Of the 5,328 individuals in the 2017 IM4Q data file, 12 individuals registered in Delaware Administrative Entity received residential services from Devereux. The
data in this profile are for the provider’s community-based residential services. This report presents the scale scores for the State, the Southeast Region, Delaware
AE and Devereux (Delaware). There must be data for 10 or more individuals to meet our selection criteria for reporting. If the number of respondents for any item
falls below 5, a dash (-) is shown. For all of the scale scores, a higher score is better and the scores can range from 0 to 100. Confidence intervals for provider
scores are given. Link to explanation of items in scales is below.
* indicates meaningful difference
Link to explanation of the questions in each scale Above average marked by
SCALES State Southeast Delaware Devereux (Delaware)
Individual Satisfaction 85.87* 82.83* 85.90* 95.00 (88.31 – 100.00)
Individual Choice 46.90* 37.62 31.93 27.96 (17.46 – 38.46)
Individual Inclusion 43.72 39.99 35.43* 42.89 (36.17 – 49.61)
Individual Dignity 82.28 79.12* 82.56 88.19 (79.15 – 97.24)
Physical Quality 96.92 96.57 96.98 98.61 (95.89 – 100.00)
Family Satisfaction 90.54 87.82 86.86 -
86
47 44
82
9791
83
38 40
79
978886
32 35
83
9787
95
28
43
88
99
0
20
40
60
80
100
120
SATISFACTION CHOICE INCLUSION DIGNITY PHYS QUAL FAM SAT
Scale Scores for State, Region, County, Provider
State SE Delaware Devereux (Delaware)

95
Provider Profile Summary: Divine Supports Services, LLC www.divinesupportsservices.com/
Our mission is to advance the quality of care and life of people with intellectual disabilities through care and empathy. We achieve the mission by hiring hardworking, competent, trustworthy and sympathetic caregivers to assist our consumers in maintaining their independence and dignity.
Out guiding values: Quality- Providing quality services and support through the hiring of qualified staff. Stability- Ensuring that consumers feel secure about changes in their lives. Safety-We understand the need of our consumers to feel safe in their immediate environment.
We have been serving people for 2.6 years.
We offer: Home and Community Hab and Nursing Adult Residential Facility services.
Our special expertise is medical needs and Behavior Support.
We ensure staff can effectively communicate with people they support through training on an ongoing basis to meet the needs of the consumers.
We engage people we support in the community through taking them to the YMCA, malls, rides, shopping and other community outings as well as visiting family members.
We support and engage families through encouraging visits.
Quality improvement project we are working on: Training staff on incident management, to recognize and report an incident in a timely manner.
We are dedicated to ensuring an everyday life for all of our consumers.

96
Provider Profile Summary: Do Moore, LLC www.domoore.net
As members of Do Moore, LLC, we are committed to preparing adults with disabilities for volunteer employment beyond the school years. We strive for individuals to do more for themselves, their community, and their world.
Do Moore's guiding values are to make a difference, being reliable, helping others, and showing tolerance.
Do Moore, LLC was established in the summer of 2008.
Do Moore, LLC provides individuals with volunteer job opportunities in the community. Our work sites include two elementary schools, a hospice office site, and a historical museum. Each job site gives the individual the opportunity to use different job skills. A Do Moore staff member is working beside the individuals in order to provide support if needed.
Do Moore, LLC participates fully in the community.
The individuals at Do Moore, LLC are mostly verbal. Staff communicates with the non-verbal individual through the augmentative device provided by that individual.
Do Moore, LLC is fully in the community. Throughout the day, individuals will interact with teachers, students, administrators, office workers, and staff members from the museum. Do Moore staff will encourage individuals to greet, ask questions, and will have them deliver completed projects to the people at the job sites. All of our job sites welcome the Do Moore Team.

97
Provider Profile Summary: Down to Earth Community Homes (DTE)
DTE's mission is to provide services to individuals with disabilities in community settings, utilizing the highest quality of services specifically designed to address an individual's needs and help them maximize their potential.
Some of the values that guide us are respect, dignity, safety, independence, empowerment, and self-fulfillment.
DTE was started in 2016 after the founders spent 20+ years as direct care professionals in community residential services. We feel that knowing firsthand the needs of the individual and of those supporting them is key to building a strong team and having successful outcomes.
DTE offers community living homes and staff support so individuals can become more independent and enjoy being part of their community. We help individuals maintain their health and safety while developing fellowship within the community using a consumer first approach, open communication, and a passion for the people we serve, our employees, and our services.
We at DTE ensure our staff are trained in the appropriate assistive technologies necessary for each individual.
We seek out community organizations and activities based on the individual’s preferences and abilities.
We feel families are an important building block in laying a strong foundation for an individual to become successful. Ongoing communication with families about the skills, interests, and needs of an individual, assists us in creating a strength-based approach to self-fulfillment, and a better quality of life for their loved one.

98
Provider Profile Summary: Dr. Gertrude A. Barber Center www.barberinstitute.org
We are making dreams come true. We provide children and adults with autism, intellectual disabilities or behavioral health challenges and their families the
education, support, and resources needed to be self-reliant, independent, valued members of their community. Professionals who serve them are provided with
world-class education and training. The Barber National Institute believes that all persons have the capacity for growth and fulfillment, and to that end, must be
afforded every opportunity to attain the greatest use of their potential within themselves and their community.
Our guiding values are our commitment to respect for all people, integrity, quality, excellence, teamwork and compassion in the conduct of our services to
individuals and their families. Barber National Institute has provided services to children and adults since 1952.
Barber National Institute provides services to individuals throughout their life span that include: *Adult Day Services that foster greater independence, increase
community involvement and improve social interaction; *Home & Community Habilitation providing opportunities to explore activities of individuals choosing to
become active members of the community; *a range of Employment services that provide work experiences and specialized training to help individuals obtain
competitive integrated employment within their community; and Senior programs geared toward the unique needs and interests of older adults.
*Adult Residential services include: * Community Homes with 2 to 4 individuals sharing a home; *Life Sharing through Family Living with 1 or 2 individuals living
in a private home with a person, or family, or approved relative; and *Respite Care providing caregivers with temporary residential support for an individual;
*Behavioral Health services for individuals of all ages and their families.
Agency with Choice program allows individuals to self-direct waiver services while remaining on their own or in the home of a family member. Services offered
through Agency with Choice include: *Companion services to supervise, assist or perform activities for an individual; * Respite services providing temporary
residential service giving family members a break; *Recreational Camps; *Home and Vehicle adaptations as necessary for an individual to remain as independent
as possible.
Staff are trained in the communication needs of each individual they serve. Staff are offered sign language classes as well as specific training in the communication
devices used by the individuals they work with. Through person centered planning which includes identification of interests, likes and dislikes, individuals are
provided support to participate in community activities, social, employment, and volunteer opportunities.
Families are integral members of the team developing individualized service plans to support individuals in their community. Open lines of communication
encourage families to ask questions or voice concerns. Annual satisfaction surveys are sent to families for their comments and feedback relative to services
provided.
Through internal program audits Barber identifies areas where improvement may be made to enhance quality services to individuals and their families. Our Quality
Management Plan identifies goals which are monitored quarterly by programs in areas identified from satisfaction surveys, state level monitoring and survey
results, as well as internal strategic planning. We encourage consumers and families to learn more about our organization and services by visiting
BarberInstitute.org.

99
Interpreting the Data
These data will allow you to compare the average response
from this provider to the average response from all people
sampled in the state, region, and AE (when applicable).
Some differences are less meaningful than others,
depending on things like the size of the sample and the range
of answers provided for that particular scale. “Confidence
intervals” are used to determine whether differences are
statistically significant, or meaningful. Confidence intervals
are reported in parentheses.
To determine whether the average score of the provider is
meaningfully different from the averages of the state,
region, or AE, you can look at whether these scores fall
outside or inside the provider’s confidence interval.
Meaningful differences are marked with an asterisk “*”.
Summary of Findings
• The provider scores significantly below average for the
state on Individual Choice
Provider Profiles Data Display: Dr. Gertrude A. Barber Center (Statewide 2016-2017
Of the 5,328 individuals in the 2017 IM4Q data file, 80 individuals registered in Pennsylvania received residential services from Barber. The data in this profile are
for the provider’s community-based residential services. This report presents the scale scores for the State of Pennsylvania and Barber (Statewide). There must
be data for 10 or more individuals to meet our selection criteria for reporting. If the number of respondents for any item falls below 5, a dash (-) is shown. For all
of the scale scores, a higher score is better and the scores can range from 0 to 100. Confidence intervals for provider scores are given. Link to explanation of items
in scales is below.
* indicates meaningful difference
Link to explanation of the questions in each scale Above average marked by
SCALES State Barber
Individual Satisfaction 85.87 82.33 (75.29 – 89.36)
Individual Choice 46.90* 41.57 (37.13 – 46.01)
Individual Inclusion 43.72 42.82 (39.76 – 45.87)
Individual Dignity 82.28 80.89 (77.06 – 84.73)
Physical Quality 96.92 97.75 (95.73 – 99.77)
Family Satisfaction 90.54 84.72 (71.22 – 98.22)
86
47 44
82
9791
82
42 43
81
98
85
0
20
40
60
80
100
120
SATISFACTION CHOICE INCLUSION DIGNITY PHYS QUAL FAM SAT
Scale Scores for State and Provider
State Barber

100
Interpreting the Data
These data will allow you to compare the average response
from this provider to the average response from all people
sampled in the state, region, and AE (when applicable).
Some differences are less meaningful than others,
depending on things like the size of the sample and the range
of answers provided for that particular scale. “Confidence
intervals” are used to determine whether differences are
statistically significant, or meaningful. Confidence intervals
are reported in parentheses.
To determine whether the average score of the provider is
meaningfully different from the averages of the state,
region, or AE, you can look at whether these scores fall
outside or inside the provider’s confidence interval.
Meaningful differences are marked with an asterisk “*”.
Summary of Findings
• The provider scores significantly above average for the
AE on Individual Inclusion
• The provider scores significantly above average for the
region on Individual Dignity
• The provider scores significantly above average for the
AE on Physical Quality
Provider Profiles Data Display: Dr. Gertrude A. Barber Center (Erie AE) 2016-2017
Of the 5,328 individuals in the 2017 IM4Q data file, 58 individuals registered in Erie Administrative Entity received residential services from Barber. The data in this
profile are for the provider’s community-based residential services. This report presents the scale scores for the State, the West Region, Erie AE and Barber (Erie).
There must be data for 10 or more individuals to meet our selection criteria for reporting. If the number of respondents for any item falls below 5, a dash (-) is
shown. For all of the scale scores, a higher score is better and the scores can range from 0 to 100. Confidence intervals for provider scores are given. Link to
explanation of items in scales is below.
* indicates meaningful difference
Link to explanation of the questions in each scale Above average marked by
SCALES State West Erie Barber (Erie AE)
Individual Satisfaction 85.87 85.05 85.24 88.01 (82.83 – 93.19)
Individual Choice 46.90 49.35 44.53 44.88 (39.98 – 49.77)
Individual Inclusion 43.72 43.58 37.48* 44.33 (41.16 – 47.49)
Individual Dignity 82.28 80.22* 80.91 84.58 (80.33 – 88.84)
Physical Quality 96.92 97.13 93.82* 97.66 (95.15 – 100.00)
Family Satisfaction 90.54 91.79 89.83 -
86
47 44
82
9791
85
4944
80
9792
85
4537
81
949088
45 44
85
98
00
20
40
60
80
100
120
SATISFACTION CHOICE INCLUSION DIGNITY PHYS QUAL FAM SAT
Scale Scores for State, Region, County, Provider
State West Erie Barber (Erie)
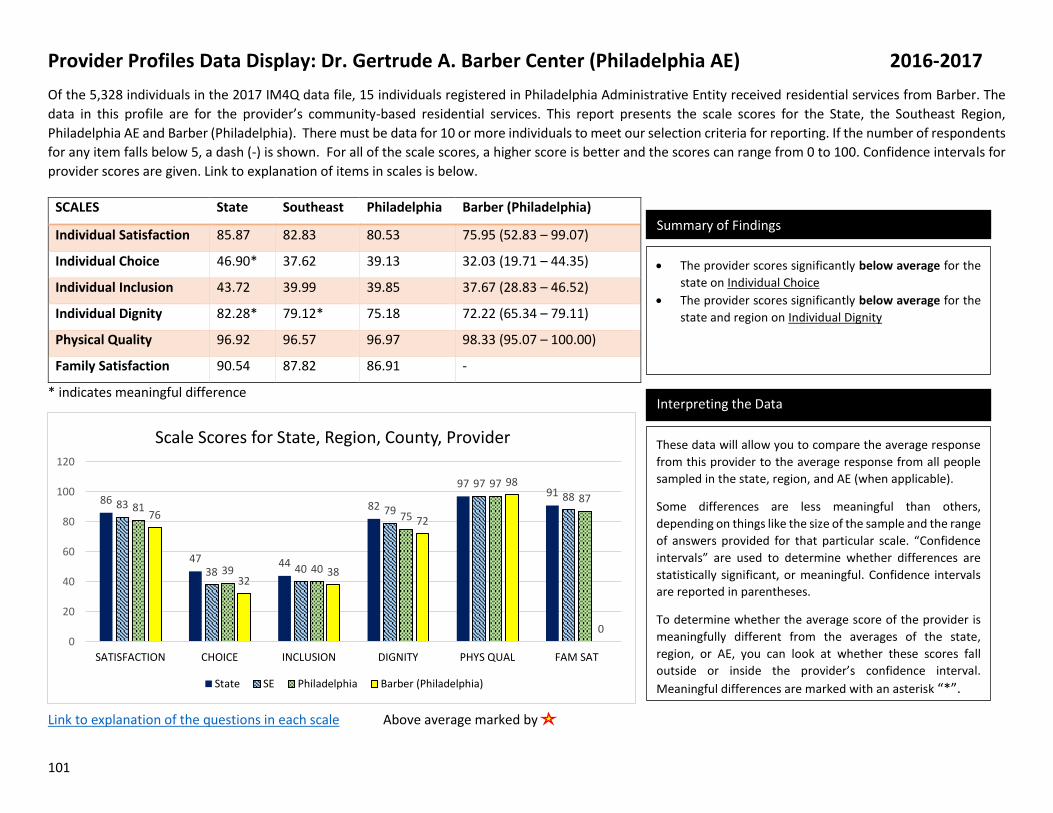
101
Interpreting the Data
These data will allow you to compare the average response
from this provider to the average response from all people
sampled in the state, region, and AE (when applicable).
Some differences are less meaningful than others,
depending on things like the size of the sample and the range
of answers provided for that particular scale. “Confidence
intervals” are used to determine whether differences are
statistically significant, or meaningful. Confidence intervals
are reported in parentheses.
To determine whether the average score of the provider is
meaningfully different from the averages of the state,
region, or AE, you can look at whether these scores fall
outside or inside the provider’s confidence interval.
Meaningful differences are marked with an asterisk “*”.
Summary of Findings
• The provider scores significantly below average for the
state on Individual Choice
• The provider scores significantly below average for the
state and region on Individual Dignity
Provider Profiles Data Display: Dr. Gertrude A. Barber Center (Philadelphia AE) 2016-2017
Of the 5,328 individuals in the 2017 IM4Q data file, 15 individuals registered in Philadelphia Administrative Entity received residential services from Barber. The
data in this profile are for the provider’s community-based residential services. This report presents the scale scores for the State, the Southeast Region,
Philadelphia AE and Barber (Philadelphia). There must be data for 10 or more individuals to meet our selection criteria for reporting. If the number of respondents
for any item falls below 5, a dash (-) is shown. For all of the scale scores, a higher score is better and the scores can range from 0 to 100. Confidence intervals for
provider scores are given. Link to explanation of items in scales is below.
* indicates meaningful difference
Link to explanation of the questions in each scale Above average marked by
SCALES State Southeast Philadelphia Barber (Philadelphia)
Individual Satisfaction 85.87 82.83 80.53 75.95 (52.83 – 99.07)
Individual Choice 46.90* 37.62 39.13 32.03 (19.71 – 44.35)
Individual Inclusion 43.72 39.99 39.85 37.67 (28.83 – 46.52)
Individual Dignity 82.28* 79.12* 75.18 72.22 (65.34 – 79.11)
Physical Quality 96.92 96.57 96.97 98.33 (95.07 – 100.00)
Family Satisfaction 90.54 87.82 86.91 -
86
47 44
82
9791
83
38 40
79
9788
81
39 40
75
9787
76
3238
72
98
00
20
40
60
80
100
120
SATISFACTION CHOICE INCLUSION DIGNITY PHYS QUAL FAM SAT
Scale Scores for State, Region, County, Provider
State SE Philadelphia Barber (Philadelphia)

102
Provider Profile Summary: Eagle Valley Community Home Services
Eagle Valley Services is committed to providing quality care to individuals with intellectual disabilities. Eagle Valley provides services that enable individuals to achieve greater independence, choice and opportunity in their lives based on the individuals’ abilities, desires, goals, and needs via the most independent means possible. Eagle Valley provides services and supports that are flexible, innovative and person-centered and will accommodate individual needs to the best of our ability to enable individuals to remain in their homes and community for as long as possible.
Eagle Valley believes that people with disabilities have a right to an everyday life; a life that is no different than that of all other citizens, as outlined in Everyday Lives. We value what is important to people with disabilities and their families, who are striving for an everyday life. An everyday life is about opportunities, relationships, rights and responsibilities, being a member of the community, having a valued role, making a contribution to society, and having one’s rights as a citizen respected. Eagle Valley is committed to upholding these values as outlined in Everyday Lives.
Eagle Valley has been serving people for eight years.
Eagle Valley provides 24-hour staffing, maintenance services, on-call nursing services, transportation services, on-site laundry facilities and personal care services. We schedule appointments, maintain annual visits with individuals’ medical care team. We assist with obtaining other needed services. All homes are fully furnished, have internet phone and cable, and linens are provided.
Eagle Valley specializes in serving those with complex medical needs and dual diagnoses; individuals with MH and ID. We have an LPN on call and our CEO is a registered nurse, specializing in diabetic education. We also serve 13 individuals with MH in community living programs. As a corporation, we work together to share expertise and strategies which enables us to provide comprehensive care for these populations.
Staff are trained to the unique needs of the individual(s) being served, including communication and behavioral health needs. Staff are taught to examine behaviors as communication.
Eagle Valley encourages involvement in the community and activities in their community. Eagle Valley provides monthly opportunities for interaction among our participants and 2 large parties per year with our other community-based programs.
Eagle Valley is a family-oriented company that understands the importance of family. We encourage individuals to build and sustain positive relationships with their families and maintain communication with families. We encourage visitation in home and community settings.
Eagle Valley strives to improve and expand services. As individuals enter our program, we recognize a need to include more community-based and age appropriate activities.
Eagle Valley looks forward to expanding our program to meet the needs of individuals in our community. Our team consists of direct care staff who are kind,
compassionate, and enjoy the work they do. Eagle Valley values the relationships that can be built in a small-town setting which allow individuals to develop
relationships with their neighbors, get to know the locals and enjoy a quiet, peaceful life in their own homes.
103
Provider Profile Summary: Eastern Christian Children's Retreat (ECCR) www.eccretreat.org
The Eastern Christian Children's Retreat is a private, non-profit organization created to support individuals with a broad range of intellectual and developmental disabilities. The sincere desire of the founders and the Board of Directors is that each resident have the opportunity to achieve personal growth and a meaningful life. Such a life will be ministered to our residents by a caring, skilled and dedicated staff and guided by our Christian calling and principles.
Eastern Christian Children's Retreat guiding value: “More than a home supporting individuals of all ages with developmental disabilities.”
The Eastern Christian Children's Retreat has been serving people for 46.5 years.
The Eastern Christian Children's Retreat provides group home living, congregate care living with 24-hour nursing care and a day program.
We serve people with complex medical needs.
Staff can effectively communicate with people they support, through staff training and ongoing in-service.
Residents are involved in many aspects of their community, including church, community groups and employment, in some cases.
We support and engage families through regular communication and events.

104
Provider Profile Summary: Elwyn www.elwyn.org
“Through personal commitment, collective talent and innovation, Elwyn supports individuals with diverse challenges in shaping distinctive, meaningful lives.” Our five operating principles are Integrity, High Expectations, Safety, Accountability and Sustainability.
“I am a servant-leader, with a passion and enthusiasm for our mission. Because I share Elwyn’s deep sense of purpose, I am fully committed to being part of a collaborative, decisive, and courageous team that creates an organization of continuous learning.”
We have been serving people since 1852.
In Pennsylvania, Elwyn provides residential services on campus and in the community for people with intellectual disabilities (IDD). Campus- and community-style housing provides 24-hour care with nursing, activities and skills building. Campus residences are larger whereas community residences provide supports anywhere from 1 to 3-4 individuals in an apartment or a home. Direct Support Professionals provide supervision, assistance with daily living skills and support for safety 24 hours a day, seven days a week.
Life Sharing matches a person or a family and an individual who needs support but who wishes to live in a family-like environment. In Home Supports provides supports to the individual and his/her family/support system, including assistance in community integration, medical appointments, and working on skill acquisition.
Adult Day Services support individuals in programs where individuals learn, maintain, or improve skills such as self-care, personal hygiene, adaptive living, leisure, and social skill.
Older Adult Day Services support individuals 60 years old or older and those who are 18 or older with diagnoses of post-stroke dementia, Parkinson’s or Alzheimer’s disease or other neurological disorders.
Elwyn Industries’ programs provide vocational assessment, skill training, work center employment, supported employment services. Participants earn a commensurate wage for their work.
Career Supports/Supported Employment are services provided primarily in the community, related to finding and keeping employment and include community assessment, training, job placement and job support services in a variety of fields/locations. Transitional employment opportunities or mobile crews are also available.
All of Elwyn’s programs supporting individuals with IDD are monitored and/or licensed under many different regulations, including Department of Health, Department of Human Services, Office of Developmental Programs and Department of Aging, to name a few monitoring agencies.
We have special expertise with Deaf/hard of hearing and Prader-Willi specialized community residential programs.
Staff are trained on each individual’s needs, including communication. Trainings occur annually and as the needs change for the individual we support.
Individuals make choices for what they want to do, learn, based on their interests.
Individual-staff-family is the service triangle, and communication within and between this triangle is key.
We focus on community engagement, communications, and health-related topics such as diets/textures of diets to ensure that individuals are safe.
We are servant-leaders, with a passion and enthusiasm for our mission. We look forward to helping you with your journey!
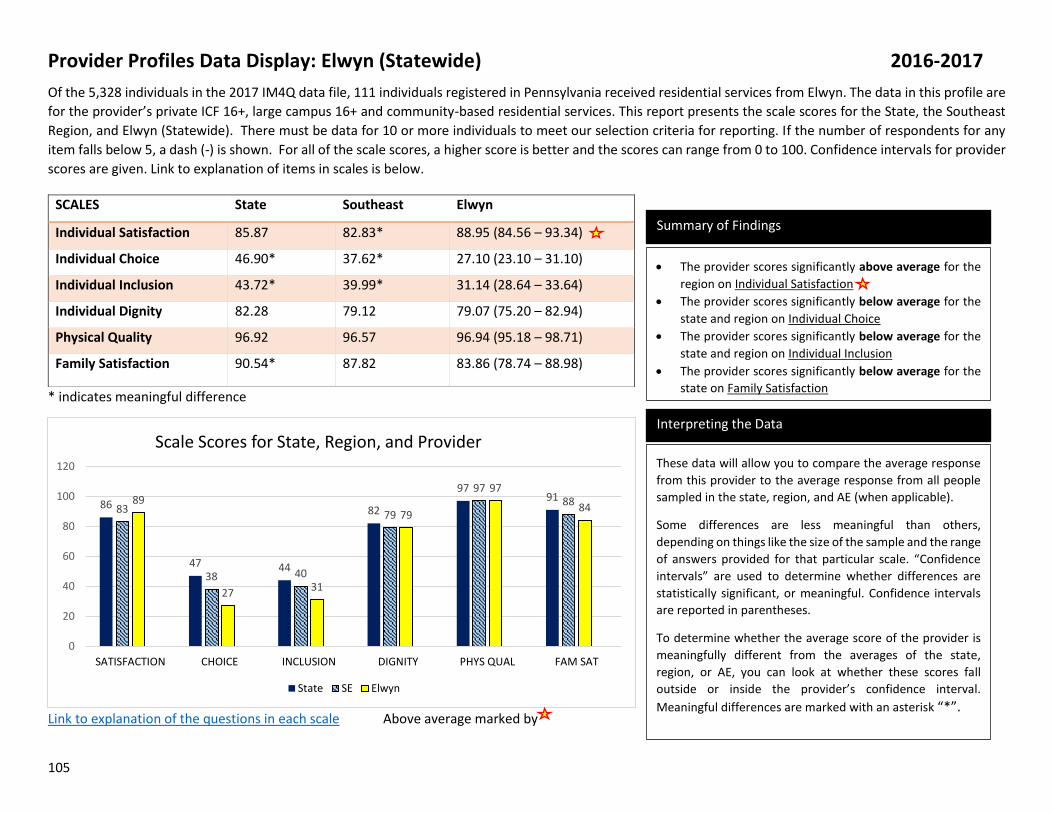
105
Interpreting the Data
These data will allow you to compare the average response
from this provider to the average response from all people
sampled in the state, region, and AE (when applicable).
Some differences are less meaningful than others,
depending on things like the size of the sample and the range
of answers provided for that particular scale. “Confidence
intervals” are used to determine whether differences are
statistically significant, or meaningful. Confidence intervals
are reported in parentheses.
To determine whether the average score of the provider is
meaningfully different from the averages of the state,
region, or AE, you can look at whether these scores fall
outside or inside the provider’s confidence interval.
Meaningful differences are marked with an asterisk “*”.
Summary of Findings
• The provider scores significantly above average for the
region on Individual Satisfaction
• The provider scores significantly below average for the
state and region on Individual Choice
• The provider scores significantly below average for the
state and region on Individual Inclusion
• The provider scores significantly below average for the
state on Family Satisfaction
Provider Profiles Data Display: Elwyn (Statewide) 2016-2017
Of the 5,328 individuals in the 2017 IM4Q data file, 111 individuals registered in Pennsylvania received residential services from Elwyn. The data in this profile are
for the provider’s private ICF 16+, large campus 16+ and community-based residential services. This report presents the scale scores for the State, the Southeast
Region, and Elwyn (Statewide). There must be data for 10 or more individuals to meet our selection criteria for reporting. If the number of respondents for any
item falls below 5, a dash (-) is shown. For all of the scale scores, a higher score is better and the scores can range from 0 to 100. Confidence intervals for provider
scores are given. Link to explanation of items in scales is below.
* indicates meaningful difference
Link to explanation of the questions in each scale Above average marked by
SCALES State Southeast Elwyn
Individual Satisfaction 85.87 82.83* 88.95 (84.56 – 93.34)
Individual Choice 46.90* 37.62* 27.10 (23.10 – 31.10)
Individual Inclusion 43.72* 39.99* 31.14 (28.64 – 33.64)
Individual Dignity 82.28 79.12 79.07 (75.20 – 82.94)
Physical Quality 96.92 96.57 96.94 (95.18 – 98.71)
Family Satisfaction 90.54* 87.82 83.86 (78.74 – 88.98)
86
47 44
82
9791
83
38 40
79
978889
2731
79
97
84
0
20
40
60
80
100
120
SATISFACTION CHOICE INCLUSION DIGNITY PHYS QUAL FAM SAT
Scale Scores for State, Region, and Provider
State SE Elwyn
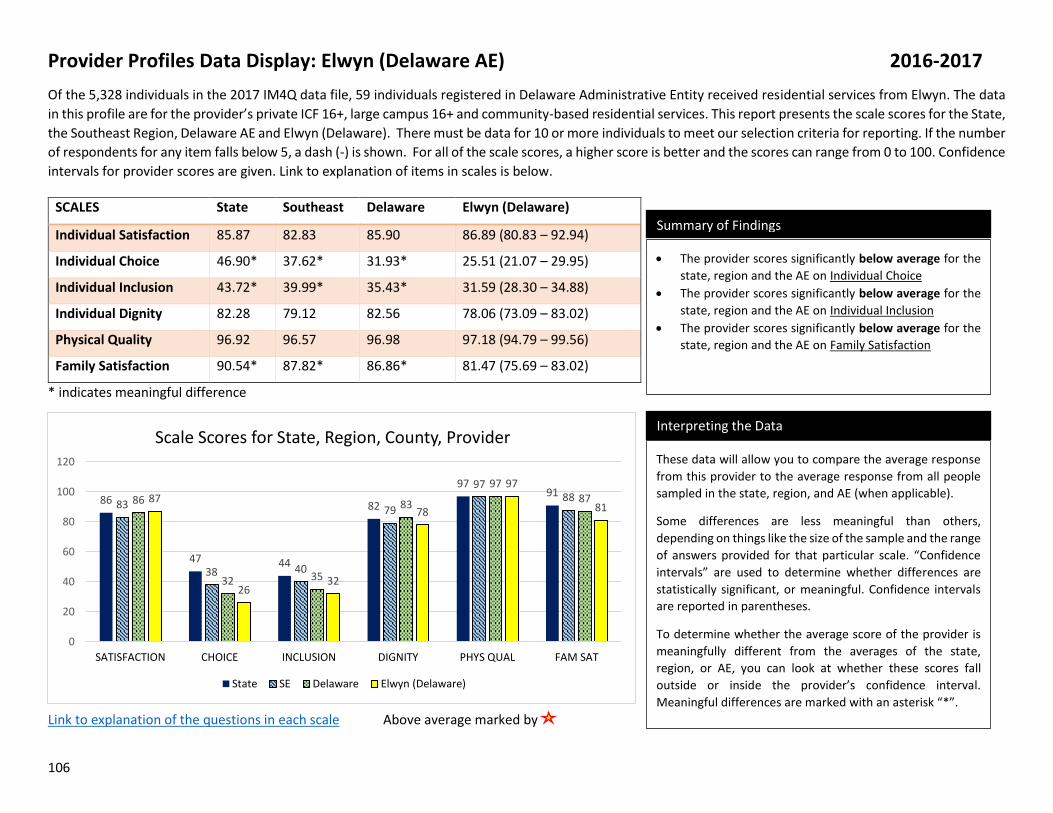
106
Interpreting the Data
These data will allow you to compare the average response
from this provider to the average response from all people
sampled in the state, region, and AE (when applicable).
Some differences are less meaningful than others,
depending on things like the size of the sample and the range
of answers provided for that particular scale. “Confidence
intervals” are used to determine whether differences are
statistically significant, or meaningful. Confidence intervals
are reported in parentheses.
To determine whether the average score of the provider is
meaningfully different from the averages of the state,
region, or AE, you can look at whether these scores fall
outside or inside the provider’s confidence interval.
Meaningful differences are marked with an asterisk “*”.
Summary of Findings
• The provider scores significantly below average for the
state, region and the AE on Individual Choice
• The provider scores significantly below average for the
state, region and the AE on Individual Inclusion
• The provider scores significantly below average for the
state, region and the AE on Family Satisfaction
Provider Profiles Data Display: Elwyn (Delaware AE) 2016-2017
Of the 5,328 individuals in the 2017 IM4Q data file, 59 individuals registered in Delaware Administrative Entity received residential services from Elwyn. The data
in this profile are for the provider’s private ICF 16+, large campus 16+ and community-based residential services. This report presents the scale scores for the State,
the Southeast Region, Delaware AE and Elwyn (Delaware). There must be data for 10 or more individuals to meet our selection criteria for reporting. If the number
of respondents for any item falls below 5, a dash (-) is shown. For all of the scale scores, a higher score is better and the scores can range from 0 to 100. Confidence
intervals for provider scores are given. Link to explanation of items in scales is below.
* indicates meaningful difference
Link to explanation of the questions in each scale Above average marked by
SCALES State Southeast Delaware Elwyn (Delaware)
Individual Satisfaction 85.87 82.83 85.90 86.89 (80.83 – 92.94)
Individual Choice 46.90* 37.62* 31.93* 25.51 (21.07 – 29.95)
Individual Inclusion 43.72* 39.99* 35.43* 31.59 (28.30 – 34.88)
Individual Dignity 82.28 79.12 82.56 78.06 (73.09 – 83.02)
Physical Quality 96.92 96.57 96.98 97.18 (94.79 – 99.56)
Family Satisfaction 90.54* 87.82* 86.86* 81.47 (75.69 – 83.02)
86
47 44
82
9791
83
38 40
79
978886
32 35
83
978787
2632
78
97
81
0
20
40
60
80
100
120
SATISFACTION CHOICE INCLUSION DIGNITY PHYS QUAL FAM SAT
Scale Scores for State, Region, County, Provider
State SE Delaware Elwyn (Delaware)

107
Interpreting the Data
These data will allow you to compare the average response
from this provider to the average response from all people
sampled in the state, region, and AE (when applicable).
Some differences are less meaningful than others,
depending on things like the size of the sample and the range
of answers provided for that particular scale. “Confidence
intervals” are used to determine whether differences are
statistically significant, or meaningful. Confidence intervals
are reported in parentheses.
To determine whether the average score of the provider is
meaningfully different from the averages of the state,
region, or AE, you can look at whether these scores fall
outside or inside the provider’s confidence interval.
Meaningful differences are marked with an asterisk “*”.
Summary of Findings
• The provider scores significantly above average for the
state, region and the AE on Individual Satisfaction
• The provider scores significantly below average for the
state and the AE on Individual Choice
• The provider scores significantly below average for the
state, region and the AE on Individual Inclusion
• The provider scores significantly above average for the
AE in Individual Dignity
• The provider scores significantly above average for the
state, region and the AE on Family Satisfaction
Provider Profiles Data Display: Elwyn (Philadelphia AE) 2016-2017
Of the 5,328 individuals in the 2017 IM4Q data file, 43 individuals registered in Philadelphia Administrative Entity received residential services from Elwyn. The
data in this profile are for the provider’s private ICF 16+ and community-based residential services. This report presents the scale scores for the State, the Southeast
Region, Philadelphia AE and Elwyn (Philadelphia). There must be data for 10 or more individuals to meet our selection criteria for reporting. If the number of
respondents for any item falls below 5, a dash (-) is shown. For all of the scale scores, a higher score is better and the scores can range from 0 to 100. Confidence
intervals for provider scores are given. Link to explanation of items in scales is below.
* indicates meaningful difference
Link to explanation of the questions in each scale Above average marked by
SCALES State Southeast Philadelphia Elwyn (Philadelphia)
Individual Satisfaction 85.87* 82.83* 80.53* 92.38 (87.70 – 97.06)
Individual Choice 46.90* 37.62 39.13* 31.16 (23.56 – 38.77)
Individual Inclusion 43.72* 39.99* 39.85* 30.19 (26.11 – 34.27)
Individual Dignity 82.28 79.12 75.18* 82.92 (76.66 – 89.18)
Physical Quality 96.92 96.57 96.97 96.75 (93.90 – 99.59)
Family Satisfaction 90.54* 87.82* 86.91* 96.68 (93.43 – 99.94)
86
47 44
82
9791
83
38 40
79
9788
81
39 40
75
97
8792
31 30
83
97 97
0
20
40
60
80
100
120
SATISFACTION CHOICE INCLUSION DIGNITY PHYS QUAL FAM SAT
Scale Scores for State, Region, County, Provider
State SE Philadelphia Elwyn (Philadelphia)

108
Provider Profile Summary: Emmaus Community of Pittsburgh, Inc www.emmauspgh.org
The Emmaus Community of Pittsburgh provides community-based residential homes and in-home supports for people with intellectual and other developmental disabilities and promotes public awareness of their needs. The Community is inspired by faith and a desire to help others, and seeks to improve the quality of life for persons with intellectual disabilities. In living, working, and breaking bread together, people with and without disabilities learn and grow together.
OUR VALUES: Hospitality - Everyone is welcome at Emmaus. Celebration - We celebrate the fact that every person has gifts and talents to share—Holidays, birthdays, and other special events are important in the life of our Community. Faith - Emmaus is ecumenical and we welcome people of all faiths—Individuals who desire to practice the faith of their choice are given support to do so. Relationships – Person-centered relationships, based on dignity and respect, form the basis of everything we do. Quality – Emmaus believes in going “above and beyond” to ensure the best possible supports and services.
Emmaus was founded in 1989 by Lorraine and Ken Wagner, parents of an adult with developmental disability, along with other family members, friends, and advocates.
In our residential homes, Direct Support Professionals provide around the clock supports, share meals and holidays, ensure all healthcare needs are met, and work to identify residents’ interests and passions. Emmaus In-Home Supports are for individuals who live in their own homes or with family, but need some level of support in order to succeed. We provide opportunities for people to become more self-reliant as they work to build new skills. In all of our supports, we recognize and cherish each person’s uniqueness, and we encourage everyone to grow and achieve personal goals and dreams.
All staff are trained on each person’s Individual Support Plan, including how to best support their unique communication needs.
Emmaus ensures that people with disabilities have the same access to community life that people without disabilities have.
When an individual receives supports from Emmaus, their family members become part of the Emmaus Community too. They’re invited to offer feedback formally and informally, they receive regular updates regarding their loved one, and they are welcome to attend special Emmaus events and celebrations. Some family members serve on the Board of Directors. Other family members choose to serve on a fundraising committee such as the Gala, Golf, 5K or Purse Bash. Emmaus also sends a special “Family Electronic Newsletter” out to keep everyone informed of Emmaus Community news.
Emmaus has implemented a Direct Support Professional recruitment campaign. Emmaus is working to build the strongest possible support network for the people we support, in order to ensure stability and a high quality of life for everyone. Emmaus also continues to grow its volunteer program, so individuals in the greater community have an opportunity to build relationships with people with intellectual disabilities and better understand their needs. Our Young Professional Advisory Board is open to post-college aged adults who wish to add value to Emmaus through service, leadership, and philanthropy.
109
Provider Profile Summary: Epic Health Services of PA LLC (Aveanna Healthcare) www.aveanna.com
Epic Health Service’s mission is to revolutionize the way pediatric healthcare is delivered, one patient at a time.
Epic Health Service’s guiding values are: Compassion, Team Integrity, Accountability, Trust, Innovation, Compliance, and Fun.
Epic Health Services has been serving people for 20 years.
We offer: Skilled Nursing Services, private duty nursing, personal care, housekeeping, meal preparation and companion care. We also accompany clients to school and accompany and encourage them to participate in community outings and events.
Staff are trained to work with clients that utilize communication devices. We also utilize a language line when necessary to assist with communication.
Skilled Nursing Services are available for clients with complex medical needs.
Families are involved from the admission of a client to services with Epic Health Services. Families are encouraged to contact the office at any time. The office provides an on-call service after normal business hours. Home visits by a clinical supervisor are scheduled periodically to allow families and the client to address questions and concerns.
We conduct satisfaction survey calls and the results are analyzed.
Epic Health Services/Aveanna Healthcare is a nationwide company that provides skilled nursing, home health aide and direct care worker services.

110
Provider Profile Summary: Erie Homes for Children and Adults www.ehca.org
The mission of EHCA is to assist people with disabilities to live rich and fulfilling lives. To fulfill this mission, EHCA provides compassionate, therapeutic, and
medical support to individuals of all ages and all levels of disability while enabling them to live with purpose and dignity. We provide opportunities and choices
for individuals to grow to their full potential, coordinating services that maximize ability and participation in a variety of community settings.
Each person with a disability should have the opportunity to make choices, to contribute to his or her own daily lifestyle, to obtain the best education or training
available, and to enjoy a home-like atmosphere with quality caregivers.
EHCA was founded in 1912.
Residential EHCA operates 19 group homes in Erie and Crawford counties, serving 100 full-time residents. The goal is to provide a true home environment for
residents while meeting their medical, social, and emotional needs. Quality caregivers help provide opportunities for enrichment and choices so that individuals
can grow to their full potential. Residents and staff members become a second family to one another, sharing meals, outings, and activities.
Adult Day Program – MOVE: MOVE (Making Opportunities for Volunteerism and Exploration) creates opportunities for exploration through community
engagement, volunteerism, and the arts. MOVE is a licensed adult day program with a community focus. Through unique partnerships with dozens of local
organizations, MOVE participants engage in meaningful work as community volunteers. Individuals take part in recreational activities, attend community events,
and visit community parks and other sites of interest. They play games with friends and use technology to explore and communicate.
Options: This multi-faceted program offers a variety of community-based daytime alternatives for families caring for loved ones with developmental disabilities at
home. Options staff members provide in-home supports, respite and companion services, group activities, community partnerships, and other services to meet
individual needs LifeSharing: This program matches a family with a person in need of supervised living. Staff members work hard to match individuals with providers
who can offer the home environment, skills, and opportunities that they need. Life Sharing providers find their own lives enriched by caring for individuals in their
homes, and participants thrive in a home environment as part of a caring family.
We provide residential services to individuals with behavioral support needs and complex medical needs. We also have employment services and community
participation.
Individual communication needs are identified, and staff are trained specifically to those individual’s needs.
Individuals make plans to attend special events in the community, use community resources, and volunteer. Resources to support individual interests.
Families receive newsletters. In addition, families are encouraged to participate in holiday parties, special events, and fundraising events. Families are encouraged
to visit. Families are also informed of updates on the individual’s health and participation in activities.
Promote health wellness and safety. Support individuals with complex needs. Develop and support qualified staff -reduce turnover rate, increase retention, etc.
Medication error reduction.
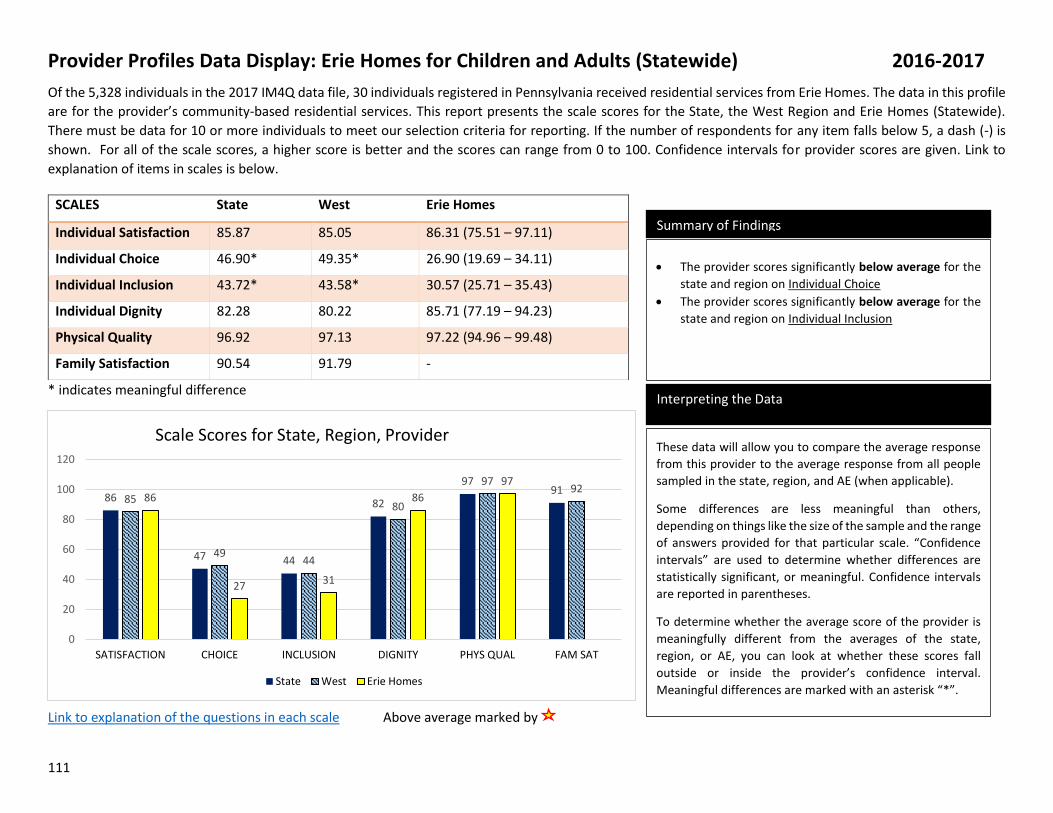
111
Interpreting the Data
These data will allow you to compare the average response
from this provider to the average response from all people
sampled in the state, region, and AE (when applicable).
Some differences are less meaningful than others,
depending on things like the size of the sample and the range
of answers provided for that particular scale. “Confidence
intervals” are used to determine whether differences are
statistically significant, or meaningful. Confidence intervals
are reported in parentheses.
To determine whether the average score of the provider is
meaningfully different from the averages of the state,
region, or AE, you can look at whether these scores fall
outside or inside the provider’s confidence interval.
Meaningful differences are marked with an asterisk “*”.
Summary of Findings
• The provider scores significantly below average for the
state and region on Individual Choice
• The provider scores significantly below average for the
state and region on Individual Inclusion
Provider Profiles Data Display: Erie Homes for Children and Adults (Statewide) 2016-2017
Of the 5,328 individuals in the 2017 IM4Q data file, 30 individuals registered in Pennsylvania received residential services from Erie Homes. The data in this profile
are for the provider’s community-based residential services. This report presents the scale scores for the State, the West Region and Erie Homes (Statewide).
There must be data for 10 or more individuals to meet our selection criteria for reporting. If the number of respondents for any item falls below 5, a dash (-) is
shown. For all of the scale scores, a higher score is better and the scores can range from 0 to 100. Confidence intervals for provider scores are given. Link to
explanation of items in scales is below.
* indicates meaningful difference
Link to explanation of the questions in each scale Above average marked by
SCALES State West Erie Homes
Individual Satisfaction 85.87 85.05 86.31 (75.51 – 97.11)
Individual Choice 46.90* 49.35* 26.90 (19.69 – 34.11)
Individual Inclusion 43.72* 43.58* 30.57 (25.71 – 35.43)
Individual Dignity 82.28 80.22 85.71 (77.19 – 94.23)
Physical Quality 96.92 97.13 97.22 (94.96 – 99.48)
Family Satisfaction 90.54 91.79 -
86
47 44
82
9791
85
4944
80
9792
86
2731
86
97
0
20
40
60
80
100
120
SATISFACTION CHOICE INCLUSION DIGNITY PHYS QUAL FAM SAT
Scale Scores for State, Region, Provider
State West Erie Homes
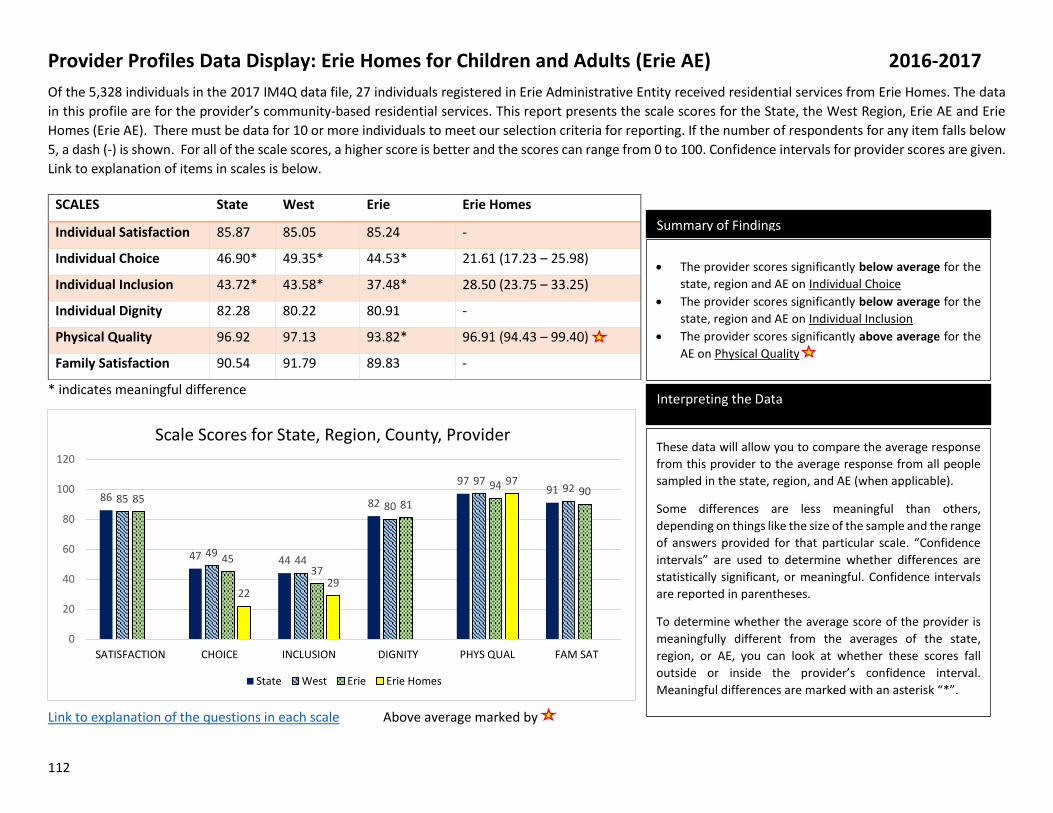
112
Interpreting the Data
These data will allow you to compare the average response
from this provider to the average response from all people
sampled in the state, region, and AE (when applicable).
Some differences are less meaningful than others,
depending on things like the size of the sample and the range
of answers provided for that particular scale. “Confidence
intervals” are used to determine whether differences are
statistically significant, or meaningful. Confidence intervals
are reported in parentheses.
To determine whether the average score of the provider is
meaningfully different from the averages of the state,
region, or AE, you can look at whether these scores fall
outside or inside the provider’s confidence interval.
Meaningful differences are marked with an asterisk “*”.
Summary of Findings
• The provider scores significantly below average for the
state, region and AE on Individual Choice
• The provider scores significantly below average for the
state, region and AE on Individual Inclusion
• The provider scores significantly above average for the
AE on Physical Quality
Provider Profiles Data Display: Erie Homes for Children and Adults (Erie AE) 2016-2017
Of the 5,328 individuals in the 2017 IM4Q data file, 27 individuals registered in Erie Administrative Entity received residential services from Erie Homes. The data
in this profile are for the provider’s community-based residential services. This report presents the scale scores for the State, the West Region, Erie AE and Erie
Homes (Erie AE). There must be data for 10 or more individuals to meet our selection criteria for reporting. If the number of respondents for any item falls below
5, a dash (-) is shown. For all of the scale scores, a higher score is better and the scores can range from 0 to 100. Confidence intervals for provider scores are given.
Link to explanation of items in scales is below.
* indicates meaningful difference
Link to explanation of the questions in each scale Above average marked by
SCALES State West Erie Erie Homes
Individual Satisfaction 85.87 85.05 85.24 -
Individual Choice 46.90* 49.35* 44.53* 21.61 (17.23 – 25.98)
Individual Inclusion 43.72* 43.58* 37.48* 28.50 (23.75 – 33.25)
Individual Dignity 82.28 80.22 80.91 -
Physical Quality 96.92 97.13 93.82* 96.91 (94.43 – 99.40)
Family Satisfaction 90.54 91.79 89.83 -
86
47 44
82
9791
85
4944
80
9792
85
4537
81
9490
2229
97
0
20
40
60
80
100
120
SATISFACTION CHOICE INCLUSION DIGNITY PHYS QUAL FAM SAT
Scale Scores for State, Region, County, Provider
State West Erie Erie Homes

113
Provider Profile Summary: Ewing House, LLC
Our Mission at Ewing House, LLC is to promote independence in the lives of those with intellectual and developmental disabilities and autism by creating an environment that focuses on person-centered care.
At Ewing House, LLC we are committed to supporting our individuals' highest level of functioning with a focus on improving independence and promoting self-choice in an environment that fosters dignity and respect.
Ewing House, LLC is a small family-owned and operated organization founded in 2014 to provide services in a home-like atmosphere for those individuals with intellectual and developmental disabilities and autism.
We offer Residential Services to our individuals to ensure they receive the supports they need to achieve greater independence in their lives and reach their fullest potential. In addition to staff support for activities of daily living, Ewing House, LLC offers individuals the opportunity to engage in day programming of their choice and to also enhance their lives with Supported Employment jobs through OVR.
Staff are trained on how to effectively communicate with each individual based on their ISP, behavioral plan, individual needs, and through specific guidance and mentoring by our in-house behavioral specialist. In addition, all staff receive on-going training in various areas to ensure the best possible communication with each individual we serve.
Each individual is given the opportunity to be involved in the community at their desired level of participation. Ewing House, LLC offers individuals many opportunities within their community through group outings such as attending community events and activities, local swimming pools, zoos, bowling, community dances, and county fairs to name a few. Additionally, individuals may choose to participate in church funded community programs and weekly services at the church of their choice.
Ewing House, LLC recognizes the importance of family involvement in all aspects of an individual's life and maintains and open-door policy for visitation. Staff
communicate regularly with family members, families are invited to participate in all scheduled events sponsored by Ewing House, LLC and are encouraged to
provide their input and opinion on how we can better serve their loved one.

114
Provider Profile Summary: Evergreen Homes www.eghinc.org
Evergreen Homes provides a diversified, individualized, and inclusive program for intellectually disabled persons, meeting current needs, changing needs and
lifetime needs. Our philosophy states that a quality service puts the needs of individuals served first in all situations.
We believe that every component of service delivery prioritizes the needs and wants of persons served, with individualized team-oriented treatment. Using the
principles of Everyday Lives and Positive Approaches, we strive to maintain an environment focused on individual worth, encouraging new challenges and
celebrating accomplishments.
Evergreen Homes was founded in the 1970's when community programs became a service option. We opened our first community home in 1976. We have adapted
to embrace new challenges and modified services to meet evolving needs, always seeking to advocate for individuals to have choice and control in their lives.
We offer a Residential Program with fifteen homes. Our Adult Day Services Program provides community participation services. In our Home and Community
Program individuals are supported to live independently with access to community options. The Family Aid Program provides respite sitting services to families
and assists individuals living in the community with medical appointments.
Evergreen Homes provides residential and day services to those with behavioral needs and medical needs, to include three homes adapted for wheelchair use.
We have adapted services and facilities to assist those aging through the program, so they can continue to receive the services they require. The day services
program has fostered community involvement and is increasing Community Participation Support services to assist program participants in finding out how to be
an asset to the neighborhoods they reside in.
Our staff are trained to understand and implement each person's preferred mode of communication and are expected to become familiar with the persons they
support to fully understand wants and needs.
By individualizing the service continuum, we assist individuals in exploring community activities that interest them, such as church groups, volunteering at local
libraries, animal shelters, or charitable organizations, and attending community events. A Crafts for Sale Program provides an opportunity to engage with
community members who purchase the merchandise while learning work skills needed to complete work tasks.
We encourage families to team with us in providing the highest quality service with open dialogue and constructive criticism to evaluate methods and improve
services. We recognize the importance of family and how their relationship with the person served is vital to fostering growth and self-reliance.
Through data analysis we set goals to reduce incidents that inhibit quality and strive to foster excellence in health and wellness. We work toward certifying staff
in Sign Language and Community Participation Supports to provide well trained direct service professional staffing. We make improvements when presented with
data from monitoring projects, quality assessments, and feedback from all areas of the service continuum.
Evergreen Homes is proud to have many long-term employees in every level of service, all serving 25 years or more to provide program stability that individuals
and families can rely on.

115
Interpreting the Data
These data will allow you to compare the average response
from this provider to the average response from all people
sampled in the state, region, and AE (when applicable).
Some differences are less meaningful than others,
depending on things like the size of the sample and the range
of answers provided for that particular scale. “Confidence
intervals” are used to determine whether differences are
statistically significant, or meaningful. Confidence intervals
are reported in parentheses.
To determine whether the average score of the provider is
meaningfully different from the averages of the state,
region, or AE, you can look at whether these scores fall
outside or inside the provider’s confidence interval.
Meaningful differences are marked with an asterisk “*”.
Summary of Findings
• The provider scores significantly below average for the
region and AE on Individual Choice
• The provider scores significantly above average for the
state, region and AE on Physical Quality
• The provider scores significantly above average for the
state and region on Family Satisfaction
Provider Profiles Data Display: Evergreen Homes (Armstrong/Indiana AE) 2016-2017
Of the 5,328 individuals in the 2017 IM4Q data file, 15 individuals registered in Armstrong/Indiana Administrative Entity received residential services from
Evergreen Homes. The data in this profile are for the provider’s community-based residential services. This report presents the scale scores for the State, the
Western Region, Armstrong/Indiana AE and Evergreen Homes (Armstrong/Indiana). There must be data for 10 or more individuals to meet our selection criteria
for reporting. If the number of respondents for any item falls below 5, a dash (-) is shown. For all of the scale scores, a higher score is better and the scores can
range from 0 to 100. Confidence intervals for provider scores are given. Link to explanation of items in scales is below.
* indicates meaningful difference **Statewide and AE specific data is the same for this provider
Link to explanation of the questions in each scale Above average marked by
SCALES State West Armstrong/ Indiana
Evergreen Homes (Armstrong/Indiana)**
Individual Satisfaction 85.87 85.05 87.95 83.21 (73.56 – 92.87)
Individual Choice 46.90 49.35* 51.34* 42.34 (36.53 – 48.15)
Individual Inclusion 43.72 43.58 49.74 46.38 (37.58 – 55.18)
Individual Dignity 82.28 80.22 87.87 83.68 (74.23 – 93.14)
Physical Quality 96.92* 97.13* 97.45* 100.00 (100.00 – 100.00)
Family Satisfaction 90.54* 91.79* 94.56 95.71 (92.01 – 99.42)
86
47 44
82
9791
85
4944
80
9792
88
51 50
8897 95
83
4246
84
10096
0
20
40
60
80
100
120
SATISFACTION CHOICE INCLUSION DIGNITY PHYS QUAL FAM SAT
Scale Scores for State, Region, County, Provider
State West Armstrong/Indiana AE Evergreen Homes (Armstrong/Indiana)
116
Provider Profile Summary: EXCENTIA www.ourexcentia.org
Excentia provides supports for people with developmental needs and autism throughout the lifespan. These services can start at birth with therapeutic and
educational programs for children and their families – some will use services for only a few months, and others until public school services take over. We also pick
up where school services leave off with adult day services, independent living, employment supports, and residential options. It’s our goal to provide
comprehensive supports for as little or as long as they are needed. Excentia is here to partner with you in as many ways as we can.
We are firm believers in self-determination and person-centered planning. All of the service options provided by Excentia are designed to encourage self-worth,
build independence, and promote measurable growth. It’s more than just taking people into a community setting - it’s about helping them become part of it.
Relationship building is the key concept to effective communication. We learn each person’s preferred way to communicate and utilize this to the maximum
benefit. Effective communication is stressed during our staff trainings. Excentia provides sign language training for staff as well. We encourage people to not only
be in the community but to also be an active member of the community.
People we support are encouraged to maintain relationships with their families as much as they want. Families are encouraged to visit with their loved one when
it is convenient for them and their loved one. Open lines of communication are very important between families and Excentia. Individuals spend time with their
families away from their home.
Excentia serves as a bridge between individuals and their communities by ensuring that some planned supports and services are aimed at increasing each person’s
social capital. Individuals will know the sense of pride, satisfaction and self-worth that comes from earning real wages for performing meaningful work. Excentia
provides a stable, effective and satisfied workforce. Excentia staff will demonstrate the successful learning and application of training in relation to Health
Promotion Plans, Supervision Plans, Specialized mealtime plans and recognition/ response to medical emergencies and when to call 911.
Excentia uses a dynamic team approach with individuals, families, friends, the community and staff. Everyone works to create a well-rounded schedule filled with
social outings, volunteer projects, skills development, and recreational activities.
Today you can see the people we support learning in preschools alongside other children with and without developmental needs, volunteering in nursing homes,
museums, and animal shelters throughout Lancaster County, as well as being gainfully employed with various businesses in the community.
At Excentia, it is all about relationships and results. Relationships are the focus at every level of the organization, from the families and people we support, to our
employees, to the community that becomes a better place to live.
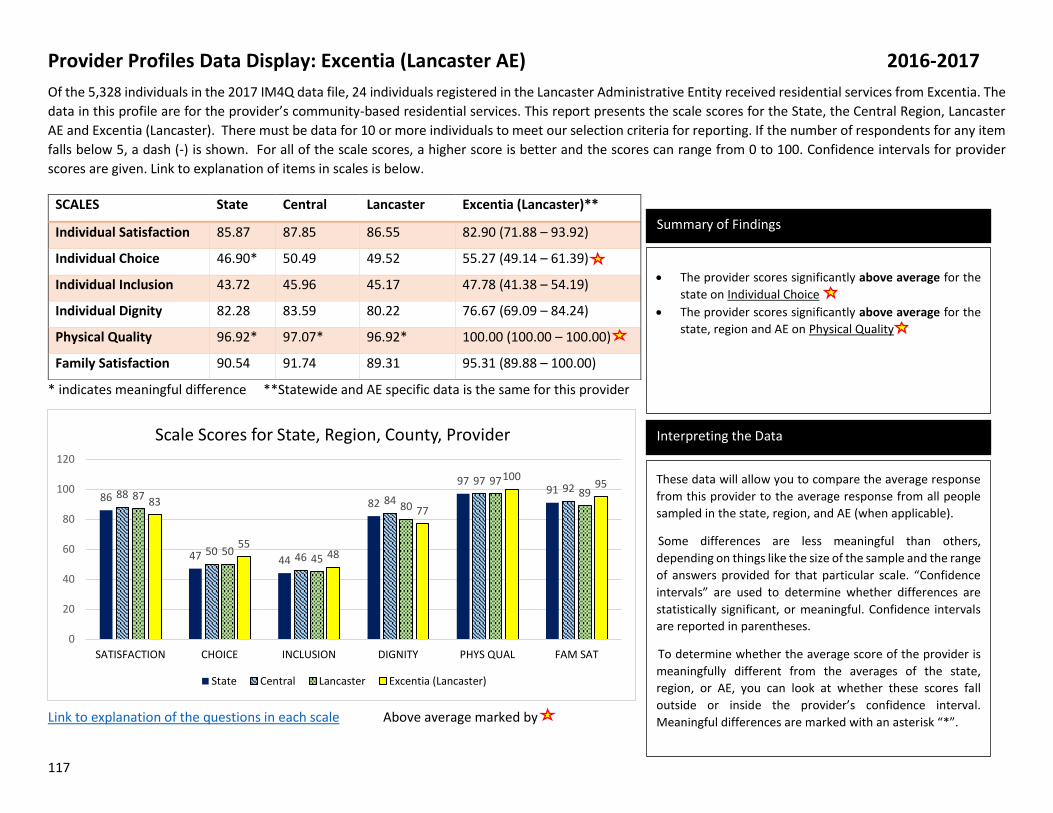
117
Interpreting the Data
These data will allow you to compare the average response
from this provider to the average response from all people
sampled in the state, region, and AE (when applicable).
Some differences are less meaningful than others,
depending on things like the size of the sample and the range
of answers provided for that particular scale. “Confidence
intervals” are used to determine whether differences are
statistically significant, or meaningful. Confidence intervals
are reported in parentheses.
To determine whether the average score of the provider is
meaningfully different from the averages of the state,
region, or AE, you can look at whether these scores fall
outside or inside the provider’s confidence interval.
Meaningful differences are marked with an asterisk “*”.
Summary of Findings
• The provider scores significantly above average for the
state on Individual Choice
• The provider scores significantly above average for the
state, region and AE on Physical Quality
Provider Profiles Data Display: Excentia (Lancaster AE) 2016-2017
Of the 5,328 individuals in the 2017 IM4Q data file, 24 individuals registered in the Lancaster Administrative Entity received residential services from Excentia. The
data in this profile are for the provider’s community-based residential services. This report presents the scale scores for the State, the Central Region, Lancaster
AE and Excentia (Lancaster). There must be data for 10 or more individuals to meet our selection criteria for reporting. If the number of respondents for any item
falls below 5, a dash (-) is shown. For all of the scale scores, a higher score is better and the scores can range from 0 to 100. Confidence intervals for provider
scores are given. Link to explanation of items in scales is below.
* indicates meaningful difference **Statewide and AE specific data is the same for this provider
Link to explanation of the questions in each scale Above average marked by
SCALES State Central Lancaster Excentia (Lancaster)**
Individual Satisfaction 85.87 87.85 86.55 82.90 (71.88 – 93.92)
Individual Choice 46.90* 50.49 49.52 55.27 (49.14 – 61.39)
Individual Inclusion 43.72 45.96 45.17 47.78 (41.38 – 54.19)
Individual Dignity 82.28 83.59 80.22 76.67 (69.09 – 84.24)
Physical Quality 96.92* 97.07* 96.92* 100.00 (100.00 – 100.00)
Family Satisfaction 90.54 91.74 89.31 95.31 (89.88 – 100.00)
86
47 44
82
979188
50 46
84
9792
87
5045
80
9789
83
5548
77
10095
0
20
40
60
80
100
120
SATISFACTION CHOICE INCLUSION DIGNITY PHYS QUAL FAM SAT
Scale Scores for State, Region, County, Provider
State Central Lancaster Excentia (Lancaster)
118
Provider Profile Summary: Excel Home Care www.excelhc.com/services
Excel Home Care provides compassionate and reliable support services to individuals with physical, intellectual and developmental disabilities in home and in the community. These services shall be of the highest quality and will be provided by pre-screened, trained, competent and ethical staff. Additionally, Excel Home Care will strive to maintain the consumer’s rights, well-being and quality of life, while promoting dignity and an independent lifestyle through the provisions of these services. Excel Home Care will assist the individuals being served with becoming active and participating members in their communities. We are committed to ongoing performance improvement and will continually seek ways to meet the needs of our consumers and community.
Excel Home Care believes in and adheres to the Office of Developmental Program’s (ODP) Everyday Lives principles. We believe that ALL individuals have the right to live their life as they choose and opt to meet their needs.
We have been supporting people since 2007.
We offer: Companion Services, In-Home and Community Supports (IHCS), Respite.
Excel Home Care is a wholly owned subsidiary of Help at Home LLC. Help at Home and their family of companies are able to provide support services in a variety of different capacities, which varies by location. We service individuals who are hard of hearing, people with behavioral support needs and people with complex medical needs. We also provide Employment Services, Community Participation Services and Residential Services.
Excel provides initial and on-going training to all Direct Support Professionals. In addition, each staff is specifically trained on the Individual’s Support Plan. For those who communicate through non-traditional means, Excel is able to assist families with accessing resources to obtain communication devices. Excel’s supervisors also encourage staff to be aware of their own non-verbal communication. This includes: body posture, body language, hand gestures, eye contact, therapeutic touch, and spacing. We strive to pair our DSPs with individuals and families where relationships based on trust, empathy and reciprocity can grow.
One of Excel’s top priorities is community integration. Excel works with many local businesses to ensure that those being served are respected, valued and cared for while participating in activities, or utilizing the business’ services. Community integration is a key component of ensuring that those being served find happiness and increase their independence. The people we serve want to live their lives to the fullest and we consider it our duty to assist them on their journey of self-discovery.
Excel’s model of service delivery highlights family members/friends as Direct Support Professionals (DSPs). In this model, family members and friends of the individual receiving services are hired and trained by Excel., Use of this model allows family members and friends to provide support for individuals and also be compensated for it. The ability for family members and friends to provide services has been hugely beneficial for everyone and is helping to relieve a multiplicity of difficulties – it provides financial relief, frees up time, allows for more consistency with staffing and builds upon an already flourishing relationship. Often, this model has enabled people to receive services who would otherwise go without them.

119
Provider Profile Summary: Faithful Homes LLC www.faithfulhomespa.com
Our mission is to provide revolutionary supports to individuals with intellectual and/or developmental disabilities to promote their independence. Our vision is to come alongside the individuals we support and support and encourage them to set goals and accomplish them to promote a better quality of life.
Faithful Homes continues to strive to provide dynamic services while working alongside individuals and their families to promote the healthiest environment for the individual.
Faithful Homes was founded in late 2017 with the goal to support individuals to live their most fulfilled lives possible. From its inception, Faithful Homes has grown to provide residential housing for individuals in Lancaster County, as well as being an approved provider for Community Participation Supports (CPS) and Lifesharing.
Lifesharing provides a family with the unique opportunity to share their home with an individual looking for permanent placement. Faithful Homes, LLC provides residential housing for individuals with intellectual and/or developmental disabilities. Through Community Participation Supports, Faithful Homes staff work with individuals to find potential employment and/or volunteer opportunities, as well as working to network and build strong, healthy relationships in their communities.
Faithful Homes offers individuals who want an individualized program to focus on Community Participation Supports (CPS). CPS allows individuals to explore new opportunities while also becoming an integral part of their communities.
Staff are trained on all aspects of the Individual Support Plan for the individual they support, and how to effectively communicate with those individuals.
We strive to maintain strong, open communication with families with frequent direct communication and updates.
We survey our individuals regularly to learn areas where we can improve the quality of our services.
We are now a qualified Lifesharing provider and are looking for individuals and families interested in this support model.

120
Provider Profile Summary: Family Care Services www.familycareservices.org
Family Care Services provides services to adults with developmental disabilities, mental health services, and children’s services. Our mission is to provide supportive, community-based, family placements for children and adults who are not able to live with their own families. We encourage and support all individuals to achieve their maximum potential for independence in all growth and progress areas using a person-centered approach. The agency provides for the safety, permanence, and well-being of individuals while following the guidelines, rules and regulations of the referring counties, the state of Pennsylvania, and the federal government. Our ID program only serves adults. Our philosophy is to help everyone lead the quality life they choose. We embrace the Everyday Lives Principles. Services are provided in a family setting where individuals have an opportunity to build meaningful relationships with people who will support them in all areas of their lives.
We value individual choice and the establishment of meaningful relationships. Life Sharing is different than other residential options because it naturally allows the opportunity to create a trusting connection with a primary caregiver, as opposed to frequent staff changes where connections are more difficult.
We were founded in 1977.
We provide Life Sharing and respite services in private homes. Life-sharing is when an individual lives with a trained caregiver who teaches them to live life to their fullest potential. Respite is a temporary stay in a licensed home and is generally used to give bio-families a break. The same level of care and supervision is provided in both services.
FCS serves a wide range of people with ID. We have caregivers comfortable with supporting significant medical needs and the dually diagnosed. Our supervisory staff are highly educated and experienced. Among the 10 staff helping to run the ID program; six have at least one master’s degree, eight are FBA certified, and all are qualified to provide behavioral supports.
Language and communication preferences of an individual are considered during the referral and matching process. Additional language supports can also be sought and/or developed to improve an individual’s communication abilities.
Community inclusion is key in Life Sharing. We focus more on helping individuals find meaningful activities based on their own desires and wishes. Individuals are encouraged to become truly involved in the activities of their choice. These activities could include going to church, a show, vacations, community organizations, athletics, shopping, attending ARC events, going out to eat, etc.
Families are encouraged to participate in the individual’s Life Sharing placement to the highest level possible. Under normal circumstances, they are welcome to join every meeting and appointment, as well as continue to spend as much time with the individual as they wish and as desired by the individual.
Data shows that individuals in Life Sharing report the highest level of satisfaction, happiness, dignity, respect, and choice when compared to other types of residential options. To meet the need for expanded Life Sharing services, we initiated a strong and ongoing recruitment project to identify and attract qualified caregivers.
121
Provider Profile Summary: Fayette Resources www.fayetteresources.org
Our Mission at Fayette Resources is to support people with disabilities in the community by providing the highest quality, evidence based, individualized services,
which promote independence, choice, growth, acceptance and respect.
Fayette Guiding Values are to be the provider of choice for services for individuals with Intellectual and Developmental Disabilities (IDD) including those with
Autism Spectrum Disorder (ASD) and those with complex needs. Established in 1991, Fayette Resources, Inc. is an agency that serves children, adolescents and
adults with a variety of disabilities using a Bio-Psych-Social approach that is individualized and specific to the needs of the person.
Fayette provides the following services: Community Homes, the primary goals of the residential program are to support individuals in living successfully and
independently in the community, and offer a variety of activities that encompass, mind, body and spirit. Life Sharing, Fayette Resources’ Life Sharing Program is
an alternative way to provide community living. The consumers live in a host family’s home and are included as part of the family’s everyday life. Behavioral
Support Team, Our Behavioral Support Team works with individuals, families and school/agency staff to help alleviate challenging behaviors and/or mental health
symptoms that interfere with the individual’s quality of life. Adult Training, Fayette Resources provides practical, personalized Adult Training Services through its
Activity Centers. Individuals receive highly individualized, meaningful, integrative, and age-appropriate service across a variety of life domains. Supported and
Customized Employment, Industry-integrated training at Fayette Resources is an approach designed to assist businesses in hiring persons with disabilities.
MH Support Services, improving personal independence and achieving optimal mental health supports are the primary goals of our Community Residential
Rehabilitation and Specialized Supportive Housing programs. NADD Accreditation and Staff Certification, At the heart of Fayette Resources is the National
Association of Dual Diagnosis (NADD) accredited residential program. Individuals are supported by clinical and Direct Support Professionals (DSPs) who receive
specialized training in Dual Diagnosis and are certified by NADD.
Each participant’s communication skills are assessed annually to determine need and level of support. Strategies are developed to assist the participant improve
their communication. All staff working with the participant receive training on these communication strategies. Fayette Resources places an emphasis on
community engagement on a variety of levels from work activities, social groups, recreational and spiritual groups to opportunities for volunteering.
Families are invited to participate in the development of the support plan, providing feedback following home visits or family events, completing annual satisfaction
surveys and by regular communication by staff.
As part a Quality Management Plan, performance data is gathered and analyzed to determine areas needing improvement. Some areas of focus in the plan include
reductions of restrictive interventions and of medication errors, compliance with state and federal regulations, and increase satisfaction of our participants,
families and employees.
Currently Fayette Resources is the only residential provider in the United States that has earned the national Association on Dual Diagnosis (NADD) Accreditation.
It is the seal of approval from NADD that is supported by The National Association of State Directors of Developmental Disabilities Services (NASDDDS).
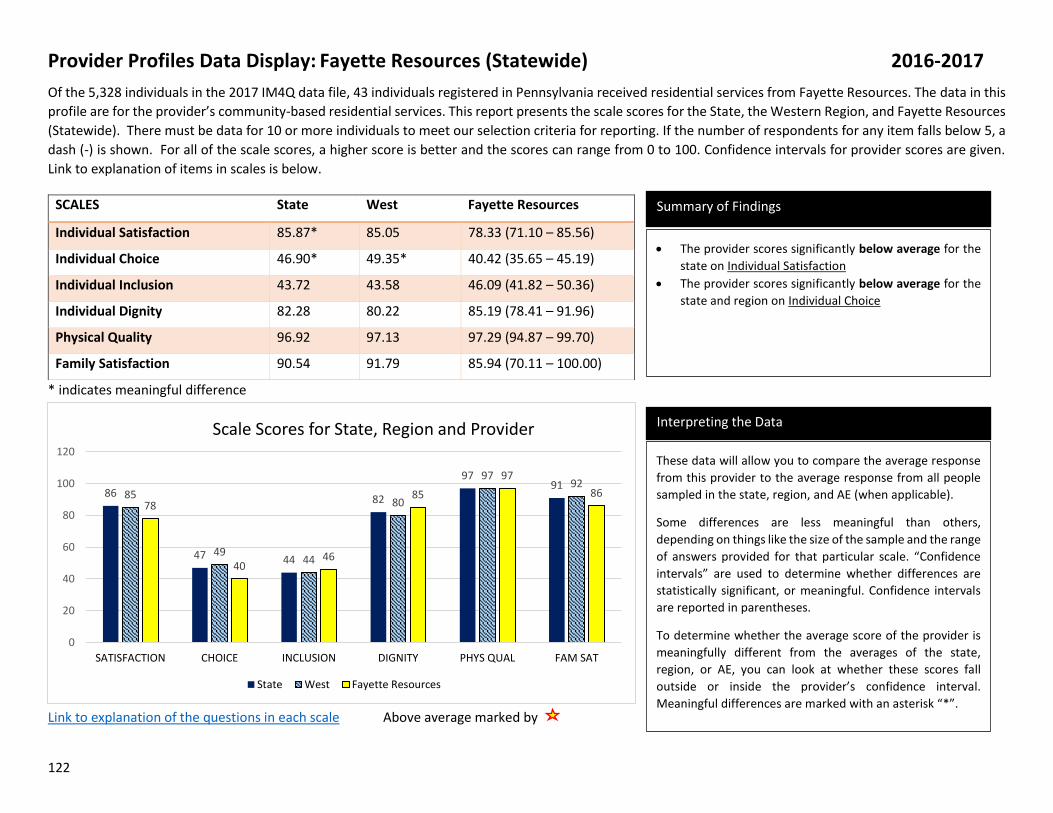
122
Interpreting the Data
These data will allow you to compare the average response
from this provider to the average response from all people
sampled in the state, region, and AE (when applicable).
Some differences are less meaningful than others,
depending on things like the size of the sample and the range
of answers provided for that particular scale. “Confidence
intervals” are used to determine whether differences are
statistically significant, or meaningful. Confidence intervals
are reported in parentheses.
To determine whether the average score of the provider is
meaningfully different from the averages of the state,
region, or AE, you can look at whether these scores fall
outside or inside the provider’s confidence interval.
Meaningful differences are marked with an asterisk “*”.
Summary of Findings
• The provider scores significantly below average for the
state on Individual Satisfaction
• The provider scores significantly below average for the
state and region on Individual Choice
Provider Profiles Data Display: Fayette Resources (Statewide) 2016-2017
Of the 5,328 individuals in the 2017 IM4Q data file, 43 individuals registered in Pennsylvania received residential services from Fayette Resources. The data in this
profile are for the provider’s community-based residential services. This report presents the scale scores for the State, the Western Region, and Fayette Resources
(Statewide). There must be data for 10 or more individuals to meet our selection criteria for reporting. If the number of respondents for any item falls below 5, a
dash (-) is shown. For all of the scale scores, a higher score is better and the scores can range from 0 to 100. Confidence intervals for provider scores are given.
Link to explanation of items in scales is below.
* indicates meaningful difference
Link to explanation of the questions in each scale Above average marked by
SCALES State West Fayette Resources
Individual Satisfaction 85.87* 85.05 78.33 (71.10 – 85.56)
Individual Choice 46.90* 49.35* 40.42 (35.65 – 45.19)
Individual Inclusion 43.72 43.58 46.09 (41.82 – 50.36)
Individual Dignity 82.28 80.22 85.19 (78.41 – 91.96)
Physical Quality 96.92 97.13 97.29 (94.87 – 99.70)
Family Satisfaction 90.54 91.79 85.94 (70.11 – 100.00)
86
47 44
82
9791
85
4944
80
9792
78
4046
85
97
86
0
20
40
60
80
100
120
SATISFACTION CHOICE INCLUSION DIGNITY PHYS QUAL FAM SAT
Scale Scores for State, Region and Provider
State West Fayette Resources
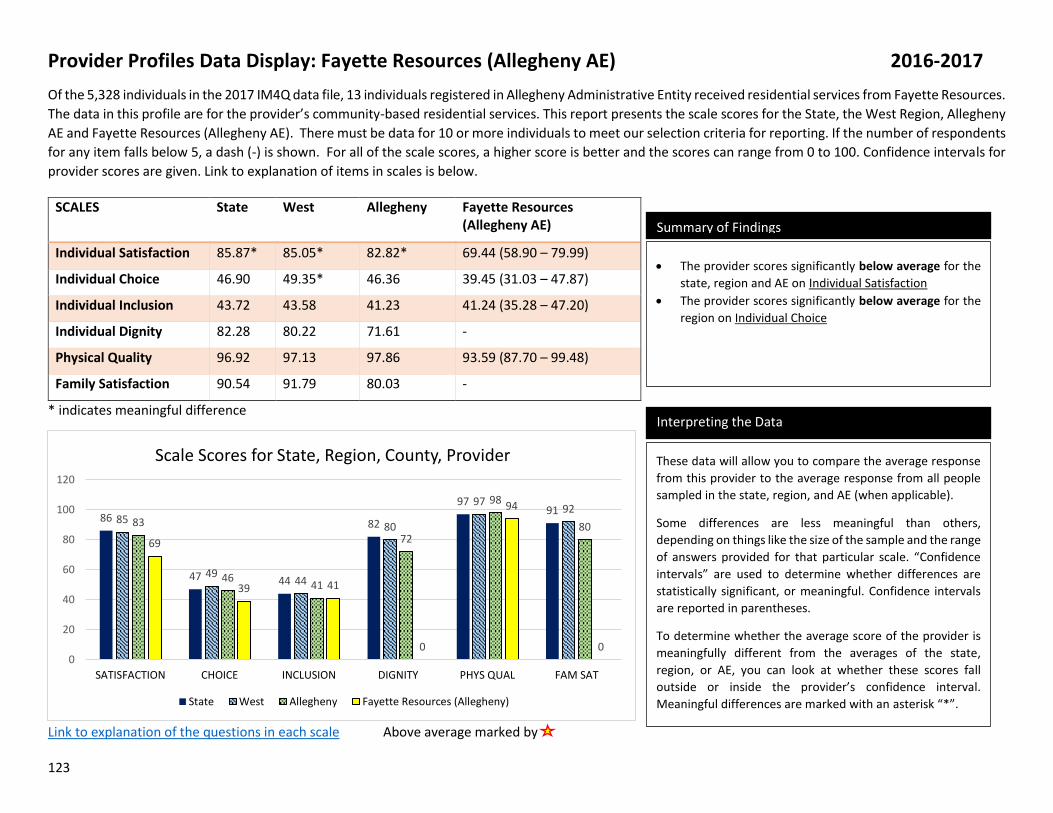
123
Interpreting the Data
These data will allow you to compare the average response
from this provider to the average response from all people
sampled in the state, region, and AE (when applicable).
Some differences are less meaningful than others,
depending on things like the size of the sample and the range
of answers provided for that particular scale. “Confidence
intervals” are used to determine whether differences are
statistically significant, or meaningful. Confidence intervals
are reported in parentheses.
To determine whether the average score of the provider is
meaningfully different from the averages of the state,
region, or AE, you can look at whether these scores fall
outside or inside the provider’s confidence interval.
Meaningful differences are marked with an asterisk “*”.
Summary of Findings
• The provider scores significantly below average for the
state, region and AE on Individual Satisfaction
• The provider scores significantly below average for the
region on Individual Choice
Provider Profiles Data Display: Fayette Resources (Allegheny AE) 2016-2017
Of the 5,328 individuals in the 2017 IM4Q data file, 13 individuals registered in Allegheny Administrative Entity received residential services from Fayette Resources.
The data in this profile are for the provider’s community-based residential services. This report presents the scale scores for the State, the West Region, Allegheny
AE and Fayette Resources (Allegheny AE). There must be data for 10 or more individuals to meet our selection criteria for reporting. If the number of respondents
for any item falls below 5, a dash (-) is shown. For all of the scale scores, a higher score is better and the scores can range from 0 to 100. Confidence intervals for
provider scores are given. Link to explanation of items in scales is below.
* indicates meaningful difference
Link to explanation of the questions in each scale Above average marked by
SCALES State West Allegheny Fayette Resources (Allegheny AE)
Individual Satisfaction 85.87* 85.05* 82.82* 69.44 (58.90 – 79.99)
Individual Choice 46.90 49.35* 46.36 39.45 (31.03 – 47.87)
Individual Inclusion 43.72 43.58 41.23 41.24 (35.28 – 47.20)
Individual Dignity 82.28 80.22 71.61 -
Physical Quality 96.92 97.13 97.86 93.59 (87.70 – 99.48)
Family Satisfaction 90.54 91.79 80.03 -
86
47 44
82
9791
85
4944
80
9792
83
4641
72
98
80
69
39 41
0
94
00
20
40
60
80
100
120
SATISFACTION CHOICE INCLUSION DIGNITY PHYS QUAL FAM SAT
Scale Scores for State, Region, County, Provider
State West Allegheny Fayette Resources (Allegheny)
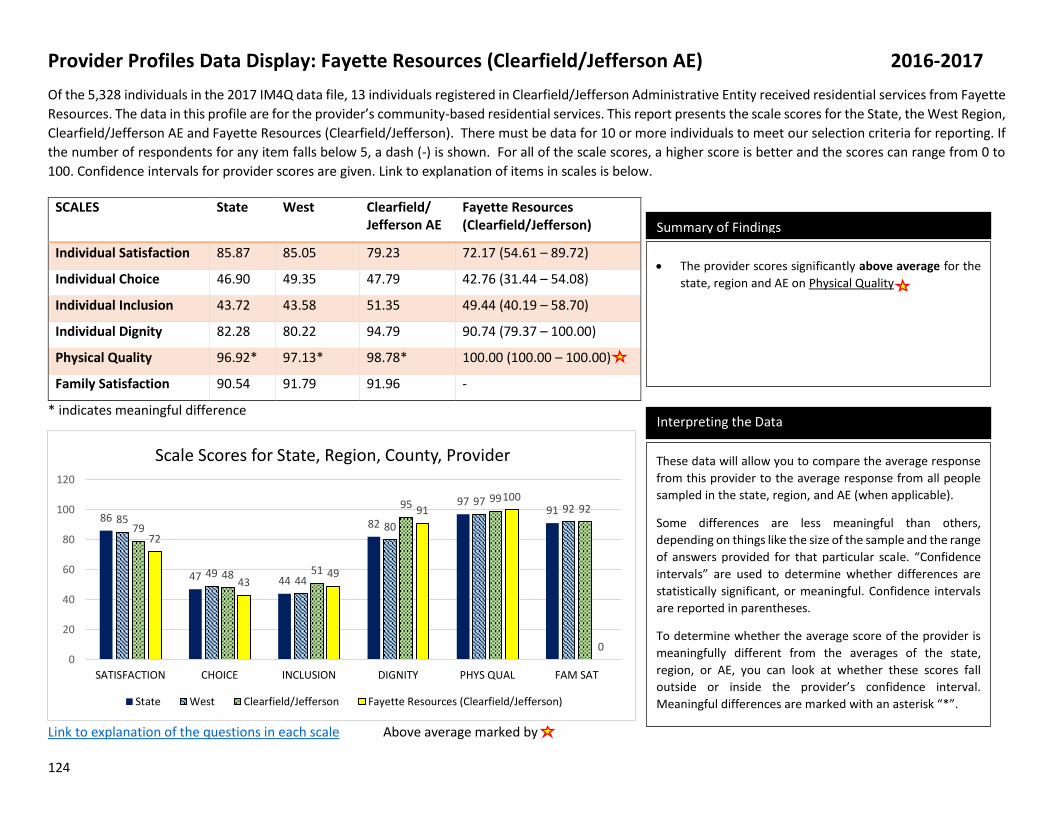
124
Interpreting the Data
These data will allow you to compare the average response
from this provider to the average response from all people
sampled in the state, region, and AE (when applicable).
Some differences are less meaningful than others,
depending on things like the size of the sample and the range
of answers provided for that particular scale. “Confidence
intervals” are used to determine whether differences are
statistically significant, or meaningful. Confidence intervals
are reported in parentheses.
To determine whether the average score of the provider is
meaningfully different from the averages of the state,
region, or AE, you can look at whether these scores fall
outside or inside the provider’s confidence interval.
Meaningful differences are marked with an asterisk “*”.
Summary of Findings
• The provider scores significantly above average for the
state, region and AE on Physical Quality
Provider Profiles Data Display: Fayette Resources (Clearfield/Jefferson AE) 2016-2017
Of the 5,328 individuals in the 2017 IM4Q data file, 13 individuals registered in Clearfield/Jefferson Administrative Entity received residential services from Fayette
Resources. The data in this profile are for the provider’s community-based residential services. This report presents the scale scores for the State, the West Region,
Clearfield/Jefferson AE and Fayette Resources (Clearfield/Jefferson). There must be data for 10 or more individuals to meet our selection criteria for reporting. If
the number of respondents for any item falls below 5, a dash (-) is shown. For all of the scale scores, a higher score is better and the scores can range from 0 to
100. Confidence intervals for provider scores are given. Link to explanation of items in scales is below.
* indicates meaningful difference
Link to explanation of the questions in each scale Above average marked by
SCALES State West Clearfield/ Jefferson AE
Fayette Resources (Clearfield/Jefferson)
Individual Satisfaction 85.87 85.05 79.23 72.17 (54.61 – 89.72)
Individual Choice 46.90 49.35 47.79 42.76 (31.44 – 54.08)
Individual Inclusion 43.72 43.58 51.35 49.44 (40.19 – 58.70)
Individual Dignity 82.28 80.22 94.79 90.74 (79.37 – 100.00)
Physical Quality 96.92* 97.13* 98.78* 100.00 (100.00 – 100.00)
Family Satisfaction 90.54 91.79 91.96 -
86
47 44
82
9791
85
4944
80
9792
79
48 51
9599
92
72
4349
91100
00
20
40
60
80
100
120
SATISFACTION CHOICE INCLUSION DIGNITY PHYS QUAL FAM SAT
Scale Scores for State, Region, County, Provider
State West Clearfield/Jefferson Fayette Resources (Clearfield/Jefferson)

125
Interpreting the Data
These data will allow you to compare the average response
from this provider to the average response from all people
sampled in the state, region, and AE (when applicable).
Some differences are less meaningful than others,
depending on things like the size of the sample and the range
of answers provided for that particular scale. “Confidence
intervals” are used to determine whether differences are
statistically significant, or meaningful. Confidence intervals
are reported in parentheses.
To determine whether the average score of the provider is
meaningfully different from the averages of the state,
region, or AE, you can look at whether these scores fall
outside or inside the provider’s confidence interval.
Meaningful differences are marked with an asterisk “*”.
Summary of Findings
• The provider scores significantly below average for the
state and region on Individual Choice
• The provider scores significantly above average for the
state, region and AE on Physical Quality
Provider Profiles Data Display: Fayette Resources (Fayette AE) 2016-2017
Of the 5,328 individuals in the 2017 IM4Q data file, 13 individuals registered in Fayette Administrative Entity received residential services from Fayette Resources.
The data in this profile are for the provider’s community-based residential services. This report presents the scale scores for the State, the West Region, Fayette
AE and Fayette Resources (Fayette). There must be data for 10 or more individuals to meet our selection criteria for reporting. If the number of respondents for
any item falls below 5, a dash (-) is shown. For all of the scale scores, a higher score is better and the scores can range from 0 to 100. Confidence intervals for
provider scores are given. Link to explanation of items in scales is below.
* indicates meaningful difference
Link to explanation of the questions in each scale Above average marked by
SCALES State West Fayette AE Fayette Resources (Fayette)
Individual Satisfaction 85.87 85.05 93.62 90.30 (83.91 – 96.70)
Individual Choice 46.90* 49.35* 42.92 36.58 (28.85 – 44.32)
Individual Inclusion 43.72 43.58 49.04 47.26 (37.72 – 56.79)
Individual Dignity 82.28 80.22 88.48 82.58 (69.84 – 95.31)
Physical Quality 96.92* 97.13* 97.08 100.00 (100.00 – 100.00)
Family Satisfaction 90.54 91.79 89.34 -
86
47 44
82
9791
85
4944
80
979294
4349
8897
8990
3747
83
100
00
20
40
60
80
100
120
SATISFACTION CHOICE INCLUSION DIGNITY PHYS QUAL FAM SAT
Scale Scores for State, Region, County, Provider
State West Fayette Fayette Resources (Fayette)

126
Provider Profile Summary: Firely Adult Homes (Harleysville Pediatric Home Care)
Harleysville Pediatric Home Care is committed to meeting the needs of our clients through providing individualized care, nurturing each child to help them reach their full potential and to preserve the health, safety and wellbeing of every child we care for. We will always maintain the highest level of ethical standards and focus on our guiding values: Integrity, Honesty, and Trust.
We have been serving people since 1998.
We offer: In-Home Skilled Nursing Care Services for individuals with intellectual disabilities and skilled nursing needs.
Our organization has expertise in complex medical needs, including technology dependence and trach/vent dependence.
For individuals who are able to communicate, special attention is dedicated to education and effective usage of formal communication systems.
Detailed efforts are made to ensure that the individuals we serve live freely within their communities and participate within their communities to the extent that they wish. Outings are scheduled based on the choices and preferences of each individual to maintain engagement.
When families are able to be involved in their loved one's care and services, extensive efforts are made for inclusion. Families of individuals with intellectual disabilities and complex medical needs are in need of abounding support. Easing care responsibilities from these families ensures that the both individual and family member are supported.
Current quality improvement projects include employee incentive programs, medication error elimination, and preventable incident reduction and elimination.
127
Provider Profile Summary: Fitzmaurice Community Services (FCS) www.fitzmaurice.org
Our motto is Bringing out the Best in People which includes the individuals we serve, their families, friends and the staff. We believe that individuals, families and staff have a Bright Future with the appropriate supports to meet their needs.
FCS is considered one of the leading organizations in Carbon, Monroe, and Pike counties for enriching lives. Our ultimate goal is to empower our clients to achieve independence, individuality, productivity and inclusion within our community. We pride ourselves in exceeding client & family expectations by providing environments that promote growth, success, and friendships. This is accomplished by consumers, family members, Direct Support Professional Staff and the community working together.
We have been serving people for over 55 Years.
Fitzmaurice Community Services provides a wide range of services for persons with intellectual disabilities, persons with autism and persons with behavioral health diagnosis. Services include: Residential, Lifesharing, Community Participation Support, Agency with Choice, Representative Payee Services, Employment Services, Housing Services, Behavior Support, and psychiatric services.
Our clinical support team provides advanced services for individuals with specialized medical needs, dual diagnosis and those on the autism spectrum. We see the 'ability' in disability in all of our services; especially at our Library Cafe located at the Public Library in downtown Stroudsburg in the heart of the Poconos. The cafe is staffed and run by persons with 'abilities,' greeting our community every day, serving coffee and freshly baked cookies with a smile.
Upon admission, each person is assessed to determine how they communicate and what their needs are to determine what level of support is necessary. An individual service plan is developed in a team environment to include the individual and family members.
Family, friends and a network of community members greatly enhances the lives of the individuals we serve. We promote and encourage community and family engagement through church memberships, clubs, classes, library membership and celebrations to name a few.
Families are an important part in supporting the individuals we serve. Our staff works with both individuals and their families to develop skills, and community relationships. Satisfaction surveys are conducted on an annual basis to evaluate where services can be enhanced.
Fitzmaurice Community Services has a quality management plan which systematically looks at areas that need to be addressed to enhance quality of services. The plan is formally reviewed every three months and is measured on progress.
Fitzmaurice Community Services is located in Northeastern PA, and provides services in Carbon, Monroe, Pike, Northampton and Lehigh counties. Our organization
was founded in 1966 by Johanna Fitzmaurice, who was a pioneer in developing community-based services for persons with intellectual disabilities. Following her
passing in 1978, the organization continued to grow to include behavioral health services, and services for persons with autism.

128
Provider Profile Summary: Friendship Community www.friendshipcommunity.net
Friendship Community is a Christian organization cultivating capabilities of Individuals with Intellectual Disability and Autism.
Friendship Community’s values include the following: * Relationships ~ Inspiring unity, respect and perspective *Integrity ~ Modeling authenticity, clarity and truth
*Spirituality ~ Embracing the whole person to encourage living in balance with God, self and others *Excellence ~ Creating the extraordinary with passion and
purpose.
Friendship Community was founded in 1972, opening Lancaster County’s first Community Group Home.
In-home and community-based services and supports offered by Friendship Community on behalf of Individuals with Intellectual Disability and/or Autism include
Residential Services, Family Living Support, Home Based Services and Day Services within Lancaster and Lebanon counties.
Friendship Community specializes in offering enhanced medical supports with a skilled Nursing Team. Additionally, our organization offers unique opportunities
for artistic expression and community participation. Having a dedicated onsite Training Team provides for enhanced Team Member development, equipping us to
support Individuals with targeted areas of need.
Beyond required training to maintain numerous areas of compliance, priority is given to Team Member development, including specialized mentoring and coaching
to ensure that areas of Individual need are fully addressed, which encompasses effective communication and individual engagement.
Intentional emphasis is placed on meaningful and individualized integrated experiences within all programs of services and supports. With a Networking
Ambassador and Coordinator of Community Life among our Team, we are well equipped to actively engage Individuals in the community and promote networking
throughout Lancaster and Lebanon counties.
Recognizing the importance of supporting and engaging families, our organization strives for effective communication and promotes family member participation
in various areas including, but not limited to, daily support of Individuals, volunteer opportunities, Quality Improvement Council representation, Family Support
Fellowship, and Partner Artist opportunities. Additionally, Friendship Community encourages an ‘Open Door’ practice and strives to provide pertinent information
through ongoing communication.
Our organization’s Quality Management Plan currently focuses on equipping Team Members with knowledge and skills to effectively and safely support Individuals
while promoting satisfaction with supports offered. Specifically, Team Member development and retention efforts and prevention of incidents are of emphasis.
Friendship Community operates with a spirit of compassion and gratitude that is pervasive and positively impacts each Individual supported as well as family
members, Team Members, and members of the community. As a Provider with a long-standing reputation for exceptional care, our organization continues to
evolve as a partner within the community, dedicated to enhancing lives and fulfilling our vision of Impacting the World with Capabilities.

129
Interpreting the Data
These data will allow you to compare the average response
from this provider to the average response from all people
sampled in the state, region, and AE (when applicable).
Some differences are less meaningful than others,
depending on things like the size of the sample and the range
of answers provided for that particular scale. “Confidence
intervals” are used to determine whether differences are
statistically significant, or meaningful. Confidence intervals
are reported in parentheses.
To determine whether the average score of the provider is
meaningfully different from the averages of the state,
region, or AE, you can look at whether these scores fall
outside or inside the provider’s confidence interval.
Meaningful differences are marked with an asterisk “*”.
Summary of Findings
• The provider scores significantly above average for the
state, region and AE on Family Satisfaction
Provider Profiles Data Display: Friendship Community (Lancaster AE) 2016-2017
Of the 5,328 individuals in the 2017 IM4Q data file, 16 individuals registered in Lancaster Administrative Entity received residential services from Friendship. The
data in this profile are for the provider’s community-based residential services. This report presents the scale scores for the State, the Central Region, Lancaster
AE and Friendship (Lancaster). There must be data for 10 or more individuals to meet our selection criteria for reporting. If the number of respondents for any
item falls below 5, a dash (-) is shown. For all of the scale scores, a higher score is better and the scores can range from 0 to 100. Confidence intervals for provider
scores are given. Link to explanation of items in scales is below.
* indicates meaningful difference
Link to explanation of the questions in each scale Above average marked by
SCALES State Central Lancaster Friendship (Lancaster)
Individual Satisfaction 85.87 87.85 86.55 88.56 (81.65 – 95.46)
Individual Choice 46.90 50.49 49.52 46.35 (32.72 – 59.97)
Individual Inclusion 43.72 45.96 45.17 45.66 (37.93 – 53.40)
Individual Dignity 82.28 83.59 80.22 87.50 (79.18 – 95.82)
Physical Quality 96.92 97.07 96.92 96.88 (92.43 – 100.00)
Family Satisfaction 90.54* 91.74* 89.31* 98.13 (95.68 – 100.00)
86
47 44
82
979188
5046
84
9792
87
5045
80
978989
46 46
8897 98
0
20
40
60
80
100
120
SATISFACTION CHOICE INCLUSION DIGNITY PHYS QUAL FAM SAT
Scale Scores for State, Region, County, Provider
State Central Lancaster Friendship (Lancaster)

130
Provider Profile Summary: Goodwill Industries of North Central PA www.goodwillinc.com
Our mission is to meet life challenges through opportunity, education, training and work.
We believe that everyone who desires to work should be given the opportunity.
We have supported people with disability for over 20 years.
Our services include job shadows, worksite experience and assessment, driver education, support employment using a fade plan, job coaching to assist job seekers, and Community Participation Support which is offered through our licensed facility.
Work-based experience is a field we excel in. Diverse work sites allow the individual real work experience in a work environment. Assessments are useful as it gives the job coach information as they observe the participant in an actual job using the skills required to perform the work.
Newly hired staff begin their employment with a job shadowing of a seasoned employee. They are required to complete the Association of Community Rehabilitation Educators (ACRE) training in their first six months. Also, ODP training are done as they are offered.
Participant are treated with respect and encouraged to engage at worksite as any other employee. Policies are explained as are social norms within workplace.
Families are included to an extent if the participant wishes. Service are based around the participant, however, family input can be helpful.
A job coaching module has been created to improve services. It allows us to assist job seekers in a more organized manner. Small assignments are included to keep the job seeker motivated and engaged. Quarterly checks on all state required paperwork is completed. Also, the annual training plan includes all required items by the state, along with training we find pertinent to perform our jobs well.
Driver education is growing rapidly. Currently, we are working toward certifying another instructor. This will allow us to complete services in a timely manner. Competitive Integrated Employment is our goal for you!

131
Provider Profile Summary: Goodwill of the Southern Alleghenies www.gogoodwill.org
Our mission is to empower individuals and their families who have employment barriers to achieve their fullest potential in the community through work services. We believe that work plays a critical role in the ability of individuals to achieve desirable life outcomes and that through work, individuals are enabled to assume, in addition to the role of worker, other roles within the community.
Our guided values are: to recognize the basic human rights and dignities of all people; the recognition, acceptance, and development of individual abilities; the provision of quality goods and services; and operating with integrity in all areas.
Goodwill has been supporting people with intellectual disabilities and autism for more than 30 years.
We assist individuals living with disabilities to find jobs and keep the jobs they find. Each individual job seeker comes with their own set of skills and abilities they have yet to explore, or are finding a way to use their unique skill set to benefit the employer of their choice. Self-awareness and exploration provide the information to a job seeker, allowing them to make their own employment choices. This also motivates an individual to continue learning and improving on the job they do get. From the decision to become employed, to maintaining a job for 10+ years, services are tailored to each person’s specific needs and choices. Our staff guides each person in finding their footing when they arrive and encourages them to put their best foot forward in trying new things, whether they are brand new to job finding, coming back to find a different job, or learning new skills on their job.
Goodwill believes in and supports the rights of people with communication challenges to receive the necessary supports/services in order to effectively and more fully communicate. We work collaboratively with the individual, family, Supports Coordinator, and other team members to ensure that all individuals with communication challenges have the assistance they need to communicate across all aspects of their lives and have access to services/supports that best match their current and future communication needs.
We believe that all individuals should be a full member of their community with respect, dignity and status. Individuals' family, supporters, and community should know them as a person, and welcome and accept them. We believe that the individuals we serve want to work and/or have other ways to contribute to their community.
Goodwill adopts a family strengthening philosophy, assessing 'family' needs. Actively engaging in the local community to learn about and form relationships with the variety of social, human, recreational, financial, and other resources that can contribute to families' economic, health, educational, recreational, and social success.
Accommodations are made to ensure that all intakes and services are user-friendly. Goodwill staff collaborates with the Supports Coordinators to ensure that services are initiated within a reasonable amount of time after Goodwill receives service authorization, taking into consideration transportation arrangements and participants’ availability. Services are furnished in accordance with the participant’s plan.

132
Provider Profile Summary: Growth Horizons www.grhorizons.com
Our mission is to support people with intellectual and developmental disabilities (IDD) to make choices, attain life goals, build relationships, and participate in
community life. We start with the presumption that all people have the right and ability to make choices regarding the direction of their own lives, should be
afforded the opportunity to form relationships within the community, and have the right to take risks and learn through life experiences.
We treat everyone with respect, dignity, courtesy, and equality regardless of ability. We have been supporting people for 40 years.
Growth Horizons provides residential services and supports to assist adults with I/DD to live in and become active members of their community. Our goal is to
provide a safe and nurturing environment to support individuals to become as independent as possible. We strive to remain flexible in supporting everyone as the
needs of the individual and his/her life circumstances change. We support self-determination through Person Centered Planning and attempt to incorporate choice
into all aspects of life for the people we support. Community Participation Supports- CPS provides many opportunities for volunteering, including meal delivery,
park/trail clean-up and assisting in thrift shops.
Benefits of CPS include increased self-esteem and positive interactions within the community. Clinical Supports: Healthcare-We provide medical oversight and
technical assistance through our nursing staff for every individual, focusing on everyday health issues to more complex medical needs. Our goal is to provide the
supports necessary so that individuals receive the best possible health supports while remaining in their home. Behavior support- We provide functional
assessment, training and a variety of treatment supports, including counseling, to assist individuals with autism, I/DD and individuals with dual mental health
diagnoses. We work closely with a renowned psychiatrist to provide holistic treatment and focus on achieving outcomes that improve quality of life with full
participation in community activities. Dysphagia- We provide a full range of services for individuals with eating/swallowing problems or who are at risk. Services
include assessment, treatment strategies and training at all levels of the organization.
We support people with behavior support needs as well as people with complex medical needs.
For individuals who are not able to effectively communicate, we develop Communication Profiles to support staff in understanding their communication and utilize
an SLP for communication evaluations and to identify and implement the best possible Augmentative and Alternative Communication strategies.
We encourage all the individuals we support to engage in their local community in a variety of ways, including but not limited to employment, volunteerism, social,
educational as directed by their own personal interests. This in turn allows individuals to develop friendships and connections with people who they would
otherwise not meet.
We encourage and welcome family involvement in all activities and events related to the services we're providing to their family member.
We continually strive to improve services by enhancing individuals’ communication, improving timely incident management completion and improving
accountability, efficiency and compliance through implementation of an electronic visit verification system.

133
Interpreting the Data
These data will allow you to compare the average response
from this provider to the average response from all people
sampled in the state, region, and AE (when applicable).
Some differences are less meaningful than others,
depending on things like the size of the sample and the range
of answers provided for that particular scale. “Confidence
intervals” are used to determine whether differences are
statistically significant, or meaningful. Confidence intervals
are reported in parentheses.
To determine whether the average score of the provider is
meaningfully different from the averages of the state,
region, or AE, you can look at whether these scores fall
outside or inside the provider’s confidence interval.
Meaningful differences are marked with an asterisk “*”.
Summary of Findings
• The provider’s scores were not significantly different
from the average scores for the state or region.
Provider Profiles Data Display: Growth Horizons (Statewide) 2016-2017
Of the 5,328 individuals in the 2017 IM4Q data file, 39 individuals registered in Pennsylvania received residential services from Growth Horizons. The data in this
profile are for the provider’s community-based residential services. This report presents the scale scores for the State, the Southeast Region and Growth Horizons
(Statewide). There must be data for 10 or more individuals to meet our selection criteria for reporting. If the number of respondents for any item falls below 5, a
dash (-) is shown. For all of the scale scores, a higher score is better and the scores can range from 0 to 100. Confidence intervals for provider scores are given.
Link to explanation of items in scales is below.
* indicates meaningful difference
Link to explanation of the questions in each scale Above average marked by
SCALES State Southeast Growth Horizons
Individual Satisfaction 85.87 82.83 83.77 (76.63 – 90.91)
Individual Choice 46.90 37.62 40.41 (33.34 – 47.47)
Individual Inclusion 43.72 39.99 40.54 (35.66 – 45.41)
Individual Dignity 82.28 79.12 78.51 (72.26 – 84.76)
Physical Quality 96.92 96.57 95.61 (92.20 – 99.03)
Family Satisfaction 90.54 87.82 92.84 (86.41 – 99.26)
86
47 44
82
9791
83
38 40
79
9788
84
40 41
79
96 93
0
20
40
60
80
100
120
SATISFACTION CHOICE INCLUSION DIGNITY PHYS QUAL FAM SAT
Scale Scores for State, Region, Provider
State SE Growth Horizons
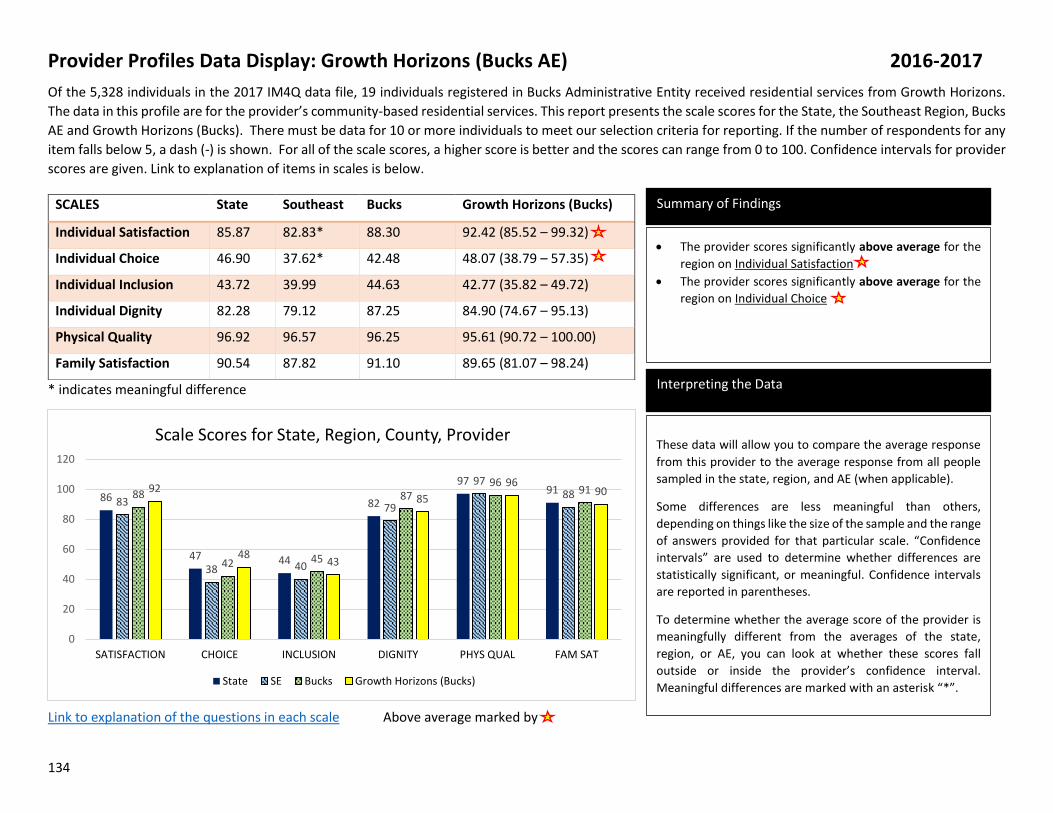
134
Interpreting the Data
These data will allow you to compare the average response
from this provider to the average response from all people
sampled in the state, region, and AE (when applicable).
Some differences are less meaningful than others,
depending on things like the size of the sample and the range
of answers provided for that particular scale. “Confidence
intervals” are used to determine whether differences are
statistically significant, or meaningful. Confidence intervals
are reported in parentheses.
To determine whether the average score of the provider is
meaningfully different from the averages of the state,
region, or AE, you can look at whether these scores fall
outside or inside the provider’s confidence interval.
Meaningful differences are marked with an asterisk “*”.
Summary of Findings
• The provider scores significantly above average for the
region on Individual Satisfaction
• The provider scores significantly above average for the
region on Individual Choice
Provider Profiles Data Display: Growth Horizons (Bucks AE) 2016-2017
Of the 5,328 individuals in the 2017 IM4Q data file, 19 individuals registered in Bucks Administrative Entity received residential services from Growth Horizons.
The data in this profile are for the provider’s community-based residential services. This report presents the scale scores for the State, the Southeast Region, Bucks
AE and Growth Horizons (Bucks). There must be data for 10 or more individuals to meet our selection criteria for reporting. If the number of respondents for any
item falls below 5, a dash (-) is shown. For all of the scale scores, a higher score is better and the scores can range from 0 to 100. Confidence intervals for provider
scores are given. Link to explanation of items in scales is below.
* indicates meaningful difference
Link to explanation of the questions in each scale Above average marked by
SCALES State Southeast Bucks Growth Horizons (Bucks)
Individual Satisfaction 85.87 82.83* 88.30 92.42 (85.52 – 99.32)
Individual Choice 46.90 37.62* 42.48 48.07 (38.79 – 57.35)
Individual Inclusion 43.72 39.99 44.63 42.77 (35.82 – 49.72)
Individual Dignity 82.28 79.12 87.25 84.90 (74.67 – 95.13)
Physical Quality 96.92 96.57 96.25 95.61 (90.72 – 100.00)
Family Satisfaction 90.54 87.82 91.10 89.65 (81.07 – 98.24)
86
47 44
82
9791
83
38 40
79
978888
42 45
8796
9192
4843
85
9690
0
20
40
60
80
100
120
SATISFACTION CHOICE INCLUSION DIGNITY PHYS QUAL FAM SAT
Scale Scores for State, Region, County, Provider
State SE Bucks Growth Horizons (Bucks)

135
Interpreting the Data
These data will allow you to compare the average response
from this provider to the average response from all people
sampled in the state, region, and AE (when applicable).
Some differences are less meaningful than others,
depending on things like the size of the sample and the range
of answers provided for that particular scale. “Confidence
intervals” are used to determine whether differences are
statistically significant, or meaningful. Confidence intervals
are reported in parentheses.
To determine whether the average score of the provider is
meaningfully different from the averages of the state,
region, or AE, you can look at whether these scores fall
outside or inside the provider’s confidence interval.
Meaningful differences are marked with an asterisk “*”.
Summary of Findings
• The provider scores significantly below average for the
state on Individual Choice
• The provider scores significantly below average for the
state on Individual Dignity
Provider Profiles Data Display: Growth Horizons (Montgomery AE) 2016-2017
Of the 5,328 individuals in the 2017 IM4Q data file, 20 individuals registered in Montgomery Administrative Entity received residential services from Growth
Horizons. The data in this profile are for the provider’s community-based residential services. The data in this profile are for the provider’s community-based
residential services. This report presents the scale scores for the State, the Southeast Region, Montgomery AE and Growth Horizons (Montgomery). There must
be data for 10 or more individuals to meet our selection criteria for reporting. If the number of respondents for any item falls below 5, a dash (-) is shown. For all
of the scale scores, a higher score is better and the scores can range from 0 to 100. Confidence intervals for provider scores are given. Link to explanation of items
in scales is below.
* indicates meaningful difference
Link to explanation of the questions in each scale Above average marked by
SCALES State SE Montgomery Growth Horizons (Montgomery)
Individual Satisfaction 85.87 82.83 79.07 75.83 (65.35 – 86.31)
Individual Choice 46.90* 37.62 31.31 32.32 (22.72 – 41.92)
Individual Inclusion 43.72 39.99 38.83 37.86 (31.11 – 44.61)
Individual Dignity 82.28* 79.12 76.96 73.86 (66.89 – 80.84)
Physical Quality 96.92 96.57 95.79 95.61 (90.72 – 100.00)
Family Satisfaction 90.54 87.82 83.83 -
86
47 44
82
9791
83
38 40
79
9788
79
3139
77
96
8476
3238
74
96
0
20
40
60
80
100
120
SATISFACTION CHOICE INCLUSION DIGNITY PHYS QUAL FAM SAT
Scale Scores for State, Region, County, Provider
State SE Montgomery Growth Horizons (Montgomery)

136
Provider Profile Summary: GSI Home Care Solutions LLC
Our mission is to provide unparalleled care and support to those with intellectual disabilities. We strive to give total respect and dignity to all. We are here to help individuals have more independence and control in their day-to-day lives. We are dedicated to helping enhance the quality everyday life for our supported individuals. We will always ensure that respect and dignity of each individual is of paramount importance. We believe that our supported individuals should participate to the fullest extent possible in all decisions affecting them. GSI HCS believes that we must recognize the uniqueness of each individual and foster such uniqueness when providing services.
We have had the pleasure of being able to give support to our intellectually disabled community since 2000.
GSI provides assistance with integration into the community. We also assist with personal care and grooming goals, such as assisting with bathing, dressing, grooming and toileting. We assist individuals with meal preparation and feeding assistance along with shopping and cooking nutritious meals. GSI also provides companion and respite services. Taking into consideration individual interests and needs, we accompany individuals to community events such as concerts in the park, going to the mall, movies, beauty salon/barber, various sporting activities or hobby-based activities or just provide quiet company. Respite care can also aid other caregivers with needed time off.
We take great care to match each individual with the right care giver for them and their family. Once family and staff have met and ensured good coherence, we train staff of that particular person’s Individual Service Plan, which includes making sure that staff knows how to communicate effectively in the manner in which the supported individual is comfortable with.
GSI works with individuals to find out what they enjoy doing and we look for events within the community that will foster their interests and hobbies. We also try to introduce the consumers to new activities in order to broaden their interests.
We provide routine follow-ups with individuals and their families via home visits or telephone calls to ensure satisfaction of services.

137
Provider Profile Summary: Handi-Crafters, Inc. www.handi-crafters.org
Handi-Crafters mission is to provide employment opportunities and other supportive services for individuals with disabilities or barriers to be productive workers and develop greater self-esteem.
Handi-Crafters is a non-profit, community resource that uses experiences in the “world of work” to engage individuals in a program of habilitation and rehabilitation, primarily for individuals who have significant barriers, leading to productive employment and increased independence.
We have been serving people for 58 years.
We offer work skills training, community work crews, Competitive Employment, Community Participation, Adult Day Services, housing search for people with disabilities, and Counseling. We have special expertise in all those areas.
Staff have over 30 hours of training, some specific to individuals with communication barriers. We also have a weekly deaf and hard of hearing socialization class.
We offer a fully engaged Community Participation Program in which over 140 individuals currently choose to participate. We also have volunteers from area businesses who come and work side by side with our clients. We offer a weekly after-hours program of activities for our all clients, which is assisted by volunteers from the community.
Families are always welcome to come to our facility at any time to visit. We send regular communications via email blasts, web page, Facebook, and attachments to pay checks.
Our plans for our new facility will include more technology opportunities for our clients, a sensory room, an exercise area designed for our physically disabled clients and clients in general, and more opportunities to work successfully in the community under our supervision.
One needs to visit to really understand who we are and what we do.

138
Provider Profile Summary: HAP Enterprises www.hapenterprises.org
HAP Enterprises, Inc. (HAP) is committed to promoting growth, independence and community involvement for the individuals we serve. HAP provides progressive
person-centered supports to individuals with ID/DD and services to children of all abilities through programs that champion choice, integration and opportunity.
HAP’s guiding values include transparency, open/effective communication, and treating all people with dignity and respect.
HAP has been providing support services since 1970.
HAP Enterprises, Inc. is comprised of three separate programs, each targeting a different area of social service. The first component is our residential program for
adults with intellectual and/or developmental disabilities (ID/DD). We currently serve 70 individuals in 25 homes throughout Beaver County with no more than 4
individuals residing in a home. Our residential services include both 24 hours supervised, licensed, and some independent living homes. Staff in the residential
program provide support with daily living skills, personal development and community integration. HAP also offers a day program for adults and seniors with
ID/DD. Presently, 57 adults participate in our licensed day program (Krakoff Center) and 30 individuals attend our Older Adult Daily Living Center (60 North). The
focus of the day program is to provide opportunities for community participation. The third component of HAP is Tiny Tot Child Development Center. Services at
Tiny Tot CDC include child care, infant/toddler early intervention, preschool early intervention and PA Pre-K Counts.
Tiny Tot CDC is the only child care facility in Beaver County to have earned a STAR 4 rating in Keystone STARS, Pennsylvania’s quality rating system.
Training, experience and patience are the hallmarks of a great support staff. Staff are required to initially get to know the individuals they support through their
ISP. Communication can be facilitated through traditional and not traditional modalities. Respectful, person-first language is the expectation for all staff.
Individuals are encouraged to explore a variety of interests and engage in their community through participation in social events, churches, employment, recreation
and any other activity he/she expresses interest in.
Families are welcomed and encouraged to stay involved as HAP provides support to their loved one. Families serve as an integral component of the support team
and are involved in decision making, program planning and considered an invaluable resource in determining how to best support the individuals we work with.
To retain quality, dedicated staff, HAP has taken steps to improve staff training, increase wages, and include retention bonuses. Another area of focus is increasing
and improving the quality of experiences individuals have in the community. A concerted effort to increase resources to serve this purpose has been a core focus
of the company over the past few years. In the past 15 months, HAP has purchased 12 new vehicles, increased staff by 30% in our day program and increased the
number of vacations taken by individuals in the residential program. Recent vacation destinations for the individuals we serve include The Grand Canyon, Disney
World, Myrtle Beach and Hollywood California.

139
Interpreting the Data
These data will allow you to compare the average response
from this provider to the average response from all people
sampled in the state, region, and AE (when applicable).
Some differences are less meaningful than others,
depending on things like the size of the sample and the range
of answers provided for that particular scale. “Confidence
intervals” are used to determine whether differences are
statistically significant, or meaningful. Confidence intervals
are reported in parentheses.
To determine whether the average score of the provider is
meaningfully different from the averages of the state,
region, or AE, you can look at whether these scores fall
outside or inside the provider’s confidence interval.
Meaningful differences are marked with an asterisk “*”.
Summary of Findings
• The provider scores significantly below average for the
state on Individual Choice
• The provider scores significantly above average for the
state on Physical Quality
Provider Profiles Data Display: HAP Enterprises (Statewide) 2016-2017
Of the 5,328 individuals in the 2017 IM4Q data file, 27 individuals registered in Pennsylvania received residential services from HAP. The data in this profile are for
the provider’s community-based residential services. This report presents the scale scores for the State of Pennsylvania and HAP (Statewide). There must be data
for 10 or more individuals to meet our selection criteria for reporting. If the number of respondents for any item falls below 5, a dash (-) is shown. For all of the
scale scores, a higher score is better and the scores can range from 0 to 100. Confidence intervals for provider scores are given. Link to explanation of items in
scales is below.
* indicates meaningful difference
Link to explanation of the questions in each scale Above average marked by
SCALES State HAP
Individual Satisfaction 85.87 79.25 (70.25 – 88.26)
Individual Choice 46.90* 37.02 (30.41 – 43.63)
Individual Inclusion 43.72 48.11 (41.31 – 54.91)
Individual Dignity 82.28 82.24 (75.07 – 89.41)
Physical Quality 96.92* 100.00 (100.00 – 100.00)
Family Satisfaction 90.54 -
86
47 44
82
9791
79
37
48
82
100
0
20
40
60
80
100
120
SATISFACTION CHOICE INCLUSION DIGNITY PHYS QUAL FAM SAT
Scale Scores for State and Provider
State HAP
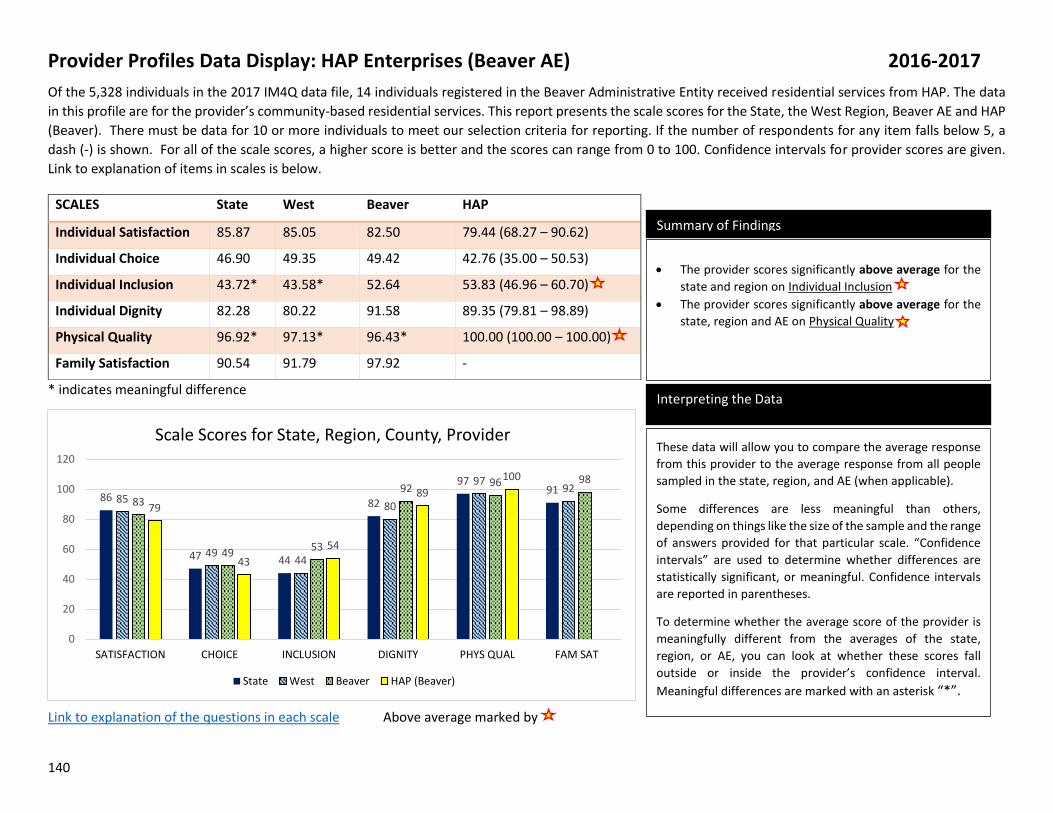
140
Interpreting the Data
These data will allow you to compare the average response
from this provider to the average response from all people
sampled in the state, region, and AE (when applicable).
Some differences are less meaningful than others,
depending on things like the size of the sample and the range
of answers provided for that particular scale. “Confidence
intervals” are used to determine whether differences are
statistically significant, or meaningful. Confidence intervals
are reported in parentheses.
To determine whether the average score of the provider is
meaningfully different from the averages of the state,
region, or AE, you can look at whether these scores fall
outside or inside the provider’s confidence interval.
Meaningful differences are marked with an asterisk “*”.
Summary of Findings
• The provider scores significantly above average for the
state and region on Individual Inclusion
• The provider scores significantly above average for the
state, region and AE on Physical Quality
Provider Profiles Data Display: HAP Enterprises (Beaver AE) 2016-2017
Of the 5,328 individuals in the 2017 IM4Q data file, 14 individuals registered in the Beaver Administrative Entity received residential services from HAP. The data
in this profile are for the provider’s community-based residential services. This report presents the scale scores for the State, the West Region, Beaver AE and HAP
(Beaver). There must be data for 10 or more individuals to meet our selection criteria for reporting. If the number of respondents for any item falls below 5, a
dash (-) is shown. For all of the scale scores, a higher score is better and the scores can range from 0 to 100. Confidence intervals for provider scores are given.
Link to explanation of items in scales is below.
* indicates meaningful difference
Link to explanation of the questions in each scale Above average marked by
SCALES State West Beaver HAP
Individual Satisfaction 85.87 85.05 82.50 79.44 (68.27 – 90.62)
Individual Choice 46.90 49.35 49.42 42.76 (35.00 – 50.53)
Individual Inclusion 43.72* 43.58* 52.64 53.83 (46.96 – 60.70)
Individual Dignity 82.28 80.22 91.58 89.35 (79.81 – 98.89)
Physical Quality 96.92* 97.13* 96.43* 100.00 (100.00 – 100.00)
Family Satisfaction 90.54 91.79 97.92 -
86
47 44
82
9791
85
4944
80
9792
83
4953
9296 98
79
43
54
89
100
0
20
40
60
80
100
120
SATISFACTION CHOICE INCLUSION DIGNITY PHYS QUAL FAM SAT
Scale Scores for State, Region, County, Provider
State West Beaver HAP (Beaver)

141
Provider Profile Summary: Harmony Companion Home Care Inc www.harmonycompanion.com
Harmony Companion Home care has been serving people for three years and is committed to providing high quality, client-centered and affordable Home Care Services to its clients. To assist them to lead dignified and independent lives in the comfort and safety of their own homes. Their individual needs are carefully assessed, understood and met through the selective assignment of qualified, trustworthy and compassionate personnel.
The core values include: Keeping our client's health, quality of life and well-being central in the design and delivery of services; Treating and interacting with our clients with respect, dignity, compassion, empathy, honesty, and integrity while recognizing and maintaining confidentiality of client information; Being courteous and competent to clients, families, co-professionals and the community-at large; Showing respect for all cultures, religions, ethnicity, sexual orientation, ages, gender and disabilities; Valuing, supporting, recognizing and appreciating other employees, for employees are the agency's greatest asset; nurturing a work environment that encourages personal enjoyment and enhances job satisfaction and performance through recognition and reward; developing and maintaining positive relationships with the community, including local Home Care and Health Care personnel/organizations; Conducting Agency business in an accountable and responsible manner; adhering to the professional code of ethics of the Home Care industry; and Applying continuous quality improvement measures throughout the Agency.
Harmony Companion Home Care offers Companionship, Personal Care, and Personal Assistant, addressing a variety of issues that will always differ from individual to individual. Issues include: fire safety, traffic safety, outdoor appliances safety, indoor appliances, water safety, hazardous substances safety, protection from strangers, hygiene, medication reminders and food and drink consumption.
Harmony Companion Home Care has policies in place to address and coordinate services for people who are deaf or hard of hearing, people with behavioral support needs and people with complex medical needs. We also provide Employment and Community Participation Services.
The staff is learning and adapting very quickly to the language or method of communication that the individuals apply or use. For cases in which the individual requires deaf and/or special interpretation services, we hire specialists.
Engaging people we support in the community is always led by Individual Service Plans, new interests that may be developed and individuals’ curiosity about new subjects. For example, attending a basketball match or walking a dog.
Families are the greater part of their member, therefore, any plan, activity or insight that comes along, they will immediately be contacted and informed about it. Also, if the family has any suggestions concerning services for their loved one, the family will always be given first priority to present their platform/ideas.
Harmony Companion Home Care does use the simple and effective Plan-Do-Act- Check method in quality assurance; comparison is made between current performance and the target objective to be achieved by the end of a designated time-frame. Management then reviews progress to determine if strategies or plans put into place are being implemented timely or need to be revised in order to achieve our target objectives. Throughout the process, we closely monitor all developments and aim to achieve the best possible outcomes.
We take all individual cases very personal like we would with our own personal and close family member. We also choose to serve our client and not to work for them.
142
Provider Profile Summary: Helping Individuals Succeed (HIS)
The mission of Helping Individuals Succeed (HIS) is to offer the individuals we serve personalized In-Home and Community Support Services and to assist individuals with disabilities and others needing assistance to maintain quality of life. Our services support the individual's choice and preference of their services in order to maintain their dignity and independence.
With the support of family, friends and other team members, individuals will acquire the skills and supports needed to maximize capabilities. HIS proudly serves individuals in the southeast region of Pennsylvania.
HIS has been serving people for 5 years.
We offer: In-Home and Community Support-This a direct service provided in home and community setting to assist individuals with learning a skill. Companion-assists individuals to participate more meaningfully in home and community life. Respite Care-provided to supervise and support individuals on a short-term basis due to the absence or need for relief of those persons normally providing care. Homemaker/Chore - includes household cleaning and maintenance and homemaker activities. Behavioral Support- includes comprehensive assessment and the development of and revisions to a Behavioral Support Plan. Community Participation Support- provides opportunities and support for community inclusion and building interest in and developing skills and potential for competitive integrated employment. Supported Employment- services are provided in a variety of community settings for the purpose of supporting individuals in obtaining and sustaining competitive integrated employment.
We specialize in Community Participation.
Each staff is trained on the ISP for every individual receiving services. We review how every individual communicates and how staff should communicate with each person.
We conduct an extensive survey to determine the interests of each individual. Using survey results, we plan activities in the community, based on identified interests. We monitor closely these activities and how receptive individuals are to them.
We maintain an open-door policy with our families and the individuals we serve. We welcome feedback both good and bad. We work closely with our families to help with services that may benefit both the individual and the family.
We use our measurable data as a guide for areas that we may need improvement in. For instance, data collected for the number of staff call-outs in a given quarter may call for a revision of policy and procedure.
HIS is committed to providing quality care. Our staff go above and beyond the ISP. Our main goal is to help individuals in every aspect of their lives. Our staff come with a wealth of knowledge that we use and share with our individuals and families, to assure they are receiving quality life.

143
Provider Profile Summary: Home Care Associates (HCA)
Home Care Associates (HCA) is a home health care company that provides high quality and reliable home and community-based services. HCA's mission is to provide the highest quality, most skilled, reliable and compassionate paraprofessional health care, and to create quality jobs and a worker-owned company, where all employees are supported to achieve their personal and professional best.
HCA strives to impact the home health care industry by operating a successful company that sets the standard of quality care and quality jobs. The company was founded in 1993 with the belief that to provide quality service, home health aides must be treated with respect and appreciation for the importance of the vital and difficult job they do.
For over 25 years, HCA has provided support for the medical, behavioral and personal needs of individuals with disabilities. In 2014, we expanded our services to support the needs of individuals with autism, intellectual and developmental disabilities.
HCA provides a wide variety of home care services. Our assistance programs are designed to help individuals remain independent in a comfortable and safe environment.
Through our award-winning training program, our caregivers are fully equipped to provide support whether it’s providing personal assistance with daily activities or tending to complex medical needs. Our caregivers are trained to provide care that promotes self-direction, positive decision-making and independent growth. Our programs are designed to help individuals remain independent in a comfortable and safe environment.
Our training program requires several weeks of extensive learning about diseases and the development of a full range of clinical, communication and problem-solving skills. HCA caregivers also receive continued support through mentors who aim to provide on-going education to help improve and broaden their skills.
We value the individuals and families we serve. HCA maintains an open-door policy to both staff and participants in efforts to encourage open communication and interaction. HCA continues to make outreach efforts through acknowledging milestones and receiving feedback on the delivery of service, and using that feedback to provide innovative programs that deliver quality care.
HCA takes a company-wide approach with ensuring continuous improvement of its mission. HCA staff is not only committed to providing quality care but also putting measures into place to ensure quality outcomes.

144
Provider Profile Summary: Home Nursing Agency (UPMC)
UPMC’s mission is to serve our community by providing outstanding patient care and to shape tomorrow’s health system through clinical and technological innovation, research, and education.
Our Values: Quality & Safety—We create a safe environment where quality is our guiding principle. Dignity & Respect—We treat all individuals with dignity and respect. Caring & Listening—We listen to and care for our patients, our health plan members, our fellow employees, our physicians, and our community. Responsibility & Integrity—We perform our work with the highest levels of responsibility and integrity. Excellence & Innovation—We think creatively and build excellence into everything that we do.
We have been serving people for 20 years.
We offer Respite Services.
Our area of special expertise is complex medical needs.
We provide training annually to all employees who provide care to these individuals.
We involve families in the care of our patients.
We continue to have a goal of providing all the coverage we are requested to provide with quality and properly trained staff.
145
Provider Profile Summary: Home to Stay, Inc www.hometostaypa.com
Our mission is to assist clients to be independent in their homes by providing quality, affordable care.
Our guiding value is Quality care—allowing for client choice and promoting client independence.
We have been serving people for 9 years.
We offer: Skilled Nursing Service and Home Health Aide Service.
Our area of special expertise is clients with complex medical needs.
We ensure staff can effectively communicate with people they support through Interpreters and sign language as needed, in addition to training staff on communication devices.
We engage people we support in the community through encouraging clients to take part in activities outside their home.
We communicate with families on a regular basis.
Quality improvement projects we are working on: GOAL I: Develop a plan to reduce the number of feeding tube dislodgement in patients. ACTION: 1. Staff will be trained upon hire on the proper handling and monitoring of patients with feeding tubes to reduce the risk of accidental dislodgement. 2. Staff will have annual training on feeding tubes during the annual competencies and instructors will cover proper care methods for feeding tubes. 3. Office staff will identify patients with behaviors and a history of pulling out their feeding tubes and instruct the field staff assigned to those patients to be more vigilant and to monitor behaviors.
GOAL II: Develop a policy to make all vitals on patient 485’s uniform and that cover all doctor’s orders. ACTION: 1. Staff will review all patient 485’s for what is included in the orders for vitals. Staff will notate all findings. 2. Once all charts are reviewed, staff will create a template for the 485’s that include what vitals are to be taken and the frequency that they are to be taken. 3. Staff will be trained on the new template for the 485 and will have to use the new template on their future 485’s.
Goal III: Compliance with agency policies will be monitored for improvement through review of complaints and incidents. The following will be assessed during the life of this Quality Management Plan: 1. Professionalism 2. Documentation 3. Call offs/ Tardiness.
146
Provider Profile Summary: HOPE Enterprises www.hopeability.org
Hope Enterprises, Inc. enhances the quality of life for people with intellectual disabilities through comprehensive services in central Pennsylvania. Our vision is to
provide an individualized approach that allows each person the opportunity to live their best life, in their own community.
Hope is committed to providing services that support those with disabilities to live a life, no different than any other citizen. Our role is to support opportunities
that give people the relationships, rights and responsibilities to be a member of their own community.
Hope Enterprises, Inc. was founded in 1952 by Dr. Max Miller and his wife Leona, along with other community leaders.
Early Intervention Services are provided to eligible children from birth to age 3 who have intellectual delays or disabilities. Our educators visit children in their
home, and work with families on a range of developmental areas. Community homes provide around-the-clock care while respecting people's rights,
independence, privacy and experiences for personal growth. Lifesharing opportunities give people the option to live with a family or person who will support
his/her desires and needs to live an everyday life. Employment services provide one-on-one work-skills assessments, job search support, hands-on training, and
job coaching allows employment to be the first option for people with disabilities. Companion services are provided in a private home with the limited purpose of
providing supervision or assistance to ensure a person's health and safety. Community Participation Support is a community-based, day service that supports
opportunities for growth and development within a person’s own community.
Hope Enterprises, Inc. provides an individualized approach to allow each person the opportunity to enhance their life. Each of our services are unique to a person’s
needs and wants.
Staff are trained on individual’s Individual Support Plans. Specialized training is made available as needed.
We engage the people we support in the community through Coffee Clubs Volunteering (SPCA, Food Bank, Churches, Senior Centers, etc.) Theatre Productions,
Educational Outings, Wellness Groups and Employment Options Exercise Programs.
Hope is committed to having open and honest communication with all families. We encourage families to remain a positive influence in the lives of their family
members. Hope has sponsored family meetings offering explanations of current services through presentations by individuals, staff and other families. Hope has
an active presence in the community. Hope families have been encouraged to develop a family group to assist Hope management in ensuring services meet the
needs of those served. Hope’s president is actively involved in meeting with families who may have concerns and ensures that any needed follow through is
completed.
Quality improvement projects we are working on are Reducing Individual to Individual Abuse, increasing transitions to independent Community Employment,
reducing # of incidents of Choking, maintaining number of individuals living in Hope supported community living options while evaluating person-centered
preferences and needs.
We feel our commitment and passion for the people we serve is reflected in how we support adults with disabilities. By creating opportunities and breaking down
barriers, Hope will continue to be a front runner in enhancing people’s lives.

147
Interpreting the Data
These data will allow you to compare the average response
from this provider to the average response from all people
sampled in the state, region, and AE (when applicable).
Some differences are less meaningful than others,
depending on things like the size of the sample and the range
of answers provided for that particular scale. “Confidence
intervals” are used to determine whether differences are
statistically significant, or meaningful. Confidence intervals
are reported in parentheses.
To determine whether the average score of the provider is
meaningfully different from the averages of the state,
region, or AE, you can look at whether these scores fall
outside or inside the provider’s confidence interval.
Meaningful differences are marked with an asterisk “*”.
Summary of Findings
• The provider scores significantly below average for the
region on Individual Choice
• The provider scores significantly below average for the
region on Individual Dignity
• The provider scores significantly above average for the
state and region on Physical Quality
Provider Profiles Data Display: HOPE Enterprises (Statewide) 2016-2017
Of the 5,328 individuals in the 2017 IM4Q data file, 53 individuals registered in Pennsylvania received residential services from Hope. The data in this profile are
for the provider’s community-based residential services. This report presents the scale scores for the State of Pennsylvania and Hope (Statewide). There must be
data for 10 or more individuals to meet our selection criteria for reporting. If the number of respondents for any item falls below 5, a dash (-) is shown. For all of
the scale scores, a higher score is better and the scores can range from 0 to 100. Confidence intervals for provider scores are given. Link to explanation of items in
scales is below.
* indicates meaningful difference
Link to explanation of the questions in each scale Above average marked by
SCALES State Central Hope
Individual Satisfaction 85.87 87.85 89.09 (84.56 – 93.62)
Individual Choice 46.90 50.49* 43.28 (37.63 – 48.92)
Individual Inclusion 43.72 45.96 44.05 (39.69 – 48.41)
Individual Dignity 82.28 83.59* 78.68 (75.02 – 82.34)
Physical Quality 96.92* 97.07* 98.69 (97.15 – 100.00)
Family Satisfaction 90.54 91.74 84.62 (71.81 – 97.44)
86
47 44
82
979188
50 46
84
979289
43 44
79
99
85
0
20
40
60
80
100
120
SATISFACTION CHOICE INCLUSION DIGNITY PHYS QUAL FAM SAT
Scale Scores for State, Region, Provider
State Central Hope

148
Interpreting the Data
These data will allow you to compare the average response
from this provider to the average response from all people
sampled in the state, region, and AE (when applicable).
Some differences are less meaningful than others,
depending on things like the size of the sample and the range
of answers provided for that particular scale. “Confidence
intervals” are used to determine whether differences are
statistically significant, or meaningful. Confidence intervals
are reported in parentheses.
To determine whether the average score of the provider is
meaningfully different from the averages of the state,
region, or AE, you can look at whether these scores fall
outside or inside the provider’s confidence interval.
Meaningful differences are marked with an asterisk “*”.
Summary of Findings
• The provider scores significantly below average for the
region on Individual Choice
• The provider scores significantly above average for the
state, region and AE on Physical Quality
Provider Profiles Data Display: HOPE Enterprises (Columbia/Montour/Snyder/Union AE) 2016-2017
Of the 5,328 individuals in the 2017 IM4Q data file, 17 individuals registered in Columbia/Montour/Snyder/Union (CMSU) Administrative Entity received residential
services from Hope. The data in this profile are for the provider’s community-based residential services. This report presents the scale scores for the State, the
Central Region, CMSU AE and Hope (CMSU). There must be data for 10 or more individuals to meet our selection criteria for reporting. If the number of respondents
for any item falls below 5, a dash (-) is shown. For all of the scale scores, a higher score is better and the scores can range from 0 to 100. Confidence intervals for
provider scores are given. Link to explanation of items in scales is below.
* indicates meaningful difference
Link to explanation of the questions in each scale Above average marked by
SCALES State Central CMSU Hope (CMSU)
Individual Satisfaction 85.87 87.85 82.29 86.21 (77.57 – 94.86)
Individual Choice 46.90 50.49* 41.53 37.59 (26.53 – 48.66)
Individual Inclusion 43.72 45.96 44.00 43.79 (35.39 – 52.19)
Individual Dignity 82.28 83.59 79.03 77.65 (71.49 – 83.81)
Physical Quality 96.92* 97.07* 95.50* 100.00 (100.00 – 100.00)
Family Satisfaction 90.54 91.74 91.51 -
86
47 44
82
979188
50 46
84
9792
82
42 44
79
96 9286
3844
78
100
00
20
40
60
80
100
120
SATISFACTION CHOICE INCLUSION DIGNITY PHYS QUAL FAM SAT
Scale Scores for State, Region, County, Provider
State Central CMSU Hope (CMSU)

149
Interpreting the Data
These data will allow you to compare the average response
from this provider to the average response from all people
sampled in the state, region, and AE (when applicable).
Some differences are less meaningful than others,
depending on things like the size of the sample and the range
of answers provided for that particular scale. “Confidence
intervals” are used to determine whether differences are
statistically significant, or meaningful. Confidence intervals
are reported in parentheses.
To determine whether the average score of the provider is
meaningfully different from the averages of the state,
region, or AE, you can look at whether these scores fall
outside or inside the provider’s confidence interval.
Meaningful differences are marked with an asterisk “*”.
Summary of Findings
• The provider scores were not significantly different from
the average scores for the state, region or AE.
Provider Profiles Data Display: HOPE Enterprises (Lycoming/Clinton AE) 2016-2017
Of the 5,328 individuals in the 2017 IM4Q data file, 36 individuals registered in the Lycoming/Clinton Administrative Entity received residential services from Hope.
The data in this profile are for the provider’s community-based residential services. This report presents the scale scores for the State, the Central Region,
Lycoming/Clinton AE and Hope (Lycoming/Clinton). There must be data for 10 or more individuals to meet our selection criteria for reporting. If the number of
respondents for any item falls below 5, a dash (-) is shown. For all of the scale scores, a higher score is better and the scores can range from 0 to 100. Confidence
intervals for provider scores are given. Link to explanation of items in scales is below.
* indicates meaningful difference
Link to explanation of the questions in each scale Above average marked by
SCALES State Central Lycoming/ Clinton
HOPE (Lycoming/Clinton)
Individual Satisfaction 85.87 87.85 91.30 90.47 (85.16 – 95.79)
Individual Choice 46.90 50.49 49.41 46.04 (39.69 – 52.39)
Individual Inclusion 43.72 45.96 44.85 44.19 (39.14 – 49.24)
Individual Dignity 82.28 83.59 78.28 79.17 (74.55 – 83.79)
Physical Quality 96.92 97.07 96.69 98.04 (95.75 – 100.00)
Family Satisfaction 90.54 91.74 87.26 83.48 (69.18 – 97.79)
86
47 44
82
979188
5046
84
979291
4945
78
97
8790
46 44
79
98
83
0
20
40
60
80
100
120
SATISFACTION CHOICE INCLUSION DIGNITY PHYS QUAL FAM SAT
Scale Scores for State, Region, County, Provider
State Central Lycoming/Clinton Hope (Lycoming/Clinton)
150
Provider Profile Summary: Horizon House www.hhinc.org
At Horizon House, our mission is to support individuals with intellectual disabilities and autism, so they can live and thrive in the community. We provide person-
centered services in environments that emphasize individual strengths, opportunities and choice.
We value people, personal growth, diversity, shared ideas and advocacy. These core values are central to who we are as an organization.
Horizon House, founded in 1951, has been providing community-based services for people with intellectual disabilities for over 30 years. We expanded to include
services for individuals with autism 15 years ago.
Our supportive services are designed to help individuals increase their ability to manage their lives and to become actively involved in the community. Each living
arrangement is customized to an individual’s personal growth, enrichment, individual preference and needs as they change. Residential services include: 24/7 in-
home assistance to individuals in need, facilitating semi-independent or supported living levels of care for those who require less than 24-hour per day in home
assistance, and offering “life sharing through family living’’ services for individuals desiring a family placement.
We provide care to medically fragile, those with complex needs, individuals with autism and behavioral health challenges. We built this expansion of our services,
over the last fifteen years in response to a community need and based on our experiences serving individuals with intellectual disabilities for many years. We will
work with you to make your family member comfortable and thrive in their home, based on their unique situation.
Before our staff begins working with an individual, they will first get trained on the support plan for the individual. Each team has a communication champion that
works with them to ensure we have the appropriate equipment to communicate effectively.
We encourage the individuals we serve to be active in their community. The activities are selected based on individual preference and may include religious
services, art and music therapy classes, using local gyms and fitness facilities to exercise or attend a class, local hair and nail salons, banks, restaurants, and stores.
Some individuals are active in local civic associations such as neighborhood recycling and gardening groups.
We believe that we are partners helping to build a wonderful life for those we serve. Each plan is developed with the person and his or her identified family
members and friends. We encourage regular communication between families and members of management and health care teams, and we will support families
by offering transportation to help regular visitation, sharing of life experiences and learning, celebrations and supporting each other thru the life transitions.
We believe to best provide the care we must continue to evolve and assess care. We are currently working to increase opportunities for employment for those
wishing to do so, exploring new tools and techniques that support effective means to communicate and offering alternative Residential Options of Life Sharing
and other dynamics as needs occur.

151
Interpreting the Data
These data will allow you to compare the average response
from this provider to the average response from all people
sampled in the state, region, and AE (when applicable).
Some differences are less meaningful than others,
depending on things like the size of the sample and the range
of answers provided for that particular scale. “Confidence
intervals” are used to determine whether differences are
statistically significant, or meaningful. Confidence intervals
are reported in parentheses.
To determine whether the average score of the provider is
meaningfully different from the averages of the state,
region, or AE, you can look at whether these scores fall
outside or inside the provider’s confidence interval.
Meaningful differences are marked with an asterisk “*”.
Summary of Findings
• The provider scores significantly above average for the
region on Individual Inclusion
• The provider scores significantly above average for the
state and region on Physical Quality
Provider Profiles Data Display: Horizon House (Statewide) 2016-2017
Of the 5,328 individuals in the 2017 IM4Q data file, 33 individuals registered in Pennsylvania received residential services from Horizon House. The data in this
profile are for the provider’s community-based residential services. This report presents the scale scores for the State, the Southeast Region and Horizon House
(Statewide). There must be data for 10 or more individuals to meet our selection criteria for reporting. If the number of respondents for any item falls below 5, a
dash (-) is shown. For all of the scale scores, a higher score is better and the scores can range from 0 to 100. Confidence intervals for provider scores are given.
Link to explanation of items in scales is below.
* indicates meaningful difference
Link to explanation of the questions in each scale Above average marked by
SCALES State Southeast Horizon House
Individual Satisfaction 85.87 82.83 83.83 (77.36 – 90.30)
Individual Choice 46.90 37.62 42.09 (34.26 – 49.91)
Individual Inclusion 43.72 39.99* 46.62 (40.93 – 52.31)
Individual Dignity 82.28 79.12 78.83 (73.34 – 84.33)
Physical Quality 96.92* 96.57* 99.48 (98.46 – 100.00)
Family Satisfaction 90.54 87.82 -
86
47 44
82
9791
83
38 40
79
9788
84
4247
79
99
0
20
40
60
80
100
120
SATISFACTION CHOICE INCLUSION DIGNITY PHYS QUAL FAM SAT
Scale Scores for State, Region, Provider
State SE Horizon House

152
Interpreting the Data
These data will allow you to compare the average response
from this provider to the average response from all people
sampled in the state, region, and AE (when applicable).
Some differences are less meaningful than others,
depending on things like the size of the sample and the range
of answers provided for that particular scale. “Confidence
intervals” are used to determine whether differences are
statistically significant, or meaningful. Confidence intervals
are reported in parentheses.
To determine whether the average score of the provider is
meaningfully different from the averages of the state,
region, or AE, you can look at whether these scores fall
outside or inside the provider’s confidence interval.
Meaningful differences are marked with an asterisk “*”.
Summary of Findings
• The provider scores significantly above average for the
region on Individual Choice
• The provider scores significantly above average for the
region and AE on Individual Inclusion
• The provider scores significantly above average for the
state, region and AE on Physical Quality
Provider Profiles Data Display: Horizon House (Philadelphia AE) 2016-2017
Of the 5,328 individuals in the 2017 IM4Q data file, 24 individuals registered in Philadelphia Administrative Entity received residential services from Horizon House.
The data in this profile are for the provider’s community-based residential services. This report presents the scale scores for the State, the Southeast Region,
Philadelphia AE and Horizon House (Philadelphia). There must be data for 10 or more individuals to meet our selection criteria for reporting. If the number of
respondents for any item falls below 5, a dash (-) is shown. For all of the scale scores, a higher score is better and the scores can range from 0 to 100. Confidence
intervals for provider scores are given. Link to explanation of items in scales is below.
* indicates meaningful difference
Link to explanation of the questions in each scale Above average marked by
SCALES State SE Philadelphia Horizon House (Philadelphia)
Individual Satisfaction 85.87 82.83 80.53 85.23 (77.79 – 92.67)
Individual Choice 46.90 37.62* 39.13 47.72 (38.14 – 57.30)
Individual Inclusion 43.72 39.99* 39.85* 49.44 (42.18 – 56.70)
Individual Dignity 82.28 79.12 75.18 77.08 (73.16 – 81.00)
Physical Quality 96.92* 96.57* 96.97* 99.31 (97.94 – 100.00)
Family Satisfaction 90.54 87.82 86.91 -
86
47 44
82
9791
83
38 40
79
9788
81
39 40
75
978785
48 49
77
99
0
20
40
60
80
100
120
SATISFACTION CHOICE INCLUSION DIGNITY PHYS QUAL FAM SAT
Scale Scores for State, Region, County, Provider
State SE Philadelphia Horizon House (Philadelphia)

153
Provider Profile Summary: Inclusive Employment Program (I.E.P) www.iepcarlisle.com
Our mission at the Inclusive Employment Program (I.E.P.) is to promote sustainable employment within one’s community for adults with disabilities. Our philosophy at the Inclusive Employment Program is to allow adults with disabilities to choose a career within their community that appeals to their interest. They should be afforded the opportunity to be successfully employed and socially interact with people without disabilities. We believe the inclusive employment opportunities will develop independence and self-worth in the adults with disabilities, as well as, aid in disability awareness, eliminate discrimination, and segregation within the community.
Our organization values the individuals we serve. Having a positive impact on the lives of the individuals we serve, as well as, protecting dignity of each individual is important to our organization.
We have been supporting people with intellectual disabilities and/or autism since 2016.
The Inclusive Employment Program offers services and supports to a population of individuals that truly desires to work in their community and socially engage with people without disabilities. We offer daily community participation activities in the Carlisle community. We participate in the community at many locations: Bosler Library, Grocery Stores, Community Garden, Midway Bowling, Many Restaurants, Laundromats, YMCA, Carlisle Arts Learning Center, Movie Theater, Community Pool, and Lyft/Uber Public Transportation to Locations in the Community. The exploratory worksites at the facility may include: cooking, clothing sorting/sizing, cleaning tasks, usage of appliances, copying, laminating, food inventory, money management, and social skills instruction. We offer job development that may include computer usage, filling out forms, mock interviews, and resume writing. Also, we offer supported employment that provides ongoing support for an individual at a job site. This service is tailored to the individual strengths and needs of each client to facilitate learning and job performance.
Staff receive scheduled training opportunities throughout the calendar year. We provide additional opportunities for staff to receive training with communication devices and sign language.
To engage the people we support, we provide community participation opportunities tailored to their interests.
We support our families by providing daily communication, opportunities to engage in activities at our program with other families, and by providing resources that would be beneficial to the needs of their family member.

154
Provider Profile Summary: Indian Creek Foundation www.indcreek.org
For more than 40 years, Indian Creek Foundation has provided services to children and adults with intellectual and developmental disabilities throughout Bucks
and Montgomery counties. The Foundation’s mission is to provide opportunities for people with intellectual and developmental disabilities to live in and enrich
the community throughout their lives. Through three departments offering behavioral health services, residential, and vocational programs, the foundation meets
the needs of nearly 1200 individuals each year.
Behavioral Health Services: This department provides behavioral health supports to children and adults, who have an intellectual or developmental disability, as
well as a mental health challenge. Home and community-based supports incorporate the use of positive approaches, relationship development, skill building and
environmental adaptations to promote positive behaviors and personal wellness. Medication management and psychotherapy promote recovery and symptom
management. Services include: Intake/ Extended Assessment, Behavioral Health Rehabilitation Services - Wraparound (BHRS), Applied Behavior Analysis (ABA),
the Outpatient Mental Health Center, Therapeutic After School Program (TASP), Summer Therapeutic Activities Program (STAP), Transition Age Youth (TAY)
Program, Peer Support Services, and Adult Behavior Support.
Residential & Community Based Services: A continuum of individualized services are offered to support people in exploring their place in the community. Twenty-
four hour a day care is provided in homes throughout the area. Support is also given to individuals living independently or with a host family in their community.
Residential & Community Based Services Department believes that individuals with an intellectual or developmental disability deserve to live in a safe environment
that encourages positive relationships. Individuals served are supported in realizing their life goals through the expression of personal choice and community
involvement.
Day Services: Community Participation Supports, vocational training, small group employment, Discovery and career development and day program options are
provided for adults with intellectual and developmental disabilities. Residents of Indian Creek Foundation and other adults in the community are offered a variety
of support options to assist adults with intellectual and developmental disabilities to greater community integration through meaningful community activities,
volunteerism and competitive employment.
Staff are trained on the ISP for each individual and follow the communication guidelines that are specified in it.
All of Indian Creek Foundation’s programs have an element of community participation built into them. Youth in our autism support programs take part in
community activities and exploration several times a week. Our day services individuals can choose from over one dozen community volunteer opportunities. In
our residential programs, individuals are encouraged to participate in activities in their neighborhoods, either individually or in groups.
Direct communication with families is a key part of how Indian Creek Foundation operates. Our staff works with families and their support teams to ensure that
all involved are a part of the care plan. Additionally, we provide information about advocacy and activity opportunities through the FOR FAMILIES tab on our
website and other social media outlets. Families are also invited to community-wide events that are hosted by Indian Creek Foundation.

155
Interpreting the Data
These data will allow you to compare the average response
from this provider to the average response from all people
sampled in the state, region, and AE (when applicable).
Some differences are less meaningful than others,
depending on things like the size of the sample and the range
of answers provided for that particular scale. “Confidence
intervals” are used to determine whether differences are
statistically significant, or meaningful. Confidence intervals
are reported in parentheses.
To determine whether the average score of the provider is
meaningfully different from the averages of the state,
region, or AE, you can look at whether these scores fall
outside or inside the provider’s confidence interval.
Meaningful differences are marked with an asterisk “*”.
Summary of Findings
• The provider scores significantly below average for the
state and region on Individual Choice
• The provider scores significantly below average for the
state and region on Individual Inclusion
• The provider scores significantly below average for the
state on Individual Dignity
Provider Profiles Data Display: Indian Creek Foundation (Statewide) 2016-2017
Of the 5,328 individuals in the 2017 IM4Q data file, 23 individuals registered in Pennsylvania received residential services from Indian Creek. The data in this profile
are for the provider’s community-based residential services. This report presents the scale scores for the State, the Southeast Region and Indian Creek (Statewide).
There must be data for 10 or more individuals to meet our selection criteria for reporting. If the number of respondents for any item falls below 5, a dash (-) is
shown. For all of the scale scores, a higher score is better and the scores can range from 0 to 100. Confidence intervals for provider scores are given. Link to
explanation of items in scales is below.
* indicates meaningful difference
Link to explanation of the questions in each scale Above average marked by
SCALES State SE Indian Creek
Individual Satisfaction 85.87 82.83 80.54 (66.60 – 94.47)
Individual Choice 46.90* 37.62* 19.31 (11.45 – 27.16)
Individual Inclusion 43.72* 39.99* 27.25 (21.67 – 32.83)
Individual Dignity 82.28* 79.12 75.00 (70.16 – 79.84)
Physical Quality 96.92 96.57 96.21 (88.79 – 100.00)
Family Satisfaction 90.54 87.82 92.71 (84.85 – 100.00)
86
47 44
82
9791
83
38 40
79
9788
81
1927
75
96 93
0
20
40
60
80
100
120
SATISFACTION CHOICE INCLUSION DIGNITY PHYS QUAL FAM SAT
Scale Scores for State, Region, Provider
State SE Indian Creek
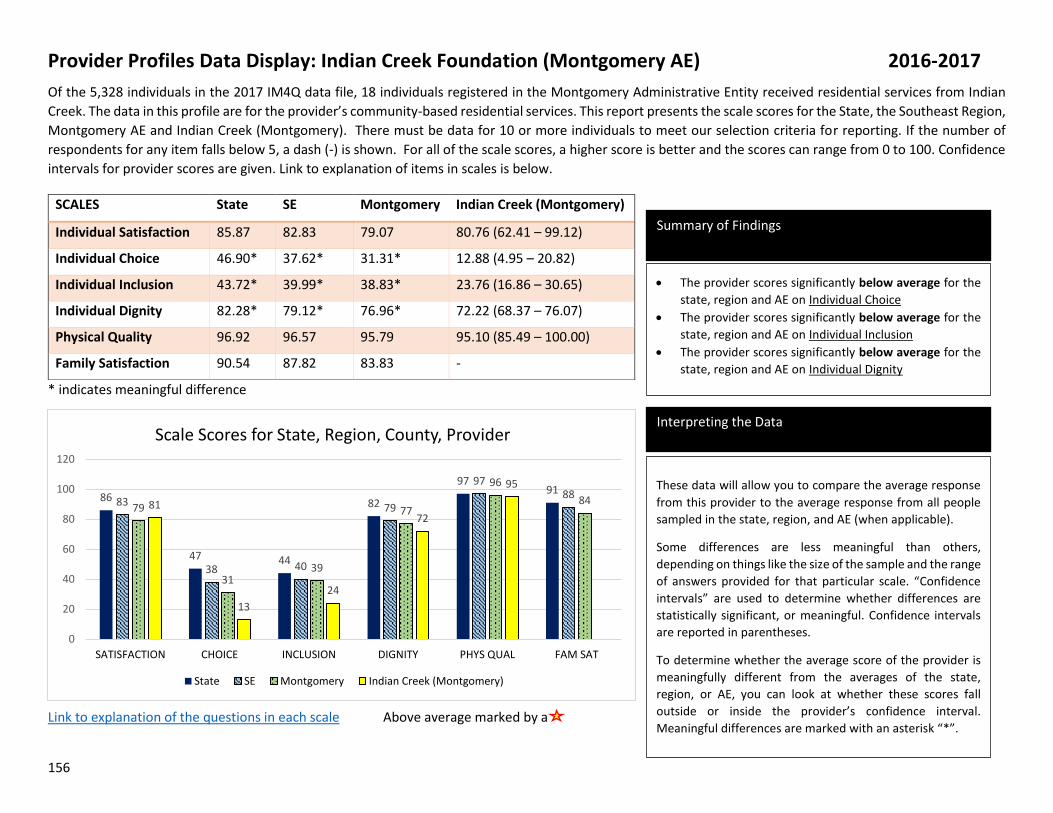
156
Interpreting the Data
These data will allow you to compare the average response
from this provider to the average response from all people
sampled in the state, region, and AE (when applicable).
Some differences are less meaningful than others,
depending on things like the size of the sample and the range
of answers provided for that particular scale. “Confidence
intervals” are used to determine whether differences are
statistically significant, or meaningful. Confidence intervals
are reported in parentheses.
To determine whether the average score of the provider is
meaningfully different from the averages of the state,
region, or AE, you can look at whether these scores fall
outside or inside the provider’s confidence interval.
Meaningful differences are marked with an asterisk “*”.
Summary of Findings
• The provider scores significantly below average for the
state, region and AE on Individual Choice
• The provider scores significantly below average for the
state, region and AE on Individual Inclusion
• The provider scores significantly below average for the
state, region and AE on Individual Dignity
Provider Profiles Data Display: Indian Creek Foundation (Montgomery AE) 2016-2017
Of the 5,328 individuals in the 2017 IM4Q data file, 18 individuals registered in the Montgomery Administrative Entity received residential services from Indian
Creek. The data in this profile are for the provider’s community-based residential services. This report presents the scale scores for the State, the Southeast Region,
Montgomery AE and Indian Creek (Montgomery). There must be data for 10 or more individuals to meet our selection criteria for reporting. If the number of
respondents for any item falls below 5, a dash (-) is shown. For all of the scale scores, a higher score is better and the scores can range from 0 to 100. Confidence
intervals for provider scores are given. Link to explanation of items in scales is below.
* indicates meaningful difference
Link to explanation of the questions in each scale Above average marked by a
SCALES State SE Montgomery Indian Creek (Montgomery)
Individual Satisfaction 85.87 82.83 79.07 80.76 (62.41 – 99.12)
Individual Choice 46.90* 37.62* 31.31* 12.88 (4.95 – 20.82)
Individual Inclusion 43.72* 39.99* 38.83* 23.76 (16.86 – 30.65)
Individual Dignity 82.28* 79.12* 76.96* 72.22 (68.37 – 76.07)
Physical Quality 96.92 96.57 95.79 95.10 (85.49 – 100.00)
Family Satisfaction 90.54 87.82 83.83 -
86
47 44
82
9791
83
38 40
79
9788
79
3139
77
96
8481
13
24
72
95
0
20
40
60
80
100
120
SATISFACTION CHOICE INCLUSION DIGNITY PHYS QUAL FAM SAT
Scale Scores for State, Region, County, Provider
State SE Montgomery Indian Creek (Montgomery)

157
Provider Profile Summary: Institute for Human Resources & Services www.ihrser.com
Our mission is to provide a homelike atmosphere within a semi-structured community setting that enables consumers to attain their individual potential. This
includes supporting the consumers in their everyday lives by providing a consumer with choice, control, stability, safety, and freedom. Integral to this mission is
the direct care professional's support of each individual's personal and social development. This support includes ensuring that the consumers have access to
quality care and services, consumers have the opportunity to make choices on their own and form healthy relationships within the community. The direct care
professionals will act as mentors to the consumers so that they may achieve success as contributing members of the community.
Our guiding values are to provide continuity of care, create a homelike environment, encourage independence and engage in community activities.
We have been serving people for over forty years.
The Institute provides residential services for individuals with intellectual disabilities in a home that is owned by the Institute. These services include, but are not
limited to, assistance with hygiene, dressing, cooking, transportation, medical appointments, and community activities. The Institute also provides respite services
for individuals with intellectual disabilities who are in need of a place to stay for a short period of time due to family emergencies, medical emergencies, etc.
Behavior support services are provided by a behavior specialist who is employed by the Institute.
Our employees receive training specific to each individual's needs.
Individuals who reside in Institute homes have many opportunities to engage in community activities. Employees transport individuals to grocery stores, malls,
restaurants, parks, movies, concerts, sporting events, and many other activities on a regular basis.
Families are encouraged to participate in the support and care of their loved one as much as possible.

158
Interpreting the Data
These data will allow you to compare the average response from this provider to the average response from all people sampled in the state, region, and AE (when applicable).
Some differences are less meaningful than others, depending on things like the size of the sample and the range of answers provided for that particular scale. “Confidence intervals” are used to determine whether differences are statistically significant, or meaningful. Confidence intervals are reported in parentheses.
To determine whether the average score of the provider is meaningfully different from the averages of the state, region, or AE, you can look at whether these scores fall outside or inside the provider’s confidence interval. Meaningful differences are marked with an asterisk “*”.
Summary of Findings
• The provider scores significantly above average for the
state on Individual Satisfaction
• The provider scores significantly below average for the
region on Individual Choice
• The provider scores significantly below average for the
state, region and AE on Individual Dignity
Provider Profiles Data Display: Institute for Human Resources & Services (Luzerne/Wyoming AE) 2016-2017
Of the 5,328 individuals in the 2017 IM4Q data file, 21 individuals registered in Luzerne/Wyoming Administrative Entity received residential services from Institute
for Human Resources & Services. The data in this profile are for the provider’s community-based residential services. This report presents the scale scores for the
State, the Northeast Region, Luzerne/Wyoming AE and Institute for Human Resources & Services (Luzerne/Wyoming). There must be data for 10 or more
individuals to meet our selection criteria for reporting. If the number of respondents for any item falls below 5, a dash (-) is shown. For all of the scale scores, a
higher score is better and the scores can range from 0 to 100. Confidence intervals for provider scores are given. Link to explanation of items in scales is below.
* indicates meaningful difference **Statewide and AE specific data is the same for this provider
Link to explanation of the questions in each scale Above average marked by
SCALES State NE Luzerne/ Wyoming
Institute for Human Resources & Services (Luzerne/Wyoming)**
Individual Satisfaction 85.87* 89.11 92.14 93.06 (87.73 – 98.38)
Individual Choice 46.90 54.66* 47.14 43.77 (37.95 – 49.59)
Individual Inclusion 43.72 48.05 43.34 42.97 (37.54 – 48.40)
Individual Dignity 82.28* 88.82* 79.60* 75.98 (73.50 – 78.46)
Physical Quality 96.92 96.97 96.06 95.24 (91.24 – 99.23)
Family Satisfaction 90.54 92.50 95.76 94.00 (89.26 – 98.73)
86
47 44
82
979189
5548
8997
9392
4743
80
96 9693
44 43
76
95 94
0
20
40
60
80
100
120
SATISFACTION CHOICE INCLUSION DIGNITY PHYS QUAL FAM SAT
Scale Scores for State, Region, County, Provider
State NE Luzerne/Wyoming Institute for Human Resources & Services (Luzerne/Wyoming)

159
Provider Profile Summary: Integrity Home Health www.integrityhomehealthllcpa.com
Integrity Home Health’s mission is to improve the relationship of all consumers served, partnering agencies and employees. The business was founded on the hope of providing the best level of care while retaining the uppermost respect for consumers, their families, partnering agencies and our employees. We developed a unique service and that is to create a positive experience to everyone we come in contact with. Integrity’s employees are trained to give reverence to all. Raising the bar by remaining committed to providing Integrity, Excellence, and Empathy to employees, partnering agencies and consumers. Integrity values what is important to people with disabilities and their families, who are striving for an Everyday Life. An Everyday Life is about opportunities, relationships, rights, and responsibilities. It is about being a member of the community, having a valued role, contributing to society, and having one’s rights as a citizen fully respected. It is a vision that we should all be working toward together. People with disabilities have a right to an everyday life; a life that is no different than that of all other citizens. This continues to be the truest statement on which we can build our work. We do not discriminate against any person on the basis of race, color, national origin, disability, age, treatment services and/or employment.
Guiding values: To respect choice in all aspects of your life, including relationships, community support, living arrangements, and your individual life. We respect your right to control medical treatment, support and services. To be actively involved in a comprehensive assessment of your individual care plan. To raise the bar to exceed your expectations. To assist you in living an Everyday Life.
We have been serving people for 4 Years.
We offer: In-Home Community Supports, Companion Services, Respite (In-Home) and Home Chore Services.
We take every step to make sure our staff is ISP-trained, including our consumers’ methods of communication.
Confirming an employee's understanding of strategy and direction is vital to our agency. Independent data shows that engaged employees promote the agency, stay longer and positively affect outcomes.
We support and engage family members in meaningful agency activities. Family involvement is an important component.
Consumer and family feedback is an important component of quality improvement for IHCS. The overall consumer experience is crucial, not only to the agency, but also to our consumer health. Consumers can be dissatisfied for many reasons, such as poor communication, therefore, the data from our surveys are taken seriously and we work with families to improve overall quality of services.

160
Provider Profile Summary: Interim HealthCare of Pittsburgh, Inc. www.interimhealthcare.com
Throughout our 50-year history, Interim’s mission has remained clear and consistent: to improve people’s lives in our community by supporting them to help maintain their safety, independence, and dignity in an environment of mutual respect and compassion. Our ODP mission is to provide individuals with intellectual disabilities, autism, and their families the services and supports they need and the opportunity to make real choices about living, working, and options for social activities to enable them to live in and participate fully in the life of their communities.
Our guiding values: • Integrity: We act openly and truthfully in all that we do and comply with laws and regulations. • Compassion: We care about others' needs. • Customer Focus: We value long-term relationships by being committed to listening, respecting and responding to our customers' needs. • Innovation: We find solutions and are resourceful in meeting customers' needs. • Financial Responsibility: We continue to grow and prosper to ensure long-term opportunities for our employees and customers.
Interim has been supporting individuals with intellectual disabilities in the Pittsburgh and surrounding areas for over 30 years.
Interim provides in-home nursing and home health aide shift care.
Our areas of expertise include supporting individuals with complex medical needs by servicing with nursing and home health aide shift care in their home setting. We employ nurse educators that provide comprehensive training to our field staff through utilization of state-of-the-art simulation equipment and individualized training with the individual.
Prior to initiating an assignment with a new client, our clinical management team will communicate with the family to ensure a clear understanding of the client’s needs and the environment of care. This way we can ensure a good match with our personnel. We then offer the family a “meet and greet” session with the client and family to once again ensure that the personnel is a good fit for everyone. Once agreed upon, an orientation to the client’s plan of care and ISP is provided to the assigned staff before they begin their official assignment.
Interim HealthCare embraces the philosophy of providing individualized and appropriate care within the nurturing environment of the client’s home. Our personnel are trained to follow the individual’s ISP and are able to address any concerns with their assigned clinical supervisor. We offer a comprehensive range of home health care personnel and services.
Prior to initiating an assignment with a new client, our clinical management team interviews with the families to ensure a clear understanding of the client’s needs and the environment of care so that we can ensure a good match with our assigned staff. Our in-home staff then engage and interact regularly with their clients (and families) while supporting their needs. Our clinical management staff conduct routine supervisory visits in the home to assess how things are going. A clinical RN supervisor is available to the individual/families and personnel 24 hours a day 7 days a week. In addition, our in-office coordinators have regular touchpoint calls with the clients/families to ensure smooth scheduling and offer any necessary support or provide any requested information.
Our Quality Management Plan is focusing on adverse events, infectious disease trends, hospital readmission reductions and also maximizing client satisfaction. Our QAPI team is constantly evaluating our data to identify any new or additional areas that might benefit from improvement projects.
Interim HealthCare is the national leader in home health, senior care, medical staffing and hospice franchises. We have been providing home care to clients since 1966, and locally in Pittsburgh since 1971. At the core of this longevity and success is a staff committed to providing the most compassionate and professional care available in the communities they serve. We are dedicated to providing the highest quality personnel, care, and service to our clients. We operate with a written Code of Ethics and abide by national Standards of Practice.

161
Provider Profile Summary: InVision Customized Services www.invisionhs.org
InVision’s mission is to passionately deliver an array of person-driven services for people with disabilities in pursuit of their life visions. We believe the foundation
for successful supports are services customized to meet each person’s individual needs; meaningful relationships between the staff, the people we support, and
their families; and honoring the person’s role as the leader of his or her own services.
All human beings are treated with dignity and respect. We are determined to act with integrity, knowing that doing so often requires courage and tenacity. We
choose innovation over convention. We take risks, learn from the outcomes, and use that knowledge as an impetus for improvement.
We have been serving people for 27 years.
We offer a residential program which provides support 24 hours per day, seven days per week, including a program that specializes in the support of people with
problematic sexual behaviors. The location of each home is selected based upon the preferences of the person supported and his or her family and is customized
to meet their needs. Our employment supports program helps people find jobs by focusing on what a person wants to do, what they are good at, and what they
need to be successful. We can also provide support on the job once a person is employed. InVision’s community supports program is for people who already have
a home or live with family members and are looking for support in a variety of areas. These services can be individualized to meet many needs including but not
limited to socialization, community involvement, shopping, personal care, home maintenance, and health care coordination.
We specialize in working with people who are dually diagnosed and exhibit complex behavioral concerns. Many of the people we support in our residential
programs have been incarcerated, experienced institutional care or extended /frequent psychiatric hospitalizations, or were unsuccessfully supported by other
providers.
Our staffs communicate with the people they support in the manner which best works for the person, whether it be through the use of gestures, a communication
device, pictures, individualized sign language or ASL.
The people we support are engaged in the communities of their choice based upon their personal interests and preferences. This can range from membership at
a local gym, to participation at their preferred church, to watching high school baseball, or volunteering at a local animal shelter.
Our quality initiatives include the following: decreasing turnover of DSPs and front-line supervisory staff, reducing critical incidents, and increasing the satisfaction
of our employees, their families, and the people we support.
Communication with family members is based upon the families’ preference and can range from weekly phone calls, to routine email updates, to quarterly face-
to-face meetings. We are determined to enhance our relationships with the family members of the people we support by holding regional roundtable discussions
and asking family members to join our advocacy efforts.

162
Interpreting the Data
These data will allow you to compare the average response
from this provider to the average response from all people
sampled in the state, region, and AE (when applicable).
Some differences are less meaningful than others,
depending on things like the size of the sample and the range
of answers provided for that particular scale. “Confidence
intervals” are used to determine whether differences are
statistically significant, or meaningful. Confidence intervals
are reported in parentheses.
To determine whether the average score of the provider is
meaningfully different from the averages of the state,
region, or AE, you can look at whether these scores fall
outside or inside the provider’s confidence interval.
Meaningful differences are marked with an asterisk “*”.
Summary of Findings
• The provider scores significantly above average for the
state on Individual Choice
• The provider scores significantly above average for the
state on Individual Inclusion
Provider Profiles Data Display: InVision Customized Services (Statewide) 2016-2017
Of the 5,328 individuals in the 2017 IM4Q data file, 25 individuals registered in Pennsylvania received residential services from Invision. The data in this profile are
for the provider’s community-based residential services. This report presents the scale scores for the State of Pennsylvania and Invision (Statewide). There must
be data for 10 or more individuals to meet our selection criteria for reporting. If the number of respondents for any item falls below 5, a dash (-) is shown. For all
of the scale scores, a higher score is better and the scores can range from 0 to 100. Confidence intervals for provider scores are given. Link to explanation of items
in scales is below.
* indicates meaningful difference
Link to explanation of the questions in each scale Above average marked by
SCALES State Invision
Individual Satisfaction 85.87 85.61 (77.46 – 93.76)
Individual Choice 46.90* 60.53 (52.15 – 68.90)
Individual Inclusion 43.72* 54.89 (49.13 – 60.65)
Individual Dignity 82.28 81.82 (66.91 – 96.73)
Physical Quality 96.92 97.57 (94.88 – 100.00)
Family Satisfaction 90.54 -
86
47 44
82
9791
86
6155
82
98
0
20
40
60
80
100
120
SATISFACTION CHOICE INCLUSION DIGNITY PHYS QUAL FAM SAT
Scale Scores for State and Provider
State Invision

163
Provider Profile Summary: J-30 Solutions
J-30 Solutions, LLC provides behavioral support services for individuals. Our mission is to support Pennsylvanians with developmental disabilities to achieve greater independence, choice and opportunity in their everyday lives. Our vision is to continuously improve an effective system of accessible services and supports that are flexible, innovative and person-centered. Through a variety of intervention and support strategies, in concert with the individual, their staff, or their family, we design, monitor, and re-evaluate interventions to best meet their current needs. Services can be time-limited in the case of crisis management or may be ongoing for more chronic conditions. In all cases, our purpose is to enhance the abilities of our clients to have the highest quality of life experiences possible.
J-30 Solution’s values are to provide the highest quality of care in a manner that encourages healing and inspires hope. We value the unique strengths and capabilities of our clients, and we are dedicated to providing a personalized treatment experience to each individual who heals with us. We appreciate the valuable role that family can play in the treatment and servicing processes, and we endeavor to promote healing within individuals/families and prepare our clients’ loved ones to be sources of ongoing support. J-30 Solution’s clients and their families can expect to receive clinically superior care in a safe, supportive, and highly structured environment where each person will be treated with kindness, dignity, and respect.
J-30 Solutions has been serving people for 18 years.
J-30 Solutions, LLC offers a range of positive participant-centered services to persons with developmental disability, intellectual disability or autism, to live more independently in their homes and communities and to provide a variety of services that promote community living, including participant directed service models, and traditional agency-based models.
J-30 Solution’s area of special expertise is individuals with behavioral support needs.
J-30 Solutions ensures staff can effectively communicate with people they support through creating a receptive atmosphere, making it easier to communicate their thoughts and feelings to staff via open meetings.
J-30 Solutions engages people it supports in the community through asking questions and creating open ended content. We build excitement to get people involved. We encourage a Community-Focused Culture.
J-30 Solutions engages families by being intentional in learning about our families. It is important to engage in conversations and develop an awareness of each family’s needs, preferences and prior experiences in terms of involvement with behavioral health.

164
Provider Profile Summary: Jennifer Menichini (Keystone Adult Day Care)
Keystone Adult Day Care is a flexible, safe environment accommodating the special needs and behaviors of people with intellectual disabilities, Alzheimer's and Dementia diseases and other related disorders. We promote 'High Touch' rather than 'High Tech'. Our staff is trained and expected to adapt to and respect the lifestyle, dignity, independence and diversity of each individual that is being cared for at our facility. Our programs of activities and exercise, physical environment and operating philosophy establish our center as a model for similar centers and populations. Keystone welcomes anyone in the Wyoming Valley who may benefit from our program and the services we offer. We provide education, counseling, care planning and general support to those clients, family members and caregivers wishing to engage in the process of support. We work hand in hand with case workers, family members and other persons, providing care to our clients to ensure the treatment and stimulation they are being provided coincides with the Individuals Support Plan (ISP), uniquely designed with each client. As a facility, we partake in the ISP planning process to see that each one of our clients receives the exact support, stimulation and care that they need. The facility is designed to be a home-like atmosphere, one that provides respect, understanding and compassion. At Keystone Adult Day Care, we strive to make clients feel as comfortable in their environment as possible and are devoted to the consistency of the care we provide.
Keystone Adult Day Care shows respect along with compassion to every client we serve. Treating others with compassion, consideration, appreciation and dignity.
We have been serving people for 19 years.
Keystone Adult Day Care provides group and individual activities, health and wellness monitoring, exercises for all levels of ability, assistance with personal care needs, assistance with breakfast and lunch monitoring/feeding, along with personal attention to meet the needs of each individual.
Keystone Adult Day Care is dedicated to socially impaired, physically impaired, mentally confused, and can provide behavior supports to each individual as needed.
Keystone Adult Day Care staff can effectively communicate with the clients they support by reading each individuals ISP, talking with each client and learning what they like and what their needs are. Staff members read each ISP annually and when there are changes made, and also sign off that they have read each ISP. Staff has yearly training to ensure proper and effective communication with the clients.
Keystone Adult Day care will review each client’s ISP to see what the client enjoys doing. We will ask the client what they would like to do and encourage them to participate.
Each client’s family is invited to attend all meetings in regard to the client. The program manager speaks to the families weekly in regard to the client’s week, health and needs. All families are invited to attend in-house and community activities.

165
Provider Profile Summary: JEVS Human Services www.jevshumanservices.org
JEVS Human Services believes that individuals strengthen their communities by realizing their highest quality of life through the achievement of personal and
vocational potential. Individuals can build rich and meaningful lives with a strong focus on identifying opportunities where they can contribute their gifts and make
a difference. Our mission is to enhance the employability, independence and quality of life of individuals.
Guided by our Core Principles of Commitment to Excellence, Quality Customer Service, Leadership at All Levels, Collaboration, and Integrity, JEVS creates solutions
to address current and future community needs and to make hope happen for individuals.
Although our emphasis is now community employment, JEVS was cutting-edge in 1955 when we opened a sheltered workshop for people with disabilities.
Residentially, JEVS opened our first home in 1984 to support individuals returning to the community from Pennhurst Institution.
Currently, we provide residential supports in many ways for people to live an everyday life. Some people live in our Community Homes and need staffing support
24 hours a day while we support others who live in their own home and need life coaching or specified support. Others live with a host family in our Life Sharing
service. JEVS operates a Community Participation program where we support individuals to volunteer and participate in meaningful activities in the community.
We foster independence from a whole life perspective, teach independent living skills, help people find and keep meaningful work in the community, and
encourage an active and engaged community life.
JEVS builds consistent support relationships so that staff understand and support an individual’s personal communication style. We work with support teams to
determine the best techniques for each individual and take necessary steps to support them with technology and tools. We assure that each person has a voice
and we value what they say.
JEVS trains their staff to assure that each person is able to explore and seek what is meaningful and important that will lead to increased community engagement
and connection. We encourage individuals to contribute as a good neighbor and learn what resources are available to them. As an organization, JEVS actively seeks
community partnerships that support engagement. While the ways in which this happens varies based on individual preference, we take steps to ensure that
individuals are a part of the full fabric of their community.
JEVS intentionally seeks opportunities to build strong collaboration and partnerships with both the people we serve and their families to help us be responsive to
changing needs and drive service innovation. We survey families related to their satisfaction. In some programs, families join a Steering Committee to partner with
us for outreach and provide input into our structures.
We have learned that when we engage committed and talented staff who connect our customers with high impact services through ongoing relationships rooted
in love and respect, we enhance lives, expand opportunities, foster sustained resilience and independence, and help people reach their goals.

166
Interpreting the Data
These data will allow you to compare the average response
from this provider to the average response from all people
sampled in the state, region, and AE (when applicable).
Some differences are less meaningful than others,
depending on things like the size of the sample and the range
of answers provided for that particular scale. “Confidence
intervals” are used to determine whether differences are
statistically significant, or meaningful. Confidence intervals
are reported in parentheses.
To determine whether the average score of the provider is
meaningfully different from the averages of the state,
region, or AE, you can look at whether these scores fall
outside or inside the provider’s confidence interval.
Meaningful differences are marked with an asterisk “*”.
Summary of Findings
• The provider scores significantly above average for the
region on Individual Choice
Provider Profiles Data Display: JEVS Human Services (Statewide) 2016-2017
Of the 5,328 individuals in the 2017 IM4Q data file, 20 individuals registered in Pennsylvania received residential services from JEVS. The data in this profile are for
the provider’s community-based residential services. This report presents the scale scores for the State, the Southeast Region and JEVS (Statewide). There must
be data for 10 or more individuals to meet our selection criteria for reporting. If the number of respondents for any item falls below 5, a dash (-) is shown. For all
of the scale scores, a higher score is better and the scores can range from 0 to 100. Confidence intervals for provider scores are given. Link to explanation of items
in scales is below.
* indicates meaningful difference
Link to explanation of the questions in each scale Above average marked by
SCALES State SE JEVS
Individual Satisfaction 85.87 82.83 76.92 (66.77 – 87.08)
Individual Choice 46.90 37.62* 49.72 (39.87 – 59.58)
Individual Inclusion 43.72 39.99 42.84 (34.17 – 51.51)
Individual Dignity 82.28 79.12 78.82 (71.89 – 85.74)
Physical Quality 96.92 96.57 94.17 (89.88 – 98.46)
Family Satisfaction 90.54 87.82 -
86
47 44
82
9791
83
38 40
79
9788
77
5043
79
94
0
20
40
60
80
100
120
SATISFACTION CHOICE INCLUSION DIGNITY PHYS QUAL FAM SAT
Scale Scores for State, Region, Provider
State SE JEVS

167
Interpreting the Data
These data will allow you to compare the average response
from this provider to the average response from all people
sampled in the state, region, and AE (when applicable).
Some differences are less meaningful than others,
depending on things like the size of the sample and the range
of answers provided for that particular scale. “Confidence
intervals” are used to determine whether differences are
statistically significant, or meaningful. Confidence intervals
are reported in parentheses.
To determine whether the average score of the provider is
meaningfully different from the averages of the state,
region, or AE, you can look at whether these scores fall
outside or inside the provider’s confidence interval.
Meaningful differences are marked with an asterisk “*”.
Summary of Findings
• The provider scores significantly below average for the
state on Individual Satisfaction
• The provider scores significantly above average for the
region and AE on Individual Choice
Provider Profiles Data Display: JEVS Human Services (Philadelphia AE) 2016-2017
Of the 5,328 individuals in the 2017 IM4Q data file, 18 individuals registered in Philadelphia Administrative Entity received residential services from JEVS. The data
in this profile are for the provider’s community-based residential services. This report presents the scale scores for the State, the Southeast Region, Philadelphia
AE and JEVS (Philadelphia). There must be data for 10 or more individuals to meet our selection criteria for reporting. If the number of respondents for any item
falls below 5, a dash (-) is shown. For all of the scale scores, a higher score is better and the scores can range from 0 to 100. Confidence intervals for provider
scores are given. Link to explanation of items in scales is below.
* indicates meaningful difference
Link to explanation of the questions in each scale Above average marked by
SCALES State SE Philadelphia JEVS (Philadelphia)
Individual Satisfaction 85.87* 82.83 80.53 75.00 (64.75 – 85.25)
Individual Choice 46.90 37.62* 39.13* 50.38 (40.05 – 60.71)
Individual Inclusion 43.72 39.99 39.85 42.04 (33.02 – 51.06)
Individual Dignity 82.28 79.12 75.18 79.17 (71.62 – 86.72)
Physical Quality 96.92 96.57 96.97 94.44 (89.87 – 99.02)
Family Satisfaction 90.54 87.82 86.91 -
86
47 44
82
9791
83
38 40
79
9788
81
39 40
75
97
87
75
5042
79
94
0
20
40
60
80
100
120
SATISFACTION CHOICE INCLUSION DIGNITY PHYS QUAL FAM SAT
Scale Scores for State, Region, County, Provider
State SE Philadelphia JEVS (Philadelphia)
168
Provider Profile Summary: Just Life, Inc.
Just Life is a private agency whose mission is to provide positive behavior supports, clinical expertise and functional adaptive training options to children, adolescents and adults experiencing intellectual and developmental disabilities, mental health disorders and/or behavior challenges and who may be characterized as having a dual diagnosis. Support plans and programs provided by Just Life Inc staff evolve through functional analysis and comprehensive assessment processes. As such, plans, programs and supports are functional, state of the art, and based on sound clinical information and expertise. A key aspect of all plans and supports is the direct attention given to incorporation of a person-centered/positive approach, encouraging the principles of the “Everyday Lives” philosophy. To this end, Just Life Inc assists service providers and augment services across many environments as individuals are assisted to integrate into many varied environments and become successful.
Our guiding values aligns with the 'Everyday Lives Philosophy'.
We have been supporting people for approximately 20 years.
We offer Behavioral Support Services.
Our area of special expertise is Individuals with Behavioral Support Needs and often individuals who are dually diagnosed.
Staff are trained in using visuals and information from others who are serving our individuals in order to best understand the people we support; we do not support the deaf population at this time.
We encourage participation in community activities.
If applicable, families are part of the initial assessment process when completing functional behavioral analyses, and are also welcome to participate in any training offered following the completion of a behavior support plan for the individual.
Our main quality improvement project is to optimize our collection and analysis of data to support evidence-based practices.
169
Provider Profile Summary: K&K Healthcare Services (KKHC)
K&K Healthcare Service’s mission is to create a system of care and supports that will provide individuals with complex behavioral or medical conditions with the options for living at home or in the community. KKHC supports programs for attaining independence and seeks opportunities for individuals to grow and develop personal connections in community settings. KKHC believes that individuals should have opportunities to receive services and supports in their own communities, regardless of the complexity of their conditions, the severity of their disabilities, or the challenges of their behavior. KKHC empowers the individuals we serve to have the freedom to direct their care vision to preserve the promise of good quality of life for all people we serve.
Our values at KKHC help shape and direct the services we provide to individuals and their families. As an organization, we believe that human relationships are the basis for growth and change. We maintain that individuals have both the right and a responsibility to participate in the development of their service plan. We respect the individuals. We believe that in community settings, the individuals we serve have the freedom and opportunity to establish safe and stable relationships. We encourage a culture that embraces and promotes growth, change, and innovation through teamwork.
We have been serving people for more than 20 years.
We offer: Residential Services- this is designed to assist individuals to live as independently as possible with one other roommate in the community. The program focuses on safety, skill building, fostering relationships, socialization, choice, independence, community integration, and personal growth. Staffing ratios depend on individual needs. Home & Community Habilitation Services- this is a direct (face-to-face) service provided in-home and in community settings to assist individuals in acquiring, maintaining, and improving self-help; services are provided by trained staff and tailored to the needs and goals of the individual.
The staff that support the people we serve are trained to be patient and allow additional time for exchange of information. Our staff speak with individuals in a respectful manner and tone of voice. Also having consistence staff persons that know individuals well may help.
AT KKHC we engage the people we support in the community by first setting up an initial appointment/meeting to ask what they would like to do. We also follow ISPs and develop working relationships.
We support individuals by giving choice as to what they will like to do in their everyday life, and engage families in developing the plan through working collaboratively.
The quality improvement projects we are working on include making sure individuals we serve are protected from neglect and abuse and do not have any incidents.
K & K Healthcare Services is an agency that believes everyone has the right to live life as they wish, with the help of people they trust. We are also an agency that treats all of our individuals as family.

170
Provider Profile Summary: Kabernet Assist, LLC
Our Mission: To create opportunities for people with intellectual and developmental disabilities to actively participate in their communities and make choices that enrich their quality of life. Our Vision: for individuals with diverse needs to have the opportunity to 'actualize' their potential and be a contributing citizen in society.
Our guiding values: To support individuals with diverse needs while creating health experiences in life and meaningful encounters in the community.
We have been serving people for 9 years.
We offer: In-Home Community Supports- 1:1 Assist participants to acquire, maintain and improve those skills necessary to live at home and function in the community successfully. Community Participation Support-1:1 Facilitate opportunities that support community inclusion. Assist individuals with skill development and participation in various integrated community settings based on their interests. Supported Employment- 1:1 Job Finding-Assist individuals with identifying job skills, resume preparation, interview preparation, employer outreach and task development necessary for successful employment. Job Coaching- 1:1 Job support such as assisting with on the job assignments and training that is necessary to maintain or learn new job assignments. Assist with maintaining acceptable job performance.
Our areas of expertise are Community Participation and Supported Employment.
All staff complete a comprehensive training program prior to working with their clients. Training is also customized for each client.
All our services take place 100% in the community. We attend community activities and support individuals in engaging in meaningful volunteer work.
We engage families through weekly or daily contact via conversation or emails, and reviewing choices, successes and plans.
Quality improvement projects we are working on: Health and Safety and Person-Centered (i.e. Consumers will have full access to activities of choice free of restrictions).
Many of our services focus on utilizing educational nature experiences as a healing medium.

171
Provider Profile Summary: Keller Wheelchair Lifts
The mission of Keller Wheelchair Lifts is to provide mobility equipment with professional installation and safe and courteous transportation.
Keller Wheelchair Lift’s guiding values are dependability and reliability for our customers.
We have been serving people for more than 40 years.
We specialize in mobility equipment and professional installation for vans and cars.
We also provide handicap driver training.
Most of our staff has been with us for more than 15 years. We are all well versed.
We inform people about our services through advertising and involvement with local rehab centers. We explain our process to families from the beginning, to the end and along the way.
We are constantly keeping up with technology.

172
Provider Profile Summary: Kelsch Associates www.kelschassociates.org
Mission: Kelsch Associates is a family run and privately-operated social service agency administering a variety of residential and Community Participation Supports.
Philosophy: We view our primary responsibility as being consumer oriented. People have the right to participate in decisions affecting their welfare. The basic
process for promoting growth involves doing for the person, doing with the person, and having the person do for themselves. This helps avoid dependency. When
there is a difficulty with the individual we: look at the program and environment, look at our own (staff) involvement and participation, and look at the individual's
involvement. People have a tendency of meeting your expectations. Avoid scapegoating and labeling. Every person is an individual and unique and should be
treated in an individual and unique manner. Be what you say you are; do what you say you'll do. Make sure you can keep a promise or don't make it. Maintain a
non-judgmental attitude. Be sensitive to value differences. Explain your feelings in terms of Event, Effect, and Emotion. Avoid put down phrases starting with 'you'.
Avoid overuse of the words Always, Should, and Never. People change, people grow. There is no such thing as a 'problem person', only a lack of adequate solutions.
Our most important core value is the provision and delivery of our services in a consumer-oriented fashion. We are guided by our Agency Philosophy.
1. Licensed Residential home for 2-3 adults in Chester County. Staffed up to 24 hours/day depending on needs. 2. Life Sharing. We match up a consumer and a
family to share a home. 3. Unlicensed Residential. Small houses and apartment settings for consumers who need less than 30 hours of weekly supervision. 4.
Community Participation Supports. Consumers come to our facility during the day and spend between 25-50% of the time, in the community doing activities for
fun and for learning.
Our staff communicate with our consumers based on the abilities and needs of the consumer. We work as a team to identify ways that communication is possible
via observations of gestures, sounds, or behaviors.
We encourage our staff to take our consumers out into the community to do activities that the consumers choose. Monthly calendar of events is sent out by our
Recreation and Events Coordinator. Events are area concerts, shows, festivals, sporting events, etc. We also hold a monthly recreation event in our office or
community.
We encourage families to visit their loved ones in their homes and encourage our staff to make them feel welcome. We also invite family members to our recreation
events and annual Picnic in June at the Brandywine Picnic Park and our Holiday Party in December at the Concordville Inn. Family members are also encouraged
to contact staff and admin with questions and concerns.
We are working to better individualize training to meet the specific needs of the consumers at the home in which the staff are selected to work. We are also
working on improving our system of staff scheduling.
Our goal is to operate our homes in a way in which we'd all want our family member cared for.

173
Interpreting the Data
These data will allow you to compare the average response
from this provider to the average response from all people
sampled in the state, region, and AE (when applicable).
Some differences are less meaningful than others,
depending on things like the size of the sample and the range
of answers provided for that particular scale. “Confidence
intervals” are used to determine whether differences are
statistically significant, or meaningful. Confidence intervals
are reported in parentheses.
To determine whether the average score of the provider is
meaningfully different from the averages of the state,
region, or AE, you can look at whether these scores fall
outside or inside the provider’s confidence interval.
Meaningful differences are marked with an asterisk “*”.
Summary of Findings
• The provider scores significantly above average for the
state, region and AE on Physical Quality
Provider Profiles Data Display: Kelsch Associates (Chester AE) 2016-2017
Of the 5,328 individuals in the 2017 IM4Q data file, 20 individuals registered in Chester Administrative Entity received residential services from Kelsch. The data in
this profile are for the provider’s community-based residential services. This report presents the scale scores for the State, the Southeast Region, Chester AE and
Kelsch (Chester). There must be data for 10 or more individuals to meet our selection criteria for reporting. If the number of respondents for any item falls below
5, a dash (-) is shown. For all of the scale scores, a higher score is better and the scores can range from 0 to 100. Confidence intervals for provider scores are given.
Link to explanation of items in scales is below.
* indicates meaningful difference **Statewide and AE specific data is the same for this provider
Link to explanation of the questions in each scale Above average marked by
SCALES State Southeast Chester Kelsch (Chester)**
Individual Satisfaction 85.87 82.83 85.41 78.38 (68.53 – 88.24)
Individual Choice 46.90 37.62 43.27 44.67 (35.81 – 53.53)
Individual Inclusion 43.72 39.99 43.52 40.93 (34.37 – 47.50)
Individual Dignity 82.28 79.12 80.36 76.96 (67.10 – 86.82)
Physical Quality 96.92* 96.57* 97.36* 99.17 (97.53 – 100.00)
Family Satisfaction 90.54 87.82 90.79 90.82 (84.10 – 97.53)
86
47 44
82
9791
83
38 40
79
978885
43 44
80
9791
78
4541
77
9991
0
20
40
60
80
100
120
SATISFACTION CHOICE INCLUSION DIGNITY PHYS QUAL FAM SAT
Scale Scores for State, Region, County, Provider
State SE Chester Kelsch (Chester)

174
Provider Profile Summary: KenCrest Services www.kencrest.org
KenCrest’s mission supports community development by exploring possibilities, mobilizing resources and empowering dreams. KenCrest is driven by four guiding
themes: social responsibility, economic accountability, innovation, and strategic growth. These themes are fueled by our values represented by the word PRIDE –
(P) Positive approaches-empowering individuals (R) Reaching Higher–embracing change (I) Inclusion–building community (D) Discovery – a love for learning (E)
Excellent Leadership – challenging and inspiring toward a shared vision.
KenCrest was founded in 1905. KenCrest has been providing financially sound, socially responsible services. KenCrest offers homes with full-time supervised
support. Additionally, Lifesharing and In-home Supports are available to those who choose to live more independently, along with a full range of employment
services (transition age and up) and facility-based programing with community participation. All programs practice innovative person-centered approaches
supporting choice.
We support: -Medically complex individuals -Transitioning individuals from school supported activities to independent choice options. -Clinical services including
sexuality therapies -Meaningful Life team – an internal initiative in its 2nd year -Customized employment options -avail – software application that promotes
independence through the acquisition of new or refined skills -Charting the Life Course– staff trained as implementers and Trainers.
KenCrest assesses the communication needs of each individual and identifies staff who, through education and training, gains the necessary skillset needed to
successfully support the person. Utilizing the appropriate assistive technology, services, and tools, staff ensures identified needs are satisfied. For ongoing
consistency, the individual’s care plan identifies specific needs and a corresponding action plan.
Following the principles of person-centered planning, our individuals decide how they want to participate in their local community. To some, that includes planned
activities of social interest. To others, that is defined as independent time to explore their community on their own. Supported by their team, each individual is
encouraged to identify new experiences, promote engagement and foster new connections. KenCrest staff is the conduit to making these connections. We supply
transportation, assist with scheduling social connections and coordinating requests for activities and appointments. The focus is on the individual being the force
behind the initiative.
Families and friends are a major influencer in the lives of the individuals KenCrest supports. - Those bonds are recognized, valued, appreciated, and always
welcomed. Visits, phone calls, emails and letters are encouraged for your loved one and responded to if directed to our staff. We recognize communication is a
two-way street and make every effort to keep families engaged. Invitations to special events and celebrations will be extended and participation will be
encouraged. Of course, a special occasion will not be necessary to visit or call. - KenCrest welcomes friends and family involvement.
In 2018, our Corporate initiative, Measurement Capacity, launched. The goal then and continues to be, build a culture of excellence through measuring
performance, in many different areas of the agency and use the data collected to refine existing and create new program supports in an effort to provide the best
possible and the highest quality person centered programming to our participants.

175
Interpreting the Data
These data will allow you to compare the average response
from this provider to the average response from all people
sampled in the state, region, and AE (when applicable).
Some differences are less meaningful than others,
depending on things like the size of the sample and the range
of answers provided for that particular scale. “Confidence
intervals” are used to determine whether differences are
statistically significant, or meaningful. Confidence intervals
are reported in parentheses.
To determine whether the average score of the provider is
meaningfully different from the averages of the state,
region, or AE, you can look at whether these scores fall
outside or inside the provider’s confidence interval.
Meaningful differences are marked with an asterisk “*”.
Summary of Findings
• The provider scores significantly below average for the
state on Individual Choice
• The provider scores significantly above average for the
state and region on Physical Quality
Provider Profiles Data Display: KenCrest Services (Statewide) 2016-2017
Of the 5,328 individuals in the 2017 IM4Q data file, 102 individuals registered in Pennsylvania received residential services from KenCrest. This report presents the
scale scores for the State, the Southeast Region, and KenCrest (Statewide). There must be data for 10 or more individuals to meet our selection criteria for
reporting. If the number of respondents for any item falls below 5, a dash (-) is shown. For all of the scale scores, a higher score is better and the scores can range
from 0 to 100. Confidence intervals for provider scores are given. Link to explanation of items in scales is below.
* indicates meaningful difference
Link to explanation of the questions in each scale Above average marked by
SCALES State SE KenCrest
Individual Satisfaction 85.87 82.83 87.58 (82.33 – 92.84)
Individual Choice 46.90* 37.62 34.24 (29.72 – 38.76)
Individual Inclusion 43.72 39.99 41.96 (38.41 – 45.50)
Individual Dignity 82.28 79.12 80.98 (77.61 – 84.34)
Physical Quality 96.92* 96.57* 98.67 (97.30 – 100.00)
Family Satisfaction 90.54 87.82 88.63 (82.82 – 94.43)
86
47 44
82
9791
83
38 40
79
978888
3442
81
99
89
0
20
40
60
80
100
120
SATISFACTION CHOICE INCLUSION DIGNITY PHYS QUAL FAM SAT
Scale Scores for State, Region, and Provider
State SE KenCrest
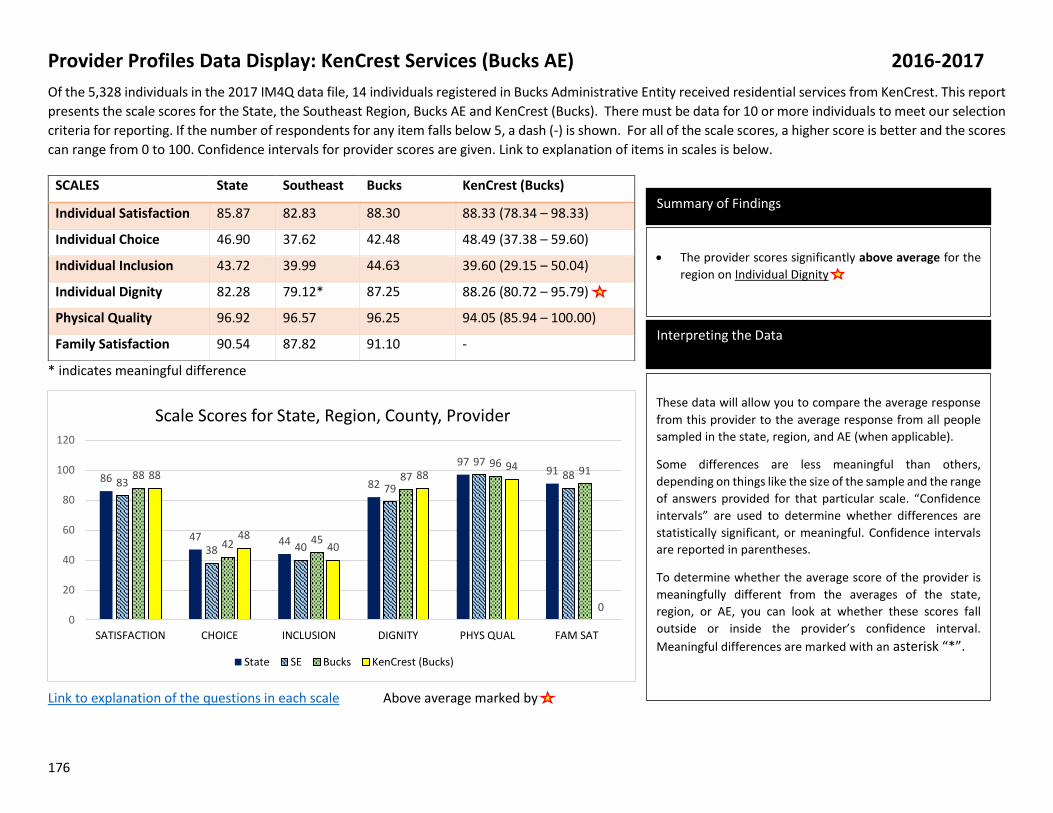
176
Interpreting the Data
These data will allow you to compare the average response
from this provider to the average response from all people
sampled in the state, region, and AE (when applicable).
Some differences are less meaningful than others,
depending on things like the size of the sample and the range
of answers provided for that particular scale. “Confidence
intervals” are used to determine whether differences are
statistically significant, or meaningful. Confidence intervals
are reported in parentheses.
To determine whether the average score of the provider is
meaningfully different from the averages of the state,
region, or AE, you can look at whether these scores fall
outside or inside the provider’s confidence interval.
Meaningful differences are marked with an asterisk “*”.
Summary of Findings
• The provider scores significantly above average for the
region on Individual Dignity
Provider Profiles Data Display: KenCrest Services (Bucks AE) 2016-2017
Of the 5,328 individuals in the 2017 IM4Q data file, 14 individuals registered in Bucks Administrative Entity received residential services from KenCrest. This report
presents the scale scores for the State, the Southeast Region, Bucks AE and KenCrest (Bucks). There must be data for 10 or more individuals to meet our selection
criteria for reporting. If the number of respondents for any item falls below 5, a dash (-) is shown. For all of the scale scores, a higher score is better and the scores
can range from 0 to 100. Confidence intervals for provider scores are given. Link to explanation of items in scales is below.
* indicates meaningful difference
Link to explanation of the questions in each scale Above average marked by
SCALES State Southeast Bucks KenCrest (Bucks)
Individual Satisfaction 85.87 82.83 88.30 88.33 (78.34 – 98.33)
Individual Choice 46.90 37.62 42.48 48.49 (37.38 – 59.60)
Individual Inclusion 43.72 39.99 44.63 39.60 (29.15 – 50.04)
Individual Dignity 82.28 79.12* 87.25 88.26 (80.72 – 95.79)
Physical Quality 96.92 96.57 96.25 94.05 (85.94 – 100.00)
Family Satisfaction 90.54 87.82 91.10 -
86
47 44
82
9791
83
38 40
79
978888
42 45
8796
9188
4840
8894
00
20
40
60
80
100
120
SATISFACTION CHOICE INCLUSION DIGNITY PHYS QUAL FAM SAT
Scale Scores for State, Region, County, Provider
State SE Bucks KenCrest (Bucks)
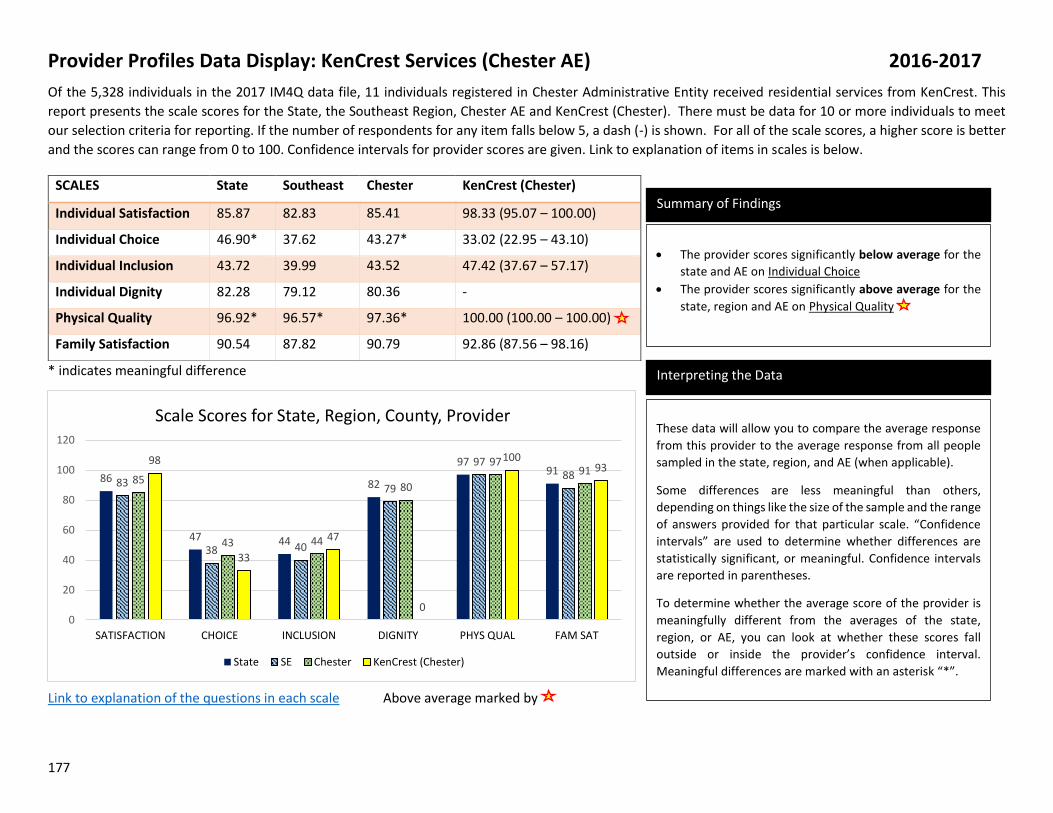
177
Interpreting the Data
These data will allow you to compare the average response
from this provider to the average response from all people
sampled in the state, region, and AE (when applicable).
Some differences are less meaningful than others,
depending on things like the size of the sample and the range
of answers provided for that particular scale. “Confidence
intervals” are used to determine whether differences are
statistically significant, or meaningful. Confidence intervals
are reported in parentheses.
To determine whether the average score of the provider is
meaningfully different from the averages of the state,
region, or AE, you can look at whether these scores fall
outside or inside the provider’s confidence interval.
Meaningful differences are marked with an asterisk “*”.
Summary of Findings
• The provider scores significantly below average for the
state and AE on Individual Choice
• The provider scores significantly above average for the
state, region and AE on Physical Quality
Provider Profiles Data Display: KenCrest Services (Chester AE) 2016-2017
Of the 5,328 individuals in the 2017 IM4Q data file, 11 individuals registered in Chester Administrative Entity received residential services from KenCrest. This
report presents the scale scores for the State, the Southeast Region, Chester AE and KenCrest (Chester). There must be data for 10 or more individuals to meet
our selection criteria for reporting. If the number of respondents for any item falls below 5, a dash (-) is shown. For all of the scale scores, a higher score is better
and the scores can range from 0 to 100. Confidence intervals for provider scores are given. Link to explanation of items in scales is below.
* indicates meaningful difference
Link to explanation of the questions in each scale Above average marked by
SCALES State Southeast Chester KenCrest (Chester)
Individual Satisfaction 85.87 82.83 85.41 98.33 (95.07 – 100.00)
Individual Choice 46.90* 37.62 43.27* 33.02 (22.95 – 43.10)
Individual Inclusion 43.72 39.99 43.52 47.42 (37.67 – 57.17)
Individual Dignity 82.28 79.12 80.36 -
Physical Quality 96.92* 96.57* 97.36* 100.00 (100.00 – 100.00)
Family Satisfaction 90.54 87.82 90.79 92.86 (87.56 – 98.16)
86
47 44
82
9791
83
38 40
79
978885
43 44
80
9791
98
33
47
0
10093
0
20
40
60
80
100
120
SATISFACTION CHOICE INCLUSION DIGNITY PHYS QUAL FAM SAT
Scale Scores for State, Region, County, Provider
State SE Chester KenCrest (Chester)
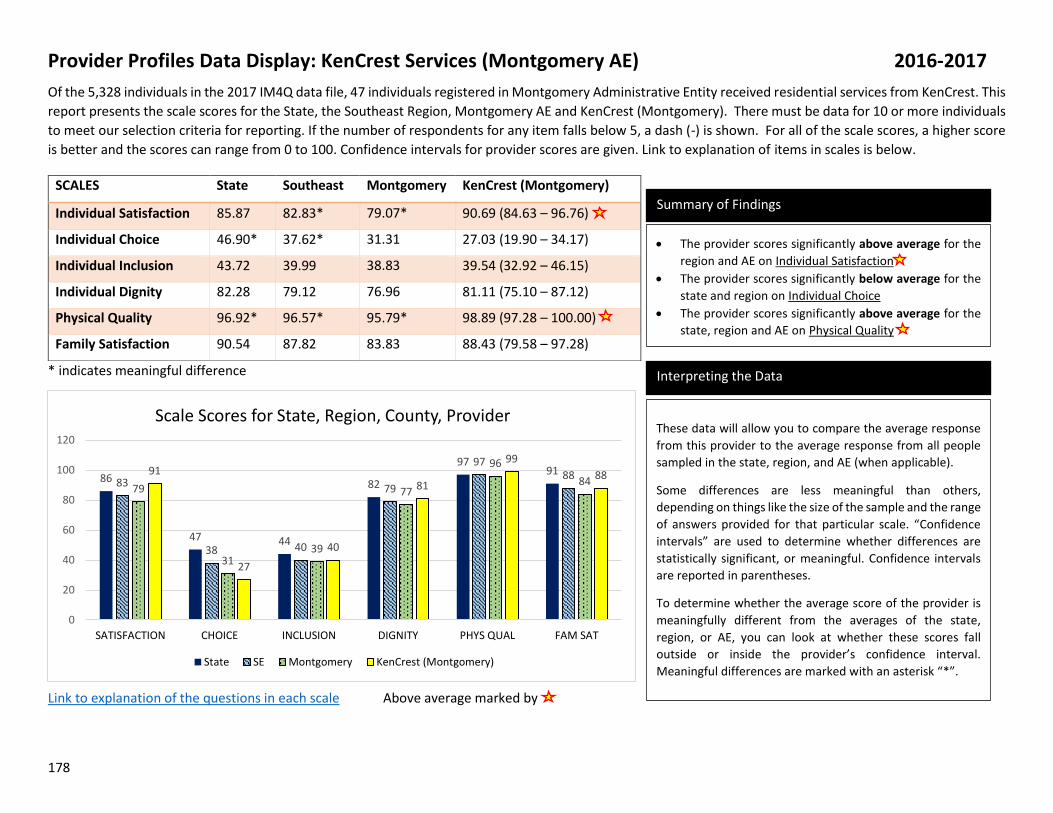
178
Interpreting the Data
These data will allow you to compare the average response
from this provider to the average response from all people
sampled in the state, region, and AE (when applicable).
Some differences are less meaningful than others,
depending on things like the size of the sample and the range
of answers provided for that particular scale. “Confidence
intervals” are used to determine whether differences are
statistically significant, or meaningful. Confidence intervals
are reported in parentheses.
To determine whether the average score of the provider is
meaningfully different from the averages of the state,
region, or AE, you can look at whether these scores fall
outside or inside the provider’s confidence interval.
Meaningful differences are marked with an asterisk “*”.
Summary of Findings
• The provider scores significantly above average for the
region and AE on Individual Satisfaction
• The provider scores significantly below average for the
state and region on Individual Choice
• The provider scores significantly above average for the
state, region and AE on Physical Quality
Provider Profiles Data Display: KenCrest Services (Montgomery AE) 2016-2017
Of the 5,328 individuals in the 2017 IM4Q data file, 47 individuals registered in Montgomery Administrative Entity received residential services from KenCrest. This
report presents the scale scores for the State, the Southeast Region, Montgomery AE and KenCrest (Montgomery). There must be data for 10 or more individuals
to meet our selection criteria for reporting. If the number of respondents for any item falls below 5, a dash (-) is shown. For all of the scale scores, a higher score
is better and the scores can range from 0 to 100. Confidence intervals for provider scores are given. Link to explanation of items in scales is below.
* indicates meaningful difference
Link to explanation of the questions in each scale Above average marked by
SCALES State Southeast Montgomery KenCrest (Montgomery)
Individual Satisfaction 85.87 82.83* 79.07* 90.69 (84.63 – 96.76)
Individual Choice 46.90* 37.62* 31.31 27.03 (19.90 – 34.17)
Individual Inclusion 43.72 39.99 38.83 39.54 (32.92 – 46.15)
Individual Dignity 82.28 79.12 76.96 81.11 (75.10 – 87.12)
Physical Quality 96.92* 96.57* 95.79* 98.89 (97.28 – 100.00)
Family Satisfaction 90.54 87.82 83.83 88.43 (79.58 – 97.28)
86
47 44
82
9791
83
38 40
79
9788
79
3139
77
96
8491
27
40
81
99
88
0
20
40
60
80
100
120
SATISFACTION CHOICE INCLUSION DIGNITY PHYS QUAL FAM SAT
Scale Scores for State, Region, County, Provider
State SE Montgomery KenCrest (Montgomery)
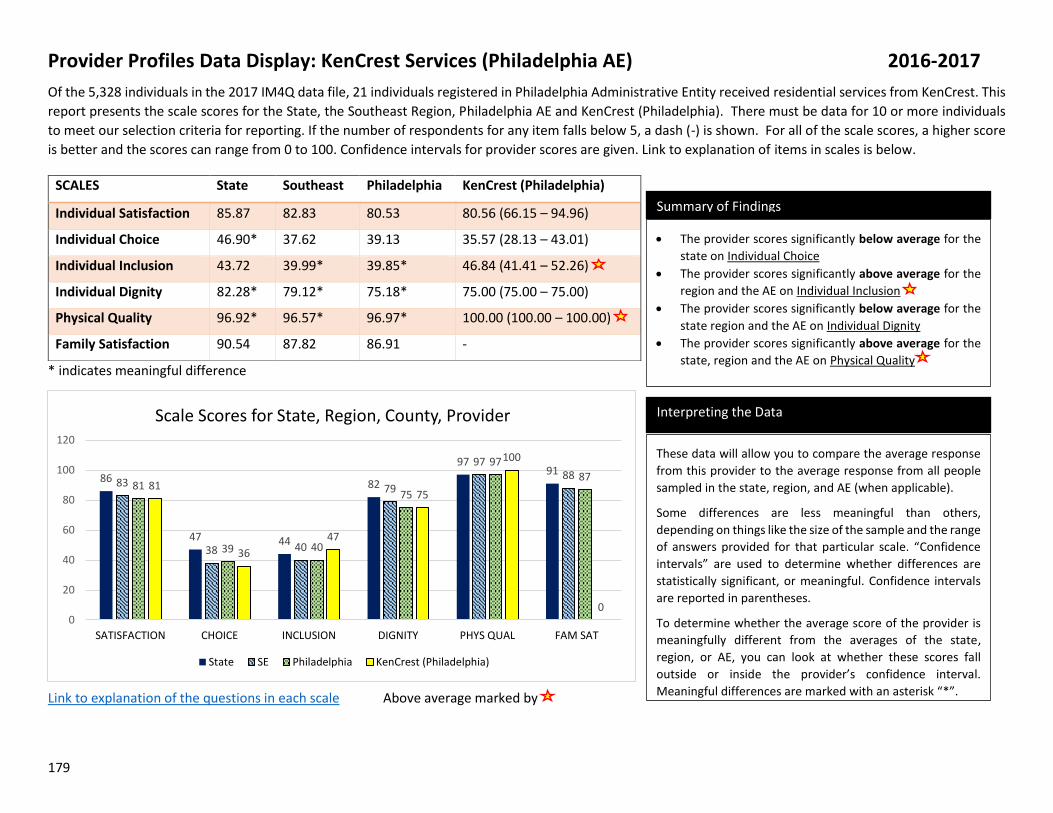
179
Interpreting the Data
These data will allow you to compare the average response
from this provider to the average response from all people
sampled in the state, region, and AE (when applicable).
Some differences are less meaningful than others,
depending on things like the size of the sample and the range
of answers provided for that particular scale. “Confidence
intervals” are used to determine whether differences are
statistically significant, or meaningful. Confidence intervals
are reported in parentheses.
To determine whether the average score of the provider is
meaningfully different from the averages of the state,
region, or AE, you can look at whether these scores fall
outside or inside the provider’s confidence interval.
Meaningful differences are marked with an asterisk “*”.
Summary of Findings
• The provider scores significantly below average for the
state on Individual Choice
• The provider scores significantly above average for the
region and the AE on Individual Inclusion
• The provider scores significantly below average for the
state region and the AE on Individual Dignity
• The provider scores significantly above average for the
state, region and the AE on Physical Quality
Provider Profiles Data Display: KenCrest Services (Philadelphia AE) 2016-2017
Of the 5,328 individuals in the 2017 IM4Q data file, 21 individuals registered in Philadelphia Administrative Entity received residential services from KenCrest. This
report presents the scale scores for the State, the Southeast Region, Philadelphia AE and KenCrest (Philadelphia). There must be data for 10 or more individuals
to meet our selection criteria for reporting. If the number of respondents for any item falls below 5, a dash (-) is shown. For all of the scale scores, a higher score
is better and the scores can range from 0 to 100. Confidence intervals for provider scores are given. Link to explanation of items in scales is below.
* indicates meaningful difference
Link to explanation of the questions in each scale Above average marked by
SCALES State Southeast Philadelphia KenCrest (Philadelphia)
Individual Satisfaction 85.87 82.83 80.53 80.56 (66.15 – 94.96)
Individual Choice 46.90* 37.62 39.13 35.57 (28.13 – 43.01)
Individual Inclusion 43.72 39.99* 39.85* 46.84 (41.41 – 52.26)
Individual Dignity 82.28* 79.12* 75.18* 75.00 (75.00 – 75.00)
Physical Quality 96.92* 96.57* 96.97* 100.00 (100.00 – 100.00)
Family Satisfaction 90.54 87.82 86.91 -
86
47 44
82
9791
83
38 40
79
9788
81
39 40
75
97
8781
36
47
75
100
00
20
40
60
80
100
120
SATISFACTION CHOICE INCLUSION DIGNITY PHYS QUAL FAM SAT
Scale Scores for State, Region, County, Provider
State SE Philadelphia KenCrest (Philadelphia)

180
Provider Profile Summary: Kensington Community Corporation for Individual Dignity (KenCCID) www.kenccid.org
KenCCID strives to promote dignity and choice to empower individuals with intellectual and developmental disabilities (our “Individuals”) to reach their full
potential.
I CARE- Impact, Compassion, Accountability, Respect, Empowerment. Impact-We are here to have a positive effect on the lives of our Individuals. Compassion-We
are drawn to our Mission with a genuine desire to help others. Accountability-We are responsible for promoting the highest possible quality of care to our
Individuals Respect- We respect the rights of all others. Empowerment-We empower our Individuals to live self-directed lives.
We have been serving people since 1974.
We offer: Community Living Housing- a variety of living arrangements including 1, 2, 3-bedroom homes and apartments. Each home is staffed 24 hours a day, 7
days a week by our well-trained and caring professionals and 24-hour on-call coverage for emergencies. Semi-Independent Housing-residences for Individuals who
may live on their own with customized care supports Nursing- provides oversight and physical health care training for the varied needs of our IDD Individuals
Supported Employment- community integrated employment services including individualized work assessments, on and off-site job search assistance, job coaches,
and Job development.
We provide services for people that are hard of hearing, people with behavioral support needs, people with complex medical needs, and we support people’s
community participation.
All staff participate in a comprehensive training curriculum, including a thorough review of the Individual Service Plan (ISP). Staff assigned to specific homes have
access to shared communication, including remote connectivity to ensure readily accessible information among all team members.
KenCCID encourages and supports individuals who want to work, presenting opportunities for Community Integrated Employment. We further support Individuals
by upholding the standards of Everyday Lives. Our individuals are encouraged to do their own food shopping, attend community events and frequent local
establishments to build relationships.
Families are an integral part of supporting our Individuals in their community settings. Our program staff are accessible to family members via all modes of
communication, phone, computer, etc. and families are welcomed participants in the care of the Individuals we serve.
Improvement projects: Implemented Office 365 as a way to better communicate with staff both internally and externally and provide better accessibility to
information. Implementing a new Electronic Health Record to ensure all service delivery is documented and readily available. Piloting My25- a customized menu
planning resource used to address the health and nutritional needs of our individuals to promote overall wellness. Enhancement of orientation training, to full live
training, with skill acquisition confirmation to ensure that all direct care staff are knowledgeable and well trained about the Individuals with whom they will be
working.
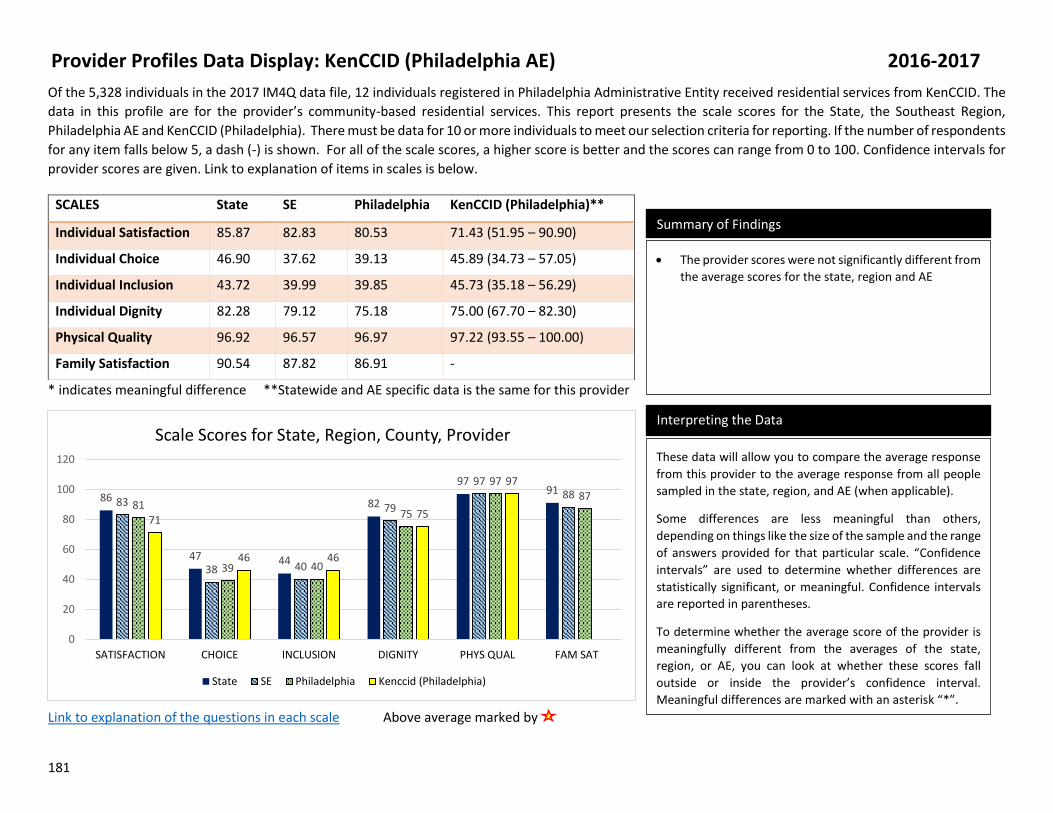
181
Interpreting the Data
These data will allow you to compare the average response
from this provider to the average response from all people
sampled in the state, region, and AE (when applicable).
Some differences are less meaningful than others,
depending on things like the size of the sample and the range
of answers provided for that particular scale. “Confidence
intervals” are used to determine whether differences are
statistically significant, or meaningful. Confidence intervals
are reported in parentheses.
To determine whether the average score of the provider is
meaningfully different from the averages of the state,
region, or AE, you can look at whether these scores fall
outside or inside the provider’s confidence interval.
Meaningful differences are marked with an asterisk “*”.
Summary of Findings
• The provider scores were not significantly different from
the average scores for the state, region and AE
Provider Profiles Data Display: KenCCID (Philadelphia AE) 2016-2017
Of the 5,328 individuals in the 2017 IM4Q data file, 12 individuals registered in Philadelphia Administrative Entity received residential services from KenCCID. The
data in this profile are for the provider’s community-based residential services. This report presents the scale scores for the State, the Southeast Region,
Philadelphia AE and KenCCID (Philadelphia). There must be data for 10 or more individuals to meet our selection criteria for reporting. If the number of respondents
for any item falls below 5, a dash (-) is shown. For all of the scale scores, a higher score is better and the scores can range from 0 to 100. Confidence intervals for
provider scores are given. Link to explanation of items in scales is below.
* indicates meaningful difference **Statewide and AE specific data is the same for this provider
Link to explanation of the questions in each scale Above average marked by
SCALES State SE Philadelphia KenCCID (Philadelphia)**
Individual Satisfaction 85.87 82.83 80.53 71.43 (51.95 – 90.90)
Individual Choice 46.90 37.62 39.13 45.89 (34.73 – 57.05)
Individual Inclusion 43.72 39.99 39.85 45.73 (35.18 – 56.29)
Individual Dignity 82.28 79.12 75.18 75.00 (67.70 – 82.30)
Physical Quality 96.92 96.57 96.97 97.22 (93.55 – 100.00)
Family Satisfaction 90.54 87.82 86.91 -
86
47 44
82
9791
83
38 40
79
9788
81
39 40
75
97
87
71
46 46
75
97
0
20
40
60
80
100
120
SATISFACTION CHOICE INCLUSION DIGNITY PHYS QUAL FAM SAT
Scale Scores for State, Region, County, Provider
State SE Philadelphia Kenccid (Philadelphia)

182
Provider Profile Summary: Keystone Community Resources www.kcrnow.com
Our mission is to provide people with intellectual disabilities and Autism diverse opportunities to lead fulfilling lives.
We value and hold dear the following attitudes, beliefs and commitments: We value the growth, health, safety and happiness of the people we serve. We maintain
an atmosphere of mutual respect and support among ourselves, our community and the families we serve. We value a positive attitude and sense of humor,
enjoying our work while taking it seriously. We promote a sense of excellence in our work. We take pride in our efforts, and responsibility for our outcomes. As a
diverse organization, we value unity and teamwork. We are committed to developing and maintaining a highly trained and skilled staff. We value communication
that is active, consistent and accurate throughout our organization. We continuously evaluate and improve the services we provide in response to the individual’s
needs and preferences. We value diversity among the people we serve and employ. We value our responsibility and commitment to the people we serve.
We have been supporting people since 1964.
We provide residential community living arrangements, day and vocational program services, supported living services, Family Living (Life sharing), supports
brokering, supported employment and job coaching.
Keystone offers a variety of services to meet the individual needs of the consumers we serve. Our services include; residential/community living, cps, community
supports, employment services and behavioral supports. Keystone serves multiple special populations to include; individuals with complex medical needs, Prader-
Willi syndrome, deaf / hard of hearing and individuals with autism.
All staff receive a two-week orientation and comprehensive ISP training. Depending on the program and the individuals served receive additional training on
individual’s diagnosis, behavioral support plans, medical needs and communication preferences.
All programs are located within the community setting. Individuals are encouraged to pursue activities within the community that they enjoy; examples of such
are shopping, bowling, movies, parks, and special events.
Keystone sends out family surveys to solicit feedback regarding services. Survey responses are reviewed and actions are taken to address areas of concern.
Families are encouraged to participate in the full scope of services offered to their family member and routinely participate in all planning meetings. Keystone
also routinely sends out an agency newsletter and invites families to participate in organizational functions.
Keystone completes an annual quality management plan and reviews data to support this plan on a quarterly basis. The current plan addresses community
integration, medication error reduction, abuse prevention, and program development.
Keystone Training and Rehabilitation Residence opened in downtown Scranton in 1964. Founded by Ignatz Deutsch, Keystone provided residential services to such
individuals, thus giving them access to social, cultural, educational and vocational activities. Today, Keystone Community Resources (KCR) is comprised of 60
community homes; nine day/vocational programs; a bakery, a coffee business, and Artworks Gallery. We continue to grow with a new Day Program location in
Scranton PA opening in April and a new Psychiatric Rehabilitation Program opening in Montrose PA this summer.
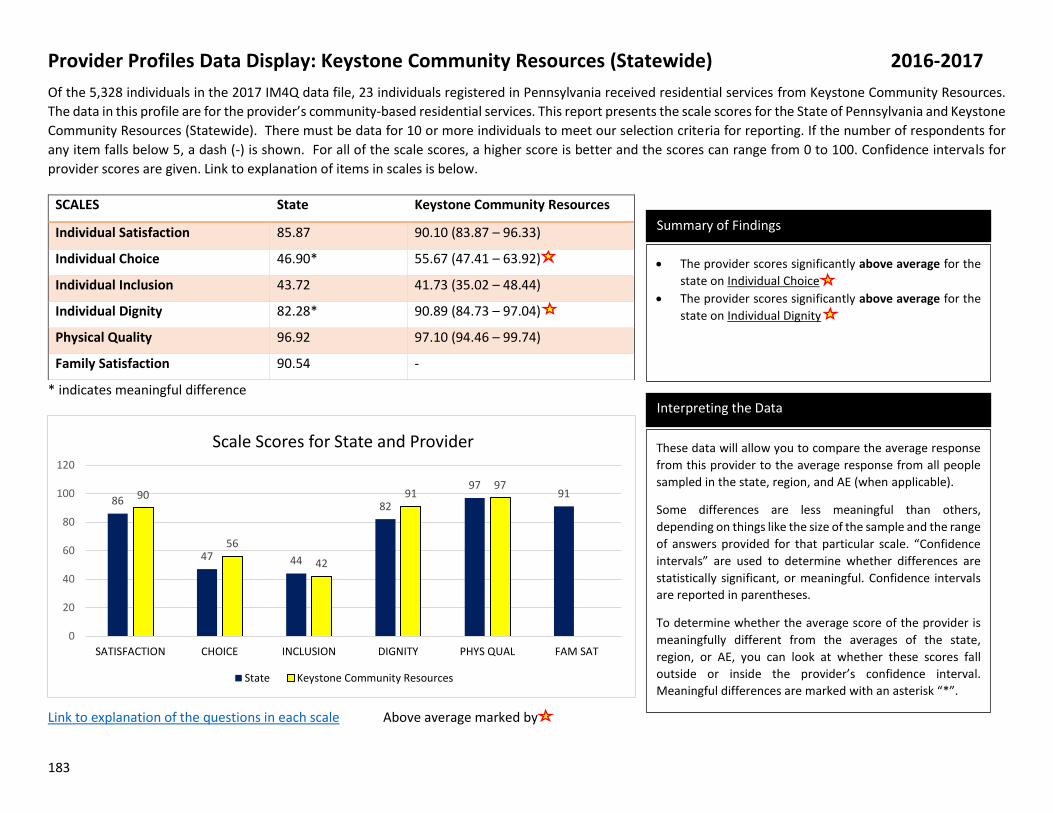
183
Interpreting the Data
These data will allow you to compare the average response
from this provider to the average response from all people
sampled in the state, region, and AE (when applicable).
Some differences are less meaningful than others,
depending on things like the size of the sample and the range
of answers provided for that particular scale. “Confidence
intervals” are used to determine whether differences are
statistically significant, or meaningful. Confidence intervals
are reported in parentheses.
To determine whether the average score of the provider is
meaningfully different from the averages of the state,
region, or AE, you can look at whether these scores fall
outside or inside the provider’s confidence interval.
Meaningful differences are marked with an asterisk “*”.
Summary of Findings
• The provider scores significantly above average for the
state on Individual Choice
• The provider scores significantly above average for the
state on Individual Dignity
Provider Profiles Data Display: Keystone Community Resources (Statewide) 2016-2017
Of the 5,328 individuals in the 2017 IM4Q data file, 23 individuals registered in Pennsylvania received residential services from Keystone Community Resources.
The data in this profile are for the provider’s community-based residential services. This report presents the scale scores for the State of Pennsylvania and Keystone
Community Resources (Statewide). There must be data for 10 or more individuals to meet our selection criteria for reporting. If the number of respondents for
any item falls below 5, a dash (-) is shown. For all of the scale scores, a higher score is better and the scores can range from 0 to 100. Confidence intervals for
provider scores are given. Link to explanation of items in scales is below.
* indicates meaningful difference
Link to explanation of the questions in each scale Above average marked by
SCALES State Keystone Community Resources
Individual Satisfaction 85.87 90.10 (83.87 – 96.33)
Individual Choice 46.90* 55.67 (47.41 – 63.92)
Individual Inclusion 43.72 41.73 (35.02 – 48.44)
Individual Dignity 82.28* 90.89 (84.73 – 97.04)
Physical Quality 96.92 97.10 (94.46 – 99.74)
Family Satisfaction 90.54 -
86
47 44
82
979190
56
42
9197
0
20
40
60
80
100
120
SATISFACTION CHOICE INCLUSION DIGNITY PHYS QUAL FAM SAT
Scale Scores for State and Provider
State Keystone Community Resources
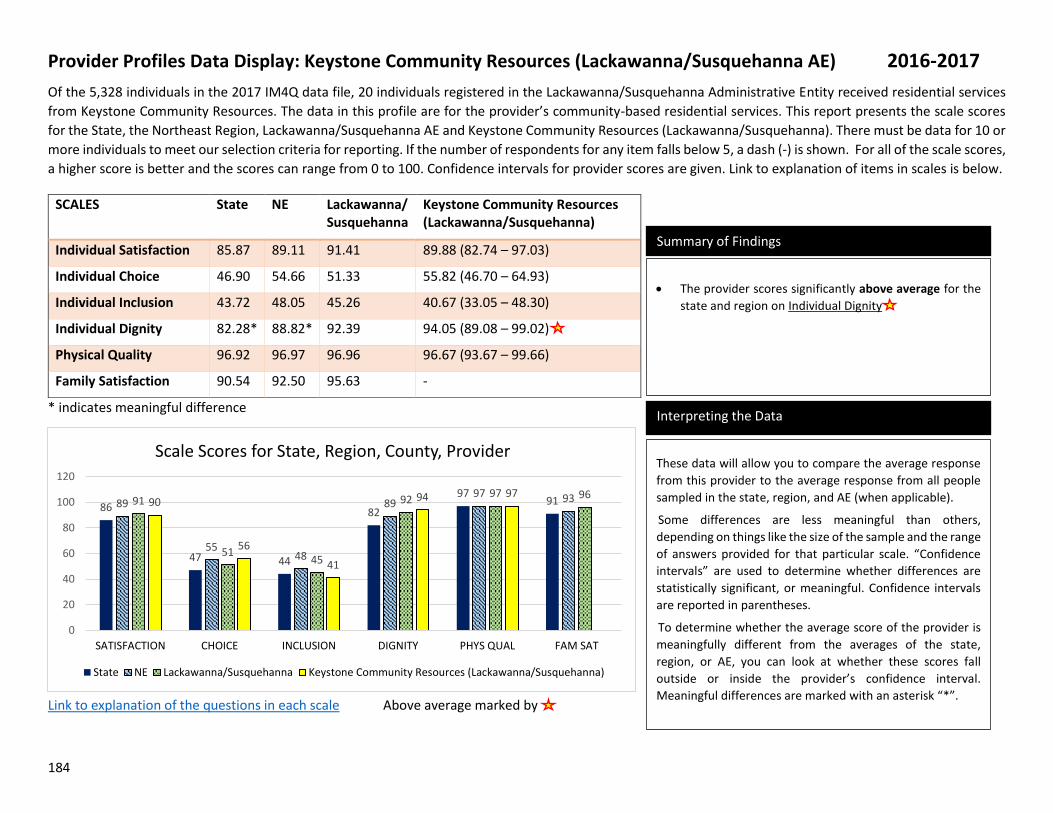
184
Interpreting the Data
These data will allow you to compare the average response
from this provider to the average response from all people
sampled in the state, region, and AE (when applicable).
Some differences are less meaningful than others,
depending on things like the size of the sample and the range
of answers provided for that particular scale. “Confidence
intervals” are used to determine whether differences are
statistically significant, or meaningful. Confidence intervals
are reported in parentheses.
To determine whether the average score of the provider is
meaningfully different from the averages of the state,
region, or AE, you can look at whether these scores fall
outside or inside the provider’s confidence interval.
Meaningful differences are marked with an asterisk “*”.
Summary of Findings
• The provider scores significantly above average for the
state and region on Individual Dignity
Provider Profiles Data Display: Keystone Community Resources (Lackawanna/Susquehanna AE) 2016-2017
Of the 5,328 individuals in the 2017 IM4Q data file, 20 individuals registered in the Lackawanna/Susquehanna Administrative Entity received residential services
from Keystone Community Resources. The data in this profile are for the provider’s community-based residential services. This report presents the scale scores
for the State, the Northeast Region, Lackawanna/Susquehanna AE and Keystone Community Resources (Lackawanna/Susquehanna). There must be data for 10 or
more individuals to meet our selection criteria for reporting. If the number of respondents for any item falls below 5, a dash (-) is shown. For all of the scale scores,
a higher score is better and the scores can range from 0 to 100. Confidence intervals for provider scores are given. Link to explanation of items in scales is below.
* indicates meaningful difference
Link to explanation of the questions in each scale Above average marked by
SCALES State NE Lackawanna/ Susquehanna
Keystone Community Resources (Lackawanna/Susquehanna)
Individual Satisfaction 85.87 89.11 91.41 89.88 (82.74 – 97.03)
Individual Choice 46.90 54.66 51.33 55.82 (46.70 – 64.93)
Individual Inclusion 43.72 48.05 45.26 40.67 (33.05 – 48.30)
Individual Dignity 82.28* 88.82* 92.39 94.05 (89.08 – 99.02)
Physical Quality 96.92 96.97 96.96 96.67 (93.67 – 99.66)
Family Satisfaction 90.54 92.50 95.63 -
86
47 44
82
979189
5548
8997 9391
5145
9297 96
90
56
41
94 97
0
20
40
60
80
100
120
SATISFACTION CHOICE INCLUSION DIGNITY PHYS QUAL FAM SAT
Scale Scores for State, Region, County, Provider
State NE Lackawanna/Susquehanna Keystone Community Resources (Lackawanna/Susquehanna)
185
Provider Profile Summary: Keystone Human Services www.keystonehumanservices.org
Our mission is to create an environment where all people, regardless of background and ability, can grow, make choices, and be valued and contributing members
of their community. We support each person to be employed, to have their own home, to be fully involved in the community, and to make a positive contribution
to the lives of others.
We are committed to decreasing people’s dependence on formal services. Natural supports are essential for enduring success, and services should be offered in
the least restrictive and most natural setting possible. Knowing that people learn throughout their lifetime, we support them to continuously develop. We believe
in services that are individualized and responsive to the unique needs of each person, and we involve each person in all aspects of planning and service delivery.
All people have the right to direct their future and to control how they live their lives. Keystone was founded in 1972.
Keystone provides a full continuum of services, including: Employment, Community Participation Supports (as a pathway to employment), Licensed and Unlicensed
Residential, Supported Living, LifeSharing, and community-based services and supports.
Because we use a person-centered approach to designing supports, Keystone has a long and successful history of supporting people who are experiencing an
intellectual disability, mental illness, autism and/or who require behavioral support to work and live healthy, happy, productive lives.
Keystone upholds the right of people to communicate, be heard, and live in an environment that promotes and supports their communication needs. We support
people to access communication aids, services, and resources. If someone is experiencing communication difficulties, we conduct a communication assessment
to identify their preferred communication style and support strategies. Within each person’s support plan, we document and then implement their Communication
Plan or information pertaining to their communication needs and methods to improve them.
Taking a person-centered approach, each person and their team identifies the person’s talents, skills, interests, and dreams, which help to determine places in the
community the person may enjoy for recreation and places where their skills may be welcomed for work. The person receives support from staff and transportation
as necessary for them to be involved with church, work, volunteering, joining clubs and organizations, shopping, dining out, and more.
We believe we are most accountable to the people using our services and their families. Our organization is strengthened by welcoming the people and their
family members to play an influential role in governance, planning, policy, advocacy, oversight of services, and the agency.
Keystone supports an outcome-based approach to ensure that people are valued and contributing members of their community. We analyze health and behavioral
trends to ensure that supports are effective and person-centered. These processes are based on strategic goals to increase employment, improve health outcomes,
and support and increase the adoption of enabling technologies.
We welcome you to visit Keystone’s website and to reach out to us for more information about the organization and the services and supports we provide.

186
Interpreting the Data
These data will allow you to compare the average response
from this provider to the average response from all people
sampled in the state, region, and AE (when applicable).
Some differences are less meaningful than others,
depending on things like the size of the sample and the range
of answers provided for that particular scale. “Confidence
intervals” are used to determine whether differences are
statistically significant, or meaningful. Confidence intervals
are reported in parentheses.
To determine whether the average score of the provider is
meaningfully different from the averages of the state,
region, or AE, you can look at whether these scores fall
outside or inside the provider’s confidence interval.
Meaningful differences are marked with an asterisk “*”.
Summary of Findings
• The provider scores significantly below average for the
state on Individual Dignity
• The provider scores significantly above average for the
state on Physical Quality
Provider Profiles Data Display: Keystone Human Services (Statewide) 2016-2017
Of the 5,328 individuals in the 2017 IM4Q data file, 155 individuals registered in Pennsylvania received residential services from Keystone Human Services. This
report presents the scale scores for the State of Pennsylvania and Keystone Human Services (Statewide). There must be data for 10 or more individuals to meet
our selection criteria for reporting. If the number of respondents for any item falls below 5, a dash (-) is shown. For all of the scale scores, a higher score is better
and the scores can range from 0 to 100. Confidence intervals for provider scores are given. Link to explanation of items in scales is below.
* indicates meaningful difference
Link to explanation of the questions in each scale Above average marked by
SCALES State Keystone Human Services
Individual Satisfaction 85.87 84.63 (80.78 – 88.48)
Individual Choice 46.90 45.11 (41.49 – 48.73)
Individual Inclusion 43.72 43.25 (40.84 – 45.66)
Individual Dignity 82.28* 78.65 (76.18 – 81.12)
Physical Quality 96.92* 99.08 (98.46 – 99.70)
Family Satisfaction 90.54 91.11 (85.34 – 96.88)
86
47 44
82
9791
85
45 43
79
9991
0
20
40
60
80
100
120
SATISFACTION CHOICE INCLUSION DIGNITY PHYS QUAL FAM SAT
Scale Scores for State and Provider
State Keystone Service Systems
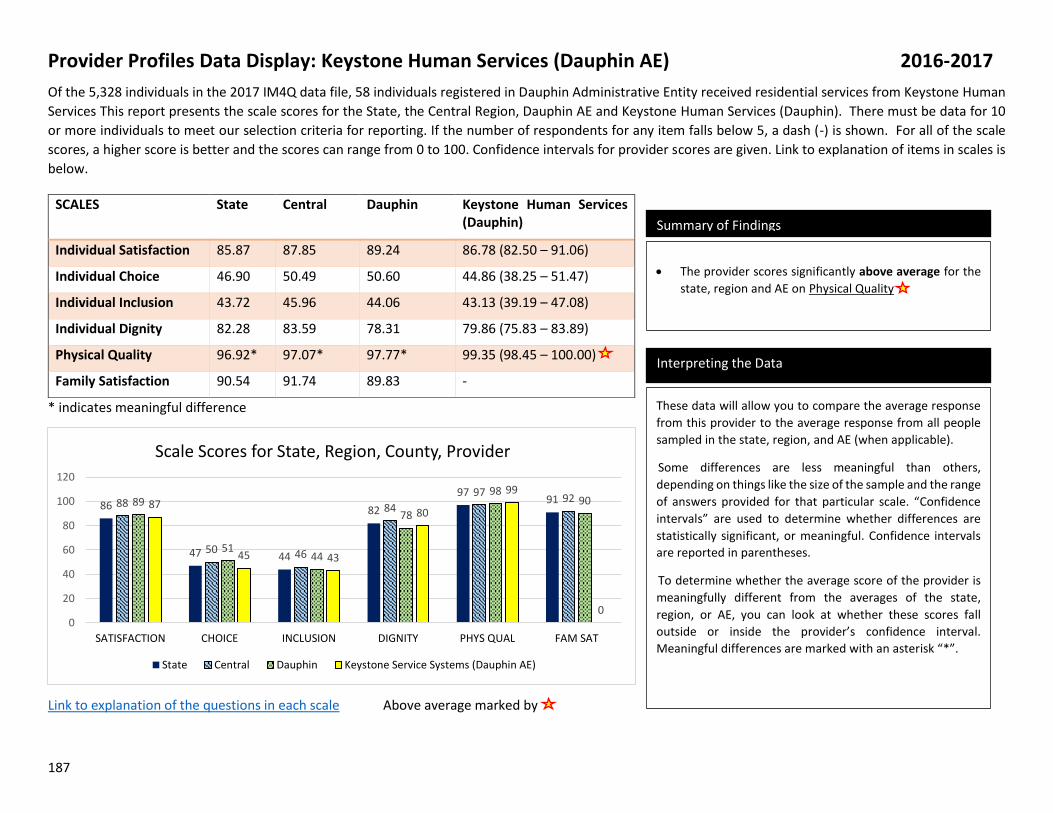
187
Interpreting the Data
These data will allow you to compare the average response
from this provider to the average response from all people
sampled in the state, region, and AE (when applicable).
Some differences are less meaningful than others,
depending on things like the size of the sample and the range
of answers provided for that particular scale. “Confidence
intervals” are used to determine whether differences are
statistically significant, or meaningful. Confidence intervals
are reported in parentheses.
To determine whether the average score of the provider is
meaningfully different from the averages of the state,
region, or AE, you can look at whether these scores fall
outside or inside the provider’s confidence interval.
Meaningful differences are marked with an asterisk “*”.
Summary of Findings
• The provider scores significantly above average for the
state, region and AE on Physical Quality
Provider Profiles Data Display: Keystone Human Services (Dauphin AE) 2016-2017
Of the 5,328 individuals in the 2017 IM4Q data file, 58 individuals registered in Dauphin Administrative Entity received residential services from Keystone Human
Services This report presents the scale scores for the State, the Central Region, Dauphin AE and Keystone Human Services (Dauphin). There must be data for 10
or more individuals to meet our selection criteria for reporting. If the number of respondents for any item falls below 5, a dash (-) is shown. For all of the scale
scores, a higher score is better and the scores can range from 0 to 100. Confidence intervals for provider scores are given. Link to explanation of items in scales is
below.
* indicates meaningful difference
Link to explanation of the questions in each scale Above average marked by
SCALES State Central Dauphin Keystone Human Services (Dauphin)
Individual Satisfaction 85.87 87.85 89.24 86.78 (82.50 – 91.06)
Individual Choice 46.90 50.49 50.60 44.86 (38.25 – 51.47)
Individual Inclusion 43.72 45.96 44.06 43.13 (39.19 – 47.08)
Individual Dignity 82.28 83.59 78.31 79.86 (75.83 – 83.89)
Physical Quality 96.92* 97.07* 97.77* 99.35 (98.45 – 100.00)
Family Satisfaction 90.54 91.74 89.83 -
86
47 44
82
979188
50 46
84
979289
5144
78
989087
45 43
80
99
00
20
40
60
80
100
120
SATISFACTION CHOICE INCLUSION DIGNITY PHYS QUAL FAM SAT
Scale Scores for State, Region, County, Provider
State Central Dauphin Keystone Service Systems (Dauphin AE)
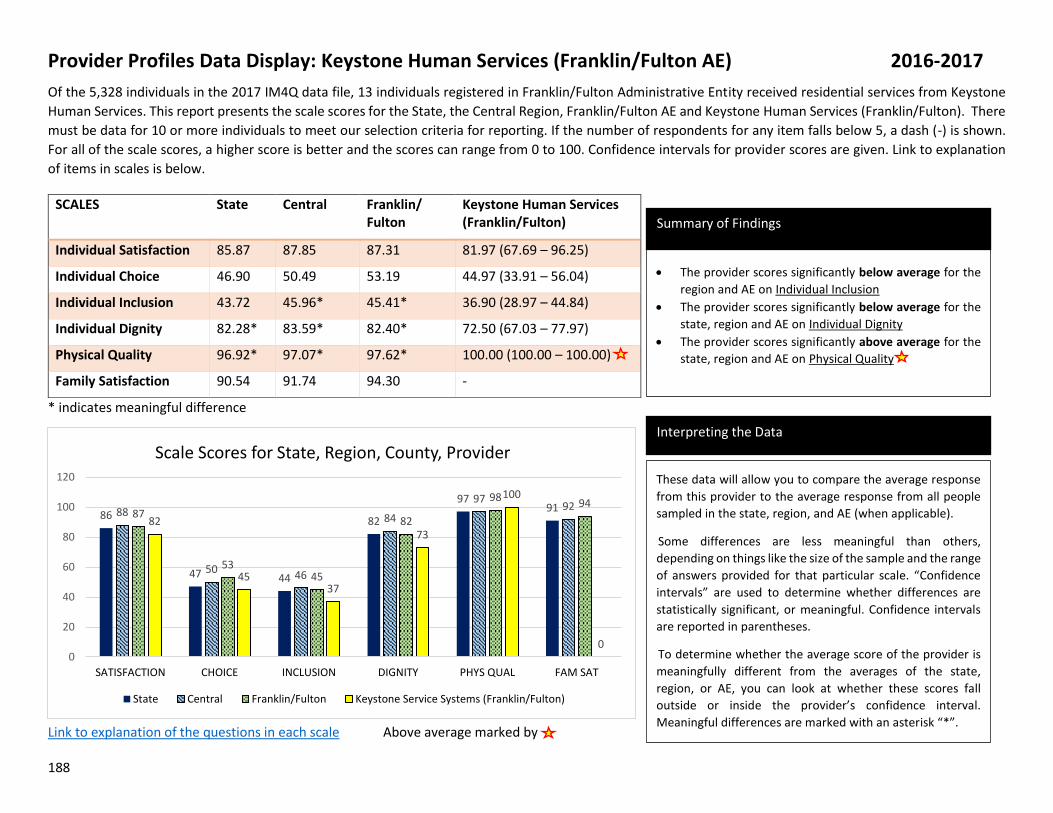
188
Interpreting the Data
These data will allow you to compare the average response
from this provider to the average response from all people
sampled in the state, region, and AE (when applicable).
Some differences are less meaningful than others,
depending on things like the size of the sample and the range
of answers provided for that particular scale. “Confidence
intervals” are used to determine whether differences are
statistically significant, or meaningful. Confidence intervals
are reported in parentheses.
To determine whether the average score of the provider is
meaningfully different from the averages of the state,
region, or AE, you can look at whether these scores fall
outside or inside the provider’s confidence interval.
Meaningful differences are marked with an asterisk “*”.
Summary of Findings
• The provider scores significantly below average for the
region and AE on Individual Inclusion
• The provider scores significantly below average for the
state, region and AE on Individual Dignity
• The provider scores significantly above average for the
state, region and AE on Physical Quality
Provider Profiles Data Display: Keystone Human Services (Franklin/Fulton AE) 2016-2017
Of the 5,328 individuals in the 2017 IM4Q data file, 13 individuals registered in Franklin/Fulton Administrative Entity received residential services from Keystone
Human Services. This report presents the scale scores for the State, the Central Region, Franklin/Fulton AE and Keystone Human Services (Franklin/Fulton). There
must be data for 10 or more individuals to meet our selection criteria for reporting. If the number of respondents for any item falls below 5, a dash (-) is shown.
For all of the scale scores, a higher score is better and the scores can range from 0 to 100. Confidence intervals for provider scores are given. Link to explanation
of items in scales is below.
* indicates meaningful difference
Link to explanation of the questions in each scale Above average marked by
SCALES State Central Franklin/ Fulton
Keystone Human Services (Franklin/Fulton)
Individual Satisfaction 85.87 87.85 87.31 81.97 (67.69 – 96.25)
Individual Choice 46.90 50.49 53.19 44.97 (33.91 – 56.04)
Individual Inclusion 43.72 45.96* 45.41* 36.90 (28.97 – 44.84)
Individual Dignity 82.28* 83.59* 82.40* 72.50 (67.03 – 77.97)
Physical Quality 96.92* 97.07* 97.62* 100.00 (100.00 – 100.00)
Family Satisfaction 90.54 91.74 94.30 -
86
47 44
82
979188
5046
84
9792
87
5345
82
9894
82
4537
73
100
00
20
40
60
80
100
120
SATISFACTION CHOICE INCLUSION DIGNITY PHYS QUAL FAM SAT
Scale Scores for State, Region, County, Provider
State Central Franklin/Fulton Keystone Service Systems (Franklin/Fulton)

189
Interpreting the Data
These data will allow you to compare the average response
from this provider to the average response from all people
sampled in the state, region, and AE (when applicable).
Some differences are less meaningful than others,
depending on things like the size of the sample and the range
of answers provided for that particular scale. “Confidence
intervals” are used to determine whether differences are
statistically significant, or meaningful. Confidence intervals
are reported in parentheses.
To determine whether the average score of the provider is
meaningfully different from the averages of the state,
region, or AE, you can look at whether these scores fall
outside or inside the provider’s confidence interval.
Meaningful differences are marked with an asterisk “*”.
Summary of Findings
• The provider scores significantly above average for the
state on Individual Choice
• The provider scores significantly above average for the
state, region and AE on Physical Quality
Provider Profiles Data Display: Keystone Human Services (Lancaster AE) 2016-2017
Of the 5,328 individuals in the 2017 IM4Q data file, 17 individuals registered in Lancaster Administrative Entity received residential services from Keystone Human
Services This report presents the scale scores for the State, the Central Region, Lancaster AE and Keystone Human Services (Lancaster). There must be data for 10
or more individuals to meet our selection criteria for reporting. If the number of respondents for any item falls below 5, a dash (-) is shown. For all of the scale
scores, a higher score is better and the scores can range from 0 to 100. Confidence intervals for provider scores are given. Link to explanation of items in scales is
below.
* indicates meaningful difference
Link to explanation of the questions in each scale Above average marked by
SCALES State Central Lancaster Keystone Human Services (Lancaster)
Individual Satisfaction 85.87 87.85 86.55 82.33 (68.86 – 95.81)
Individual Choice 46.90* 50.49 49.52 57.88 (47.63 – 68.13)
Individual Inclusion 43.72 45.96 45.17 47.01 (38.53 – 55.48)
Individual Dignity 82.28 83.59 80.22 83.33 (77.16 – 89.51)
Physical Quality 96.92* 97.07* 96.92* 99.02 (97.10 – 100.00)
Family Satisfaction 90.54 91.74 89.31 -
86
47 44
82
979188
50 46
84
9792
87
5045
80
9789
82
58
47
83
99
00
20
40
60
80
100
120
SATISFACTION CHOICE INCLUSION DIGNITY PHYS QUAL FAM SAT
Scale Scores for State, Region, County, Provider
State Central Lancaster Keystone Service Systems (Lancaster)

190
Interpreting the Data
These data will allow you to compare the average response from this provider to the average response from all people sampled in the state, region, and AE (when applicable).
Some differences are less meaningful than others, depending on things like the size of the sample and the range of answers provided for that particular scale. “Confidence intervals” are used to determine whether differences are statistically significant, or meaningful. Confidence intervals are reported in parentheses.
To determine whether the average score of the provider is meaningfully different from the averages of the state, region, or AE, you can look at whether these scores fall outside or inside the provider’s confidence interval. Meaningful differences are marked with an asterisk “*”.
Summary of Findings
• The provider scores significantly above average for the
state on Individual Satisfaction
• The provider scores significantly below average for the
state, region and AE on Individual Choice
• The provider scores significantly above average for the
state and AE on Individual Inclusion
• The provider scores significantly below average for the
region on Individual Dignity
• The provider scores significantly above average for the
state, region and AE on Physical Quality
Provider Profiles Data Display: Keystone Human Services (Luzerne/Wyoming AE) 2016-2017
Of the 5,328 individuals in the 2017 IM4Q data file, 18 individuals registered in Luzerne/Wyoming Administrative Entity received residential services from Keystone
Human Services. This report presents the scale scores for the State, the Northeast Region, Luzerne/Wyoming AE and Keystone Human Services (Luzerne/Wyoming).
There must be data for 10 or more individuals to meet our selection criteria for reporting. If the number of respondents for any item falls below 5, a dash (-) is
shown. For all of the scale scores, a higher score is better and the scores can range from 0 to 100. Confidence intervals for provider scores are given. Link to
explanation of items in scales is below.
* indicates meaningful difference
Link to explanation of the questions in each scale Above average marked by
SCALES State Northeast Luzerne/ Wyoming
Keystone Human Services (Luzerne/Wyoming)
Individual Satisfaction 85.87* 89.11 92.14 92.56 (86.05 – 99.08)
Individual Choice 46.90* 54.66* 47.14* 38.13 (32.25 – 44.00)
Individual Inclusion 43.72* 48.05 43.34* 49.05 (44.13 – 53.97)
Individual Dignity 82.28 88.82* 79.60 80.77 (77.01 – 84.53)
Physical Quality 96.92* 96.97* 96.06* 99.07 (97.26 – 100.00)
Family Satisfaction 90.54 92.50 95.76 -
86
47 44
82
979189
5548
8997
9392
4743
80
96 9693
38
49
81
99
00
20
40
60
80
100
120
SATISFACTION CHOICE INCLUSION DIGNITY PHYS QUAL FAM SAT
Scale Scores for State, Region, County, Provider
State NE Luzerne/Wyoming Keystone Service Systems (Luzerne/Wyoming)

191
Interpreting the Data
These data will allow you to compare the average response
from this provider to the average response from all people
sampled in the state, region, and AE (when applicable).
Some differences are less meaningful than others,
depending on things like the size of the sample and the range
of answers provided for that particular scale. “Confidence
intervals” are used to determine whether differences are
statistically significant, or meaningful. Confidence intervals
are reported in parentheses.
To determine whether the average score of the provider is
meaningfully different from the averages of the state,
region, or AE, you can look at whether these scores fall
outside or inside the provider’s confidence interval.
Meaningful differences are marked with an asterisk “*”.
Summary of Findings
• The provider scores significantly below average for the
region on Individual Choice
• The provider scores significantly below average for the
region and AE on Individual Inclusion
• The provider scores significantly below average for the
state and region on Individual Dignity
• The provider scores significantly above average for the
AE on Physical Quality
Provider Profiles Data Display: Keystone Human Services (Northumberland AE) 016-2017
Of the 5,328 individuals in the 2017 IM4Q data file, 13 individuals registered in Northumberland Administrative Entity received residential services from Keystone
Human Services. This report presents the scale scores for the State, the Central Region, Northumberland AE and Keystone Human Services (Northumberland).
There must be data for 10 or more individuals to meet our selection criteria for reporting. If the number of respondents for any item falls below 5, a dash (-) is
shown. For all of the scale scores, a higher score is better and the scores can range from 0 to 100. Confidence intervals for provider scores are given. Link to
explanation of items in scales is below.
* indicates meaningful difference
Link to explanation of the questions in each scale Above average marked by
SCALES State Central North-umberland
Keystone Human Services (Northumberland)
Individual Satisfaction 85.87 87.85 78.37 66.67 (42.81 – 90.52)
Individual Choice 46.90 50.49* 46.22 41.34 (32.52 – 50.17)
Individual Inclusion 43.72 45.96* 48.81* 40.01 (34.75 – 45.27)
Individual Dignity 82.28* 83.59* 73.61 72.69 (66.14 – 79.23)
Physical Quality 96.92 97.07 92.19* 98.72 (96.21 – 100.00)
Family Satisfaction 90.54 91.74 81.62 -
86
47 44
82
979188
50 46
84
9792
87
5345
82
9894
82
4537
73
100
00
20
40
60
80
100
120
SATISFACTION CHOICE INCLUSION DIGNITY PHYS QUAL FAM SAT
Scale Scores for State, Region, County, Provider
State Central Franklin/Fulton Keystone Service Systems (Franklin/Fulton)

192
Provider Profile Summary: King Family Enterprise www.kingfamilyenterprise.com
The King Family’s mission is to provide support that is motivated by kindness and care for individuals with intellectual disabilities. We believe that every person has the right to live independently and safely in their home or in our residential setting; therefore, our mission is to provide the proper and direct services to achieve these goals. With our carefully picked staff, we intend to provide a family environment in our Adult Residence. We will welcome with open arms the chance to impact the lives of anyone with the need of our services for Home and Community Habilitation, Companionship and Employment Services.
The King Family’s guiding values are Caring, Inspiring, Supportive, Passionate, and Committed.
We have been serving people for 7 years.
We offer: Companion Services—Our staff will work with individuals in the privacy of their home or in the community. We build on relationships that reflect true companionship. Home and Community Habilitation—We will partner with the Parent/Caregiver and the individual and build a plan that will help develop community integration and improve quality of life. Adult Residence—We provide a home-like atmosphere in a clean and safe environment. We carefully select our staff that has the same values we embrace at King Family Enterprise. Our consumers will feel at home and a part of the family when staying at our Adult Residence.
We carefully select staff that embrace the values of King Family Enterprise and provide them with the necessary training to meet the needs of the people they support.
After gathering information on the interests, goals from the individual and the family, we build a plan that includes a weekly schedule. Our goal is to allow the individual the opportunity to develop his or her independence and social skills in the community as outlined in the ISP. We will help the individual put together plans that support their interests instead of them supporting our plans. Our goal is to provide services that allow each person to develop to their maximum potential.
Because King Family Enterprise is a close family, we understand how important it is to have caring and loving people supporting their loved ones and that's who we are. We also feel that consistent communication is very important. This is why we will provide a schedule of activities and many of our plans will include the family, such as our annual cookout and bowling party. So once again, keeping the family engaged.
We have committed to developing an activity that will give our staff more options to offer to the individuals. We feel that this will help improve community integration.
King Family Enterprise is a small provider with a big heart. This will give you the benefit of having a close and personal company who will give your loved one the support they deserve. We hope to have the opportunity.

193
Provider Profile Summary: Lakeshore Community Services www.lakeshorecs.org
The mission of Lakeshore Community Services, Inc. is to enhance the ability of persons with mental and physical disabilities to live as independently as possible
through the acquisition of skills and utilization of services that promote each individual's self-direction, personal worth, and value.
Lakeshore Community Services values people for each of our individualities, interests, perspectives and life paths.
Lakeshore Community Services has been supporting people diagnosed with intellectual disabilities and autism since 1986, 33 years.
Lakeshore Community Services offers people diagnosed with intellectual disabilities and autism the following services: *Exploring community activities that match
their interests *Volunteer opportunities in the community *Supports to successfully live in their own homes *Residential services to support individuals living in
community homes throughout western PA by providing supports and personal care assistance to ensure their health and safety, and community integration *A
daily place for people to relax, work on things that interest them, and experiences in the Warren area community *Supporting people to overcome challenging
behavior are available for individuals in our residential services. *Providing residential supports with a variety of options to suit their needs. This includes life
sharing.
With over 33 years of service, Lakeshore Community Services has worked with people who have a range of needs and interests. We enjoy providing opportunities
for community participation that match what interests our consumers. We love helping people become more confident and independent by supporting them to
the degree they are comfortable.
Staff are trained in effective communication, and for those consumers who are deaf, our staff are trained in ASL.
Consumers and staff are matched based upon interests, and staff assure consumer's health and safety while experiencing those things that interest them.
Families are a vital part of providing support to the individuals we serve. We encourage family involvement in services and engage them to the degree in which
they are comfortable.
Currently Lakeshore Community Services is working on a number of quality improvement projects based on data analytics. We are focusing on assuring that people
who use English as a second language work with Lakeshore staff and interpreters to be certain that all of their needs are met, that people have opportunities to
volunteer and give back to their communities, that people have opportunities to try new things that they are interested in, and that documentation of our service
delivery is more flexible and timely. We are also working to decrease the number of incident extensions that we need to request.
Lakeshore Community Services is known for developing supports around individuals instead of finding people that fit into traditional programs and services.

194
Interpreting the Data
These data will allow you to compare the average response
from this provider to the average response from all people
sampled in the state, region, and AE (when applicable).
Some differences are less meaningful than others,
depending on things like the size of the sample and the range
of answers provided for that particular scale. “Confidence
intervals” are used to determine whether differences are
statistically significant, or meaningful. Confidence intervals
are reported in parentheses.
To determine whether the average score of the provider is
meaningfully different from the averages of the state,
region, or AE, you can look at whether these scores fall
outside or inside the provider’s confidence interval.
Meaningful differences are marked with an asterisk “*”.
Summary of Findings
• The provider scores significantly above average for the
state, region and AE on Physical Quality
Provider Profiles Data Display: Lakeshore Community Services (Erie AE) 2016-2017
Of the 5,328 individuals in the 2017 IM4Q data file, 16 individuals registered in Erie Administrative Entity received residential services from Lakeshore Community
Services. The data in this profile are for the provider’s community-based residential services. This report presents the scale scores for the State, the West Region,
Erie AE and Lakeshore Community Services (Erie). There must be data for 10 or more individuals to meet our selection criteria for reporting. If the number of
respondents for any item falls below 5, a dash (-) is shown. For all of the scale scores, a higher score is better and the scores can range from 0 to 100. Confidence
intervals for provider scores are given. Link to explanation of items in scales is below.
* indicates meaningful difference
Link to explanation of the questions in each scale Above average marked by
SCALES State West Erie Lakeshore Community Services (Erie)
Individual Satisfaction 85.87 85.05 85.24 74.72 (53.71 – 95.73)
Individual Choice 46.90 49.35 44.53 43.68 (31.99 – 55.36)
Individual Inclusion 43.72 43.58 37.48 41.52 (34.40 – 48.63)
Individual Dignity 82.28 80.22 80.91 84.03 (76.60 – 91.46)
Physical Quality 96.92* 97.13* 93.82* 100.00 (100.00 – 100.00)
Family Satisfaction 90.54 91.79 89.83 -
86
47 44
82
9791
85
4944
80
9792
85
4537
81
9490
75
44 42
84
100
0
20
40
60
80
100
120
SATISFACTION CHOICE INCLUSION DIGNITY PHYS QUAL FAM SAT
Scale Scores for State, Region, County, Provider
State West Erie Lakeshore Community Services (Erie)

195
Provider Profile Summary: Landis Adult Day Services www.landisadultday.org
The mission of Landis Homes is to serve aging adults and their families by honoring and enriching their lives in a community of Christ-like love.
We commit to these values as we honor God in our service to others: Joy, Compassion, Integrity, Stewardship and Community.
We have supported individuals with intellectual disabilities in our Adult Day Services program since 2004.
We offer Adult Day Services Monday through Friday from 7 AM to 5 PM.
Our special areas of expertise are individuals over the age of 60 and individuals with Alzheimer's disease or a related dementia.
Staff are familiar with the ISP of each individual we serve and follow the communication strategies in the ISP and the preferences expressed by the individual.
We offer field trips in the Lancaster County community. For individuals with memory loss, we have a Sing for the Moment Choir for them and their care partners. Each year there is a spring and fall series with a concert at the end of each series.
We offer a Memory Loss Support Group in collaboration with the Alzheimer's Association each month for care partners of individuals with memory loss.
The individuals and their families complete a satisfaction survey every other year and upon discharge. Surveys are reviewed to identify opportunities for improvement.

196
Provider Profile Summary: Laurel House www.laurelhouseinc.org
We believe that everyone has an equal right to live, work and play. And we strive to ensure that all of our individuals get the opportunity to achieve their potential
and exercise their right to a full and rewarding life.
Our guiding value is to provide a quality life to all individuals residing in this program accompanied by fair and equal treatment for all.
Laurel House Inc. opened on December 1, 1970. Almost 49 years of providing services.
We offer: 1. Residential placement- individuals reside in a group home setting with 24 hr. supervision. 2. Lifesharing (Adult foster care) - Individuals have the
opportunity to live and share lives with a family. 3. Homebased Waiver Services - Individuals have the chance to have someone come into their home and provide
services. This allows the individual to remain at home with their family. 4. Community Participation Support - An individual will have the opportunity to have a
staff person find ways for them to become part of a community group.
Laurel House has served all individuals with different needs.
Staff are trained appropriately for each individual that receives services.
All individuals are given notice of activities and events and are encouraged by their staff to participate. We are a very social group and all individuals love
participating. Individuals attend baseball games, dances, parties, community activities including paint and sip events, church activities and travel. Our individuals
have traveled on cruises, Hawaii, Mexico, Steeler games, concerts, casinos, Disneyworld, Hollywood, etc.
Families are always welcome to attend any activities that are scheduled. We also send surveys to families annually to ask how we are doing with the services we
are providing and are open to suggestions for improvement.
We would like to hopefully provide more services to the ASD population.
Laurel House Inc. is known as one of the first residential homes in the state of Pa. Over the last 49 years, this agency has earned a wonderful reputation as a quality
program that provides excellent care to all individuals who are participating.
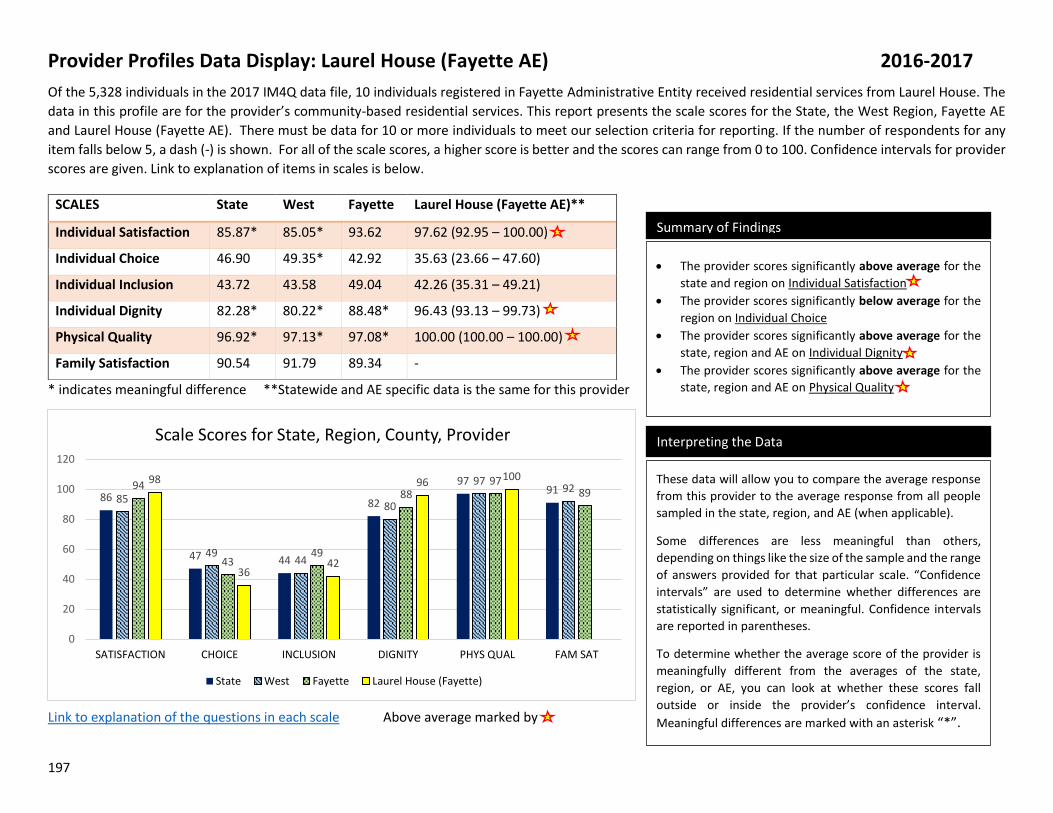
197
Interpreting the Data
These data will allow you to compare the average response
from this provider to the average response from all people
sampled in the state, region, and AE (when applicable).
Some differences are less meaningful than others,
depending on things like the size of the sample and the range
of answers provided for that particular scale. “Confidence
intervals” are used to determine whether differences are
statistically significant, or meaningful. Confidence intervals
are reported in parentheses.
To determine whether the average score of the provider is
meaningfully different from the averages of the state,
region, or AE, you can look at whether these scores fall
outside or inside the provider’s confidence interval.
Meaningful differences are marked with an asterisk “*”.
Summary of Findings
• The provider scores significantly above average for the
state and region on Individual Satisfaction
• The provider scores significantly below average for the
region on Individual Choice
• The provider scores significantly above average for the
state, region and AE on Individual Dignity
• The provider scores significantly above average for the
state, region and AE on Physical Quality
Provider Profiles Data Display: Laurel House (Fayette AE) 2016-2017
Of the 5,328 individuals in the 2017 IM4Q data file, 10 individuals registered in Fayette Administrative Entity received residential services from Laurel House. The
data in this profile are for the provider’s community-based residential services. This report presents the scale scores for the State, the West Region, Fayette AE
and Laurel House (Fayette AE). There must be data for 10 or more individuals to meet our selection criteria for reporting. If the number of respondents for any
item falls below 5, a dash (-) is shown. For all of the scale scores, a higher score is better and the scores can range from 0 to 100. Confidence intervals for provider
scores are given. Link to explanation of items in scales is below.
* indicates meaningful difference **Statewide and AE specific data is the same for this provider
Link to explanation of the questions in each scale Above average marked by
SCALES State West Fayette Laurel House (Fayette AE)**
Individual Satisfaction 85.87* 85.05* 93.62 97.62 (92.95 – 100.00)
Individual Choice 46.90 49.35* 42.92 35.63 (23.66 – 47.60)
Individual Inclusion 43.72 43.58 49.04 42.26 (35.31 – 49.21)
Individual Dignity 82.28* 80.22* 88.48* 96.43 (93.13 – 99.73)
Physical Quality 96.92* 97.13* 97.08* 100.00 (100.00 – 100.00)
Family Satisfaction 90.54 91.79 89.34 -
86
47 44
82
9791
85
4944
80
979294
4349
8897
8998
3642
96100
0
20
40
60
80
100
120
SATISFACTION CHOICE INCLUSION DIGNITY PHYS QUAL FAM SAT
Scale Scores for State, Region, County, Provider
State West Fayette Laurel House (Fayette)

198
Provider Profile Summary: Lawrence County ARC www.lcarconline.org
Lawrence County Association for Responsible Care's (LCARC) staff and leadership advocate for and provide quality services for people with intellectual disabilities.
Our mission is to ensure their health, safety and welfare while promoting personal choice and growth in all areas of their daily lives.
Each person we serve is a unique individual with their own wants, needs and desires. Each of them has the right to shape their own vision of a good life. We respect
the important role of friends and families; and strive to offer supports in a manner that is dignified and respectful of their values. Learning is a lifelong process for
us and the people we serve. We strive to continuously improve our services and the experience of our consumers. LCARC values Integrity and Transparency above
all else.
LCARC provides services to infants, toddlers, children and adults with intellectual disabilities, developmental delays and autism. Sixty years of experience and
seasoned staff allow us to provide high quality supports and services.
LCARC provides service and supports in family and individual homes, the community and licensed settings. We offer daytime programming that focuses on adult
learning and community participation. Our residential homes provide an opportunity for individuals to live in the community with supports they need around the
clock. LCARC staff develop a personal profile for each consumer. The profile assures that all necessary medical, physical and emotional supports are in place. They
also assure that the individual's preferences are incorporated into their daily routines.
LCARC has had the privilege of supporting many individuals throughout their lifespan. We meet their changing needs by continuously evaluating and adapting their
services and supports. Complex medical needs and the aging process do not prevent recipients from enjoying friends, family and their community. LCARC
supervisory and management staff are available 24/7 to handle emergencies and offer staff support.
Individuals make their wants and needs known in the manner they are most comfortable with. Some access technology to communicate; while others use gestures,
facial expressions, picture boards or their own version of sign. Staff receive extensive training on the individual's preferred mode of communication.
LCARC employees offer choice across all environments. Opportunities are provided for socialization, volunteerism, worship, recreation and adult learning. Staff
support individuals while they form healthy relationships and enjoy real life experiences.
Families are encouraged to take an active role in programming; and to share the knowledge and understanding they have of their family member's needs. Services
are designed to be respectful of each family's desired level of involvement.
LCARC has strong Risk Management and Quality Improvement Programs that involve staff, consumers and families. Through quality initiatives we have successfully
increased supervisory time, improved our response to incidents and emergencies, and improved our staff training programs. An agency wide quality team was
recently formed to provide education/opportunities for improved Health and Wellness.

199
Interpreting the Data
These data will allow you to compare the average response
from this provider to the average response from all people
sampled in the state, region, and AE (when applicable).
Some differences are less meaningful than others,
depending on things like the size of the sample and the range
of answers provided for that particular scale. “Confidence
intervals” are used to determine whether differences are
statistically significant, or meaningful. Confidence intervals
are reported in parentheses.
To determine whether the average score of the provider is
meaningfully different from the averages of the state,
region, or AE, you can look at whether these scores fall
outside or inside the provider’s confidence interval.
Meaningful differences are marked with an asterisk “*”.
Summary of Findings
• The provider scores significantly below average for the
region and AE on Individual Choice
• The provider scores significantly above average for the
state and region on Individual Dignity
• The provider scores significantly above average for the
state, region and AE on Physical Quality
• The provider scores significantly above average for the
state and region on Family Satisfaction
Provider Profiles Data Display: Lawrence County ARC (Lawrence AE) 2016-2017
Of the 5,328 individuals in the 2017 IM4Q data file, 17 individuals registered in the Lawrence Administrative Entity received residential services from Lawrence Co.
ARC. The data in this profile are for the provider’s community-based residential services. This report presents the scale scores for the State, the Western Region,
Lawrence AE and Lawrence Co. ARC (Lawrence AE). There must be data for 10 or more individuals to meet our selection criteria for reporting. If the number of
respondents for any item falls below 5, a dash (-) is shown. For all of the scale scores, a higher score is better and the scores can range from 0 to 100. Confidence
intervals for provider scores are given. Link to explanation of items in scales is below
* indicates meaningful difference **Statewide and AE specific data is the same for this provider
Link to explanation of the questions in each scale Above average marked by
SCALES State West Lawrence AE Lawrence County ARC (Lawrence)**
Individual Satisfaction 85.87 85.05 84.33 88.93 (81.13 – 96.73)
Individual Choice 46.90 49.35* 53.84* 40.79 (32.33 – 49.25)
Individual Inclusion 43.72 43.58 40.56 39.22 (32.33 – 46.10)
Individual Dignity 82.28* 80.22* 89.88 92.42 (85.65 – 99.20)
Physical Quality 96.92* 97.13* 96.53 100.00 (100.00 – 100.00)
Family Satisfaction 90.54* 91.79* 94.00 95.12 (91.86 – 98.38)
86
47 44
82
9791
85
4944
80
9792
84
54
41
9097 94
89
41 39
92100
95
0
20
40
60
80
100
120
SATISFACTION CHOICE INCLUSION DIGNITY PHYS QUAL FAM SAT
Scale Scores for State, Region, County, Provider
State West Lawrence AE Lawrence Co. ARC (Lawrence)
200
Provider Profile Summary: LifePath www.lifepath.org
LifePath’s mission is to provide the highest quality of services to people needing specialized support through the blending of professional knowledge, arts and
skills in an environment of unconditional respect and dignity. We have promoted an everyday lives philosophy since our inception.
LifePath’s guiding values are: Compassionate Care with Dignity and Respect. LifePath was founded in 1974.
LifePath provides a wide range of services to help people who are living in their own or family residences as well as people who live in homes that we own and
provide supports in. We also provide Community Participation Supports, Psychiatry and Counseling, Day Services, Employment Opportunities and Early
Intervention. Our residential services include LifeSharing, In-Home and Community Supports (family supports), Living supported apartments, staffed Community
Homes, an ICF setting for people with medical needs and an insurance/private pay setting for children with medical needs.
LifePath employs 75 nurses who allow us to extend our services to people who have more medical needs than most providers are able to do. The needs of this
group do change the way our IM4Q data looks. We also support highly independent individuals - two of the people we serve have received top medals at
international Special Olympics events!
LifePath employs staff who are fluent in numerous languages and communication processes. We have a number of certified Communication Mentors. We utilize
and help people to access communication devices. Our Technology and Learning Center has a strong emphasis upon technology utilization. When needed, we seek
outside expertise to provide communication services and training for our staff.
LifePath is actively engaging people in the community, in accordance with each person's interests, goals and needs, through a wide variety of resources and
opportunities.
LifePath has different family engagement opportunities happening in different locations. In the Lehigh Valley, families participate with people we serve and staff
in our Dignity Committee which champions community engagement, relationship building and staff excellence. In our Bucks/Mont area, an active group of family
members comes together for mutual support and socialization. Throughout LifePath, we need families to be an active part of fulfilling our mission.
LifePath's Management and Risk Management Teams review vital sign, incident and goal-based data monthly to insure a continued focus on excellence. One
important current project is an effort to utilize increased technology to maximize utilization of our workforce.
LifePath was founded by a group of family members in 1974. Our emphasis on Compassionate Care with Dignity and Respect continues to guide our efforts. We
have services located in the Lehigh Valley and throughout southeastern Pennsylvania. We understand the challenges of accessing good services - We share our
best wishes and hopes that you will be successful.

201
Interpreting the Data
These data will allow you to compare the average response
from this provider to the average response from all people
sampled in the state, region, and AE (when applicable).
Some differences are less meaningful than others,
depending on things like the size of the sample and the range
of answers provided for that particular scale. “Confidence
intervals” are used to determine whether differences are
statistically significant, or meaningful. Confidence intervals
are reported in parentheses.
To determine whether the average score of the provider is
meaningfully different from the averages of the state,
region, or AE, you can look at whether these scores fall
outside or inside the provider’s confidence interval.
Meaningful differences are marked with an asterisk “*”.
Summary of Findings
• The provider scores significantly below average for the
state on Individual Choice
• The provider scores significantly below average for the
state on Individual Inclusion
Provider Profiles Data Display: LifePath (Statewide) 2016-2017
Of the 5,328 individuals in the 2017 IM4Q data file, 81 individuals registered in Pennsylvania received residential services from LifePath. The data in this profile
are for the provider’s community-based residential services. This report presents the scale scores for the State of Pennsylvania and LifePath (Statewide). There
must be data for 10 or more individuals to meet our selection criteria for reporting. If the number of respondents for any item falls below 5, a dash (-) is shown.
For all of the scale scores, a higher score is better and the scores can range from 0 to 100. Confidence intervals for provider scores are given. Link to explanation
of items in scales is below.
* indicates meaningful difference
Link to explanation of the questions in each scale Above average marked by
SCALES State LifePath
Individual Satisfaction 85.87 87.93 (82.54 – 93.33)
Individual Choice 46.90* 35.97 (31.27 – 40.66)
Individual Inclusion 43.72* 36.22 (32.88 – 39.55)
Individual Dignity 82.28 83.33 (79.29 – 87.37)
Physical Quality 96.92 98.63 (96.69 – 100.00)
Family Satisfaction 90.54 90.18 (81.54 – 98.83)
86
47 44
82
979188
36 36
83
9990
0
20
40
60
80
100
120
SATISFACTION CHOICE INCLUSION DIGNITY PHYS QUAL FAM SAT
Scale Scores for State and Provider
State Life Path

202
Interpreting the Data
These data will allow you to compare the average response
from this provider to the average response from all people
sampled in the state, region, and AE (when applicable).
Some differences are less meaningful than others,
depending on things like the size of the sample and the range
of answers provided for that particular scale. “Confidence
intervals” are used to determine whether differences are
statistically significant, or meaningful. Confidence intervals
are reported in parentheses.
To determine whether the average score of the provider is
meaningfully different from the averages of the state,
region, or AE, you can look at whether these scores fall
outside or inside the provider’s confidence interval.
Meaningful differences are marked with an asterisk “*”.
Summary of Findings
• The provider scores significantly above average for the region on Individual Satisfaction
• The provider scores significantly below average for the state and AE on Individual Choice
• The provider scores significantly below average for the state and AE on Individual Inclusion
• The provider scores significantly above average for the region on Individual Dignity
• The provider scores significantly above average for the region and AE on Physical Quality
Provider Profiles Data Display: LifePath (Bucks AE) 2016-2017
Of the 5,328 individuals in the 2017 IM4Q data file, 32 individuals registered in Bucks Administrative Entity received residential services from LifePath. The data in
this profile are for the provider’s community-based residential services. This report presents the scale scores for the State, the Southeast Region, Bucks AE and
LifePath (Bucks). There must be data for 10 or more individuals to meet our selection criteria for reporting. If the number of respondents for any item falls below
5, a dash (-) is shown. For all of the scale scores, a higher score is better and the scores can range from 0 to 100. Confidence intervals for provider scores are given.
Link to explanation of items in scales is below.
* indicates meaningful difference
Link to explanation of the questions in each scale Above average marked by
SCALES State SE Bucks LifePath (Bucks)
Individual Satisfaction 85.87 82.83* 88.30 90.49 (84.02 – 96.96)
Individual Choice 46.90* 37.62 42.48* 32.71 (26.87 – 38.57)
Individual Inclusion 43.72* 39.99 44.63* 36.45 (30.83 – 42.07)
Individual Dignity 82.28 79.12* 87.25 83.33 (79.29 – 87.37)
Physical Quality 96.92 96.57* 96.25* 98.63 (96.69 – 100.00)
Family Satisfaction 90.54 87.82 91.10 90.18 (81.54 – 98.83)
86
47 44
82
9791
83
38 40
79
978888
42 45
8796
9190
33 36
91100 99
0
20
40
60
80
100
120
SATISFACTION CHOICE INCLUSION DIGNITY PHYS QUAL FAM SAT
Scale Scores for State, Region, County, Provider
State SE Bucks Life Path (Bucks)

203
Interpreting the Data
These data will allow you to compare the average response
from this provider to the average response from all people
sampled in the state, region, and AE (when applicable).
Some differences are less meaningful than others,
depending on things like the size of the sample and the range
of answers provided for that particular scale. “Confidence
intervals” are used to determine whether differences are
statistically significant, or meaningful. Confidence intervals
are reported in parentheses.
To determine whether the average score of the provider is
meaningfully different from the averages of the state,
region, or AE, you can look at whether these scores fall
outside or inside the provider’s confidence interval.
Meaningful differences are marked with an asterisk “*”.
Summary of Findings
• The provider scores significantly below average for the
state on Individual Choice
• The provider scores significantly below average for the
state on Individual Inclusion
Provider Profiles Data Display: LifePath (Delaware AE) 2016-2017
Of the 5,328 individuals in the 2017 IM4Q data file, 19 individuals registered in Delaware Administrative Entity received residential services from LifePath. The
data in this profile are for the provider’s community-based residential services. This report presents the scale scores for the State, the Southeast Region, Delaware
AE and LifePath (Delaware). There must be data for 10 or more individuals to meet our selection criteria for reporting. If the number of respondents for any item
falls below 5, a dash (-) is shown. For all of the scale scores, a higher score is better and the scores can range from 0 to 100. Confidence intervals for provider
scores are given. Link to explanation of items in scales is below.
* indicates meaningful difference
Link to explanation of the questions in each scale Above average marked by
SCALES State Southeast Delaware LifePath (Delaware)
Individual Satisfaction 85.87 82.83 85.90 80.00 (66.63 – 93.37)
Individual Choice 46.90* 37.62 31.93 36.54 (27.49 – 45.58)
Individual Inclusion 43.72* 39.99 35.43 35.84 (30.99 – 40.69)
Individual Dignity 82.28 79.12 82.56 77.88 (69.96 – 85.81)
Physical Quality 96.92 96.57 96.98 94.30 (86.39 – 100.00)
Family Satisfaction 90.54 87.82 86.86 86.70 (75.27 – 98.12)
86
47 44
82
9791
83
38 40
79
978886
32 35
83
97
8780
37 36
78
9487
0
20
40
60
80
100
120
SATISFACTION CHOICE INCLUSION DIGNITY PHYS QUAL FAM SAT
Scale Scores for State, Region, County, Provider
State SE Delaware Life Path (Delaware)

204
Interpreting the Data
These data will allow you to compare the average response from this provider to the average response from all people sampled in the state, region, and AE (when applicable).
Some differences are less meaningful than others, depending on things like the size of the sample and the range of answers provided for that particular scale. “Confidence intervals” are used to determine whether differences are statistically significant, or meaningful. Confidence intervals are reported in parentheses.
To determine whether the average score of the provider is meaningfully different from the averages of the state, region, or AE, you can look at whether these scores fall outside or inside the provider’s confidence interval. Meaningful differences are marked with an asterisk “*”.
Summary of Findings
• The provider scores significantly above average for the
state, region and AE on Individual Satisfaction
• The provider scores significantly below average for the
state on Individual Choice
• The provider scores significantly below average for the
state, region and AE on Individual Inclusion
• The provider scores significantly above average for the
state, region and AE on Physical Quality
Provider Profiles Data Display: LifePath (Montgomery AE) 2016-2017
Of the 5,328 individuals in the 2017 IM4Q data file, 11 individuals registered in Montgomery Administrative Entity received residential services from LifePath. The
data in this profile are for the provider’s community-based residential services. This report presents the scale scores for the State, the Southeast Region,
Montgomery AE and LifePath (Montgomery). There must be data for 10 or more individuals to meet our selection criteria for reporting. If the number of
respondents for any item falls below 5, a dash (-) is shown. For all of the scale scores, a higher score is better and the scores can range from 0 to 100. Confidence
intervals for provider scores are given. Link to explanation of items in scales is below.
* indicates meaningful difference
Link to explanation of the questions in each scale Above average marked by
SCALES State Southeast Montgomery LifePath (Montgomery)
Individual Satisfaction 85.87* 82.83* 79.07* 97.22 (91.78 – 100.00)
Individual Choice 46.90* 37.62 31.31 25.20 (12.75 – 37.65)
Individual Inclusion 43.72* 39.99* 38.83* 28.23 (22.90 – 33.56)
Individual Dignity 82.28 79.12 76.96 76.67 (68.67 – 84.67)
Physical Quality 96.92 96.57 95.79 100.00 (100.00 – 100.00)
Family Satisfaction 90.54 87.82 83.83 -
86
47 44
82
9791
83
38 40
79
9788
79
3139
77
96
84
97
25 28
77
100
00
20
40
60
80
100
120
SATISFACTION CHOICE INCLUSION DIGNITY PHYS QUAL FAM SAT
Scale Scores for State, Region, County, Provider
State SE Montgomery Life Path (Montgomery)
205
Provider Profile Summary: Life’s New Beginning www.lifesnewbeginning.org
We provide group homes in the community for individuals to live in. In the homes, staff model and mentor for the individuals how to live as independently as possible. Each home will support one to three individuals. The number of occupants will be based on the needs of the individuals. Houses will be set in local residential neighborhoods. In licensed homes, staff will be available 24 hours a day, and thus will be able to meet all of the needs of the individuals. All licensed homes will abide by PA Chapter 6400 state regulations.
Our guiding values are to empower the individuals to live a life that promotes independence and self-advocacy.
We have been serving people for 4 years.
We offer: Residential Habilitation – This service is described in the first paragraph above. Companion Services - Companion services are recreation-based and may serve more than one individual per outing. The individual's preferences, interests and likes will provide the direction of the activity. Our companion services provide support to develop relationships with groups in the community. Community Participation Supports - We work with individuals to gain connections within their communities. Whether it is through community employment or volunteering to help their neighbors, this service gives individuals an opportunity to be an active participant in their community.
Our area of special expertise is Individuals that are dual-diagnosed with an intellectual disorder and a mental health disorder.
Staff are trained in the individual's ISP prior to working with the person. Life's New Beginning has monthly staff meetings in which the direct support staff meet with their program manager, program specialist and other members of management. This team discusses and assesses any areas of concern, areas that need improvement and areas that are working well.
We engage the people we support in the community through offering a variety of activities based on their likes, wants and desires. We also model and mentor the individual for encouragement and support.
Life's New Beginning has an open-door policy and we communicate with families on a consistent basis.
We are working on decreasing medication errors, increasing health and wellness through the utilization of an exercise room and promoting computer skills.

206
Provider Profile Summary: Lifesteps www.lifesteps.net
Mission: Helping individuals and families with life’s changing needs by developing programs and providing services which will improve their quality of life.
Vision: Improve the quality of life for members of our communities.
Lifesteps has a history of providing programs and services with value, quality, integrity, and compassion. The Agency’s following guiding principles have remained
constant:
• Our programs and services will respond to present and emerging community needs.
• We will operate in an economically and financially responsible manner.
• The assurance of quality will be present in all programs.
• We will be accountable to those who use and support our services.
• Strengthening individuals and families is a core element of everything we do.
• All individuals associated with Lifesteps will be treated with respect and dignity.
• All our activities will be conducted in an ethical and honest manner.
• We are committed to enhancing the skills and talents of our staff and encouraging their participation.
• We are committed to being a unique provider of comprehensive services.
• We will accept opportunities and challenges to serve with creativity, flexibility, and timeliness. Lifesteps has been supporting people with disabilities since 1923. Today these services have expanded to include residential and training programs throughout
western Pennsylvania including but not limited to: Community Homes, Community Participation Supports, Employment and Transition Services including
Supported Employment, Behavioral Services, and Adult Day Program and Services (Senior).
With teams of direct care professionals, behavior support staff and nurses, the Agency supports the diverse needs of each person to achieve their personal potential
through self-direction and community integration. Supports range from total care with activities of daily living to modeling and training in self-advocacy skills to
providing services for community integrated employment including job coaching.
Lifesteps trains staff to understand and develop techniques to use for effective communication. Staff training is tailored to support residential living and community
participation and covers: civil rights; social, emotional, environmental planning, sign language, working with visually impaired adults; behavioral plan support; and
Crisis Prevention Intervention (CPI).
Staff and individuals strive to create ways to be active members of the community in both residential and Community Participation Supports with activities such
as: planning, planting and maintaining home gardens; community integrated job exploration and training; or celebrating holidays through fellowship with
neighbors, family and friends. Indeed, families, friends and guardians of individuals form an important source of natural support for individuals with intellectual
disabilities and Lifesteps strongly encourages their involvement in the lives of individuals.
Over 90% of Lifesteps families and individuals most recently ranked Lifesteps services for individuals with intellectual disabilities as excellent or good in survey
areas such as: Confidentiality, Quality of Service, Curriculum, Activities, Planning, and Communication.

207
Interpreting the Data
These data will allow you to compare the average response
from this provider to the average response from all people
sampled in the state, region, and AE (when applicable).
Some differences are less meaningful than others,
depending on things like the size of the sample and the range
of answers provided for that particular scale. “Confidence
intervals” are used to determine whether differences are
statistically significant, or meaningful. Confidence intervals
are reported in parentheses.
To determine whether the average score of the provider is
meaningfully different from the averages of the state,
region, or AE, you can look at whether these scores fall
outside or inside the provider’s confidence interval.
Meaningful differences are marked with an asterisk “*”.
Summary of Findings
• The provider scores significantly above average for the
state and region on Physical Quality
Provider Profiles Data Display: Lifesteps (Statewide) 2016-2017
Of the 5,328 individuals in the 2017 IM4Q data file, 27 individuals registered in Pennsylvania received residential services from Lifesteps. The data in this profile
are for the provider’s community-based residential services. This report presents the scale scores for the State, the West Region and Lifesteps (Statewide). There
must be data for 10 or more individuals to meet our selection criteria for reporting. If the number of respondents for any item falls below 5, a dash (-) is shown.
For all of the scale scores, a higher score is better and the scores can range from 0 to 100. Confidence intervals for provider scores are given. Link to explanation
of items in scales is below.
* indicates meaningful difference
Link to explanation of the questions in each scale Above average marked by
SCALES State West Lifesteps
Individual Satisfaction 85.87 85.05 74.00 (60.84 – 87.16)
Individual Choice 46.90 49.35 50.30 (43.03 – 57.58)
Individual Inclusion 43.72 43.58 47.03 (41.80 – 52.25)
Individual Dignity 82.28 80.22 75.52 (67.16 – 83.88)
Physical Quality 96.92* 97.13* 100.00 (100.00 – 100.00)
Family Satisfaction 90.54 91.79 90.18 (79.96 – 100.00)
86
47 44
82
9791
85
4944
80
9792
74
50 47
76
100
90
0
20
40
60
80
100
120
SATISFACTION CHOICE INCLUSION DIGNITY PHYS QUAL FAM SAT
Scale Scores for State, Region, Provider
State West Lifesteps
208
Provider Profile Summary: Lifestyle Support Services www.lifestylesupport.net
Lifestyle Support Services, Inc. is committed to providing opportunities for individuals to achieve their desired dreams. Quality services are delivered by
compassionate, well-trained employees in a consistent, cost effective manner.
LSS’s core values: Integrity, Respect, Ethical Practices, Commitment to mission and Balanced Effectiveness & Efficiency.
We have been serving people since 1998.
LSS provides the following services: Residential, Behavioral Services, Community Participation Supports (CPS), Home-based and Companion.
LSS specializes in working with individuals with complex behavioral needs.
LSS continually provides staff education via the following: Staff meetings, Staff trainings, LSS Care tracker system, ODP Regulatory Guidelines Education and
Management observation via community outings/activities.
LSS engages individuals we support in the community via: Internal weekly activities, Vocational opportunities and Community activities such as Special Olympics,
bowling, baseball, fishing derbies, track & field, rainbow swim to name a few.
LSS supports & engages families via the following: LSS social events, Meet & greet, Home & community visits, Telephone contact and Face to face meetings.
LSS current quality improvement projects: Reducing medication errors, Reducing restrictive procedures and Reduce financial errors.
LSS goes above and beyond to ensure individuals receive quality treatment. The following is a list outlining an array of services to assist in meeting individual needs
including but not limited to: Internal Behavioral Specialist, Internal Licensed Therapist, Internal contracted Psychiatry & Tele-Psychiatry, Pathway’s to
Independence Day Program (CPS), Music Therapy, Contracted multifaceted therapy providers, Services with external providers and Contracted services with the
Altoona Career & Technology Center.
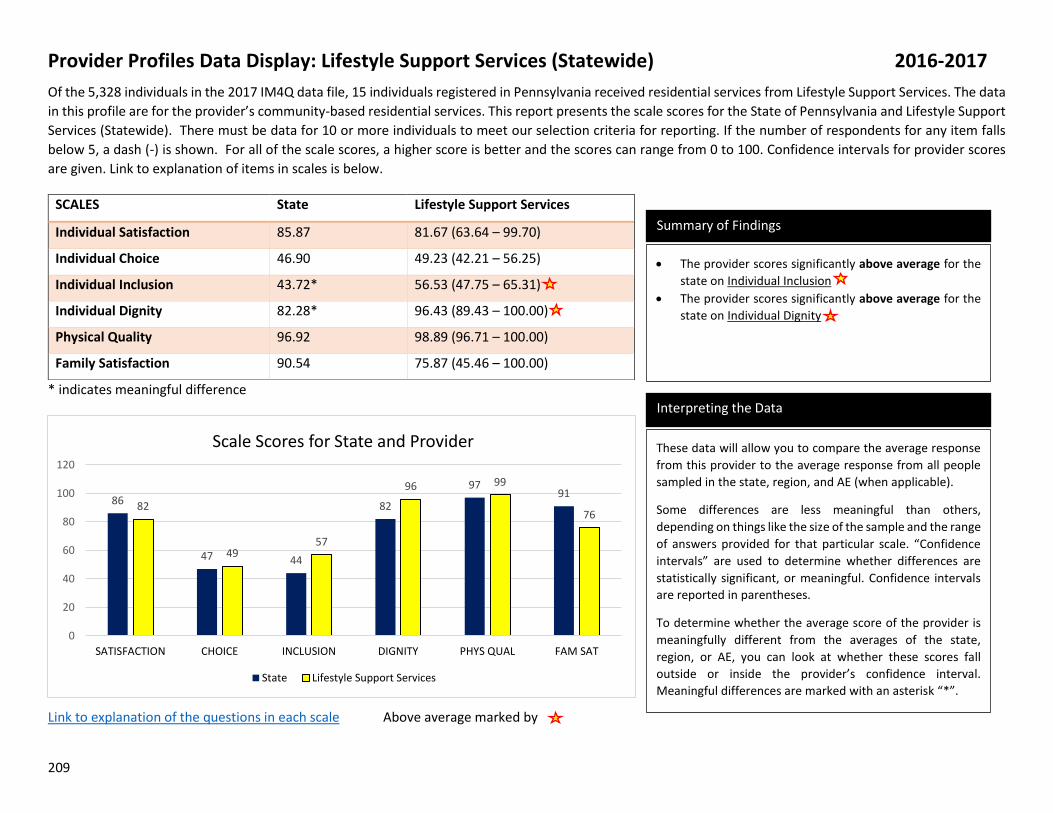
209
Interpreting the Data
These data will allow you to compare the average response
from this provider to the average response from all people
sampled in the state, region, and AE (when applicable).
Some differences are less meaningful than others,
depending on things like the size of the sample and the range
of answers provided for that particular scale. “Confidence
intervals” are used to determine whether differences are
statistically significant, or meaningful. Confidence intervals
are reported in parentheses.
To determine whether the average score of the provider is
meaningfully different from the averages of the state,
region, or AE, you can look at whether these scores fall
outside or inside the provider’s confidence interval.
Meaningful differences are marked with an asterisk “*”.
Summary of Findings
• The provider scores significantly above average for the
state on Individual Inclusion
• The provider scores significantly above average for the
state on Individual Dignity
Provider Profiles Data Display: Lifestyle Support Services (Statewide) 2016-2017
Of the 5,328 individuals in the 2017 IM4Q data file, 15 individuals registered in Pennsylvania received residential services from Lifestyle Support Services. The data
in this profile are for the provider’s community-based residential services. This report presents the scale scores for the State of Pennsylvania and Lifestyle Support
Services (Statewide). There must be data for 10 or more individuals to meet our selection criteria for reporting. If the number of respondents for any item falls
below 5, a dash (-) is shown. For all of the scale scores, a higher score is better and the scores can range from 0 to 100. Confidence intervals for provider scores
are given. Link to explanation of items in scales is below.
* indicates meaningful difference
Link to explanation of the questions in each scale Above average marked by
SCALES State Lifestyle Support Services
Individual Satisfaction 85.87 81.67 (63.64 – 99.70)
Individual Choice 46.90 49.23 (42.21 – 56.25)
Individual Inclusion 43.72* 56.53 (47.75 – 65.31)
Individual Dignity 82.28* 96.43 (89.43 – 100.00)
Physical Quality 96.92 98.89 (96.71 – 100.00)
Family Satisfaction 90.54 75.87 (45.46 – 100.00)
86
47 44
82
9791
82
4957
96 99
76
0
20
40
60
80
100
120
SATISFACTION CHOICE INCLUSION DIGNITY PHYS QUAL FAM SAT
Scale Scores for State and Provider
State Lifestyle Support Services

210
Provider Profile Summary: Links to Everyday Lives (DON Services) www.doninc.org
Our mission statement is assisting people with disabilities to live how and where they choose by providing Home and Community-Based Services in Western Pennsylvania.
All persons with disabilities are created equal to all persons without disabilities. They deserve the benefits of full integration within their community and their country. They are entitled to be referred to in terms of respective language. They are entitled to community respect as individuals without prejudice or bias relative to a disability. As part of the larger DON Services, the Links program values the individual’s right to live an “Everyday Life.”
Links to Everyday Lives has been supporting people with intellectual disabilities and/or autism for the past three years. DON Services has been serving people with disabilities since 2005, however, this has included the non-profit Disabilities Option Network, the Center for Independent Living for Lawrence, Beaver, Mercer, and Butler counties. Disabilities Option Network provides advocacy, training, information and referral, peer support, and transition services without charge.
Links to Everyday Lives provides In-Home and Community Supports, Companion, and Homemaker services. In-Home and Community Supports are face-to-face services provided within the home and community. The goal is to assist in acquiring, maintaining, and improving various skills including self-care, communication, motor skills, mobility, therapeutic activities, relationship development, socialization, and use of community services. Transportation is provided when working with agency-based providers. Companion Services are provided to individuals living in private residences for providing supervision and minimal assistance to protect the health and safety of an adult with an intellectual disability. Homemaker Services can help the individual remain in their own residence by providing cleaning, laundry, and other household care services.
Staff are trained in communicating with verbal and non-verbal consumers. They undergo training in positive practices, emphasizing consumer control of services and in allowing consumers to make choices during service delivery. They also undergo training in CPI Non-Violent Crisis Intervention. This training focuses on communication and de-escalating crisis situations.
We emphasize community engagement by taking our consumers into the community for social activities, shopping, dining out, medical appointments, and scheduled activities they choose to participate in.
We support families by making them aware of external services available such as assistance for Disability Options Network and other community resources. We also keep open communication and quick replies to email as allowed by individual’s documented consent to exchange of protected health information.
211
Provider Profile Summary: Mainstay Life Services www.mainstaylifeservices.org
Mainstay Life Services provides life-long, high quality support to ensure that people with developmental disabilities lead fulfilling lives and realize their vision of a
desirable future.
Mainstay offers compassionate, specialized support with sensitivity, respect, and dignity. We are flexible and responsive to the changing needs of those we support.
Mainstay is celebrating 20 years of supporting people with intellectual disabilities, autism, and Prader Willi Syndrome.
The level of residential care offered runs the gamut from 24 hour supervised group homes to supported living apartments with staff oversight. Living with a host
family (LifeSharing) is also an option. Individuals who would like to remain in their own or family home may opt for a support staff to visit as scheduled. We also
offer staffing for community outings or to explore job opportunities. An urban respite camp held each summer at Carnegie Mellon University can provide a much-
needed break for caregivers while their family member enjoys a week or two of exploring what the city has to offer.
Mainstay Life Services is one of the only residential providers with homes that specialize in support for people with Prader Willi Syndrome. We also provide for
people with physical and/or behavioral challenges.
All staff are trained to meet the individualized communication needs of the people they support.
People served by Mainstay are supported and encouraged to participate in their communities through competitive employment, volunteerism, worship, shopping,
banking, eating out, attending concerts, cultural events, using libraries, joining gyms, etc.
Mainstay was founded by families and continues to include family members on the Board of Directors. Families are invited to an annual picnic and are surveyed
regularly for feedback and suggestions. Phone calls and visits are welcomed and encouraged.
We continuously look at data regarding the homes, care and medical oversight of people who are supported by Mainstay. We work to improve wellness, community
access, home quality, and safety. Quality oversight is a continual process. Our current medication error rate is less than .02%.
Mainstay Life Services currently provides support to 350 people with intellectual disabilities in Allegheny and surrounding counties. 150 of those are in our
Residential program and the rest are served through Community Services and Summer Camp. We look forward to expanding into employment supports and
continuing our commitment to those with Prader Willi Syndrome.

212
Interpreting the Data
These data will allow you to compare the average response
from this provider to the average response from all people
sampled in the state, region, and AE (when applicable).
Some differences are less meaningful than others,
depending on things like the size of the sample and the range
of answers provided for that particular scale. “Confidence
intervals” are used to determine whether differences are
statistically significant, or meaningful. Confidence intervals
are reported in parentheses.
To determine whether the average score of the provider is
meaningfully different from the averages of the state,
region, or AE, you can look at whether these scores fall
outside or inside the provider’s confidence interval.
Meaningful differences are marked with an asterisk “*”.
Summary of Findings
• The provider scores significantly below average for the
region on Individual Choice
• The provider scores significantly below average for the
state and region on Individual Inclusion
• The provider scores significantly below average for the
state and region on Individual Dignity
• The provider scores significantly above average for the
state and region on Physical Quality
Provider Profiles Data Display: Mainstay Life Services (Statewide) 2016-2017
Of the 5,328 individuals in the 2017 IM4Q data file, 21 individuals registered in Pennsylvania received residential services from Mainstay. The data in this profile
are for the provider’s community-based residential services. This report presents the scale scores for the State, the Western Region and Mainstay (Statewide).
There must be data for 10 or more individuals to meet our selection criteria for reporting. If the number of respondents for any item falls below 5, a dash (-) is
shown. For all of the scale scores, a higher score is better and the scores can range from 0 to 100. Confidence intervals for provider scores are given. Link to
explanation of items in scales is below.
* indicates meaningful difference
Link to explanation of the questions in each scale Above average marked by
SCALES State West Mainstay
Individual Satisfaction 85.87 85.05 85.20 (79.19 – 91.20)
Individual Choice 46.90 49.35* 40.99 (33.35 – 48.63)
Individual Inclusion 43.72* 43.58* 35.87 (30.77 – 40.98)
Individual Dignity 82.28* 80.22* 74.11 (68.68 – 79.53)
Physical Quality 96.92* 97.13* 100.00 (100.00 – 100.00)
Family Satisfaction 90.54 91.79 -
86
47 44
82
9791
85
4944
80
9792
85
4136
74
100
0
20
40
60
80
100
120
SATISFACTION CHOICE INCLUSION DIGNITY PHYS QUAL FAM SAT
Scale Scores for State, Region, Provider
State West Mainstay
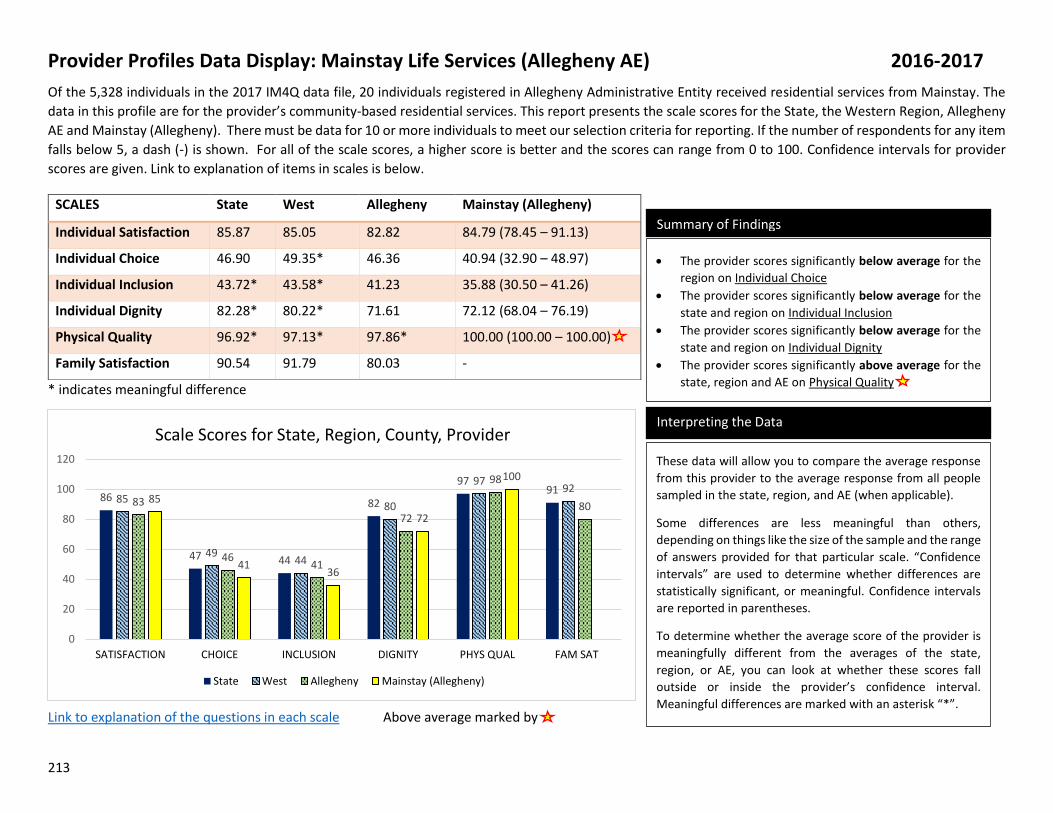
213
Interpreting the Data
These data will allow you to compare the average response
from this provider to the average response from all people
sampled in the state, region, and AE (when applicable).
Some differences are less meaningful than others,
depending on things like the size of the sample and the range
of answers provided for that particular scale. “Confidence
intervals” are used to determine whether differences are
statistically significant, or meaningful. Confidence intervals
are reported in parentheses.
To determine whether the average score of the provider is
meaningfully different from the averages of the state,
region, or AE, you can look at whether these scores fall
outside or inside the provider’s confidence interval.
Meaningful differences are marked with an asterisk “*”.
Summary of Findings
• The provider scores significantly below average for the
region on Individual Choice
• The provider scores significantly below average for the
state and region on Individual Inclusion
• The provider scores significantly below average for the
state and region on Individual Dignity
• The provider scores significantly above average for the
state, region and AE on Physical Quality
Provider Profiles Data Display: Mainstay Life Services (Allegheny AE) 2016-2017
Of the 5,328 individuals in the 2017 IM4Q data file, 20 individuals registered in Allegheny Administrative Entity received residential services from Mainstay. The
data in this profile are for the provider’s community-based residential services. This report presents the scale scores for the State, the Western Region, Allegheny
AE and Mainstay (Allegheny). There must be data for 10 or more individuals to meet our selection criteria for reporting. If the number of respondents for any item
falls below 5, a dash (-) is shown. For all of the scale scores, a higher score is better and the scores can range from 0 to 100. Confidence intervals for provider
scores are given. Link to explanation of items in scales is below.
* indicates meaningful difference
Link to explanation of the questions in each scale Above average marked by
SCALES State West Allegheny Mainstay (Allegheny)
Individual Satisfaction 85.87 85.05 82.82 84.79 (78.45 – 91.13)
Individual Choice 46.90 49.35* 46.36 40.94 (32.90 – 48.97)
Individual Inclusion 43.72* 43.58* 41.23 35.88 (30.50 – 41.26)
Individual Dignity 82.28* 80.22* 71.61 72.12 (68.04 – 76.19)
Physical Quality 96.92* 97.13* 97.86* 100.00 (100.00 – 100.00)
Family Satisfaction 90.54 91.79 80.03 -
86
47 44
82
9791
85
4944
80
9792
83
4641
72
98
8085
4136
72
100
0
20
40
60
80
100
120
SATISFACTION CHOICE INCLUSION DIGNITY PHYS QUAL FAM SAT
Scale Scores for State, Region, County, Provider
State West Allegheny Mainstay (Allegheny)

214
Provider Profile Summary: Maplewood Adult Day Center (Maplewood ADC) www.fccaa.org
Mission: Maplewood Adult Day Center offers a community-based program to enrich the lives of impaired and disabled adults, their families, and the community through specialized adult day services, education and support. This service enables participants to remain in the community, and allows families to continue caring for their loved ones at home, thus avoiding premature or inappropriate institutionalization Philosophy: Maplewood Adult Day Care will be a trusted provider on the forefront of accessible community-based care, education and support for adults in need, and their caregivers.
Guiding values: • Promote the individual’s maximum level of functioning for as long as possible. • Promote emotional, physical, and spiritual well-being.
• Provide respite, support, and education for the families and caregivers. • Maintain the participant in the community for as long as possible, avoiding premature or inappropriate institutionalization. • Serve as an integral part of the community service network in the continuum of care. • Provide the following principles: 1) Choice in all aspects of life 2) Control 3) Quality of life 4) Stability 5) Safety 6) Individuality 7) Strong relationships 8) Freedom to have the life they want
9) Success 10) Contributing to the community 11) Accountability 12) Mentoring 13) Collaboration 14) Community integration in all aspects of the person’s life.
Maplewood Adult Day Center has been supporting people with intellectual disabilities and/or autism for 2 years.
We offer Respite Care and Adult Day Center.
Staff are trained and review ISPs prior to working with individuals.
We communicate with staff/families when they pick up participants and make phone calls to discuss participant.
Quality improvement projects we are working on: 1. Client participation: we offer a variety of interest-based activities during small group. 2. Health and Wellness: we have an exercise program every day and have speakers that discuss the importance of eating well.
Maplewood ADC is open from 7a-6p. Every day we offer small group interested-based activities and whole group activities. The activities include: card club, dominoes, puzzle, photography, arts and crafts. We also have sport games including: horseshoes, bean bag toss, basketball shoot, and bowling. Each day, there are opportunities for socialization during morning and afternoon snack time, and throughout the day. Bingo is played 3 times a week at Maplewood ADC.

215
Provider Profile Summary: Martha Lloyd Community Residential Facility www.marthalloyd.org
Martha Lloyd will support people with disabilities to achieve independence and lead a fulfilled life. We strive to create an environment in which every person is
recognized for their value in the community and services meet the ever-changing needs of the individuals.
We Value the health and safety of all, the quality of people's lives, honesty and integrity, family and community, our employees, individual differences, teamwork
and professionals.
Martha Lloyd has been supporting people with Intellectual Disabilities and Autism since 1928 in rural Northeastern Pennsylvania.
We provide residential services both in group home settings and Life Sharing settings within the community. Here, individuals receive the supports they need to
live in their home and lead the life they choose. Our day programs provide a variety of activities based on the individual's personal desire.
We recognize that all individuals communicate in their own unique way. We are committed to understanding the people's mode of communication. All staff are
trained to develop relationships that aid in understanding the individual. Training on different modes of communication and assistive technologies to meet
individual needs is provided.
Martha Lloyd is active in the communities we serve. Through Community Mapping we have explored the resources in our communities that match the interest of
each individual. Staff support individuals to engage in community activities and build relationships within the community. We participate in local churches, service
organizations, libraries, businesses, other non-profits, recreational venues and continue to expand the options for those we serve.
Martha Lloyd recognizes the value of family involvement at all levels of the organization. Families are represented on our Board of Directors. An annual meeting
is a key information sharing event for our families and staff. Programming staff communicate regularly with many of our families and have developed a trusting
relationship with them. We believe a strong partnership with families benefits those we serve and is an asset to our programs.

216
Interpreting the Data
These data will allow you to compare the average response from this provider to the average response from all people sampled in the state, region, and AE (when applicable).
Some differences are less meaningful than others, depending on things like the size of the sample and the range of answers provided for that particular scale. “Confidence intervals” are used to determine whether differences are statistically significant, or meaningful. Confidence intervals are reported in parentheses.
To determine whether the average score of the provider is meaningfully different from the averages of the state, region, or AE, you can look at whether these scores fall outside or inside the provider’s confidence interval. Meaningful differences are marked with an asterisk “*”.
Summary of Findings
• The provider scores significantly above average for the
state on Individual Satisfaction
• The provider scores significantly below average for the
region on Individual Choice
• The provider scores significantly above average for the
state and region on Individual Dignity
• The provider scores significantly above average for the
state and region on Physical Quality
Provider Profiles Data Display: Martha Lloyd Community Residential Facility (Statewide) 2016-2017
Of the 5,328 individuals in the 2017 IM4Q data file, 18 individuals registered in Pennsylvania received residential services from Martha Lloyd. The data in this
profile are for the provider’s private ICF 16+ and community-based residential services. This report presents the scale scores for the State, the Northeast Region
and Martha Lloyd (Statewide). There must be data for 10 or more individuals to meet our selection criteria for reporting. If the number of respondents for any
item falls below 5, a dash (-) is shown. For all of the scale scores, a higher score is better and the scores can range from 0 to 100. Confidence intervals for provider
scores are given. Link to explanation of items in scales is below.
* indicates meaningful difference
Link to explanation of the questions in each scale Above average marked by
SCALES State NE Martha Lloyd
Individual Satisfaction 85.87* 89.11 93.63 (88.47 – 98.79)
Individual Choice 46.90 54.66* 43.85 (36.90 – 50.80)
Individual Inclusion 43.72 48.05 49.96 (43.38 – 56.55)
Individual Dignity 82.28* 88.82* 98.04 (95.81 – 100.00)
Physical Quality 96.92* 96.97* 100.00 (100.00 – 100.00)
Family Satisfaction 90.54 92.50 90.63 (77.49 – 100.00)
86
47 44
82
979189
5548
8997
9394
4450
98 10091
0
20
40
60
80
100
120
SATISFACTION CHOICE INCLUSION DIGNITY PHYS QUAL FAM SAT
Scale Scores for State, Region, Provider
State NE Martha Lloyd

217
Interpreting the Data
These data will allow you to compare the average response from this provider to the average response from all people sampled in the state, region, and AE (when applicable).
Some differences are less meaningful than others, depending on things like the size of the sample and the range of answers provided for that particular scale. “Confidence intervals” are used to determine whether differences are statistically significant, or meaningful. Confidence intervals are reported in parentheses.
To determine whether the average score of the provider is meaningfully different from the averages of the state, region, or AE, you can look at whether these scores fall outside or inside the provider’s confidence interval. Meaningful differences are marked with an asterisk “*”.
Summary of Findings
• The provider scores significantly below average for the
region and AE on Individual Choice
• The provider scores significantly above average for the
state, region and AE on Individual Dignity
• The provider scores significantly above average for the
state, region and AE on Physical Quality
Provider Profiles Data Display: Martha Lloyd Community Residential Facility (Tioga AE) 2016-2017
Of the 5,328 individuals in the 2017 IM4Q data file, 13 individuals registered in Tioga Administrative Entity received residential services from Martha Lloyd. The
data in this profile are for the provider’s community-based residential services. This report presents the scale scores for the State, the Northeast Region, Tioga AE
and Martha Lloyd (Tioga). There must be data for 10 or more individuals to meet our selection criteria for reporting. If the number of respondents for any item
falls below 5, a dash (-) is shown. For all of the scale scores, a higher score is better and the scores can range from 0 to 100. Confidence intervals for provider
scores are given. Link to explanation of items in scales is below.
* indicates meaningful difference
Link to explanation of the questions in each scale Above average marked by
SCALES State NE Tioga Martha Lloyd (Tioga)
Individual Satisfaction 85.87 89.11 90.66 92.31 (85.77 – 98.85)
Individual Choice 46.90 54.66* 56.56* 45.34 (37.68 – 53.00)
Individual Inclusion 43.72 48.05 50.51 48.21 (41.77 – 54.66)
Individual Dignity 82.28* 88.82* 91.33* 97.44 (94.58 – 100.00)
Physical Quality 96.92* 96.97* 98.61* 100.00 (100.00 – 100.00)
Family Satisfaction 90.54 92.50 95.95 -
86
47 44
82
979189
5548
8997
9391
5751
9199 96
92
45 48
97 100
0
20
40
60
80
100
120
SATISFACTION CHOICE INCLUSION DIGNITY PHYS QUAL FAM SAT
Scale Scores for State, Region, County, Provider
State NE Tioga Martha Lloyd (Tioga)

218
Provider Profile Summary: McGuire Memorial www.mcguirememorial.org
McGuire Memorial is committed to providing comprehensive services to people with mental/physical disabilities that may include complex medical conditions and
autism offering services to them and their families.
McGuire Memorial believes that the highest quality of care can only be achieved if our actions are consistent with the core values we profess. We believe in
Respect for Human Dignity, Compassion, Solidarity with the Poor, Justice, Peace and Transformation.
McGuire Memorial was established in 1963.
McGuire Memorial offers Licensed Residential Community Homes, Intermediate Care Residential Program for Person with Intellectual Disabilities (ICF/ID), Licensed
Adult Day Programs- Life Enrichment Adult Program (LEAP) and the Employment Option Center (EOC), Small Group Employment, Supported Employment, Behavior
Supports - Level 1, Communication Specialist and Supplemental Habilitation.
McGuire Memorial specializes in supports to individuals with multiple complex disabilities including medical concerns.
All staff receive direct training on the individual's communication supports initially upon hire and annually thereafter.
Individuals are supported in the community through outings, activities and recreational opportunities based on their interests, choices and desires in order to
maximize their community experiences.
McGuire Memorial has a Family Services Director who provides individualized direct support to families upon admission and as needed. We offer family
handicapped accessible vans for their use, on-going regular meetings, emails and phone calls as forms of on-going support.
McGuire Memorial has an active Quality Management program and committee. Members of the Quality Management committee are ODP certified quality
managers.
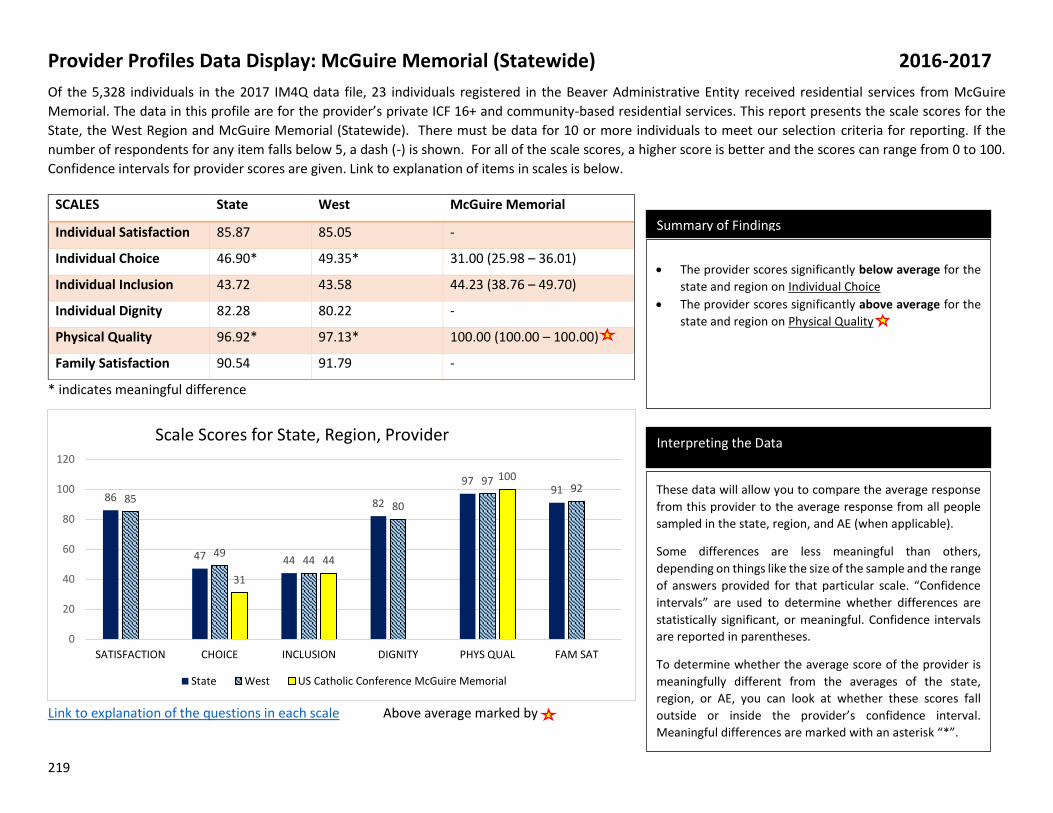
219
Interpreting the Data
These data will allow you to compare the average response
from this provider to the average response from all people
sampled in the state, region, and AE (when applicable).
Some differences are less meaningful than others,
depending on things like the size of the sample and the range
of answers provided for that particular scale. “Confidence
intervals” are used to determine whether differences are
statistically significant, or meaningful. Confidence intervals
are reported in parentheses.
To determine whether the average score of the provider is
meaningfully different from the averages of the state,
region, or AE, you can look at whether these scores fall
outside or inside the provider’s confidence interval.
Meaningful differences are marked with an asterisk “*”.
Summary of Findings
• The provider scores significantly below average for the
state and region on Individual Choice
• The provider scores significantly above average for the
state and region on Physical Quality
Provider Profiles Data Display: McGuire Memorial (Statewide) 2016-2017
Of the 5,328 individuals in the 2017 IM4Q data file, 23 individuals registered in the Beaver Administrative Entity received residential services from McGuire
Memorial. The data in this profile are for the provider’s private ICF 16+ and community-based residential services. This report presents the scale scores for the
State, the West Region and McGuire Memorial (Statewide). There must be data for 10 or more individuals to meet our selection criteria for reporting. If the
number of respondents for any item falls below 5, a dash (-) is shown. For all of the scale scores, a higher score is better and the scores can range from 0 to 100.
Confidence intervals for provider scores are given. Link to explanation of items in scales is below.
* indicates meaningful difference
Link to explanation of the questions in each scale Above average marked by
SCALES State West McGuire Memorial
Individual Satisfaction 85.87 85.05 -
Individual Choice 46.90* 49.35* 31.00 (25.98 – 36.01)
Individual Inclusion 43.72 43.58 44.23 (38.76 – 49.70)
Individual Dignity 82.28 80.22 -
Physical Quality 96.92* 97.13* 100.00 (100.00 – 100.00)
Family Satisfaction 90.54 91.79 -
86
47 44
82
9791
85
4944
80
9792
31
44
100
0
20
40
60
80
100
120
SATISFACTION CHOICE INCLUSION DIGNITY PHYS QUAL FAM SAT
Scale Scores for State, Region, Provider
State West US Catholic Conference McGuire Memorial

220
Interpreting the Data
These data will allow you to compare the average response
from this provider to the average response from all people
sampled in the state, region, and AE (when applicable).
Some differences are less meaningful than others,
depending on things like the size of the sample and the range
of answers provided for that particular scale. “Confidence
intervals” are used to determine whether differences are
statistically significant, or meaningful. Confidence intervals
are reported in parentheses.
To determine whether the average score of the provider is
meaningfully different from the averages of the state,
region, or AE, you can look at whether these scores fall
outside or inside the provider’s confidence interval.
Meaningful differences are marked with an asterisk “*”.
Summary of Findings
• The provider scores significantly below average for the
state, region and AE on Individual Choice
• The provider scores significantly above average for the
state and region on Individual Inclusion
• The provider scores significantly above average for the
state, region and AE on Physical Quality
Provider Profiles Data Display: McGuire Memorial (Beaver AE) 2016-2017
Of the 5,328 individuals in the 2017 IM4Q data file, 14 individuals registered in the Beaver Administrative Entity received residential services from McGuire
Memorial. The data in this profile are for the provider’s private ICF 16+ and community-based residential services. This report presents the scale scores for the
State, the West Region, Beaver AE and McGuire Memorial (Beaver). There must be data for 10 or more individuals to meet our selection criteria for reporting. If
the number of respondents for any item falls below 5, a dash (-) is shown. For all of the scale scores, a higher score is better and the scores can range from 0 to
100. Confidence intervals for provider scores are given. Link to explanation of items in scales is below.
* indicates meaningful difference
Link to explanation of the questions in each scale Above average marked by
SCALES State West Beaver McGuire Memorial (Beaver)
Individual Satisfaction 85.87 85.05 82.50 -
Individual Choice 46.90* 49.35* 49.42* 34.93 (27.17 – 42.69)
Individual Inclusion 43.72* 43.58* 52.64 49.91 (43.98 – 55.84)
Individual Dignity 82.28 80.22 91.58 -
Physical Quality 96.92* 97.13* 96.43* 100.00 (100.00 – 100.00)
Family Satisfaction 90.54 91.79 97.92 -
86
47 44
82
9791
85
4944
80
9792
83
4953
92 96 98
35
50
100
0
20
40
60
80
100
120
SATISFACTION CHOICE INCLUSION DIGNITY PHYS QUAL FAM SAT
Scale Scores for State, Region, County, Provider
State West Beaver US Catholic Conference McGuire Memorial (Beaver)

221
Provider Profile Summary: Melmark www.melmark.org
Melmark is a multi-state human service provider committed to enhancing the lives of individuals with autism, intellectual and developmental disabilities and their
families by providing exceptional evidence-based and applied behavior analytic services to every individual, every day. Melmark’s vision is to expand and raise the
quality of service delivery systems throughout the country by disseminating and replicating the Melmark Model of Program Development and Clinical Treatment.
We have been supporting individuals with disabilities since 1966. Our core values are as follows:
• Compassionate Care- Melmark provides a culture of ongoing care, support and respect for the individuals we serve, their families and our staff.
• Integrity in Everything We Do- Melmark consistently assesses the fidelity of organizational and staff systems to ensure educational and clinical
standards are achieved and maintained.
• Highly Skilled Workforce- Melmark applies performance-based training and professional growth opportunities to enhance the skill set for all staff.
• Evidence-based Practices- Melmark uses scientific evidence and performance data to inform all decision-making.
• Best Outcome- Melmark affects positive change in the quality of life of the individuals we serve by implementing data-driven trend analyses.
Melmark offers a full range of integrated programs and services for adults with autism spectrum disorders, intellectual disabilities, brain injuries, other neurological
and genetic disorders, and related challenging behaviors. Individuals served in our Adult programs range in ability and skill level, thus, our programs are
individualized to meet the unique needs and preferences of each individual. Our goal is to increase independence and enhance the quality of life for adults with
disabilities, by providing them meaningful work/program experience and opportunities to become contributing, socially connected members of their local
communities.
Beyond expertise in working with Adults with a diagnosis of Autism and IDD who have behavior support needs and who are medically compromised, Melmark also
offers creative programs such as The Joy-bells, The Melmark Traveling Art Show and The Melmark Players.
Communication needs for individuals are assessed through the ISP assessment process. Individualized goals are developed for needs identified and specific
alternative communication systems are provided. Staff are trained on how to run the goal and communicate with the individual effectively based on need.
Melmark engages families by ensuring on-going communication through weekly newsletters, annual family satisfaction surveys and family meetings. Our families
are invited and encouraged to partner with our caring and professional staff, and serve as equal members of the multi-disciplinary team.
Below are some Quality Improvement projects that Melmark has been working on based on analysis of data:
• Implementation of a new strategic plan which focuses on how to achieve a culture that reflects a mission-first organization, ensuring every individual we
serve receives the highest quality of service every day.
• Conducting year round mock surveys to improve compliance throughout the year
• Increasing community participation.
• Trend analysis of incidents and development of corrective action plans to reduce negative trends.
• Improving new hire and on-the-job training curriculum.
• Developing and implementing a comprehensive Emergency Preparedness Plan.
• Decreasing staff vacancies and increasing staff retention.
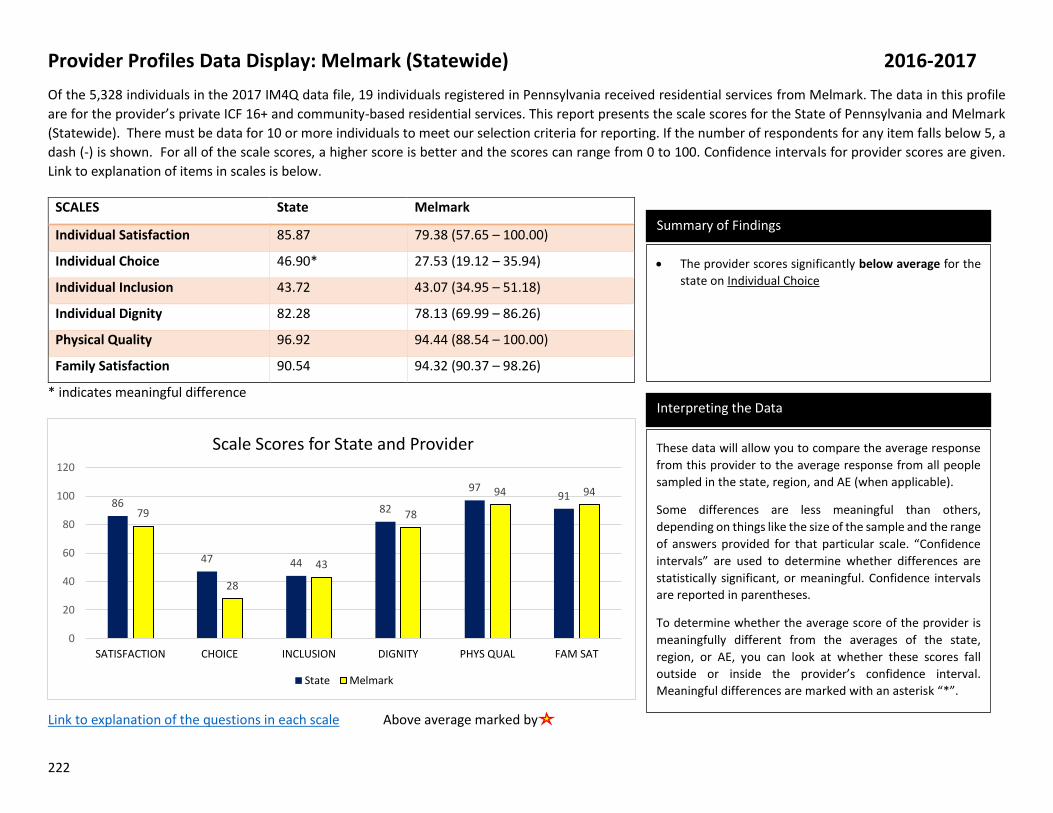
222
Interpreting the Data
These data will allow you to compare the average response
from this provider to the average response from all people
sampled in the state, region, and AE (when applicable).
Some differences are less meaningful than others,
depending on things like the size of the sample and the range
of answers provided for that particular scale. “Confidence
intervals” are used to determine whether differences are
statistically significant, or meaningful. Confidence intervals
are reported in parentheses.
To determine whether the average score of the provider is
meaningfully different from the averages of the state,
region, or AE, you can look at whether these scores fall
outside or inside the provider’s confidence interval.
Meaningful differences are marked with an asterisk “*”.
Summary of Findings
• The provider scores significantly below average for the
state on Individual Choice
Provider Profiles Data Display: Melmark (Statewide) 2016-2017
Of the 5,328 individuals in the 2017 IM4Q data file, 19 individuals registered in Pennsylvania received residential services from Melmark. The data in this profile
are for the provider’s private ICF 16+ and community-based residential services. This report presents the scale scores for the State of Pennsylvania and Melmark
(Statewide). There must be data for 10 or more individuals to meet our selection criteria for reporting. If the number of respondents for any item falls below 5, a
dash (-) is shown. For all of the scale scores, a higher score is better and the scores can range from 0 to 100. Confidence intervals for provider scores are given.
Link to explanation of items in scales is below.
* indicates meaningful difference
Link to explanation of the questions in each scale Above average marked by
SCALES State Melmark
Individual Satisfaction 85.87 79.38 (57.65 – 100.00)
Individual Choice 46.90* 27.53 (19.12 – 35.94)
Individual Inclusion 43.72 43.07 (34.95 – 51.18)
Individual Dignity 82.28 78.13 (69.99 – 86.26)
Physical Quality 96.92 94.44 (88.54 – 100.00)
Family Satisfaction 90.54 94.32 (90.37 – 98.26)
86
47 44
82
9791
79
28
43
78
94 94
0
20
40
60
80
100
120
SATISFACTION CHOICE INCLUSION DIGNITY PHYS QUAL FAM SAT
Scale Scores for State and Provider
State Melmark
223
Provider Profile Summary: Merakey www.merakey.org
Our mission is Enriching lives by providing exceptional services through an individualized approach. Creating communities where everyone is empowered to take
meaningful steps toward reaching their fullest potential. Our core values are Compassion, Diversity, Integrity, Quality, safety and trust.
Merakey was founded 49 years ago.
We provide an array of services to include: 1. Community Based service Support Employment: In this program we support individuals in developing the needed
skills to acquire and maintain employment in the community 2. Community Day Services supports each individual to participate in activities of their choice while
helping them to become active members of their community as well as the global community.
Behavioral Services provides the needed supports for the individuals, caregiver and staffing. The supports included a comprehensive Assessment, the development
of behavioral support plan that includes strategies and technique to support the needs of the individuals. The plans are continuously revised to meet the current
needs of the individuals.
Residential Services to include Community, Support living and Family living home. We also have a number of community and facility based Intermediate care
locations. We provide a number of Technology driving solutions in both our day and residential setting to include tablets and computers in our Day program to
help support individuals with communication skills. Residentially we have a number of Smart homes that include Remote patient supports and video Triage allowing
individuals to live more independently.
Merakey offers specialized services in the areas of technology driven solutions, In home supports and Competitive employment.
Merakey’ s goal is to create and maintain a nurturing, rewarding and productive environment within which all staff work in unison and focus all efforts on the
individuals we serve. For example, our innovative technology driven solutions help our staff members to communicate with individuals they support by teaching
them how to use communications, including laptop and other devices appropriately and effectively.
Merakey services are aimed at partnering with individuals as they become self-sufficient and live everyday lives. Merakey focuses on helping individuals find
meaningful roles in their community and to feel valued as community members. Individuals are always at the core of planning and implementation of services to
ensure they are engaged and that they feel valued as contributing members of the community.
Similar to individuals being involved in the planning and implementation of services, families and other important people in their lives have a significant role in
their loved one’s support. Families and others identified by our individuals are updated on a regular basis and are welcome to participate in program activities and
events.

224
Interpreting the Data
These data will allow you to compare the average response
from this provider to the average response from all people
sampled in the state, region, and AE (when applicable).
Some differences are less meaningful than others,
depending on things like the size of the sample and the range
of answers provided for that particular scale. “Confidence
intervals” are used to determine whether differences are
statistically significant, or meaningful. Confidence intervals
are reported in parentheses.
To determine whether the average score of the provider is
meaningfully different from the averages of the state,
region, or AE, you can look at whether these scores fall
outside or inside the provider’s confidence interval.
Meaningful differences are marked with an asterisk “*”.
Summary of Findings
• The provider scores significantly below average for the
state on Individual Choice
• The provider scores significantly below average for the
state on Individual Inclusion
• The provider scores significantly below average for the
state on Individual Dignity
• The provider scores significantly above average for the
state on Physical Quality
Provider Profiles Data Display: Merakey (Statewide) 2016-2017
Of the 5,328 individuals in the 2017 IM4Q data file, 364 individuals registered in Pennsylvania received residential services from Merakey. The data in this profile
are for the provider’s private ICF 16+, large campus 16+ and community-based residential services. This report presents the scale scores for the State of
Pennsylvania and Merakey (Statewide). There must be data for 10 or more individuals to meet our selection criteria for reporting. If the number of respondents
for any item falls below 5, a dash (-) is shown. For all of the scale scores, a higher score is better and the scores can range from 0 to 100. Confidence intervals for
provider scores are given. Link to explanation of items in scales is below.
* indicates meaningful difference
Link to explanation of the questions in each scale Above average marked by
SCALES State Merakey
Individual Satisfaction 85.87 84.47 (80.99 – 87.94)
Individual Choice 46.90* 33.07 (30.96 – 35.18)
Individual Inclusion 43.72* 37.11 (35.37 – 38.85)
Individual Dignity 82.28* 76.29 (74.00 – 78.58)
Physical Quality 96.92* 98.22 (97.41 – 99.02)
Family Satisfaction 90.54 86.60 (82.63 – 90.57)
86
47 44
82
9791
84
3337
76
98
87
0
20
40
60
80
100
120
SATISFACTION CHOICE INCLUSION DIGNITY PHYS QUAL FAM SAT
Scale Scores for State and Provider
State Merakey
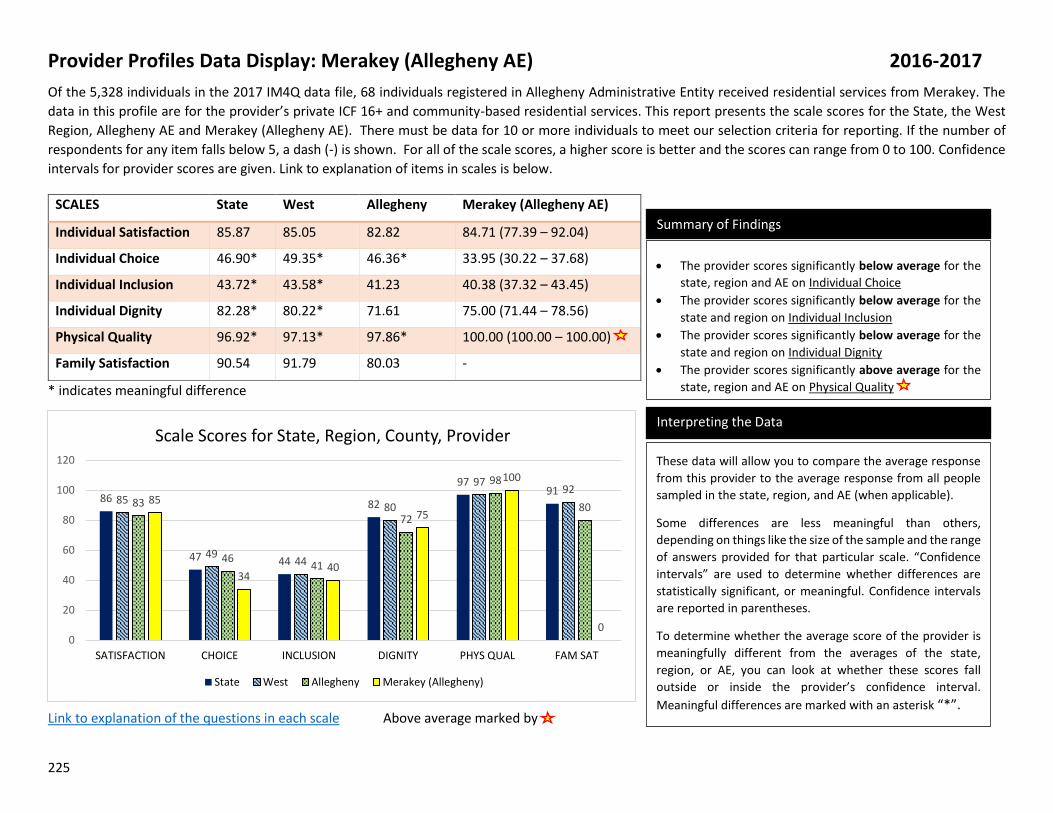
225
Interpreting the Data
These data will allow you to compare the average response
from this provider to the average response from all people
sampled in the state, region, and AE (when applicable).
Some differences are less meaningful than others,
depending on things like the size of the sample and the range
of answers provided for that particular scale. “Confidence
intervals” are used to determine whether differences are
statistically significant, or meaningful. Confidence intervals
are reported in parentheses.
To determine whether the average score of the provider is
meaningfully different from the averages of the state,
region, or AE, you can look at whether these scores fall
outside or inside the provider’s confidence interval.
Meaningful differences are marked with an asterisk “*”.
Summary of Findings
• The provider scores significantly below average for the
state, region and AE on Individual Choice
• The provider scores significantly below average for the
state and region on Individual Inclusion
• The provider scores significantly below average for the
state and region on Individual Dignity
• The provider scores significantly above average for the
state, region and AE on Physical Quality
Provider Profiles Data Display: Merakey (Allegheny AE) 2016-2017
Of the 5,328 individuals in the 2017 IM4Q data file, 68 individuals registered in Allegheny Administrative Entity received residential services from Merakey. The
data in this profile are for the provider’s private ICF 16+ and community-based residential services. This report presents the scale scores for the State, the West
Region, Allegheny AE and Merakey (Allegheny AE). There must be data for 10 or more individuals to meet our selection criteria for reporting. If the number of
respondents for any item falls below 5, a dash (-) is shown. For all of the scale scores, a higher score is better and the scores can range from 0 to 100. Confidence
intervals for provider scores are given. Link to explanation of items in scales is below.
* indicates meaningful difference
Link to explanation of the questions in each scale Above average marked by
SCALES State West Allegheny Merakey (Allegheny AE)
Individual Satisfaction 85.87 85.05 82.82 84.71 (77.39 – 92.04)
Individual Choice 46.90* 49.35* 46.36* 33.95 (30.22 – 37.68)
Individual Inclusion 43.72* 43.58* 41.23 40.38 (37.32 – 43.45)
Individual Dignity 82.28* 80.22* 71.61 75.00 (71.44 – 78.56)
Physical Quality 96.92* 97.13* 97.86* 100.00 (100.00 – 100.00)
Family Satisfaction 90.54 91.79 80.03 -
86
47 44
82
9791
85
4944
80
9792
83
4641
72
98
8085
3440
75
100
00
20
40
60
80
100
120
SATISFACTION CHOICE INCLUSION DIGNITY PHYS QUAL FAM SAT
Scale Scores for State, Region, County, Provider
State West Allegheny Merakey (Allegheny)

226
Interpreting the Data
These data will allow you to compare the average response
from this provider to the average response from all people
sampled in the state, region, and AE (when applicable).
Some differences are less meaningful than others,
depending on things like the size of the sample and the range
of answers provided for that particular scale. “Confidence
intervals” are used to determine whether differences are
statistically significant, or meaningful. Confidence intervals
are reported in parentheses.
To determine whether the average score of the provider is
meaningfully different from the averages of the state,
region, or AE, you can look at whether these scores fall
outside or inside the provider’s confidence interval.
Meaningful differences are marked with an asterisk “*”.
Summary of Findings
• The provider scores significantly below average for the
state on Individual Choice
• The provider scores significantly below average for the
state and AE on Individual Inclusion
Provider Profiles Data Display: Merakey (Bucks AE) 2016-2017
Of the 5,328 individuals in the 2017 IM4Q data file, 10 individuals registered in Bucks Administrative Entity received residential services from Merakey. The data
in this profile are for the provider’s private ICF 16+, large campus 16+ and community-based residential services. This report presents the scale scores for the State,
the Southeast Region, Bucks AE and Merakey (Bucks). There must be data for 10 or more individuals to meet our selection criteria for reporting. If the number of
respondents for any item falls below 5, a dash (-) is shown. For all of the scale scores, a higher score is better and the scores can range from 0 to 100. Confidence
intervals for provider scores are given. Link to explanation of items in scales is below.
* indicates meaningful difference
Link to explanation of the questions in each scale Above average marked by
SCALES State Southeast Bucks Merakey (Bucks)
Individual Satisfaction 85.87 82.83 88.30 -
Individual Choice 46.90* 37.62 42.48 34.85 (23.03 – 46.66)
Individual Inclusion 43.72* 39.99 44.63* 33.21 (23.03 – 43.39)
Individual Dignity 82.28 79.12 87.25 -
Physical Quality 96.92 96.57 96.25 83.33 (68.72 – 97.94)
Family Satisfaction 90.54 87.82 91.10 87.15 (76.19 – 98.12)
86
47 44
82
9791
83
38 40
79
978888
42 45
8796
91
0
35 33
0
8387
0
20
40
60
80
100
120
SATISFACTION CHOICE INCLUSION DIGNITY PHYS QUAL FAM SAT
Scale Scores for State, Region, County, Provider
State SE Bucks Merakey (Bucks)
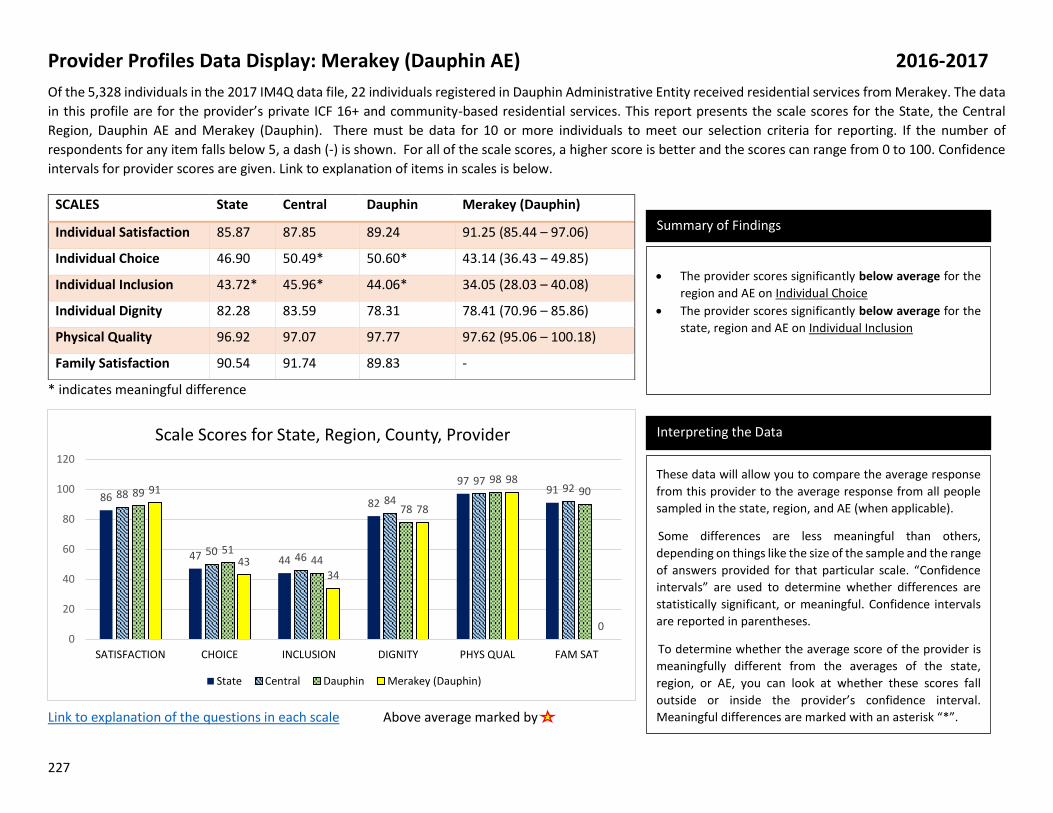
227
Interpreting the Data
These data will allow you to compare the average response
from this provider to the average response from all people
sampled in the state, region, and AE (when applicable).
Some differences are less meaningful than others,
depending on things like the size of the sample and the range
of answers provided for that particular scale. “Confidence
intervals” are used to determine whether differences are
statistically significant, or meaningful. Confidence intervals
are reported in parentheses.
To determine whether the average score of the provider is
meaningfully different from the averages of the state,
region, or AE, you can look at whether these scores fall
outside or inside the provider’s confidence interval.
Meaningful differences are marked with an asterisk “*”.
Summary of Findings
• The provider scores significantly below average for the
region and AE on Individual Choice
• The provider scores significantly below average for the
state, region and AE on Individual Inclusion
Provider Profiles Data Display: Merakey (Dauphin AE) 2016-2017
Of the 5,328 individuals in the 2017 IM4Q data file, 22 individuals registered in Dauphin Administrative Entity received residential services from Merakey. The data
in this profile are for the provider’s private ICF 16+ and community-based residential services. This report presents the scale scores for the State, the Central
Region, Dauphin AE and Merakey (Dauphin). There must be data for 10 or more individuals to meet our selection criteria for reporting. If the number of
respondents for any item falls below 5, a dash (-) is shown. For all of the scale scores, a higher score is better and the scores can range from 0 to 100. Confidence
intervals for provider scores are given. Link to explanation of items in scales is below.
* indicates meaningful difference
Link to explanation of the questions in each scale Above average marked by
SCALES State Central Dauphin Merakey (Dauphin)
Individual Satisfaction 85.87 87.85 89.24 91.25 (85.44 – 97.06)
Individual Choice 46.90 50.49* 50.60* 43.14 (36.43 – 49.85)
Individual Inclusion 43.72* 45.96* 44.06* 34.05 (28.03 – 40.08)
Individual Dignity 82.28 83.59 78.31 78.41 (70.96 – 85.86)
Physical Quality 96.92 97.07 97.77 97.62 (95.06 – 100.18)
Family Satisfaction 90.54 91.74 89.83 -
86
47 44
82
979188
50 46
84
979289
5144
78
989091
4334
78
98
00
20
40
60
80
100
120
SATISFACTION CHOICE INCLUSION DIGNITY PHYS QUAL FAM SAT
Scale Scores for State, Region, County, Provider
State Central Dauphin Merakey (Dauphin)

228
Interpreting the Data
These data will allow you to compare the average response
from this provider to the average response from all people
sampled in the state, region, and AE (when applicable).
Some differences are less meaningful than others,
depending on things like the size of the sample and the range
of answers provided for that particular scale. “Confidence
intervals” are used to determine whether differences are
statistically significant, or meaningful. Confidence intervals
are reported in parentheses.
To determine whether the average score of the provider is
meaningfully different from the averages of the state,
region, or AE, you can look at whether these scores fall
outside or inside the provider’s confidence interval.
Meaningful differences are marked with an asterisk “*”.
Summary of Findings
• The provider scores significantly below average for the
state, region and the AE on Individual Choice
• The provider scores significantly below average for the
state and region on Individual Inclusion
Provider Profiles Data Display: Merakey (Delaware AE) 2016-2017
Of the 5,328 individuals in the 2017 IM4Q data file, 14 individuals registered in Delaware Administrative Entity received residential services from Merakey. The
data in this profile are for the provider’s private ICF 16+ and community-based residential services. This report presents the scale scores for the State, the Southeast
Region, Delaware AE and Merakey (Delaware). There must be data for 10 or more individuals to meet our selection criteria for reporting. If the number of
respondents for any item falls below 5, a dash (-) is shown. For all of the scale scores, a higher score is better and the scores can range from 0 to 100. Confidence
intervals for provider scores are given. Link to explanation of items in scales is below.
* indicates meaningful difference
Link to explanation of the questions in each scale Above average marked by
SCALES State Southeast Delaware Merakey (Delaware)
Individual Satisfaction 85.87 82.83 85.90 -
Individual Choice 46.90* 37.62* 31.93* 21.16 (11.41 – 30.91)
Individual Inclusion 43.72* 39.99* 35.43 31.24 (24.90 – 37.58)
Individual Dignity 82.28 79.12 82.56 -
Physical Quality 96.92 96.57 96.98 97.62 (94.45 – 100.79)
Family Satisfaction 90.54 87.82 86.86 82.84 (70.60 – 95.07)
86
47 44
82
9791
83
38 40
79
978886
32 35
83
97
87
0
21
31
0
98
83
0
20
40
60
80
100
120
SATISFACTION CHOICE INCLUSION DIGNITY PHYS QUAL FAM SAT
Scale Scores for State, Region, County, Provider
State SE Delaware Merakey (Delaware)

229
Interpreting the Data
These data will allow you to compare the average response
from this provider to the average response from all people
sampled in the state, region, and AE (when applicable).
Some differences are less meaningful than others,
depending on things like the size of the sample and the range
of answers provided for that particular scale. “Confidence
intervals” are used to determine whether differences are
statistically significant, or meaningful. Confidence intervals
are reported in parentheses.
To determine whether the average score of the provider is
meaningfully different from the averages of the state,
region, or AE, you can look at whether these scores fall
outside or inside the provider’s confidence interval.
Meaningful differences are marked with an asterisk “*”.
Summary of Findings
• The provider scores significantly below average for the
state, region and the AE on Individual Choice
• The provider scores significantly below average for the
state, region and the AE on Individual Inclusion
• The provider scores significantly below average for the
state and region in Individual Dignity
• The provider scores significantly above average for the
state, region and the AE on Physical Quality
• The provider scores significantly below average for the
state on Family Satisfaction
Provider Profiles Data Display: Merakey (Philadelphia AE) 2016-2017
Of the 5,328 individuals in the 2017 IM4Q data file, 185 individuals registered in Philadelphia Administrative Entity received residential services from Merakey.
The data in this profile are for the provider’s private ICF 16+ and community-based residential services. This report presents the scale scores for the State, the
Southeast Region, Philadelphia AE and Merakey (Philadelphia). There must be data for 10 or more individuals to meet our selection criteria for reporting. If the
number of respondents for any item falls below 5, a dash (-) is shown. For all of the scale scores, a higher score is better and the scores can range from 0 to 100.
Confidence intervals for provider scores are given. Link to explanation of items in scales is below.
* indicates meaningful difference
Link to explanation of the questions in each scale Above average marked by
SCALES State Southeast Philadelphia Merakey (Philadelphia)
Individual Satisfaction 85.87 82.83 80.53 80.75 (74.76 – 86.74)
Individual Choice 46.90* 37.62* 39.13* 29.41 (26.29 – 32.52)
Individual Inclusion 43.72* 39.99* 39.85* 34.54 (31.86 – 37.21)
Individual Dignity 82.28* 79.12* 75.18 73.80 (69.94 – 77.65)
Physical Quality 96.92* 96.57* 96.97* 98.50 (97.68 – 99.33)
Family Satisfaction 90.54* 87.82 86.91 84.09 (78.48 – 89.70)
86
47 44
82
9791
83
38 40
79
9788
81
39 40
75
97
8781
2935
74
99
84
0
20
40
60
80
100
120
SATISFACTION CHOICE INCLUSION DIGNITY PHYS QUAL FAM SAT
Scale Scores for State, Region, County, Provider
State SE Philadelphia Merakey (Philadelphia)
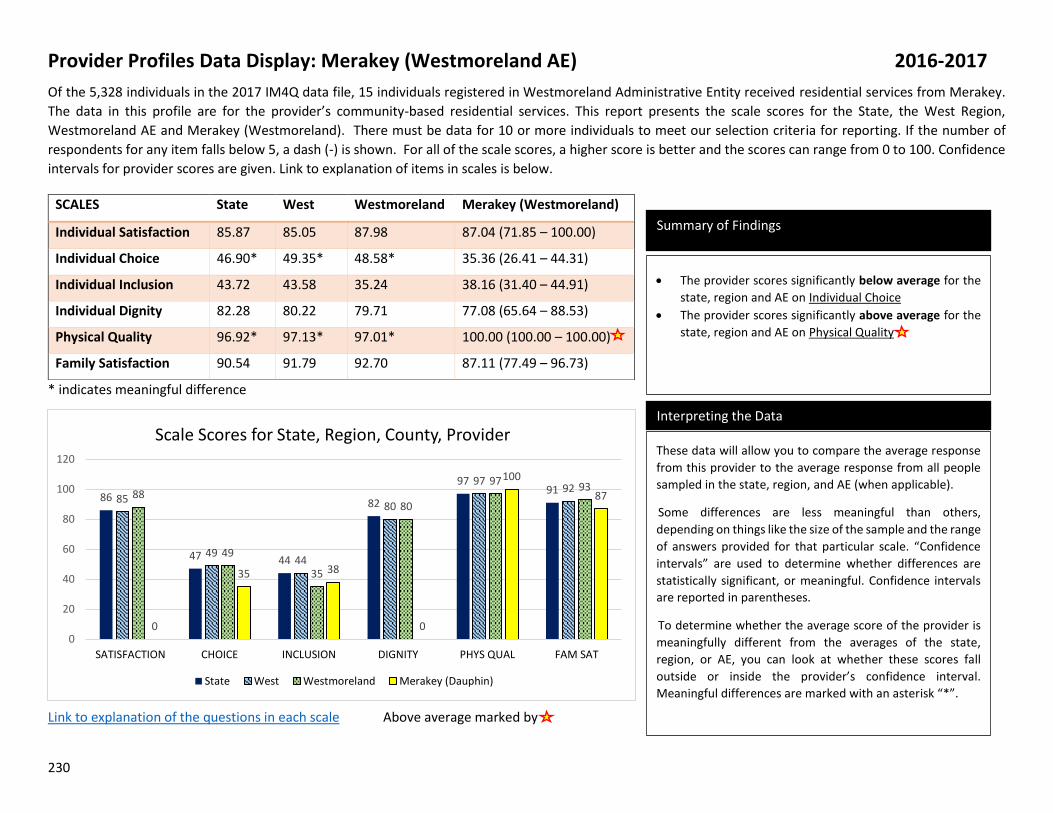
230
Interpreting the Data
These data will allow you to compare the average response
from this provider to the average response from all people
sampled in the state, region, and AE (when applicable).
Some differences are less meaningful than others,
depending on things like the size of the sample and the range
of answers provided for that particular scale. “Confidence
intervals” are used to determine whether differences are
statistically significant, or meaningful. Confidence intervals
are reported in parentheses.
To determine whether the average score of the provider is
meaningfully different from the averages of the state,
region, or AE, you can look at whether these scores fall
outside or inside the provider’s confidence interval.
Meaningful differences are marked with an asterisk “*”.
Summary of Findings
• The provider scores significantly below average for the
state, region and AE on Individual Choice
• The provider scores significantly above average for the
state, region and AE on Physical Quality
Provider Profiles Data Display: Merakey (Westmoreland AE) 2016-2017
Of the 5,328 individuals in the 2017 IM4Q data file, 15 individuals registered in Westmoreland Administrative Entity received residential services from Merakey.
The data in this profile are for the provider’s community-based residential services. This report presents the scale scores for the State, the West Region,
Westmoreland AE and Merakey (Westmoreland). There must be data for 10 or more individuals to meet our selection criteria for reporting. If the number of
respondents for any item falls below 5, a dash (-) is shown. For all of the scale scores, a higher score is better and the scores can range from 0 to 100. Confidence
intervals for provider scores are given. Link to explanation of items in scales is below.
* indicates meaningful difference
Link to explanation of the questions in each scale Above average marked by
SCALES State West Westmoreland Merakey (Westmoreland)
Individual Satisfaction 85.87 85.05 87.98 87.04 (71.85 – 100.00)
Individual Choice 46.90* 49.35* 48.58* 35.36 (26.41 – 44.31)
Individual Inclusion 43.72 43.58 35.24 38.16 (31.40 – 44.91)
Individual Dignity 82.28 80.22 79.71 77.08 (65.64 – 88.53)
Physical Quality 96.92* 97.13* 97.01* 100.00 (100.00 – 100.00)
Family Satisfaction 90.54 91.79 92.70 87.11 (77.49 – 96.73)
86
47 44
82
9791
85
4944
80
9792
88
49
35
80
9793
0
35 38
0
100
87
0
20
40
60
80
100
120
SATISFACTION CHOICE INCLUSION DIGNITY PHYS QUAL FAM SAT
Scale Scores for State, Region, County, Provider
State West Westmoreland Merakey (Dauphin)

231
Provider Profile Summary: Milestone Centers www.milestonepa.org
Milestone Centers, Inc. provides quality, life-enhancing services that promote wellness and the development of human potential to persons with intellectual and
developmental disabilities and/or behavioral health challenges.
Milestone acknowledges the dignity of all people and is dedicated to serving our community with integrity, respect and compassion and we work toward a future
where persons with any level of disability or challenge are recognized as equal contributors toward the good of society.
Milestone (formerly Allegheny East MH/MR Center) has been supporting the needs of individuals with behavioral health challenges and intellectual and
developmental disabilities in communities throughout Western Pennsylvania since 1969.
Milestone provides a full array of Home and Community Based Services to individuals with intellectual and developmental disabilities, including Residential homes,
Life Sharing arrangements, In-Home & Community Supports, Community Participation Supports (through licensed Adult Day programs, Senior Adult Day programs
and a Pre-Vocational program) and Small Group (Transitional) Employment and Supported Employment Services.
Milestone is a trauma-informed organization certified in using the Sanctuary Model. We also provide Behavioral Health Services such as Psychiatry, Outpatient
Therapy and Social Rehabilitation along with specialized Behavioral Health supports to the IDD population and the Deaf population.
All staff are trained to work with each individual we serve according to the individual's needs (including communication needs and preferences) as defined in the
Individual Support Plan (ISP). When needed, we will facilitate additional training for an individual's primary staff, such as with specific communication technology
and/or in sign language.
Our Direct Support Professionals are provided with ongoing training and development, utilizing information and materials from the Office of Developmental
Programs, to support clients to access their communities and in fostering relationships with people without disabilities and with people who are not paid to support
them in those communities. In each of our six-day programs that provide Community Participation Supports, we have Community Participation Specialists who
coordinate our outreach and engagement efforts in the community. We assist with and provide transportation and find creative solutions to challenges in order
to ensure all individuals can access the community in the ways they choose based on their interests and preferences.
Families are an important part of the individual's team and are included in all goal planning and treatment discussions and decisions. Our In-Home & Community
Supports program provides direct support to families through services such as Companion and Respite.
In 2018, we created two new positions: Director of Program Improvement and Director of Risk/Incident Management and these two Directors, together with the
Director of Systems Compliance, are responsible for the coordination and implementation of our Quality Management Plan. Through that plan, we are currently
focused on increasing community participation, employment and community living while also promoting the health and safety of everyone receiving and providing
our services. We analyze all accidents and incidents to determine the root causes so that we can develop effective preventative and corrective action plans.

232
Interpreting the Data
These data will allow you to compare the average response
from this provider to the average response from all people
sampled in the state, region, and AE (when applicable).
Some differences are less meaningful than others,
depending on things like the size of the sample and the range
of answers provided for that particular scale. “Confidence
intervals” are used to determine whether differences are
statistically significant, or meaningful. Confidence intervals
are reported in parentheses.
To determine whether the average score of the provider is
meaningfully different from the averages of the state,
region, or AE, you can look at whether these scores fall
outside or inside the provider’s confidence interval.
Meaningful differences are marked with an asterisk “*”.
Summary of Findings
• The provider scores significantly below average for the
state and region on Individual Dignity
• The provider scores significantly above average for the
state and region on Physical Quality
Provider Profiles Data Display: Milestone Centers (Statewide) 2016-2017
Of the 5,328 individuals in the 2017 IM4Q data file, 14 individuals registered in Pennsylvania received residential services from Milestone. The data in this profile
are for the provider’s community-based residential services. This report presents the scale scores for the State, the Western Region and Milestone (Statewide).
There must be data for 10 or more individuals to meet our selection criteria for reporting. If the number of respondents for any item falls below 5, a dash (-) is
shown. For all of the scale scores, a higher score is better and the scores can range from 0 to 100. Confidence intervals for provider scores are given. Link to
explanation of items in scales is below.
* indicates meaningful difference
Link to explanation of the questions in each scale Above average marked by
SCALES State West Milestone
Individual Satisfaction 85.87 85.05 92.38 (84.45 – 100.00)
Individual Choice 46.90 49.35 51.35 (41.41 – 61.29)
Individual Inclusion 43.72 43.58 45.04 (34.26 – 55.82)
Individual Dignity 82.28* 80.22* 76.19 (73.86 – 78.52)
Physical Quality 96.92* 97.13* 100.00 (100.00 – 100.00)
Family Satisfaction 90.54 91.79 -
86
47 44
82
9791
85
4944
80
979292
5145
76
100
0
20
40
60
80
100
120
SATISFACTION CHOICE INCLUSION DIGNITY PHYS QUAL FAM SAT
Scale Scores for State, Region, Provider
State West Milestone

233
Interpreting the Data
These data will allow you to compare the average response
from this provider to the average response from all people
sampled in the state, region, and AE (when applicable).
Some differences are less meaningful than others,
depending on things like the size of the sample and the range
of answers provided for that particular scale. “Confidence
intervals” are used to determine whether differences are
statistically significant, or meaningful. Confidence intervals
are reported in parentheses.
To determine whether the average score of the provider is
meaningfully different from the averages of the state,
region, or AE, you can look at whether these scores fall
outside or inside the provider’s confidence interval.
Meaningful differences are marked with an asterisk “*”.
Summary of Findings
• The provider scores significantly above average for the
AE on Individual Satisfaction
• The provider scores significantly below average for the
state and region on Individual Dignity
• The provider scores significantly above average for the
state, region and AE on Physical Quality
Provider Profiles Data Display: Milestone Centers (Allegheny AE) 2016-2017
Of the 5,328 individuals in the 2017 IM4Q data file, 13 individuals registered in Allegheny Administrative Entity received residential services from Milestone. The
data in this profile are for the provider’s community-based residential services. This report presents the scale scores for the State, the Western Region, Allegheny
AE and Milestone (Allegheny). There must be data for 10 or more individuals to meet our selection criteria for reporting. If the number of respondents for any
item falls below 5, a dash (-) is shown. For all of the scale scores, a higher score is better and the scores can range from 0 to 100. Confidence intervals for provider
scores are given. Link to explanation of items in scales is below.
* indicates meaningful difference
Link to explanation of the questions in each scale Above average marked by
SCALES State West Allegheny Milestone (Allegheny)
Individual Satisfaction 85.87 85.05 82.82* 92.38 (84.45 – 100.00)
Individual Choice 46.90 49.35 46.36 52.79 (42.35 – 63.23)
Individual Inclusion 43.72 43.58 41.23 45.94 (34.46 – 57.42)
Individual Dignity 82.28* 80.22* 71.61 76.19 (73.86 – 78.52)
Physical Quality 96.92* 97.13* 97.86* 100.00 (100.00 – 100.00)
Family Satisfaction 90.54 91.79 80.03 -
86
47 44
82
9791
85
4944
80
9792
83
4641
72
98
80
92
5346
76
100
0
20
40
60
80
100
120
SATISFACTION CHOICE INCLUSION DIGNITY PHYS QUAL FAM SAT
Scale Scores for State, Region, County, Provider
State West Allegheny Milestone (Allegheny)

234
Provider Profile Summary: Mon Yough Community Services www.mycs.org
At Mon Yough Community Services (MYCS), our mission is to foster hope, renewal, healing and wellness for those who face the challenges of mental health,
substance use, and intellectual disabilities.
Our vision is that our services will be relevant, effective, well-coordinated, and accessible. Our service values include: Hope, Choice, Connection, Respect, Diversity
and Partnering.
Since 1969, MYCS has served the community members of the McKeesport and Mon Valley area. We continue to provide critical services to those with mental
health and developmental disabilities, substance use and behavioral health issues, and those in need of training, employment and rehabilitation programs. Mon
Yough Community Services employees interact and serve nearly 6,000 individuals a year who are struggling with a variety of issues ranging from mental illness,
addiction and developmental challenges.
As a part of the UPMC Health System, MYCS provides a variety of community-based services including mental and behavioral health treatment, onsite behavioral
supports, case management services, developmental and intellectual disabilities living arrangements, semi-independent living, LifeSharing, vocational, community
participation supports, employment services and substance use treatment and prevention. Our comprehensive service continuum ranges from outpatient therapy
to residential services, vocational training and supported employment, to in-school prevention and treatment programs, to psychosocial rehabilitation. We work
with people where they are, geographically and emotionally.
MYCS actively participates in local and statewide initiatives, maintaining a constant emphasis on easy access and quality services for the people we serve. MYCS
provides expert counseling and recovery-based programs in Behavioral Health (including Mental Health and Addiction Treatment & Intervention) and Intellectual
and Developmental Disabilities.
We value continuing education for all staff and offer an extensive training curriculum to promote effective communication strategies for the people we support.
We are committed to offering individualized supports and services to encourage active participation and inclusion to live an everyday life. Activities may include
but are not limited to: community participation supports, volunteer experiences, employment and recreational activities. MYCS works closely with community
partners to offer a diverse range of activities and services.
Family engagement is a priority at MYCS. We encourage open communication and the understanding that family is an integral part of the team. MYCS promotes
family participation and recognizing the importance of their role in their loved one’s lives.
MYCS was founded on the belief that a community is only as strong as its members.
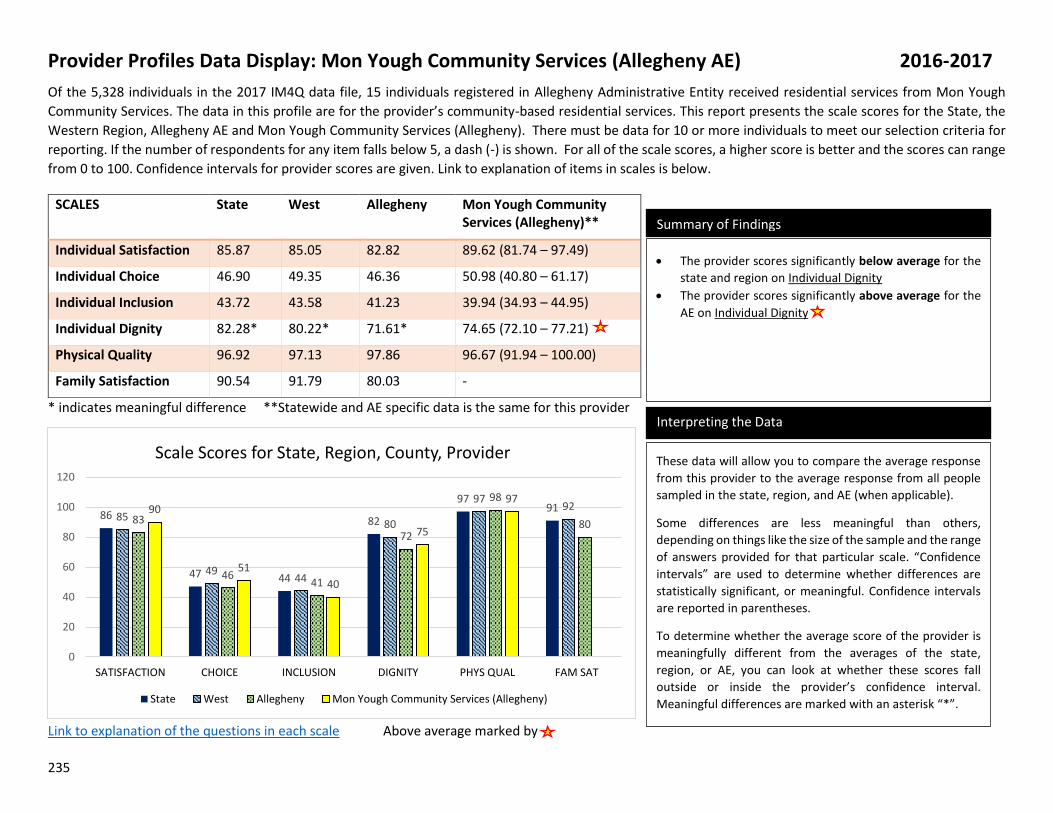
235
Interpreting the Data
These data will allow you to compare the average response
from this provider to the average response from all people
sampled in the state, region, and AE (when applicable).
Some differences are less meaningful than others,
depending on things like the size of the sample and the range
of answers provided for that particular scale. “Confidence
intervals” are used to determine whether differences are
statistically significant, or meaningful. Confidence intervals
are reported in parentheses.
To determine whether the average score of the provider is
meaningfully different from the averages of the state,
region, or AE, you can look at whether these scores fall
outside or inside the provider’s confidence interval.
Meaningful differences are marked with an asterisk “*”.
Summary of Findings
• The provider scores significantly below average for the
state and region on Individual Dignity
• The provider scores significantly above average for the
AE on Individual Dignity
Provider Profiles Data Display: Mon Yough Community Services (Allegheny AE) 2016-2017
Of the 5,328 individuals in the 2017 IM4Q data file, 15 individuals registered in Allegheny Administrative Entity received residential services from Mon Yough
Community Services. The data in this profile are for the provider’s community-based residential services. This report presents the scale scores for the State, the
Western Region, Allegheny AE and Mon Yough Community Services (Allegheny). There must be data for 10 or more individuals to meet our selection criteria for
reporting. If the number of respondents for any item falls below 5, a dash (-) is shown. For all of the scale scores, a higher score is better and the scores can range
from 0 to 100. Confidence intervals for provider scores are given. Link to explanation of items in scales is below.
* indicates meaningful difference **Statewide and AE specific data is the same for this provider
Link to explanation of the questions in each scale Above average marked by
SCALES State West Allegheny Mon Yough Community Services (Allegheny)**
Individual Satisfaction 85.87 85.05 82.82 89.62 (81.74 – 97.49)
Individual Choice 46.90 49.35 46.36 50.98 (40.80 – 61.17)
Individual Inclusion 43.72 43.58 41.23 39.94 (34.93 – 44.95)
Individual Dignity 82.28* 80.22* 71.61* 74.65 (72.10 – 77.21)
Physical Quality 96.92 97.13 97.86 96.67 (91.94 – 100.00)
Family Satisfaction 90.54 91.79 80.03 -
86
47 44
82
9791
85
4944
80
9792
83
4641
72
98
8090
51
40
75
97
0
20
40
60
80
100
120
SATISFACTION CHOICE INCLUSION DIGNITY PHYS QUAL FAM SAT
Scale Scores for State, Region, County, Provider
State West Allegheny Mon Yough Community Services (Allegheny)

236
Provider Profile Summary: National Mentor HealthCare www.thementornetwork.com
Pennsylvania Mentor is dedicated to offering individuals and their families innovative, quality services and supports that lead to growth and independence,
regardless of the physical, intellectual, or behavioral challenges they face. Our philosophy emphasizes partnerships-with those we serve, their families, our
employees, and the communities-in an effort to help people shape the direction of their own lives in community-based settings.
We believe that individuals of all abilities deserve the opportunity to realize their full potential through services and supports provided in their own communities.
We believe that positive, nurturing relationships are the basis for growth and change. These relationships are best fostered through active participation in the
daily activities of neighborhood and family life. We believe in the power of personal choice. Individuals have both the right and the responsibility to participate in
the process of selecting their own services and developing their own life goals.
Pennsylvania Mentor has been supporting people with intellectual disabilities and/or autism for over 30 years.
Pennsylvania Mentor provides supports and services in a variety of settings. We provide supports to individuals and their families in their own homes by providing
respite for caregivers, assistance in community integration and the development of skills necessary to foster independence. In our residential group homes, we
provide 24 hour supports to individuals in homes located in multiple neighborhood settings. We provide Life Sharing services to individuals who choose to live in
family settings rather than a more structured group home setting. Pennsylvania Mentor also provides structured day activities in a variety of locations in the
community as well as in a licensed setting. In addition, we provide behavior support services in certain geographic areas of the state.
Pennsylvania Mentor strives to be able to provide an array of services tailored to the individual being served. We are able to garner needed expertise from sister
agencies across the country when necessary to address complex support needs for a wide spectrum of individuals.
We believe the key to effective communication between staff and the individuals they support is relationship building. Relationship building is the foundation
upon which other aspects of communications is built upon. Once an effective relationship is formed, communication becomes easy regardless of the type of
communication used by the individual being supported.
We engage the people we support in the community by emphasizing personal choice and responsibility along with relationship building.
Families are a critical component of providing quality care and supports. Families can be invaluable assets in developing and providing supports to any person
receiving services and are treated as such.
We are currently implementing a variety of processes and procedures as a direct result of analyzing data related to satisfaction survey results which are conducted
with various stakeholders on an annual basis as well as incident patterns and trends. The efforts to improve the supports and services we provide by analyzing
data and developing comprehensive responses and program changes is ongoing.
Pennsylvania Mentor has the ability to leverage expertise and resources from a wide network of 'sister' agencies across the country.

237
Interpreting the Data
These data will allow you to compare the average response
from this provider to the average response from all people
sampled in the state, region, and AE (when applicable).
Some differences are less meaningful than others,
depending on things like the size of the sample and the range
of answers provided for that particular scale. “Confidence
intervals” are used to determine whether differences are
statistically significant, or meaningful. Confidence intervals
are reported in parentheses.
To determine whether the average score of the provider is
meaningfully different from the averages of the state,
region, or AE, you can look at whether these scores fall
outside or inside the provider’s confidence interval.
Meaningful differences are marked with an asterisk “*”.
Summary of Findings
• The provider scores significantly above average for the
state on Individual Inclusion
• The provider scores significantly below average for the
state on Individual Dignity
Provider Profiles Data Display: National Mentor HealthCare (Statewide) 2016-2017
Of the 5,328 individuals in the 2017 IM4Q data file, 13 individuals registered in Pennsylvania received residential services from National Mentor Healthcare. The
data in this profile are for the provider’s community-based residential services. This report presents the scale scores for the State of Pennsylvania and National
Mentor Healthcare (Statewide). There must be data for 10 or more individuals to meet our selection criteria for reporting. If the number of respondents for any
item falls below 5, a dash (-) is shown. For all of the scale scores, a higher score is better and the scores can range from 0 to 100. Confidence intervals for provider
scores are given. Link to explanation of items in scales is below.
* indicates meaningful difference
Link to explanation of the questions in each scale Above average marked by
SCALES State National Mentor Healthcare
Individual Satisfaction 85.87 90.14 (78.94 – 100.00)
Individual Choice 46.90 49.21 (38.05 – 60.37)
Individual Inclusion 43.72* 53.85 (46.36 – 61.33)
Individual Dignity 82.28* 74.58 (70.29 – 78.88)
Physical Quality 96.92 93.59 (84.89 – 100.00)
Family Satisfaction 90.54 -
86
47 44
82
979190
4954
75
94
0
20
40
60
80
100
120
SATISFACTION CHOICE INCLUSION DIGNITY PHYS QUAL FAM SAT
Scale Scores for State and Provider
State National Mentor Healthcare

238
Provider Profile Summary: New Horizon Care Services
The mission of New Horizon Care Services is to support individuals with intellectual disabilities and/or autism to achieve independence and create opportunities to continue an everyday life. Our goal is to commit to enhancing the quality of life of each client, and motivating growth to each of the clients we serve through support and independence. New Horizon Care Services passionately believes in the success of each individual and the abilities they possess. Through our array of services and personal empowerment, as well as a structured plan to help each individual one step at a time, we believe every individual can succeed at reaching their goals.
New Horizon Care Services vision is to provide choice to individuals with intellectual disabilities and/or autism, to view all life as having equal and unconditional value. Our motto is to help individuals with intellectual/developmental disabilities succeed in life one step at a time, at a pace that is comfortable for them. New Horizon Care Services values diversity, integrity, respect, courage, and compassion for those we serve and their families.
New Horizon Care Services has been supporting people with intellectual disabilities and/or autism since 2018.
We provide home and community-based supports. Services we offer are: Companion - It is provided to individuals with the purposes of providing supervision or assistance that is designed to ensure the individual’s health, safety and welfare, or to perform activities of daily living for the individual. Respite - These are services that are provided to supervise and support individuals living in one of our Residential Community Homes on a short-term basis for planned or emergency situations, giving the person(s) normally providing care, a period of relief that may be scheduled or due to an emergency. Home and Community Habilitation - provided in home and community settings to assist individuals in acquiring, retaining, and improving self-help, socialization, and adaptive skills. Residential Community Homes - Our homes are licensed and integrated within the community.
To ensure that staff can effectively communicate with those they support, the use of appropriate assistive technologies will be used. Strategies will also be developed to assist with communication needs. Staff working with individuals will receive training on these strategies as well as any additional training needed
We engage people that we support in the community by participating in activities of their choice, also introducing new unique community activities. Some of those activities include social dances, festivals, and Special Olympics. We are constantly striving to create opportunities for inclusion and growth.
We support the families of individuals that we serve through community and family outings, a listening ear, kind words, encouraging families to actively participate throughout their lifetime, and promote open communication with families.
As part of our quality management a variety of data is gathered and analyzed to determine areas needing improvement.

239
Provider Profile Summary: Oak Manor
Our goal is to support individuals with intellectual disabilities to achieve greater independence, choice, and opportunity in their lives. We will assist them according
to their needs in all aspects of daily life and make available to them the knowledge & skills of everyday life.
These services are provided in settings conducive to the dignity, health, safety and social well-being of each individual while supporting their rights, fostering their
strengths and ensuring comfort, peace and joy in their lives.
We opened our doors in March of 1975.
We provide Community Living homes where we provide assistance with all aspects of daily life.
We adjust our services to meet the needs of any individual we support.
We assist the individual according to their needs be it organizing outings, transportation, participation, etc.
We communicate with the families according to the wants and needs of the individual and the family.
We recently built an accessible home for some of our aging residents.

240
Interpreting the Data
These data will allow you to compare the average response
from this provider to the average response from all people
sampled in the state, region, and AE (when applicable).
Some differences are less meaningful than others,
depending on things like the size of the sample and the range
of answers provided for that particular scale. “Confidence
intervals” are used to determine whether differences are
statistically significant, or meaningful. Confidence intervals
are reported in parentheses.
To determine whether the average score of the provider is
meaningfully different from the averages of the state,
region, or AE, you can look at whether these scores fall
outside or inside the provider’s confidence interval.
Meaningful differences are marked with an asterisk “*”.
Summary of Findings
• The provider scores significantly above average for the
state and region on Individual Satisfaction
• The provider scores significantly above average for the
state, region and AE on Physical Quality
Provider Profiles Data Display: Oak Manor (Cameron/Elk AE) 2016-2017
Of the 5,328 individuals in the 2017 IM4Q data file, 11 individuals registered in Cameron/Elk Administrative Entity received residential services from Oak Manor.
The data in this profile are for the provider’s community-based residential services. This report presents the scale scores for the State, the Western Region,
Cameron/Elk AE and Oak Manor (Cameron/Elk). There must be data for 10 or more individuals to meet our selection criteria for reporting. If the number of
respondents for any item falls below 5, a dash (-) is shown. For all of the scale scores, a higher score is better and the scores can range from 0 to 100. Confidence
intervals for provider scores are given. Link to explanation of items in scales is below.
* indicates meaningful difference **Statewide and AE specific data is the same for this provider
Link to explanation of the questions in each scale Above average marked by
SCALES State West Cameron/Elk Oak Manor (Cameron/Elk)**
Individual Satisfaction 85.87* 85.05* 87.94 93.67 (86.48 – 100.00)
Individual Choice 46.90 49.35 57.32 52.51 (44.70 – 60.32)
Individual Inclusion 43.72 43.58 45.07 48.92 (41.82 – 56.02)
Individual Dignity 82.28 80.22 79.79 80.83 (74.25 – 87.41)
Physical Quality 96.92* 97.13* 99.33* 100.00 (100.00 – 100.00)
Family Satisfaction 90.54 91.79 97.06 -
86
47 44
82
9791
85
4944
80
9792
88
57
45
80
99 9794
5349
81
100
0
20
40
60
80
100
120
SATISFACTION CHOICE INCLUSION DIGNITY PHYS QUAL FAM SAT
Scale Scores for State, Region, County, Provider
State West Cameron/Elk Oak Manor (Cameron/Elk)

241
Provider Profile Summary: Overbrook Friedlander Programs
The Mission of the Overbrook Friedlander Programs (OFP) is to provide comprehensive day and residential programs for adults with intellectual disabilities who
are blind, visually impaired, or deafblind so that they actively participate in their community and have the supports needed for safe, healthy, and fulfilling lives.
We value each person we support and all the team members who support them. We believe a team effort is the only way to provide the best possible everyday
life for each person we support.
Overbrook Friedlander Programs was founded in July 1986 after the need for residential services for adults with intellectual disabilities, who also have visual
impairments or deaf-blindness was recognized.
Overbrook Friedlander Programs provides adults (21 years of age and older) with intellectual disabilities, who also have either visual impairments or deaf-blindness,
with residential services and day services. OFP operate nine community homes in Philadelphia and Delaware County for 25 men and women. Many of the adults
also receive day services through OFP or other service providers and some individuals are retired. OFP also provides residential services in a 10-bed facility with
nursing services available. OFP provides a licensed day program Monday – Friday, 9 AM – 3 PM, for 15 of our residential individuals.
Overbrook Friedlander Programs was established through the endeavors of Overbrook School for the Blind to meet the needs of adults with intellectual disabilities
who are blind, visually impaired, or deafblind.
Our individuals’ communication styles vary from individuals who communicate verbally to individuals who are nonverbal and utilize American Sign Language. We
support their communication needs through staff training and utilizing individual systems to meet their needs.
Some individuals have memberships with a YMCA/gym or attend a church of their choice on Sundays. Individuals who attend the day program also participate in
the MANNA Program, an organization that distributes meals to individuals within the community. Individuals are encouraged to participate in community activities
of their personal choice.
Overbrook Friedlander Programs considers that communication with families is paramount to successfully supporting our individuals. Families are kept up to date
with the individual’s health, progress, and concerns. Overbrook Friedlander Programs encourages the families to contact a team member with their concerns.
Annual Team meetings are scheduled in advance, at a convenient time for all team members. Other Team meetings are scheduled as needs arise. At times, family
members desire to attend medical appointments/procedures, and OFP attempts to make those appointments convenient for all who wish to attend.
We are currently working on setting up a Meal Profile/Placemat for each individual, we support. The Meal Profile has a picture of the individual sitting at the table
and eating in the correct position that is best for them. The profile also provides the individual’s Diet Order, Solid Food Consistency, Liquid Food Consistency, Food
Allergies, Dietary Restrictions, Precautions, Dislikes, Adaptive Equipment Needed, Environmental Considerations, Positioning, Supervision or Assistance Needed
and Special Instructions or Strategies. When completed, each person will have their own Meal Profile. The Profiles will be laminated and will be on the dining table
as they are eating so that those who support the individual can easily see each individual’s eating information. Staff receive training regarding each individual’s
needs during meals and snacks.

242
Interpreting the Data
These data will allow you to compare the average response
from this provider to the average response from all people
sampled in the state, region, and AE (when applicable).
Some differences are less meaningful than others,
depending on things like the size of the sample and the range
of answers provided for that particular scale. “Confidence
intervals” are used to determine whether differences are
statistically significant, or meaningful. Confidence intervals
are reported in parentheses.
To determine whether the average score of the provider is
meaningfully different from the averages of the state,
region, or AE, you can look at whether these scores fall
outside or inside the provider’s confidence interval.
Meaningful differences are marked with an asterisk “*”.
Summary of Findings
• The provider scores significantly below average for the
state on Individual Choice
• The provider scores significantly below average for the
state on Individual Inclusion
Provider Profiles Data Display: Overbrook Friedlander Programs (Statewide) 2016-2017
Of the 5,328 individuals in the 2017 IM4Q data file, 14 individuals registered in Pennsylvania received residential services from Overbrook. The data in this profile
are for the provider’s private ICF 16+ and community-based residential services. This report presents the scale scores for the State of Pennsylvania and Overbrook
(Statewide). There must be data for 10 or more individuals to meet our selection criteria for reporting. If the number of respondents for any item falls below 5, a
dash (-) is shown. For all of the scale scores, a higher score is better and the scores can range from 0 to 100. Confidence intervals for provider scores are given.
Link to explanation of items in scales is below.
* indicates meaningful difference
Link to explanation of the questions in each scale Above average marked by
SCALES State Overbrook
Individual Satisfaction 85.87 -
Individual Choice 46.90* 22.44 (11.48 – 33.39)
Individual Inclusion 43.72* 31.70 (24.27 – 39.12)
Individual Dignity 82.28 -
Physical Quality 96.92 95.24 (88.90 – 100.00)
Family Satisfaction 90.54 -
86
47 44
82
9791
2232
95
0
20
40
60
80
100
120
SATISFACTION CHOICE INCLUSION DIGNITY PHYS QUAL FAM SAT
Scale Scores for State and Provider
State Overbrook
243
Provider Profile Summary: Passavant Memorial Homes Family of Services www.passavant.org
Passavant Memorial Homes, PDC Pharmacy, Life Enrichment Trust, Accessible Dental Services, and Passavant Memorial Homes Foundation, are together known
as Passavant Memorial Homes Family of Services (PMHFOS). Just as a family cares for one another, our companies offer a wide range of supports to address the
special needs and unique desires of individuals with disabilities. Our mission is to empower individuals with intellectual disabilities, autism and behavioral health
needs to live successfully in the community. Through a continuum of care, the highest quality supports are always provided, while promoting choice and
independence.
PMHFOS is committed to a team-oriented work environment that exemplifies a participatory management driven process and is characterized by staff
development and advancement. By promoting this philosophy and valuing every employee’s talents, initiative, and leadership skills, every consumer and family
member will be ensured the utmost quality.
Since its creation in 1895, PMHFOS has dedicated itself to providing only the highest quality supports and services to individuals living with disabilities.
Our services include: Consolidated Waiver: Adult Training Facilities, Children’s Programs, Community Residential Services, Job Support and Vocational Training,
Life Sharing, Long Term Structured Residences, Senior Centers, Supported Living/Housing Support, Transition to Work for Special Education Students.
Person/Family Directed Supports Waiver: Home and Community Based Programs. Adult Autism Waiver: Behavior Specialist, Community Inclusion, Day Habilitation,
Job Assessment, Job Finding, Residential Habilitation – Community Home and Family Living Options.
PMHFOS provides specialized services to behaviorally and medically complex individuals. Well-trained employees are the key resource to assuring a high-quality
and effective method for communication. PMH provides services to individuals that have a wide array of needs. We develop goals and tailor the training to our
staff so that communication with each individual can develop and progress.
PMHFOS works with each individual and their team to identify a specific community engagement plan which is based on the individual’s specific interests and
unique abilities. All staff are trained on each individual’s plan as well as the overall philosophy and goal of involving individuals in their communities so that a clear
understanding is developed on how important it is to create the opportunities necessary for each individual to develop relationships and become an integral part
of the community they live in.
PMHFOS believes that family members are invaluable in helping us understand each individual’s unique needs and we work directly with the family members to
provide opportunities for a successful life. We believe it is vital to engage and assist families through consistent communication to develop the individual's skills
and abilities to live a healthy and satisfying life as an integral part of their community.
PMHFOS is working to further enhance our efforts to assist each individual to fully engage in making choices regarding how they live, work and socialize and how
they can become more active and engaged in their communities. We continually monitor and review our data to ensure that each individual we serve has every
opportunity to engage in an “everyday life.”
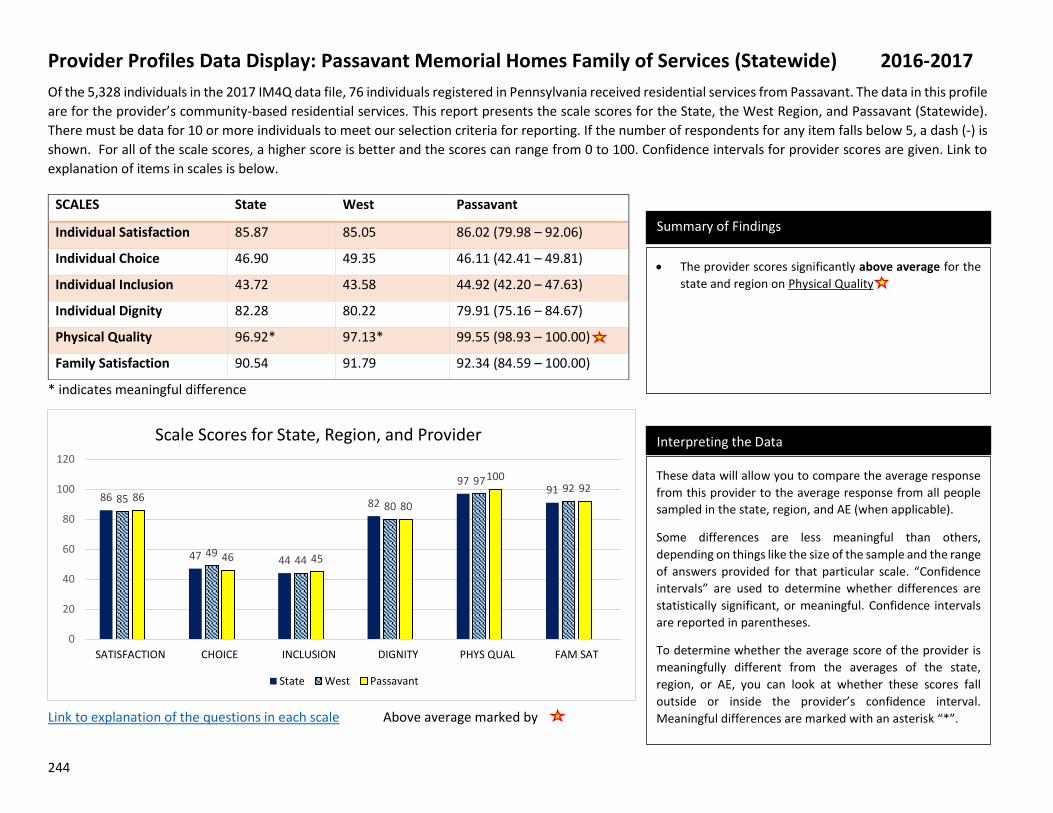
244
Interpreting the Data
These data will allow you to compare the average response
from this provider to the average response from all people
sampled in the state, region, and AE (when applicable).
Some differences are less meaningful than others,
depending on things like the size of the sample and the range
of answers provided for that particular scale. “Confidence
intervals” are used to determine whether differences are
statistically significant, or meaningful. Confidence intervals
are reported in parentheses.
To determine whether the average score of the provider is
meaningfully different from the averages of the state,
region, or AE, you can look at whether these scores fall
outside or inside the provider’s confidence interval.
Meaningful differences are marked with an asterisk “*”.
Summary of Findings
• The provider scores significantly above average for the
state and region on Physical Quality
Provider Profiles Data Display: Passavant Memorial Homes Family of Services (Statewide) 2016-2017
Of the 5,328 individuals in the 2017 IM4Q data file, 76 individuals registered in Pennsylvania received residential services from Passavant. The data in this profile
are for the provider’s community-based residential services. This report presents the scale scores for the State, the West Region, and Passavant (Statewide).
There must be data for 10 or more individuals to meet our selection criteria for reporting. If the number of respondents for any item falls below 5, a dash (-) is
shown. For all of the scale scores, a higher score is better and the scores can range from 0 to 100. Confidence intervals for provider scores are given. Link to
explanation of items in scales is below.
* indicates meaningful difference
Link to explanation of the questions in each scale Above average marked by
SCALES State West Passavant
Individual Satisfaction 85.87 85.05 86.02 (79.98 – 92.06)
Individual Choice 46.90 49.35 46.11 (42.41 – 49.81)
Individual Inclusion 43.72 43.58 44.92 (42.20 – 47.63)
Individual Dignity 82.28 80.22 79.91 (75.16 – 84.67)
Physical Quality 96.92* 97.13* 99.55 (98.93 – 100.00)
Family Satisfaction 90.54 91.79 92.34 (84.59 – 100.00)
86
47 44
82
9791
85
4944
80
9792
86
46 45
80
10092
0
20
40
60
80
100
120
SATISFACTION CHOICE INCLUSION DIGNITY PHYS QUAL FAM SAT
Scale Scores for State, Region, and Provider
State West Passavant

245
Interpreting the Data
These data will allow you to compare the average response
from this provider to the average response from all people
sampled in the state, region, and AE (when applicable).
Some differences are less meaningful than others,
depending on things like the size of the sample and the range
of answers provided for that particular scale. “Confidence
intervals” are used to determine whether differences are
statistically significant, or meaningful. Confidence intervals
are reported in parentheses.
To determine whether the average score of the provider is
meaningfully different from the averages of the state,
region, or AE, you can look at whether these scores fall
outside or inside the provider’s confidence interval.
Meaningful differences are marked with an asterisk “*”.
Summary of Findings
• The provider scores significantly below average for the
state and region on Individual Dignity
• The provider scores significantly above average for the
state, region and AE on Physical Quality
Provider Profiles Data Display: Passavant Memorial Homes Family of Services (Allegheny AE) 2016-2017
Of the 5,328 individuals in the 2017 IM4Q data file, 44 individuals registered in Allegheny Administrative Entity received residential services from Passavant. The
data in this profile are for the provider’s community-based residential services. This report presents the scale scores for the State, the West Region, Allegheny AE
and Passavant (Allegheny). There must be data for 10 or more individuals to meet our selection criteria for reporting. If the number of respondents for any item
falls below 5, a dash (-) is shown. For all of the scale scores, a higher score is better and the scores can range from 0 to 100. Confidence intervals for provider
scores are given. Link to explanation of items in scales is below.
* indicates meaningful difference
Link to explanation of the questions in each scale Above average marked by
SCALES State West Allegheny Passavant (Allegheny)
Individual Satisfaction 85.87 85.05 82.82 85.28 (74.59 – 95.97)
Individual Choice 46.90 49.35 46.36 46.47 (41.55 – 51.39)
Individual Inclusion 43.72 43.58 41.23 44.24 (41.61 – 46.86)
Individual Dignity 82.28* 80.22* 71.61 72.92 (65.98 – 79.85)
Physical Quality 96.92* 97.13* 97.86* 99.21 (98.12 – 100.00)
Family Satisfaction 90.54 91.79 80.03 -
86
47 44
82
9791
85
4944
80
9792
83
4641
72
98
8085
46 44
73
99
00
20
40
60
80
100
120
SATISFACTION CHOICE INCLUSION DIGNITY PHYS QUAL FAM SAT
Scale Scores for State, Region, County, Provider
State West Allegheny Passavant (Allegheny)

246
Interpreting the Data
These data will allow you to compare the average response
from this provider to the average response from all people
sampled in the state, region, and AE (when applicable).
Some differences are less meaningful than others,
depending on things like the size of the sample and the range
of answers provided for that particular scale. “Confidence
intervals” are used to determine whether differences are
statistically significant, or meaningful. Confidence intervals
are reported in parentheses.
To determine whether the average score of the provider is
meaningfully different from the averages of the state,
region, or AE, you can look at whether these scores fall
outside or inside the provider’s confidence interval.
Meaningful differences are marked with an asterisk “*”.
Summary of Findings
• The provider scores significantly above average for the
AE on Individual Inclusion
• The provider scores significantly above average for the
state, region and AE on Physical Quality
Provider Profiles Data Display: Passavant Memorial Homes Family of Services (Westmoreland AE) 2016-2017
Of the 5,328 individuals in the 2017 IM4Q data file, 24 individuals registered in Westmoreland Administrative Entity received residential services from Passavant.
The data in this profile are for the provider’s community-based residential services. This report presents the scale scores for the State, the West Region,
Westmoreland AE and Passavant (Westmoreland). There must be data for 10 or more individuals to meet our selection criteria for reporting. If the number of
respondents for any item falls below 5, a dash (-) is shown. For all of the scale scores, a higher score is better and the scores can range from 0 to 100. Confidence
intervals for provider scores are given. Link to explanation of items in scales is below.
* indicates meaningful difference
Link to explanation of the questions in each scale Above average marked by
SCALES State West Westmoreland Passavant (Westmoreland)
Individual Satisfaction 85.87 85.05 87.98 85.14 (77.25 – 93.03)
Individual Choice 46.90 49.35 48.58 44.42 (38.94 – 49.90)
Individual Inclusion 43.72 43.58 35.24* 43.15 (38.25 – 48.06)
Individual Dignity 82.28 80.22 79.71 85.16 (78.74 – 91.57)
Physical Quality 96.92* 97.13* 97.01* 100.00 (100.00 – 100.00)
Family Satisfaction 90.54 91.79 92.70 94.16 (88.47 – 99.86)
86
47 44
82
9791
85
4944
80
9792
88
49
35
80
9793
85
44 43
85
10094
0
20
40
60
80
100
120
SATISFACTION CHOICE INCLUSION DIGNITY PHYS QUAL FAM SAT
Scale Scores for State, Region, County, Provider
State West Westmoreland Passavant (Westmoreland)

247
Provider Profile Summary: PATH www.pathcenter.org
PATH’s mission: “Helping Individuals Achieve A More Independent and Fulfilling Life.”
While at PATH you will be treated consistent with the following values:
You will be treated with dignity and respect by everyone at all times. You will be treated in a confidential manner. You will be supported and encouraged to
participate in the planning of your own services and supports. You will have information about these services and supports, and you will decide about the supports
and services you wish to receive. You will be informed and consulted about any changes in your services, staff who work with you or program changes. This includes
your right to refuse services. You will receive the help necessary to understand all printed forms which you are asked to sign. You can always ask about anything
you do not understand or anything that makes you uncomfortable. You will be supported in practicing your own cultural, ethnic or religious practices. In residential
services, you will be supported in managing your own financial affairs and making meaningful decisions about how you spend your money as well as your time.
Staff will use language and terminology that you and your family can understand. You, your family and our staff will establish working relationships based upon
mutual respect and understanding. You may be asked for your permission to share information about yourself with others outside of PATH, in order for us to do a
better job in working with you to reach your goals.
PATH’s roots can be traced back to 1973 when PATH was incorporated as a not-for-profit corporation.
Within the Intellectual Disabilities Program, PATH offers three main services: Residential, Adult Day, and Vocational.
PATH begins by hiring people who have care and compassion for serving individuals with an intellectual disability. Each PATH staff member seeks to fulfill the
communication needs of the individual. As the team meets, including the Supports Coordinator, the family members and most importantly the individual, PATH
staff are critical in developing our understanding of how best to interact, engage and communicate with the individual.
All individuals are supported in community settings that match the individual’s interests and in ways to facilitate communication and skill building.
Families play an integral role in serving individuals at PATH. Families provide essential information and are key members of the interdisciplinary team. PATH
communicates with families and guardians year-round regarding the support and services their family member receives.
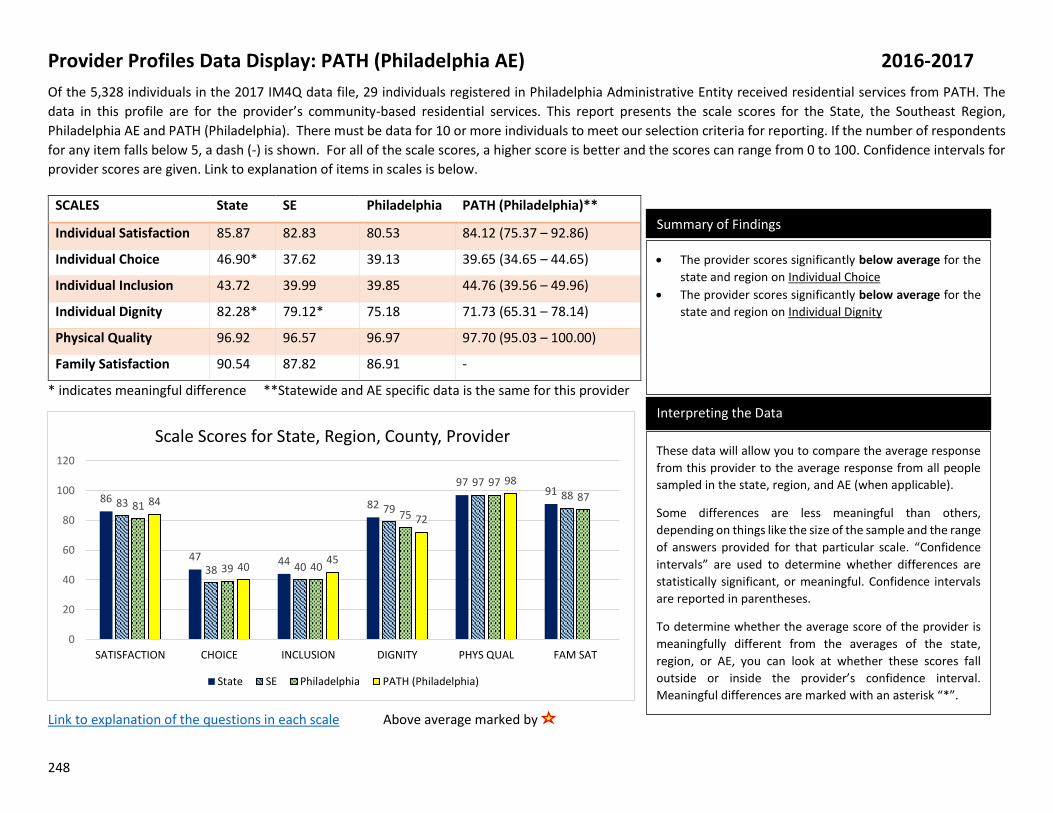
248
Interpreting the Data
These data will allow you to compare the average response
from this provider to the average response from all people
sampled in the state, region, and AE (when applicable).
Some differences are less meaningful than others,
depending on things like the size of the sample and the range
of answers provided for that particular scale. “Confidence
intervals” are used to determine whether differences are
statistically significant, or meaningful. Confidence intervals
are reported in parentheses.
To determine whether the average score of the provider is
meaningfully different from the averages of the state,
region, or AE, you can look at whether these scores fall
outside or inside the provider’s confidence interval.
Meaningful differences are marked with an asterisk “*”.
Summary of Findings
• The provider scores significantly below average for the
state and region on Individual Choice
• The provider scores significantly below average for the
state and region on Individual Dignity
Provider Profiles Data Display: PATH (Philadelphia AE) 2016-2017
Of the 5,328 individuals in the 2017 IM4Q data file, 29 individuals registered in Philadelphia Administrative Entity received residential services from PATH. The
data in this profile are for the provider’s community-based residential services. This report presents the scale scores for the State, the Southeast Region,
Philadelphia AE and PATH (Philadelphia). There must be data for 10 or more individuals to meet our selection criteria for reporting. If the number of respondents
for any item falls below 5, a dash (-) is shown. For all of the scale scores, a higher score is better and the scores can range from 0 to 100. Confidence intervals for
provider scores are given. Link to explanation of items in scales is below.
* indicates meaningful difference **Statewide and AE specific data is the same for this provider
Link to explanation of the questions in each scale Above average marked by
SCALES State SE Philadelphia PATH (Philadelphia)**
Individual Satisfaction 85.87 82.83 80.53 84.12 (75.37 – 92.86)
Individual Choice 46.90* 37.62 39.13 39.65 (34.65 – 44.65)
Individual Inclusion 43.72 39.99 39.85 44.76 (39.56 – 49.96)
Individual Dignity 82.28* 79.12* 75.18 71.73 (65.31 – 78.14)
Physical Quality 96.92 96.57 96.97 97.70 (95.03 – 100.00)
Family Satisfaction 90.54 87.82 86.91 -
86
47 44
82
9791
83
38 40
79
9788
81
39 40
75
978784
4045
72
98
0
20
40
60
80
100
120
SATISFACTION CHOICE INCLUSION DIGNITY PHYS QUAL FAM SAT
Scale Scores for State, Region, County, Provider
State SE Philadelphia PATH (Philadelphia)

249
Provider Profile Summary: Penn-Mar Human Services www.penn-mar.org
Our mission is to transform life into living for individuals, families, staff and volunteers.
We have four core values to help guide decisions: integrity, excellence, collaboration and innovation.
The history of Penn-Mar dates back to 1980, when a group of concerned families from the states of Maryland and Pennsylvania met to discuss the future of their
sons and daughters with disabilities. The families created a program that began in a church and the organization was incorporated in 1983. From that humble and
courageous beginning springs the programs and services offered today.
We offer a variety of residential, day and employment services while continuing to evaluate new opportunities. We operate residential homes, support people
living with their families and we also operate a respite home where more than 90 people visit for short-stays throughout the year. Our day program provides
opportunities in a newly renovated building and in the community. We also offer small group employment and integrated employment services.
We are innovative! We closed our sheltered workshop in 2012 to be focused on more community-based options in both employment and the day program. We
also have a process for individuals to pursue entrepreneurship. We also support people considered to have complex medical needs.
We have robust onboarding, training and leadership programs. We identify preferred communication methods then provide the necessary training. We offer
American Sign Language and work with specialists to identify adaptive equipment that will enhance communication abilities.
We have a full-time Community Inclusion Resource Specialist to identify opportunities for community engagement. This information is provided directly to the
individuals and the team members supporting them.
We view families as an active and important partner. We encourage open and ongoing dialogue. We host events with families and organizational leadership to
connect about the strategic vision of the organization. We use a quarterly family newsletter and social media to communicate about important operational changes
that are occurring in addition to immediate written communication for more timely issues.
Through our annual strategic planning process, we identified and are subsequently working to improve the person-centered culture of our organization. As part
of our quality management plan, we are increasing our level of community participation support, continued focus on safe driving, decreasing medication errors,
and general oversight of regulatory requirements. We are working to reduce staff vacancy/turnover, in part by ensuring more timely evaluations of new staff and
further development of leadership skills of supervisors.
The retention and engagement of DSPs is a significant area of focus. We are working to raise the professional skills of the DSPs in our organization through the
support of a Career Ladder program. In partnership with the National Alliance of Direct Support Professionals (NADSP), we are funding the professional certification
of team members who choose to live their legacy by having a long-term career working directly with individuals we support.
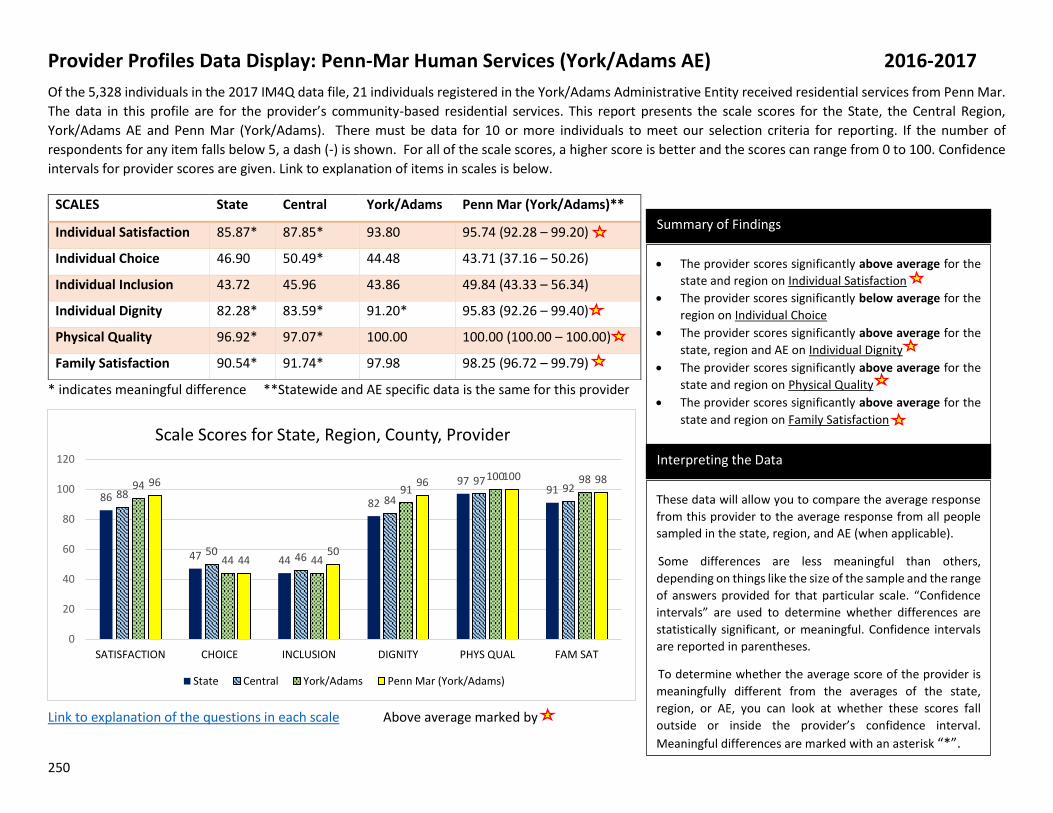
250
Interpreting the Data
These data will allow you to compare the average response
from this provider to the average response from all people
sampled in the state, region, and AE (when applicable).
Some differences are less meaningful than others,
depending on things like the size of the sample and the range
of answers provided for that particular scale. “Confidence
intervals” are used to determine whether differences are
statistically significant, or meaningful. Confidence intervals
are reported in parentheses.
To determine whether the average score of the provider is
meaningfully different from the averages of the state,
region, or AE, you can look at whether these scores fall
outside or inside the provider’s confidence interval.
Meaningful differences are marked with an asterisk “*”.
Summary of Findings
• The provider scores significantly above average for the
state and region on Individual Satisfaction
• The provider scores significantly below average for the
region on Individual Choice
• The provider scores significantly above average for the
state, region and AE on Individual Dignity
• The provider scores significantly above average for the
state and region on Physical Quality
• The provider scores significantly above average for the
state and region on Family Satisfaction
Provider Profiles Data Display: Penn-Mar Human Services (York/Adams AE) 2016-2017
Of the 5,328 individuals in the 2017 IM4Q data file, 21 individuals registered in the York/Adams Administrative Entity received residential services from Penn Mar.
The data in this profile are for the provider’s community-based residential services. This report presents the scale scores for the State, the Central Region,
York/Adams AE and Penn Mar (York/Adams). There must be data for 10 or more individuals to meet our selection criteria for reporting. If the number of
respondents for any item falls below 5, a dash (-) is shown. For all of the scale scores, a higher score is better and the scores can range from 0 to 100. Confidence
intervals for provider scores are given. Link to explanation of items in scales is below.
* indicates meaningful difference **Statewide and AE specific data is the same for this provider
Link to explanation of the questions in each scale Above average marked by
SCALES State Central York/Adams Penn Mar (York/Adams)**
Individual Satisfaction 85.87* 87.85* 93.80 95.74 (92.28 – 99.20)
Individual Choice 46.90 50.49* 44.48 43.71 (37.16 – 50.26)
Individual Inclusion 43.72 45.96 43.86 49.84 (43.33 – 56.34)
Individual Dignity 82.28* 83.59* 91.20* 95.83 (92.26 – 99.40)
Physical Quality 96.92* 97.07* 100.00 100.00 (100.00 – 100.00)
Family Satisfaction 90.54* 91.74* 97.98 98.25 (96.72 – 99.79)
86
47 44
82
979188
50 46
84
979294
44 44
91100 9896
4450
96100 98
0
20
40
60
80
100
120
SATISFACTION CHOICE INCLUSION DIGNITY PHYS QUAL FAM SAT
Scale Scores for State, Region, County, Provider
State Central York/Adams Penn Mar (York/Adams)

251
Provider Profile Summary: Person Directed Supports www.persondirectedsupports.com
The mission of Person Directed Supports, Inc. (PDS) is to provide an opportunity for people and their families to learn about a larger world and to make decisions
about how they choose to experience and contribute to the resources, joys and traditions of the community. Through a person-centered planning process,
comprehensive supports coordination, and best practice treatment and habilitative approaches, people will learn, grow and enjoy a wide array of new experiences,
friendships and activity. Our mission is to support people to create and enjoy happy meaningful lives.
PDS values everyone's gifts, creativity, our role as partners, people's dreams, each individual's path toward a dream, and every individual's circle of support. We
value and practice person centered planning as the cornerstone of all our services.
PDS has been supporting people with intellectual disabilities and autism since February of 2000.
PDS offers the following services and supports: community homes, shared living/lifesharing, supportive living, behavioral supports, housing services, companion
services, in-home and community supports, and community participation services.
PDS supports people with complex behavioral support needs. Our Behavior Specialists each have a unique background supporting people with Intellectual
Developmental Disabilities and co-occurring mental health disorders. The supports we provide are individualized to every person’s specific needs. We utilize
empirically-validated practices to identify the causes of, intervene to prevent, and identify appropriate reactions to maladaptive behaviors. We believe it is
important to provide support to the person, family, friends, and staff members, always having the person’s best interest for a positive behavior.
PDS has a Communication Committee dedicated to supporting our individuals’ communication needs. We have implemented many initiatives to foster
communication among people we support. Examples include speech therapy, communication assessments, assistive technology device demonstrations, American
Sign Language Trainings, and Deaf Culture awareness trainings. PDS collaborates with speech therapists, occupational therapists and behavioral specialists, to
implement and monitor communication systems that are person centered to effectively address each person’s unique needs.
PDS engages people we support in the community by providing opportunities for people to participate in community activities that they enjoy. People choose how
they would like to spend their time in the community and staff provide them with support to engage in activities, communicate with others, and form relationships
with community members.
Families are supported and engaged by PDS through several pathways of communication and inclusion. At the direction of the person, families are included in
team meetings, intensive systems therapy (IST), and the creation of biographical timelines. They act as a support system not just for their family member but for
the agency as they provide us with knowledge and support. PDS also sends out family satisfaction surveys and a quarterly newsletter to all families to provide
them with agency updates.
PDS is increasing wellness through newsletters and exercise videos. PDS is also broadening community events for people such as sporting events and educational
trips.
PDS is a family owned and operated agency that stays true to the mission of putting people first.
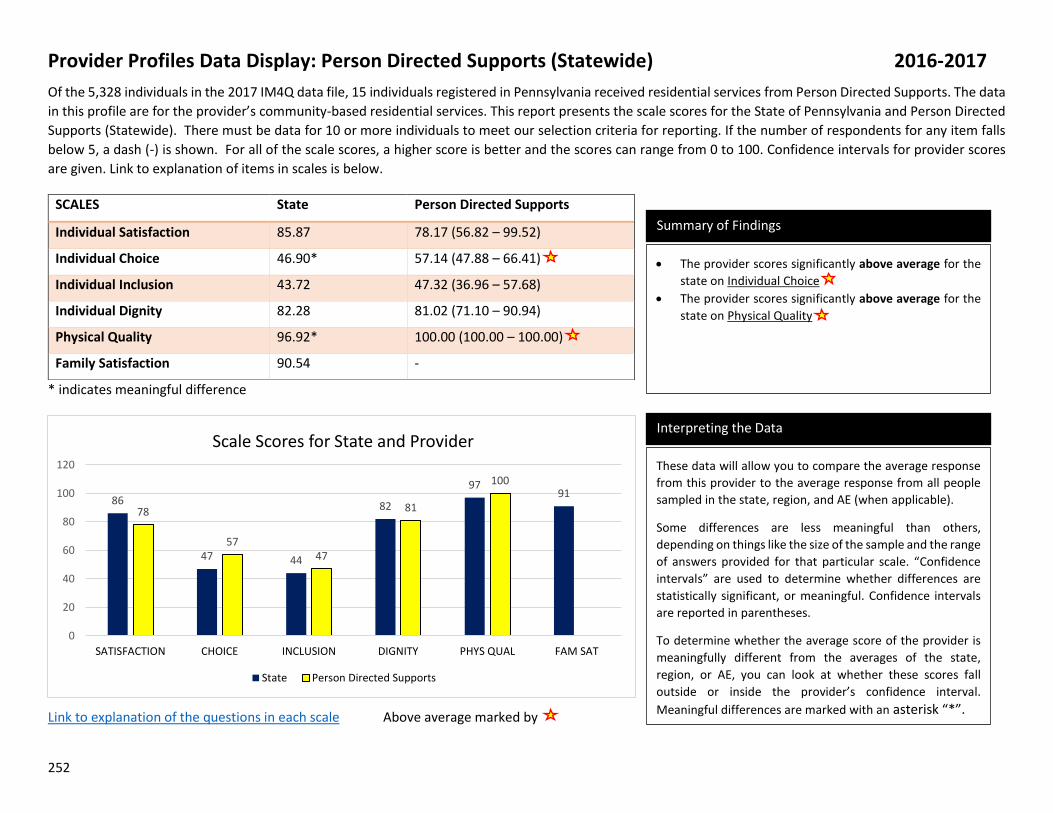
252
Interpreting the Data
These data will allow you to compare the average response
from this provider to the average response from all people
sampled in the state, region, and AE (when applicable).
Some differences are less meaningful than others,
depending on things like the size of the sample and the range
of answers provided for that particular scale. “Confidence
intervals” are used to determine whether differences are
statistically significant, or meaningful. Confidence intervals
are reported in parentheses.
To determine whether the average score of the provider is
meaningfully different from the averages of the state,
region, or AE, you can look at whether these scores fall
outside or inside the provider’s confidence interval.
Meaningful differences are marked with an asterisk “*”.
Summary of Findings
• The provider scores significantly above average for the
state on Individual Choice
• The provider scores significantly above average for the
state on Physical Quality
Provider Profiles Data Display: Person Directed Supports (Statewide) 2016-2017
Of the 5,328 individuals in the 2017 IM4Q data file, 15 individuals registered in Pennsylvania received residential services from Person Directed Supports. The data
in this profile are for the provider’s community-based residential services. This report presents the scale scores for the State of Pennsylvania and Person Directed
Supports (Statewide). There must be data for 10 or more individuals to meet our selection criteria for reporting. If the number of respondents for any item falls
below 5, a dash (-) is shown. For all of the scale scores, a higher score is better and the scores can range from 0 to 100. Confidence intervals for provider scores
are given. Link to explanation of items in scales is below.
* indicates meaningful difference
Link to explanation of the questions in each scale Above average marked by
SCALES State Person Directed Supports
Individual Satisfaction 85.87 78.17 (56.82 – 99.52)
Individual Choice 46.90* 57.14 (47.88 – 66.41)
Individual Inclusion 43.72 47.32 (36.96 – 57.68)
Individual Dignity 82.28 81.02 (71.10 – 90.94)
Physical Quality 96.92* 100.00 (100.00 – 100.00)
Family Satisfaction 90.54 -
86
47 44
82
9791
78
5747
81
100
0
20
40
60
80
100
120
SATISFACTION CHOICE INCLUSION DIGNITY PHYS QUAL FAM SAT
Scale Scores for State and Provider
State Person Directed Supports

253
Provider Profile Summary: Pittsburgh Mercy Health System www.pittsburghmercy.org
We intend to offer excellent person-centered services to each individual with respect to the individual.
We are a faith-based organization founded in the beliefs of the Sisters of Mercy. Our Core Values are Reverence, Commitment to those who are poor, Justice,
Stewardship, Integrity, Community, and Courage.
We opened our doors officially in 1978. We grew out of two small providers joining together to become the large and varied provider we are today.
Our “work” programs allow each person to learn skills from the very basic, of caring for self, through community employment. We support individuals as they
present, both residentially and day supports. We care for people with various “diagnoses/conditions”. Having a Mental Health component we can draw upon that
unit’s expertise when necessary. We manage a variety of programs, bus passes administration, mileage reimbursement for families, 24-hour respite program and
other caregiver relief support. We pay staff to provide services in your home and/or community.
We offer extensive employment supports. We assist individuals in finding a job or preparing them for that search and if a job is not desired or considered we can
help provide training of skills for everyday life activities. Our program’s locations are in different local Pittsburgh areas.
One of our organization quality management goals encompasses supports to our deaf individuals and how we can best support them through staff trainings and
program considerations.
A second quality goal addresses community participation. We are hoping to not just have individuals walk through communities but to introduce them and
integrate with natural supports where they can go freely as they choose. We propose this in both our residential and day supports programs.
We have an open-door policy and respectful philosophy. We understand our individuals had family before they met us.
Staff medication errors have dropped significantly in the last 3 years. We collected and analyzed detailed information of medication errors to gain an understanding
of why errors occurred. From this we made organization policy and procedure changes. This is a standing agenda item for our quality committee meetings. Some
other goals are to increase community participation, to improve services to the deaf and improve our performance regarding the care we provide.
We invite you to our website to learn of all we do beyond ID services, which officially opened in 1978. We encourage you to contact us, Support Coordination
units, the County Human Services department and/or ODP to inquire about us. We are a very financially strong organization and are CARF accredited. The
management team has an average of 18 years of service at Pittsburgh Mercy Health Services and an average of 9 years as a supervisor/manager. Our ID unit has
a nurse consultant to help make decisions regarding care. As a note of clarification, we are not connected to Mercy Hospital or UPMC. We are a faith-based
organization. MLCC wants each individual to have the best experience in care one can have. We are person centered which means we “wrap” desired
services/supports around the person rather than force them into a “system”.

254
Interpreting the Data
These data will allow you to compare the average response
from this provider to the average response from all people
sampled in the state, region, and AE (when applicable).
Some differences are less meaningful than others,
depending on things like the size of the sample and the range
of answers provided for that particular scale. “Confidence
intervals” are used to determine whether differences are
statistically significant, or meaningful. Confidence intervals
are reported in parentheses.
To determine whether the average score of the provider is
meaningfully different from the averages of the state,
region, or AE, you can look at whether these scores fall
outside or inside the provider’s confidence interval.
Meaningful differences are marked with an asterisk “*”.
Summary of Findings
• The provider scores significantly above average for the
state, region and AE on Individual Choice
• The provider scores significantly below average for the
state and region on Individual Dignity
• The provider scores significantly above average for the
state, region and AE on Physical Quality
Provider Profiles Data Display: Pittsburgh Mercy Health System (Allegheny AE) 2016-2017
Of the 5,328 individuals in the 2017 IM4Q data file, 25 individuals registered in Allegheny Administrative Entity received residential services from Mercy. The data
in this profile are for the provider’s community-based residential services. This report presents the scale scores for the State, the Western Region, Allegheny AE
and Mercy (Allegheny). There must be data for 10 or more individuals to meet our selection criteria for reporting. If the number of respondents for any item falls
below 5, a dash (-) is shown. For all of the scale scores, a higher score is better and the scores can range from 0 to 100. Confidence intervals for provider scores
are given. Link to explanation of items in scales is below.
* indicates meaningful difference **Statewide and AE specific data is the same for this provider
Link to explanation of the questions in each scale Above average marked by
SCALES State West Allegheny Mercy (Allegheny)**
Individual Satisfaction 85.87 85.05 82.82 85.50 (77.46 – 93.54)
Individual Choice 46.90* 49.35* 46.36* 58.88 (51.78 – 65.97)
Individual Inclusion 43.72 43.58 41.23 45.95 (40.56 – 51.34)
Individual Dignity 82.28* 80.22* 71.61 73.28 (69.64 – 76.93)
Physical Quality 96.92* 97.13* 97.86* 99.31 (97.94 – 100.00)
Family Satisfaction 90.54 91.79 80.03 -
86
47 44
82
9791
85
4944
80
9792
83
4641
72
98
8086
59
46
73
99
0
20
40
60
80
100
120
SATISFACTION CHOICE INCLUSION DIGNITY PHYS QUAL FAM SAT
Scale Scores for State, Region, County, Provider
State West Allegheny Mercy (Allegheny)

255
Provider Profile Summary: Prospectus Berco www.proberco.org
Prospectus’s mission is to inspire people with special needs to lead meaningful lives by providing innovative supports.
Our guiding values are Compassion, Dignity and Respect, Responsibility, Integrity, Fairness and Justice, Innovation, Inspiration, Aspiration and Teamwork.
We have been serving people for 41 years.
Services we provide include Residential, Vocational, Adult Training, Life Sharing and Home-Based Waiver.
Area of special expertise: Community Participation, Deaf and Hard of Hearing, Employment Services
We ensure continuous professional development and ongoing Sign Language training, so our staff can effectively communicate with people they support
We continually encourage and support individuals based on their needs and interests.
We encourage family participation and involvement. We support and engage families through family meetings and newsletters.
Quality improvement projects we are working on are Increase the number of program participants receiving Life Sharing Services and continue to increase the
number of program participants in Community Participation.

256
Interpreting the Data
These data will allow you to compare the average response
from this provider to the average response from all people
sampled in the state, region, and AE (when applicable).
Some differences are less meaningful than others,
depending on things like the size of the sample and the range
of answers provided for that particular scale. “Confidence
intervals” are used to determine whether differences are
statistically significant, or meaningful. Confidence intervals
are reported in parentheses.
To determine whether the average score of the provider is
meaningfully different from the averages of the state,
region, or AE, you can look at whether these scores fall
outside or inside the provider’s confidence interval.
Meaningful differences are marked with an asterisk “*”.
Summary of Findings
• The provider scores significantly above average for the
state on Individual Dignity
• The provider scores significantly above average for the
AE on Physical Quality
Provider Profiles Data Display: Prospectus Berco (Berks AE) 2016-2017
Of the 5,328 individuals in the 2017 IM4Q data file, 22 individuals registered in the Berks Administrative Entity received residential services from Prospectus. The
data in this profile are for the provider’s community-based residential services. This report presents the scale scores for the State, the Northeast Region, Berks AE
and Prospectus (Berks). There must be data for 10 or more individuals to meet our selection criteria for reporting. If the number of respondents for any item falls
below 5, a dash (-) is shown. For all of the scale scores, a higher score is better and the scores can range from 0 to 100. Confidence intervals for provider scores
are given. Link to explanation of items in scales is below.
* indicates meaningful difference **Statewide and AE specific data is the same for this provider
Link to explanation of the questions in each scale Above average marked by
SCALES State NE Berks Prospectus (Berks)**
Individual Satisfaction 85.87 89.11 82.70 79.44 (66.78 – 92.11)
Individual Choice 46.90 54.66 51.81 45.85 (35.43 – 56.27)
Individual Inclusion 43.72 48.05 45.64 44.96 (37.30 – 52.62)
Individual Dignity 82.28* 88.82 93.09 93.15 (88.50 – 97.81)
Physical Quality 96.92 96.97 92.98* 97.73 (95.28 – 100.00)
Family Satisfaction 90.54 92.50 89.01 -
86
47 44
82
979189
5548
8997
93
83
5246
93 9389
79
46 45
9398
0
20
40
60
80
100
120
SATISFACTION CHOICE INCLUSION DIGNITY PHYS QUAL FAM SAT
Scale Scores for State, Region, County, Provider
State NE Berks Prospectus (Berks)

257
Provider Profile Summary: Resources for Human Development (RHD) www.rhd.org
Since 1972, Resources for Human Development (RHD) has assisted people with intellectual and developmental disabilities. RHD’s mission is to provide caring,
effective and innovative services that empower people of all abilities as they work to achieve the highest level of independence possible and build better lives for
themselves, their families and their communities. Each year, RHD provides essential day and residential services to more than 25,000 individuals, while RHD’s
community health centers provide care to more than 24,000 patients.
We know that what we do each day is what defines us – from the way we serve people we support to the commitment we make to our employees. Although there
are a number of values, which are important to RHD, certain values have been particularly relevant to the life of the RHD community and collectively serve as its
cornerstone: Respect for the dignity and worth of each individual, Multi-level thinking, Empowerment of the groups, Decentralization of authority, Safe and open
environment, Creativity, Honesty and trust, Diversity, Organizational integrity, Ongoing growth and development, Personal and professional enrichment, Quality
service.
RHD provides services to individuals, so each individual can live a life of their choice with meaningful and frequent community involvement, skill building
opportunities and socialization.
RHD’s Pennsylvania intellectual developmental disabilities program provides the following services: Residential Habilitation Services, Lifesharing, Day Services,
Community Participation Support, Supported Employment, Behavior Supports, Respite.
RHD provides residential settings that support individuals who have specialized needs like the dual diagnosed, medically involved, and those on the autism
spectrum. RHD’s clinical staff provides regular and enhanced behavioral support that can be accessed by the outside ID/A community too.
RHD has piloted the use of technology by having “tech enabled” clinicians and direct service employees to assist our participants in reaching their highest level of
independence in their homes and finding employment opportunities.
Individual’s communication skills are assessed upon admission to determine levels of need and support. RHD strongly supports community participation for all
individuals receiving services. RHD provides individuals with opportunities to become fully engaged in their communities by committing to strategies that keep
individuals informed and encourages decision-making that promotes inclusive community engagement.
RHD encourages and empowers each individual’s family to be involved. The development of a supportive network of friends and family is a priority and it fosters
a level of respect between the individual, the family, and the provider.
RHD has a quality management plan which provides a systematic method for continuously improving the quality, efficiency, and effectiveness of the services provided.
RHD can share a number of success stories such as its non-traditional day services that offer creative arts to individuals with intellectual disabilities. Individuals
build skills and earn money through painting, drawing, printmaking, music, woodworking, ceramics and sculpture. An individual from RHD’s non-traditional arts
day program stated, “CCW inspired me. I love the staff. I feel it is right for me. I feel great. And I’m proud of myself.”

258
Interpreting the Data
These data will allow you to compare the average response
from this provider to the average response from all people
sampled in the state, region, and AE (when applicable).
Some differences are less meaningful than others,
depending on things like the size of the sample and the range
of answers provided for that particular scale. “Confidence
intervals” are used to determine whether differences are
statistically significant, or meaningful. Confidence intervals
are reported in parentheses.
To determine whether the average score of the provider is
meaningfully different from the averages of the state,
region, or AE, you can look at whether these scores fall
outside or inside the provider’s confidence interval.
Meaningful differences are marked with an asterisk “*”.
Summary of Findings
• The provider scores significantly below average for the
state on Individual Satisfaction
• The provider scores significantly above average for the
state on Individual Choice
• The provider scores significantly above average for the
state on Individual Inclusion
Provider Profiles Data Display: Resources for Human Development (Statewide 2016-2017
Of the 5,328 individuals in the 2017 IM4Q data file, 57 individuals registered in Pennsylvania received residential services from RHD. The data in this profile are for
the provider’s community-based residential services. This report presents the scale scores for the State of Pennsylvania and RHD (Statewide). There must be data
for 10 or more individuals to meet our selection criteria for reporting. If the number of respondents for any item falls below 5, a dash (-) is shown. For all of the
scale scores, a higher score is better and the scores can range from 0 to 100. Confidence intervals for provider scores are given. Link to explanation of items in
scales is below.
* indicates meaningful difference
Link to explanation of the questions in each scale Above average marked by
SCALES State RHD
Individual Satisfaction 85.87* 77.54 (69.38 – 85.70)
Individual Choice 46.90* 53.54 (47.22 – 59.85)
Individual Inclusion 43.72* 49.74 (46.11 – 53.37)
Individual Dignity 82.28 76.56 (70.35 – 82.77)
Physical Quality 96.92 96.36 (93.86 – 98.86)
Family Satisfaction 90.54 84.38 (73.53 – 95.22)
86
47 44
82
9791
78
54 50
77
96
84
0
20
40
60
80
100
120
SATISFACTION CHOICE INCLUSION DIGNITY PHYS QUAL FAM SAT
Scale Scores for State and Provider
State RHD

259
Interpreting the Data
These data will allow you to compare the average response
from this provider to the average response from all people
sampled in the state, region, and AE (when applicable).
Some differences are less meaningful than others,
depending on things like the size of the sample and the range
of answers provided for that particular scale. “Confidence
intervals” are used to determine whether differences are
statistically significant, or meaningful. Confidence intervals
are reported in parentheses.
To determine whether the average score of the provider is
meaningfully different from the averages of the state,
region, or AE, you can look at whether these scores fall
outside or inside the provider’s confidence interval.
Meaningful differences are marked with an asterisk “*”.
Summary of Findings
• The provider scores significantly below average for the
state on Individual Satisfaction
• The provider scores significantly below average for the
state region and AE on Individual Dignity
Provider Profiles Data Display: Resources for Human Development (Montgomery AE) 2016-2017
Of the 5,328 individuals in the 2017 IM4Q data file, 12 individuals registered in Montgomery Administrative Entity received residential services from RHD. The data
in this profile are for the provider’s community-based residential services. This report presents the scale scores for the State, the Southeast Region, Montgomery
AE and RHD (Montgomery). There must be data for 10 or more individuals to meet our selection criteria for reporting. If the number of respondents for any item
falls below 5, a dash (-) is shown. For all of the scale scores, a higher score is better and the scores can range from 0 to 100. Confidence intervals for provider
scores are given. Link to explanation of items in scales is below.
* indicates meaningful difference
Link to explanation of the questions in each scale Above average marked by
SCALES State SE Montgomery RHD (Montgomery)
Individual Satisfaction 85.87* 82.83 79.07 65.65 (45.51 – 85.79)
Individual Choice 46.90 37.62 31.31 43.06 (25.98 – 60.14)
Individual Inclusion 43.72 39.99 38.83 44.16 (34.52 – 53.80)
Individual Dignity 82.28* 79.12* 76.96* 69.64 (62.36 – 76.93)
Physical Quality 96.92 96.57 95.79 90.28 (80.88 – 99.67)
Family Satisfaction 90.54 87.82 83.83 88.54 (74.25 – 100.00)
86
47 44
82
9791
83
38 40
79
9788
79
3139
77
96
84
66
43 44
70
90 89
0
20
40
60
80
100
120
SATISFACTION CHOICE INCLUSION DIGNITY PHYS QUAL FAM SAT
Scale Scores for State, Region, County, Provider
State SE Montgomery RHD (Montgomery)

260
Interpreting the Data
These data will allow you to compare the average response from this provider to the average response from all people sampled in the state, region, and AE (when applicable).
Some differences are less meaningful than others, depending on things like the size of the sample and the range of answers provided for that particular scale. “Confidence intervals” are used to determine whether differences are statistically significant, or meaningful. Confidence intervals are reported in parentheses.
To determine whether the average score of the provider is meaningfully different from the averages of the state, region, or AE, you can look at whether these scores fall outside or inside the provider’s confidence interval.
Meaningful differences are marked with an asterisk “*”.
Summary of Findings
• The provider scores significantly above average for the
state on Individual Satisfaction
• The provider scores significantly above average for the
state, region and AE on Individual Inclusion
Provider Profiles Data Display: Resources for Human Development (Northampton AE) 2016-2017
Of the 5,328 individuals in the 2017 IM4Q data file, 14 individuals registered in the Northampton Administrative Entity received residential services from RHD. The
data in this profile are for the provider’s community-based residential services. This report presents the scale scores for the State, the Northeast Region,
Northampton AE and RHD (Northampton). There must be data for 10 or more individuals to meet our selection criteria for reporting. If the number of respondents
for any item falls below 5, a dash (-) is shown. For all of the scale scores, a higher score is better and the scores can range from 0 to 100. Confidence intervals for
provider scores are given. Link to explanation of items in scales is below.
* indicates meaningful difference
Link to explanation of the questions in each scale Above average marked by
SCALES State NE Northampton RHD (Northampton)
Individual Satisfaction 85.87* 89.11 89.02 92.86 (86.26 – 99.46)
Individual Choice 46.90 54.66 60.09 56.42 (44.00 – 68.84)
Individual Inclusion 43.72* 48.05* 50.49* 56.83 (50.56 – 63.09)
Individual Dignity 82.28 88.82 87.25 88.10 (72.62 – 100.00)
Physical Quality 96.92 96.97 99.03 98.81 (96.48 – 100.00)
Family Satisfaction 90.54 92.50 90.61 -
86
47 44
82
979189
5548
8997 93
89
60
50
87
999193
56 57
88
99
0
20
40
60
80
100
120
SATISFACTION CHOICE INCLUSION DIGNITY PHYS QUAL FAM SAT
Scale Scores for State, Region, County, Provider
State NE Northampton RHD (Northampton)
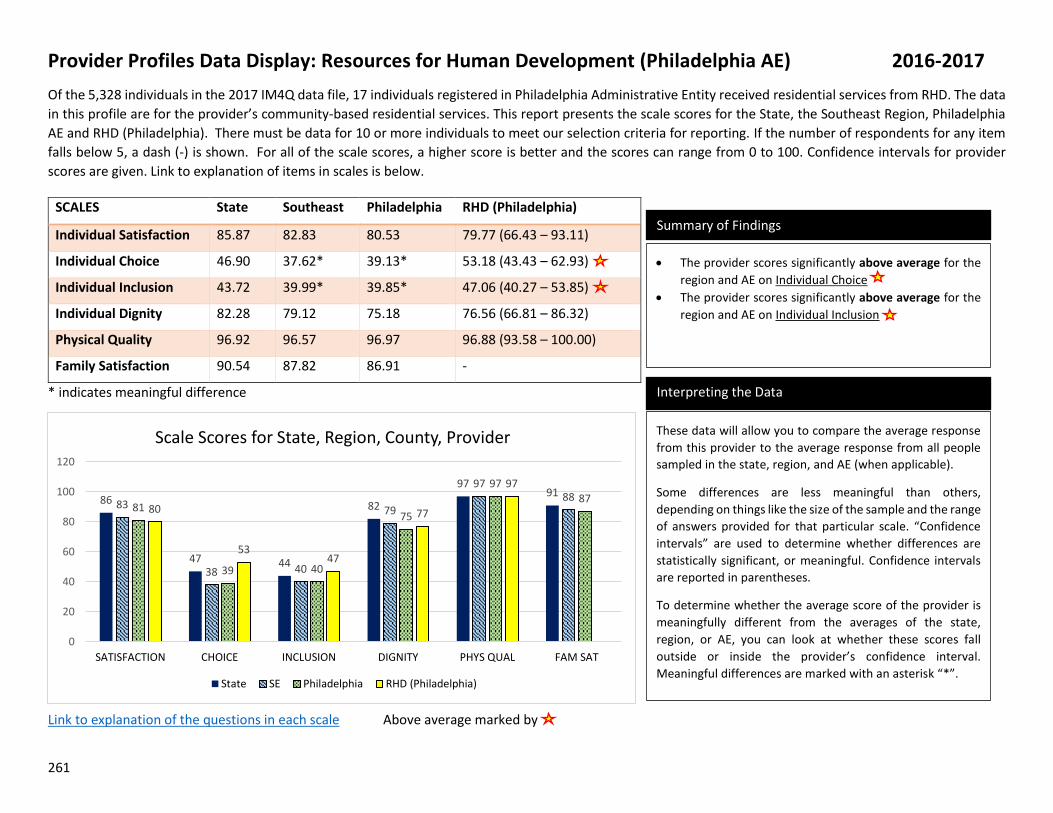
261
Interpreting the Data
These data will allow you to compare the average response
from this provider to the average response from all people
sampled in the state, region, and AE (when applicable).
Some differences are less meaningful than others,
depending on things like the size of the sample and the range
of answers provided for that particular scale. “Confidence
intervals” are used to determine whether differences are
statistically significant, or meaningful. Confidence intervals
are reported in parentheses.
To determine whether the average score of the provider is
meaningfully different from the averages of the state,
region, or AE, you can look at whether these scores fall
outside or inside the provider’s confidence interval.
Meaningful differences are marked with an asterisk “*”.
Summary of Findings
• The provider scores significantly above average for the
region and AE on Individual Choice
• The provider scores significantly above average for the
region and AE on Individual Inclusion
Provider Profiles Data Display: Resources for Human Development (Philadelphia AE) 2016-2017
Of the 5,328 individuals in the 2017 IM4Q data file, 17 individuals registered in Philadelphia Administrative Entity received residential services from RHD. The data
in this profile are for the provider’s community-based residential services. This report presents the scale scores for the State, the Southeast Region, Philadelphia
AE and RHD (Philadelphia). There must be data for 10 or more individuals to meet our selection criteria for reporting. If the number of respondents for any item
falls below 5, a dash (-) is shown. For all of the scale scores, a higher score is better and the scores can range from 0 to 100. Confidence intervals for provider
scores are given. Link to explanation of items in scales is below.
* indicates meaningful difference
Link to explanation of the questions in each scale Above average marked by
SCALES State Southeast Philadelphia RHD (Philadelphia)
Individual Satisfaction 85.87 82.83 80.53 79.77 (66.43 – 93.11)
Individual Choice 46.90 37.62* 39.13* 53.18 (43.43 – 62.93)
Individual Inclusion 43.72 39.99* 39.85* 47.06 (40.27 – 53.85)
Individual Dignity 82.28 79.12 75.18 76.56 (66.81 – 86.32)
Physical Quality 96.92 96.57 96.97 96.88 (93.58 – 100.00)
Family Satisfaction 90.54 87.82 86.91 -
86
47 44
82
9791
83
38 40
79
9788
81
39 40
75
9787
80
5347
77
97
0
20
40
60
80
100
120
SATISFACTION CHOICE INCLUSION DIGNITY PHYS QUAL FAM SAT
Scale Scores for State, Region, County, Provider
State SE Philadelphia RHD (Philadelphia)

262
Provider Profile Summary: Salvation Army www.pendel.salvationarmy.org
The mission of The Salvation Army’s Developmental Disabilities Program is to enable people with disabilities to live as citizens in their communities in an
atmosphere of dignity and respect. DDP is dedicated to serving the community by recognizing the gifts each person brings to community life and by supporting
their efforts to achieve their potential.
Unique programs are provided for each individual that meet their needs and provide them with the quality of life that they desire. New opportunities are provided
to grow and individuals are safe and content with their life.
The Salvation Army Developmental Disabilities Program (DDP) was founded in 1980 to transition adults with Intellectual/Developmental Disabilities and Autism
from institutions into community settings and continues to support individuals moving from their family or other residence into their own home in the community
with supports geared to individual needs.
Residential programs range from fully staffed for those who require assistance with all activities of daily living, to Supported/Independent Living programs, where
individuals with disabilities live on their own with minimal assistance for tasks such as bill paying, appointments, and shopping. In 1991, Supported Employment
and Community Based Day supports began.
Supported Employment assists individuals in gaining and maintaining jobs in their community. Jobs are matched to the individual’s skills and preferences, and a
job coach provides support as needed. Our Community Options day program provides volunteer opportunities with non-profit organizations, including
opportunities to develop job skills, opportunities for socialization and exposure to local cultural events and recreational activities. For over 35 years, services have
been provided to individuals requiring behavioral support, visual and hearing concerns, and any other supports needed throughout the lifespan including complex
medical needs and end of life care. We have been providing community-based day experiences for over 25 years, with many people in the community for 100%
of their day.
Staff receive individualized training to effectively communicate with the people they support using the individual’s preferred communication method. Training
may involve formal communication techniques or be based on an individual’s “Get to Know Me Book”, where specific sounds, facial expressions and body language
are cataloged for individuals to assist employees with understanding them.
We have DSPs who have been with the organization for over 35 years, who can assist in identifying community connections of value, where “everybody knows
your name”. Families of the people we support are encouraged to be active in the life of their family member. We seek their guidance in providing supports and
provide resources to help make the best choices with their family member. Comprehensive training is offered to our staff to address issues identified internally
or system-wide. Our Quality Assurance staff conduct monitorings of homes, programs, health care and staff interactions; those results combined with external
monitorings are used to improve the quality of services.
When a person chooses The Salvation Army’s Developmental Disabilities Program for their supports, we make a commitment to the person and their family to
provide all the supports they will need throughout their lifespan.

263
Interpreting the Data
These data will allow you to compare the average response
from this provider to the average response from all people
sampled in the state, region, and AE (when applicable).
Some differences are less meaningful than others,
depending on things like the size of the sample and the range
of answers provided for that particular scale. “Confidence
intervals” are used to determine whether differences are
statistically significant, or meaningful. Confidence intervals
are reported in parentheses.
To determine whether the average score of the provider is
meaningfully different from the averages of the state,
region, or AE, you can look at whether these scores fall
outside or inside the provider’s confidence interval.
Meaningful differences are marked with an asterisk “*”.
Summary of Findings
• The provider scores were not significantly different from
the average scores for the state or region.
Provider Profiles Data Display: Salvation Army (Statewide) 2016-2017
Of the 5,328 individuals in the 2017 IM4Q data file, 15 individuals registered in Pennsylvania received residential services from Salvation Army. The data in this
profile are for the provider’s community-based residential services. This report presents the scale scores for the State, the Southeast Region and Salvation Army
(Statewide). There must be data for 10 or more individuals to meet our selection criteria for reporting. If the number of respondents for any item falls below 5, a
dash (-) is shown. For all of the scale scores, a higher score is better and the scores can range from 0 to 100. Confidence intervals for provider scores are given.
Link to explanation of items in scales is below.
* indicates meaningful difference
Link to explanation of the questions in each scale Above average marked by
SCALES State SE Salvation Army
Individual Satisfaction 85.87 82.83 87.33 (77.85 – 96.82)
Individual Choice 46.90 37.62 44.69 (34.50 – 54.88)
Individual Inclusion 43.72 39.99 46.43 (39.14 – 53.72)
Individual Dignity 82.28 79.12 85.42 (74.39 – 96.44)
Physical Quality 96.92 96.57 97.78 (93.42 – 100.00)
Family Satisfaction 90.54 87.82 -
86
47 44
82
9791
83
38 40
79
978887
45 46
85
98
0
20
40
60
80
100
120
SATISFACTION CHOICE INCLUSION DIGNITY PHYS QUAL FAM SAT
Scale Scores for State, Region, County, Provider
State SE Salvation Army

264
Provider Profile Summary: Shared Support www.sharedsupport.org
Shared Support, Inc. was founded in April 2005 on the belief that adults and children living with intellectual and developmental disabilities are not defined by their
diagnosis and, with the proper support, are able to achieve their dreams and become valued members of their communities.
Person Centered Supports are the cornerstone of a quality life for the people who choose Shared Support. Person centered planning tools are used to listen to
people, as listening is key to developing personal outcomes. Once the focus person and the important people in their lives have identified a vision, action plans
and supports are developed in pursuit of a meaningful life. People have a continuous circle of support that they have chosen to help them direct their lives which
may include friends, family, and paid professionals from Shared Support and other organizations. The circle contributes to a monthly discussion about what is
working and what is not working for the focus person and promotes continuous, proactive support planning to assure the person's programming is dynamic and
effective. Progress towards personal outcomes is discussed and new strategies and action plans are developed. The circle pursues people's dreams and makes
important decisions.
Shared Support, Inc. specializes in the provision of life sharing services, the least restrictive and most community inclusive form of residential service delivery.
Shared Support provides services to people experiencing both complex behavioral health and physical health needs and employs masters level clinicians as well
as a nurse to ensure the delivery of exceptional support services.
Shared Support recognizes that there may be situations requiring a different level of support and offers Residential Habilitation. Residential Habilitation occurs in
community living arrangements that are specifically tailored to meet the needs of one person at a time. This means that each person will be the sole focus and
driver of their services, without the complexities associated with typical three and four-person community home settings.
Shared Support also specializes in a variety of community-based services. With Employment Services, we match the unique passions, strengths and skill sets of
those we support with the needs of local businesses or in the development of self-employment ventures. Our Employment Specialists provide career assessment,
job finding or development services, and job coaching and the ongoing support needed to effectively maintain competitive employment.
Community Participation Support is a flexible service designed to wrap around an individual’s community life interests and needs, while promoting increased
independence, potential for employment, and overall inclusion into the community.
Child Residential Therapeutic Support is provided to children and adolescents living with intellectual and developmental disabilities. Understanding that future
independence will differ among children, Shared Support assists with the development of goals and strategies to support each child in reaching their full potential.
Home and Community Supports services assist individuals in learning and developing new skills that will enhance opportunities for independence and inclusion.
Support may include the use of community resources and recreational facilities, volunteer opportunities, and assistance with daily living needs, medical
appointments and specialized therapies.

265
Interpreting the Data
These data will allow you to compare the average response
from this provider to the average response from all people
sampled in the state, region, and AE (when applicable).
Some differences are less meaningful than others,
depending on things like the size of the sample and the range
of answers provided for that particular scale. “Confidence
intervals” are used to determine whether differences are
statistically significant, or meaningful. Confidence intervals
are reported in parentheses.
To determine whether the average score of the provider is
meaningfully different from the averages of the state,
region, or AE, you can look at whether these scores fall
outside or inside the provider’s confidence interval.
Meaningful differences are marked with an asterisk “*”.
Summary of Findings
• The provider scores significantly above average for the
state on Individual Inclusion
• The provider scores significantly above average for the
state on Physical Quality
Provider Profiles Data Display: Shared Support (Statewide) 2016-2017
Of the 5,328 individuals in the 2017 IM4Q data file, 17 individuals registered in Pennsylvania received residential services from Shared Supports. The data in this
profile are for the provider’s community-based residential services. This report presents the scale scores for the State of Pennsylvania and Shared Supports
(Statewide). There must be data for 10 or more individuals to meet our selection criteria for reporting. If the number of respondents for any item falls below 5, a
dash (-) is shown. For all of the scale scores, a higher score is better and the scores can range from 0 to 100. Confidence intervals for provider scores are given.
Link to explanation of items in scales is below.
* indicates meaningful difference
Link to explanation of the questions in each scale Above average marked by
SCALES State Shared Supports
Individual Satisfaction 85.87 86.90 (78.06 – 95.75)
Individual Choice 46.90 52.71 (44.75 – 60.67)
Individual Inclusion 43.72* 55.39 (50.02 – 60.77)
Individual Dignity 82.28 87.82 (81.59 – 94.06)
Physical Quality 96.92* 100.00 (100.00 – 100.00)
Family Satisfaction 90.54 -
86
47 44
82
979187
53 55
88
100
0
20
40
60
80
100
120
SATISFACTION CHOICE INCLUSION DIGNITY PHYS QUAL FAM SAT
Scale Scores for State and Provider
State Shared Supports
266
Provider Profile Summary: Skills of Central PA www.skillsofcentralpa.org
Skills is committed to creating opportunities, providing choices and support, and promoting recovery to enhance all aspects of people's lives.
Skills guiding values: Empowerment, Quality, Integrity, Learning and Partnership. We were founded in 1960.
We offer: Residential Services Vocational Training Services Home and Community Habilitation In-home and Community Supports Employment Services Life Sharing
Services Behavioral Support Services Outpatient Drug & Alcohol Services Outpatient Mental Health Services Psychiatric Rehabilitation Services - site based and
mobile Peer Support Services Transportation.
We have extensive experience in working with all populations who have needs for services listed here.
All staff have reviewed and are oriented to the ISP for each person served. We create one-page profiles for people we support to assist staff. Provide necessary
training for staff to work with people who have specialized communication needs.
We offer people choice in their community participation. Also, offer alternative opportunities to expose people to new experiences such as volunteer work and
social activities.
Families are invited to participate in team meetings. Inform families with any changes with their family member. Family surveys Family members are on our board.
Our current quality improvement plan reflects the following: increase community participation; promote health, wellness, and safety; and develop and support
qualified staff. The Quality and Compliance Department is evaluating the plan for up-dates and/or revisions.
We are currently building a respite home in Blair County to meet the needs of people in Blair and surrounding counties. We are expanding our Peer Support
program to include Transitional Youth.

267
Interpreting the Data
These data will allow you to compare the average response
from this provider to the average response from all people
sampled in the state, region, and AE (when applicable).
Some differences are less meaningful than others,
depending on things like the size of the sample and the range
of answers provided for that particular scale. “Confidence
intervals” are used to determine whether differences are
statistically significant, or meaningful. Confidence intervals
are reported in parentheses.
To determine whether the average score of the provider is
meaningfully different from the averages of the state,
region, or AE, you can look at whether these scores fall
outside or inside the provider’s confidence interval.
Meaningful differences are marked with an asterisk “*”.
Summary of Findings
• The provider scores significantly above average for the
state on Individual Dignity
Provider Profiles Data Display: Skills of Central PA (Statewide) 2016-2017
Of the 5,328 individuals in the 2017 IM4Q data file, 59 individuals registered in Pennsylvania received residential services from Skills. The data in this profile are
for the provider’s community-based residential services. This report presents the scale scores for the State of Pennsylvania and Skills (Statewide). There must be
data for 10 or more individuals to meet our selection criteria for reporting. If the number of respondents for any item falls below 5, a dash (-) is shown. For all of
the scale scores, a higher score is better and the scores can range from 0 to 100. Confidence intervals for provider scores are given. Link to explanation of items in
scales is below.
* indicates meaningful difference
Link to explanation of the questions in each scale Above average marked by
SCALES State Skills
Individual Satisfaction 85.87 88.07 (83.20 – 92.94)
Individual Choice 46.90 45.79 (41.03 – 50.55)
Individual Inclusion 43.72 44.33 (40.29 – 48.36)
Individual Dignity 82.28* 87.16 (82.95 – 91.38)
Physical Quality 96.92 96.54 (93.58 – 99.51)
Family Satisfaction 90.54 93.30 (86.70 – 99.91)
86
47 44
82
979188
46 44
8797 93
0
20
40
60
80
100
120
SATISFACTION CHOICE INCLUSION DIGNITY PHYS QUAL FAM SAT
Scale Scores for State and Provider
State Skills

268
Interpreting the Data
These data will allow you to compare the average response
from this provider to the average response from all people
sampled in the state, region, and AE (when applicable).
Some differences are less meaningful than others,
depending on things like the size of the sample and the range
of answers provided for that particular scale. “Confidence
intervals” are used to determine whether differences are
statistically significant, or meaningful. Confidence intervals
are reported in parentheses.
To determine whether the average score of the provider is
meaningfully different from the averages of the state,
region, or AE, you can look at whether these scores fall
outside or inside the provider’s confidence interval.
Meaningful differences are marked with an asterisk “*”.
Summary of Findings
• The provider scores significantly above average for the
state, region and AE on Individual Satisfaction
• The provider scores significantly below average for the
region and AE on Individual Choice
• The provider scores significantly above average for the
state and region on Individual Inclusion
• The provider scores significantly above average for the
state, region and AE on Physical Quality
Provider Profiles Data Display: Skills of Central PA (Blair AE) 2016-2017
Of the 5,328 individuals in the 2017 IM4Q data file, 17 individuals registered in the Blair Administrative Entity received residential services from Skills. The data in
this profile are for the provider’s community-based residential services. This report presents the scale scores for the State, the Central Region, Blair AE and Skills
(Blair). There must be data for 10 or more individuals to meet our selection criteria for reporting. If the number of respondents for any item falls below 5, a dash
(-) is shown. For all of the scale scores, a higher score is better and the scores can range from 0 to 100. Confidence intervals for provider scores are given. Link to
explanation of items in scales is below.
* indicates meaningful difference
Link to explanation of the questions in each scale Above average marked by
SCALES State Central Blair Skills (Blair)
Individual Satisfaction 85.87* 87.85* 92.36* 97.71 (94.75 – 100.00)
Individual Choice 46.90 50.49* 51.60* 40.00 (30.85 – 49.14)
Individual Inclusion 43.72* 45.96* 49.87 53.70 (46.55 – 60.85)
Individual Dignity 82.28 83.59 90.02 85.71 (77.19 – 94.23)
Physical Quality 96.92 97.07 94.93 100.00 (100.00 – 100.00)
Family Satisfaction 90.54 91.74 90.42 -
86
47 44
82
979188
50 46
84
979292
52 50
9095
9098
40
54
86
100
00
20
40
60
80
100
120
SATISFACTION CHOICE INCLUSION DIGNITY PHYS QUAL FAM SAT
Scale Scores for State, Region, County, Provider
State Central Blair Skills (Blair)
269
Provider Profile Summary: Southwinds www.southwindsinc.org
Southwinds' mission is to provide residencies for intellectually and developmentally disabled persons in the community, while enhancing their quality of life and
offering opportunities for specialized programming, social involvement, and independence. Southwinds will provide the highest quality care of our residents
through innovative solutions and impactful individualized services and experiences that will enrich their lives and enable them to age in place in their homes
throughout the various stages of adult life.
Our guiding values are Choice, Control, Quality of Life, Stability, Safety, Individuality, Relationships, Freedom, Success, Contributing to the Community,
Accountability, Mentoring, Collaboration, and Community Integration.
We have been supporting individuals for more than 37 years.
Southwinds provides residential homes for individuals with intellectual disabilities.
Southwinds provides residencies for all individuals regardless of needs.
Our staff receive training when an individual requires specialized communication needs. For example, if an individual utilizes a communication device, they will be
trained on how to utilize the device.
Our individuals are encouraged to do grocery shopping and their own banking. They participate in different activities depending on their likes. Our individuals go
to Kennywood, the Zoo, museums, restaurants, fundraising events, community benefits, etc. Our residents are encouraged to speak for themselves rather than
staff speaking for them.
Southwinds has always encouraged family involvement. In fact, Southwinds was initially started by family members. Families are involved in annual parties and
events. Families are also encouraged to be a part of their family members’ lives as much as possible.
Southwinds is always striving to offer the best practices to enhance the lives of our individuals; as well as, assisting our staff with better training and tools to
complete their jobs effectively. Southwinds has opened several locations for handicapped accessibility; we have incorporated a computer-based program for
program documentation and medication training; we offer a Certified Nursing Assistant program; and we provide ongoing residential inspections to ensure quality
and compliance.
Southwinds has always been an agency that has provided a family-oriented atmosphere. Our staff are dedicated to providing the best care to our individuals and
ensuring their health and safety.

270
Interpreting the Data
These data will allow you to compare the average response
from this provider to the average response from all people
sampled in the state, region, and AE (when applicable).
Some differences are less meaningful than others,
depending on things like the size of the sample and the range
of answers provided for that particular scale. “Confidence
intervals” are used to determine whether differences are
statistically significant, or meaningful. Confidence intervals
are reported in parentheses.
To determine whether the average score of the provider is
meaningfully different from the averages of the state,
region, or AE, you can look at whether these scores fall
outside or inside the provider’s confidence interval.
Meaningful differences are marked with an asterisk “*”.
Summary of Findings
• The provider scores significantly below average for the
region on Individual Choice
• The provider scores significantly below average for the
state and region on Individual Inclusion
• The provider scores significantly below average for the
state and region on Individual Dignity
• The provider scores significantly above average for the
AE on Individual Dignity
• The provider scores significantly above average for the
state and region on Physical Quality
Provider Profiles Data Display: Southwinds (Allegheny AE) 2016-2017
Of the 5,328 individuals in the 2017 IM4Q data file, 20 individuals registered in Allegheny Administrative Entity received residential services from Southwinds. The
data in this profile are for the provider’s community-based residential services. This report presents the scale scores for the State, the Western Region, Allegheny
AE and Southwinds (Allegheny). There must be data for 10 or more individuals to meet our selection criteria for reporting. If the number of respondents for any
item falls below 5, a dash (-) is shown. For all of the scale scores, a higher score is better and the scores can range from 0 to 100. Confidence intervals for provider
scores are given. Link to explanation of items in scales is below.
* indicates meaningful difference **Statewide and AE specific data is the same for this provider
Link to explanation of the questions in each scale Above average marked by
SCALES State West Allegheny Southwinds (Allegheny)**
Individual Satisfaction 85.87 85.05 82.82 88.82 (79.05 – 98.59)
Individual Choice 46.90 49.35* 46.36 41.09 (33.95 – 48.24)
Individual Inclusion 43.72* 43.58* 41.23 35.48 (29.70 – 41.25)
Individual Dignity 82.28* 80.22* 71.61* 75.00 (75.00 – 75.00)
Physical Quality 96.92* 97.13* 97.86 99.17 (97.53 – 100.00)
Family Satisfaction 90.54 91.79 80.03 -
86
47 44
82
9791
85
4944
80
9792
83
4641
72
98
8089
4135
75
99
0
20
40
60
80
100
120
SATISFACTION CHOICE INCLUSION DIGNITY PHYS QUAL FAM SAT
Scale Scores for State, Region, County, Provider
State West Allegheny Southwinds (Allegheny)

271
Provider Profile Summary: Spectrum Community Services www.spectrumcommunityservices.org
Spectrum Community Services, Inc. provides quality and individual services to persons with disabilities to achieve greater independence and enriched quality of
life.
Our vision is to continue to improve our services and supports that focus on an individual’s unique needs, expressed preferences, and decisions concerning his or
her own life.
We have been supporting people for approximately 20 years.
Services and supports we offer include 21 Community group homes, life sharing for living opportunities in homes of community members, and day adult programs.
Staff are trained above and beyond state requirements to effectively communicate with individuals we serve no matter what their communication abilities might
be, including deaf/hard of hearing, nonverbal, etc.
We engage in community outings as a daily, regular part of the activities of all of those we serve, to the extent that they wish to be out in the community. We
engage them in activities they choose.
We meet with the ‘teams’ of the individuals we serve that include family members and encourage all positive interaction that is possible between those we serve
and their families, including regular visits where appropriate.
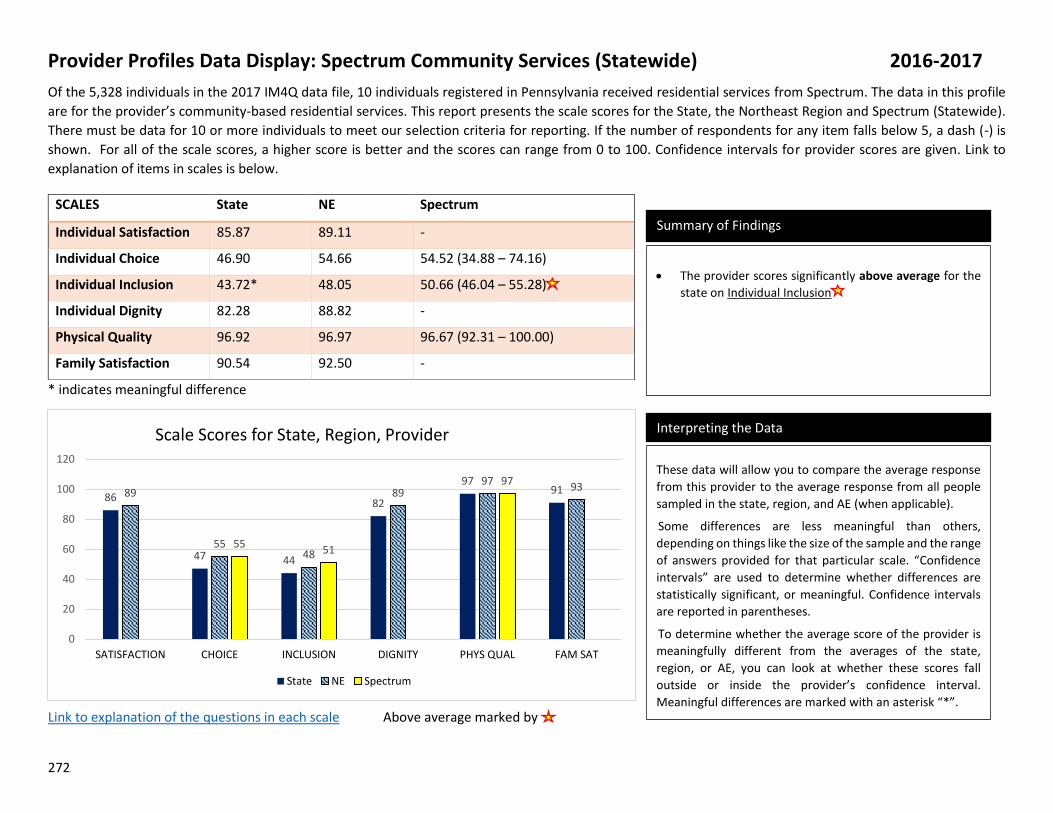
272
Interpreting the Data
These data will allow you to compare the average response
from this provider to the average response from all people
sampled in the state, region, and AE (when applicable).
Some differences are less meaningful than others,
depending on things like the size of the sample and the range
of answers provided for that particular scale. “Confidence
intervals” are used to determine whether differences are
statistically significant, or meaningful. Confidence intervals
are reported in parentheses.
To determine whether the average score of the provider is
meaningfully different from the averages of the state,
region, or AE, you can look at whether these scores fall
outside or inside the provider’s confidence interval.
Meaningful differences are marked with an asterisk “*”.
Summary of Findings
• The provider scores significantly above average for the
state on Individual Inclusion
Provider Profiles Data Display: Spectrum Community Services (Statewide) 2016-2017
Of the 5,328 individuals in the 2017 IM4Q data file, 10 individuals registered in Pennsylvania received residential services from Spectrum. The data in this profile
are for the provider’s community-based residential services. This report presents the scale scores for the State, the Northeast Region and Spectrum (Statewide).
There must be data for 10 or more individuals to meet our selection criteria for reporting. If the number of respondents for any item falls below 5, a dash (-) is
shown. For all of the scale scores, a higher score is better and the scores can range from 0 to 100. Confidence intervals for provider scores are given. Link to
explanation of items in scales is below.
* indicates meaningful difference
Link to explanation of the questions in each scale Above average marked by
SCALES State NE Spectrum
Individual Satisfaction 85.87 89.11 -
Individual Choice 46.90 54.66 54.52 (34.88 – 74.16)
Individual Inclusion 43.72* 48.05 50.66 (46.04 – 55.28)
Individual Dignity 82.28 88.82 -
Physical Quality 96.92 96.97 96.67 (92.31 – 100.00)
Family Satisfaction 90.54 92.50 -
86
47 44
82
979189
5548
8997
93
5551
97
0
20
40
60
80
100
120
SATISFACTION CHOICE INCLUSION DIGNITY PHYS QUAL FAM SAT
Scale Scores for State, Region, Provider
State NE Spectrum

273
Provider Profile Summary: SPIN www.spininc.org
SPIN’s mission is to provide the highest quality people-first services and supports for children and adults with intellectual, developmental, and autism spectrum
disabilities so that each may achieve and enjoy a life of possibilities. Our vision is a world that values, respects and includes everyone. SPIN’s four Pillars of People-
First, Professionalism, Performance Excellence and Productivity are our guiding values. Our philosophy has always been rooted in families, inclusion and promoting
people’s highest potential.
Since 1970, SPIN specializes in lifespan services to support people with developmental, intellectual disability, complex behavioral and medical needs, and autism.
SPIN is highly regarded as a top provider of human services. Together with a caring and committed team, SPIN supports thousands of children and adults across
the lifespan in Philadelphia and Lehigh regions to live a life of possibilities at home, in school, at work, and in the community.
SPIN provides Early Intervention, an Autism Center for Excellence for children age 2-21, Transition services, Adult services including: Employment, Community
Participation, Residential, Lifesharing services and Therapeutic Recreation. SPIN’s highly qualified staff are experienced in assessing people’s interests and
developing connections within the community. SPIN has expertise in supporting people with intellectual disability, behavioral support needs, complex medical
needs, autism within community settings.
Developing communication skills with people who have various abilities and needs is a priority in SPIN’s training and ongoing support and development of our
staff. Staff learn that behavior is a form of communication and they utilize positive approaches to assure that each person has a voice for their self-determined
needs and wants. SPIN identifies each person’s preferred communication and trains our staff on the individualized methods of the people they support.
Involvement with and in community has always been a hallmark of SPIN. We develop community partnerships to support people to participate in meaningful
opportunities, where they can be valued members of their communities. SPIN assesses each person’s interests and develops individualized plans based on
preferences for community involvement. We support people to develop skills and opportunities they need to build relationships, make choices and above all stay
healthy, happy and safe.
SPIN has open, caring relationships with families and prioritizes their importance in people’s lives. In addition to ongoing, open communication, SPIN holds family
meetings and gatherings. We work with families to meet their changing needs.
Quality improvement projects include: Increase people’s engagement in valued and inclusive activities in the community; Increase safety of individuals with
behavioral health diagnoses through additional staff training; Improve people’s health through early identification of risk for dementia and dysphagia.
SPIN has a dedicated team with a 24/7 on site management oversight structure supporting our services. SPIN has been named as a Top Workplace for 9 consecutive
years. SPIN cultivates a high performing, stable workforce that engages the highest quality service. SPIN’s Direct Support turnover and vacancy rates are
significantly lower than the state average. SPIN does not use temps from staffing agencies to cover for our Direct Support Professionals.

274
Interpreting the Data
These data will allow you to compare the average response
from this provider to the average response from all people
sampled in the state, region, and AE (when applicable).
Some differences are less meaningful than others,
depending on things like the size of the sample and the range
of answers provided for that particular scale. “Confidence
intervals” are used to determine whether differences are
statistically significant, or meaningful. Confidence intervals
are reported in parentheses.
To determine whether the average score of the provider is
meaningfully different from the averages of the state,
region, or AE, you can look at whether these scores fall
outside or inside the provider’s confidence interval.
Meaningful differences are marked with an asterisk “*”.
Summary of Findings
• The provider scores significantly above average for the
region on Individual Choice
• The provider scores significantly above average for the
region on Individual Inclusion
• The provider scores significantly below average for the
state and region on Individual Dignity
• The provider scores significantly above average for the
state and region on Physical Quality
Provider Profiles Data Display: SPIN (Statewide) 2016-2017
Of the 5,328 individuals in the 2017 IM4Q data file, 69 individuals registered in Pennsylvania received residential services from SPIN. The data in this profile are
for the provider’s community-based residential services. This report presents the scale scores for the State, the Southeast Region, and SPIN (Statewide). There
must be data for 10 or more individuals to meet our selection criteria for reporting. If the number of respondents for any item falls below 5, a dash (-) is shown.
For all of the scale scores, a higher score is better and the scores can range from 0 to 100. Confidence intervals for provider scores are given. Link to explanation
of items in scales is below.
* indicates meaningful difference
Link to explanation of the questions in each scale Above average marked by
SCALES State SE SPIN
Individual Satisfaction 85.87 82.83 82.57 (75.11 – 90.02)
Individual Choice 46.90 37.62* 45.81 (41.88 – 49.75)
Individual Inclusion 43.72 39.99* 45.84 (42.41 – 49.26)
Individual Dignity 82.28* 79.12* 71.74 (65.16 – 78.33)
Physical Quality 96.92* 96.57* 98.41 (97.16 – 99.65)
Family Satisfaction 90.54 87.82 76.63 (59.70 – 93.56)
86
47 44
82
9791
83
38 40
79
9788
83
46 46
72
98
77
0
20
40
60
80
100
120
SATISFACTION CHOICE INCLUSION DIGNITY PHYS QUAL FAM SAT
Scale Scores for State, Region, and Provider
State SE SPIN

275
Interpreting the Data
These data will allow you to compare the average response
from this provider to the average response from all people
sampled in the state, region, and AE (when applicable).
Some differences are less meaningful than others,
depending on things like the size of the sample and the range
of answers provided for that particular scale. “Confidence
intervals” are used to determine whether differences are
statistically significant, or meaningful. Confidence intervals
are reported in parentheses.
To determine whether the average score of the provider is
meaningfully different from the averages of the state,
region, or AE, you can look at whether these scores fall
outside or inside the provider’s confidence interval.
Meaningful differences are marked with an asterisk “*”.
Summary of Findings
• The provider scores significantly above average for the
region and AE on Individual Choice
• The provider scores significantly above average for the
region and AE on Individual Inclusion
• The provider scores significantly below average for the
state and region on Individual Dignity
• The provider scores significantly above average for the
state, region and AE on Physical Quality
Provider Profiles Data Display: SPIN (Philadelphia AE) 2016-2017
Of the 5,328 individuals in the 2017 IM4Q data file, 67 individuals registered in Philadelphia Administrative Entity received residential services from SPIN. The data
in this profile are for the provider’s community-based residential services. This report presents the scale scores for the State, the Southeast Region, Philadelphia
AE and SPIN (Philadelphia). There must be data for 10 or more individuals to meet our selection criteria for reporting. If the number of respondents for any item
falls below 5, a dash (-) is shown. For all of the scale scores, a higher score is better and the scores can range from 0 to 100. Confidence intervals for provider
scores are given. Link to explanation of items in scales is below.
* indicates meaningful difference
Link to explanation of the questions in each scale Above average marked by
SCALES State SE Philadelphia SPIN (Philadelphia)
Individual Satisfaction 85.87 82.83 80.53 83.01 (75.40 – 90.62)
Individual Choice 46.90 37.62* 39.13* 45.58 (41.53 – 49.63)
Individual Inclusion 43.72 39.99* 39.85* 45.15 (41.79 – 48.50)
Individual Dignity 82.28* 79.12* 75.18 72.45 (65.79 – 79.10)
Physical Quality 96.92* 96.57* 96.97* 98.36 (97.08 – 99.64)
Family Satisfaction 90.54 87.82 86.91 76.63 (59.70 – 93.56)
86
47 44
82
9791
83
38 40
79
9788
81
39 40
75
9787
83
46 45
72
98
77
0
20
40
60
80
100
120
SATISFACTION CHOICE INCLUSION DIGNITY PHYS QUAL FAM SAT
Scale Scores for State, Region, County, Provider
State SE Philadelphia SPIN (Philadelphia)

276
Provider Profile Summary: St. Joseph's Center www.stjosephscenter.org
St. Joseph's Center is an independent Catholic agency sponsored by the congregation of the sisters, Servants of the Immaculate Heart of Mary. As such, it is the
desire to help others and to respond with dignity and love to the ever-changing needs in the community. The Center strives to provide individuals and families
who have special needs the opportunity to develop their abilities and potential to the fullest extent possible.
Care, Concern, Compassion and Commitment are the core values imbedded in all of the varied services and supports provided by St. Joseph's Center.
St. Joseph's Center has been meeting community needs for 130 years. What began as a home for homeless children, grew into a maternity shelter and later into
adoption agency and orphanage. In 1950 a decision was made to admit children to the home with developmental disabilities. From that point on, St. Joseph's has
expanded to include various residential and community services to meet the unmet needs and changing philosophies of care.
90% of individuals receiving residential and adult day services are non-ambulatory, need total assistance for personal care, and do not use words to communicate.
Approximately 35% receiving nutrition via gastrostomy tube and many have medically compromising conditions. In residential services the goal is to provide an
everyday life for those entrusted to St. Joseph's Center’s care. All services strive to recognize each person's unique gifts and abilities and offer supports that will
assist each individual in personal growth, enhance his/her quality of life and remain safe, healthy and secure while exercising choice and control in their own lives.
The Center does this through ICF/ID, Community Residential and Supported Independent Living services.
The Community Support Services Department provides support to individuals who live independently or with their family. An array of activities, such as going to
the movies, going to the library, training on public transportation, grocery shopping, etc., are offered to enhance life skills and help individuals stay engaged in
their community. Through Adult Day Services individuals receive a combination of both facility-based and community engagement activities. Time spent in the
facility is focused on shared interest, i.e. cooking or gardening groups, while Community Participation Services offer the individual a variety of options for
meaningful interactions with the community, such as volunteering or taking classes.
Staff are trained in each person's preferred method of communication. Fostering of strong relationships between the individual and staff is encouraged, as it is
vital to understanding the non-verbal cues of the majority of individuals served. The creation of a career ladder through Collage of Direct Support demonstrates a
commitment to retaining those staff who provide person centered care.
We engage people through thoughtful discussion with the person, as well as those accompanying him/her, assist in discerning personal interests. Dialogues
concerning: what did the individual like about an activity, what did not work for the individual, was the activity too long or short, etc. are key in providing meaningful
community engagement activities.
Open and honest communication with family members is paramount to quality service provision. Phone calls, daily emails, Skype, progress reports, are but a few
means in assisting families to feel engaged and part of their son/daughter’s life.

277
Interpreting the Data
These data will allow you to compare the average response
from this provider to the average response from all people
sampled in the state, region, and AE (when applicable).
Some differences are less meaningful than others,
depending on things like the size of the sample and the range
of answers provided for that particular scale. “Confidence
intervals” are used to determine whether differences are
statistically significant, or meaningful. Confidence intervals
are reported in parentheses.
To determine whether the average score of the provider is
meaningfully different from the averages of the state,
region, or AE, you can look at whether these scores fall
outside or inside the provider’s confidence interval.
Meaningful differences are marked with an asterisk “*”.
Summary of Findings
• The provider scores significantly below average for the
state on Individual Choice
• The provider scores significantly below average for the
state on Individual Inclusion
• The provider scores significantly above average for the
state on Physical Quality
Provider Profiles Data Display: St. Joseph's Center (Statewide) 2016-2017
Of the 5,328 individuals in the 2017 IM4Q data file, 29 individuals registered in Pennsylvania received residential services from St. Joseph’s. The data in this profile
are for the provider’s private ICF 16+ and community-based residential services. This report presents the scale scores for the State of Pennsylvania and St. Joseph’s
(Statewide). There must be data for 10 or more individuals to meet our selection criteria for reporting. If the number of respondents for any item falls below 5, a
dash (-) is shown. For all of the scale scores, a higher score is better and the scores can range from 0 to 100. Confidence intervals for provider scores are given.
Link to explanation of items in scales is below.
* indicates meaningful difference
Link to explanation of the questions in each scale Above average marked by
SCALES State St. Joseph’s
Individual Satisfaction 85.87 -
Individual Choice 46.90* 26.67 (19.19 – 34.16)
Individual Inclusion 43.72* 25.96 (20.59 – 31.33)
Individual Dignity 82.28 -
Physical Quality 96.92* 98.81 (97.19 – 100.00)
Family Satisfaction 90.54 93.23 (87.22 – 99.23)
86
47 44
82
9791
27 26
9993
0
20
40
60
80
100
120
SATISFACTION CHOICE INCLUSION DIGNITY PHYS QUAL FAM SAT
Scale Scores for State and Provider
State St. Joseph's
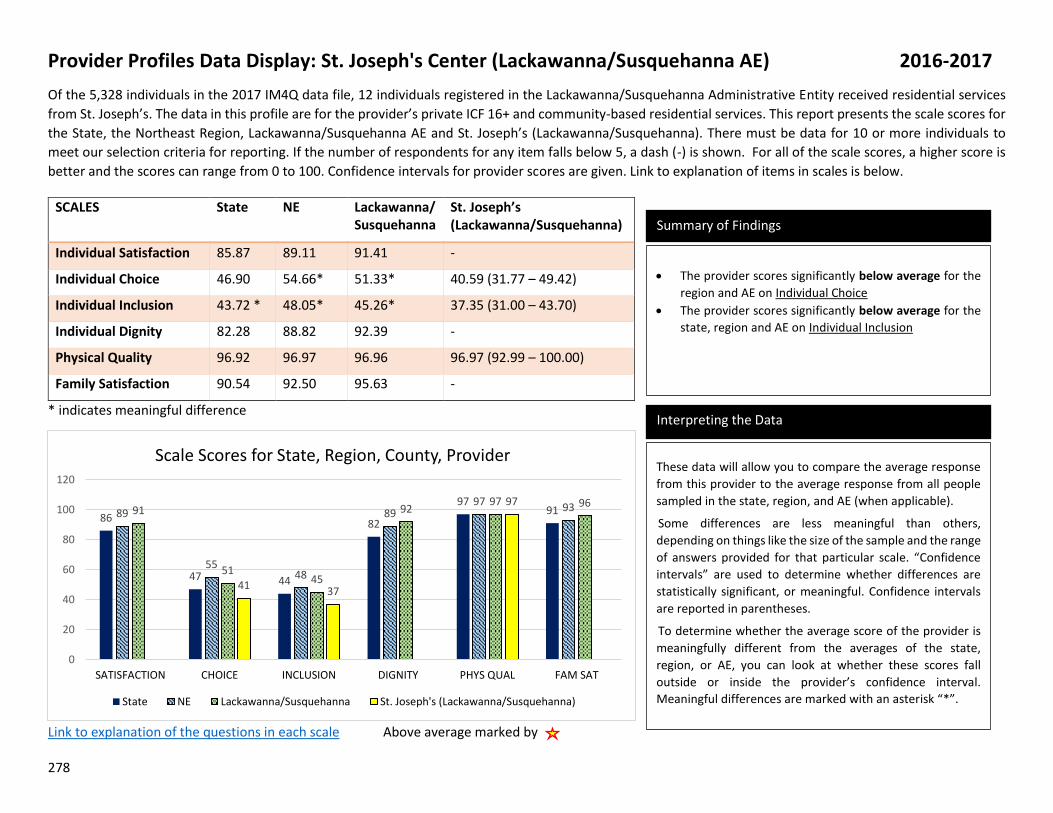
278
Interpreting the Data
These data will allow you to compare the average response
from this provider to the average response from all people
sampled in the state, region, and AE (when applicable).
Some differences are less meaningful than others,
depending on things like the size of the sample and the range
of answers provided for that particular scale. “Confidence
intervals” are used to determine whether differences are
statistically significant, or meaningful. Confidence intervals
are reported in parentheses.
To determine whether the average score of the provider is
meaningfully different from the averages of the state,
region, or AE, you can look at whether these scores fall
outside or inside the provider’s confidence interval.
Meaningful differences are marked with an asterisk “*”.
Summary of Findings
• The provider scores significantly below average for the
region and AE on Individual Choice
• The provider scores significantly below average for the
state, region and AE on Individual Inclusion
Provider Profiles Data Display: St. Joseph's Center (Lackawanna/Susquehanna AE) 2016-2017
Of the 5,328 individuals in the 2017 IM4Q data file, 12 individuals registered in the Lackawanna/Susquehanna Administrative Entity received residential services
from St. Joseph’s. The data in this profile are for the provider’s private ICF 16+ and community-based residential services. This report presents the scale scores for
the State, the Northeast Region, Lackawanna/Susquehanna AE and St. Joseph’s (Lackawanna/Susquehanna). There must be data for 10 or more individuals to
meet our selection criteria for reporting. If the number of respondents for any item falls below 5, a dash (-) is shown. For all of the scale scores, a higher score is
better and the scores can range from 0 to 100. Confidence intervals for provider scores are given. Link to explanation of items in scales is below.
* indicates meaningful difference
Link to explanation of the questions in each scale Above average marked by
SCALES State NE Lackawanna/ Susquehanna
St. Joseph’s (Lackawanna/Susquehanna)
Individual Satisfaction 85.87 89.11 91.41 -
Individual Choice 46.90 54.66* 51.33* 40.59 (31.77 – 49.42)
Individual Inclusion 43.72 * 48.05* 45.26* 37.35 (31.00 – 43.70)
Individual Dignity 82.28 88.82 92.39 -
Physical Quality 96.92 96.97 96.96 96.97 (92.99 – 100.00)
Family Satisfaction 90.54 92.50 95.63 -
86
47 44
82
979189
5548
8997
9391
5145
9297 96
4137
97
0
20
40
60
80
100
120
SATISFACTION CHOICE INCLUSION DIGNITY PHYS QUAL FAM SAT
Scale Scores for State, Region, County, Provider
State NE Lackawanna/Susquehanna St. Joseph's (Lackawanna/Susquehanna)
279
Provider Profile Summary: Step By Step www.stepbystepusa.com
Opening Doors to Independence and Opportunity is our mission. Our guiding values are: Belief in a person’s potential for growth; Belief in the value of community
participation; Belief in the value of a professional and caring staff; Belief in the value of diversity; and Belief in the value of creativity and innovation.
As a pioneer in the development of community group homes in the late 70’s, we have provided safe, supervised, home-like settings for individuals with intellectual
disabilities and Autism for over 40 years. Step By Step, Inc., assists individuals who want to live in a home by themselves or with roommates. We offer 24 hour or
part time assistance, based on need. We teach life skills in the home and community and help individuals maximize their potential. We will help find a family to
share their life with through our Lifesharing service. We support individuals through employment/ job coaching opportunities, day support services and community
integration.
Our special expertise includes Behavioral Services, Employment Services, Autism Spectrum supports, and supporting people with Complex Medical Needs. We
maximize internal resources, utilize external resources, and conduct assessments/evaluations to identify communication needs. Ensuring staff are effectively
communicating with people they support can be achieved, in part, through assessment of an individual’s level of satisfaction and happiness.
We provide staff the training, tools, and support that promote community participation, encourage community volunteerism, and encourage community
connections. We encourage families to be active partners in supporting their relative. We invite families to participate in planning; encourage visits to the home
or community events; celebrate special occasions; and share vacation and holiday opportunities with their loved ones.
Of the various quality improvement projects including staff and individual satisfaction, exit surveys, and compliance reviews, our recent campaign to address
reportable incidents stands out. Our “Protect and Respect” Campaign ensures the people we serve receive support in an environment that prioritizes health and
safety.
Our management team has a combined 200+ years of experience and leadership. In addition, we have caring, compassionate, and well-trained staff providing
support and guidance to individuals in their homes.
Each person’s uniqueness sets the tone for what a typical day looks like for a person we support. Making decisions of what to wear; spending time with family and
friends; attending church; enjoying dinner at a favorite restaurant are part of a person’s day.
Our history of initiating and participating in community awareness activities is evidenced by: Providing books to local school libraries on people with disabilities,
developing Advisory Committees, Chamber of Commerce memberships, and Day of Caring projects.
As a member of several Provider Associations, we strongly advocate for the Human Service community. Over 40 years into its mission, we continue to provide a
broad spectrum of services administered by a multidiscipline professional team with a singular focus on improving the quality of life for people with disabilities.
Step By Step, Inc. is a private, not for profit, community based human services provider that has maintained CARF accreditation since 2000.

280
Interpreting the Data
These data will allow you to compare the average response
from this provider to the average response from all people
sampled in the state, region, and AE (when applicable).
Some differences are less meaningful than others,
depending on things like the size of the sample and the range
of answers provided for that particular scale. “Confidence
intervals” are used to determine whether differences are
statistically significant, or meaningful. Confidence intervals
are reported in parentheses.
To determine whether the average score of the provider is
meaningfully different from the averages of the state,
region, or AE, you can look at whether these scores fall
outside or inside the provider’s confidence interval.
Meaningful differences are marked with an asterisk “*”.
Summary of Findings
• The provider scores significantly below average for the
state on Individual Choice
Provider Profiles Data Display: Step By Step (Statewide) 2016-2017
Of the 5,328 individuals in the 2017 IM4Q data file, 88 individuals registered in Pennsylvania received residential services from Step By Step. The data in this profile
are for the provider’s community-based residential services. This report presents the scale scores for the State of Pennsylvania and Step By Step (Statewide). There
must be data for 10 or more individuals to meet our selection criteria for reporting. If the number of respondents for any item falls below 5, a dash (-) is shown.
For all of the scale scores, a higher score is better and the scores can range from 0 to 100. Confidence intervals for provider scores are given. Link to explanation
of items in scales is below.
* indicates meaningful difference
Link to explanation of the questions in each scale Above average marked by
SCALES State Step BY Step
Individual Satisfaction 85.87 86.02 (79.98 – 92.06)
Individual Choice 46.90* 38.55 (33.84 – 43.26)
Individual Inclusion 43.72 41.27 (37.95 – 44.60)
Individual Dignity 82.28 79.91 (75.16 – 84.67)
Physical Quality 96.92 98.24 (96.89 – 99.58)
Family Satisfaction 90.54 83.15 (70.89 – 95.41)
86
47 44
82
9791
86
39 41
80
98
83
0
20
40
60
80
100
120
SATISFACTION CHOICE INCLUSION DIGNITY PHYS QUAL FAM SAT
Scale Scores for State and Provider
State Step By Step
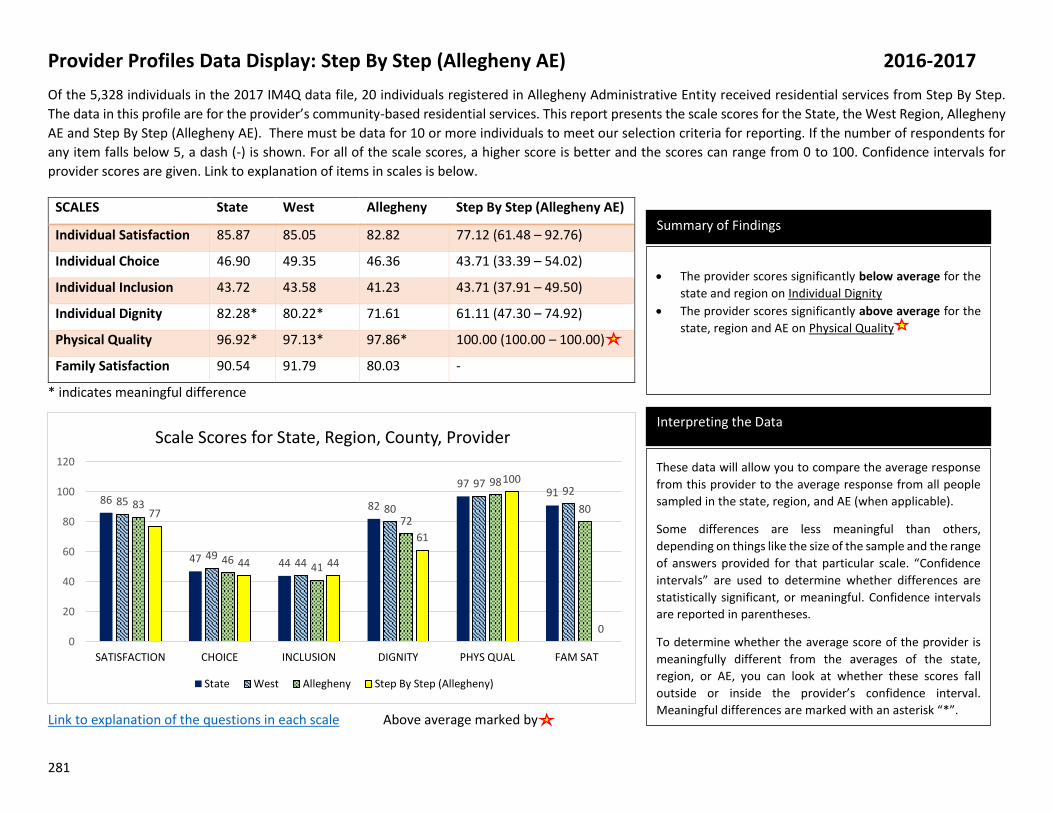
281
Interpreting the Data
These data will allow you to compare the average response
from this provider to the average response from all people
sampled in the state, region, and AE (when applicable).
Some differences are less meaningful than others,
depending on things like the size of the sample and the range
of answers provided for that particular scale. “Confidence
intervals” are used to determine whether differences are
statistically significant, or meaningful. Confidence intervals
are reported in parentheses.
To determine whether the average score of the provider is
meaningfully different from the averages of the state,
region, or AE, you can look at whether these scores fall
outside or inside the provider’s confidence interval.
Meaningful differences are marked with an asterisk “*”.
Summary of Findings
• The provider scores significantly below average for the
state and region on Individual Dignity
• The provider scores significantly above average for the
state, region and AE on Physical Quality
Provider Profiles Data Display: Step By Step (Allegheny AE) 2016-2017
Of the 5,328 individuals in the 2017 IM4Q data file, 20 individuals registered in Allegheny Administrative Entity received residential services from Step By Step.
The data in this profile are for the provider’s community-based residential services. This report presents the scale scores for the State, the West Region, Allegheny
AE and Step By Step (Allegheny AE). There must be data for 10 or more individuals to meet our selection criteria for reporting. If the number of respondents for
any item falls below 5, a dash (-) is shown. For all of the scale scores, a higher score is better and the scores can range from 0 to 100. Confidence intervals for
provider scores are given. Link to explanation of items in scales is below.
* indicates meaningful difference
Link to explanation of the questions in each scale Above average marked by
SCALES State West Allegheny Step By Step (Allegheny AE)
Individual Satisfaction 85.87 85.05 82.82 77.12 (61.48 – 92.76)
Individual Choice 46.90 49.35 46.36 43.71 (33.39 – 54.02)
Individual Inclusion 43.72 43.58 41.23 43.71 (37.91 – 49.50)
Individual Dignity 82.28* 80.22* 71.61 61.11 (47.30 – 74.92)
Physical Quality 96.92* 97.13* 97.86* 100.00 (100.00 – 100.00)
Family Satisfaction 90.54 91.79 80.03 -
86
47 44
82
9791
85
4944
80
9792
83
4641
72
98
8077
44 44
61
100
00
20
40
60
80
100
120
SATISFACTION CHOICE INCLUSION DIGNITY PHYS QUAL FAM SAT
Scale Scores for State, Region, County, Provider
State West Allegheny Step By Step (Allegheny)

282
Interpreting the Data
These data will allow you to compare the average response
from this provider to the average response from all people
sampled in the state, region, and AE (when applicable).
Some differences are less meaningful than others,
depending on things like the size of the sample and the range
of answers provided for that particular scale. “Confidence
intervals” are used to determine whether differences are
statistically significant, or meaningful. Confidence intervals
are reported in parentheses.
To determine whether the average score of the provider is
meaningfully different from the averages of the state,
region, or AE, you can look at whether these scores fall
outside or inside the provider’s confidence interval.
Meaningful differences are marked with an asterisk “*”.
Summary of Findings
• The provider scores significantly below average for the
state, region and the AE on Individual Choice
• The provider scores significantly below average for the
state and region on Individual Inclusion
Provider Profiles Data Display: Step By Step (Delaware AE) 2016-2017
Of the 5,328 individuals in the 2017 IM4Q data file, 13 individuals registered in Delaware Administrative Entity received residential services from Step By Step. The
data in this profile are for the provider’s community-based residential services. This report presents the scale scores for the State, the Southeast Region, Delaware
AE and Step By Step (Delaware). There must be data for 10 or more individuals to meet our selection criteria for reporting. If the number of respondents for any
item falls below 5, a dash (-) is shown. For all of the scale scores, a higher score is better and the scores can range from 0 to 100. Confidence intervals for provider
scores are given. Link to explanation of items in scales is below.
* indicates meaningful difference
Link to explanation of the questions in each scale Above average marked by
SCALES State Southeast Delaware Step BY Step (Delaware)
Individual Satisfaction 85.87 82.83 85.90 -
Individual Choice 46.90* 37.62* 31.93* 18.44 (8.89 – 28.00)
Individual Inclusion 43.72* 39.99* 35.43 33.49 (28.03 – 38.94)
Individual Dignity 82.28 79.12 82.56 -
Physical Quality 96.92 96.57 96.98 96.15 (92.18 – 100.00)
Family Satisfaction 90.54 87.82 86.86 87.39 (75.11 – 99.66)
86
47 44
82
9791
83
38 40
79
978886
32 35
83
9787
18
33
9687
0
20
40
60
80
100
120
SATISFACTION CHOICE INCLUSION DIGNITY PHYS QUAL FAM SAT
Scale Scores for State, Region, County, Provider
State SE Delaware Step By Step (Delaware)

283
Interpreting the Data
These data will allow you to compare the average response from this provider to the average response from all people sampled in the state, region, and AE (when applicable).
Some differences are less meaningful than others, depending on things like the size of the sample and the range of answers provided for that particular scale. “Confidence intervals” are used to determine whether differences are statistically significant, or meaningful. Confidence intervals are reported in parentheses.
To determine whether the average score of the provider is meaningfully different from the averages of the state, region, or AE, you can look at whether these scores fall outside or inside the provider’s confidence interval. Meaningful differences are marked with an asterisk “*”.
Summary of Findings
• The provider scores significantly above average for the
state, region and AE on Individual Satisfaction
• The provider scores significantly below average for the
region on Individual Choice
• The provider scores significantly below average for the
region on Individual Dignity
• The provider scores significantly above average for the
state, region and AE on Physical Quality
• The provider scores significantly above average for the
state, region and AE on Family Satisfaction
Provider Profiles Data Display: Step By Step (Luzerne/Wyoming AE) 2016-2017
Of the 5,328 individuals in the 2017 IM4Q data file, 16 individuals registered in Luzerne/Wyoming Administrative Entity received residential services from Step By
Step. The data in this profile are for the provider’s community-based residential services. This report presents the scale scores for the State, the Northeast Region,
Luzerne/Wyoming AE and Step By Step (Luzerne/Wyoming). There must be data for 10 or more individuals to meet our selection criteria for reporting. If the
number of respondents for any item falls below 5, a dash (-) is shown. For all of the scale scores, a higher score is better and the scores can range from 0 to 100.
Confidence intervals for provider scores are given. Link to explanation of items in scales is below.
* indicates meaningful difference
Link to explanation of the questions in each scale Above average marked by
SCALES State NE Luzerne/ Wyoming
Step By Step (Luzerne/Wyoming)
Individual Satisfaction 85.87* 89.11* 92.14* 96.97 (92.99 – 100.00)
Individual Choice 46.90 54.66* 47.14 43.81 (35.92 – 51.70)
Individual Inclusion 43.72 48.05 43.34 50.74 (43.30 – 58.19)
Individual Dignity 82.28 88.82* 79.60 76.52 (70.26 – 82.77)
Physical Quality 96.92* 96.97* 96.06* 100.00 (100.00 – 100.00)
Family Satisfaction 90.54* 92.50* 95.76* 99.11 (97.36 – 100.00)
86
47 44
82
979189
5548
8997
9392
4743
80
96 9697
4451
77
100 99
0
20
40
60
80
100
120
SATISFACTION CHOICE INCLUSION DIGNITY PHYS QUAL FAM SAT
Scale Scores for State, Region, County, Provider
State NE Luzerne/Wyoming Step By Step (Luzerne/Wyoming)

284
Interpreting the Data
These data will allow you to compare the average response from this provider to the average response from all people sampled in the state, region, and AE (when applicable).
Some differences are less meaningful than others, depending on things like the size of the sample and the range of answers provided for that particular scale. “Confidence intervals” are used to determine whether differences are statistically significant, or meaningful. Confidence intervals are reported in parentheses.
To determine whether the average score of the provider is meaningfully different from the averages of the state, region, or AE, you can look at whether these scores fall outside or inside the provider’s confidence interval. Meaningful differences are marked with an asterisk “*”.
Summary of Findings
• The provider scores significantly below average for the
state on Individual Choice
• The provider scores significantly below average for the
state, region and AE on Individual Inclusion
• The provider scores significantly below average for the
state and region on Individual Dignity
Provider Profiles Data Display: Step By Step (Montgomery AE) 2016-2017
Of the 5,328 individuals in the 2017 IM4Q data file, 13 individuals registered in Montgomery Administrative Entity received residential services from Step By Step.
The data in this profile are for the provider’s community-based residential services. This report presents the scale scores for the State, the Southeast Region,
Montgomery AE and Step By Step (Montgomery). There must be data for 10 or more individuals to meet our selection criteria for reporting. If the number of
respondents for any item falls below 5, a dash (-) is shown. For all of the scale scores, a higher score is better and the scores can range from 0 to 100. Confidence
intervals for provider scores are given. Link to explanation of items in scales is below.
* indicates meaningful difference
Link to explanation of the questions in each scale Above average marked by
SCALES State Southeast Montgomery Step By Step (Montgomery)
Individual Satisfaction 85.87 82.83 79.07 70.71 (45.01 – 96.41)
Individual Choice 46.90* 37.62 31.31 28.01 (12.68 – 43.36)
Individual Inclusion 43.72* 39.99* 38.83* 26.12 (16.08 – 36.16)
Individual Dignity 82.28* 79.12* 76.96 68.75 (60.38 – 77.12)
Physical Quality 96.92 96.57 95.79 94.87 (88.07 – 100.00)
Family Satisfaction 90.54 87.82 83.83 48.57 (6.25 – 90.90)
86
47 44
82
9791
83
38 40
79
9788
79
3139
77
96
84
71
28 26
69
95
49
0
20
40
60
80
100
120
SATISFACTION CHOICE INCLUSION DIGNITY PHYS QUAL FAM SAT
Scale Scores for State, Region, County, Provider
State SE Montgomery Step By Step (Montgomery)

285
Provider Profile Summary: Strawberry Fields www.fionline.org
Strawberry Fields is committed to enhancing the quality of life and promoting the individual growth of those we serve. Regardless of the person’s background or
ability, we strive to assist each individual in growth, making decisions, and becoming a valued and contributing member of our community.
Founded out of love for their children with intellectual disabilities, a group of family members started Strawberry Fields on a farm in Yarnell, Pa in 1972. At that
time, the only alternative was placement in a state operated facility. Our founding families had a dream and a vision of the time when people with disabilities
would be accepted and recognized for their unique contributions to our community.
Strawberry Fields, Inc. specializes in residential programs providing comprehensive services and supports to meet the needs of individuals with
intellectual/developmental disabilities. These homes provide support to acquire, maintain or improve their skills to live more independently in the community.
Services are individualized based on each individual’s needs and may include support in household skills such as self-care, meal planning and cooking, money
management, building relationships and developing hobbies. The purpose is to support people to grow and develop, to make their own decisions, to achieve their
personal goals, to develop relationships and to enjoy life as participating valued members of their community.
Strawberry Fields, Inc. provides a comprehensive and extensive training program to all the staff working as Direct Support Professionals in our residential programs.
Training to effectively communicate is done on an individualized basis by the “TEAM” that supports each individual.
Strawberry Fields, Inc. encourages and supports individuals to develop relationships and make meaningful life choices.
We believe that families are an integral part of an individual’s success. We encourage and welcome them to be active team members, helping to guide and support
us and their family member.
We are working with individuals to live healthy and safe lives by assisting them with accurate medication management, attending health care appointments and
education. Strawberry Fields, Inc. also works to ensure that individuals are safe and secure in their home and community. We educate individuals in accurate
money management and provide safe opportunities to be active members of the community. Strawberry Fields, Inc. ensures our staff has the capabilities to
effectively serve each individual by providing on-going, specialized training throughout the year. Our focus is to communicate and educate our staff in order to
provide the high-quality services that Strawberry Fields, Inc. is known for.
Strawberry Fields, Inc. provides comprehensive services and supports for people with disabilities and their families. Today, we have grown from that farm to an
organization that offers a continuum of services, enhancing the lives of individuals and families with developmental delays, intellectual disabilities, autism and
mental illness.
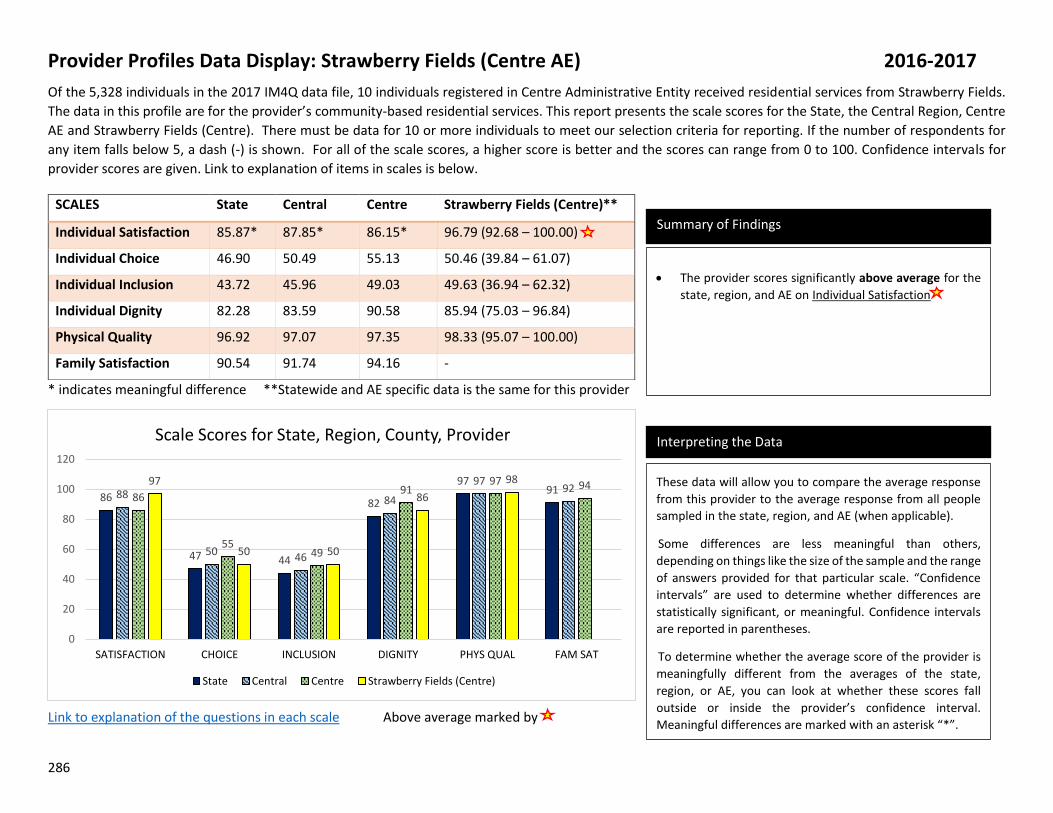
286
Interpreting the Data
These data will allow you to compare the average response
from this provider to the average response from all people
sampled in the state, region, and AE (when applicable).
Some differences are less meaningful than others,
depending on things like the size of the sample and the range
of answers provided for that particular scale. “Confidence
intervals” are used to determine whether differences are
statistically significant, or meaningful. Confidence intervals
are reported in parentheses.
To determine whether the average score of the provider is
meaningfully different from the averages of the state,
region, or AE, you can look at whether these scores fall
outside or inside the provider’s confidence interval.
Meaningful differences are marked with an asterisk “*”.
Summary of Findings
• The provider scores significantly above average for the
state, region, and AE on Individual Satisfaction
Provider Profiles Data Display: Strawberry Fields (Centre AE) 2016-2017
Of the 5,328 individuals in the 2017 IM4Q data file, 10 individuals registered in Centre Administrative Entity received residential services from Strawberry Fields.
The data in this profile are for the provider’s community-based residential services. This report presents the scale scores for the State, the Central Region, Centre
AE and Strawberry Fields (Centre). There must be data for 10 or more individuals to meet our selection criteria for reporting. If the number of respondents for
any item falls below 5, a dash (-) is shown. For all of the scale scores, a higher score is better and the scores can range from 0 to 100. Confidence intervals for
provider scores are given. Link to explanation of items in scales is below.
* indicates meaningful difference **Statewide and AE specific data is the same for this provider
Link to explanation of the questions in each scale Above average marked by
SCALES State Central Centre Strawberry Fields (Centre)**
Individual Satisfaction 85.87* 87.85* 86.15* 96.79 (92.68 – 100.00)
Individual Choice 46.90 50.49 55.13 50.46 (39.84 – 61.07)
Individual Inclusion 43.72 45.96 49.03 49.63 (36.94 – 62.32)
Individual Dignity 82.28 83.59 90.58 85.94 (75.03 – 96.84)
Physical Quality 96.92 97.07 97.35 98.33 (95.07 – 100.00)
Family Satisfaction 90.54 91.74 94.16 -
86
47 44
82
979188
50 46
84
9792
86
5549
9197 9497
50 50
86
98
0
20
40
60
80
100
120
SATISFACTION CHOICE INCLUSION DIGNITY PHYS QUAL FAM SAT
Scale Scores for State, Region, County, Provider
State Central Centre Strawberry Fields (Centre)

287
Provider Profile Summary: Supportive Concepts for Families www.supportiveconcepts.org
Supportive Concepts for Families, Inc. is a provider of high-quality services and supports for individuals with Behavioral Health/Intellectual and/or Developmental
Disabilities and is well known throughout Pennsylvania for our person directed service approach and our delivery of qualified and diversified services. We are
dedicated to being person directed and partnering with all of our stakeholders, offering the people we support opportunities to develop the skills, the resources,
and the network of support they need to achieve strength and balance as they meet life’s challenges. Our service philosophy allows us to establish and arrange
services to accommodate the unique needs of each individual, as well as to continually evaluate the services and partner with those we support in an effort to
provide the most meaningful and effective supports possible.
We value dedication, integrity, compassion, empathy, responsiveness, quality, and dependability.
SCFF was founded in 1993.
Our programs and services include the following: Residential Community and Life Sharing/Family Living Services, Adult Day Programming, Home Based Waiver
Services, Respite Services, Community Hospital Integration Project Program, Crisis Support, Transportation, Behavioral Support, Financial and Vocational Services,
and Residential Habilitation/Supported Living Program and Services.
SCFF provides services to individuals with complex medical needs, people with behavioral support needs, as well as individuals who receive community
participation supports. We provide a comprehensive, individualized approach of supports and assistance. Specialized evaluations and consumer specific trainings
are tailored to meet the needs of the individual, and staff receive hands on and in-house training on the plans, protocols, adaptive equipment, and the most
effective methods of communication for the individual.
SCFF strives to ensure that each individual becomes an active member of the community in which they reside, and we function as a liaison so those resources can
be explored. These may include employment, volunteer opportunities, day programming services, and recreational and socialization activities. All individuals are
able to participate in the development of their plan.
SCFF can be accessed 24 hours a day either by phone or email. Individuals and their family members work extensively with the program team in order to develop
a plan of care that supports the physical and behavioral health needs of the individual. We strive to support families through our advocacy line, surveys, and our
friends and family group.
In addition to our QM plan goals of reducing med errors, abuse, and restraints, SCFF has been working on identifying Key Performance Indicators (KPIs) for all
areas of our programs. These will be utilized to track and analyze factors deemed crucial to the success of our organization and give us a quantifiable measurement
of items we have determined are important to our long-term success and efficiency.
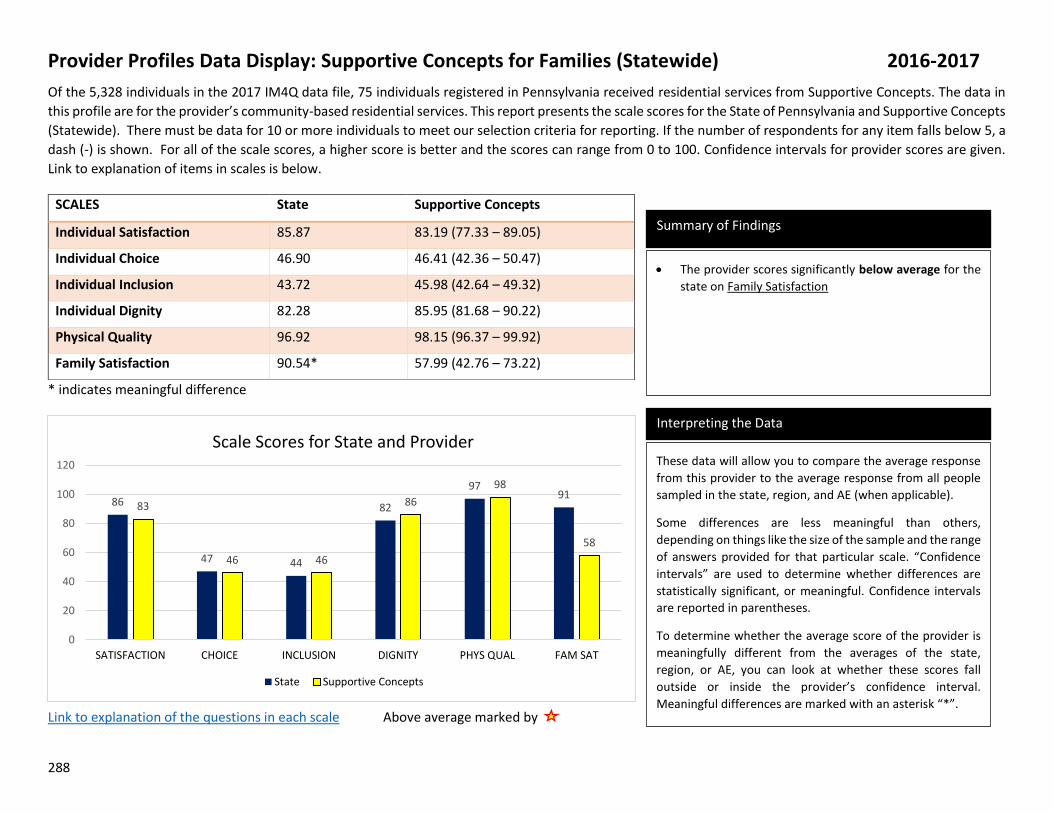
288
Interpreting the Data
These data will allow you to compare the average response
from this provider to the average response from all people
sampled in the state, region, and AE (when applicable).
Some differences are less meaningful than others,
depending on things like the size of the sample and the range
of answers provided for that particular scale. “Confidence
intervals” are used to determine whether differences are
statistically significant, or meaningful. Confidence intervals
are reported in parentheses.
To determine whether the average score of the provider is
meaningfully different from the averages of the state,
region, or AE, you can look at whether these scores fall
outside or inside the provider’s confidence interval.
Meaningful differences are marked with an asterisk “*”.
Summary of Findings
• The provider scores significantly below average for the
state on Family Satisfaction
Provider Profiles Data Display: Supportive Concepts for Families (Statewide) 2016-2017
Of the 5,328 individuals in the 2017 IM4Q data file, 75 individuals registered in Pennsylvania received residential services from Supportive Concepts. The data in
this profile are for the provider’s community-based residential services. This report presents the scale scores for the State of Pennsylvania and Supportive Concepts
(Statewide). There must be data for 10 or more individuals to meet our selection criteria for reporting. If the number of respondents for any item falls below 5, a
dash (-) is shown. For all of the scale scores, a higher score is better and the scores can range from 0 to 100. Confidence intervals for provider scores are given.
Link to explanation of items in scales is below.
* indicates meaningful difference
Link to explanation of the questions in each scale Above average marked by
SCALES State Supportive Concepts
Individual Satisfaction 85.87 83.19 (77.33 – 89.05)
Individual Choice 46.90 46.41 (42.36 – 50.47)
Individual Inclusion 43.72 45.98 (42.64 – 49.32)
Individual Dignity 82.28 85.95 (81.68 – 90.22)
Physical Quality 96.92 98.15 (96.37 – 99.92)
Family Satisfaction 90.54* 57.99 (42.76 – 73.22)
86
47 44
82
9791
83
46 46
86
98
58
0
20
40
60
80
100
120
SATISFACTION CHOICE INCLUSION DIGNITY PHYS QUAL FAM SAT
Scale Scores for State and Provider
State Supportive Concepts
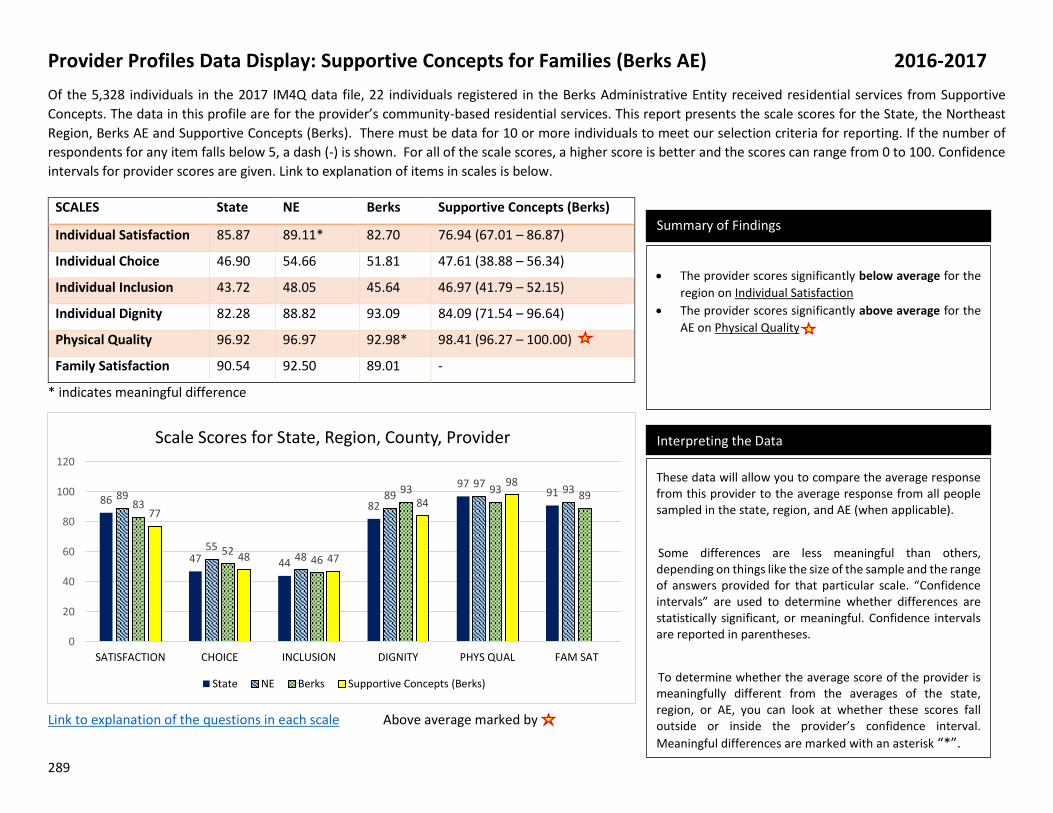
289
Interpreting the Data
These data will allow you to compare the average response from this provider to the average response from all people sampled in the state, region, and AE (when applicable).
Some differences are less meaningful than others, depending on things like the size of the sample and the range of answers provided for that particular scale. “Confidence intervals” are used to determine whether differences are statistically significant, or meaningful. Confidence intervals are reported in parentheses.
To determine whether the average score of the provider is meaningfully different from the averages of the state, region, or AE, you can look at whether these scores fall outside or inside the provider’s confidence interval.
Meaningful differences are marked with an asterisk “*”.
Summary of Findings
• The provider scores significantly below average for the
region on Individual Satisfaction
• The provider scores significantly above average for the
AE on Physical Quality
Provider Profiles Data Display: Supportive Concepts for Families (Berks AE) 2016-2017
Of the 5,328 individuals in the 2017 IM4Q data file, 22 individuals registered in the Berks Administrative Entity received residential services from Supportive
Concepts. The data in this profile are for the provider’s community-based residential services. This report presents the scale scores for the State, the Northeast
Region, Berks AE and Supportive Concepts (Berks). There must be data for 10 or more individuals to meet our selection criteria for reporting. If the number of
respondents for any item falls below 5, a dash (-) is shown. For all of the scale scores, a higher score is better and the scores can range from 0 to 100. Confidence
intervals for provider scores are given. Link to explanation of items in scales is below.
* indicates meaningful difference
Link to explanation of the questions in each scale Above average marked by
SCALES State NE Berks Supportive Concepts (Berks)
Individual Satisfaction 85.87 89.11* 82.70 76.94 (67.01 – 86.87)
Individual Choice 46.90 54.66 51.81 47.61 (38.88 – 56.34)
Individual Inclusion 43.72 48.05 45.64 46.97 (41.79 – 52.15)
Individual Dignity 82.28 88.82 93.09 84.09 (71.54 – 96.64)
Physical Quality 96.92 96.97 92.98* 98.41 (96.27 – 100.00)
Family Satisfaction 90.54 92.50 89.01 -
86
47 44
82
979189
5548
8997 93
83
5246
93 9389
77
48 47
84
98
0
20
40
60
80
100
120
SATISFACTION CHOICE INCLUSION DIGNITY PHYS QUAL FAM SAT
Scale Scores for State, Region, County, Provider
State NE Berks Supportive Concepts (Berks)

290
Interpreting the Data
These data will allow you to compare the average response
from this provider to the average response from all people
sampled in the state, region, and AE (when applicable).
Some differences are less meaningful than others,
depending on things like the size of the sample and the range
of answers provided for that particular scale. “Confidence
intervals” are used to determine whether differences are
statistically significant, or meaningful. Confidence intervals
are reported in parentheses.
To determine whether the average score of the provider is
meaningfully different from the averages of the state,
region, or AE, you can look at whether these scores fall
outside or inside the provider’s confidence interval.
Meaningful differences are marked with an asterisk “*”.
Summary of Findings
• The provider scores significantly above average for the
state and region on Individual Satisfaction
• The provider scores significantly above average for the
state, region and AE on Individual Dignity
• The provider scores significantly above average for the
state, region and AE on Physical Quality
Provider Profiles Data Display: Supportive Concepts for Families (Huntington/Mifflin/Juniata AE) 2016-2017
Of the 5,328 individuals in the 2017 IM4Q data file, 17 individuals registered in Huntington/Mifflin/Juniata Administrative Entity received residential services from
Supportive Concepts. The data in this profile are for the provider’s community-based residential services. This report presents the scale scores for the State, the
Central Region, Huntington/Mifflin/Juniata AE and Supportive Concepts (Huntington/Mifflin/Juniata). There must be data for 10 or more individuals to meet our
selection criteria for reporting. If the number of respondents for any item falls below 5, a dash (-) is shown. For all of the scale scores, a higher score is better and
the scores can range from 0 to 100. Confidence intervals for provider scores are given. Link to explanation of items in scales is below.
* indicates meaningful difference
Link to explanation of the questions in each scale Above average marked by
SCALES State Central Huntington/ Mifflin/Juniata
Supportive Concepts (Huntington/Mifflin/Juniata)
Individual Satisfaction 85.87* 87.85* 96.02 97.31 (94.36 – 100.00)
Individual Choice 46.90 50.49 59.63 52.99 (43.42 – 62.55)
Individual Inclusion 43.72 45.96 50.87 49.46 (42.55 – 56.38)
Individual Dignity 82.28* 83.59* 87.94* 94.87 (89.79 – 99.95)
Physical Quality 96.92* 97.07* 97.39* 100.00 (100.00 – 100.00)
Family Satisfaction 90.54 91.74 - -
86
47 44
82
979188
50 46
84
979296
6051
889797
53 49
95100
0
20
40
60
80
100
120
SATISFACTION CHOICE INCLUSION DIGNITY PHYS QUAL FAM SAT
Scale Scores for State, Region, County, Provider
State Central Huntington Mifflin Juniata Supportive Concepts (Huntington/Mifflin/Juniata)

291
Interpreting the Data
These data will allow you to compare the average response
from this provider to the average response from all people
sampled in the state, region, and AE (when applicable).
Some differences are less meaningful than others,
depending on things like the size of the sample and the range
of answers provided for that particular scale. “Confidence
intervals” are used to determine whether differences are
statistically significant, or meaningful. Confidence intervals
are reported in parentheses.
To determine whether the average score of the provider is
meaningfully different from the averages of the state,
region, or AE, you can look at whether these scores fall
outside or inside the provider’s confidence interval.
Meaningful differences are marked with an asterisk “*”.
Summary of Findings
• The provider scores significantly above average for the
AE on Individual Choice
• The provider scores significantly below average for the
state, region and AE on Family Satisfaction
Provider Profiles Data Display: Supportive Concepts for Families (Montgomery AE) 2016-2017
Of the 5,328 individuals in the 2017 IM4Q data file, 14 individuals registered in Montgomery Administrative Entity received residential services from Supportive
Concepts. The data in this profile are for the provider’s community-based residential services. This report presents the scale scores for the State, the Southeast
Region, Montgomery AE and Supportive Concepts (Montgomery). There must be data for 10 or more individuals to meet our selection criteria for reporting. If the
number of respondents for any item falls below 5, a dash (-) is shown. For all of the scale scores, a higher score is better and the scores can range from 0 to 100.
Confidence intervals for provider scores are given. Link to explanation of items in scales is below.
* indicates meaningful difference
Link to explanation of the questions in each scale Above average marked by
SCALES State SE Montgomery Supportive Concepts (Montgomery)
Individual Satisfaction 85.87 82.83 79.07 74.17 (55.32 – 93.01)
Individual Choice 46.90 37.62 31.31* 42.71 (33.45 – 51.96)
Individual Inclusion 43.72 39.99 38.83 45.89 (37.39 – 54.39)
Individual Dignity 82.28 79.12 76.96 86.67 (76.57 – 96.76)
Physical Quality 96.92 96.57 95.79 96.43 (91.37 – 100.00)
Family Satisfaction 90.54* 87.82* 83.83* 49.15 (31.16 – 67.13)
86
47 44
82
9791
83
38 40
79
9788
79
3139
77
96
8474
43 46
8796
49
0
20
40
60
80
100
120
SATISFACTION CHOICE INCLUSION DIGNITY PHYS QUAL FAM SAT
Scale Scores for State, Region, County, Provider
State SE Montgomery Supportive Concepts (Montgomery)

292
Provider Profile Summary: The Arc of Clarion and Venango Counties Inc. www.thearcclarion.org
The Arc of Clarion and Venango Counties promotes and protects the human rights of people with intellectual and developmental disabilities, and actively supports their full inclusion and participation in the community throughout their lifetimes.
The Arc believes that all people with intellectual and developmental disabilities are defined by their own strengths, abilities, and inherent value, not by their disability. The Arc believes that people with intellectual and developmental disabilities are entitled to the respect, dignity, equality, safety and security accorded to other members of society, and are equal before the law. The Arc believes that people with intellectual and developmental disabilities belong in the community and have fundamental moral, civil and constitutional rights to be fully included and actively participate in all aspects of society. The Arc believes in self-determination and self-advocacy. People with intellectual and developmental disabilities, with appropriate resources and supports, can make decisions about their own lives and must be heard on issues that affect their well-being. The Arc believes that society in general, and The Arc in particular, benefits from the contributions of people with diverse personal characteristics—including but not limited to race, ethnicity, religion, age, geographic location, sexual orientation, gender, and type of disability.
The Arc has been supporting people who experience disabilities since 2003.
The Arc provides a variety of customized supports and services which are community-based and person-centered in nature. In-Home and Community Supports Services assist people to gain, maintain, and improve skills in the areas of self-care, daily living activities, and social skills. These services support people to live as independently as possible while promoting full community inclusion. Respite Services provide direct support to people on a short-term basis due to the absence or need for relief by those who normally are providing care. Companion Services provide support meant to ensure the health and safety of the person while in the community or while in their own home.
All staff receive extensive training related to the communication methods utilized by each person being supported. Specialized training such as sign language, adaptive communication strategies, and gestural sign is provided to staff based on the needs of the person being supported.
All services provided by The Arc are community based in nature. We work actively to support people developing and maintaining fully integrated relationships with others in the community, in addition to maintaining meaningful relationships with peers.
The Arc believes that families are the foundation of community. This belief drives our services to fully engage families in every aspect of the person's services to the fullest extent that the person desires. Families are encouraged to be involved in the services and supports that their loved one receives. The Arc recognizes family input and direction as invaluable assets to the success of our agency.
As part of The Arc's quality improvement practices, we actively work on goals and objectives which work towards improving the overall satisfaction of the people we support and their families. Additionally, our quality improvement plan focuses on strategies to ensure fiscal responsibility and financial conservatism.
The Arc of Clarion and Venango Counties is very fortunate to have the privilege of supporting the people we work for and their families. This privilege is something that is never taken for granted. The satisfaction of the people we support and their families is always our priority.

293
Provider Profile Summary: The Arc of Butler County www.arcbutler.org
The Arc of Butler County is committed to education, advocacy, support, & service provision so individuals with intellectual & developmental disabilities are able
to realize their goals of where & how they learn, live, work, & play. We work toward securing personal independence, choices, inclusion, equal rights, & adequate
supports.
Values that guide us are: Committing to integrity, respecting confidentiality, honoring diversity & valuing the worth of each individual while striving for excellence,
ensuring those served receive most inclusive & least restrictive services/supports.
Supporting & serving people for 60+ years. 1957 The Arc of Butler credits grass roots initiative that began with concerned families & community leaders surrounding
services & supports for individuals with intellectual & developmental disabilities.
We offer: Community Living: 24/7 supervision, providing skills to live independently; shopping, cooking, money management, & community awareness. Semi-
Independent: 40 hours/week individuals that acquired basic skills necessary, staff assists in refining their skills to the level necessary for complete independence.
In home and Community Supports/Supported Housing: Develop independent living skills in private residence. Family Living: Individuals are integrated into families
& homes of community providers for long-term care. Sheltered Workshop - Employs individuals for completion of meaningful paid work. Centrally located facility
handles assembly, packaging, bulk mailing, etc. Budgeting- Money management skills. Job Applications/Resumes - Complete applications, relate skills, & create
resume. Interview - Job Coaches simulate a realistic setting. Job Finding - Research requirements/duties to help make decisions. Job Shadowing – Prior to applying
In-depth look at what job entails. Community Integration - Volunteer activities, shopping, & seeking employment opportunities. Appropriate
Communication/Behavior - Communicate emotions with peers & staff. Socialization - Attend events & learn positive social skills. Job Matching –Job/work
environment are compatible with employee. Job Coaching – Provide quality instruction. Fading – Develop independent work habits & training needs, supports
gradually fade. Follow-up – Job coaches return if work duties/area change.
We are successful providing Community Participation that is increasing employment potential; developing relationships; increasing independence & inclusion.
We evaluate individuals using Developmental Assessment Tool for needed communication devices. Staff trained on types, purposes, & how to identify need. A
team meeting to discuss options held for identified non-verbal consumers.
We create a Newsletter. Encourage progressive legislation local, state, & national chapters of The Arc. Volunteering opportunities. Attend conventions,
conferences, & special meetings. Promote & apply research, offer guidance to enhance independence. Make public aware of needs, rights, & abilities of individuals.
Advocacy: Early intervention services, help secure appropriate programs, & our Parent Transition Group helps transition from school to community services. Aid
individuals/families dealing with on-going challenges. Advocacy with The Arc of Pennsylvania & United States. Public general educational material regarding ID
disabilities.
IT Infrastructure Modernization: Improving software/equipment reliability to help staff be productive & better focused. Integration with payroll, training &
documentation which provide tools that improve job performance by simplifying, speeding up tasks, & accessing up to date information.
The Arc of Butler hosts monthly Thursday night parties at Tanglewood Center. Individuals 18 + with intellectual & developmental disabilities enjoy a new theme,
dancing, snacks & fun!
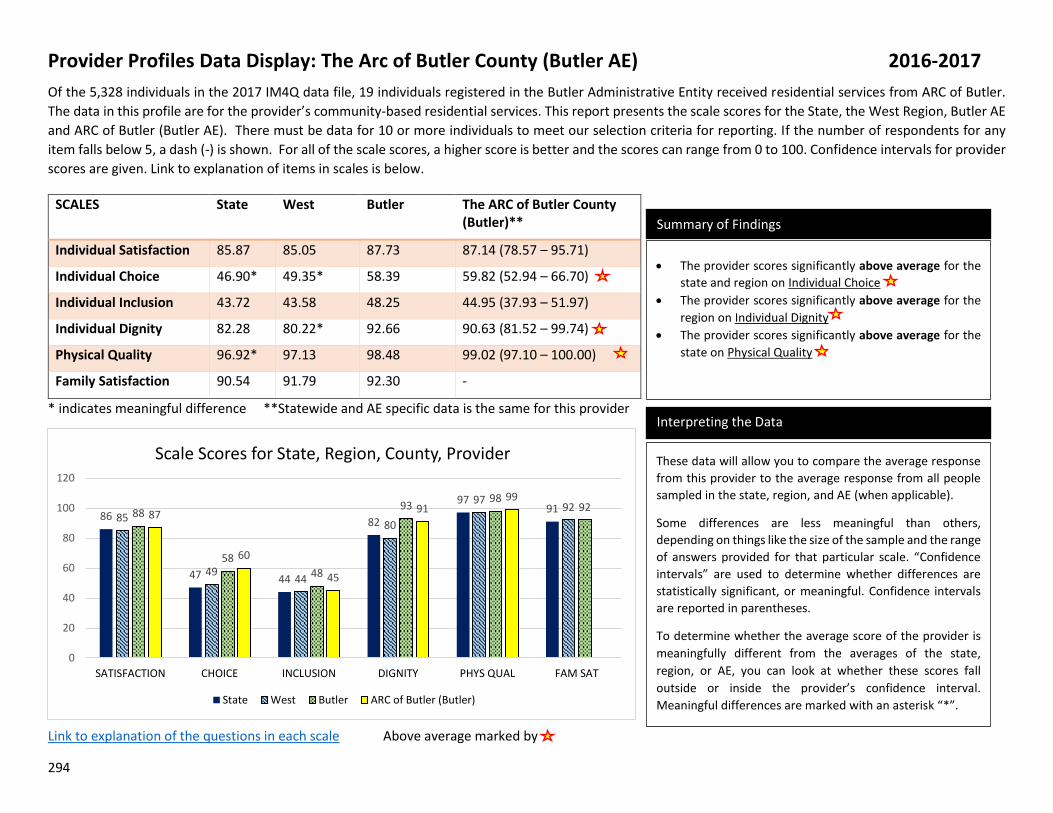
294
Interpreting the Data
These data will allow you to compare the average response
from this provider to the average response from all people
sampled in the state, region, and AE (when applicable).
Some differences are less meaningful than others,
depending on things like the size of the sample and the range
of answers provided for that particular scale. “Confidence
intervals” are used to determine whether differences are
statistically significant, or meaningful. Confidence intervals
are reported in parentheses.
To determine whether the average score of the provider is
meaningfully different from the averages of the state,
region, or AE, you can look at whether these scores fall
outside or inside the provider’s confidence interval.
Meaningful differences are marked with an asterisk “*”.
Summary of Findings
• The provider scores significantly above average for the
state and region on Individual Choice
• The provider scores significantly above average for the
region on Individual Dignity
• The provider scores significantly above average for the
state on Physical Quality
Provider Profiles Data Display: The Arc of Butler County (Butler AE) 2016-2017
Of the 5,328 individuals in the 2017 IM4Q data file, 19 individuals registered in the Butler Administrative Entity received residential services from ARC of Butler.
The data in this profile are for the provider’s community-based residential services. This report presents the scale scores for the State, the West Region, Butler AE
and ARC of Butler (Butler AE). There must be data for 10 or more individuals to meet our selection criteria for reporting. If the number of respondents for any
item falls below 5, a dash (-) is shown. For all of the scale scores, a higher score is better and the scores can range from 0 to 100. Confidence intervals for provider
scores are given. Link to explanation of items in scales is below.
* indicates meaningful difference **Statewide and AE specific data is the same for this provider
Link to explanation of the questions in each scale Above average marked by
SCALES State West Butler The ARC of Butler County (Butler)**
Individual Satisfaction 85.87 85.05 87.73 87.14 (78.57 – 95.71)
Individual Choice 46.90* 49.35* 58.39 59.82 (52.94 – 66.70)
Individual Inclusion 43.72 43.58 48.25 44.95 (37.93 – 51.97)
Individual Dignity 82.28 80.22* 92.66 90.63 (81.52 – 99.74)
Physical Quality 96.92* 97.13 98.48 99.02 (97.10 – 100.00)
Family Satisfaction 90.54 91.79 92.30 -
86
47 44
82
9791
85
4944
80
9792
88
5848
9398
9287
60
45
9199
0
20
40
60
80
100
120
SATISFACTION CHOICE INCLUSION DIGNITY PHYS QUAL FAM SAT
Scale Scores for State, Region, County, Provider
State West Butler ARC of Butler (Butler)

295
Provider Profile Summary: The Arc of Cumberland & Perry (CPARC) www.cparc.org
The mission of The Arc of Cumberland & Perry Counties is to empower, inspire, and educate people with intellectual and developmental disabilities, their families
and the community.
CPARC provides person-centered supports to people with intellectual and developmental disabilities and their families. CPARC envisions a community that
recognizes a person’s abilities and offers support to foster individuality, independence, and inclusion that enhance a person’s full participation in community life.
We have been serving people since 1953.
Residential Services provide a range of community living supports for adults. • Community Support provides services to people who live at home with their families
and to people living in nursing homes. • Apartment Programs provide support appropriate to a person’s level of independence. • Group Homes located in typical
neighborhood settings. People are encouraged to continue learning skills that enhance their abilities and are supported in being active members of their
community. Homes are staffed 24/7 to best support people’s needs. • Respite Care provides a temporary home during emergency situations. The S. Wilson Pollock
Center for Industrial Training (PCIT) offers a range of employment services: • Discovery - certified staff complete an alternative vocational assessment leading to
a customized employment plan • Career Learning Center an instructor lead employment skill curriculum • Pre-Employment Transition Services (PETS) for students
in transition years • Facility based work includes packaging promotional and display materials from local businesses • Community Participation Support provides
the opportunity to explore vocational interests in the community. • Off-site programs provide a staff supervised work setting. • Job Coaching provides job search
and training assistance. CPARC Community Fusion day programs keep people actively engaged in the community. A typical day includes morning outings, stopping
back at the program before the groups head back out for afternoon activities. Life Time Adult Day Care program that provides compassionate care to older adults
with physical and psychological needs, medical concerns, dementia, or inactivity. Advocacy provides free advocacy assistance for people residing in
Cumberland/Perry Counties.
Staff are trained, by qualified communication and behavior support specialists, in the specific communication methods of the people they support which may
include, sign-language, PECS and iPads. On-going trainings are scheduled.
All day programs have mapped the community and plan activities-based on people’s interests. We encourage cross department sharing of networks/activities.
Residential services also engage people with daily living activities such as grocery and clothes shopping and recreational activities of the person’s choice.
Families are encouraged to be active members of their loved one’s team. The Advocacy & Family Education department actively supports families. Special
Education advocates help families understand their child’s rights, attend school meetings and support families through key transitions. Adult Advocates support
families with a wide array of challenges that may include advocating for appropriate services and explaining guardianship. Family Education connects families to
resources and provides trainings on a variety of topics which may include: financial planning, IEP overview, and topics relating to behavioral needs and social skills.
CPARC uses social media, electronic and print newsletters to engage families.

296
Interpreting the Data
These data will allow you to compare the average response
from this provider to the average response from all people
sampled in the state, region, and AE (when applicable).
Some differences are less meaningful than others,
depending on things like the size of the sample and the range
of answers provided for that particular scale. “Confidence
intervals” are used to determine whether differences are
statistically significant, or meaningful. Confidence intervals
are reported in parentheses.
To determine whether the average score of the provider is
meaningfully different from the averages of the state,
region, or AE, you can look at whether these scores fall
outside or inside the provider’s confidence interval.
Meaningful differences are marked with an asterisk “*”.
Summary of Findings
• The provider scores significantly below average for the
state and region on Individual Dignity
• The provider scores significantly above average for the
state and region on Physical Quality
Provider Profiles Data Display: The Arc of Cumberland & Perry (Statewide) 2016-2017
Of the 5,328 individuals in the 2017 IM4Q data file, 18 individuals registered in Pennsylvania received residential services from ARC of Cumberland & Perry. The
data in this profile are for the provider’s community-based residential services. This report presents the scale scores for the State, the Central Region and ARC of
Cumberland & Perry (Statewide). There must be data for 10 or more individuals to meet our selection criteria for reporting. If the number of respondents for any
item falls below 5, a dash (-) is shown. For all of the scale scores, a higher score is better and the scores can range from 0 to 100. Confidence intervals for provider
scores are given. Link to explanation of items in scales is below.
* indicates meaningful difference
Link to explanation of the questions in each scale Above average marked by
SCALES State Central The ARC of Cumberland & Perry
Individual Satisfaction 85.87 87.85 89.33 (83.02 – 95.64)
Individual Choice 46.90 50.49 52.23 (41.49 – 62.97)
Individual Inclusion 43.72 45.96 44.11 (35.94 – 52.28)
Individual Dignity 82.28* 83.59* 74.31 (71.15 – 77.46)
Physical Quality 96.92* 97.07* 100.00 (100.00 – 100.00)
Family Satisfaction 90.54 91.74 -
86
47 44
82
979188
5046
84
979289
5244
74
100
0
20
40
60
80
100
120
SATISFACTION CHOICE INCLUSION DIGNITY PHYS QUAL FAM SAT
Scale Scores for State, Region, Provider
State Central ARC of Cumberland & Perry
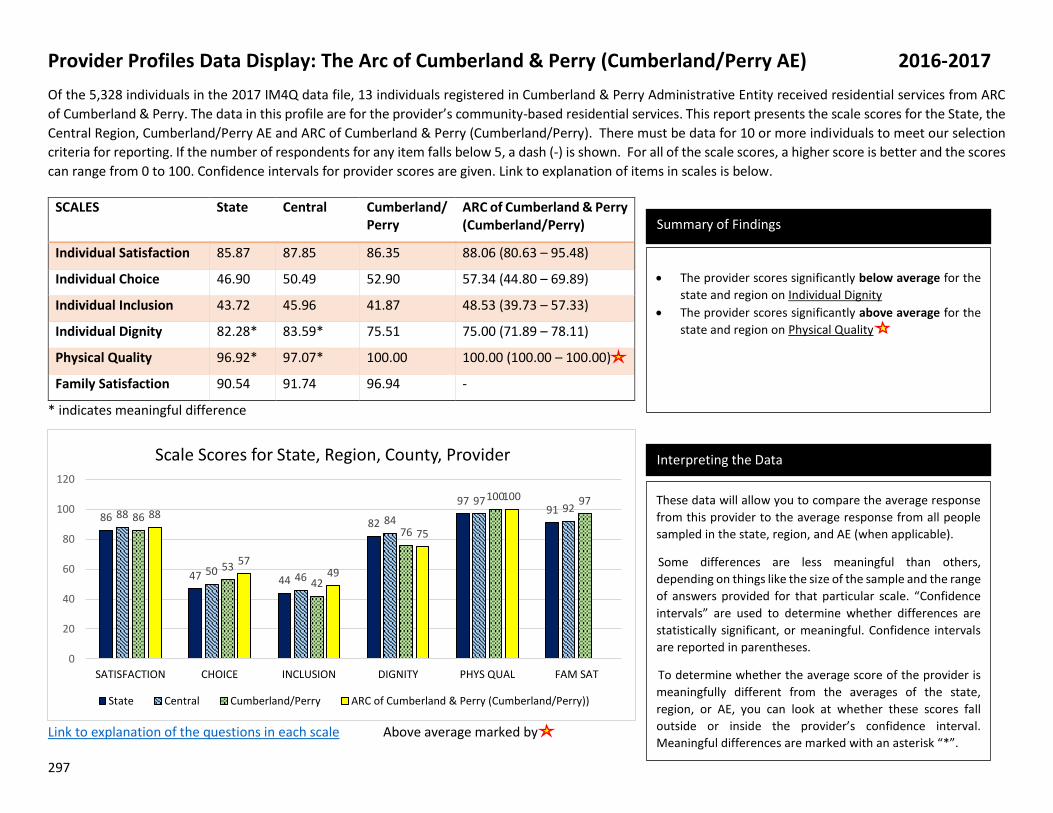
297
Interpreting the Data
These data will allow you to compare the average response
from this provider to the average response from all people
sampled in the state, region, and AE (when applicable).
Some differences are less meaningful than others,
depending on things like the size of the sample and the range
of answers provided for that particular scale. “Confidence
intervals” are used to determine whether differences are
statistically significant, or meaningful. Confidence intervals
are reported in parentheses.
To determine whether the average score of the provider is
meaningfully different from the averages of the state,
region, or AE, you can look at whether these scores fall
outside or inside the provider’s confidence interval.
Meaningful differences are marked with an asterisk “*”.
Summary of Findings
• The provider scores significantly below average for the
state and region on Individual Dignity
• The provider scores significantly above average for the
state and region on Physical Quality
Provider Profiles Data Display: The Arc of Cumberland & Perry (Cumberland/Perry AE) 2016-2017
Of the 5,328 individuals in the 2017 IM4Q data file, 13 individuals registered in Cumberland & Perry Administrative Entity received residential services from ARC
of Cumberland & Perry. The data in this profile are for the provider’s community-based residential services. This report presents the scale scores for the State, the
Central Region, Cumberland/Perry AE and ARC of Cumberland & Perry (Cumberland/Perry). There must be data for 10 or more individuals to meet our selection
criteria for reporting. If the number of respondents for any item falls below 5, a dash (-) is shown. For all of the scale scores, a higher score is better and the scores
can range from 0 to 100. Confidence intervals for provider scores are given. Link to explanation of items in scales is below.
* indicates meaningful difference
Link to explanation of the questions in each scale Above average marked by
SCALES State Central Cumberland/ Perry
ARC of Cumberland & Perry (Cumberland/Perry)
Individual Satisfaction 85.87 87.85 86.35 88.06 (80.63 – 95.48)
Individual Choice 46.90 50.49 52.90 57.34 (44.80 – 69.89)
Individual Inclusion 43.72 45.96 41.87 48.53 (39.73 – 57.33)
Individual Dignity 82.28* 83.59* 75.51 75.00 (71.89 – 78.11)
Physical Quality 96.92* 97.07* 100.00 100.00 (100.00 – 100.00)
Family Satisfaction 90.54 91.74 96.94 -
86
47 44
82
979188
5046
84
9792
86
53
42
76
100 9788
5749
75
100
0
20
40
60
80
100
120
SATISFACTION CHOICE INCLUSION DIGNITY PHYS QUAL FAM SAT
Scale Scores for State, Region, County, Provider
State Central Cumberland/Perry ARC of Cumberland & Perry (Cumberland/Perry))
298
Provider Profile Summary: The Communities of Don Guanella and Divine Providence www.dgdpcommunities.org
Following the loving example of Jesus, we, the Communities of Don Guanella and Divine Providence, embrace persons with intellectual disabilities with professional
and compassionate care.
Rooted in the tradition of our Catholic faith and guided by Guanellian values, we maximize the potential of those we serve. Through the quality of our services, we
promote individuality and belonging, ensure respect and dignity, and nourish spirituality and wellness, all within the supportive love of family. The core values that
govern all of Catholic Social Services, Compassion, Dignity, Charity, Justice, and Excellence are practiced and take on special significance in the context of the values
we have inherited from our patron, St. Luigi Guanella.
We have been supporting people since mid1900s.
We offer Residential Nursing Day Program, Community Participation, LifeSharing, and In-Home Supports Therapies.
We serve individuals with intellectual disabilities. Some have complex medical needs, behavioral support needs, employment needs, community participation
needs.
Staff are trained on all modes of vocal and non-vocal communication. If an individual has specific communication needs, staff are trained on those specific needs.
We support individuals who work, volunteer, and enjoy access to activities and services in the community. We provide transportation and staffing support as
needed to individuals to meet their community participation needs and desires.
We have annual meetings with families as well as communication on a regular basis throughout the year. We have monthly town halls for information sharing
purposes. Our QIDPs and Program Specialists and other team members have constant interaction with family members.
We complete regular mock audits, site and program of all of our locations, quarterly trend analyses, quarterly review of our quality management plan, emergency
preparedness preparation, trainings and other quality measures to enhance health and safety and to be proactive in the delivery of quality services.
Our agency strives to promote least restrictive interventions and environments to support individuals to maximize their potential and to be as independent as
possible. We use a person-centered planning model. We make efforts to promote diversity as well as our Catholic identity. Our quality assurance efforts are driven
by pro-active strategies and Best Practices.

299
Interpreting the Data
These data will allow you to compare the average response
from this provider to the average response from all people
sampled in the state, region, and AE (when applicable).
Some differences are less meaningful than others,
depending on things like the size of the sample and the range
of answers provided for that particular scale. “Confidence
intervals” are used to determine whether differences are
statistically significant, or meaningful. Confidence intervals
are reported in parentheses.
To determine whether the average score of the provider is
meaningfully different from the averages of the state,
region, or AE, you can look at whether these scores fall
outside or inside the provider’s confidence interval.
Meaningful differences are marked with an asterisk “*”.
Summary of Findings
• The provider scores significantly below average for the
state and region on Individual Choice
• The provider scores significantly below average for the
state on Individual Inclusion
• The provider scores significantly above average for the
state and region on Physical Quality
Provider Profiles Data Display: The Communities of Don Guanella and Divine Providence (Statewide) 2016-2017
Of the 5,328 individuals in the 2017 IM4Q data file, 36 individuals registered in Pennsylvania received residential services from Divine Providence Village. The data
in this profile are for the provider’s private ICF 16+, large campus 16+ and community-based residential services. This report presents the scale scores for the State,
the Southeast Region and Divine Providence Village (Statewide). There must be data for 10 or more individuals to meet our selection criteria for reporting. If the
number of respondents for any item falls below 5, a dash (-) is shown. For all of the scale scores, a higher score is better and the scores can range from 0 to 100.
Confidence intervals for provider scores are given. Link to explanation of items in scales is below.
* indicates meaningful difference
Link to explanation of the questions in each scale Above average marked by
SCALES State Southeast Don Guanella and Divine Providence
Individual Satisfaction 85.87 82.83 83.13 (71.62 – 94.63)
Individual Choice 46.90* 37.62* 30.32 (25.25 – 35.39)
Individual Inclusion 43.72* 39.99 39.19 (35.16 – 43.22)
Individual Dignity 82.28 79.12 81.67 (71.69 – 91.65)
Physical Quality 96.92* 96.57* 99.07 (97.81 – 100.00)
Family Satisfaction 90.54 87.82 80.73 (63.73 – 97.73)
86
47 44
82
9791
83
38 40
79
9788
83
3039
82
99
81
0
20
40
60
80
100
120
SATISFACTION CHOICE INCLUSION DIGNITY PHYS QUAL FAM SAT
Scale Scores for State, Region, Provider
State SE Divine Providence Village
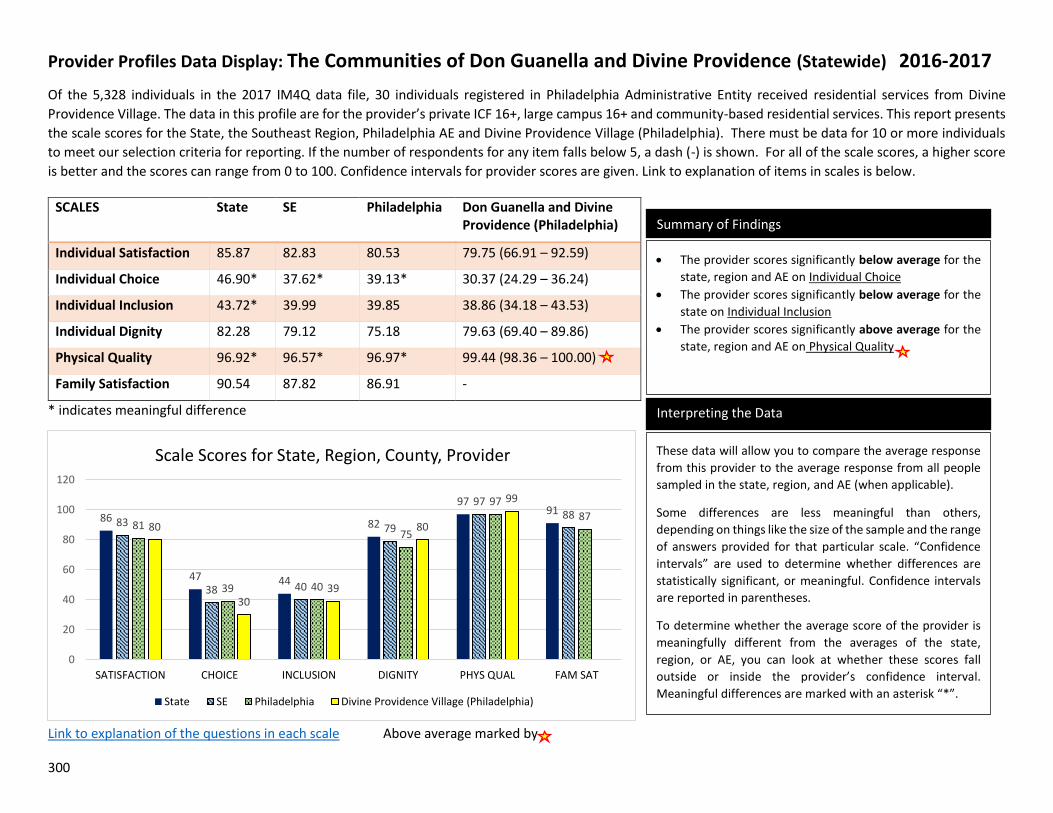
300
Interpreting the Data
These data will allow you to compare the average response
from this provider to the average response from all people
sampled in the state, region, and AE (when applicable).
Some differences are less meaningful than others,
depending on things like the size of the sample and the range
of answers provided for that particular scale. “Confidence
intervals” are used to determine whether differences are
statistically significant, or meaningful. Confidence intervals
are reported in parentheses.
To determine whether the average score of the provider is
meaningfully different from the averages of the state,
region, or AE, you can look at whether these scores fall
outside or inside the provider’s confidence interval.
Meaningful differences are marked with an asterisk “*”.
Summary of Findings
• The provider scores significantly below average for the
state, region and AE on Individual Choice
• The provider scores significantly below average for the
state on Individual Inclusion
• The provider scores significantly above average for the
state, region and AE on Physical Quality
Provider Profiles Data Display: The Communities of Don Guanella and Divine Providence (Statewide) 2016-2017
Of the 5,328 individuals in the 2017 IM4Q data file, 30 individuals registered in Philadelphia Administrative Entity received residential services from Divine
Providence Village. The data in this profile are for the provider’s private ICF 16+, large campus 16+ and community-based residential services. This report presents
the scale scores for the State, the Southeast Region, Philadelphia AE and Divine Providence Village (Philadelphia). There must be data for 10 or more individuals
to meet our selection criteria for reporting. If the number of respondents for any item falls below 5, a dash (-) is shown. For all of the scale scores, a higher score
is better and the scores can range from 0 to 100. Confidence intervals for provider scores are given. Link to explanation of items in scales is below.
* indicates meaningful difference
Link to explanation of the questions in each scale Above average marked by
SCALES State SE Philadelphia Don Guanella and Divine Providence (Philadelphia)
Individual Satisfaction 85.87 82.83 80.53 79.75 (66.91 – 92.59)
Individual Choice 46.90* 37.62* 39.13* 30.37 (24.29 – 36.24)
Individual Inclusion 43.72* 39.99 39.85 38.86 (34.18 – 43.53)
Individual Dignity 82.28 79.12 75.18 79.63 (69.40 – 89.86)
Physical Quality 96.92* 96.57* 96.97* 99.44 (98.36 – 100.00)
Family Satisfaction 90.54 87.82 86.91 -
86
47 44
82
9791
83
38 40
79
9788
81
39 40
75
97
8780
3039
80
99
0
20
40
60
80
100
120
SATISFACTION CHOICE INCLUSION DIGNITY PHYS QUAL FAM SAT
Scale Scores for State, Region, County, Provider
State SE Philadelphia Divine Providence Village (Philadelphia)

301
Provider Profile Summary: The Cornerstone Agency of Pa Inc. www.thecornerstoneagency.com
The Cornerstone Agency is committed to supporting individuals with disabilities to grow, achieve, develop, maintain, and enhance skills and abilities. Through collaboration with team members, we build and sustain long-term positive life changes.
The Cornerstone Agency's guiding values are to treat all individuals with dignity and respect. We understand the importance of working together as a team to enhance to lives of the individuals we support. We value collaboration, growth, and the desire to help others.
The Cornerstone Agency has been supporting individuals with intellectual disabilities and autism since 2013.
The Cornerstone Agency offers Behavior Support Services. Through the principles of Applied Behavior Analysis, our trained Behavior Consultants conduct Functional Behavior Assessments to determine the function of problematic behaviors. Through observation, data collection, and team collaboration, our behavior consultants will determine and implement effective strategies to manage and improve problematic behaviors. Our consultants will write a comprehensive Behavior Support Plan that will be presented to the individual’s team. Through ongoing Behavior Support Services our consultants will continue to collaborate with teams, train, model, and work together towards a successful goal completion. The Cornerstone Agency offers Communication Specialist Services. Our Communication Specialists assess the communication needs of each individual and, through education and training, teach and train the individual and the team the necessary skills needed to successfully support the individual in their environment(s). A Plan of Action is written and implemented, identifying specific needs and goals for the individual.
Our diverse and skillfully trained staff share in a multitude of areas of expertise. Some of these areas include, but are not limited to, working with individuals with autism, individuals with complex behavioral needs, and individuals who are deaf or hard of hearing.
The Cornerstone Agency provides staff the training and tools necessary to provide the most efficient and effective services possible to the individuals that we support. We encourage a positive relationship between our staff and the individuals we support, including the team members. This positive relationship is vital to the success of our supports.
The Cornerstone Agency supports and promotes community involvement for all individuals. We encourage individuals to build their independence when and where possible through skill building, teaching, and modeling behavior.
The Cornerstone Agency believes that family and team involvement is crucial to our successes with the individuals we support. Our staff are able to learn so much about an individual from their family. This information is invaluable to the therapeutic process. We also strongly believe that consistency in an individual’s routine and day-to-day life is important to their success. With family and team involvement we can engage and build consistent routines for the individuals we support.
The Cornerstone Agency strives to provide the most effective and efficient services to the individuals we support. Therefore, one of our goals is to earn an 80% or above on all of our Satisfaction Surveys given to individuals and/team members. Communication Supports is also very important to our agency. Therefore, we have set a goal that our Communication Support Services will support the growth and improvement on all communication assessment scores obtained by consumers who participate in a communication assessment.
302
Provider Profile Summary: The ReDCo Group www.pathwaysofpa.com
The ReDCo Group is committed to the belief that each person, no matter what their disability, has dreams and hopes, likes and dislikes. Through knowledge,
friendship, and collaboration, we advocate for person/family autonomy through the principles of self-determination.
The concepts of Everyday Lives and Recovery and Resiliency are embodied throughout each of The ReDCo Group’s programs. The philosophical beliefs that each
person has hopes and dreams come to life within every program and are embraced by the staff members working with the individuals we support.
We have been serving people for 38 years.
The ReDCo Group provides a rich array of both behavioral health and intellectual disability supports. The company features two closely related divisions (Behavioral
Health “BH” and Intellectual Disability “ID”) that work in conjunction with one another to support the whole person.
Supports offered within the Intellectual Disability division include: Behavior Support Services, Community Participation Support (CPS), Family Living/Life Sharing,
Intermediate Care Facility, Residential Habilitation, & Supported Living.
The ReDCo Group has a high level of expertise supporting individuals with behavioral challenges. The Behavior Support Services program provides supports to
individuals who present with significant behavior challenges that impede their inclusion into the community. Through the use of structured, data-driven
interventions, the program provides extensive training to the individuals receiving the service as well as those who support the individuals in the community. The
goal of the program is to provide skill-building opportunities to the individuals that will eventually allow them to learn techniques to self-regulate challenging
behaviors and integrate more fully into their community.
All staff members from executive management through front line direct support professionals undergo regular training on the individuals they support. If an
individual communicates through alternative methods, training programs are established by trained professionals that educate the staff members supporting the
individual as to their preferred communication style.
For individuals who speak English as a second language, staff members who are fluent in their native language are recruited and assigned.
Additionally, recognizing that behavior is a form of communication, the ReDCo Group provides a robust behavior support service that provides the individuals
served and their staff members access to licensed clinical staff as well as board certified behavior analysts.
Individuals supported by the ReDCo Group are encouraged to always be contributing members to their communities. This is accomplished through a variety of
guiding ideas. The first being that each person has a desire to be part of their larger community. Individuals are encouraged to explore the activities in their
community and determine what interests them.
Family input is always the paramount goal of every treatment team. The ReDCo Group ensures that families always have a seat at the table and that their input is
fully considered with every decision. The ReDCo Group offers opportunities for families to engage in training that allows them to better support their loved ones.

303
Interpreting the Data
These data will allow you to compare the average response
from this provider to the average response from all people
sampled in the state, region, and AE (when applicable).
Some differences are less meaningful than others,
depending on things like the size of the sample and the range
of answers provided for that particular scale. “Confidence
intervals” are used to determine whether differences are
statistically significant, or meaningful. Confidence intervals
are reported in parentheses.
To determine whether the average score of the provider is
meaningfully different from the averages of the state,
region, or AE, you can look at whether these scores fall
outside or inside the provider’s confidence interval.
Meaningful differences are marked with an asterisk “*”.
Summary of Findings
• The provider scores significantly below average for the
region on Individual Choice
• The provider scores significantly below average for the
region on Individual Inclusion
• The provider scores significantly above average for the
state and region on Individual Dignity
• The provider scores significantly above average for the
state and region on Physical Quality
Provider Profiles Data Display: The ReDCo Group (Statewide) 2016-2017
Of the 5,328 individuals in the 2017 IM4Q data file, 29 individuals registered in Pennsylvania received residential services from Redco. The data in this profile are
for the provider’s community-based residential services. This report presents the scale scores for the State, the Northeast Region, and Redco (Statewide). There
must be data for 10 or more individuals to meet our selection criteria for reporting. If the number of respondents for any item falls below 5, a dash (-) is shown.
For all of the scale scores, a higher score is better and the scores can range from 0 to 100. Confidence intervals for provider scores are given. Link to explanation
of items in scales is below.
* indicates meaningful difference
Link to explanation of the questions in each scale Above average marked by
SCALES State NE The ReDCo Group
Individual Satisfaction 85.87 89.11 79.95 (68.38 – 91.52)
Individual Choice 46.90 54.66* 43.07 (32.91 – 53.23)
Individual Inclusion 43.72 48.05* 42.25 (36.72 – 47.79)
Individual Dignity 82.28* 88.82* 96.88 (92.69 – 100.00)
Physical Quality 96.92* 96.97* 99.43 (98.30 – 100.00)
Family Satisfaction 90.54 92.50 -
86
47 44
82
979189
5548
8997
93
80
43 42
97 99
0
20
40
60
80
100
120
SATISFACTION CHOICE INCLUSION DIGNITY PHYS QUAL FAM SAT
Scale Scores for State, Region, Provider
State NE Redco
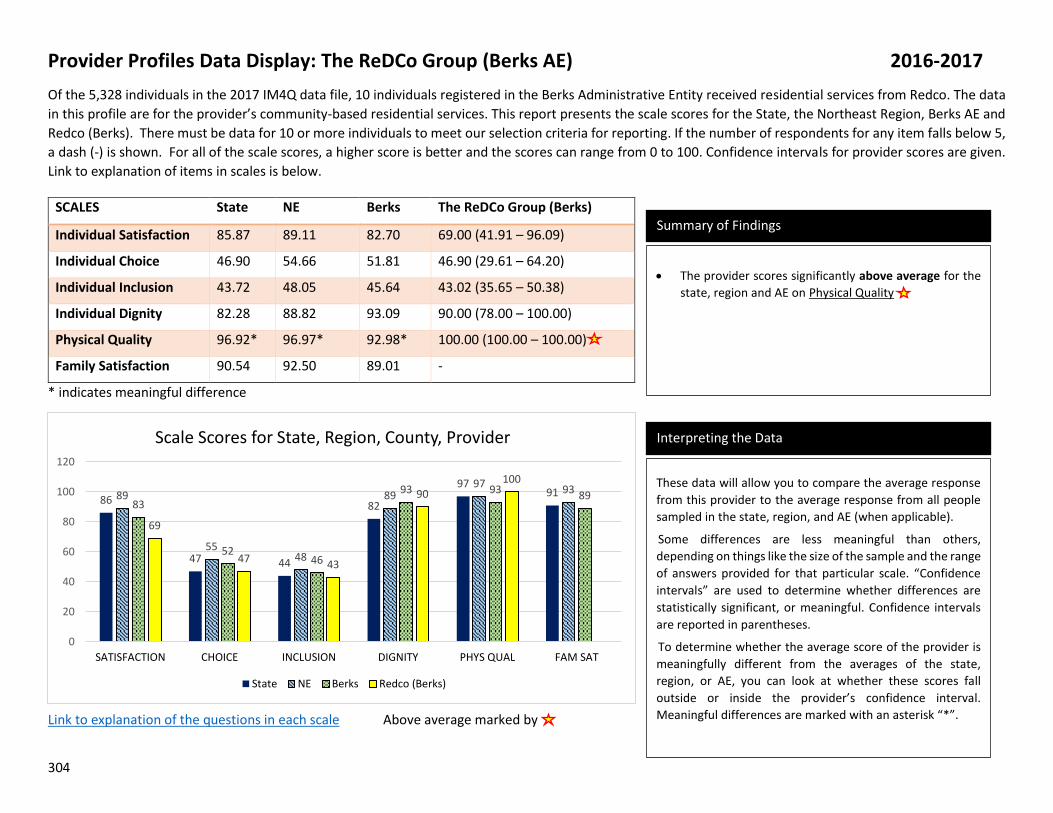
304
Interpreting the Data
These data will allow you to compare the average response
from this provider to the average response from all people
sampled in the state, region, and AE (when applicable).
Some differences are less meaningful than others,
depending on things like the size of the sample and the range
of answers provided for that particular scale. “Confidence
intervals” are used to determine whether differences are
statistically significant, or meaningful. Confidence intervals
are reported in parentheses.
To determine whether the average score of the provider is
meaningfully different from the averages of the state,
region, or AE, you can look at whether these scores fall
outside or inside the provider’s confidence interval.
Meaningful differences are marked with an asterisk “*”.
Summary of Findings
• The provider scores significantly above average for the
state, region and AE on Physical Quality
Provider Profiles Data Display: The ReDCo Group (Berks AE) 2016-2017
Of the 5,328 individuals in the 2017 IM4Q data file, 10 individuals registered in the Berks Administrative Entity received residential services from Redco. The data
in this profile are for the provider’s community-based residential services. This report presents the scale scores for the State, the Northeast Region, Berks AE and
Redco (Berks). There must be data for 10 or more individuals to meet our selection criteria for reporting. If the number of respondents for any item falls below 5,
a dash (-) is shown. For all of the scale scores, a higher score is better and the scores can range from 0 to 100. Confidence intervals for provider scores are given.
Link to explanation of items in scales is below.
* indicates meaningful difference
Link to explanation of the questions in each scale Above average marked by
SCALES State NE Berks The ReDCo Group (Berks)
Individual Satisfaction 85.87 89.11 82.70 69.00 (41.91 – 96.09)
Individual Choice 46.90 54.66 51.81 46.90 (29.61 – 64.20)
Individual Inclusion 43.72 48.05 45.64 43.02 (35.65 – 50.38)
Individual Dignity 82.28 88.82 93.09 90.00 (78.00 – 100.00)
Physical Quality 96.92* 96.97* 92.98* 100.00 (100.00 – 100.00)
Family Satisfaction 90.54 92.50 89.01 -
86
47 44
82
979189
5548
8997 93
83
5246
93 9389
69
4743
90
100
0
20
40
60
80
100
120
SATISFACTION CHOICE INCLUSION DIGNITY PHYS QUAL FAM SAT
Scale Scores for State, Region, County, Provider
State NE Berks Redco (Berks)

305
Interpreting the Data
These data will allow you to compare the average response
from this provider to the average response from all people
sampled in the state, region, and AE (when applicable).
Some differences are less meaningful than others,
depending on things like the size of the sample and the range
of answers provided for that particular scale. “Confidence
intervals” are used to determine whether differences are
statistically significant, or meaningful. Confidence intervals
are reported in parentheses.
To determine whether the average score of the provider is
meaningfully different from the averages of the state,
region, or AE, you can look at whether these scores fall
outside or inside the provider’s confidence interval.
Meaningful differences are marked with an asterisk “*”.
Summary of Findings
• The provider scores significantly below average for the
state, region and AE on Individual Choice
• The provider scores significantly below average for the
region and AE on Individual Inclusion
• The provider scores significantly above average for the
state, region and AE on Individual Dignity
Provider Profiles Data Display: The ReDCo Group (Schuylkill AE) 2016-2017
Of the 5,328 individuals in the 2017 IM4Q data file, 13 individuals registered in the Schuylkill Administrative Entity received residential services from Redco. The
data in this profile are for the provider’s community-based residential services. This report presents the scale scores for the State, the Northeast Region, Schuylkill
AE and Redco (Schuylkill). There must be data for 10 or more individuals to meet our selection criteria for reporting. If the number of respondents for any item
falls below 5, a dash (-) is shown. For all of the scale scores, a higher score is better and the scores can range from 0 to 100. Confidence intervals for provider
scores are given. Link to explanation of items in scales is below.
* indicates meaningful difference
Link to explanation of the questions in each scale Above average marked by
SCALES State NE Schuylkill The ReDCo Group (Schuylkill)
Individual Satisfaction 85.87 89.11 87.91 90.31 (85.39 – 95.23)
Individual Choice 46.90* 54.66* 47.58* 33.95 (23.80 – 44.10)
Individual Inclusion 43.72 48.05* 46.42* 38.16 (31.40 – 44.91)
Individual Dignity 82.28* 88.82* 98.40* 100.00 (100.00 – 100.00)
Physical Quality 96.92 96.97 96.26 98.72 (96.21 – 100.00)
Family Satisfaction 90.54 92.50 96.49 -
86
47 44
82
979189
5548
8997
9388
48 46
98 96 9690
3438
100 99
0
20
40
60
80
100
120
SATISFACTION CHOICE INCLUSION DIGNITY PHYS QUAL FAM SAT
Scale Scores for State, Region, County, Provider
State NE Schuylkill Redco (Schuylkill)
306
Provider Profile Summary: Threshold Rehabilitation Services www.trsinc.org
The Mission of Threshold is to enhance the quality of life of persons with disabilities and the economically disadvantaged by providing opportunities to achieve
total integration into their community through vocational rehabilitation, employment and residential services. Vision: Threshold envisions a world where all people
are valued and supported to lead fulfilling lives.
Our values: Respect, Integrity, Dignity, Equality, and Responsibility for ourselves, for each other, and for our community.
Threshold has been providing supports to people with intellectual disabilities and/or autism for over 50 years.
We offer: Vocational rehabilitation through a community work center. Community Participation Support connecting individuals to the community. Work Stations
in Industry providing employment and training opportunities in the community. Employment Services including work assessments, pre-employment transition
services, supported employment to assist individuals in finding, obtaining and succeeding in competitive employment. Employment opportunities are provided as
photo license technicians in Photo License Centers. Residential services are provided in community homes, LifeSharing services, and supportive living services in
peoples' own homes or apartments.
Threshold has been providing supported employment services for over 30 years through its Berks Personnel Network program.
Threshold provides their employees with Communicating with the Non-verbal Individual Training as well as supports employee training for American Sign Language
proficiency when indicated. Threshold employs significant Spanish speaking staff.
Individuals are supported in the community through a formal Community Participation Supports Program which includes various volunteer opportunities as well
as visits to local business and industry and small group or individual participation in various events and locations accessible to the public. Individuals in residential
settings fully participate in various community life events through shopping, attending entertainment events and by fully utilizing their community environments.
Families and other significant people in the lives of the individuals that Threshold supports are encouraged to become full members of the individuals' teams by
attending their team meetings, visiting individuals in their homes and/or programs, attending medical appointments and otherwise fully participating in their lives.
Quality improvement projects we are working on: 1. Improving the timeliness of Incident Reporting. Incidents will be entered into the HCSIS/EIM system within
24 hours and reports will be finalized within 30 days. 2. Improving Documentation: Daily Service Notes will reflect service which matches the goals identified within
individuals' ISPs. 3. Increasing Competitive Integrated Employment. The outcome of competitive, integrated employment will increase for individuals receiving
Community Participation Supports.

307
Interpreting the Data
These data will allow you to compare the average response
from this provider to the average response from all people
sampled in the state, region, and AE (when applicable).
Some differences are less meaningful than others,
depending on things like the size of the sample and the range
of answers provided for that particular scale. “Confidence
intervals” are used to determine whether differences are
statistically significant, or meaningful. Confidence intervals
are reported in parentheses.
To determine whether the average score of the provider is
meaningfully different from the averages of the state,
region, or AE, you can look at whether these scores fall
outside or inside the provider’s confidence interval.
Meaningful differences are marked with an asterisk “*”.
Summary of Findings
• The provider scores significantly above average for the
state and region on Individual Dignity
• The provider scores significantly above average for the
state, region and AE on Physical Quality
Provider Profiles Data Display: Threshold Rehabilitation Services (Berks AE) 2016-2017
Of the 5,328 individuals in the 2017 IM4Q data file, 19 individuals registered in the Berks Administrative Entity received residential services from Threshold. The
data in this profile are for the provider’s community-based residential services. This report presents the scale scores for the State, the Northeast Region, Berks AE
and Threshold (Berks). There must be data for 10 or more individuals to meet our selection criteria for reporting. If the number of respondents for any item falls
below 5, a dash (-) is shown. For all of the scale scores, a higher score is better and the scores can range from 0 to 100. Confidence intervals for provider scores
are given. Link to explanation of items in scales is below.
* indicates meaningful difference **Statewide and AE specific data is the same for this provider
Link to explanation of the questions in each scale Above average marked by
SCALES State NE Berks Threshold (Berks)**
Individual Satisfaction 85.87 89.11 82.70 83.56 (75.85 – 91.27)
Individual Choice 46.90 54.66 51.81 52.31 (43.00 – 61.62)
Individual Inclusion 43.72 48.05 45.64 43.17 (36.24 – 50.09)
Individual Dignity 82.28* 88.82* 93.09 95.00 (90.92 – 99.08)
Physical Quality 96.92* 96.97* 92.98* 100.00 (100.00 – 100.00)
Family Satisfaction 90.54 92.50 89.01 -
86
47 44
82
979189
5548
8997
93
83
5246
93 9389
84
5243
95100
0
20
40
60
80
100
120
SATISFACTION CHOICE INCLUSION DIGNITY PHYS QUAL FAM SAT
Scale Scores for State, Region, County, Provider
State NE Berks Threshold (Berks)

308
Provider Profile Summary: Training Toward Self-Reliance www.ttsrinc.com
Training Toward Self-Reliance, Inc. believes that people and their family members want to have an “Everyday Life” that is typical of the general population. They
want more in their lives and they have greater expectations of the system than they did ten years ago. People want to have self-determined lives. This means with
the support of family and friends, they decide: how to live their lives; what supports they need; and how they want to spend the money in their individual budgets.
It also means they are responsible for their decisions and actions.
Training Toward Self-Reliance, Inc. believes that every human being deserves the right to have an Every Day Life, which is a life of happiness, opportunity, and
choice. We also believe that all individuals can make a positive impact, regardless of disability, in their home and community. We will continue to offer a safe,
healthy, and home-like living environment filled with choice, for all individuals residing with us because to most, we are their families. Our staff are well trained
and experienced in interacting with a wide diversity of individuals in the programs we offer as well as out in the community environment.
We have been serving people for18 years.
We offer: Residential Group home Adult Training Facility.
We serve a very diverse population with behavioral support needs, deaf/mute individuals who require staff to be knowledgeable and proficient in American Sign
Language, caring for individuals with minor medical needs, extensive interaction within and outside of the community we live in and assisting the individuals with
learning skills of employment at our facility. In 2019, we employed an in-house nurse and behavioral specialist.
Each individual has a specific plan with communication strategies that works for that specific individual. Staff are trained on the plans.
Interest inventories are conducted at our Adult Training Facility with each individual. Thereafter, community activities are scheduled based on feedback.
Family is important for everyone. We encourage family members to remain in contact, interact and help us support the individuals by being present in their lives
as much as possible. This includes phone calls, home visits and attending scheduled meetings throughout the year.
We always have a number of projects going on throughout the year to better the quality of our services, staff recognition, holiday events and fundraisers. Currently,
we conduct meetings to identify potential community activities/events to expand the experiences of community integration, Quality Management meetings with
set goals every quarter, Safety Committee meetings to review any possible underlying issue within our agency in order to keep a safe living and work environment
for all individuals and staff, Staff appreciation events, prizes and giveaways throughout the year to build staff morale, a continuous strive and effort putting on
multiple fundraiser events to ensure our fundraiser account is sufficient for the upcoming years and planning and holding special holiday events throughout the
year for the individuals we serve.
A number of individuals we serve do not have any family contact. With this being said, we appreciate and honor the opportunities we have to build a family like
environment for all the individuals we serve and to help and watch them succeed throughout their lives here at Training Toward Self Reliance, Inc.

309
Interpreting the Data
These data will allow you to compare the average response
from this provider to the average response from all people
sampled in the state, region, and AE (when applicable).
Some differences are less meaningful than others,
depending on things like the size of the sample and the range
of answers provided for that particular scale. “Confidence
intervals” are used to determine whether differences are
statistically significant, or meaningful. Confidence intervals
are reported in parentheses.
To determine whether the average score of the provider is
meaningfully different from the averages of the state,
region, or AE, you can look at whether these scores fall
outside or inside the provider’s confidence interval.
Meaningful differences are marked with an asterisk “*”.
Summary of Findings
• The provider scores significantly below average for the
state on Individual Dignity
• The provider scores significantly above average for the
state and region on Physical Quality
Provider Profiles Data Display: Training Toward Self-Reliance (Statewide) 2016-2017
Of the 5,328 individuals in the 2017 IM4Q data file, 16 individuals registered in Pennsylvania received residential services from Training Toward Self-Reliance. The
data in this profile are for the provider’s community-based residential services. This report presents the scale scores for the State, the Western Region and Training
Toward Self-Reliance (Statewide). There must be data for 10 or more individuals to meet our selection criteria for reporting. If the number of respondents for any
item falls below 5, a dash (-) is shown. For all of the scale scores, a higher score is better and the scores can range from 0 to 100. Confidence intervals for provider
scores are given. Link to explanation of items in scales is below.
* indicates meaningful difference
Link to explanation of the questions in each scale Above average marked by
SCALES State West Training Toward Self-Reliance
Individual Satisfaction 85.87 85.05 88.97 (77.95 – 100.00)
Individual Choice 46.90 49.35 50.75 (44.53 – 56.96)
Individual Inclusion 43.72 43.58 42.11 (36.70 – 47.53)
Individual Dignity 82.28* 80.22 77.60 (74.17 – 81.03)
Physical Quality 96.92* 97.13* 100.00 (100.00 – 100.00)
Family Satisfaction 90.54 91.79 -
86
47 44
82
9791
85
4944
80
979289
5142
78
100
0
20
40
60
80
100
120
SATISFACTION CHOICE INCLUSION DIGNITY PHYS QUAL FAM SAT
Scale Scores for State, Region, Provider
State West Training Toward Self-Reliance

310
Provider Profile Summary: UNITED COMMUNITY INDEPENDENCE PROGRAMS www.uciponline.com
United Community Independence Programs is a professional human service organization specializing in the unique and diverse needs of the individuals we support.
With uncompromising commitment, we will continually strive to ensure that people with disabilities have expanding opportunities at home, work, and in the
community. UCIP enables people to lead a life that is committed to individual choice while focusing on their abilities, interests, and talents. Our mission states:
UCIP is committed to establishing communities where all people can experience their desired quality of life, where their choices, relationships and values are
respected and where they have ongoing opportunities for personal growth.
UCIP embraces these core values: RESPECT: all people are born valuable and are worthy of acceptance regardless of their differences, CHOICE: everyone should
determine their own path and relationships, COMMUNITY: we foster environments that encourage people to participate in activities that interest them and
surrounding themselves with people they choose, QUALITY OF CARE: we continually train, support and evaluate our staff and services.
UCIP has been supporting people since 1965.
UCIP provides the following services: Community Homes with staff support up to 24 hours a day, Life sharing homes, where people reside with carefully matched
families. Home Supports, provides help to an individual at home with activities including personal care skills, transportation, medical appointments, and
community activities. Day Services which provides daily activities in our facility as well as participation in the community. Supported Employment, supporting
people on the job, and Behavioral Supports.
UCIP provides Behavioral Supports by professional and qualified people who are on staff. We employ a Registered Nurse to help us support anyone with complex
medical needs. We have trained staff in employment services, and Music and Art Therapy at some of our facilities.
Staff meet at least monthly to share information, collaborate and strategize on what is the best way to effectively support the individuals they serve. Of major
importance and focus at these meetings is how to effectively communicate with the people they support. In addition, we have a professional trainer on staff meet
the training needs of staff.
UCIP ensures people we support attend community activities and events, and enjoy friendships of their choosing. To facilitate this, we provide additional staff as
needed so our individuals have enough support to enjoy the community life they desire.
We value both our individuals and their families. We allow the individual and the family to decide their level of involvement in the individual’s service. Families
also participate in satisfaction surveys. Our management team utilizes these surveys to improve the quality of our services. UCIP has both family members and
individuals participate on our governing Board of Directors.
UCIP has three quality improvement projects: Participant Safeguards ODP's Mission Vision and Values compliance, Falls, and Medicine Safety. UCIP's QMP’s object
is to ensure that all individuals are safe in their home and community. It also monitors and ensures that UCIP practice ODP's Mission, Vision, and Values.
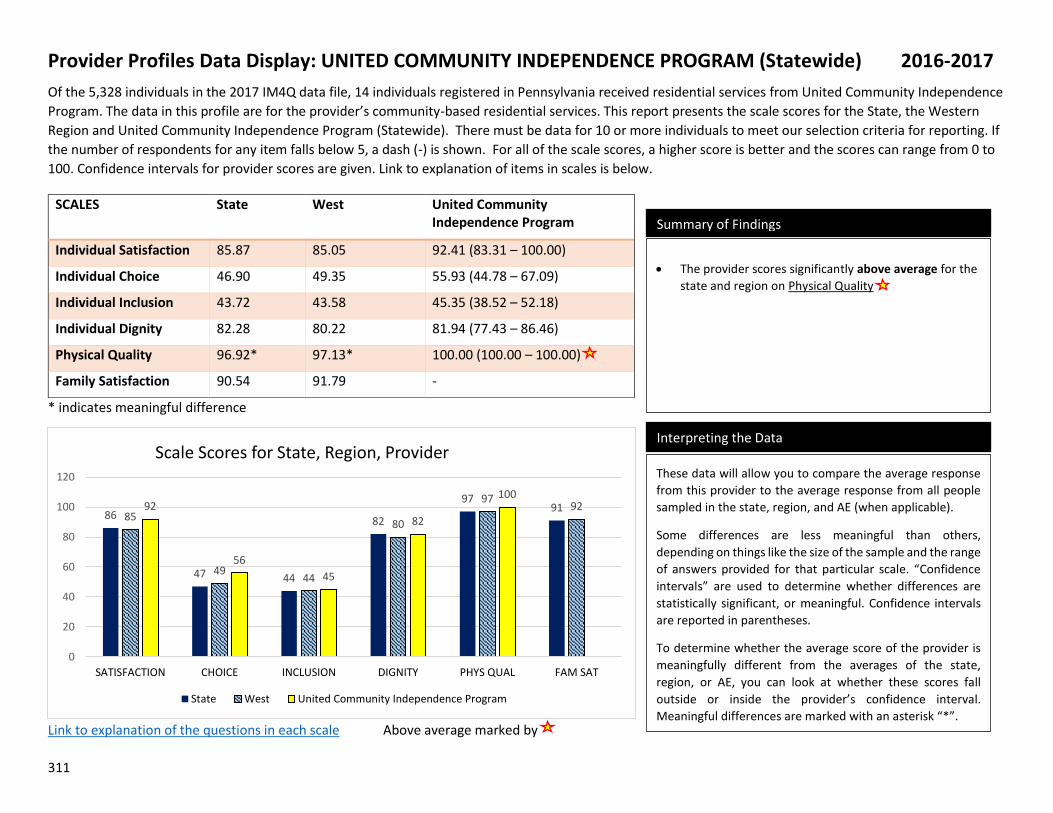
311
Interpreting the Data
These data will allow you to compare the average response
from this provider to the average response from all people
sampled in the state, region, and AE (when applicable).
Some differences are less meaningful than others,
depending on things like the size of the sample and the range
of answers provided for that particular scale. “Confidence
intervals” are used to determine whether differences are
statistically significant, or meaningful. Confidence intervals
are reported in parentheses.
To determine whether the average score of the provider is
meaningfully different from the averages of the state,
region, or AE, you can look at whether these scores fall
outside or inside the provider’s confidence interval.
Meaningful differences are marked with an asterisk “*”.
Summary of Findings
• The provider scores significantly above average for the
state and region on Physical Quality
Provider Profiles Data Display: UNITED COMMUNITY INDEPENDENCE PROGRAM (Statewide) 2016-2017
Of the 5,328 individuals in the 2017 IM4Q data file, 14 individuals registered in Pennsylvania received residential services from United Community Independence
Program. The data in this profile are for the provider’s community-based residential services. This report presents the scale scores for the State, the Western
Region and United Community Independence Program (Statewide). There must be data for 10 or more individuals to meet our selection criteria for reporting. If
the number of respondents for any item falls below 5, a dash (-) is shown. For all of the scale scores, a higher score is better and the scores can range from 0 to
100. Confidence intervals for provider scores are given. Link to explanation of items in scales is below.
* indicates meaningful difference
Link to explanation of the questions in each scale Above average marked by
SCALES State West United Community Independence Program
Individual Satisfaction 85.87 85.05 92.41 (83.31 – 100.00)
Individual Choice 46.90 49.35 55.93 (44.78 – 67.09)
Individual Inclusion 43.72 43.58 45.35 (38.52 – 52.18)
Individual Dignity 82.28 80.22 81.94 (77.43 – 86.46)
Physical Quality 96.92* 97.13* 100.00 (100.00 – 100.00)
Family Satisfaction 90.54 91.79 -
86
47 44
82
9791
85
4944
80
979292
56
45
82
100
0
20
40
60
80
100
120
SATISFACTION CHOICE INCLUSION DIGNITY PHYS QUAL FAM SAT
Scale Scores for State, Region, Provider
State West United Community Independence Program

312
Provider Profile Summary: Valley Special Needs Program www.valleycommunityservices.org
"Supporting People" Our mission statement is intentionally broad. "Supporting," connotes an understanding that the responsibility of the agency is not to "do" or
to "care" but to support people with the choices they make. Valley Community Services (VCS) understands all people deserve the dignity of risk and it is the duty
of the agency to support such risk. "People" belies the agency's insistence on person first language. Words like "individuals," "consumers," and "residents" are
ways to separate people with disabilities from those without. "People" will always remind us of the singularity of the human experience and our desires and
aspirations will always be similar to those whom we support.
We believe if you are a person with a disability, you should be able to choose your best life. As your provider, we should help you do that.
We have been serving people for 41 years.
We offer: Group homes, support in your home or another family’s home, learning employment skills, helping you find a job.
VCS has staff that can communicate in Spanish, Farsi and American Sign Language.
We have created a Life Enrichment Coordinator who can help access parts of the community you may not know about, i.e. finding ice skating lessons if you want
to learn or a fishing license if you’ve always wanted to fish.
We know how important it is for families to be engaged in the lives of the people we support. 92% of families who responded to a recent survey were either “very
or somewhat” satisfied with the homes where they were living.
VCS has improved correspondence, data collection and training with the use of technology. Moving forward, embracing technology fully will enable complete
independence for everyone.
Founded in 1976 as an early learning program in the greater Pittsburgh area, VCS has evolved to meet the needs of the places where it provides services. We now
support 200+ people in Pennsylvania. We believe that 1) The needs and aspirations of the people we support must be the keystone in any plan 2) All plans must
be specifically focused on community integration and Everyday Lives principles and 3) No person will ever be discharged from VCS based on their behavioral
support needs. This encourages all support teams to focus on positive outcomes for all persons served. Community Living Arrangements, Intermediate Care
Facilities, Lifesharing, In Home and Community, Companion, Adult Training Facilities and Supported Employment. We believe the system should work for the
person and not the other way around. The agency has found creative ways to plan dream vacations, find dream jobs and help plan and execute a dream wedding.
Our job is to support you as you dream.
VCS employs licensed Psychologists, Nurses and Direct Support Professionals who exceed the state minimum requirements for training. Retaining quality staff
members is integral to the process of providing seamless supports. None of this means anything without the goal of every one of our 500+ support staff who must
believe the notion that theirs is a profession dedicated to supporting people.

313
Interpreting the Data
These data will allow you to compare the average response
from this provider to the average response from all people
sampled in the state, region, and AE (when applicable).
Some differences are less meaningful than others,
depending on things like the size of the sample and the range
of answers provided for that particular scale. “Confidence
intervals” are used to determine whether differences are
statistically significant, or meaningful. Confidence intervals
are reported in parentheses.
To determine whether the average score of the provider is
meaningfully different from the averages of the state,
region, or AE, you can look at whether these scores fall
outside or inside the provider’s confidence interval.
Meaningful differences are marked with an asterisk “*”.
Summary of Findings
• The provider scores significantly above average for the
state on Physical Quality
Provider Profiles Data Display: Valley Special Needs Program (Statewide) 2016-2017
Of the 5,328 individuals in the 2017 IM4Q data file, 19 individuals registered in Pennsylvania received residential services from Valley Special Needs Program. The
data in this profile are for the provider’s community-based residential services. This report presents the scale scores for the State of Pennsylvania and Valley Special
Needs Program (Statewide). There must be data for 10 or more individuals to meet our selection criteria for reporting. If the number of respondents for any item
falls below 5, a dash (-) is shown. For all of the scale scores, a higher score is better and the scores can range from 0 to 100. Confidence intervals for provider
scores are given. Link to explanation of items in scales is below.
* indicates meaningful difference
Link to explanation of the questions in each scale Above average marked by
SCALES State Valley Special Needs Program
Individual Satisfaction 85.87 89.05 (82.84 – 95.26)
Individual Choice 46.90 42.81 (34.32 – 51.31)
Individual Inclusion 43.72 41.65 (34.85 – 48.45)
Individual Dignity 82.28 82.05 (73.21 – 90.89)
Physical Quality 96.92* 99.02 (97.10 – 100.00)
Family Satisfaction 90.54 83.33 (69.46 – 97.20)
86
47 44
82
979189
43 42
82
99
83
0
20
40
60
80
100
120
SATISFACTION CHOICE INCLUSION DIGNITY PHYS QUAL FAM SAT
Scale Scores for State and Provider
State Valley Special Needs Program
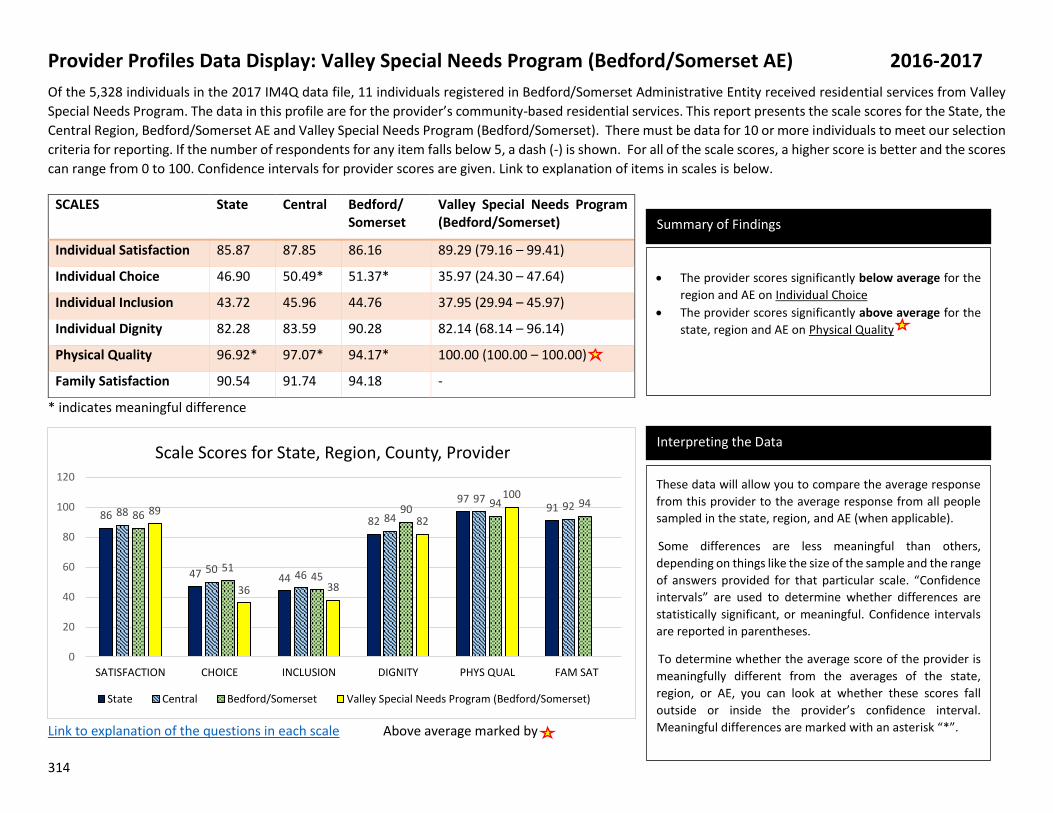
314
Interpreting the Data
These data will allow you to compare the average response
from this provider to the average response from all people
sampled in the state, region, and AE (when applicable).
Some differences are less meaningful than others,
depending on things like the size of the sample and the range
of answers provided for that particular scale. “Confidence
intervals” are used to determine whether differences are
statistically significant, or meaningful. Confidence intervals
are reported in parentheses.
To determine whether the average score of the provider is
meaningfully different from the averages of the state,
region, or AE, you can look at whether these scores fall
outside or inside the provider’s confidence interval.
Meaningful differences are marked with an asterisk “*”.
Summary of Findings
• The provider scores significantly below average for the
region and AE on Individual Choice
• The provider scores significantly above average for the
state, region and AE on Physical Quality
Provider Profiles Data Display: Valley Special Needs Program (Bedford/Somerset AE) 2016-2017
Of the 5,328 individuals in the 2017 IM4Q data file, 11 individuals registered in Bedford/Somerset Administrative Entity received residential services from Valley
Special Needs Program. The data in this profile are for the provider’s community-based residential services. This report presents the scale scores for the State, the
Central Region, Bedford/Somerset AE and Valley Special Needs Program (Bedford/Somerset). There must be data for 10 or more individuals to meet our selection
criteria for reporting. If the number of respondents for any item falls below 5, a dash (-) is shown. For all of the scale scores, a higher score is better and the scores
can range from 0 to 100. Confidence intervals for provider scores are given. Link to explanation of items in scales is below.
* indicates meaningful difference
Link to explanation of the questions in each scale Above average marked by
SCALES State Central Bedford/ Somerset
Valley Special Needs Program (Bedford/Somerset)
Individual Satisfaction 85.87 87.85 86.16 89.29 (79.16 – 99.41)
Individual Choice 46.90 50.49* 51.37* 35.97 (24.30 – 47.64)
Individual Inclusion 43.72 45.96 44.76 37.95 (29.94 – 45.97)
Individual Dignity 82.28 83.59 90.28 82.14 (68.14 – 96.14)
Physical Quality 96.92* 97.07* 94.17* 100.00 (100.00 – 100.00)
Family Satisfaction 90.54 91.74 94.18 -
86
47 44
82
979188
5046
84
9792
86
5145
9094 94
89
36 38
82
100
0
20
40
60
80
100
120
SATISFACTION CHOICE INCLUSION DIGNITY PHYS QUAL FAM SAT
Scale Scores for State, Region, County, Provider
State Central Bedford/Somerset Valley Special Needs Program (Bedford/Somerset)

315
Provider Profile Summary: Verland www.verland.org
Verland’s mission is to establish, support, maintain, advocate, and operate residences and programs for the guidance, education, treatment and long-term care of
children and adults with intellectual or developmental disability, all without regard to race, color, creed, sex, or national origin and with emphasis on the spiritual,
emotional, physical and social habilitation in order to bring about healing of the whole person. Verland is committed to the belief that our society must provide
for all human beings the opportunity to live a life of dignity, to maximize their potential, and to contribute to our society to the full extent of their abilities. Verland
employs the highest ethical standards and leadership principles designed to promote for Verlanders such honored values as choice, control, safety, stability,
success and relationships.
On July 1, 1978, Verland started providing services to people with intellectual disability and autism (ICF/IID and HCBS), and to those with other related conditions
(ICF/ORC), serving them for over 40 years.
Verland ensures that our individuals and staff are able to effectively communicate with each other through the use of on-site American Sign Language trainings,
assistive technology trainings and reaching out to outside providers to provide any additional training that may be needed. Verland’s program helps to promote
growth and development of the individuals, giving them the opportunity to attend schools and community centers, find jobs nearby, and in some cases live near
their families. Verland provides an “Everyday Lives life style” with person-centered programming that is specific to each individual’s interests and needs.
Verland’s highly-trained in-home staff accompanies individuals on a variety of activities including bowling, shopping, movies, and dining out. Verland encourages
individuals to participate in meaningful work through competitive employment, vocational training and volunteer opportunities. Verland’s Adult Training Facilities’
programs in conjunction with the in-homes programs also provide social and recreational activities which enable each individual to develop increased levels of
independence.
Verland’s management team also works to create effective communication with families to determine appropriate supports and resources for their loved ones
through involvement in team planning meetings, quarterly updates and frequent communication with leadership team.
Verland continuously aims to improve front-line supervision through the use of training programs like the “Leadership Journey” which provides tools and resources
to increase team work and personal leadership.
To ensure program accountability and safety, we have reduced Program Specialists' caseloads and increased the number of direct supervisors; implemented
weekly mealtime monitoring to ensure proper food and liquid consistencies, adaptive equipment, and staff presence through direct observations by frontline
supervisors to reduce and prevent aspiration and choking risks; analyze number of hospitalizations and emergency room visits related to Fatal Four diagnoses;
and focus on staff training and prevention.
At Verland, our leadership and staff are passionate, caring advocates for whatever help and services our individuals and their families need. We put our hearts
into giving our individuals beautiful homes and services with love, dignity, and respect, hence our three intertwined hearts logo and motto, State-of-the- Heart®

316
Interpreting the Data
These data will allow you to compare the average response
from this provider to the average response from all people
sampled in the state, region, and AE (when applicable).
Some differences are less meaningful than others,
depending on things like the size of the sample and the range
of answers provided for that particular scale. “Confidence
intervals” are used to determine whether differences are
statistically significant, or meaningful. Confidence intervals
are reported in parentheses.
To determine whether the average score of the provider is
meaningfully different from the averages of the state,
region, or AE, you can look at whether these scores fall
outside or inside the provider’s confidence interval.
Meaningful differences are marked with an asterisk “*”.
Summary of Findings
• The provider scores significantly below average for the
state and region on Individual Choice
• The provider scores significantly below average for the
state and region on Individual Inclusion
• The provider scores significantly below average for the
state on Individual Dignity
• The provider scores significantly above average for the
state and region on Physical Quality
Provider Profiles Data Display: Verland (Statewide) 2016-2017
Of the 5,328 individuals in the 2017 IM4Q data file, 67 individuals registered in Pennsylvania received residential services from Verland. The data in this profile are
for the provider’s private ICF 16+ and community-based residential services. This report presents the scale scores for the State of Pennsylvania, the Western region,
and Verland (Statewide). There must be data for 10 or more individuals to meet our selection criteria for reporting. If the number of respondents for any item
falls below 5, a dash (-) is shown. For all of the scale scores, a higher score is better and the scores can range from 0 to 100. Confidence intervals for provider
scores are given. Link to explanation of items in scales is below.
* indicates meaningful difference
Link to explanation of the questions in each scale Above average marked by
SCALES State West Verland
Individual Satisfaction 85.87 85.05 84.61 (74.61 – 94.61)
Individual Choice 46.90* 49.35* 29.63 (24.99 – 34.28)
Individual Inclusion 43.72* 43.58* 35.59 (31.71 – 39.48)
Individual Dignity 82.28* 80.22 75.00 (68.67 – 81.33)
Physical Quality 96.92* 97.13* 100.00 (100.00 – 100.00)
Family Satisfaction 90.54 91.79 85.63 (69.24 – 100.00)
86
47 44
82
9791
85
4944
80
9792
85
3036
75
100
86
0
20
40
60
80
100
120
SATISFACTION CHOICE INCLUSION DIGNITY PHYS QUAL FAM SAT
Scale Scores for State, Region, Provider
State West Verland

317
Interpreting the Data
These data will allow you to compare the average response
from this provider to the average response from all people
sampled in the state, region, and AE (when applicable).
Some differences are less meaningful than others,
depending on things like the size of the sample and the range
of answers provided for that particular scale. “Confidence
intervals” are used to determine whether differences are
statistically significant, or meaningful. Confidence intervals
are reported in parentheses.
To determine whether the average score of the provider is
meaningfully different from the averages of the state,
region, or AE, you can look at whether these scores fall
outside or inside the provider’s confidence interval.
Meaningful differences are marked with an asterisk “*”.
Summary of Findings
• The provider scores significantly below average for the
state, region and AE on Individual Choice
• The provider scores significantly below average for the
state, region and AE on Individual Inclusion
• The provider scores significantly below average for the
state and region on Individual Dignity
• The provider scores significantly above average for the
state, region and AE on Physical Quality
Provider Profiles Data Display: Verland (Allegheny AE) 2016-2017
Of the 5,328 individuals in the 2017 IM4Q data file, 56 individuals registered in Allegheny Administrative Entity received residential services from Verland. The
data in this profile are for the provider’s private ICF 16+ and community-based residential services. This report presents the scale scores for the State, the Western
Region, Allegheny AE and Verland (Allegheny AE). There must be data for 10 or more individuals to meet our selection criteria for reporting. If the number of
respondents for any item falls below 5, a dash (-) is shown. For all of the scale scores, a higher score is better and the scores can range from 0 to 100. Confidence
intervals for provider scores are given. Link to explanation of items in scales is below.
* indicates meaningful difference
Link to explanation of the questions in each scale Above average marked by
SCALES State West Allegheny Verland (Allegheny)
Individual Satisfaction 85.87 85.05 82.82 84.36 (72.29 – 96.43)
Individual Choice 46.90* 49.35* 46.36* 27.85 (22.86 – 32.84)
Individual Inclusion 43.72* 43.58* 41.23* 33.65 (29.58 – 37.71)
Individual Dignity 82.28* 80.22* 71.61 70.83 (65.33 – 76.34)
Physical Quality 96.92* 97.13* 97.86* 100.00 (100.00 – 100.00)
Family Satisfaction 90.54 91.79 80.03 -
86
47 44
82
9791
85
4944
80
9792
83
4641
72
98
8084
2834
71
100
0
20
40
60
80
100
120
SATISFACTION CHOICE INCLUSION DIGNITY PHYS QUAL FAM SAT
Scale Scores for State, Region, County, Provider
State West Allegheny Verland (Allegheny)

318
Provider Profile Summary: Washington-Greene Alternative Residential Services
Our mission for intellectual disabilities residential and day services is to assist individuals with disabilities to become independent and productive members of the
community. This mission reflects the principles and core values on which we base our services; the positive approaches incorporated into those services; and the
foundation of our policy, which is the belief that individuals with intellectual disabilities must have access to opportunities in the community and the training to
increase independence in the community.
The principles and core values of Washington-Greene Alternative Residential Services, INC are choice, quality, stability, safety, individuality, relationships, freedom,
success, contributing to the community, accountability, mentoring, collaboration, and community integration.
Washington-Greene Alternative Residential Services, INC opened its first residential home in 1988 and has been supporting individuals with intellectual disabilities
and/or autism at several locations in Washington County since that time. We currently have 5 Home and Community Based Waiver Homes, 2 Intermediate Care
Facilities, and 1 Adult Training Facility which also includes a licensed Senior program.
Washington-Greene Alternative Residential Services, INC offers the opportunity for individuals to experience excellent health care by accessing medical services
in the local area as well as resources in the greater Pittsburgh metropolitan area. Washington-Greene Alternative Residential Services, INC also utilizes nursing
staff to monitor the health care of the individuals 24 hours per day. Washington-Greene Alternative Residential Services, INC also contracts with a Physiatrist,
Physical Therapist, Nutritionist, Psychologist, and Social Worker to provide necessary services.
Washington-Greene Alternative Residential Services, INC offers services and support to individuals with varying needs and abilities. Washington-Greene Alternative
Residential Services, INC serves individuals with intellectual disabilities who have hearing impairments, visual impairments, behavioral and emotional supports,
complex medical conditions, and so much more. Washington-Greene Alternative Residential Services, INC offers minimum wage to individuals at the Adult Training
Facility for completing various paid work. The Adult Training Facility also provides various opportunities for community participation.
Training is provided to all staff who are employed at Washington-Greene Alternative Residential Services, INC upon hire and then as needed throughout their
employment. Staff are also required to have 24 hours of in-service training each year.
Each individual is encouraged to participate in a variety of hobbies, past times, and community experiences that he or she likes, including opportunities for religious,
recreational and social events. These events may include the Gateway Clipper, Pirate games, dances, and holiday events of all kinds.
Washington-Greene Alternative Residential Services, INC has an open-door policy for the families of the individuals we support. This means that they are welcome
to come any time to visit their family member or to schedule a meeting with the team to discuss any concerns they may have. Families are encouraged to be
actively involved in their loved one’s life.

319
Interpreting the Data
These data will allow you to compare the average response
from this provider to the average response from all people
sampled in the state, region, and AE (when applicable).
Some differences are less meaningful than others,
depending on things like the size of the sample and the range
of answers provided for that particular scale. “Confidence
intervals” are used to determine whether differences are
statistically significant, or meaningful. Confidence intervals
are reported in parentheses.
To determine whether the average score of the provider is
meaningfully different from the averages of the state,
region, or AE, you can look at whether these scores fall
outside or inside the provider’s confidence interval.
Meaningful differences are marked with an asterisk “*”.
Summary of Findings
• The provider’s scores are not significantly different from
the average scores for the state or region
Provider Profiles Data Display: Washington-Greene Alternative Residential Services (Statewide) 2016-2017
Of the 5,328 individuals in the 2017 IM4Q data file, 11 individuals registered in Pennsylvania received residential services from Washington Greene ARS. The data
in this profile are for the provider’s community-based residential services. This report presents the scale scores for the State, the Western Region and Washington
Greene ARS (Statewide). There must be data for 10 or more individuals to meet our selection criteria for reporting. If the number of respondents for any item falls
below 5, a dash (-) is shown. For all of the scale scores, a higher score is better and the scores can range from 0 to 100. Confidence intervals for provider scores
are given. Link to explanation of items in scales is below.
* indicates meaningful difference
Link to explanation of the questions in each scale Above average marked by
SCALES State West Washington Greene ARS
Individual Satisfaction 85.87 85.05 90.00 (76.61 – 100.00)
Individual Choice 46.90 49.35 38.68 (23.94 – 53.43)
Individual Inclusion 43.72 43.58 35.93 (27.26 – 44.60)
Individual Dignity 82.28 80.22 -
Physical Quality 96.92 97.13 91.67 (78.55 – 100.00)
Family Satisfaction 90.54 91.79 -
86
47 44
82
9791
85
4944
80
979290
39 36
92
0
20
40
60
80
100
120
SATISFACTION CHOICE INCLUSION DIGNITY PHYS QUAL FAM SAT
Scale Scores for State, Region, Provider
State West Washington Greene ARS

320
Interpreting the Data
These data will allow you to compare the average response
from this provider to the average response from all people
sampled in the state, region, and AE (when applicable).
Some differences are less meaningful than others,
depending on things like the size of the sample and the range
of answers provided for that particular scale. “Confidence
intervals” are used to determine whether differences are
statistically significant, or meaningful. Confidence intervals
are reported in parentheses.
To determine whether the average score of the provider is
meaningfully different from the averages of the state,
region, or AE, you can look at whether these scores fall
outside or inside the provider’s confidence interval.
Meaningful differences are marked with an asterisk “*”.
Summary of Findings
• The provider scores significantly above average for the
state, region and AE on Individual Satisfaction
Provider Profiles Data Display: Washington-Greene Alternative Residential Services (Washington AE) 2016-2017
Of the 5,328 individuals in the 2017 IM4Q data file, 10 individuals registered in Washington Administrative Entity received residential services from Washington
Greene ARS. The data in this profile are for the provider’s community-based residential services. This report presents the scale scores for the State, the Western
Region, Washington AE and Washington Greene ARS (Washington). There must be data for 10 or more individuals to meet our selection criteria for reporting. If
the number of respondents for any item falls below 5, a dash (-) is shown. For all of the scale scores, a higher score is better and the scores can range from 0 to
100. Confidence intervals for provider scores are given. Link to explanation of items in scales is below.
* indicates meaningful difference
Link to explanation of the questions in each scale Above average marked by
SCALES State West Washington Washington Greene ARS (Washington)
Individual Satisfaction 85.87* 85.05* 82.37* 96.00 (88.16 – 100.00)
Individual Choice 46.90 49.35 48.45 38.68 (23.94 – 53.43)
Individual Inclusion 43.72 43.58 45.08 35.86 (26.27 – 45.44)
Individual Dignity 82.28 80.22 70.83 -
Physical Quality 96.92 97.13 99.18 98.15 (94.52 – 100.00)
Family Satisfaction 90.54 91.79 81.79 -
86
47 44
82
9791
85
4944
80
9792
82
48 45
71
99
82
96
39 36
98
0
20
40
60
80
100
120
SATISFACTION CHOICE INCLUSION DIGNITY PHYS QUAL FAM SAT
Scale Scores for State, Region, County, Provider
State West Washington Washington Greene ARS (Washington)

321
Provider Profile Summary: Weiblinger’s Residential Care www.wrcare.com
Mission: Weiblinger’s Residential Care, Inc. (WRC) will work to ensure that every individual with intellectual and developmental disabilities is treated with respect
and dignity, both in the home and community. It is our mission to support the right of individuals with disabilities to live within any community of their choice, in
an effort to provide them with the same opportunities and standards of living as others in the community. Weiblinger's Residential Care, Inc. (WRC) will strive to
provide these individuals with supports tailored to their unique needs, as well as training and opportunities to facilitate their personal growth and independence.
It is the VISION of Weiblinger’s Residential Care, Inc. to: 1) Provide services to the Intellectually Disabled community with the same dignity and respect that any
other person in society would expect or receive. 2) Individuals served will be integrated with society and not treated any differently from the standards of norm.
3) The challenges the individual may possess will be both embraced and understood by WRC employees to afford them the knowledge to adapt both training and
necessary skills which help the individual learn and achieve their goal that involves living with dignity within society as any other person would.
WRC started in this field in 1975 when we opened our home and hearts to two gentlemen who lived as a part of our family for the next 28 years. In 1997 we
purchased a second home in order to grow our blended family by starting Respite Care for IDD individuals. The birth of Weiblinger’s Residential Care, Inc. took
place in 2002.
WRC values its DSP workforce through provision of thorough training. New DSP’s shadow fellow-seasoned DSP’s prior to working independently with consumers
served. DSP’s are versed on consumer’s ISP’s on an ongoing basis as services and support needs change. WRC strives at retention efforts to promote continuity of
care.
In the spirit of “Everyday Lives,” WRC regularly attempts to engage the individuals by involving them in both internal activities and any/all external activities that
the Pittsburgh area has to offer. An individual served by WRC proudly sits as Co-Chair of the WRC “Activities Committee.”
Family members are invited and encouraged to attend any event planned by WRC. WRC maintains an open-door policy regarding family visitation.
WRC maintains its internal Quality Management process. Consumer input is sought and data is maintained and on file.
What separates us? Family! Each participant and their family are like family to us. We work as a team with inside and outside members and aim toward helping
our residents work toward self-determination and control over the decisions they make.

322
Interpreting the Data
These data will allow you to compare the average response
from this provider to the average response from all people
sampled in the state, region, and AE (when applicable).
Some differences are less meaningful than others,
depending on things like the size of the sample and the range
of answers provided for that particular scale. “Confidence
intervals” are used to determine whether differences are
statistically significant, or meaningful. Confidence intervals
are reported in parentheses.
To determine whether the average score of the provider is
meaningfully different from the averages of the state,
region, or AE, you can look at whether these scores fall
outside or inside the provider’s confidence interval.
Meaningful differences are marked with an asterisk “*”.
Summary of Findings
• The provider scores significantly above average for the
state and AE on Individual Choice
• The provider scores significantly below average for the
state and region on Individual Dignity
• The provider scores significantly above average for the
state and region on Physical Quality
Provider Profiles Data Display: Weiblinger’s Residential Care (Allegheny AE) 2016-2017
Of the 5,328 individuals in the 2017 IM4Q data file, 21 individuals registered in Allegheny Administrative Entity received residential services from Weiblinger’s.
The data in this profile are for the provider’s community-based residential services. This report presents the scale scores for the State, the Western Region,
Allegheny AE and Weiblinger’s (Allegheny). There must be data for 10 or more individuals to meet our selection criteria for reporting. If the number of respondents
for any item falls below 5, a dash (-) is shown. For all of the scale scores, a higher score is better and the scores can range from 0 to 100. Confidence intervals for
provider scores are given. Link to explanation of items in scales is below.
* indicates meaningful difference **Statewide and AE specific data is the same for this provider
Link to explanation of the questions in each scale Above average marked by
SCALES State West Allegheny Weiblinger’s (Allegheny)**
Individual Satisfaction 85.87 85.05 82.82 77.55 (68.35 – 86.75)
Individual Choice 46.90* 49.35 46.36* 53.80 (47.38 – 60.22)
Individual Inclusion 43.72 43.58 41.23 41.61 (37.08 – 46.14)
Individual Dignity 82.28* 80.22* 71.61 64.77 (56.80 – 72.74)
Physical Quality 96.92* 97.13* 97.86 99.17 (97.53 – 100.00)
Family Satisfaction 90.54 91.79 80.03 -
86
47 44
82
9791
85
4944
80
9792
83
4641
72
98
8078
54
42
65
99
0
20
40
60
80
100
120
SATISFACTION CHOICE INCLUSION DIGNITY PHYS QUAL FAM SAT
Scale Scores for State, Region, County, Provider
State West Allegheny Weiblinger's (Allegheny)

323
Provider Profile Summary: Wesley Family Services (Formerly Family Services of Western PA) www.wfspa.org
Our mission is to empower children, adults and families by providing transformational care. Our vision is to do more for children, families and adults; be more
effective, efficient and sustainable; and continue to innovate in what we do and how we do it.
Our guiding values: Transformation, empathy, excellence, innovation and inspiration.
We have been serving people for more than 45 years.
We Provide: Residential Group Home Living – Support for individuals living together in community group homes; Life Sharing – Support for individuals living in
homes owned by family members or community members; Respite – Short-term residential support for individuals that need planned or immediate residential
services; Community Participation Support – Support for individuals creating relationships in their communities by volunteering or employment; Job Coaching –
Support for individuals to become employment ready and or support for individuals that are actively employed; Behavior Services – support for providers and
individuals to help address individual behavior concerns.
We have a deaf home and staff that are trained in basic American Sign Language. We have a full-time behavior support specialist as a member of our team. We
have a community integration program where staff work to secure employment opportunities in the community.
Staff that work in our deaf house are all trained in basic American Sign Language. We develop individual service plans for each individual that address their specific
communication needs. We utilize communication specialist services as needs arise with clients. Staff are trained in all individual communication needs.
All clients are assessed to determine their individual needs, wants, strengths and weaknesses. Services and community integration are then planned based on the
client’s interests. Depending on the identified needs of the clients, staff are trained to help advocate for and support the individual in their preferred activities. For
example, we have clients that work in local Attorney General offices, participate in their local senior center and activities and also travel to other states to spend
time with family members and go on family vacations.
All family members of individuals in services participate in an annual satisfaction survey. Our agency also facilitates a peer support program for family and
community members involved in services. Our agency also has a Parent Advisory Board that meets monthly to help plan annual activities for clients and staff. All
family members are invited to attend our annual client activities. For example, we host an annual prom and annual picnic at a local amusement park.
During our 18-19 fiscal year we have imbedded a professional development program for our DSP staff, increased our hourly wage and are also providing a semi-
annual staff bonus. We plan to continue these efforts into our next fiscal year as well. With the recent OIG report regarding risk factors in the IDD population, we
contracted out and hosted a “Choking and Aspiration” training with a qualified RN that all DSP staff are required to attend. We are also adding these to our QM
plan.
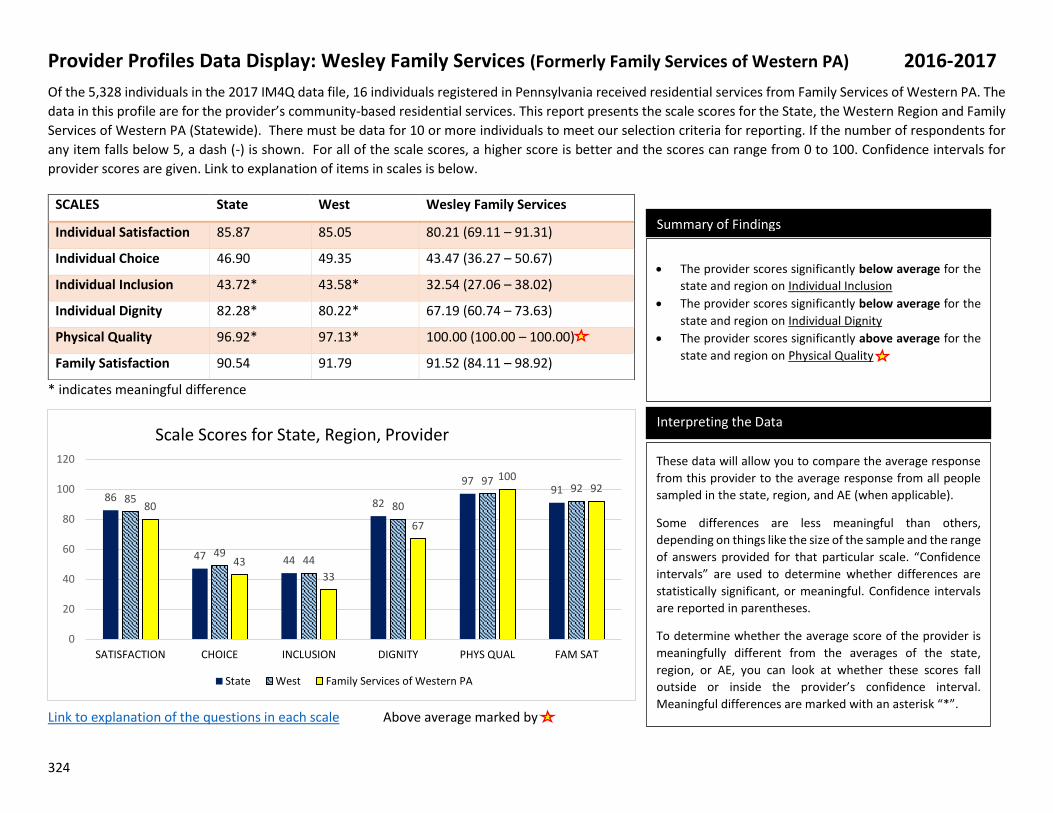
324
Interpreting the Data
These data will allow you to compare the average response
from this provider to the average response from all people
sampled in the state, region, and AE (when applicable).
Some differences are less meaningful than others,
depending on things like the size of the sample and the range
of answers provided for that particular scale. “Confidence
intervals” are used to determine whether differences are
statistically significant, or meaningful. Confidence intervals
are reported in parentheses.
To determine whether the average score of the provider is
meaningfully different from the averages of the state,
region, or AE, you can look at whether these scores fall
outside or inside the provider’s confidence interval.
Meaningful differences are marked with an asterisk “*”.
Summary of Findings
• The provider scores significantly below average for the
state and region on Individual Inclusion
• The provider scores significantly below average for the
state and region on Individual Dignity
• The provider scores significantly above average for the
state and region on Physical Quality
Provider Profiles Data Display: Wesley Family Services (Formerly Family Services of Western PA) 2016-2017
Of the 5,328 individuals in the 2017 IM4Q data file, 16 individuals registered in Pennsylvania received residential services from Family Services of Western PA. The
data in this profile are for the provider’s community-based residential services. This report presents the scale scores for the State, the Western Region and Family
Services of Western PA (Statewide). There must be data for 10 or more individuals to meet our selection criteria for reporting. If the number of respondents for
any item falls below 5, a dash (-) is shown. For all of the scale scores, a higher score is better and the scores can range from 0 to 100. Confidence intervals for
provider scores are given. Link to explanation of items in scales is below.
* indicates meaningful difference
Link to explanation of the questions in each scale Above average marked by
SCALES State West Wesley Family Services
Individual Satisfaction 85.87 85.05 80.21 (69.11 – 91.31)
Individual Choice 46.90 49.35 43.47 (36.27 – 50.67)
Individual Inclusion 43.72* 43.58* 32.54 (27.06 – 38.02)
Individual Dignity 82.28* 80.22* 67.19 (60.74 – 73.63)
Physical Quality 96.92* 97.13* 100.00 (100.00 – 100.00)
Family Satisfaction 90.54 91.79 91.52 (84.11 – 98.92)
86
47 44
82
9791
85
4944
80
9792
80
43
33
67
10092
0
20
40
60
80
100
120
SATISFACTION CHOICE INCLUSION DIGNITY PHYS QUAL FAM SAT
Scale Scores for State, Region, Provider
State West Family Services of Western PA
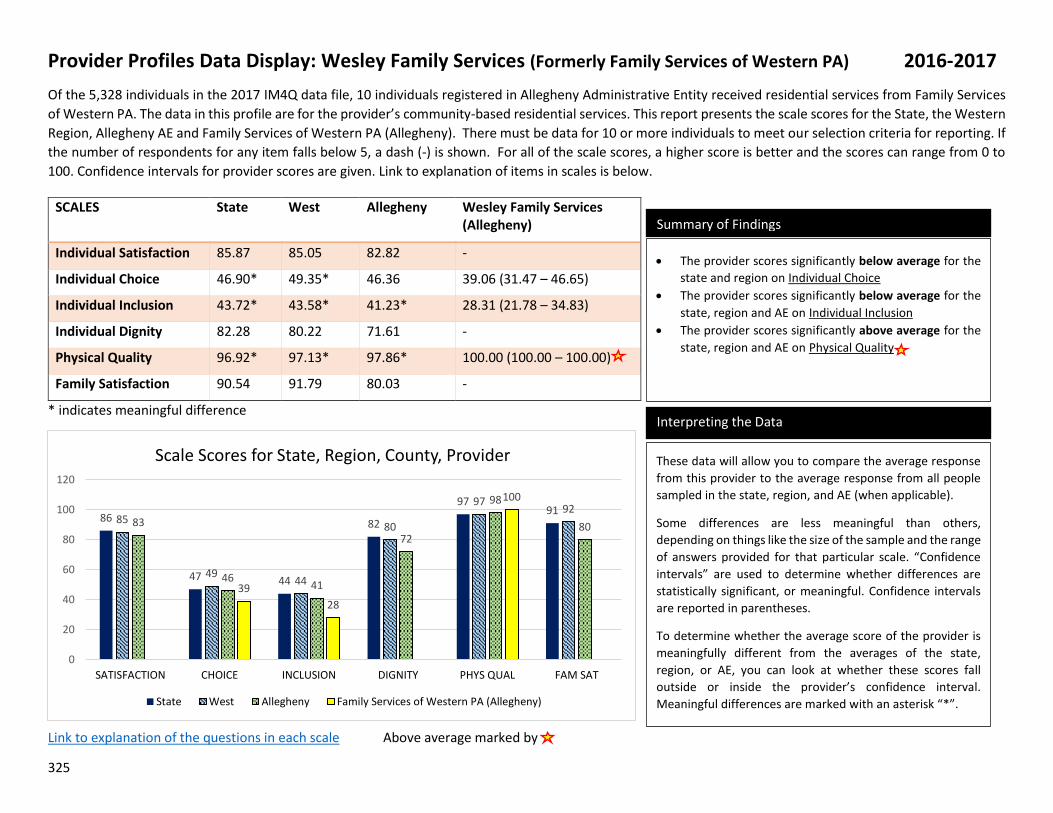
325
Interpreting the Data
These data will allow you to compare the average response
from this provider to the average response from all people
sampled in the state, region, and AE (when applicable).
Some differences are less meaningful than others,
depending on things like the size of the sample and the range
of answers provided for that particular scale. “Confidence
intervals” are used to determine whether differences are
statistically significant, or meaningful. Confidence intervals
are reported in parentheses.
To determine whether the average score of the provider is
meaningfully different from the averages of the state,
region, or AE, you can look at whether these scores fall
outside or inside the provider’s confidence interval.
Meaningful differences are marked with an asterisk “*”.
Summary of Findings
• The provider scores significantly below average for the
state and region on Individual Choice
• The provider scores significantly below average for the
state, region and AE on Individual Inclusion
• The provider scores significantly above average for the
state, region and AE on Physical Quality
Provider Profiles Data Display: Wesley Family Services (Formerly Family Services of Western PA) 2016-2017
Of the 5,328 individuals in the 2017 IM4Q data file, 10 individuals registered in Allegheny Administrative Entity received residential services from Family Services
of Western PA. The data in this profile are for the provider’s community-based residential services. This report presents the scale scores for the State, the Western
Region, Allegheny AE and Family Services of Western PA (Allegheny). There must be data for 10 or more individuals to meet our selection criteria for reporting. If
the number of respondents for any item falls below 5, a dash (-) is shown. For all of the scale scores, a higher score is better and the scores can range from 0 to
100. Confidence intervals for provider scores are given. Link to explanation of items in scales is below.
* indicates meaningful difference
Link to explanation of the questions in each scale Above average marked by
SCALES State West Allegheny Wesley Family Services (Allegheny)
Individual Satisfaction 85.87 85.05 82.82 -
Individual Choice 46.90* 49.35* 46.36 39.06 (31.47 – 46.65)
Individual Inclusion 43.72* 43.58* 41.23* 28.31 (21.78 – 34.83)
Individual Dignity 82.28 80.22 71.61 -
Physical Quality 96.92* 97.13* 97.86* 100.00 (100.00 – 100.00)
Family Satisfaction 90.54 91.79 80.03 -
86
47 44
82
9791
85
4944
80
9792
83
4641
72
98
80
39
28
100
0
20
40
60
80
100
120
SATISFACTION CHOICE INCLUSION DIGNITY PHYS QUAL FAM SAT
Scale Scores for State, Region, County, Provider
State West Allegheny Family Services of Western PA (Allegheny)

326
Provider Profile Summary: Woods Services www.woods.org
MISSION: Woods supports children and adults with disabilities or challenges to achieve their highest potential and independence through innovative and
individualized approaches that promote learning and personal fulfillment. Woods is a nonprofit multi-service population health management and advocacy
organization that provides innovated, comprehensive and integrated health education, housing, workforce, behavioral health and care coordination services to
children and adults in the intellectual and developmental disability, child welfare, behavioral and brain trauma public health sectors who have complex and
intensive medical and behavioral healthcare needs. Woods envisions a world where an individual has opportunities and supports that promote self-determination,
the joy of achievement, and a fulfilling life. Our core values are Tenacity, Exceptional, Advocacy, and Multicultural.
Woods has been supporting people with intellectual disabilities and/or autism for 105 years.
Woods provides housing opportunities across the continuum; including independent living, group home settings, and campus-based opportunities. Woods
provides age and developmentally appropriate education and day program services, therapeutic recreation and community integration and engagement, primary
and specialized medical care and treatment, nutritional services, rehabilitation services, family therapy, parent education, vocational programming and planning,
job readiness training and supports, job placement and employment opportunities, as well as allied therapies including individual and group therapy, applied
behavioral analysis and other interventions and supports, speech, occupational therapy and physical therapy.
Areas of special expertise: For example, people who are deaf or hard of hearing, people with behavioral support needs, people with complex medical needs,
employment services, community participation.
Woods specializes in supporting individuals with intellectual/developmental disability and co-occurring psychiatric, behavioral, and medically complex conditions.
All staff participate in a comprehensive onboarding program before working with individuals. This program includes education about communication systems and
strategies used by those we serve. For individuals who rely on individualized or assisted modes of communication, staff receive instruction by speech therapists
and/or care coordinators.
Woods multidisciplinary teams use a strength-based model in their support of those we serve. This includes assessment and understanding of each consumer's
personal goals, likes, dislikes, and interests. Once identified, team members support individuals in networking and connecting with community resources to
facilitate active community engagement.
Families and others involved in the lives of those we serve are valued members of each planning team. They participate in all program development activities and
are invited to engage in all Woods supported activities. Woods supports ongoing family contact through various means including personal visits in the family or
individual's home, communication through various social media options, and other means that may be unique to the needs of each family.
Through our quality improvement process we’ve identified key areas to address towards improvement of our service delivery. Areas of concentration include the
introduction of a trauma informed approach to supporting individuals who struggle with behavioral challenges, a person-centered population health approach to
improve overall physical and behavioral health outcomes and a systematic method to reduce the risk of falls among those consumers who are experiencing age
related conditions.
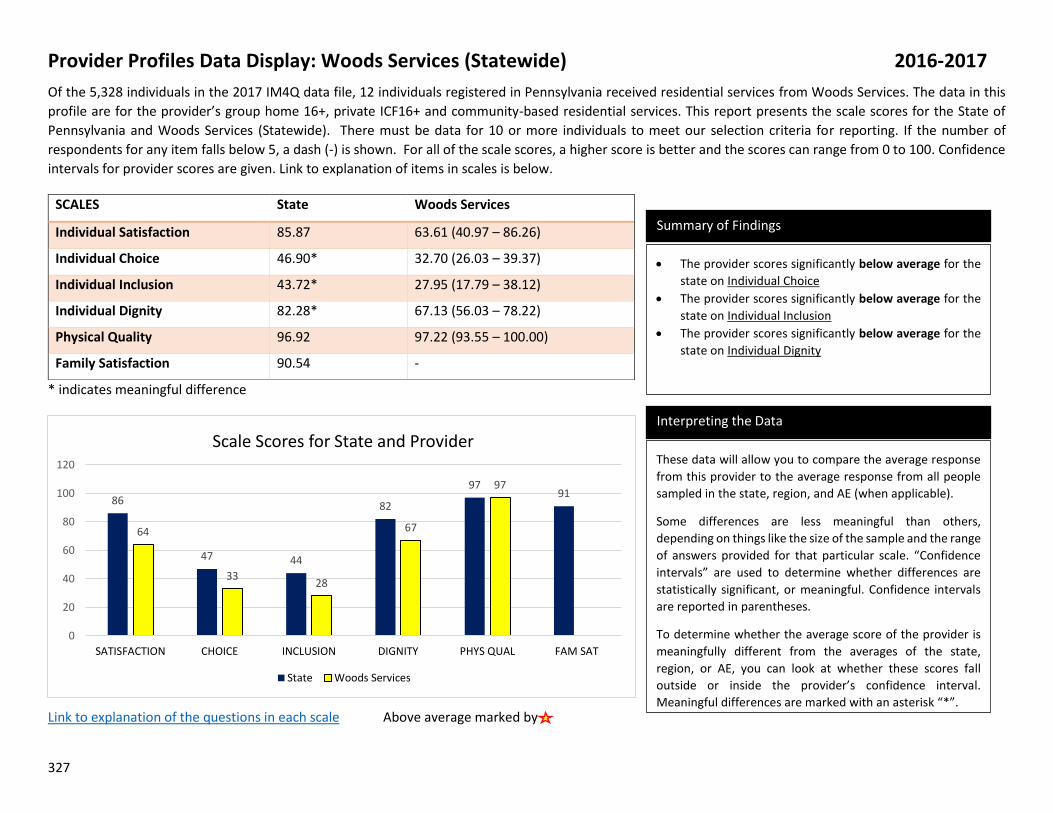
327
Interpreting the Data
These data will allow you to compare the average response
from this provider to the average response from all people
sampled in the state, region, and AE (when applicable).
Some differences are less meaningful than others,
depending on things like the size of the sample and the range
of answers provided for that particular scale. “Confidence
intervals” are used to determine whether differences are
statistically significant, or meaningful. Confidence intervals
are reported in parentheses.
To determine whether the average score of the provider is
meaningfully different from the averages of the state,
region, or AE, you can look at whether these scores fall
outside or inside the provider’s confidence interval.
Meaningful differences are marked with an asterisk “*”.
Summary of Findings
• The provider scores significantly below average for the
state on Individual Choice
• The provider scores significantly below average for the
state on Individual Inclusion
• The provider scores significantly below average for the
state on Individual Dignity
Provider Profiles Data Display: Woods Services (Statewide) 2016-2017
Of the 5,328 individuals in the 2017 IM4Q data file, 12 individuals registered in Pennsylvania received residential services from Woods Services. The data in this
profile are for the provider’s group home 16+, private ICF16+ and community-based residential services. This report presents the scale scores for the State of
Pennsylvania and Woods Services (Statewide). There must be data for 10 or more individuals to meet our selection criteria for reporting. If the number of
respondents for any item falls below 5, a dash (-) is shown. For all of the scale scores, a higher score is better and the scores can range from 0 to 100. Confidence
intervals for provider scores are given. Link to explanation of items in scales is below.
* indicates meaningful difference
Link to explanation of the questions in each scale Above average marked by
SCALES State Woods Services
Individual Satisfaction 85.87 63.61 (40.97 – 86.26)
Individual Choice 46.90* 32.70 (26.03 – 39.37)
Individual Inclusion 43.72* 27.95 (17.79 – 38.12)
Individual Dignity 82.28* 67.13 (56.03 – 78.22)
Physical Quality 96.92 97.22 (93.55 – 100.00)
Family Satisfaction 90.54 -
86
47 44
82
9791
64
3328
67
97
0
20
40
60
80
100
120
SATISFACTION CHOICE INCLUSION DIGNITY PHYS QUAL FAM SAT
Scale Scores for State and Provider
State Woods Services