Embed Size (px)
Citation preview

Compensation Update
Office of Human Resources
1
Board Presentation
August 10, 2015

PURPOSE
1. Provide an overview of the compensation study.
2. Provide the APS administration’s salary adjustment recommendations based upon the compensation study.
2
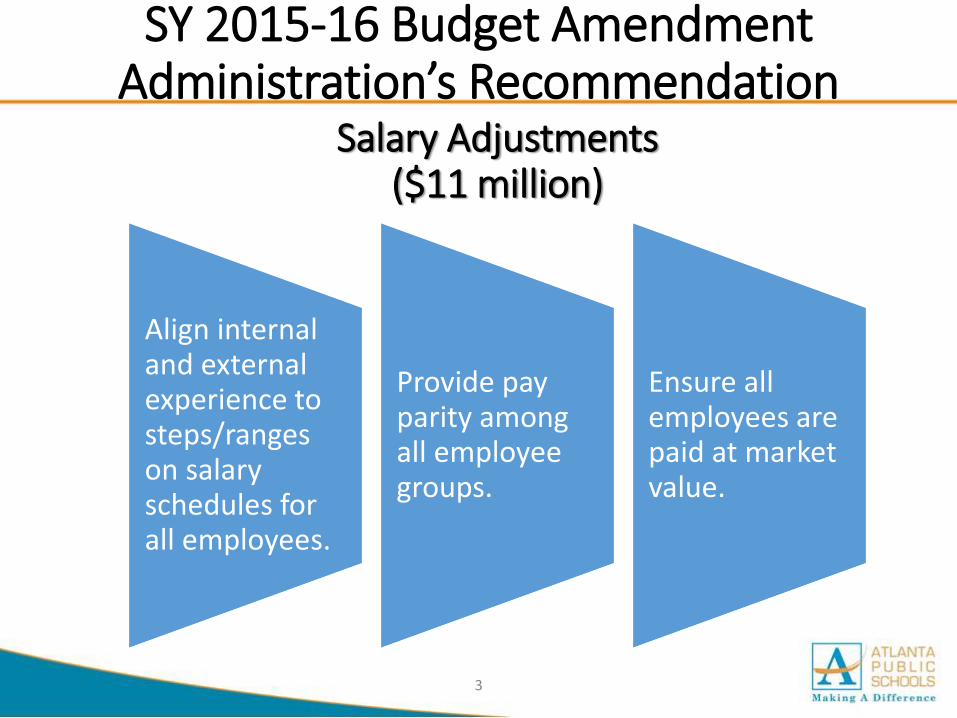
SY 2015-16 Budget Amendment Administration’s Recommendation
3
Align internal and external experience to steps/ranges on salary schedules for all employees.
Provide pay parity among all employee groups.
Ensure all employees are paid at market value.
Salary Adjustments($11 million)
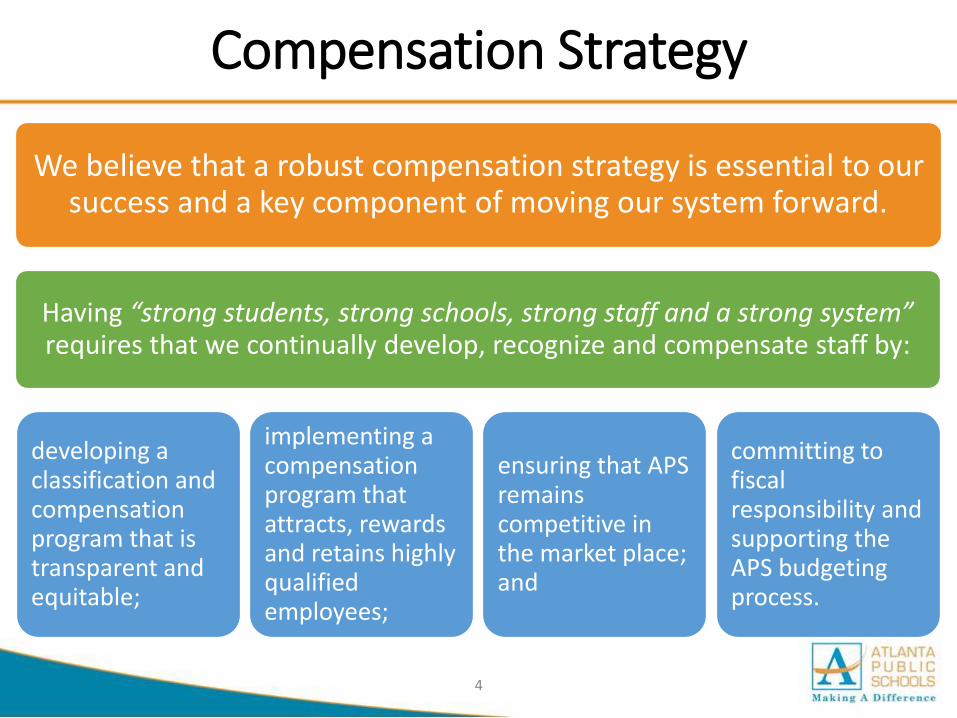
Compensation Strategy
4
We believe that a robust compensation strategy is essential to our success and a key component of moving our system forward.
Having “strong students, strong schools, strong staff and a strong system” requires that we continually develop, recognize and compensate staff by:
developing a classification and compensation program that is transparent and equitable;
implementing a compensation program that attracts, rewards and retains highly qualified employees;
ensuring that APS remains competitive in the market place; and
committing to fiscal responsibility and supporting the APS budgeting process.
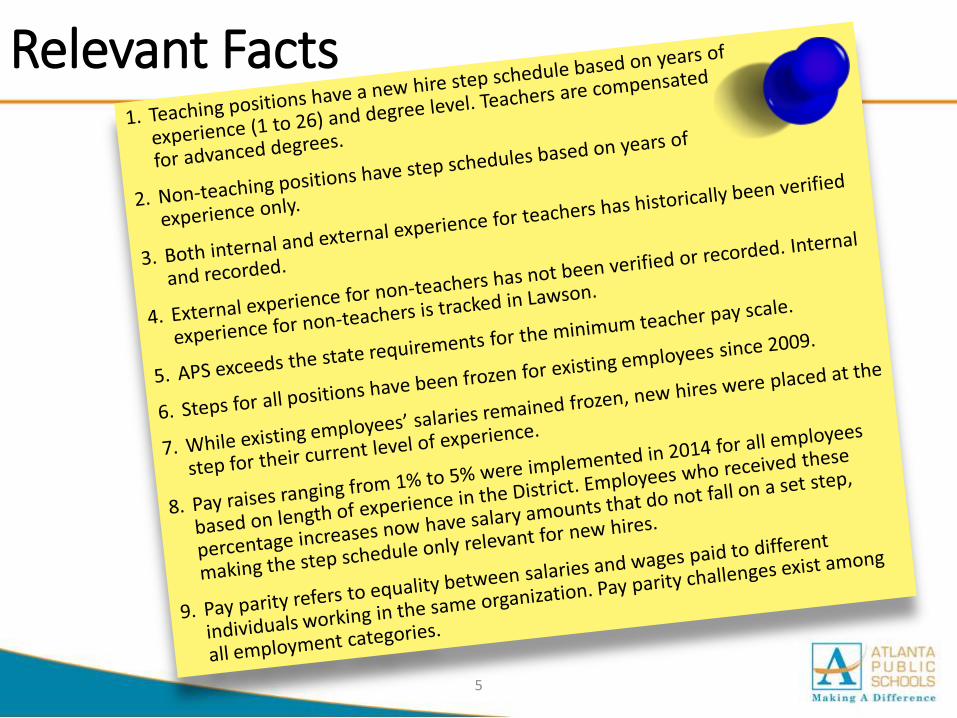
Relevant Facts
5
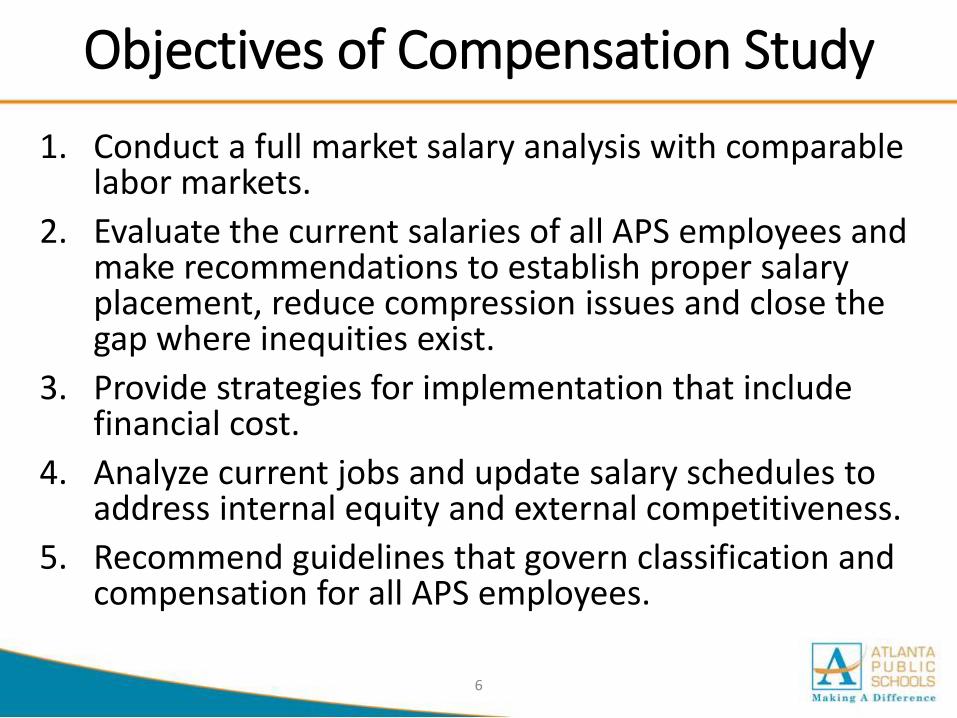
Objectives of Compensation Study
1. Conduct a full market salary analysis with comparable labor markets.
2. Evaluate the current salaries of all APS employees and make recommendations to establish proper salary placement, reduce compression issues and close the gap where inequities exist.
3. Provide strategies for implementation that include financial cost.
4. Analyze current jobs and update salary schedules to address internal equity and external competitiveness.
5. Recommend guidelines that govern classification and compensation for all APS employees.
6

Compensation Study Consultant• The Management Advisory Group International, Inc. (MAG) was
selected through a procurement RFP process to conduct the compensation and classification study for a fee.
• MAG is a national, full service human resources consulting firm based in Woodbridge, Virginia with extensive experience in classification and compensation projects, job analysis and evaluation, personnel policy and human resource software.
• Principals of the firm have over 30 years of municipal consulting experience and have conducted over 500 similar studies in 24 states.
• MAG conducted similar compensation projects for:• Philadelphia School District• Fairfax County Public Schools• Memphis City Schools• Virginia Beach City Schools• Dallas Independent School District• Henry County Public School District – GA• DeKalb County Schools – GA
7
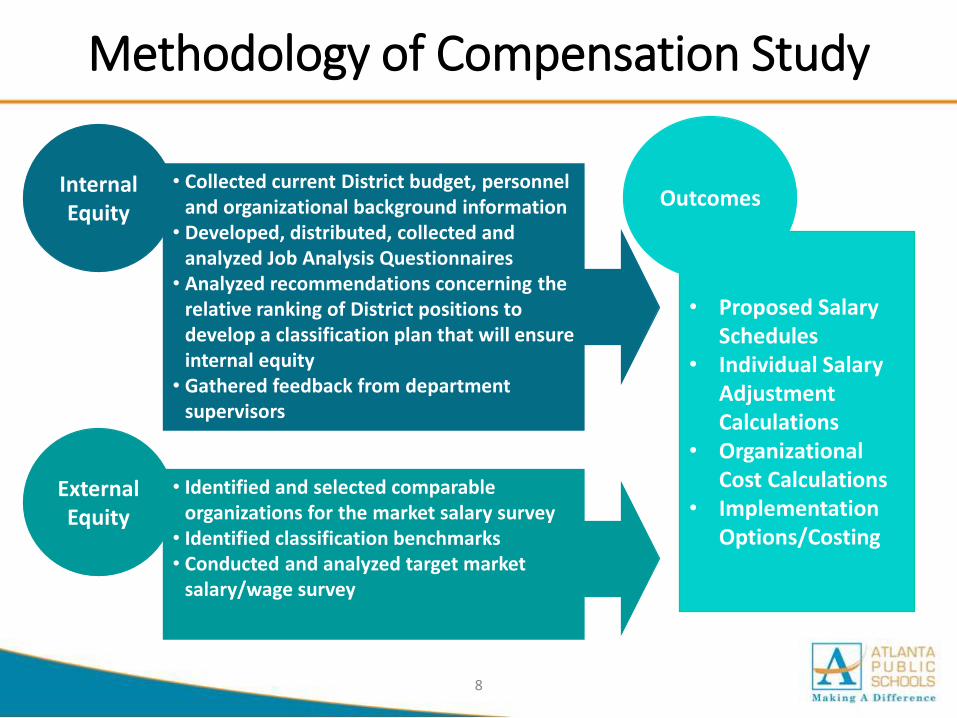
Methodology of Compensation Study
8
• Collected current District budget, personnel and organizational background information
• Developed, distributed, collected and analyzed Job Analysis Questionnaires
• Analyzed recommendations concerning the relative ranking of District positions to develop a classification plan that will ensure internal equity
• Gathered feedback from department supervisors
• Identified and selected comparable organizations for the market salary survey
• Identified classification benchmarks• Conducted and analyzed target market
salary/wage survey
Internal Equity
External Equity
• Proposed Salary Schedules
• Individual Salary Adjustment Calculations
• Organizational Cost Calculations
• Implementation Options/Costing
Outcomes
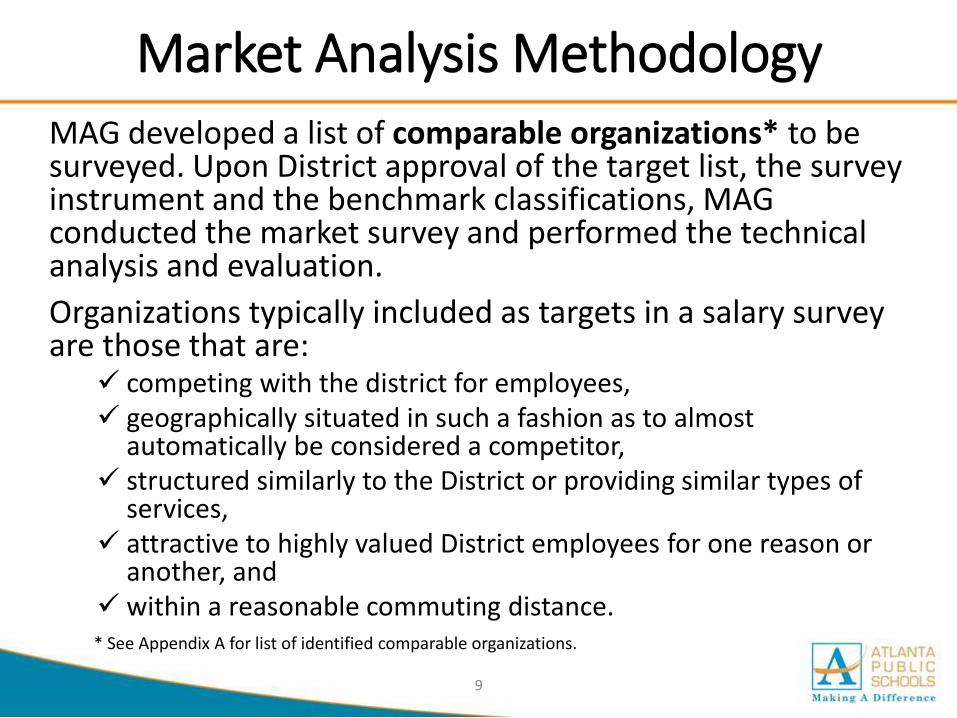
Market Analysis Methodology
9
MAG developed a list of comparable organizations* to be surveyed. Upon District approval of the target list, the survey instrument and the benchmark classifications, MAG conducted the market survey and performed the technical analysis and evaluation.
Organizations typically included as targets in a salary survey are those that are:
competing with the district for employees, geographically situated in such a fashion as to almost
automatically be considered a competitor, structured similarly to the District or providing similar types of
services, attractive to highly valued District employees for one reason or
another, and within a reasonable commuting distance.* See Appendix A for list of identified comparable organizations.
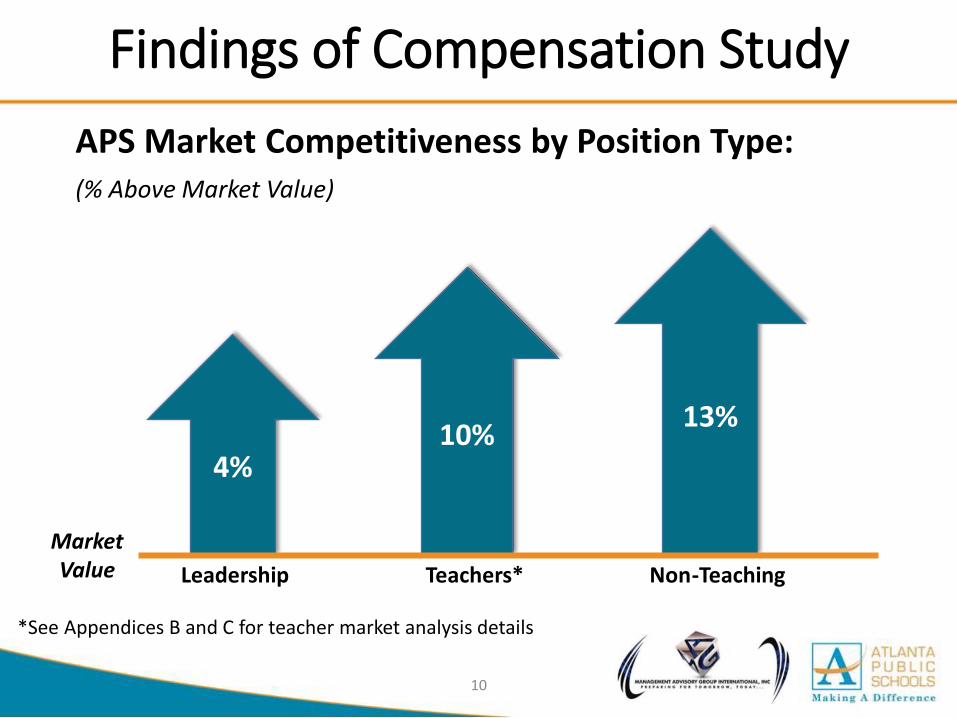
Findings of Compensation Study
APS Market Competitiveness by Position Type:(% Above Market Value)
10
4%10%
13%
Market Value Leadership Teachers* Non-Teaching
*See Appendices B and C for teacher market analysis details
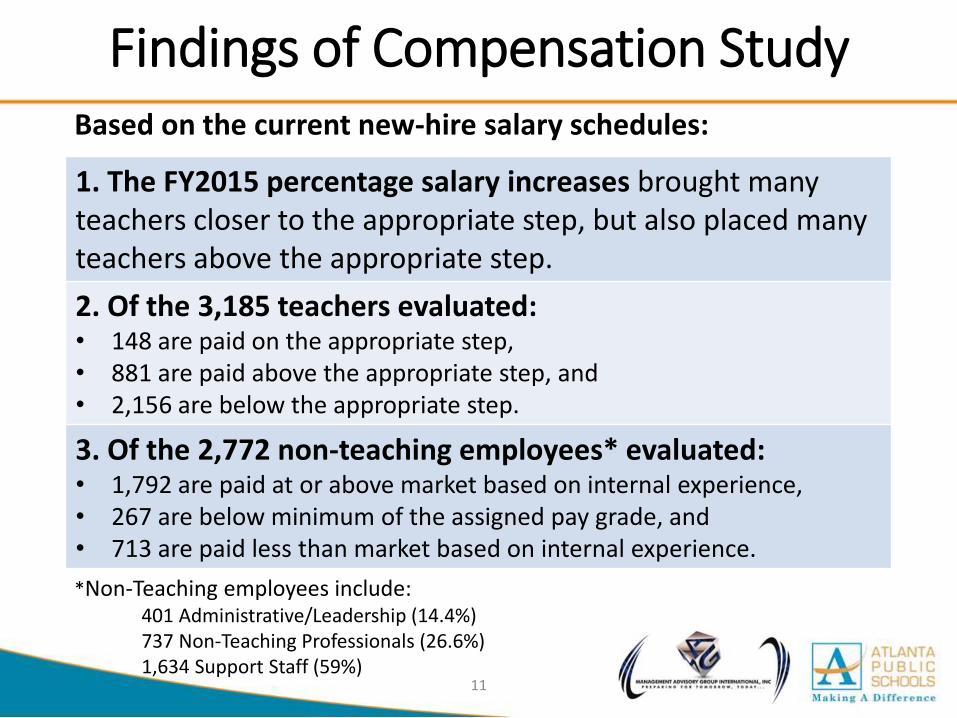
Findings of Compensation Study
11
1. The FY2015 percentage salary increases brought many teachers closer to the appropriate step, but also placed many teachers above the appropriate step.
2. Of the 3,185 teachers evaluated:• 148 are paid on the appropriate step,• 881 are paid above the appropriate step, and• 2,156 are below the appropriate step.
3. Of the 2,772 non-teaching employees* evaluated:• 1,792 are paid at or above market based on internal experience,• 267 are below minimum of the assigned pay grade, and• 713 are paid less than market based on internal experience.
*Non-Teaching employees include:401 Administrative/Leadership (14.4%)737 Non-Teaching Professionals (26.6%)1,634 Support Staff (59%)
Based on the current new-hire salary schedules:
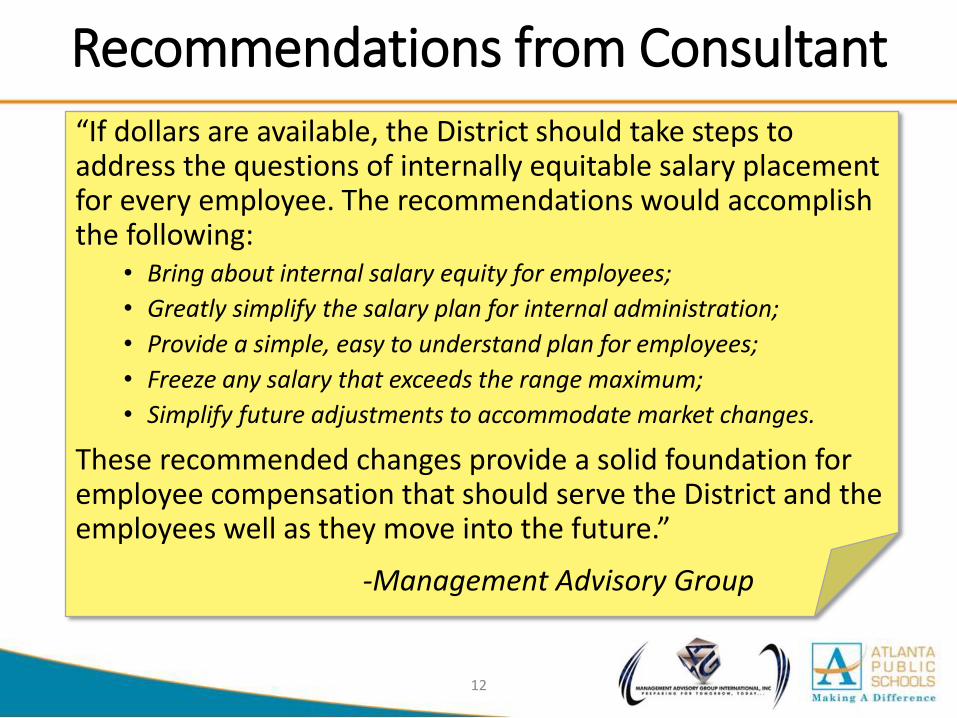
Recommendations from Consultant
12
“If dollars are available, the District should take steps to address the questions of internally equitable salary placement for every employee. The recommendations would accomplish the following:
• Bring about internal salary equity for employees;
• Greatly simplify the salary plan for internal administration;
• Provide a simple, easy to understand plan for employees;
• Freeze any salary that exceeds the range maximum;
• Simplify future adjustments to accommodate market changes.
These recommended changes provide a solid foundation for employee compensation that should serve the District and the employees well as they move into the future.”
-Management Advisory Group
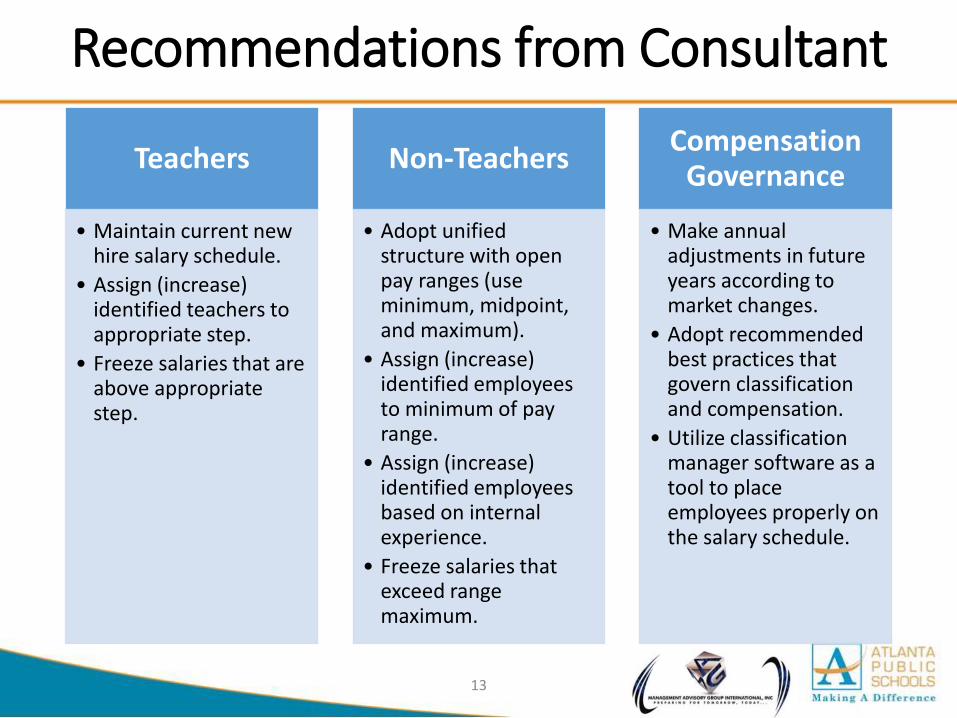
Recommendations from Consultant
13
Teachers
• Maintain current new hire salary schedule.
• Assign (increase) identified teachers to appropriate step.
• Freeze salaries that are above appropriate step.
Non-Teachers
• Adopt unified structure with open pay ranges (use minimum, midpoint, and maximum).
• Assign (increase) identified employees to minimum of pay range.
• Assign (increase) identified employees based on internal experience.
• Freeze salaries that exceed range maximum.
Compensation Governance
• Make annual adjustments in future years according to market changes.
• Adopt recommended best practices that govern classification and compensation.
• Utilize classification manager software as a tool to place employees properly on the salary schedule.
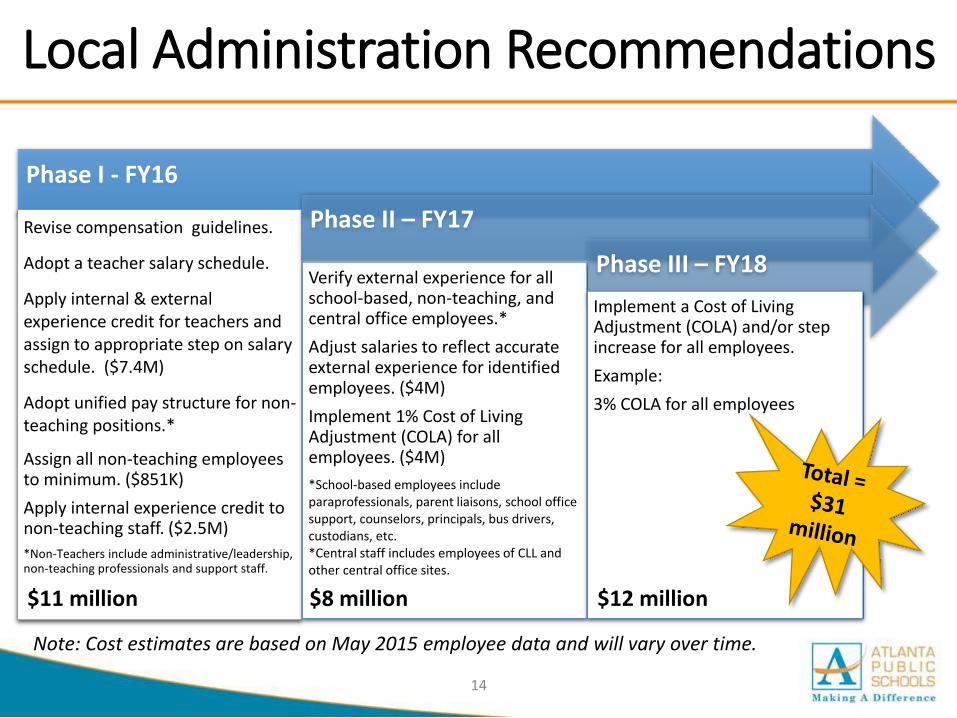
Local Administration Recommendations
Phase I - FY16
Revise compensation guidelines.
Adopt a teacher salary schedule.
Apply internal & external experience credit for teachers and assign to appropriate step on salary schedule. ($7.4M)
Adopt unified pay structure for non-teaching positions.*
Assign all non-teaching employees to minimum. ($851K)
Apply internal experience credit to non-teaching staff. ($2.5M)
*Non-Teachers include administrative/leadership, non-teaching professionals and support staff.
Phase II – FY17
Verify external experience for all school-based, non-teaching, and central office employees.*
Adjust salaries to reflect accurate external experience for identified employees. ($4M)
Implement 1% Cost of Living Adjustment (COLA) for all employees. ($4M)
*School-based employees include paraprofessionals, parent liaisons, school office support, counselors, principals, bus drivers, custodians, etc. *Central staff includes employees of CLL and other central office sites.
Phase III – FY18
Implement a Cost of Living Adjustment (COLA) and/or step increase for all employees.
Example:
3% COLA for all employees
14
$11 million
Note: Cost estimates are based on May 2015 employee data and will vary over time.
$8 million $12 million
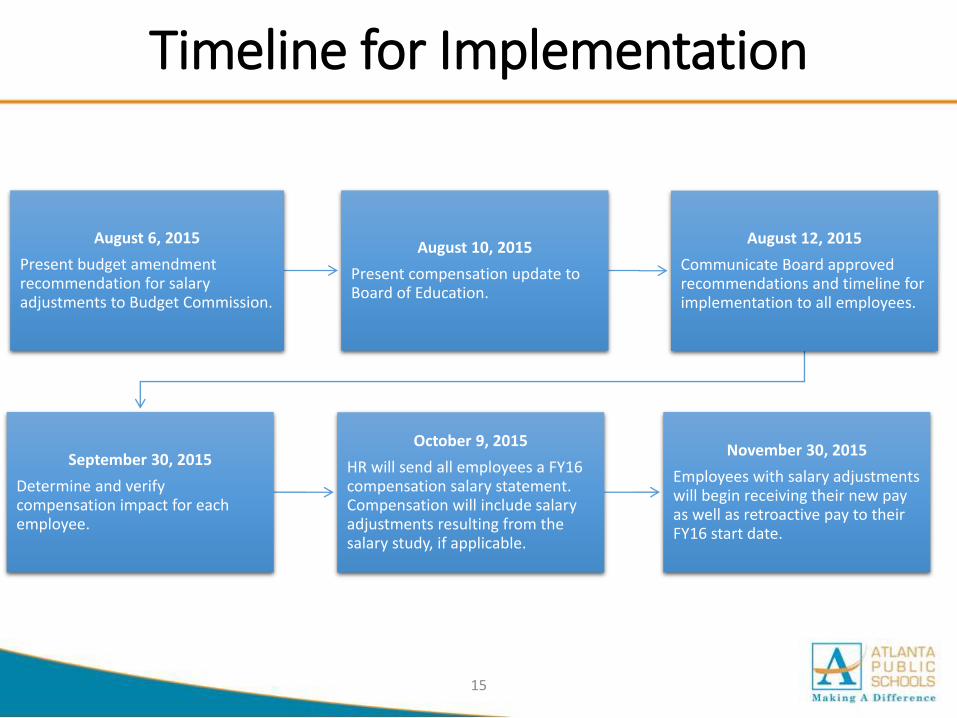
Timeline for Implementation
15
August 6, 2015
Present budget amendment recommendation for salary adjustments to Budget Commission.
August 10, 2015
Present compensation update to Board of Education.
August 12, 2015
Communicate Board approved recommendations and timeline for implementation to all employees.
September 30, 2015
Determine and verify compensation impact for each employee.
October 9, 2015
HR will send all employees a FY16 compensation salary statement. Compensation will include salary adjustments resulting from the salary study, if applicable.
November 30, 2015
Employees with salary adjustments will begin receiving their new pay as well as retroactive pay to their FY16 start date.
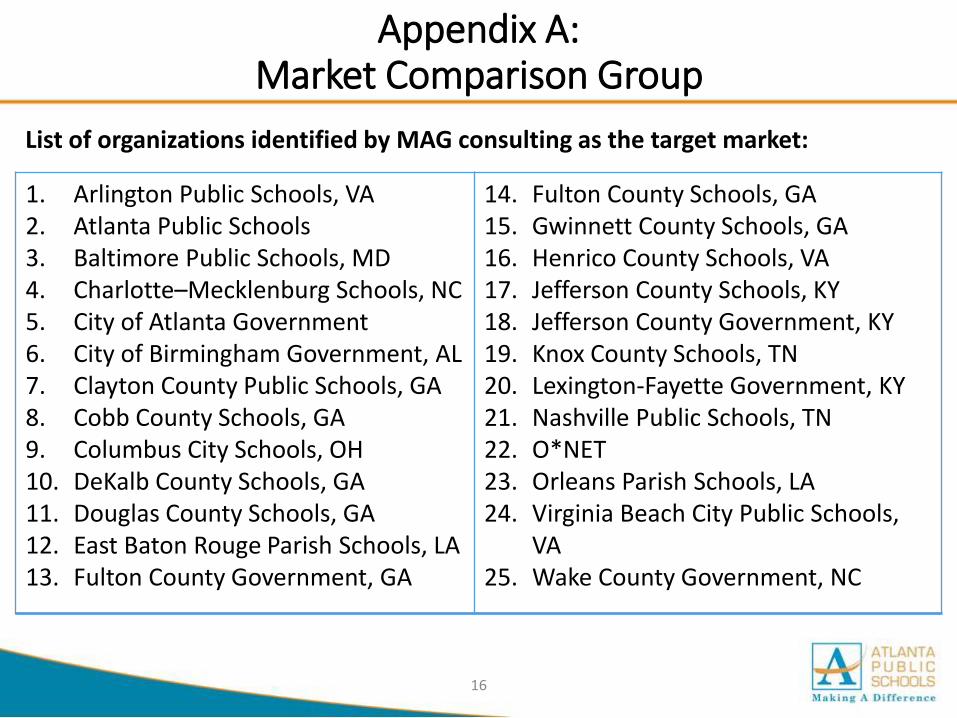
Appendix A: Market Comparison Group
16
1. Arlington Public Schools, VA2. Atlanta Public Schools3. Baltimore Public Schools, MD4. Charlotte–Mecklenburg Schools, NC5. City of Atlanta Government6. City of Birmingham Government, AL7. Clayton County Public Schools, GA8. Cobb County Schools, GA9. Columbus City Schools, OH10. DeKalb County Schools, GA11. Douglas County Schools, GA12. East Baton Rouge Parish Schools, LA13. Fulton County Government, GA
14. Fulton County Schools, GA15. Gwinnett County Schools, GA16. Henrico County Schools, VA17. Jefferson County Schools, KY18. Jefferson County Government, KY19. Knox County Schools, TN20. Lexington-Fayette Government, KY21. Nashville Public Schools, TN22. O*NET23. Orleans Parish Schools, LA24. Virginia Beach City Public Schools,
VA25. Wake County Government, NC
List of organizations identified by MAG consulting as the target market:
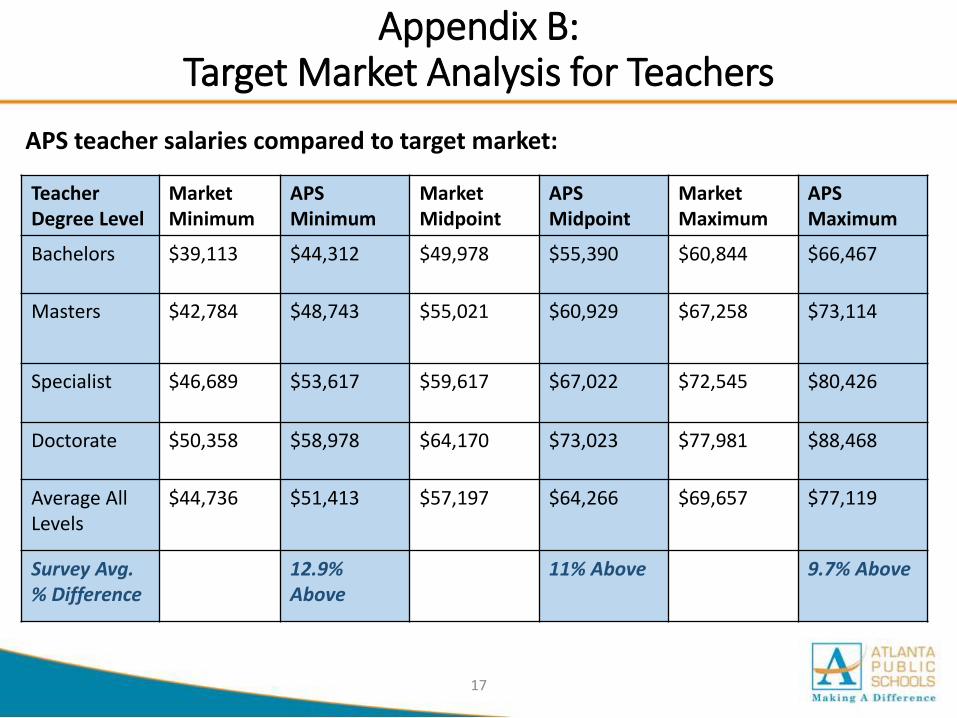
Appendix B: Target Market Analysis for Teachers
17
Teacher Degree Level
Market Minimum
APS Minimum
Market Midpoint
APS Midpoint
Market Maximum
APS Maximum
Bachelors $39,113 $44,312 $49,978 $55,390 $60,844 $66,467
Masters $42,784 $48,743 $55,021 $60,929 $67,258 $73,114
Specialist $46,689 $53,617 $59,617 $67,022 $72,545 $80,426
Doctorate $50,358 $58,978 $64,170 $73,023 $77,981 $88,468
Average All Levels
$44,736 $51,413 $57,197 $64,266 $69,657 $77,119
Survey Avg. % Difference
12.9% Above
11% Above 9.7% Above
APS teacher salaries compared to target market:
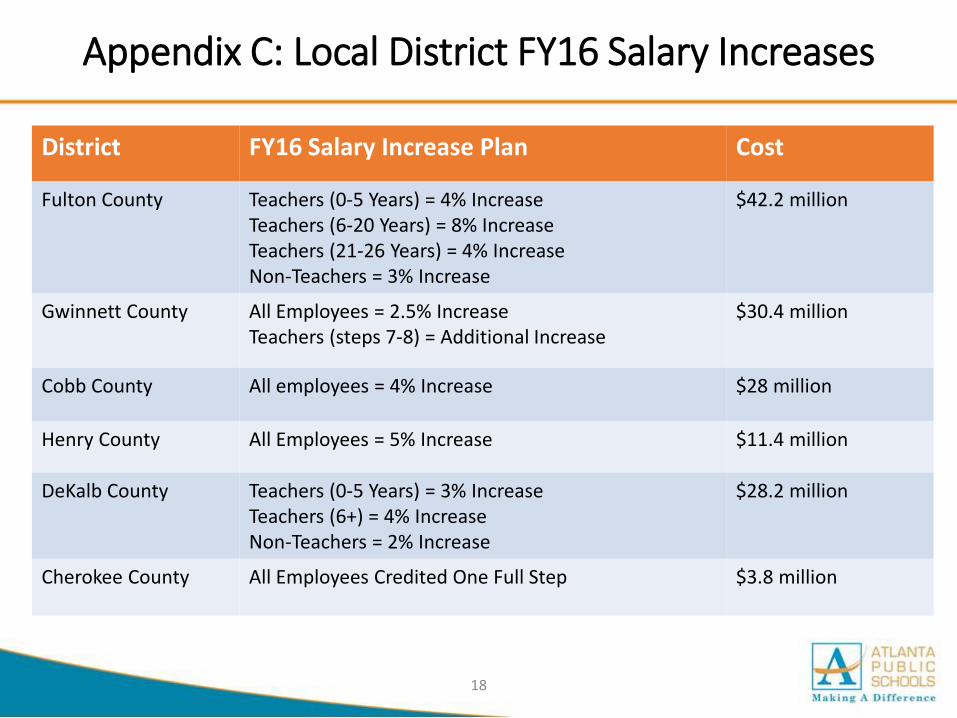
Appendix C: Local District FY16 Salary Increases
18
District FY16 Salary Increase Plan Cost
Fulton County Teachers (0-5 Years) = 4% IncreaseTeachers (6-20 Years) = 8% IncreaseTeachers (21-26 Years) = 4% IncreaseNon-Teachers = 3% Increase
$42.2 million
Gwinnett County All Employees = 2.5% IncreaseTeachers (steps 7-8) = Additional Increase
$30.4 million
Cobb County All employees = 4% Increase $28 million
Henry County All Employees = 5% Increase $11.4 million
DeKalb County Teachers (0-5 Years) = 3% IncreaseTeachers (6+) = 4% IncreaseNon-Teachers = 2% Increase
$28.2 million
Cherokee County All Employees Credited One Full Step $3.8 million
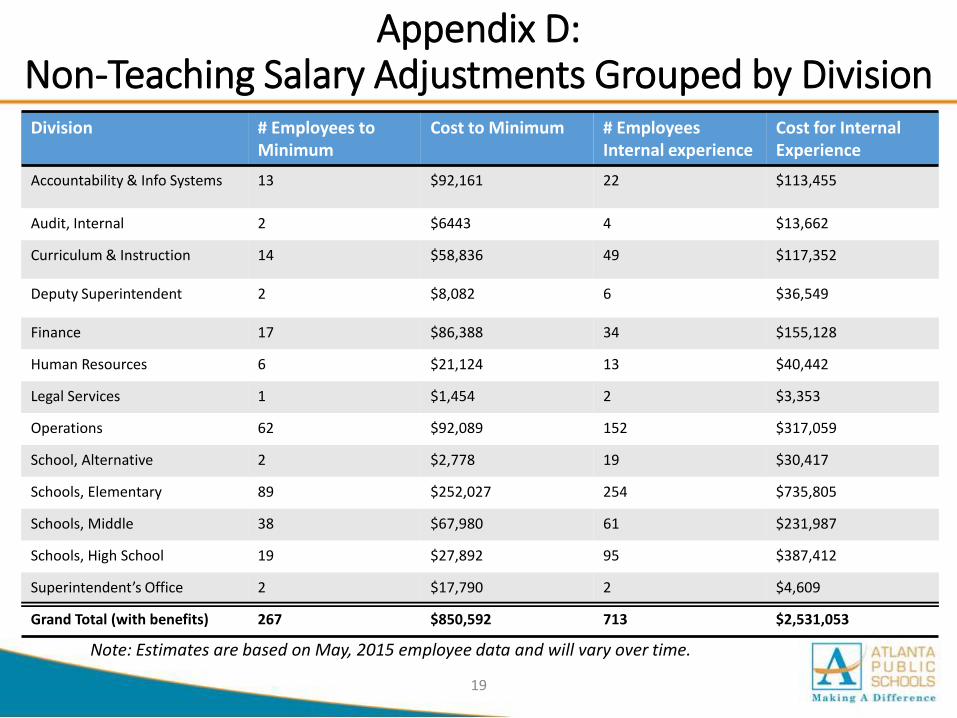
Appendix D: Non-Teaching Salary Adjustments Grouped by Division
19
Division # Employees to Minimum
Cost to Minimum # Employees Internal experience
Cost for Internal Experience
Accountability & Info Systems 13 $92,161 22 $113,455
Audit, Internal 2 $6443 4 $13,662
Curriculum & Instruction 14 $58,836 49 $117,352
Deputy Superintendent 2 $8,082 6 $36,549
Finance 17 $86,388 34 $155,128
Human Resources 6 $21,124 13 $40,442
Legal Services 1 $1,454 2 $3,353
Operations 62 $92,089 152 $317,059
School, Alternative 2 $2,778 19 $30,417
Schools, Elementary 89 $252,027 254 $735,805
Schools, Middle 38 $67,980 61 $231,987
Schools, High School 19 $27,892 95 $387,412
Superintendent’s Office 2 $17,790 2 $4,609
Grand Total (with benefits) 267 $850,592 713 $2,531,053
Note: Estimates are based on May, 2015 employee data and will vary over time.

20
74924%
65320%
71022%
48315%
59019%
Teachers by Years of Experience
0 - 5 Years 6 - 10 Years 11 - 15 Years
16 - 20 Years 21+ Years
81826%
1,45446%
70422%
2096%
Teachers by Degree Level
Bachelors Masters Specialist Doctorate
Appendix E: Teachers by Years of Experience and Degree Level