Embed Size (px)
Citation preview
DEPARTMENT of HEALTH
and HUMAN SERVICES
Fiscal Year 2014
Justification of
Estimates for Appropriations Committees
Office of Inspector General

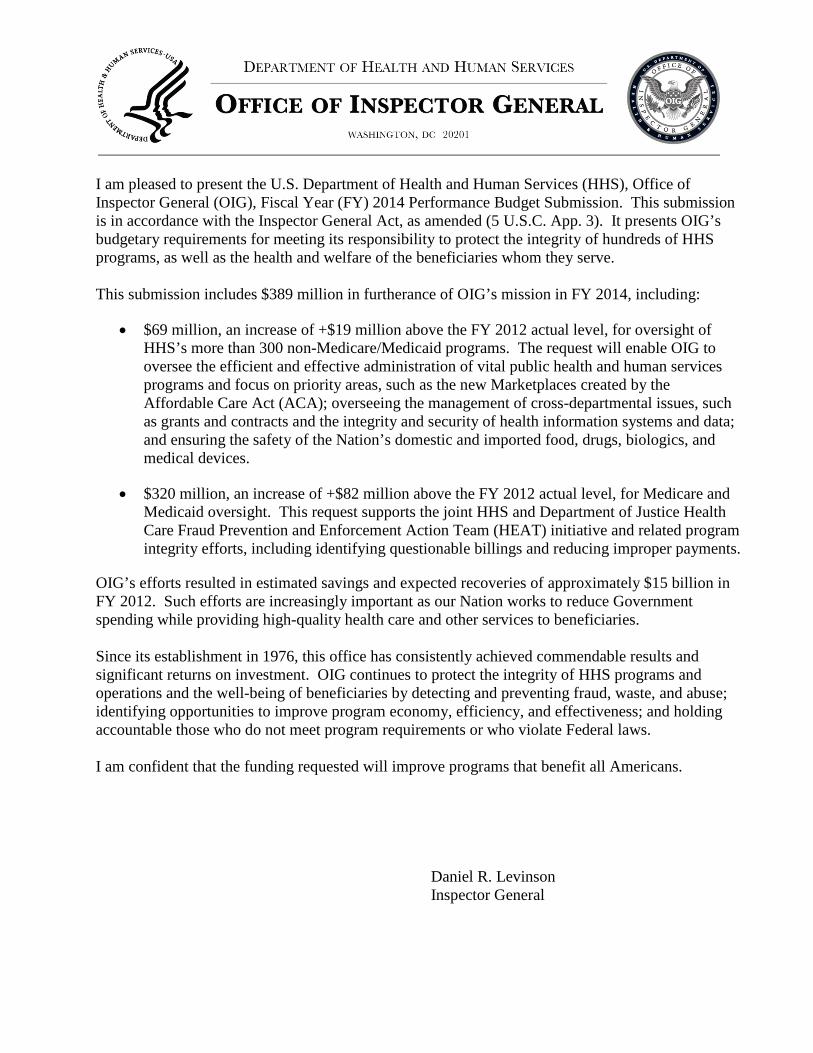
I am pleased to present the U.S. Department of Health and Human Services (HHS), Office of Inspector General (OIG), Fiscal Year (FY) 2014 Performance Budget Submission. This submission is in accordance with the Inspector General Act, as amended (5 U.S.C. App. 3). It presents OIG’s budgetary requirements for meeting its responsibility to protect the integrity of hundreds of HHS programs, as well as the health and welfare of the beneficiaries whom they serve. This submission includes $389 million in furtherance of OIG’s mission in FY 2014, including:
• $69 million, an increase of +$19 million above the FY 2012 actual level, for oversight of HHS’s more than 300 non-Medicare/Medicaid programs. The request will enable OIG to oversee the efficient and effective administration of vital public health and human services programs and focus on priority areas, such as the new Marketplaces created by the Affordable Care Act (ACA); overseeing the management of cross-departmental issues, such as grants and contracts and the integrity and security of health information systems and data; and ensuring the safety of the Nation’s domestic and imported food, drugs, biologics, and medical devices.
• $320 million, an increase of +$82 million above the FY 2012 actual level, for Medicare and Medicaid oversight. This request supports the joint HHS and Department of Justice Health Care Fraud Prevention and Enforcement Action Team (HEAT) initiative and related program integrity efforts, including identifying questionable billings and reducing improper payments.
OIG’s efforts resulted in estimated savings and expected recoveries of approximately $15 billion in FY 2012. Such efforts are increasingly important as our Nation works to reduce Government spending while providing high-quality health care and other services to beneficiaries. Since its establishment in 1976, this office has consistently achieved commendable results and significant returns on investment. OIG continues to protect the integrity of HHS programs and operations and the well-being of beneficiaries by detecting and preventing fraud, waste, and abuse; identifying opportunities to improve program economy, efficiency, and effectiveness; and holding accountable those who do not meet program requirements or who violate Federal laws. I am confident that the funding requested will improve programs that benefit all Americans.
Daniel R. Levinson Inspector General

PAGE INTENTIONALLY LEFT BLANK
i
The FY 2014 Justification of Estimates for Appropriations Committees U.S. Department of Health and Human Services
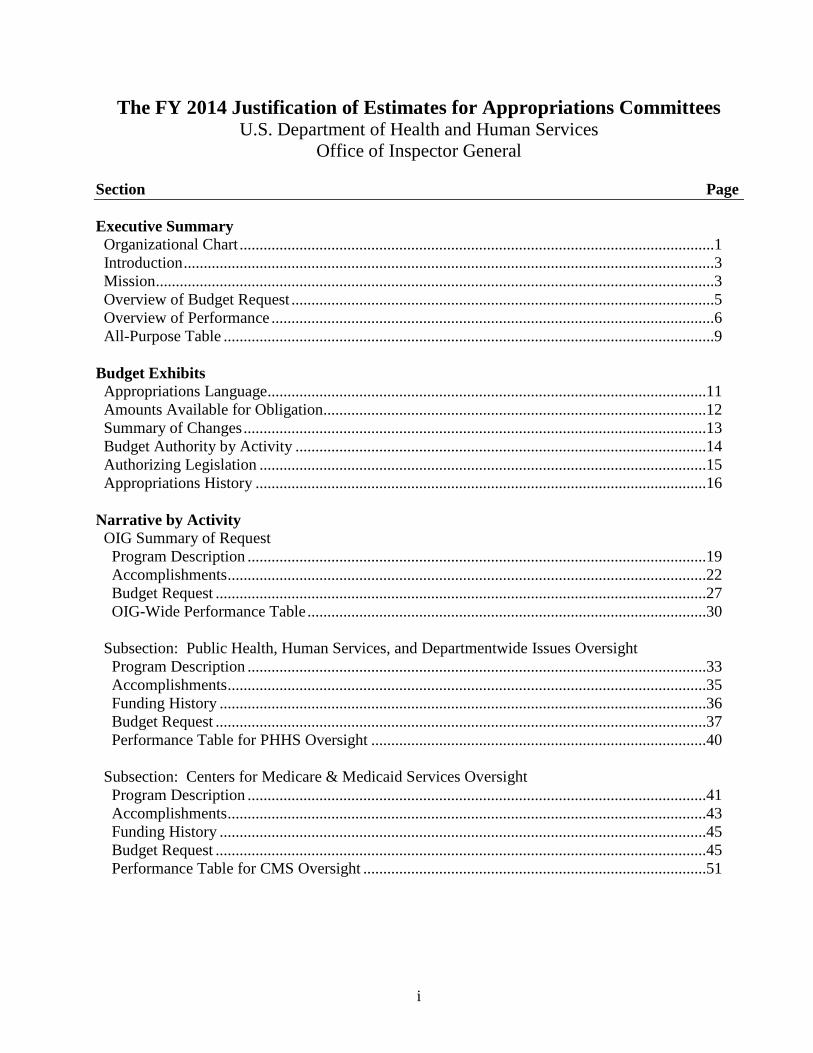
Office of Inspector General Section Page Executive Summary Organizational Chart .......................................................................................................................1 Introduction .....................................................................................................................................3 Mission ............................................................................................................................................3 Overview of Budget Request ..........................................................................................................5 Overview of Performance ...............................................................................................................6 All-Purpose Table ...........................................................................................................................9 Budget Exhibits Appropriations Language ..............................................................................................................11 Amounts Available for Obligation................................................................................................12 Summary of Changes ....................................................................................................................13 Budget Authority by Activity .......................................................................................................14 Authorizing Legislation ................................................................................................................15 Appropriations History .................................................................................................................16 Narrative by Activity OIG Summary of Request Program Description ...................................................................................................................19 Accomplishments ........................................................................................................................22 Budget Request ...........................................................................................................................27 OIG-Wide Performance Table ....................................................................................................30 Subsection: Public Health, Human Services, and Departmentwide Issues Oversight Program Description ...................................................................................................................33 Accomplishments ........................................................................................................................35 Funding History ..........................................................................................................................36 Budget Request ...........................................................................................................................37 Performance Table for PHHS Oversight ....................................................................................40 Subsection: Centers for Medicare & Medicaid Services Oversight Program Description ...................................................................................................................41 Accomplishments ........................................................................................................................43 Funding History ..........................................................................................................................45 Budget Request ...........................................................................................................................45 Performance Table for CMS Oversight ......................................................................................51
ii
The FY 2014 Justification of Estimates for Appropriations Committees U.S. Department of Health and Human Services
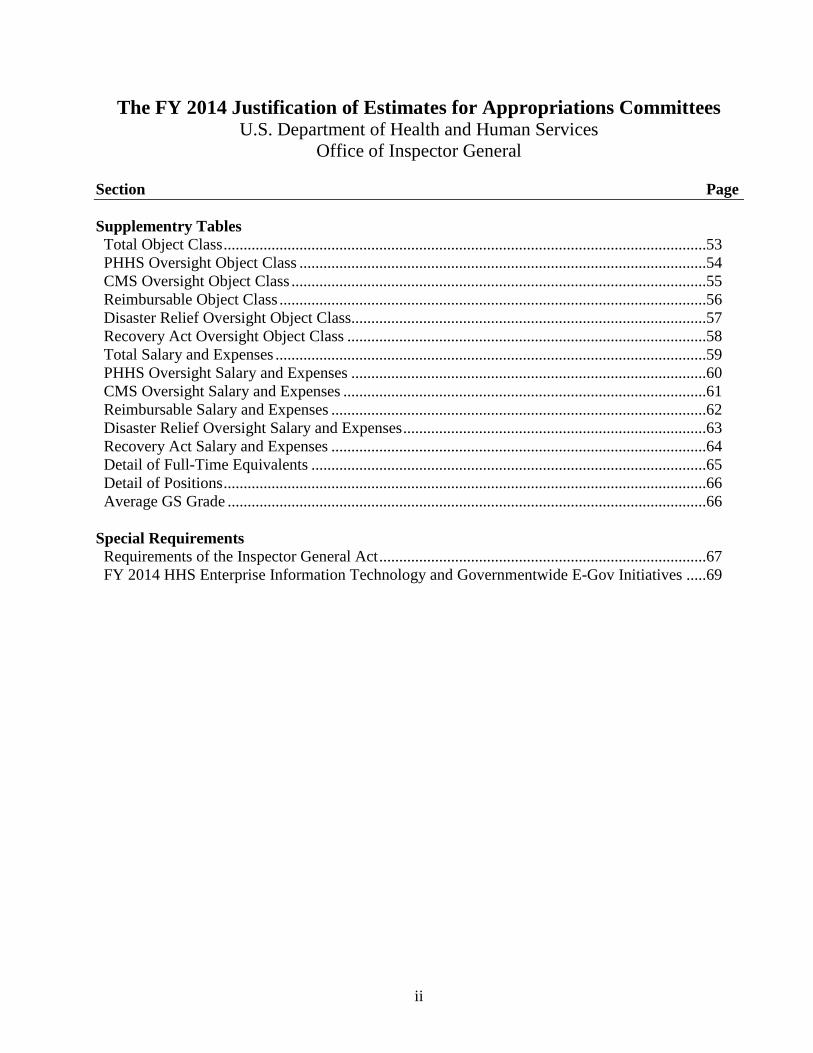
Office of Inspector General Section Page Supplementry Tables Total Object Class .........................................................................................................................53 PHHS Oversight Object Class ......................................................................................................54 CMS Oversight Object Class ........................................................................................................55 Reimbursable Object Class ...........................................................................................................56 Disaster Relief Oversight Object Class.........................................................................................57 Recovery Act Oversight Object Class ..........................................................................................58 Total Salary and Expenses ............................................................................................................59 PHHS Oversight Salary and Expenses .........................................................................................60 CMS Oversight Salary and Expenses ...........................................................................................61 Reimbursable Salary and Expenses ..............................................................................................62 Disaster Relief Oversight Salary and Expenses ............................................................................63 Recovery Act Salary and Expenses ..............................................................................................64 Detail of Full-Time Equivalents ...................................................................................................65 Detail of Positions .........................................................................................................................66 Average GS Grade ........................................................................................................................66 Special Requirements Requirements of the Inspector General Act ..................................................................................67 FY 2014 HHS Enterprise Information Technology and Governmentwide E-Gov Initiatives .....69
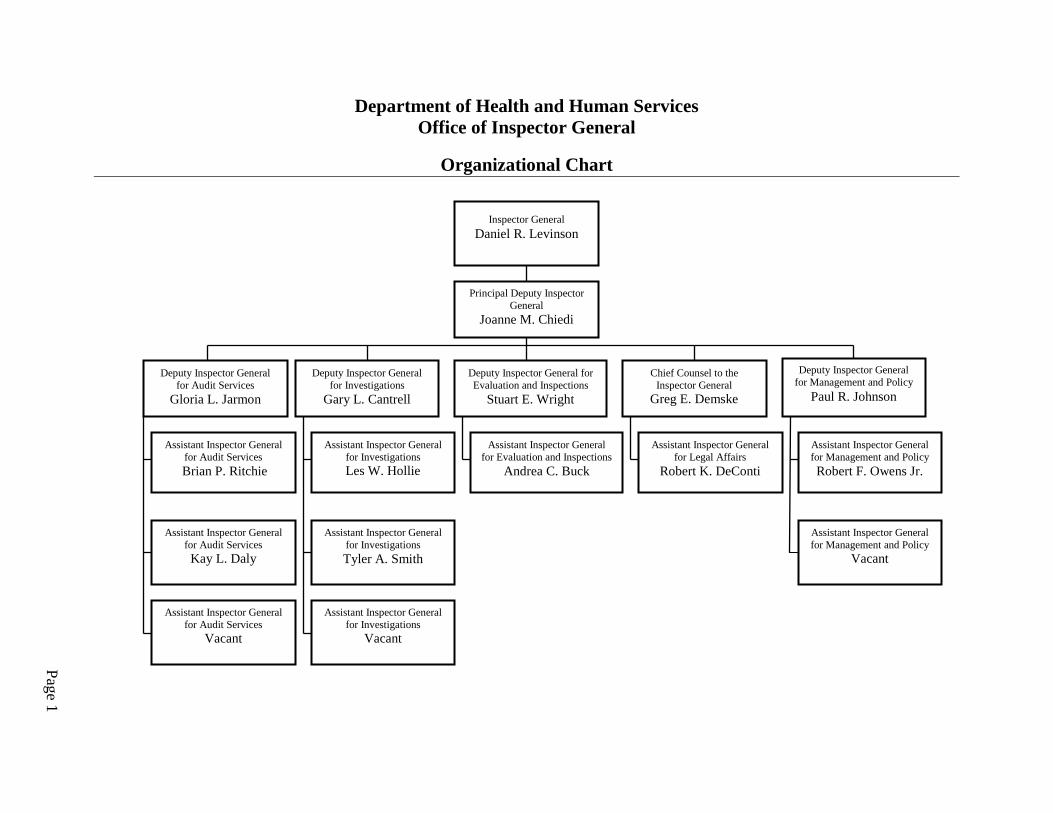
Department of Health and Human Services Office of Inspector General
Organizational Chart
Page 1
Assistant Inspector General for Legal Affairs
Robert K. DeConti
Inspector General Daniel R. Levinson
Deputy Inspector General for Audit Services
Gloria L. Jarmon
Deputy Inspector General for Investigations
Gary L. Cantrell
Deputy Inspector General for Evaluation and Inspections
Stuart E. Wright
Chief Counsel to the Inspector General
Greg E. Demske
Assistant Inspector General for Audit Services
Brian P. Ritchie
Assistant Inspector General for Audit Services Kay L. Daly
Assistant Inspector General for Audit Services
Vacant
Assistant Inspector General for Management and Policy
Vacant
Principal Deputy Inspector General
Joanne M. Chiedi
Assistant Inspector General for Investigations Les W. Hollie
Assistant Inspector General for Investigations Tyler A. Smith
Assistant Inspector General for Evaluation and Inspections
Andrea C. Buck
Assistant Inspector General for Management and Policy Robert F. Owens Jr.
Deputy Inspector General for Management and Policy
Paul R. Johnson
Assistant Inspector General for Investigations
Vacant
Executive Summary Department of Health and Human Services Office of Inspector General
Page 2
PAGE INTENTIONALLY LEFT BLANK
Executive Summary Department of Health and Human Services Office of Inspector General
Page 3
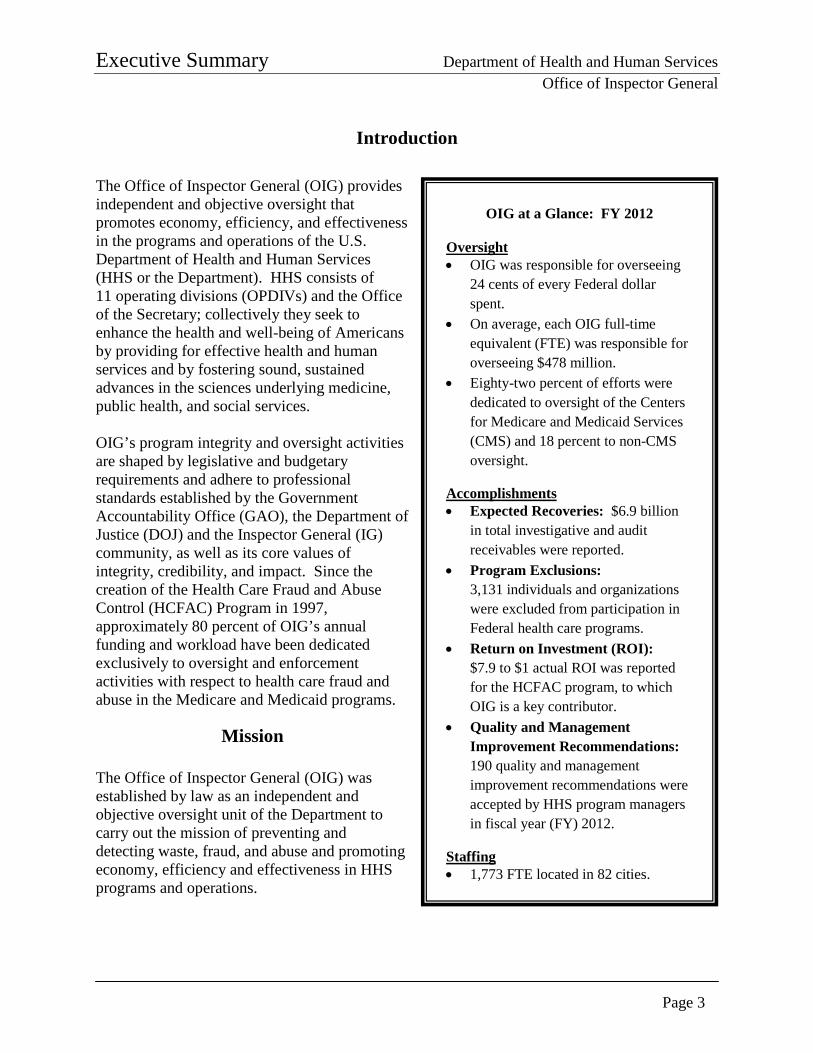
Introduction The Office of Inspector General (OIG) provides independent and objective oversight that promotes economy, efficiency, and effectiveness in the programs and operations of the U.S. Department of Health and Human Services (HHS or the Department). HHS consists of 11 operating divisions (OPDIVs) and the Office of the Secretary; collectively they seek to enhance the health and well-being of Americans by providing for effective health and human services and by fostering sound, sustained advances in the sciences underlying medicine, public health, and social services. OIG’s program integrity and oversight activities are shaped by legislative and budgetary requirements and adhere to professional standards established by the Government Accountability Office (GAO), the Department of Justice (DOJ) and the Inspector General (IG) community, as well as its core values of integrity, credibility, and impact. Since the creation of the Health Care Fraud and Abuse Control (HCFAC) Program in 1997, approximately 80 percent of OIG’s annual funding and workload have been dedicated exclusively to oversight and enforcement activities with respect to health care fraud and abuse in the Medicare and Medicaid programs.
Mission The Office of Inspector General (OIG) was established by law as an independent and objective oversight unit of the Department to carry out the mission of preventing and detecting waste, fraud, and abuse and promoting economy, efficiency and effectiveness in HHS programs and operations.
OIG at a Glance: FY 2012
Oversight • OIG was responsible for overseeing
24 cents of every Federal dollar spent.
• On average, each OIG full-time equivalent (FTE) was responsible for overseeing $478 million.
• Eighty-two percent of efforts were dedicated to oversight of the Centers for Medicare and Medicaid Services (CMS) and 18 percent to non-CMS oversight.
Accomplishments • Expected Recoveries: $6.9 billion
in total investigative and audit receivables were reported.
• Program Exclusions: 3,131 individuals and organizations were excluded from participation in Federal health care programs.
• Return on Investment (ROI): $7.9 to $1 actual ROI was reported for the HCFAC program, to which OIG is a key contributor.
• Quality and Management Improvement Recommendations: 190 quality and management improvement recommendations were accepted by HHS program managers in fiscal year (FY) 2012.
Staffing • 1,773 FTE located in 82 cities.

Executive Summary Department of Health and Human Services Office of Inspector General
Page 4
PAGE INTENTIONALLY LEFT BLANK
Executive Summary Department of Health and Human Services Office of Inspector General
Page 5
Overview of Budget Request
OIG’s FY 2014 budget submission includes $388,699,000 and 2,030 FTE, an increase of +$100,852,000, which will support an additional +257 FTE above the FY 2012 actual level. Program increases include:
• Public Health, Human Services, and Departmentwide (PHHS) Oversight (+$19 million): Ensuring the efficient and effective administration of vital public health and human services programs and focusing on key priority areas, including monitoring the implementation and operation of the new Marketplaces and other ACA programs; overseeing the management of cross-Departmental issues, such as grants and contracts, and IT security; and ensuring the safety the Nation’s domestic and imported food, drugs, biologics and medical devices.
• CMS Oversight (+$82 million): Supporting the expansion of the Administration’s multiagency initiative to focus on preventing health care fraud and enforcing current antifraud laws around the country through the Health Care Fraud Prevention and Enforcement Action Team (HEAT) initiative; continuing oversight of activities that were previously funded through mandatory appropriations (such as the Deficit Reduction Act) and have expired; and continuing a range of program integrity efforts, including identifying questionable billings and reducing improper payments. While OIG’s HCFAC funding is formally requested through the budget for CMS, information on OIG-specific activities can be found in this document.
Efforts in FY 2014 will continue to be guided by OIG’s dynamic and ongoing work planning process. Many areas of potential focus are reflected in OIG’s assessment of the top management and performance challenges facing HHS, the most recent of which are found here: https://oig.hhs.gov/reports-and-publications/top-challenges/2012/.
Executive Summary Department of Health and Human Services Office of Inspector General
Page 6
Overview of Performance OIG ensures an efficient and effective use of resources through integrated planning, monitoring, and reporting processes that together help set organizational priorities; measure and analyze the impact of our work; and, when necessary, inform strategic and operational change. OIG’s program integrity activities support the HHS Strategic Plan’s Goal 4, to increase efficiency, transparency and accountability of HHS programs.
Planning: OIG plans its work and allocates its resources using a number of factors. These include the purpose limitations in the agency’s various funding sources, authorizing statutes and mandates, stakeholder input, and risk assessments of HHS programs. OIG conducts an annual work-planning process, which results in a published Work Plan. As part of this process, OIG engages stakeholders to identify the issues with the greatest potential impact on HHS programs and beneficiaries. Throughout the year, OIG responds to emerging issues and makes adjustments. Priorities identified in the work-planning process often address issues outlined in the HHS Top Management and Performance Challenges.
Monitoring: OIG monitors its efforts through qualitative and quantitative metrics, capturing both outputs and outcomes, which are integrated into executive performance plans of OIG’s senior leadership.
Reporting: OIG also produces, and is a significant contributor to, several annual or semiannual reports that communicate the impact of our programs to Congress and the public. These reports include the OIG Semiannual Report to Congress, the HCFAC Annual Report, and the Compendium of Unimplemented OIG Recommendations.
Significant Accomplishments As reported in OIG’s Fall 2012 Semiannual Report to Congress, OIG had reported savings and expected recoveries of approximately $15.4 billion for FY 2012. This includes $8.5 billion from legislative and other cost-saving actions that were supported by recommendations in audits and evaluations, $6 billion in investigative receivables (which includes $1.7 billion in non-HHS investigative receivables resulting from OIG’s work in areas such as States’ share of Medicaid restitution), and $0.9 billion in audit receivables. Additionally, in FY 2012, OIG excluded 3,131 individuals and organizations from participation in Federal health care programs. OIG reported 778 criminal actions against individuals or organizations that engaged in crimes against HHS programs and 367 civil and administrative enforcement actions, including False Claims Act and unjust enrichment suits filed in Federal district court, civil monetary penalties (CMP) law settlements, and administrative recoveries related to provider self-disclosure matters. OIG work also prevents fraud and abuse through industry outreach and guidance and recommendations to remedy program vulnerabilities.

Executive Summary Department of Health and Human Services Office of Inspector General
Page 7
For a more complete discussion of OIG’s outcome and output measures and recent performance results, refer to the sections of this document describing OIG’s PHHS (beginning on page 33) and CMS (beginning on page 41) oversight work.

Executive Summary Department of Health and Human Services Office of Inspector General
Page 8
PAGE INTENTIONALLY LEFT BLANK
Executive Summary Department of Health and Human Services Office of Inspector General
Page 9
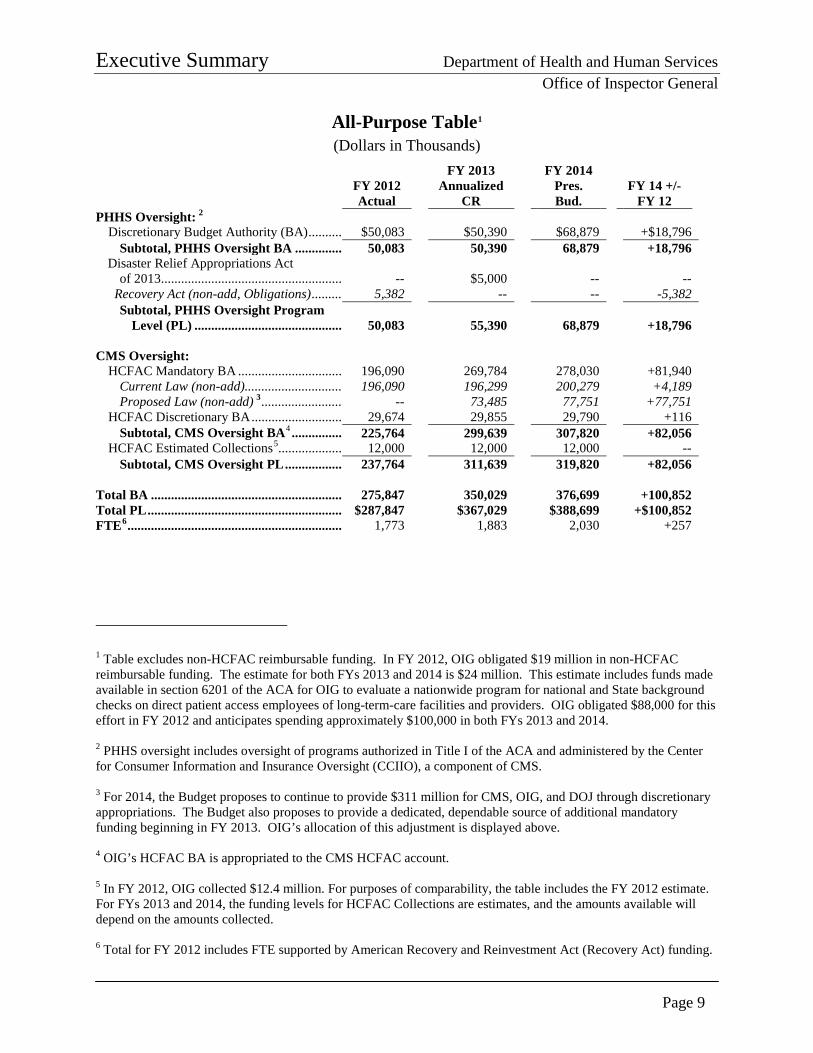
All-Purpose Table1 (Dollars in Thousands)
FY 2012 Actual
FY 2013 Annualized
CR
FY 2014 Pres. Bud.
FY 14 +/- FY 12
PHHS Oversight: 2 Discretionary Budget Authority (BA) .......... $50,083 $50,390 $68,879 +$18,796
Subtotal, PHHS Oversight BA .............. 50,083 50,390 68,879 +18,796 Disaster Relief Appropriations Act
of 2013 ...................................................... -- $5,000 -- -- Recovery Act (non-add, Obligations) .......... 5,382 -- -- -5,382
Subtotal, PHHS Oversight Program Level (PL) ............................................ 50,083 55,390 68,879 +18,796
CMS Oversight:
HCFAC Mandatory BA ............................... 196,090 269,784 278,030 +81,940 Current Law (non-add) .............................. 196,090 196,299 200,279 +4,189 Proposed Law (non-add) 3 ......................... -- 73,485 77,751 +77,751
HCFAC Discretionary BA ........................... 29,674 29,855 29,790 +116 Subtotal, CMS Oversight BA4 ............... 225,764 299,639 307,820 +82,056
HCFAC Estimated Collections5 ................... 12,000 12,000 12,000 -- Subtotal, CMS Oversight PL ................. 237,764 311,639 319,820 +82,056
Total BA ......................................................... 275,847 350,029 376,699 +100,852 Total PL .......................................................... $287,847 $367,029 $388,699 +$100,852 FTE6 ................................................................ 1,773 1,883 2,030 +257
1 Table excludes non-HCFAC reimbursable funding. In FY 2012, OIG obligated $19 million in non-HCFAC reimbursable funding. The estimate for both FYs 2013 and 2014 is $24 million. This estimate includes funds made available in section 6201 of the ACA for OIG to evaluate a nationwide program for national and State background checks on direct patient access employees of long-term-care facilities and providers. OIG obligated $88,000 for this effort in FY 2012 and anticipates spending approximately $100,000 in both FYs 2013 and 2014. 2 PHHS oversight includes oversight of programs authorized in Title I of the ACA and administered by the Center for Consumer Information and Insurance Oversight (CCIIO), a component of CMS. 3 For 2014, the Budget proposes to continue to provide $311 million for CMS, OIG, and DOJ through discretionary appropriations. The Budget also proposes to provide a dedicated, dependable source of additional mandatory funding beginning in FY 2013. OIG’s allocation of this adjustment is displayed above. 4 OIG’s HCFAC BA is appropriated to the CMS HCFAC account. 5 In FY 2012, OIG collected $12.4 million. For purposes of comparability, the table includes the FY 2012 estimate. For FYs 2013 and 2014, the funding levels for HCFAC Collections are estimates, and the amounts available will depend on the amounts collected. 6 Total for FY 2012 includes FTE supported by American Recovery and Reinvestment Act (Recovery Act) funding.
Executive Summary Department of Health and Human Services Office of Inspector General
Page 10
PAGE INTENTIONALLY LEFT BLANK
Budget Exhibits Department of Health and Human Services Office of Inspector General
Page 11
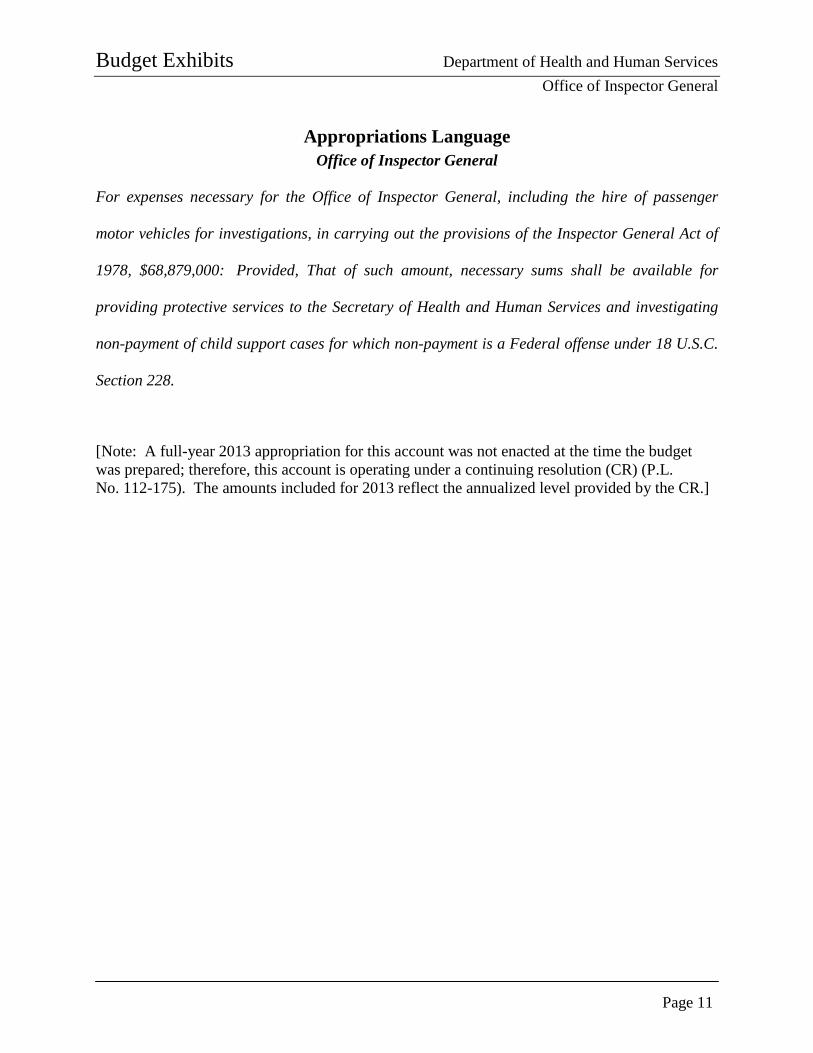
Appropriations Language Office of Inspector General
For expenses necessary for the Office of Inspector General, including the hire of passenger
motor vehicles for investigations, in carrying out the provisions of the Inspector General Act of
1978, $68,879,000: Provided, That of such amount, necessary sums shall be available for
providing protective services to the Secretary of Health and Human Services and investigating
non-payment of child support cases for which non-payment is a Federal offense under 18 U.S.C.
Section 228.
[Note: A full-year 2013 appropriation for this account was not enacted at the time the budget was prepared; therefore, this account is operating under a continuing resolution (CR) (P.L. No. 112-175). The amounts included for 2013 reflect the annualized level provided by the CR.]
Budget Exhibits Department of Health and Human Services Office of Inspector General
Page 12
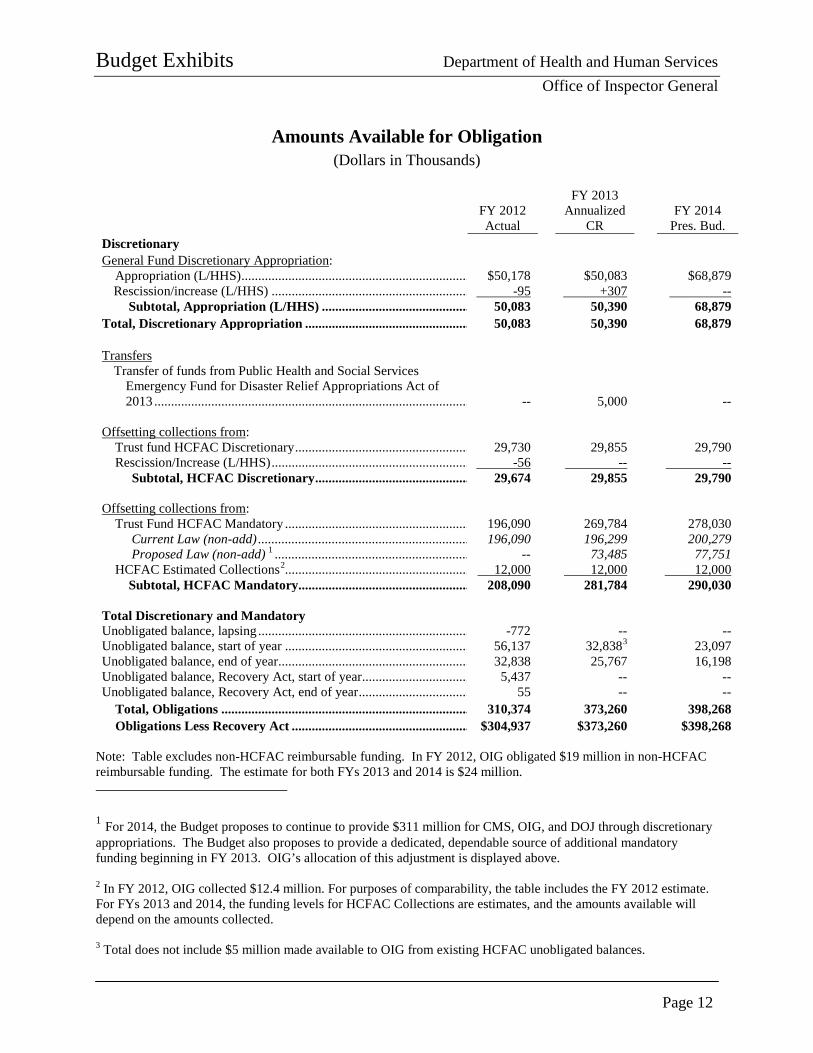
Amounts Available for Obligation (Dollars in Thousands)
FY 2012 Actual
FY 2013 Annualized
CR
FY 2014
Pres. Bud. Discretionary General Fund Discretionary Appropriation:
Appropriation (L/HHS) .................................................................... $50,178 $50,083 $68,879 Rescission/increase (L/HHS) ........................................................... -95 +307 --
Subtotal, Appropriation (L/HHS) ............................................ 50,083 50,390 68,879 Total, Discretionary Appropriation ................................................. 50,083 50,390 68,879
Transfers
Transfer of funds from Public Health and Social Services Emergency Fund for Disaster Relief Appropriations Act of 2013 .............................................................................................. -- 5,000 --
Offsetting collections from:
Trust fund HCFAC Discretionary .................................................... 29,730 29,855 29,790 Rescission/Increase (L/HHS) ........................................................... -56 -- --
Subtotal, HCFAC Discretionary .............................................. 29,674 29,855 29,790
Offsetting collections from: Trust Fund HCFAC Mandatory ....................................................... 196,090 269,784 278,030
Current Law (non-add) ............................................................... 196,090 196,299 200,279 Proposed Law (non-add) 1 .......................................................... -- 73,485 77,751
HCFAC Estimated Collections2....................................................... 12,000 12,000 12,000 Subtotal, HCFAC Mandatory................................................... 208,090 281,784 290,030
Total Discretionary and Mandatory Unobligated balance, lapsing ............................................................... -772 -- -- Unobligated balance, start of year ....................................................... 56,137 32,8383 23,097 Unobligated balance, end of year ......................................................... 32,838 25,767 16,198 Unobligated balance, Recovery Act, start of year ................................ 5,437 -- -- Unobligated balance, Recovery Act, end of year ................................. 55 -- --
Total, Obligations .......................................................................... 310,374 373,260 398,268 Obligations Less Recovery Act ..................................................... $304,937 $373,260 $398,268
Note: Table excludes non-HCFAC reimbursable funding. In FY 2012, OIG obligated $19 million in non-HCFAC reimbursable funding. The estimate for both FYs 2013 and 2014 is $24 million. 1 For 2014, the Budget proposes to continue to provide $311 million for CMS, OIG, and DOJ through discretionary appropriations. The Budget also proposes to provide a dedicated, dependable source of additional mandatory funding beginning in FY 2013. OIG’s allocation of this adjustment is displayed above. 2 In FY 2012, OIG collected $12.4 million. For purposes of comparability, the table includes the FY 2012 estimate. For FYs 2013 and 2014, the funding levels for HCFAC Collections are estimates, and the amounts available will depend on the amounts collected. 3 Total does not include $5 million made available to OIG from existing HCFAC unobligated balances.
Budget Exhibits Department of Health and Human Services Office of Inspector General
Page 13
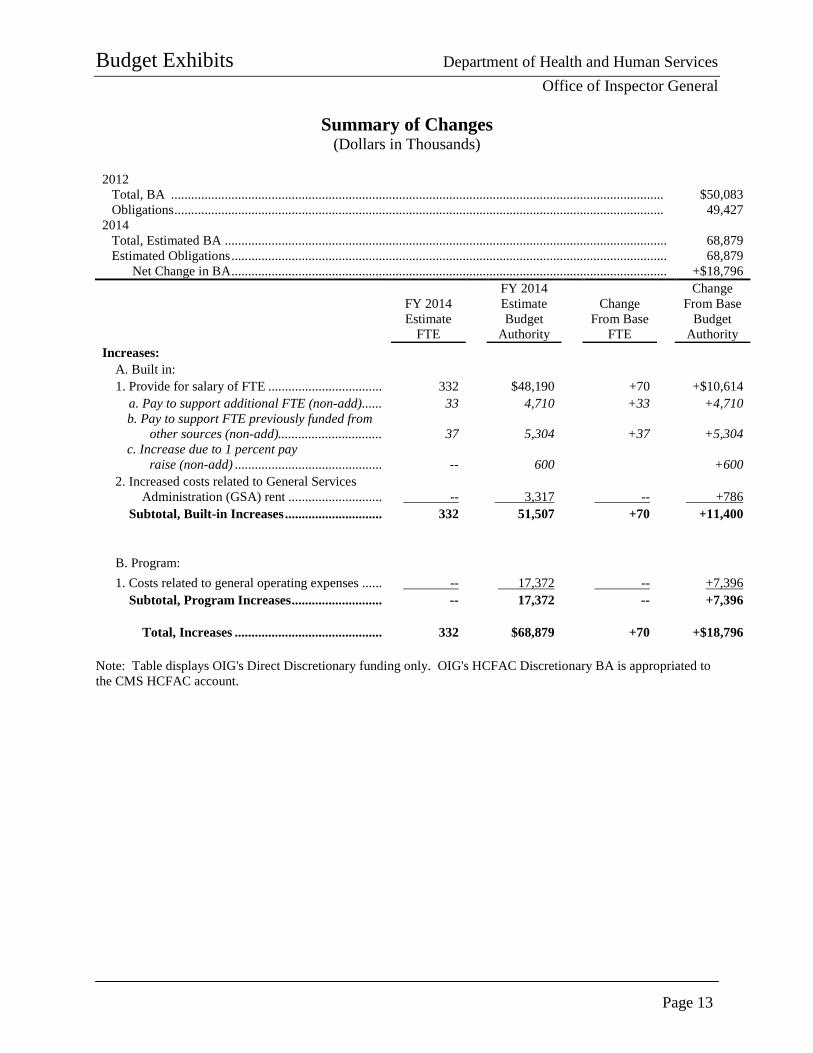
Summary of Changes (Dollars in Thousands)
2012
Total, BA ................................................................................................................................................... $50,083 Obligations .................................................................................................................................................. 49,427
2014 Total, Estimated BA .................................................................................................................................... 68,879 Estimated Obligations .................................................................................................................................. 68,879
Net Change in BA .................................................................................................................................. +$18,796
FY 2014 Estimate
FTE
FY 2014 Estimate Budget
Authority
Change From Base
FTE
Change From Base
Budget Authority
Increases: A. Built in:
1. Provide for salary of FTE .................................. 332 $48,190 +70 +$10,614 a. Pay to support additional FTE (non-add) ...... 33 4,710 +33 +4,710 b. Pay to support FTE previously funded from
other sources (non-add)............................... 37 5,304 +37 +5,304 c. Increase due to 1 percent pay
raise (non-add) ............................................ -- 600 +600 2. Increased costs related to General Services
Administration (GSA) rent ............................ -- 3,317 -- +786 Subtotal, Built-in Increases ............................. 332 51,507 +70 +11,400
B. Program: 1. Costs related to general operating expenses ...... -- 17,372 -- +7,396
Subtotal, Program Increases ........................... -- 17,372 -- +7,396
Total, Increases ............................................ 332 $68,879 +70 +$18,796 Note: Table displays OIG's Direct Discretionary funding only. OIG's HCFAC Discretionary BA is appropriated to the CMS HCFAC account.
Budget Exhibits Department of Health and Human Services Office of Inspector General
Page 14
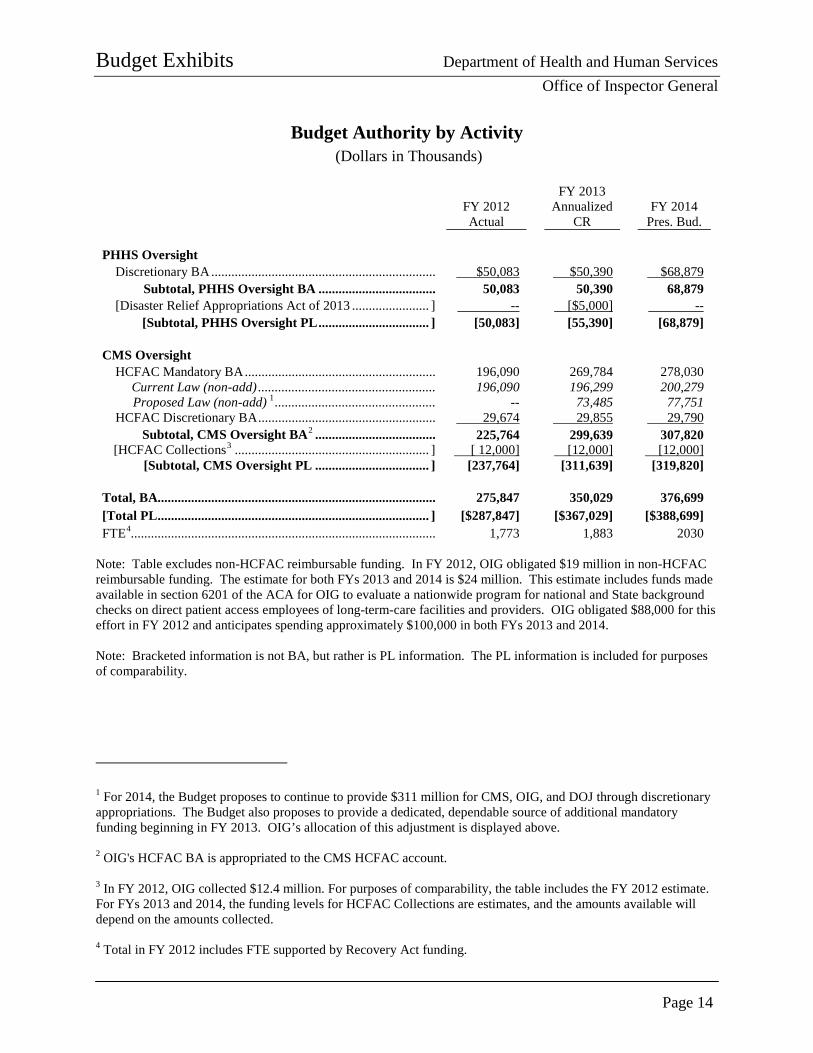
Budget Authority by Activity (Dollars in Thousands)
FY 2012 Actual
FY 2013 Annualized
CR
FY 2014 Pres. Bud.
PHHS Oversight
Discretionary BA ................................................................... $50,083 $50,390 $68,879 Subtotal, PHHS Oversight BA ................................... 50,083 50,390 68,879
[Disaster Relief Appropriations Act of 2013 ....................... ] -- [$5,000] -- [Subtotal, PHHS Oversight PL ................................. ] [50,083] [55,390] [68,879]
CMS Oversight
HCFAC Mandatory BA ......................................................... 196,090 269,784 278,030 Current Law (non-add) ..................................................... 196,090 196,299 200,279 Proposed Law (non-add) 1 ................................................ -- 73,485 77,751
HCFAC Discretionary BA ..................................................... 29,674 29,855 29,790 Subtotal, CMS Oversight BA2 .................................... 225,764 299,639 307,820
[HCFAC Collections3 .......................................................... ] [ 12,000] [12,000] [12,000] [Subtotal, CMS Oversight PL .................................. ] [237,764] [311,639] [319,820]
Total, BA................................................................................... 275,847 350,029 376,699 [Total PL ................................................................................. ] [$287,847] [$367,029] [$388,699] FTE4........................................................................................... 1,773 1,883 2030
Note: Table excludes non-HCFAC reimbursable funding. In FY 2012, OIG obligated $19 million in non-HCFAC reimbursable funding. The estimate for both FYs 2013 and 2014 is $24 million. This estimate includes funds made available in section 6201 of the ACA for OIG to evaluate a nationwide program for national and State background checks on direct patient access employees of long-term-care facilities and providers. OIG obligated $88,000 for this effort in FY 2012 and anticipates spending approximately $100,000 in both FYs 2013 and 2014. Note: Bracketed information is not BA, but rather is PL information. The PL information is included for purposes of comparability.
1 For 2014, the Budget proposes to continue to provide $311 million for CMS, OIG, and DOJ through discretionary appropriations. The Budget also proposes to provide a dedicated, dependable source of additional mandatory funding beginning in FY 2013. OIG’s allocation of this adjustment is displayed above. 2 OIG's HCFAC BA is appropriated to the CMS HCFAC account. 3 In FY 2012, OIG collected $12.4 million. For purposes of comparability, the table includes the FY 2012 estimate. For FYs 2013 and 2014, the funding levels for HCFAC Collections are estimates, and the amounts available will depend on the amounts collected. 4 Total in FY 2012 includes FTE supported by Recovery Act funding.
Budget Exhibits Department of Health and Human Services Office of Inspector General
Page 15
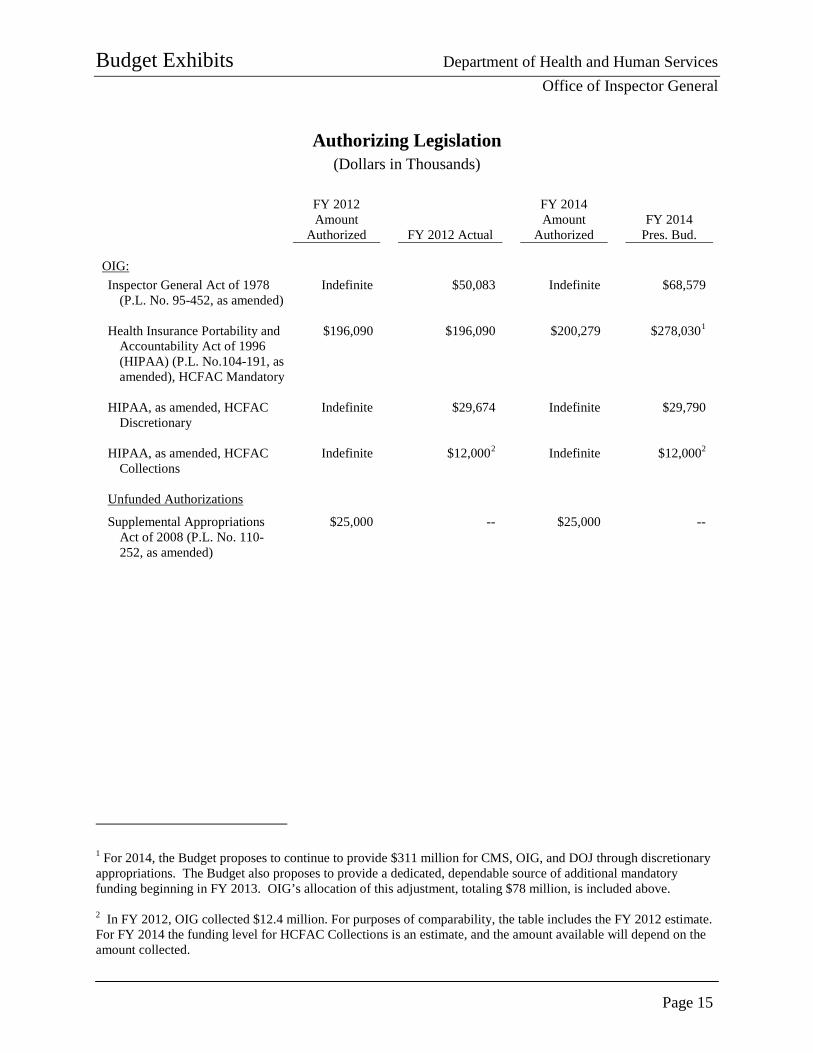
Authorizing Legislation (Dollars in Thousands)
FY 2012
Amount Authorized FY 2012 Actual
FY 2014 Amount
Authorized FY 2014
Pres. Bud. OIG: Inspector General Act of 1978
(P.L. No. 95-452, as amended) Indefinite $50,083 Indefinite $68,579
Health Insurance Portability and
Accountability Act of 1996 (HIPAA) (P.L. No.104-191, as amended), HCFAC Mandatory
$196,090 $196,090 $200,279 $278,0301
HIPAA, as amended, HCFAC
Discretionary Indefinite $29,674 Indefinite $29,790
HIPAA, as amended, HCFAC
Collections Indefinite $12,0002 Indefinite $12,0002
Unfunded Authorizations
Supplemental Appropriations Act of 2008 (P.L. No. 110-252, as amended)
$25,000 -- $25,000 --
1 For 2014, the Budget proposes to continue to provide $311 million for CMS, OIG, and DOJ through discretionary appropriations. The Budget also proposes to provide a dedicated, dependable source of additional mandatory funding beginning in FY 2013. OIG’s allocation of this adjustment, totaling $78 million, is included above. 2 In FY 2012, OIG collected $12.4 million. For purposes of comparability, the table includes the FY 2012 estimate. For FY 2014 the funding level for HCFAC Collections is an estimate, and the amount available will depend on the amount collected.

Budget Exhibits Department of Health and Human Services Office of Inspector General
Page 16
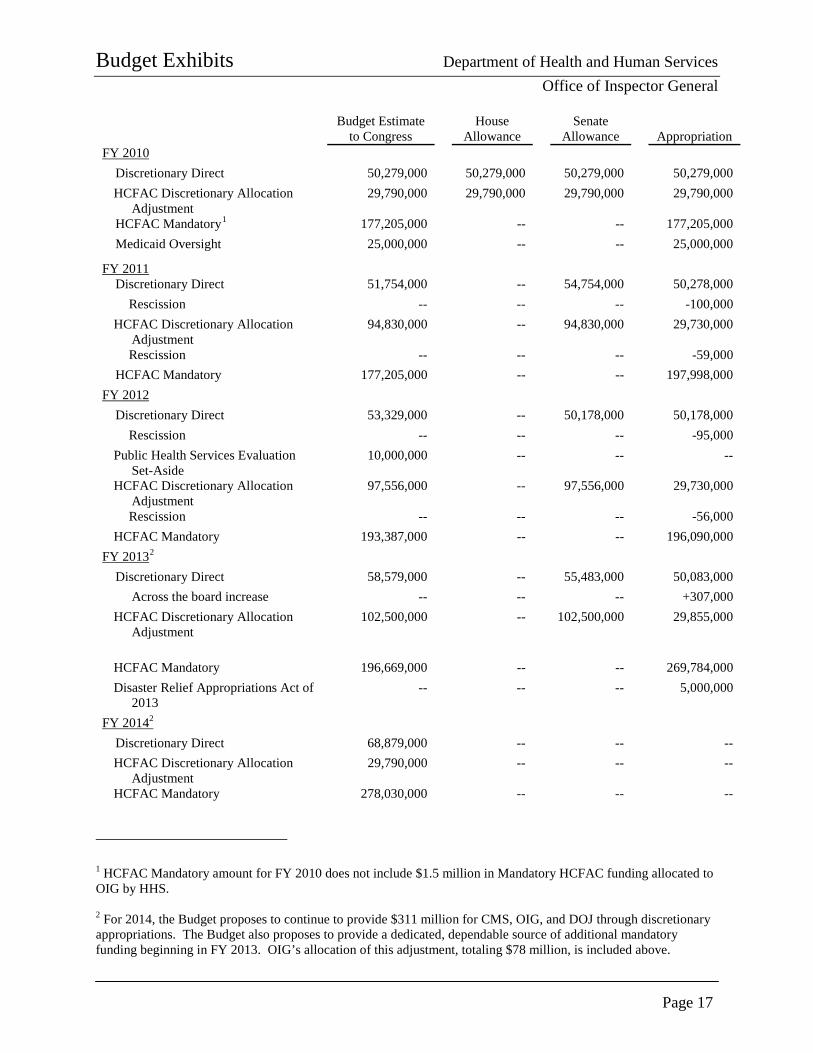
Appropriations History
Budget Estimate to Congress
House Allowance
Senate Allowance Appropriation
FY 2005 Discretionary Direct $40,323,000 $40,323,000 $40,323,000 $39,930,000
Rescission -- -- -- -393,000 HCFAC Mandatory 160,000,000 160,000,000 160,000,000 160,000,000
FY 2006 Discretionary Direct 39,813,000 39,813,000 39,813,000 39,813,000
Rescission -- -- -- -398,000 HCFAC Mandatory 160,000,000 160,000,000 160,000,000 160,000,000 Medicaid Oversight1 25,000,000 -- -- 25,000,000
FY 2007 Discretionary Direct 43,760,000 41,415,000 43,760,000 39,808,000 HCFAC Discretionary Allocation
Adjustment 11,336,000 -- -- --
HCFAC Mandatory 160,000,000 160,000,000 160,000,000 165,920,000 Medicaid Oversight1 25,000,000 -- -- 25,000,000
Never Events2 -- -- -- 3,000,000 FY 2008
Discretionary Direct 44,687,000 44,687,000 45,687,000 44,000,000 Rescission -- -- -- -769,000
HCFAC Discretionary Allocation Adjustment
17,530,000 36,690,000 36,690,000 --
HCFAC Mandatory 169,238,000 -- -- 169,736,000 Medicaid Oversight1 25,000,000 -- -- 25,000,000
FY 2009 Discretionary Direct 46,058,000 44,500,000 46,058,000 45,279,000 HCFAC Discretionary Allocation
Adjustment 18,967,000 18,967,000 18,967,000 18,967,000
HCFAC Mandatory 174,998,000 -- -- 177,205,000 Medicaid Oversight1 25,000,000 -- -- 25,000,000 Medicaid Oversight3 (Supplemental) -- -- -- 25,000,000 Recovery Act: Medicaid Oversight -- -- -- 31,250,000 Recovery Act: General Oversight -- -- -- 17,000,000
1 Funds appropriated for Medicaid Oversight in the Deficit Reduction Act of 2005 (P.L. No. 109-171). 2 The Tax Relief and Health Care Act of 2006 (TRHCA) (P.L. No. 109-432) included $3 million for OIG to study Medicare “never events.” For TRHCA purposes, the term “never event” means “an event that is listed and endorsed as a serious reportable event by the National Quality Forum as of November 16, 2006.” (TRHCA, § 203(d)) 3 Funds appropriated for Medicaid Oversight in the Supplemental Appropriations Act of 2008 (P.L. No. 110-252).
Budget Exhibits Department of Health and Human Services Office of Inspector General
Page 17
Budget Estimate to Congress
House Allowance
Senate Allowance Appropriation
FY 2010 Discretionary Direct 50,279,000 50,279,000 50,279,000 50,279,000 HCFAC Discretionary Allocation
Adjustment 29,790,000 29,790,000 29,790,000 29,790,000
HCFAC Mandatory1 177,205,000 -- -- 177,205,000 Medicaid Oversight 25,000,000 -- -- 25,000,000
FY 2011 Discretionary Direct 51,754,000 -- 54,754,000 50,278,000
Rescission -- -- -- -100,000 HCFAC Discretionary Allocation
Adjustment 94,830,000 -- 94,830,000 29,730,000
Rescission -- -- -- -59,000 HCFAC Mandatory 177,205,000 -- -- 197,998,000
FY 2012 Discretionary Direct 53,329,000 -- 50,178,000 50,178,000
Rescission -- -- -- -95,000 Public Health Services Evaluation
Set-Aside 10,000,000 -- -- --
HCFAC Discretionary Allocation Adjustment
97,556,000 -- 97,556,000 29,730,000
Rescission -- -- -- -56,000 HCFAC Mandatory 193,387,000 -- -- 196,090,000
FY 20132 Discretionary Direct 58,579,000 -- 55,483,000 50,083,000
Across the board increase -- -- -- +307,000 HCFAC Discretionary Allocation
Adjustment 102,500,000 -- 102,500,000 29,855,000
HCFAC Mandatory 196,669,000 -- -- 269,784,000 Disaster Relief Appropriations Act of
2013 -- -- -- 5,000,000
FY 20142 Discretionary Direct 68,879,000 -- -- -- HCFAC Discretionary Allocation
Adjustment 29,790,000 -- -- --
HCFAC Mandatory 278,030,000 -- -- --
1 HCFAC Mandatory amount for FY 2010 does not include $1.5 million in Mandatory HCFAC funding allocated to OIG by HHS. 2 For 2014, the Budget proposes to continue to provide $311 million for CMS, OIG, and DOJ through discretionary appropriations. The Budget also proposes to provide a dedicated, dependable source of additional mandatory funding beginning in FY 2013. OIG’s allocation of this adjustment, totaling $78 million, is included above.
Budget Exhibits Department of Health and Human Services Office of Inspector General
Page 18
PAGE INTENTIONALLY LEFT BLANK
Narrative by Activity Department of Health and Human Services Office of Inspector General
Page 19
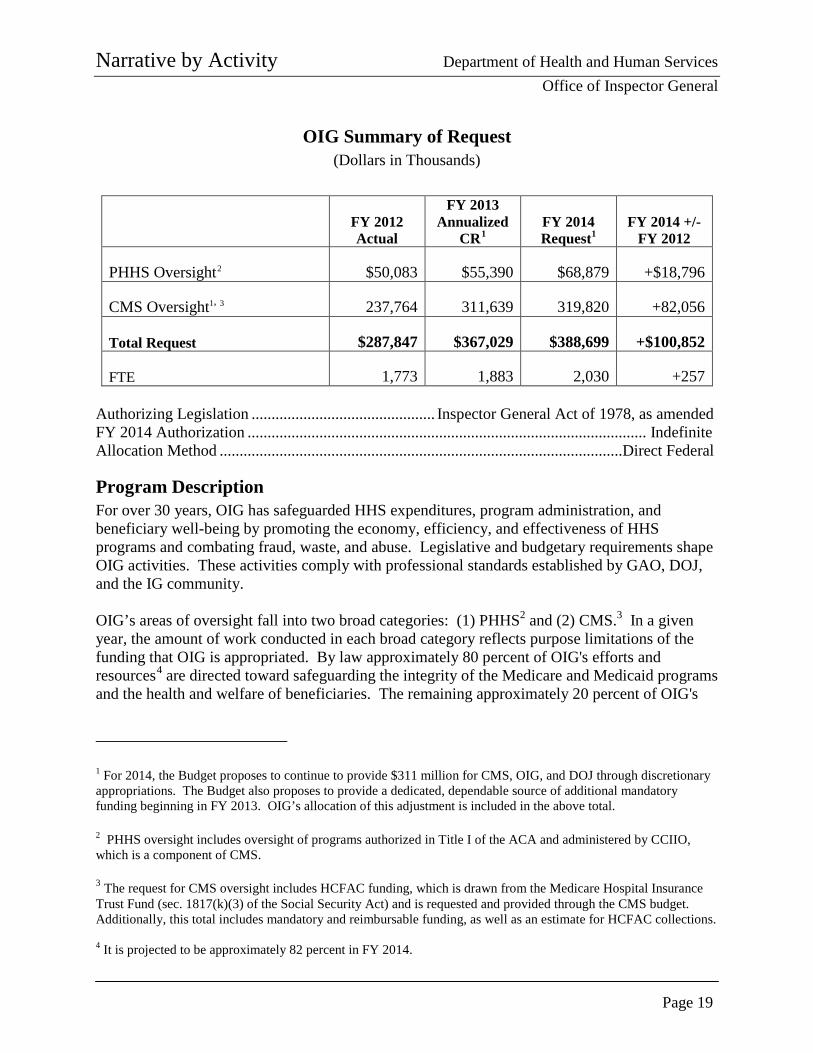
OIG Summary of Request (Dollars in Thousands)
FY 2012 Actual
FY 2013 Annualized
CR1 FY 2014 Request1
FY 2014 +/- FY 2012
PHHS Oversight2 $50,083 $55,390 $68,879 +$18,796
CMS Oversight1, 3 237,764 311,639 319,820 +82,056
Total Request $287,847 $367,029 $388,699 +$100,852
FTE 1,773 1,883 2,030 +257 Authorizing Legislation .............................................. Inspector General Act of 1978, as amended FY 2014 Authorization .................................................................................................... Indefinite Allocation Method .....................................................................................................Direct Federal
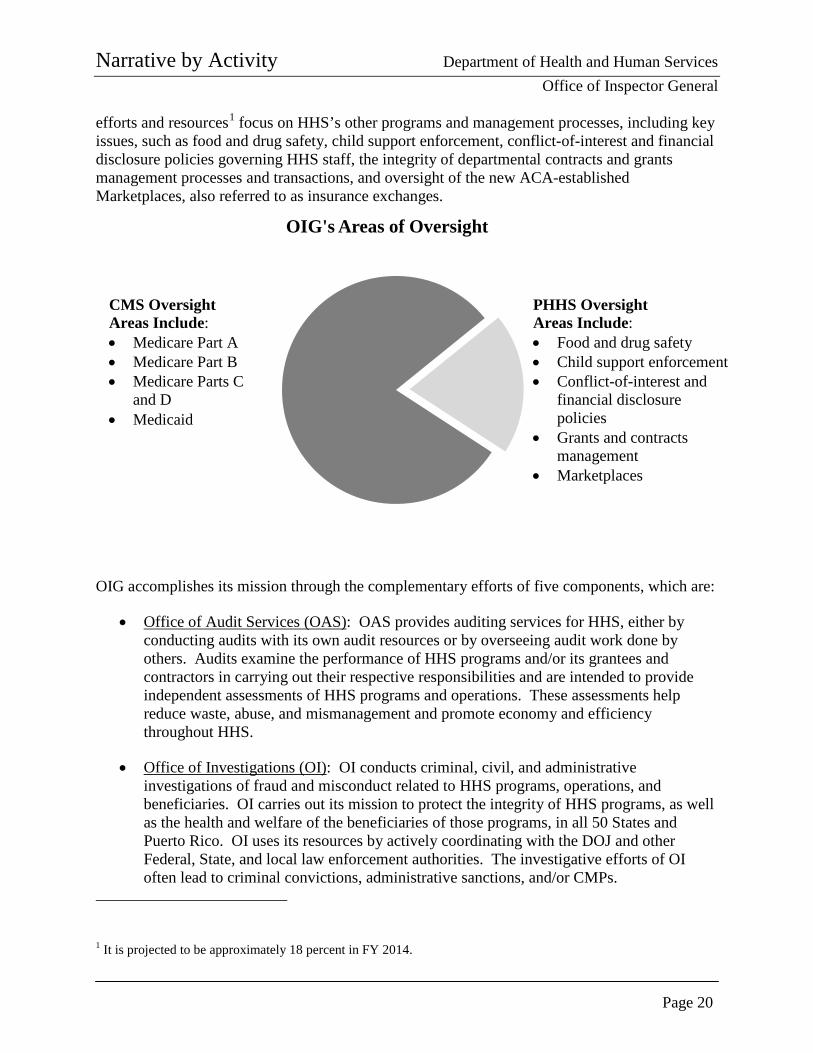
Program Description For over 30 years, OIG has safeguarded HHS expenditures, program administration, and beneficiary well-being by promoting the economy, efficiency, and effectiveness of HHS programs and combating fraud, waste, and abuse. Legislative and budgetary requirements shape OIG activities. These activities comply with professional standards established by GAO, DOJ, and the IG community. OIG’s areas of oversight fall into two broad categories: (1) PHHS2 and (2) CMS.3 In a given year, the amount of work conducted in each broad category reflects purpose limitations of the funding that OIG is appropriated. By law approximately 80 percent of OIG's efforts and resources4 are directed toward safeguarding the integrity of the Medicare and Medicaid programs and the health and welfare of beneficiaries. The remaining approximately 20 percent of OIG's
1 For 2014, the Budget proposes to continue to provide $311 million for CMS, OIG, and DOJ through discretionary appropriations. The Budget also proposes to provide a dedicated, dependable source of additional mandatory funding beginning in FY 2013. OIG’s allocation of this adjustment is included in the above total. 2 PHHS oversight includes oversight of programs authorized in Title I of the ACA and administered by CCIIO, which is a component of CMS. 3 The request for CMS oversight includes HCFAC funding, which is drawn from the Medicare Hospital Insurance Trust Fund (sec. 1817(k)(3) of the Social Security Act) and is requested and provided through the CMS budget. Additionally, this total includes mandatory and reimbursable funding, as well as an estimate for HCFAC collections. 4 It is projected to be approximately 82 percent in FY 2014.
Narrative by Activity Department of Health and Human Services Office of Inspector General
Page 20
efforts and resources1 focus on HHS’s other programs and management processes, including key issues, such as food and drug safety, child support enforcement, conflict-of-interest and financial disclosure policies governing HHS staff, the integrity of departmental contracts and grants management processes and transactions, and oversight of the new ACA-established Marketplaces, also referred to as insurance exchanges.
OIG accomplishes its mission through the complementary efforts of five components, which are:
• Office of Audit Services (OAS): OAS provides auditing services for HHS, either by conducting audits with its own audit resources or by overseeing audit work done by others. Audits examine the performance of HHS programs and/or its grantees and contractors in carrying out their respective responsibilities and are intended to provide independent assessments of HHS programs and operations. These assessments help reduce waste, abuse, and mismanagement and promote economy and efficiency throughout HHS.
• Office of Investigations (OI): OI conducts criminal, civil, and administrative investigations of fraud and misconduct related to HHS programs, operations, and beneficiaries. OI carries out its mission to protect the integrity of HHS programs, as well as the health and welfare of the beneficiaries of those programs, in all 50 States and Puerto Rico. OI uses its resources by actively coordinating with the DOJ and other Federal, State, and local law enforcement authorities. The investigative efforts of OI often lead to criminal convictions, administrative sanctions, and/or CMPs.
1 It is projected to be approximately 18 percent in FY 2014.
OIG's Areas of Oversight
PHHS Oversight Areas Include: • Food and drug safety • Child support enforcement • Conflict-of-interest and
financial disclosure policies
• Grants and contracts management
• Marketplaces
CMS Oversight Areas Include: • Medicare Part A • Medicare Part B • Medicare Parts C
and D • Medicaid
Narrative by Activity Department of Health and Human Services Office of Inspector General
Page 21
• Office of Evaluation and Inspections (OEI): OEI conducts national evaluations to provide HHS, Congress, and the public with timely, useful, and reliable information on significant issues. These evaluations focus on preventing fraud, waste, and abuse and promoting economy, efficiency, and effectiveness of departmental programs. To promote impact, OEI reports also present practical recommendations for improving program operations.
• Office of Counsel to the Inspector General (OCIG): OCIG provides general legal services to OIG, rendering advice and opinions on HHS programs and operations and providing all legal support for OIG’s internal operations. OCIG represents OIG in all civil and administrative fraud and abuse cases involving HHS programs, including False Claims Act, program exclusion, and civil monetary penalty cases. In connection with these cases, OCIG also negotiates and monitors corporate integrity agreements (CIAs). OCIG renders advisory opinions, issues compliance program guidance, publishes fraud alerts, and provides other guidance to the health care industry concerning the anti-kickback statute and other OIG enforcement authorities.
• Executive Management (EM): EM is composed of the Immediate Office of the Inspector General and the Office of Management and Policy. EM is responsible for generally supervising and coordinating the activities of OIG’s components; setting vision and direction, in collaboration with the components, for OIG’s priorities and strategic planning; ensuring effective management of budget, finance, information technology (IT), human resource management, and operations; and serving as a liaison with HHS, Congress, and other stakeholders. EM plans, conducts, and participates in a variety of cooperative projects within HHS and with other Government agencies.
The specialties and technical skills within each of these components enable OIG to implement a multifaceted program integrity approach that simultaneously assesses broad trends in HHS public policy implementation while focusing significant effort on promoting economy, efficiency, and effectiveness and addressing instances of possible fraud, waste, and abuse. OIG maintains a Washington, DC, office and a nationwide network of regional and field offices; approximately 75 percent of employees live and work outside the Washington, DC, metropolitan area. At all levels, OIG staff work closely with HHS and its operating and staff divisions; DOJ, other IG offices, and other Federal agencies in the executive branch; Congress; and States to bring about systemic changes, successful prosecutions, negotiated settlements, and recovery of funds to protect the integrity of HHS programs and expenditures and the well-being of beneficiaries.
Narrative by Activity Department of Health and Human Services Office of Inspector General
Page 22
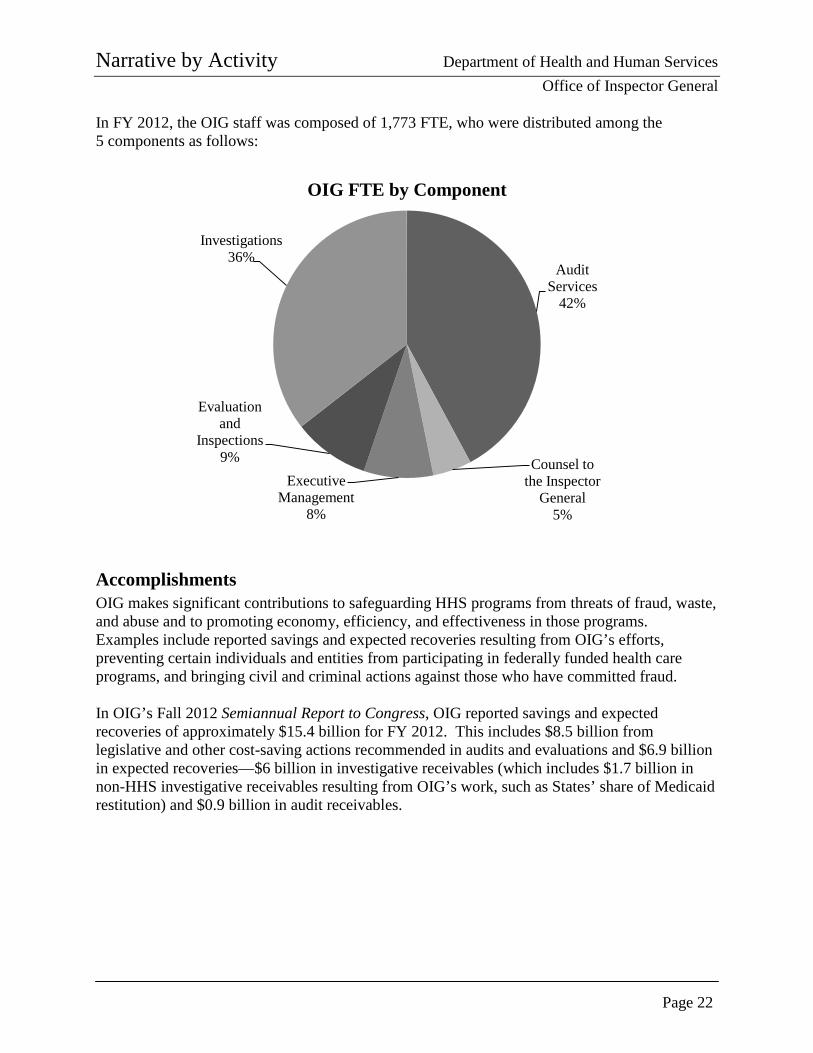
In FY 2012, the OIG staff was composed of 1,773 FTE, who were distributed among the 5 components as follows:
Accomplishments OIG makes significant contributions to safeguarding HHS programs from threats of fraud, waste, and abuse and to promoting economy, efficiency, and effectiveness in those programs. Examples include reported savings and expected recoveries resulting from OIG’s efforts, preventing certain individuals and entities from participating in federally funded health care programs, and bringing civil and criminal actions against those who have committed fraud. In OIG’s Fall 2012 Semiannual Report to Congress, OIG reported savings and expected recoveries of approximately $15.4 billion for FY 2012. This includes $8.5 billion from legislative and other cost-saving actions recommended in audits and evaluations and $6.9 billion in expected recoveries—$6 billion in investigative receivables (which includes $1.7 billion in non-HHS investigative receivables resulting from OIG’s work, such as States’ share of Medicaid restitution) and $0.9 billion in audit receivables.
Audit Services
42%
Counsel to the Inspector
General 5%
Executive Management
8%
Evaluation and
Inspections 9%
Investigations 36%
OIG FTE by Component
Narrative by Activity Department of Health and Human Services Office of Inspector General
Page 23
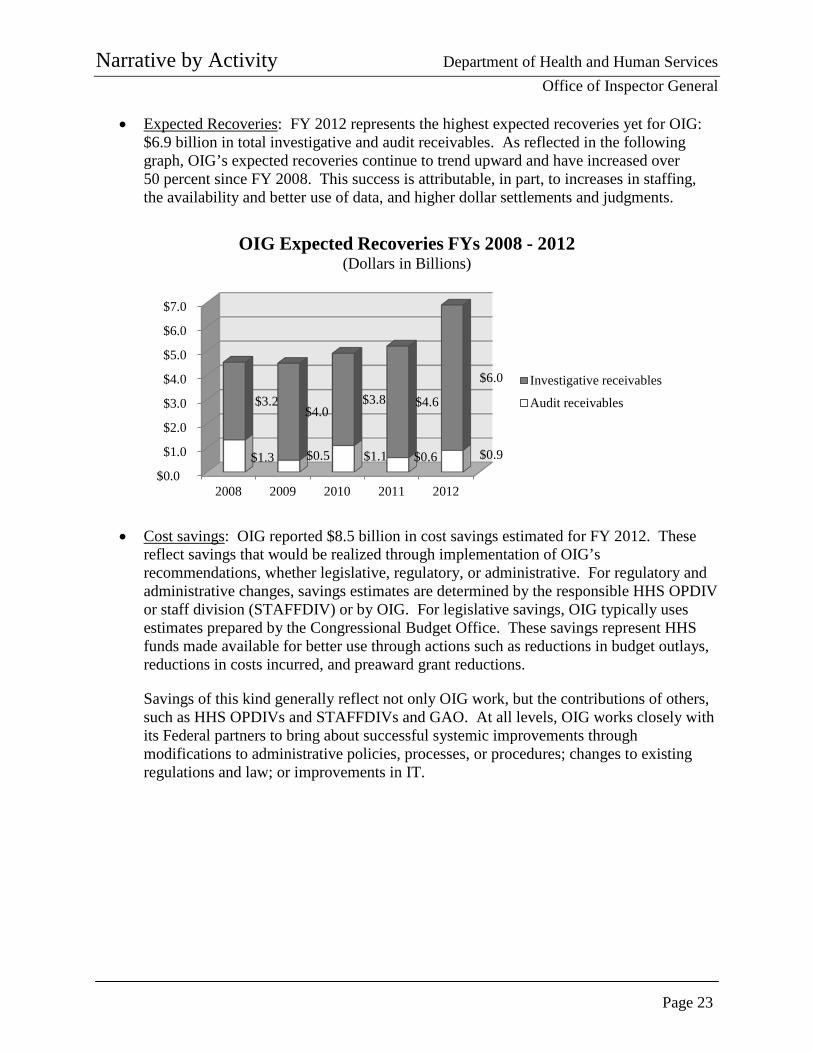
• Expected Recoveries: FY 2012 represents the highest expected recoveries yet for OIG: $6.9 billion in total investigative and audit receivables. As reflected in the following graph, OIG’s expected recoveries continue to trend upward and have increased over 50 percent since FY 2008. This success is attributable, in part, to increases in staffing, the availability and better use of data, and higher dollar settlements and judgments.
• Cost savings: OIG reported $8.5 billion in cost savings estimated for FY 2012. These reflect savings that would be realized through implementation of OIG’s recommendations, whether legislative, regulatory, or administrative. For regulatory and administrative changes, savings estimates are determined by the responsible HHS OPDIV or staff division (STAFFDIV) or by OIG. For legislative savings, OIG typically uses estimates prepared by the Congressional Budget Office. These savings represent HHS funds made available for better use through actions such as reductions in budget outlays, reductions in costs incurred, and preaward grant reductions.
Savings of this kind generally reflect not only OIG work, but the contributions of others, such as HHS OPDIVs and STAFFDIVs and GAO. At all levels, OIG works closely with its Federal partners to bring about successful systemic improvements through modifications to administrative policies, processes, or procedures; changes to existing regulations and law; or improvements in IT.
$0.0
$1.0
$2.0
$3.0
$4.0
$5.0
$6.0
$7.0
2008 2009 2010 2011 2012
$1.3 $0.5 $1.1 $0.6 $0.9
$3.2 $4.0
$3.8 $4.6
$6.0
OIG Expected Recoveries FYs 2008 - 2012 (Dollars in Billions)
Investigative receivables
Audit receivables
Narrative by Activity Department of Health and Human Services Office of Inspector General
Page 24
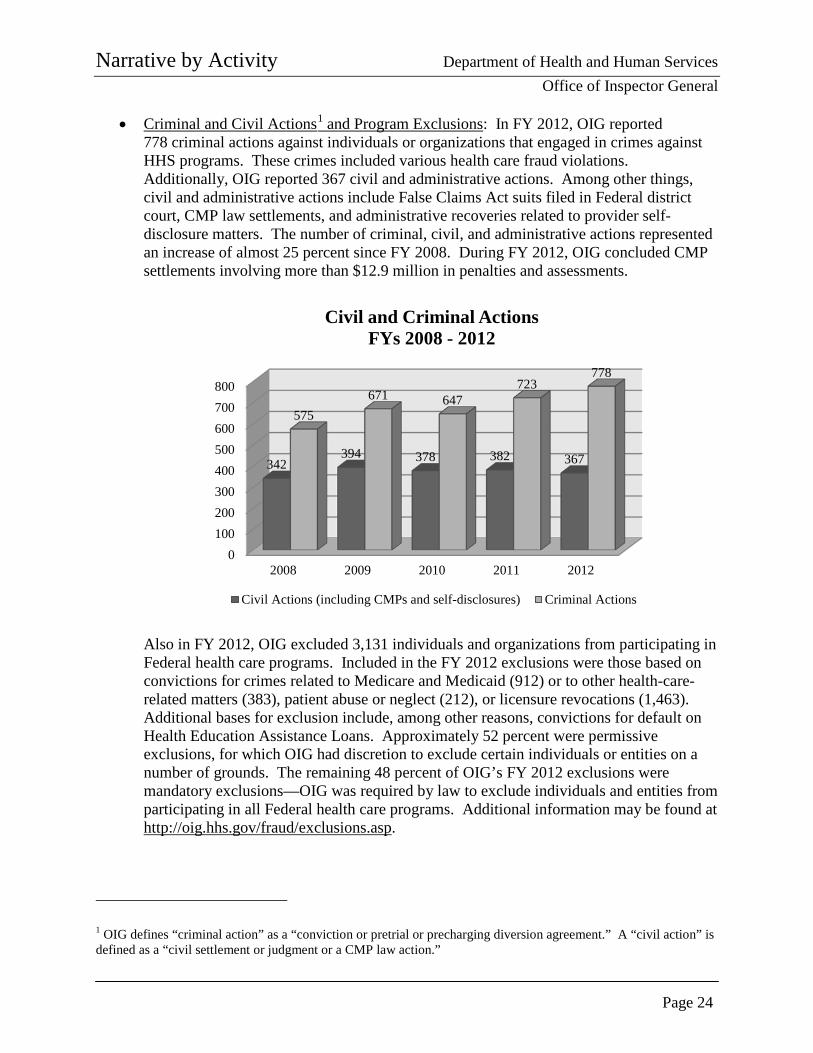
• Criminal and Civil Actions1 and Program Exclusions: In FY 2012, OIG reported 778 criminal actions against individuals or organizations that engaged in crimes against HHS programs. These crimes included various health care fraud violations. Additionally, OIG reported 367 civil and administrative actions. Among other things, civil and administrative actions include False Claims Act suits filed in Federal district court, CMP law settlements, and administrative recoveries related to provider self-disclosure matters. The number of criminal, civil, and administrative actions represented an increase of almost 25 percent since FY 2008. During FY 2012, OIG concluded CMP settlements involving more than $12.9 million in penalties and assessments.
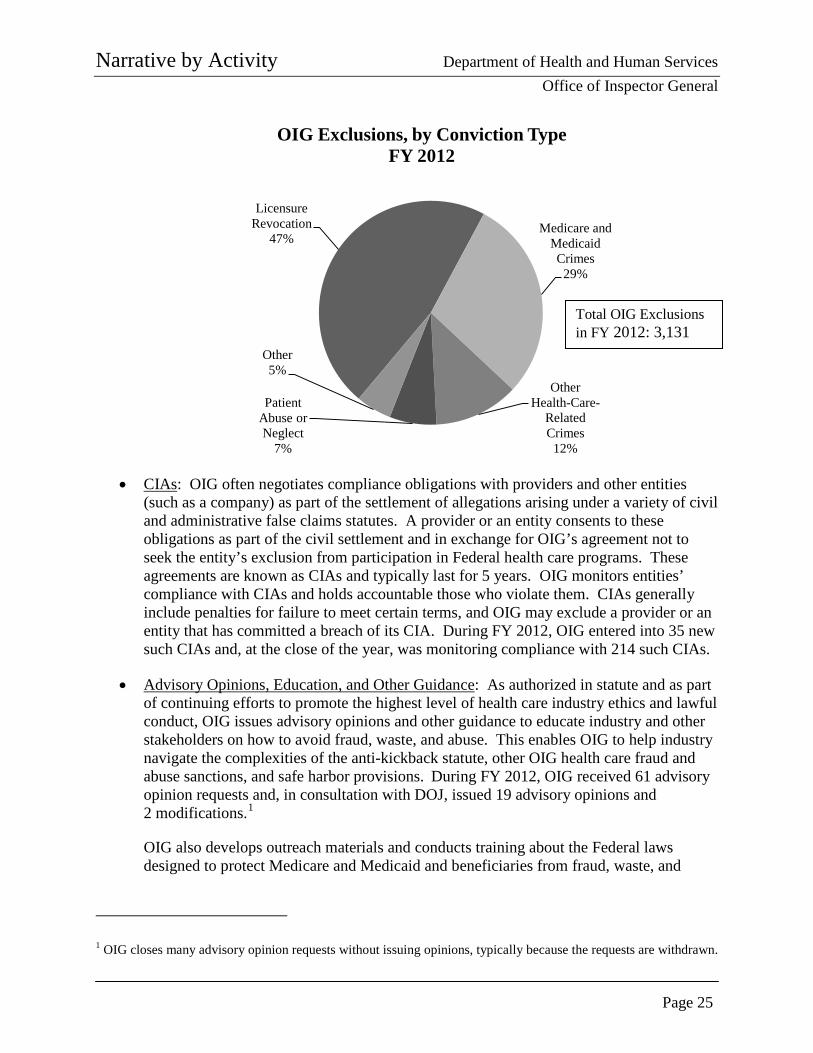
Also in FY 2012, OIG excluded 3,131 individuals and organizations from participating in Federal health care programs. Included in the FY 2012 exclusions were those based on convictions for crimes related to Medicare and Medicaid (912) or to other health-care-related matters (383), patient abuse or neglect (212), or licensure revocations (1,463). Additional bases for exclusion include, among other reasons, convictions for default on Health Education Assistance Loans. Approximately 52 percent were permissive exclusions, for which OIG had discretion to exclude certain individuals or entities on a number of grounds. The remaining 48 percent of OIG’s FY 2012 exclusions were mandatory exclusions—OIG was required by law to exclude individuals and entities from participating in all Federal health care programs. Additional information may be found at http://oig.hhs.gov/fraud/exclusions.asp.
1 OIG defines “criminal action” as a “conviction or pretrial or precharging diversion agreement.” A “civil action” is defined as a “civil settlement or judgment or a CMP law action.”
0100200300400500600700800
2008 2009 2010 2011 2012
342 394 378 382 367
575 671 647
723 778
Civil and Criminal Actions FYs 2008 - 2012
Civil Actions (including CMPs and self-disclosures) Criminal Actions
Narrative by Activity Department of Health and Human Services Office of Inspector General
Page 25
• CIAs: OIG often negotiates compliance obligations with providers and other entities (such as a company) as part of the settlement of allegations arising under a variety of civil and administrative false claims statutes. A provider or an entity consents to these obligations as part of the civil settlement and in exchange for OIG’s agreement not to seek the entity’s exclusion from participation in Federal health care programs. These agreements are known as CIAs and typically last for 5 years. OIG monitors entities’ compliance with CIAs and holds accountable those who violate them. CIAs generally include penalties for failure to meet certain terms, and OIG may exclude a provider or an entity that has committed a breach of its CIA. During FY 2012, OIG entered into 35 new such CIAs and, at the close of the year, was monitoring compliance with 214 such CIAs.
• Advisory Opinions, Education, and Other Guidance: As authorized in statute and as part of continuing efforts to promote the highest level of health care industry ethics and lawful conduct, OIG issues advisory opinions and other guidance to educate industry and other stakeholders on how to avoid fraud, waste, and abuse. This enables OIG to help industry navigate the complexities of the anti-kickback statute, other OIG health care fraud and abuse sanctions, and safe harbor provisions. During FY 2012, OIG received 61 advisory opinion requests and, in consultation with DOJ, issued 19 advisory opinions and 2 modifications.1
OIG also develops outreach materials and conducts training about the Federal laws designed to protect Medicare and Medicaid and beneficiaries from fraud, waste, and
1 OIG closes many advisory opinion requests without issuing opinions, typically because the requests are withdrawn.
Licensure Revocation
47% Medicare and
Medicaid Crimes
29%
Other Health-Care-
Related Crimes
12%
Patient Abuse or Neglect
7%
Other 5%
OIG Exclusions, by Conviction Type FY 2012
Total OIG Exclusions in FY 2012: 3,131
Narrative by Activity Department of Health and Human Services Office of Inspector General
Page 26
abuse. For example, as part of the HEAT Compliance Training Initiative, training materials, including podcasts and video, are available on OIG’s Web site. Additionally, OIG continues to look for ways to improve the effectiveness of its publications and expand on its work in key areas. In November 2012, OIG published an OIG Portfolio titled Personal Care Services: Trends, Vulnerabilities, and Recommendations for Improvement, which synthesizes OIG’s body of work in the personal care services area and offers new and comprehensive recommendations to address vulnerabilities. The Portfolio identifies trends in payment, compliance, oversight, or fraud vulnerabilities requiring priority attention and action to protect the integrity of HHS programs and the beneficiaries they serve.
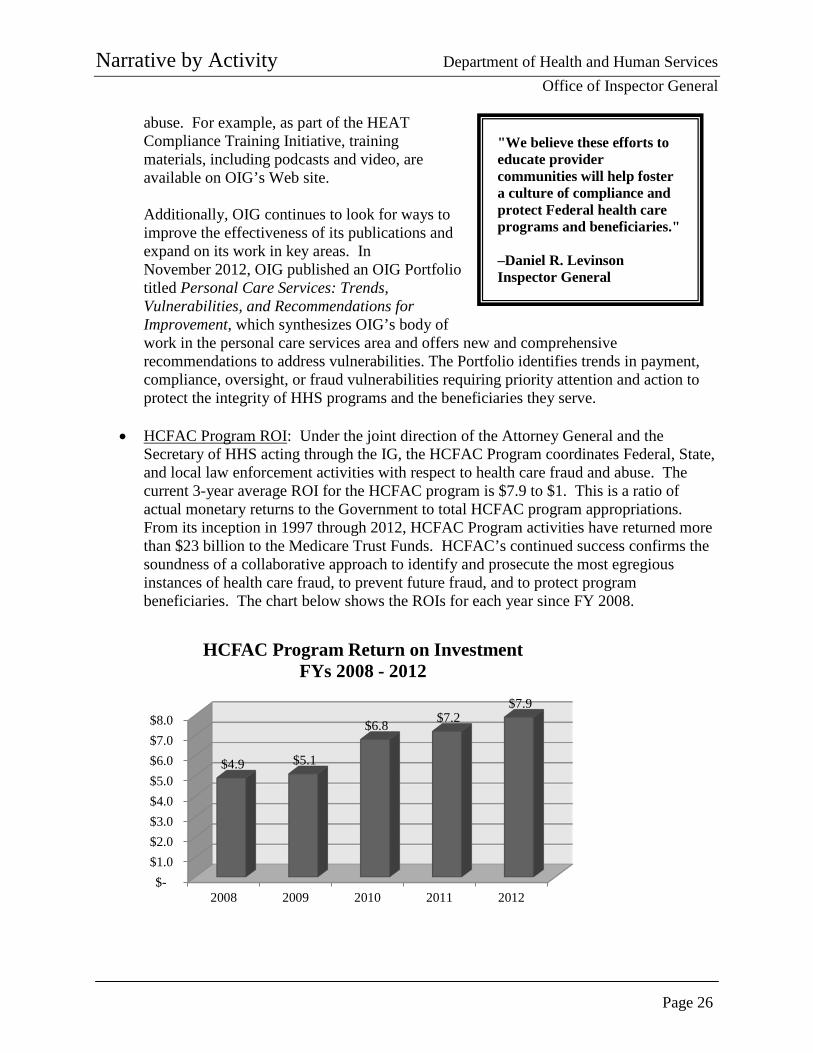
• HCFAC Program ROI: Under the joint direction of the Attorney General and the Secretary of HHS acting through the IG, the HCFAC Program coordinates Federal, State, and local law enforcement activities with respect to health care fraud and abuse. The current 3-year average ROI for the HCFAC program is $7.9 to $1. This is a ratio of actual monetary returns to the Government to total HCFAC program appropriations. From its inception in 1997 through 2012, HCFAC Program activities have returned more than $23 billion to the Medicare Trust Funds. HCFAC’s continued success confirms the soundness of a collaborative approach to identify and prosecute the most egregious instances of health care fraud, to prevent future fraud, and to protect program beneficiaries. The chart below shows the ROIs for each year since FY 2008.
$- $1.0 $2.0 $3.0 $4.0 $5.0 $6.0 $7.0 $8.0
2008 2009 2010 2011 2012
$4.9 $5.1
$6.8 $7.2 $7.9
HCFAC Program Return on Investment FYs 2008 - 2012
"We believe these efforts to educate provider communities will help foster a culture of compliance and protect Federal health care programs and beneficiaries." –Daniel R. Levinson Inspector General
Narrative by Activity Department of Health and Human Services Office of Inspector General
Page 27
Budget Request The FY 2014 request for OIG includes $388,699,000 and 2,030 FTE, an increase of +$100,852,000, which will support an additional +257 FTE above the FY 2012 actual level. With these resources, OIG is charged with overseeing approximately $900 billion in HHS spending, which represents 24 cents of every Federal dollar spent. Consistent with its funding, OIG’s spending falls into two broad categories, PHHS and CMS oversight. For each of these areas, this submission includes:
• PHHS Oversight: An increase of +$18,796,000 above the FY 2012 actual level is
requested to ensure oversight of HHS activities and key priority areas. The request reflects the demand for OIG oversight of the non-CMS programs, which represent over $100 billion in spending and are critical to the health and well-being of Americans. The request will enable OIG to oversee the efficient and effective administration of vital public health and human services programs and to expand in key priority areas, including addressing existing and emerging issues, such as monitoring the implementation of ACA programs, including the Marketplaces; overseeing the management of cross-Departmental issues, such as grants and contracts and IT security; ensuring the safety of the Nation’s domestic and imported food, drugs, biologics, and medical devices; and expanding OIG’s capacity to leverage data and to identify potential fraud trends in the non-CMS program areas. Additional detail about OIG’s efforts in this area and this request can be found in the PHHS subsection beginning on page 33.
• CMS Oversight: An increase of +$82,056,000 above the FY 2012 actual level is
requested to continue oversight of Medicaid and Medicare activities previously funded through mandatory appropriations and support OIG’s CMS-related program integrity efforts, including sustaining and expanding HEAT efforts, such as the Medicare Fraud Strike Forces. The resources will continue to support OIG’s efforts to leverage technology and data to continue program integrity efforts and address emerging trends; adapt its workforce and approach to changing health care systems; increase its efforts to identify questionable billings, address improper payments, and improve patient safety and quality of care; and review IT security at CMS, Medicare providers, and Medicaid agencies.
The current ROI for the HCFAC program is $7.9 to $1. Through 2012, over $23 billion has been returned to the Medicare Trust funds. Additional information about OIG’s efforts in this area and this request can be found in the CMS subsection beginning on page 41.
Included in these funding increases are funds to maintain existing oversight efforts of Medicare, Medicaid, and other HHS programs. The request provides for the replacement of funding that was previously provided from other sources and has expired, such as the Deficit Reduction Act and the Recovery Act. As this replacement funding is yet to be appropriated, OIG has instituted a number of actions to reduce costs, including instituting a hiring freeze beginning in FY 2012; reducing nonpersonnel budgets; and, in January 2013, offering employees early retirement through Voluntary Early Retirement Authority (VERA) and separation incentive payments
Narrative by Activity Department of Health and Human Services Office of Inspector General
Page 28
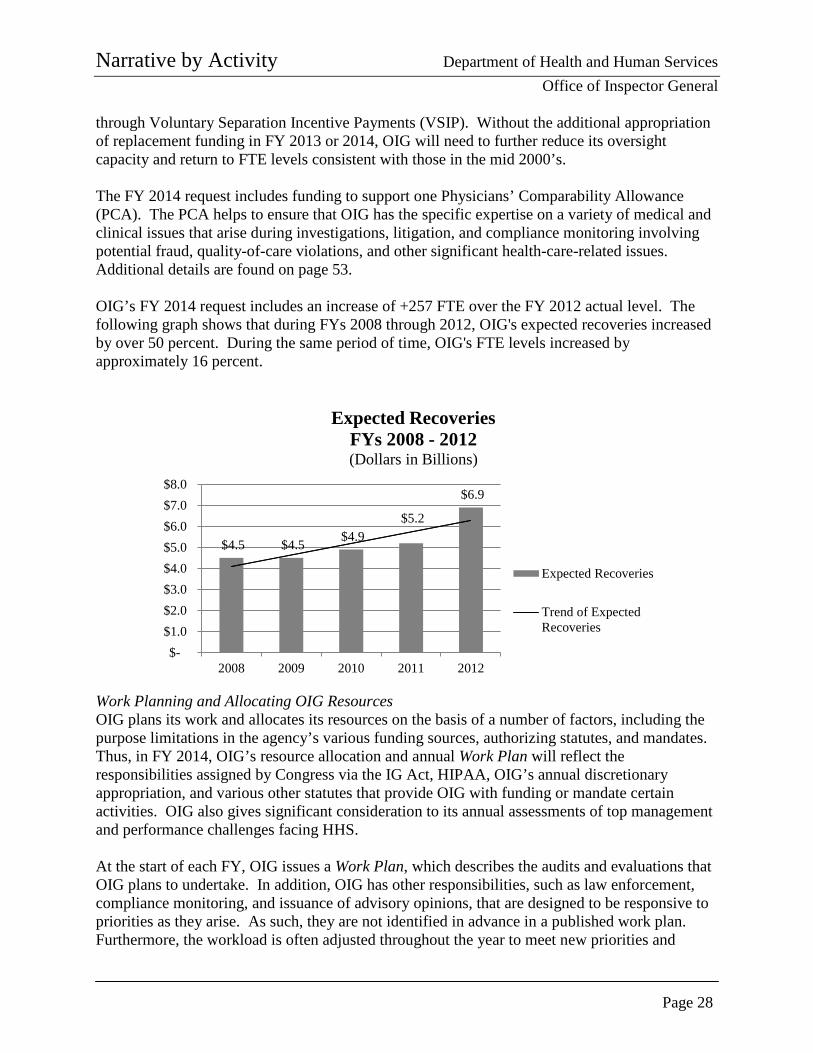
through Voluntary Separation Incentive Payments (VSIP). Without the additional appropriation of replacement funding in FY 2013 or 2014, OIG will need to further reduce its oversight capacity and return to FTE levels consistent with those in the mid 2000’s. The FY 2014 request includes funding to support one Physicians’ Comparability Allowance (PCA). The PCA helps to ensure that OIG has the specific expertise on a variety of medical and clinical issues that arise during investigations, litigation, and compliance monitoring involving potential fraud, quality-of-care violations, and other significant health-care-related issues. Additional details are found on page 53. OIG’s FY 2014 request includes an increase of +257 FTE over the FY 2012 actual level. The following graph shows that during FYs 2008 through 2012, OIG's expected recoveries increased by over 50 percent. During the same period of time, OIG's FTE levels increased by approximately 16 percent.
Work Planning and Allocating OIG Resources OIG plans its work and allocates its resources on the basis of a number of factors, including the purpose limitations in the agency’s various funding sources, authorizing statutes, and mandates. Thus, in FY 2014, OIG’s resource allocation and annual Work Plan will reflect the responsibilities assigned by Congress via the IG Act, HIPAA, OIG’s annual discretionary appropriation, and various other statutes that provide OIG with funding or mandate certain activities. OIG also gives significant consideration to its annual assessments of top management and performance challenges facing HHS. At the start of each FY, OIG issues a Work Plan, which describes the audits and evaluations that OIG plans to undertake. In addition, OIG has other responsibilities, such as law enforcement, compliance monitoring, and issuance of advisory opinions, that are designed to be responsive to priorities as they arise. As such, they are not identified in advance in a published work plan. Furthermore, the workload is often adjusted throughout the year to meet new priorities and
$4.5 $4.5 $4.9 $5.2
$6.9
$- $1.0 $2.0 $3.0 $4.0 $5.0 $6.0 $7.0 $8.0
2008 2009 2010 2011 2012
Expected Recoveries FYs 2008 - 2012 (Dollars in Billions)
Expected Recoveries
Trend of ExpectedRecoveries
Narrative by Activity Department of Health and Human Services Office of Inspector General
Page 29
respond to emergencies, unforeseen events, and emerging issues identified through the strategic use of field intelligence and data analysis. In developing and evaluating specific Work Plan proposals for FY 2014, OIG will consider a number of factors, including the following:
• requirements in laws, regulations, or other directives;
• requests made or concerns raised by Congress and HHS management;
• significant management and performance challenges facing HHS, which OIG identifies as part of the HHS annual agency financial report;
• analysis of Medicare and Medicaid claims data for patterns that indicate possible fraud, waste, and abuse;
• work performed by other oversight agencies, such as GAO;
• management’s actions to implement OIG recommendations from previous reviews; and
• timing (e.g., a program may be reviewed because it is approaching reauthorization).
Chief among the factors considered by OIG are the levels of vulnerability of HHS programs and funds to fraud, waste, and abuse and the estimated effect of the vulnerabilities on HHS programs and beneficiaries. Two factors considered heavily when assessing risk are the likelihood of occurrence and reoccurrence of a given vulnerability and the magnitude of its impact. For example, weak internal controls or significant growth in program authority or spending may signal a greater likelihood of fraud, waste, or abuse, and the number of beneficiaries served by a program may be an indicator of impact. Reviews will be prioritized for implementation when the consequence of mismanagement, noncompliance, or other deficiencies in a specific program area could:
• undermine the intent and effectiveness of HHS programs;
• compound known and inherent financial risks;
• negatively impact health care; or
• reduce productivity, economy, or efficiency of HHS operations or systems.
Highlights from the FY 2013 Work Plan can be found in the PHHS and CMS oversight budget request subsections of this document (pages 39 and 46, respectively).
Narrative by Activity Department of Health and Human Services Office of Inspector General
Page 30
OIG-Wide Performance Table Key Outcomes1
Most Recent Result (FY 2012)
FY 2012 Target
FY 2014 Target
FY 2014 +/- FY 2012
Expected recoveries resulting from OIG involvement in health care fraud and abuse oversight activities (dollars in millions)
FY 2012: $4,594 (Target exceeded) $3,400 $3,400 --
ROI resulting from OIG involvement in health care fraud and abuse oversight activities
FY 2012: $17.9 (Target exceeded) $12.0 $12.0 --
Number of quality and management improvement recommendations accepted
FY 2012: 190 (Target exceeded) 123 123 --
PL funding (dollars in millions) $288 $288 $389 +$101
Key Outputs Most Recent Result (FY 2012)
FY 2012 Target
FY 2014 Target
FY 2014 +/- FY 2012
Audits:
Audit reports started FY 2012: 472 (Target exceeded)
249 194 -55
Audit reports issued FY 2012: 438 (Target exceeded)
315 224 -91
Audit reports issued within 1 year of start (percentage)
FY 2012: 72% (Target exceeded) 63% 63% --
Evaluations:
Evaluation reports started FY 2012: 83 (Target exceeded)
57 60 +3
Evaluation reports issued FY 2012: 59 (Target exceeded)
52 52 --
Evaluation reports issued within 1 year of start (percentage)
FY 2012: 51% (Target not met) 55% 55% --
Investigations:
Complaints received for investigation FY 2012: 4,827 (Target not met)
6,290 4,900 -1,390
Investigative cases started FY 2012: 2,369 (Target exceeded)
2,176 2,345 +169
Investigative cases closed FY 2012: 2,105 (Target exceeded) 2,033 2,114 +81
PL funding (dollars in millions) $288 $288 $389 +$101
1 The “expected recoveries” and ROI performance measures are calculated using 3-year moving averages.
Narrative by Activity Department of Health and Human Services Office of Inspector General
Page 31
Performance Measures Among other indicators, OIG uses three key outcome measures to express progress in accomplishing OIG’s mission of combating fraud, waste, and abuse and promoting economy, efficiency, and effectiveness in HHS programs and operations:
• the 3-year moving average of expected recoveries from OIG’s health care oversight activities that resulted in investigative receivables and audit disallowances,
• the 3-year moving average of the expected ROI from OIG’s health care oversight activities that resulted in investigative receivables and audit disallowances, and
• the number of accepted quality and management improvement recommendations.
These measures (also shown on the table on the previous page) generally reflect the culmination of investigation, audit, and evaluation efforts initiated in prior years. Moreover, these measures are expressions of OIG’s joint success and joint efforts with a network of program integrity partners at all levels of government. For example, OIG investigators and attorneys work closely with DOJ; MFCUs; and other Federal, State, and local law enforcement organizations to develop cases and pursue appropriate enforcement actions, which often include criminal or administrative sanctions and restitution to the Federal and State governments and other affected parties. Similarly, OIG audits and evaluations generate findings and recommendations intended to save money or improve programs. While OIG is not authorized to implement its recommendations, it informs Congress and HHS program officials of potential cost disallowances and corrective actions that may be taken to address the vulnerabilities OIG identifies. As shown in the table on the previous page, several outputs contribute to OIG’s success in meeting its goals. Many factors are considered when identifying OIG’s output targets. An increase in resources in one fiscal year may not necessarily yield results in the same fiscal year. Performance targets reflect the time required to hire and train new staff. Similarly, a lack of resources can negatively impact performance results in future years. Thus, OIG’s targets for audit reports started and issued have declined to reflect recent staff reductions; the current hiring freeze; and a focus on producing fewer, but higher impact, reports. An increase in funding in FY 2014 would most likely affect audit reports issued in FYs 2015 and beyond. Finally, the decrease in the target for complaints received is due to improvements in the OIG complaint hotline process. In the past year, OIG’s hotline process has undergone significant changes to ensure more efficient and effective complaint referrals to OIG regional offices. OIG is considering discontinuing this output measure. A breakdown of OIG’s output measures by PHHS and CMS oversight can be found on pages 40 and 51, respectively.

Narrative by Activity Department of Health and Human Services Office of Inspector General
Page 32
PAGE INTENTIONALLY LEFT BLANK
Narrative by Activity Department of Health and Human Services Office of Inspector General
Page 33
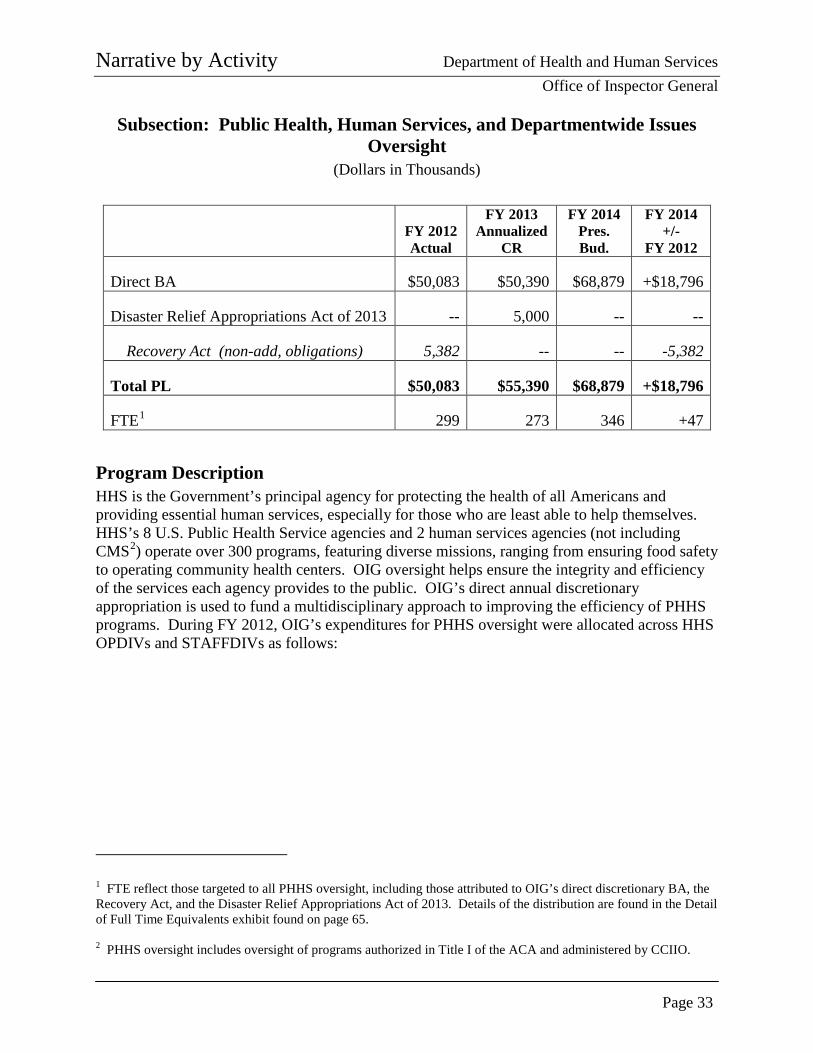
Subsection: Public Health, Human Services, and Departmentwide Issues Oversight
(Dollars in Thousands)
FY 2012 Actual
FY 2013 Annualized
CR
FY 2014 Pres. Bud.
FY 2014 +/-
FY 2012
Direct BA $50,083 $50,390 $68,879 +$18,796
Disaster Relief Appropriations Act of 2013 -- 5,000 -- --
Recovery Act (non-add, obligations) 5,382 -- -- -5,382
Total PL $50,083 $55,390 $68,879 +$18,796
FTE1 299 273 346 +47
Program Description HHS is the Government’s principal agency for protecting the health of all Americans and providing essential human services, especially for those who are least able to help themselves. HHS’s 8 U.S. Public Health Service agencies and 2 human services agencies (not including CMS2) operate over 300 programs, featuring diverse missions, ranging from ensuring food safety to operating community health centers. OIG oversight helps ensure the integrity and efficiency of the services each agency provides to the public. OIG’s direct annual discretionary appropriation is used to fund a multidisciplinary approach to improving the efficiency of PHHS programs. During FY 2012, OIG’s expenditures for PHHS oversight were allocated across HHS OPDIVs and STAFFDIVs as follows:
1 FTE reflect those targeted to all PHHS oversight, including those attributed to OIG’s direct discretionary BA, the Recovery Act, and the Disaster Relief Appropriations Act of 2013. Details of the distribution are found in the Detail of Full Time Equivalents exhibit found on page 65. 2 PHHS oversight includes oversight of programs authorized in Title I of the ACA and administered by CCIIO.
Narrative by Activity Department of Health and Human Services Office of Inspector General
Page 34
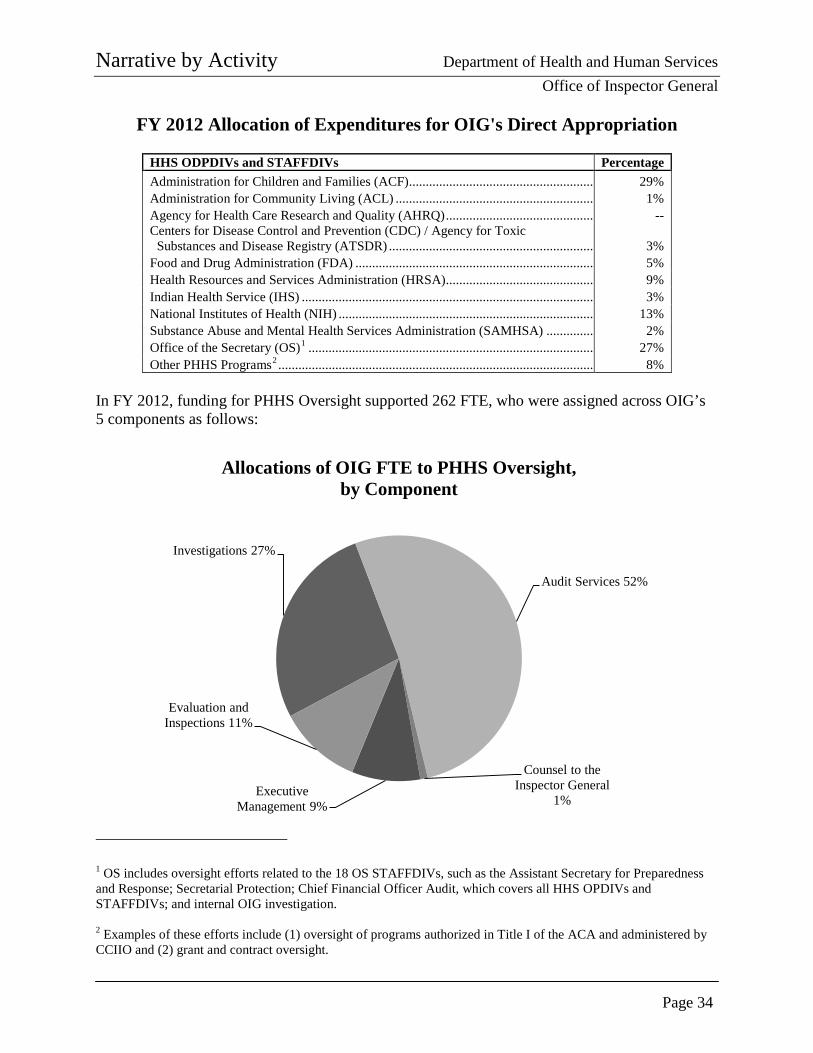
FY 2012 Allocation of Expenditures for OIG's Direct Appropriation
HHS ODPDIVs and STAFFDIVs Percentage Administration for Children and Families (ACF)....................................................... 29% Administration for Community Living (ACL) ........................................................... 1% Agency for Health Care Research and Quality (AHRQ) ............................................ -- Centers for Disease Control and Prevention (CDC) / Agency for Toxic
Substances and Disease Registry (ATSDR) ............................................................. 3% Food and Drug Administration (FDA) ....................................................................... 5% Health Resources and Services Administration (HRSA)............................................ 9% Indian Health Service (IHS) ....................................................................................... 3% National Institutes of Health (NIH) ............................................................................ 13% Substance Abuse and Mental Health Services Administration (SAMHSA) .............. 2% Office of the Secretary (OS)1 ..................................................................................... 27% Other PHHS Programs2 .............................................................................................. 8%
In FY 2012, funding for PHHS Oversight supported 262 FTE, who were assigned across OIG’s 5 components as follows:
1 OS includes oversight efforts related to the 18 OS STAFFDIVs, such as the Assistant Secretary for Preparedness and Response; Secretarial Protection; Chief Financial Officer Audit, which covers all HHS OPDIVs and STAFFDIVs; and internal OIG investigation. 2 Examples of these efforts include (1) oversight of programs authorized in Title I of the ACA and administered by CCIIO and (2) grant and contract oversight.
Investigations 27%
Audit Services 52%
Counsel to the Inspector General
1% Executive
Management 9%
Evaluation and Inspections 11%
Allocations of OIG FTE to PHHS Oversight, by Component
Narrative by Activity Department of Health and Human Services Office of Inspector General
Page 35
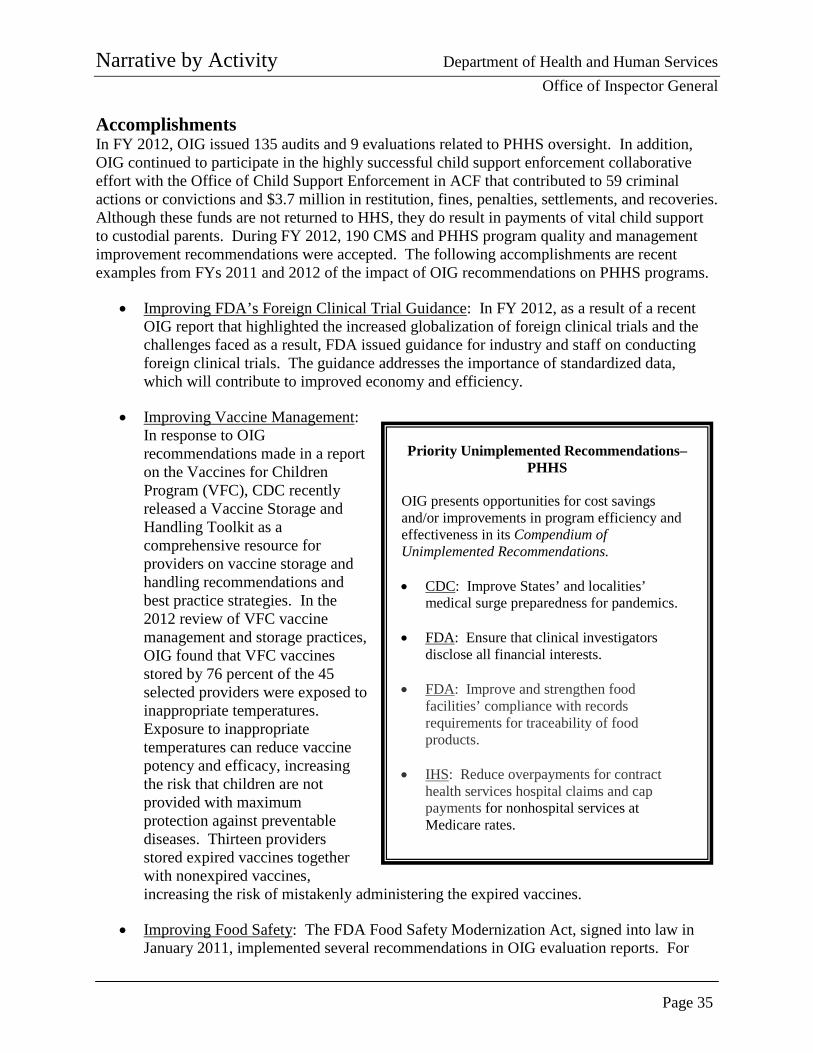
Accomplishments In FY 2012, OIG issued 135 audits and 9 evaluations related to PHHS oversight. In addition, OIG continued to participate in the highly successful child support enforcement collaborative effort with the Office of Child Support Enforcement in ACF that contributed to 59 criminal actions or convictions and $3.7 million in restitution, fines, penalties, settlements, and recoveries. Although these funds are not returned to HHS, they do result in payments of vital child support to custodial parents. During FY 2012, 190 CMS and PHHS program quality and management improvement recommendations were accepted. The following accomplishments are recent examples from FYs 2011 and 2012 of the impact of OIG recommendations on PHHS programs.
• Improving FDA’s Foreign Clinical Trial Guidance: In FY 2012, as a result of a recent OIG report that highlighted the increased globalization of foreign clinical trials and the challenges faced as a result, FDA issued guidance for industry and staff on conducting foreign clinical trials. The guidance addresses the importance of standardized data, which will contribute to improved economy and efficiency.
• Improving Vaccine Management: In response to OIG recommendations made in a report on the Vaccines for Children Program (VFC), CDC recently released a Vaccine Storage and Handling Toolkit as a comprehensive resource for providers on vaccine storage and handling recommendations and best practice strategies. In the 2012 review of VFC vaccine management and storage practices, OIG found that VFC vaccines stored by 76 percent of the 45 selected providers were exposed to inappropriate temperatures. Exposure to inappropriate temperatures can reduce vaccine potency and efficacy, increasing the risk that children are not provided with maximum protection against preventable diseases. Thirteen providers stored expired vaccines together with nonexpired vaccines, increasing the risk of mistakenly administering the expired vaccines.
• Improving Food Safety: The FDA Food Safety Modernization Act, signed into law in January 2011, implemented several recommendations in OIG evaluation reports. For
Priority Unimplemented Recommendations–PHHS
OIG presents opportunities for cost savings and/or improvements in program efficiency and effectiveness in its Compendium of Unimplemented Recommendations. • CDC: Improve States’ and localities’
medical surge preparedness for pandemics.
• FDA: Ensure that clinical investigators disclose all financial interests.
• FDA: Improve and strengthen food facilities’ compliance with records requirements for traceability of food products.
• IHS: Reduce overpayments for contract
health services hospital claims and cap payments for nonhospital services at Medicare rates.
Narrative by Activity Department of Health and Human Services Office of Inspector General
Page 36
example, the law authorizes FDA to establish a new product-tracking system, implementing OIG’s recommendation that FDA seek additional statutory authority to improve food traceability. When seeking this authority, the Administration repeatedly cited OIG’s report. Additionally, the law now requires facilities to renew their registration every 2 years, addressing OIG’s recommendation that FDA seek statutory authority to require facilities to reregister routinely. Finally, the law implements several key recommendations designed to improve FDA’s inspections program, such as increasing the overall number of food facility inspections and improving FDA’s access to certain records during the inspection process.
• NIH Grantees’ Conflicts of Interest: In response to OIG’s report recommending that NIH require grantees to collect and provide information on researchers’ financial conflicts of interest, NIH promulgated a final rule in August 2011, revising 1995 regulations covering financial conflicts of interest for investigators. The rule addresses a number of issues related to promoting objectivity in research and addresses our recommendation to require grantee institutions to provide details regarding the nature of financial conflicts of interest and the ways in which they are managed, reduced, or eliminated.
• Strengthening Head Start Grantees’ Compliance With Health and Safety Requirements: Since 2009, OIG’s reporting of prevalent health and safety issues among Head Start grantees has led to safer conditions for children. Of the 24 grantees reviewed, none had fully complied with Federal or State requirements to protect children from unsafe materials and equipment; restrict access to child care facilities; and maintain play areas free of harmful conditions. Further, most of the grantees did not comply fully with Federal Head Start or State requirements to conduct criminal records checks, conduct checks of childcare exclusion lists, or conduct checks of child abuse and neglect registries. In addition, OIG’s review found that all eight States required preemployment background checks, but additional background checks for childcare employees varied significantly from State to State. The reporting of these conditions led to improved conditions for children, including correction of the problems by 21 of the 24 Head Start facilities and the closure of 3 grantee facilities.
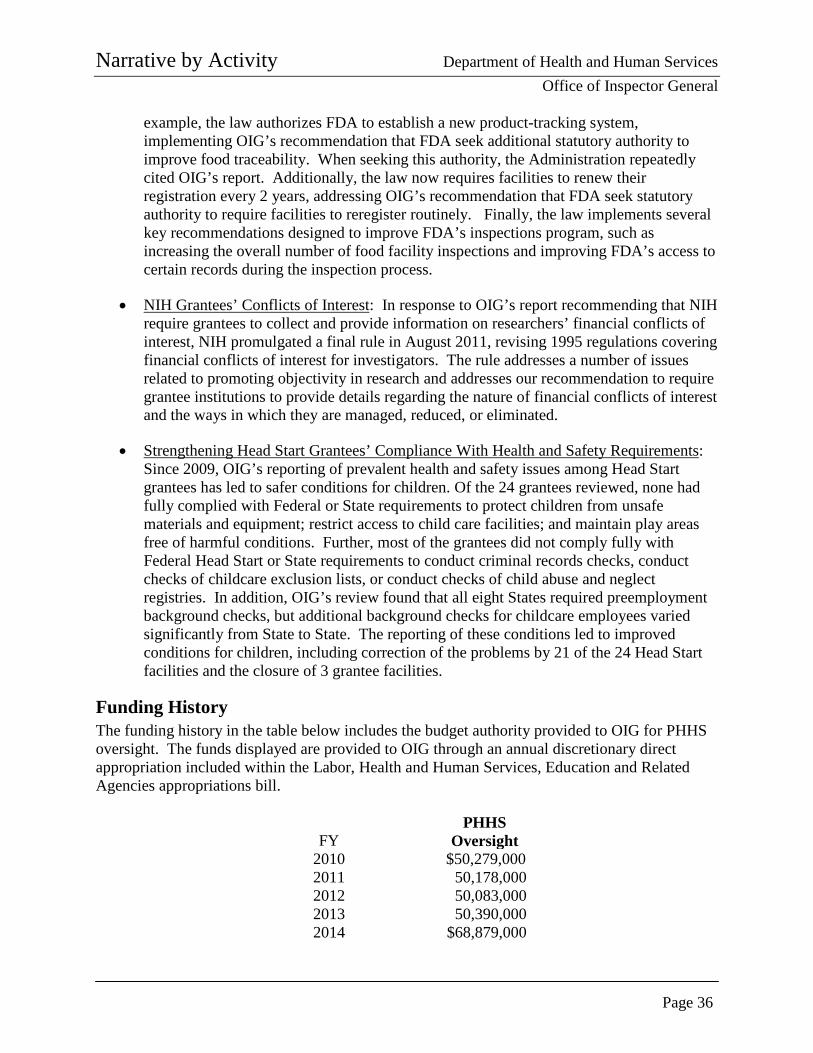
Funding History The funding history in the table below includes the budget authority provided to OIG for PHHS oversight. The funds displayed are provided to OIG through an annual discretionary direct appropriation included within the Labor, Health and Human Services, Education and Related Agencies appropriations bill.
FY
PHHS
Oversight 2010 $50,279,000 2011 50,178,000 2012 50,083,000 2013 50,390,000 2014 $68,879,000
Narrative by Activity Department of Health and Human Services Office of Inspector General
Page 37
Budget Request With funding from its annual discretionary direct appropriation, OIG conducts program integrity and enforcement activities with regard to PHHS programs and operations. These programs are over 300 in number, represent over $100 billion in spending each year, and are carried out by approximately 70,000 HHS employees spread across the globe. OIG prioritizes the allocation of these resources to comply with the requirements in appropriations language and other directives established in law. These include requirements that OIG conduct or oversee reviews under the Federal Information Security Management Act (FISMA) (P.L. No. 107-347) and the Single Audit Act (P.L. No. 98-502), other IT audits, and investigations of interstate nonpayment of child support obligations. In addition, OIG provides protective services for the HHS Secretary using its discretionary appropriation. OIG’s FY 2014 budget request for PHHS oversight is $68,879,000, which is an increase of +$18,796,000 and +47 FTE above the FY 2012 actual level. Of this increase, approximately $5,500,000 will replace funding that has recently expired (such as funding under the Recovery Act) and allow OIG to redirect (approximately 33 FTE) efforts to other priorities. While the output of OIG’s efforts will be measured by the number of PHHS audits, evaluations, investigations, and enforcement actions, the outcome will be preventing or reducing fraud, waste, and abuse. Such a deterrent effect is difficult to measure reliably and affordably, but it is demonstrated partially in the acceptance of OIG recommendations to improve economy and efficiency and promote effectiveness in HHS programs. In this regard, OIG recommendations provide HHS policymakers and senior officials with information for making key policy decisions. In 2012, 190 OIG quality and management improvement recommendations were accepted by HHS program managers—recommendations that will impact the programs and may result in significant improvements to the health and well-being of those served by HHS programs. Examples of the impact of OIG’s recommendations are contained in the previous sections covering OIG’s accomplishments. OIG anticipates that increased investments will yield similar results. Consistent with the most recent top management challenges, OIG has identified the following potential areas for oversight with the additional resources requested in 2014:
• Capacity To Address Existing and Emerging Priorities: Given the complexity of HHS programs and the funding involved, OIG needs the ability to address current priorities, while ensuring capacity to address the challenges of tomorrow. Resources requested for 2014 will help OIG to achieve this goal by strengthening its evaluative and audit capacity; its readiness to oversee the implementation of various ACA provisions; and its oversight of HHS’s international efforts, such as food and drug imports. OIG evaluations and audits focus on preventing fraud and abuse and promoting efficiency and effectiveness in Departmental programs by presenting practical recommendations for improving program operations. With increased capacity, OIG will
Narrative by Activity Department of Health and Human Services Office of Inspector General
Page 38
be able to better identify patterns of fraud and mismanagement and develop recommendations to improve the efficiency and effectiveness of HHS programs.
The implementation of new ACA programs, such as those authorized in Title I and administered by CCIIO, underscores the need for OIG audits and evaluations to identify and mitigate vulnerabilities, help ensure that data systems supporting ACA programs are accurate and complete and comply with security and privacy rules, and identify opportunities to improve efficiencies in new programs and benefits. In addition to increasing its evaluative and audit capacity for all HHS programs, OIG will need to be prepared to respond to an overall increase in credible allegations of fraud in new ACA programs in the coming years.
Furthermore, HHS’s reach is increasingly international. Whether it is drug and food imports or clinical testing, it is important for OIG to be able to effectively oversee these efforts. Moreover, OIG is seeing an increasing number of international ties (especially through money laundering and fugitives) in its investigations. The resources requested for FY 2014 will help OIG to achieve these goals.
• Increased Oversight of Departmental, ODPIV, and STAFFDIV Management: As HHS is responsible for 24 cents of every Federal dollar spent, it is important to ensure that those dollars are being managed responsibly and consistently. Additional funding would enable OIG to support and expand multidisciplinary approaches to identify areas in need of review; examine those areas more closely; and make recommendations or pursue enforcement actions as appropriate. Examples of potential OIG work in this area includes reviews of IT security within the Department and at organizations that partnered with or are under contract with HHS and efforts surrounding HHS spending, such as those concerning grant and contract oversight. Furthermore, HHS grants management and the administration of contract funds continue to be identified as HHS top management challenge and continue to be an OIG oversight priority. HHS is the largest grant-awarding agency in the Federal Government. In FY 2012, the Department awarded over 81,000 grants totaling approximately $347 billion, of which over 80,000 grants and $90 billion were for non-CMS programs. In addition, the Department, in FY 2012 alone, awarded over $19 billion in contracts across all program areas. Work in this area will continue to take on increasing importance as more ACA dollars are awarded and expended. The size and scope of HHS grant expenditures and contracts make the management of these funds a significant challenge. The FY 2014 request will allow OIG to supplement its existing grant oversight work with a greater emphasis on grant and procurement fraud investigations, which may lead to additional enforcement or administrative actions, such as suspensions and debarments of HHS grantees and contractors. While OIG is not authorized to debar those that have violated laws from participation in Federal programs, the organization has committed to identifying cases of fraud and mismanagement and to making referrals to the HHS suspension and debarment official. In addition to safeguarding Federal funds, grant and
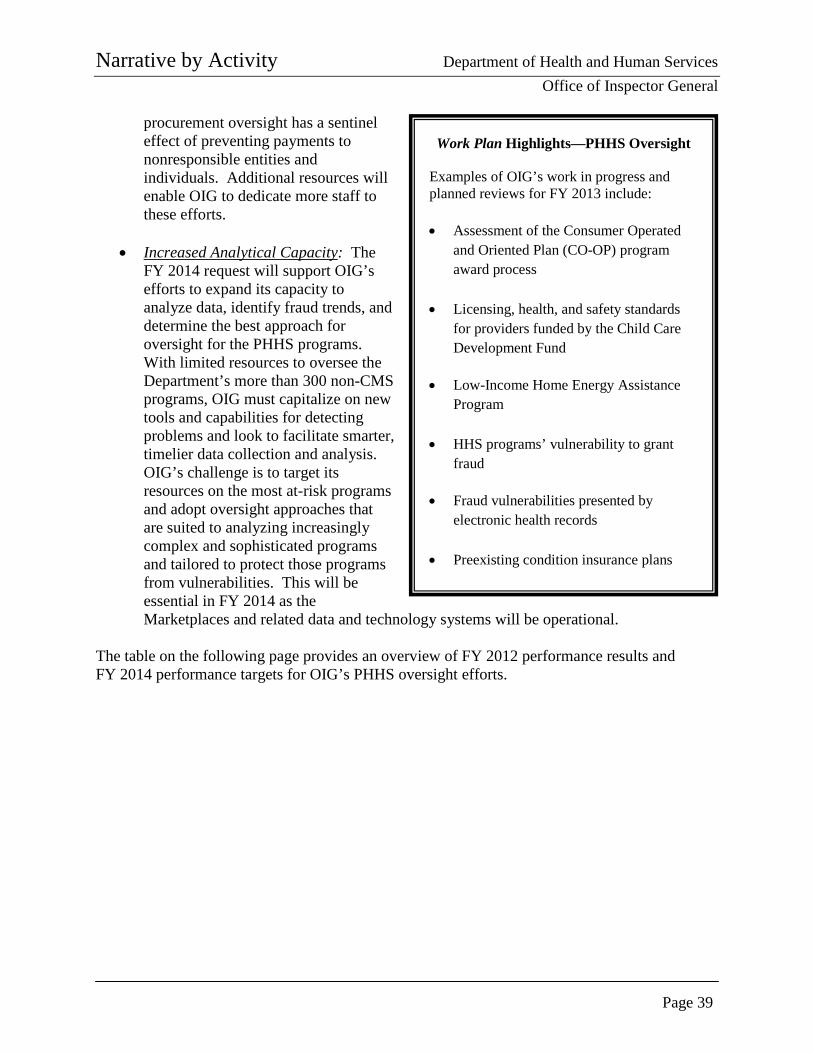
Narrative by Activity Department of Health and Human Services Office of Inspector General
Page 39
procurement oversight has a sentinel effect of preventing payments to nonresponsible entities and individuals. Additional resources will enable OIG to dedicate more staff to these efforts.
• Increased Analytical Capacity: The FY 2014 request will support OIG’s efforts to expand its capacity to analyze data, identify fraud trends, and determine the best approach for oversight for the PHHS programs. With limited resources to oversee the Department’s more than 300 non-CMS programs, OIG must capitalize on new tools and capabilities for detecting problems and look to facilitate smarter, timelier data collection and analysis. OIG’s challenge is to target its resources on the most at-risk programs and adopt oversight approaches that are suited to analyzing increasingly complex and sophisticated programs and tailored to protect those programs from vulnerabilities. This will be essential in FY 2014 as the Marketplaces and related data and technology systems will be operational.
The table on the following page provides an overview of FY 2012 performance results and FY 2014 performance targets for OIG’s PHHS oversight efforts.
Work Plan Highlights—PHHS Oversight
Examples of OIG’s work in progress and planned reviews for FY 2013 include:
• Assessment of the Consumer Operated
and Oriented Plan (CO-OP) program award process
• Licensing, health, and safety standards for providers funded by the Child Care Development Fund
• Low-Income Home Energy Assistance
Program
• HHS programs’ vulnerability to grant fraud
• Fraud vulnerabilities presented by
electronic health records
• Preexisting condition insurance plans
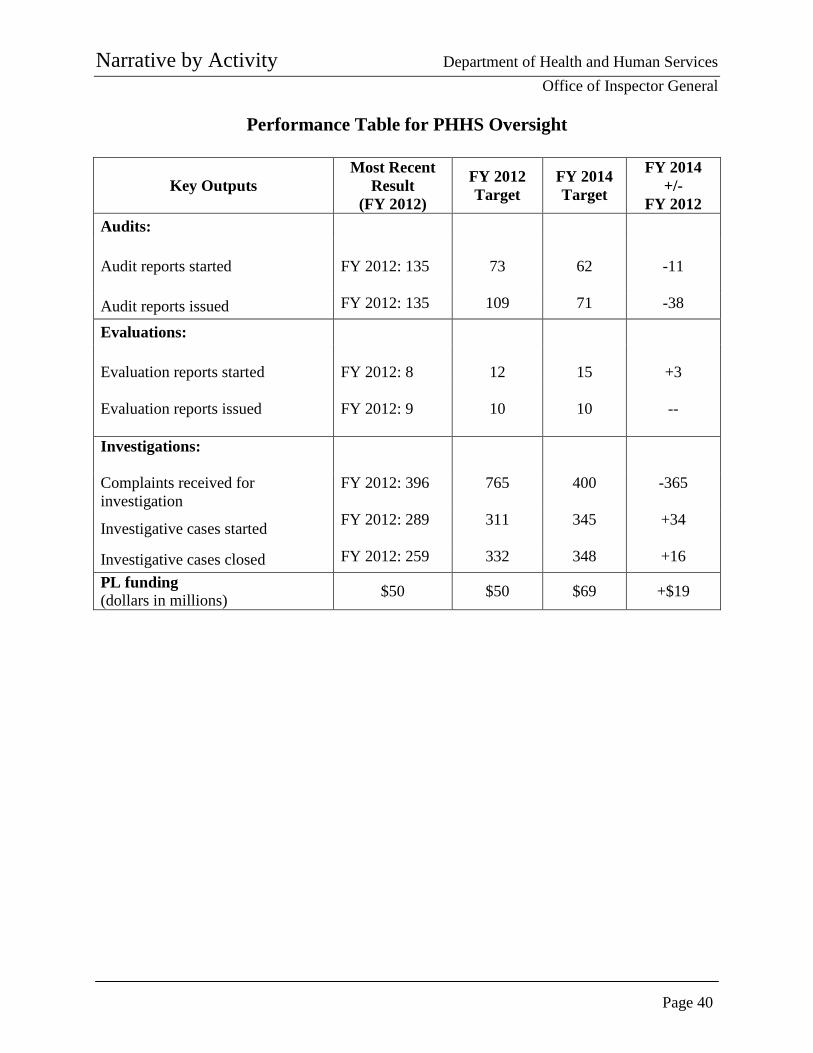
Narrative by Activity Department of Health and Human Services Office of Inspector General
Page 40
Performance Table for PHHS Oversight
Key Outputs Most Recent
Result (FY 2012)
FY 2012 Target
FY 2014 Target
FY 2014 +/-
FY 2012 Audits:
Audit reports started FY 2012: 135
73
62
-11
Audit reports issued FY 2012: 135 109 71 -38
Evaluations: Evaluation reports started
FY 2012: 8
12
15
+3
Evaluation reports issued FY 2012: 9
10
10
--
Investigations:
Complaints received for investigation
FY 2012: 396
765 400 -365
Investigative cases started FY 2012: 289
311 345 +34
Investigative cases closed FY 2012: 259 332 348 +16 PL funding (dollars in millions) $50 $50 $69 +$19
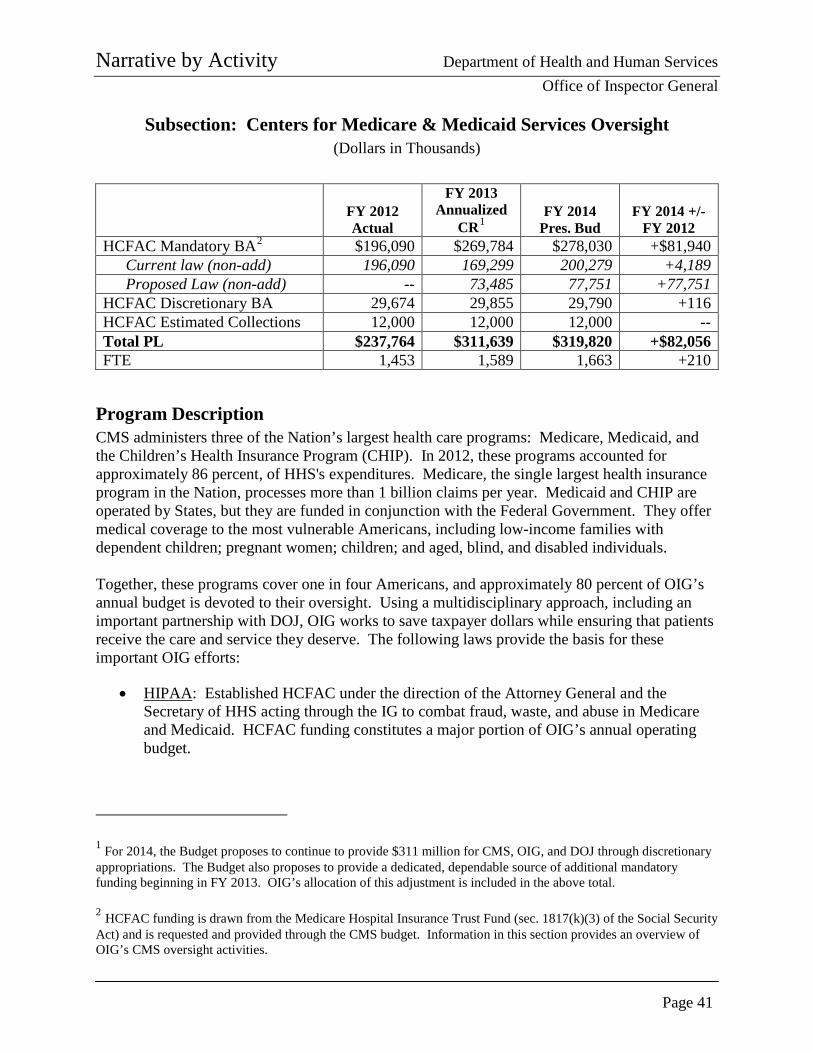
Narrative by Activity Department of Health and Human Services Office of Inspector General
Page 41
Subsection: Centers for Medicare & Medicaid Services Oversight (Dollars in Thousands)
FY 2012 Actual
FY 2013 Annualized
CR1 FY 2014
Pres. Bud FY 2014 +/-
FY 2012 HCFAC Mandatory BA2 $196,090 $269,784 $278,030 +$81,940
Current law (non-add) 196,090 169,299 200,279 +4,189 Proposed Law (non-add) -- 73,485 77,751 +77,751
HCFAC Discretionary BA 29,674 29,855 29,790 +116 HCFAC Estimated Collections 12,000 12,000 12,000 -- Total PL $237,764 $311,639 $319,820 +$82,056 FTE 1,453 1,589 1,663 +210
Program Description CMS administers three of the Nation’s largest health care programs: Medicare, Medicaid, and the Children’s Health Insurance Program (CHIP). In 2012, these programs accounted for approximately 86 percent, of HHS's expenditures. Medicare, the single largest health insurance program in the Nation, processes more than 1 billion claims per year. Medicaid and CHIP are operated by States, but they are funded in conjunction with the Federal Government. They offer medical coverage to the most vulnerable Americans, including low-income families with dependent children; pregnant women; children; and aged, blind, and disabled individuals. Together, these programs cover one in four Americans, and approximately 80 percent of OIG’s annual budget is devoted to their oversight. Using a multidisciplinary approach, including an important partnership with DOJ, OIG works to save taxpayer dollars while ensuring that patients receive the care and service they deserve. The following laws provide the basis for these important OIG efforts:
• HIPAA: Established HCFAC under the direction of the Attorney General and the Secretary of HHS acting through the IG to combat fraud, waste, and abuse in Medicare and Medicaid. HCFAC funding constitutes a major portion of OIG’s annual operating budget.
1 For 2014, the Budget proposes to continue to provide $311 million for CMS, OIG, and DOJ through discretionary appropriations. The Budget also proposes to provide a dedicated, dependable source of additional mandatory funding beginning in FY 2013. OIG’s allocation of this adjustment is included in the above total. 2 HCFAC funding is drawn from the Medicare Hospital Insurance Trust Fund (sec. 1817(k)(3) of the Social Security Act) and is requested and provided through the CMS budget. Information in this section provides an overview of OIG’s CMS oversight activities.
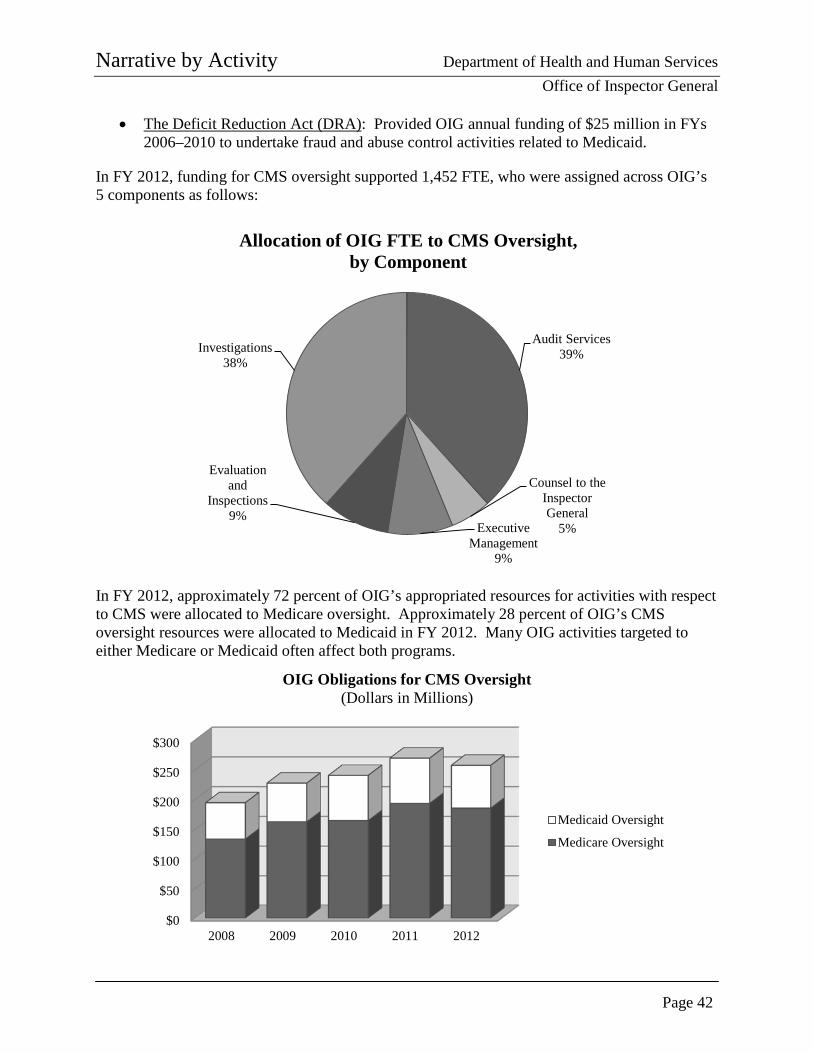
Narrative by Activity Department of Health and Human Services Office of Inspector General
Page 42
• The Deficit Reduction Act (DRA): Provided OIG annual funding of $25 million in FYs 2006–2010 to undertake fraud and abuse control activities related to Medicaid.
In FY 2012, funding for CMS oversight supported 1,452 FTE, who were assigned across OIG’s 5 components as follows:
In FY 2012, approximately 72 percent of OIG’s appropriated resources for activities with respect to CMS were allocated to Medicare oversight. Approximately 28 percent of OIG’s CMS oversight resources were allocated to Medicaid in FY 2012. Many OIG activities targeted to either Medicare or Medicaid often affect both programs.
Audit Services 39%
Counsel to the Inspector General
5% Executive Management
9%
Evaluation and
Inspections 9%
Investigations 38%
Allocation of OIG FTE to CMS Oversight, by Component
$0
$50
$100
$150
$200
$250
$300
2008 2009 2010 2011 2012
OIG Obligations for CMS Oversight (Dollars in Millions)
Medicaid Oversight
Medicare Oversight
Narrative by Activity Department of Health and Human Services Office of Inspector General
Page 43
Accomplishments During FY 2012, OIG’s CMS oversight efforts resulted in approximately $6.9 billion in expected health care recoveries (which include non-HHS investigative receivables resulting from OIG’s work, such as the States’ share of Medicaid restitution.) Specific examples of OIG’s CMS oversight work in FYs 2011 and 2012 include:
• Audits of Medicare Prescription Drug Plan Sponsors: As a result of OIG’s recommendations, CMS developed a Part D program audit strategy and developed procedures for validating corrective actions of deficiencies found through audits and for keeping documentation related to audits in electronic files. Both procedures are included in CMS’s Standard Operating Procedures for Prescription Drug and Medicare Advantage 2012 Program Audits. In the 2011 report, OIG had found that some stand-alone prescription drug plan contracts were never audited during the first 4 years of the Part D program. Further, CMS had no parameters regarding the number of audits it should conduct and did not complete any compliance plan audits during the 4-year period. OIG also found that CMS did not have evidence to show that corrective actions resulting from audits were implemented.
• Emergency Preparedness in Nursing Homes: CMS agreed with OIG’s 2012 report recommendations to revise Federal regulations to include specific requirements for emergency plans and training, update the State Operations Manual to provide detailed guidance for State survey agencies on nursing home compliance with emergency plans and training requirements, and promote use of checklists for emergency planning. ACL agreed with OIG’s recommendation to develop model policies and procedures for long-term-care ombudsmen to protect residents during and after disasters. In September 2012, ACL awarded a grant to the National Resource Center to describe model practices and develop resources, materials, and training for long-term-care Ombudsman programs regarding emergency preparedness. OIG had found that while most nursing homes nationwide met Federal requirements for written emergency plans and preparedness training, many of the same gaps in nursing home preparedness and response that OIG found in its 2006 report continued to exist. For example, nursing homes faced challenges with unreliable transportation contracts, lack of collaboration with local emergency management, and residents who developed health problems.
• Refunding Improper Medicaid Payments for Personal Care Services: As a result of OIG recommendations, CMS agreed to recover $206.7 million in Federal matching funds for personal care services that did not meet Federal and/or State requirements and agreed to set aside an additional $34.8 million for further analysis and resolution. OIG also recommended improvements in guidance, controls, and monitoring.
• CMS Contractor Oversight: CMS relies on a number of program integrity contractors to identify and respond to fraud, abuse, and improper payments in Medicare and Medicaid. Recent OIG reports examining Medicare and Medicaid integrity contractors’ efforts revealed weaknesses in contractor performance. For example, OIG found that Review Medicaid Integrity Contractors (MICs) (responsible for identifying potential
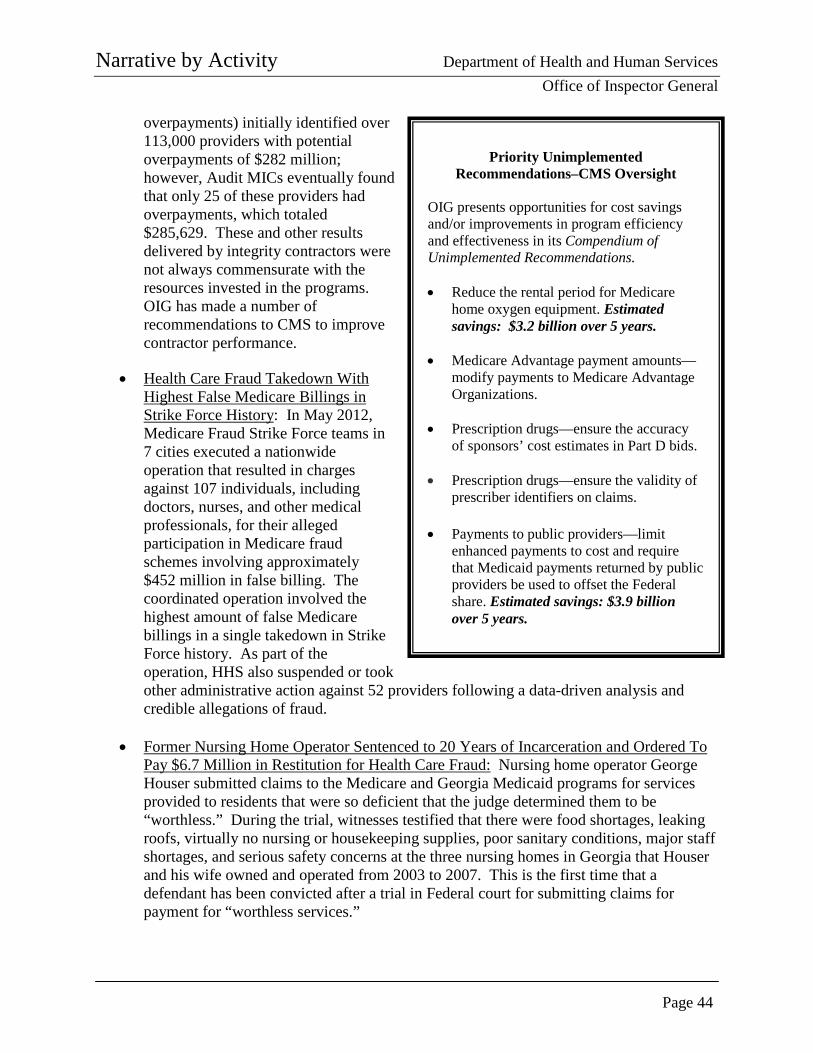
Narrative by Activity Department of Health and Human Services Office of Inspector General
Page 44
overpayments) initially identified over 113,000 providers with potential overpayments of $282 million; however, Audit MICs eventually found that only 25 of these providers had overpayments, which totaled $285,629. These and other results delivered by integrity contractors were not always commensurate with the resources invested in the programs. OIG has made a number of recommendations to CMS to improve contractor performance.
• Health Care Fraud Takedown With Highest False Medicare Billings in Strike Force History: In May 2012, Medicare Fraud Strike Force teams in 7 cities executed a nationwide operation that resulted in charges against 107 individuals, including doctors, nurses, and other medical professionals, for their alleged participation in Medicare fraud schemes involving approximately $452 million in false billing. The coordinated operation involved the highest amount of false Medicare billings in a single takedown in Strike Force history. As part of the operation, HHS also suspended or took other administrative action against 52 providers following a data-driven analysis and credible allegations of fraud.
• Former Nursing Home Operator Sentenced to 20 Years of Incarceration and Ordered To Pay $6.7 Million in Restitution for Health Care Fraud: Nursing home operator George Houser submitted claims to the Medicare and Georgia Medicaid programs for services provided to residents that were so deficient that the judge determined them to be “worthless.” During the trial, witnesses testified that there were food shortages, leaking roofs, virtually no nursing or housekeeping supplies, poor sanitary conditions, major staff shortages, and serious safety concerns at the three nursing homes in Georgia that Houser and his wife owned and operated from 2003 to 2007. This is the first time that a defendant has been convicted after a trial in Federal court for submitting claims for payment for “worthless services.”
Priority Unimplemented Recommendations–CMS Oversight
OIG presents opportunities for cost savings and/or improvements in program efficiency and effectiveness in its Compendium of Unimplemented Recommendations.
• Reduce the rental period for Medicare
home oxygen equipment. Estimated savings: $3.2 billion over 5 years.
• Medicare Advantage payment amounts—modify payments to Medicare Advantage Organizations.
• Prescription drugs—ensure the accuracy of sponsors’ cost estimates in Part D bids.
• Prescription drugs—ensure the validity of
prescriber identifiers on claims.
• Payments to public providers—limit enhanced payments to cost and require that Medicaid payments returned by public providers be used to offset the Federal share. Estimated savings: $3.9 billion over 5 years.
Narrative by Activity Department of Health and Human Services Office of Inspector General
Page 45
• GlaxoSmithKline (GSK) Entered into a Settlement and Agreed To Pay $3 Billion: In the largest health care fraud settlement in U.S. history, GSK entered into a global criminal, civil, and administrative settlement and agreed to pay $3 billion to resolve its liability for its marketing and promotion practices associated with several drugs. In three False Claims Act settlement agreements, the United States alleged that GSK promoted several drugs, including Paxil, Wellbutrin, Advair, Lamictal, and Zofran, for off-label uses and paid kickbacks to induce the prescription of certain drugs; improperly promoted the drugs Avandia, Advandmet, and Avandaryl with false and misleading statements about the drugs’ safety; and violated the requirements of the Medicaid drug rebate program. As part of the settlement, GSK also entered into a 5-year CIA with OIG, which includes enhanced compliance provisions designed to promote accountability and transparency in GSK’s business practices. In addition, the CIA requires that GSK maintain its “Patient First” program, which is designed to compensate sales representatives on the basis of the quality of services they provide to physicians instead of the volume of sales in their territories. Also, GSK must establish and maintain a financial recoupment program for executives.
Funding History The funding history in the table below includes the budget authority provided to OIG for CMS oversight. The funds displayed are provided to OIG through a number of sources, including HCFAC Mandatory; HCFAC Discretionary Allocation Adjustment; and HCFAC Collections and specifically for Medicaid oversight provided through the DRA, the Supplemental Appropriations Act of 2008, and the Recovery Act.
FY CMS Oversight 2010 $239,351,000 2011 239,728,000 2012 237,764,000 2013 311,639,0001 2014 $319,820,000
Budget Request2 As indicated in the “Accomplishments” sections of this document, OIG’s efforts hold individuals and entities accountable through criminal and civil actions and exclusions while providing HHS policymakers, program officials, and the Congress with recommendations for improving the health care system through audits and evaluations.
1 For 2014, the Budget proposes to continue to provide $311 million for CMS, OIG, and DOJ through discretionary appropriations. The Budget also proposes to provide a dedicated, dependable source of additional mandatory funding beginning in FY 2013. OIG’s allocation of this adjustment is described in this section. 2 This section includes funding estimates for all OIG CMS oversight activities. All of OIG’s CMS oversight funding is mandatory, except for the HCFAC Discretionary Allocation Adjustment.
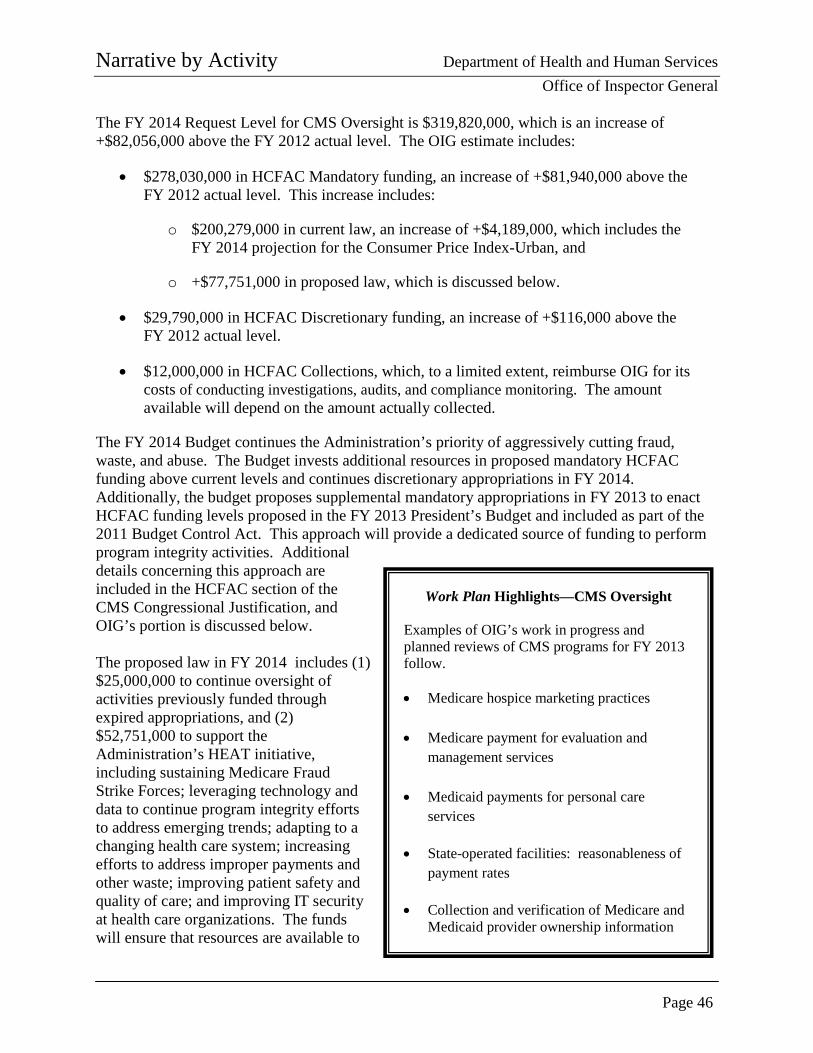
Narrative by Activity Department of Health and Human Services Office of Inspector General
Page 46
The FY 2014 Request Level for CMS Oversight is $319,820,000, which is an increase of +$82,056,000 above the FY 2012 actual level. The OIG estimate includes:
• $278,030,000 in HCFAC Mandatory funding, an increase of +$81,940,000 above the FY 2012 actual level. This increase includes:
o $200,279,000 in current law, an increase of +$4,189,000, which includes the FY 2014 projection for the Consumer Price Index-Urban, and
o +$77,751,000 in proposed law, which is discussed below.
• $29,790,000 in HCFAC Discretionary funding, an increase of +$116,000 above the FY 2012 actual level.
• $12,000,000 in HCFAC Collections, which, to a limited extent, reimburse OIG for its costs of conducting investigations, audits, and compliance monitoring. The amount available will depend on the amount actually collected.
The FY 2014 Budget continues the Administration’s priority of aggressively cutting fraud, waste, and abuse. The Budget invests additional resources in proposed mandatory HCFAC funding above current levels and continues discretionary appropriations in FY 2014. Additionally, the budget proposes supplemental mandatory appropriations in FY 2013 to enact HCFAC funding levels proposed in the FY 2013 President’s Budget and included as part of the 2011 Budget Control Act. This approach will provide a dedicated source of funding to perform program integrity activities. Additional details concerning this approach are included in the HCFAC section of the CMS Congressional Justification, and OIG’s portion is discussed below. The proposed law in FY 2014 includes (1) $25,000,000 to continue oversight of activities previously funded through expired appropriations, and (2) $52,751,000 to support the Administration’s HEAT initiative, including sustaining Medicare Fraud Strike Forces; leveraging technology and data to continue program integrity efforts to address emerging trends; adapting to a changing health care system; increasing efforts to address improper payments and other waste; improving patient safety and quality of care; and improving IT security at health care organizations. The funds will ensure that resources are available to
Work Plan Highlights—CMS Oversight
Examples of OIG’s work in progress and planned reviews of CMS programs for FY 2013 follow. • Medicare hospice marketing practices
• Medicare payment for evaluation and
management services
• Medicaid payments for personal care services
• State-operated facilities: reasonableness of
payment rates
• Collection and verification of Medicare and Medicaid provider ownership information
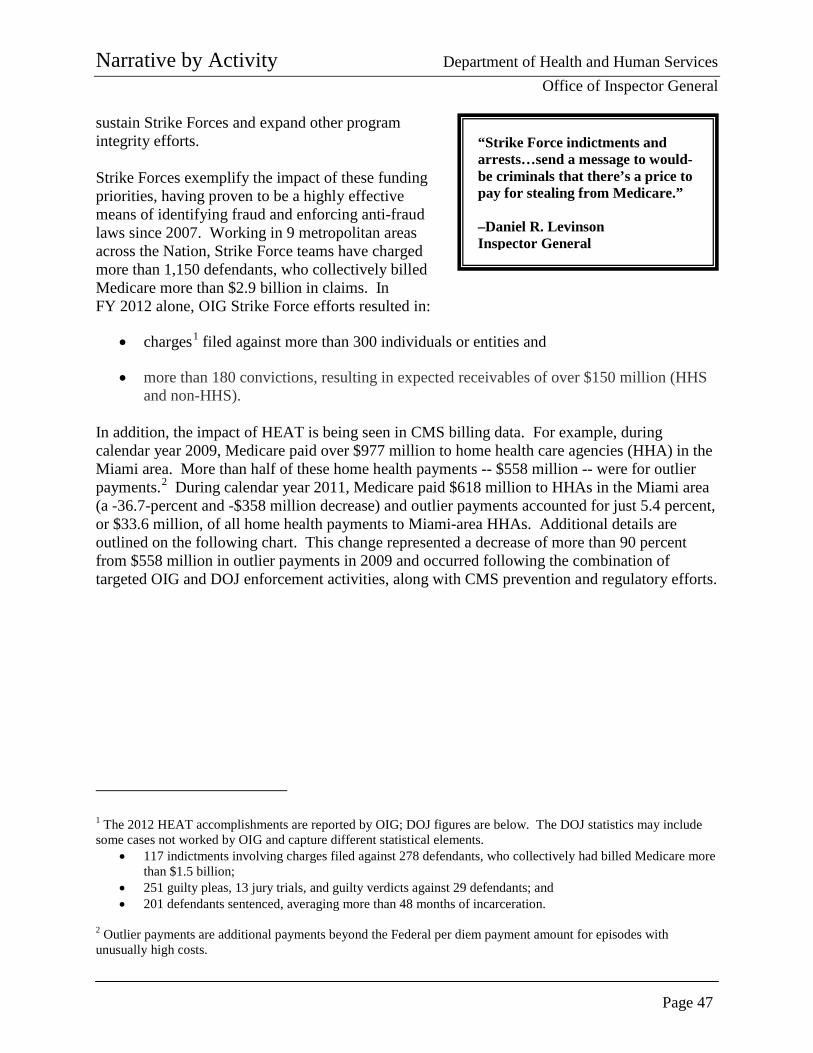
Narrative by Activity Department of Health and Human Services Office of Inspector General
Page 47
sustain Strike Forces and expand other program integrity efforts. Strike Forces exemplify the impact of these funding priorities, having proven to be a highly effective means of identifying fraud and enforcing anti-fraud laws since 2007. Working in 9 metropolitan areas across the Nation, Strike Force teams have charged more than 1,150 defendants, who collectively billed Medicare more than $2.9 billion in claims. In FY 2012 alone, OIG Strike Force efforts resulted in:
• charges1 filed against more than 300 individuals or entities and
• more than 180 convictions, resulting in expected receivables of over $150 million (HHS and non-HHS).
In addition, the impact of HEAT is being seen in CMS billing data. For example, during calendar year 2009, Medicare paid over $977 million to home health care agencies (HHA) in the Miami area. More than half of these home health payments -- $558 million -- were for outlier payments.2 During calendar year 2011, Medicare paid $618 million to HHAs in the Miami area (a -36.7-percent and -$358 million decrease) and outlier payments accounted for just 5.4 percent, or $33.6 million, of all home health payments to Miami-area HHAs. Additional details are outlined on the following chart. This change represented a decrease of more than 90 percent from $558 million in outlier payments in 2009 and occurred following the combination of targeted OIG and DOJ enforcement activities, along with CMS prevention and regulatory efforts.
1 The 2012 HEAT accomplishments are reported by OIG; DOJ figures are below. The DOJ statistics may include some cases not worked by OIG and capture different statistical elements.
• 117 indictments involving charges filed against 278 defendants, who collectively had billed Medicare more than $1.5 billion;
• 251 guilty pleas, 13 jury trials, and guilty verdicts against 29 defendants; and • 201 defendants sentenced, averaging more than 48 months of incarceration.
2 Outlier payments are additional payments beyond the Federal per diem payment amount for episodes with unusually high costs.
“Strike Force indictments and arrests…send a message to would-be criminals that there’s a price to pay for stealing from Medicare.” –Daniel R. Levinson Inspector General
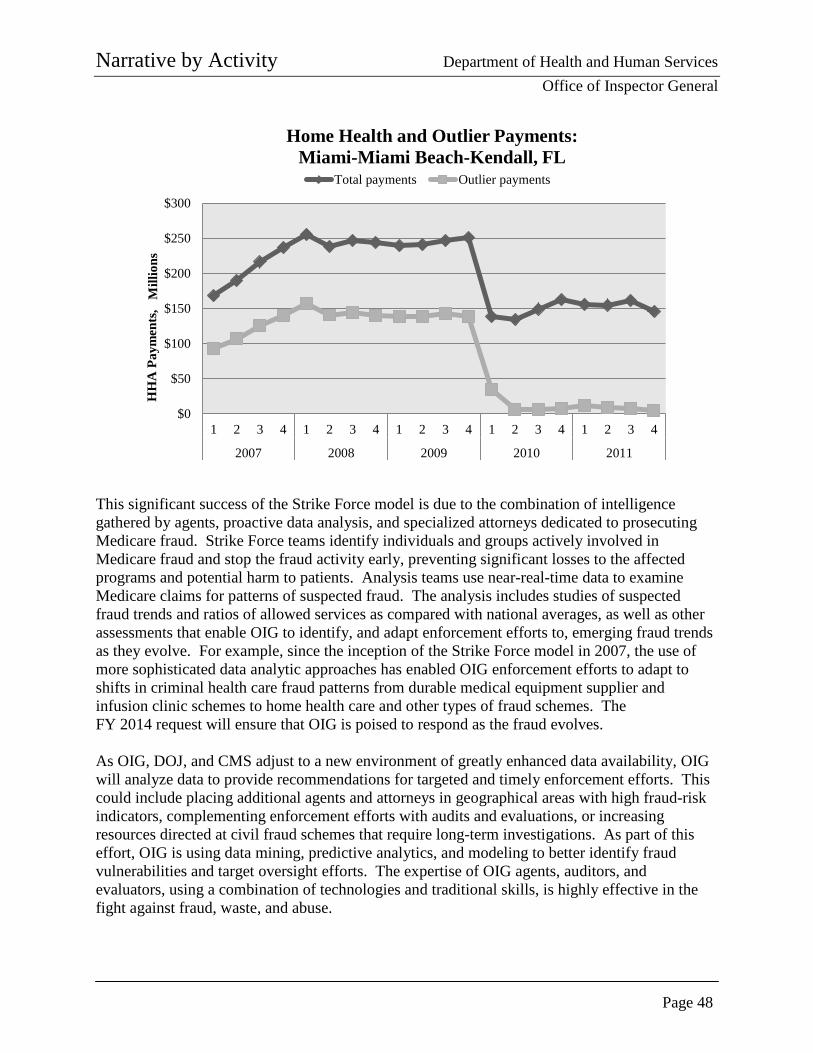
Narrative by Activity Department of Health and Human Services Office of Inspector General
Page 48
This significant success of the Strike Force model is due to the combination of intelligence gathered by agents, proactive data analysis, and specialized attorneys dedicated to prosecuting Medicare fraud. Strike Force teams identify individuals and groups actively involved in Medicare fraud and stop the fraud activity early, preventing significant losses to the affected programs and potential harm to patients. Analysis teams use near-real-time data to examine Medicare claims for patterns of suspected fraud. The analysis includes studies of suspected fraud trends and ratios of allowed services as compared with national averages, as well as other assessments that enable OIG to identify, and adapt enforcement efforts to, emerging fraud trends as they evolve. For example, since the inception of the Strike Force model in 2007, the use of more sophisticated data analytic approaches has enabled OIG enforcement efforts to adapt to shifts in criminal health care fraud patterns from durable medical equipment supplier and infusion clinic schemes to home health care and other types of fraud schemes. The FY 2014 request will ensure that OIG is poised to respond as the fraud evolves. As OIG, DOJ, and CMS adjust to a new environment of greatly enhanced data availability, OIG will analyze data to provide recommendations for targeted and timely enforcement efforts. This could include placing additional agents and attorneys in geographical areas with high fraud-risk indicators, complementing enforcement efforts with audits and evaluations, or increasing resources directed at civil fraud schemes that require long-term investigations. As part of this effort, OIG is using data mining, predictive analytics, and modeling to better identify fraud vulnerabilities and target oversight efforts. The expertise of OIG agents, auditors, and evaluators, using a combination of technologies and traditional skills, is highly effective in the fight against fraud, waste, and abuse.
$0
$50
$100
$150
$200
$250
$300
1 2 3 4 1 2 3 4 1 2 3 4 1 2 3 4 1 2 3 4
2007 2008 2009 2010 2011
HH
A P
aym
ents
, M
illio
ns
Home Health and Outlier Payments: Miami-Miami Beach-Kendall, FL
Total payments Outlier payments
Narrative by Activity Department of Health and Human Services Office of Inspector General
Page 49
In addition to Medicare Fraud Strike Force efforts and other investigative efforts, possible issues and areas of oversight to be considered for 2014 include the following:
• Leveraging Technology and Data To Continue Program Integrity Efforts and Address Emerging Trends: Advances in data analysis have changed the way OIG investigates health care fraud and significantly reduced the time from investigation to indictment. However, health care fraud itself has become more sophisticated, as criminals use advances in technology, including electronic health records, to their advantage. Evidence collection is moving increasingly away from paper files to an unprecedented amount of electronic evidence to be seized and analyzed. As such, there is an increasing demand for forensic enhancements to more effectively analyze investigative data. Advances in data analysis have the potential to provide OIG, and its law enforcement partners, with more leads to investigate than ever before. It is anticipated that advances in OIG’s efforts in this area, along with those of CMS, through its Fraud Prevention System, will make it imperative that OIG have the resources needed to analyze data and to investigate allegations of fraud.
One example of recent work on using data to analyze trends and possible program vulnerabilities involves CMS payments for evaluation and management (E/M) services. Between 2001 and 2010, Medicare payments for Part B items and services increased by 43 percent, from $77 billion to $110 billion. During this same time, Medicare payments for E/M services increased by 48 percent, from $22.7 billion to $33.5 billion. E/M services have been vulnerable to fraud and abuse. In 2009, two health care entities paid over $10 million to settle allegations that they fraudulently billed Medicare for E/M services. CMS also found that certain types of E/M services had the most improper payments of all Medicare Part B service types in 2008. While this study did not determine whether these E/M claims were inappropriate, recommendations were made to CMS to address the potential vulnerabilities.
• Adapting the Oversight Approach to a Changing Health Care System: Changes are
taking place across the health care industry and are fueled by innovations in science and IT, the need to address health care spending, the shift from volume-based to value-based payment, advances in quality measurement, and increasing access to care. Others changes include growth in Medicaid enrollment, an emphasis on coordinated care, and an increased use of electronic health records. OIG will need to adopt oversight approaches that are suited to an increasingly sophisticated health care system and that are tailored to protect programs and patients from existing and new vulnerabilities.
• Identifying Questionable Billing and Reducing Improper Payments: OIG continues to
conduct targeted reviews to determine the scope of improper payments and areas of questionable billing for specific service types and recommend actions to improve program safeguards. By reviewing billing data, medical records, and other documentation associated with claims, OIG identifies services that are questionable, undocumented, not medically necessary, or incorrectly coded, as well as duplicate
Narrative by Activity Department of Health and Human Services Office of Inspector General
Page 50
payments and payments for services that were not provided. In doing so, OIG uncovers payment vulnerabilities and makes recommendations to address them.
One example of work in uncovering payment vulnerabilities is OIG’s report on retail pharmacies with questionable Part D billings. In 2009, retail pharmacies each billed Part D an average of nearly $1 million for prescriptions. Over 2,600 of these pharmacies had questionable billing. These pharmacies had extremely high billing for at least one of the eight measures we developed. For example, many pharmacies billed extremely high dollar amounts or numbers of prescriptions per beneficiary or per prescriber. This could mean that a pharmacy is billing for drugs that are not medically necessary or were never provided to the beneficiary. Although some of this billing may be legitimate, pharmacies that bill for extremely high amounts warrant further scrutiny. The Miami, Los Angeles, and Detroit areas were the most likely to have pharmacies with questionable billing. On the topic of drug diversion in both Part D and Medicaid, OIG has seen a significant increase in its investigative caseload in FY 2012. These cases range from drug-seeking beneficiaries to large-scale criminal enterprises engaged in high-dollar drug trafficking. HEAT and Strike Force efforts have also increased in this area. As a result, an increased caseload, continued use of Strike Force resources, and proactive data analysis of drug diversion activity is expected in the coming fiscal year and beyond.
• Improving Patient Safety and Quality of Care: The challenge of ensuring that
beneficiaries receive quality health care has many dimensions, including overseeing providers’ compliance with quality-of-care standards, ensuring patient safety, and identifying opportunities for improvements in quality of care. OIG work in this area includes:
o examining nursing facilities’ compliance with selected Federal requirements for
quality of care and
o reviewing the extent to which Medicaid-enrolled children are prescribed atypical antipsychotic drugs.
• Improving IT Security at Health Care Organizations: The challenge of ensuring that
health care organizations have adequate IT security to protect their systems and sensitive data is an ongoing endeavor. OIG work in this area includes reviews at hospitals and Medicare, Medicaid, and Part D providers.
“Medically unnecessary services are particularly concerning as beneficiaries may be subjected to tests and treatments that serve no purpose and may even cause harm.” —Daniel R. Levinson Inspector General
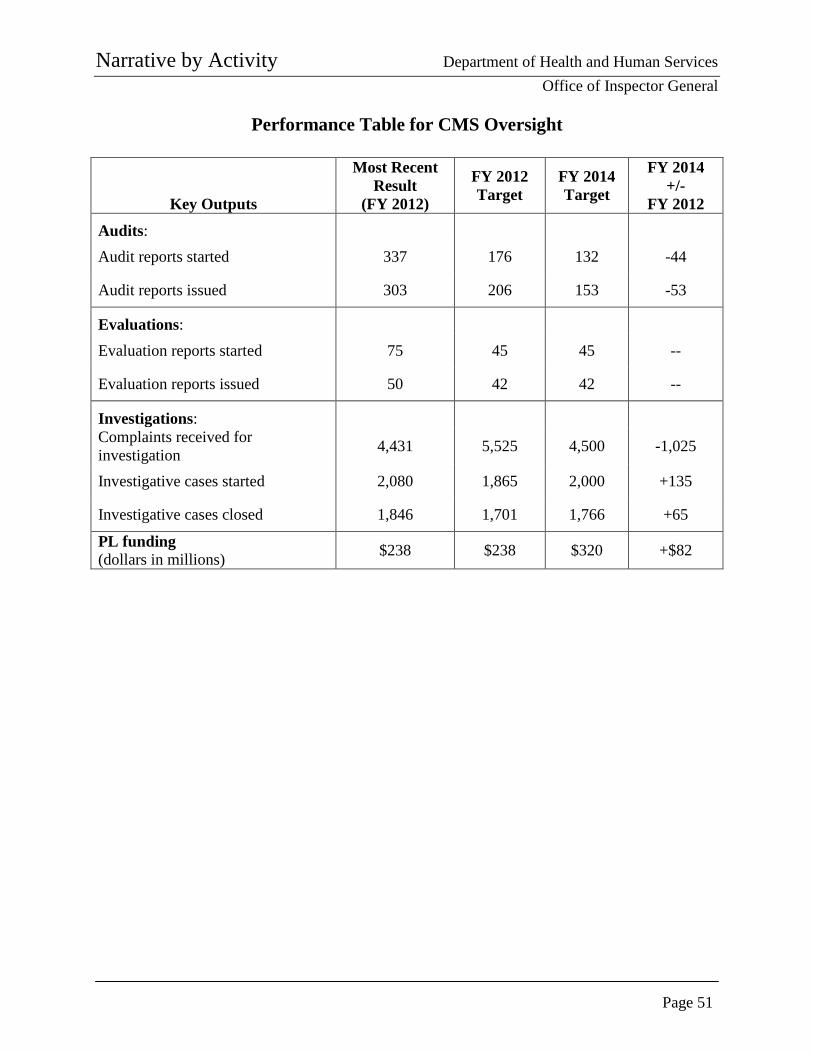
Narrative by Activity Department of Health and Human Services Office of Inspector General
Page 51
Performance Table for CMS Oversight
Key Outputs
Most Recent Result
(FY 2012)
FY 2012 Target
FY 2014 Target
FY 2014 +/-
FY 2012
Audits: Audit reports started 337 176 132 -44
Audit reports issued 303 206 153 -53
Evaluations: Evaluation reports started 75 45 45 --
Evaluation reports issued 50 42 42 --
Investigations: Complaints received for investigation 4,431 5,525 4,500 -1,025
Investigative cases started 2,080 1,865 2,000 +135
Investigative cases closed 1,846 1,701 1,766 +65
PL funding (dollars in millions) $238 $238 $320 +$82
Narrative by Activity Department of Health and Human Services Office of Inspector General
Page 52
PAGE INTENTIONALLY LEFT BLANK
Supplementary Tables Department of Health and Human Services
Office of Inspector General
Page 53
Total Object Class (Dollars in Thousands)
FY 2012 Actual
FY 2014 Pres. Bud.
Increase or Decrease
Obligations Personnel compensation:
Full-time permanent (11.1) ......................................... $169,195 $196,718 +27,744
Other than full-time permanent (11.3) ........................ 5,391 6,850 +1,458
Other personnel compensation (11.5) ......................... 2,084 2,879 +794 Military personnel (11.7) ............................................ -- -- -- Special personnel services payments (11.8) ............... 47 46 -1
Subtotal, Personnel ............................................... 176,717 206,492 +29,775 Civilian benefits (12.1) ................................................... 59,736 67,721 +7,985 Military benefits (12.2) ................................................... -- -- -- Benefits to former personnel (13.0) ................................ -- -- --
Subtotal, Pay Costs1 .............................................. 236,453 274,213 +37,760 Travel and transportation of persons (21.0) .................... 8,626 11,844 +3,218 Transportation of things (22.0) ....................................... 2,808 4,785 +1,976 Rental payments to GSA (23.1) ...................................... 20,482 25,726 +5,244 Rental payments to others (23.2) .................................... 6 -- -6 Communication, utilities, and misc. charges (23.3) ........ 4,445 4,254 -191 Printing and reproduction (24.0) ..................................... 101 108 +7 Other contractual services: --
Advisory and assistance services (25.1) ..................... 1 2 +1 Other services (25.2) ................................................... 19,411 25,567 +6,157 Purchase of goods and services from Government accounts (25.3) .........................................................
24,257
43,007
+18,750
Operation and maintenance of facilities (25.4) ........... 5,165 10,748 +5,583 Research and development contracts (25.5) ............... -- -- --
Medical care (25.6) ..................................................... 8 11 +3 Operation and maintenance of equipment (25.7) ........ 2,486 3,346 +861 Subsistence and support of persons (25.8) .................. -- -- --
Subtotal, Other Contractual Services ................. 51,329 82,682 +31,553 Supplies and materials (26.0) .......................................... 2,883 6,987 +4,104 Equipment (31.0) ............................................................ 5,749 11,582 +5,833 Land and structures (32.0) .............................................. -- -- -- Investments and loans (33.0) .......................................... -- -- -- Grants, subsidies, and contributions (41.0) ..................... -- -- -- Insurance claims and indemnities (42.0) ........................ 72 87 +15 Receipts (61.0) ................................................................ -- -- --
Subtotal, Nonpay Costs ........................................ 96,501 148,054 +51,553 Total, Obligations by Object Class .............................. $332,953 $422,267 +$89,313
Note: Numbers, as displayed in all object class tables, may not add to totals because of rounding.
1 Total for each year includes funds for one PCA. For each FY, $24,000 is included for the PCA payment. Additional details can be found on page 28.

Supplementary Tables Department of Health and Human Services
Office of Inspector General
Page 54
PHHS Oversight Object Class (Dollars in Thousands)
FY 2012 Actual
FY 2014 Pres. Bud.
Increase or Decrease
Obligations Personnel compensation:
Full-time permanent (11.1) ......................................... $26,800 $34,369 +$7,570 Other than full-time permanent (11.3) ........................ 89 1,140 +251 Other personnel compensation (11.5) ......................... 358 460 +101 Military personnel (11.7) ............................................ -- -- -- Special personnel services payments (11.8) ............... 15 20 +4
Subtotal, Personnel ............................................... 28,062 35,988 +7,926 Civilian benefits (12.1) ................................................... 9,514 12,202 +2,687 Military benefits (12.2) ................................................... -- -- -- Benefits to former personnel (13.0) ................................ -- -- --
Subtotal, Pay Costs ............................................... 37,576 48,190 +10,614 Travel and transportation of persons (21.0) .................... 1,278 2,321 +1,043 Transportation of things (22.0) ....................................... 436 552 +116 Rental payments to GSA (23.1) ...................................... 2,531 3,317 +786 Rental payments to others (23.2) .................................... 1 -- -1 Communication, utilities, and misc. charges (23.3) ........ 671 706 +34 Printing and reproduction (24.0) ..................................... 12 18 +6 Other contractual services:
Advisory and assistance services (25.1) ..................... -- -- -- Other services (25.2) ................................................... 1,137 2,579 +1,442 Purchase of goods and services from Government accounts (25.3) ......................................................... 3,481 7,078 +3,598 Operation and maintenance of facilities (25.4) ........... 503 637 +134
Research and development contracts (25.5) ............... -- -- -- Medical care (25.6) ..................................................... 1 2 +1 Operation and maintenance of equipment (25.7) ........ 397 503 +106 Subsistence and support of persons (25.8) .................. -- -- --
Subtotal, Other Contractual Services ................. 5,519 10,799 +5,280 Supplies and materials (26.0) .......................................... 473 598 +126 Equipment (31.0) ............................................................ 918 2,362 +1,445 Land and structures (32.0) .............................................. -- -- -- Investments and loans (33.0) .......................................... -- -- -- Grants, subsidies, and contributions (41.0) ..................... -- -- -- Insurance claims and indemnities (42.0) ........................ 12 15 +3 Receipts (61.0) ................................................................ -- -- --
Subtotal, Nonpay Costs ........................................ 11,851 20,689 +8,838 Total, Obligations by Object Class .............................. $49,427 $68,879 +$19,452
Note: The amounts in this table include only direct discretionary appropriations to OIG for PHHS oversight through the annual appropriations process.
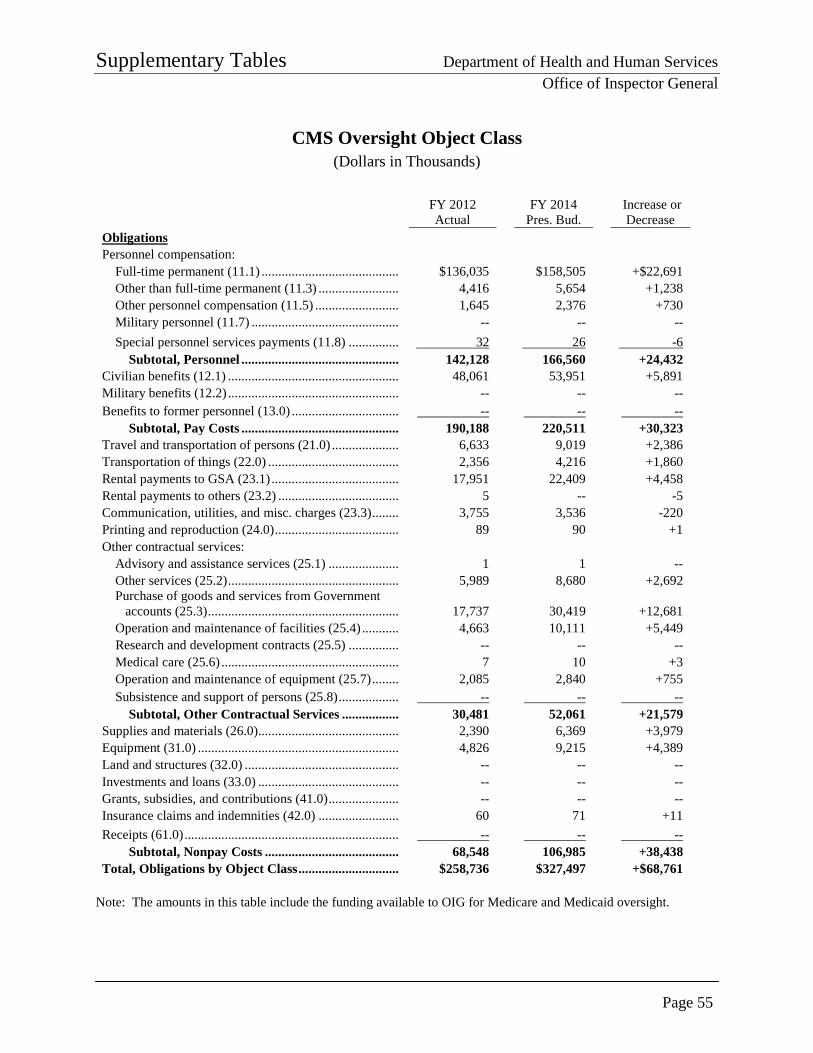
Supplementary Tables Department of Health and Human Services
Office of Inspector General
Page 55
CMS Oversight Object Class (Dollars in Thousands)
FY 2012 Actual
FY 2014 Pres. Bud.
Increase or Decrease
Obligations Personnel compensation:
Full-time permanent (11.1) ......................................... $136,035 $158,505 +$22,691 Other than full-time permanent (11.3) ........................ 4,416 5,654 +1,238 Other personnel compensation (11.5) ......................... 1,645 2,376 +730 Military personnel (11.7) ............................................ -- -- -- Special personnel services payments (11.8) ............... 32 26 -6
Subtotal, Personnel ............................................... 142,128 166,560 +24,432 Civilian benefits (12.1) ................................................... 48,061 53,951 +5,891 Military benefits (12.2) ................................................... -- -- -- Benefits to former personnel (13.0) ................................ -- -- --
Subtotal, Pay Costs ............................................... 190,188 220,511 +30,323 Travel and transportation of persons (21.0) .................... 6,633 9,019 +2,386 Transportation of things (22.0) ....................................... 2,356 4,216 +1,860 Rental payments to GSA (23.1) ...................................... 17,951 22,409 +4,458 Rental payments to others (23.2) .................................... 5 -- -5 Communication, utilities, and misc. charges (23.3) ........ 3,755 3,536 -220 Printing and reproduction (24.0) ..................................... 89 90 +1 Other contractual services:
Advisory and assistance services (25.1) ..................... 1 1 -- Other services (25.2) ................................................... 5,989 8,680 +2,692 Purchase of goods and services from Government accounts (25.3) ......................................................... 17,737 30,419 +12,681 Operation and maintenance of facilities (25.4) ........... 4,663 10,111 +5,449
Research and development contracts (25.5) ............... -- -- -- Medical care (25.6) ..................................................... 7 10 +3 Operation and maintenance of equipment (25.7) ........ 2,085 2,840 +755 Subsistence and support of persons (25.8) .................. -- -- --
Subtotal, Other Contractual Services ................. 30,481 52,061 +21,579 Supplies and materials (26.0) .......................................... 2,390 6,369 +3,979 Equipment (31.0) ............................................................ 4,826 9,215 +4,389 Land and structures (32.0) .............................................. -- -- -- Investments and loans (33.0) .......................................... -- -- -- Grants, subsidies, and contributions (41.0) ..................... -- -- -- Insurance claims and indemnities (42.0) ........................ 60 71 +11 Receipts (61.0) ................................................................ -- -- --
Subtotal, Nonpay Costs ........................................ 68,548 106,985 +38,438 Total, Obligations by Object Class .............................. $258,736 $327,497 +$68,761
Note: The amounts in this table include the funding available to OIG for Medicare and Medicaid oversight.
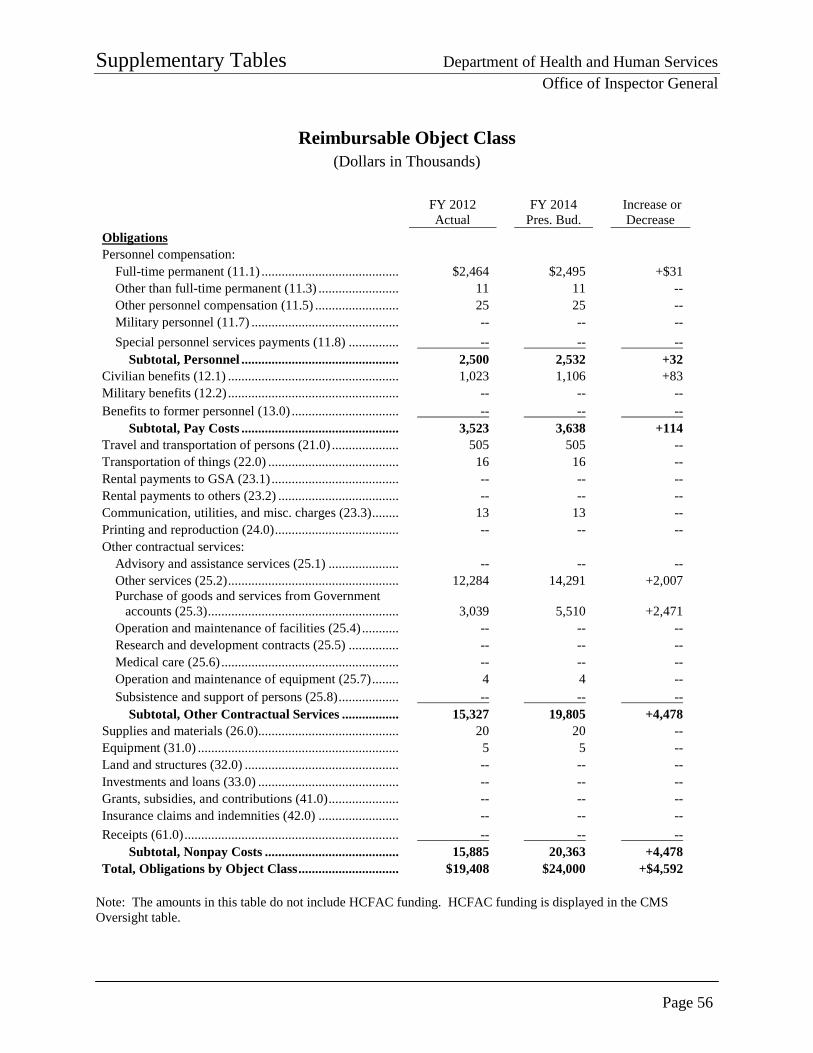
Supplementary Tables Department of Health and Human Services
Office of Inspector General
Page 56
Reimbursable Object Class (Dollars in Thousands)
FY 2012 Actual
FY 2014 Pres. Bud.
Increase or Decrease
Obligations Personnel compensation:
Full-time permanent (11.1) ......................................... $2,464 $2,495 +$31 Other than full-time permanent (11.3) ........................ 11 11 -- Other personnel compensation (11.5) ......................... 25 25 -- Military personnel (11.7) ............................................ -- -- -- Special personnel services payments (11.8) ............... -- -- --
Subtotal, Personnel ............................................... 2,500 2,532 +32 Civilian benefits (12.1) ................................................... 1,023 1,106 +83 Military benefits (12.2) ................................................... -- -- -- Benefits to former personnel (13.0) ................................ -- -- --
Subtotal, Pay Costs ............................................... 3,523 3,638 +114 Travel and transportation of persons (21.0) .................... 505 505 -- Transportation of things (22.0) ....................................... 16 16 -- Rental payments to GSA (23.1) ...................................... -- -- -- Rental payments to others (23.2) .................................... -- -- -- Communication, utilities, and misc. charges (23.3) ........ 13 13 -- Printing and reproduction (24.0) ..................................... -- -- -- Other contractual services:
Advisory and assistance services (25.1) ..................... -- -- -- Other services (25.2) ................................................... 12,284 14,291 +2,007 Purchase of goods and services from Government accounts (25.3) ......................................................... 3,039 5,510 +2,471 Operation and maintenance of facilities (25.4) ........... -- -- --
Research and development contracts (25.5) ............... -- -- -- Medical care (25.6) ..................................................... -- -- -- Operation and maintenance of equipment (25.7) ........ 4 4 -- Subsistence and support of persons (25.8) .................. -- -- --
Subtotal, Other Contractual Services ................. 15,327 19,805 +4,478 Supplies and materials (26.0) .......................................... 20 20 -- Equipment (31.0) ............................................................ 5 5 -- Land and structures (32.0) .............................................. -- -- -- Investments and loans (33.0) .......................................... -- -- -- Grants, subsidies, and contributions (41.0) ..................... -- -- -- Insurance claims and indemnities (42.0) ........................ -- -- -- Receipts (61.0) ................................................................ -- -- --
Subtotal, Nonpay Costs ........................................ 15,885 20,363 +4,478 Total, Obligations by Object Class .............................. $19,408 $24,000 +$4,592
Note: The amounts in this table do not include HCFAC funding. HCFAC funding is displayed in the CMS Oversight table.
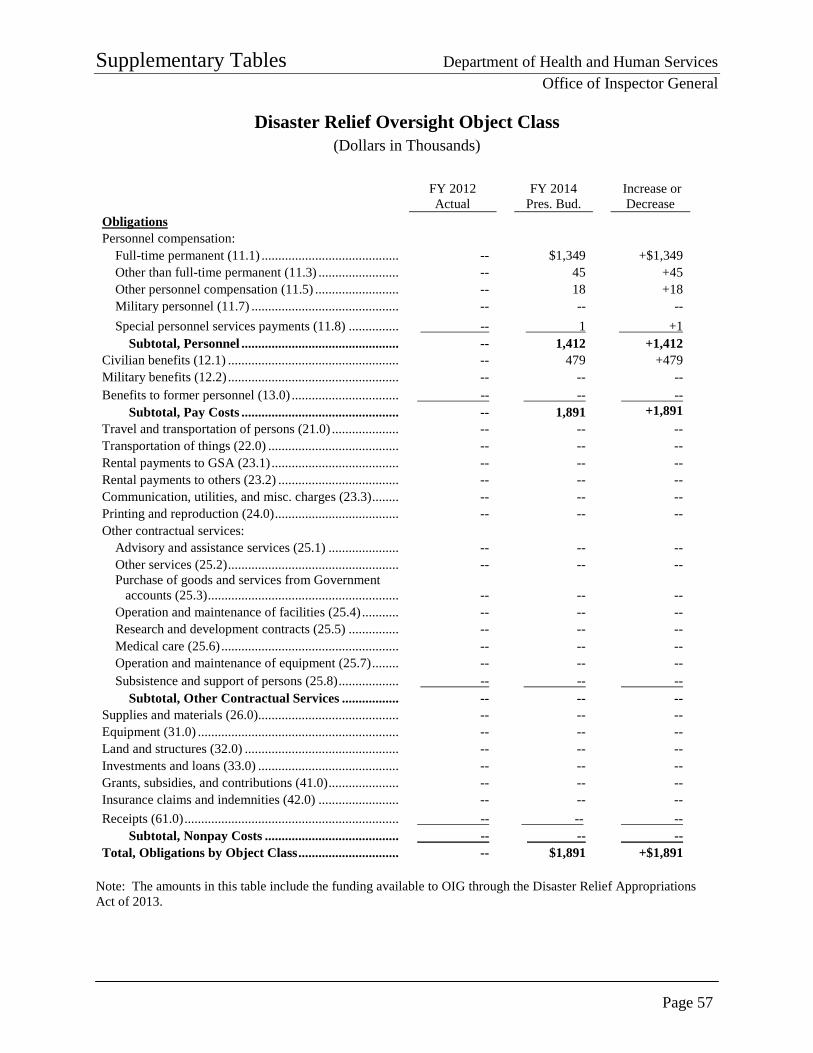
Supplementary Tables Department of Health and Human Services
Office of Inspector General
Page 57
Disaster Relief Oversight Object Class (Dollars in Thousands)
FY 2012 Actual
FY 2014 Pres. Bud.
Increase or Decrease
Obligations Personnel compensation:
Full-time permanent (11.1) ......................................... -- $1,349 +$1,349 Other than full-time permanent (11.3) ........................ -- 45 +45 Other personnel compensation (11.5) ......................... -- 18 +18 Military personnel (11.7) ............................................ -- -- -- Special personnel services payments (11.8) ............... -- 1 +1
Subtotal, Personnel ............................................... -- 1,412 +1,412 Civilian benefits (12.1) ................................................... -- 479 +479 Military benefits (12.2) ................................................... -- -- -- Benefits to former personnel (13.0) ................................ -- -- --
Subtotal, Pay Costs ............................................... -- 1,891 +1,891 Travel and transportation of persons (21.0) .................... -- -- -- Transportation of things (22.0) ....................................... -- -- -- Rental payments to GSA (23.1) ...................................... -- -- -- Rental payments to others (23.2) .................................... -- -- -- Communication, utilities, and misc. charges (23.3) ........ -- -- -- Printing and reproduction (24.0) ..................................... -- -- -- Other contractual services:
Advisory and assistance services (25.1) ..................... -- -- -- Other services (25.2) ................................................... -- -- -- Purchase of goods and services from Government accounts (25.3) ......................................................... -- -- -- Operation and maintenance of facilities (25.4) ........... -- -- --
Research and development contracts (25.5) ............... -- -- -- Medical care (25.6) ..................................................... -- -- -- Operation and maintenance of equipment (25.7) ........ -- -- -- Subsistence and support of persons (25.8) .................. -- -- --
Subtotal, Other Contractual Services ................. -- -- -- Supplies and materials (26.0) .......................................... -- -- -- Equipment (31.0) ............................................................ -- -- -- Land and structures (32.0) .............................................. -- -- -- Investments and loans (33.0) .......................................... -- -- -- Grants, subsidies, and contributions (41.0) ..................... -- -- -- Insurance claims and indemnities (42.0) ........................ -- -- -- Receipts (61.0) ................................................................ -- -- --
Subtotal, Nonpay Costs ........................................ -- -- -- Total, Obligations by Object Class .............................. -- $1,891 +$1,891
Note: The amounts in this table include the funding available to OIG through the Disaster Relief Appropriations Act of 2013.
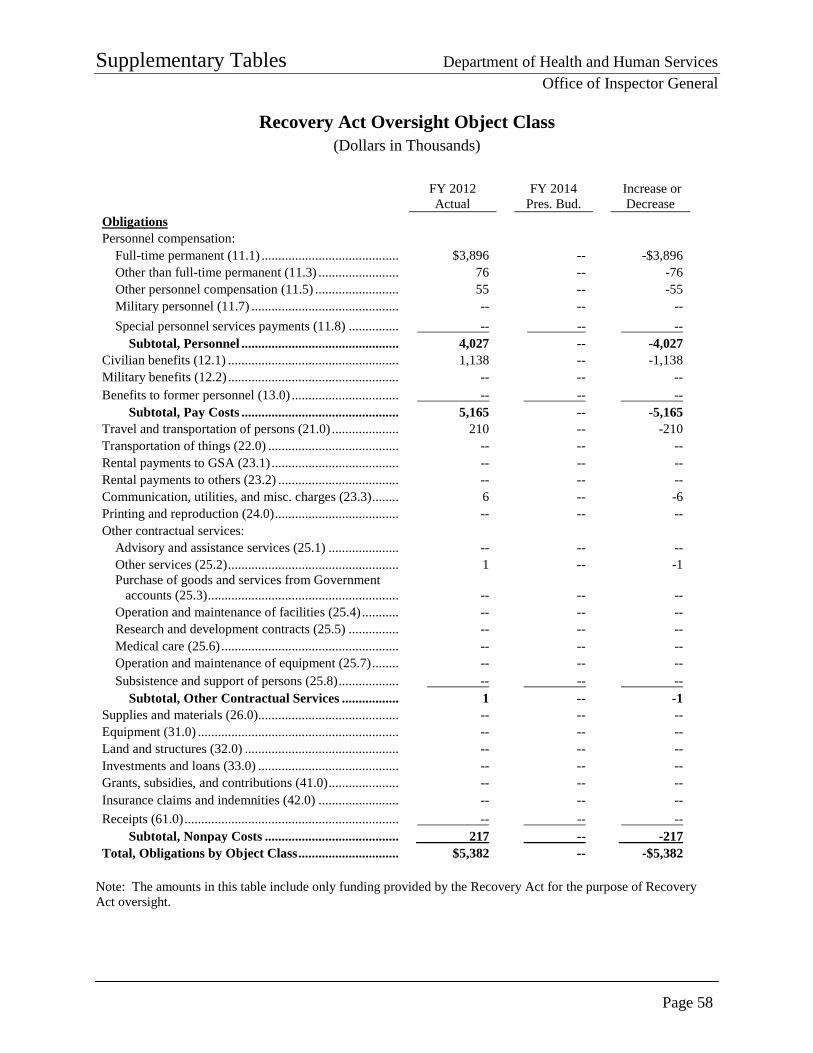
Supplementary Tables Department of Health and Human Services
Office of Inspector General
Page 58
Recovery Act Oversight Object Class (Dollars in Thousands)
FY 2012 Actual
FY 2014 Pres. Bud.
Increase or Decrease
Obligations Personnel compensation:
Full-time permanent (11.1) ......................................... $3,896 -- -$3,896 Other than full-time permanent (11.3) ........................ 76 -- -76 Other personnel compensation (11.5) ......................... 55 -- -55 Military personnel (11.7) ............................................ -- -- -- Special personnel services payments (11.8) ............... -- -- --
Subtotal, Personnel ............................................... 4,027 -- -4,027 Civilian benefits (12.1) ................................................... 1,138 -- -1,138 Military benefits (12.2) ................................................... -- -- -- Benefits to former personnel (13.0) ................................ -- -- --
Subtotal, Pay Costs ............................................... 5,165 -- -5,165 Travel and transportation of persons (21.0) .................... 210 -- -210 Transportation of things (22.0) ....................................... -- -- -- Rental payments to GSA (23.1) ...................................... -- -- -- Rental payments to others (23.2) .................................... -- -- -- Communication, utilities, and misc. charges (23.3) ........ 6 -- -6 Printing and reproduction (24.0) ..................................... -- -- -- Other contractual services:
Advisory and assistance services (25.1) ..................... -- -- -- Other services (25.2) ................................................... 1 -- -1 Purchase of goods and services from Government accounts (25.3) ......................................................... -- -- -- Operation and maintenance of facilities (25.4) ........... -- -- --
Research and development contracts (25.5) ............... -- -- -- Medical care (25.6) ..................................................... -- -- -- Operation and maintenance of equipment (25.7) ........ -- -- -- Subsistence and support of persons (25.8) .................. -- -- --
Subtotal, Other Contractual Services ................. 1 -- -1 Supplies and materials (26.0) .......................................... -- -- -- Equipment (31.0) ............................................................ -- -- -- Land and structures (32.0) .............................................. -- -- -- Investments and loans (33.0) .......................................... -- -- -- Grants, subsidies, and contributions (41.0) ..................... -- -- -- Insurance claims and indemnities (42.0) ........................ -- -- -- Receipts (61.0) ................................................................ -- -- --
Subtotal, Nonpay Costs ........................................ 217 -- -217 Total, Obligations by Object Class .............................. $5,382 -- -$5,382
Note: The amounts in this table include only funding provided by the Recovery Act for the purpose of Recovery Act oversight.
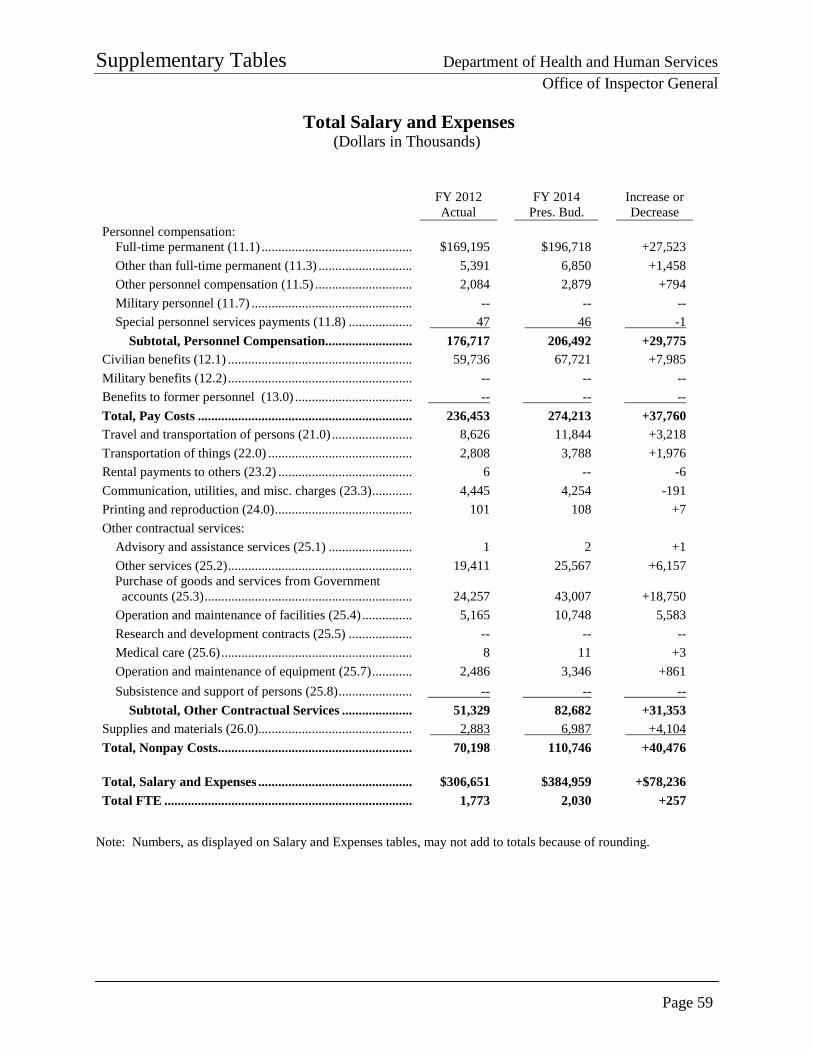
Supplementary Tables Department of Health and Human Services
Office of Inspector General
Page 59
Total Salary and Expenses (Dollars in Thousands)
FY 2012 Actual
FY 2014 Pres. Bud.
Increase or Decrease
Personnel compensation: Full-time permanent (11.1) ............................................. $169,195 $196,718 +27,523 Other than full-time permanent (11.3) ............................ 5,391 6,850 +1,458 Other personnel compensation (11.5) ............................. 2,084 2,879 +794 Military personnel (11.7) ................................................ -- -- -- Special personnel services payments (11.8) ................... 47 46 -1
Subtotal, Personnel Compensation.......................... 176,717 206,492 +29,775 Civilian benefits (12.1) ....................................................... 59,736 67,721 +7,985 Military benefits (12.2) ....................................................... -- -- -- Benefits to former personnel (13.0) ................................... -- -- -- Total, Pay Costs ................................................................ 236,453 274,213 +37,760 Travel and transportation of persons (21.0) ........................ 8,626 11,844 +3,218 Transportation of things (22.0) ........................................... 2,808 3,788 +1,976 Rental payments to others (23.2) ........................................ 6 -- -6 Communication, utilities, and misc. charges (23.3) ............ 4,445 4,254 -191 Printing and reproduction (24.0) ......................................... 101 108 +7 Other contractual services:
Advisory and assistance services (25.1) ......................... 1 2 +1 Other services (25.2) ....................................................... 19,411 25,567 +6,157
Purchase of goods and services from Government accounts (25.3) .............................................................. 24,257 43,007 +18,750 Operation and maintenance of facilities (25.4) ............... 5,165 10,748 5,583 Research and development contracts (25.5) ................... -- -- -- Medical care (25.6) ......................................................... 8 11 +3 Operation and maintenance of equipment (25.7) ............ 2,486 3,346 +861 Subsistence and support of persons (25.8) ...................... -- -- --
Subtotal, Other Contractual Services ..................... 51,329 82,682 +31,353 Supplies and materials (26.0).............................................. 2,883 6,987 +4,104 Total, Nonpay Costs.......................................................... 70,198 110,746 +40,476 Total, Salary and Expenses .............................................. $306,651 $384,959 +$78,236 Total FTE .......................................................................... 1,773 2,030 +257
Note: Numbers, as displayed on Salary and Expenses tables, may not add to totals because of rounding.
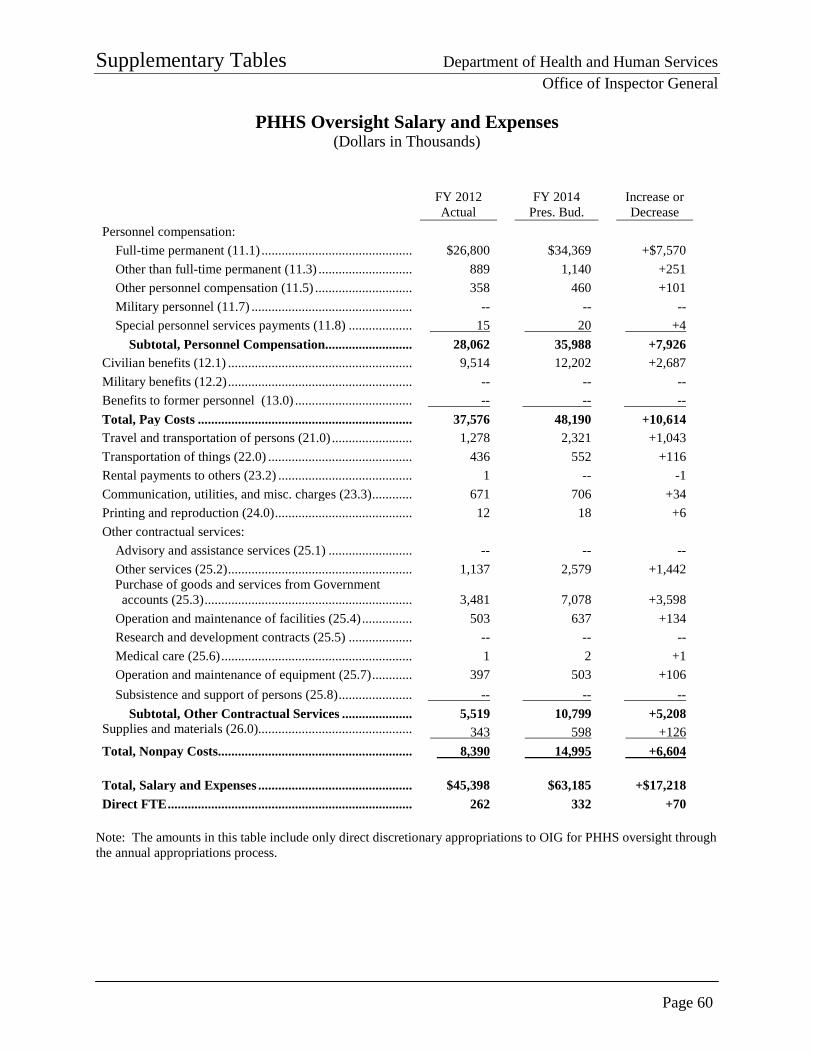
Supplementary Tables Department of Health and Human Services
Office of Inspector General
Page 60
PHHS Oversight Salary and Expenses (Dollars in Thousands)
FY 2012 Actual
FY 2014 Pres. Bud.
Increase or Decrease
Personnel compensation: Full-time permanent (11.1) ............................................. $26,800 $34,369 +$7,570 Other than full-time permanent (11.3) ............................ 889 1,140 +251 Other personnel compensation (11.5) ............................. 358 460 +101 Military personnel (11.7) ................................................ -- -- -- Special personnel services payments (11.8) ................... 15 20 +4
Subtotal, Personnel Compensation.......................... 28,062 35,988 +7,926 Civilian benefits (12.1) ....................................................... 9,514 12,202 +2,687 Military benefits (12.2) ....................................................... -- -- -- Benefits to former personnel (13.0) ................................... -- -- -- Total, Pay Costs ................................................................ 37,576 48,190 +10,614 Travel and transportation of persons (21.0) ........................ 1,278 2,321 +1,043 Transportation of things (22.0) ........................................... 436 552 +116 Rental payments to others (23.2) ........................................ 1 -- -1 Communication, utilities, and misc. charges (23.3) ............ 671 706 +34 Printing and reproduction (24.0) ......................................... 12 18 +6 Other contractual services:
Advisory and assistance services (25.1) ......................... -- -- -- Other services (25.2) ....................................................... 1,137 2,579 +1,442
Purchase of goods and services from Government accounts (25.3) .............................................................. 3,481 7,078
+3,598
Operation and maintenance of facilities (25.4) ............... 503 637 +134 Research and development contracts (25.5) ................... -- -- -- Medical care (25.6) ......................................................... 1 2 +1 Operation and maintenance of equipment (25.7) ............ 397 503 +106 Subsistence and support of persons (25.8) ...................... -- -- --
Subtotal, Other Contractual Services ..................... 5,519 10,799 +5,208 Supplies and materials (26.0).............................................. 343 598 +126 Total, Nonpay Costs.......................................................... 8,390 14,995 +6,604 Total, Salary and Expenses .............................................. $45,398 $63,185 +$17,218 Direct FTE ......................................................................... 262 332 +70
Note: The amounts in this table include only direct discretionary appropriations to OIG for PHHS oversight through the annual appropriations process.
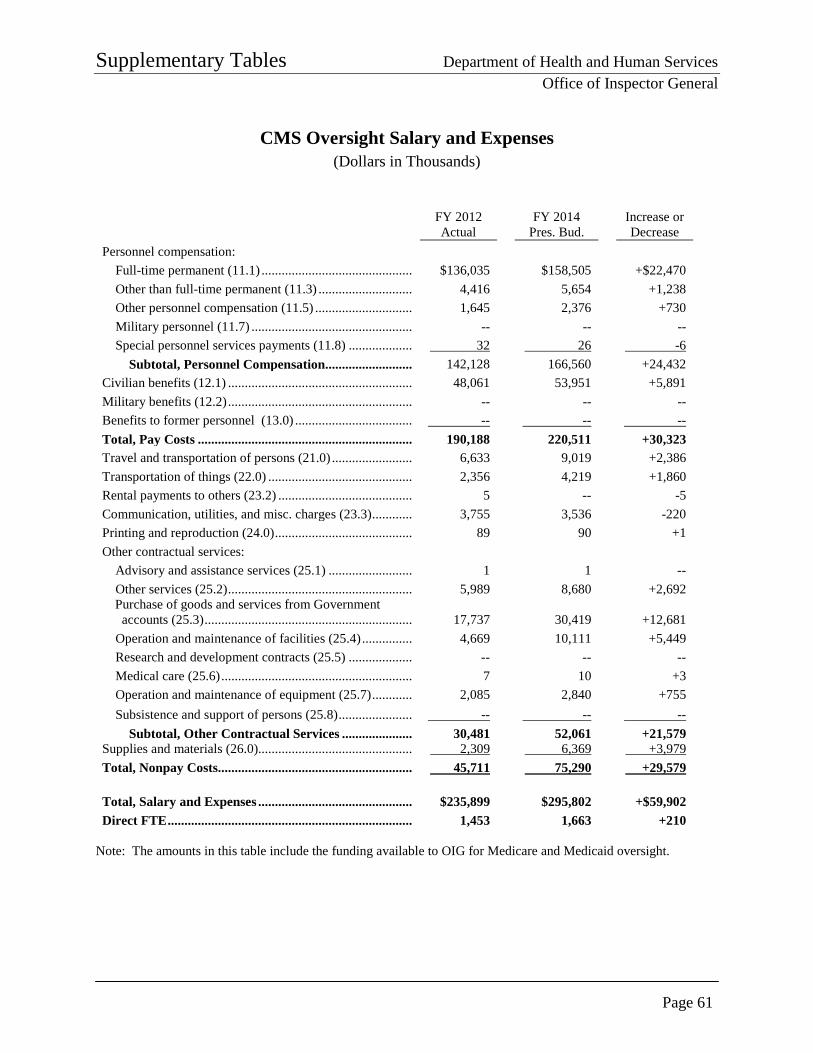
Supplementary Tables Department of Health and Human Services
Office of Inspector General
Page 61
CMS Oversight Salary and Expenses (Dollars in Thousands)
FY 2012 Actual
FY 2014 Pres. Bud.
Increase or Decrease
Personnel compensation: Full-time permanent (11.1) ............................................. $136,035 $158,505 +$22,470 Other than full-time permanent (11.3) ............................ 4,416 5,654 +1,238 Other personnel compensation (11.5) ............................. 1,645 2,376 +730 Military personnel (11.7) ................................................ -- -- -- Special personnel services payments (11.8) ................... 32 26 -6
Subtotal, Personnel Compensation.......................... 142,128 166,560 +24,432 Civilian benefits (12.1) ....................................................... 48,061 53,951 +5,891 Military benefits (12.2) ....................................................... -- -- -- Benefits to former personnel (13.0) ................................... -- -- -- Total, Pay Costs ................................................................ 190,188 220,511 +30,323 Travel and transportation of persons (21.0) ........................ 6,633 9,019 +2,386 Transportation of things (22.0) ........................................... 2,356 4,219 +1,860 Rental payments to others (23.2) ........................................ 5 -- -5 Communication, utilities, and misc. charges (23.3) ............ 3,755 3,536 -220 Printing and reproduction (24.0) ......................................... 89 90 +1 Other contractual services:
Advisory and assistance services (25.1) ......................... 1 1 -- Other services (25.2) ....................................................... 5,989 8,680 +2,692
Purchase of goods and services from Government accounts (25.3) .............................................................. 17,737 30,419 +12,681 Operation and maintenance of facilities (25.4) ............... 4,669 10,111 +5,449 Research and development contracts (25.5) ................... -- -- -- Medical care (25.6) ......................................................... 7 10 +3 Operation and maintenance of equipment (25.7) ............ 2,085 2,840 +755 Subsistence and support of persons (25.8) ...................... -- -- --
Subtotal, Other Contractual Services ..................... 30,481 52,061 +21,579 Supplies and materials (26.0).............................................. 2,309 6,369 +3,979 Total, Nonpay Costs.......................................................... 45,711 75,290 +29,579 Total, Salary and Expenses .............................................. $235,899 $295,802 +$59,902 Direct FTE ......................................................................... 1,453 1,663 +210
Note: The amounts in this table include the funding available to OIG for Medicare and Medicaid oversight.
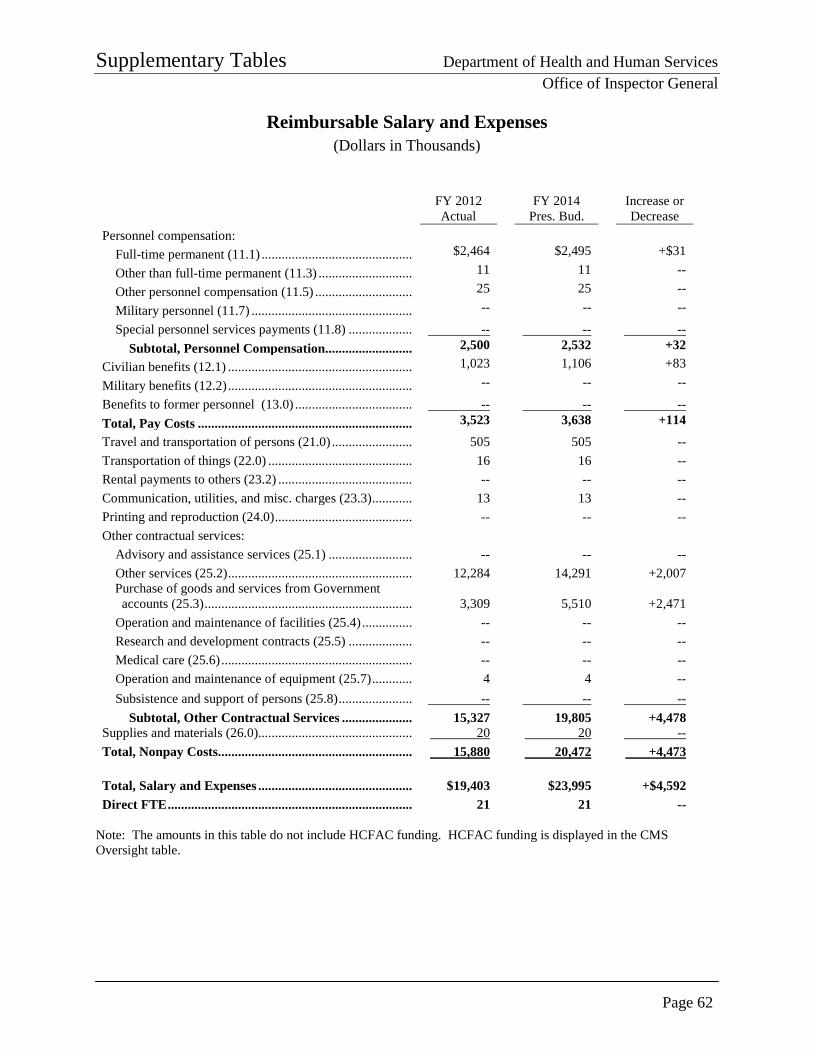
Supplementary Tables Department of Health and Human Services
Office of Inspector General
Page 62
Reimbursable Salary and Expenses (Dollars in Thousands)
FY 2012 Actual
FY 2014 Pres. Bud.
Increase or Decrease
Personnel compensation: Full-time permanent (11.1) ............................................. $2,464 $2,495 +$31
Other than full-time permanent (11.3) ............................ 11 11 --
Other personnel compensation (11.5) ............................. 25 25 --
Military personnel (11.7) ................................................ -- -- --
Special personnel services payments (11.8) ................... -- -- -- Subtotal, Personnel Compensation.......................... 2,500 2,532 +32
Civilian benefits (12.1) ....................................................... 1,023 1,106 +83
Military benefits (12.2) ....................................................... -- -- --
Benefits to former personnel (13.0) ................................... -- -- -- Total, Pay Costs ................................................................ 3,523 3,638 +114 Travel and transportation of persons (21.0) ........................ 505 505 -- Transportation of things (22.0) ........................................... 16 16 -- Rental payments to others (23.2) ........................................ -- -- -- Communication, utilities, and misc. charges (23.3) ............ 13 13 -- Printing and reproduction (24.0) ......................................... -- -- -- Other contractual services:
Advisory and assistance services (25.1) ......................... -- -- -- Other services (25.2) ....................................................... 12,284 14,291 +2,007
Purchase of goods and services from Government accounts (25.3) .............................................................. 3,309 5,510 +2,471 Operation and maintenance of facilities (25.4) ............... -- -- -- Research and development contracts (25.5) ................... -- -- -- Medical care (25.6) ......................................................... -- -- -- Operation and maintenance of equipment (25.7) ............ 4 4 -- Subsistence and support of persons (25.8) ...................... -- -- --
Subtotal, Other Contractual Services ..................... 15,327 19,805 +4,478 Supplies and materials (26.0).............................................. 20 20 -- Total, Nonpay Costs.......................................................... 15,880 20,472 +4,473 Total, Salary and Expenses .............................................. $19,403 $23,995 +$4,592 Direct FTE ......................................................................... 21 21 --
Note: The amounts in this table do not include HCFAC funding. HCFAC funding is displayed in the CMS Oversight table.
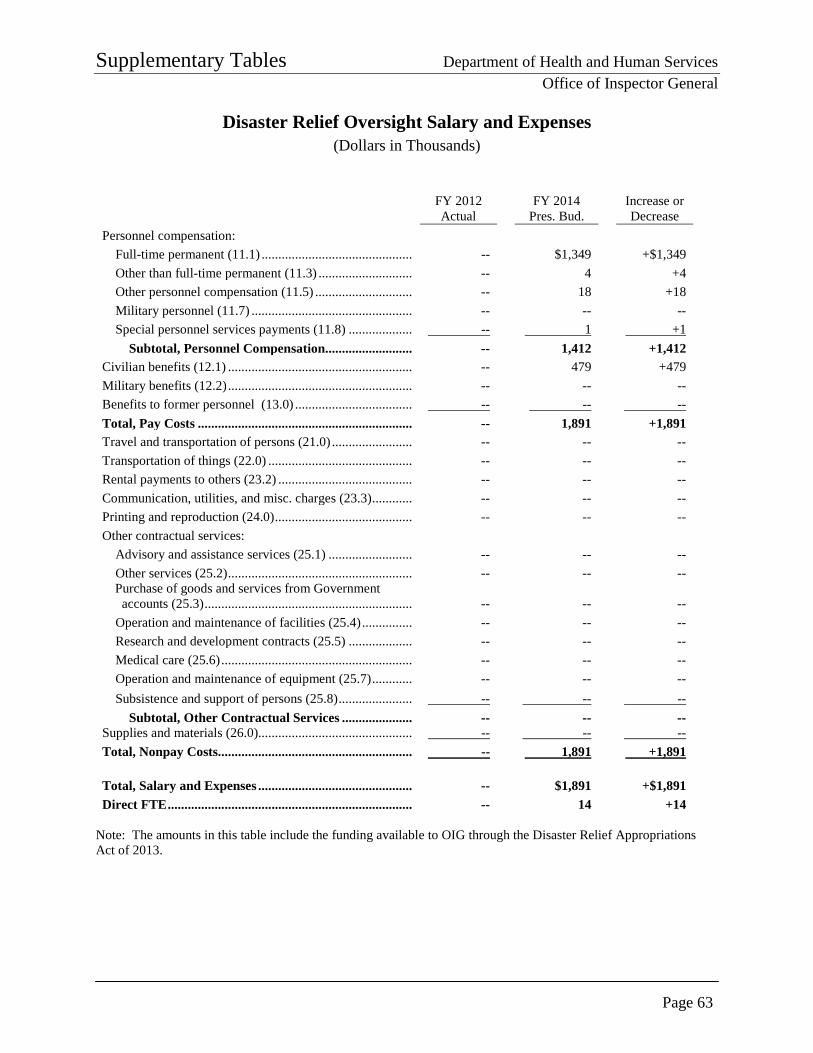
Supplementary Tables Department of Health and Human Services
Office of Inspector General
Page 63
Disaster Relief Oversight Salary and Expenses (Dollars in Thousands)
FY 2012 Actual
FY 2014 Pres. Bud.
Increase or Decrease
Personnel compensation: Full-time permanent (11.1) ............................................. -- $1,349 +$1,349 Other than full-time permanent (11.3) ............................ -- 4 +4 Other personnel compensation (11.5) ............................. -- 18 +18 Military personnel (11.7) ................................................ -- -- -- Special personnel services payments (11.8) ................... -- 1 +1
Subtotal, Personnel Compensation.......................... -- 1,412 +1,412 Civilian benefits (12.1) ....................................................... -- 479 +479 Military benefits (12.2) ....................................................... -- -- -- Benefits to former personnel (13.0) ................................... -- -- -- Total, Pay Costs ................................................................ -- 1,891 +1,891 Travel and transportation of persons (21.0) ........................ -- -- -- Transportation of things (22.0) ........................................... -- -- -- Rental payments to others (23.2) ........................................ -- -- -- Communication, utilities, and misc. charges (23.3) ............ -- -- -- Printing and reproduction (24.0) ......................................... -- -- -- Other contractual services:
Advisory and assistance services (25.1) ......................... -- -- -- Other services (25.2) ....................................................... -- -- --
Purchase of goods and services from Government accounts (25.3) .............................................................. -- -- -- Operation and maintenance of facilities (25.4) ............... -- -- -- Research and development contracts (25.5) ................... -- -- -- Medical care (25.6) ......................................................... -- -- -- Operation and maintenance of equipment (25.7) ............ -- -- -- Subsistence and support of persons (25.8) ...................... -- -- --
Subtotal, Other Contractual Services ..................... -- -- -- Supplies and materials (26.0).............................................. -- -- -- Total, Nonpay Costs.......................................................... -- 1,891 +1,891 Total, Salary and Expenses .............................................. -- $1,891 +$1,891 Direct FTE ......................................................................... -- 14 +14
Note: The amounts in this table include the funding available to OIG through the Disaster Relief Appropriations Act of 2013.
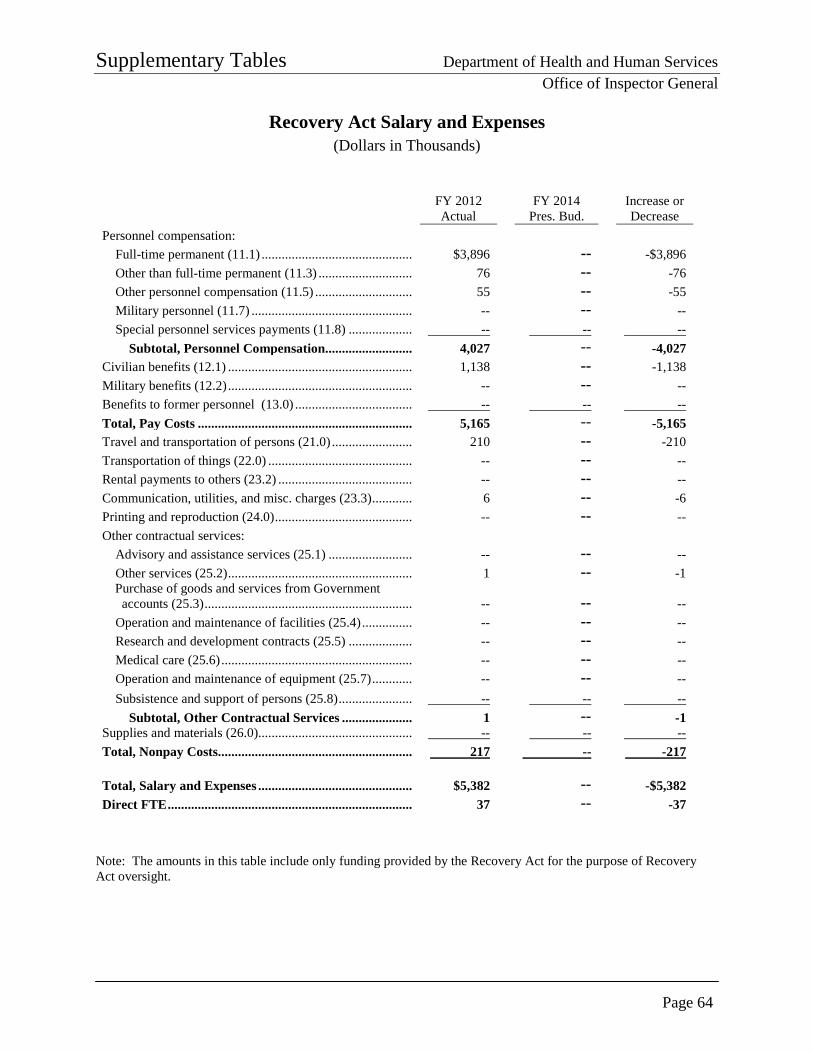
Supplementary Tables Department of Health and Human Services
Office of Inspector General
Page 64
Recovery Act Salary and Expenses (Dollars in Thousands)
FY 2012 Actual
FY 2014 Pres. Bud.
Increase or Decrease
Personnel compensation: Full-time permanent (11.1) ............................................. $3,896 -- -$3,896 Other than full-time permanent (11.3) ............................ 76 -- -76 Other personnel compensation (11.5) ............................. 55 -- -55 Military personnel (11.7) ................................................ -- -- -- Special personnel services payments (11.8) ................... -- -- --
Subtotal, Personnel Compensation.......................... 4,027 -- -4,027 Civilian benefits (12.1) ....................................................... 1,138 -- -1,138 Military benefits (12.2) ....................................................... -- -- -- Benefits to former personnel (13.0) ................................... -- -- -- Total, Pay Costs ................................................................ 5,165 -- -5,165 Travel and transportation of persons (21.0) ........................ 210 -- -210 Transportation of things (22.0) ........................................... -- -- -- Rental payments to others (23.2) ........................................ -- -- -- Communication, utilities, and misc. charges (23.3) ............ 6 -- -6 Printing and reproduction (24.0) ......................................... -- -- -- Other contractual services:
Advisory and assistance services (25.1) ......................... -- -- -- Other services (25.2) ....................................................... 1 -- -1
Purchase of goods and services from Government accounts (25.3) .............................................................. -- -- -- Operation and maintenance of facilities (25.4) ............... -- -- -- Research and development contracts (25.5) ................... -- -- -- Medical care (25.6) ......................................................... -- -- -- Operation and maintenance of equipment (25.7) ............ -- -- -- Subsistence and support of persons (25.8) ...................... -- -- --
Subtotal, Other Contractual Services ..................... 1 -- -1 Supplies and materials (26.0).............................................. -- -- -- Total, Nonpay Costs.......................................................... 217 -- -217 Total, Salary and Expenses .............................................. $5,382 -- -$5,382 Direct FTE ......................................................................... 37 -- -37
Note: The amounts in this table include only funding provided by the Recovery Act for the purpose of Recovery Act oversight.
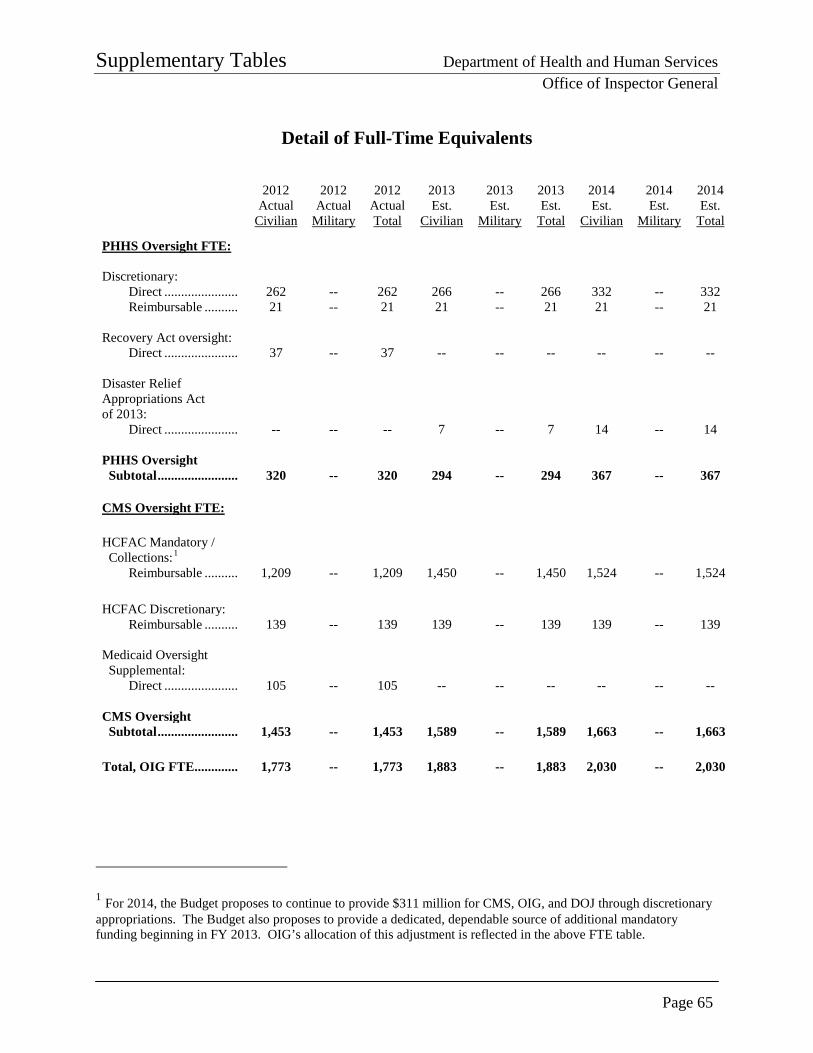
Supplementary Tables Department of Health and Human Services
Office of Inspector General
Page 65
Detail of Full-Time Equivalents
2012 Actual
Civilian
2012 Actual
Military
2012 Actual Total
2013 Est.
Civilian
2013 Est.
Military
2013 Est.
Total
2014 Est.
Civilian
2014 Est.
Military
2014 Est.
Total
PHHS Oversight FTE:
Discretionary: Direct ...................... 262 -- 262 266 -- 266 332 -- 332 Reimbursable .......... 21 -- 21 21 -- 21 21 -- 21
Recovery Act oversight:
Direct ...................... 37 -- 37 -- -- -- -- -- --
Disaster Relief Appropriations Act of 2013:
Direct ...................... -- -- -- 7 -- 7 14 -- 14
PHHS Oversight Subtotal ........................ 320 -- 320 294 -- 294 367 -- 367 CMS Oversight FTE: HCFAC Mandatory / Collections:1
Reimbursable .......... 1,209 -- 1,209 1,450 -- 1,450 1,524 -- 1,524
HCFAC Discretionary: Reimbursable .......... 139 -- 139 139 -- 139 139 -- 139
Medicaid Oversight Supplemental:
Direct ...................... 105 -- 105 -- -- -- -- -- --
CMS Oversight Subtotal ........................ 1,453 -- 1,453 1,589 -- 1,589 1,663 -- 1,663
Total, OIG FTE............. 1,773 -- 1,773 1,883 -- 1,883 2,030 -- 2,030
1 For 2014, the Budget proposes to continue to provide $311 million for CMS, OIG, and DOJ through discretionary appropriations. The Budget also proposes to provide a dedicated, dependable source of additional mandatory funding beginning in FY 2013. OIG’s allocation of this adjustment is reflected in the above FTE table.
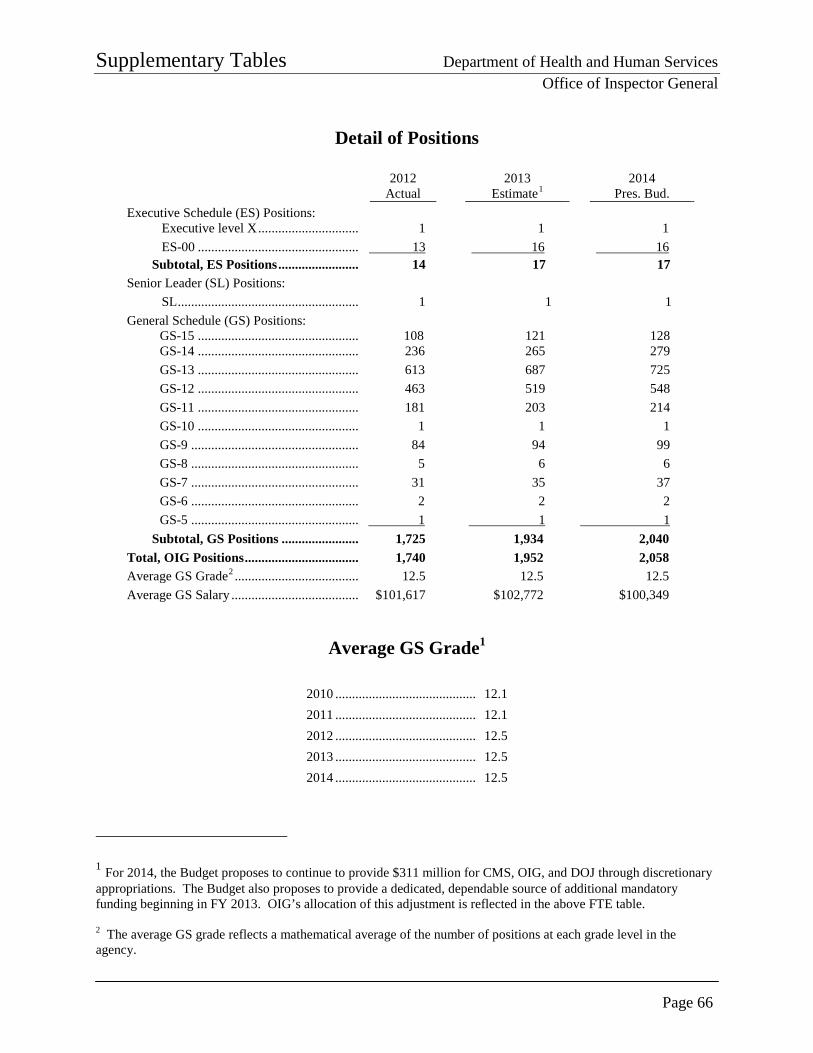
Supplementary Tables Department of Health and Human Services
Office of Inspector General
Page 66
Detail of Positions
2012
Actual 2013
Estimate1 2014
Pres. Bud. Executive Schedule (ES) Positions:
Executive level X .............................. 1 1 1 ES-00 ................................................ 13 16 16
Subtotal, ES Positions ........................ 14 17 17 Senior Leader (SL) Positions:
SL ...................................................... 1 1 1 General Schedule (GS) Positions:
GS-15 ................................................ 108 121 128 GS-14 ................................................ 236 265 279 GS-13 ................................................ 613 687 725 GS-12 ................................................ 463 519 548 GS-11 ................................................ 181 203 214 GS-10 ................................................ 1 1 1 GS-9 .................................................. 84 94 99 GS-8 .................................................. 5 6 6 GS-7 .................................................. 31 35 37 GS-6 .................................................. 2 2 2 GS-5 .................................................. 1 1 1
Subtotal, GS Positions ....................... 1,725 1,934 2,040 Total, OIG Positions .................................. 1,740 1,952 2,058 Average GS Grade2 ..................................... 12.5 12.5 12.5 Average GS Salary ...................................... $101,617 $102,772 $100,349
Average GS Grade1
2010 ........................................... 12.1 2011 ........................................... 12.1 2012 ........................................... 12.5 2013 ........................................... 12.5 2014 ........................................... 12.5
1 For 2014, the Budget proposes to continue to provide $311 million for CMS, OIG, and DOJ through discretionary appropriations. The Budget also proposes to provide a dedicated, dependable source of additional mandatory funding beginning in FY 2013. OIG’s allocation of this adjustment is reflected in the above FTE table. 2 The average GS grade reflects a mathematical average of the number of positions at each grade level in the agency.
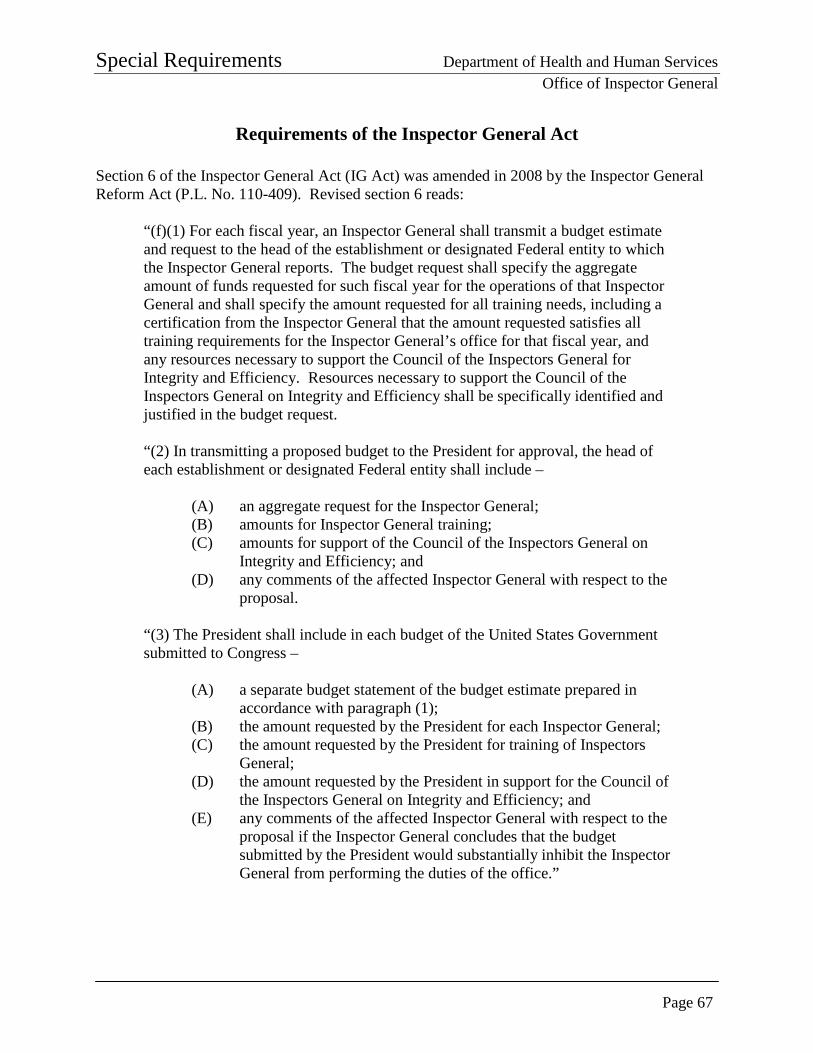
Special Requirements Department of Health and Human Services
Office of Inspector General
Page 67
Requirements of the Inspector General Act Section 6 of the Inspector General Act (IG Act) was amended in 2008 by the Inspector General Reform Act (P.L. No. 110-409). Revised section 6 reads:
“(f)(1) For each fiscal year, an Inspector General shall transmit a budget estimate and request to the head of the establishment or designated Federal entity to which the Inspector General reports. The budget request shall specify the aggregate amount of funds requested for such fiscal year for the operations of that Inspector General and shall specify the amount requested for all training needs, including a certification from the Inspector General that the amount requested satisfies all training requirements for the Inspector General’s office for that fiscal year, and any resources necessary to support the Council of the Inspectors General for Integrity and Efficiency. Resources necessary to support the Council of the Inspectors General on Integrity and Efficiency shall be specifically identified and justified in the budget request.
“(2) In transmitting a proposed budget to the President for approval, the head of each establishment or designated Federal entity shall include –
(A) an aggregate request for the Inspector General; (B) amounts for Inspector General training; (C) amounts for support of the Council of the Inspectors General on
Integrity and Efficiency; and (D) any comments of the affected Inspector General with respect to the
proposal.
“(3) The President shall include in each budget of the United States Government submitted to Congress –
(A) a separate budget statement of the budget estimate prepared in
accordance with paragraph (1); (B) the amount requested by the President for each Inspector General; (C) the amount requested by the President for training of Inspectors
General; (D) the amount requested by the President in support for the Council of
the Inspectors General on Integrity and Efficiency; and (E) any comments of the affected Inspector General with respect to the
proposal if the Inspector General concludes that the budget submitted by the President would substantially inhibit the Inspector General from performing the duties of the office.”
Special Requirements Department of Health and Human Services
Office of Inspector General
Page 68
HHS OIG meets the above requirement by providing the following information:
• OIG’s aggregate budget estimate and request to HHS at the beginning of the FY 2014 process was $392 million.
• OIG’s aggregate budget request to Congress for FY 2014 is $389 million.
• Funding requested for training is $12 million.
• A total of $468,000 will be necessary to support the Council of the Inspectors General on Integrity and Efficiency (CIGIE).
• The IG comments on this budget request are on page 1 of this submission in the section entitled “Message From the Inspector General.”
HHS OIG Training Requirements In accordance with section 6(f)(3)(C) of the IG Act, this budget requests $12 million in FY 2014 for training expenses, of which a portion will be funded from the discretionary budget. This amount is composed of OIG’s baseline training budget for its entire staff, which with the FY 2014 request includes more than 2,000 criminal investigators, auditors, program evaluators, attorneys, and administrative and management staff. HHS OIG Financial Support for CIGIE In support of the Governmentwide IG community, OIG contributes funds to CIGIE for such expenses as maintaining www.IGNet.gov, maintaining the awards nomination database, and hosting the annual awards ceremony. In accordance with the reporting requirements of section 6(f)(3)(D) of the IG Act, this budget requests $468,000 in necessary expenses for OIG’s support of CIGIE, of which a portion will be funded from the discretionary budget.
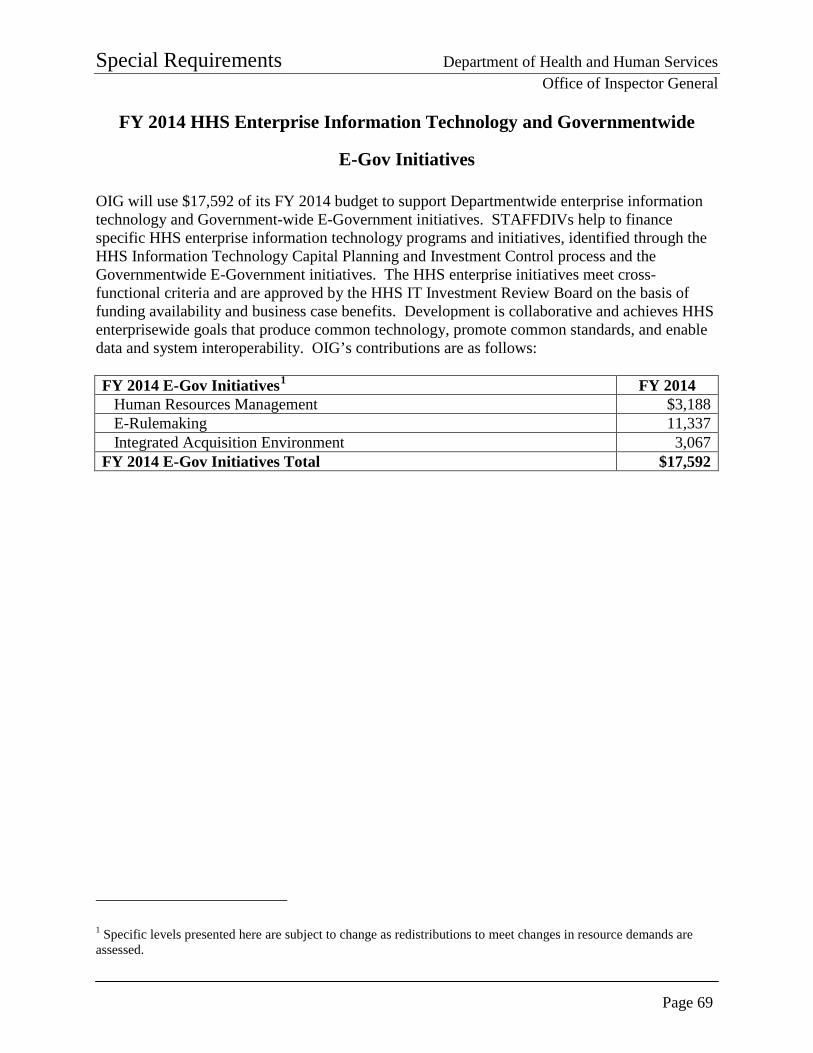
Special Requirements Department of Health and Human Services
Office of Inspector General
Page 69
FY 2014 HHS Enterprise Information Technology and Governmentwide
E-Gov Initiatives OIG will use $17,592 of its FY 2014 budget to support Departmentwide enterprise information technology and Government-wide E-Government initiatives. STAFFDIVs help to finance specific HHS enterprise information technology programs and initiatives, identified through the HHS Information Technology Capital Planning and Investment Control process and the Governmentwide E-Government initiatives. The HHS enterprise initiatives meet cross-functional criteria and are approved by the HHS IT Investment Review Board on the basis of funding availability and business case benefits. Development is collaborative and achieves HHS enterprisewide goals that produce common technology, promote common standards, and enable data and system interoperability. OIG’s contributions are as follows: FY 2014 E-Gov Initiatives1 FY 2014 Human Resources Management $3,188 E-Rulemaking 11,337 Integrated Acquisition Environment 3,067 FY 2014 E-Gov Initiatives Total $17,592
1 Specific levels presented here are subject to change as redistributions to meet changes in resource demands are assessed.
Special Requirements Department of Health and Human Services
Office of Inspector General
Page 70
PAGE INTENTIONALLY LEFT BLANK