Embed Size (px)
Citation preview
Office of Institutional Research and Planning One Harpst Street • Arcata, California 95521-8299
707.826.5489 • www.humboldt.edu/irp
Presentation Overview
Concept of Student Engagement
NSSE in 2013
2013 HSU NSSE Administration
Selected HSU Results HSU First-Year Students HSU Senior Students
Questions & Discussion
NSSE and the Concept of Student Engagement
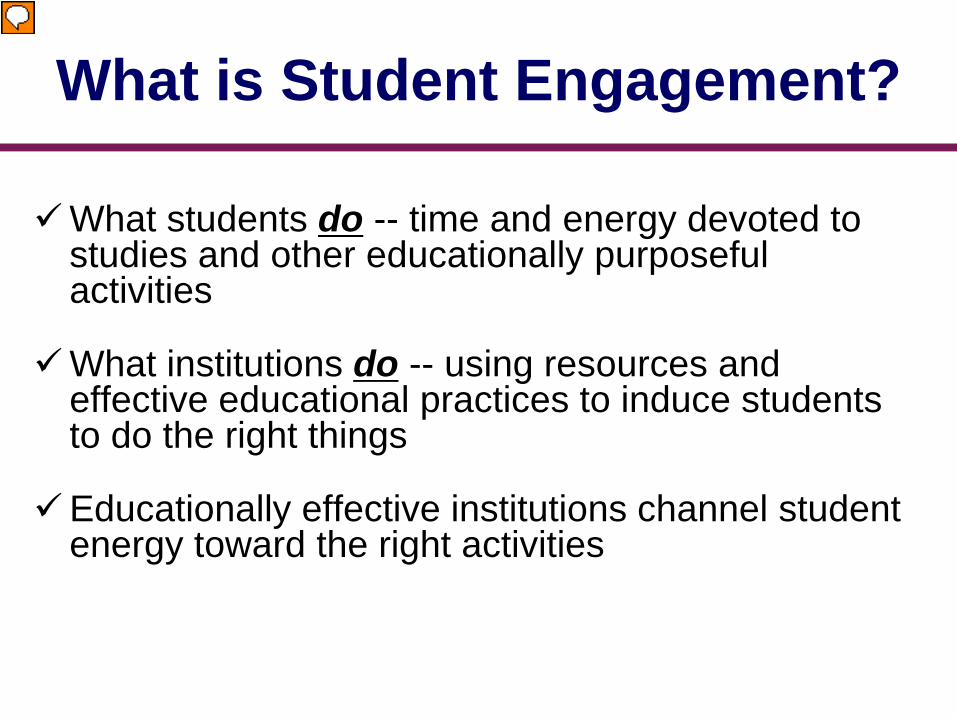
What is Student Engagement?
What students do -- time and energy devoted to studies and other educationally purposeful activities
What institutions do -- using resources and effective educational practices to induce students to do the right things
Educationally effective institutions channel student energy toward the right activities
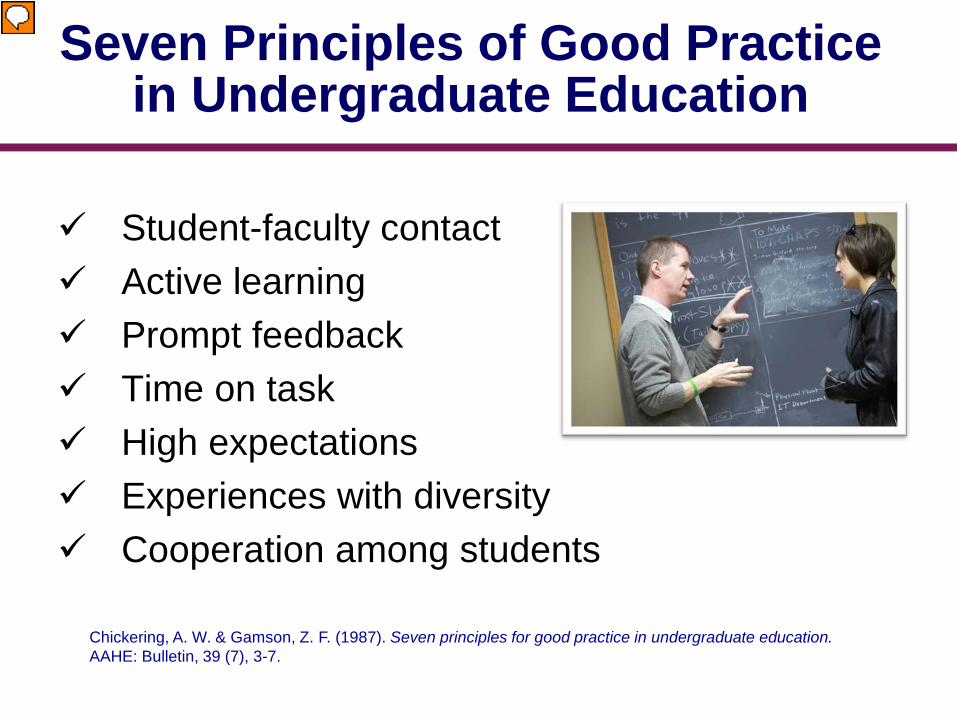
Seven Principles of Good Practice in Undergraduate Education
Student-faculty contact Active learning Prompt feedback Time on task High expectations Experiences with diversity Cooperation among students
Chickering, A. W. & Gamson, Z. F. (1987). Seven principles for good practice in undergraduate education. AAHE: Bulletin, 39 (7), 3-7.
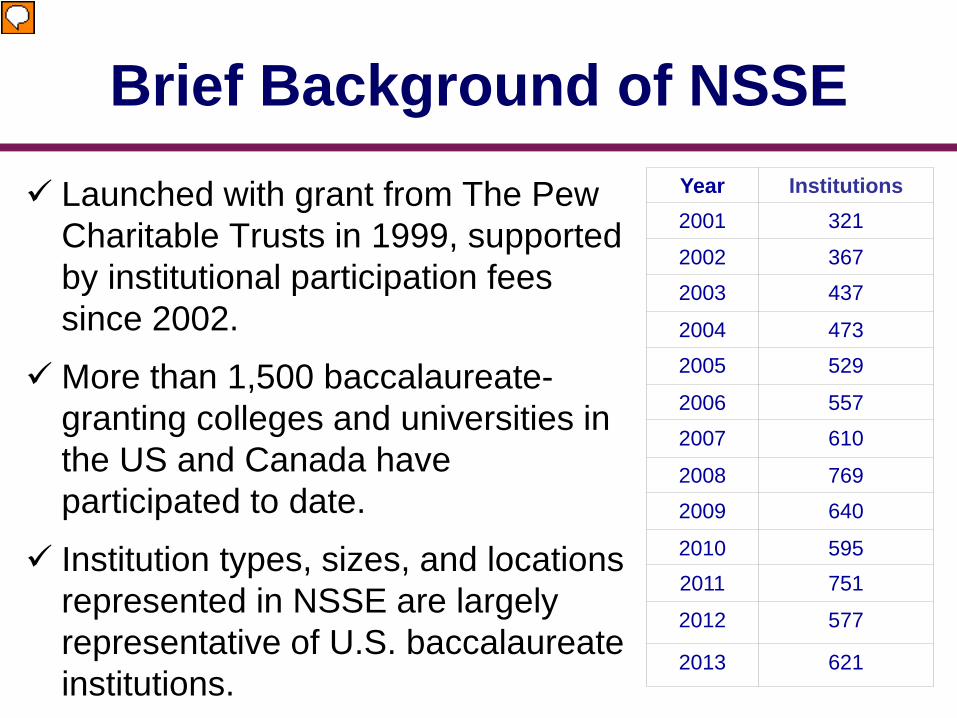
Brief Background of NSSE Year Institutions 2001 321
2002 367
2003 437
2004 473
2005 529
2006 557
2007 610
2008 769
2009 640
2010 595 2011 751
2012 577
2013 621
Launched with grant from The Pew Charitable Trusts in 1999, supported by institutional participation fees since 2002.
More than 1,500 baccalaureate-granting colleges and universities in the US and Canada have participated to date.
Institution types, sizes, and locations represented in NSSE are largely representative of U.S. baccalaureate institutions.
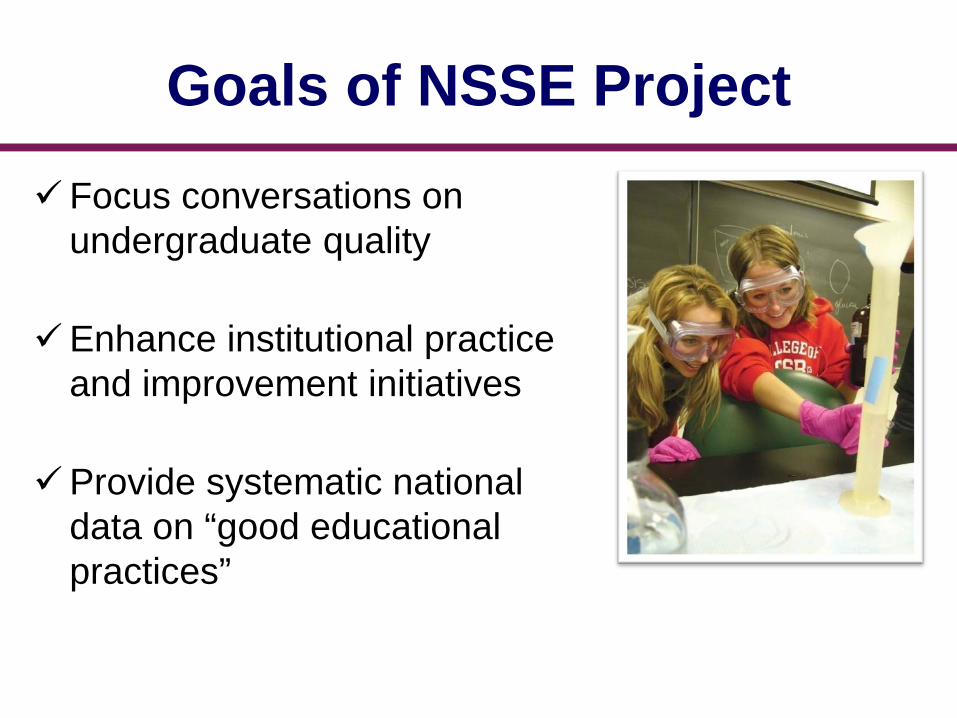
Goals of NSSE Project
Focus conversations on undergraduate quality
Enhance institutional practice and improvement initiatives
Provide systematic national data on “good educational practices”
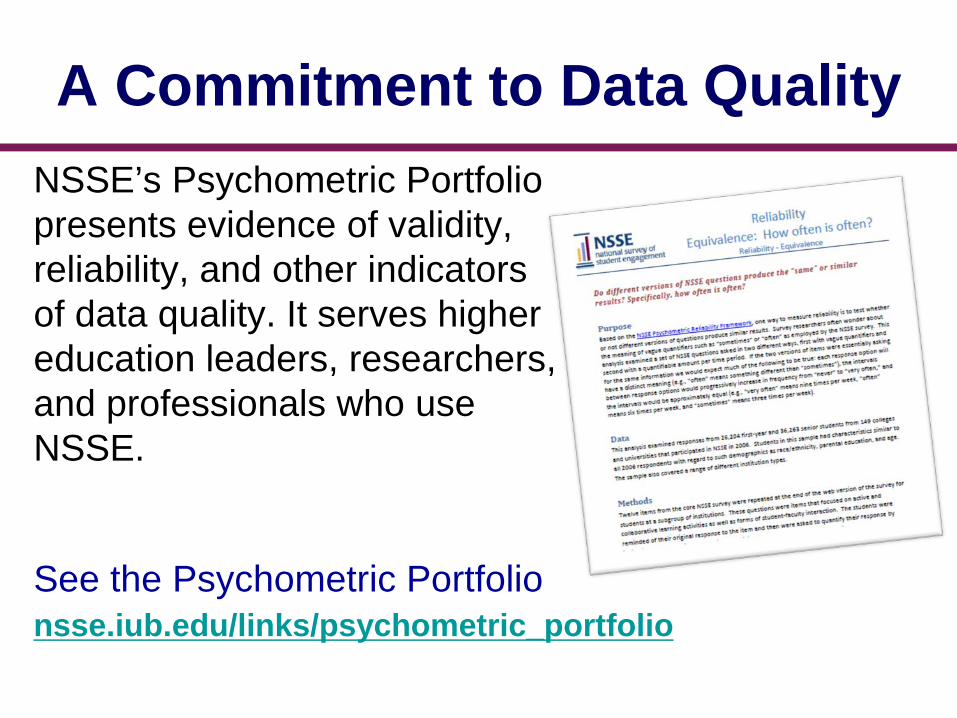
A Commitment to Data Quality NSSE’s Psychometric Portfolio presents evidence of validity, reliability, and other indicators of data quality. It serves higher education leaders, researchers, and professionals who use NSSE.
See the Psychometric Portfolio nsse.iub.edu/links/psychometric_portfolio
NSSE in 2013
HSU photos are courtesy of HSU Marketing and Communication Department. www.flickr.com/photos/humboldtstate
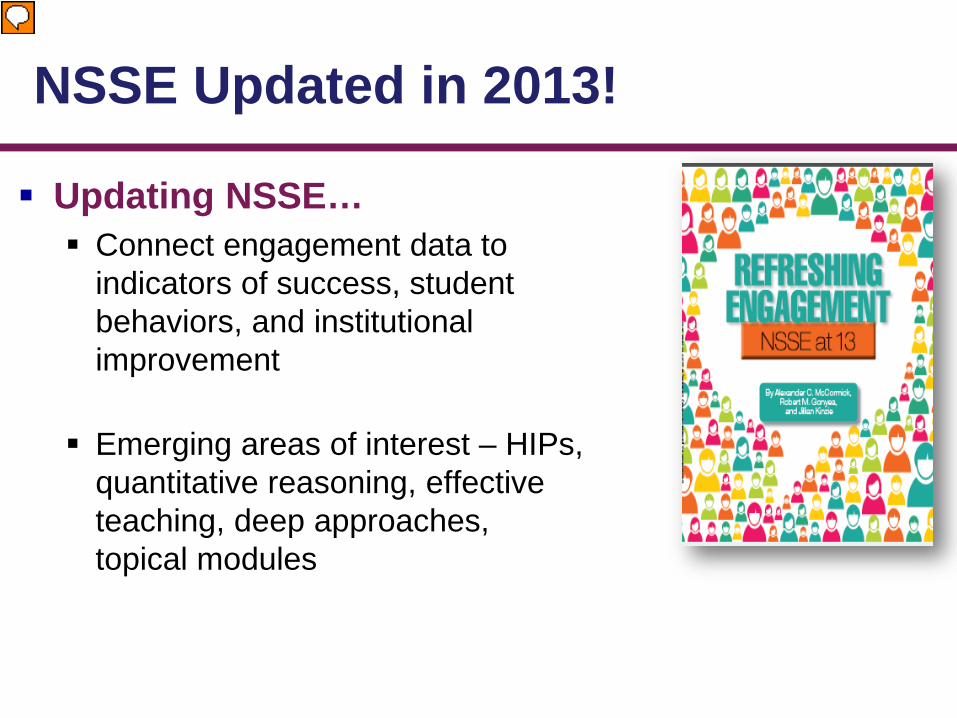
NSSE Updated in 2013!
Updating NSSE… Connect engagement data to
indicators of success, student behaviors, and institutional improvement
Emerging areas of interest – HIPs, quantitative reasoning, effective teaching, deep approaches, topical modules
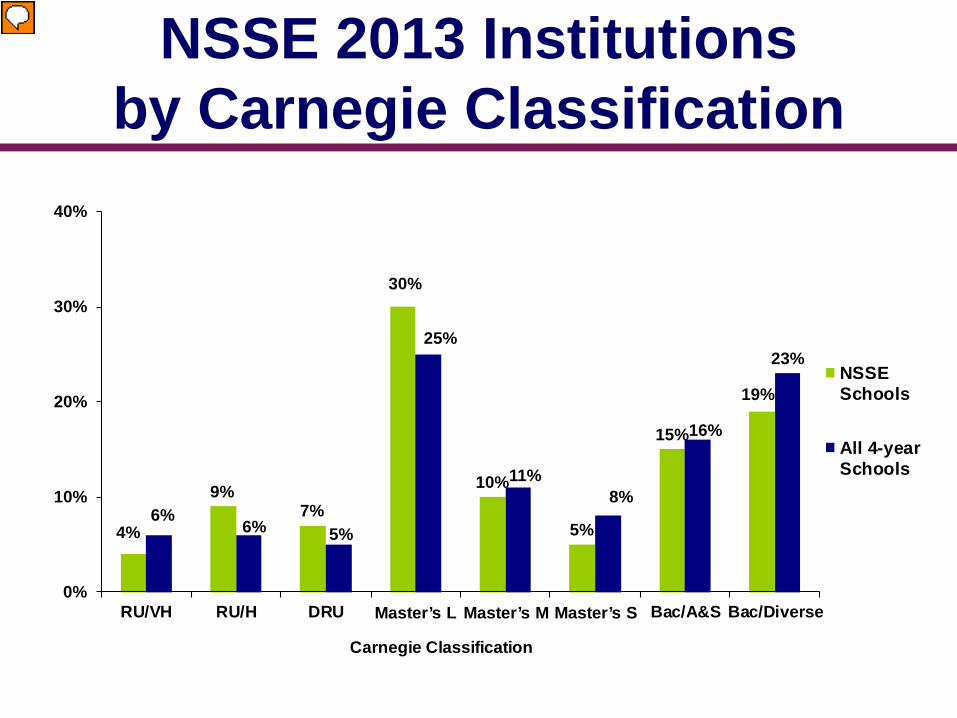
NSSE 2013 Institutions by Carnegie Classification
4%
9%7%
30%
10%
5%
15%
19%
6%6% 5%
25%
11%8%
16%
23%
0%
10%
20%
30%
40%
RU/VH RU/H DRU Master’s L Master’s M Master’s S Bac/A&S Bac/Diverse
Carnegie Classification
NSSESchools
All 4-yearSchools
2013 HSU NSSE Administration
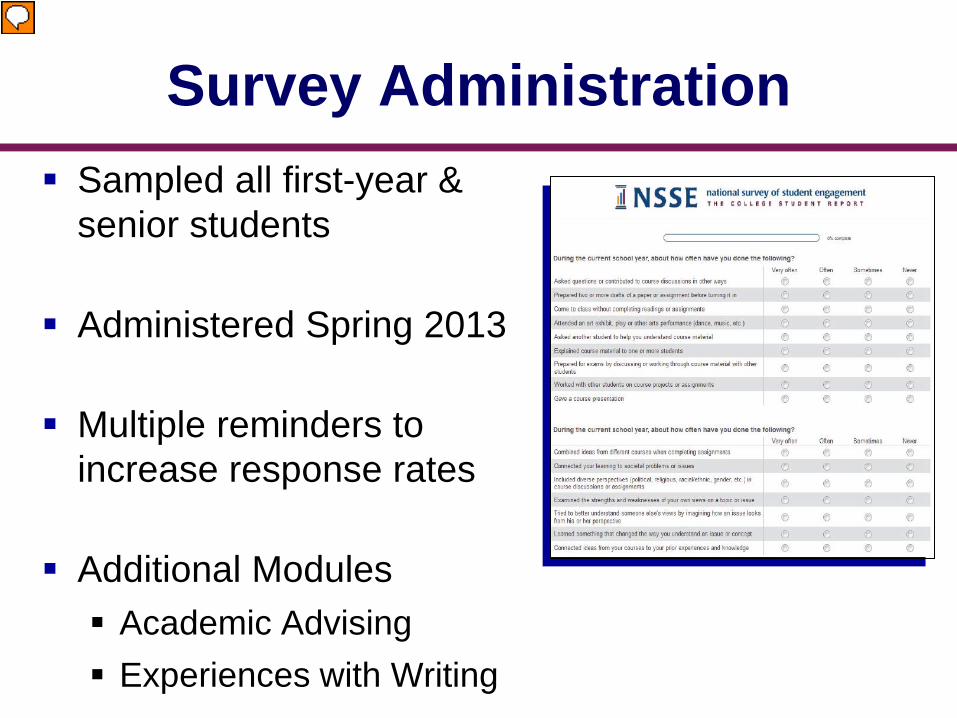
Survey Administration Sampled all first-year &
senior students
Administered Spring 2013
Multiple reminders to increase response rates
Additional Modules Academic Advising Experiences with Writing
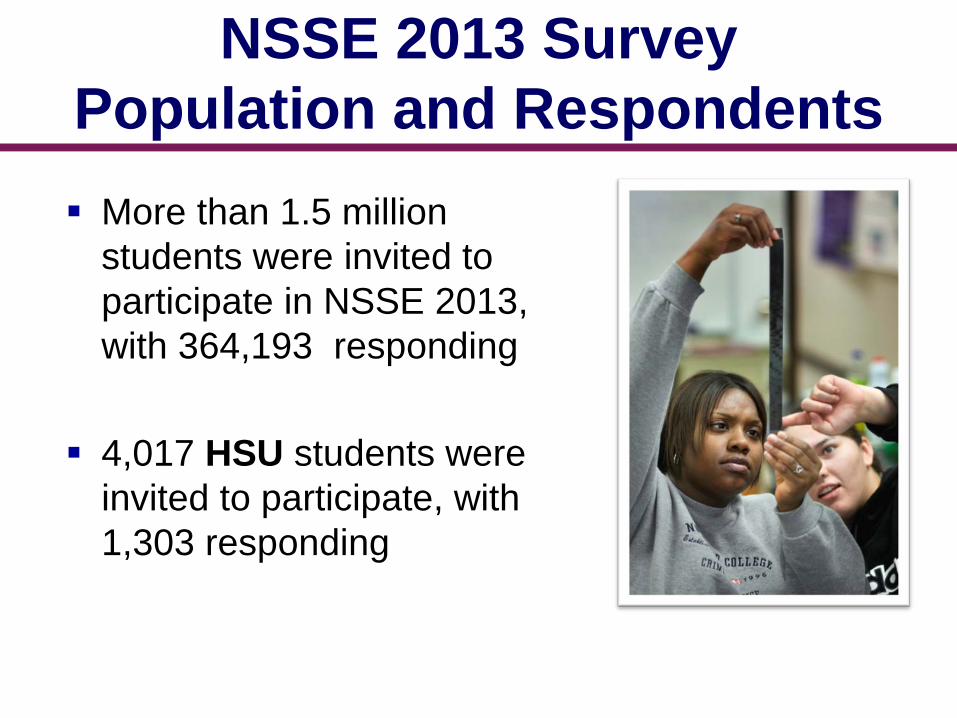
NSSE 2013 Survey Population and Respondents More than 1.5 million
students were invited to participate in NSSE 2013, with 364,193 responding
4,017 HSU students were
invited to participate, with 1,303 responding
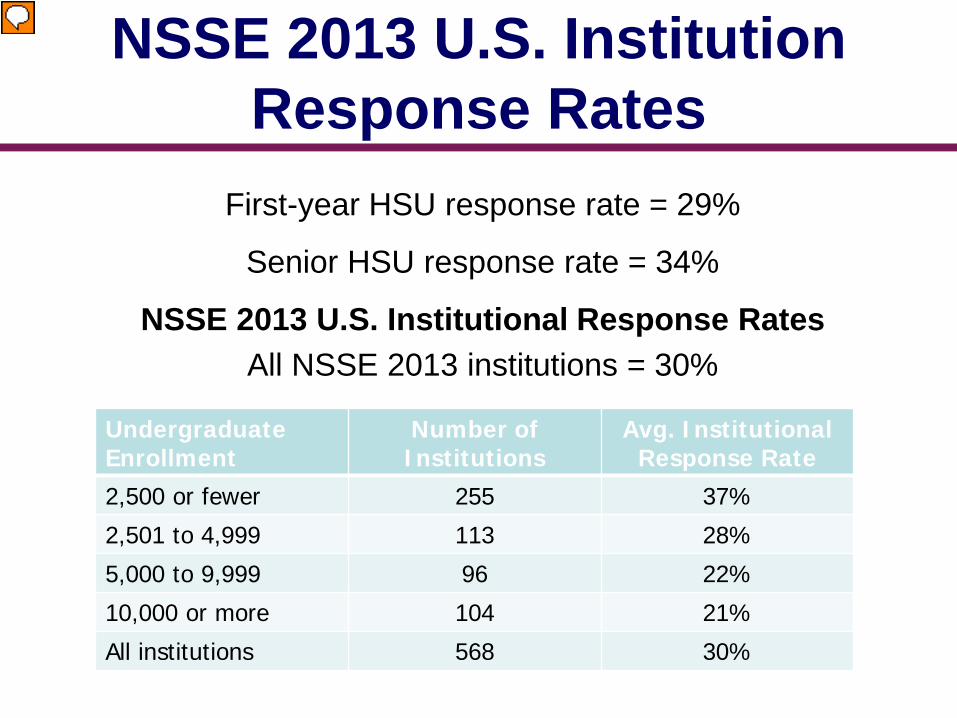
NSSE 2013 U.S. Institution Response Rates
First-year HSU response rate = 29%
Senior HSU response rate = 34%
NSSE 2013 U.S. Institutional Response Rates All NSSE 2013 institutions = 30%
Undergraduate Enrollment
Number of Institutions
Avg. Institutional Response Rate
2,500 or fewer 255 37%
2,501 to 4,999 113 28%
5,000 to 9,999 96 22%
10,000 or more 104 21%
All institutions 568 30%
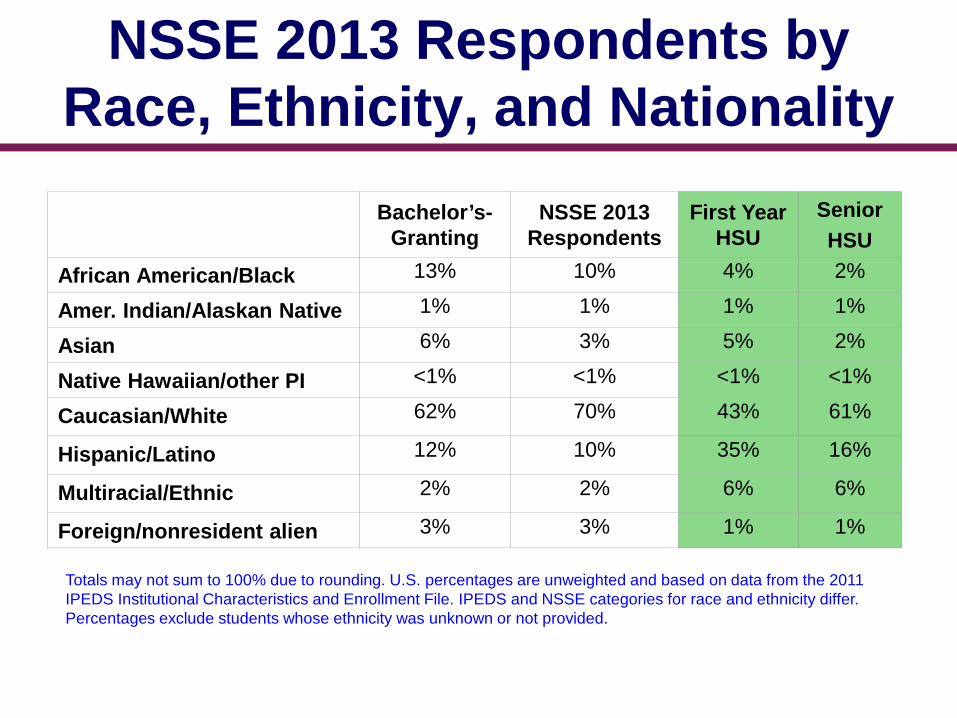
NSSE 2013 Respondents by Race, Ethnicity, and Nationality
Bachelor’s-Granting
NSSE 2013 Respondents
First Year HSU
Senior HSU
African American/Black 13% 10% 4% 2%
Amer. Indian/Alaskan Native 1% 1% 1% 1%
Asian 6% 3% 5% 2%
Native Hawaiian/other PI <1% <1% <1% <1%
Caucasian/White 62% 70% 43% 61%
Hispanic/Latino 12% 10% 35% 16%
Multiracial/Ethnic 2% 2% 6% 6%
Foreign/nonresident alien 3% 3% 1% 1%
Totals may not sum to 100% due to rounding. U.S. percentages are unweighted and based on data from the 2011 IPEDS Institutional Characteristics and Enrollment File. IPEDS and NSSE categories for race and ethnicity differ. Percentages exclude students whose ethnicity was unknown or not provided.
Selected HSU Results
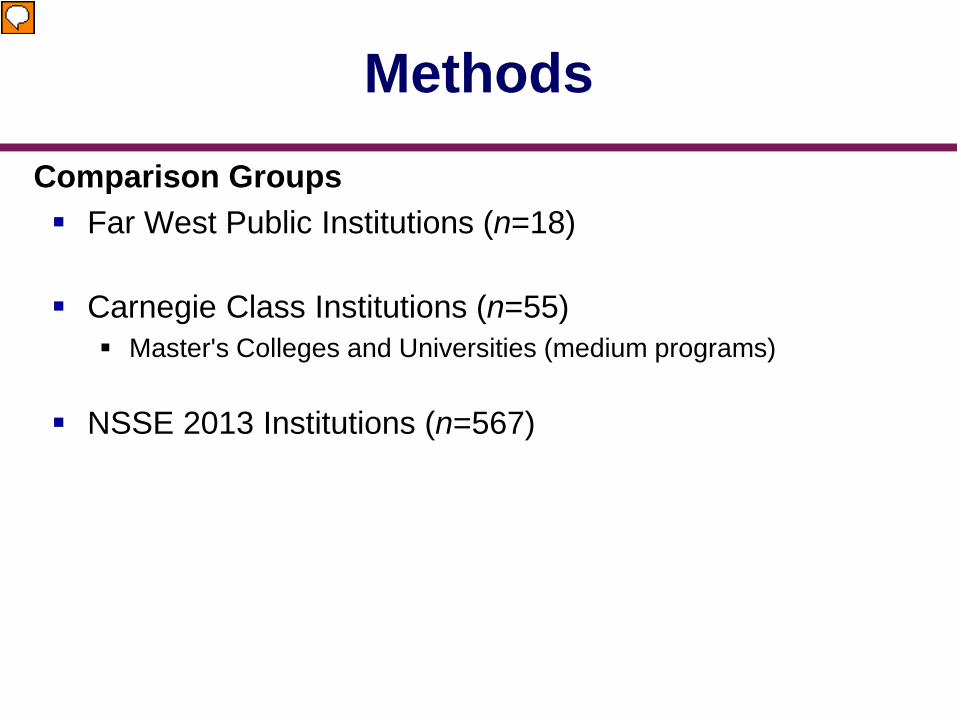
Methods Comparison Groups Far West Public Institutions (n=18)
Carnegie Class Institutions (n=55)
Master's Colleges and Universities (medium programs)
NSSE 2013 Institutions (n=567)
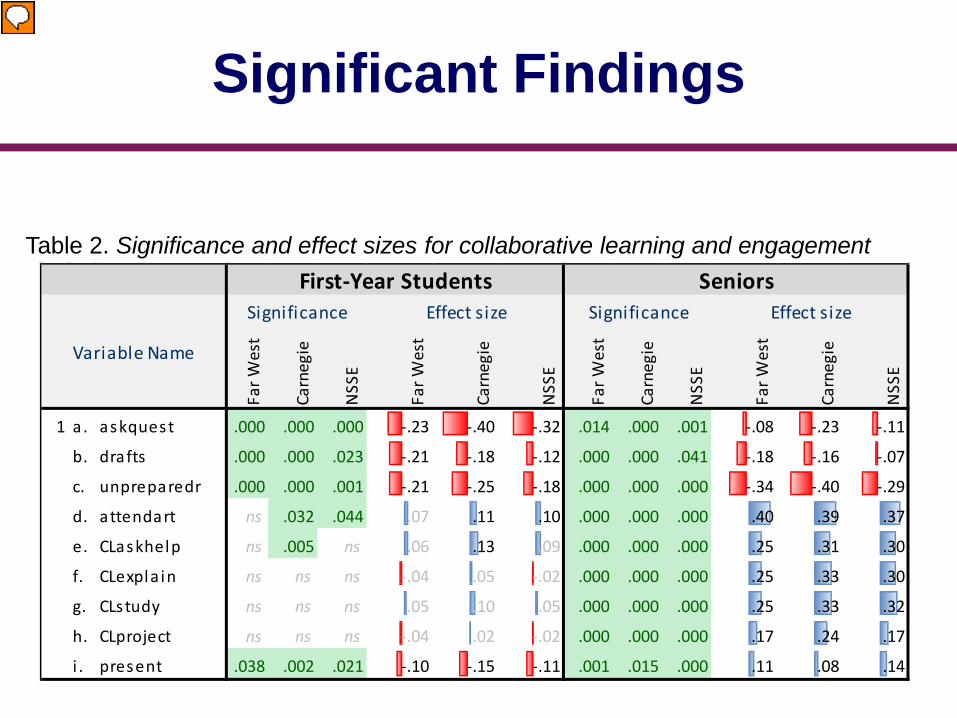
Significant Findings
Far W
est
Carn
egie
NSS
E
Far W
est
Carn
egie
NSS
E
Far W
est
Carn
egie
NSS
E
Far W
est
Carn
egie
NSS
E
1 a . askquest .000 .000 .000 -.23 -.40 -.32 .014 .000 .001 -.08 -.23 -.11
b. drafts .000 .000 .023 -.21 -.18 -.12 .000 .000 .041 -.18 -.16 -.07
c. unpreparedr .000 .000 .001 -.21 -.25 -.18 .000 .000 .000 -.34 -.40 -.29
d. attendart ns .032 .044 .07 .11 .10 .000 .000 .000 .40 .39 .37
e. CLaskhelp ns .005 ns .06 .13 .09 .000 .000 .000 .25 .31 .30
f. CLexpla in ns ns ns -.04 .05 -.02 .000 .000 .000 .25 .33 .30
g. CLstudy ns ns ns .05 .10 .05 .000 .000 .000 .25 .33 .32
h. CLproject ns ns ns -.04 .02 -.02 .000 .000 .000 .17 .24 .17
i . present .038 .002 .021 -.10 -.15 -.11 .001 .015 .000 .11 .08 .14
Variable Name
First-Year Students SeniorsSignificance Effect size Significance Effect size
Table 2. Significance and effect sizes for collaborative learning and engagement
Significant Findings
Statistically significant findings First-year Students Senior Students
Full report found at: www.humboldt.edu/irp/Reports/NESSE/NSSE.html
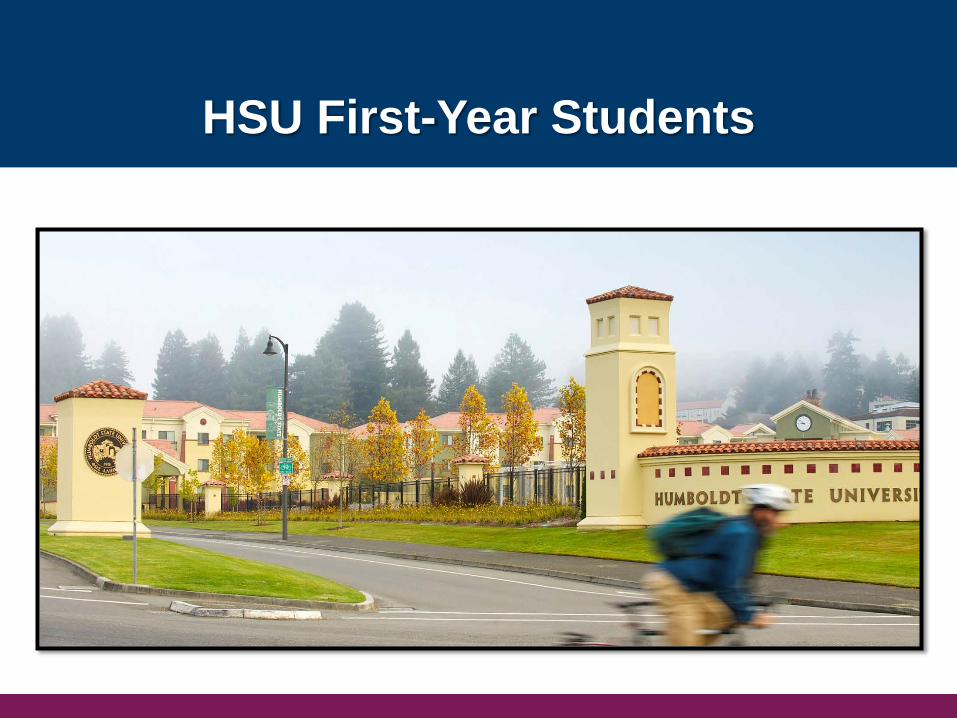
HSU First-Year Students
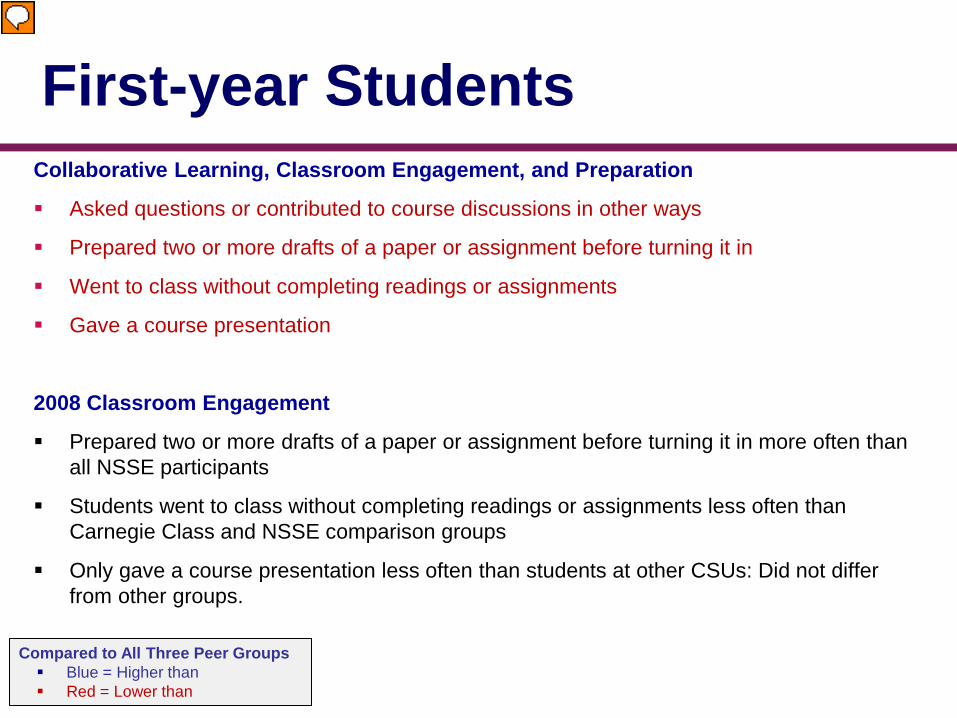
First-year Students Collaborative Learning, Classroom Engagement, and Preparation
Asked questions or contributed to course discussions in other ways
Prepared two or more drafts of a paper or assignment before turning it in
Went to class without completing readings or assignments
Gave a course presentation
2008 Classroom Engagement
Prepared two or more drafts of a paper or assignment before turning it in more often than all NSSE participants
Students went to class without completing readings or assignments less often than Carnegie Class and NSSE comparison groups
Only gave a course presentation less often than students at other CSUs: Did not differ from other groups.
Compared to All Three Peer Groups Blue = Higher than Red = Lower than
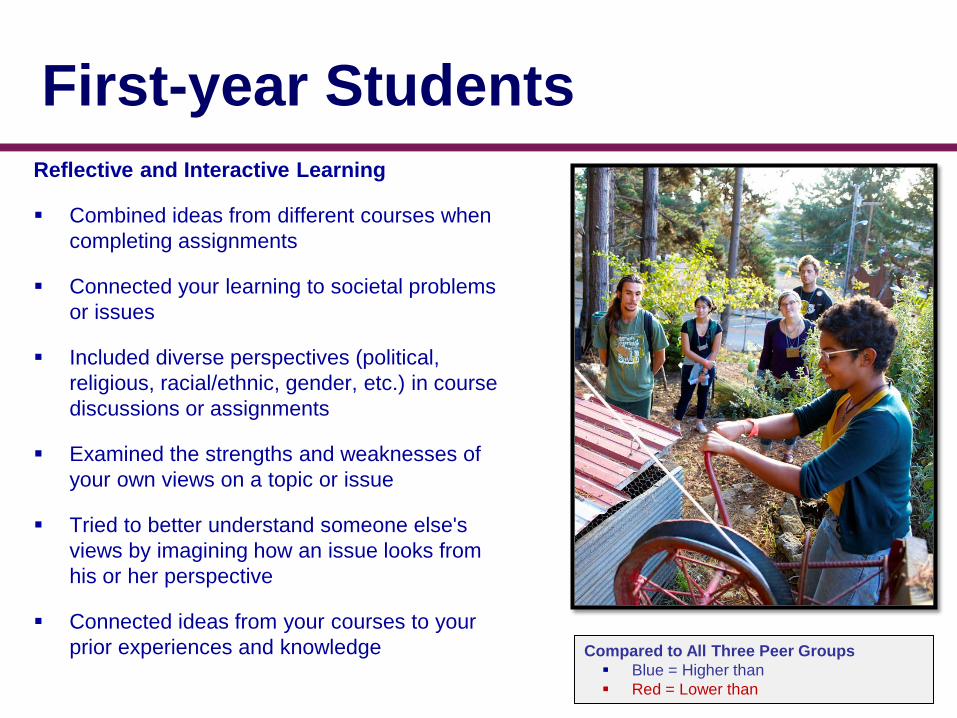
First-year Students Reflective and Interactive Learning
Combined ideas from different courses when completing assignments
Connected your learning to societal problems or issues
Included diverse perspectives (political, religious, racial/ethnic, gender, etc.) in course discussions or assignments
Examined the strengths and weaknesses of your own views on a topic or issue
Tried to better understand someone else's views by imagining how an issue looks from his or her perspective
Connected ideas from your courses to your prior experiences and knowledge Compared to All Three Peer Groups
Blue = Higher than Red = Lower than
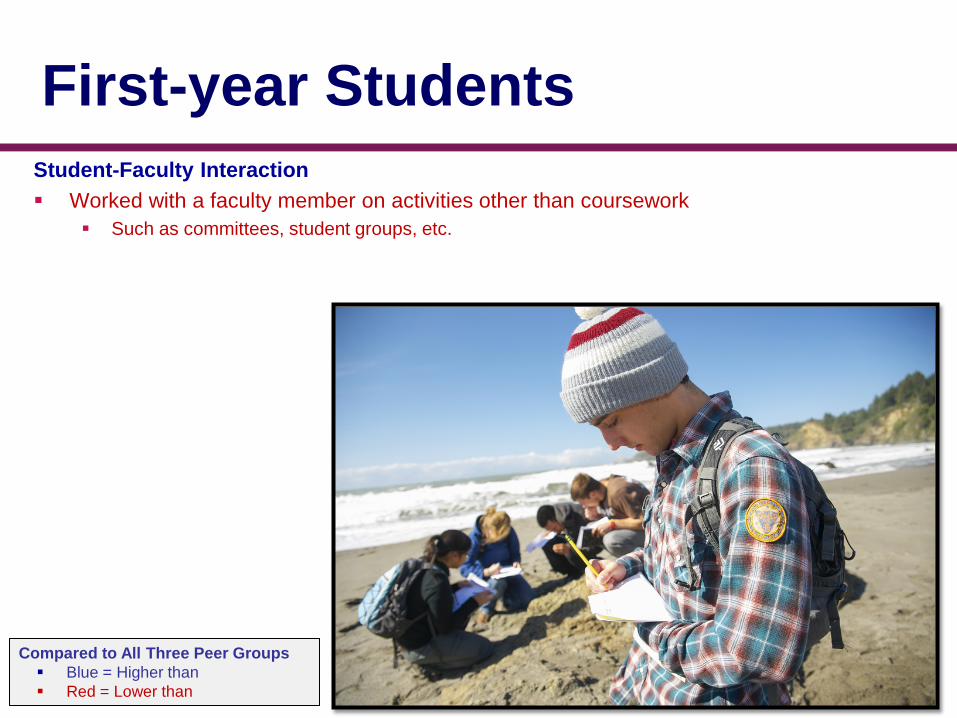
First-year Students Student-Faculty Interaction Worked with a faculty member on activities other than coursework
Such as committees, student groups, etc.
Compared to All Three Peer Groups Blue = Higher than Red = Lower than
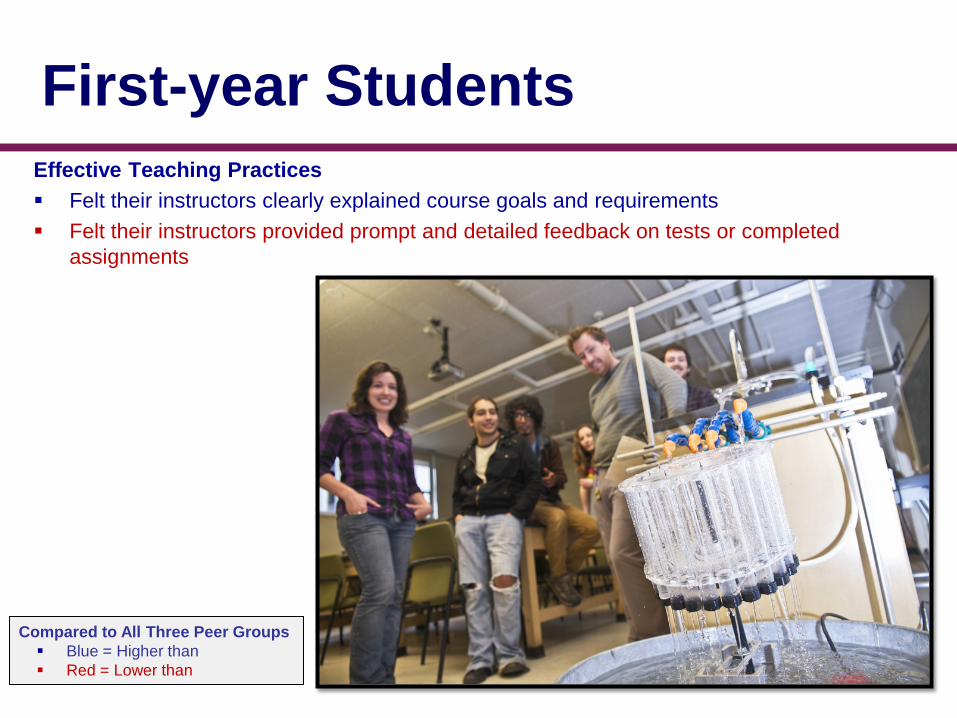
First-year Students Effective Teaching Practices Felt their instructors clearly explained course goals and requirements Felt their instructors provided prompt and detailed feedback on tests or completed
assignments
Compared to All Three Peer Groups Blue = Higher than Red = Lower than
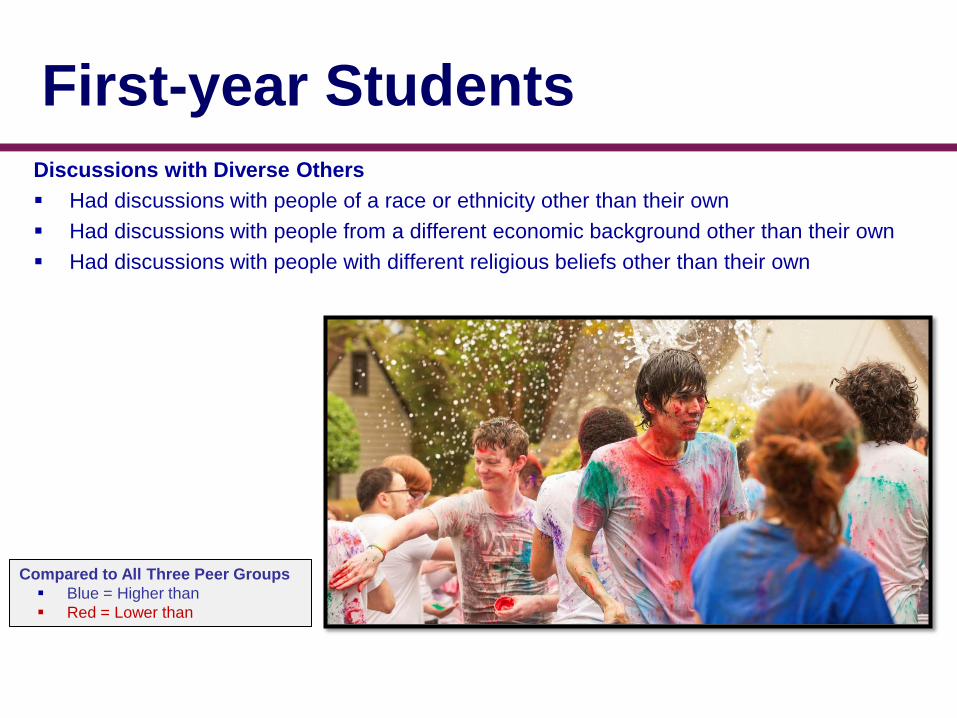
First-year Students Discussions with Diverse Others Had discussions with people of a race or ethnicity other than their own Had discussions with people from a different economic background other than their own Had discussions with people with different religious beliefs other than their own
Compared to All Three Peer Groups Blue = Higher than Red = Lower than
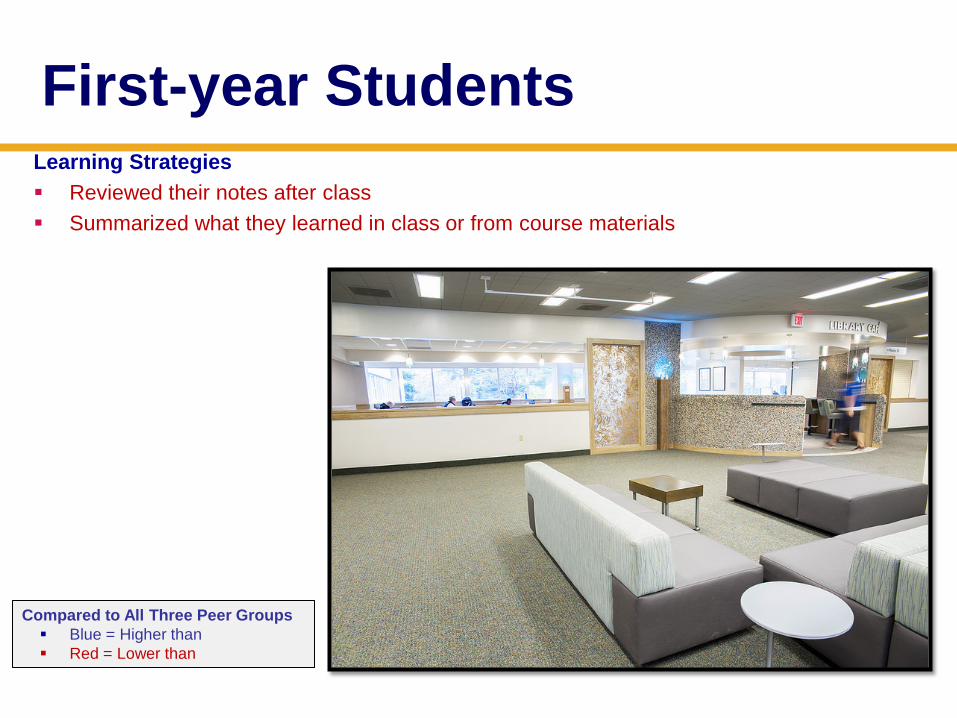
First-year Students Learning Strategies Reviewed their notes after class Summarized what they learned in class or from course materials
Compared to All Three Peer Groups Blue = Higher than Red = Lower than
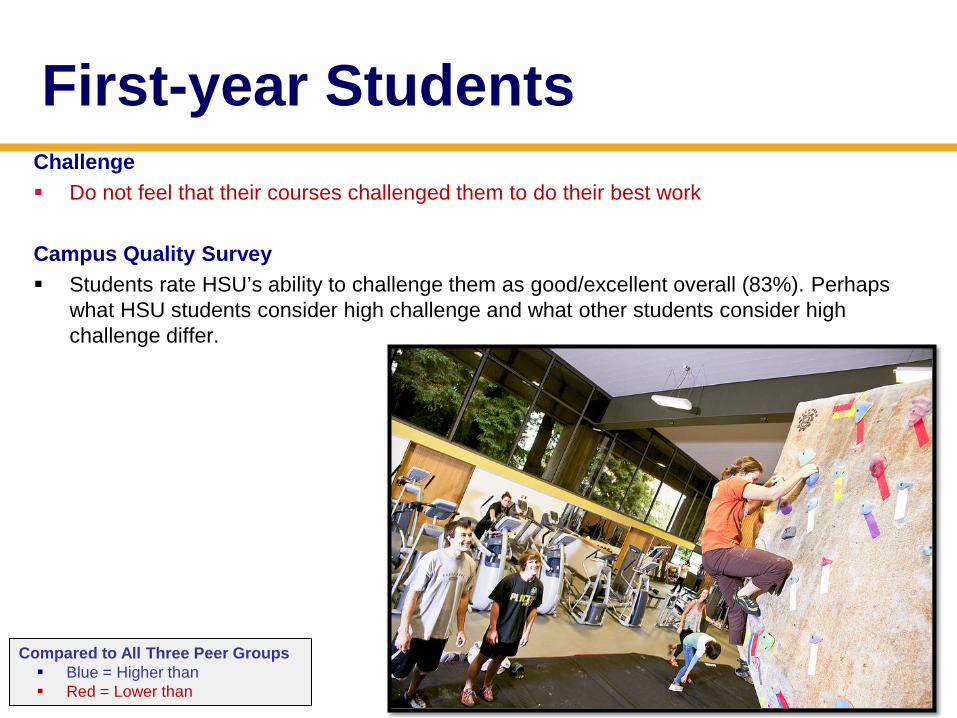
First-year Students Challenge Do not feel that their courses challenged them to do their best work
Campus Quality Survey Students rate HSU’s ability to challenge them as good/excellent overall (83%). Perhaps
what HSU students consider high challenge and what other students consider high challenge differ.
Compared to All Three Peer Groups Blue = Higher than Red = Lower than
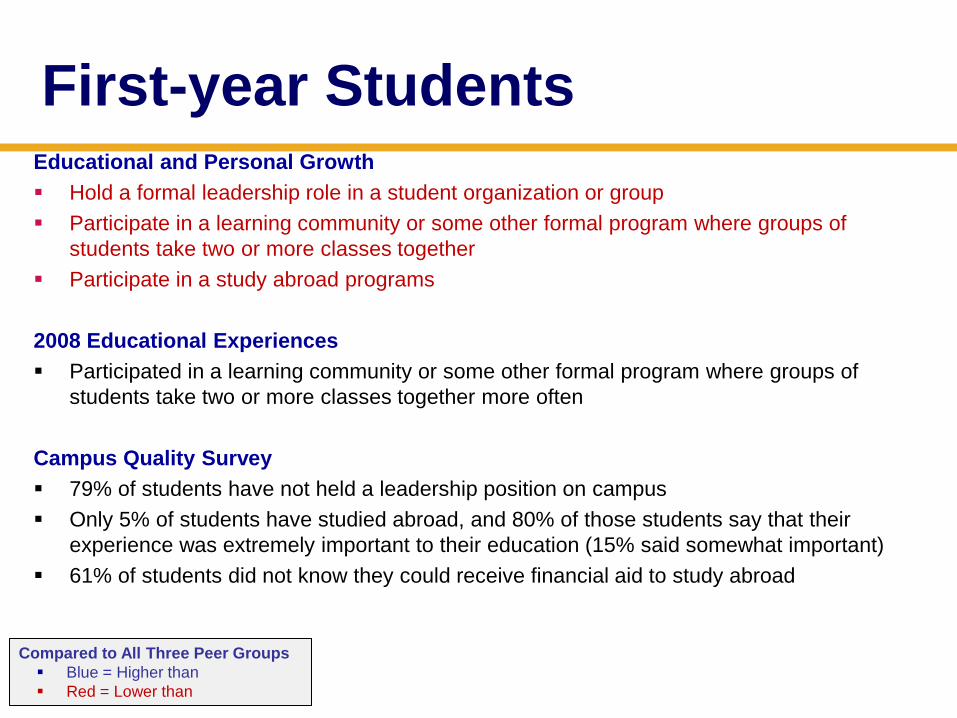
First-year Students Educational and Personal Growth Hold a formal leadership role in a student organization or group Participate in a learning community or some other formal program where groups of
students take two or more classes together Participate in a study abroad programs
2008 Educational Experiences Participated in a learning community or some other formal program where groups of
students take two or more classes together more often
Campus Quality Survey 79% of students have not held a leadership position on campus Only 5% of students have studied abroad, and 80% of those students say that their
experience was extremely important to their education (15% said somewhat important) 61% of students did not know they could receive financial aid to study abroad
Compared to All Three Peer Groups Blue = Higher than Red = Lower than
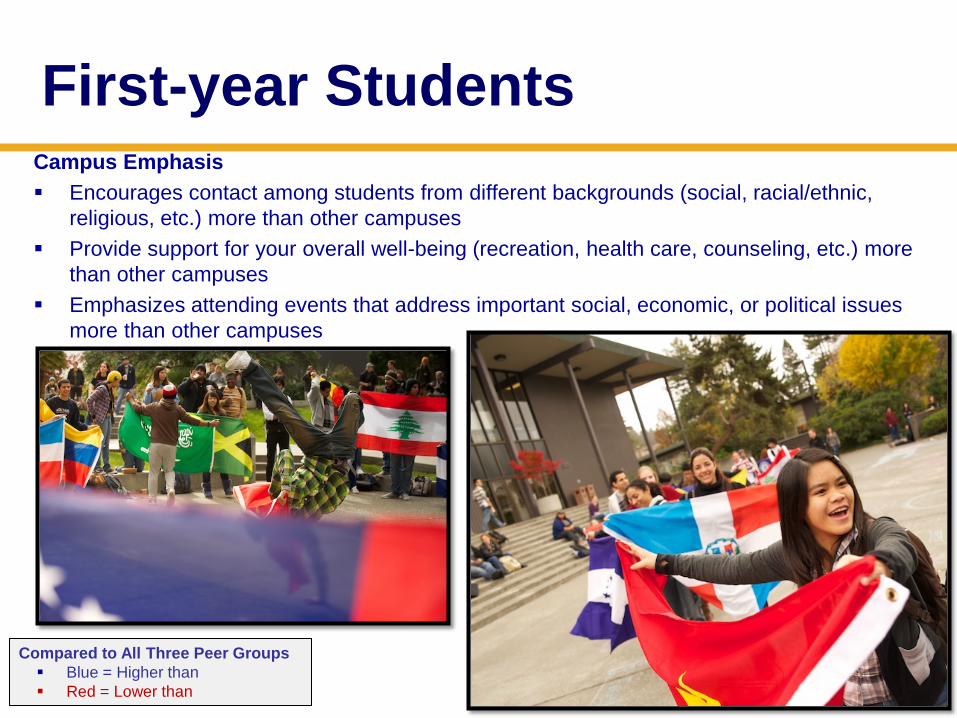
First-year Students Campus Emphasis Encourages contact among students from different backgrounds (social, racial/ethnic,
religious, etc.) more than other campuses Provide support for your overall well-being (recreation, health care, counseling, etc.) more
than other campuses Emphasizes attending events that address important social, economic, or political issues
more than other campuses
Compared to All Three Peer Groups Blue = Higher than Red = Lower than
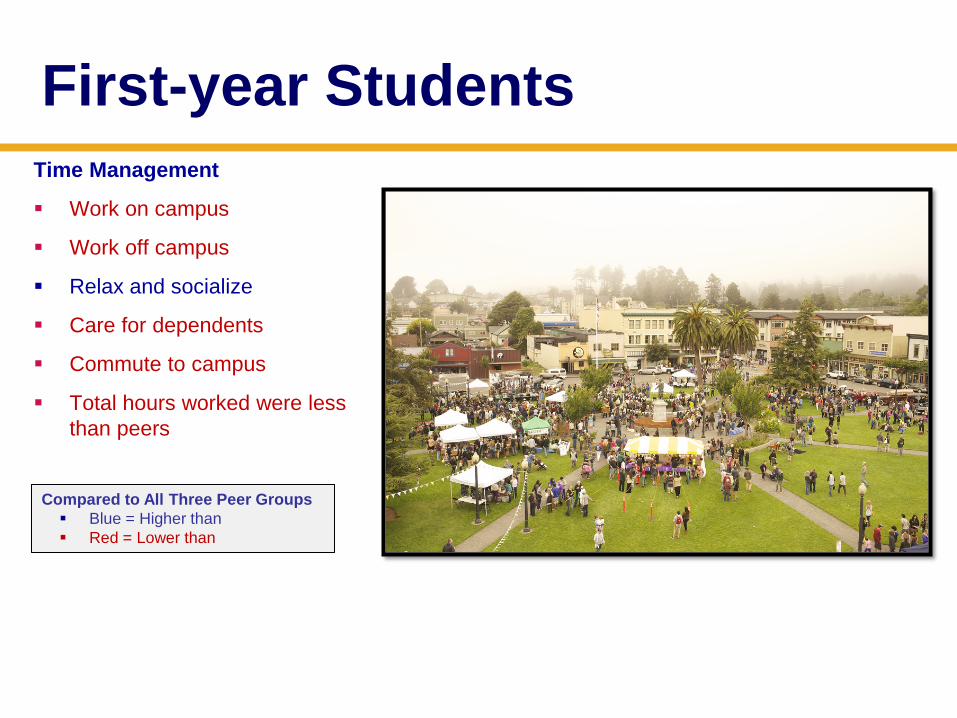
First-year Students Time Management
Work on campus
Work off campus
Relax and socialize
Care for dependents
Commute to campus
Total hours worked were less than peers
Compared to All Three Peer Groups Blue = Higher than Red = Lower than
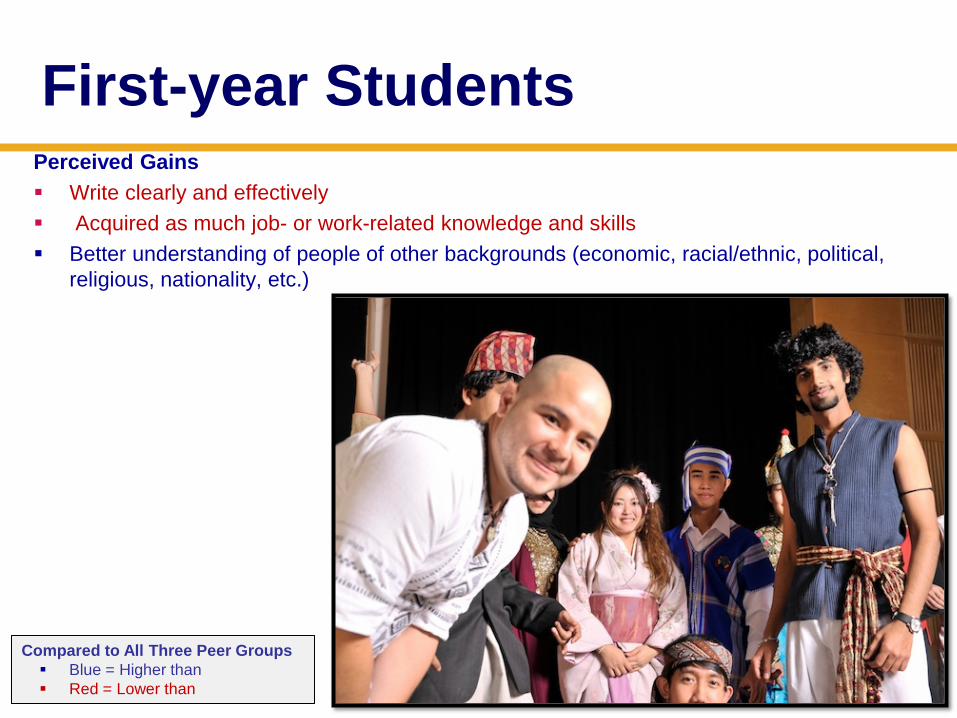
First-year Students Perceived Gains Write clearly and effectively Acquired as much job- or work-related knowledge and skills Better understanding of people of other backgrounds (economic, racial/ethnic, political,
religious, nationality, etc.)
Compared to All Three Peer Groups Blue = Higher than Red = Lower than
First-year Students Writing
Argue a position using evidence and reasoning in their writing
Write in the style and format of a specific field less often than their peers.
Instructors provided clear instructions describing what he or she wanted the student to do
Campus Quality Survey
Only 43% of respondents frequently wrote a term paper. Seniors wrote the most (52%) and freshmen wrote the least (26%). Less than 50% of respondents found writing a term paper difficult.
Students wrote a term paper or prepared/delivered an oral presentation less often than students at two other CSUs used for comparison
Compared to All Three Peer Groups Blue = Higher than Red = Lower than
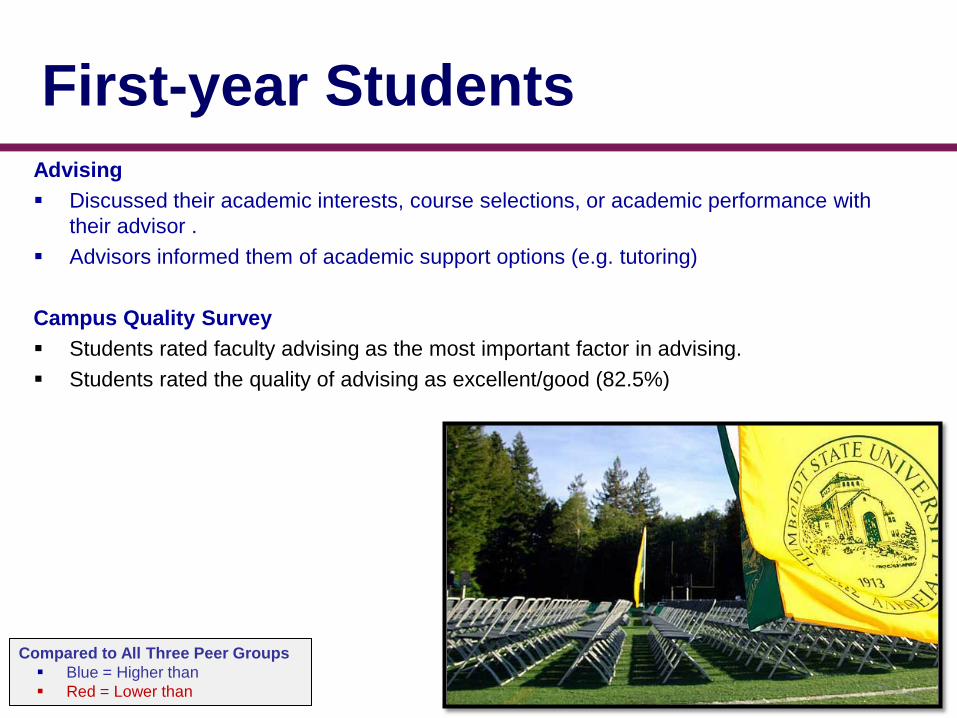
First-year Students Advising Discussed their academic interests, course selections, or academic performance with
their advisor . Advisors informed them of academic support options (e.g. tutoring)
Campus Quality Survey Students rated faculty advising as the most important factor in advising. Students rated the quality of advising as excellent/good (82.5%)
Compared to All Three Peer Groups Blue = Higher than Red = Lower than
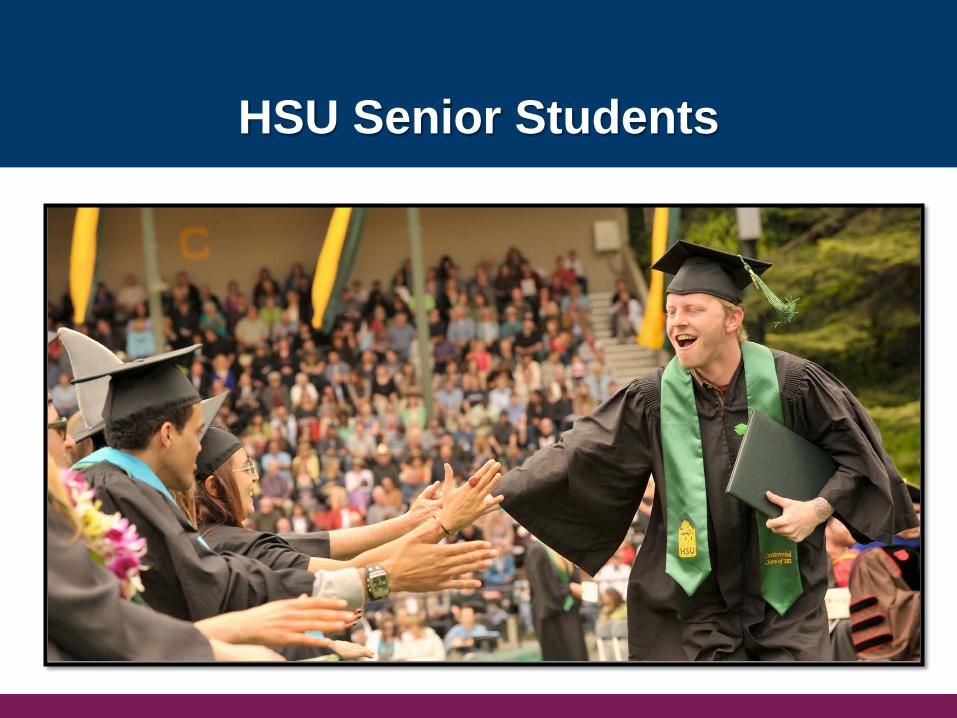
HSU Senior Students
Senior Students 2013 Classroom Engagement
Asked questions or contributed to course discussions in other ways
Prepared two or more drafts of a paper or assignment before turning it in
Went to class without completing readings or assignments
Attended an art exhibit, play or other arts performance (dance, music, etc.)
2008 Classroom Engagement
Asked questions or contributed to course discussions in other ways more often than CSU students, but less often than CC peers
Prepared two or more drafts of a paper or assignment before turning it in more often than overall NSSE participants
Came to class without completing readings or assignments less often than peers
Compared to All Three Peer Groups Blue = Higher than Red = Lower than
Senior Students Collaborative Learning
Asked another student to help him/her understand course material
Explained course material to one or more students
Prepared for exams by discussing or working through course material with other students
Worked with other students on course projects or assignments
Gave a course presentation
2008 Collaborative Learning
Worked with other students on course projects or assignments less often than peers
Gave a course presentation less often than peers
Compared to All Three Peer Groups Blue = Higher than Red = Lower than
Senior Students Reflective and Interactive Learning
Combined ideas from different courses when completing assignments
Connected their learning to societal problems or issues
Examined the strengths and weaknesses of their own views on a topic or issue
Tried to better understand someone else's views by imagining how an issue looks from his or her perspective
Learned something that changed the way you understand an issue or concept
Connected ideas from their courses to their prior experiences and knowledge
Compared to All Three Peer Groups Blue = Higher than Red = Lower than
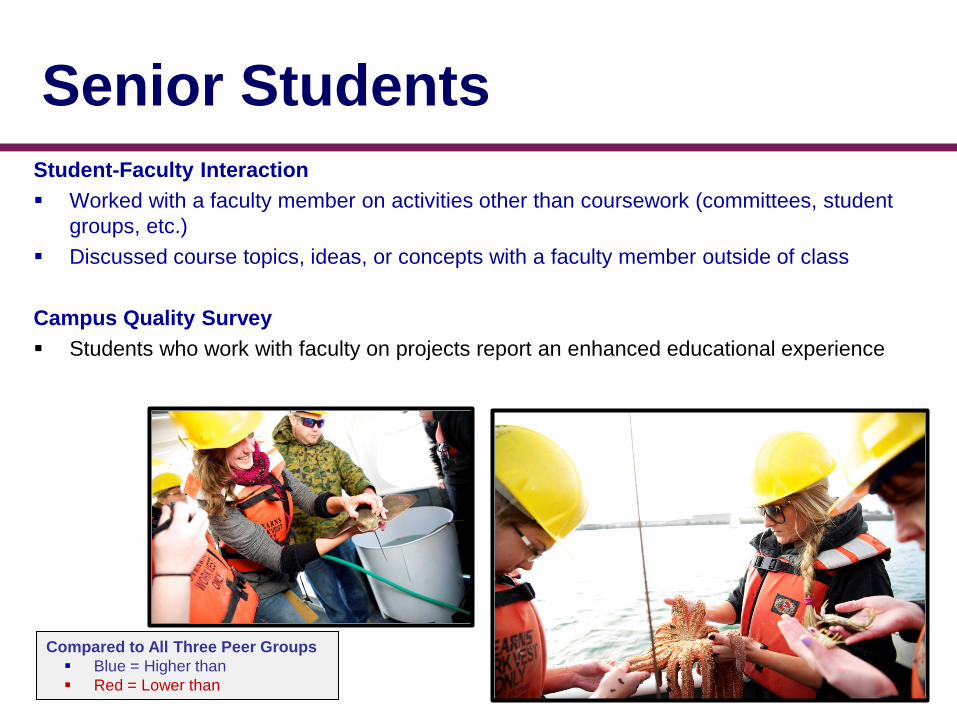
Senior Students Student-Faculty Interaction Worked with a faculty member on activities other than coursework (committees, student
groups, etc.) Discussed course topics, ideas, or concepts with a faculty member outside of class
Campus Quality Survey Students who work with faculty on projects report an enhanced educational experience
Compared to All Three Peer Groups Blue = Higher than Red = Lower than
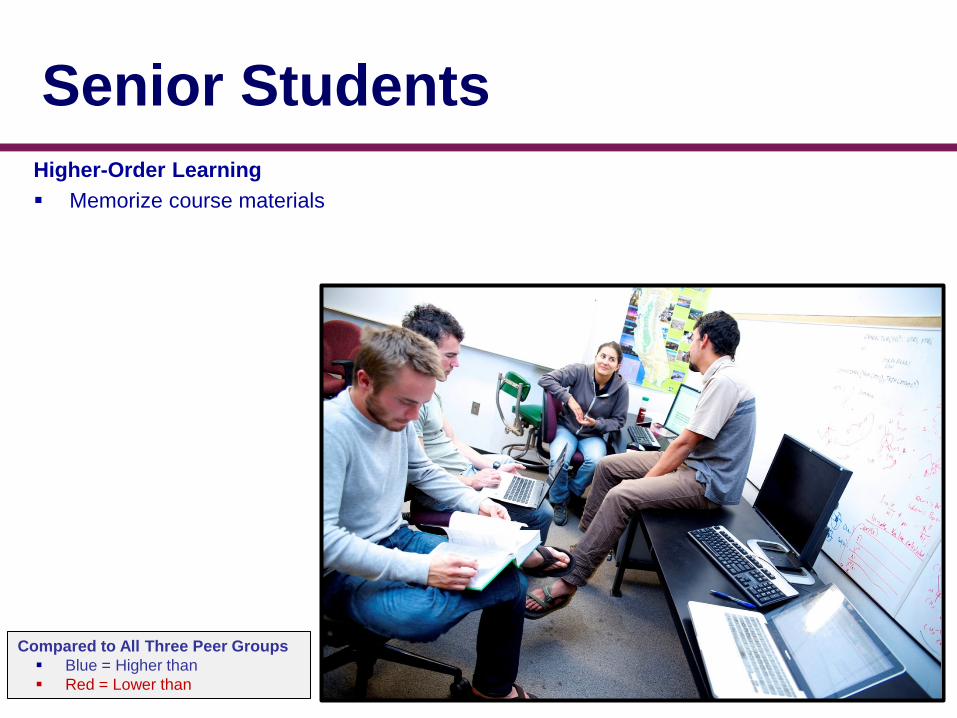
Senior Students Higher-Order Learning Memorize course materials
Compared to All Three Peer Groups Blue = Higher than Red = Lower than
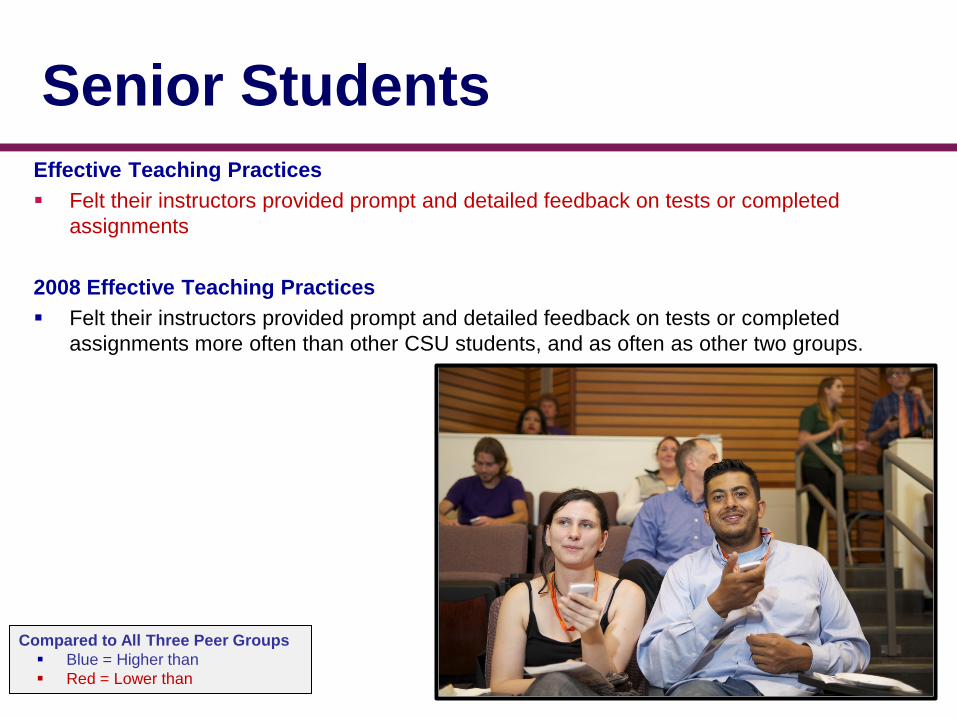
Senior Students Effective Teaching Practices Felt their instructors provided prompt and detailed feedback on tests or completed
assignments
2008 Effective Teaching Practices Felt their instructors provided prompt and detailed feedback on tests or completed
assignments more often than other CSU students, and as often as other two groups.
Compared to All Three Peer Groups Blue = Higher than Red = Lower than
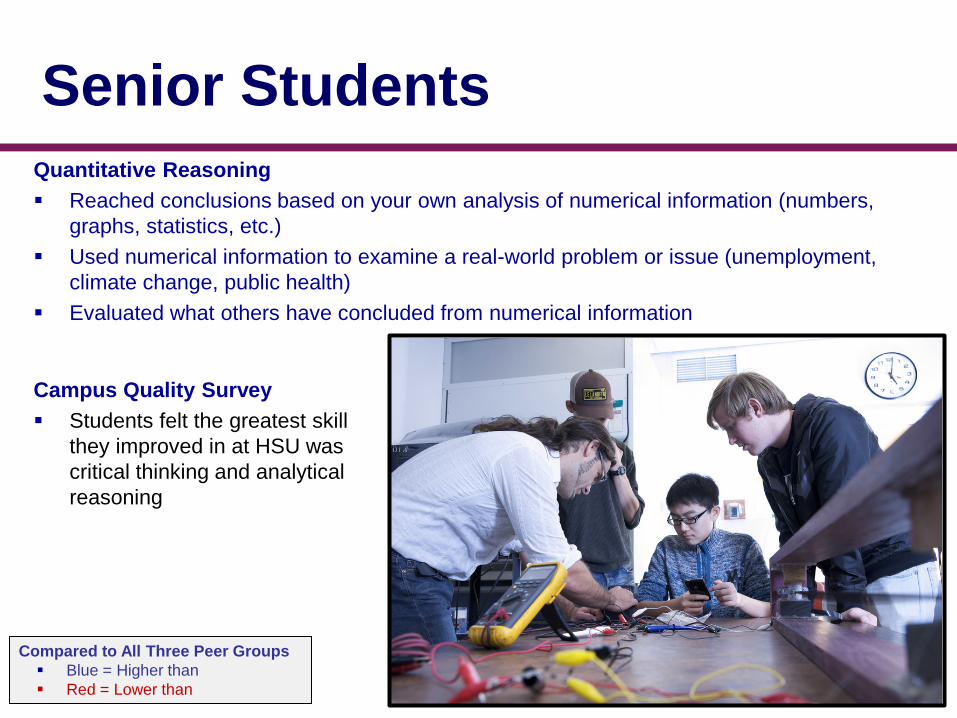
Senior Students Quantitative Reasoning Reached conclusions based on your own analysis of numerical information (numbers,
graphs, statistics, etc.) Used numerical information to examine a real-world problem or issue (unemployment,
climate change, public health) Evaluated what others have concluded from numerical information
Campus Quality Survey Students felt the greatest skill
they improved in at HSU was critical thinking and analytical reasoning
Compared to All Three Peer Groups Blue = Higher than Red = Lower than
Senior Students Reading and Writing Frequency Time spent on assigned reading
Compared to All Three Peer Groups Blue = Higher than Red = Lower than
Senior Students Discussions with Diverse Others Had discussions with people of a race or ethnicity other than their own Had discussions with people from a different economic background other than their own Had discussions with people with political views other than their own
Compared to All Three Peer Groups Blue = Higher than Red = Lower than
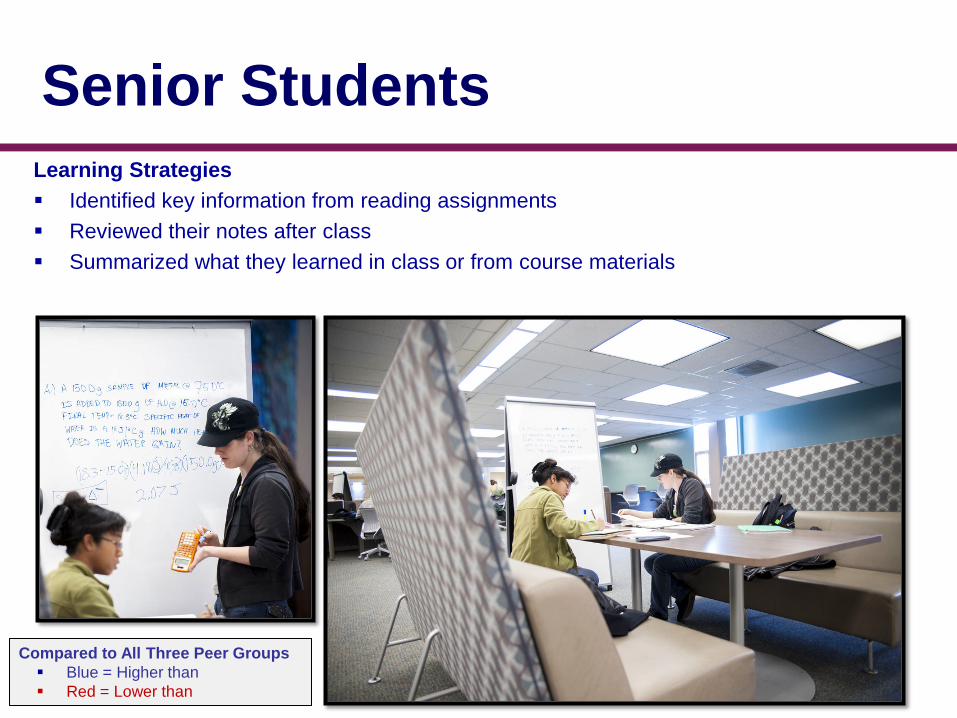
Senior Students Learning Strategies Identified key information from reading assignments Reviewed their notes after class Summarized what they learned in class or from course materials
Compared to All Three Peer Groups Blue = Higher than Red = Lower than
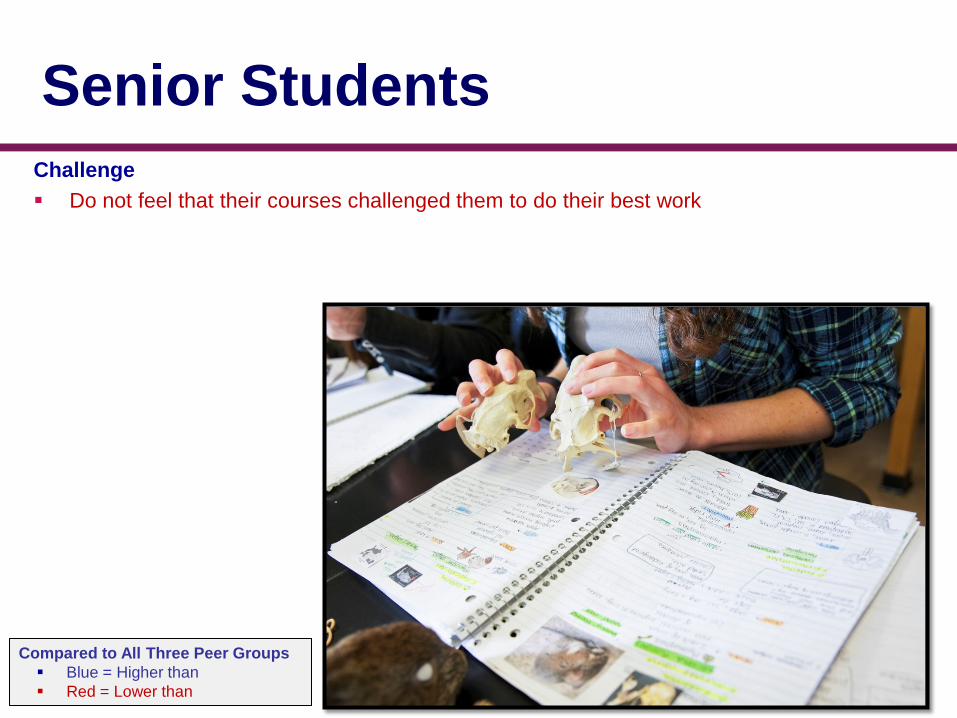
Senior Students Challenge Do not feel that their courses challenged them to do their best work
Compared to All Three Peer Groups Blue = Higher than Red = Lower than
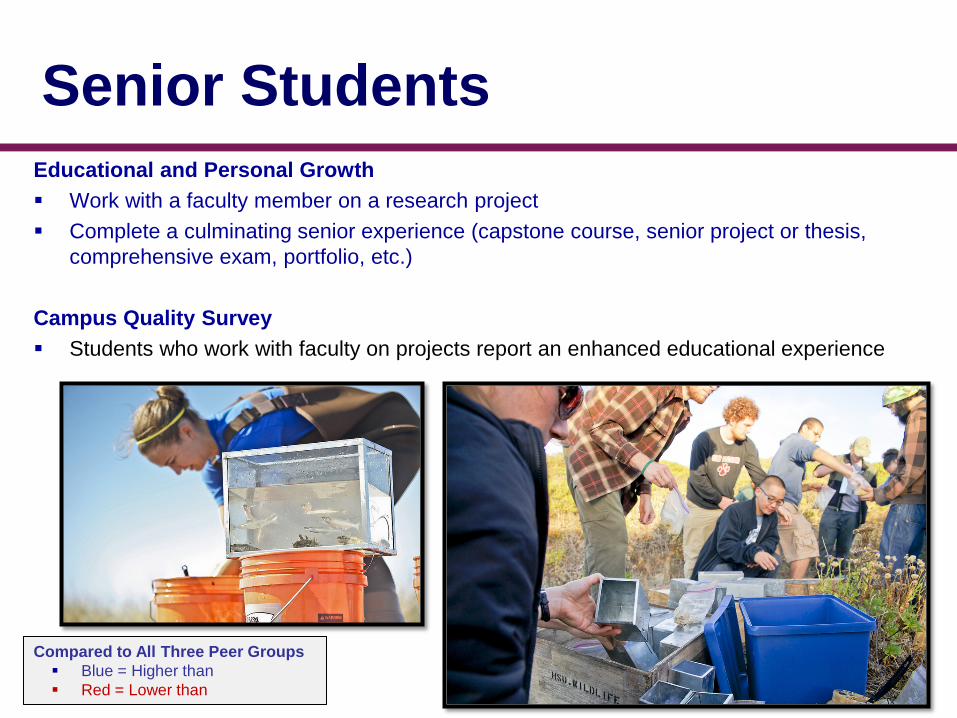
Senior Students Educational and Personal Growth Work with a faculty member on a research project Complete a culminating senior experience (capstone course, senior project or thesis,
comprehensive exam, portfolio, etc.)
Campus Quality Survey Students who work with faculty on projects report an enhanced educational experience
Compared to All Three Peer Groups Blue = Higher than Red = Lower than
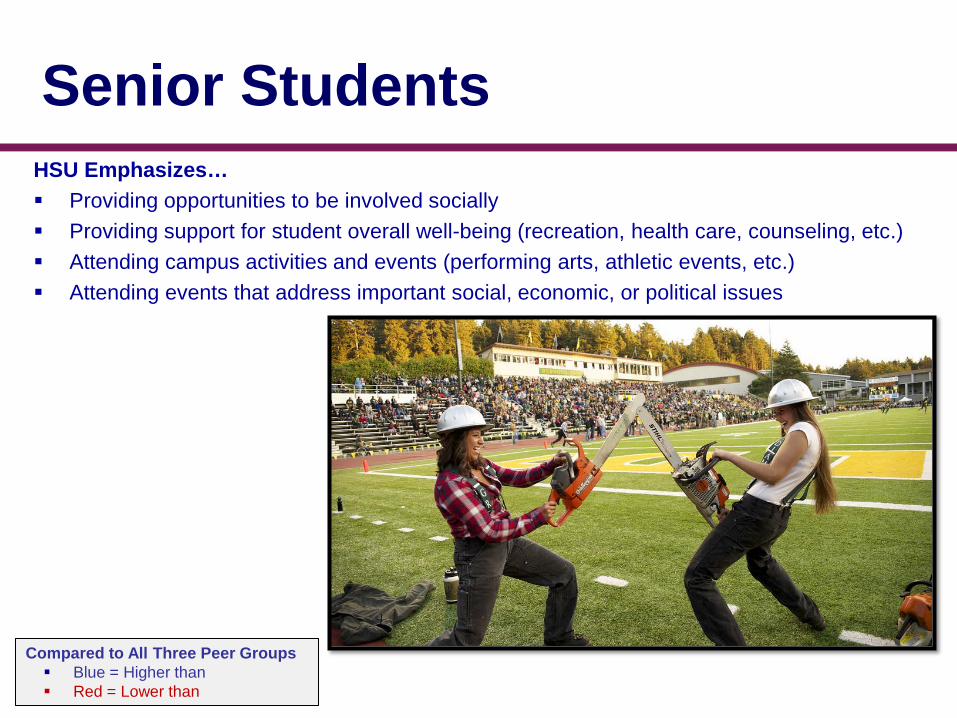
Senior Students HSU Emphasizes… Providing opportunities to be involved socially Providing support for student overall well-being (recreation, health care, counseling, etc.) Attending campus activities and events (performing arts, athletic events, etc.) Attending events that address important social, economic, or political issues
Compared to All Three Peer Groups Blue = Higher than Red = Lower than
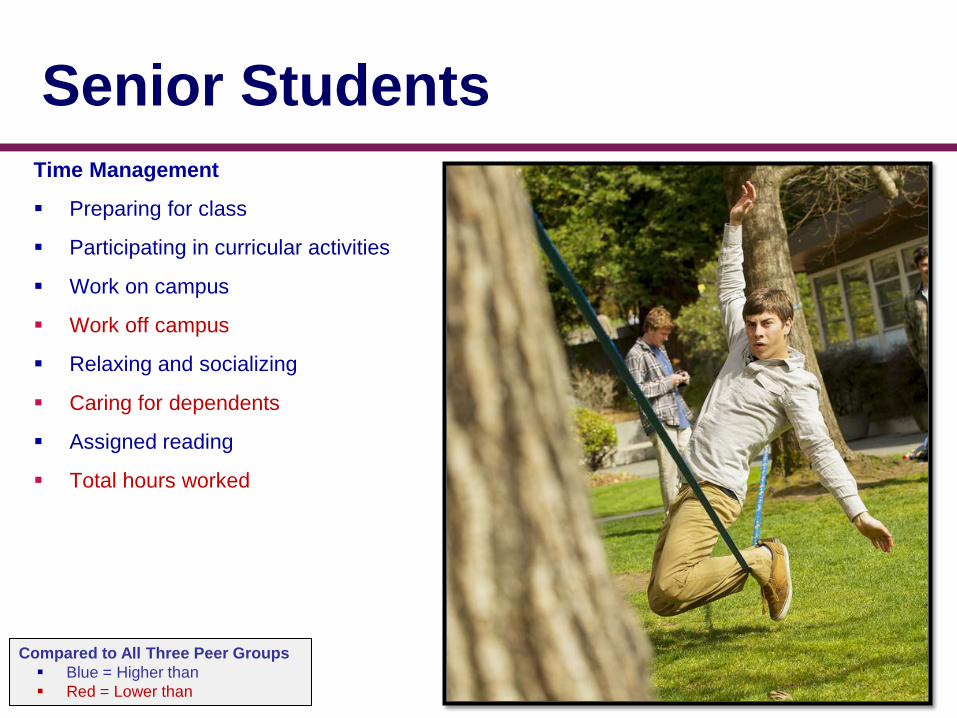
Senior Students Time Management
Preparing for class
Participating in curricular activities
Work on campus
Work off campus
Relaxing and socializing
Caring for dependents
Assigned reading
Total hours worked
Compared to All Three Peer Groups Blue = Higher than Red = Lower than
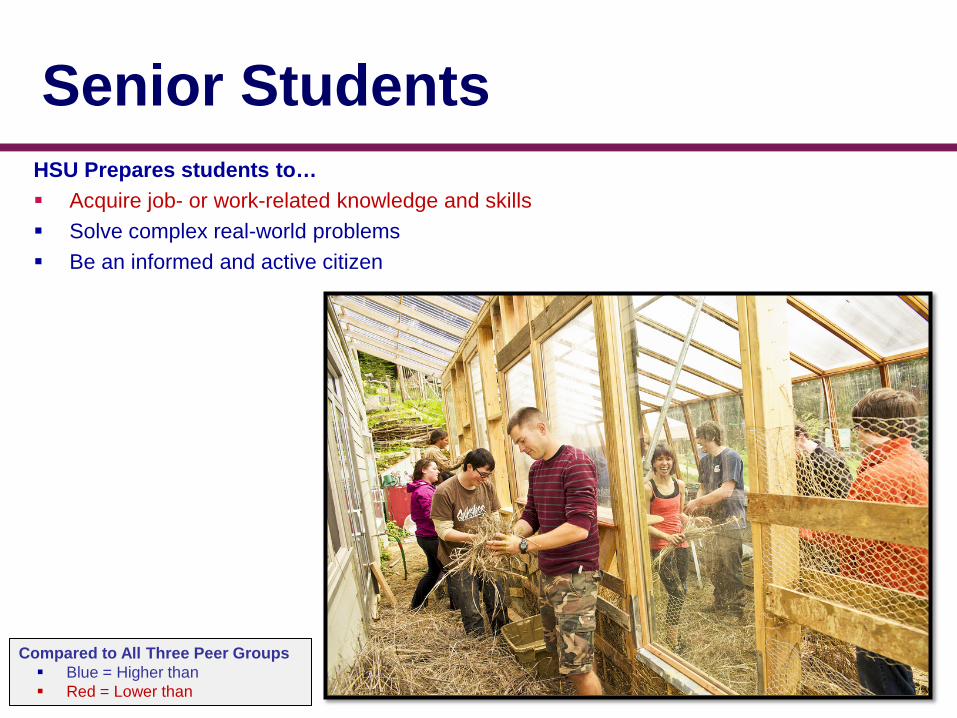
Senior Students HSU Prepares students to… Acquire job- or work-related knowledge and skills Solve complex real-world problems Be an informed and active citizen
Compared to All Three Peer Groups Blue = Higher than Red = Lower than
Senior Students Writing Developed ideas before starting assignment Received feedback on a draft before final assignment Gave feedback to a classmate about a draft or outline Analyzed something read, researched, or observed Described methods or findings related to data Argued a position using evidence and reasoning Explained in writing the meaning of statistical data Wrote in the style and format of a specific field Addressed a real or imagined audience Explained in advance learning objectives Campus Quality Survey Only 43% of respondents frequently wrote a term paper. Seniors wrote the most (52%) and
freshmen wrote the least (26%). Less than 50% of respondents found writing a term paper difficult.
Students wrote a term paper less often than students at two other CSUs used for comparison Compared to All Three Peer Groups Blue = Higher than Red = Lower than
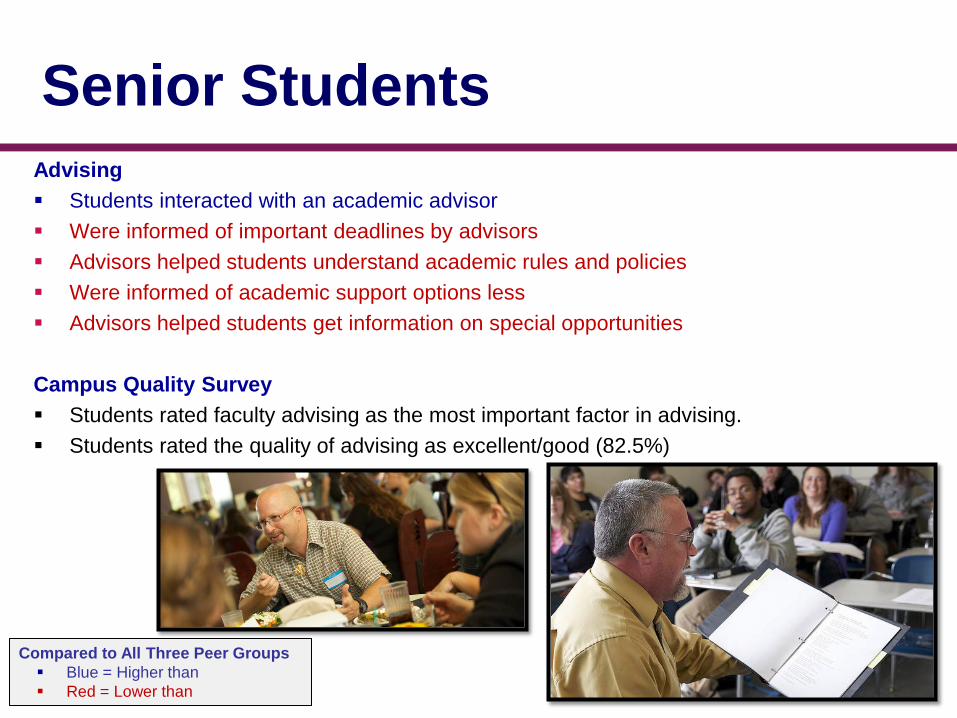
Senior Students Advising Students interacted with an academic advisor Were informed of important deadlines by advisors Advisors helped students understand academic rules and policies Were informed of academic support options less Advisors helped students get information on special opportunities
Campus Quality Survey Students rated faculty advising as the most important factor in advising. Students rated the quality of advising as excellent/good (82.5%)
Compared to All Three Peer Groups Blue = Higher than Red = Lower than
Questions & Discussion