Embed Size (px)
Citation preview
OFFICE OF RESEARCH ADMINISTRATIONPROCESS IMPROVEMENT TOOL KIT
OFFICE OF RESEARCH ADMINISTRATION
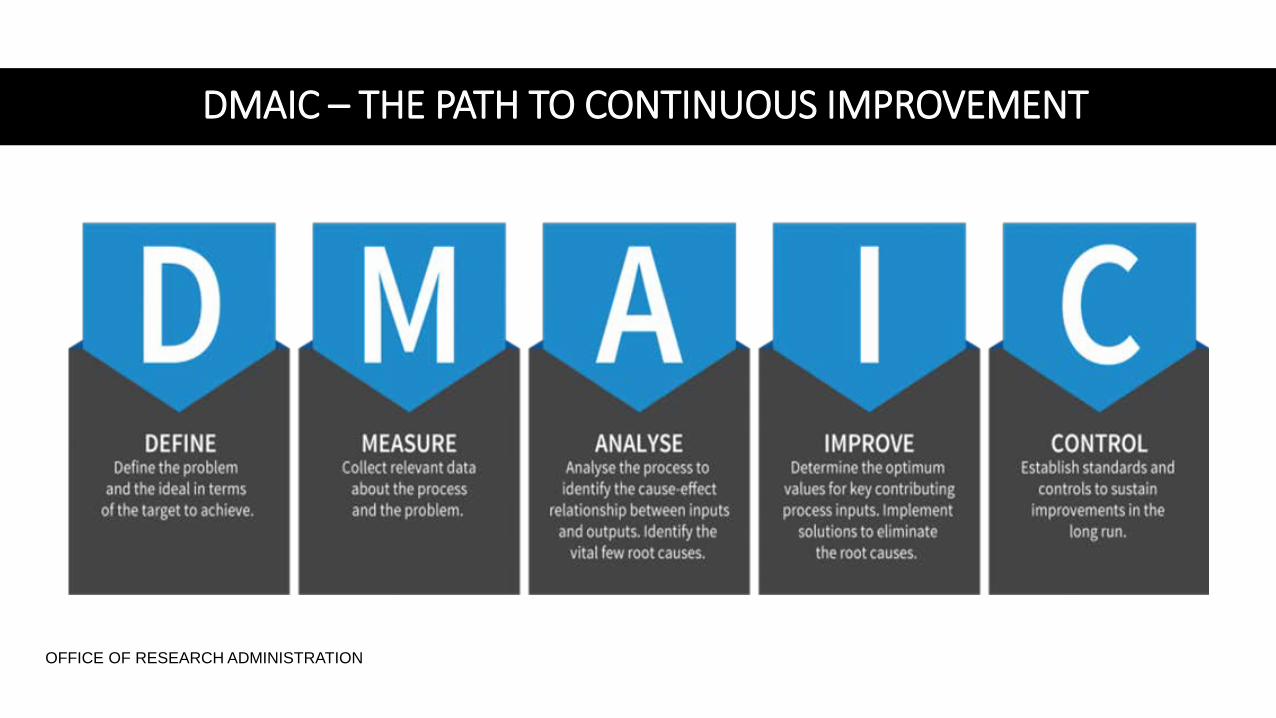
DMAIC – THE PATH TO CONTINUOUS IMPROVEMENT
OFFICE OF RESEARCH ADMINISTRATION
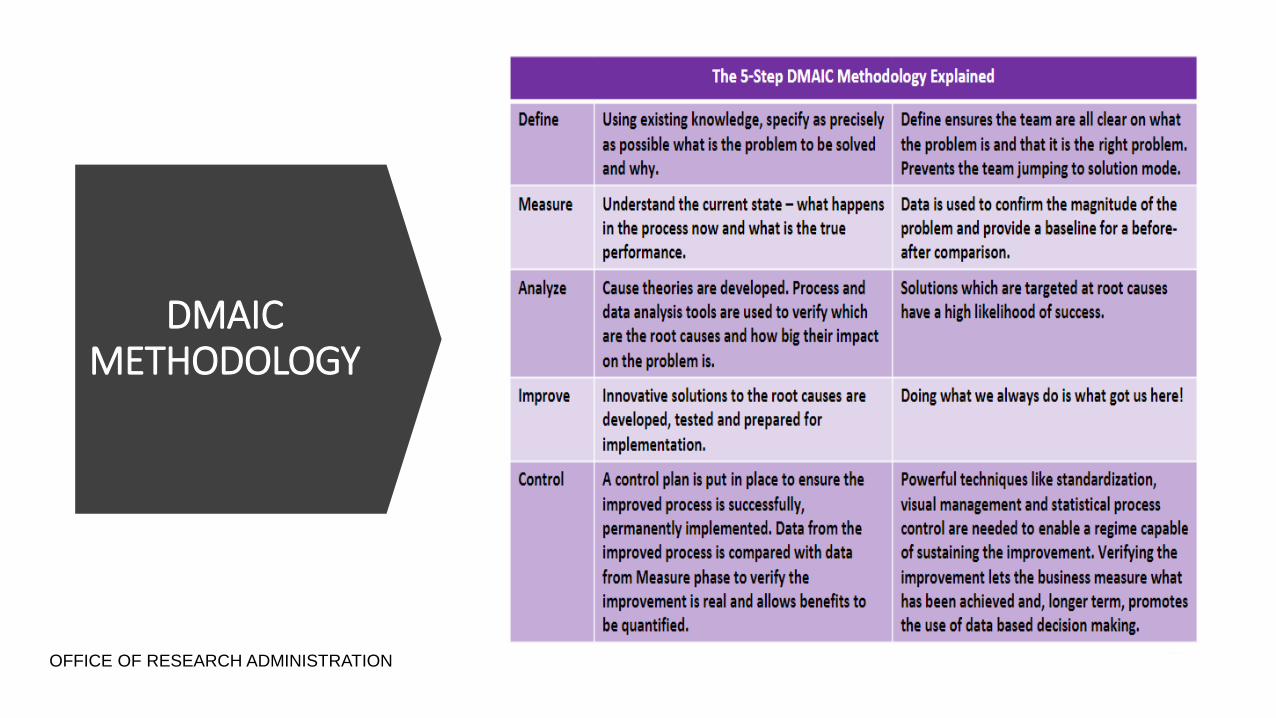
DMAIC METHODOLOGY
OFFICE OF RESEARCH ADMINISTRATION
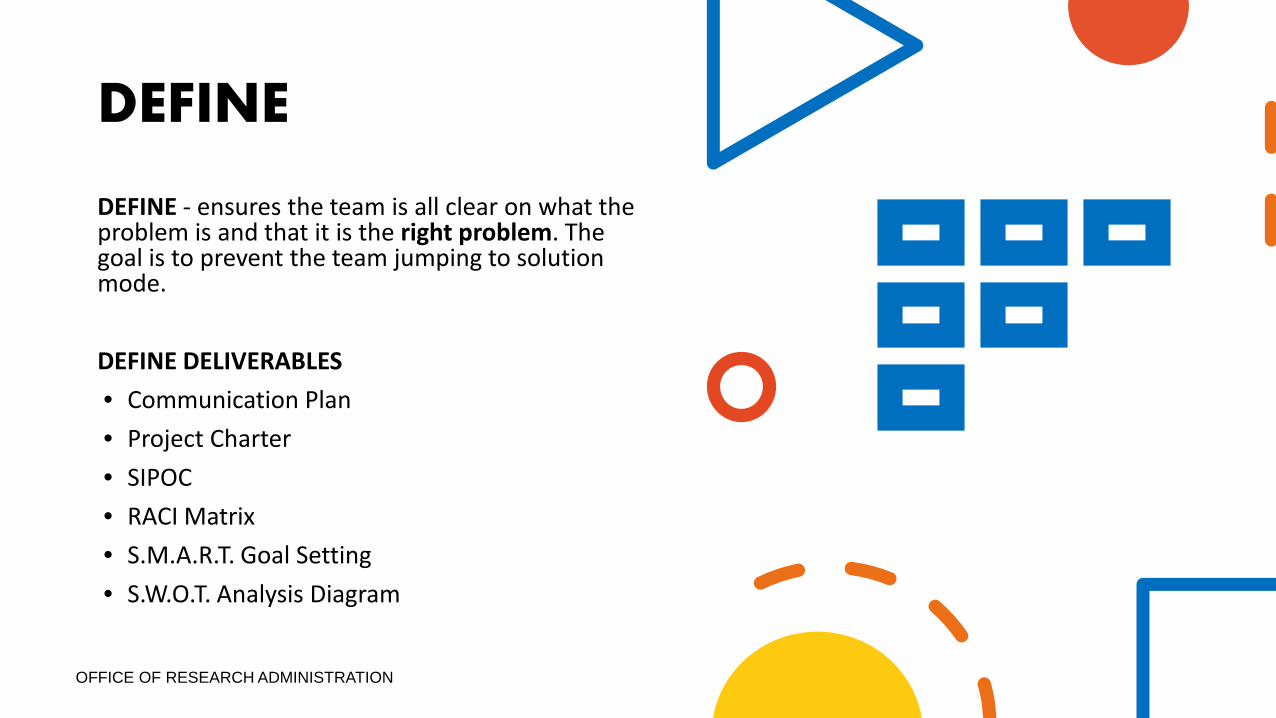
DEFINE
DEFINE - ensures the team is all clear on what the problem is and that it is the right problem. The goal is to prevent the team jumping to solution mode.
DEFINE DELIVERABLES• Communication Plan• Project Charter• SIPOC• RACI Matrix • S.M.A.R.T. Goal Setting• S.W.O.T. Analysis Diagram
OFFICE OF RESEARCH ADMINISTRATION
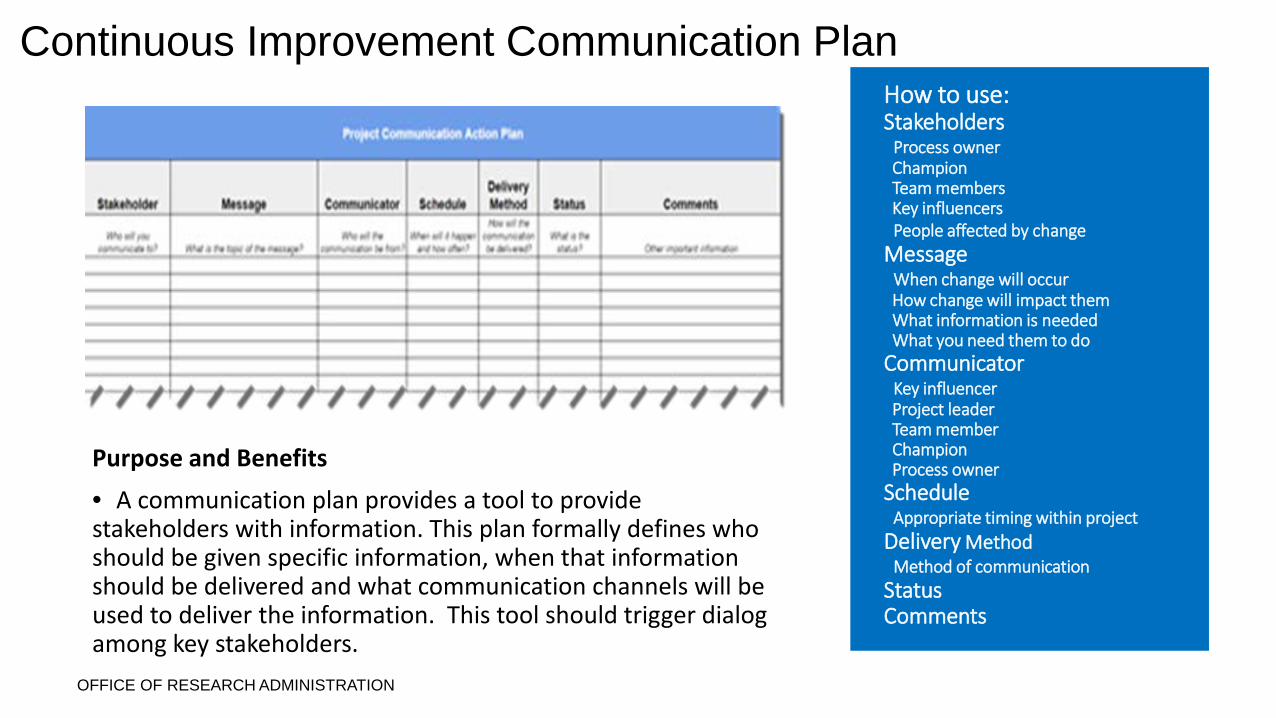
How to use:Stakeholders
Process ownerChampionTeam membersKey influencersPeople affected by change
MessageWhen change will occurHow change will impact themWhat information is needed What you need them to do
CommunicatorKey influencerProject leaderTeam memberChampionProcess owner
ScheduleAppropriate timing within project
Delivery MethodMethod of communication
StatusComments
Purpose and Benefits• A communication plan provides a tool to provide stakeholders with information. This plan formally defines who should be given specific information, when that information should be delivered and what communication channels will be used to deliver the information. This tool should trigger dialog among key stakeholders.
OFFICE OF RESEARCH ADMINISTRATION
Continuous Improvement Communication Plan
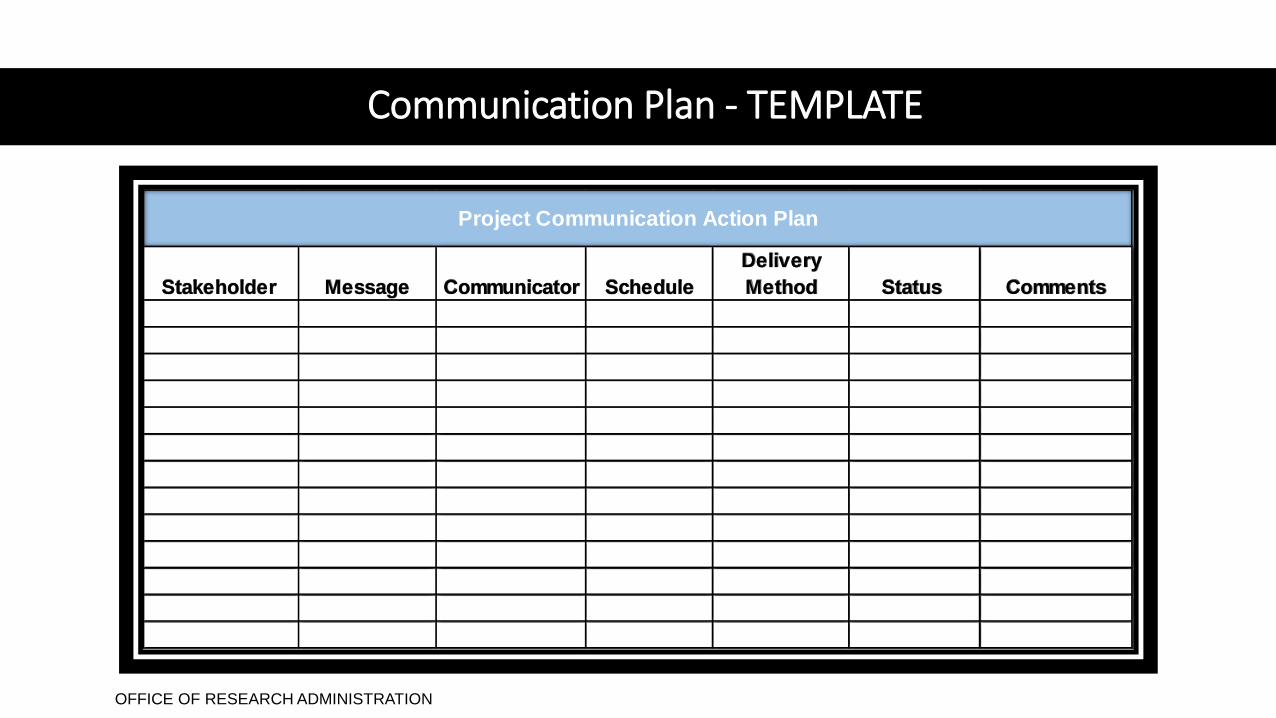
Communication Plan - TEMPLATE
Stakeholder Message Communicator ScheduleDelivery Method Status Comments
Project Communication Action Plan
OFFICE OF RESEARCH ADMINISTRATION
Continuous Improvement Project Charter
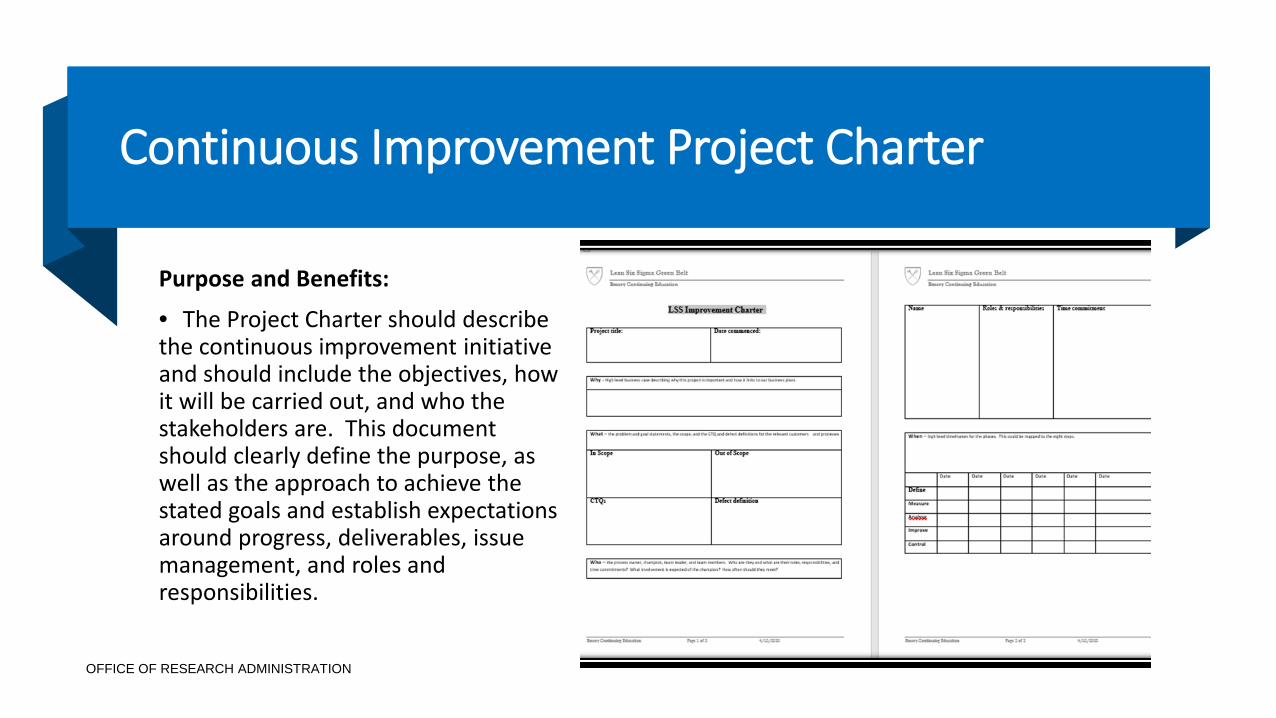
Purpose and Benefits:
• The Project Charter should describe the continuous improvement initiative and should include the objectives, how it will be carried out, and who the stakeholders are. This document should clearly define the purpose, as well as the approach to achieve the stated goals and establish expectations around progress, deliverables, issue management, and roles and responsibilities.
OFFICE OF RESEARCH ADMINISTRATION
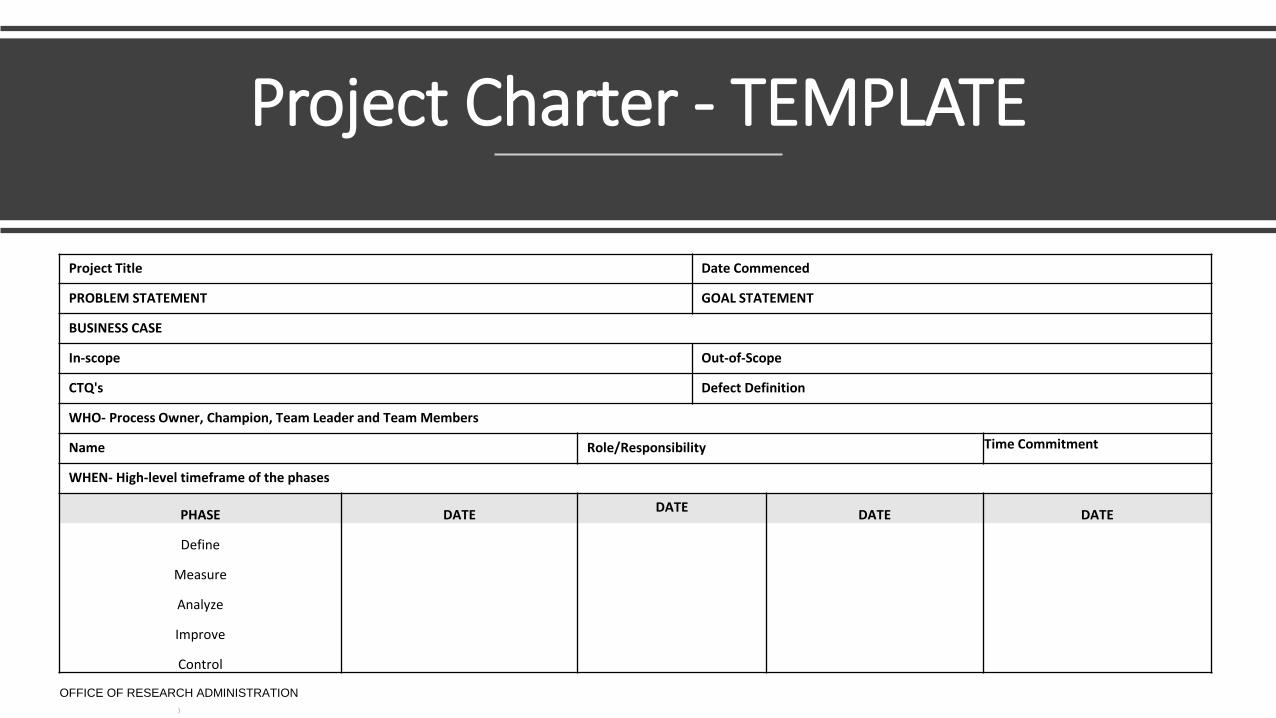
Project Charter - TEMPLATE
OFFICE OF RESEARCH ADMINISTRATION)
Project Title Date Commenced
PROBLEM STATEMENT GOAL STATEMENT
BUSINESS CASE
In-scope Out-of-Scope
CTQ's Defect Definition
WHO- Process Owner, Champion, Team Leader and Team Members
Name Role/Responsibility Time Commitment
WHEN- High-level timeframe of the phases
PHASE DATE DATE DATE DATE
Define
Measure
Analyze
Improve
Control
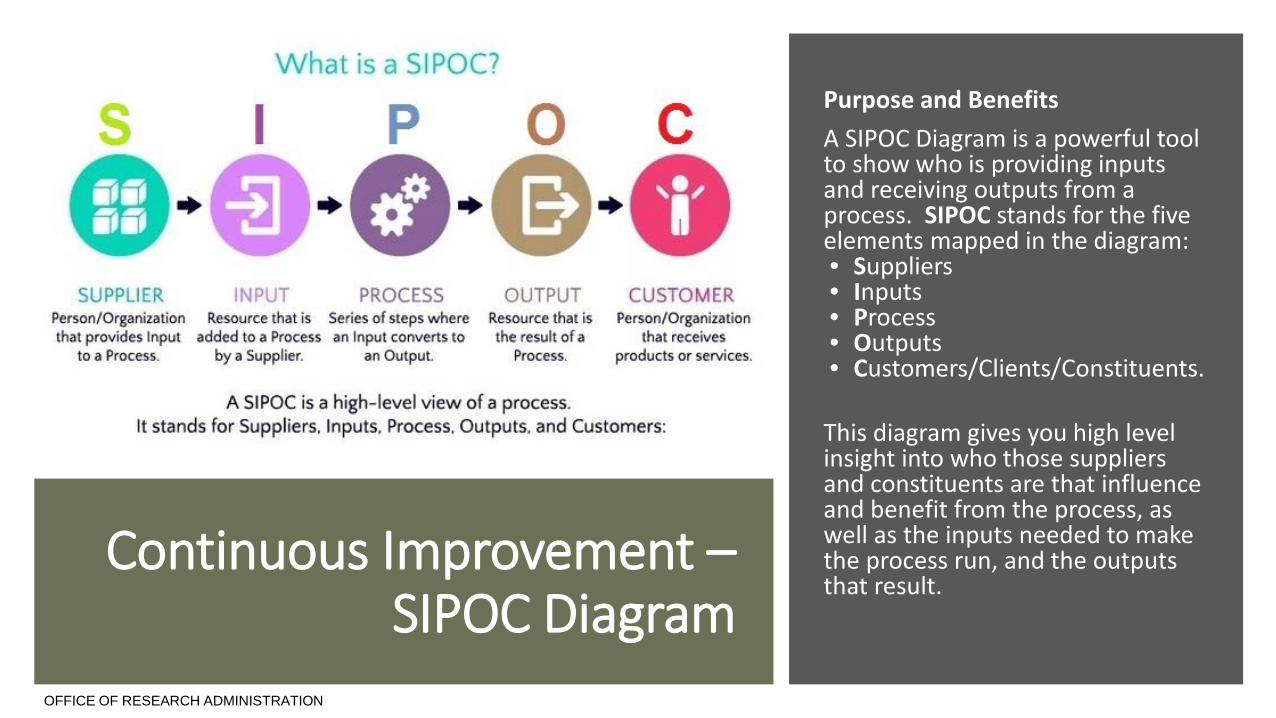
Continuous Improvement –SIPOC Diagram
OFFICE OF RESEARCH ADMINISTRATION
Purpose and BenefitsA SIPOC Diagram is a powerful tool to show who is providing inputs and receiving outputs from a process. SIPOC stands for the five elements mapped in the diagram: • Suppliers• Inputs• Process• Outputs• Customers/Clients/Constituents.
This diagram gives you high level insight into who those suppliers and constituents are that influence and benefit from the process, as well as the inputs needed to make the process run, and the outputs that result.
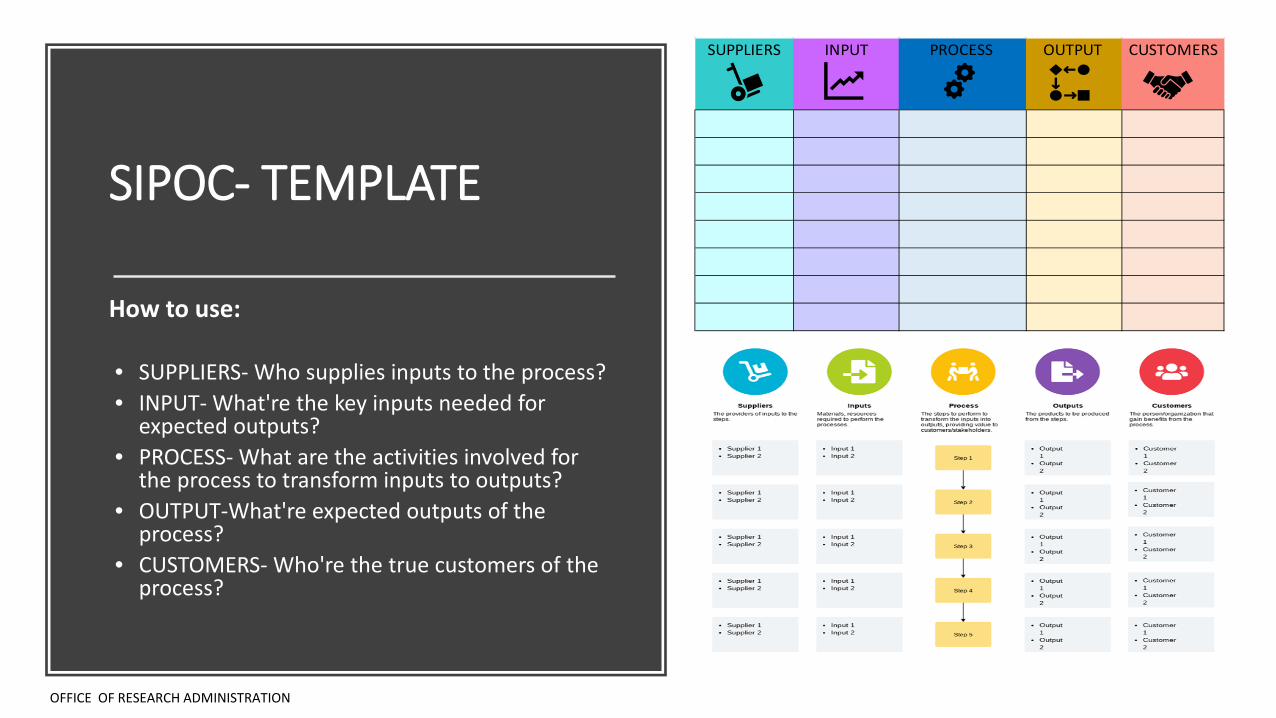
SIPOC- TEMPLATE
How to use:
• SUPPLIERS- Who supplies inputs to the process?• INPUT- What're the key inputs needed for
expected outputs?• PROCESS- What are the activities involved for
the process to transform inputs to outputs?• OUTPUT-What're expected outputs of the
process?• CUSTOMERS- Who're the true customers of the
process?
OFFICE OF RESEARCH ADMINISTRATION
SUPPLIERS INPUT PROCESS OUTPUT CUSTOMERS
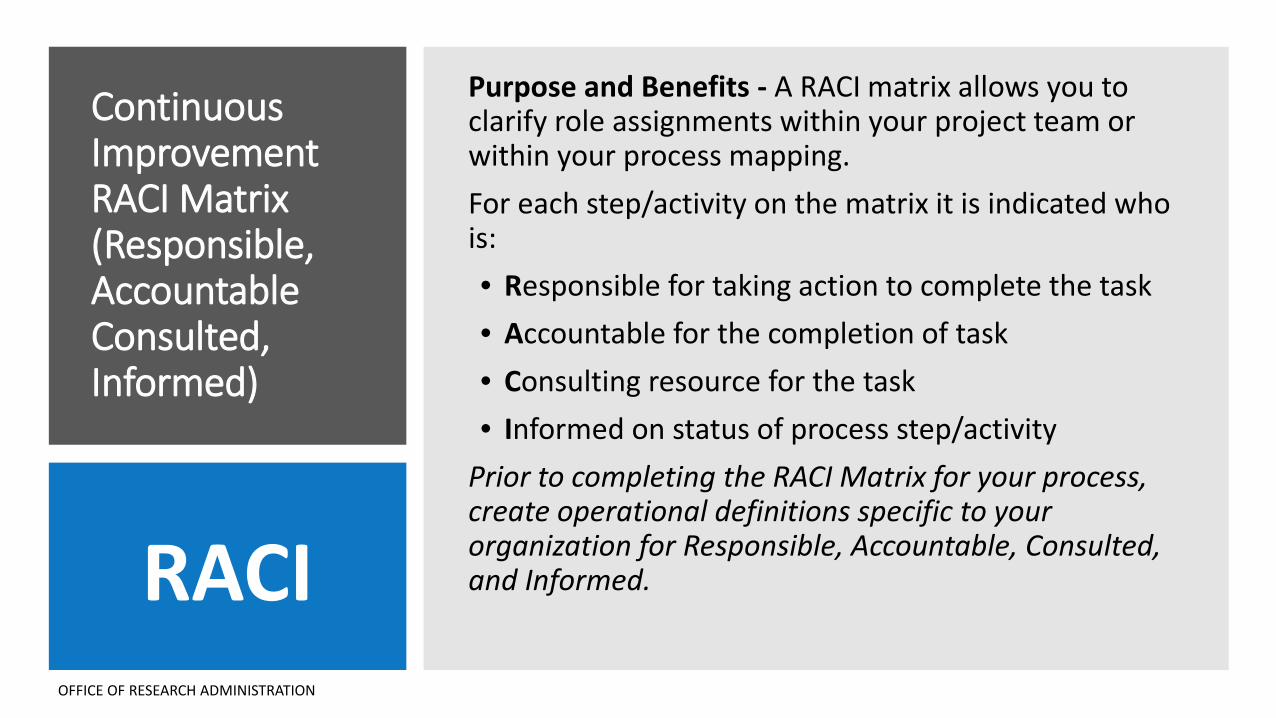
Continuous Improvement RACI Matrix(Responsible, Accountable Consulted, Informed)
Purpose and Benefits - A RACI matrix allows you to clarify role assignments within your project team or within your process mapping.For each step/activity on the matrix it is indicated who is:• Responsible for taking action to complete the task• Accountable for the completion of task• Consulting resource for the task• Informed on status of process step/activity
Prior to completing the RACI Matrix for your process, create operational definitions specific to your organization for Responsible, Accountable, Consulted, and Informed.
OFFICE OF RESEARCH ADMINISTRATION
RACI
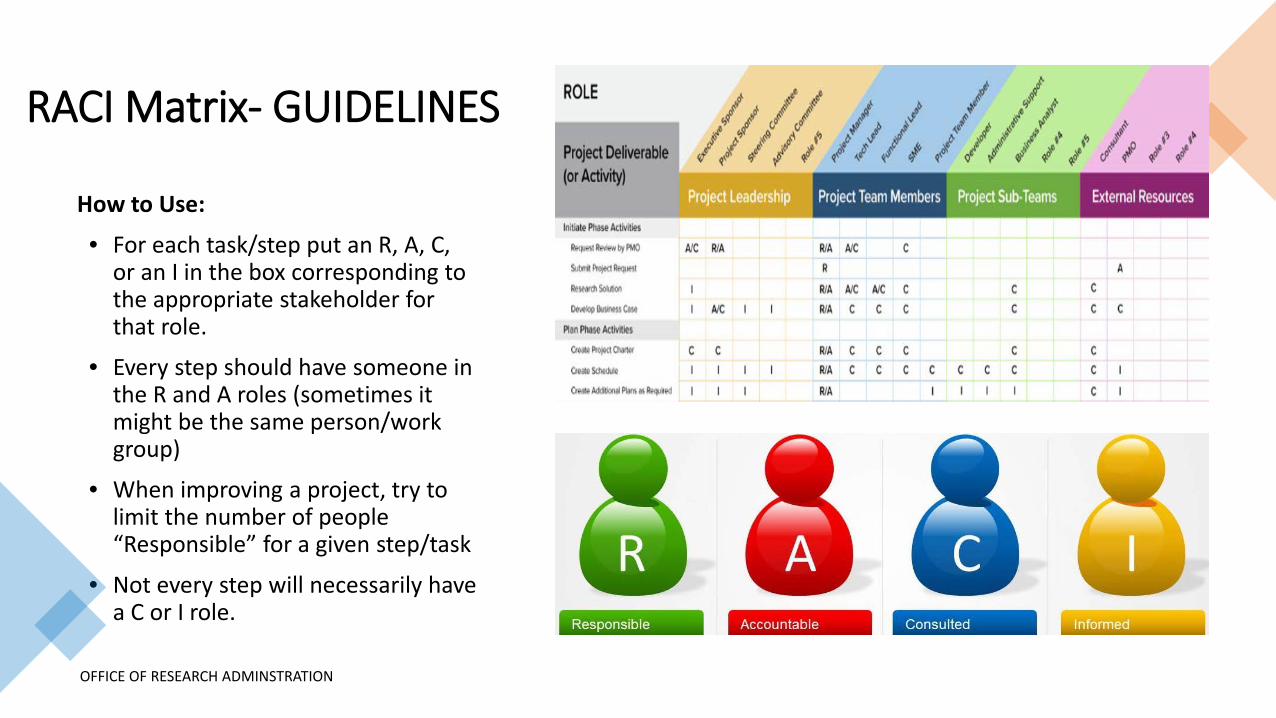
RACI Matrix- GUIDELINES
How to Use:
• For each task/step put an R, A, C, or an I in the box corresponding to the appropriate stakeholder for that role.
• Every step should have someone in the R and A roles (sometimes it might be the same person/work group)
• When improving a project, try to limit the number of people “Responsible” for a given step/task
• Not every step will necessarily have a C or I role.
OFFICE OF RESEARCH ADMINSTRATION
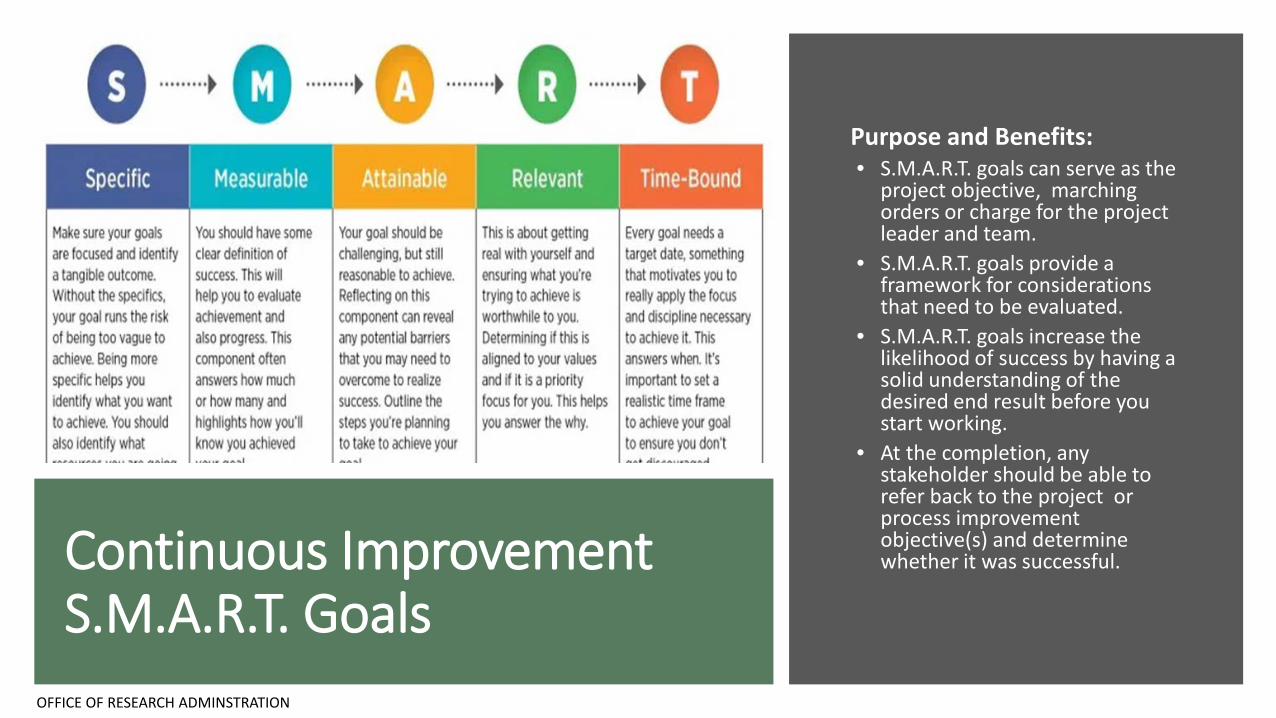
Continuous Improvement S.M.A.R.T. Goals
Purpose and Benefits:• S.M.A.R.T. goals can serve as the
project objective, marching orders or charge for the project leader and team.
• S.M.A.R.T. goals provide a framework for considerations that need to be evaluated.
• S.M.A.R.T. goals increase the likelihood of success by having a solid understanding of the desired end result before you start working.
• At the completion, any stakeholder should be able to refer back to the project or process improvement objective(s) and determine whether it was successful.
OFFICE OF RESEARCH ADMINSTRATION
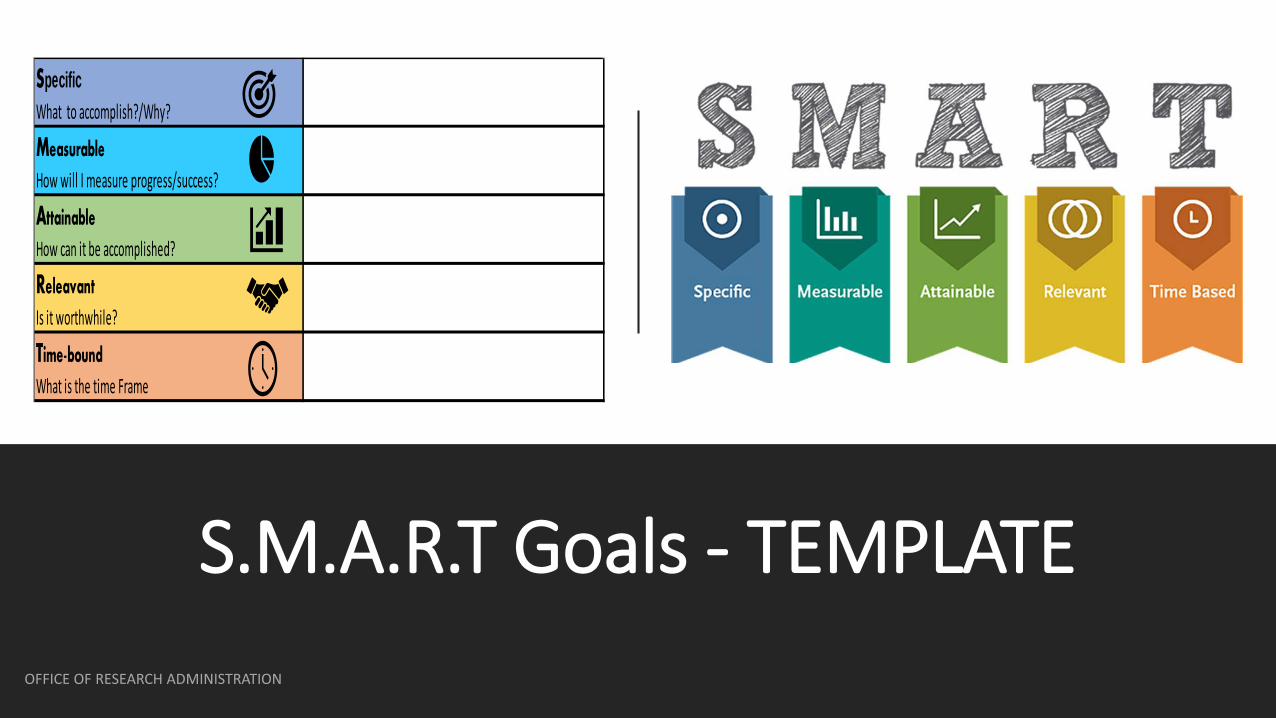
S.M.A.R.T Goals - TEMPLATE
SpecificWhat to accomplish?/Why?
MeasurableHow will I measure progress/success?
AttainableHow can it be accomplished?
ReleavantIs it worthwhile?
Time-boundWhat is the time Frame
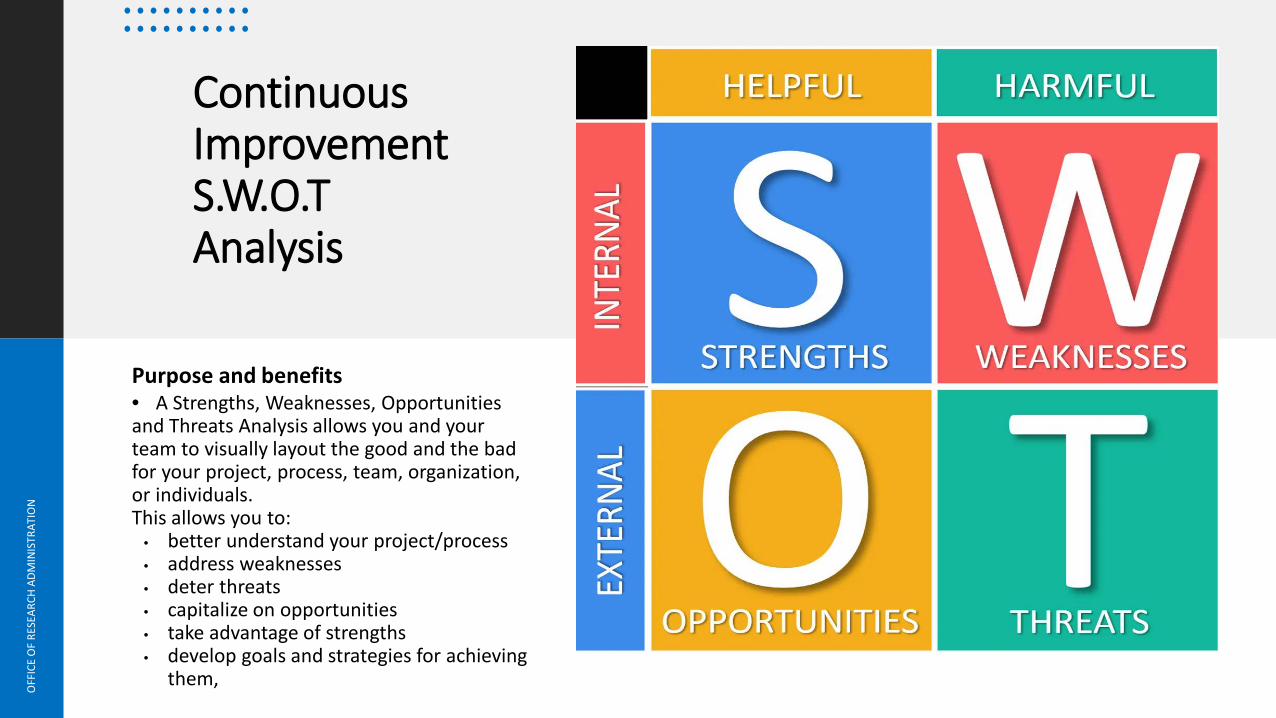
Continuous Improvement S.W.O.T Analysis
OFF
ICE
OF
RESE
ARCH
ADM
INIS
TRAT
ION
Purpose and benefits• A Strengths, Weaknesses, Opportunities and Threats Analysis allows you and your team to visually layout the good and the bad for your project, process, team, organization, or individuals.This allows you to:
• better understand your project/process• address weaknesses• deter threats• capitalize on opportunities• take advantage of strengths• develop goals and strategies for achieving
them,
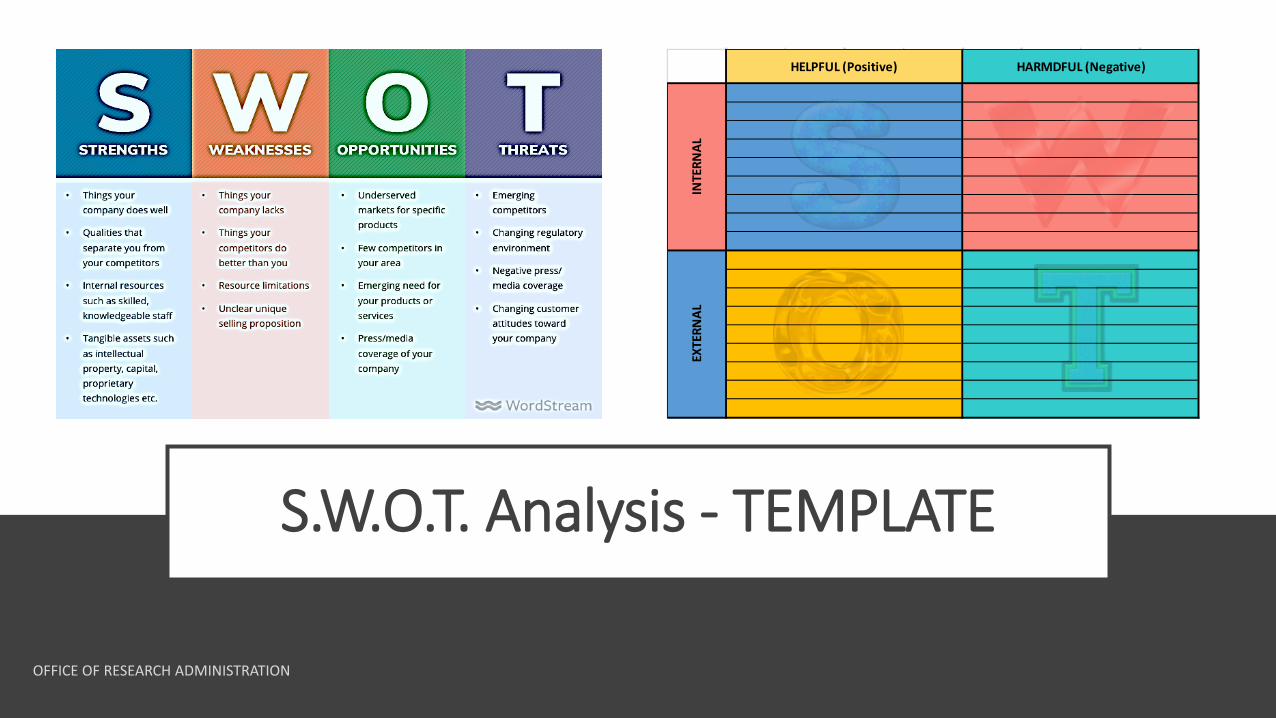
S.W.O.T. Analysis - TEMPLATE
HELPFUL (Positive) HARMDFUL (Negative)
INTE
RNAL
EXTE
RNAL
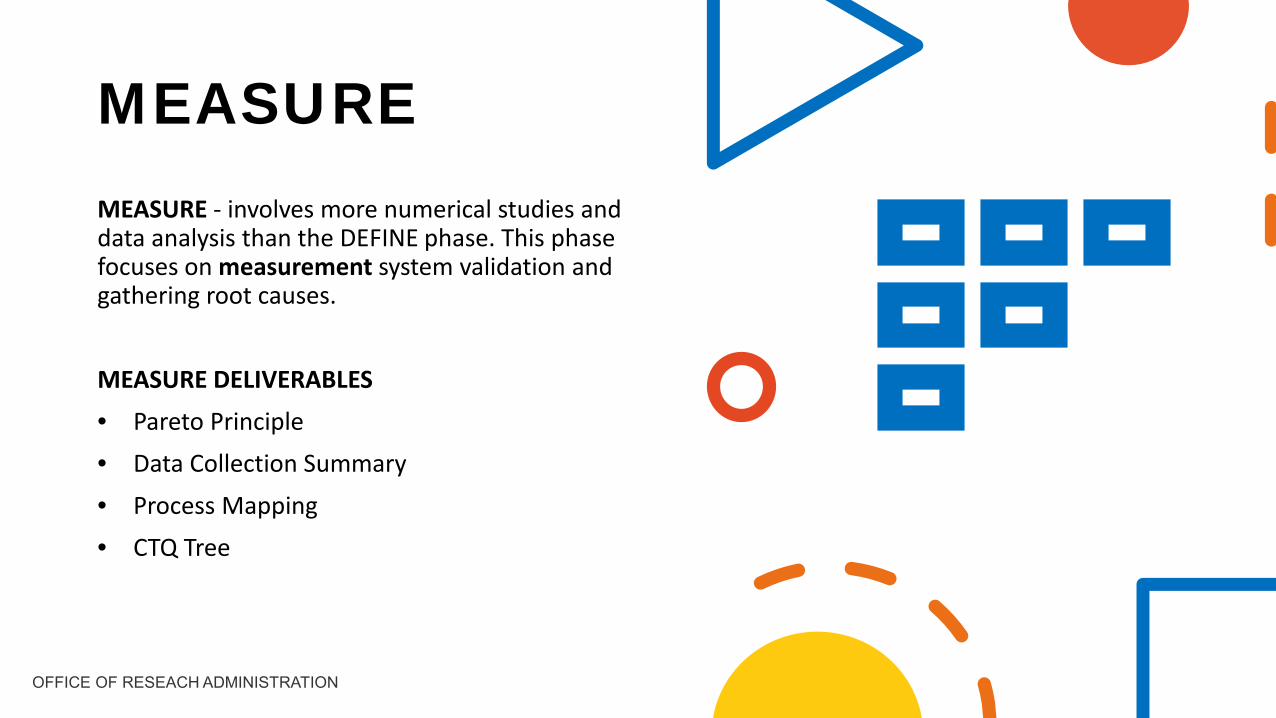
MEASUREMEASURE - involves more numerical studies and data analysis than the DEFINE phase. This phase focuses on measurement system validation and gathering root causes.
MEASURE DELIVERABLES• Pareto Principle• Data Collection Summary
• Process Mapping• CTQ Tree
Continuous Improvement Pareto Principle
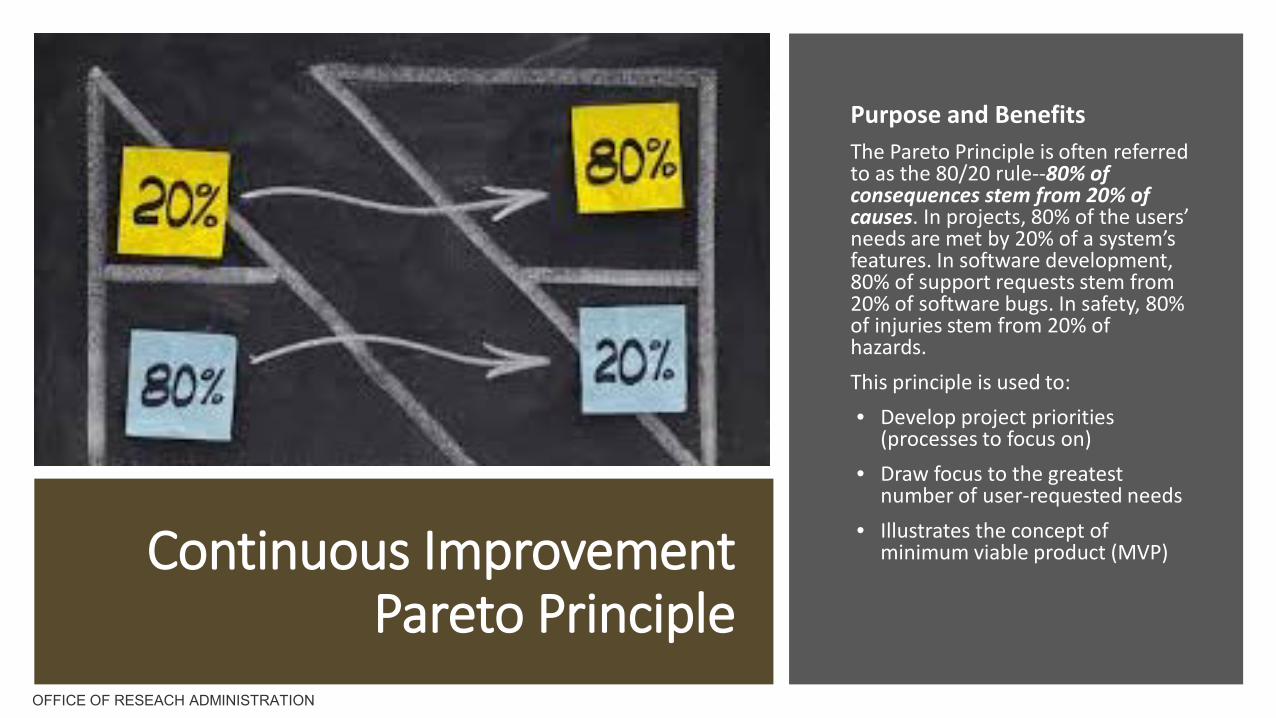
Purpose and BenefitsThe Pareto Principle is often referred to as the 80/20 rule--80% of consequences stem from 20% of causes. In projects, 80% of the users’ needs are met by 20% of a system’s features. In software development, 80% of support requests stem from 20% of software bugs. In safety, 80% of injuries stem from 20% of hazards. This principle is used to:• Develop project priorities
(processes to focus on)• Draw focus to the greatest
number of user-requested needs• Illustrates the concept of
minimum viable product (MVP)
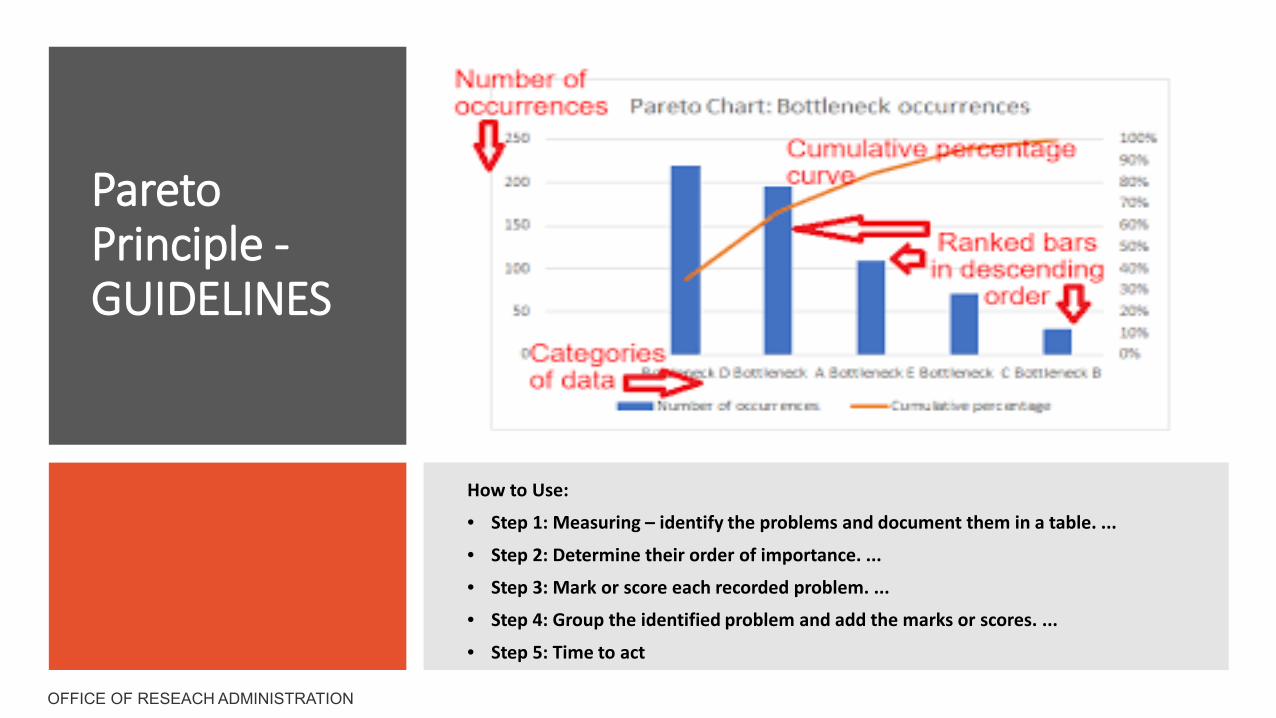
Pareto Principle -GUIDELINES
How to Use:
• Step 1: Measuring – identify the problems and document them in a table. ...
• Step 2: Determine their order of importance. ...
• Step 3: Mark or score each recorded problem. ...
• Step 4: Group the identified problem and add the marks or scores. ...
• Step 5: Time to act
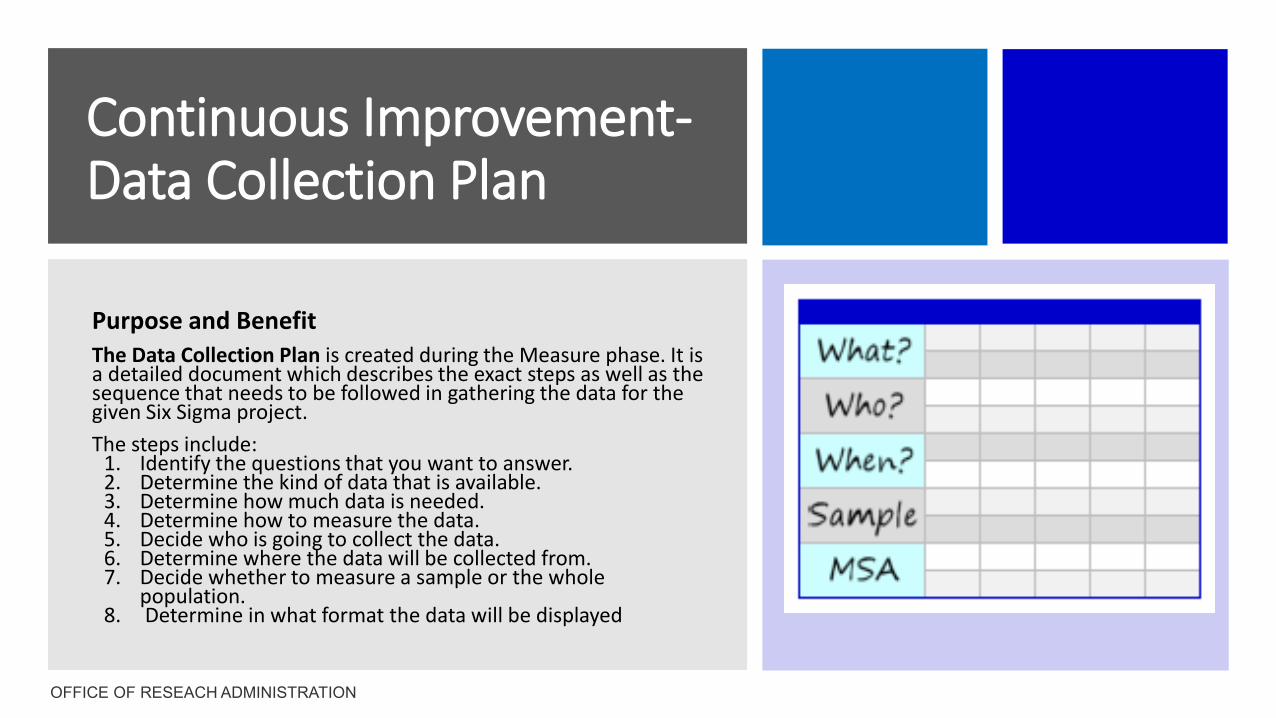
Continuous Improvement-Data Collection Plan
Purpose and BenefitThe Data Collection Plan is created during the Measure phase. It is a detailed document which describes the exact steps as well as the sequence that needs to be followed in gathering the data for the given Six Sigma project.The steps include:
1. Identify the questions that you want to answer.2. Determine the kind of data that is available.3. Determine how much data is needed.4. Determine how to measure the data.5. Decide who is going to collect the data.6. Determine where the data will be collected from.7. Decide whether to measure a sample or the whole
population.8. Determine in what format the data will be displayed
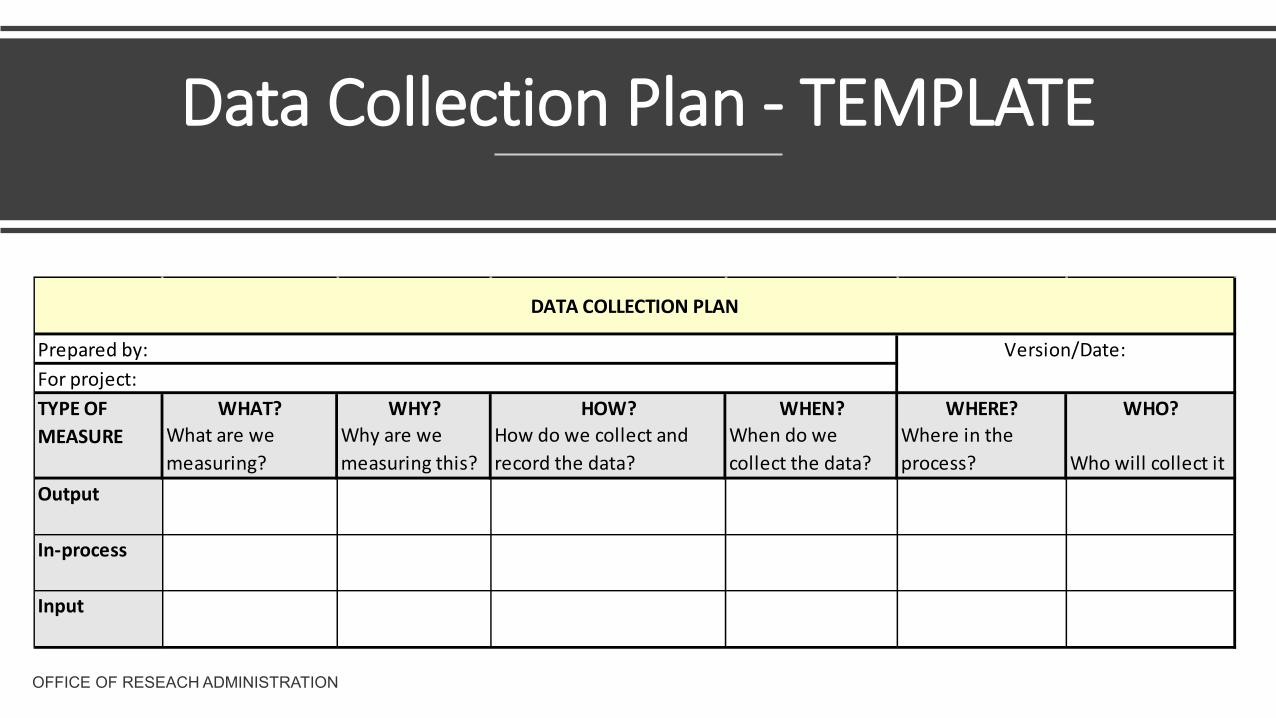
Data Collection Plan - TEMPLATE
WHAT? WHY? HOW? WHEN? WHERE? WHO?What are we measuring?
Why are we measuring this?
How do we collect and record the data?
When do we collect the data?
Where in the process? Who will collect it
TYPE OF MEASURE
Output
DATA COLLECTION PLAN
Version/Date: Prepared by: For project:
Input
In-process
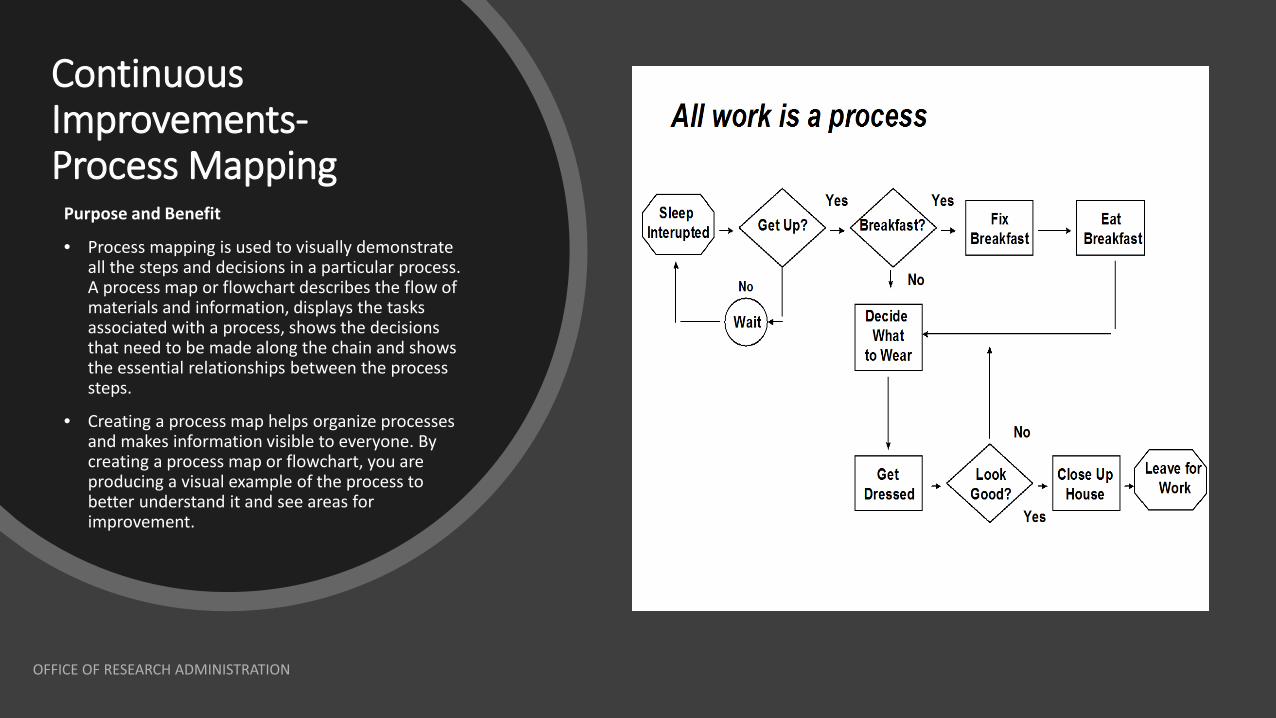
Continuous Improvements-Process Mapping
Purpose and Benefit
• Process mapping is used to visually demonstrate all the steps and decisions in a particular process. A process map or flowchart describes the flow of materials and information, displays the tasks associated with a process, shows the decisions that need to be made along the chain and shows the essential relationships between the process steps.
• Creating a process map helps organize processes and makes information visible to everyone. By creating a process map or flowchart, you are producing a visual example of the process to better understand it and see areas for improvement.
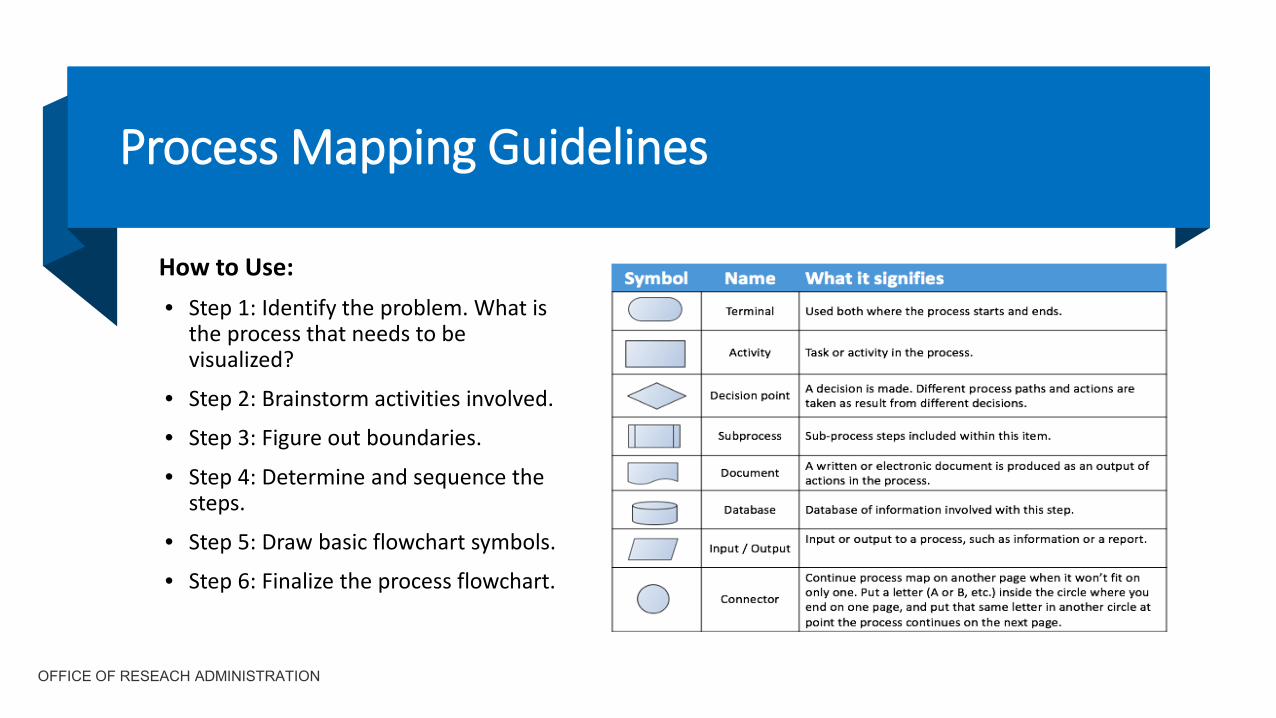
Process Mapping Guidelines
How to Use:• Step 1: Identify the problem. What is
the process that needs to be visualized?
• Step 2: Brainstorm activities involved.
• Step 3: Figure out boundaries.
• Step 4: Determine and sequence the steps.
• Step 5: Draw basic flowchart symbols.
• Step 6: Finalize the process flowchart.
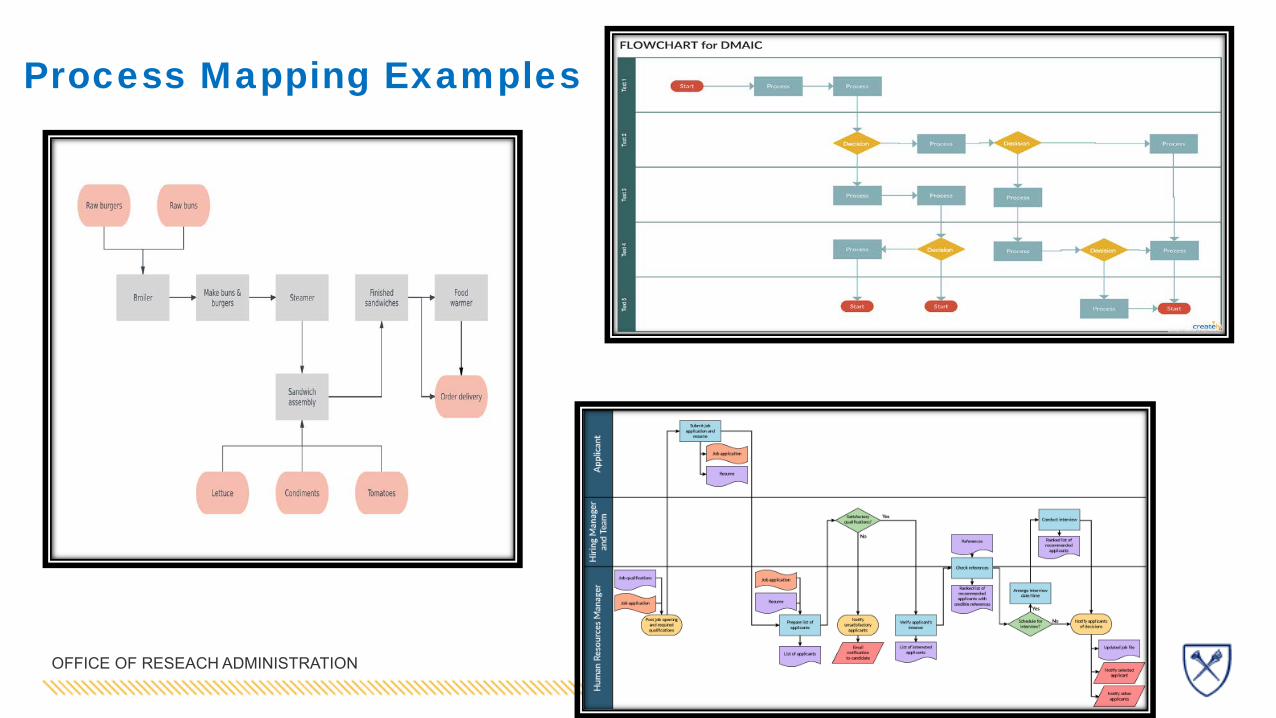
Process Mapping Examples
Continuous ImprovementCTQ Tree –Critical To Quality
Critical to Quality (CTQs) are the key measurable characteristics of a product or process whose performance standards or specification limits must be met in order to satisfy the customer. These outputs represent the product or service characteristics defined by the customer (internal or external) are parameters that defines the requirements of the customers.
CTQs are very important while developing a product or service. In Six Sigma and other continuous improvement projects too, CTQ plays a critical role as the main purpose of many of these projects is to provide a product or service that satisfies the customers on various parameters.
CTQs characteristic or component that has a direct effect on whether the overall process or product is perceived by the customer to be of acceptable quality. Identification of specific, measurable critical to quality (CTQ) characteristics is essential for meaningful and measurable business process improvement.
Purpose and Benefits
OFFICE OF RESEARCH ADMINISTRATION
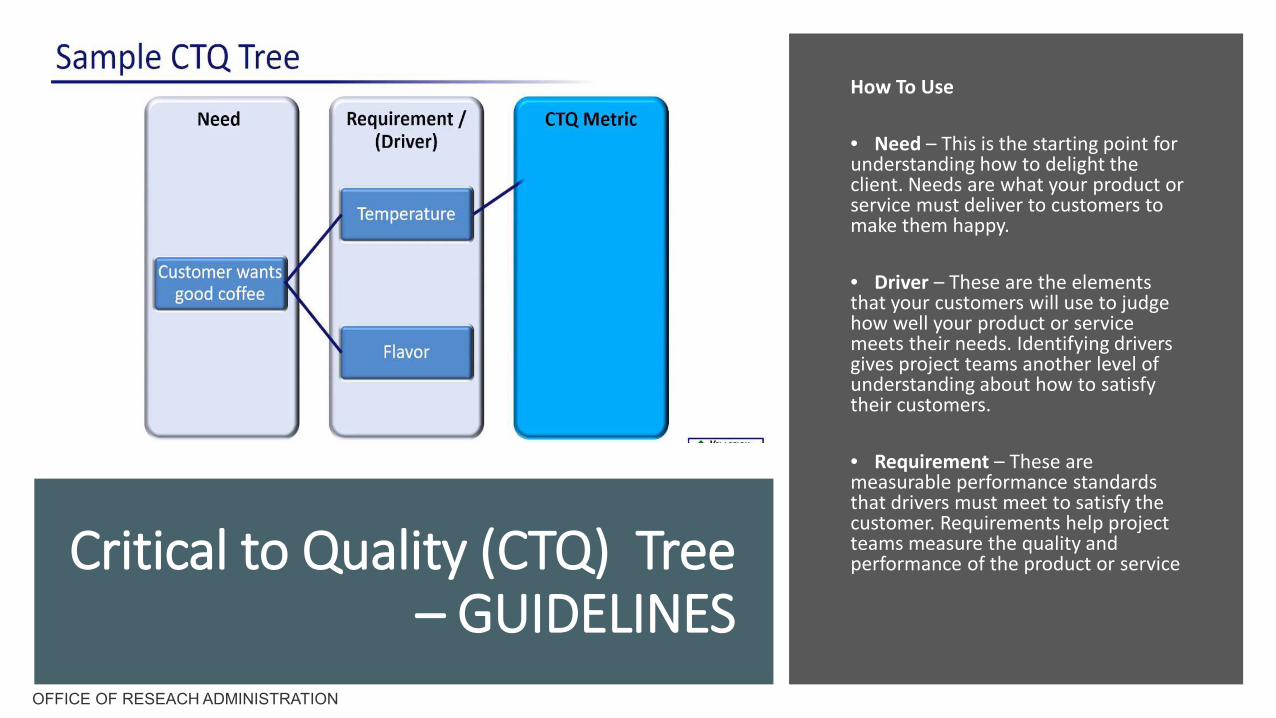
Critical to Quality (CTQ) Tree – GUIDELINES
How To Use
• Need – This is the starting point for understanding how to delight the client. Needs are what your product or service must deliver to customers to make them happy.
• Driver – These are the elements that your customers will use to judge how well your product or service meets their needs. Identifying drivers gives project teams another level of understanding about how to satisfy their customers.
• Requirement – These are measurable performance standards that drivers must meet to satisfy the customer. Requirements help project teams measure the quality and performance of the product or service
ANALYZEANALYZE - The ANALYZE phase of DMAIC helps project teams identify problems in the production process that cause product defects. The ANALYZE phase provides tools to help spot the problems and determine if these problems are the root causes of defects.
ANALYZE DELIVERABLES
• TIM WOOD
• Fishbone Diagram (Ishikawa)
• Five- Whys
• Root Cause Analysis
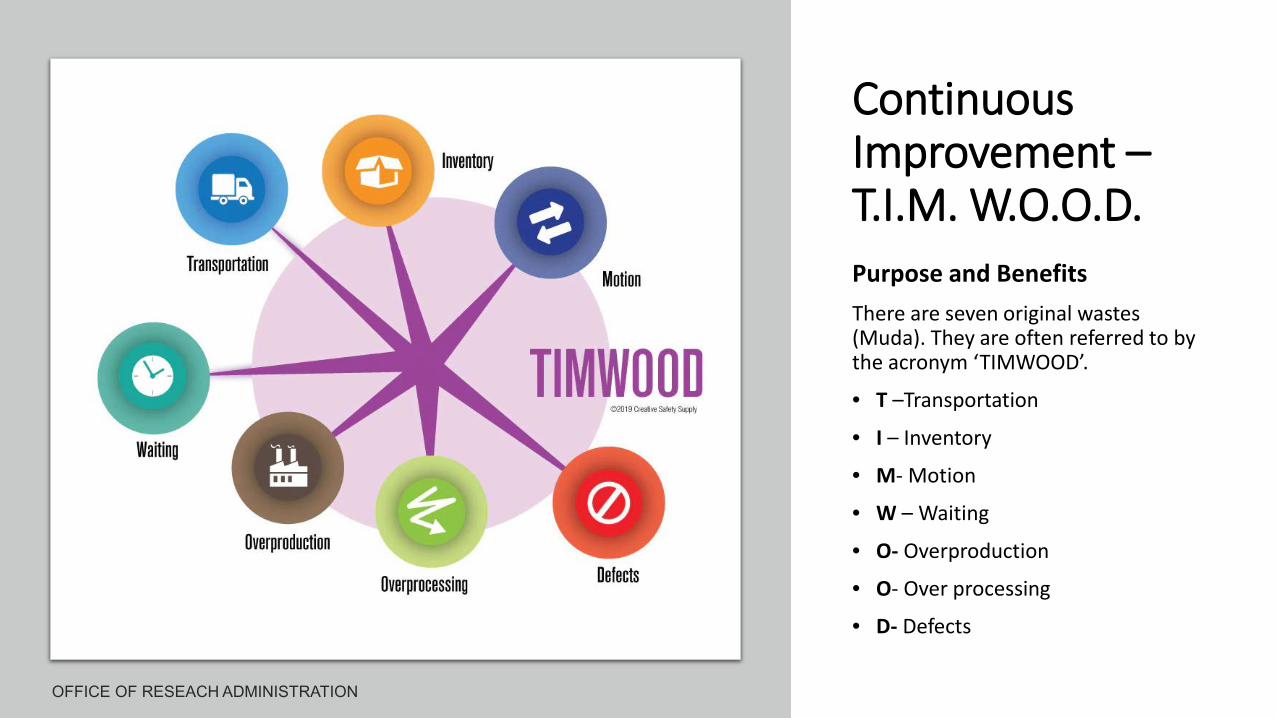
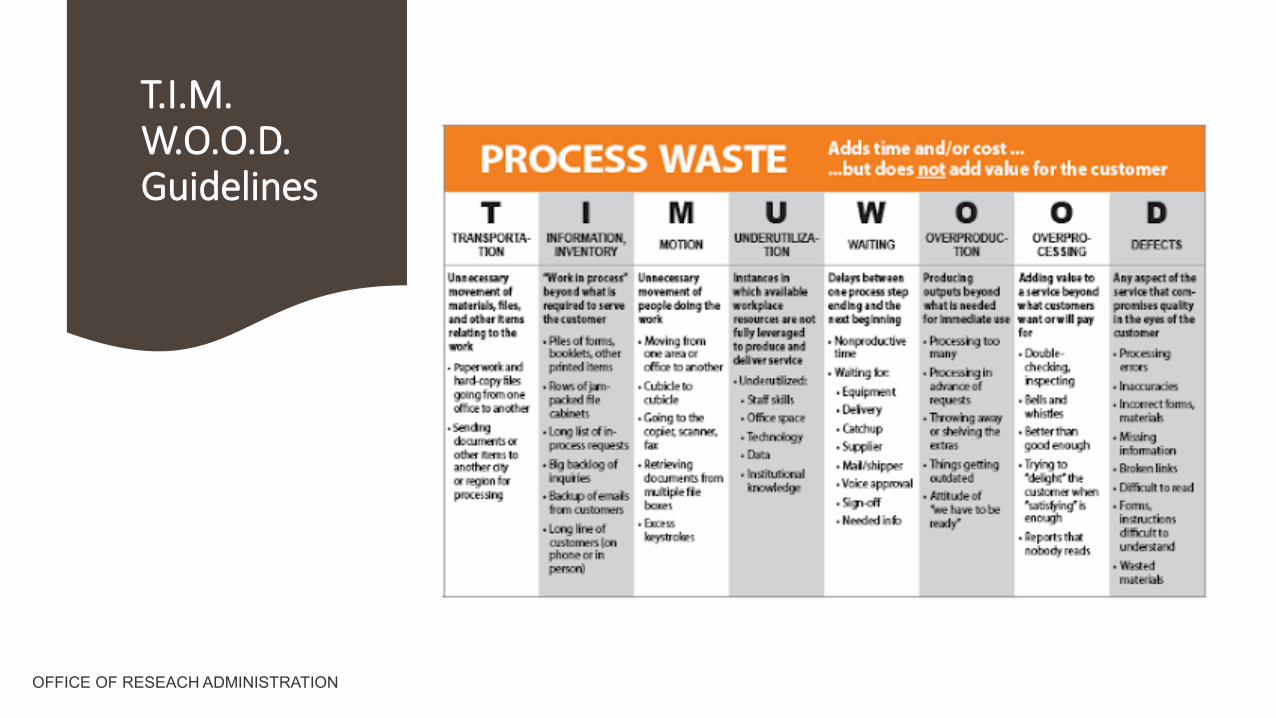
Continuous Improvement –T.I.M. W.O.O.D.Purpose and BenefitsThere are seven original wastes (Muda). They are often referred to by the acronym ‘TIMWOOD’.
• T –Transportation
• I – Inventory
• M- Motion
• W – Waiting
• O- Overproduction
• O- Over processing
• D- Defects
T.I.M. W.O.O.D. Guidelines
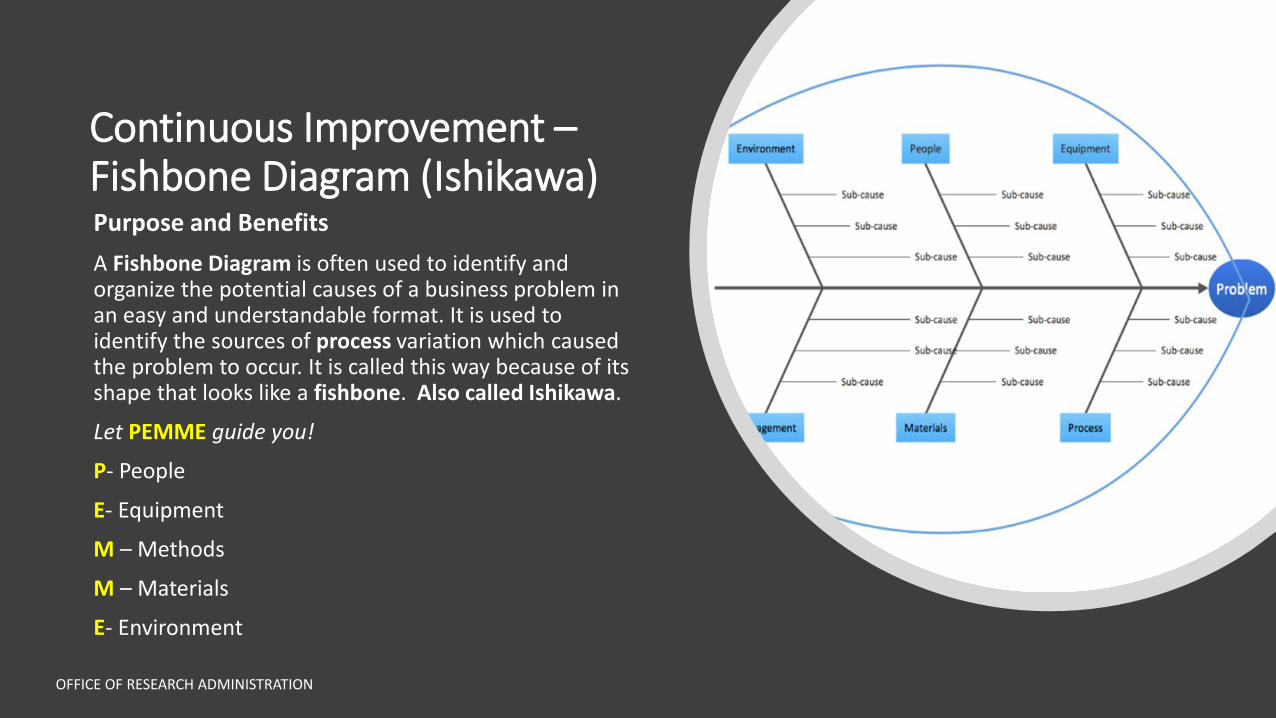
Continuous Improvement –Fishbone Diagram (Ishikawa)Purpose and BenefitsA Fishbone Diagram is often used to identify and organize the potential causes of a business problem in an easy and understandable format. It is used to identify the sources of process variation which caused the problem to occur. It is called this way because of its shape that looks like a fishbone. Also called Ishikawa.
Let PEMME guide you!
P- People
E- Equipment
M – Methods
M – Materials
E- Environment
OFFICE OF RESEARCH ADMINISTRATION
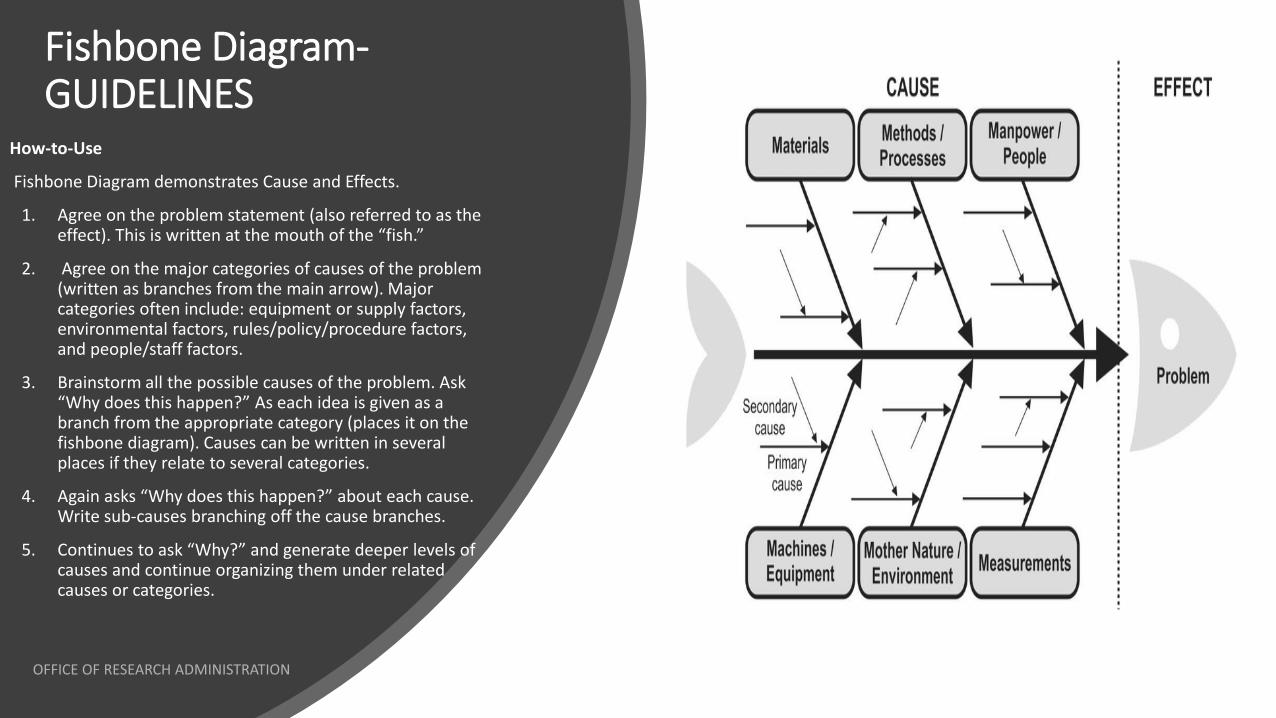
Fishbone Diagram-GUIDELINES
How-to-Use
Fishbone Diagram demonstrates Cause and Effects.
1. Agree on the problem statement (also referred to as the effect). This is written at the mouth of the “fish.”
2. Agree on the major categories of causes of the problem (written as branches from the main arrow). Major categories often include: equipment or supply factors, environmental factors, rules/policy/procedure factors, and people/staff factors.
3. Brainstorm all the possible causes of the problem. Ask “Why does this happen?” As each idea is given as a branch from the appropriate category (places it on the fishbone diagram). Causes can be written in several places if they relate to several categories.
4. Again asks “Why does this happen?” about each cause. Write sub-causes branching off the cause branches.
5. Continues to ask “Why?” and generate deeper levels of causes and continue organizing them under related causes or categories.
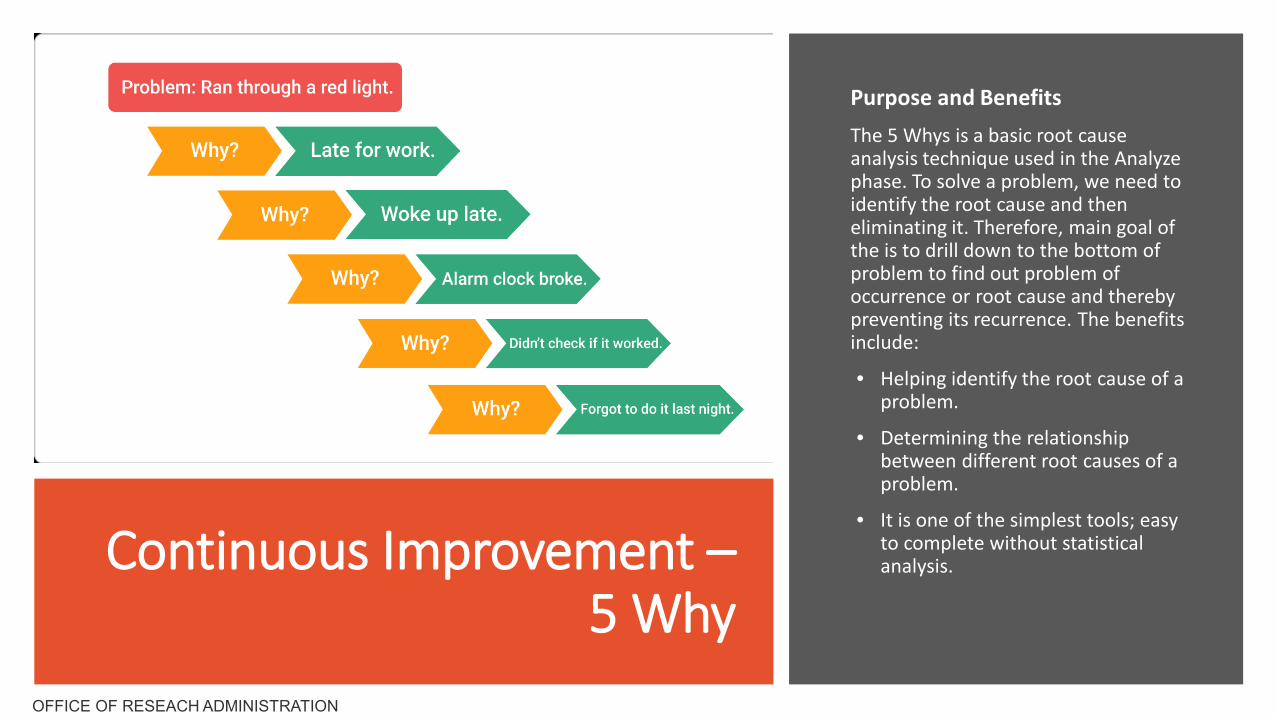
Continuous Improvement –5 Why
Purpose and BenefitsThe 5 Whys is a basic root cause analysis technique used in the Analyze phase. To solve a problem, we need to identify the root cause and then eliminating it. Therefore, main goal of the is to drill down to the bottom of problem to find out problem of occurrence or root cause and thereby preventing its recurrence. The benefits include:
• Helping identify the root cause of a problem.
• Determining the relationship between different root causes of a problem.
• It is one of the simplest tools; easy to complete without statistical analysis.
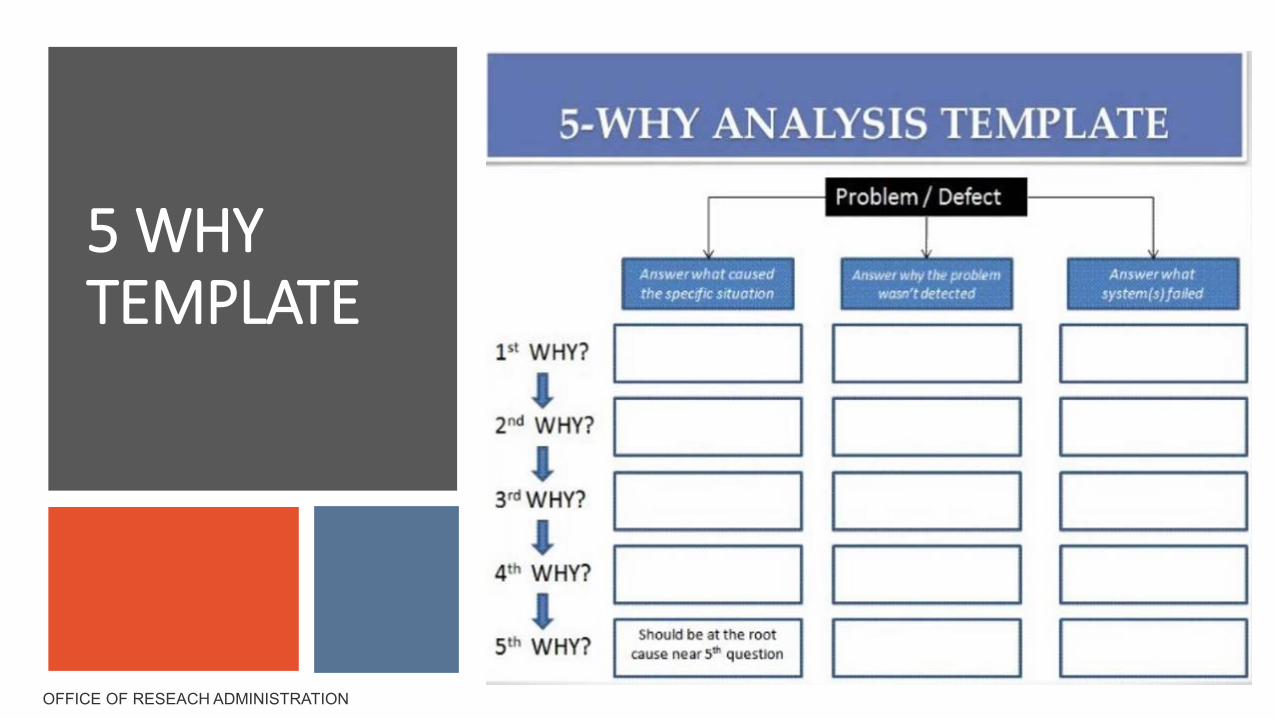
5 WHY TEMPLATE
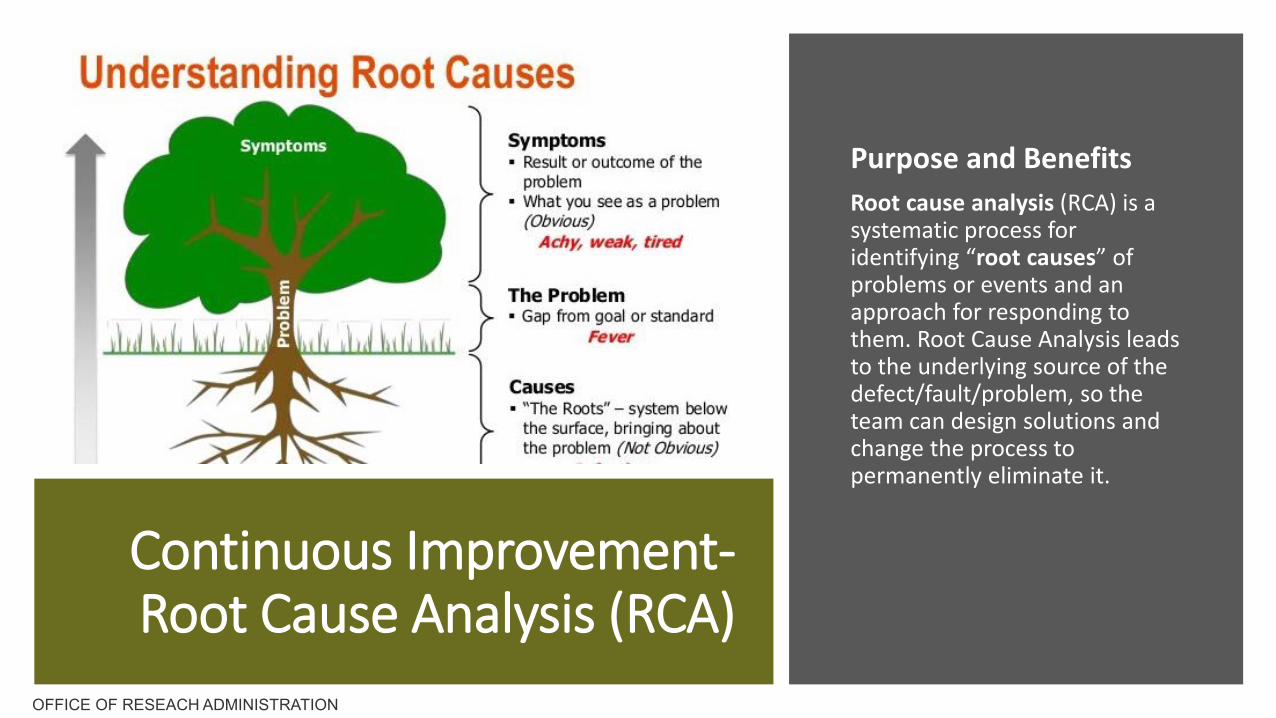
Continuous Improvement-Root Cause Analysis (RCA)
Purpose and BenefitsRoot cause analysis (RCA) is a systematic process for identifying “root causes” of problems or events and an approach for responding to them. Root Cause Analysis leads to the underlying source of the defect/fault/problem, so the team can design solutions and change the process to permanently eliminate it.
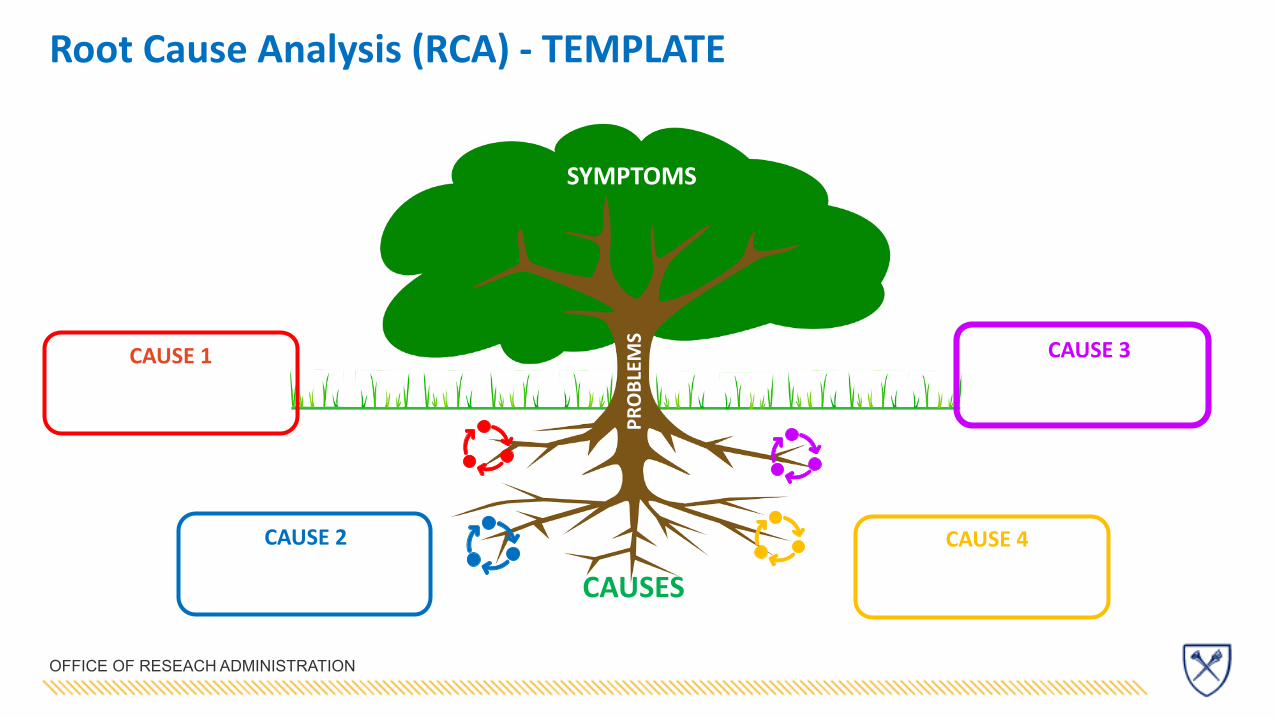
Root Cause Analysis (RCA) - TEMPLATE
SYMPTOMS
PRO
BLEM
S
CAUSES
CAUSE 1
CAUSE 2
CAUSE 3
CAUSE 4
IMPROVEIMPROVE – The IMPROVE phase of DMAIC determines a solution which is based on the uncovered problem in the first three phases. The IMPROVE Phase consists of generating a potential solution, validating the pilot solution, mitigating risk and developing a roll out plan for implementation
IMPROVE DELIVERABLES
• 5 S’s
• Plan, Do, Check, Act (PDCA)
• Error Proofing
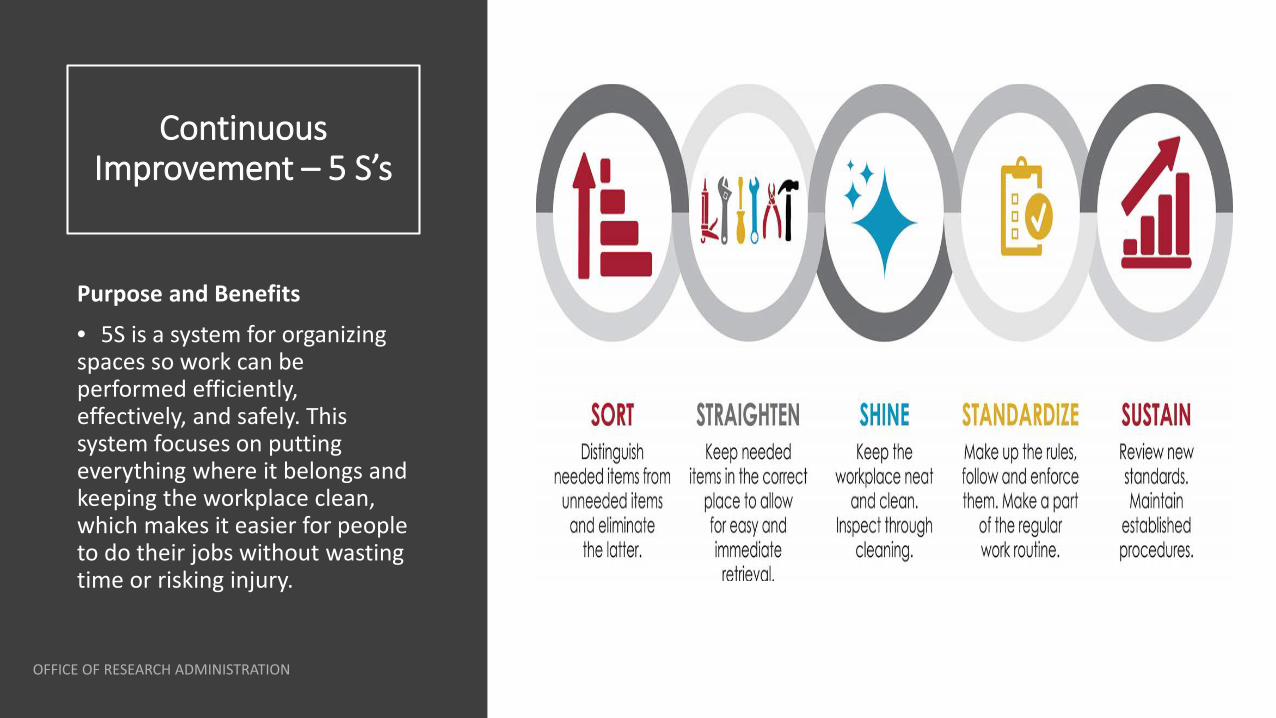
Continuous Improvement – 5 S’s
Purpose and Benefits
• 5S is a system for organizing spaces so work can be performed efficiently, effectively, and safely. This system focuses on putting everything where it belongs and keeping the workplace clean, which makes it easier for people to do their jobs without wasting time or risking injury.
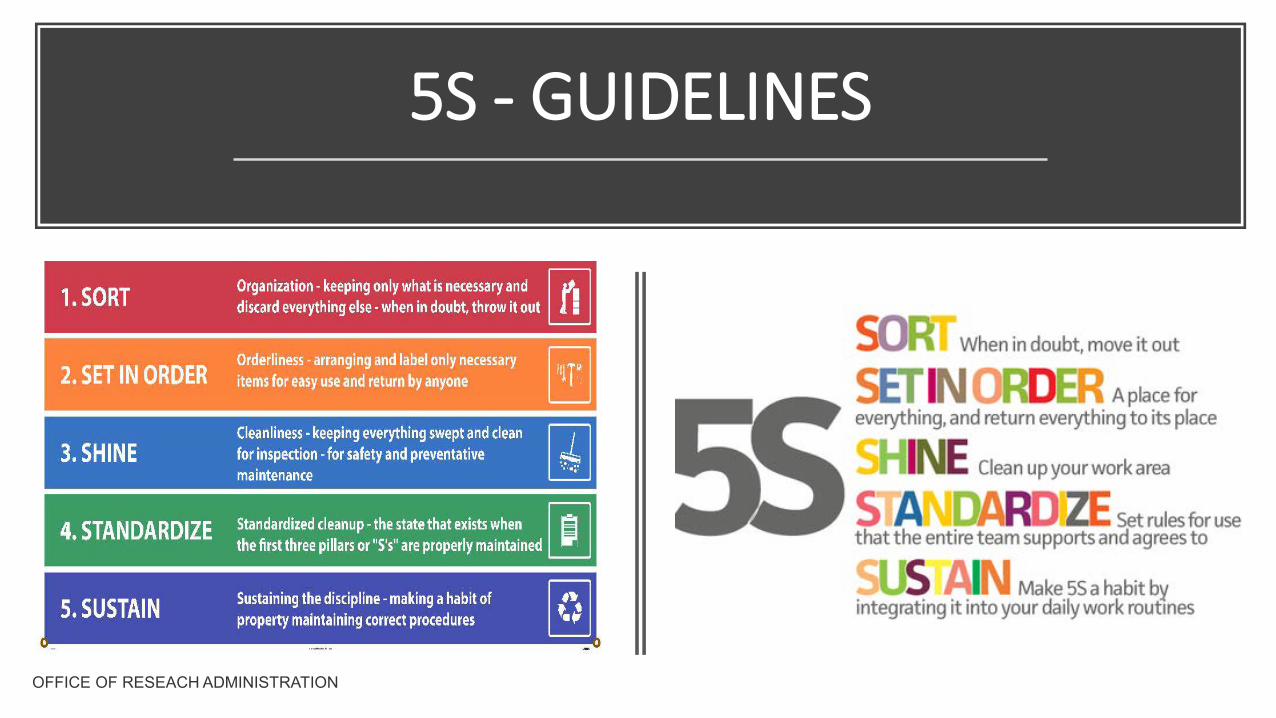
5S - GUIDELINES
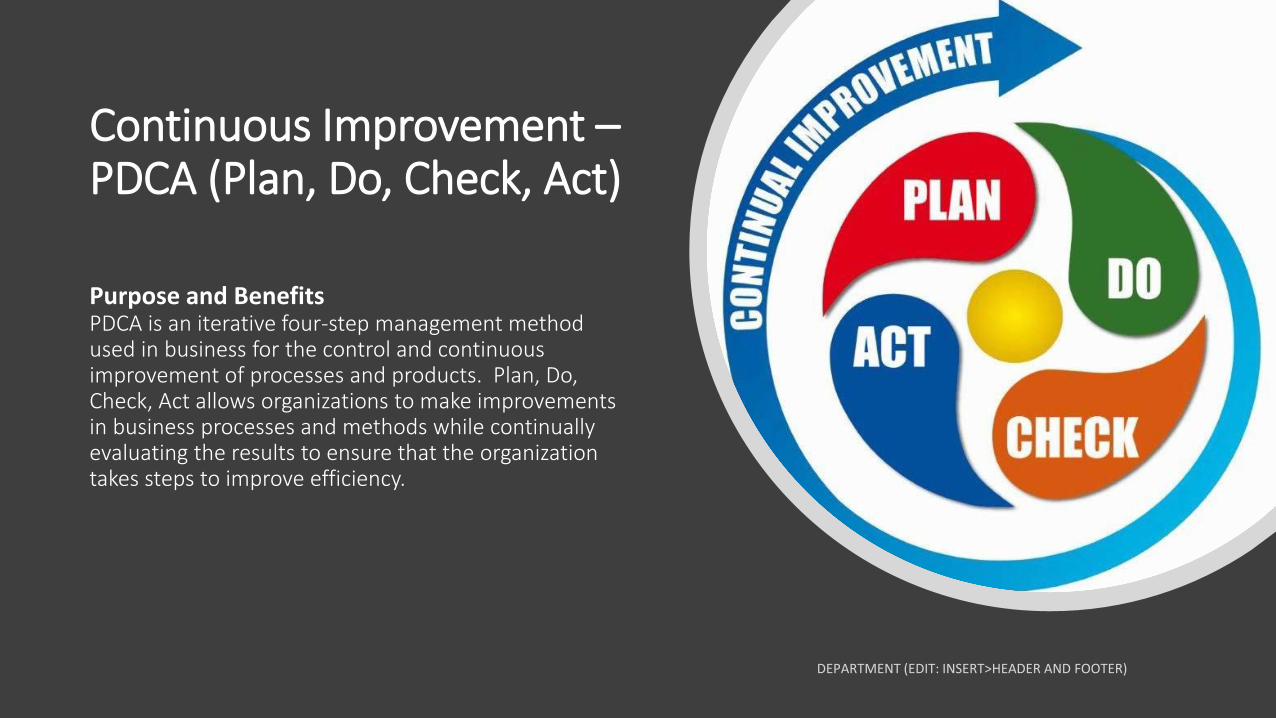
Continuous Improvement –PDCA (Plan, Do, Check, Act)
Purpose and BenefitsPDCA is an iterative four-step management method used in business for the control and continuous improvement of processes and products. Plan, Do, Check, Act allows organizations to make improvements in business processes and methods while continually evaluating the results to ensure that the organization takes steps to improve efficiency.
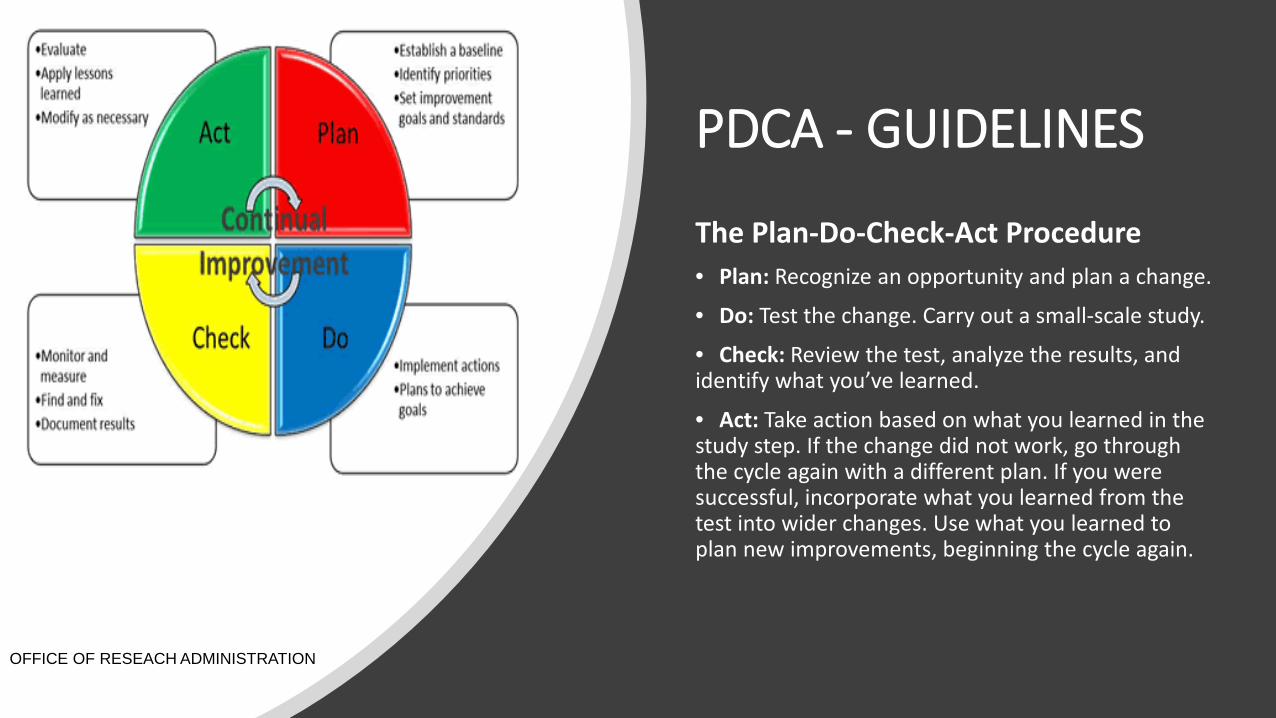
PDCA - GUIDELINES
The Plan-Do-Check-Act Procedure• Plan: Recognize an opportunity and plan a change.
• Do: Test the change. Carry out a small-scale study.
• Check: Review the test, analyze the results, and identify what you’ve learned.
• Act: Take action based on what you learned in the study step. If the change did not work, go through the cycle again with a different plan. If you were successful, incorporate what you learned from the test into wider changes. Use what you learned to plan new improvements, beginning the cycle again.
OFFICE OF RESEACH ADMINISTRATION
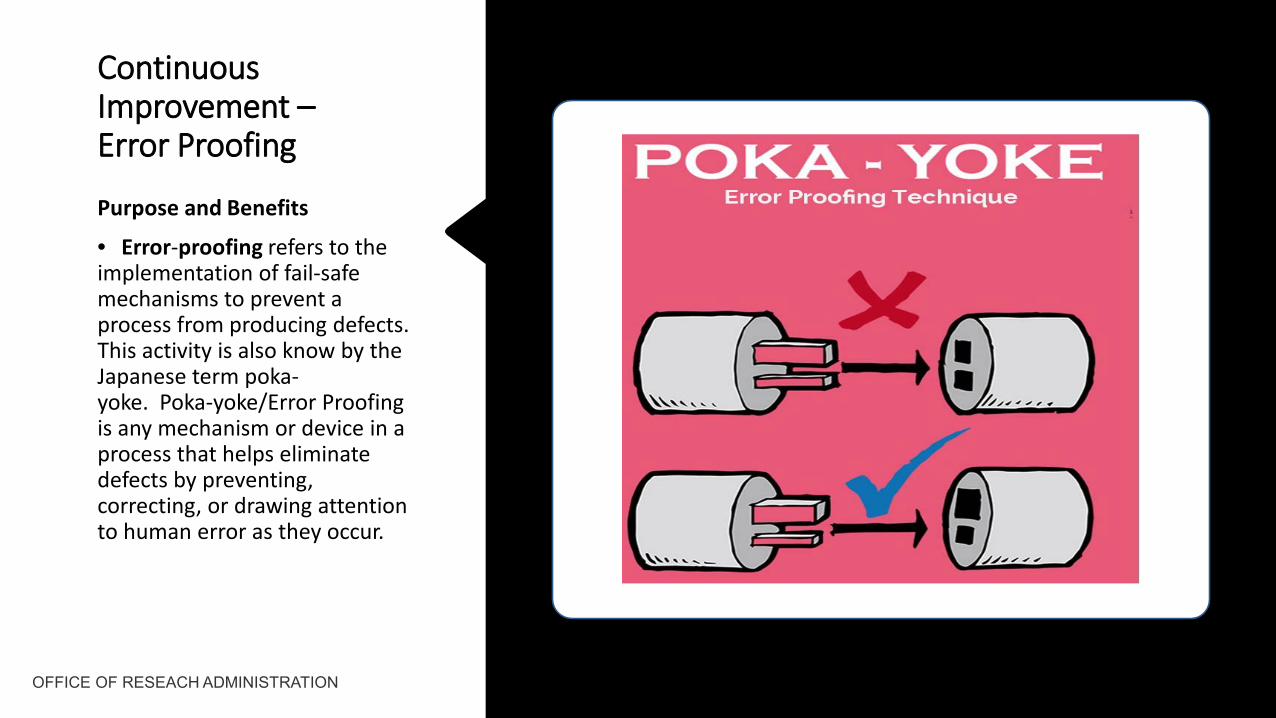
Continuous Improvement –Error Proofing
Purpose and Benefits
• Error-proofing refers to the implementation of fail-safe mechanisms to prevent a process from producing defects. This activity is also know by the Japanese term poka-yoke. Poka-yoke/Error Proofing is any mechanism or device in a process that helps eliminate defects by preventing, correcting, or drawing attention to human error as they occur.
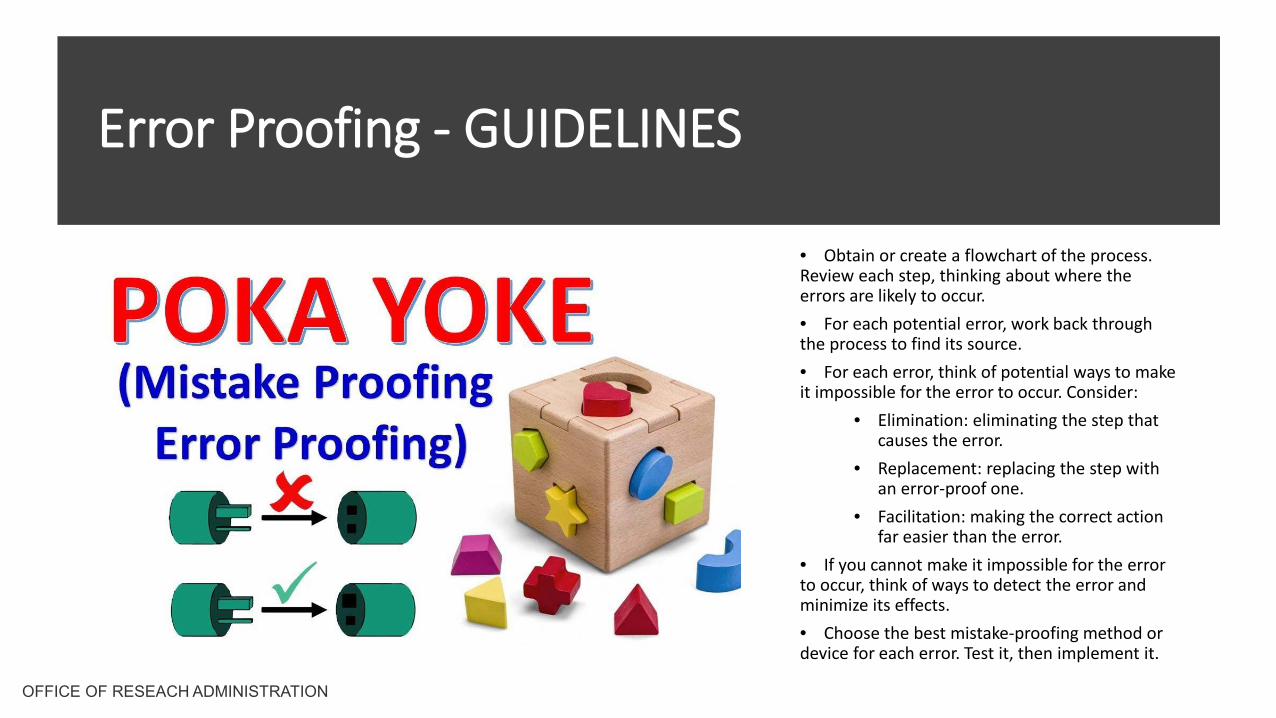
Error Proofing - GUIDELINES
• Obtain or create a flowchart of the process. Review each step, thinking about where the errors are likely to occur.• For each potential error, work back through the process to find its source.• For each error, think of potential ways to make it impossible for the error to occur. Consider:
• Elimination: eliminating the step that causes the error.
• Replacement: replacing the step with an error-proof one.
• Facilitation: making the correct action far easier than the error.
• If you cannot make it impossible for the error to occur, think of ways to detect the error and minimize its effects. • Choose the best mistake-proofing method or device for each error. Test it, then implement it.
CONTROLCONTROL – The CONTROL phase is the conclusion of the team's journey. The focus of this stage is to make sure that the action item created in the Improve Phase is well-implemented and maintained. Several tools are used in this stage to make sure that variables are within its limits. This is the handoff phase to the Process Owner to maintain the gains.
IMPROVE DELIVERABLE
• Process Monitoring Plan• Control Chart• PFMEA (Process Failure Modes and Effects
Analysis)
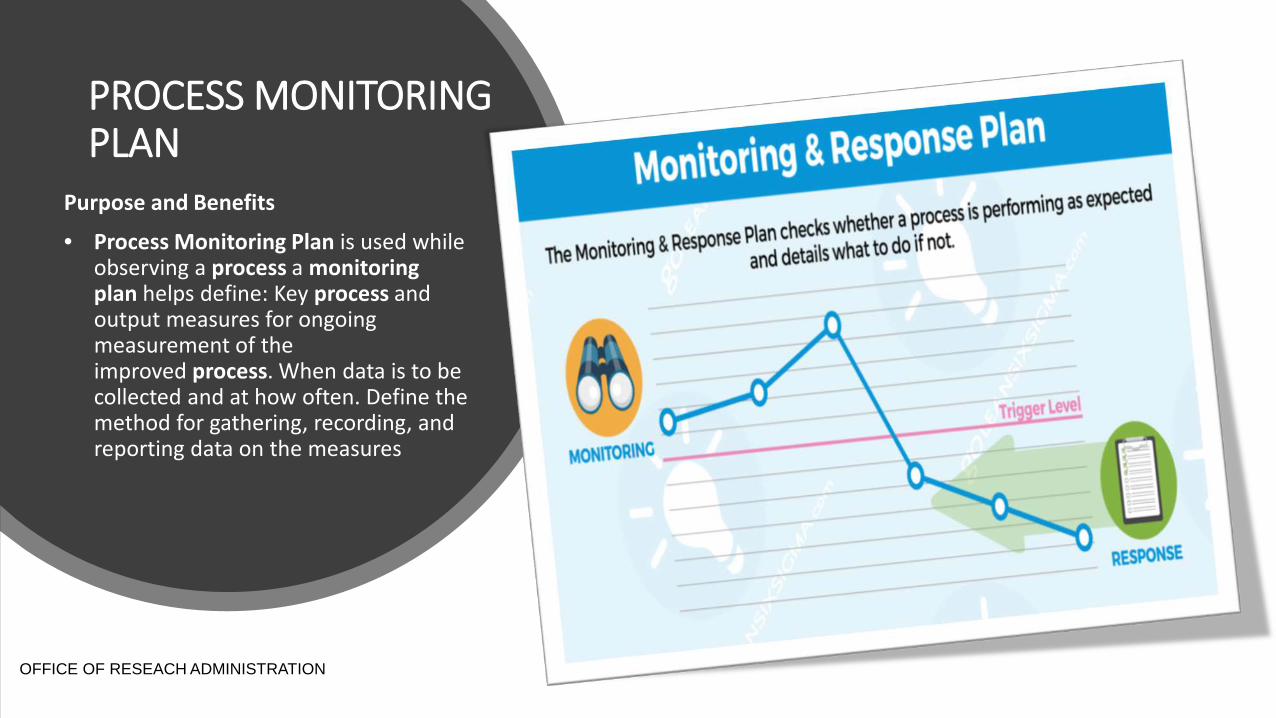
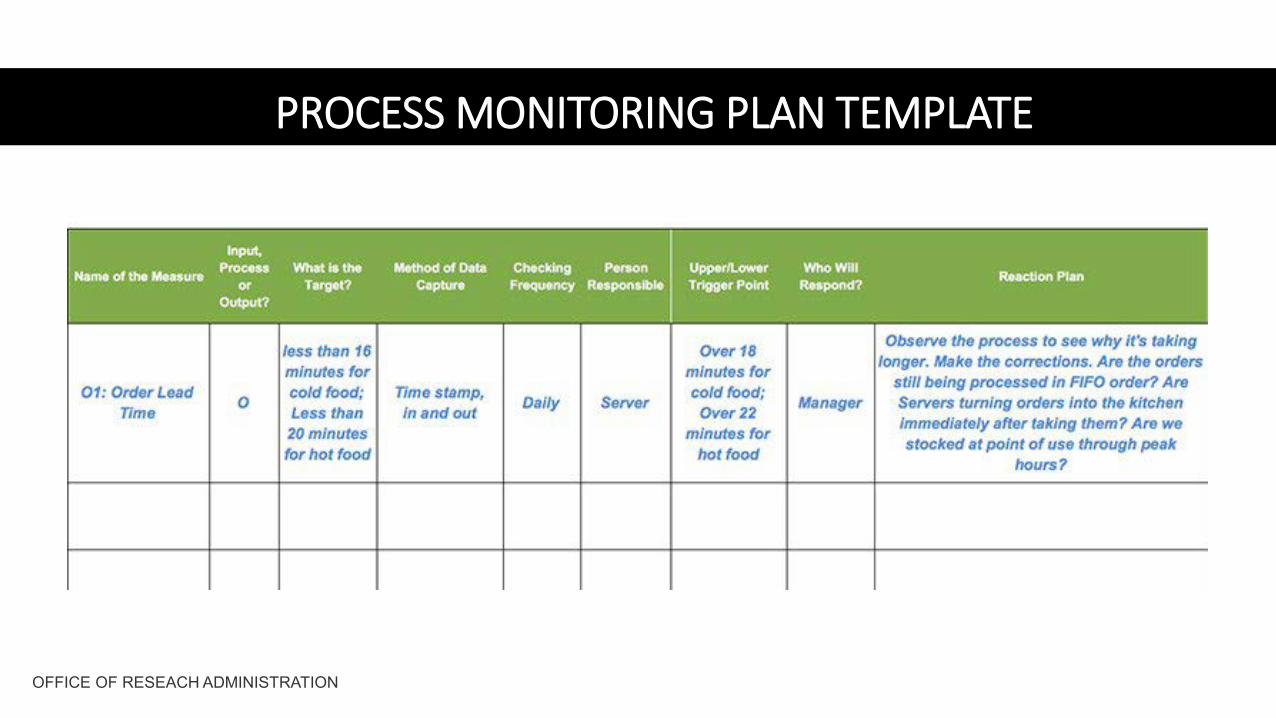
PROCESS MONITORING PLAN
Purpose and Benefits
• Process Monitoring Plan is used while observing a process a monitoring plan helps define: Key process and output measures for ongoing measurement of the improved process. When data is to be collected and at how often. Define the method for gathering, recording, and reporting data on the measures
OFFICE OF RESEACH ADMINISTRATION
PROCESS MONITORING PLAN TEMPLATE
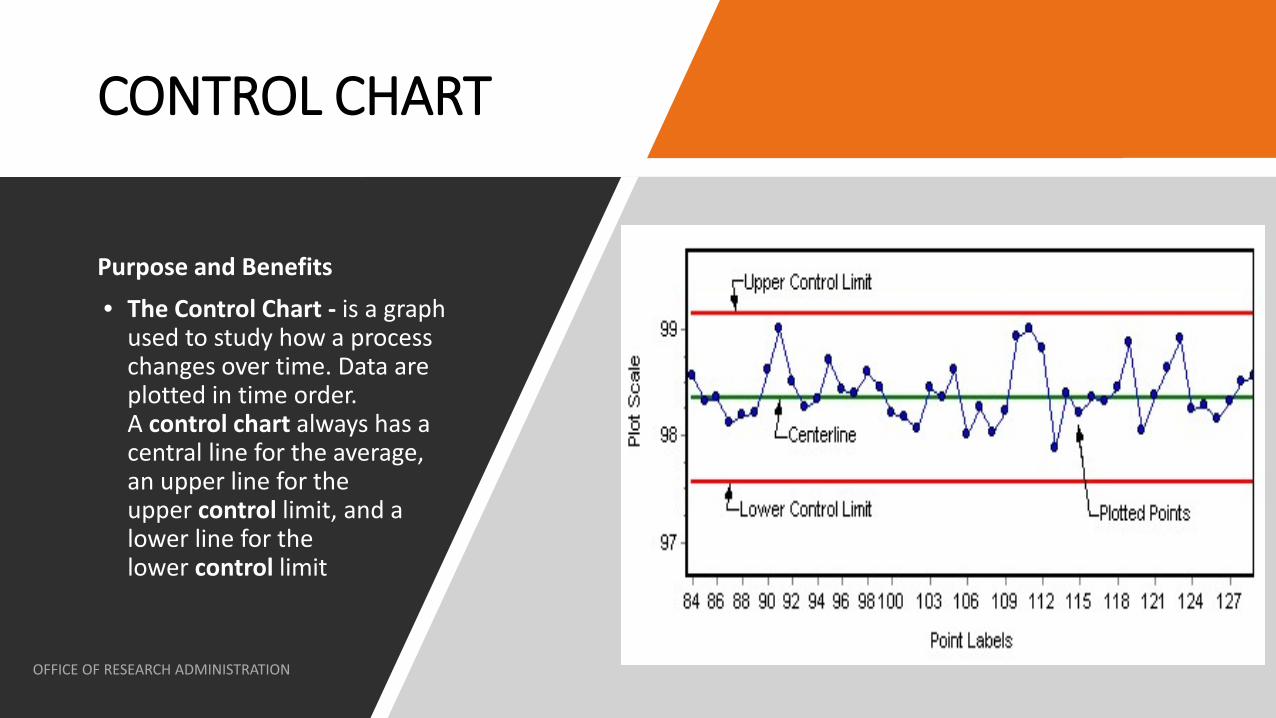
CONTROL CHART
Purpose and Benefits• The Control Chart - is a graph
used to study how a process changes over time. Data are plotted in time order. A control chart always has a central line for the average, an upper line for the upper control limit, and a lower line for the lower control limit
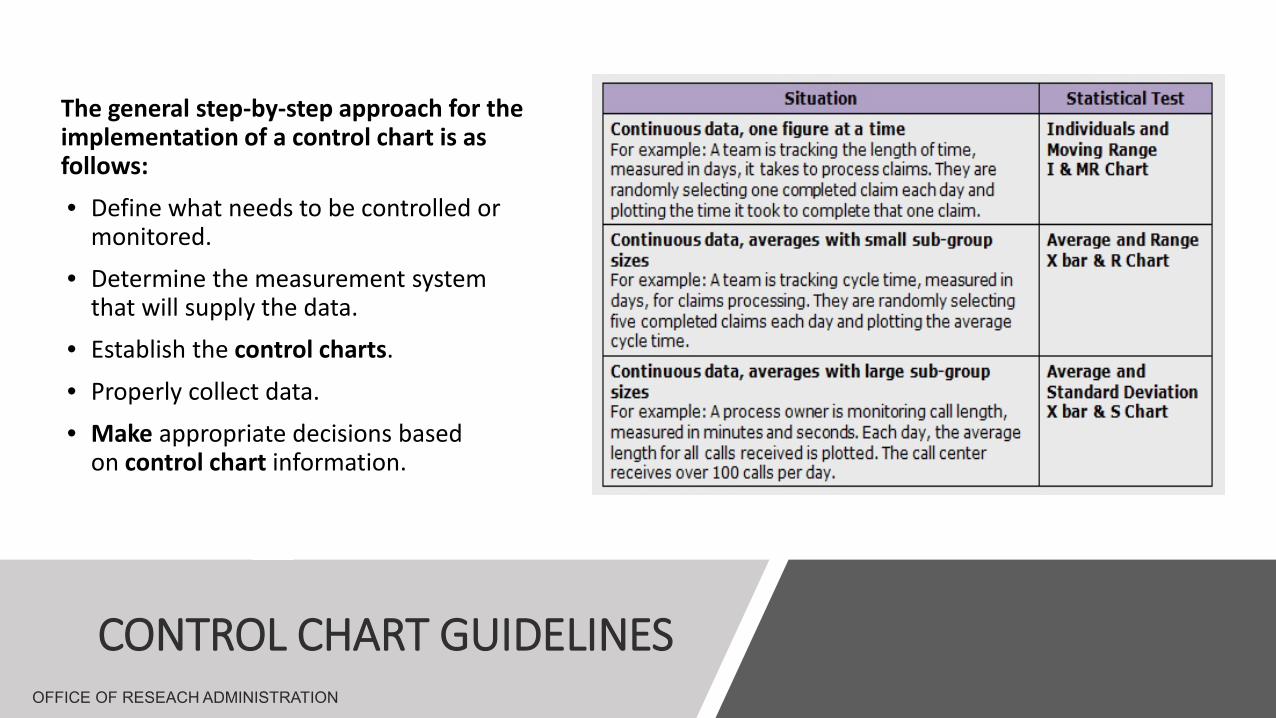
CONTROL CHART GUIDELINES
The general step-by-step approach for the implementation of a control chart is as follows:
• Define what needs to be controlled or monitored.
• Determine the measurement system that will supply the data.
• Establish the control charts.
• Properly collect data.• Make appropriate decisions based
on control chart information.
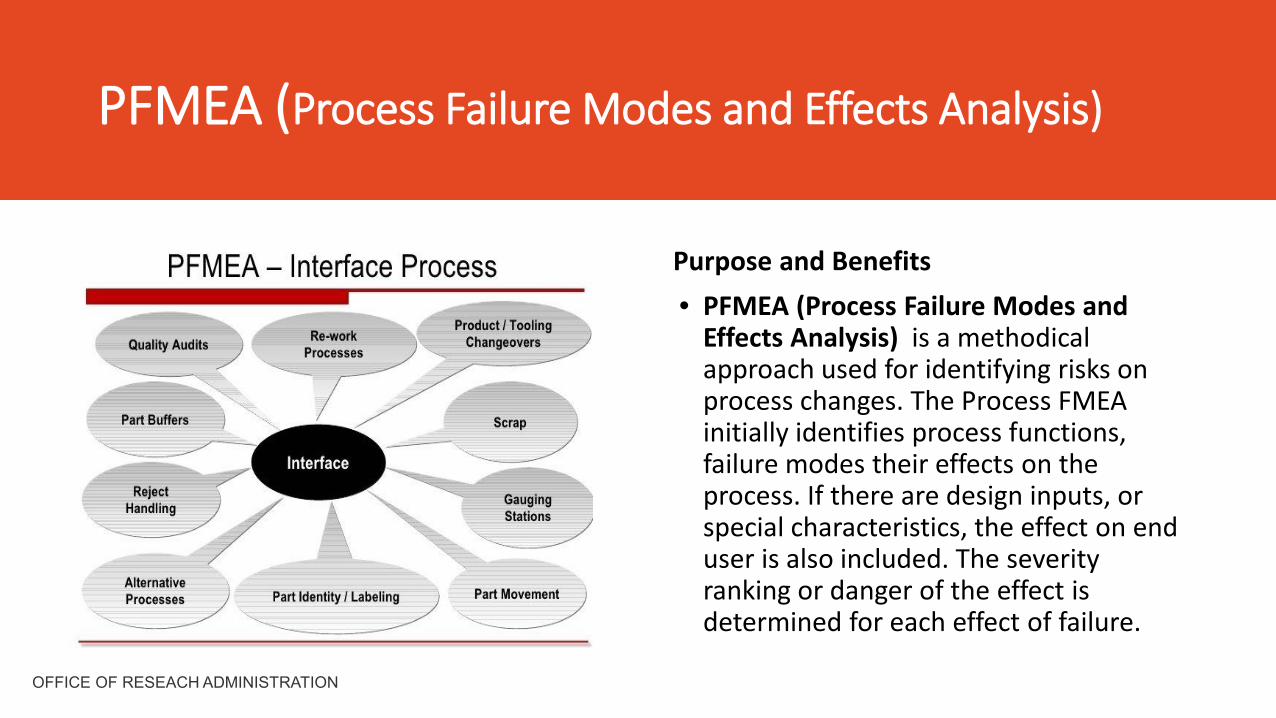
PFMEA (Process Failure Modes and Effects Analysis)
Purpose and Benefits• PFMEA (Process Failure Modes and
Effects Analysis) is a methodical approach used for identifying risks on process changes. The Process FMEA initially identifies process functions, failure modes their effects on the process. If there are design inputs, or special characteristics, the effect on end user is also included. The severity ranking or danger of the effect is determined for each effect of failure.
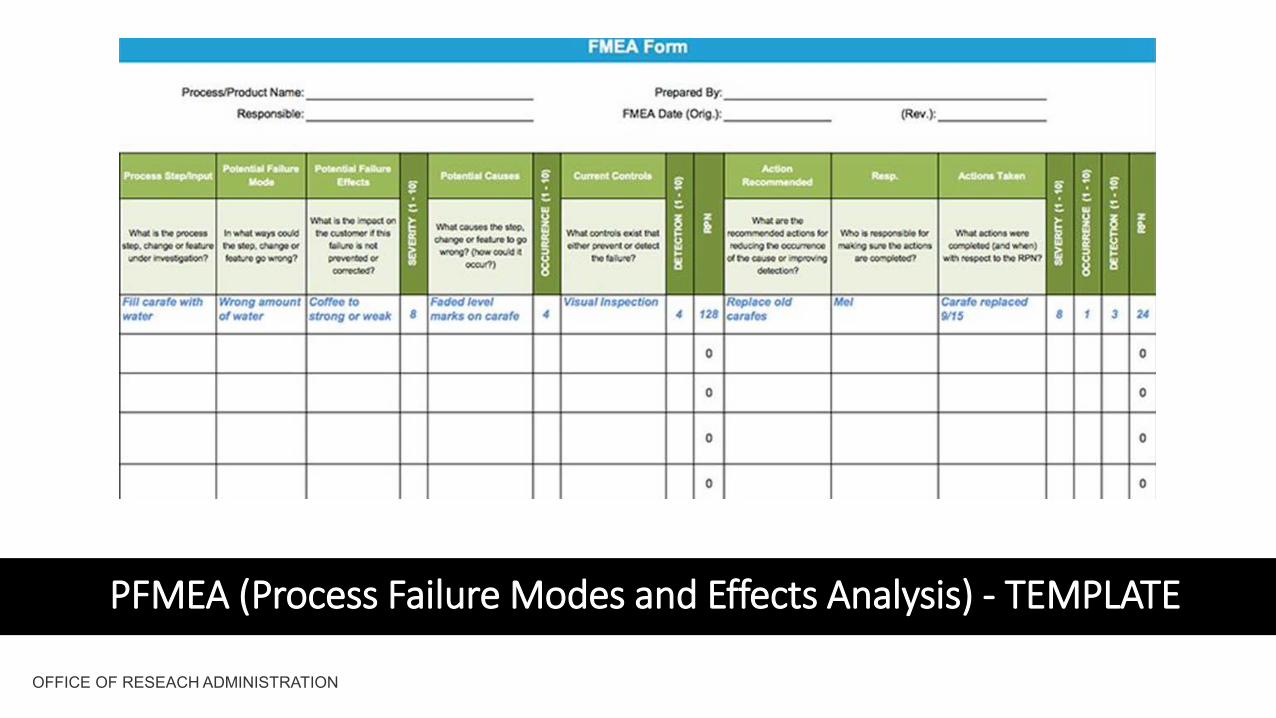
PFMEA (Process Failure Modes and Effects Analysis) - TEMPLATE
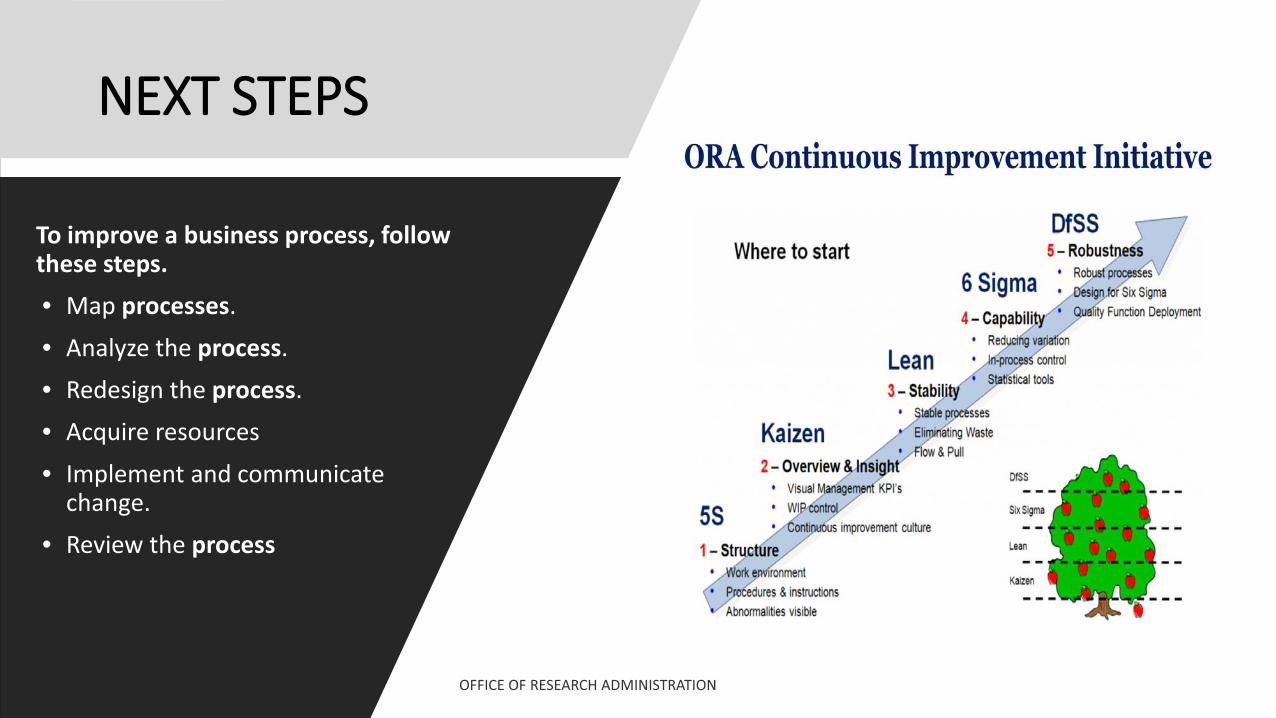
NEXT STEPS
To improve a business process, follow these steps.• Map processes.
• Analyze the process.• Redesign the process.• Acquire resources
• Implement and communicate change.
• Review the process
NEED HELP?
If you have questions or need assistance with implementing Process Improvements or the DMAIC Process, contact the DRAGON TEAM!
• Dragon Team Email: [email protected]
• Inger GarnettDirector of Strategic [email protected] ; 404-727-0325
• Sharon JonesStrategic Operations [email protected] ; 404-727-0476
• Julie FloresStrategic Operations [email protected] ; 404-727-0466
OFFICE OF RESEARCH ADMINIISTRATION