Embed Size (px)
Citation preview
Annual Report 2005
OD
PM
An
nualR
eport2005

© Crown Copyright 2005The text in this document (excluding the Royal Arms and departmental logos) may be reproduced freeof charge in any format or medium providing that it is reproduced accurately and not used in amisleading context. The material must be acknowledged as Crown copyright and the title of thedocument specified.Any enquiries relating to the copyright in this document should be addressed to The Licensing Division,HMSO, St Clements House, 2-16 Colegate, Norwich, NR3 1BQ. Fax: 01603 723000 or e-mail:[email protected]
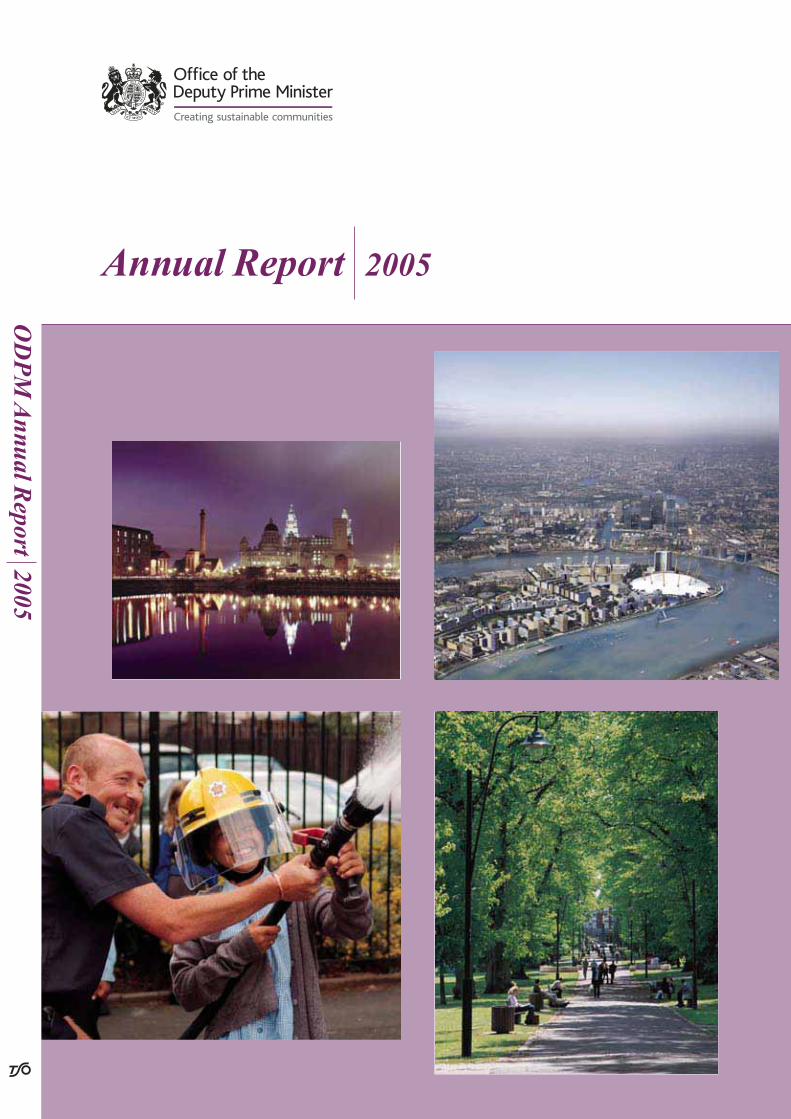
FRONT COVER IMAGES:1) Three Graces – revitalising and regenerating Liverpool 2) Greenwich Peninsula: Meridian Delta mixed use
development plan
3) West Midlands Fire and Rescue Service 4) Southampton Central Parks – Green Flag award winner
Office of theDeputy Prime Minister
Annual Report 2005
Presented to Parliament byThe Deputy Prime Minister and First Secretary of State,
and the Chief Secretary to the Treasuryby Command of Her Majesty
June 2005
Cm 6526 £00.00

© Crown Copyright 2005
The text in this document (excluding the Royal Arms and departmental logos) may be reproducedfree of charge in any format or medium providing that it is reproduced accurately and not used in a misleadingcontext. The material must be acknowledged as Crown copyright and the title of the document specified.Any enquiries relating to the copyright in this document should be addressed to The Licensing Division, HMSO, St Clements House, 2-16 Colegate, Norwich, NR3 1BQ. Fax: 01603 723000 or e-mail: [email protected]
Foreword: Deputy Prime Minister 5
Permanent Secretary’s Introduction 7
Chapter 1: Who we are 9
Chapter 2: The strategic context 12
Chapter 3: Delivering our objectives 18
Chapter 4: Managing our resources 39
Chapter 5: Executive Agencies and public bodies 54
Annex A: Work streams by Strategic Priority 59
Annex B: Core tables 116
Annex C: Other tables 133
Annex D: ODPM’s approach to asset management 135
Annex E: Office (Departmental) Investment Strategy 136
Annex F: SR 2004 and its outcome 141
Annex G: SR 2004 Public Service Agreement targets 143
Annex H: Public Accounts Committee recommendations 145
Annex I: Useful addresses 148
Annex J: How to obtain publications 152
Annex K: List of abbreviations 154
Contents


Deputy Prime Minister: Draft ForewordODPM Annual Report 2005
Just over two years ago, I set out the Government’sambition to create sustainable communities across thecountry. After the previous decades of underinvestment,our £38 billion Sustainable Communities Plandemonstrated our commitment, right acrossGovernment, to create better places to live – renewingexisting towns and cities and creating new places to livewhich will stand the test of time.
Our aim is to give people more opportunity and choice, so that everyone can havethe chance to share in the prosperity of this country. We want people to feelconfident and proud of living in a neighbourhood which offers them a decent home,a better quality of life, and excellent local services such as schools and hospitals.
This third Annual Report from ODPM reflects on the progress we have made indelivering the Sustainable Communities Plan over the last 12 months. There havebeen a number of landmarks during the year:
● We have reduced by 1 million the total number of social rented homes which failedto meet a decent standard in 1997. These may not be new houses – but for thepeople who live in them, they are a new home.
● We are providing more new housing in areas of high demand. House building inLondon and the South East increased by 25% in the year to September 2004.
● We assisted 10,000 key workers to buy or part-buy their homes under the StarterHome Initiative and announced important new schemes to offer equity shares andlow-cost homeownership to up to 400,000 households.
● The highly successful Delivering Sustainable Communities Summit in Manchestershowed that our approach to sustainable communities is not only making realprogress in this country but is also attracting international support and attention.
5
Foreword
● Local authorities are continuing to improve. 67% of single-tier and county councilsare now classified as good or excellent under the Comprehensive PerformanceAssessment programme, compared with 51% in 2002.
● The planning system has been sped up considerably, despite the highest numberof planning applications since 1988.
Creating sustainable communities is a long-term commitment and there is still a hugeamount to do. Our five-year plans – Sustainable Communities: Homes for All andSustainable Communities: People, Places and Prosperity – set out our ideas andinvestment for the future.
But this Annual Report describes what we have achieved already, thanks to theremarkable energy, expertise and enthusiasm of staff in ODPM, its agencies and ofour countless partners in the public, private and voluntary sector.
John Prescott Deputy Prime Minister
ODPM Annua l Repor t 2005
6

Welcome to the third annual report for the Office ofthe Deputy Prime Minister. It sets out what we haveachieved in 2004/05 and the progress towards ourlonger-term objectives.
ODPM has achieved a great deal that we can be proudof over the past 12 months in delivering and meetingthe challenges of the Sustainable Communities Plan.The Plan set out a comprehensive programme to delivermore housing where it was needed in the South, torevive housing markets in parts of the North and
Midlands, to support the most disadvantaged communities and to improve people’shomes, neighbourhoods and quality of life.
We have made significant progress on all these fronts, and laid the foundations ofsustainable communities. In the high-demand areas of London and the South East,we have made a good start in delivering the additional dwellings necessary to provideaffordable accommodation for the people who work there. In the deprived areas inthe North and Midlands, nine pathfinder partnerships are tackling the most acuteproblems of low demand and abandonment. The Northern Way Growth Strategy, acomprehensive plan for economic growth across the North, has been up and runningsince September 2004, assisted by a £100 million contribution from ODPM.
Not only have we been building new homes and tackling low-demand areas, wehave also made huge strides in improving existing housing. Over a million fewercouncil and housing association-owned dwellings are now classed as non-decent,compared with 1997. We have also made a good start in reducing the number ofvulnerable people living in sub-standard private housing. Good progress is beingmade across a range of priority areas for tackling disadvantage and social exclusion.
The work of ODPM and others in delivering sustainable communities is being greatlyassisted by the improvements we have delivered in the planning system, withsignificantly improved turnaround times in dealing with applications.
7
Permanent Secretary’sIntroduction

We have helped local authorities in improving their services, this being recognisedby the fact that over two-thirds of single-tier and county councils are now rated as‘good’ or ‘excellent’ by the Audit Commission.
We have made a good start in transforming ODPM into a leaner, fitter, moredelivery-focused organisation, equipped with the necessary project and programmemanagement and other skills necessary to deliver the major projects in which weare engaged.
All in all, everybody at ODPM can be proud of what we have achieved, by workingtogether in partnership with our stakeholders, over the past 12 months.
Dame Mavis McDonald DCB
ODPM Annua l Repor t 2005
8

Ministerial team and responsibilities
9
Who we are 1The Rt Hon. John Prescott MP
Deputy Prime Minister and
First Secretary of State
The Rt Hon. David Miliband MP
Minister of Communities and
Local Government
Yvette Cooper MP
Minister for Housing and Planning
Baroness Andrews OBEParliamentary Under Secretary
of State
Jim Fitzpatrick MPParliamentary Under Secretary
of State
Phil Woolas MPMinister for Local Government

Senior management structure
ODPM is managed by the Board, which is chaired by the Permanent Secretary.The Board comprises eight executive members and two non-executive members.
ODPM Annua l Repor t 2005
10
Non-executive members
Vanessa LawrenceNon-Executive BoardMemberDirector General,Ordnance Survey
Bob KerslakeNon-Executive BoardMemberChief Executive ofSheffield City Council
Derek PlewsDirector of Communication
Claire TylerDirector – Social Exclusion Unit
Peter UnwinDirector General –Corporate Strategy andResources Group
Rob Smith Director General – Regional DevelopmentGroup
Joe MontgomeryDirector General – Tackling DisadvantageGroup
Neil KinghanDirector General – Local Government andFire Group
Richard McCarthyDirector General – Sustainable CommunitiesGroup
Mavis McDonaldPermanent Secretary

The structure of the Office of the Deputy Prime Minister
ODPM comprises five major groups:
● The Sustainable Communities Group: responsible for delivering a better balancebetween housing supply and demand, ensuring that people have decent placesto live and improving planning performance by local authorities.
● The Tackling Disadvantage Group: responsible for neighbourhood renewal andsocial inclusion.
● The Local Government and Fire Group: responsible for delivering better publicservices and for improving local government performance.
● The Regional Development Group: responsible for regional economic performance,regional referendums and regional assemblies. It also co-ordinates the work of theGovernment Offices.
● The Corporate Strategy and Resources Group: provides strategic support andensures that ODPM has the resources, skills and facilities it needs to deliver itsobjectives.
ODPM also comprises a number of smaller units that provide support functions forthese groups. These include the following:
● The Directorate of Communication: provides ODPM’s media interface andmanages ODPM’s information responsibilities.
● The Ministerial Group: provides Ministers with their private offices and handles allODPM’s business with Parliament.
● The Legal Directorate: advises Ministers and officials on legal issues and is closelyinvolved in the development and implementation of policy.
Executive Agencies and Non-Departmental Public BodiesDuring the year ODPM was responsible for four Executive Agencies: the PlanningInspectorate, the Fire Service College, the Rent Service and the Queen Elizabeth IIConference Centre. ODPM was also responsible for a number of Non-DepartmentalPublic Bodies.
Chapter 1: Who we are
11

12
ODPM’s responsibilities for local and regional government, housing, planning,fire, regeneration, social exclusion and neighbourhood renewal put ODPM at theheart of the Government’s ambition to create sustainable communities for all.
Our visionA flourishing, fair society based on opportunity and choice for everyone dependson creating sustainable communities – places that offer everyone a decent homethat they can afford in a community in which they want to live and work, now and inthe future.
Not all communities are the same – different places have different strengths andneeds. But sustainable communities have many different things in common: decenthomes at prices people can afford; clean, safe, green environments; access to jobsand excellent services – schools, health services, shops and banks; and peoplehaving a say in the way their community is run.
Sustainable communities should be:
● active, inclusive and safe – fair, tolerant and cohesive with a strong local cultureand other shared community activities;
● well run – with effective and inclusive participation, representation and leadership;
● environmentally sensitive – providing places for people to live that areconsiderate of the environment;
● well designed and built – featuring a quality built and natural environment;
● well connected – with good transport services and communication linking peopleto jobs, schools, health and other services;
● thriving – with a flourishing and diverse local economy;
● well served – with public, private, community and voluntary services that areappropriate to people’s needs and accessible to all; and
● fair for everyone – including other communities, now and in the future.
The strategic context 2

We believe that sustainable communities are the building blocks of a decent,tolerant, inclusive society. That is why we are working across Government and withother partners to open up opportunity and choice in housing across the country; togive everyone the chance of a share in the nation’s prosperity; to create pleasant,safe, clean and green places to live, with excellent local services. We want a fairersociety where everyone has the chance of a decent home, at a price they can affordin a prosperous and sustainable community of which they can feel proud.
Moving forward – our five-year plansThe Sustainable Communities Plan (2003) sets out a long-term commitment tochange the way our housing and communities are planned, designed and built,including major investment in housing, transport and regeneration and promotingexcellence in design and construction. The Government has committed over£38 billion to creating sustainable communities.
In January, we set out the next phase of this ambitious programme in two five-yearplans: Sustainable Communities: Homes for All and Sustainable Communities:People, Places and Prosperity.
A decent, affordable home is a key requirement of a sustainable community.Sustainable Communities: Homes for All details our plans to offer more choice andfairness in housing, providing the opportunity of a decent home at a price peoplecan afford by:
● making sure that there are enough high-quality homes across the whole spectrumof housing – owner-occupied, social rented and private rented;
● helping more people to own their homes;
● making sure that all socialtenants, and at least sevenout of ten vulnerablepeople in the privatesector, have a decenthome;
Chapter 2: The s t ra teg ic context
13
Sustainable Communities Summit:Deputy Prime Minister’s
opening address

● creating sustainable, mixed communities in both rural and urban areas, with thejobs, services and infrastructure they need to thrive;
● providing for those who need more support to meet their housing needs andaspirations, including halving numbers in temporary accommodation;
● cracking down on unauthorised development, and providing for those who choosealternative types of accommodation, such as gypsies and travellers; and
● protecting and enhancing the environment, our historic towns and cities and thecountryside.
Improvements to housing, infrastructure and the environment are key to creatingsustainable communities. But on their own they are not enough. SustainableCommunities: People, Places and Prosperity sets out our plans to work at every levelto improve the communities that people live in: putting people in control and givingthem the tools to shape their future, providing good governance and strongleadership, including:
● giving people more of a say in the way places (both urban and rural) are run,helping improve local services and making areas cleaner, safer and greener;
● working through the town, city or county hall so that local government deliversexcellent services and leads effective partnerships, and enabling communityempowerment;
● tackling disadvantage, so that people are not condemned to lives of poverty,poor services and disempowerment by accidents of birth or geography; and
● working through the regions to increase prosperity, and bringing together services,funding and plans which can best be co-ordinated at regional level.
Taken together, our five-year plans represent an ambitious agenda for transformingthe places where people live, providing more choice, fairness and quality in meetingpeople’s housing needs, and putting more power in the hands of local people andcommunities, ensuring excellent services, democracy and prosperity for all.
The delivery of this agenda, working across all central government departments andwith local government and communities themselves, will promote prosperity for alland help local people create communities they can feel proud to be a part of.
Our Strategic Priorities and Public Service Agreement targetsOur aim is to give people more opportunity and choice, so that everyone can havethe chance to share in the economic and cultural wealth of this country.
ODPM Annua l Repor t 2005
14
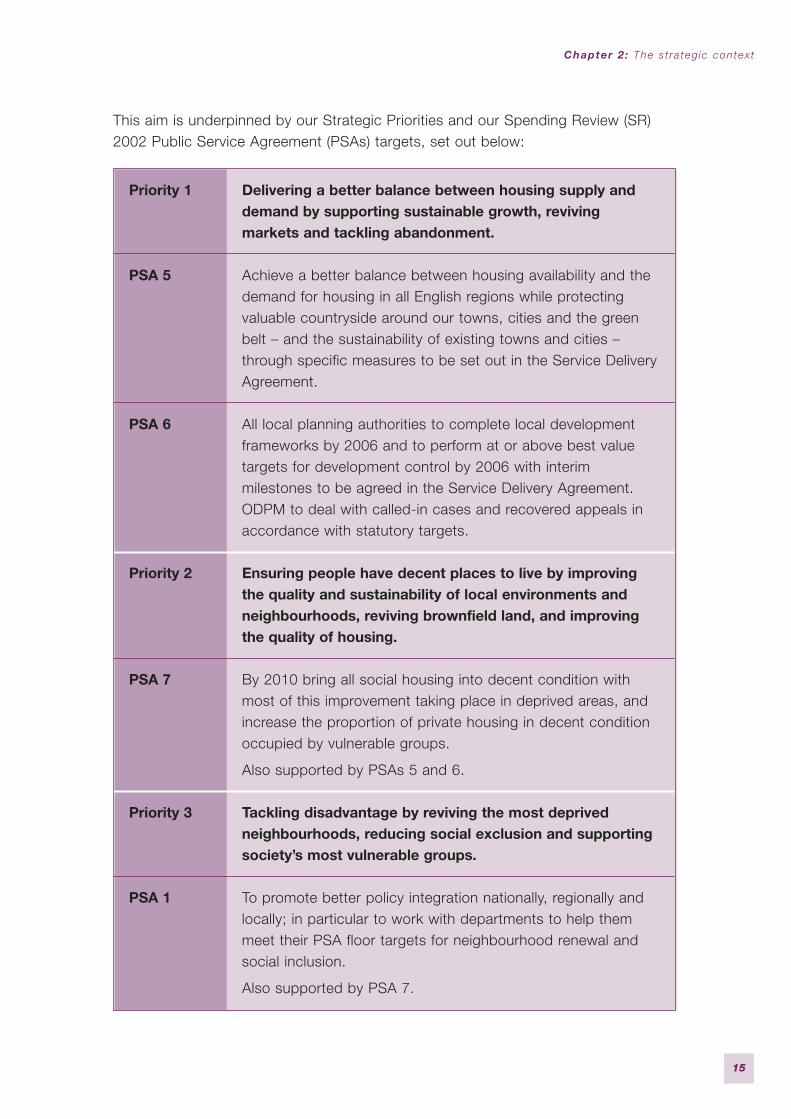
This aim is underpinned by our Strategic Priorities and our Spending Review (SR)2002 Public Service Agreement (PSAs) targets, set out below:
Priority 1 Delivering a better balance between housing supply anddemand by supporting sustainable growth, revivingmarkets and tackling abandonment.
PSA 5 Achieve a better balance between housing availability and thedemand for housing in all English regions while protectingvaluable countryside around our towns, cities and the greenbelt – and the sustainability of existing towns and cities –through specific measures to be set out in the Service DeliveryAgreement.
PSA 6 All local planning authorities to complete local developmentframeworks by 2006 and to perform at or above best valuetargets for development control by 2006 with interimmilestones to be agreed in the Service Delivery Agreement.ODPM to deal with called-in cases and recovered appeals inaccordance with statutory targets.
Priority 2 Ensuring people have decent places to live by improvingthe quality and sustainability of local environments andneighbourhoods, reviving brownfield land, and improvingthe quality of housing.
PSA 7 By 2010 bring all social housing into decent condition withmost of this improvement taking place in deprived areas, andincrease the proportion of private housing in decent conditionoccupied by vulnerable groups.
Also supported by PSAs 5 and 6.
Priority 3 Tackling disadvantage by reviving the most deprivedneighbourhoods, reducing social exclusion and supportingsociety’s most vulnerable groups.
PSA 1 To promote better policy integration nationally, regionally andlocally; in particular to work with departments to help themmeet their PSA floor targets for neighbourhood renewal andsocial inclusion.
Also supported by PSA 7.
Chapter 2: The s t ra teg ic context
15
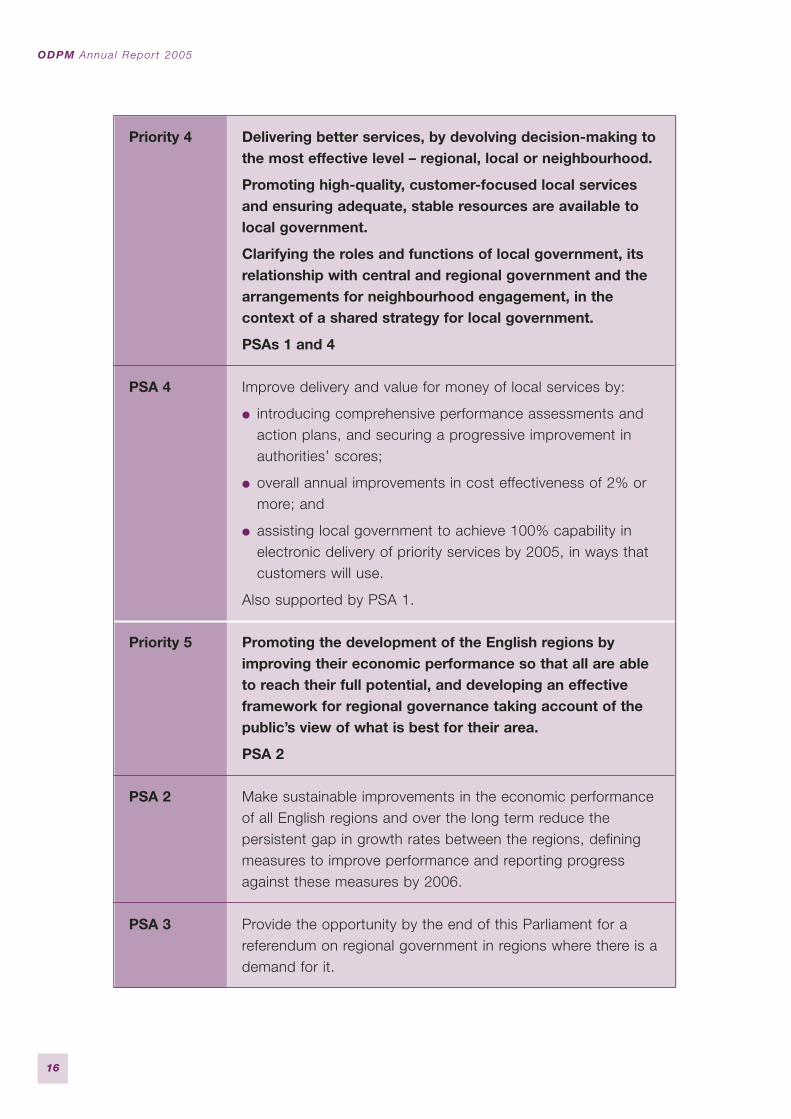
Priority 4 Delivering better services, by devolving decision-making tothe most effective level – regional, local or neighbourhood.
Promoting high-quality, customer-focused local servicesand ensuring adequate, stable resources are available tolocal government.
Clarifying the roles and functions of local government, itsrelationship with central and regional government and thearrangements for neighbourhood engagement, in thecontext of a shared strategy for local government.
PSAs 1 and 4
PSA 4 Improve delivery and value for money of local services by:
● introducing comprehensive performance assessments andaction plans, and securing a progressive improvement inauthorities’ scores;
● overall annual improvements in cost effectiveness of 2% ormore; and
● assisting local government to achieve 100% capability inelectronic delivery of priority services by 2005, in ways thatcustomers will use.
Also supported by PSA 1.
Priority 5 Promoting the development of the English regions byimproving their economic performance so that all are ableto reach their full potential, and developing an effectiveframework for regional governance taking account of thepublic’s view of what is best for their area.
PSA 2
PSA 2 Make sustainable improvements in the economic performanceof all English regions and over the long term reduce thepersistent gap in growth rates between the regions, definingmeasures to improve performance and reporting progressagainst these measures by 2006.
PSA 3 Provide the opportunity by the end of this Parliament for areferendum on regional government in regions where there is ademand for it.
ODPM Annua l Repor t 2005
16

Chapter 3, in broad terms, sets out the progress we have made against thesepriorities and the PSA targets which were set in 2002 SR. Annex A sets out in moredetail the specific progress we have made against the SR 2002 PSA targets, as wellas progress against the other targets.
SR 2004 updated and added to our PSA targets for 2005/06, to reflect the additionaland evolving challenges and priorities for ODPM – in particular to adopt newchallenging targets for fire modernisation and liveability. These are given in full inAnnex F.
Chapter 2: The s t ra teg ic context
17
Sustainable CommunitiesAward Winners:
Grange Park Community Project,Blackpool

18
Real progress
In February 2003 we published the £38 billion Sustainable Communities Plan –the most comprehensive programme of investment in decades to improve people’shomes, neighbourhoods and quality of life.
The Plan set out a vision of sustainable communities for the next 15 to 20 years anda programme for immediate action, bringing together work across Government todeliver real change.
To take this agenda forward we have set ourselves five Strategic Priorities aroundwhich our work is based, reorganised ODPM to better reflect these priorities, andpublished our two five-year plans setting out the programme for delivery of our ideas.
ODPM is playing a leading rolein creating sustainablecommunities: investing in decenthomes and quality publicspaces, promoting excellentlocal services, help forvulnerable people andsupporting a thriving economy inall regions. But to deliver lastingchange, Government as a wholeneeds to work together.
ODPM’s focus is on the waydifferent Governmentprogrammes come together
Delivering ourobjectives 3
Sustainable CommunitiesYouth Summit

for people in different places – across regions, in cities, towns, villages andneighbourhoods.
This underpins ODPM’s work in bringing together efforts across Government tocreate sustainable communities. ODPM’s contribution is threefold: working to fashionGovernment policies and programmes around the needs of particular places orgroups of people; promoting good local government and good local services; anddelivering some of the key things upon which sustainable communities depend, suchas housing.
We have a number of key functions that help us to deliver sustainable communities:
● responsibility for good governance at all levels – the regions, local government andneighbourhoods;
● leading the development of a cross-Government strategy for local government;
● reforming the planning system to promote sustainable development reflecting thesocial, economic and environmental needs of different places and people; and
● working across Government to improve standards of public services to benefit themost disadvantaged communities.
The importance of the cross-departmental aspect of our working is underlined bythe shared Public Service Agreements (PSAs) to which we contribute, in addition tothose agreed specifically to meet our aim of creating sustainable communities.
This work is coming together in different places across the country to make a realdifference to the quality of people’s lives and communities.
Strategic Priority 1A better balance between housing supplyand demand
Over one million more people own their own homes now than in 1997; 70% ofhouseholds now own their own home; and nine out of ten households would preferto own their own home if they could. The Barker Review of Housing Supply (March2004) confirmed the need for a step change in housing supply, with almost 190,000new households expected to be formed each year to 2021. Our SustainableCommunities Plan sets out our programme to build more homes supported by jobs,infrastructure and public services, whilst protecting the countryside and our historictowns and cities. Increasing the supply of market and affordable homes in high-
Chapter 3: Del iver ing our ob ject ives
19

demand areas will reduce the upward trend in homelessness, whilst we are alsoaddressing the causes of low demand in areas of the North and Midlands.
This is a complex objective involving a diverse range of work streams across theregions and tailored to reflect their specific circumstances. Whilst it is too early tomake an assessment across all elements of the target, good progress is being made.
The delivery structure for the Thames Gateway Programme has been rationalisedthrough the creation of a Thames Gateway Delivery Office, two Urban DevelopmentCorporations at London and Thurrock, an Urban Renaissance Corporation and sixlocal regeneration partnerships to oversee delivery on the ground across theGateway. Creating Sustainable Communities: Delivering the Thames Gateway waspublished in March 2005 – a gateway setting out the Government’s strategy forgrowth and regeneration in the Thames Gateway, showing how it is being deliveredand giving direction for the future.
On homelessness, we have achieved and sustained our March 2004 target of endingthe long-term use of bed and breakfast hotels for homeless families with childrenand we have sustained reductions in rough sleeping. There are also emerging
indications of successfrom new localauthorityhomelessnessstrategies andprevention initiatives,with a slight fall in theflow of homelessnessacceptances duringthe first half of 2004 –this is ahead ofexpectations.
PSA 5 – SR 2002 PSA target
Achieve a better balance between housing availability and the demand forhousing in all English regions while protecting valuable countryside aroundour towns, cities and green belt – and the sustainability of existing townsand cities – through specific measures to be set out in the Service DeliveryAgreement.
ODPM Annua l Repor t 2005
20
Regeneration sitesin Medway

In March 2004 we launched Key Worker Living (KWL), a new £690 millionprogramme of support for key workers. KWL is targeted at public services inLondon, the South East and the East of England, where the high cost of housingis contributing to serious recruitment and retention problems. 2,532 key workersexchanged or completed purchases by the end of January 2005.
We set the Housing Corporation a target for 2004/05 of 27,000 homes for rent orlow-cost home ownership, including those for key workers. To the end of January,18,886 completions had been reported by the Corporation.
Within low-demand areas the housing market renewal pathfinders are progressingwell into the delivery stage of their programmes. The pathfinders are all at differentstages of their development but they are working hard to develop strategies that willenable them to overcome low demand and abandonment. Once all of thepathfinders have had their schemes agreed, we should begin to see visible signsof progress on the ground in these areas.
Housing – South East
We said that we would work to tackle the housing shortage in London and theSouth East, delivering new growth in a sustainable way. We have delivered:
● a 25% increase in the number of new houses built in London and the South East,from 43,700 in the year to June 2001 to 55,500 in the year to June 2004, anincrease of 25%;
● over 60,000 new homes now built annually in the wider South East, whileprotecting the environment; and
● the allocation of £850 million to the Thames Gateway from 2003 to 2008, and theapproval of 160 projects totalling £510 million.
Housing – low-demand areas
We said that we would bring life back to parts of the North and Midlands that weresuffering from decay and decline. We have delivered:
● nine pathfinder partnerships in the North and Midlands to tackle the most acuteproblems of low demand and abandonment;
● a new sense of dynamism in the regions, with the three Northern RegionalDevelopment Agencies leading work on the Northern Way Growth Strategy,a comprehensive plan for economic growth across the North; and
Chapter 3: Del iver ing our ob ject ives
21

● an extra £65 million to 2008, as announced in Homes for All, to tackle low-demand problems outside the existing pathfinders. Their funds will be distributedthrough the Regional Housing Boards to the three northern regions.
Housing – affordable homes
Providing affordable homes and helping more people into sustainable homeownership is central to our policies. We have delivered:
● the Starter Home Initiative, assisting over 10,000 key workers to buy or part-buytheir homes;
● the establishment of a wide range of low-cost homeownership schemes, asoutlined in Homes for All, which will help 80,000 households into low-cost homeownership – the schemes include the First Time Buyers Initiative, Home Buy andKWL;
● the setting up, since the publication of the Barker Review (March 2004), of theCommunity Infrastructure Fund, which has made £200 million available fortransport infrastructure in the Growth Areas in 2006/07 and 2007/08. We are alsoundertaking two major research projects that will support decisions on anaffordability goal, which will be set by the end of 2005.
Protecting the countryside
We said that we would protect the countryside and address the needs of ruralcommunities. We have delivered:
● 67% of new homes in England being built on brownfield land in 2002 and 2003.This exceeds our target of 60%, and represents a substantial progress since 1997when the proportion was 56%;
● an increase in the density of new development from 25 dwellings per hectare (dph)in 1997 to 33 dph in 2003;
● 19,000 hectares added to the green belt; and
● with the densities and levels of brownfield land use now being achieved in thewider South East, the 1.1 million proposed new homes will be built on about 3,300hectares less of greenfield land – an area the size of Oxford – than the 900,000homes previously planned with the 1997 densities and levels of brownfield land use.
Key work streams set out in Tackling Homelessness also contribute to the deliveryof PSA target 5.
ODPM Annua l Repor t 2005
22

Reforming the planning system is an important part of delivering on this StrategicPriority. We have introduced the Planning and Compulsory Purchase Act, whichprovides the basis for a better and faster planning system. It enables the productionof Regional Spatial Strategies and Local Development Frameworks, on whichseparate regulations, guidance and training have been produced. Throughincentivisation and funding, we have enabled local planning authorities to handle40% more applications now than they did a decade ago, and to process them faster.And we have committed to a new PSA 6 target for the planning system which willdeliver sustainable development outcomes at national, regional and local levels.
An effective planning system is essential to delivering our objectives for sustainablecommunities; for urban and rural regeneration; for improving the country’sinfrastructure; and for achieving truly sustainable development. It needs to deliver thestep changes we need to tackle the challenges of ensuring that everyone has theopportunities of a decent home, and the quality of life that goes with that.
The planning system should:
● deliver in a sustainable way key Government objectives such as housing,economic development, transport infrastructure and rural regeneration whileprotecting the environment;
● create and sustain mixed and inclusive communities;
● be transparent so that the right decisions are taken more quickly, with a set ofrules that everyone can understand;
● deliver a development control system that is efficient and effective;
● enable local communities to be involved much more positively than before; and
● deliver a higher quality and better respected public service.
The vision for a planning system meeting those objectives would be a system which is:
● central to policy making and governance at all levels – national, regional and local;
PSA 6 – SR 2002 PSA target
All local planning authorities to complete local development frameworks by2006 and to perform at or above best value targets for development controlby 2006 with interim milestones to be agreed in the Service DeliveryAgreement. ODPM to deal with called-in cases and recovered appeals inaccordance with statutory targets.
Chapter 3: Del iver ing our ob ject ives
23

● accepted with confidence by stakeholders, ensuring that developers know thattheir plans will be dealt with consistently, transparently and efficiently, and thatcommunities know that their views will be properly considered and will influenceoutcomes;
● regarded as a high status profession, offering attractive careers and stimulatingand worthwhile jobs.
Planning – improving performance
We said that we would reform the planning system, devolve power to the regionsand provide more freedom for local government and raise standards. We havedelivered:
● improvements in local government – two-thirds of single-tier and county councilsare now rated good or excellent by the independent Audit Commission;
● Local Area Agreements to deliver better services based on shared priorities; and
● a faster planning system: over half of major applications are now determined within13 weeks; and two-thirds of minor applications are now determined in eightweeks.
Strategic Priority 2Ensuring people have decent places to live
People want a decent, affordable home in an attractive place to live that is clean andsafe, with good parks, play areas and green spaces.
Falling investment in housing during the 1980s meant fewer social houses were built,and the quality of existing stock fell. By 1997, there was a £19 billion backlog ofrepairs in local authority housing, and some two million social homes failed to meetdecency standards.
Since 1997, we have reduced the number of non-decent homes by around onemillion. By 2010, we aim to have delivered decent homes for all social tenants andto have ensured that at least 70% of vulnerable households in the private sectorhave decent homes.
Alongside measures to improve the physical condition of social housing aremeasures to protect and support vulnerable people and action to make publicspaces cleaner, safer and greener.
ODPM Annua l Repor t 2005
24

We said that we would work towards our goal of a decent home for everyone andhelp for vulnerable people. We have delivered:
● a reduction by one million since 1997 in the number of non-decent social sectorhomes;
● 130,000 vulnerable households in the private sector helped to make their homesdecent; and
● an end to the long-term use of bed and breakfast accommodation for homelessfamilies.
We have, through the Housing Act 2004, introduced measures to protect and supportvulnerable tenants. Around 1.5 million buyers and sellers a year will benefit fromHome Information Packs which will streamline the home buying and selling process.We are strengthening the private rented sectorthrough the licensing of landlords and theprotection of tenancy deposits. We arefocusing enforcement activity on dwellings thatpose potential risks to the health and safety ofvulnerable occupants. The Act also introducesnew powers for social landlords to tackle anti-social behaviour and strengthens the rights ofthose who live in park homes. We will also besafeguarding against abuses of the Right toBuy system and tackling illegal Gypsy andTraveller sites through the provision of officialsites and the refurbishment of existing ones.
Our agenda to improve housing managementincludes the commitment to introduce choiceand mobility across all rented sectors and tosupport the efficiency improvements in the
PSA 7 – SR 2002 PSA target
By 2010 bring all social housing into decent condition with most of thisimprovement taking place in deprived areas, and increase the proportionof private housing in decent condition occupied by vulnerable groups.
Chapter 3: Del iver ing our ob ject ives
25
Newly refurbished home at Grove Village, Manchester, made possible by the Housing Private Finance Initiative
way in which social landlords maintain and manage their housing stock. ‘moveUK’was launched in March 2005. This is a web-based system that brings togethernationwide information on jobs and social housing to assist social tenants seeking tomove to another area.
We have led action across Government to improve public spaces following thepublication of Living Places in 2002. Since then we have invested £200 million inparks and open spaces, driving up satisfaction and performance, and we haveworked with other departments on new powers, rights and responsibilities to tackleanti-social behaviour and local environmental issues which affect the day-to-dayexperience of our neighbourhoods.
Through our new PSA target on liveability we will lead delivery of cleaner, safer,greener communities by support for local authorities to raise standards in theservices they provide and in their community leadership role. This includes acommitment to give more power to neighbourhoods to tackle doorstep issues, extrapowers through the Clean Neighbourhoods and Environment Bill, and a ‘How To’programme to develop and disseminate good practice with leaders and practitioners.
This is an ambitious and long-term agenda, which builds on the significant progressmade in recent years in improving housing for millions.
Strategic Priority 3Tackling disadvantage
Deprived neighbourhoods have a lot in common: poor housing, poor health, pooreducation, fewer job opportunities and high crime rates.
Our priority is to continue our efforts to renew the most deprived neighbourhoods,bring our expertise to bear on the tougher areas so preventing social inclusion, andto maintain the significant reductions in homelessness that have been achieved inrecent years.
As stated in our five-year plan, we will continuously improve our targeted support toneighbourhoods, and tackle the five key drivers of deprivation for both people andplace, namely worklessness, homelessness, low educational attainment, healthinequalities and crime. We will also focus on the most disadvantaged and championthem as services are transformed across Government.
Our focus has been centred on the delivery of the neighbourhood renewal PSA,which commits us to work to deliver improvements in key areas, set out in floor
ODPM Annua l Repor t 2005
26
targets across Government, as well as our work on tackling homelessness, andprogress on our Strategic Priorities on housing supply and demand and on decenthomes. Progress against specific work streams is set out in Annex A.
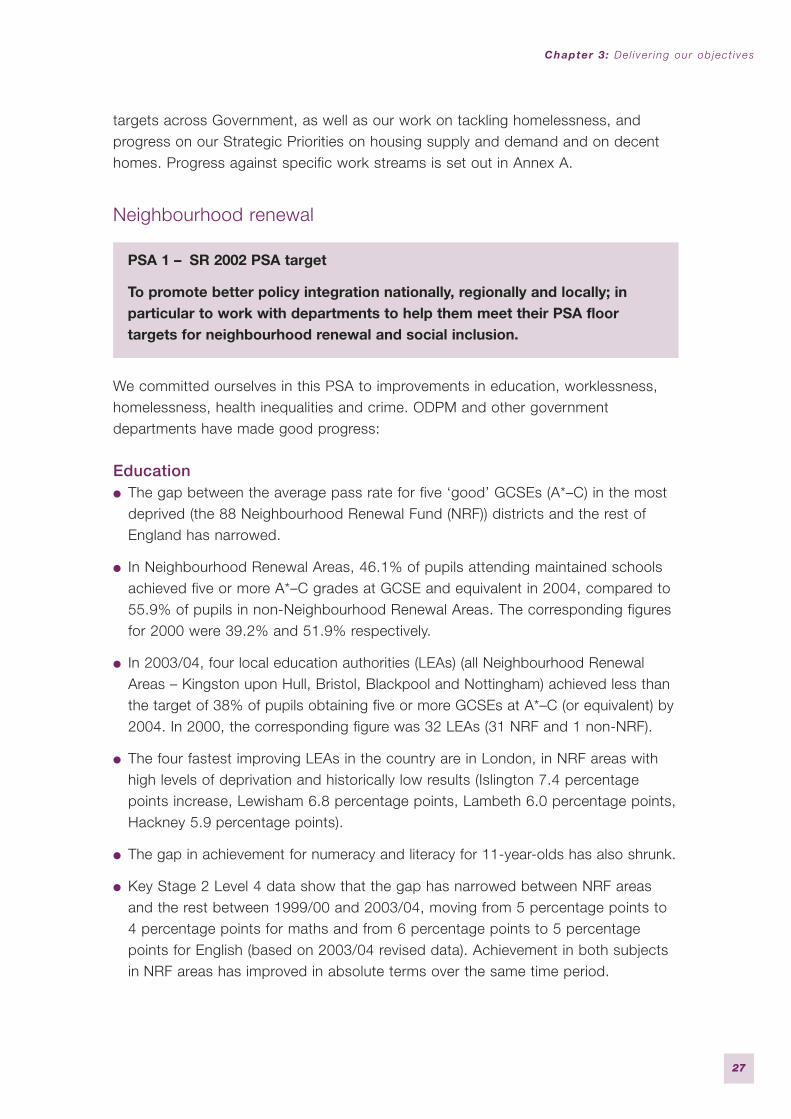
Neighbourhood renewal
We committed ourselves in this PSA to improvements in education, worklessness,homelessness, health inequalities and crime. ODPM and other governmentdepartments have made good progress:
Education● The gap between the average pass rate for five ‘good’ GCSEs (A*–C) in the most
deprived (the 88 Neighbourhood Renewal Fund (NRF)) districts and the rest ofEngland has narrowed.
● In Neighbourhood Renewal Areas, 46.1% of pupils attending maintained schoolsachieved five or more A*–C grades at GCSE and equivalent in 2004, compared to55.9% of pupils in non-Neighbourhood Renewal Areas. The corresponding figuresfor 2000 were 39.2% and 51.9% respectively.
● In 2003/04, four local education authorities (LEAs) (all Neighbourhood RenewalAreas – Kingston upon Hull, Bristol, Blackpool and Nottingham) achieved less thanthe target of 38% of pupils obtaining five or more GCSEs at A*–C (or equivalent) by2004. In 2000, the corresponding figure was 32 LEAs (31 NRF and 1 non-NRF).
● The four fastest improving LEAs in the country are in London, in NRF areas withhigh levels of deprivation and historically low results (Islington 7.4 percentagepoints increase, Lewisham 6.8 percentage points, Lambeth 6.0 percentage points,Hackney 5.9 percentage points).
● The gap in achievement for numeracy and literacy for 11-year-olds has also shrunk.
● Key Stage 2 Level 4 data show that the gap has narrowed between NRF areasand the rest between 1999/00 and 2003/04, moving from 5 percentage points to4 percentage points for maths and from 6 percentage points to 5 percentagepoints for English (based on 2003/04 revised data). Achievement in both subjectsin NRF areas has improved in absolute terms over the same time period.
PSA 1 – SR 2002 PSA target
To promote better policy integration nationally, regionally and locally; inparticular to work with departments to help them meet their PSA floortargets for neighbourhood renewal and social inclusion.
Chapter 3: Del iver ing our ob ject ives
27
Worklessness ● Autumn 2004 data show that between spring 2003 (base line) and autumn 2004,
the employment rate in the 30 Local Authority Districts (LADs) with the highestlevels of worklessness increased by 1.1 percentage point, and over the sameperiod the gap between target areas and national average narrowed by0.9 percentage point. This indicates that the Department for Work and Pensions(DWP) are ahead of schedule in meeting their target in the 30 LADs. The autumn2004 data also confirm the trend in the gap being reduced for black and minorityethnic (BME) and low qualifications groups.
● An extra half a million more people from deprived areas are in jobs. Employmentrates in the 88 NRF districts have increased by 1.7 percentage points since1997/98. Regional Development Agencies have also contributed to 89,694 newand safeguarded jobs, 6,064 new businesses and 194,380 more learningopportunities.
Homelessness and housing● The two-thirds reduction in the level of rough sleeping has been sustained and is
currently at the lowest ever recorded level (around 500 people on a night).
● The long-term use of bed and breakfast accommodation for homeless familieswith children has been virtually eliminated, with 95% fewer families with childrenliving in bed and breakfast accommodation for over six weeks at the end ofSeptember 2004 compared with March 2002 when the target was announced.
● The number of non-decent homes has been reduced by one million, with£18 billion invested in social housing.
● Findings indicate that housing conditions across the 88 NRF areas have steadilyimproved, with the number of non-decent social sector homes falling by 38%(from 1.4 to 0.8 million) since 1996. This accounts for 66% of the overall reductionin social sector non-decent homes since 2001.
● Increased investment in social housing – up by almost £360 for each propertysince 1997 and many in NRF areas.
Health● England is experiencing rapidly reducing death rates from cancer and
cardiovascular disease.
● Teenage pregnancy rates are falling faster in our most deprived areas – droppingmore quickly in the 88 NRF districts than the England average. This has reducedthe gap between the two from 12.6 percentage points to 11.6.
ODPM Annua l Repor t 2005
28
Crime● The gap between average burglary rates for the 88 NRF districts and the rest of
England fell by just under a fifth.
● Robbery rates for England and the 88 most deprived districts have decreasedover the last two years.
● Vehicle crime rates in the 88 NRF districts have fallen at a faster rate than theEngland average – dropping from 27 to 23 for every 1,000 people.
Tackling Social Exclusion
The Social Exclusion Unit’s role is to look at specific problems and produce actionplans, supported by a strong evidence base to tackle these problems. During thelast year the SEU has published reports on Mental Health and Social Exclusion, Jobsand Enterprise in Deprived Areas and has agreed a series of action plans with othergovernment departments relating to each of these reports. The responsibility forimplementation of the specific agreed action lies with the nominated department.However, the SEU continues to play a significant part in the process by championingand supporting the implementation of the action plans. It works closely withgovernment departments and key service delivery agencies to ensure that theagreed actions are taken forward in a timely and effective manner and aredisseminated to stakeholders.
Breaking the cycle of social exclusionSEU also undertook a major stocktake exercise in 2004, which culminated in thepublication of Breaking the Cycle – taking stock of progress and priorities for thefuture in September 2004. This report outlines the progress made to date in tacklingthe causes and consequences of social exclusion; the challenges that remain andthat might arise in the future; the lessons learned about delivering services todisadvantaged people; and the priorities for future action. Its findings formed thebasis of the current SEU work programme, which was announced alongside thisreport and is aimed at improving the service delivery to disadvantaged groups inorder to improve their life chances, compared with the rest of the population.
Supporting People contribution
Our principal work this year has been to implement the recommendations of theSupporting People Independent Review published in January 2004. We havefocused on promoting value for money, capacity building for authorities andproviders, and removing some of the uncertainties around the programme. We havefunded the Audit Commission inspections of administering authorities, including 19apparently high-cost authorities. Last October we undertook, in our response to the
Chapter 3: Del iver ing our ob ject ives
29

Select Committee report into Supporting People, to give a comprehensive update onthe progress we have made in the effective delivery of the programme.
Following the SR 2004 announcement, in August we revealed an unprecedented £5billion three-year funding settlement for Supporting People, giving authorities greaterassurance to plan ahead. £1.72 billion will be allocated in 2005/06 and around£1.7 billion each year in 2006/07 and 2007/08. In December, authorities wereinformed of their individual allocations, which were partially informed by the newlydeveloped distribution formula which takes into account relative need.
From the start of the programme to date, we have commissioned the AuditCommission to undertake Supporting People inspections of 61 administeringauthorities (AAs), including the 19 apparently high-cost authorities. Whereinspections indicate that authorities have not performed well, we offer support to theauthority to help implement the recommendations. The Audit Commission re-inspectthe 0 star authorities within six months.
We have instituted the monitoring and support programme for authorities to helpthem improve their administration of the programme. This includes:
● development of a Supporting People Capacity Building programme, and providingsupport for authorities and providers to effectively manage the programme anddeliver improved services;
● launch of the Value Improvement Projects, which will identify, evaluate and pursueopportunities to secure substantial improvements in value for money;
● work on benchmarking so that providers can compare performance and focus onbest practice to improve service delivery; and
● launch of a substantially improved Supporting People website; and we are workingto introduce a Directory of Services next year.
Administering authorities are making progress on their service reviews and we aremonitoring this closely. To help ensure that the deadline of April 2006 for completingreviews is met, we have made an additional £2 million available to authorities.Authorities are currently working on their five-year strategies which will set out theirlonger-term vision of Supporting People in their areas. These are due at the end ofMarch 2005.
ODPM Annua l Repor t 2005
30
During the first six months of 2004/05, we estimate some 84,000 new clients receivedSupporting People services. Last year we undertook a Benefits Realisation study toestablish the potential benefits of the Supporting People programme for the clientgroups, who account for 80% of Supporting People funding. The findings suggest thatthe quantifiable benefits are roughly equal to the costs of the programme for thegroups examined. Additionally, there are substantial benefits that cannot be priced,such as greater choice, independence, and social inclusion for individual users.
It is essential that in the delivery of Supporting People services, AAs and providersensure that they are getting good value for money. This includes assessment of theoutcomes delivered by each service for vulnerable people: a cheap service is notgood value for money if it is not achieving positive outcomes for people.
We are now collecting data from all AAs on performance against the three KeyPerformance Indicators (KPIs). We will use 2005/06 to establish baselineperformance against these indicators and will then look to authorities to improve thatperformance and ensure that they are delivering the best possible outcomes for allgroups of vulnerable people.
The three KPIs are:
● service users who are supported to establish and maintain independent living (forlong-term services);
● service users who have moved on in a planned way from temporary livingarrangements (for short-term services); and
● fair access to people who are eligible for Supporting People services. This relatesprimarily to BME groups but we will look to examine this against other client groups.
We will continue to improve the administration of the programme, further developthe support available for providers, and to complete work on the needs baseddistribution formula in the coming year.
We will work with Supporting People authorities to help them improve their delivery ofthe programme and to promote better use of their resources. We will encourage bettercross-authority planning and delivery of services to vulnerable groups. In particular wewill seek to help district councils to improve the links between their homelessnessservices and the Supporting People services delivered through counties.
Chapter 3: Del iver ing our ob ject ives
31

Strategic Priority 4Delivering better local public services
There is real evidence that local authority services and performance are improving.By the end of 2004, two-thirds of upper-tier local authorities were rated as good orexcellent under the Comprehensive Performance Assessment (CPA) by theindependent Audit Commission, with only one being rated as poor.
A key priority in our efforts to deliver better local public services is to develop a newstrategic direction for local government, to provide a coherent framework for astronger, more confident local government, and a more coherent settlementbetween central and local government, leading to clearer democratic accountability.
We published The future of local government: Developing a 10-year vision in July,setting out the Government’s intentions to develop a longer-term strategic approachto local government, to be developed in conjunction with partners across Whitehall,local government and beyond.
Since then, ODPM has been working to develop the strategy through engagementactivity and a series of discussion documents on key themes. The first of these wasa prospectus for local area agreements, published alongside The Future of Local
Government. This was followed in January withpapers entitled Vibrant Local Leadership andCitizen Engagement and Public Services: WhyNeighbourhoods Matter. In March we publisheda fourth discussion document Securing betteroutcomes: developing a new performanceframework, which also posed some broadquestions about the future of local services.
We shall be taking forward discussions on theseand others questions with a view to developinga longer-term vision for local government, whichwill include the Government’s Response to theLyons Inquiry.
We have set out in detail in Annex A the progresswe have made, but our main focus has beenaround delivering our targets on LocalGovernment Performance and the Fire Service.
ODPM Annua l Repor t 2005
32
West Yorkshire Fire and Rescue Service in action
Our PSA target for local government performance focuses on CPA scores, cost-effectiveness and delivery of electronic services. Our progress against CPA scoresis set out below, and the other elements of the PSA target in Annex X.
Comprehensive Performance Assessments
● The third year of CPA results for single-tier and county councils published inDecember 2004 show that:
– 52 councils moved to a higher CPA category in December 2004;
– two-thirds of single-tier and county councils were categorised as either‘excellent’ or ‘good’ compared to just over half when CPA was first introducedin 2002; and
– only 16 councils were categorised as either ‘weak’ or ‘poor’ in 2004 comparedto 35 in 2002.
● The average combined score for service delivery and corporate capacity in unitaryand county authorities was 69.87 in December 2002, 72.11 in December 2003and 76.03 in December 2004.
● Results for 237 out of 238 district council CPAs published by December 2004show that nearly half of all district councils (48%) have been assessed as either‘excellent’ or ‘good’.
● Of the 15 councils entering engagement with ODPM in 2002, only one remains‘poor’.
● Since December 2004, there have been an additional seven corporateassessments that have further improved the position. By the end of the year, thenumber of single-tier and county councils in each category, as measured by CPA,were: 46 excellent, 56 good, 33 fair, 14 weak and one poor.
Local government finance
ODPM is committed to maintain and develop a framework for local governmentfinance which supports local engagement and flexibility and the delivery of sharedGovernment priorities.
PSA 4 – SR 2002 PSA target
Improve delivery and value for money of local services by:
● introducing comprehensive performance assessments and action plans,and securing a progressive improvement in authorities’ scores.
Chapter 3: Del iver ing our ob ject ives
33

We have delivered the following:
● From April 2004, introduced a new local government capital finance system,the Prudential System. This delivers a major new freedom for local governmentby removing the previous requirements under which authorities could only borrowwith specific Government permission. Authorities now take their own borrowingdecisions, subject only to the borrowing being affordable.
● Reduced pressures on council tax by £1 billion in 2005/06 through providingmore resources and by increasing flexibility, reducing ring-fencing and lesseningobligations on local government.
● Since 1997, there has been a real terms increase in total Government grant tolocal government of 33%, compared with a real terms cut of 7% between 1993and 1997.
Local Area Agreements
Negotiations for the initial phase of 21 LAA pilots is now complete, and the firstLAAs are now in operation across all regions.
They have enabled these areas to pool or align £500 million of funding which isfocused on high-level outcomes agreed between the Government and local partners.They represent a radical new approach in the relationship between central and localgovernment, including a new approach to devolved decision making and largereductions in bureaucracy
LAAs have already led to more shared agendas among central departments,including a willingness to pool funding streams and focus on key outcomes.In negotiations, pilots have built upon this with their own priorities. This meansthat national outcomes will be met in ways better suited to local areas.
LAAs will lead to improved delivery and value for money of local services by joiningup services, providing greater flexibility for local priorities, pooling funding streams,and encouraging close partnership working.
In light of the very encouraging progress made so far, we shall announce a furtherphase of agreements to be in place by April 2006. These agreements will bring LocalPublic Service Agreements together with LAAs, providing a reward element of LAAs.
ODPM Annua l Repor t 2005
34
Fire modernisation
We said that we would reduce the number of fire-related deaths and deliberate fires:
● The current average (1999/00 to 2003/04) for accidental deaths in the home peryear is 311, a reduction of 18% on the average in the five years to March 1999.The latest figure available – for the financial year ending March 2004 – is 304 suchdeaths. This represents good progress towards meeting the fire deaths target.Nonetheless, further progress is required to actually meet the target, especiallywhen account is taken of the upward pressure from population changes.
● The Government’s initiatives, such as funding arson reduction and quicker vehicleremoval, are reducing the number of deliberate fires. The most recent statistics, forthe year ending March 2004, also show an encouraging reduction in deliberatefires of 8% to 99,500. But it is too early to conclude that this marks the reversal ofthe long-term upward trend.
Civil Resilience The Civil Resilience Directorate (CRD) was established in June 2003 to co-ordinateODPM resilience programmes. Resilience means ensuring that the country is wellprepared to detect, prevent and respond to major emergencies, including terroristattacks.
Since its establishment CRD has ensured that ODPM is fully involved in theGovernment’s resilience agenda. We have led on providing the Fire and RescueService with the capability to respond to major catastrophic incidents. Theintroduction of the Fire and Rescue Service Act 2004 provided the Fire Service withthe statutory cover to respond to such incidents.
SR 2002 SDA target – revised
Community fire safety and health inequalities:
To reduce the number of accidental fire-related deaths in the home by 20%averaged over the 11-year period to March 2010 compared with the averagerecorded in the five-year period to March 1999 – with a floor element that nolocal authority fire brigade will have a fatality rate more than 1.25 times thenational average by March 2010.
Arson reduction
To reduce by 10% the number of deliberate fires by 31 March 2010 from the2001/02 baseline figure.
Chapter 3: Del iver ing our ob ject ives
35

Strategic Priority 5Promoting the development of English regions
The Government’s aim is to achieve rising prosperity and a better quality of life, witheconomic and employment opportunities for all. Central to this aim is improving theeconomic performance of all the English regions, and reducing the persistent gap ingrowth rates between the regions. This will enhance equality and release the economicpotential of every region and locality to improve the growth rate of the UK overall.
Regions have played a powerful part in driving the UK’s economic success in recentyears. Projections suggest that, by 2010, the trend in growth in every region will behigher than in the period 1989–2002, and improved regional economic performancewill mean that people in all regions of England will be better off compared to 2004.
However, economic growth continues to be led by some regions more than others,meaning that the economy as a whole is not achieving its full potential. The keychallenge is to promote strong economies in all regions, narrowing the economicdivide and boosting the economy as a whole. ODPM has a central role in developingthe Government’s regional agenda, together with the Department of Trade andIndustry (DTI) and HM Treasury.
ODPM is also responsible for co-ordinating the work of the nine Government Offices,which deliver many of ODPM’s and the Government’s policies in the regions.
ODPM Annua l Repor t 2005
36
Prime Mover vehicles, with high volumepumping equipment, in use during thefloods in Carlisle (January 2005)

Successful delivery of the Regional Economic Performance (REP) PSA depends on theactions of a wide range of government departments, the Regional Development Agencies(RDAs) and other delivery agents which have the potential to contribute to improvementsin the performance of each region in each of the key drivers of economic growth.Significant progress has been made with delivery of the REP PSA over the past year:
● the identification of key measures to improve regional economic performance,based around the key drivers of economic growth – employment, skills, innovation,enterprise, investment and competition. These measures were published in theTechnical Note for the PSA in July 2004 which can be viewed on the ODPM, DTIand HM Treasury websites;
● the publication, at the Sustainable Communities Summit on 1 February 2005, ofRealising the Potential of All Our Regions: the way forward, which sets out howthe Government and RDAs are working together to deliver the REP PSA. Realisingthe Potential of All Our Regions: the story so far, which describes the measuresalready in place in more detail, is available on the ODPM website; and
● the establishment of three demonstration projects to deliver some of the key PSApolicy propositions on: addressing inactivity in the North East, especially amongthe sick and disabled; encouraging enterprise in the North West; and improvingskills in Yorkshire andHumberside.
PSA 2 – SR 2002 PSA target
Make sustainable improvements in the economic performance of all Englishregions and over the long term reduce the persistent gap in growth ratesbetween the regions, defining measures to improve performance andreporting progress against these measures by 2006.
Joint target with HM Treasury and DTI
Chapter 3: Del iver ing our ob ject ives
37
The City of Manchester Stadium – contributing to helping local
communities

It is early days in the delivery of the PSA, but already we have:
● announced that we will match fund the RDAs’ contribution to create a £100 millionNorthern Way Investment Fund to help close a £29 billion productivity gap with therest of the country;
● given the RDAs substantial funding flexibility to allow them to respond to regionalpriorities and we are increasing their funding from £1.6 billion in 2002/03 to£2.3 billion in 2007/08; and
● investing £11 billion per year by 2007/08 on post-16 education and skills(excluding higher education) across the English regions and enabling the RDAChief Executive and Regional Local Skills Council Director in each region to adoptjoint budgeting and planning of the adult skills budget, where they want it. In thethree Northern regions, this is worth £634 million in 2004/05.
ODPM Annua l Repor t 2005
38

39
This section of the report sets out how we have managed our resources and whatwe have done to improve our capacity to deliver. It sets out the ways in which weare working to reduce the burden of our policy proposals and details how we haveresponded to central initiatives. It also reports the progress we have made on keymilestones in our business plan.
Financial and business management
ODPM’s provisional forecast outturn on its programmes (excluding local government)in 2004/05 is £8,745 million. This is split between resource consumption, resourceinvestment (capital grants to the private sector) and capital as set out in the followingchart:
Provisional outturn 2004/05 (£m)
Resource consumption
Resource investment
Capital
3,230
2,553
2,965
Managing our resources 4
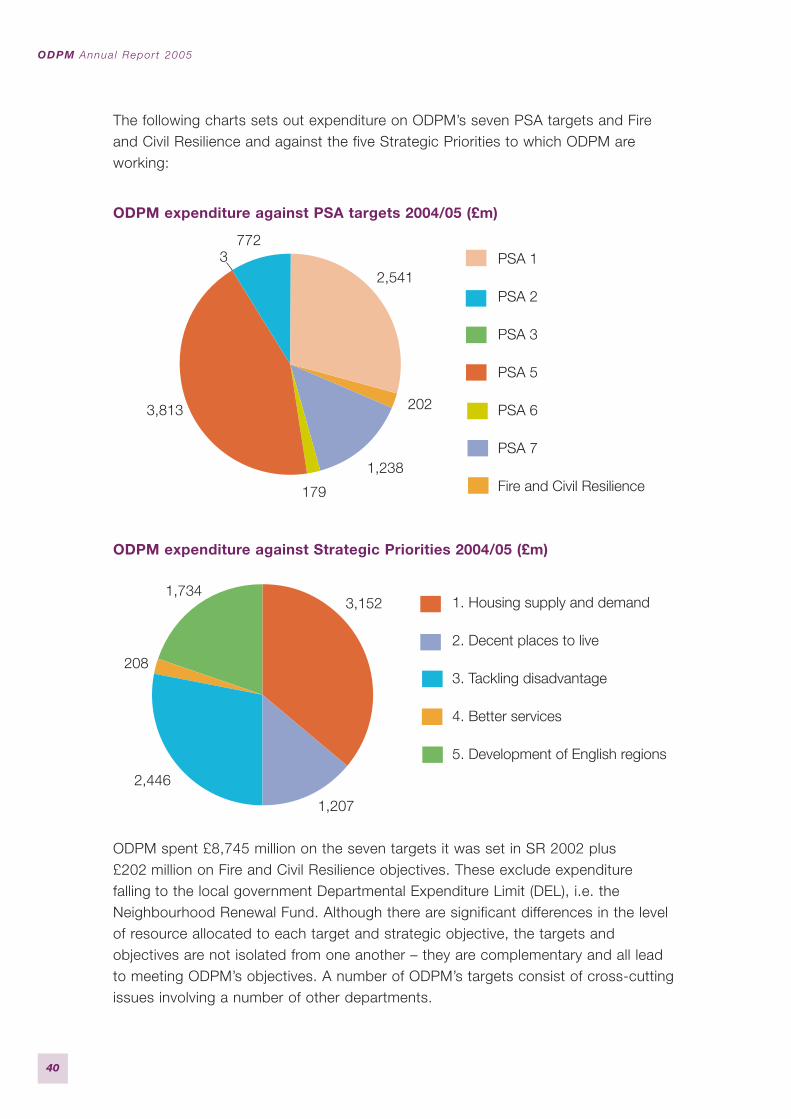
The following charts sets out expenditure on ODPM’s seven PSA targets and Fireand Civil Resilience and against the five Strategic Priorities to which ODPM areworking:
ODPM expenditure against PSA targets 2004/05 (£m)
ODPM expenditure against Strategic Priorities 2004/05 (£m)
ODPM spent £8,745 million on the seven targets it was set in SR 2002 plus£202 million on Fire and Civil Resilience objectives. These exclude expenditurefalling to the local government Departmental Expenditure Limit (DEL), i.e. theNeighbourhood Renewal Fund. Although there are significant differences in the levelof resource allocated to each target and strategic objective, the targets andobjectives are not isolated from one another – they are complementary and all leadto meeting ODPM’s objectives. A number of ODPM’s targets consist of cross-cuttingissues involving a number of other departments.
1. Housing supply and demand
2. Decent places to live
3. Tackling disadvantage
4. Better services
5. Development of English regions
3,152
1,207
2,446
208
1,734
PSA 1
PSA 2
PSA 3
PSA 5
PSA 6
PSA 7
Fire and Civil Resilience
2,541
772
3,813
179
1,238
3
202
ODPM Annua l Repor t 2005
40
Local government grant Aggregate External Finance (AEF) is the total level of support that central governmentprovides to local authorities. This support is normally made up of Revenue SupportGrant, police grant, specific formula and ring-fenced grants, and the amountdistributed from business rates.
The main areas of funding that central government supports are Education, PersonalSocial Services, Police, Fire, Highways Maintenance, Environmental, Protective andCultural Services and Capital Financing.
For 2004/05, £54.9 billion was provided in AEF.
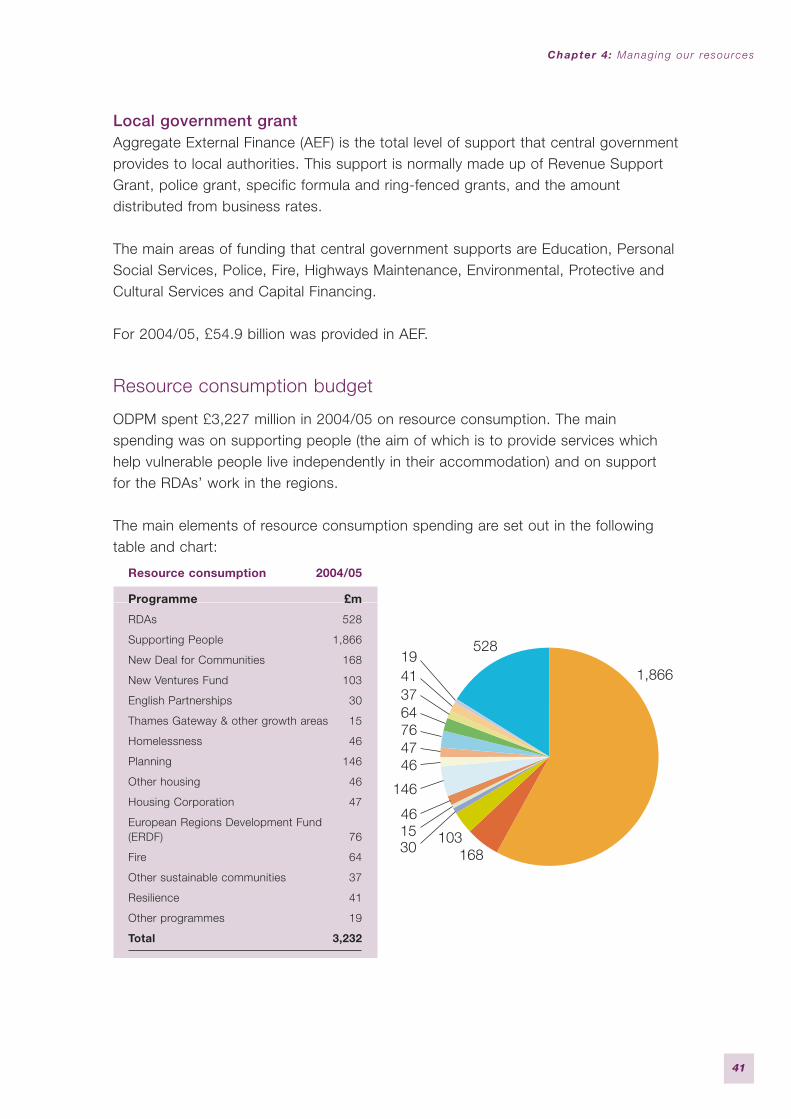
Resource consumption budget
ODPM spent £3,227 million in 2004/05 on resource consumption. The mainspending was on supporting people (the aim of which is to provide services whichhelp vulnerable people live independently in their accommodation) and on supportfor the RDAs’ work in the regions.
The main elements of resource consumption spending are set out in the followingtable and chart:
Resource consumption 2004/05
Programme £m
RDAs 528
Supporting People 1,866
New Deal for Communities 168
New Ventures Fund 103
English Partnerships 30
Thames Gateway & other growth areas 15
Homelessness 46
Planning 146
Other housing 46
Housing Corporation 47
European Regions Development Fund (ERDF) 76
Fire 64
Other sustainable communities 37
Resilience 41
Other programmes 19
Total 3,232
168
1,866
1031530
46
146
46477664374119
528
Chapter 4: Managing our resources
41
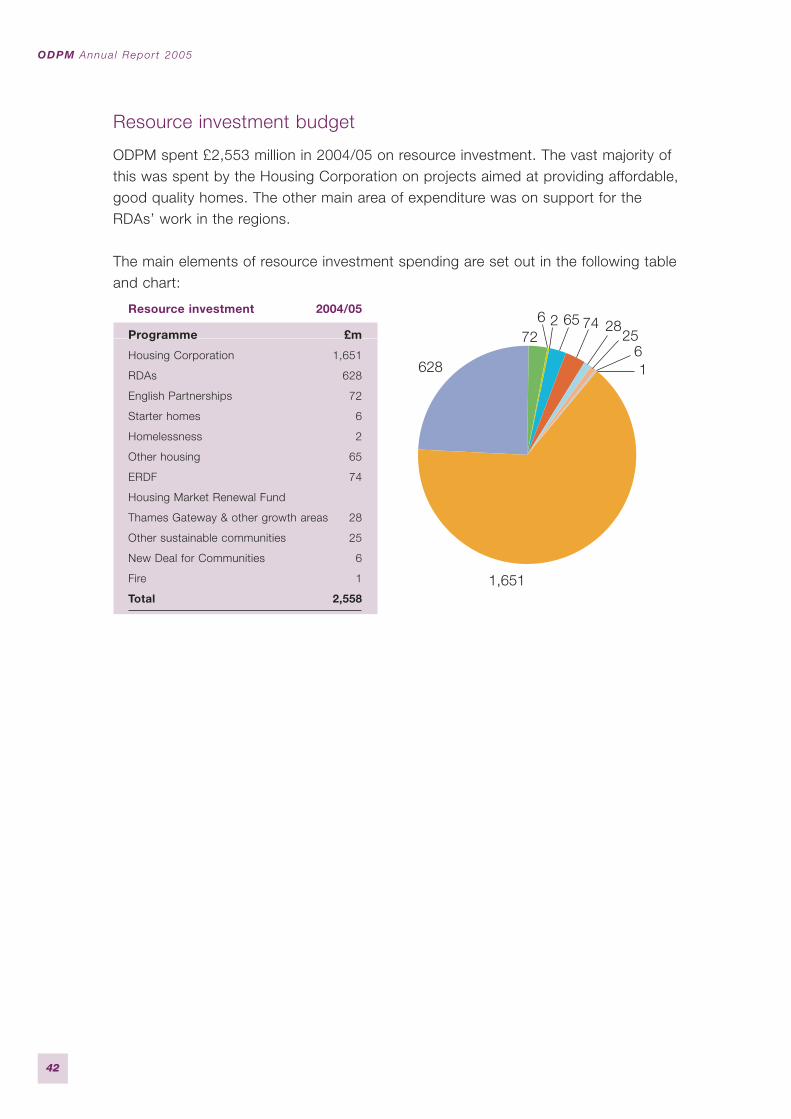
Resource investment budget
ODPM spent £2,553 million in 2004/05 on resource investment. The vast majority ofthis was spent by the Housing Corporation on projects aimed at providing affordable,good quality homes. The other main area of expenditure was on support for theRDAs’ work in the regions.
The main elements of resource investment spending are set out in the following tableand chart:
Resource investment 2004/05
Programme £m
Housing Corporation 1,651
RDAs 628
English Partnerships 72
Starter homes 6
Homelessness 2
Other housing 65
ERDF 74
Housing Market Renewal Fund
Thames Gateway & other growth areas 28
Other sustainable communities 25
New Deal for Communities 6
Fire 1
Total 2,558
1
1,651
726 2 65 74 28
256
628
ODPM Annua l Repor t 2005
42
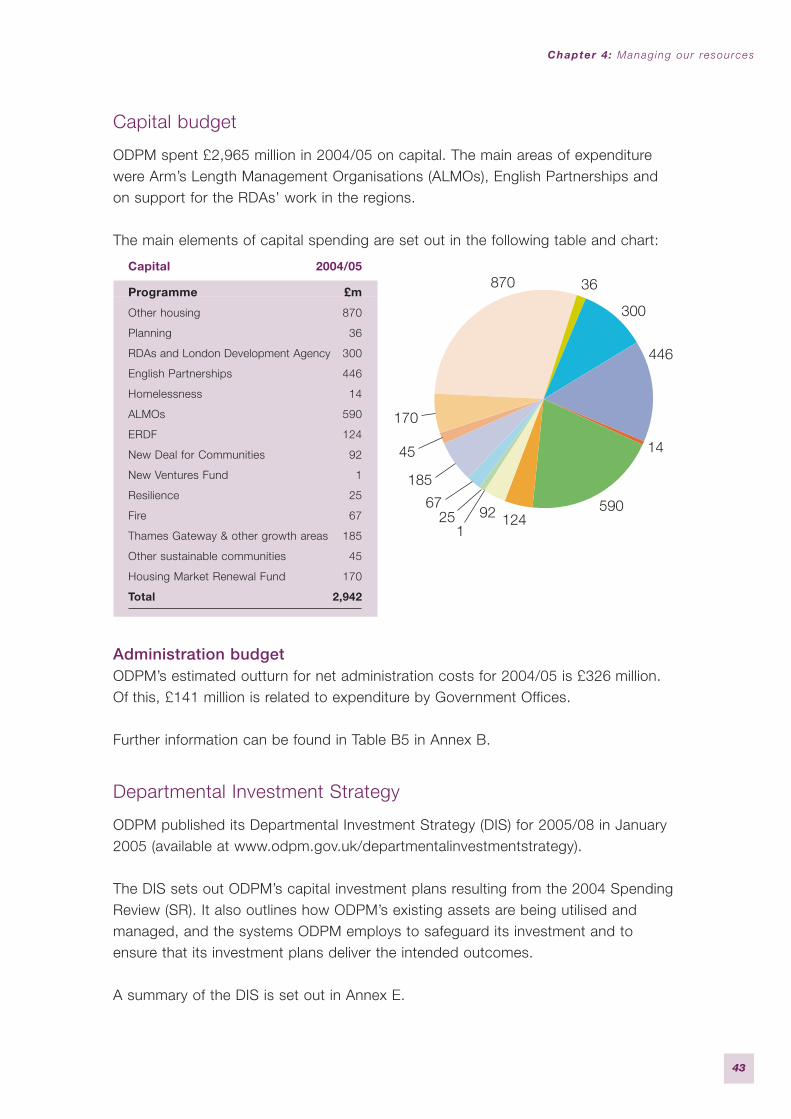
Capital budget
ODPM spent £2,965 million in 2004/05 on capital. The main areas of expenditurewere Arm’s Length Management Organisations (ALMOs), English Partnerships andon support for the RDAs’ work in the regions.
The main elements of capital spending are set out in the following table and chart:
Capital 2004/05
Programme £m
Other housing 870
Planning 36
RDAs and London Development Agency 300
English Partnerships 446
Homelessness 14
ALMOs 590
ERDF 124
New Deal for Communities 92
New Ventures Fund 1
Resilience 25
Fire 67
Thames Gateway & other growth areas 185
Other sustainable communities 45
Housing Market Renewal Fund 170
Total 2,942
Administration budget ODPM’s estimated outturn for net administration costs for 2004/05 is £326 million.Of this, £141 million is related to expenditure by Government Offices.
Further information can be found in Table B5 in Annex B.
Departmental Investment Strategy
ODPM published its Departmental Investment Strategy (DIS) for 2005/08 in January2005 (available at www.odpm.gov.uk/departmentalinvestmentstrategy).
The DIS sets out ODPM’s capital investment plans resulting from the 2004 SpendingReview (SR). It also outlines how ODPM’s existing assets are being utilised andmanaged, and the systems ODPM employs to safeguard its investment and toensure that its investment plans deliver the intended outcomes.
A summary of the DIS is set out in Annex E.
870 36
446
14
5901249225
1
67
185
45
170
300
Chapter 4: Managing our resources
43

Improving our ability to deliver
Role of the BoardThe Permanent Secretary chairs the ODPM Management Board, which has nineother members, including two non-executive board members. The Board givescollective strategic leadership at official level, and supports Ministers in steeringthe work of ODPM. The role of the Board is to:
● manage the performance of ODPM, through its challenge function on performancemanagement issues (including PSAs, mission-critical projects and corporate risks)and building capacity to meet these issues;
● champion ODPM’s change programme ‘Excellence in Delivery’;
● ensure that ODPM has the staff and resources to deliver its objectives;
● give strategic direction, through the development of ODPM strategy, and byensuring that wider, cross-cutting and longer-term issues are properly consideredthrough regular reviews of progress of its Strategic Priorities; and
● listen to and communicate with staff and the outside world and promote goodmanagement.
The Management Board meets monthly. There are also a number of standing sub-committees (including the Audit and Risk Committee, the Analytical Strategy Boardand the Programmes and Major Projects Board) and ad-hoc committees to supportthe Management Board.
Efficiency and Relocation ProgrammeThe ODPM has three distinct Efficiency work streams, each with their own targetsset as part of the SR 2004 settlement: ODPM(C), Local Government and SocialHousing. Each of the work streams has an agreed plan of work and publishedEfficiency Technical Note setting out how they plan to measure their efficiency gains.All three work streams have there own programme boards to drive through andmonitor delivery against the Efficiency Technical Note and to challenge individualproject areas.
ODPM Annua l Repor t 2005
44
Chapter 4: Managing our resources
45
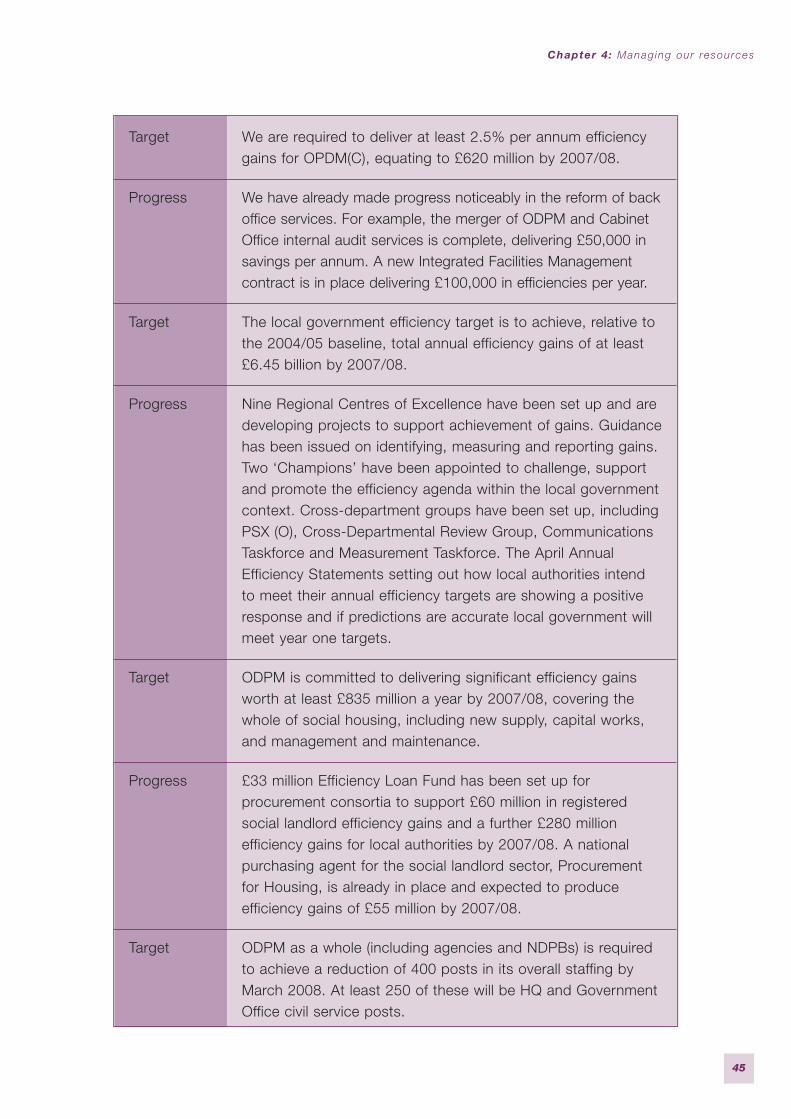
Target We are required to deliver at least 2.5% per annum efficiencygains for OPDM(C), equating to £620 million by 2007/08.
Progress We have already made progress noticeably in the reform of backoffice services. For example, the merger of ODPM and CabinetOffice internal audit services is complete, delivering £50,000 insavings per annum. A new Integrated Facilities Managementcontract is in place delivering £100,000 in efficiencies per year.
Target The local government efficiency target is to achieve, relative tothe 2004/05 baseline, total annual efficiency gains of at least£6.45 billion by 2007/08.
Progress Nine Regional Centres of Excellence have been set up and aredeveloping projects to support achievement of gains. Guidancehas been issued on identifying, measuring and reporting gains.Two ‘Champions’ have been appointed to challenge, supportand promote the efficiency agenda within the local governmentcontext. Cross-department groups have been set up, includingPSX (O), Cross-Departmental Review Group, CommunicationsTaskforce and Measurement Taskforce. The April AnnualEfficiency Statements setting out how local authorities intendto meet their annual efficiency targets are showing a positiveresponse and if predictions are accurate local government willmeet year one targets.
Target ODPM is committed to delivering significant efficiency gainsworth at least £835 million a year by 2007/08, covering thewhole of social housing, including new supply, capital works,and management and maintenance.
Progress £33 million Efficiency Loan Fund has been set up forprocurement consortia to support £60 million in registeredsocial landlord efficiency gains and a further £280 millionefficiency gains for local authorities by 2007/08. A nationalpurchasing agent for the social landlord sector, Procurementfor Housing, is already in place and expected to produceefficiency gains of £55 million by 2007/08.
Target ODPM as a whole (including agencies and NDPBs) is requiredto achieve a reduction of 400 posts in its overall staffing byMarch 2008. At least 250 of these will be HQ and GovernmentOffice civil service posts.
Risk management
Risk management procedures are being applied to key areas of the work of ODPM,improving the quality of operation through initiatives and projects within theExcellence in Delivery change management programme and heightened awarenessof the benefits of risk management through workshops and the application ofproportionate project and programme management techniques.
As a result, the level of risk across ODPM has been assessed as being reduced byabout half.
SponsorshipDuring 2004/05 ODPM received £207,500 in sponsorship for the SustainableCommunities Summit from a range of stakeholders, including RDAs, the HouseBuilders’ Federation, Marketing Manchester, Deloitte’s and the Thames Gateway.PricewaterhouseCoopers are undertaking pre- and post-Summit evaluation delegatesurveys at no cost to ODPM.
ODPM Annua l Repor t 2005
46
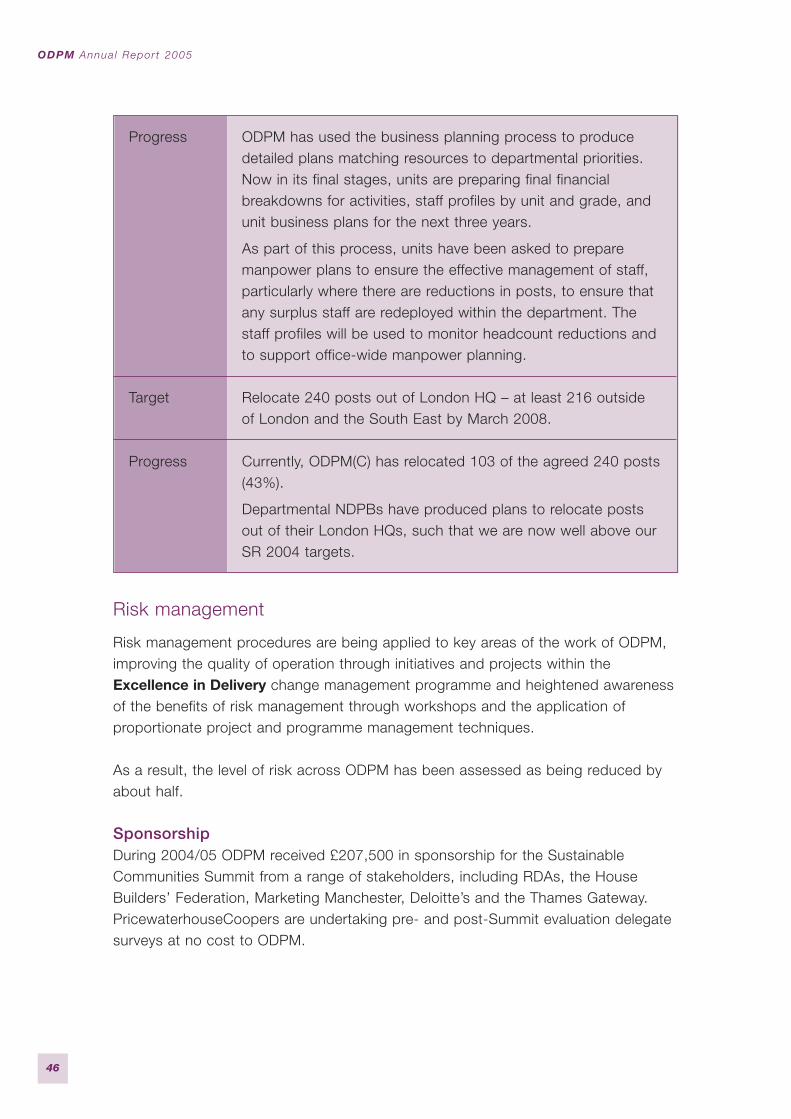
Progress ODPM has used the business planning process to producedetailed plans matching resources to departmental priorities.Now in its final stages, units are preparing final financialbreakdowns for activities, staff profiles by unit and grade, andunit business plans for the next three years.
As part of this process, units have been asked to preparemanpower plans to ensure the effective management of staff,particularly where there are reductions in posts, to ensure thatany surplus staff are redeployed within the department. Thestaff profiles will be used to monitor headcount reductions andto support office-wide manpower planning.
Target Relocate 240 posts out of London HQ – at least 216 outsideof London and the South East by March 2008.
Progress Currently, ODPM(C) has relocated 103 of the agreed 240 posts(43%).
Departmental NDPBs have produced plans to relocate postsout of their London HQs, such that we are now well above ourSR 2004 targets.

CommunicationsThe Directorate of Communication has continued to provide an efficient, professionaland seamless communications service to Ministers and policy officials in support ofour overarching business plan.
Media handlingThe 2004 overarching communications strategy for ODPM highlighted the need fora strong focus on regional and specialist media to ensure that ODPM’s vision anddelivery of programmes was clearly communicated to regional, local and stakeholderaudiences. We have implemented reinforced media activities to target theseaudiences and, in order to bring our stories to life, we have produced human interestcase studies which have been used extensively by both national and regional printand broadcast media.
During the year, we successfully launched a range of key policies and programmes,including the Housing Act, the Planning and Compulsory Purchase Act 2004, Fireand Rescue Services Act, and the wide-ranging Local:Vision debate. In addition,the Government’s response to the Northern Way and ODPM’s five-year plan –Sustainable Communities: Homes for All and Sustainable Communities: People,Places and Prosperity – set out clear messages on delivery against the 2003Sustainable Communities Plan, and ODPM’s longer term vision for both policy andprogrammes. All of these major announcements were supported by extensive mediastrategies targeting national, regional and specialist media outlets, culminating in thewidely and positively reported 2005 Sustainable Communities Summit.
Public informationDuring 2004/05 we ran a successful multi-media public information campaign onfire safety, continued to provide communications activity to promote the firemodernisation agenda, and ran a public information campaign on the referendumsfor the Elected Regional Assemblies in the North West, North East and Yorkshireand the Humber.
Working across government and with stakeholders, we have launched the CleanerSafer Greener Communities initiative to improve the quality of the environments inwhich people live and work. We provided information on ODPM sustainablecommunities’ policy with the production of policy documents and supporting material.
The introduction of a publications protocol has improved both the quality and therelevance of ODPM publications. We continued to develop our relationships withcommercial partnerships, booksellers and publishers to improve the marketpenetration of ODPM priced publications and to deliver cost-efficient productionof quality items.
Chapter 4: Managing our resources
47

Corporate communicationsWe have continued to develop our stakeholder communications strategy byidentifying and mapping our key stakeholders and planning a robust programme ofengagement activities. Following the launch of the revised ODPM corporate identity,we have worked hard to imbed the brand and brand values into the culture of theorganisation. At the Staff Conference in June we launched the ODPM corporatestand, which has proved to be highly effective as the corporate presence atconferences and events throughout the year, culminating in the successfulSustainable Communities Summit in 2005.
Electronic communicationE-communications have become more integrated in both external and internalcommunications initiatives, such as the five-year plan and Summit 2005, and inimproved guidance, discussion forums and e-learning initiatives. Info4localcontinues to be a market leader in central to local government communications,with subscribers increasing to 41,000 during the year.
Internal communicationInternal communication over the year has been dominated by supporting andcommunicating ODPM’s Excellence in Delivery programme, including introductionof a monthly newsletter to staff and providing all ODPM managers with a resourcepack and communications toolkit, with the emphasis on increasing face-to-facecommunications.
Legal servicesThe Legal Directorate provides advice and drafting services that contribute toStrategic Priorities and major projects across ODPM. The Directorate’s key activitieswere work on the Regional Assemblies Bill and the Housing Act 2004; draftingsecondary legislation; providing advice on major projects and on litigation asrequired; providing advice and training on the Freedom of Information Act; androlling out a programme of legal awareness training across ODPM.
Building the evidence base for policy makingHaving a robust evidence base for policy making in ODPM is key to the delivery ofour objectives. The Analytical Services Directorate (ASD) in ODPM provides aprofessional and influential analytical service to ODPM. It provides economic advice,the collection, analysis and dissemination of housing and land use statistics, andsocial research and analytical support for sustainable communities and other aspectsof housing, homelessness, urban and planning policy. ASD is also responsible forODPM’s geographic information strategy. We have:
● provided evidence and analysis to support the delivery of PSA targets, includingBarker recommendations;
ODPM Annua l Repor t 2005
48

● launched the State of the Cities progress report at the Sustainable CommunitiesSummit held on 1 February 2005;
● produced 2002 Town Centre Boundaries and Statistics in January 2005;
● published an evaluation of Local Authority Homelessness Strategies in November2004, together with a policy briefing on the recommendations of the report; and
● delivered ODPM’s initial ‘Maps-on-Tap’ services to intra-government and publicaudiences by October 2004.
Equality and Diversity UnitThe Equality and Diversity Unit works with ODPM policy areas to ensure thatconsideration of equality is at the heart of policy development, and that ODPMmeets its statutory obligations as a public body. The Unit also has policyresponsibility for Human Rights, Public Appointments and ‘Learning to Listen’, thecross-Government strategy for improving the engagement of children and youngpeople in policies that affect their lives.
In October 2004, the ODPM Board agreed an Equality and Inclusion strategy and aDisability Action Plan. Progress on these is reviewed regularly. The ODPM RaceEquality Scheme is available on the ODPM website and will be published in May 2005.
Equality and diversity and public appointmentsODPM currently makes around 417 appointments to 11 Executive NDPBs,six Advisory NDPBs and five Tribunal NDPBs.
Targets for public appointments are reviewed regularly to reflect changingcircumstances and necessitated a revision to those published in last year’s report.
Current records based on 417 appointments (at 15 February) show our appointmentsto be 30% women (target 32%), 10% ethnic minorities (target 11%) and 3% disabledpeople (target 3%) respectively. Public appointments are published on our website.
We continue to undertake specific activities to encourage diversity in publicappointments. In March 2004, we held a Disability Seminar aimed at increasingNDPB sponsors’ awareness of the Disability Discrimination Act and good recruitmentpractice towards disabled people. Additionally, ODPM is one of the departments whovolunteered to support the Cabinet Office in piloting a shadowing and mentoringscheme for disabled people who might be interested in serving on public bodies.
Chapter 4: Managing our resources
49

Departmental reporting on better regulationBecause much of the data on better regulation is only available for the calendar year2004, rather than the financial year 2004/05, the calendar year has generally beenused throughout this Better Regulation report.
Regulatory Impact AssessmentODPM maintained 100% compliance, as measured by Cabinet Office, with theRegulatory Impact Assessment (RIA) process.
Guidance on the RIA process has been significantly improved during the course ofthe year, and this, together with an increased level of training and advice, has led toa noticeable improvement in the quality of RIAs. This will be further enhanced by theBetter Policy Making website which has recently been set up on ODPM’s IT network.
Effective use of the RIA process in EU negotiations has been illustrated by the initialRIA produced after the Communication from the European Commission to theEuropean Council, the European Parliament, the European Economic and SocialCommittee and the Committee of the Regions – Towards a thematic strategy on theurban environment. This RIA informed our UK position letter to the Commission andour negotiating position for meetings was based on that letter.
An example of light-touch regulation was given in the High Hedges Bill, where acode, information and guidance were tried prior to the legislative option beingadopted. This option is also light-touch as it encourages resolution throughnegotiation, with local authority powers being used only as a last resort.
We do not have full information on the number of commitments made to review infinal RIAs, but policy officials are encouraged to do so and good examples includefinal RIAs for the Planning and Compulsory Purchase Bill and Small Business RateRelief scheme. A more detailed report will be available for the 2005/06 annual report.
ConsultationDuring 2004 ODPM issued 53 public consultations. Of these, 40 lasted for 12 weeksor more. The 13 consultations which were issued for less than 12 weeks were allauthorised by the appropriate minister. Of these, only one was for a period of lessthan eight weeks. Reasons for these deviations were:
● to meet Parliamentary/Local Government timetables (8);
● prior consultation (3);
● technical in nature (1); and
● stakeholder pressure for quick action (1).
ODPM Annua l Repor t 2005
50
There were 16 non-public consultations, the majority of which were consultationswith local authorities.
In almost all cases the consultation process influenced the final policy proposals.In particular the consultations on the Northampton Urban Development Corporation(UDC) and the Milton Keynes Urban Development Area led to amendments to theproposed areas covered; the consultation on Park Homes – Implied Terms andConsents led to certain proposals being dropped or amended, while the ProvidingIndemnities to Relevant Authority Officers and Members consultation resulted inseveral significant changes to the proposals, including developing separateregulations to clarify the position of elected mayors.
Regulatory reformAt the start of 2004, the Regulatory Reform Action Plan contained 19 activeregulatory reform measures owned by ODPM, five of which were Regulatory ReformOrders (RROs):
● four measures have been completed, one of which was an RRO;
● two measures have been dropped, one of which was an RRO; and
● one new measure has been identified, which was an RRO.
Hence this brings the total number of RROs begun by ODPM since the introductionof the Regulatory Reform Act to 10, of which five have been completed and one hasbeen dropped.
Going into 2005 there are 14 measures, four of which are RROs.
Non-RRO measuresA major piece of planning reform was introduced through the Planning andCompulsory Purchase Act 2004, which included a range of measures to simplifyand streamline the planning system. Such reforms include the move to spatialplanning rather than land use planning. The structure plan and local plan or unitarydevelopment plan system has been replaced with a more simplified and flexiblesystem of regional spatial strategy and local development documents.
In Sustainable Communities: Homes for all, we announced a HouseholderDevelopment Consents Review to improve the regulatory regimes that householdersface when making minor improvements to their homes. While retaining essentialenvironmental safeguards, the review aims to cut red tape and streamline theapplication processes.
Chapter 4: Managing our resources
51
We have dropped Building Regulations – Approved Documents in its current formfrom the Regulatory Reform Action Plan. The intention now is to use interactive XMLcomputer technology to achieve the same aim, but by a different means; that is, bymaking it easier to search and use the approved documents.
RROsThe Business Tenancies RRO, which came into force on 1 June 2004, was amongthe longest and most complex of RROs to date. The most significant change is thatlandlords and tenants no longer need to get court approval for agreement to excludesecurity of tenure. The reforms introduced by the RRO should lead to fewer casesgoing to court and less litigation.
We are also in the final stages of the Regulatory Reform (Fire Safety) Order, whichwill simplify, rationalise and consolidate existing legislation, removing multiple andoverlapping provision with a single risk-based fire safety regime. The proposed in-force date is April 2006, in line with the Common Commencement Dates initiative.The new RRO will repeal or amend just over 50 Acts of Parliament and numerousStatutory Instruments.
Of the RROs listed in the Regulatory Reform Action Plan, it is no longer intended toprogress the Tree Preservation Order RRO. As not all of the proposals will beremoving/reducing burdens, an RRO could not be used to deliver the full package ofreforms, and the remaining burdens to be removed were too minor to justifyproceeding at this stage. The proposals are on hold at present.
However a new RRO measure, Building Control – Local Authority Charges, has beenintroduced and should be in force by 1 April 2006. It will enable local authorities tomore accurately relate their charges to the actual costs of carrying out individualbuilding control functions for individual projects, thereby securing ‘best value’, andconcurrently improve local authorities competitive position with private sector approvedinspectors.
Transparency of implementation plans for European legislationODPM uses the following methods to inform the public of new EU legislation:
● standalone RIAs;
● public consultations, accompanied by an RIA where necessary; and
● press releases, providing an overview of the changes along with links toconsultation documents and RIAs where available.
ODPM has also embraced the new ‘Regulation Updates’ initiative, led by the DTISmall Business Service, and we currently have seven updates being produced at
ODPM Annua l Repor t 2005
52
present. It is our intention to utilise this resource, where suitable, for new EUregulations over the coming year.
Working with the Voluntary and Community SectorODPM chaired a further Cross Cutting Review of the Voluntary and CommunitySector (VCS) in the SR 2004, building on the VCS Review in the SR 2002. The 2004VCS Review focused on making a difference in specific areas of service delivery.ODPM’s priority was homeless hostel provision. Further outcomes of the Reviewinclude a good practice guide, Effective Local Partnerships.
The Spending Review White Paper established the Local Community SectorTaskforce, chaired by ODPM, whose role is:
● to ensure that all VCS groups have the capacity to access the full range ofgovernment investment available to them; and
● to recommend how Compact activity should progress at the regional level.
The process of engaging the VCS in the development of the 10-year localgovernment strategy began with a national conference in March.
ODPM continued to take forward its commitments from the earlier Cross-CuttingReview. All ODPM units and regional Government Offices have given informationabout their current engagement with the VCS. This has provided the baseline fordeveloping an action plan to improve partnership working with the VCS and toincrease awareness of the Compact.
Chapter 4: Managing our resources
53

54
Executive Agencies
Fire Service CollegeThe Fire Service College, at Moreton-in-Marsh, is the central training establishmentfor the UK Fire and Rescue Service. It provides a wide range of operational incidentand New Dimension training and a comprehensive suite of courses designed tosupport all aspects of vocational development, including community fire safety,fire legislation and risk management.
The Planning InspectorateThe Planning Inspectorate’s main work is the processing of planning andenforcement appeals and holding inquiries into local development plans.
It also deals with a range of other planning related casework including:
● listed building consent appeals;
● advertisement appeals;
● reporting on called-in planning applications;
● reporting on inquires into compulsory purchase orders made under a varietyof planning and housing legislation;
● Rights of Way cases; and
● cases arising from the Environment Protection and Water Acts and the Transportand Works Act.
Further information can be found in Chapter 3 of this report.
Queen Elizabeth II Conference CentreThe Queen Elizabeth II Conference Centre (QEIICC) is a purpose-built venue,specialising in events for 40 to 1,000 delegates, based in the heart of Westminster.It is an Executive Agency with Trading Fund status and its Chief Executive is ErnestVincent. The QEIICC has a set of key performance targets progress against whichwill be reported in its own Annual Report (see www.qeiicc.co.uk).
ExecutiveAgencies andpublic bodies
5

Ordnance Survey
Ordnance Survey is Great Britain’s national mapping agency. It is responsible forcreating and updating the master map of the entire country, from which it producesand markets a wide range of digital map data and paper maps for business, leisure,educational and administrative use. Ordnance Survey is a Government Departmentand Executive Agency with Trading Fund status in its own right. ODPM has ashareholder interest in Ordnance Survey and, as such, it should pay ODPM adividend each year to offset capital employed in the business.
Non-Departmental Public Bodies
Audit CommissionThe Audit Commission is an independent executive Non-Departmental Public Body(NDPB) which appoints auditors to local authorities and some NHS bodies, carriesout inspections of local authorities and registered social landlords, and reports onthe performance of local authorities in Comprehensive Performance Assessments(CPAs). The Commission is required to produce an Annual Report, copies of whichmay be obtained from its website (www.audit-commission.gov.uk).
English PartnershipsEnglish Partnerships is the national regeneration agency helping the Government tosupport high-quality sustainable growth across the country. English Partnerships is amajor contributor to the ODPM vision of creating ‘thriving, inclusive and sustainablecommunities’ as outlined in Sustainable Communities: Building for the futurepublished in February 2003. Its overall aim is to achieve high-quality, well-designed,sustainable places for people to live, work and enjoy.
Housing Action TrustsTower Hamlets Housing Action Trust (HAT) completed its regeneration work in Bowand was dissolved in June 2004. The three remaining HATs – at Castle Vale(Birmingham), Liverpool and Stonebridge (Brent) – are working to complete their10–12-year programmes of housing renewal, economic and social development, andenvironmental improvements by June 2005, December 2005 and 2007 respectively.HAT tenants can choose the local authority or a Registered Social Landlord (RSL)as their future landlord, and continue to benefit from services provided by theselandlords and HATs’ successor organisations.
Housing CorporationThe Housing Corporation registers, regulates and facilitates the proper performanceof more than 2,000 not-for-profit RSLs in England. It invests public money in RSLs toprovide new or improved homes that meet local needs and contribute to the creationand maintenance of sustainable communities. It carries out its work in ways and to
Chapter 5: Execut ive Agenc ies and pub l ic bod ies
55

targets that promote and deliver the Government’s wider objectives and policies,notably sustainable communities.
London Thames Gateway Development CorporationThe London Thames Gateway Development Corporation was established in June2004 to drive forward the regeneration of key opportunity areas in East London, aspart of the Government’s vision for delivering new sustainable communities in theThames Gateway. The Corporation’s area covers the Lower Lea Valley and LondonRiverside.
The Corporation has made good progress in setting up its infrastructure andoperating systems. Peter Andrews was appointed Chief Executive and took up hispost in June 2005.
London Thames Gateway Development Corporation is holding workshops with arange of stakeholders in May and June to discuss their regeneration framework.
Standards Board for EnglandThe Standards Board for England (SBE) is an independent-funded executive NDPBresponsible for promoting high ethical standards among members of local authoritiesand for investigating allegations that members’ behaviour may have fallen short ofthe required standards.
Thurrock UDCThe Thurrock Thames Gateway Urban Development Corporation was established in2003 to deliver jobs and housing in Thurrock as part of the Government’s plans forgrowth in the Thames Gateway. Chaired by Will McKee, it is developing a wide-reaching strategy for the comprehensive regeneration of the area. Over the last12 months, the Development Corporation has completed a baseline study of theborough, and is about to complete its Regeneration Framework. The Framework,together with a borough-wide Spatial Plan, will constitute the DevelopmentCorporation’s main policy framework, which will be fully in place later in 2005.
Valuation Tribunal ServiceThe aim of the Valuation Tribunal Service is to provide staff, accommodation andother support, including general advice about procedure in relation to proceedingsbefore tribunals, to the 56 Valuation Tribunals in England.
Valuation Tribunals hear and determine appeals against non-domestic rating, counciltax valuations and council tax liability.
ODPM Annua l Repor t 2005
56

West Northamptonshire Development CorporationAn Urban Development Corporation (UDC) for West Northamptonshire wasestablished on 15 December 2004. The UDC will work with local partners todeliver sustainable regeneration and growth.
Advisory Panel on Standards for the Planning InspectorateThe Advisory Panel on Standards (APOS) for the Planning Inspectorate wasestablished as an independent body in January 1993. Its purpose is to advise theSecretary of State and the First Minister for the Welsh Assembly Government onthe maintenance and enhancement of professional standards in the PlanningInspectorate Executive Agency.
Advisory Panel on Beacon CouncilsThe Advisory Panel on Beacon Councils provides independent advice to Ministerson the operation of the Beacon Council Scheme. The Panel’s responsibilities includeadvising Ministers on the cross-cutting service areas to be chosen each year asBeacon themes, advising Ministers on the selection criteria for Beacons andrecommending to Ministers a list of potential Beacon authorities.
Beacon authorities share their best practice with others, helping to raise standardsof public services across the country.
Boundary Commission for England and WalesThe Boundary Commissions are advisory NDPBs set up by statue to keep underreview the Boundaries of Parliamentary constituencies. Following the completionof its 5th General Review, the Welsh Commission presented its report to the DeputyPrime Minister on 31 January 2005. The English Commission is on target to presentits report before 12 April 2007 as required by statue.
Building Regulations Advisory CommitteeThe Building Regulations Advisory Committee (BRAC) was set up to advise theSecretary of State on the making of Building Regulations, and on other connectedsubjects in England and Wales.
The core of its business is determined by the Buildings Division Work Programmewhich in turn reflects Ministers’ priorities. Members are appointed on an independentbasis and are unpaid.
Chapter 5: Execut ive Agenc ies and pub l ic bod ies
57

National Community Forum To provide a community perspective on Tackling Disadvantage Group (TDG) policyand practice and to ensure that community priorities and needs are addressedacross all TDG programmes. The National Community Forum acts as a soundingboard and a source of ideas for Ministers and officials. Members draw on their ‘grassroots’ knowledge and experience to provide a fresh and challenging input into workrelating to deprived areas.
ODPM Annua l Repor t 2005
58

59
Annex:Work streams by Strategic Priority
APSA 5 – SR 2002 PSA targetAchieve a better balance between housing availability and the demand forhousing in all English regions while protecting valuable countryside around ourtowns, cities and green belt – and the sustainability of existing towns and cities– through specific measures to be set out in the Service Delivery Agreement.
Milestones
Low demand: Pathfinder schemes to tackle the areas most acutely affected bylow demand to be agreed by end 2004.
High demand: Annual levels of new housing in London and the East of Englandand South East regions to reach planning (RPG9) levels by 2006/07 andshortfalls from previous years to be recouped by 2011/12.
To reduce the upward trend in homelessness by 2007 and reduce the numberof families with children in temporary accommodation by 9,000 to 20,000 incomparison with current levels by 2016.
Performance indicators
Low-demand indicators
● Percentage by which the regional long-term vacant dwellings rate exceedsthe national long-term vacant dwellings rate.
● Number of local authorities where a basket of house price comparisonmeasures is substantially lower than equivalent national house price figures.
High-demand indicators
● Numbers of statutory homeless households with children in temporaryaccommodation.
● The ratio of lower quartile house prices to lower quartile earnings in theregions characterised by high demand.
● Annual net additions to the dwelling stock in the South East, London andEast Government Office regions.

Protection of the countryside indicators
● Net change in the area of designated green belt in each region.
● Percentage of housing development on previously developed land createdthrough the conversion of existing buildings. See performance information onthe SR 2000 PSA target on sustainable pattern of use.
● Average density of new housing development in each region.
Progress
This is a complex objective involving a diverse range of work streams across theregions tailored to reflect their specific circumstances. Whilst it is too early tomake an assessment across all elements of the target, good progress is beingmade.
In the 12 months to the end of December 2004, housing completions totalled152,600, 6% up on the previous 12 months.
We have now committed over £685 million of programme expenditure acrossthe four growth areas. We have also made good progress in embedding ourgrowth proposals within regional planning guidance.
The Thames Gateway Delivery Office is now open and local delivery vehicleshave been established for each of the major development zones across theGateway, including the Thurrock and London Thames Gateway UrbanDevelopment Corporation (UDCs). Thurrock UDC is currently developing acomprehensive regeneration framework for the area and a delivery-focusedbusiness plan. The Chair and Board of the London UDC have been appointed.The SR 2004 has established the £200 million Community Infrastructure Fundto support transport infrastructure in the growth areas.
On homelessness, we have achieved and sustained our March 2004 target ofending the long-term use of bed and breakfast hotels for homeless families withchildren and we have sustained reductions in rough sleeping. There are alsoemerging indications of success from new local authority homelessnessstrategies and prevention initiatives, with a slight fall in the flow of homelessnessacceptances during the first half of 2004 – ahead of expectations.
Indicator 1 – Long-term vacancies
Work on this indicator clearly identifies the North East, North West andYorkshire and the Humber regions as the most affected by long-term vacancies.Areas most acutely affected by low demand are being tackled throughimplementing tailored solutions – the market renewal pathfinders – to theparticular problems affecting the area. For the next few years, these pathfindersare mainly being funded through ODPM’s £500 million Market Renewal Fund.
ODPM Annua l Repor t 2005
60
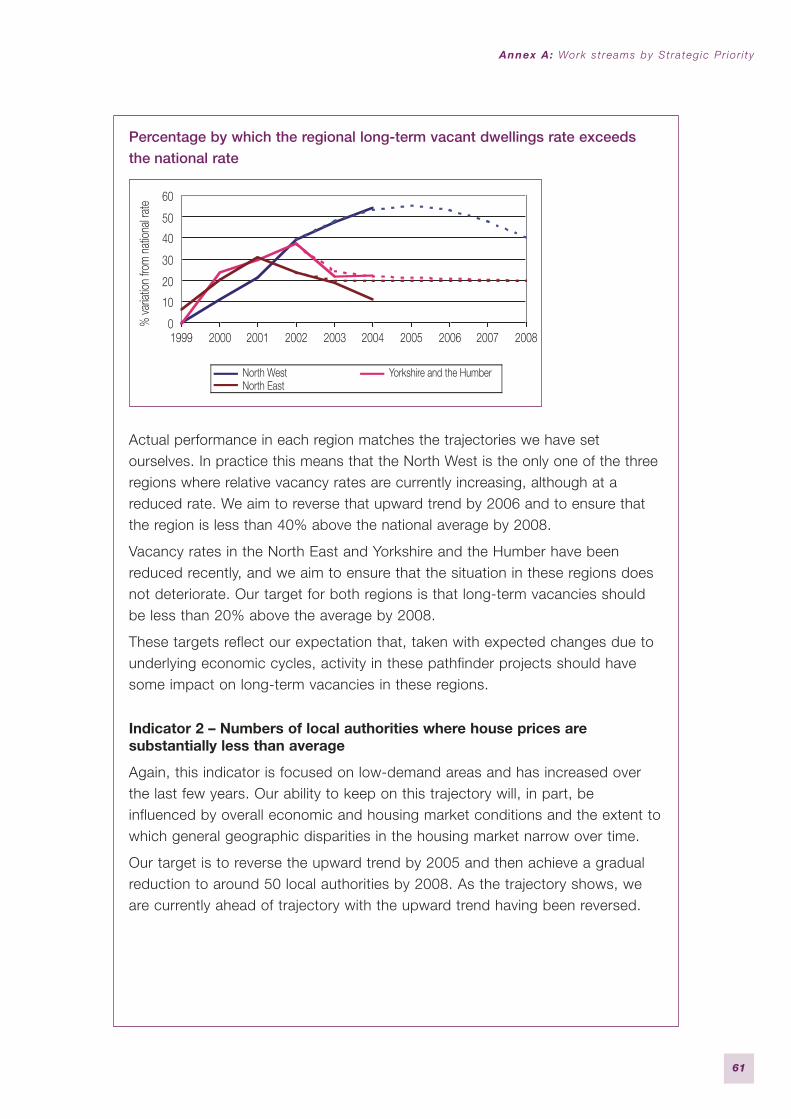
Percentage by which the regional long-term vacant dwellings rate exceedsthe national rate
Actual performance in each region matches the trajectories we have setourselves. In practice this means that the North West is the only one of the threeregions where relative vacancy rates are currently increasing, although at areduced rate. We aim to reverse that upward trend by 2006 and to ensure thatthe region is less than 40% above the national average by 2008.
Vacancy rates in the North East and Yorkshire and the Humber have beenreduced recently, and we aim to ensure that the situation in these regions doesnot deteriorate. Our target for both regions is that long-term vacancies shouldbe less than 20% above the average by 2008.
These targets reflect our expectation that, taken with expected changes due tounderlying economic cycles, activity in these pathfinder projects should havesome impact on long-term vacancies in these regions.
Indicator 2 – Numbers of local authorities where house prices aresubstantially less than average
Again, this indicator is focused on low-demand areas and has increased overthe last few years. Our ability to keep on this trajectory will, in part, beinfluenced by overall economic and housing market conditions and the extent towhich general geographic disparities in the housing market narrow over time.
Our target is to reverse the upward trend by 2005 and then achieve a gradualreduction to around 50 local authorities by 2008. As the trajectory shows, weare currently ahead of trajectory with the upward trend having been reversed.
0
10
20
30
40
50
60
1999 2000 2001 2002 2003 2004 2005 2006 2007 2008
% va
riatio
n fro
m n
ation
al ra
te
North West Yorkshire and the HumberNorth East
Annex A: Work s t reams by St ra teg ic Pr ior i ty
61
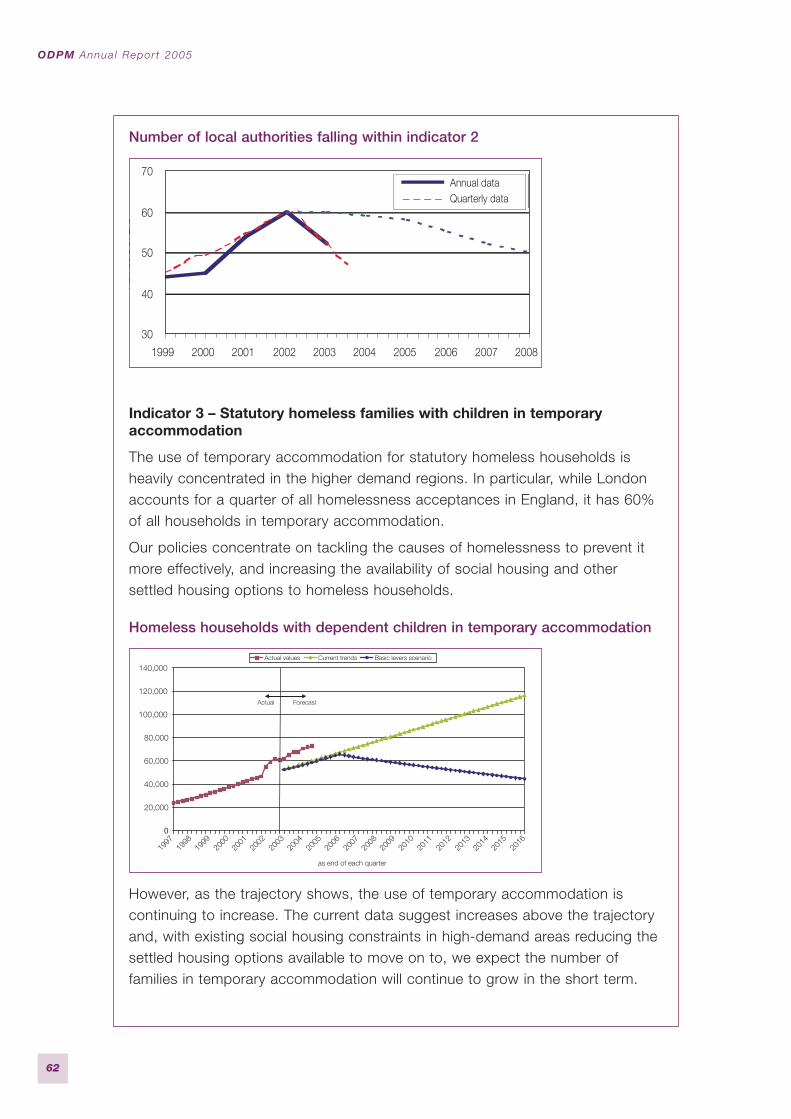
Number of local authorities falling within indicator 2
Indicator 3 – Statutory homeless families with children in temporaryaccommodation
The use of temporary accommodation for statutory homeless households isheavily concentrated in the higher demand regions. In particular, while Londonaccounts for a quarter of all homelessness acceptances in England, it has 60%of all households in temporary accommodation.
Our policies concentrate on tackling the causes of homelessness to prevent itmore effectively, and increasing the availability of social housing and othersettled housing options to homeless households.
Homeless households with dependent children in temporary accommodation
However, as the trajectory shows, the use of temporary accommodation iscontinuing to increase. The current data suggest increases above the trajectoryand, with existing social housing constraints in high-demand areas reducing thesettled housing options available to move on to, we expect the number offamilies in temporary accommodation will continue to grow in the short term.
as end of each quarter
0
20,000
40,000
60,000
80,000
100,000
120,000
140,000Actual values Current trends Basic levers scenario
Actual Forecast
1997
1998
1999
2000
2001
2002
2003
2004
2005
2006
2007
2008
2009
2010
2011
2012
2013
2014
2015
2016
30
40
50
60
70
1999 2000 2001 2002 2003 2004 2005 2006 2007 2008
Num
bers
ofLA
s
Annual dataQuarterly data
ODPM Annua l Repor t 2005
62
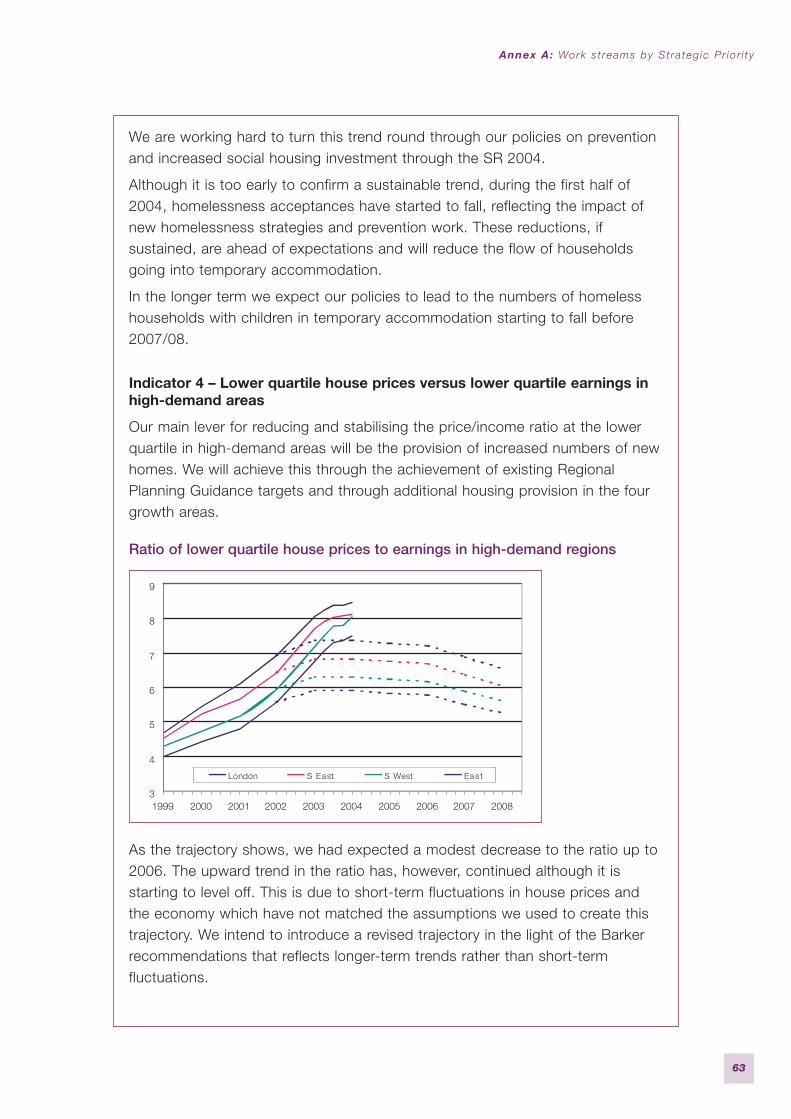
We are working hard to turn this trend round through our policies on preventionand increased social housing investment through the SR 2004.
Although it is too early to confirm a sustainable trend, during the first half of2004, homelessness acceptances have started to fall, reflecting the impact ofnew homelessness strategies and prevention work. These reductions, ifsustained, are ahead of expectations and will reduce the flow of householdsgoing into temporary accommodation.
In the longer term we expect our policies to lead to the numbers of homelesshouseholds with children in temporary accommodation starting to fall before2007/08.
Indicator 4 – Lower quartile house prices versus lower quartile earnings inhigh-demand areas
Our main lever for reducing and stabilising the price/income ratio at the lowerquartile in high-demand areas will be the provision of increased numbers of newhomes. We will achieve this through the achievement of existing RegionalPlanning Guidance targets and through additional housing provision in the fourgrowth areas.
Ratio of lower quartile house prices to earnings in high-demand regions
As the trajectory shows, we had expected a modest decrease to the ratio up to2006. The upward trend in the ratio has, however, continued although it isstarting to level off. This is due to short-term fluctuations in house prices andthe economy which have not matched the assumptions we used to create thistrajectory. We intend to introduce a revised trajectory in the light of the Barkerrecommendations that reflects longer-term trends rather than short-termfluctuations.
3
4
5
6
7
8
9
1999 2000 2001 2002 2003 2004 2005 2006 2007 2008
London S East S West Eas t
Annex A: Work s t reams by St ra teg ic Pr ior i ty
63
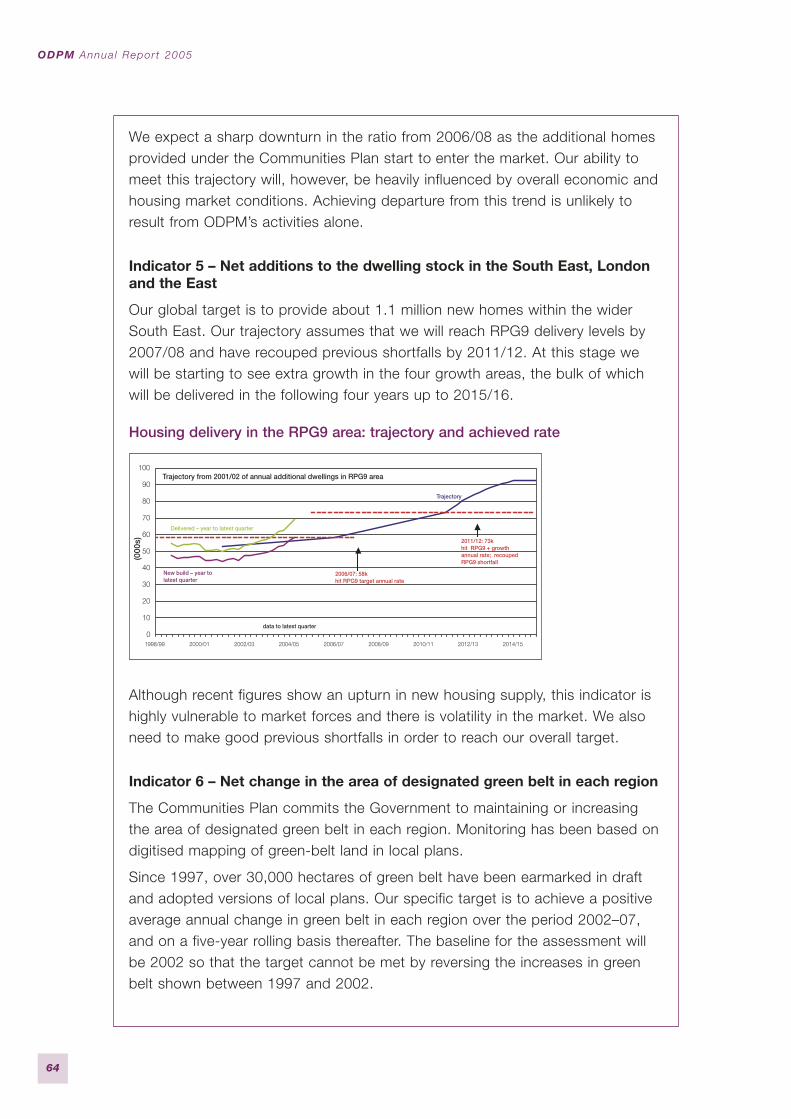
We expect a sharp downturn in the ratio from 2006/08 as the additional homesprovided under the Communities Plan start to enter the market. Our ability tomeet this trajectory will, however, be heavily influenced by overall economic andhousing market conditions. Achieving departure from this trend is unlikely toresult from ODPM’s activities alone.
Indicator 5 – Net additions to the dwelling stock in the South East, Londonand the East
Our global target is to provide about 1.1 million new homes within the widerSouth East. Our trajectory assumes that we will reach RPG9 delivery levels by2007/08 and have recouped previous shortfalls by 2011/12. At this stage wewill be starting to see extra growth in the four growth areas, the bulk of whichwill be delivered in the following four years up to 2015/16.
Housing delivery in the RPG9 area: trajectory and achieved rate
Although recent figures show an upturn in new housing supply, this indicator ishighly vulnerable to market forces and there is volatility in the market. We alsoneed to make good previous shortfalls in order to reach our overall target.
Indicator 6 – Net change in the area of designated green belt in each region
The Communities Plan commits the Government to maintaining or increasingthe area of designated green belt in each region. Monitoring has been based ondigitised mapping of green-belt land in local plans.
Since 1997, over 30,000 hectares of green belt have been earmarked in draftand adopted versions of local plans. Our specific target is to achieve a positiveaverage annual change in green belt in each region over the period 2002–07,and on a five-year rolling basis thereafter. The baseline for the assessment willbe 2002 so that the target cannot be met by reversing the increases in greenbelt shown between 1997 and 2002.
0
10
20
30
40
50
60
70
80
90
100
1998/99 2000/01 2002/03 2004/05 2006/07 2008/09 2010/11 2012/13 2014/15
Trajectory from 2001/02 of annual additional dwellings in RPG9 area
2006/07: 58khit RPG9 target annual rate
2011/12: 73k hit RPG9 + growthannual rate; recouped RPG9 shortfall
Delivered – year to latest quarter
Trajectory
New build – year to latest quarter
data to latest quarter
(000
s)
ODPM Annua l Repor t 2005
64
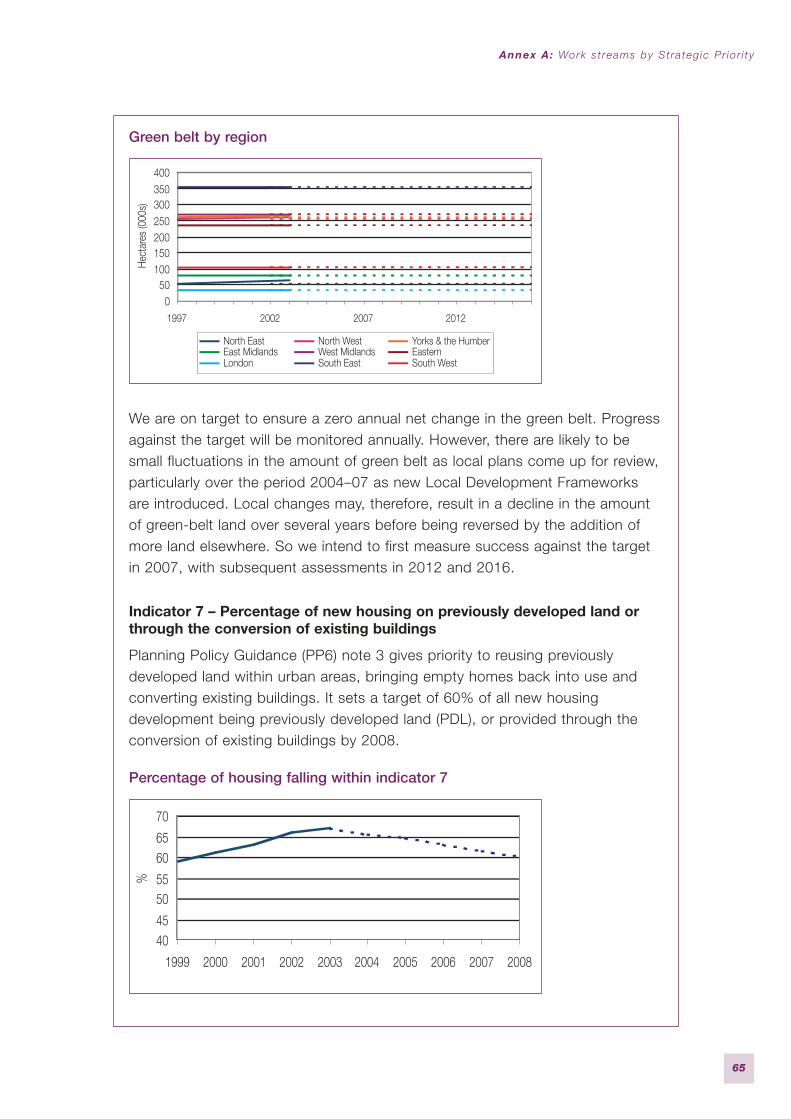
Green belt by region
We are on target to ensure a zero annual net change in the green belt. Progressagainst the target will be monitored annually. However, there are likely to besmall fluctuations in the amount of green belt as local plans come up for review,particularly over the period 2004–07 as new Local Development Frameworksare introduced. Local changes may, therefore, result in a decline in the amountof green-belt land over several years before being reversed by the addition ofmore land elsewhere. So we intend to first measure success against the targetin 2007, with subsequent assessments in 2012 and 2016.
Indicator 7 – Percentage of new housing on previously developed land orthrough the conversion of existing buildings
Planning Policy Guidance (PP6) note 3 gives priority to reusing previouslydeveloped land within urban areas, bringing empty homes back into use andconverting existing buildings. It sets a target of 60% of all new housingdevelopment being previously developed land (PDL), or provided through theconversion of existing buildings by 2008.
Percentage of housing falling within indicator 7
4045
5055
6065
70
1999 2000 2001 2002 2003 2004 2005 2006 2007 2008
%
050
100150200250300350400
1997 2002 2007 2012
Hec
tare
s (0
00s)
North East North West Yorks & the HumberEast Midlands West Midlands EasternLondon South East South West
Annex A: Work s t reams by St ra teg ic Pr ior i ty
65
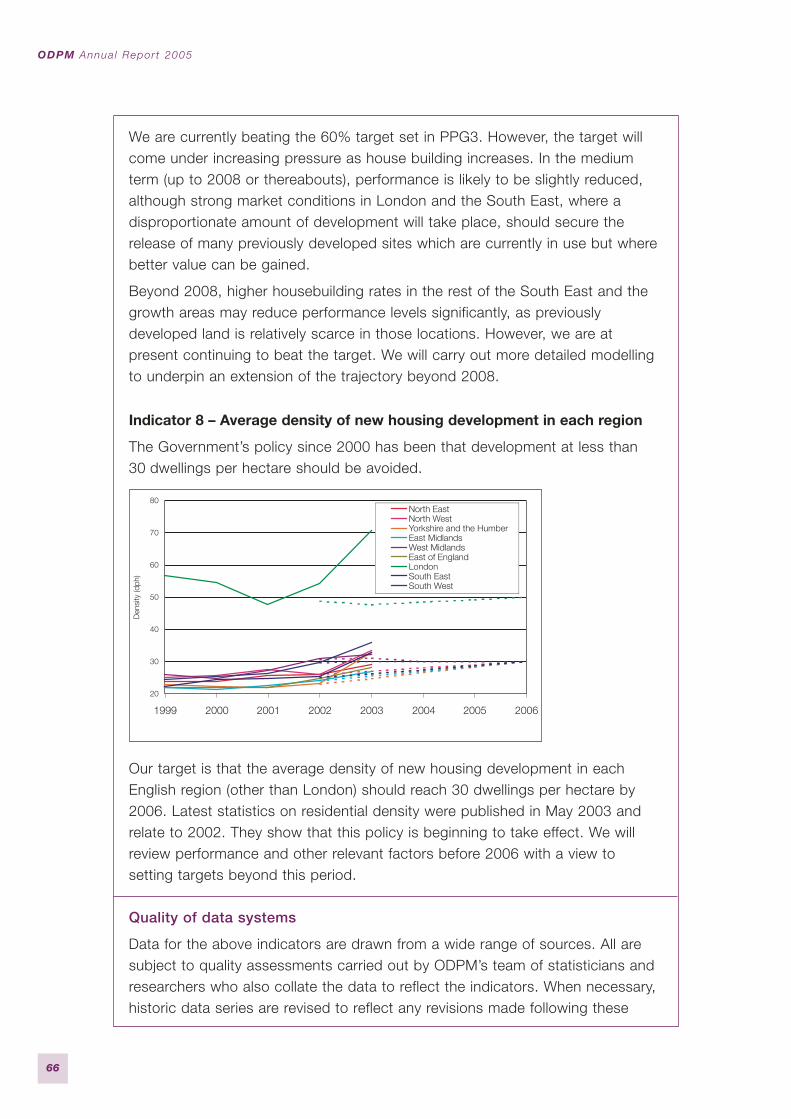
We are currently beating the 60% target set in PPG3. However, the target willcome under increasing pressure as house building increases. In the mediumterm (up to 2008 or thereabouts), performance is likely to be slightly reduced,although strong market conditions in London and the South East, where adisproportionate amount of development will take place, should secure therelease of many previously developed sites which are currently in use but wherebetter value can be gained.
Beyond 2008, higher housebuilding rates in the rest of the South East and thegrowth areas may reduce performance levels significantly, as previouslydeveloped land is relatively scarce in those locations. However, we are atpresent continuing to beat the target. We will carry out more detailed modellingto underpin an extension of the trajectory beyond 2008.
Indicator 8 – Average density of new housing development in each region
The Government’s policy since 2000 has been that development at less than30 dwellings per hectare should be avoided.
Our target is that the average density of new housing development in eachEnglish region (other than London) should reach 30 dwellings per hectare by2006. Latest statistics on residential density were published in May 2003 andrelate to 2002. They show that this policy is beginning to take effect. We willreview performance and other relevant factors before 2006 with a view tosetting targets beyond this period.
Quality of data systems
Data for the above indicators are drawn from a wide range of sources. All aresubject to quality assessments carried out by ODPM’s team of statisticians andresearchers who also collate the data to reflect the indicators. When necessary,historic data series are revised to reflect any revisions made following these
20
30
40
50
60
70
80
1999 2000 2001 2002 2003 2004 2005 2006
North EastNorth WestYorkshire and the HumberEast MidlandsWest MidlandsEast of EnglandLondonSouth EastSouth West
Den
sity
(dph
)
ODPM Annua l Repor t 2005
66
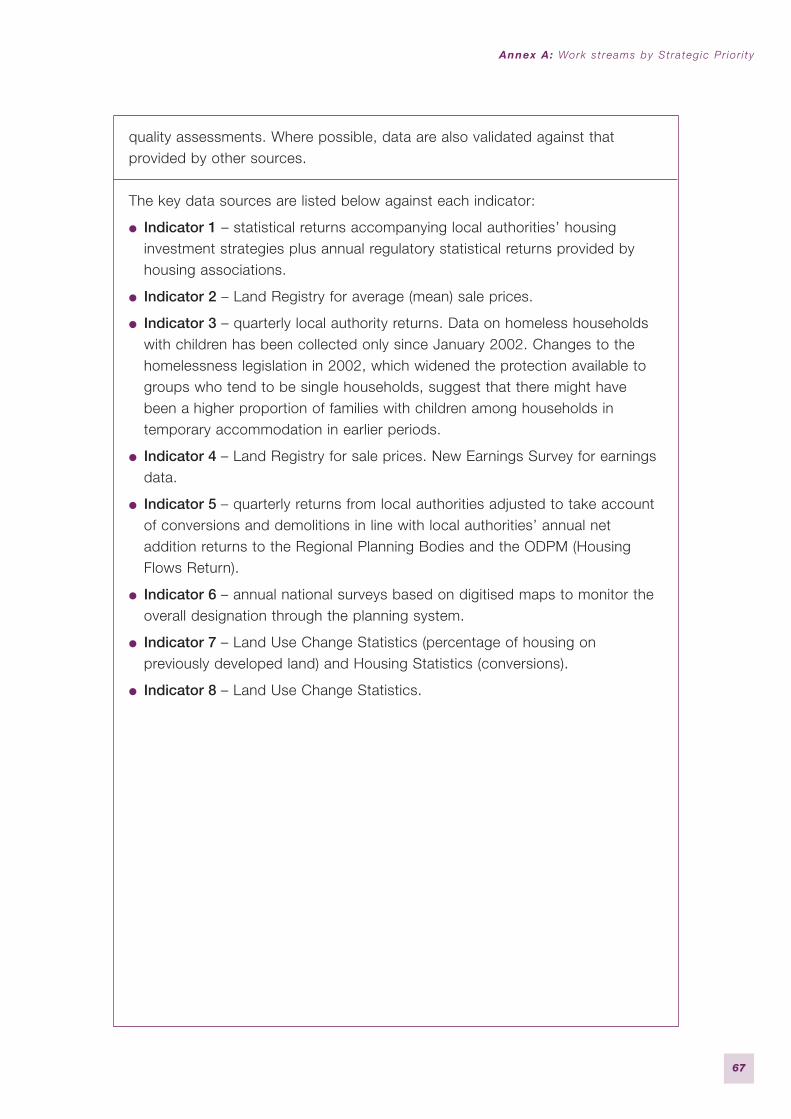
quality assessments. Where possible, data are also validated against thatprovided by other sources.
The key data sources are listed below against each indicator:
● Indicator 1 – statistical returns accompanying local authorities’ housinginvestment strategies plus annual regulatory statistical returns provided byhousing associations.
● Indicator 2 – Land Registry for average (mean) sale prices.
● Indicator 3 – quarterly local authority returns. Data on homeless householdswith children has been collected only since January 2002. Changes to thehomelessness legislation in 2002, which widened the protection available togroups who tend to be single households, suggest that there might havebeen a higher proportion of families with children among households intemporary accommodation in earlier periods.
● Indicator 4 – Land Registry for sale prices. New Earnings Survey for earningsdata.
● Indicator 5 – quarterly returns from local authorities adjusted to take accountof conversions and demolitions in line with local authorities’ annual netaddition returns to the Regional Planning Bodies and the ODPM (HousingFlows Return).
● Indicator 6 – annual national surveys based on digitised maps to monitor theoverall designation through the planning system.
● Indicator 7 – Land Use Change Statistics (percentage of housing onpreviously developed land) and Housing Statistics (conversions).
● Indicator 8 – Land Use Change Statistics.
Annex A: Work s t reams by St ra teg ic Pr ior i ty
67
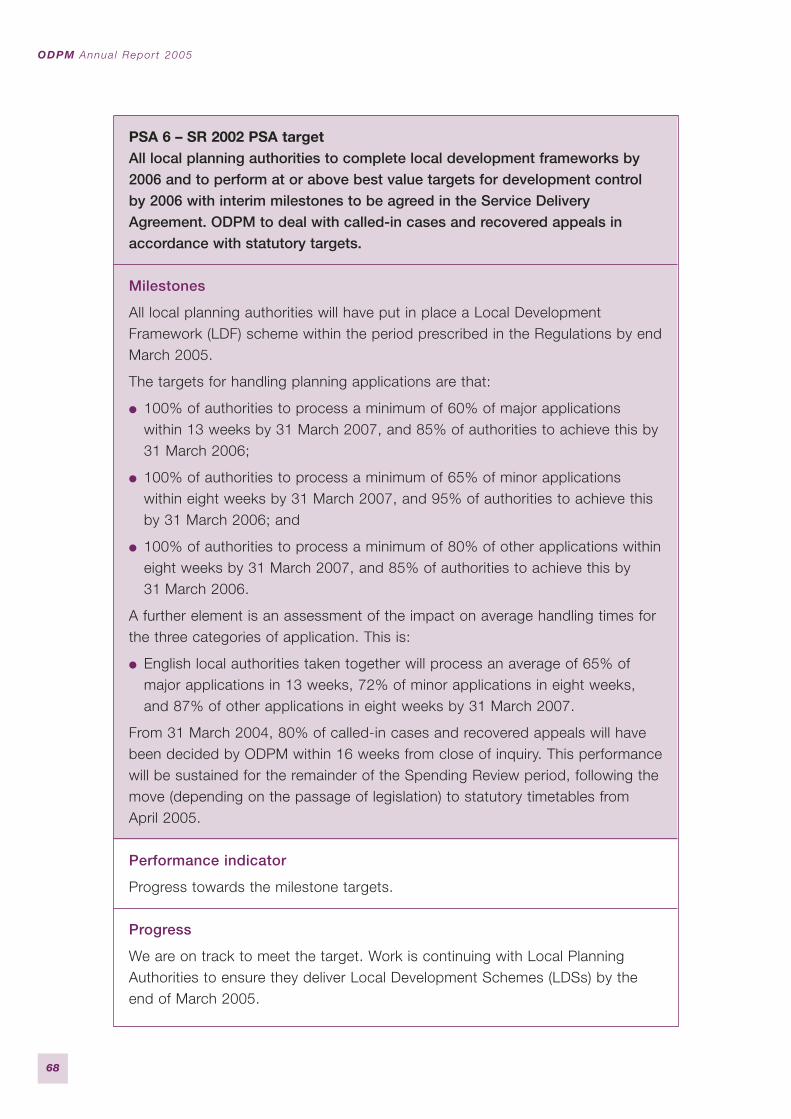
PSA 6 – SR 2002 PSA targetAll local planning authorities to complete local development frameworks by2006 and to perform at or above best value targets for development controlby 2006 with interim milestones to be agreed in the Service DeliveryAgreement. ODPM to deal with called-in cases and recovered appeals inaccordance with statutory targets.
Milestones
All local planning authorities will have put in place a Local DevelopmentFramework (LDF) scheme within the period prescribed in the Regulations by endMarch 2005.
The targets for handling planning applications are that:
● 100% of authorities to process a minimum of 60% of major applicationswithin 13 weeks by 31 March 2007, and 85% of authorities to achieve this by31 March 2006;
● 100% of authorities to process a minimum of 65% of minor applicationswithin eight weeks by 31 March 2007, and 95% of authorities to achieve thisby 31 March 2006; and
● 100% of authorities to process a minimum of 80% of other applications withineight weeks by 31 March 2007, and 85% of authorities to achieve this by31 March 2006.
A further element is an assessment of the impact on average handling times forthe three categories of application. This is:
● English local authorities taken together will process an average of 65% ofmajor applications in 13 weeks, 72% of minor applications in eight weeks,and 87% of other applications in eight weeks by 31 March 2007.
From 31 March 2004, 80% of called-in cases and recovered appeals will havebeen decided by ODPM within 16 weeks from close of inquiry. This performancewill be sustained for the remainder of the Spending Review period, following themove (depending on the passage of legislation) to statutory timetables fromApril 2005.
Performance indicator
Progress towards the milestone targets.
Progress
We are on track to meet the target. Work is continuing with Local PlanningAuthorities to ensure they deliver Local Development Schemes (LDSs) by theend of March 2005.
ODPM Annua l Repor t 2005
68
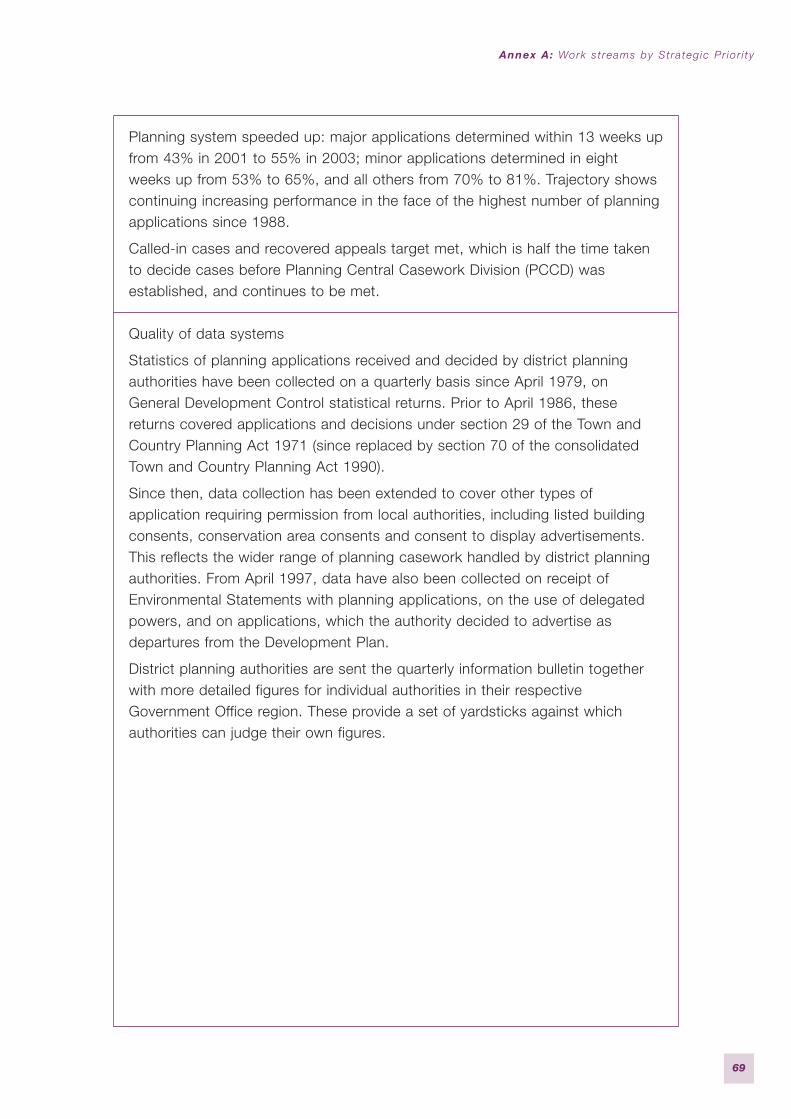
Planning system speeded up: major applications determined within 13 weeks upfrom 43% in 2001 to 55% in 2003; minor applications determined in eightweeks up from 53% to 65%, and all others from 70% to 81%. Trajectory showscontinuing increasing performance in the face of the highest number of planningapplications since 1988.
Called-in cases and recovered appeals target met, which is half the time takento decide cases before Planning Central Casework Division (PCCD) wasestablished, and continues to be met.
Quality of data systems
Statistics of planning applications received and decided by district planningauthorities have been collected on a quarterly basis since April 1979, onGeneral Development Control statistical returns. Prior to April 1986, thesereturns covered applications and decisions under section 29 of the Town andCountry Planning Act 1971 (since replaced by section 70 of the consolidatedTown and Country Planning Act 1990).
Since then, data collection has been extended to cover other types ofapplication requiring permission from local authorities, including listed buildingconsents, conservation area consents and consent to display advertisements.This reflects the wider range of planning casework handled by district planningauthorities. From April 1997, data have also been collected on receipt ofEnvironmental Statements with planning applications, on the use of delegatedpowers, and on applications, which the authority decided to advertise asdepartures from the Development Plan.
District planning authorities are sent the quarterly information bulletin togetherwith more detailed figures for individual authorities in their respectiveGovernment Office region. These provide a set of yardsticks against whichauthorities can judge their own figures.
Annex A: Work s t reams by St ra teg ic Pr ior i ty
69
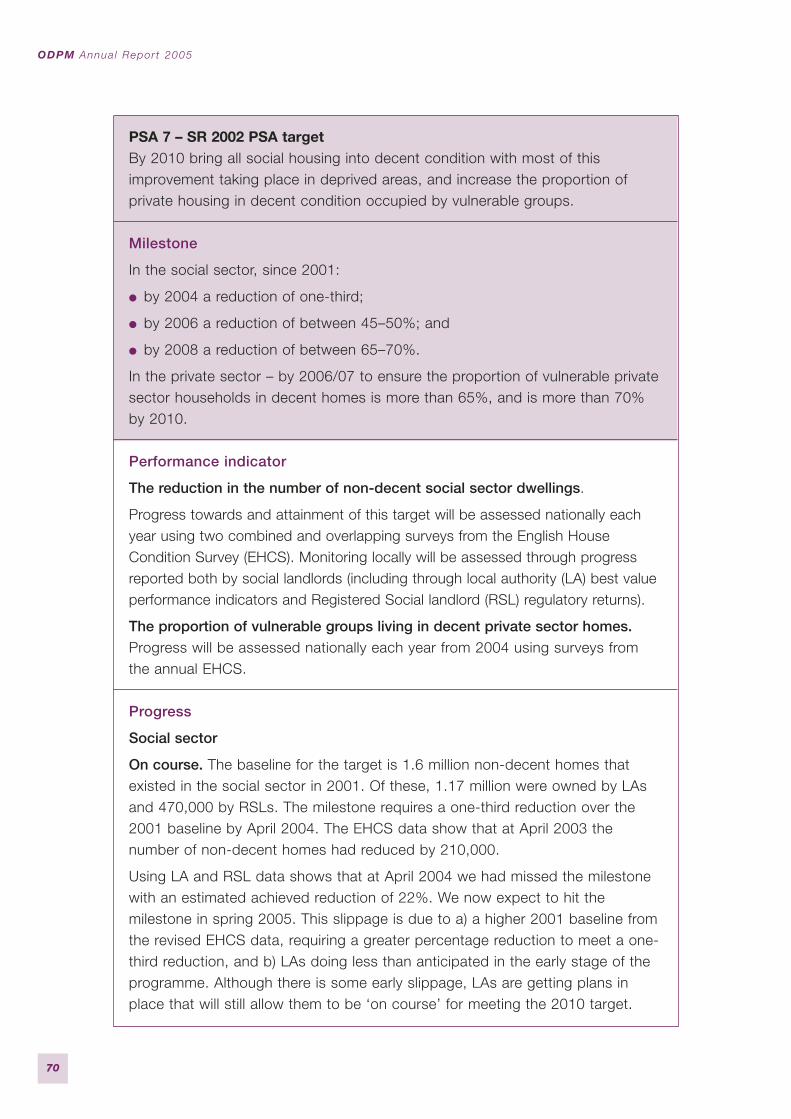
PSA 7 – SR 2002 PSA targetBy 2010 bring all social housing into decent condition with most of thisimprovement taking place in deprived areas, and increase the proportion ofprivate housing in decent condition occupied by vulnerable groups.
Milestone
In the social sector, since 2001:
● by 2004 a reduction of one-third;
● by 2006 a reduction of between 45–50%; and
● by 2008 a reduction of between 65–70%.
In the private sector – by 2006/07 to ensure the proportion of vulnerable privatesector households in decent homes is more than 65%, and is more than 70%by 2010.
Performance indicator
The reduction in the number of non-decent social sector dwellings.
Progress towards and attainment of this target will be assessed nationally eachyear using two combined and overlapping surveys from the English HouseCondition Survey (EHCS). Monitoring locally will be assessed through progressreported both by social landlords (including through local authority (LA) best valueperformance indicators and Registered Social landlord (RSL) regulatory returns).
The proportion of vulnerable groups living in decent private sector homes.Progress will be assessed nationally each year from 2004 using surveys fromthe annual EHCS.
Progress
Social sector
On course. The baseline for the target is 1.6 million non-decent homes thatexisted in the social sector in 2001. Of these, 1.17 million were owned by LAsand 470,000 by RSLs. The milestone requires a one-third reduction over the2001 baseline by April 2004. The EHCS data show that at April 2003 thenumber of non-decent homes had reduced by 210,000.
Using LA and RSL data shows that at April 2004 we had missed the milestonewith an estimated achieved reduction of 22%. We now expect to hit themilestone in spring 2005. This slippage is due to a) a higher 2001 baseline fromthe revised EHCS data, requiring a greater percentage reduction to meet a one-third reduction, and b) LAs doing less than anticipated in the early stage of theprogramme. Although there is some early slippage, LAs are getting plans inplace that will still allow them to be ‘on course’ for meeting the 2010 target.
ODPM Annua l Repor t 2005
70
Private sector
Ahead – with most progress being accounted for through a reduction in theproportion of vulnerable households whose homes fail on the thermal comfortcriterion. The private sector element of the decent homes target was introducedat the SR 2002. Progress will be monitored from the 2001 baseline positionestablished by the EHCS, which estimated that 57% (1.5 million) vulnerablehouseholds lived in decent homes.
The EHCS reported that this percentage had risen to 63% by the end of April2003. This is ahead of trajectory.
Quality of data systems
The concept of a decent home was introduced in 2001, with the final systemsdefinition agreed in March 2002. Both LAs and RSLs have had to refine theirinformation and database systems in order to accommodate the definition,record numbers of dwellings falling below this standard and track progress inthe reduction of non-decent homes. We therefore only have data at LA levelfrom 2001 and Housing Association level from 2002. But national estimates for2001 and earlier years can be constructed from the EHCS.
Data from LAs and RSLs are improving as they adjust their data collection andprocessing mechanisms to report on decent homes. The data provided by LAseach year now shows a) a revised baseline, b) gross reduction in non-decents,c) decent numbers prevented from becoming non-decent, d) numbers becomingnon-decent, e) targets set for reduction, and f) the nature and cost of worksneeded to deliver.
RSLs report on the number of non-decent dwellings annually. The HousingCorporation, along with the National Housing Federation, have completed aprogramme of work to examine the extent of the problem in the HousingAssociation sector and provide advice and good practice guidance onassessing, monitoring and ultimately achieving decent homes.
The data provided by the LAs and RSLs show broad consistency with theestimates from the EHCS. The EHCS is now being conducted annually, and willbe an independent check on the change in the numbers of non-decent stockeach year using the combined data from the last two years.
Data on private sector renewal has been revised to ensure LAs can providedetailed evidence of activity across a broad spectrum of support and in respectof targeting vulnerable households. The development and implementation of localauthority strategies is being monitored and evaluated through ongoing research.Guidance was issued to local authorities in October 2003 on ways of monitoringtheir own progress in providing decent homes for vulnerable households.
Annex A: Work s t reams by St ra teg ic Pr ior i ty
71
PSA 1 – SR 2002 PSA targetTo promote better policy integration nationally, regionally and locally; inparticular to work with departments to help them meet their PSA floor targetsfor neighbourhood renewal and social inclusion.
Milestone
The measure of success for achieving this PSA is that all 13 SR 2002 floortargets are achieved within their respective time frames as set out in theirdelivery plans.
Performance indicator
‘Floor target’ is a generic term to describe a series of targets that sets aminimum standard, in most cases for disadvantaged groups or areas, or anarrowing of the gap between them and the rest of the country. The floor targetscover a wide range of Government activities described below under ‘Progress’.
Each government department is responsible for the achievement of its own PSAfloor targets.
The trajectory for this PSA is the combination of the trajectories contained inindividual departments’ delivery plans. The Neighbourhood Renewal Unit (NRU)monitors floor targets both individually and for their combined impact inimproving service delivery in deprived areas.
Progress
As described above, the architecture of the PSA 1 target is such that it reliesupon the delivery of floor targets across Government. In the key outcome areasthe progress achieved is detailed below.
Education1
● The gap between the average pass rate for five ‘good’ GCSEs (A*–C) in themost deprived (the 88 Neighbourhood Renewal Fund (NRF)) districts and therest of England has narrowed.
● In Neighbourhood Renewal Areas, 46.1% of pupils attending maintainedschools achieved five or more A*–C grades at GCSE and equivalent in 2004,compared to 55.9% of pupils in non-Neighbourhood Renewal Areas. Thecorresponding figures for 2000 were 39.2% and 51.9% respectively.
● In 2003/04, four local education authorities (LEAs) (all Neighbourhood RenewalAreas – Kingston upon Hull, Bristol, Blackpool and Nottingham) achieved lessthan the target of 38% of pupils obtaining five or more GCSEs at A*–C (orequivalent) by 2004. In 2000, the corresponding figure was 32 LEAs (31 NRFand 1 non-NRF).
ODPM Annua l Repor t 2005
72 1 Figures quoted for 2003/04 are based on revised and not final Department for Education andSkills (DfES) data.
● The four fastest improving LEAs in the country are in London, in NRF areaswith high levels of deprivation and historically low results (Islington7.4 percentage points increase, Lewisham 6.8 percentage points, Lambeth6.0 percentage points, Hackney 5.9 percentage points).
● The gap in achievement for numeracy and literacy for 11-year-olds has alsoshrunk.
● Key Stage 2 Level 4 data show that the gap has narrowed between NRFareas and the rest between 1999/00 and 2003/04, moving from 5 percentagepoints to 4 percentage points for maths and from 6 percentage points to5 percentage points for English (based on 2003/04 revised data).Achievement in both subjects in NRF areas has improved in absolute termsover the same time period.
Worklessness
● Autumn 2004 data show that between spring 2003 (base line) and autumn2004, the employment rate in the 30 Local Authority Districts (LADs) with thehighest levels of worklessness increased by 1.1 percentage point, and overthe same period the gap between target areas and national average narrowedby 0.9 percentage point. This indicates that the Department for Work andPensions (DWP) are ahead of schedule in meeting their target in the 30 LADs.The autumn 2004 data also confirm the trend in the gap being reduced forblack and minority ethnic (BME) and low qualifications groups.
● An extra half a million more people from deprived areas are now in jobs.Employment rates in the 88 NRF districts have increased by 1.7 percentagepoints since 1997/98. Regional Development Agencies (RDAs) have alsocontributed to 89,694 new and safeguarded jobs, 6,064 new businesses and194,380 more learning opportunities.
Health
● England is experiencing rapidly reducing death rates from cancer andcardiovascular disease.
● Teenage pregnancy rates are falling faster in our most deprived areas –dropping more quickly in the 88 NRF districts than the England average.The gap between the two has reduced from 12.6 percentage points to 11.6.
Crime
● The gap between average burglary rates for the 88 NRF districts and the restof England fell by just under a fifth.
● Robbery rates for England and the 88 most deprived districts have decreasedover the last two years.
● Vehicle crime rates in the 88 NRF districts have fallen at a faster rate than theEngland average, dropping from 27 to 23 for every 1,000 people.
Annex A: Work s t reams by St ra teg ic Pr ior i ty
73

Housing
● The number of non-decent homes has been reduced by one million and£18 billion has been invested in social housing.
● Findings indicate that housing conditions across the 88 NRF areas havesteadily improved, with the number of non-decent social sector homes fallingby 38% (from 1.4 to 0.8 million) since 1996. This accounts for 66% of theoverall reduction in social sector non-decent homes since 2001.
● Increased investment in social housing – up by almost £360 for each propertysince 1997 and many in NRF areas.
Progress for the Local Strategic Partnerships with the greatest challenge
There are now 17 Local Strategic Partnerships (LSPs) facing the greatestchallenge in terms of floor target delivery. For the 17 we are deployingAssignment Managers to work with the LSPs to identify the key issues (thematicand/or partnership issues) and to draw up a clear action plan to resolve theseissues.
The process is being managed by NRU, Government Offices and theAssignment Managers.
Key work streamsSupport/challenge departments on the delivery of floor targets
Milestones
● Hold quarterly meetings with other government departments to challengeprogress and hold Ministerial trilateral meetings.
● Ensure that the neighbourhood renewal agenda is reflected in the prioritiesand target setting of other government departments.
● Contribute to Social Impact work through a joint project with HM Treasuryon deprivation for SR 2004.
● Develop a communications strategy to reach priority Whitehall and agencyaudiences by summer 2004.
Milestones repeated in bold below.
Progress
Hold quarterly meetings with other government departments to challengeprogress and hold Ministerial trilateral meetings.
Ensure that the neighbourhood renewal agenda is reflected in the prioritiesand target setting of other government departments.
ODPM Annua l Repor t 2005
74

Progress against these two:
In addition to the improvements in outcomes for deprived areas detailed earlier,the NRU has made further progress through its support and challenge roleacross Whitehall, raising the profile of neighbourhood renewal. The followingachievements capture this:
● In addition to board level meetings and quarterly progress meetings, NRU isengaging more effectively on the delivery of Home Office (HO), DWP,Department of Health (DH) and DfES floor targets through participation ontheir delivery boards and better information sharing.
● DfES and NRU have agreed to do further work exploring how to join up betterto improve outcomes in deprived areas.
● NRU has assisted DH with the emphasis it is making on tackling healthinequalities within its public health white paper delivery plan.
● NRU set up a mini-summit of Ministers involving HO, DWP and DfES,addressing the barriers to service delivery identified by the Places projectwhich focuses on Manchester, Nottingham and Southwark.
● Target framework agreed for RDAs to deliver employment and enterprise indeprived areas and assessed by NRU as contributing positively to PSA 1.
● Joint strategy agreed with DTI on enhancing business engagement withindeprived areas.
● Tour completed of the NRF areas most at risk of failing to deliver the decenthomes target. This is contributing to the development of a more focused NRUapproach towards enabling and supporting those priority authorities in boththe option appraisal phase and, ultimately, timely delivery of this target.
● Smarter delivery, better neighbourhoods pamphlet explaining the new PSA 1and floor targets.
● The ODPM and Strategy Unit produced the Improving the prospectsof people living in deprived areas in England report in January 2005.This study addressed the impact of the Government’s strategies andhighlighted strategies to create a cycle of improvement in our mostdeprived areas.
● Production of Making it Happen, the revised national strategy forneighbourhood renewal, which was released in January 2005.
● Six workshops held by ODPM’s Tackling Disadvantage Group at theSustainable Communities Summit, influencing a wide range of keystakeholders.
Annex A: Work s t reams by St ra teg ic Pr ior i ty
75
Contribute to Social Impact work through a joint project with HM Treasury ondeprivation for SR 2004.
● The SEU/NRU/HM Treasury joint project on deprivation led to the spendingreview outcomes that were secured for neighbourhood renewal.
As we move into the delivery of the new SR 2004 PSA 1 target, with itsaccompanying refined list of SR 2004 floor targets, the focus will be on closingthe gap in the six key outcome areas, namely health, education, housing,worklessness, crime and liveability.
Key work streamsSupport development of effective and inclusive Local Strategic Partnerships(LSPs)
Milestones
Ensure LSPs have performance management frameworks in place and annualperformance reviews are held between Government Offices and LSPs.
Progress
The 88 LSPs identified in the National Strategy for Neighbourhood Renewal arerequired to develop Local Neighbourhood Renewal Strategies (LNRS), thoughthe targets in these strategies are delivered by individual service deliverers suchas the LA or the police. As the co-ordinating body, the LSP supports thatdelivery through more effective and integrated strategic planning and by helpingjoint working to tackle cross-cutting issues.
LSPs in the 88 most deprived areas have been spending NRF to tackledeprivation and to kick-start mainstreaming. Now NRF LSPs are establishedthey are focusing on delivering improvements within their most deprivedneighbourhoods.
To help NRF LSPs focus on delivery, they developed and implemented aPerformance Management Framework (PMF) for the first time in April 2004.LSPs were able to use any framework they liked as long as it met the three corerequirements:
● review of delivery;
● review of partnership working; and
● improvement planning.
LSPs self-assessed their performance against delivering national floor targetsand local targets and the effectiveness of their partnership. From these reviewsthey set out priorities for the coming year in their Improvement Plan.
ODPM Annua l Repor t 2005
76
60 LSPs (the 26 in receipt of extra NRF and others that receive over £10 millionNRF 2001–06) then had their performance management framework validated bythe Audit Commission to assess whether the LSPs had carried out robustreviews and to ensure their PMF met the core requirements.
All NRF LSPs had an annual review with their Government Office to celebratesuccess and identify areas for further improvement.
Transparent support packages have been agreed with those LSPs that areunderperforming, including:
● Neighbourhood Renewal Advisors;
● delivery skills training;
● delivery seminars with Ministerial and senior official input; and
● on-line tools such as renewal.net and the LSP Delivery Toolkit.
We have taken lessons from the first round of performance management todevelop the process for 2005/06 by making the core requirements morefocused on neighbourhoods and outcomes. We are also making links betweenthe NRF LSP PMF and other initiatives including LAAs and Safer and StrongerCommunities Fund.
The NRU also delivered a national LSP conference in March 2005 with a focuson sharing learning and best practice to improve performance.
Key work streamsInfluence government departments and local service delivery agents to makemainstream services work better in deprived neighbourhoods
Milestones
● Ensure that Government Offices, Regional Development Agencies andRegional Assemblies encourage the improvement of mainstream servicesat neighbourhood level.
● Use the Permanent Secretaries Group (PSG) and Neighbourhood RenewalInterdepartmental Group work plans to focus on mainstreaming.
● Promote neighbourhood renewal through local services’ improvement andplanning mechanisms.
● Work on the race equality strategy including holding regular meetings of theRace Equality Action Group and finalise monitoring by early summer. Finalphase of race awareness training ongoing.
● Develop links between ERDF and other funding streams at neighbourhoodlevel.
Annex A: Work s t reams by St ra teg ic Pr ior i ty
77
Progress
Ensure that Government Offices, Regional Development Agencies andRegional Assemblies encourage the improvement of mainstream services atneighbourhood level.
● Closer working across the Government Offices is resulting in floor targetaction groups in some Government Offices which maintain the specific focusof the deprivation related targets across all teams in ODPM. A newperformance management reporting system for PSA 1 maintains focus onworking across ODPM and influencing mainstreaming at a regional as well aslocal level, in addition to encouraging Government Offices to share examplesof barriers with NRU Policy teams.
● Target framework agreed for RDAs to deliver employment and enterprise indeprived areas and assessed by NRU as contributing positively to PSA 1.
Use the Permanent Secretaries Group (PSG) and Neighbourhood RenewalInterdepartmental Group work plans to focus on mainstreaming
Promote neighbourhood renewal through local services’ improvement andplanning mechanisms
Progress on the above two:
During 2004/05, PSG has focused on what key departments are doing tocontribute to neighbourhood renewal with a particular focus on mainstreaming.For 2005/06, it has been agreed that there should be a focus on particularplaces which are failing on a number of floor targets.
Mainstreaming in the context of neighbourhood renewal means ‘influencingmainstream departments to make them work better in deprivedneighbourhoods, by shaping and resourcing them for the task, and makingthem focus explicitly on the places and people most in need of their support’.Key achievements are as follows:
● The announcement of the Safer and Stronger Communities Fund (SSCF) andthe local authority pilot areas for Local Area Agreements. These will provide animportant and different approach that will reduce bureaucracy and thereforerelease resources to deliver neighbourhood renewal at a local level.
● Local authorities producing community strategies embracing neighbourhoodrenewal issues, addressing increased opportunity, reduced poverty andestablishing a long-term vision.
● CPA 2005 key lines of enquiry, guidance for inspectors and pre-site analysisto include greater focus on deprivation as part of the overall assessmentprocess.
ODPM Annua l Repor t 2005
78

● Research published on mainstream spending flows tracking the flow ofmainstream funds to local areas and on measuring outcomes achieved by thisfunding.
Work on the race equality strategy including holding regular meetings of theRace Equality Action Group and finalise monitoring by early summer. Finalphase of race awareness training ongoing
● Four Race Equality Action Group (REAG) meetings were held during the year,where REAG members offered helpful advice on specific Government policyrelated to neighbourhood renewal and race and also NRU delivery.
● Ethnicity monitoring guidance, for monitoring BME outcomes andinvolvement, was published in October 2004 and tested with five LSPs.
● Race awareness training on the implications of the Race RelationsAmendment Act was completed in the Government Offices for the Regions.
Key work streamsGovernment Offices to drive change to secure delivery of floor targets on theground
Milestones
Introduce a new Government Office performance management framework forPSA 1 including the development of a strategic framework agreement that willset out the Government Office contribution to the targets and milestones thatappear in the NRU delivery plan
Progress
The nine Government Offices in the English regions are the key regional linkbetween Whitehall departments, including ODPM, LSPs, local service deliverersand neighbourhood-level activity.
Neighbourhood renewal teams in regional Government Offices (GOs) overseelocal renewal strategies, administer funding, facilitate partnership working, andjoin up government policy. The teams offer expert knowledge on projects,provide intelligence and inform Whitehall of what works in their region.
Key achievements include:
Revision of the strategic framework agreement for GOs setting out clearpriorities for activity that will support PSA 1 delivery.
Ongoing work with LSPs in the most deprived areas to both challenge andsupport their performance informally and also through formal annualperformance reviews.
Annex A: Work s t reams by St ra teg ic Pr ior i ty
79
Leading the negotiation and agreeing outcomes for the Safer and StrongerCommunities Fund and the pilot local area agreements, including the NRF andlocal public service agreement elements of those.
Key work streamsEnsure delivery is built upon a firm evidence base:
● skills and knowledge;
● neighbourhood renewal programmes; and
● research and evaluation;
Milestones
● Deliver a programme of activity at national and regional level to ensure thatthose who deliver neighbourhood renewal do so effectively, includingdevelopment of renewal.net, a comprehensive training programme and thedeployment of around 170 Neighbourhood Renewal Advisers.
● Achieve sustainability and mainstreaming of a majority of Round 2Neighbourhood Warden Schemes.
● Ensure that the New Deal for Communities scheme achieves their full spendin 2004/05.
● Develop and disseminate neighbourhood statistics and other deprivation data,maintain and develop the Indices of Deprivation, and carry out acomprehensive research and evaluation programme.
Progress
Skills and knowledge
Deliver a programme of activity at national and regional level to ensure thatthose who deliver neighbourhood renewal do so effectively, includingdevelopment of renewal.net, a comprehensive training programme and thedeployment of around 170 Neighbourhood Renewal Advisers
Neighbourhood Renewal Advisers are helping the LSPs facing the greatestchallenge to develop strategic plans to achieve floor target convergence.
Access has been provided to a range of published toolkits that can help withplanning and delivery in deprived neighbourhoods together with knowledge onhow others have tackled similar problems.
The NRU has provided a repository of information and knowledge, availablethrough a dedicated all-in-one website: www.renewal.net. Over 1,200 peopleeach day now use renewal.net. Over 75% of them say they use documents fromthe site to help them base their own programmes on what has workedelsewhere.
ODPM Annua l Repor t 2005
80
The Delivery Skills Training Programme has offered intensive learning forpractitioners on a range of key issues for neighbourhood renewal delivery.
Research and evaluation
This element of our work includes formative evaluation of LSPs and the long-term evaluation of NDCs, Business Brokers, the Deprived Urban Post OfficeFund and the overall national strategy. Additionally it involves performanceanalysis of progress on the delivery of floor targets; the development ofneighbourhood level statistics and the strengthening of evidence-basedapproaches to neighbourhood renewal activity.
Develop and disseminate neighbourhood statistics and other deprivation data,maintain and develop the Indices of Deprivation, and carry out acomprehensive research and evaluation programme
Small area statistics have been freely available on the Internet for three years.Using administrative data collected by various government departments,Neighbourhood Statistics provides the local evidence regeneration users need.
● Neighbourhood Statistics continues to grow with over 50 datasets availablealongside the 2001 Census and the Indices of Deprivation, with more addedall the time.
● Tools and support are provided to the government departments who supplytheir data to the service.
● A new statistics geography has been developed. Super Output Areas (SOAs)provide a consistent measure of population in an area over time. Lower-layerSOAs contain an average of 1,500 people. This allows users to build theirown ‘neighbourhoods’ by adding SOAs together.
● The website averages 30,000 unique visitors per month.
Other key achievements are as follows:
● Floor Targets Interactive, a web-based system for monitoring progresstowards national PSA targets, is well established and very popular amongstusers at a local, regional and national level.
● It now receives over 100 visits a day, demonstrating its value and popularity.
● An evaluation of the National Strategy for Neighbourhood Renewal has beencommissioned.
● Annual evaluation reports have been produced for NDCs, NeighbourhoodManagement, the Community Facilitation programme and ResidentConsultancies.
● Four Strengthening Evidence for Local Delivery (SELD) pilots have beencommissioned for the North East, North West, West Midlands and South
Annex A: Work s t reams by St ra teg ic Pr ior i ty
81
West regions – to improve support to local practitioners on gathering andusing evidence to deliver PSA 1.
● Evidence roadshows have been completed across the regions promoting anddisseminating the NRU evidence base, with a wide range of regenerationpractitioners invited to participate.
● Understanding change: analyses of neighbourhood change using data fromIndices of Deprivation (autumn 2004).
● Mainstream spending flows: a research team has been established to takeforward work on tracking the flow of mainstream funds to local areas and onmeasuring outcomes achieved by this funding.
● Identify the main areas of programme expenditure in the key governmentdepartments and understand how that money is reaching deprived areas, aspart of the mapping of the mainstreaming work.
● The 2004 Indices of Deprivation were released. The Indices draw from a widerange of data presented in lower layer SOAs. They are used to help focusresources in areas of greatest need.
Neighbourhood renewal pathfinder programmes
Achieve sustainability and mainstreaming of a majority of Round 2Neighbourhood Warden Schemes
Ensure that the New Deal for Communities scheme achieves their full spend in2004/05
Progress:
● Of the Round 1 Neighbourhood Warden Schemes, 83% have achievedsustainability and are to be mainstreamed.
● The NDC scheme has achieved its full spend for 2004/05.
The following update offers further detail as to the progress we have made onthe full range of programmes. The three neighbourhood renewal pathfinderprogrammes make an important contribution to developing the evidence basefor the delivery of PSA 1. These programmes (Neighbourhood ManagementPathfinders; New Deal for Communities; and Neighbourhood Wardens) aretesting out the new approaches outlined in the National Strategy forNeighbourhood Renewal. They enable us to learn practical lessons about howto deliver neighbourhood renewal effectively, which can be spread to otherdeprived neighbourhoods through LSPs and their local neighbourhood renewalstrategies.
We have seen significant progress towards our poorest neighbourhoodsbecoming places where people want to live, places that promote opportunityand places that provide a better quality of life for all.
ODPM Annua l Repor t 2005
82

Progress to date includes:
● A considerable (28%) drop in the overall rate of crime where NeighbourhoodWarden Schemes operate.
● Quality of life in warden scheme areas has improved. 25% of residents havereported an increase in satisfaction with their neighbourhoods.
● Wardens are also successfully addressing the problem of fear of crime indeprived communities, particularly among older residents. Residents whonote the presence of wardens are less worried about being robbed ormugged, and targeted action by wardens has reduced the fear of distractionburglary.
● Residents in warden areas have an improved perception of their localenvironment owing to targeted work on graffiti, fly-tipping, litter and dogfouling. The greatest impacts are seen in schemes where wardens have agood relationship with agencies responsible for the environment.
● Youth anti-social behaviour (ASB) remains one of the most serious issuesin warden areas and continues to be the main reason for residentdissatisfaction. However, there are positive signs that perceptions of ASB arechanging. The link between wardens and reduced ASB is clear. People whosay that wardens make them feel safer are more likely to say the problem ofteenagers has got better.
● Wardens have been particularly successful in their role as ‘linker’ betweenresidents and service providers. Although few warden schemes havecommunity development as an explicit objective, the most successful haveadopted a community-based approach.
● Positive progress in worklessness, education, crime, housing and environmentand health in New Deal for the Community areas compared to nationalfigures.
● Progress in mainstreaming: the 2004 National Evaluation report shows thatthe 20 Round 1 Pathfinders are making good progress towards themainstreaming of interventions and changing local services to meet the needsof the community; Round 2 Pathfinders have completed the first stage ofimplementation.
● Changing lives: the National Evaluation shows that the NeighbourhoodManagement Pathfinder (NMP) approach is making real progress in changingcommunity attitudes on a range of issues and offering sustainableimprovements for residents in deprived communities.
● Community engagement: all boards have resident members and many have aresident chair. Seven Pathfinders have a resident majority board. By the endof the second year, five NMPs had held elections for residents to be elected
Annex A: Work s t reams by St ra teg ic Pr ior i ty
83
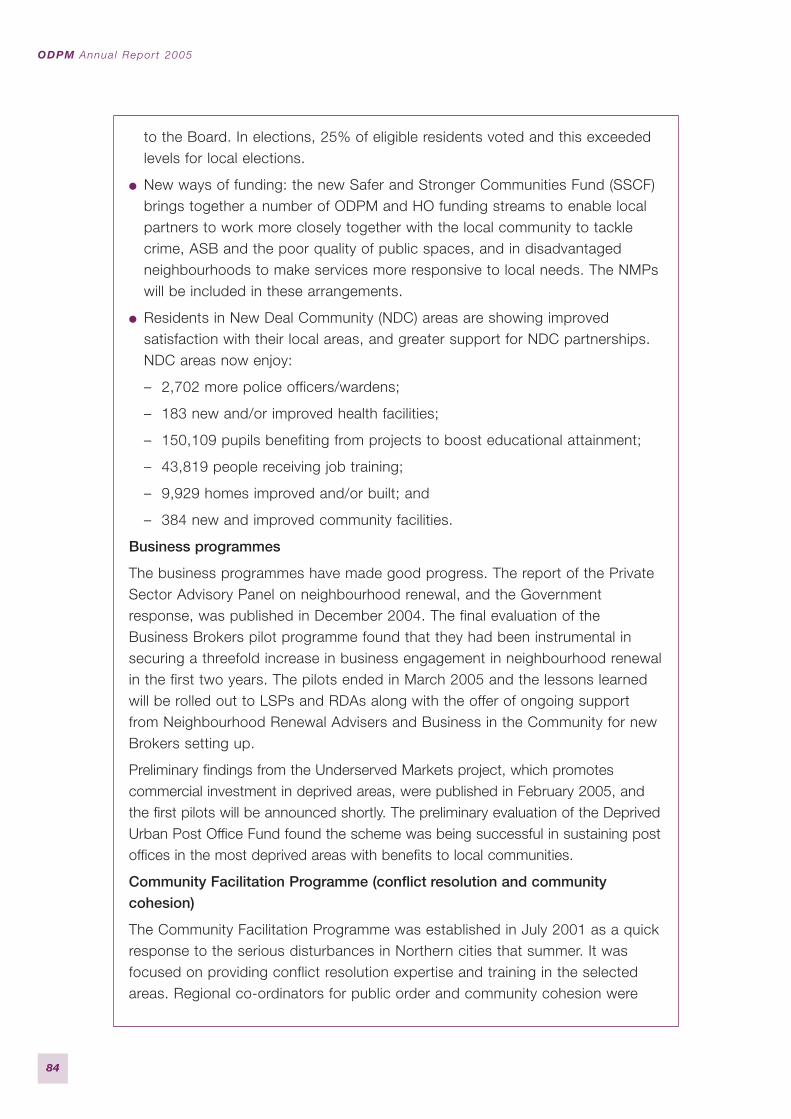
to the Board. In elections, 25% of eligible residents voted and this exceededlevels for local elections.
● New ways of funding: the new Safer and Stronger Communities Fund (SSCF)brings together a number of ODPM and HO funding streams to enable localpartners to work more closely together with the local community to tacklecrime, ASB and the poor quality of public spaces, and in disadvantagedneighbourhoods to make services more responsive to local needs. The NMPswill be included in these arrangements.
● Residents in New Deal Community (NDC) areas are showing improvedsatisfaction with their local areas, and greater support for NDC partnerships.NDC areas now enjoy:
– 2,702 more police officers/wardens;
– 183 new and/or improved health facilities;
– 150,109 pupils benefiting from projects to boost educational attainment;
– 43,819 people receiving job training;
– 9,929 homes improved and/or built; and
– 384 new and improved community facilities.
Business programmes
The business programmes have made good progress. The report of the PrivateSector Advisory Panel on neighbourhood renewal, and the Governmentresponse, was published in December 2004. The final evaluation of theBusiness Brokers pilot programme found that they had been instrumental insecuring a threefold increase in business engagement in neighbourhood renewalin the first two years. The pilots ended in March 2005 and the lessons learnedwill be rolled out to LSPs and RDAs along with the offer of ongoing supportfrom Neighbourhood Renewal Advisers and Business in the Community for newBrokers setting up.
Preliminary findings from the Underserved Markets project, which promotescommercial investment in deprived areas, were published in February 2005, andthe first pilots will be announced shortly. The preliminary evaluation of the DeprivedUrban Post Office Fund found the scheme was being successful in sustaining postoffices in the most deprived areas with benefits to local communities.
Community Facilitation Programme (conflict resolution and communitycohesion)
The Community Facilitation Programme was established in July 2001 as a quickresponse to the serious disturbances in Northern cities that summer. It wasfocused on providing conflict resolution expertise and training in the selectedareas. Regional co-ordinators for public order and community cohesion were
ODPM Annua l Repor t 2005
84

appointed in all Government Office regions. They are tasked with deployingcommunity facilitators and promoting training and support for this role.
The Tavistock Institute’s evaluation of this programme has shown that conflictresolution offers real solutions to fractured communities and that a capacity forconflict resolution is necessary in developing community cohesion. Theevaluation has drawn out good practice case studies and lessons learnt that willbe disseminated on the ODPM/NRU website renewal.net and shared with othergovernment departments and agencies.
The NRU has also established a dedicated pool of Neighbourhood RenewalAdvisors with expertise in conflict resolution who can be deployed to areas andprogrammes as and when conflicts arise. A conflict analysis training course hasbeen developed and delivered to members of various programmes andpartnerships in Neighbourhood Renewal areas.
Community Participation (Single Community Programme)
The Community Empowerment Fund, Community Chests and CommunityLearning Chests were established in 2001 in the 88 most deprived areas.Community Empowerment Networks bring together, and give a voice to, localcommunity and voluntary sector organisations on the LSP.
To ensure that the local community can participate in this way, CommunityChests and Community Learning Chests help develop active communities byproviding small grants and resource involvement in neighbourhood-levelpartnerships to drive change on the ground.
From 2004, the three programmes merged into the Single CommunityProgramme. The merger has simplified access to funding and re-focused theprogramme in a more strategic and neighbourhood-focused way. £43 millioneach year has been allocated to the Single Community Programme to 2005/06since 2001. It has so far supported around 25,000 separate community projectsin the country’s most deprived neighbourhoods. 88% of these projectscontribute directly to neighbourhood renewal targets and communities, andindividual public sector service providers are increasingly working together withcommunity groups. Local solutions to local problems are being successfullydeveloped by bringing together sub-groups of networks with service providers.
The National Audit Office Value for Money study of the Single CommunityProgramme confirmed that community participation was vital to ensure value formoney in public services. Initial outcomes from the national evaluation show:
● the Programme builds capacity, confidence and social capital throughsupporting local community groups;
Annex A: Work s t reams by St ra teg ic Pr ior i ty
85
● it makes a significant contribution to neighbourhood renewal through small-scale activities and learning; and
● it improves cohesion and co-ordination.
Tackling social exclusion
Key work streamsTo promote social inclusion by finding solutions to cross-cutting socialproblems
Milestones
● Completion of the work set out in the discussion document, published inMarch 2004, on Impacts and Trends in Social Exclusion. A final report to bepublished in summer 2004, informing the future focus of SEU work for2004/05 and 2005/06.
● Publication in summer 2004 of the Mental Health and Barriers to Employmentand Enterprise report.
● Identification by July 2004, and completion by summer 2005, of a number ofprojects, short studies and other work streams to tackle key policy anddelivery challenges in areas where barriers remain to achieving social inclusion(referred to below as the new SEU Work Programme). These to flow from theanalysis contained in the Impacts and Trends report.
● Agreement by July 2004 of the scope and timetable of work of a set of shortstudies on social exclusion to assist policy development across Government.The work to be delivered before April 2005.
Progress
● The Mental Health and Social Exclusion and Jobs and Enterprise in DeprivedAreas reports were published in June and September 2004 respectively.
● The Breaking the Cycle – taking stock of progress and priorities for the futurereport (formerly referred to as Impacts and Trends) was published inSeptember 2004. It showed that, although good progress has been made formany, the worst-off have benefited least from improvements in publicservices. The findings from this report were used to inform the future focusof SEU work for 2004/05 and 2005/06, and in particular the new SEU workprogramme.
● The new SEU work programme was finalised by Ministers in July 2004 andlaunched alongside the Breaking the Cycle report in September 2004.It focuses on improving the delivery of services to the most vulnerable groupsin society, in order to narrow inequalities and improve life chances for the most
ODPM Annua l Repor t 2005
86

disadvantaged people. The work programme concentrates on the followinggroups with multiple disadvantages (each of which is an interlinked project):
– Young Adults with Troubled Lives (due to be published in October 2005);
– Better Service Delivery for People who Move Frequently (due to bepublished in November 2005);–
– Excluded Older People (due to be published in December 2005);
– Better Service Delivery for Disadvantaged Adults (focusing on the followinggroups: people with poor basic skills; those with chronic health problemsand disability; and disadvantaged ethnic groups) (due to be published inwinter 2006);
and two short studies cutting across all of the above:
– Inclusion through Innovation: Social Exclusion and Technology (due to bepublished in July 2005); and
– Asset Inequality and Life Chances (currently an internal government paper).
● Consultation documents or information-gathering exercises were launched inOctober and November 2004 for each new project from the new SEU workprogramme.
Key work streamsTo develop and support implementation of joined-up policy to enabledepartments to deliver effectively to those in the greatest need and promotesocial inclusion
Milestones
● Continuation of support for the implementation of past reports acrossGovernment and dissemination to stakeholders.
Progress
● We have continued to champion and support the implementation of pastreports (particularly Reducing Re-offending by ex-prisoners, Transport andSocial Inclusion, A Better Education for Children in Care, Mental Health andSocial Exclusion, and Jobs and Enterprise in Deprived Areas) by workingclosely with government departments and key service delivery agencies toensure action points are taken forward in a timely and effective manager, andare disseminated to stakeholders (ongoing).
In addition, we have drawn on existing expertise from past projects to assistpolicy development and public service reform across Government, bychampioning the ‘bottom 10%’ and ensuring that other governmentdepartments prioritise action on deprivation (ongoing).
Annex A: Work s t reams by St ra teg ic Pr ior i ty
87
Tackling homelessness
Key work streamsTo sustain the targets in the reduction in rough sleeping and the use of bedand breakfast accommodation for homeless families with children
Milestones
● Work with DWP on Housing Benefit subsidy proposals for temporaryaccommodation to ensure they complement B&B reduction policy bySeptember 2004.
● Hold good practice seminars in all regions by December 2004.
● Publish revised B&B Reduction Handbook with focus on sustainability byDecember 2004.
● Publish 2004 national estimate of rough sleeping by September 2004.
● Develop, in consultation with stakeholders, a strategy for reconfiguringvoluntary sector hostel provision to ensure more effective outcomes forformally homeless residents by end of 2004.
● Develop a detailed delivery plan, in line with PSA 5, Child Poverty Review andSR 2004 settlement, to achieve reductions in the number of homeless familieswith children in temporary accommodation by the end of 2004.
Progress
The two-thirds reduction in the level of rough sleeping has been sustained andis currently at the lowest ever recorded level (around 500 people on a night).
The long-term use of B&B accommodation for homeless families with childrenhas been virtually eliminated, with 95% fewer families with children living in B&Baccommodation for over six weeks at end September 2004 compared withMarch 2002 when the target was announced.
● DWP Ministers agreed levels of thresholds/caps for Housing Benefit Subsidyin line with recommendations to sustain reductions in the use of B&Bs.
● Regional Roadshows held in all regions.
● Publication postponed until spring 2005 so that the Homes for All objectivescan be reflected.
● Published September 2004.
● £90 million Hostels Improvement Programme announced in December 2004.
● Ministerial Committee on Homelessness reconvened to oversee development ofstrategy. Main elements set out in Homes for All, published Jan 2005.
ODPM Annua l Repor t 2005
88
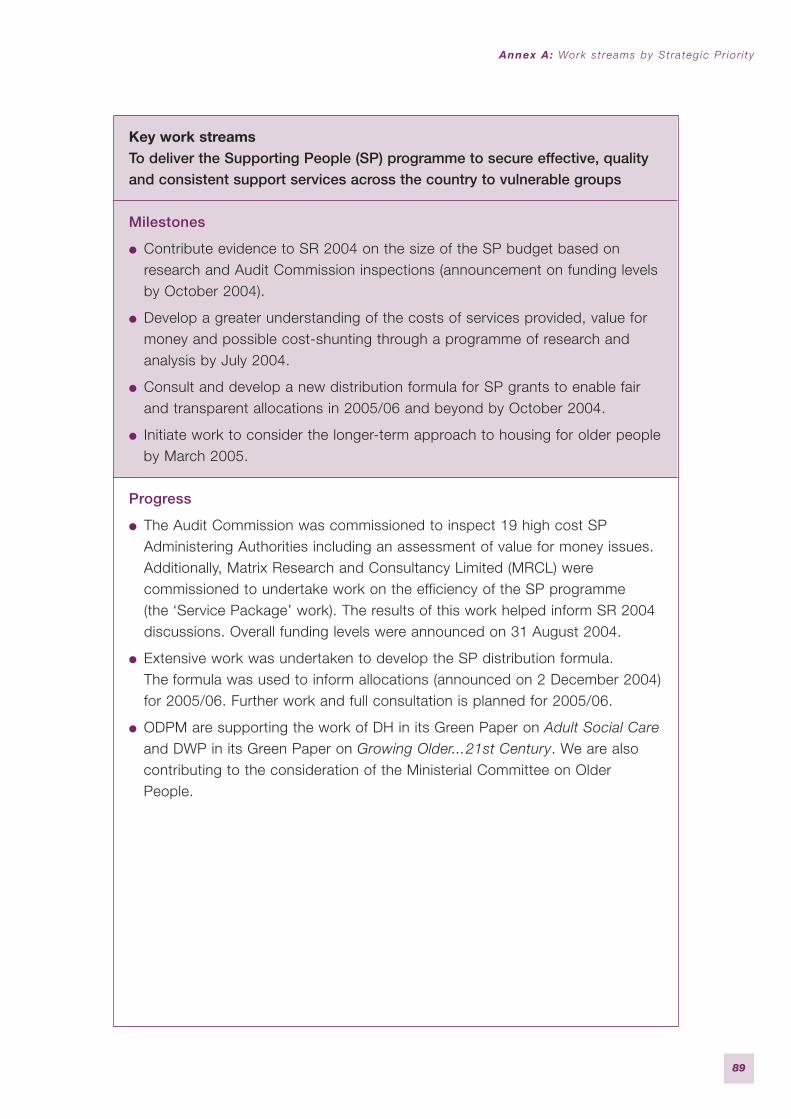
Key work streamsTo deliver the Supporting People (SP) programme to secure effective, qualityand consistent support services across the country to vulnerable groups
Milestones
● Contribute evidence to SR 2004 on the size of the SP budget based onresearch and Audit Commission inspections (announcement on funding levelsby October 2004).
● Develop a greater understanding of the costs of services provided, value formoney and possible cost-shunting through a programme of research andanalysis by July 2004.
● Consult and develop a new distribution formula for SP grants to enable fairand transparent allocations in 2005/06 and beyond by October 2004.
● Initiate work to consider the longer-term approach to housing for older peopleby March 2005.
Progress
● The Audit Commission was commissioned to inspect 19 high cost SPAdministering Authorities including an assessment of value for money issues.Additionally, Matrix Research and Consultancy Limited (MRCL) werecommissioned to undertake work on the efficiency of the SP programme(the ‘Service Package’ work). The results of this work helped inform SR 2004discussions. Overall funding levels were announced on 31 August 2004.
● Extensive work was undertaken to develop the SP distribution formula.The formula was used to inform allocations (announced on 2 December 2004)for 2005/06. Further work and full consultation is planned for 2005/06.
● ODPM are supporting the work of DH in its Green Paper on Adult Social Careand DWP in its Green Paper on Growing Older...21st Century. We are alsocontributing to the consideration of the Ministerial Committee on OlderPeople.
Annex A: Work s t reams by St ra teg ic Pr ior i ty
89
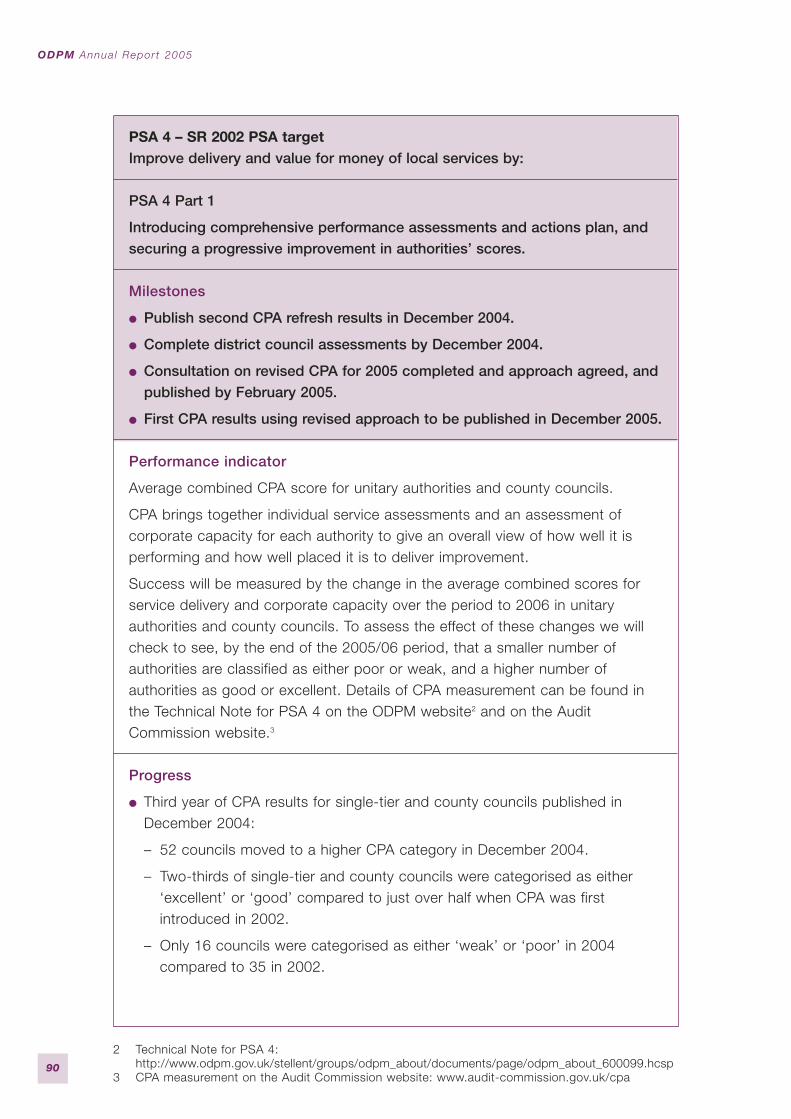
PSA 4 – SR 2002 PSA targetImprove delivery and value for money of local services by:
PSA 4 Part 1
Introducing comprehensive performance assessments and actions plan, andsecuring a progressive improvement in authorities’ scores.
Milestones
● Publish second CPA refresh results in December 2004.
● Complete district council assessments by December 2004.
● Consultation on revised CPA for 2005 completed and approach agreed, andpublished by February 2005.
● First CPA results using revised approach to be published in December 2005.
Performance indicator
Average combined CPA score for unitary authorities and county councils.
CPA brings together individual service assessments and an assessment ofcorporate capacity for each authority to give an overall view of how well it isperforming and how well placed it is to deliver improvement.
Success will be measured by the change in the average combined scores forservice delivery and corporate capacity over the period to 2006 in unitaryauthorities and county councils. To assess the effect of these changes we willcheck to see, by the end of the 2005/06 period, that a smaller number ofauthorities are classified as either poor or weak, and a higher number ofauthorities as good or excellent. Details of CPA measurement can be found inthe Technical Note for PSA 4 on the ODPM website2 and on the AuditCommission website.3
Progress
● Third year of CPA results for single-tier and county councils published inDecember 2004:
– 52 councils moved to a higher CPA category in December 2004.
– Two-thirds of single-tier and county councils were categorised as either‘excellent’ or ‘good’ compared to just over half when CPA was firstintroduced in 2002.
– Only 16 councils were categorised as either ‘weak’ or ‘poor’ in 2004compared to 35 in 2002.
ODPM Annua l Repor t 2005
90
2 Technical Note for PSA 4:http://www.odpm.gov.uk/stellent/groups/odpm_about/documents/page/odpm_about_600099.hcsp
3 CPA measurement on the Audit Commission website: www.audit-commission.gov.uk/cpa

– Of the 15 councils entering engagement with ODPM in 2002, only oneremains ‘poor’.
● The average combined score for service delivery and corporate capacity inunitary and county authorities was 69.87 in December 2002, 72.11 inDecember 2003 and 76.03 in December 2004.
● Results for 237 out of 238 District Council CPAs published by December2004 show that nearly half of all district councils (48%) were assessed aseither ‘excellent’ or ‘good’.
● Consultation on the revised CPA methodology has now been completed.A decision was taken to co-ordinate the rollout of CPA 2005 with that of JointArea Reviews of services for children and young people, and this hasinfluenced the timetable for delivery of the methodology.
● The joint ODPM/LGA capacity-building programme has now committed£32 million in support of local government improvement, which has includedthe launch of a new Local Government Leadership Centre.
● The role of regional directors of practice (RDPs) is now increasingly well-established in relation to poorly-performing authorities and in developing theoverall approach to capacity-building across all local authorities. Work on‘voluntary engagement’ has shown that a close relationship can be effectivewhere authorities are not in the bottom performance category. Furtherdevelopment of the role of RDPs and of more strategic relationship managementis being taken forward in the context of the local government strategy.
● Since December 2004, there have been an additional seven corporateassessments that have further improved the position. By the end of the year,the number of single-tier and county councils in each category as measuredby the CPA were: 46 excellent, 56 good, 33 fair, 14 weak and one poor.
● The Audit Commission is currently developing a new CPA methodology, inconjunction with central Government, to be implemented in 2005. Final detailsof the methodology will be announced later in the year.
Quality of data systems
The Audit Commission has an extensive database of CPA scores and analysisfor each authority accessible through its website.4 Best Value PerformanceIndicators (BVPIs) have been set annually for all local authorities since 2000/01.
External auditors appointed by the Audit Commission audit the data. It is alsoQuality Assured by the Audit Commission. ODPM has analysed and publishedaudited outturn data from 2000/01, 2001/02 and 2002/03 on the BVPI website5.
Annex A: Work s t reams by St ra teg ic Pr ior i ty
914 CPA scores and analysis: www.audit-commission.gov.uk/cpa5 BVPI website: www.bvpi.gov.uk
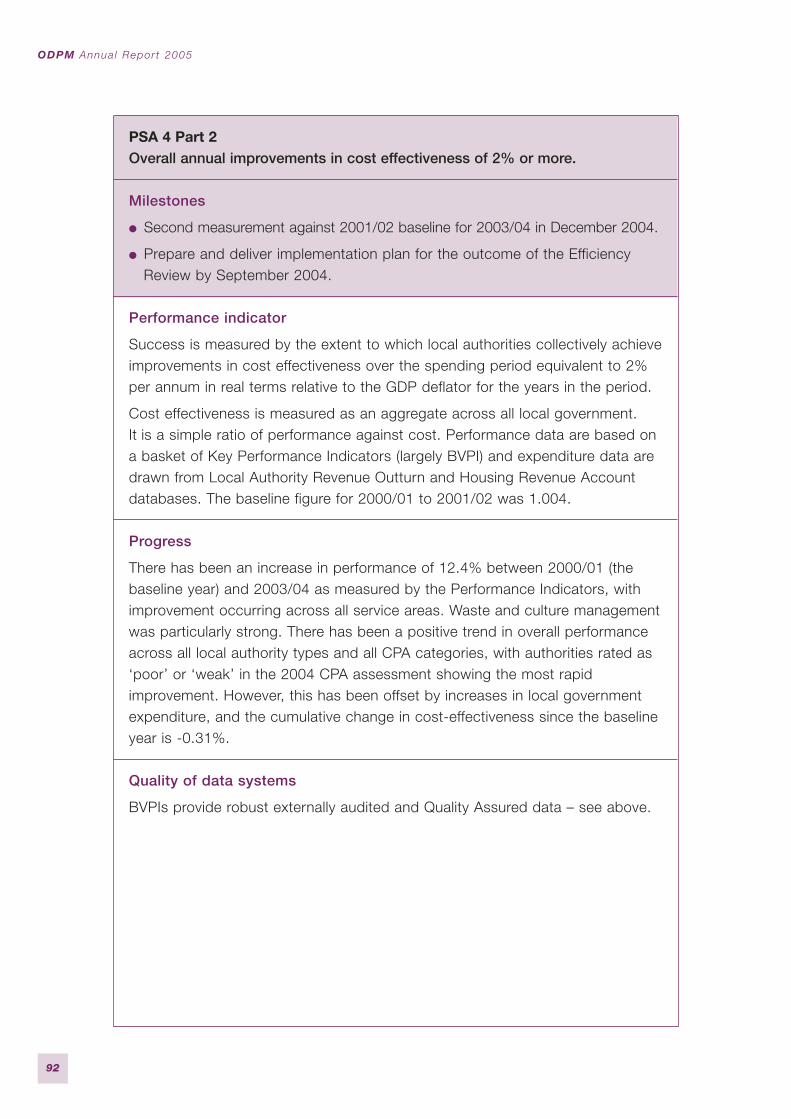
PSA 4 Part 2Overall annual improvements in cost effectiveness of 2% or more.
Milestones
● Second measurement against 2001/02 baseline for 2003/04 in December 2004.
● Prepare and deliver implementation plan for the outcome of the EfficiencyReview by September 2004.
Performance indicator
Success is measured by the extent to which local authorities collectively achieveimprovements in cost effectiveness over the spending period equivalent to 2%per annum in real terms relative to the GDP deflator for the years in the period.
Cost effectiveness is measured as an aggregate across all local government.It is a simple ratio of performance against cost. Performance data are based ona basket of Key Performance Indicators (largely BVPI) and expenditure data aredrawn from Local Authority Revenue Outturn and Housing Revenue Accountdatabases. The baseline figure for 2000/01 to 2001/02 was 1.004.
Progress
There has been an increase in performance of 12.4% between 2000/01 (thebaseline year) and 2003/04 as measured by the Performance Indicators, withimprovement occurring across all service areas. Waste and culture managementwas particularly strong. There has been a positive trend in overall performanceacross all local authority types and all CPA categories, with authorities rated as‘poor’ or ‘weak’ in the 2004 CPA assessment showing the most rapidimprovement. However, this has been offset by increases in local governmentexpenditure, and the cumulative change in cost-effectiveness since the baselineyear is -0.31%.
Quality of data systems
BVPIs provide robust externally audited and Quality Assured data – see above.
ODPM Annua l Repor t 2005
92
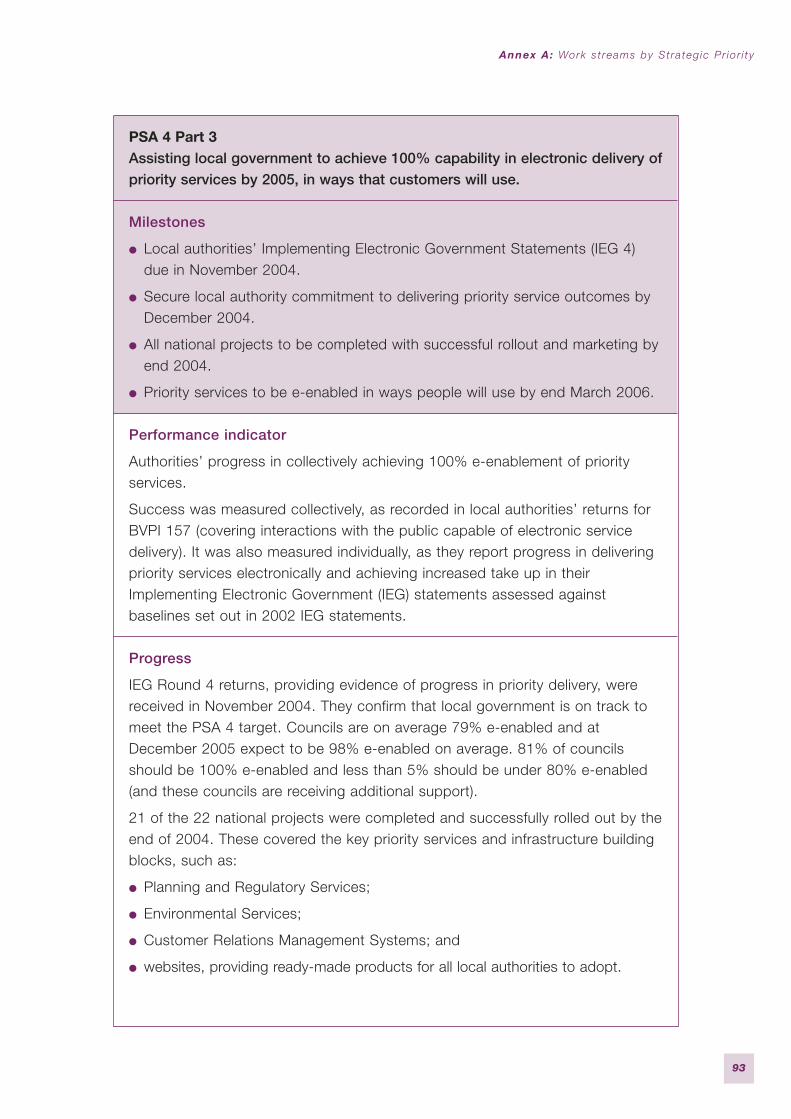
PSA 4 Part 3Assisting local government to achieve 100% capability in electronic delivery ofpriority services by 2005, in ways that customers will use.
Milestones
● Local authorities’ Implementing Electronic Government Statements (IEG 4)due in November 2004.
● Secure local authority commitment to delivering priority service outcomes byDecember 2004.
● All national projects to be completed with successful rollout and marketing byend 2004.
● Priority services to be e-enabled in ways people will use by end March 2006.
Performance indicator
Authorities’ progress in collectively achieving 100% e-enablement of priorityservices.
Success was measured collectively, as recorded in local authorities’ returns forBVPI 157 (covering interactions with the public capable of electronic servicedelivery). It was also measured individually, as they report progress in deliveringpriority services electronically and achieving increased take up in theirImplementing Electronic Government (IEG) statements assessed againstbaselines set out in 2002 IEG statements.
Progress
IEG Round 4 returns, providing evidence of progress in priority delivery, werereceived in November 2004. They confirm that local government is on track tomeet the PSA 4 target. Councils are on average 79% e-enabled and atDecember 2005 expect to be 98% e-enabled on average. 81% of councilsshould be 100% e-enabled and less than 5% should be under 80% e-enabled(and these councils are receiving additional support).
21 of the 22 national projects were completed and successfully rolled out by theend of 2004. These covered the key priority services and infrastructure buildingblocks, such as:
● Planning and Regulatory Services;
● Environmental Services;
● Customer Relations Management Systems; and
● websites, providing ready-made products for all local authorities to adopt.
Annex A: Work s t reams by St ra teg ic Pr ior i ty
93

The IEG programme is still on course for completion in March 2006. It will haveassisted local government in transforming services, renewing local democracy,promoting economic vitality and delivering e-Government. As a direct result of theprogramme, local authorities are on target to have e-enabled services to thepublic and modernised internal processes by December 2005.
Quality of data systems
BVPIs provide robust externally audited and Quality Assured data. IEGs areproduced by all local authorities and externally audited, and are then assessedby ODPM officials.
CSR PSA target An improvement in fire service efficiency of 2% a year through:
● increased co-operation and collaboration between fire brigades, includingsharing resources between them and other emergency services; and
● the introduction of modern standards of fire cover (subject to the outcomeof trials).
Milestones
● Establish Regional Management Boards (RMBs) in all English regions outsideLondon.
● Consult on National Procurement Strategy.
● FiReControl project – issue and receive responses to both theaccommodation Invitation to Tender (ITT) and infrastructure services Invitationto Submit Outline Proposals (ISOP). Prepare accommodation shortlists foreach region; and begin evaluation of ISOP responses.
● All Fire and Rescue Authorities (FRAs) in England to publish Year 2 IntegratedRisk Management Planning (IRMP) action plans.
● Develop and publish Fire Comprehensive Performance Assessmentframework.
Performance indicator
Fire and Rescue Service Best Value Performance Indicator (BVPI) data for2003/04 will be published in May 2005.
Progress
RMBs continued to prove a light-touch mechanism for FRAs to fulfil theirresponsibilities for securing public safety and improving economy, efficiency andeffectiveness, through collaboration in the six areas listed in the 2004/05 Fire
ODPM Annua l Repor t 2005
94
and Rescue National Framework (regional control centres, resilience,procurement, specialist services, training and human resources).
Production of the National Procurement Strategy for the Fire and RescueService and establishment of the entity FiReBuy to deliver key elements of thatStrategy is intended to rationalise procurement activity within the Service andallow the development of binding national specifications for key items ofoperational equipment. A draft National Procurement Strategy was publishedon 8 September 2004, with the consultation document following on30 September 2004. Consultation closed on 31 December 2004.
The FiReControl Project has progressed in consultation with Fire and RescueService personnel. Location criteria have been developed to ensure security,resilience and good working conditions. Site submissions were invited from bothpublic and private sector and shortlists prepared in each region.
A detailed specification for the control centre technology and infrastructure wasdrawn up and an ISOP issued to potential prime contractors. Responses to thisare under evaluation. It is intended to select a prime contract by autumn 2005.
Progress has been made on the financial and governance arrangements for thecontrol centres. A finance and governance working group, comprisingrepresentatives from ODPM, LGA and each type of Fire and Rescue Authority,met throughout summer 2004 and issued a consultation document in November2004. The ODPM responses to the comments received will be issued ascircumstances permit, and the working group is to be reconstituted to discusssome of the issues in more detail.
From April 2003, local IRMPs replaced the national standards of fire cover. IRMPsset out an authority’s assessment of local risk to life and how it will deploy itsresources to tackle that risk and improve the safety of all sections of society. In2004/05, all FRAs in England published their Year 2 action plans setting out howthey will make efficient and effective use of their resources in 2005/06, includingusing more efficient working practices where appropriate.
The Fire CPA framework was published in January 2005. Fire CPA is currentlybeing implemented across 46 FRAs, the outcome of which will be published inAugust 2005.
Quality of data systems
2% financial efficiency is already built into the annual revenue grant given to FRAs, asthis is deducted in advance.
However, new systems of validating efficiency are being put in place. For example,Fire CPA will help to broaden the concepts of – and evidence base for – efficiency.It will also include other measures, for example, quality of service delivered.The Key Lines of Enquiry used in CPA will consider FRAs’ capacity in terms of
Annex A: Work s t reams by St ra teg ic Pr ior i ty
95

resources and value for money, including how successful their financialmanagement arrangements are, as well as their delivery of value for money andpartnership working.
Key work streamsMaintain and develop a framework for local government finance, whichsupports local engagement and flexibility and the delivery of sharedgovernment priorities
Milestones
● Enable local government to operate flexibly and to plan effectively byminimising central controls, simplifying systems and reducing bureaucracy.
● Provide a stable long-term funding basis for local services.
● Provide a firm financial framework for economic development throughNon-Domestic Rates, Business Improvement Districts and Local AuthorityBusiness Growth Incentives.
● Maintain and modernise the grant distribution system and deliver the annualgrant settlement.
● Provide robust and timely statistics.
● Protect taxpayers’ money through stewardship of the Local GovernmentPension Scheme.
Performance Indicator
Provide robust and timely statistics
● Ensure that required deadlines and standards for statistical and administrativedata collections, and their dissemination, are met.
● Project-manage development of a new IT system for Revenue Support Grantcalculation.
● Establish robust analytical support function to support Sir Michael Lyons’inquiry into local government financing.
● Lead local government contribution to Whole of Government Accounts workprogramme.
Progress
Prudential borrowing
From April 2004 the Government introduced a new local government capitalfinance system, the Prudential System. This delivers a major new freedom forlocal government by removing the previous requirements under which authorities
ODPM Annua l Repor t 2005
96

could only borrow with specific Government permission. Authorities now taketheir own borrowing decisions, subject only to the borrowing being affordable.
This allows authorities to plan their capital programmes more efficiently and toundertake additional investment, including invest to save projects. Authoritieshave also been given new freedoms to enter into leasing arrangements and inthe financial investments that they can undertake.
Council tax
The Government has reduced pressures on council tax by £1 billion in 2005/06through providing more resources and by increasing flexibility, reducing ring-fencing and lessening obligations on local government. The total of ring-fencedgrants has been brought down from 11.1% in 2004/05 to 8.9% in 2005/6.Ministers made clear that they expected the average council tax increase inEngland to be less than 5% in 2005/06 and that they were prepared to use theircapping powers again if necessary. In the event, the average increase was 4.1%.
Balance of Funding Review and the Lyons Inquiry
For the longer term, the Balance of Funding Review, chaired by Nick Raynsford,reported on 20 July 2004. The Review concluded that council tax has importantadvantages as a local tax and should be retained, but that it needs reform toaddress its impact on those on low incomes and the impact of revaluation.The only way identified by the Review to achieve a major shift in the balance offunding is supplementing a reformed council tax with either re-localisedbusiness rates or a local income tax or a combination of both. None of theseoptions would be easy and further work would be required.
The Government agreed that council tax should be retained but reformed, and thatfurther work was required. It commissioned an independent inquiry, beingundertaken by Sir Michael Lyons, to consider the detailed case for changes to thepresent system of local government funding in England and to makerecommendations on any changes that are necessary and how to implement them.He is due to report to the Deputy Prime Minister and the Chancellor of theExchequer by the end of 2005.
Council tax revaluation 2007
We have continued to work closely with the Valuation Office Agency, inparticular on preparations for council tax revaluation in 2005, which will takeeffect in 2007. The structure of the council tax, for the purposes of revaluation,will be informed by the findings of the Lyons Inquiry. An ODPM official is theSenior Responsible Officer (SRO) for this important project.
Annex A: Work s t reams by St ra teg ic Pr ior i ty
97
Business rates
Arrangements have been put in place to provide for new valuations of allbusiness properties in England to take effect from 1 April 2005. A transitionalrelief scheme has been made to cushion the impact on bills for those whoserateable values have increased as a result of revaluation, and a special websitehas been set up jointly by ODPM and the Valuation Office Agency to provideinformation to business ratepayers. A new small business rate relief scheme,which will provide relief of up to 50% for qualifying businesses, has beendeveloped and will also take effect from 1 April 2005.
The Government has introduced Business Improvement Districts, which allowbusinesses in an area to vote to raise supplementary rates to pay for specificimprovements to their local areas. The enabling legislation was completed inSeptember and, by the end of March 2005, nine schemes had ballotedsuccessfully. Following a consultation exercise and a dry run, arrangementswere finalised for the new Local Authority Business Growth Incentives schemewhich will encourage authorities to work with business by allowing them to keeppart of the growth in local business rate revenue from 2005/06 onwards.
Provide robust and timely statistics
All survey outputs were produced to time, for use in the Local GovernmentFinance settlement and by the Office for National Statistics (ONS) and HMTreasury. Revenue outturn data supply was accelerated by two months.
We delivered, tested and signed-off a new RSG calculation system in March 2005.
The support team for the Lyons Inquiry was recruited and trained up, andanalytical models were ready to use by December 2004.
First dry run forms were issued to local authorities by March 2005.
Local Government Pension Scheme (LGPS)
The stocktake of the LGPS has, since 2001, developed a series of policy andregulatory changes for the Scheme to ensure its affordability and sustainability.A radical modernisation of the existing arrangements to bring forward a new-look LGPS for 2008 has already begun with the issue of a national consultationpaper in October 2004.
Key work streamsLocal government research
Milestones
Ensure effective use is made of research and analytical activity by ODPM andexternal stakeholders, and ensure a robust and reliable evidence base isproduced to inform the development, delivery and evaluation of all major localgovernment (LG) policies and initiatives.
ODPM Annua l Repor t 2005
98
Progress
● The 2004/05 local and regional government research programme consisted of69 projects. Within this, 28 new projects were to be set up and 27 projectswere to be completed.
The type of uses made of research on local government during 2004/05 include:
● in-house analytical work: measurement of PSA 4 cost-effectiveness targetand BVPI trends analysis; publication and analysis of user satisfaction BVPIdata and results; developing the methodology for the measurement of LGefficiency gains;
● research to support LG Strategy: underpinning evidence to neighbourhoodand leadership daughter documents and key research support on the futureof local services project and visioning;
● dissemination of research findings: through joint dissemination strategy withLGA, Audit Commission, IDeA, SOLACE and EO; via standard researchreports and seminars/presentations by contractors; via senior staffpresentations; and speeches by Ministers and members of the research unit;
● programme of process and impact evaluations on all aspects of the LGmodernisation agenda: contributing evidence to support policy thinking anddelivery on new council constitutions/political leadership, LAAs, LSPs,Intervention and Recovery Support;
● specific, ad-hoc pieces of research: on modelling transitional arrangementsand small business rate relief; central–local e-communications; LG equalityand diversity; and
● research-based advice and briefing: on topics as wide-ranging as barriers torecruitment of councillors, public attitudes towards LG and analysis of localauthority markets.
Quality of data systems
An external review of ODPM analytical activity undertaken during 2004/05 foundthat both internal and external stakeholders considered that effective use wasbeing made of research on LG and that it was providing a reliable evidencebase.
Annex A: Work s t reams by St ra teg ic Pr ior i ty
99
SR 2000 SDA targetTo ensure continuous improvements in customer satisfaction with the overallservice provided by their authority.
Milestones
Baseline established for 2000/01 in terms of Best Value Performance Indicator(BVPI) user satisfaction surveys carried out by all local authorities in England.These surveys – the general (covering corporate, environmental, waste,transport and cultural services), tenants’, planning, benefits’ and libraries’surveys – have been repeated in 2003/04.
Performance indicator
Statutory indicators of user satisfaction with local government and its servicesare contained within the 2003/04 BVPI suite. These repeat the same usersatisfaction indicators included in the 2000/01 set of BVPIs. These are:
(All local authorities in England need to monitor their performance against theseindicators)
Indicator Survey for collection
BV 3, BV 4, BV 89, BV 90, BV 103, BV 104, BV 119 General survey
BV 80 Benefits’ survey
BV 111 Planning survey
BV 118 Libraries’ survey
BV 74, BV 75 Tenants’ survey
Progress
The second triennial survey of LA customer satisfaction was completed in2003/04. National and regional aggregate results published on 30 June 2004show that the level of satisfaction with LAs overall has declined on average by10 percentage points over the past three years.
Results for different services are more mixed: with satisfaction declining in 7 ofthe 14 BVPIs collected by the survey, and increasing in the remaining 7indicators. Preliminary analysis shows that there is a relationship between feelingwell informed about an authority and being satisfied. Those who feel ‘very’ or‘fairly well informed’ are more likely to think that the authority has got betterover the last three years.
We have developed a work programme for improving customer satisfaction.This includes disseminating the results of the survey to LGs and holdingbi-laterals with Whitehall Departments; conducting further analysis of the
ODPM Annua l Repor t 2005
100

2003/04 results at a national level and developing a toolkit to help localauthorities analyse their own results; and developing ideas for improvingsatisfaction. We have established a cross-Whitehall project group to co-ordinateand oversee this work programme.
Development work has also started on an annual tracker survey to begin inspring 2005, which provide data between the three-yearly BVPI surveys and willinclude an in-depth qualitative study giving us a better understanding of whatdrives people’s views of satisfaction.
Tenant satisfaction continues to be monitored through the two national BestValue Indicators. BV 74 collects information on tenant satisfaction with overalllandlord service and BV 75 collects information on tenant satisfaction withopportunities for participation.
As stated in the SDA description, the data are required at least every threeyears (starting with 2000/01) and information was last collected in 2003/04.The Audit Commission collect and validate the data. However ODPM will beassessing the latest findings in due course and in particular looking for emergingtrends.
The target setting for these indicators is local.
Quality of data systems
External auditors appointed by the Audit Commission audit the data. It is alsoquality assured by the Audit Commission.
Annex A: Work s t reams by St ra teg ic Pr ior i ty
101
Maintaining Fire and Rescue Services
Report on Progress Against the Fire and Rescue National Framework
Under section 25 of the Fire and Rescue Services Act 2004, the Secretary ofState is required to report on progress against the Fire and Rescue NationalFramework.6
All Fire and Rescue Authorities (FRAs) published an Integrated RiskManagement Plan (IRMP) for their areas, following local consultation. Most FRAsare making use of the research embodied in the Fire Service Emergency CoverToolkit to support and inform their IRMP process.
From the information provided by some FRAs in connection with the Home FireRisk Check Initiative, 27 FRAs purchased and installed smoke alarms supportedby home fire risk checks and funded by the capital funding from ODPM in thelatter part of the year. Since October 2004, at least 90,000 smoke alarms havebeen installed through the Initiative. As reported in Evaluation of interventionswith arsonists and young firesetters (ODPM, 2005), 32 FRAs ran young firesetterprogrammes. In addition, 31 FRAs ran arson reduction initiatives funded by theArson Control Forum Implementation Fund.
Since the publication of the 2004/05 Fire and Rescue National Framework,Regional Management Boards have identified and begun taking forward thework required of them. Progress has been made in all areas, but has variedfrom region to region; Regional Management Boards have appointed regionalproject directors and regional project managers for the FiReControl project toestablish Regional Control Centres. They have also responded to ODPM’sconsultation on Finance and Governance and have indicated their preferredgovernance vehicle. Most actions are for later reporting periods. ODPM’sBusiness Change Managers have established links with key stakeholders in anumber of areas, such as Crime and Disorder Partnerships and Local StrategicPartnerships.
A number of co-responder schemes have been established by FRAs. Responseto major incidents, such as the flooding in Boscastle and in Carlisle, has shownthe Fire and Rescue Service working co-operatively with other emergencyservices, the Environment Agency and regional Government Offices. The CivilContingencies Act received Royal Assent on 18 November 2004. It delivers a
ODPM Annua l Repor t 2005
102
6 Section 25 reads:(1) The Secretary of State must report to Parliament on:
(a) the extent to which fire and rescue authorities are acting in accordance with the Frameworkprepared under section 21;
(b) any steps taken by him for the purpose of securing that fire and rescue authorities act inaccordance with the Framework.
(2) The first report under subsection (1) must be made before the end of the period of two yearsstarting on the date when the Framework as first prepared is brought into effect.
(3) Every subsequent such report must be made before the end of the period of two years startingon the date on which the last such report was made.
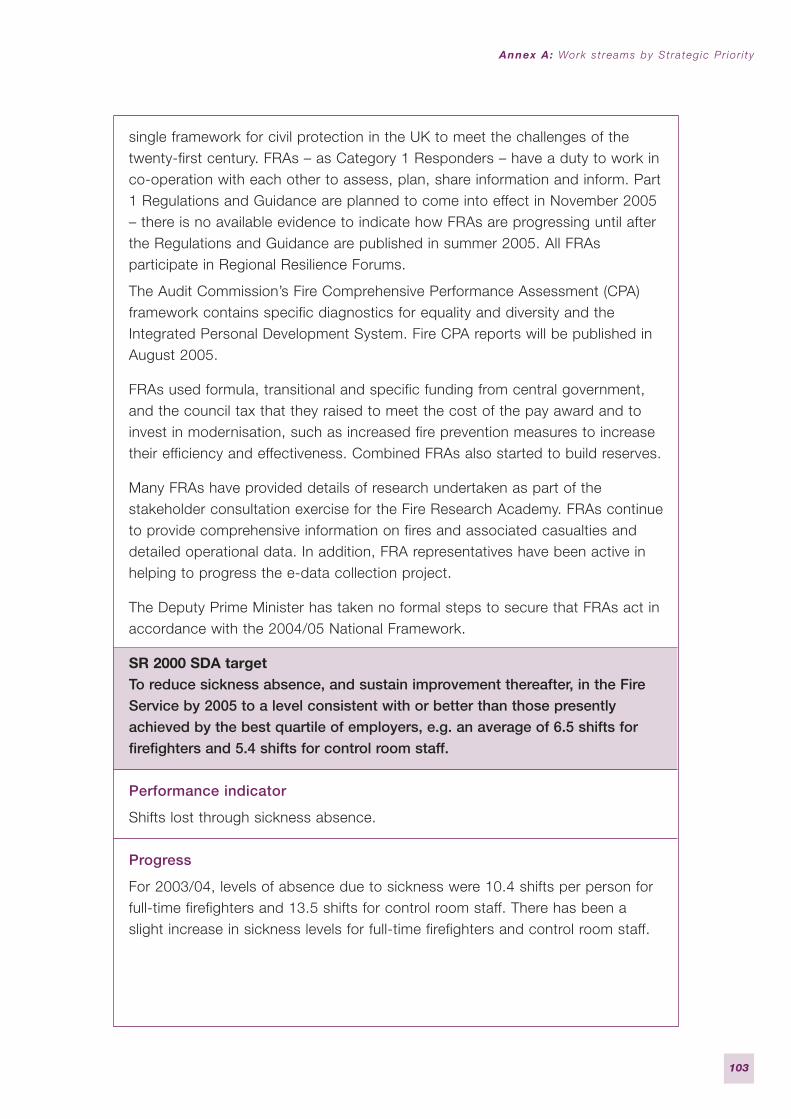
single framework for civil protection in the UK to meet the challenges of thetwenty-first century. FRAs – as Category 1 Responders – have a duty to work inco-operation with each other to assess, plan, share information and inform. Part1 Regulations and Guidance are planned to come into effect in November 2005– there is no available evidence to indicate how FRAs are progressing until afterthe Regulations and Guidance are published in summer 2005. All FRAsparticipate in Regional Resilience Forums.
The Audit Commission’s Fire Comprehensive Performance Assessment (CPA)framework contains specific diagnostics for equality and diversity and theIntegrated Personal Development System. Fire CPA reports will be published inAugust 2005.
FRAs used formula, transitional and specific funding from central government,and the council tax that they raised to meet the cost of the pay award and toinvest in modernisation, such as increased fire prevention measures to increasetheir efficiency and effectiveness. Combined FRAs also started to build reserves.
Many FRAs have provided details of research undertaken as part of thestakeholder consultation exercise for the Fire Research Academy. FRAs continueto provide comprehensive information on fires and associated casualties anddetailed operational data. In addition, FRA representatives have been active inhelping to progress the e-data collection project.
The Deputy Prime Minister has taken no formal steps to secure that FRAs act inaccordance with the 2004/05 National Framework.
SR 2000 SDA targetTo reduce sickness absence, and sustain improvement thereafter, in the FireService by 2005 to a level consistent with or better than those presentlyachieved by the best quartile of employers, e.g. an average of 6.5 shifts forfirefighters and 5.4 shifts for control room staff.
Performance indicator
Shifts lost through sickness absence.
Progress
For 2003/04, levels of absence due to sickness were 10.4 shifts per person forfull-time firefighters and 13.5 shifts for control room staff. There has been aslight increase in sickness levels for full-time firefighters and control room staff.
Annex A: Work s t reams by St ra teg ic Pr ior i ty
103
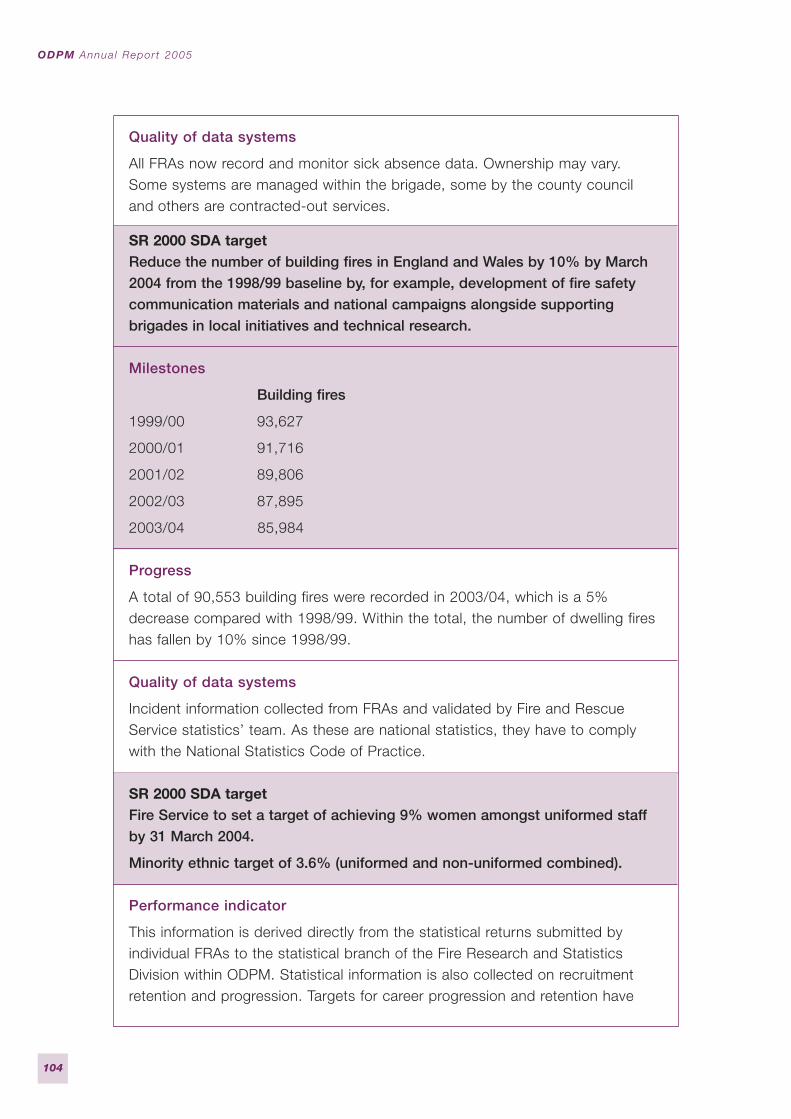
Quality of data systems
All FRAs now record and monitor sick absence data. Ownership may vary.Some systems are managed within the brigade, some by the county counciland others are contracted-out services.
SR 2000 SDA targetReduce the number of building fires in England and Wales by 10% by March2004 from the 1998/99 baseline by, for example, development of fire safetycommunication materials and national campaigns alongside supportingbrigades in local initiatives and technical research.
Milestones
Building fires
1999/00 93,627
2000/01 91,716
2001/02 89,806
2002/03 87,895
2003/04 85,984
Progress
A total of 90,553 building fires were recorded in 2003/04, which is a 5%decrease compared with 1998/99. Within the total, the number of dwelling fireshas fallen by 10% since 1998/99.
Quality of data systems
Incident information collected from FRAs and validated by Fire and RescueService statistics’ team. As these are national statistics, they have to complywith the National Statistics Code of Practice.
SR 2000 SDA targetFire Service to set a target of achieving 9% women amongst uniformed staffby 31 March 2004.
Minority ethnic target of 3.6% (uniformed and non-uniformed combined).
Performance indicator
This information is derived directly from the statistical returns submitted byindividual FRAs to the statistical branch of the Fire Research and StatisticsDivision within ODPM. Statistical information is also collected on recruitmentretention and progression. Targets for career progression and retention have
ODPM Annua l Repor t 2005
104
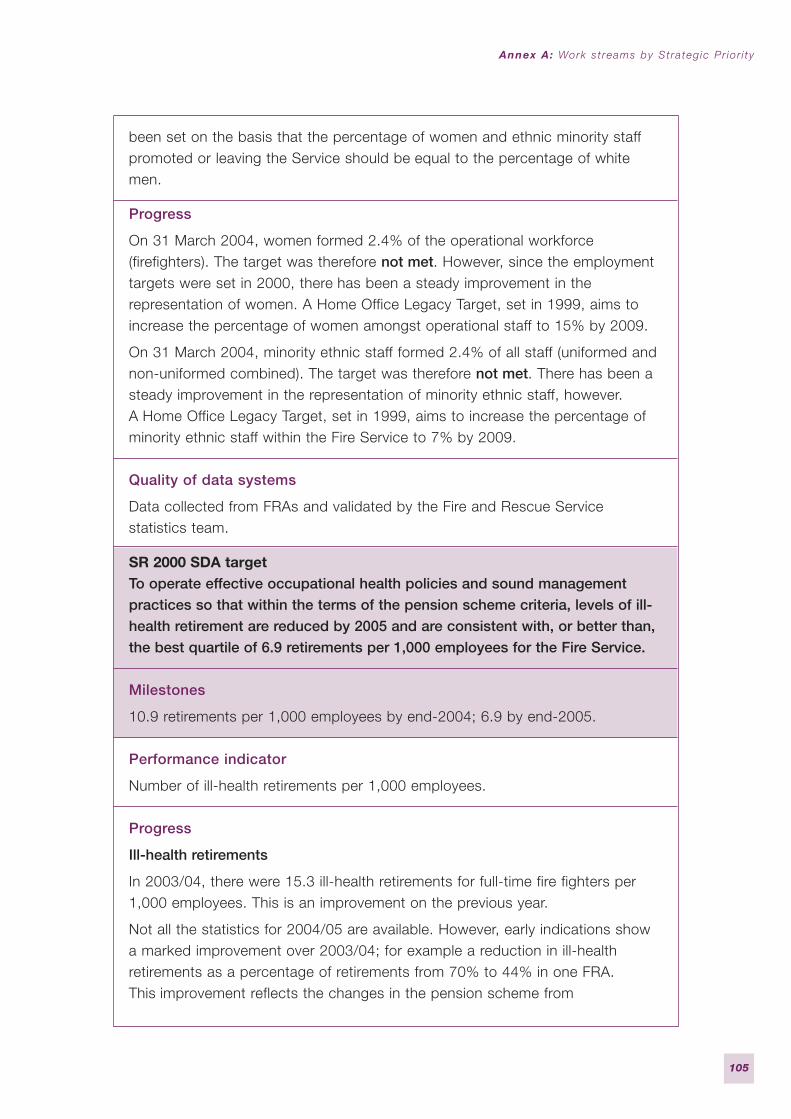
been set on the basis that the percentage of women and ethnic minority staffpromoted or leaving the Service should be equal to the percentage of whitemen.
Progress
On 31 March 2004, women formed 2.4% of the operational workforce(firefighters). The target was therefore not met. However, since the employmenttargets were set in 2000, there has been a steady improvement in therepresentation of women. A Home Office Legacy Target, set in 1999, aims toincrease the percentage of women amongst operational staff to 15% by 2009.
On 31 March 2004, minority ethnic staff formed 2.4% of all staff (uniformed andnon-uniformed combined). The target was therefore not met. There has been asteady improvement in the representation of minority ethnic staff, however.A Home Office Legacy Target, set in 1999, aims to increase the percentage ofminority ethnic staff within the Fire Service to 7% by 2009.
Quality of data systems
Data collected from FRAs and validated by the Fire and Rescue Servicestatistics team.
SR 2000 SDA targetTo operate effective occupational health policies and sound managementpractices so that within the terms of the pension scheme criteria, levels of ill-health retirement are reduced by 2005 and are consistent with, or better than,the best quartile of 6.9 retirements per 1,000 employees for the Fire Service.
Milestones
10.9 retirements per 1,000 employees by end-2004; 6.9 by end-2005.
Performance indicator
Number of ill-health retirements per 1,000 employees.
Progress
Ill-health retirements
In 2003/04, there were 15.3 ill-health retirements for full-time fire fighters per1,000 employees. This is an improvement on the previous year.
Not all the statistics for 2004/05 are available. However, early indications showa marked improvement over 2003/04; for example a reduction in ill-healthretirements as a percentage of retirements from 70% to 44% in one FRA.This improvement reflects the changes in the pension scheme from
Annex A: Work s t reams by St ra teg ic Pr ior i ty
105

13 September 2004, which allow the redeployment of firefighters to non-operational roles.
Quality of data systems
Returns were validated by:
● checking that no data was missing;
● correlating different returns from the same brigade; and
● looking at the previous year’s return for any major differences.
ODPM Annua l Repor t 2005
106
Civil resilience
The Civil Resilience Directorate (CRD) was established in June 2003 to co-ordinate ODPM resilience programmes. Resilience means ensuring that thecountry is well prepared to detect, prevent and respond to major emergencies,including terrorist attacks.
Key work streamsResilience Policy
Milestones
● To ensure that ODPM is prepared to respond effectively to any contingency.
● To have robust contingency plans for disposal of rubble and other debris froma catastrophic incident by autumn 2004.
● To achieve better contingency planning arrangements by:
– completing a secure communications room by May 2004;
– preparing a Civil Contingencies Manual by June 2004; and
– establishing a suitably equipped Emergency Operations Centre by June 2004.
Performance indicator
Performance is measured against the delivery of programme milestones.In particular:
● completion of consultation and scoping on the disposal of rubble;
● completion of secure communications room;
● provision of first draft of Civil Contingencies Manual for internal review; and
● completion of procurement and operation procedures for EmergencyOperations Centre.
Progress
Since its establishment CRD has ensured that ODPM is fully involved in theGovernment’s resilience agenda. We have lead on providing the FRS with thecapabilities to respond to major catastrophic incidents. The introduction of theFire and Rescue Services Act 2004 provided the Fire and Rescue Service withthe statutory cover to respond to such incidents. We have been working closelywith the Fire and Rescue Services and other stakeholders to determine the detailas to the nature of the emergencies to which they should respond.
Within the department, we have updated our own response capabilities.
Annex A: Work s t reams by St ra teg ic Pr ior i ty
107

A secure communication room was completed on time in May 2004.All procurement, planning and operating procedures for the EmergencyOperations Centre are also complete and training is underway for staff.
The Civil Contingencies manual was prepared for July 2004 and is now beingrefined and revised.
Guidance on the disposal of rubble is being revised and refined. The revisionsfocus on satisfying stakeholders over the most effective risk assessment processfor delivering an effective response. The revised guidance will be rolled out inspring 2005.
Quality of data
Data are drawn from programme management activity and ongoing monitoringagainst programme milestones. As yet no formal quantitative measures are inplace.
Key work streamsNew Dimension – Phase II
Milestones
● To enhance the resilience capability of the UK Fire and Rescue Service bydelivering urban search and rescue equipment and training.
● To develop the interim National Co-ordinating Centre (NCC) which will beresponsible for managing a national crisis involving the deployment of NewDimension equipment.
● To begin the rollout of Detection, Identification and Monitoring (DIM)equipment from April 2004.
● To provide high volume pumping equipment with an initial capability fromJuly 2004.
● To provide interim urban search and rescue vehicles to the Fire and RescueService in London, South West and North East regions by summer 2004.
● To contract for the provision of a comprehensive water safety programme forthe Fire and Rescue Service by September 2004.
● To begin the rollout of permanent urban search and rescue vehicles fromNovember 2004.
Performance indicator
Performance is measured against the delivery of programme milestones:
● Delivery of interim urban search and rescue capability into service.
● Acquisition and rollout of high volume pumping equipment into service.
ODPM Annua l Repor t 2005
108
● DIM training and equipment into each region.
● Delivery in service of Prime Movers.
● Interim NCC operational.
Progress
● Targets on urban search and rescue equipment were met and exceeded withurban search and rescue capability delivered to all regions.
● 10 initial high volume pumps are now in service and initial DIM basic detectioncapability has been rolled out in the regions.
● The interim NCC became operational in April 2004 for incident response unittracking. This enables the central management of incident response.
● The module contract was awarded in February 2004.
Quality of data
Data are drawn from programme management information. Equipment numbersare taken from procurement data.
Key work streamsFirelink
Milestones
● To deliver a wide-area radio system which delivers interoperability within theFire and Rescue Service and between Fire and Rescue Service and the otheremergency services.
● Begin construction of the network in the first region by November 2004:
– complete construction of network in five further areas by the end of 2005.
Performance indicator
● Invitations to be issued to the bidders in March 2005 for them to submit theirbest and final offers, with a view to evaluating the submissions and awardingto contract by June 2005.
● Programmes to be completed to ensure the continuing effectiveness ofexisting radio systems until the replacement system is introduced.
Annex A: Work s t reams by St ra teg ic Pr ior i ty
109

Progress
Good progress is being made in most areas.
The programme involves the procurement of a national wide area radio systemfor England, Wales and Scotland with planned completion by the end of 2008.The project also includes operational continuity of existing systems untilcompletion of the Firelink roll-out.
Firelink will replace the wide area radio systems currently operated by the Fireand Rescue Service in England, Scotland and Wales with a new digital one,providing capabilities for national roaming and inter-operability both betweenbrigades and with the other blue light emergency services. The competition toselect a supplier is progressing behind the originally announced schedule, but isplanned to have the new system in place and operational by the end of 2008.
The National Channel Plan has been achieved and existing systems remainoperation as new systems come online. There has been some slight delay aroundthe completion of negotiations with potential suppliers, although two strongpotential suppliers have been identified and are competing for the Firelink contract.Contract Award is now targeted for May 2005.
Quality of data
Data are drawn from programme management information. No formalquantitative data are gathered for the programme at present.
Key work streamsRegional resilience
Milestones
● Develop methodology to be used in assessing risk at both national andregional level.
● To deliver plans for enhancing regional resilience in each region.
● To ensure the risk assessment methodology is complete by late summer2004.
● To analyse regional risk by the autumn of 2004.
● To develop regional delivery plans to enhance resilience by late autumn 2004.
● To complete implementation of regional delivery plans, which is alreadyongoing.
Performance indicator
Indicators are drawn against the delivery of the milestones.
ODPM Annua l Repor t 2005
110

Progress
● Methodology for risk assessments was agreed and rolled out across theregions in autumn 2004.
● Regional risk assessment completed in January 2005.
● Development of regional delivery plans delayed pending further work by leadgovernment departments. Now due to be agreed in spring 2005.
Quality of data
Data are reported against programme milestones from programme managementinformation. No formal quantitative measures are in place at present.
Annex A: Work s t reams by St ra teg ic Pr ior i ty
111
Strategic Priority 5
Promoting the development of English regions
PSA 2 – SR 2002 PSA targetMake sustainable improvements in the economic performance of all Englishregions and over the long-term reduce the persistent gap in growth ratesbetween the regions, defining measures to improve performance andreporting progress against these measures by 2006.
Joint target with HM Treasury and DTI.
Milestone
Identification of six to ten key measures to improve economic performance,to be published by July 2004.
Performance indicator
The headline measure for this PSA target is the trend rate of growth in GrossValue Added (GVA) per head. Trend growth for the baseline 1989–2002 period,for individual regions and for the top three and bottom six regions, is available onthe ODPM, DTI and HM Treasury websites. The gap in the growth rates will bemeasured by comparing the average growth rate of regions that currently haveabove average GVA per head (top three regions) with the regions that currentlyhave below average GVA per head (bottom six regions). This measurementinvolves comparing average growth for London, South East and East withaverage growth for North East, North West, Yorkshire and the Humber, WestMidlands, East Midlands and South West, weighted by population. Measurementof trend rates of growth per head will use a similar methodology to that used byHM Treasury to estimate national trend GDP growth, i.e. by calculating averagegrowth rates between points when the national economy can be identified asbeing ‘on trend’. For the baseline period, this involves looking at average growthbetween 1990/91 and 2001. As the baseline data show that trend growth in thethree leading regions (in cash terms) was 5.2%, and 4.7% in the six laggingregions, the gap in growth rates is 0.5 percentage points.
As well as comparing the growth rates between these aggregations of regions,growth rates for individual regions will also be monitored to ensure that the partof the target that requires the performance of all regions to improve is being met.
Supporting indicators, including business surveys, employment statistics,unemployment rates, earnings growth, VAT registrations, and other indicators ofthe performance of the five drivers of productivity, are available to monitorperformance, and will inform updates of performance, at six-monthly intervals.Improvements in the majority of these indicators (taking into account cyclical
ODPM Annua l Repor t 2005
112
influences) will be considered as evidence that progress is on track. An overallassessment of progress will also be made in 2006 with the latest data for GVAand other indicators then available. Where the indicators are not NationalStatistics, the indicators will be checked internally and agreed between thethree departments. A suite of indicators to track progress on the PSA areavailable at www.rcu.gov.uk/reppsa
Progress
Significant progress has been made with the delivery of the Regional EconomicPerformance PSA over the past year:
● The identification of key measures to improve regional economic performance,based around the key drivers of economic growth – employment, skills,innovation, enterprise, investment and competition. These measures werepublished in the Technical Note for the PSA in July 2004 which can be viewedon the ODPM, DTI and HM Treasury websites.
● The publication of a summary of the background research by FrontierEconomics that underpinned the work to develop these measures, which canbe viewed on the regional overview section of the ODPM website.
● The publication, at the Sustainable Communities Summit on 1 February 2005,of Realising the Potential of All Our Regions: the way forward which sets outhow the Government and RDAs are working together to deliver the REP PSA.Realising the Potential of All Our Regions: the story so far, which describesthe measures already in place in more detail, is available on the ODPMwebsite.
● The establishment of three demonstration projects to deliver some of the keyPSA policy propositions on: addressing inactivity in the North East, especiallyamongst the sick and disabled; encouraging enterprise in the North West;and improving skills in Yorkshire and Humberside.
● The Secretaries of State for Education and Skills, for Transport, and for Workand Pensions have set out their commitment to seek to: reduce regional skillsdisparities; narrow regional disparities in employment rates; and to ensurethat our transport system fully supports improved regional economicperformance.
It is early days in the delivery of the PSA, but already we have:
● announced that we will match fund the RDAs’ contribution to create a£100 million Northern Way Investment Fund to help close a £29 billionproductivity gap with the rest of the country. This was alongside thepublication of Moving Forward: The Northern Way, on 20 September 2004.Smart Growth: The Midlands Way and The Way Ahead: Delivering sustainable
Annex A: Work s t reams by St ra teg ic Pr ior i ty
113

communities in the South West were both published by the RDAs for thoseregions in January 2005;
● devolved responsibility to the RDAs for the delivery of Business Link services,R&D grants, business university links and promoting enterprise indisadvantaged areas from April 2005;
● given the RDAs substantial funding flexibility to allow them to respond toregional priorities and increase their funding from £1.6 billion in 2002/03 to£2.3 billion in 2007/08;
● will be investing £11 billion per year by 2007/08 on post-16 education andskills (excluding HE) across the English regions and enabling the RDA ChiefExecutive and Regional Local Skills Council Director in each region to adoptjoint budgeting and planning of the adult skills budget, where they want it.(In the three Northern regions, this is worth £634 million in 2004/05);
● announced that the Government will examine new ways to integratetransport, economic and spatial development strategies in each region,within a framework of indicative funding allocations for each region; and
● announced an expansion to the ‘Pathways to Work’ pilots – an initiative tohelp people on Incapacity Benefit into work.
The target period started 1 January 2003. In general, it is too early and thereis too little data on the GVA or key drivers of economic growth to drawconclusions on movements or trends. However, early indications are that:
● unemployment is decreasing and employment rates are up in the North;
● the North, Midlands and South West all saw increases in business start-uprates, and general entrepreneurial activity has risen;
● Northern service sector firms have increased their operating rate; and
● the number of pupils with five or more GCSEs has increased in all regions.
Quality of data
To measure performance against the regional economic performance target, thetrend rate of growth in Gross Value Added (GVA) per head in each region will beestimated for the period 2003–2008. The gap in growth rates will be measuredby comparing the average growth rate of regions that currently have aboveaverage GVA per head with the average growth rate of regions that currentlyhave below average GVA per head. Annual GVA per head data for each regionare only available after a 12-month lag so performance against this target will bereported in 2010.
The publication in March 2004 of Productivity in the UK 5: Benchmarking UKproductivity performance proposed the publication of a suite of national andregional productivity indicators to help keep track of delivery of the PSA. The
ODPM Annua l Repor t 2005
114
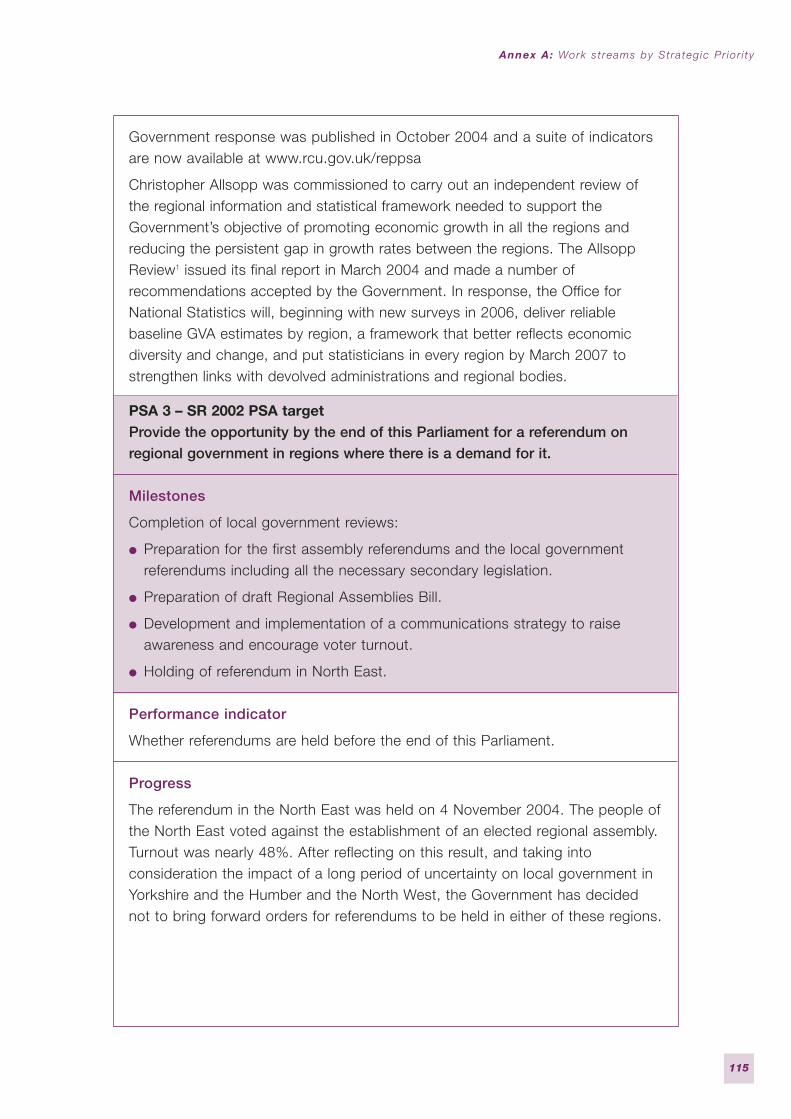
Government response was published in October 2004 and a suite of indicatorsare now available at www.rcu.gov.uk/reppsa
Christopher Allsopp was commissioned to carry out an independent review ofthe regional information and statistical framework needed to support theGovernment’s objective of promoting economic growth in all the regions andreducing the persistent gap in growth rates between the regions. The AllsoppReview1 issued its final report in March 2004 and made a number ofrecommendations accepted by the Government. In response, the Office forNational Statistics will, beginning with new surveys in 2006, deliver reliablebaseline GVA estimates by region, a framework that better reflects economicdiversity and change, and put statisticians in every region by March 2007 tostrengthen links with devolved administrations and regional bodies.
PSA 3 – SR 2002 PSA targetProvide the opportunity by the end of this Parliament for a referendum onregional government in regions where there is a demand for it.
Milestones
Completion of local government reviews:
● Preparation for the first assembly referendums and the local governmentreferendums including all the necessary secondary legislation.
● Preparation of draft Regional Assemblies Bill.
● Development and implementation of a communications strategy to raiseawareness and encourage voter turnout.
● Holding of referendum in North East.
Performance indicator
Whether referendums are held before the end of this Parliament.
Progress
The referendum in the North East was held on 4 November 2004. The people ofthe North East voted against the establishment of an elected regional assembly.Turnout was nearly 48%. After reflecting on this result, and taking intoconsideration the impact of a long period of uncertainty on local government inYorkshire and the Humber and the North West, the Government has decidednot to bring forward orders for referendums to be held in either of these regions.
Annex A: Work s t reams by St ra teg ic Pr ior i ty
115
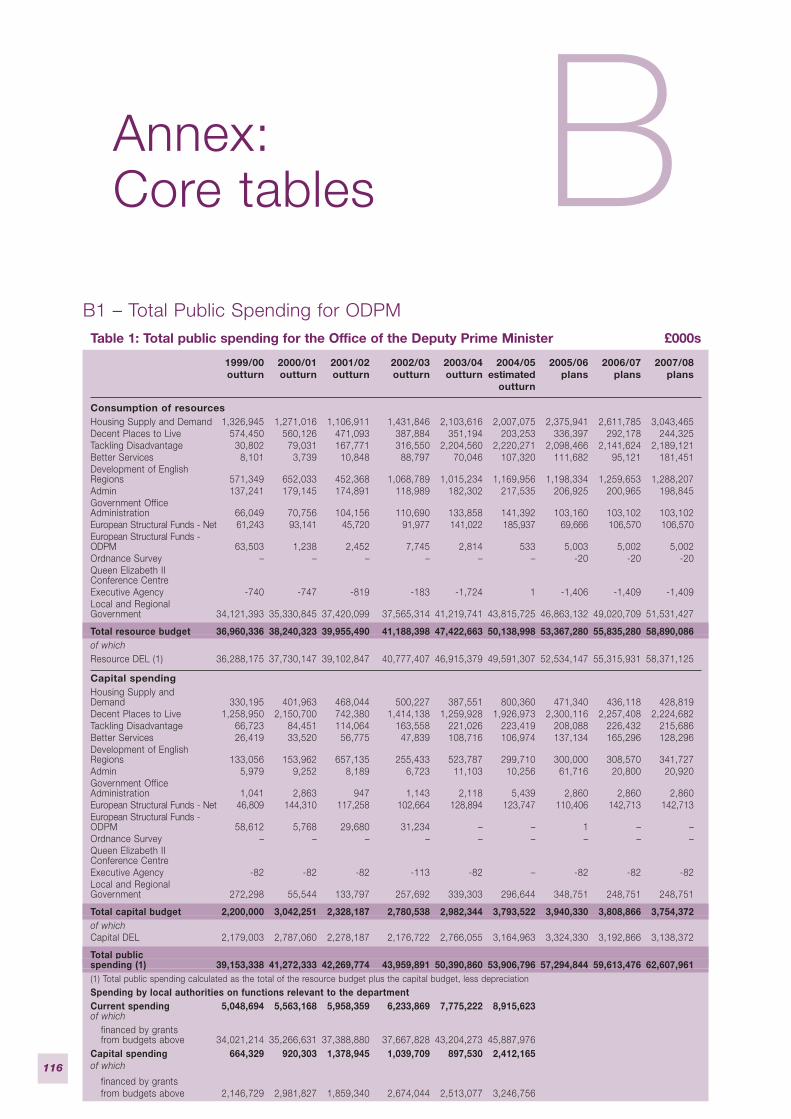
116
B1 – Total Public Spending for ODPMTable 1: Total public spending for the Office of the Deputy Prime Minister £000s
1999/00 2000/01 2001/02 2002/03 2003/04 2004/05 2005/06 2006/07 2007/08outturn outturn outturn outturn outturn estimated plans plans plans
outturn
Consumption of resourcesHousing Supply and Demand 1,326,945 1,271,016 1,106,911 1,431,846 2,103,616 2,007,075 2,375,941 2,611,785 3,043,465Decent Places to Live 574,450 560,126 471,093 387,884 351,194 203,253 336,397 292,178 244,325Tackling Disadvantage 30,802 79,031 167,771 316,550 2,204,560 2,220,271 2,098,466 2,141,624 2,189,121Better Services 8,101 3,739 10,848 88,797 70,046 107,320 111,682 95,121 181,451Development of English Regions 571,349 652,033 452,368 1,068,789 1,015,234 1,169,956 1,198,334 1,259,653 1,288,207Admin 137,241 179,145 174,891 118,989 182,302 217,535 206,925 200,965 198,845Government Office Administration 66,049 70,756 104,156 110,690 133,858 141,392 103,160 103,102 103,102European Structural Funds - Net 61,243 93,141 45,720 91,977 141,022 185,937 69,666 106,570 106,570European Structural Funds - ODPM 63,503 1,238 2,452 7,745 2,814 533 5,003 5,002 5,002Ordnance Survey – – – – – – -20 -20 -20Queen Elizabeth II Conference CentreExecutive Agency -740 -747 -819 -183 -1,724 1 -1,406 -1,409 -1,409Local and Regional Government 34,121,393 35,330,845 37,420,099 37,565,314 41,219,741 43,815,725 46,863,132 49,020,709 51,531,427
Total resource budget 36,960,336 38,240,323 39,955,490 41,188,398 47,422,663 50,138,998 53,367,280 55,835,280 58,890,086of whichResource DEL (1) 36,288,175 37,730,147 39,102,847 40,777,407 46,915,379 49,591,307 52,534,147 55,315,931 58,371,125
Capital spendingHousing Supply and Demand 330,195 401,963 468,044 500,227 387,551 800,360 471,340 436,118 428,819Decent Places to Live 1,258,950 2,150,700 742,380 1,414,138 1,259,928 1,926,973 2,300,116 2,257,408 2,224,682Tackling Disadvantage 66,723 84,451 114,064 163,558 221,026 223,419 208,088 226,432 215,686Better Services 26,419 33,520 56,775 47,839 108,716 106,974 137,134 165,296 128,296Development of English Regions 133,056 153,962 657,135 255,433 523,787 299,710 300,000 308,570 341,727Admin 5,979 9,252 8,189 6,723 11,103 10,256 61,716 20,800 20,920Government Office Administration 1,041 2,863 947 1,143 2,118 5,439 2,860 2,860 2,860European Structural Funds - Net 46,809 144,310 117,258 102,664 128,894 123,747 110,406 142,713 142,713European Structural Funds - ODPM 58,612 5,768 29,680 31,234 – – 1 – –Ordnance Survey – – – – – – – – –Queen Elizabeth II Conference CentreExecutive Agency -82 -82 -82 -113 -82 – -82 -82 -82Local and Regional Government 272,298 55,544 133,797 257,692 339,303 296,644 348,751 248,751 248,751
Total capital budget 2,200,000 3,042,251 2,328,187 2,780,538 2,982,344 3,793,522 3,940,330 3,808,866 3,754,372of whichCapital DEL 2,179,003 2,787,060 2,278,187 2,176,722 2,766,055 3,164,963 3,324,330 3,192,866 3,138,372
Total public spending (1) 39,153,338 41,272,333 42,269,774 43,959,891 50,390,860 53,906,796 57,294,844 59,613,476 62,607,961(1) Total public spending calculated as the total of the resource budget plus the capital budget, less depreciation
Spending by local authorities on functions relevant to the departmentCurrent spending 5,048,694 5,563,168 5,958,359 6,233,869 7,775,222 8,915,623of which
financed by grants from budgets above 34,021,214 35,266,631 37,388,880 37,667,828 43,204,273 45,887,976
Capital spending 664,329 920,303 1,378,945 1,039,709 897,530 2,412,165of which
financed by grants from budgets above 2,146,729 2,981,827 1,859,340 2,674,044 2,513,077 3,246,756
Annex:Core tables B
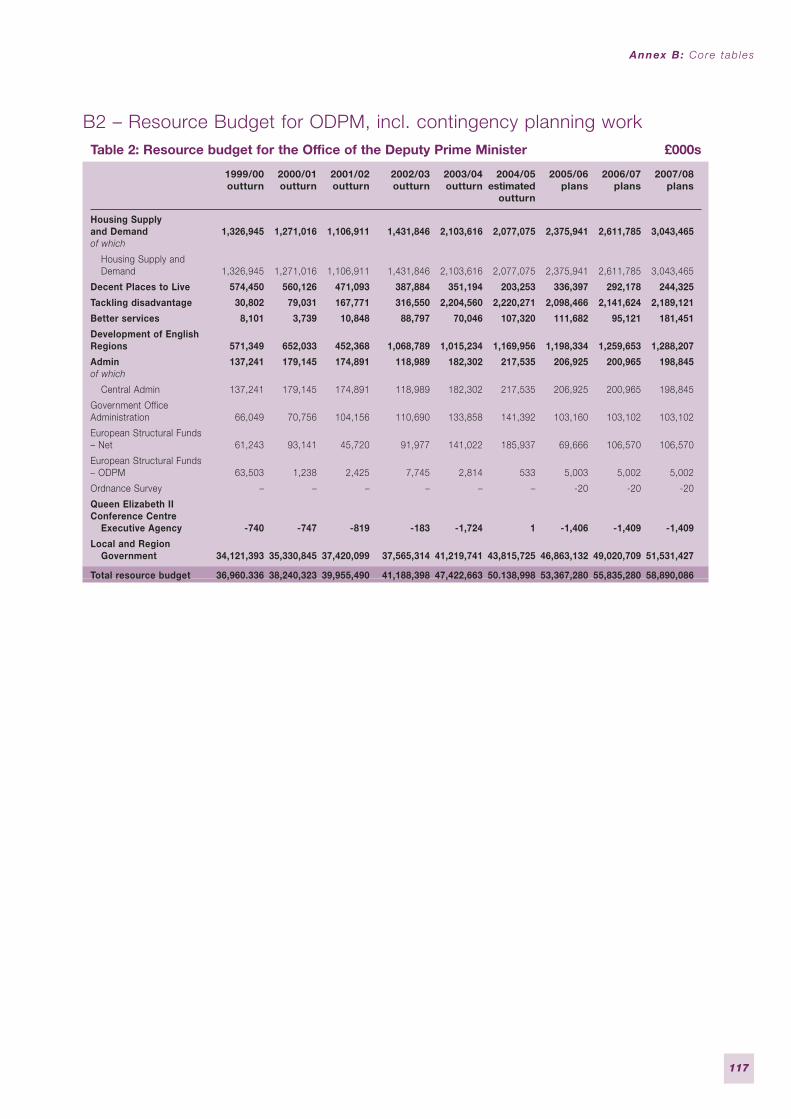
B2 – Resource Budget for ODPM, incl. contingency planning workTable 2: Resource budget for the Office of the Deputy Prime Minister £000s
1999/00 2000/01 2001/02 2002/03 2003/04 2004/05 2005/06 2006/07 2007/08outturn outturn outturn outturn outturn estimated plans plans plans
outturn
Housing Supply and Demand 1,326,945 1,271,016 1,106,911 1,431,846 2,103,616 2,077,075 2,375,941 2,611,785 3,043,465of which
Housing Supply and Demand 1,326,945 1,271,016 1,106,911 1,431,846 2,103,616 2,077,075 2,375,941 2,611,785 3,043,465
Decent Places to Live 574,450 560,126 471,093 387,884 351,194 203,253 336,397 292,178 244,325
Tackling disadvantage 30,802 79,031 167,771 316,550 2,204,560 2,220,271 2,098,466 2,141,624 2,189,121
Better services 8,101 3,739 10,848 88,797 70,046 107,320 111,682 95,121 181,451
Development of English Regions 571,349 652,033 452,368 1,068,789 1,015,234 1,169,956 1,198,334 1,259,653 1,288,207
Admin 137,241 179,145 174,891 118,989 182,302 217,535 206,925 200,965 198,845of which
Central Admin 137,241 179,145 174,891 118,989 182,302 217,535 206,925 200,965 198,845
Government OfficeAdministration 66,049 70,756 104,156 110,690 133,858 141,392 103,160 103,102 103,102
European Structural Funds – Net 61,243 93,141 45,720 91,977 141,022 185,937 69,666 106,570 106,570
European Structural Funds – ODPM 63,503 1,238 2,425 7,745 2,814 533 5,003 5,002 5,002
Ordnance Survey – – – – – – -20 -20 -20
Queen Elizabeth II Conference Centre
Executive Agency -740 -747 -819 -183 -1,724 1 -1,406 -1,409 -1,409
Local and Region Government 34,121,393 35,330,845 37,420,099 37,565,314 41,219,741 43,815,725 46,863,132 49,020,709 51,531,427
Total resource budget 36,960.336 38,240,323 39,955,490 41,188,398 47,422,663 50.138,998 53,367,280 55,835,280 58,890,086
Annex B: Core tab les
117
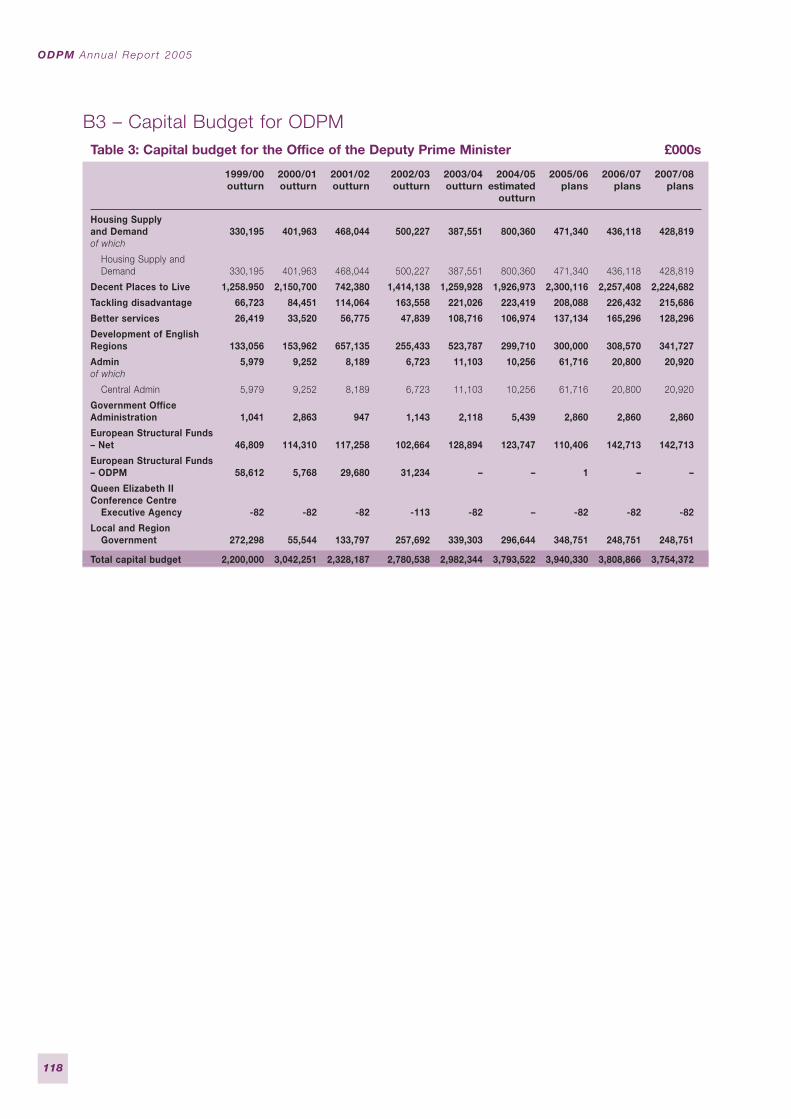
B3 – Capital Budget for ODPMTable 3: Capital budget for the Office of the Deputy Prime Minister £000s
1999/00 2000/01 2001/02 2002/03 2003/04 2004/05 2005/06 2006/07 2007/08outturn outturn outturn outturn outturn estimated plans plans plans
outturn
Housing Supply and Demand 330,195 401,963 468,044 500,227 387,551 800,360 471,340 436,118 428,819of which
Housing Supply and Demand 330,195 401,963 468,044 500,227 387,551 800,360 471,340 436,118 428,819
Decent Places to Live 1,258.950 2,150,700 742,380 1,414,138 1,259,928 1,926,973 2,300,116 2,257,408 2,224,682
Tackling disadvantage 66,723 84,451 114,064 163,558 221,026 223,419 208,088 226,432 215,686
Better services 26,419 33,520 56,775 47,839 108,716 106,974 137,134 165,296 128,296
Development of English Regions 133,056 153,962 657,135 255,433 523,787 299,710 300,000 308,570 341,727
Admin 5,979 9,252 8,189 6,723 11,103 10,256 61,716 20,800 20,920of which
Central Admin 5,979 9,252 8,189 6,723 11,103 10,256 61,716 20,800 20,920
Government OfficeAdministration 1,041 2,863 947 1,143 2,118 5,439 2,860 2,860 2,860
European Structural Funds – Net 46,809 114,310 117,258 102,664 128,894 123,747 110,406 142,713 142,713
European Structural Funds – ODPM 58,612 5,768 29,680 31,234 – – 1 – –
Queen Elizabeth II Conference Centre
Executive Agency -82 -82 -82 -113 -82 – -82 -82 -82
Local and Region Government 272,298 55,544 133,797 257,692 339,303 296,644 348,751 248,751 248,751
Total capital budget 2,200,000 3,042,251 2,328,187 2,780,538 2,982,344 3,793,522 3,940,330 3,808,866 3,754,372
ODPM Annua l Repor t 2005
118
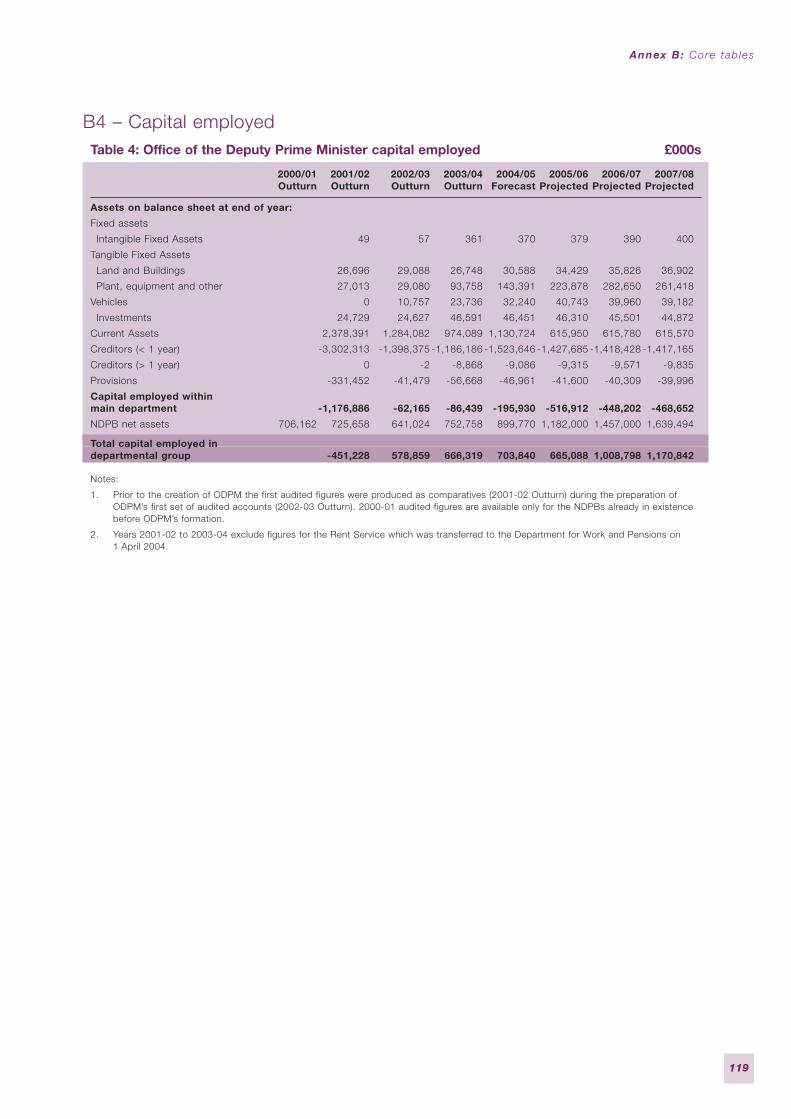
B4 – Capital employedTable 4: Office of the Deputy Prime Minister capital employed £000s
2000/01 2001/02 2002/03 2003/04 2004/05 2005/06 2006/07 2007/08Outturn Outturn Outturn Outturn Forecast Projected Projected Projected
Assets on balance sheet at end of year:
Fixed assets
Intangible Fixed Assets 49 57 361 370 379 390 400
Tangible Fixed Assets
Land and Buildings 26,696 29,088 26,748 30,588 34,429 35,826 36,902
Plant, equipment and other 27,013 29,080 93,758 143,391 223,878 282,650 261,418
Vehicles 0 10,757 23,736 32,240 40,743 39,960 39,182
Investments 24,729 24,627 46,591 46,451 46,310 45,501 44,872
Current Assets 2,378,391 1,284,082 974,089 1,130,724 615,950 615,780 615,570
Creditors (< 1 year) -3,302,313 -1,398,375 -1,186,186 -1,523,646 -1,427,685 -1,418,428 -1,417,165
Creditors (> 1 year) 0 -2 -8,868 -9,086 -9,315 -9,571 -9,835
Provisions -331,452 -41,479 -56,668 -46,961 -41,600 -40,309 -39,996
Capital employed withinmain department -1,176,886 -62,165 -86,439 -195,930 -516,912 -448,202 -468,652
NDPB net assets 706,162 725,658 641,024 752,758 899,770 1,182,000 1,457,000 1,639,494
Total capital employed in departmental group -451,228 578,859 666,319 703,840 665,088 1,008,798 1,170,842
Notes:
1. Prior to the creation of ODPM the first audited figures were produced as comparatives (2001-02 Outturn) during the preparation ofODPM’s first set of audited accounts (2002-03 Outturn). 2000-01 audited figures are available only for the NDPBs already in existencebefore ODPM’s formation.
2. Years 2001-02 to 2003-04 exclude figures for the Rent Service which was transferred to the Department for Work and Pensions on1 April 2004.
Annex B: Core tab les
119
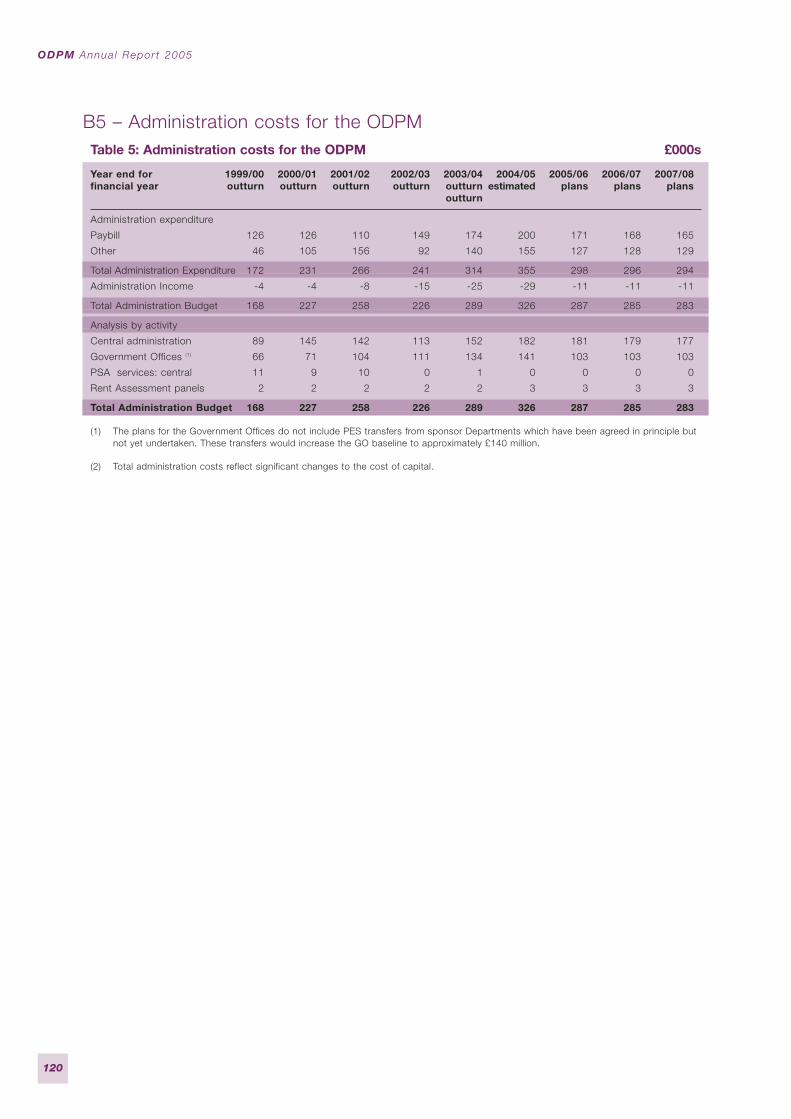
B5 – Administration costs for the ODPMTable 5: Administration costs for the ODPM £000s
Year end for 1999/00 2000/01 2001/02 2002/03 2003/04 2004/05 2005/06 2006/07 2007/08financial year outturn outturn outturn outturn outturn estimated plans plans plans
outturn
Administration expenditure
Paybill 126 126 110 149 174 200 171 168 165
Other 46 105 156 92 140 155 127 128 129
Total Administration Expenditure 172 231 266 241 314 355 298 296 294
Administration Income -4 -4 -8 -15 -25 -29 -11 -11 -11
Total Administration Budget 168 227 258 226 289 326 287 285 283
Analysis by activity
Central administration 89 145 142 113 152 182 181 179 177
Government Offices (1) 66 71 104 111 134 141 103 103 103
PSA services: central 11 9 10 0 1 0 0 0 0
Rent Assessment panels 2 2 2 2 2 3 3 3 3
Total Administration Budget 168 227 258 226 289 326 287 285 283
(1) The plans for the Government Offices do not include PES transfers from sponsor Departments which have been agreed in principle butnot yet undertaken. These transfers would increase the GO baseline to approximately £140 million.
(2) Total administration costs reflect significant changes to the cost of capital.
ODPM Annua l Repor t 2005
120
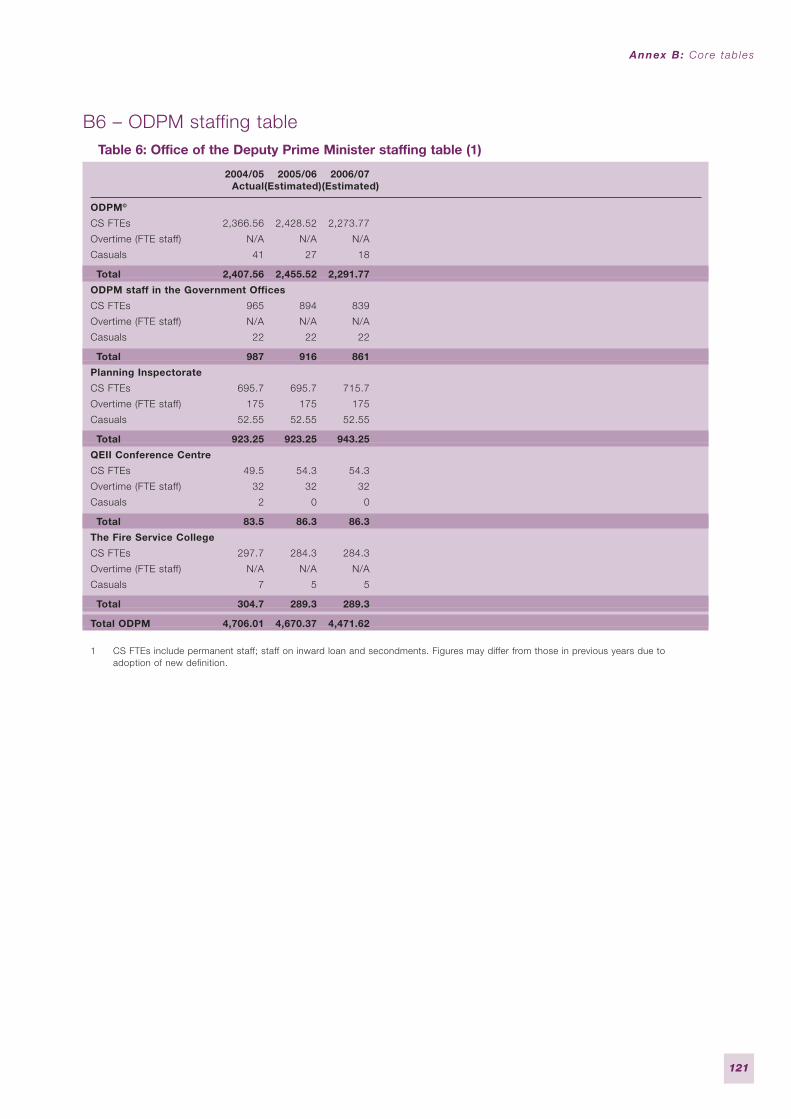
B6 – ODPM staffing tableTable 6: Office of the Deputy Prime Minister staffing table (1)
2004/05 2005/06 2006/07 Actual(Estimated)(Estimated)
ODPM©
CS FTEs 2,366.56 2,428.52 2,273.77
Overtime (FTE staff) N/A N/A N/A
Casuals 41 27 18
Total 2,407.56 2,455.52 2,291.77
ODPM staff in the Government Offices
CS FTEs 965 894 839
Overtime (FTE staff) N/A N/A N/A
Casuals 22 22 22
Total 987 916 861
Planning Inspectorate
CS FTEs 695.7 695.7 715.7
Overtime (FTE staff) 175 175 175
Casuals 52.55 52.55 52.55
Total 923.25 923.25 943.25
QEII Conference Centre
CS FTEs 49.5 54.3 54.3
Overtime (FTE staff) 32 32 32
Casuals 2 0 0
Total 83.5 86.3 86.3
The Fire Service College
CS FTEs 297.7 284.3 284.3
Overtime (FTE staff) N/A N/A N/A
Casuals 7 5 5
Total 304.7 289.3 289.3
Total ODPM 4,706.01 4,670.37 4,471.62
1 CS FTEs include permanent staff; staff on inward loan and secondments. Figures may differ from those in previous years due toadoption of new definition.
Annex B: Core tab les
121
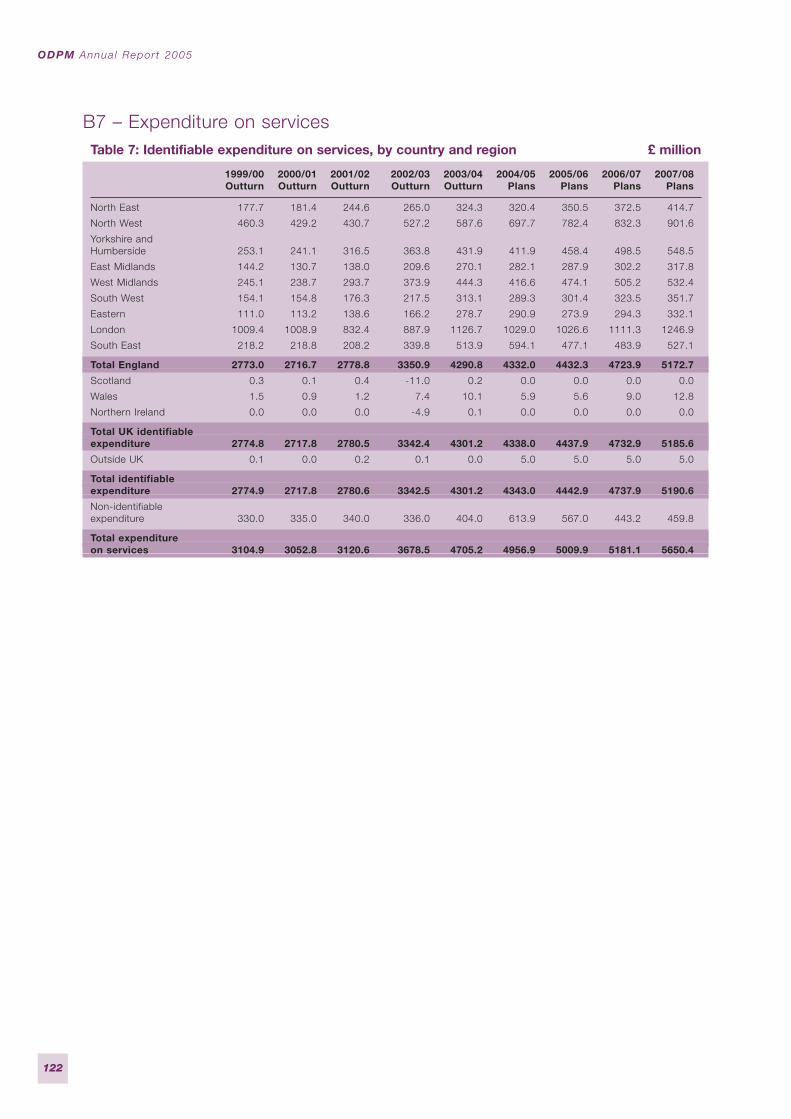
B7 – Expenditure on servicesTable 7: Identifiable expenditure on services, by country and region £ million
1999/00 2000/01 2001/02 2002/03 2003/04 2004/05 2005/06 2006/07 2007/08Outturn Outturn Outturn Outturn Outturn Plans Plans Plans Plans
North East 177.7 181.4 244.6 265.0 324.3 320.4 350.5 372.5 414.7
North West 460.3 429.2 430.7 527.2 587.6 697.7 782.4 832.3 901.6
Yorkshire and Humberside 253.1 241.1 316.5 363.8 431.9 411.9 458.4 498.5 548.5
East Midlands 144.2 130.7 138.0 209.6 270.1 282.1 287.9 302.2 317.8
West Midlands 245.1 238.7 293.7 373.9 444.3 416.6 474.1 505.2 532.4
South West 154.1 154.8 176.3 217.5 313.1 289.3 301.4 323.5 351.7
Eastern 111.0 113.2 138.6 166.2 278.7 290.9 273.9 294.3 332.1
London 1009.4 1008.9 832.4 887.9 1126.7 1029.0 1026.6 1111.3 1246.9
South East 218.2 218.8 208.2 339.8 513.9 594.1 477.1 483.9 527.1
Total England 2773.0 2716.7 2778.8 3350.9 4290.8 4332.0 4432.3 4723.9 5172.7
Scotland 0.3 0.1 0.4 -11.0 0.2 0.0 0.0 0.0 0.0
Wales 1.5 0.9 1.2 7.4 10.1 5.9 5.6 9.0 12.8
Northern Ireland 0.0 0.0 0.0 -4.9 0.1 0.0 0.0 0.0 0.0
Total UK identifiable expenditure 2774.8 2717.8 2780.5 3342.4 4301.2 4338.0 4437.9 4732.9 5185.6
Outside UK 0.1 0.0 0.2 0.1 0.0 5.0 5.0 5.0 5.0
Total identifiable expenditure 2774.9 2717.8 2780.6 3342.5 4301.2 4343.0 4442.9 4737.9 5190.6
Non-identifiableexpenditure 330.0 335.0 340.0 336.0 404.0 613.9 567.0 443.2 459.8
Total expenditure on services 3104.9 3052.8 3120.6 3678.5 4705.2 4956.9 5009.9 5181.1 5650.4
ODPM Annua l Repor t 2005
122
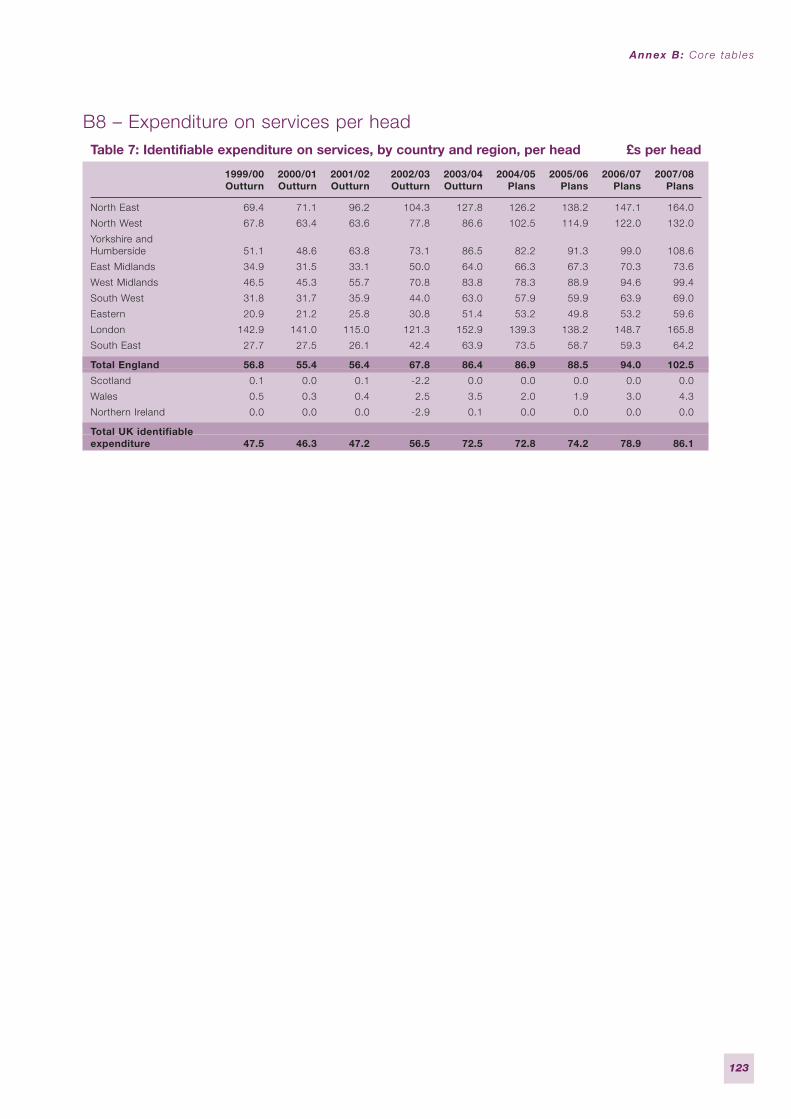
B8 – Expenditure on services per headTable 7: Identifiable expenditure on services, by country and region, per head £s per head
1999/00 2000/01 2001/02 2002/03 2003/04 2004/05 2005/06 2006/07 2007/08Outturn Outturn Outturn Outturn Outturn Plans Plans Plans Plans
North East 69.4 71.1 96.2 104.3 127.8 126.2 138.2 147.1 164.0
North West 67.8 63.4 63.6 77.8 86.6 102.5 114.9 122.0 132.0
Yorkshire and Humberside 51.1 48.6 63.8 73.1 86.5 82.2 91.3 99.0 108.6
East Midlands 34.9 31.5 33.1 50.0 64.0 66.3 67.3 70.3 73.6
West Midlands 46.5 45.3 55.7 70.8 83.8 78.3 88.9 94.6 99.4
South West 31.8 31.7 35.9 44.0 63.0 57.9 59.9 63.9 69.0
Eastern 20.9 21.2 25.8 30.8 51.4 53.2 49.8 53.2 59.6
London 142.9 141.0 115.0 121.3 152.9 139.3 138.2 148.7 165.8
South East 27.7 27.5 26.1 42.4 63.9 73.5 58.7 59.3 64.2
Total England 56.8 55.4 56.4 67.8 86.4 86.9 88.5 94.0 102.5
Scotland 0.1 0.0 0.1 -2.2 0.0 0.0 0.0 0.0 0.0
Wales 0.5 0.3 0.4 2.5 3.5 2.0 1.9 3.0 4.3
Northern Ireland 0.0 0.0 0.0 -2.9 0.1 0.0 0.0 0.0 0.0
Total UK identifiableexpenditure 47.5 46.3 47.2 56.5 72.5 72.8 74.2 78.9 86.1
Annex B: Core tab les
123
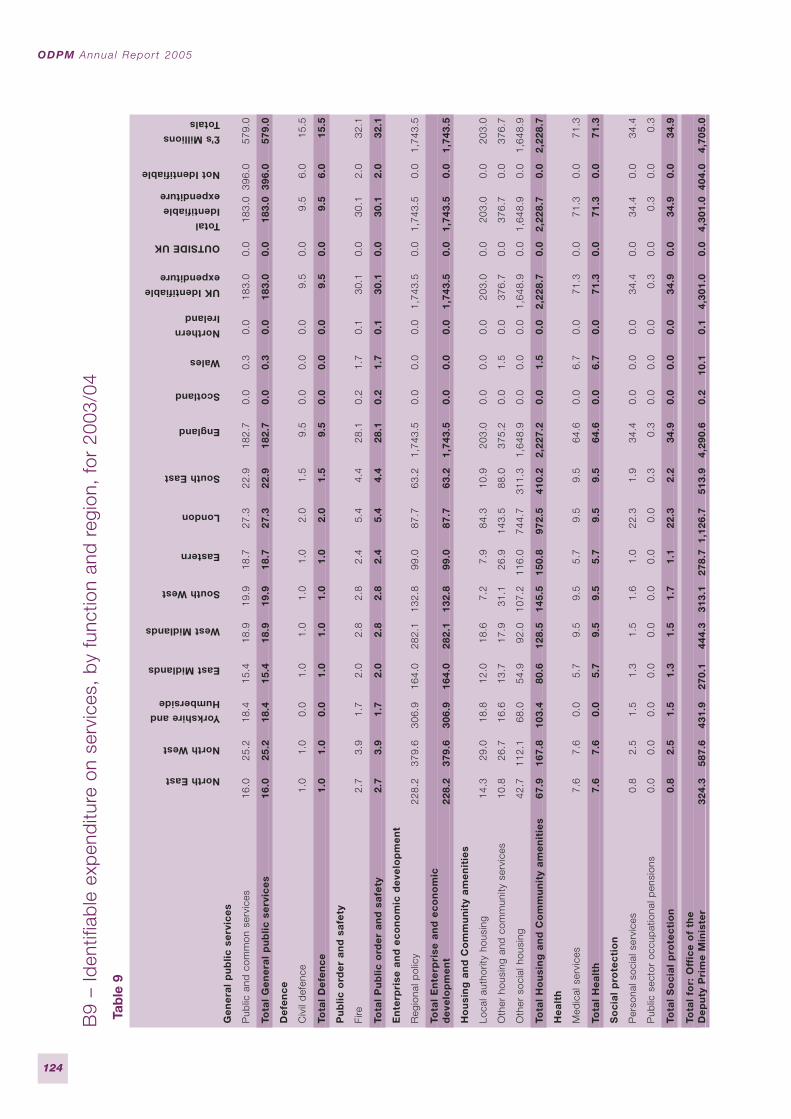
ODPM Annua l Repor t 2005
124
B9
– Id
entif
iab
le e
xpen
ditu
re o
n se
rvic
es,
by
func
tion
and
reg
ion,
for
200
3/04
Tab
le 9
Ge
ne
ral
pu
blic
se
rvic
es
Pub
lic a
nd c
omm
on s
ervi
ces
16.0
25.2
18.4
15.4
18.9
19.9
18.7
27.3
22.9
182.
70.
00.
30.
018
3.0
0.0
183.
039
6.0
579.
0
Tota
l G
en
era
l p
ub
lic s
erv
ice
s16
.025
.218
.415
.418
.919
.918
.727
.322
.918
2.7
0.0
0.3
0.0
183.
00.
018
3.0
396.
057
9.0
De
fen
ce
Civ
il d
efen
ce1.
01.
00.
01.
01.
01.
01.
02.
01.
59.
50.
00.
00.
09.
50.
09.
56.
015
.5
Tota
l D
efe
nc
e1.
01.
00.
01.
01.
01.
01.
02.
01.
59.
50.
00.
00.
09.
50.
09.
56.
015
.5
Pu
blic
ord
er
an
d s
afe
ty
Fire
2.7
3.9
1.7
2.0
2.8
2.8
2.4
5.4
4.4
28.1
0.2
1.7
0.1
30.1
0.0
30.1
2.0
32.1
Tota
l P
ub
lic o
rde
r a
nd
sa
fety
2.7
3.9
1.7
2.0
2.8
2.8
2.4
5.4
4.4
28.1
0.2
1.7
0.1
30.1
0.0
30.1
2.0
32.1
En
terp
rise
an
d e
co
no
mic
de
velo
pm
en
t
Reg
iona
l pol
icy
228.
237
9.6
306.
916
4.0
282.
113
2.8
99.0
87.7
63.2
1,74
3.5
0.0
0.0
0.0
1,74
3.5
0.0
1,74
3.5
0.0
1,74
3.5
Tota
l E
nte
rpri
se a
nd
ec
on
om
ic
de
velo
pm
en
t22
8.2
379.
630
6.9
164.
028
2.1
132.
899
.087
.763
.21,
743.
50.
00.
00.
01,
743.
50.
01,
743.
50.
01,
743.
5
Ho
usi
ng
an
d C
om
mu
nit
y a
me
nit
ies
Loca
l aut
horit
y ho
usin
g14
.329
.018
.812
.018
.67.
27.
984
.310
.920
3.0
0.0
0.0
0.0
203.
00.
020
3.0
0.0
203.
0
Oth
er h
ousi
ng a
nd c
omm
unity
ser
vice
s10
.826
.716
.613
.717
.931
.126
.914
3.5
88.0
375.
20.
01.
50.
037
6.7
0.0
376.
70.
037
6.7
Oth
er s
ocia
l hou
sing
42.7
112.
168
.054
.992
.010
7.2
116.
074
4.7
311.
31,
648.
90.
00.
00.
01,
648.
90.
01,
648.
90.
01,
648.
9
Tota
l H
ou
sin
g a
nd
Co
mm
un
ity
am
en
itie
s67
.916
7.8
103.
480
.612
8.5
145.
515
0.8
972.
541
0.2
2,22
7.2
0.0
1.5
0.0
2,22
8.7
0.0
2,22
8.7
0.0
2,22
8.7
He
alt
h
Med
ical
ser
vice
s7.
67.
60.
05.
79.
59.
55.
79.
59.
564
.60.
06.
70.
071
.30.
071
.30.
071
.3
Tota
l H
ea
lth
7.6
7.6
0.0
5.7
9.5
9.5
5.7
9.5
9.5
64.6
0.0
6.7
0.0
71.3
0.0
71.3
0.0
71.3
So
cia
l p
rote
cti
on
Per
sona
l soc
ial s
ervi
ces
0.8
2.5
1.5
1.3
1.5
1.6
1.0
22.3
1.9
34.4
0.0
0.0
0.0
34.4
0.0
34.4
0.0
34.4
Pub
lic s
ecto
r oc
cup
atio
nal p
ensi
ons
0.0
0.0
0.0
0.0
0.0
0.0
0.0
0.0
0.3
0.3
0.0
0.0
0.0
0.3
0.0
0.3
0.0
0.3
Tota
l S
oc
ial
pro
tec
tio
n0.
82.
51.
51.
31.
51.
71.
122
.32.
234
.90.
00.
00.
034
.90.
034
.90.
034
.9
Tota
l fo
r: O
ffic
e o
f th
e
De
pu
ty P
rim
e M
inis
ter
324.
358
7.6
431.
927
0.1
444.
331
3.1
278.
71,
126.
751
3.9
4,29
0.6
0.2
10.1
0.1
4,30
1.0
0.0
4,30
1.0
404.
04,
705.
0
North East
North West
Yorkshire andHumberside
East Midlands
West Midlands
South West
Eastern
London
South East
England
Scotland
Wales
NorthernIreland
UK Identifiableexpenditure
OUTSIDE UK
TotalIdentifiableexpenditure
Not Identifiable
£’s MillionsTotals
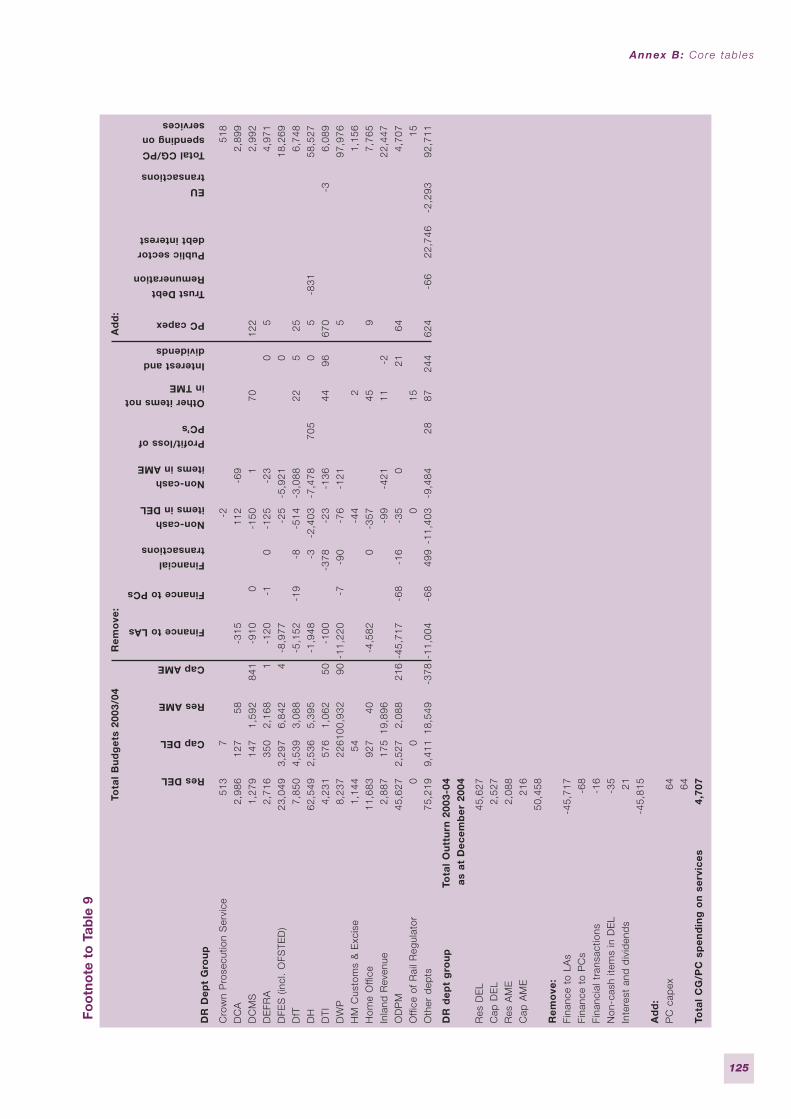
Annex B: Core tab les
125
Foo
tno
te t
o T
able
9
Tota
l B
ud
ge
ts 2
003/
04R
em
ove
:A
dd
:
DR
De
pt
Gro
up
Cro
wn
Pro
secu
tion
Ser
vice
513
7-2
518
DC
A2,
986
127
58-3
1511
2-6
92,
899
DC
MS
1,27
914
71,
592
841
-910
0-1
501
7012
22,
992
DE
FRA
2,71
635
02,
168
1-1
20-1
0-1
25-2
30
54,
971
DFE
S (
incl
. O
FSTE
D)
23,0
493,
297
6,84
24
-8,9
77-2
5-5
,921
018
,269
DfT
7,85
04,
539
3,08
8-5
,152
-19
-8-5
14-3
,088
225
256,
748
DH
62,5
492,
536
5,39
5-1
,948
-3-2
,403
-7,4
7870
50
5-8
3158
,527
DTI
4,23
157
61,
062
50-1
00-3
78-2
3-1
3644
9667
0-3
6,08
9D
WP
8,23
722
6100
,932
90-1
1,22
0-7
-90
-76
-121
597
,976
HM
Cus
tom
s &
Exc
ise
1,14
454
-44
21,
156
Hom
e O
ffice
11,6
8392
740
-4,5
820
-357
459
7,76
5In
land
Rev
enue
2,88
717
519
,896
-99
-421
11-2
22,4
47O
DP
M45
,627
2,52
72,
088
216
-45,
717
-68
-16
-35
021
644,
707
Offi
ce o
f R
ail R
egul
ator
00
015
15O
ther
dep
ts75
,219
9,41
118
,549
-378
-11,
004
-68
499
-11,
403
-9,4
8428
8724
462
4-6
622
,746
-2,2
9392
,711
DR
de
pt
gro
up
Tota
l O
utt
urn
200
3-04
a
s a
t D
ec
em
be
r 20
04
Res
DE
L45
,627
Cap
DE
L2,
527
Res
AM
E2,
088
Cap
AM
E21
650
,458
Re
mo
ve:
Fina
nce
to L
As
-45,
717
Fina
nce
to P
Cs
-68
Fina
ncia
l tra
nsac
tions
-16
Non
-cas
h ite
ms
in D
EL
-35
Inte
rest
and
div
iden
ds
21-4
5,81
5A
dd
:P
C c
apex
64 64To
tal
CG
/PC
sp
en
din
g o
n s
erv
ice
s4,
707Res DEL
Cap DEL
Res AME
Cap AME
Finance to LAs
Finance to PCs
Financialtransactions
Non-cashitems in DEL
Non-cashitems in AME
Profit/loss ofPC’s
Other items notin TME
Interest anddividends
PC capex
Trust DebtRemuneration
Public sectordebt interest
EUtransactions
Total CG/PCspending onservices
Footnotes/Explanatory Text
● The spending data shown in these tables is consistent with the country and regionalanalyses (CRA) published by HM Treasury in Public Expenditure Statistical Analyses (PESA).PESA contains more tables analysed by country and region, and also explains how theanalysis was collected and the basis for allocating expenditure between countries andregions.
● The tables include the spending of the department and its NDPBs on payments to privatesector and subsidies to public corporations. They do not include capital finance to publiccorporations but do include public corporations capital expenditure. They do not includepayments to local authorities or local authorities own expenditure.
● The data are based on a subset of spending – identifiable expenditure on services – whichis capable of being analysed as being for the benefit of individual countries and regions.Expenditure that is incurred for the benefit of the UK as a whole is excluded.
● The tables do not include depreciation, cost of capital charges or movements in provisionsthat are in DEL/AME. They do include salaries, procurement expenditure, capitalexpenditure and grants and subsidies paid to individuals and private sector enterprises.
● The figures were collected about three months before the figures in the other tables, andtherefore may not show the latest position.
● Across government, most expenditure is not planned or allocated on a regional basis.Social security payments, for example, are paid to eligible individuals irrespective of wherethey live. Expenditure on other programmes is allocated by looking at how all the projectsacross the departments area of responsibility, usually England, compare. So the analysisshows the regional outcome of spending decisions that have on the whole not been madeprimarily on a regional basis.
● The functional categories used are the standard United Nations Classifications of theFunctions of Government (COFOG) categories. This is not the same as the strategicpriorities used elsewhere in the report.
ODPM Annua l Repor t 2005
126
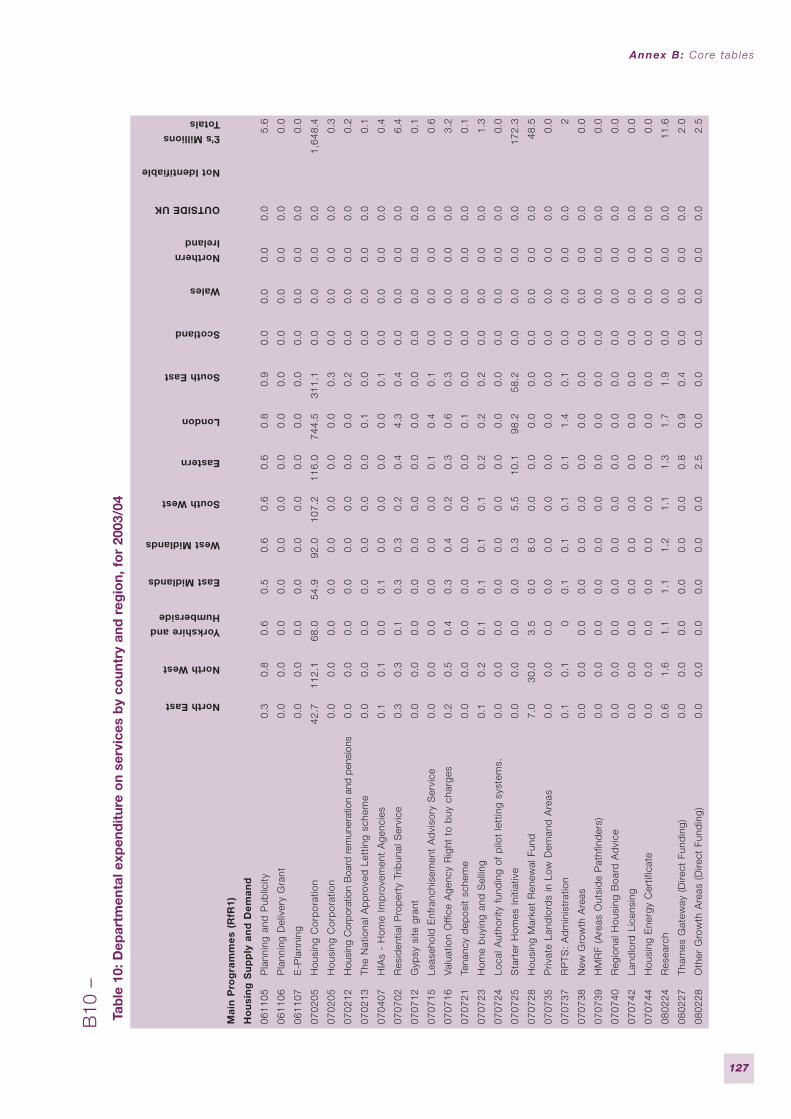
Annex B: Core tab les
127
B10
–
Tab
le 1
0: D
epar
tmen
tal e
xpen
dit
ure
on
serv
ices
by
coun
try
and
reg
ion,
fo
r 20
03/0
4
North East
North West
Yorkshire andHumberside
East Midlands
West Midlands
South West
Eastern
London
South East
Scotland
Wales
NorthernIreland
OUTSIDE UK
Not Identifiable
£’s MillionsTotals
Ma
in P
rog
ram
me
s (R
fR1)
Ho
usi
ng
Su
pp
ly a
nd
De
ma
nd
0611
05
P
lann
ing
and
Pub
licity
0.3
0.8
0.6
0.5
0.6
0.6
0.6
0.8
0.9
0.0
0.0
0.0
0.0
5.6
0611
06
P
lann
ing
Del
iver
y G
rant
0.0
0.0
0.0
0.0
0.0
0.0
0.0
0.0
0.0
0.0
0.0
0.0
0.0
0.0
0611
07
E
-Pla
nnin
g0.
00.
00.
00.
00.
00.
00.
00.
00.
00.
00.
00.
00.
00.
0
0702
05
H
ousi
ng C
orp
orat
ion
42.7
112.
168
.054
.992
.010
7.2
116.
074
4.5
311.
10.
00.
00.
00.
01,
648.
4
0702
05
H
ousi
ng C
orp
orat
ion
0.0
0.0
0.0
0.0
0.0
0.0
0.0
0.0
0.3
0.0
0.0
0.0
0.0
0.3
0702
12
H
ousi
ng C
orpo
ratio
n B
oard
rem
uner
atio
n an
d pe
nsio
ns0.
00.
00.
00.
00.
00.
00.
00.
00.
20.
00.
00.
00.
00.
2
0702
13
Th
e N
atio
nal A
pp
rove
d L
ettin
g sc
hem
e0.
00.
00.
00.
00.
00.
00.
00.
10.
00.
00.
00.
00.
00.
1
0704
07
H
IAs
- H
ome
Imp
rove
men
t A
genc
ies
0.1
0.1
0.0
0.1
0.0
0.0
0.0
0.0
0.1
0.0
0.0
0.0
0.0
0.4
0707
02
R
esid
entia
l Pro
per
ty T
ribun
al S
ervi
ce0.
30.
30.
10.
30.
30.
20.
44.
30.
40.
00.
00.
00.
06.
4
0707
12
G
ypsy
site
gra
nt0.
00.
00.
00.
00.
00.
00.
00.
00.
00.
00.
00.
00.
00.
1
0707
15
Le
aseh
old
Enf
ranc
hise
men
t A
dvi
sory
Ser
vice
0.0
0.0
0.0
0.0
0.0
0.0
0.1
0.4
0.1
0.0
0.0
0.0
0.0
0.6
0707
16
Va
luat
ion
Offi
ce A
genc
y R
ight
to
buy
cha
rges
0.2
0.5
0.4
0.3
0.4
0.2
0.3
0.6
0.3
0.0
0.0
0.0
0.0
3.2
0707
21
Te
nanc
y d
epos
it sc
hem
e0.
00.
00.
00.
00.
00.
00.
00.
10.
00.
00.
00.
00.
00.
1
0707
23
H
ome
buy
ing
and
Sel
ling
0.1
0.2
0.1
0.1
0.1
0.1
0.2
0.2
0.2
0.0
0.0
0.0
0.0
1.3
0707
24
Lo
cal A
utho
rity
fund
ing
of p
ilot
lett
ing
syst
ems.
0.0
0.0
0.0
0.0
0.0
0.0
0.0
0.0
0.0
0.0
0.0
0.0
0.0
0.0
0707
25
S
tart
er H
omes
Ini
tiativ
e0.
00.
00.
00.
00.
35.
510
.198
.258
.20.
00.
00.
00.
017
2.3
0707
28
H
ousi
ng M
arke
t R
enew
al F
und
7.0
30.0
3.5
0.0
8.0
0.0
0.0
0.0
0.0
0.0
0.0
0.0
0.0
48.5
0707
35
P
rivat
e La
ndlo
rds
in L
ow D
eman
d A
reas
0.0
0.0
0.0
0.0
0.0
0.0
0.0
0.0
0.0
0.0
0.0
0.0
0.0
0.0
0707
37
R
PTS
: A
dm
inis
trat
ion
0.1
0.1
00.
10.
10.
10.
11.
40.
10.
00.
00.
00.
02
0707
38
N
ew G
row
th A
reas
0.0
0.0
0.0
0.0
0.0
0.0
0.0
0.0
0.0
0.0
0.0
0.0
0.0
0.0
0707
39
H
MR
F (A
reas
Out
sid
e P
athf
ind
ers)
0.0
0.0
0.0
0.0
0.0
0.0
0.0
0.0
0.0
0.0
0.0
0.0
0.0
0.0
0707
40
R
egio
nal H
ousi
ng B
oard
Ad
vice
0.0
0.0
0.0
0.0
0.0
0.0
0.0
0.0
0.0
0.0
0.0
0.0
0.0
0.0
0707
42
La
ndlo
rd L
icen
sing
0.0
0.0
0.0
0.0
0.0
0.0
0.0
0.0
0.0
0.0
0.0
0.0
0.0
0.0
0707
44
H
ousi
ng E
nerg
y C
ertif
icat
e0.
00.
00.
00.
00.
00.
00.
00.
00.
00.
00.
00.
00.
00.
0
0802
24
R
esea
rch
0.6
1.6
1.1
1.1
1.2
1.1
1.3
1.7
1.9
0.0
0.0
0.0
0.0
11.6
0802
27
Th
ames
Gat
eway
(D
irect
Fun
din
g)0.
00.
00.
00.
00.
00.
00.
80.
90.
40.
00.
00.
00.
02.
0
0802
28
O
ther
Gro
wth
Are
as (
Dire
ct F
und
ing)
0.0
0.0
0.0
0.0
0.0
0.0
2.5
0.0
0.0
0.0
0.0
0.0
0.0
2.5
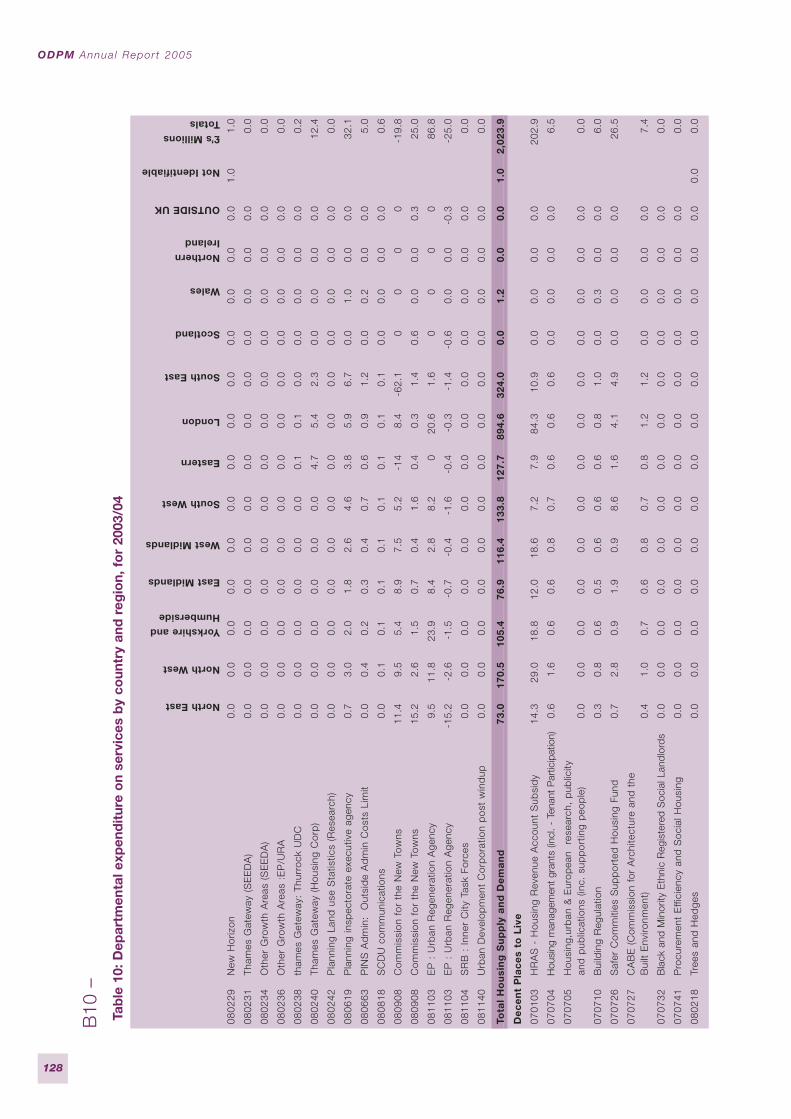
ODPM Annua l Repor t 2005
128
B10
–
Tab
le 1
0: D
epar
tmen
tal e
xpen
dit
ure
on
serv
ices
by
coun
try
and
reg
ion,
fo
r 20
03/0
4
North East
North West
Yorkshire andHumberside
East Midlands
West Midlands
South West
Eastern
London
South East
Scotland
Wales
NorthernIreland
OUTSIDE UK
Not Identifiable
£’s MillionsTotals
0802
29
N
ew H
oriz
on0.
00.
00.
00.
00.
00.
00.
00.
00.
00.
00.
00.
00.
01.
01.
0
0802
31
Th
ames
Gat
eway
(S
EE
DA
)0.
00.
00.
00.
00.
00.
00.
00.
00.
00.
00.
00.
00.
00.
0
0802
34
O
ther
Gro
wth
Are
as (
SE
ED
A)
0.0
0.0
0.0
0.0
0.0
0.0
0.0
0.0
0.0
0.0
0.0
0.0
0.0
0.0
0802
36
O
ther
Gro
wth
Are
as :
EP
/UR
A0.
00.
00.
00.
00.
00.
00.
00.
00.
00.
00.
00.
00.
00.
0
0802
38
th
ames
Get
eway
: Th
urro
ck U
DC
0.0
0.0
0.0
0.0
0.0
0.0
0.1
0.1
0.0
0.0
0.0
0.0
0.0
0.2
0802
40
Th
ames
Gat
eway
(H
ousi
ng C
orp
)0.
00.
00.
00.
00.
00.
04.
75.
42.
30.
00.
00.
00.
012
.4
0802
42
P
lann
ing
Land
use
Sta
tistic
s (R
esea
rch)
0.0
0.0
0.0
0.0
0.0
0.0
0.0
0.0
0.0
0.0
0.0
0.0
0.0
0.0
0806
19
P
lann
ing
insp
ecto
rate
exe
cutiv
e ag
ency
0.7
3.0
2.0
1.8
2.6
4.6
3.8
5.9
6.7
0.0
1.0
0.0
0.0
32.1
0806
63
P
INS
Ad
min
: O
utsi
de
Ad
min
Cos
ts L
imit
0.0
0.4
0.2
0.3
0.4
0.7
0.6
0.9
1.2
0.0
0.2
0.0
0.0
5.0
0808
18
S
CD
U c
omm
unic
atio
ns0.
00.
10.
10.
10.
10.
10.
10.
10.
10.
00.
00.
00.
00.
6
0809
08
C
omm
issi
on f
or t
he N
ew T
owns
11.4
9.5
5.4
8.9
7.5
5.2
-14
8.4
-62.
10
00
0-1
9.8
0809
08
C
omm
issi
on f
or t
he N
ew T
owns
15.2
2.6
1.5
0.7
0.4
1.6
0.4
0.3
1.4
0.6
0.0
0.0
0.3
25.0
0811
03
E
P :
Urb
an R
egen
erat
ion
Age
ncy
9.5
11.8
23.9
8.4
2.8
8.2
020
.61.
60
00
086
.8
0811
03
E
P :
Urb
an R
egen
erat
ion
Age
ncy
-15.
2-2
.6-1
.5-0
.7-0
.4-1
.6-0
.4-0
.3-1
.4-0
.60.
00.
0-0
.3-2
5.0
0811
04
S
RB
: I
nner
City
Tas
k Fo
rces
0.0
0.0
0.0
0.0
0.0
0.0
0.0
0.0
0.0
0.0
0.0
0.0
0.0
0.0
0811
40
U
rban
Dev
elop
men
t C
orp
orat
ion
pos
t w
ind
up0.
00.
00.
00.
00.
00.
00.
00.
00.
00.
00.
00.
00.
00.
0
Tota
l H
ou
sin
g S
up
ply
an
d D
em
an
d73
.017
0.5
105.
476
.911
6.4
133.
812
7.7
894.
632
4.0
0.0
1.2
0.0
0.0
1.0
2,02
3.9
De
ce
nt
Pla
ce
s to
Liv
e
0701
03
H
RA
S -
Hou
sing
Rev
enue
Acc
ount
Sub
sid
y14
.329
.018
.812
.018
.67.
27.
984
.310
.90.
00.
00.
00.
020
2.9
0707
04
H
ousi
ng m
anag
emen
t gr
ants
(inc
l. -
Tena
nt P
artic
ipat
ion)
0.6
1.6
0.6
0.6
0.8
0.7
0.6
0.6
0.6
0.0
0.0
0.0
0.0
6.5
0707
05
H
ousi
ng,u
rban
& E
urop
ean
res
earc
h, p
ublic
ity
and
pub
licat
ions
(in
c. s
upp
ortin
g p
eop
le)
0.0
0.0
0.0
0.0
0.0
0.0
0.0
0.0
0.0
0.0
0.0
0.0
0.0
0.0
0707
10
B
uild
ing
Reg
ulat
ion
0.3
0.8
0.6
0.5
0.6
0.6
0.6
0.8
1.0
0.0
0.3
0.0
0.0
6.0
0707
26
S
afer
Com
miti
es S
upp
orte
d H
ousi
ng F
und
0.7
2.8
0.9
1.9
0.9
8.6
1.6
4.1
4.9
0.0
0.0
0.0
0.0
26.5
0707
27
C
AB
E (
Com
mis
sion
for
Arc
hite
ctur
e an
d t
he
Bui
lt E
nviro
nmen
t)0.
41.
00.
70.
60.
80.
70.
81.
21.
20.
00.
00.
00.
07.
4
0707
32
B
lack
and
Min
ority
Eth
nic
Reg
iste
red
Soc
ial L
andl
ords
0.0
0.0
0.0
0.0
0.0
0.0
0.0
0.0
0.0
0.0
0.0
0.0
0.0
0.0
0707
41
P
rocu
rem
ent
Effi
cien
cy a
nd S
ocia
l Hou
sing
0.0
0.0
0.0
0.0
0.0
0.0
0.0
0.0
0.0
0.0
0.0
0.0
0.0
0.0
0802
18
Tr
ees
and
Hed
ges
0.0
0.0
0.0
0.0
0.0
0.0
0.0
0.0
0.0
0.0
0.0
0.0
0.0
0.0
0.0
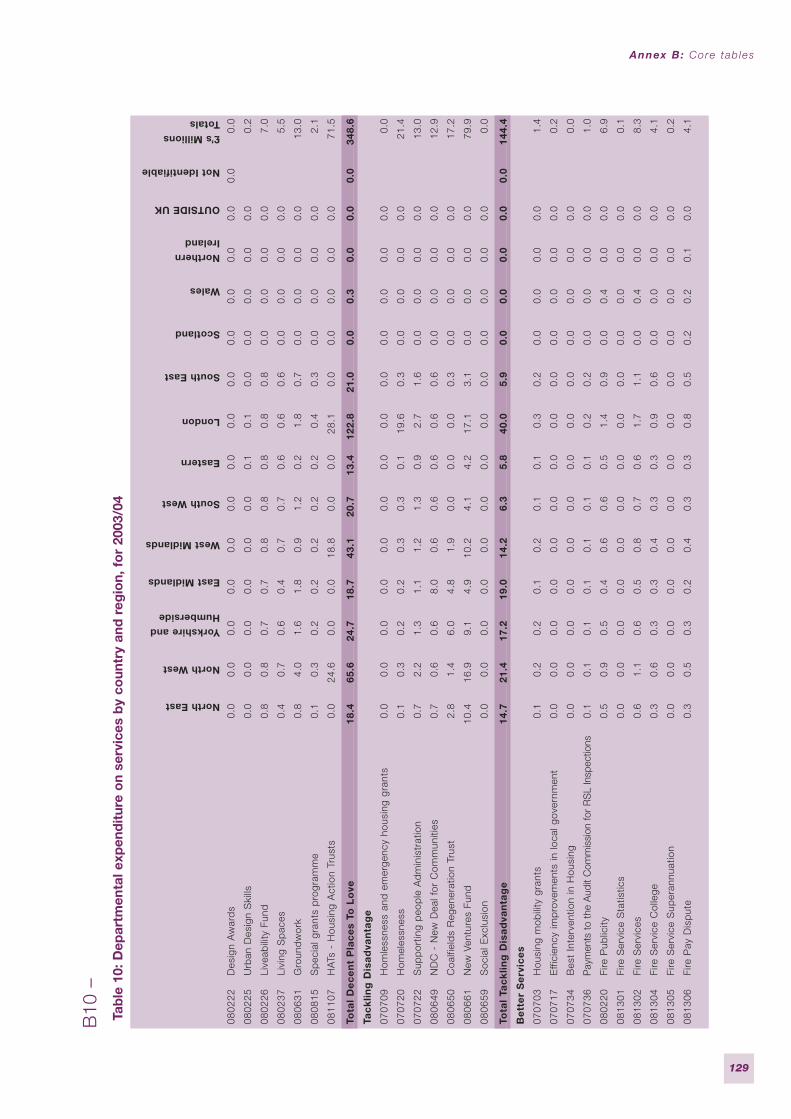
Annex B: Core tab les
129
B10
–
Tab
le 1
0: D
epar
tmen
tal e
xpen
dit
ure
on
serv
ices
by
coun
try
and
reg
ion,
fo
r 20
03/0
4
North East
North West
Yorkshire andHumberside
East Midlands
West Midlands
South West
Eastern
London
South East
Scotland
Wales
NorthernIreland
OUTSIDE UK
Not Identifiable
£’s MillionsTotals
0802
22
D
esig
n A
war
ds
0.0
0.0
0.0
0.0
0.0
0.0
0.0
0.0
0.0
0.0
0.0
0.0
0.0
0.0
0.0
0802
25
U
rban
Des
ign
Ski
lls0.
00.
00.
00.
00.
00.
00.
10.
10.
00.
00.
00.
00.
00.
2
0802
26
Li
veab
ility
Fun
d0.
80.
80.
70.
70.
80.
80.
80.
80.
80.
00.
00.
00.
07.
0
0802
37
Li
ving
Sp
aces
0.4
0.7
0.6
0.4
0.7
0.7
0.6
0.6
0.6
0.0
0.0
0.0
0.0
5.5
0806
31
G
roun
dw
ork
0.8
4.0
1.6
1.8
0.9
1.2
0.2
1.8
0.7
0.0
0.0
0.0
0.0
13.0
0808
15
S
pec
ial g
rant
s p
rogr
amm
e0.
10.
30.
20.
20.
20.
20.
20.
40.
30.
00.
00.
00.
02.
1
0811
07
H
ATs
- H
ousi
ng A
ctio
n Tr
usts
0.0
24.6
0.0
0.0
18.8
0.0
0.0
28.1
0.0
0.0
0.0
0.0
0.0
71.5
Tota
l D
ec
en
t P
lac
es
To L
ove
18.4
65.6
24.7
18.7
43.1
20.7
13.4
122.
821
.00.
00.
30.
00.
00.
034
8.6
Tac
klin
g D
isa
dva
nta
ge
0707
09
H
omle
ssne
ss a
nd e
mer
genc
y ho
usin
g gr
ants
0.0
0.0
0.0
0.0
0.0
0.0
0.0
0.0
0.0
0.0
0.0
0.0
0.0
0.0
0707
20
H
omel
essn
ess
0.1
0.3
0.2
0.2
0.3
0.3
0.1
19.6
0.3
0.0
0.0
0.0
0.0
21.4
0707
22
S
upp
ortin
g p
eop
le A
dm
inis
trat
ion
0.7
2.2
1.3
1.1
1.2
1.3
0.9
2.7
1.6
0.0
0.0
0.0
0.0
13.0
0806
49
N
DC
- N
ew D
eal f
or C
omm
uniti
es0.
70.
60.
68.
00.
60.
60.
60.
60.
60.
00.
00.
00.
012
.9
0806
50
C
oalfi
eld
s R
egen
erat
ion
Trus
t2.
81.
46.
04.
81.
90.
00.
00.
00.
30.
00.
00.
00.
017
.2
0806
61
N
ew V
entu
res
Fund
10.4
16.9
9.1
4.9
10.2
4.1
4.2
17.1
3.1
0.0
0.0
0.0
0.0
79.9
0806
59
S
ocia
l Exc
lusi
on0.
00.
00.
00.
00.
00.
00.
00.
00.
00.
00.
00.
00.
00.
0
Tota
l Ta
ck
ling
Dis
ad
van
tag
e14
.721
.417
.219
.014
.26.
35.
840
.05.
90.
00.
00.
00.
00.
014
4.4
Be
tte
r S
erv
ice
s
0707
03
H
ousi
ng m
obili
ty g
rant
s0.
10.
20.
20.
10.
20.
10.
10.
30.
20.
00.
00.
00.
01.
4
0707
17
E
ffici
ency
imp
rove
men
ts in
loca
l gov
ernm
ent
0.0
0.0
0.0
0.0
0.0
0.0
0.0
0.0
0.0
0.0
0.0
0.0
0.0
0.2
0707
34
B
est
Inte
rven
tion
in H
ousi
ng0.
00.
00.
00.
00.
00.
00.
00.
00.
00.
00.
00.
00.
00.
0
0707
36
P
aym
ents
to
the
Aud
it C
omm
issi
on fo
r R
SL
Insp
ectio
ns0.
10.
10.
10.
10.
10.
10.
10.
20.
20.
00.
00.
00.
01.
0
0802
20
Fi
re P
ublic
ity0.
50.
90.
50.
40.
60.
60.
51.
40.
90.
00.
40.
00.
06.
9
0813
01
Fi
re S
ervi
ce S
tatis
tics
0.0
0.0
0.0
0.0
0.0
0.0
0.0
0.0
0.0
0.0
0.0
0.0
0.0
0.1
0813
02
Fi
re S
ervi
ces
0.6
1.1
0.6
0.5
0.8
0.7
0.6
1.7
1.1
0.0
0.4
0.0
0.0
8.3
0813
04
Fi
re S
ervi
ce C
olle
ge0.
30.
60.
30.
30.
40.
30.
30.
90.
60.
00.
00.
00.
04.
1
0813
05
Fi
re S
ervi
ce S
uper
annu
atio
n0.
00.
00.
00.
00.
00.
00.
00.
00.
00.
00.
00.
00.
00.
2
0813
06
Fi
re P
ay D
isp
ute
0.3
0.5
0.3
0.2
0.4
0.3
0.3
0.8
0.5
0.2
0.2
0.1
0.0
4.1
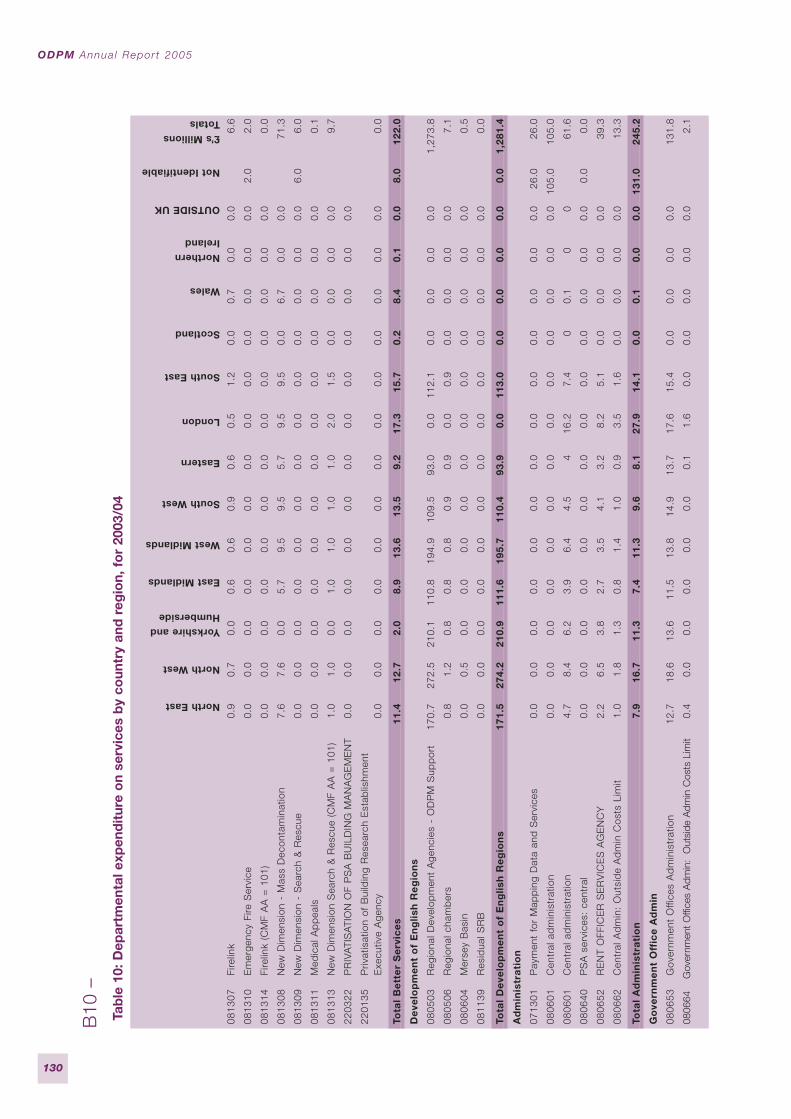
ODPM Annua l Repor t 2005
130
B10
–
Tab
le 1
0: D
epar
tmen
tal e
xpen
dit
ure
on
serv
ices
by
coun
try
and
reg
ion,
fo
r 20
03/0
4
North East
North West
Yorkshire andHumberside
East Midlands
West Midlands
South West
Eastern
London
South East
Scotland
Wales
NorthernIreland
OUTSIDE UK
Not Identifiable
£’s MillionsTotals
0813
07
Fi
relin
k0.
90.
70.
00.
60.
60.
90.
60.
51.
20.
00.
70.
00.
06.
6
0813
10
E
mer
genc
y Fi
re S
ervi
ce0.
00.
00.
00.
00.
00.
00.
00.
00.
00.
00.
00.
00.
02.
02.
0
0813
14
Fi
relin
k (C
MF
AA
= 1
01)
0.0
0.0
0.0
0.0
0.0
0.0
0.0
0.0
0.0
0.0
0.0
0.0
0.0
0.0
0813
08
N
ew D
imen
sion
- M
ass
Dec
onta
min
atio
n7.
67.
60.
05.
79.
59.
55.
79.
59.
50.
06.
70.
00.
071
.3
0813
09
N
ew D
imen
sion
- S
earc
h &
Res
cue
0.0
0.0
0.0
0.0
0.0
0.0
0.0
0.0
0.0
0.0
0.0
0.0
0.0
6.0
6.0
0813
11
M
edic
al A
pp
eals
0.0
0.0
0.0
0.0
0.0
0.0
0.0
0.0
0.0
0.0
0.0
0.0
0.0
0.1
0813
13
N
ew D
imen
sion
Sea
rch
& R
escu
e (C
MF
AA
= 1
01)
1.0
1.0
0.0
1.0
1.0
1.0
1.0
2.0
1.5
0.0
0.0
0.0
0.0
9.7
2203
22
P
RIV
ATI
SA
TIO
N O
F P
SA
BU
ILD
ING
MA
NA
GE
ME
NT
0.0
0.0
0.0
0.0
0.0
0.0
0.0
0.0
0.0
0.0
0.0
0.0
0.0
2201
35
P
rivat
isat
ion
of B
uild
ing
Res
earc
h E
stab
lishm
ent
Exe
cutiv
e A
genc
y0.
00.
00.
00.
00.
00.
00.
00.
00.
00.
00.
00.
00.
00.
0
Tota
l B
ett
er
Se
rvic
es
11.4
12.7
2.0
8.9
13.6
13.5
9.2
17.3
15.7
0.2
8.4
0.1
0.0
8.0
122.
0
De
velo
pm
en
t o
f E
ng
lish
Re
gio
ns
0805
03
R
egio
nal D
evel
opm
ent
Age
ncie
s -
OD
PM
Sup
por
t17
0.7
272.
521
0.1
110.
819
4.9
109.
593
.00.
011
2.1
0.0
0.0
0.0
0.0
1,27
3.8
0805
06
R
egio
nal c
ham
ber
s0.
81.
20.
80.
80.
80.
90.
90.
00.
90.
00.
00.
00.
07.
1
0806
04
M
erse
y B
asin
0.0
0.5
0.0
0.0
0.0
0.0
0.0
0.0
0.0
0.0
0.0
0.0
0.0
0.5
0811
39
R
esid
ual S
RB
0.0
0.0
0.0
0.0
0.0
0.0
0.0
0.0
0.0
0.0
0.0
0.0
0.0
0.0
Tota
l D
eve
lop
me
nt
of
En
glis
h R
eg
ion
s17
1.5
274.
221
0.9
111.
619
5.7
110.
493
.90.
011
3.0
0.0
0.0
0.0
0.0
0.0
1,28
1.4
Ad
min
istr
ati
on
0713
01
P
aym
ent
for
Map
pin
g D
ata
and
Ser
vice
s0.
00.
00.
00.
00.
00.
00.
00.
00.
00.
00.
00.
00.
026
.026
.0
0806
01
C
entr
al a
dm
inis
trat
ion
0.0
0.0
0.0
0.0
0.0
0.0
0.0
0.0
0.0
0.0
0.0
0.0
0.0
105.
010
5.0
0806
01
C
entr
al a
dm
inis
trat
ion
4.7
8.4
6.2
3.9
6.4
4.5
416
.27.
40
0.1
00
61.6
0806
40
P
SA
ser
vice
s: c
entr
al0.
00.
00.
00.
00.
00.
00.
00.
00.
00.
00.
00.
00.
00.
00.
0
0806
52
R
EN
T O
FFIC
ER
SE
RV
ICE
S A
GE
NC
Y2.
26.
53.
82.
73.
54.
13.
28.
25.
10.
00.
00.
00.
039
.3
0806
62
C
entr
al A
dm
in:
Out
sid
e A
dm
in C
osts
Lim
it1.
01.
81.
30.
81.
41.
00.
93.
51.
60.
00.
00.
00.
013
.3
Tota
l A
dm
inis
tra
tio
n7.
916
.711
.37.
411
.39.
68.
127
.914
.10.
00.
10.
00.
013
1.0
245.
2
Go
vern
me
nt
Off
ice
Ad
min
0806
53
G
over
nmen
t O
ffice
s A
dm
inis
trat
ion
12.7
18.6
13.6
11.5
13.8
14.9
13.7
17.6
15.4
0.0
0.0
0.0
0.0
131.
8
0806
64
G
over
nmen
t O
ffice
s A
dmin
: O
utsi
de A
dmin
Cos
ts L
imit
0.4
0.0
0.0
0.0
0.0
0.0
0.1
1.6
0.0
0.0
0.0
0.0
0.0
2.1
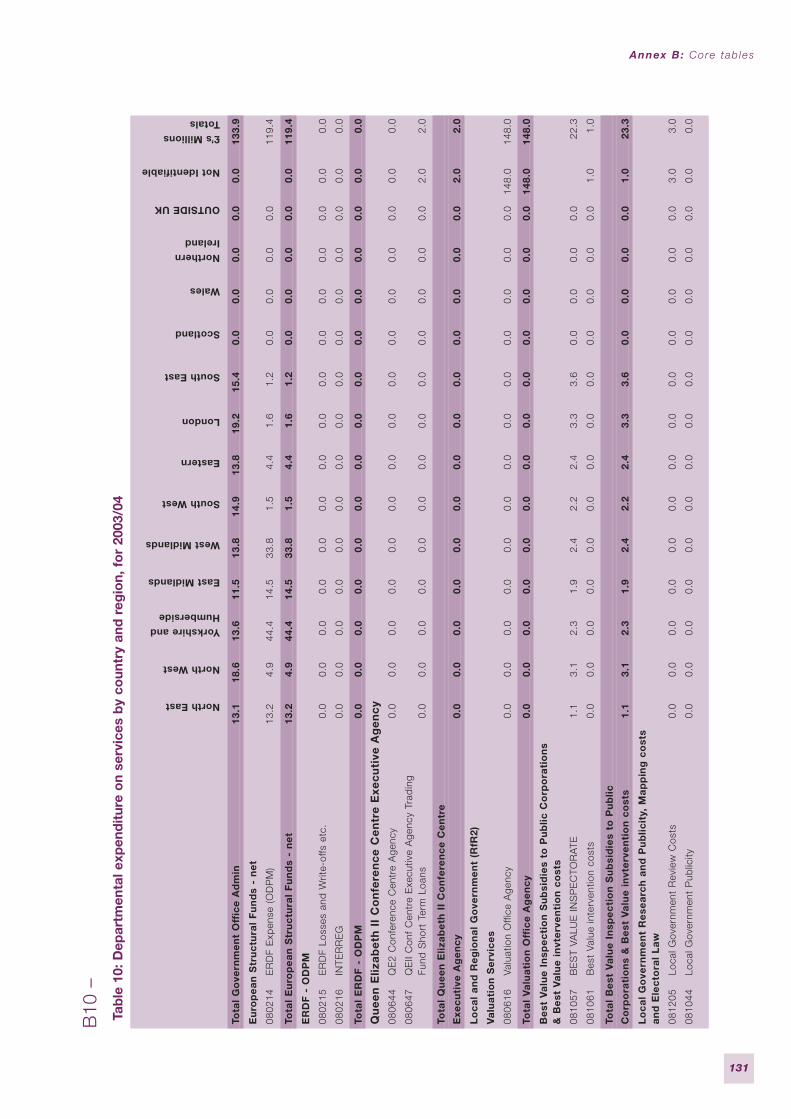
Annex B: Core tab les
131
B10
–
Tab
le 1
0: D
epar
tmen
tal e
xpen
dit
ure
on
serv
ices
by
coun
try
and
reg
ion,
fo
r 20
03/0
4
North East
North West
Yorkshire andHumberside
East Midlands
West Midlands
South West
Eastern
London
South East
Scotland
Wales
NorthernIreland
OUTSIDE UK
Not Identifiable
£’s MillionsTotals
Tota
l G
ove
rnm
en
t O
ffic
e A
dm
in13
.118
.613
.611
.513
.814
.913
.819
.215
.40.
00.
00.
00.
00.
013
3.9
Eu
rop
ea
n S
tru
ctu
ral
Fu
nd
s -
ne
t
0802
14
E
RD
F E
xpen
se (
OD
PM
)13
.24.
944
.414
.533
.81.
54.
41.
61.
20.
00.
00.
00.
011
9.4
Tota
l E
uro
pe
an
Str
uc
tura
l F
un
ds
- n
et
13.2
4.9
44.4
14.5
33.8
1.5
4.4
1.6
1.2
0.0
0.0
0.0
0.0
0.0
119.
4
ER
DF
- O
DP
M
0802
15
E
RD
F Lo
sses
and
Writ
e-of
fs e
tc.
0.0
0.0
0.0
0.0
0.0
0.0
0.0
0.0
0.0
0.0
0.0
0.0
0.0
0.0
0.0
0802
16
IN
TER
RE
G0.
00.
00.
00.
00.
00.
00.
00.
00.
00.
00.
00.
00.
00.
00.
0
Tota
l E
RD
F -
OD
PM
0.0
0.0
0.0
0.0
0.0
0.0
0.0
0.0
0.0
0.0
0.0
0.0
0.0
0.0
0.0
Qu
ee
n E
liza
be
th I
I C
on
fere
nc
e C
en
tre
Exe
cu
tive
Ag
en
cy
0806
44
Q
E2
Con
fere
nce
Cen
tre
Age
ncy
0.0
0.0
0.0
0.0
0.0
0.0
0.0
0.0
0.0
0.0
0.0
0.0
0.0
0.0
0.0
0806
47
Q
EII
Con
f C
entr
e E
xecu
tive
Age
ncy
Trad
ing
Fund
Sho
rt T
erm
Loa
ns0.
00.
00.
00.
00.
00.
00.
00.
00.
00.
00.
00.
00.
02.
02.
0
Tota
l Q
ue
en
Eliz
ab
eth
II
Co
nfe
ren
ce
Ce
ntr
e
Exe
cu
tive
Ag
en
cy
0.0
0.0
0.0
0.0
0.0
0.0
0.0
0.0
0.0
0.0
0.0
0.0
0.0
2.0
2.0
Lo
ca
l a
nd
Re
gio
na
l G
ove
rnm
en
t (R
fR2)
Va
lua
tio
n S
erv
ice
s
0806
16
Va
luat
ion
Offi
ce A
genc
y0.
00.
00.
00.
00.
00.
00.
00.
00.
00.
00.
00.
00.
014
8.0
148.
0
Tota
l V
alu
ati
on
Off
ice
Ag
en
cy
0.0
0.0
0.0
0.0
0.0
0.0
0.0
0.0
0.0
0.0
0.0
0.0
0.0
148.
014
8.0
Be
st V
alu
e I
nsp
ec
tio
n S
ub
sid
ies
to P
ub
lic C
orp
ora
tio
ns
& B
est
Va
lue
in
vte
rve
nti
on
co
sts
0810
57
B
ES
T VA
LUE
IN
SP
EC
TOR
ATE
1.1
3.1
2.3
1.9
2.4
2.2
2.4
3.3
3.6
0.0
0.0
0.0
0.0
22.3
0810
61
B
est
Valu
e in
terv
entio
n co
sts
0.0
0.0
0.0
0.0
0.0
0.0
0.0
0.0
0.0
0.0
0.0
0.0
0.0
1.0
1.0
Tota
l B
est
Va
lue
In
spe
cti
on
Su
bsi
die
s to
Pu
blic
Co
rpo
rati
on
s &
Be
st V
alu
e i
nvt
erv
en
tio
n c
ost
s1.
13.
12.
31.
92.
42.
22.
43.
33.
60.
00.
00.
00.
01.
023
.3
Lo
ca
l G
ove
rnm
en
t R
ese
arc
h a
nd
Pu
blic
ity,
Ma
pp
ing
co
sts
an
d E
lec
tora
l L
aw
0812
05
Lo
cal G
over
nmen
t R
evie
w C
osts
0.0
0.0
0.0
0.0
0.0
0.0
0.0
0.0
0.0
0.0
0.0
0.0
0.0
3.0
3.0
0810
44
Lo
cal G
over
nmen
t P
ublic
ity0.
00.
00.
00.
00.
00.
00.
00.
00.
00.
00.
00.
00.
00.
00.
0
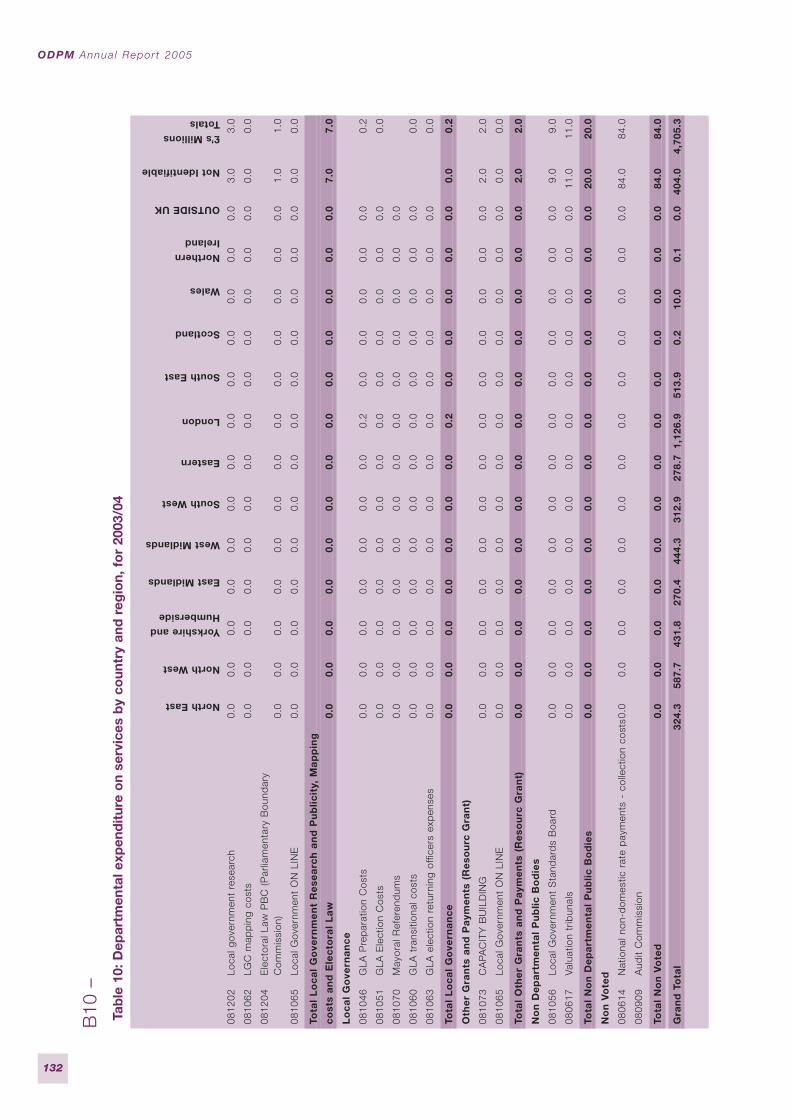
ODPM Annua l Repor t 2005
132
B10
–
Tab
le 1
0: D
epar
tmen
tal e
xpen
dit
ure
on
serv
ices
by
coun
try
and
reg
ion,
fo
r 20
03/0
4
North East
North West
Yorkshire andHumberside
East Midlands
West Midlands
South West
Eastern
London
South East
Scotland
Wales
NorthernIreland
OUTSIDE UK
Not Identifiable
£’s MillionsTotals
0812
02
Lo
cal g
over
nmen
t re
sear
ch0.
00.
00.
00.
00.
00.
00.
00.
00.
00.
00.
00.
00.
03.
03.
0
0810
62
LG
C m
app
ing
cost
s0.
00.
00.
00.
00.
00.
00.
00.
00.
00.
00.
00.
00.
00.
00.
0
0812
04
E
lect
oral
Law
PB
C (
Par
liam
enta
ry B
ound
ary
Com
mis
sion
)0.
00.
00.
00.
00.
00.
00.
00.
00.
00.
00.
00.
00.
01.
01.
0
0810
65
Lo
cal G
over
nmen
t O
N L
INE
0.0
0.0
0.0
0.0
0.0
0.0
0.0
0.0
0.0
0.0
0.0
0.0
0.0
0.0
0.0
Tota
l L
oc
al
Go
vern
me
nt
Re
sea
rch
an
d P
ub
licit
y, M
ap
pin
g
co
sts
an
d E
lec
tora
l L
aw
0.0
0.0
0.0
0.0
0.0
0.0
0.0
0.0
0.0
0.0
0.0
0.0
0.0
7.0
7.0
Lo
ca
l G
ove
rna
nc
e
0810
46
G
LA P
rep
arat
ion
Cos
ts0.
00.
00.
00.
00.
00.
00.
00.
20.
00.
00.
00.
00.
00.
2
0810
51
G
LA E
lect
ion
Cos
ts0.
00.
00.
00.
00.
00.
00.
00.
00.
00.
00.
00.
00.
00.
0
0810
70
M
ayor
al R
efer
end
ums
0.0
0.0
0.0
0.0
0.0
0.0
0.0
0.0
0.0
0.0
0.0
0.0
0.0
0810
60
G
LA t
rans
ition
al c
osts
0.0
0.0
0.0
0.0
0.0
0.0
0.0
0.0
0.0
0.0
0.0
0.0
0.0
0.0
0810
63
G
LA e
lect
ion
retu
rnin
g of
ficer
s ex
pen
ses
0.0
0.0
0.0
0.0
0.0
0.0
0.0
0.0
0.0
0.0
0.0
0.0
0.0
0.0
Tota
l L
oc
al
Go
vern
an
ce
0.0
0.0
0.0
0.0
0.0
0.0
0.0
0.2
0.0
0.0
0.0
0.0
0.0
0.0
0.2
Oth
er
Gra
nts
an
d P
aym
en
ts (
Re
sou
rc G
ran
t)
0810
73
C
APA
CIT
Y B
UIL
DIN
G0.
00.
00.
00.
00.
00.
00.
00.
00.
00.
00.
00.
00.
02.
02.
0
0810
65
Lo
cal G
over
nmen
t O
N L
INE
0.0
0.0
0.0
0.0
0.0
0.0
0.0
0.0
0.0
0.0
0.0
0.0
0.0
0.0
0.0
Tota
l O
the
r G
ran
ts a
nd
Pa
yme
nts
(R
eso
urc
Gra
nt)
0.0
0.0
0.0
0.0
0.0
0.0
0.0
0.0
0.0
0.0
0.0
0.0
0.0
2.0
2.0
No
n D
ep
art
me
nta
l P
ub
lic B
od
ies
0810
56
Lo
cal G
over
nmen
t S
tand
ard
s B
oard
0.0
0.0
0.0
0.0
0.0
0.0
0.0
0.0
0.0
0.0
0.0
0.0
0.0
9.0
9.0
0806
17
Va
luat
ion
trib
unal
s0.
00.
00.
00.
00.
00.
00.
00.
00.
00.
00.
00.
00.
011
.011
.0
Tota
l N
on
De
pa
rtm
en
tal
Pu
blic
Bo
die
s0.
00.
00.
00.
00.
00.
00.
00.
00.
00.
00.
00.
00.
020
.020
.0
No
n V
ote
d
0806
14
N
atio
nal n
on-d
omes
tic r
ate
pay
men
ts -
col
lect
ion
cost
s0.0
0.0
0.0
0.0
0.0
0.0
0.0
0.0
0.0
0.0
0.0
0.0
0.0
84.0
84.0
0809
09
A
udit
Com
mis
sion
Tota
l N
on
Vo
ted
0.0
0.0
0.0
0.0
0.0
0.0
0.0
0.0
0.0
0.0
0.0
0.0
0.0
84.0
84.0
Gra
nd
To
tal
324.
358
7.7
431.
827
0.4
444.
331
2.9
278.
71,
126.
951
3.9
0.2
10.0
0.1
0.0
404.
04,
705.
3
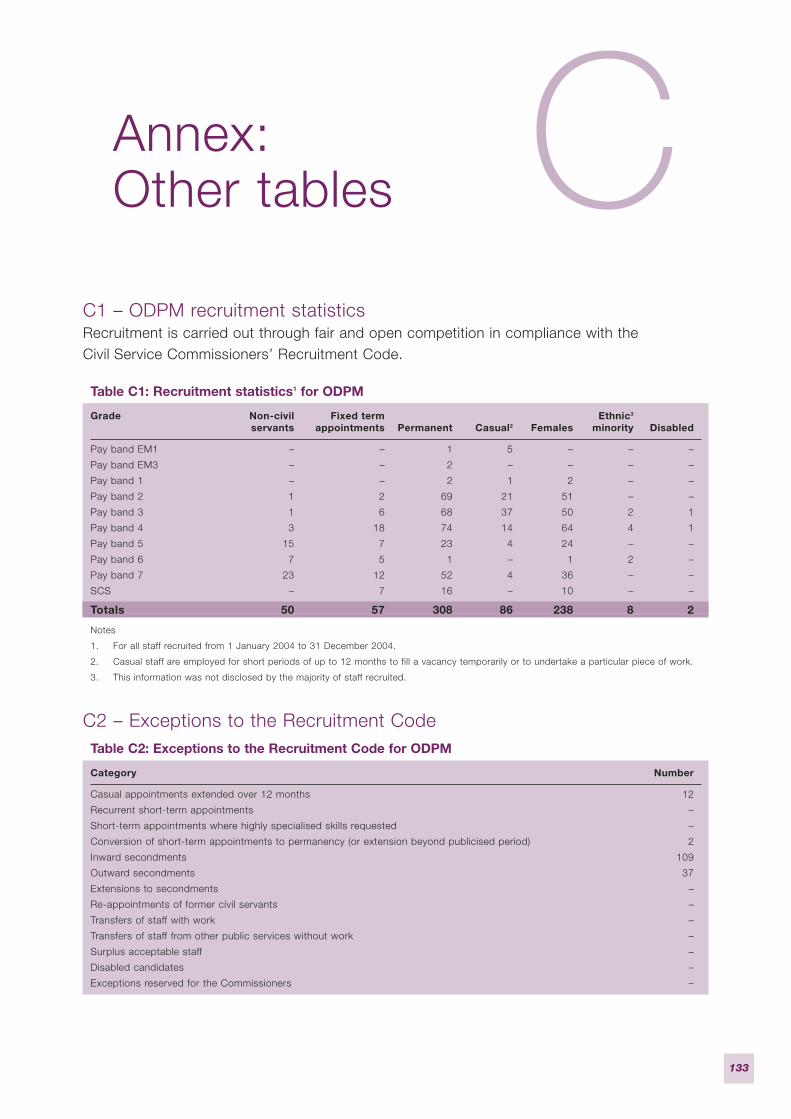
133
C1 – ODPM recruitment statisticsRecruitment is carried out through fair and open competition in compliance with theCivil Service Commissioners’ Recruitment Code.
Table C1: Recruitment statistics1 for ODPM
Grade Non-civil Fixed term Ethnic3
servants appointments Permanent Casual2 Females minority Disabled
Pay band EM1 – – 1 5 – – –
Pay band EM3 – – 2 – – – –
Pay band 1 – – 2 1 2 – –
Pay band 2 1 2 69 21 51 – –
Pay band 3 1 6 68 37 50 2 1
Pay band 4 3 18 74 14 64 4 1
Pay band 5 15 7 23 4 24 – –
Pay band 6 7 5 1 – 1 2 –
Pay band 7 23 12 52 4 36 – –
SCS – 7 16 – 10 – –
Totals 50 57 308 86 238 8 2
Notes
1. For all staff recruited from 1 January 2004 to 31 December 2004.
2. Casual staff are employed for short periods of up to 12 months to fill a vacancy temporarily or to undertake a particular piece of work.
3. This information was not disclosed by the majority of staff recruited.
C2 – Exceptions to the Recruitment CodeTable C2: Exceptions to the Recruitment Code for ODPM
Category Number
Casual appointments extended over 12 months 12
Recurrent short-term appointments –
Short-term appointments where highly specialised skills requested –
Conversion of short-term appointments to permanency (or extension beyond publicised period) 2
Inward secondments 109
Outward secondments 37
Extensions to secondments –
Re-appointments of former civil servants –
Transfers of staff with work –
Transfers of staff from other public services without work –
Surplus acceptable staff –
Disabled candidates –
Exceptions reserved for the Commissioners –
Annex:Other tables C
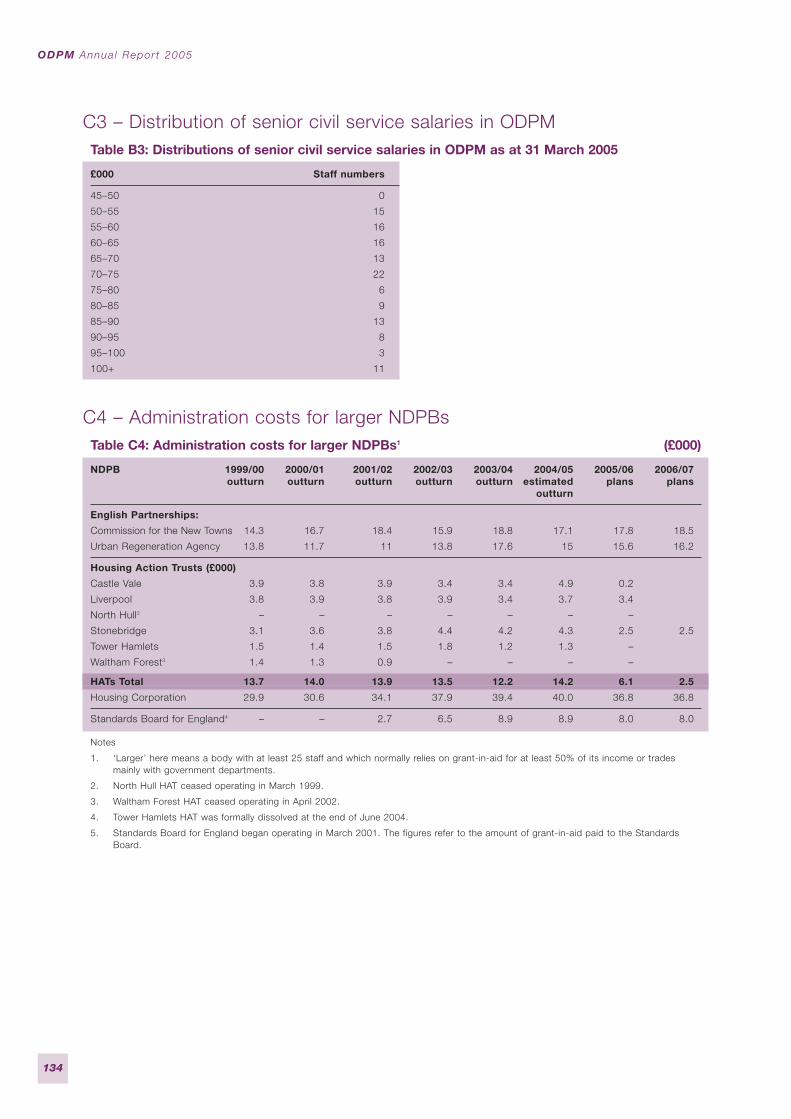
C3 – Distribution of senior civil service salaries in ODPMTable B3: Distributions of senior civil service salaries in ODPM as at 31 March 2005
£000 Staff numbers
45–50 0
50–55 15
55–60 16
60–65 16
65–70 13
70–75 22
75–80 6
80–85 9
85–90 13
90–95 8
95–100 3
100+ 11
C4 – Administration costs for larger NDPBsTable C4: Administration costs for larger NDPBs1 (£000)
NDPB 1999/00 2000/01 2001/02 2002/03 2003/04 2004/05 2005/06 2006/07outturn outturn outturn outturn outturn estimated plans plans
outturn
English Partnerships:
Commission for the New Towns 14.3 16.7 18.4 15.9 18.8 17.1 17.8 18.5
Urban Regeneration Agency 13.8 11.7 11 13.8 17.6 15 15.6 16.2
Housing Action Trusts (£000)
Castle Vale 3.9 3.8 3.9 3.4 3.4 4.9 0.2
Liverpool 3.8 3.9 3.8 3.9 3.4 3.7 3.4
North Hull2 – – – – – – –
Stonebridge 3.1 3.6 3.8 4.4 4.2 4.3 2.5 2.5
Tower Hamlets 1.5 1.4 1.5 1.8 1.2 1.3 –
Waltham Forest3 1.4 1.3 0.9 – – – –
HATs Total 13.7 14.0 13.9 13.5 12.2 14.2 6.1 2.5
Housing Corporation 29.9 30.6 34.1 37.9 39.4 40.0 36.8 36.8
Standards Board for England4 – – 2.7 6.5 8.9 8.9 8.0 8.0
Notes
1. ‘Larger’ here means a body with at least 25 staff and which normally relies on grant-in-aid for at least 50% of its income or tradesmainly with government departments.
2. North Hull HAT ceased operating in March 1999.
3. Waltham Forest HAT ceased operating in April 2002.
4. Tower Hamlets HAT was formally dissolved at the end of June 2004.
5. Standards Board for England began operating in March 2001. The figures refer to the amount of grant-in-aid paid to the StandardsBoard.
ODPM Annua l Repor t 2005
134

135
The main aim of ODPM’s asset management is to ensure that appropriate fixedassets are held to meet ODPM’s objectives. All assets are treated in accordance withthe following consistent underlying principles:
● ensure assets are retained in the public sector only where it is effective andefficient to do so;
● actively explore the scope for securing greater value from assets, includingthrough innovative techniques, information technology, sharing of assets,outsourcing and public private partnerships;
● maintain ODPM’s asset base in the condition necessary to meet its objectives;
● maintain, either directly or through bodies sponsored by ODPM, firm managementof assets, including strategies for disposing of assets that are not needed fordelivering services; and
● continue to investigate incentives, such as hard charging, to achieve betterutilisation of assets.
Annex:ODPM’s approach to asset management
D
136
What is the Departmental Investment Strategy?
ODPM published its Departmental Investment Strategy (DIS) for 2005–2008 inJanuary 2005 (available at www.odpm.gov.uk/departmentalinvestmentstrategy).
The DIS sets out ODPM’s capital investment plans resulting from the 2004 SpendingReview. It also outlines how ODPM’s existing assets are being utilised and managed,and the systems ODPM employs to safeguard its investment and to ensure that itsinvestment plans deliver the intended outcomes.
The DIS covers the period from 2005/06 to 2007/08. It deals with all planned capitalinvestment funded from ODPM’s Departmental Expenditure Limits, including: directcapital investment by ODPM and its sponsored bodies; capital grants to localauthorities, the private sector and other bodies; supported capital expenditure bylocal authorities; and capital investment supported through the Private FinanceInitiative.
Summary of the Departmental Investment Strategy
Chapter 1 summarises the strategic context for ODPM’s investment plans. It setsout what has been achieved through ODPM’s investment since the 2002 DIS waspublished and summarises ODPM’s future investment plans and explains how theywill contribute to delivering ODPM’s Strategic Priorities.
Chapter 2 looks at the management of ODPM’s own assets and those of itssponsored bodies. It describes how ODPM’s existing asset base contributes to itsStrategic Priorities and how its assets are managed (including the approach to assetmaintenance, replacement and disposal).
Annex:Office (Departmental)Investment Strategy
E
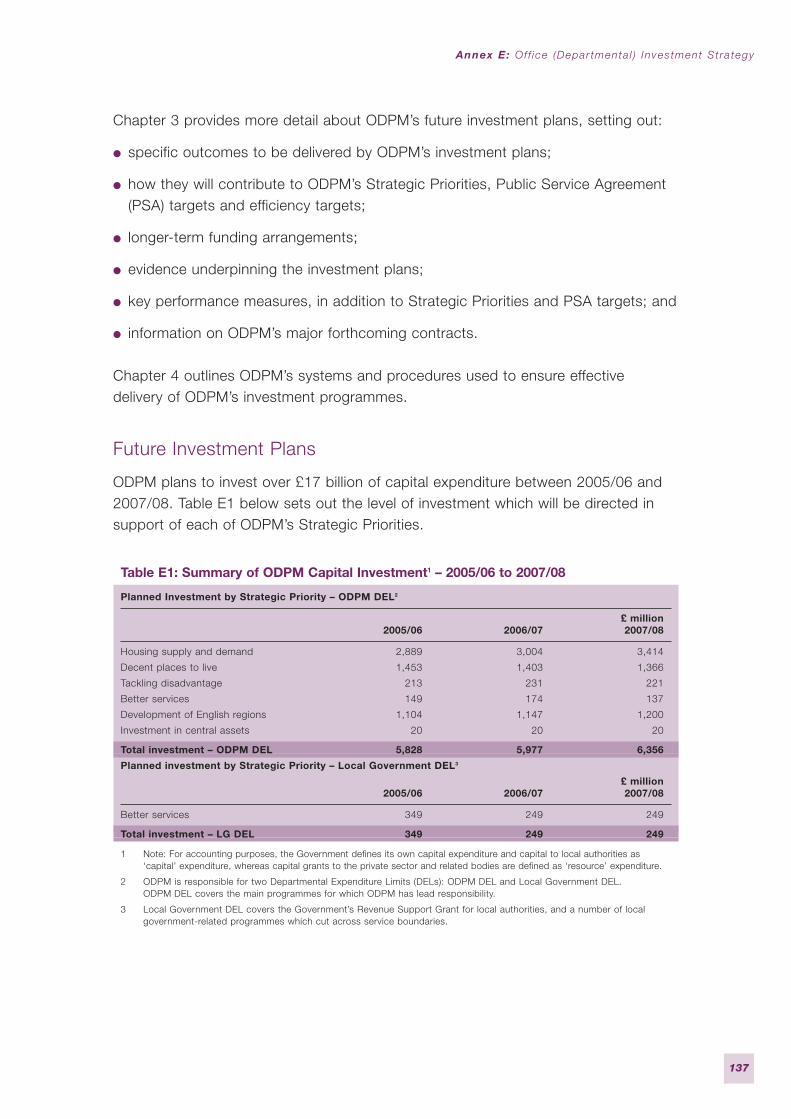
Chapter 3 provides more detail about ODPM’s future investment plans, setting out:
● specific outcomes to be delivered by ODPM’s investment plans;
● how they will contribute to ODPM’s Strategic Priorities, Public Service Agreement(PSA) targets and efficiency targets;
● longer-term funding arrangements;
● evidence underpinning the investment plans;
● key performance measures, in addition to Strategic Priorities and PSA targets; and
● information on ODPM’s major forthcoming contracts.
Chapter 4 outlines ODPM’s systems and procedures used to ensure effectivedelivery of ODPM’s investment programmes.
Future Investment Plans
ODPM plans to invest over £17 billion of capital expenditure between 2005/06 and2007/08. Table E1 below sets out the level of investment which will be directed insupport of each of ODPM’s Strategic Priorities.
Table E1: Summary of ODPM Capital Investment1 – 2005/06 to 2007/08
Planned Investment by Strategic Priority – ODPM DEL2
£ million2005/06 2006/07 2007/08
Housing supply and demand 2,889 3,004 3,414
Decent places to live 1,453 1,403 1,366
Tackling disadvantage 213 231 221
Better services 149 174 137
Development of English regions 1,104 1,147 1,200
Investment in central assets 20 20 20
Total investment – ODPM DEL 5,828 5,977 6,356
Planned investment by Strategic Priority – Local Government DEL3
£ million2005/06 2006/07 2007/08
Better services 349 249 249
Total investment – LG DEL 349 249 249
1 Note: For accounting purposes, the Government defines its own capital expenditure and capital to local authorities as‘capital’ expenditure, whereas capital grants to the private sector and related bodies are defined as ‘resource’ expenditure.
2 ODPM is responsible for two Departmental Expenditure Limits (DELs): ODPM DEL and Local Government DEL.ODPM DEL covers the main programmes for which ODPM has lead responsibility.
3 Local Government DEL covers the Government’s Revenue Support Grant for local authorities, and a number of localgovernment-related programmes which cut across service boundaries.
Annex E: Off ice (Depar tmenta l ) Investment St ra tegy
137
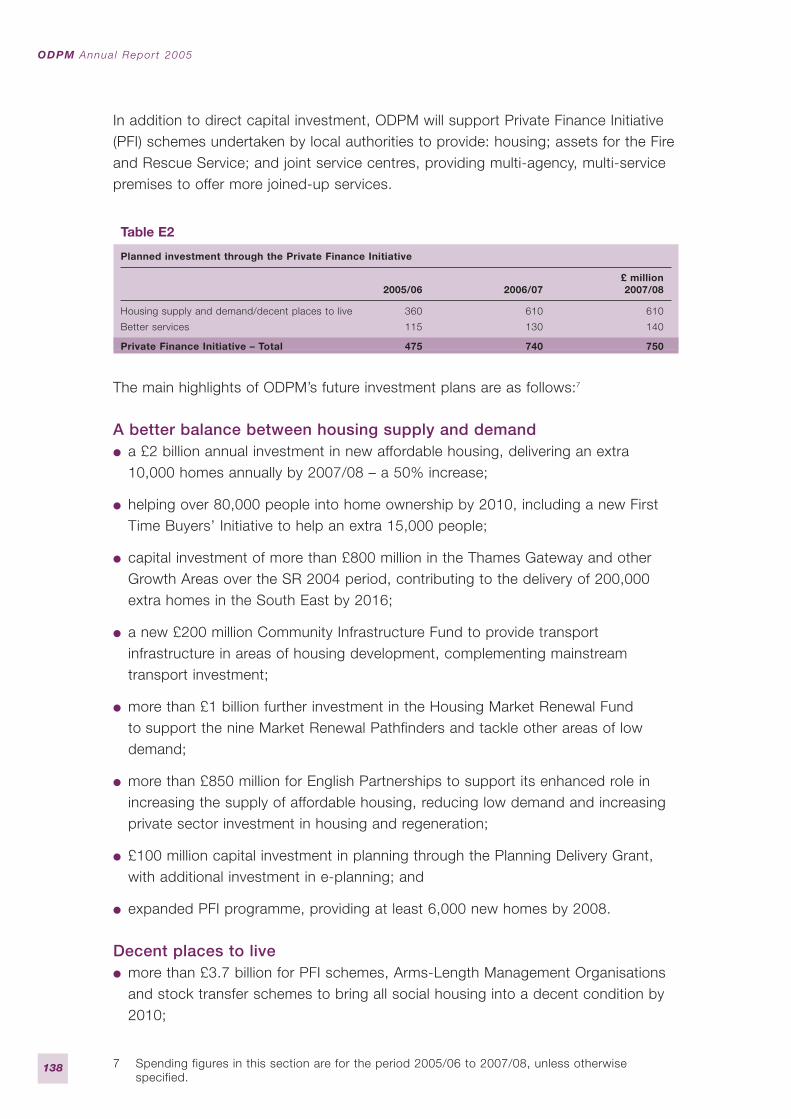
In addition to direct capital investment, ODPM will support Private Finance Initiative(PFI) schemes undertaken by local authorities to provide: housing; assets for the Fireand Rescue Service; and joint service centres, providing multi-agency, multi-servicepremises to offer more joined-up services.
Table E2
Planned investment through the Private Finance Initiative
£ million2005/06 2006/07 2007/08
Housing supply and demand/decent places to live 360 610 610
Better services 115 130 140
Private Finance Initiative – Total 475 740 750
The main highlights of ODPM’s future investment plans are as follows:7
A better balance between housing supply and demand● a £2 billion annual investment in new affordable housing, delivering an extra
10,000 homes annually by 2007/08 – a 50% increase;
● helping over 80,000 people into home ownership by 2010, including a new FirstTime Buyers’ Initiative to help an extra 15,000 people;
● capital investment of more than £800 million in the Thames Gateway and otherGrowth Areas over the SR 2004 period, contributing to the delivery of 200,000extra homes in the South East by 2016;
● a new £200 million Community Infrastructure Fund to provide transportinfrastructure in areas of housing development, complementing mainstreamtransport investment;
● more than £1 billion further investment in the Housing Market Renewal Fundto support the nine Market Renewal Pathfinders and tackle other areas of lowdemand;
● more than £850 million for English Partnerships to support its enhanced role inincreasing the supply of affordable housing, reducing low demand and increasingprivate sector investment in housing and regeneration;
● £100 million capital investment in planning through the Planning Delivery Grant,with additional investment in e-planning; and
● expanded PFI programme, providing at least 6,000 new homes by 2008.
Decent places to live● more than £3.7 billion for PFI schemes, Arms-Length Management Organisations
and stock transfer schemes to bring all social housing into a decent condition by2010;
ODPM Annua l Repor t 2005
138 7 Spending figures in this section are for the period 2005/06 to 2007/08, unless otherwisespecified.

● setting up a network of local procurement consortia to enable social landlords tomaximise efficiencies throughout the supply chain and reduce the cost of housingcapital works – £33 million between 2004/05 and 2007/08;
● some £250 million to invest in local environment services to produce cleaner,greener and safer public spaces.
Tackling disadvantage● approximately three-quarters of ODPM’s overall budget will continue to contribute
directly to tackling disadvantage;
● over £300 million capital investment in 39 deprived neighbourhoods in theSR 2004 period, through the New Deal for Communities programme – part ofa £900 million capital investment programme over 10 years;
● investment to regenerate coalfield communities through the Coalfields EnterpriseFund and Coalfields Regeneration Trust;
● £90 million to improve the quality of hostel accommodation; and
● around £350 million committed to the Disabled Facilities Grant to adapt housingfor disabled people.
Delivering better services through strong, effective local government● greater financial freedom and discretion for local authorities through the new
prudential capital finance system;
● £233 million annual investment in the Local PSA Pump-Priming Grant to deliverreal improvements across a variety of services;
● PFI credits of £65 million a year to support private sector investment in the JointService Centre programme – multi-agency and multi-service centres to improveaccess to information and frontline services;
● investment in the Fire and Rescue Service with a focus on prevention through anew single national digital radio system, much improved resilience andcommunications interoperability with other services, rationalisation of the 46control rooms to nine regional centres and £25 million investment in free smokealarms for around 1.25 million vulnerable households;
● over £39 million in 2005/06 for search and rescue resources and equipment readyfor use in civil emergencies; and
● additional investment in the Fire and Rescue Authorities through supported capitalexpenditure and PFI credits of over £480 million.
Annex E: Off ice (Depar tmenta l ) Investment St ra tegy
139

Promoting the development of the English regions● over £2.89 billion in capital projects through ODPM’s contribution to the Regional
Development Agencies, including on regional regeneration and regional inwardinvestment; and
● capital investment through the European Regional Development Fund on ODPMpriorities of over £525 million to stimulate economic development in the leastprosperous regions.
Systems and proceduresThe systems and procedures ODPM uses to ensure its investment programmes aredelivered effectively include performance and financial management; programme andproject appraisal; formal resource allocation systems; implementation of a CorporateProcurement Strategy; two-way communications between ODPM and industry; theapplication of the Gateway Review process to all acquisition-based mission-criticaland high-risk programmes and projects; programme and project management; riskmanagement and evidence-based evaluations.
The ODPM Board has prioritised strengthening these areas. This has led to thefollowing improvements:
● greater Board involvement in monitoring key programmes and projects, and in riskmanagement;
● a drive to improve programme and project management capacity across ODPM;
● enhanced budgeting guidance for all staff;
● improved forecasting, with significantly reduced underspending;
● improved appraisal systems;
● action to derive better results from procurement, including greater use of theGateway Review process; and
● strengthened central sources of professional advice and more extensive training.
ODPM Annua l Repor t 2005
140
141
Annex:SR 2004 and its outcome
FThe outcome of SR 2004 was announced in July 2004. The Spending Reviewsettlement provides ODPM with an annual average increase in funding of 3.3% overand above inflation between 2004/05 and 2007/08. This has placed ODPM in astrong position for continued delivery of its sustainable communities agenda.
Specifically, the settlement included (all figures are from 2004/05 unless otherwisestated):
● an extra £400 million per annum for new social rented housing by 2007/08,enabling a 50% increase in the annual supply of new social rented homes andturning round the rise in homelessness;
● a trebling of spending to tackle low housing demand to £450 million in 2007/08;
● extra funding for the Fire and Rescue Service, including extra funding for our majorcivil resilience projects (Firelink and New Dimension);
● action to increase housing supply, and help improve affordability, in high-demandregions – funding the Communities Plan to deliver 200,000 additional homes in theThames Gateway and the other growth areas, and responding to new proposalsfor sustainable growth where there is demand locally. By 2007/08, we will haveinvested some £850 million in the Thames Gateway and £425 million in the othergrowth areas;
● a new £200 million Community Infrastructure Fund, responding to the BarkerReport recommendation, to provide transport infrastructure to support thedevelopment of new sustainable communities;
● funding to reduce the number of non-decent social rented homes by 1.6 millionbetween 1997 and 2008, sustaining progress towards tackling all 2.1 million by2010;

● continued NRF funding of £525 million per annum providing sustained targetedinvestment in the most deprived communities and a new suite of floor targets tosupport the Government’s aim of narrowing the gap between those communitiesand the rest of the country;
● increased funding for the RDAs in order to promote economic development in theregions; and
● for the first time, a specific liveability target, backed by streamlined funding,providing an increased focus on improving the quality of the local environment.
ODPM Annua l Repor t 2005
142
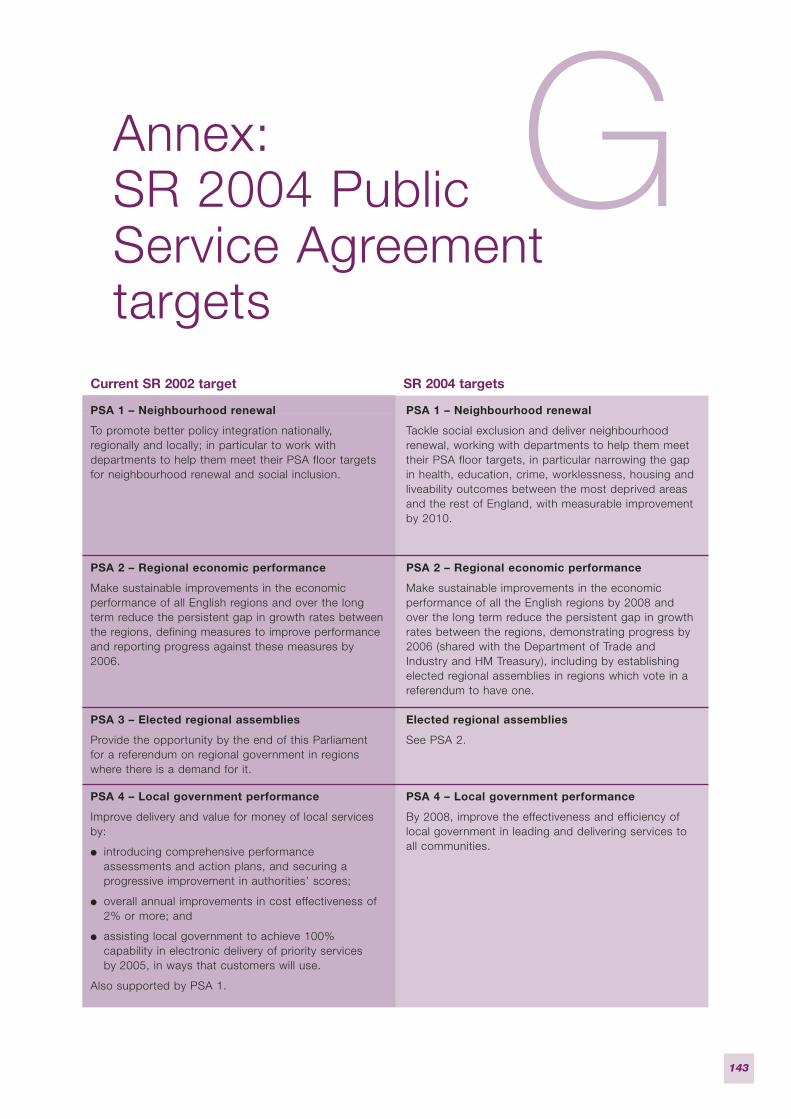
143
Current SR 2002 target SR 2004 targets
PSA 4 – Local government performance
Improve delivery and value for money of local servicesby:
● introducing comprehensive performanceassessments and action plans, and securing aprogressive improvement in authorities’ scores;
● overall annual improvements in cost effectiveness of2% or more; and
● assisting local government to achieve 100%capability in electronic delivery of priority servicesby 2005, in ways that customers will use.
Also supported by PSA 1.
PSA 4 – Local government performance
By 2008, improve the effectiveness and efficiency oflocal government in leading and delivering services toall communities.
PSA 3 – Elected regional assemblies
Provide the opportunity by the end of this Parliamentfor a referendum on regional government in regionswhere there is a demand for it.
Elected regional assemblies
See PSA 2.
PSA 2 – Regional economic performance
Make sustainable improvements in the economicperformance of all English regions and over the longterm reduce the persistent gap in growth rates betweenthe regions, defining measures to improve performanceand reporting progress against these measures by2006.
PSA 2 – Regional economic performance
Make sustainable improvements in the economicperformance of all the English regions by 2008 andover the long term reduce the persistent gap in growthrates between the regions, demonstrating progress by2006 (shared with the Department of Trade andIndustry and HM Treasury), including by establishingelected regional assemblies in regions which vote in areferendum to have one.
PSA 1 – Neighbourhood renewal
To promote better policy integration nationally,regionally and locally; in particular to work withdepartments to help them meet their PSA floor targetsfor neighbourhood renewal and social inclusion.
PSA 1 – Neighbourhood renewal
Tackle social exclusion and deliver neighbourhoodrenewal, working with departments to help them meettheir PSA floor targets, in particular narrowing the gapin health, education, crime, worklessness, housing andliveability outcomes between the most deprived areasand the rest of England, with measurable improvementby 2010.
Annex:SR 2004 Public Service Agreementtargets
G
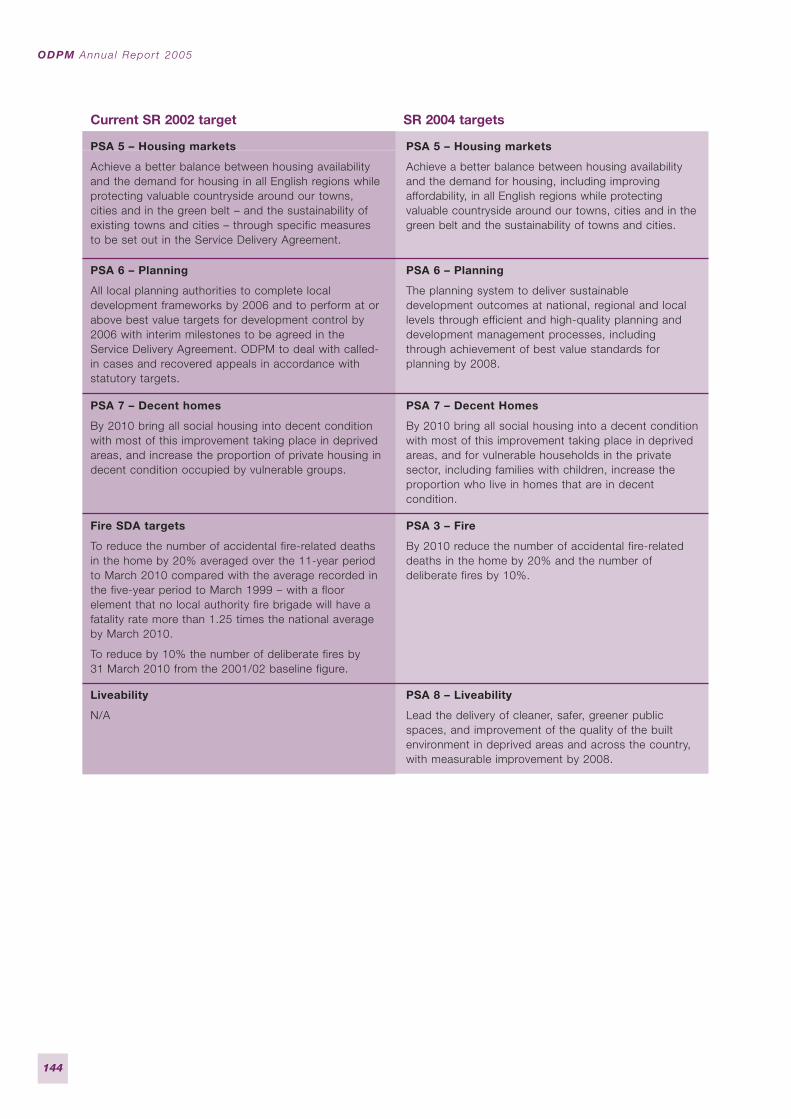
Current SR 2002 target SR 2004 targets
Liveability
N/A
PSA 8 – Liveability
Lead the delivery of cleaner, safer, greener publicspaces, and improvement of the quality of the builtenvironment in deprived areas and across the country,with measurable improvement by 2008.
Fire SDA targets
To reduce the number of accidental fire-related deathsin the home by 20% averaged over the 11-year periodto March 2010 compared with the average recorded inthe five-year period to March 1999 – with a floorelement that no local authority fire brigade will have afatality rate more than 1.25 times the national averageby March 2010.
To reduce by 10% the number of deliberate fires by31 March 2010 from the 2001/02 baseline figure.
PSA 3 – Fire
By 2010 reduce the number of accidental fire-relateddeaths in the home by 20% and the number ofdeliberate fires by 10%.
PSA 7 – Decent homes
By 2010 bring all social housing into decent conditionwith most of this improvement taking place in deprivedareas, and increase the proportion of private housing indecent condition occupied by vulnerable groups.
PSA 7 – Decent Homes
By 2010 bring all social housing into a decent conditionwith most of this improvement taking place in deprivedareas, and for vulnerable households in the privatesector, including families with children, increase theproportion who live in homes that are in decentcondition.
PSA 6 – Planning
All local planning authorities to complete localdevelopment frameworks by 2006 and to perform at orabove best value targets for development control by2006 with interim milestones to be agreed in theService Delivery Agreement. ODPM to deal with called-in cases and recovered appeals in accordance withstatutory targets.
PSA 6 – Planning
The planning system to deliver sustainabledevelopment outcomes at national, regional and locallevels through efficient and high-quality planning anddevelopment management processes, includingthrough achievement of best value standards forplanning by 2008.
PSA 5 – Housing markets
Achieve a better balance between housing availabilityand the demand for housing in all English regions whileprotecting valuable countryside around our towns,cities and in the green belt – and the sustainability ofexisting towns and cities – through specific measuresto be set out in the Service Delivery Agreement.
PSA 5 – Housing markets
Achieve a better balance between housing availabilityand the demand for housing, including improvingaffordability, in all English regions while protectingvaluable countryside around our towns, cities and in thegreen belt and the sustainability of towns and cities.
ODPM Annua l Repor t 2005
144
145
Public Accounts Committee recommendations
English Regions: An early progress report on the New Deal for CommunitiesprogrammeNAO Report, 11 February 2004 (HC309)PAC Hearing, 24 March 2004PAC 38th Report, 14 September 2004 (HC492 2003-04)Treasury Minute, 10 November 2004 (Cm 6355)
Nine recommendations and conclusions emerged in the Committee’s report:
● Working with other government departments – ODPM should work with otherdepartments to streamline area-based initiatives aimed at deprived communities;specifically looking at ways to better co-ordinate the different funding streams.
● Review of the wider impact on social cohesion of targeted and piloted approachesto neighbourhood renewal – The Committee was concerned that initiatives whichfavour particular neighbourhoods may cause resentment in neighbouringcommunities which do not receive targeted funding and that problems in New DealCommunity (NDC) neighbourhoods are addressed and not displaced into adjacentcommunities. Evaluations should take account of the programme’s impact onneighbouring communities.
● Enabling successful community engagement in the programme by ensuringcommunity representatives on NDC boards have the authority to represent theircommunity – The Committee recommended that existing governancearrangements for NDC boards should be reviewed and strengthened.
● ODPM need to clarify the role of local authorities in NDC partnerships – TheCommittee recommended clearer guidance on the role of the local authority as theaccountable body which would help clarify matters and reduce possible tensions.
Annex:Public AccountsCommitteerecommendations
H
● Increasing business activity in NDC areas – The Committee recommended thatNDCs should take more active steps to bring businesses into deprived areas.For example, identify what skill shortages exist in local businesses and targettraining to meet these needs. They could also identify what barriers there are tobusinesses moving into their areas.
● Evaluation should focus on identifying the additional benefits from the specificapproach adopted – ODPM need to identity and evaluate the specific benefitsthat arise as a direct result of the community partnership approach of the NDCprogramme compared to other approaches to neighbourhood renewal.
● Need to track consistent data for all regeneration initiatives – To determine therelative success of the different approaches to neighbourhood renewal.
● Government Offices should ensure that NDC funds should not be used to replaceexisting resources provided by local statutory agencies – The Committeerecommended that Government Offices need to monitor spending on projects touphold ODPM’s requirement that this money should not be used to financeprojects that should be supported by existing public or private sector grants.
● NDC partnerships should plan how momentum is to be maintained after theprogramme has ended – NDC partnerships need to work closely with servicedelivery agencies to agree long-term strategies and funding to continue successfulprojects and initiatives once programme funds have ended. Government Officesshould, if necessary, act as brokers between the partnerships and serviceagencies to help secure realistic funding for the future.
ODPM response
ODPM responded positively to the various conclusions and recommendations,highlighting many of the positive changes to the programme that had taken placebetween the evidence meeting and the publication of the report. In particular ODPMnoted the following:
● There was a need to co-ordinate the approach to regeneration – and this hadbeen offered through the Safer, Stronger Communities Fund announced in theSR 2004 plus the Local Area Agreement Pilots that were launched last year.
● The National Evaluation for NDCs was already designed to address the concernsraised by the Committee.
● ODPM had already taken steps to alleviate the concerns raised by the Committeeabout Board nominations through the publication of Governance Guidance.
● Two documents had been issued clarifying the role of the Accountable Body with aview to hold Accountable Body training for those local authorities in most need.
ODPM Annua l Repor t 2005
146

● There was a need to develop further the business and job opportunities withinNDC neighbourhoods, and as a result ODPM proposed a worklessness event inconjunction with DWP and Jobcentre Plus. In addition, it was recognised thatthere were general initiatives to promote business engagement and employmentopportunities, including improved targeting of Regional Development Agencies onenterprise creation and employment rates in deprived areas and that BusinessBrokers contribute to promoting links with the private sector.
● The national evaluation of NDC is already designed to address the impact ofcommunity involvement. First, a ‘community involvement’ index across all 39 areashas been created, enabling the evaluation to identify the degree to which changeat the NDC level is associated with greater or lesser community involvement byindividual NDC partnerships. Second, all changes in NDC areas will bebenchmarked against changes in other similarly deprived neighbourhoods.
● The collection of consistent small area data of deprivation-related indicators isbeing taken forward through the Neighbourhood Statistics Initiative.
● Regional Government Offices work closely with Local Strategic Partnership toensure planned delivery of local projects, including evaluating performance andvalue for money and monitoring spend. Government Offices will continue toscrutinise local plans to eliminate any misdirection of funds.
● Planning work is already in progress to ensure that successful initiatives from theNDC programme continue past the end of the 10-year central funding. ODPM isalso currently working to develop events at which NDC partnerships andmainstream agencies will be invited, in order to help all parties engage moreeffectively and develop positive working relationships.
Annex H: Publ ic Accounts Commit tee recommendat ions
147

148
ODPM(C)Eland House Bressenden PlaceLondon SW1E 5DU Telephone: 0207 944 4400 Fax: 0207 944 6589 E-mail: [email protected]
Regional Co-ordination Unit 2nd Floor Riverwalk House 157–161 Millbank London SW1P 4RR Telephone: 0207 217 3595 E-mail: [email protected]
Government Office for the East ofEngland (GO-East) Eastbrook Shaftesbury Road Cambridge CB2 2DF Telephone: 01223 372 500 Fax: 01223 372 501 E-mail: [email protected]
Government Office for the EastMidlands (GOEM) The Belgrave Centre Stanley Place Talbot Street Nottingham NG1 5GG Telephone: 0115 971 9971 Fax: 0115 971 2404 E-mail: [email protected]
Government Office for London (GOL) Riverwalk House 157–161 Millbank London SW1P 4RR Telephone: 0207 217 3328 Fax: 0207 217 3450 E-mail: [email protected]
Government Office for the North West(GONW)Sunley Tower Piccadilly Plaza Manchester M1 4BE Telephone: 0161 952 4000 Fax: 0161 952 4099 E-mail: [email protected]
Annex:Useful addresses I

Government Office for the North East(GONE)Wellbar House GallowgateNewcastle upon Tyne NE1 4TD Telephone: 0191 201 3300 Fax: 0191 202 3830 E-mail: [email protected]
Government Office for the South West(GOSW)Bristol Office 2 Rivergate Temple Quay Bristol BS1 6ED Telephone: 0117 900 1700 Fax: 0117 900 1900 E-mail: [email protected]
Government Office for the South East(GOSE)Bridge House 1 Walnut Tree Close Guildford GU1 4GA Telephone: 01483 882255 E-mail: [email protected]
Government Office for the WestMidlands (GOWM) 77 Paradise Circus QueenswayBirmingham B1 2DT Telephone: 0121 212 5050 Fax: 0121 212 1010Freephone: 0800 038 5000 E-mail: [email protected]
Government Office for Yorkshire andthe Humber (GOYH) PO Box 213 City House New Station Street Leeds LS1 4US Telephone: 0113 280 0600 Fax: 0113 283 6394 E-mail: [email protected]
Executive Agencies Fire Service College Moreton-in-Marsh Gloucestershire GL56 0RH Telephone: 01608 650 831 Fax: 01608 651 788 E-mail: [email protected]
The Planning Inspectorate Customer Support Unit Room 3/15 Eagle Wing Temple Quay House 2 The Square Temple Quay Bristol BS1 6PN Telephone: 0117 372 6372(Switchboard: 0117 372 8000) Fax: 0117 372 8128 E-mail: [email protected]
Queen Elizabeth II Conference Centre Broad Sanctuary Westminster London SW1P 3EE Telephone: 0207 222 5000 Fax: 0207 798 4200 E-mail: [email protected]
Annex I : Usefu l addresses
149

Non-Departmental Public Bodies Advisory Panel on Standards for thePlanning Inspectorate APOS Secretariat Zone 4/H1 Eland House Bressenden Place London SW1E 5DU Telephone: 0207 944 0062 Fax: 0207 944 5004 E-mail: [email protected]
Building Regulations AdvisoryCommitteeBRAC Secretariat 18/B Portland House Stag Place London SW1E 5LP Telephone: 0207 944 5742 or 5747 Fax: 0207 944 5739 E-mail: [email protected]
Boundary Commission for England The Secretary PO Box 31060 1 Drummond Gate London SW1V 2FF Telephone: 0207 533 5177 Fax: 0207 533 5176 E-mail: [email protected]
Boundary Commission for Wales The Joint Secretary Caradog House 1–6 St Andrews Place Cardiff CF10 3BE Telephone: 02920 395031 Fax: 02920 395250 E-mail: [email protected]
Audit Commission1 Vincent Square London SW1P 2PN Telephone: 0207 828 1212 Fax: 0207 976 6187 E-mail: [email protected]
English Partnerships 110 Buckingham Palace Road London SW1W 9SA Telephone: 0207 881 1600 Fax: 0207 730 9162 E-mail: (link available on website:www.englishpartnerships.co.uk)
Housing Corporation Maple House 149 Tottenham Court Road London W1T 7BN Telephone: 0207 393 2000 Fax: 0207 393 2111 E-mail: [email protected]
The Standards Board for England 1st Floor, Cottons Centre Cottons Lane London SE1 2QG Telephone: 0845 078 8181 Fax: 020 7378 5001 E-mail: [email protected]
Castle Vale Housing Action Trust Castle Vale School 220 Farnborough Road Birmingham B35 7NL Telephone: 0121 776 6784 Fax: 0121 776 6786 E-mail: [email protected]
ODPM Annua l Repor t 2005
150
Liverpool Housing Action Trust 2nd Floor Cunard Building Water Street Liverpool L3 1EG Telephone: 0151 227 1099 E-mail: [email protected]
Stonebridge Housing Action Trust Kassinga House 37–41 Winchelsea Road London NW10 8UN Telephone: 0208 961 0278 Fax: 0208 961 0291 E-mail: [email protected]
Tower Hamlets Housing Action Trust 542–544 Roman Road London E3 5ES Telephone: 0208 983 5280 Fax: 0208 983 5281 E-mail: (links available on website:www.thhat.co.uk)
Advisory Panel on Beacon Councils Beacon Council Team Zone 3/D2 Eland House Bressenden Place London SW1E 5DU Telephone: 020 7944 4759 E-mail: [email protected]
Community Forum Community Forum Secretariat Neighbourhood Renewal Unit Zone 6/J2 Eland House Bressenden Place London SW1E 5DU Telephone: 0207 944 8306 E-mail:[email protected]
Annex I : Usefu l addresses
151

152
ODPM publications
Details of all publications issued by ODPM, including those referred to in this report,can be found on our publications database: www.publications.odpm.gov.uk
You can also find details of publications by contacting ODPM(C) Enquiry Services orby e-mail at: [email protected]
The Office of the Deputy Prime Minister ODPM Publications PO Box 236 Wetherby West Yorkshire LS23 7NB Telephone: 0870 122 6236 Fax: 0870 122 6237 Text: 0870 120 7405 E-mail: [email protected]
Contact details for the main publishers of Government documents are listed below:
The Stationery Office PO Box 29 Norwich NR3 1GN Telephone: 0870 600 5522 Textphone for those with impaired hearing: 0870 600 5522
Thomas Telford Paddock Wood Tunbridge Wells Kent TN12 6UU Telephone: 020 7665 2019 E-mail: [email protected]
Annex:How to obtainpublications
J

Spon Press 2 Park SquareMilton ParkAbingdonOxon OX14 4RN Telephone: 020 7017 6000 Fax: 020 7017 6699E-mail: [email protected]
Edward Elgar Publishing Ltd Glensanda House Montpellier Parade CheltenhamGloucester GL50 IUA Telephone: 01242 226 934 Fax: 01242 262 111 E-mail: [email protected]
RIBA Enterprises Ltd 15 Bonhill Street London EC2P 2EA Tel: 020 7256 7222 Fax: 020 7374 2737 E-mail: [email protected]
Dandy Booksellers Unit 5 31–33 Priory Park Road London NW6 7UP Tel: 020 7624 2993 Fax: 020 7624 5049 E-mail:[email protected]
Annex J: How to obta in pub l icat ions
153
154
ABI Area Based Initiative ADP Approved Development ProgrammeAEF Aggregate External Finance ALMOs Arm’s Length Management Organisations APOS Advisory Panel on StandardsATWP Air Transport White Paper B&Bs Bed and breakfasts BD Building DivisionBIDs Business Improvement Districts BME Black and minority ethnic BQS Better Quality Services BRAC Building Regulations Advisory Committee BSCF Business Safety Community ForumBVPIs Best Value Performance Indicators CABE Commission for Architecture and the Built Environment CACFOA Chief and Assistant Chief Fire Officers’ AssociationCAPAM Commonwealth Association for Public Administration and
ManagementCDRPs Crime and Disorder Reduction Partnerships CLGF Commonwealth Local Government Forum CoE Centre of Excellence CPAs Comprehensive Performance Assessments CRD Civil Resilience DirectorateCSR Corporate Strategy and Resources unit DA (SER) Domestic Affairs (Social Exclusion and Regeneration) DATs Drug Action Teams DCA Department for Constitutional Affairs DCMS Department for Culture, Media and Sport DDA Disabilities Discrimination ActDefra Department for Environment Food and Rural Affairs
Annex:List of abbreviations
K

DEL Departmental Expenditure Limit DfES Department for Education and Skills DfT Department for Transport DoC Directorate of Communication DPM Deputy Prime Minister DRIU Departmental Regulatory Impact Unit DTI Department for Trade and Industry DTLR Department for Transport, Local Government & Regions DWP Department for Work and Pensions EDRM Electronic Document and Records ManagementEDU Equality and Diversity Unit EHCS English House Condition Survey EMS Environment Management System ENCAMS Environmental Campaigns EO Employers’ Organisation for Local GovernmentEP English Partnerships ERDF European Regions Development Fund ESD Electronic Service Delivery ESRC Economic and Social Research Council ETP Employer Training Pilots EU European Union FGR Formula Grant Review FRESA Frameworks for Regional Employment and Skills Action FSC Fire Service College FWC Families with Children GASPS Grants and Subsidies Payment System GLA Greater London Authority GOs Government Offices GVA Gross Value Added HA Highways Agency HATs Housing Action Trusts HMFSI Her Majesty’s Fire Service Inspectorate HMO Houses with Multiple OccupationHMT Her Majesty’s Treasury H&S Health & Safety ICRC Inner Cities Religious Council ICT Information and Communication Technology IDeA Improvement and Development Agency IEG Implementing Electronic Government IMS Investment Management SystemsIPDS Integrated Personnel Development System IRMP Integrated Risk Management Plans LAA Local Area Agreement
Annex K: L is t o f abbrev ia t ions
155

LAs Local authorities LDF Local Development Framework LG Local government LGA Local Government Association LNRS Local Neighbourhood Renewal Strategies LPA Local Planning Authority LPSA Local Public Service Agreement LSPs Local Strategic Partnerships LSVT Large Scale Voluntary TransferMPGs Minerals Planning Guidance NDC New Deal Communities NDPBs Non-Departmental Public Bodies NGC Northern Growth CorridorNHS National Health Service NRF Neighbourhood Renewal FundNRU Neighbourhood Renewal Unit ODIS Office Departmental Investment Strategy ODPM Office of the Deputy Prime Minister OFT Office of Fair Trading OGC Office of Government Commerce ONS Office for National Statistics PAC Public Accounts Committee PCT Primary Care Trusts PDG Planning Delivery Grant PFI Private Finance Initiative PI Performance Indicators PINS Planning Inspectorate PPG Planning Policy Guidance PPS Planning Policy Statement PSA Public Service Agreement PSRE Public Sector Research Exploitation QEIICC Queen Elizabeth II Conference Centre RCU Regional Co-ordination Unit RDA Regional Development Agency RED Regional Emphasis Documents RES Race Equality SchemeRIA Regulatory Impact Assessment RPG Regional Policy Group RRAP Residential Rehabilitation Assistance Programmes RRO Regulatory Reform Order RSLs Registered Social Landlords R&D Research and Development SBE Standards Board for England
ODPM Annua l Repor t 2005
156
SBS Small Business ServiceSCS Senior civil serviceSDA Service Delivery Agreement SEU Social Exclusion Unit SFLG Small Firms Loan Guarantee SHI Starter Home Initiative SMES Small and medium size enterprises SoLACE Society of Local Authority Chief Executives and
Senior ManagersSR 2000 Spending Review 2000 SR 2002 Spending Review 2002 SR 2004 Spending Review 2004 SRO Senior Responsible OfficerTHP The Housing Partnership TRS The Rent Service UDC Urban Development Corporation UGST Urban Green Spaces Taskforce URA Urban Regeneration Agency URC Urban Regeneration Companies VCS Voluntary and Community Sector VOA Valuation Office Agency VTS Valuation Tribunal Service
Annex K: L is t o f abbrev ia t ions
157
Printed in the UK for The Stationery Office Limitedon behalf of the Controller of Her Majesty’s Stationery Office
179925 05/05
Published by TSO (The Stationery Office) and available from:
Onlinewww.tso.co.uk/bookshop
Mail, Telephone, Fax & E-mailTSOPO Box 29, Norwich, NR3 1GNTelephone orders/General enquiries: 0870 600 5522Order through the Parliamentary Hotline Lo-call 0845 7 023474Fax orders: 0870 600 5533E-mail: [email protected] 0870 240 3701
TSO Shops123 Kingsway, London,WC2B 6PQ020 7242 6393 Fax 020 7242 639468-69 Bull Street, Birmingham B4 6AD0121 236 9696 Fax 0121 236 96999-21 Princess Street, Manchester M60 8AS0161 834 7201 Fax 0161 833 063416 Arthur Street, Belfast BT1 4GD028 9023 8451 Fax 028 9023 540118-19 High Street, Cardiff CF10 1PT029 2039 5548 Fax 029 2038 434771 Lothian Road, Edinburgh EH3 9AZ0870 606 5566 Fax 0870 606 5588
TSO Accredited Agents (see Yellow Pages)
and through good booksellers
ISBN 0-10-165262-3
9 780101 652629