Embed Size (px)
Citation preview
Office of Utilities Regulation
Consumer & Public Affairs Department
Quarterly Performance Report (Revised to Include Guaranteed Standards Reports*)
2015 October – December
Publication Date: March 14, 2016
36 Trafalgar Road, Kingston 10
Consumer Affairs Unit Quarterly Performance Report (Revision)
Document Number: 2016/GEN/001/QPR.001
Publication Date: March 14, 2016
2
Prepared by the Consumer & Public Affairs Department Office of Utilities Regulation Oct. - Dec. 2015
Table of Contents
The Role and Objectives of the OUR ............................................................................................................. 4
The Consumer and Public Affairs Department ............................................................................................. 4
The Consumer Affairs Unit (CAU) ................................................................................................................. 4
The Intent and Purpose of the Quarterly Performance Report .................................................................... 5
Methods of Calculation ................................................................................................................................. 5
Executive Summary ....................................................................................................................................... 7
Chapter 1: Utilities’ Responsiveness ............................................................................................................ 9
(i) Acknowledgements ....................................................................................................................... 9
(ii) Response to Case Letters .......................................................................................................... 9
Chapter 2: Main Customer Concerns .......................................................................................................... 11
(i) Billing ........................................................................................................................................... 11
(ii) Interruption of Service ............................................................................................................ 12
(iii) Poor Service Quality ................................................................................................................ 12
(iv) Disconnection.......................................................................................................................... 13
(v) Equipment Damage ................................................................................................................. 13
Chapter 3: Guaranteed Standards Performance ........................................................................................ 14
(i) What are the Guaranteed Standards? ........................................................................................ 14
(ii) How are customers compensated? ........................................................................................ 14
(iii) Quarterly Report of Breaches ................................................................................................. 14
(i) Utilities’ Performance on Guaranteed Standards ....................................................................... 15
Chapter 4: Customer Contact Distribution ................................................................................................. 17
Chapter 5: Appeals Performance ................................................................................................................ 19
(i) Closure of Appeals ............................................................................................................................. 19
(ii) Outstanding Appeals ....................................................................................................................... 19
Appeals Process Resolution Rate ............................................................................................................. 20
Chapter 5: Consumer Affairs Highlights .................................................................................................... 21
(i) Credits/Compensation ................................................................................................................ 21
(ii) Increase in Service Interruption Contacts ............................................................................... 21
List of Tables ............................................................................................................................................... 22
Table 3: Contact Activity Summary (All Utilities) 2015 October – December .................................... 22
Table 4: Distribution of Contacts by Utilities ...................................................................................... 23
3
Prepared by the Consumer & Public Affairs Department Office of Utilities Regulation Oct. - Dec. 2015
Table 5: Distribution of Contacts Jan – Dec 2015 ............................................................................... 24
Table 6: Distribution of Closed Appeals by Utilities .......................................................................... 24
Table 7: Distribution of Appeals (Outstanding) ................................................................................ 25
Table 8: CAU’s Performance on Service Standards (Appeals) ............................................................ 26
List of Figures ...................................................................................................................................... 26
Appendices .................................................................................................................................................. 27
Appendix I : Definition Of Terms Used In Documenting Customer Contacts ..................................... 27
Appendix 2: Statement on Confidentiality of Telecommunications Service Provider Information ... 28
Appendix 3: Appeals Process .............................................................................................................. 28
Appendix 4: CAU Internal Performance Standards ............................................................................. 29
Appendix 5: Process Timelines for NWC Appeals ............................................................................... 30
Appendix 6: List of Acronyms .............................................................................................................. 32
4
Prepared by the Consumer & Public Affairs Department Office of Utilities Regulation Oct. - Dec. 2015
The Role and Objectives of the OUR
The Office of Utilities Regulation Act of 1995 established the Office of Utilities Regulation
(OUR) as a body corporate. Under the Act, the OUR is charged with the responsibility of
regulating the provision of utility services in the electricity, telecommunications and water and
sewerage sectors. The objectives are to:
Ensure that consumers of utility services enjoy an acceptable quality of service at
reasonable cost;
Establish and maintain transparent, consistent and objective rules for the regulation of
utility service providers;
Promote the long-term efficient provision of utility services for national development
consistent with Government policy;
Provide an avenue of appeal for consumers who have grievances with the utility service
providers;
Work with other related agencies in the promotion of a sustainable environment; and,
to act independently and impartially.
The Consumer and Public Affairs Department Through the Consumer and Public Affairs Department (CPA), the OUR discharges its mandate to
protect utility consumers. The Consumer Affairs Unit; the Public Affairs Unit (PAU) and the OUR
Information Centre (OURIC) all comprise the CPA. This Department is the section of the OUR
that directly interfaces with utility consumers and one of its main responsibilities is to investigate
appeals of decisions made by utility service providers brought to it by aggrieved consumers.
The Consumer Affairs Unit (CAU) Among other things, the CAU, receives, records and processes consumer complaints and
appeals, monitors trends in consumer complaints and provides the Office with advice on
measures to be taken to improve consumers’ welfare.
The CAU uses as a primary input to its policy development and advice to the Office, the results
of analyses of the complaints received from customers in regard to the services provided by the
companies. Feedback from consumers garnered at town meetings, public fora and the media are
also key sources for opinions and activities of utility services.
5
Prepared by the Consumer & Public Affairs Department Office of Utilities Regulation Oct. - Dec. 2015
A consumer survey which seeks consumer feedback on a whole range of consumers’ issues is
conducted every 18 - 24 months. Additionally, a public education programme is pursued which
includes organizing consultations with stakeholders on pertinent regulatory matters.
The PAU manages the public education programme, media relations and the website while the
Information Centre (OURIC), inter alia, provides information in keeping with the requirements
of the Access to Information Act. The OUR through CPA also funds the activities of the Consumer
Advisory Committee on Utilities (CACU) which was established to operate as an independent
advocacy group providing critical feedback and support for consumer issues.
The Intent and Purpose of the Quarterly Performance Report The Quarterly Performance Report (QPR) is prepared by the Consumer Affairs Unit (CAU) and
provides the public with information and analysis about the contacts received from utility
providers. The information includes: The number of customer contacts received over the review
period; JPS and NWC’s performance against the guaranteed standards; utilities’ responsiveness to
our appeals process; and the performance of the Unit against the appeals process timelines.
The QPR is intended to be a fair, reasonable and transparent report of the above-mentioned
activities. The statistics for each reporting period is gathered from our Customer Information
Database and is reflective of the contacts received from utility consumers island-wide. These
contacts are received via various channels, namely: letters, telephone, visits, e-mails, fax and social
media.
Methods of Calculation The methods of calculation used include: summation; quarterly and year-on-year comparisons.
The resort latterly to normalize the numbers of contacts by expressing this as per the customer
base reflects our allowance for fair comparisons. Consequently the report cites the number of
contacts per 100,000 of the service provider’s customer base. Even so, it is recognized that the
telecommunications sector with its heterogonous customer bases presents a peculiarity for
comparison with the water and electricity utilities that have more homogenous customer bases.
The information should be interpreted as a sample, or statistical representation of the intake to the
Unit.
6
Prepared by the Consumer & Public Affairs Department Office of Utilities Regulation Oct. - Dec. 2015
Requests for additional details or any comments regarding this document should be directed to:
Collette Goode, Consumer Affairs Specialist – Policy
Email: [email protected]
OR
Yvonne Nicholson – Director, Consumer & Public Affairs
Email: [email protected]
7
Prepared by the Consumer & Public Affairs Department Office of Utilities Regulation Oct. - Dec. 2015
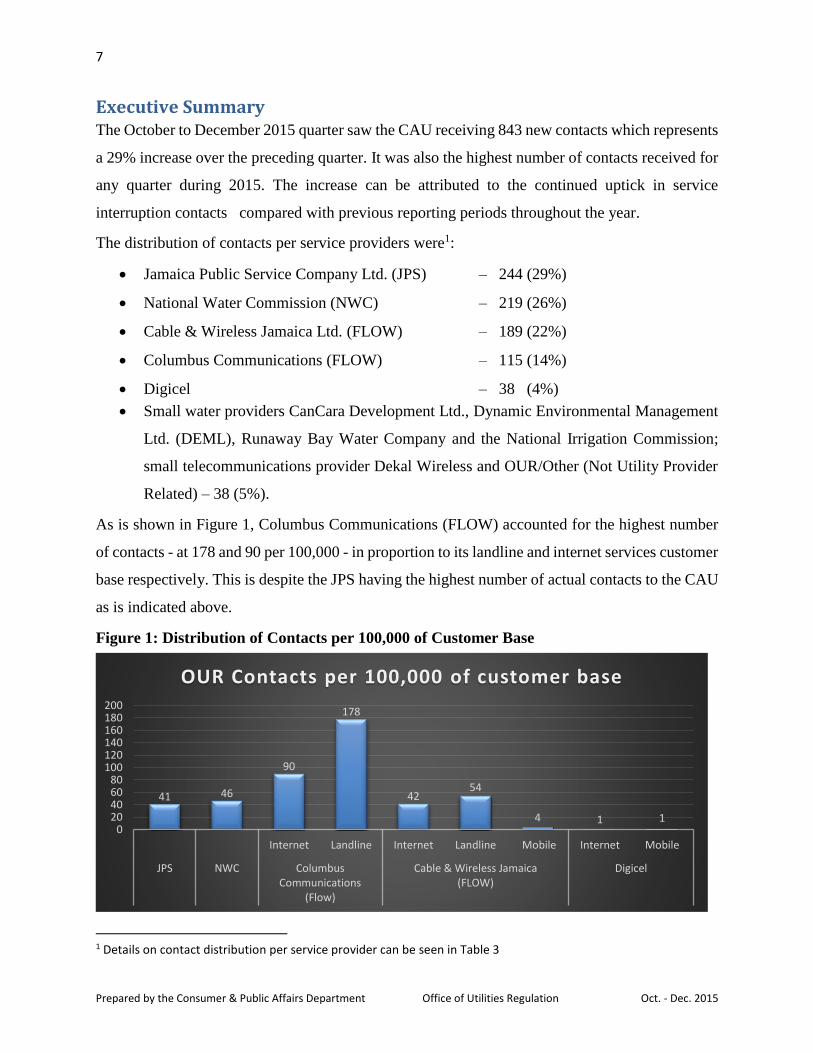
Executive Summary The October to December 2015 quarter saw the CAU receiving 843 new contacts which represents
a 29% increase over the preceding quarter. It was also the highest number of contacts received for
any quarter during 2015. The increase can be attributed to the continued uptick in service
interruption contacts compared with previous reporting periods throughout the year.
The distribution of contacts per service providers were1:
Jamaica Public Service Company Ltd. (JPS) – 244 (29%)
National Water Commission (NWC) – 219 (26%)
Cable & Wireless Jamaica Ltd. (FLOW) – 189 (22%)
Columbus Communications (FLOW) – 115 (14%)
Digicel – 38 (4%)
Small water providers CanCara Development Ltd., Dynamic Environmental Management
Ltd. (DEML), Runaway Bay Water Company and the National Irrigation Commission;
small telecommunications provider Dekal Wireless and OUR/Other (Not Utility Provider
Related) – 38 (5%).
As is shown in Figure 1, Columbus Communications (FLOW) accounted for the highest number
of contacts - at 178 and 90 per 100,000 - in proportion to its landline and internet services customer
base respectively. This is despite the JPS having the highest number of actual contacts to the CAU
as is indicated above.
Figure 1: Distribution of Contacts per 100,000 of Customer Base
1 Details on contact distribution per service provider can be seen in Table 3
41 46
90
178
4254
4 1 10
20406080
100120140160180200
Internet Landline Internet Landline Mobile Internet Mobile
JPS NWC ColumbusCommunications
(Flow)
Cable & Wireless Jamaica(FLOW)
Digicel
OUR Contacts per 100,000 of customer base
8
Prepared by the Consumer & Public Affairs Department Office of Utilities Regulation Oct. - Dec. 2015
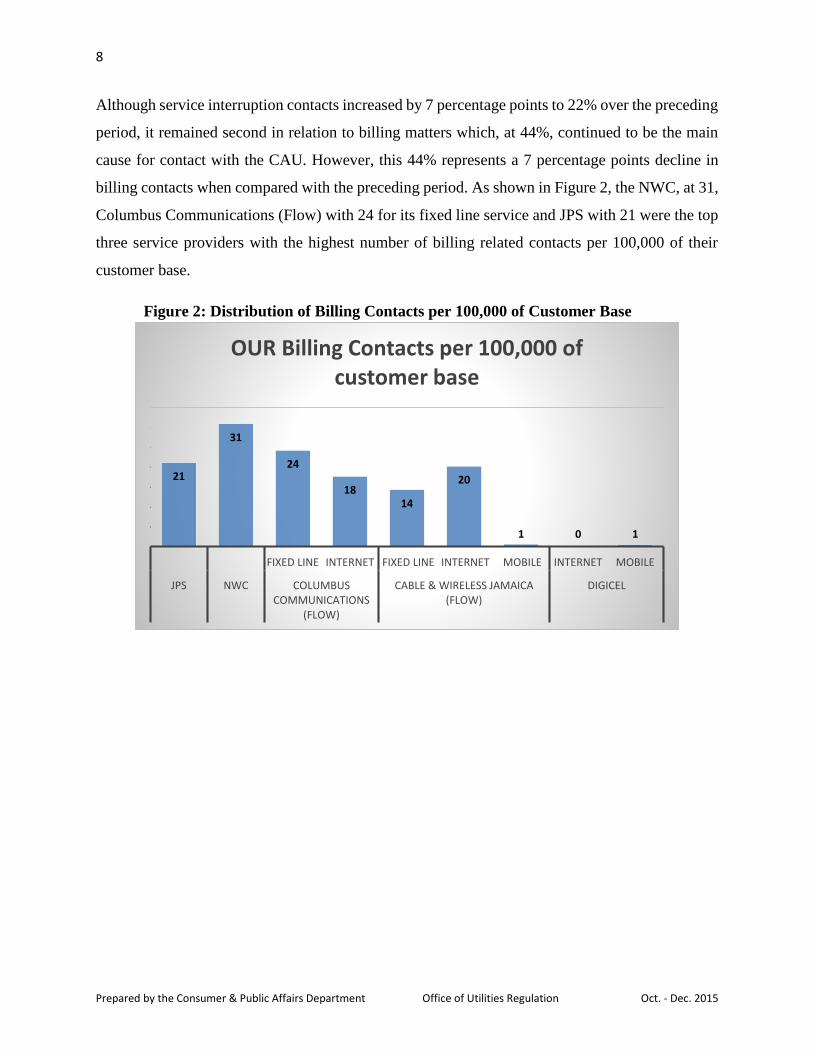
Although service interruption contacts increased by 7 percentage points to 22% over the preceding
period, it remained second in relation to billing matters which, at 44%, continued to be the main
cause for contact with the CAU. However, this 44% represents a 7 percentage points decline in
billing contacts when compared with the preceding period. As shown in Figure 2, the NWC, at 31,
Columbus Communications (Flow) with 24 for its fixed line service and JPS with 21 were the top
three service providers with the highest number of billing related contacts per 100,000 of their
customer base.
Figure 2: Distribution of Billing Contacts per 100,000 of Customer Base
21
31
24
1814
20
1 0 1
FIXED LINE INTERNET FIXED LINE INTERNET MOBILE INTERNET MOBILE
JPS NWC COLUMBUS COMMUNICATIONS
(FLOW)
CABLE & WIRELESS JAMAICA (FLOW)
DIGICEL
OUR Billing Contacts per 100,000 of customer base
9
Prepared by the Consumer & Public Affairs Department Office of Utilities Regulation Oct. - Dec. 2015
Chapter 1: Utilities’ Responsiveness
(i) Acknowledgements
Ten (10) new appeals were accepted during the review period and for which requests for
information (in the form of case letters), were sent to the respective service providers. Of the 10
case letters, six (6) were sent to JPS of which three (or 50%) acknowledgements were received.
The three acknowledgements from JPS were within the established timeline. The remaining four
(4) case letters were sent to the NWC of which 3 (or 75%) were acknowledged. However, only
one of the NWC acknowledgements was received within the agreed timeline.
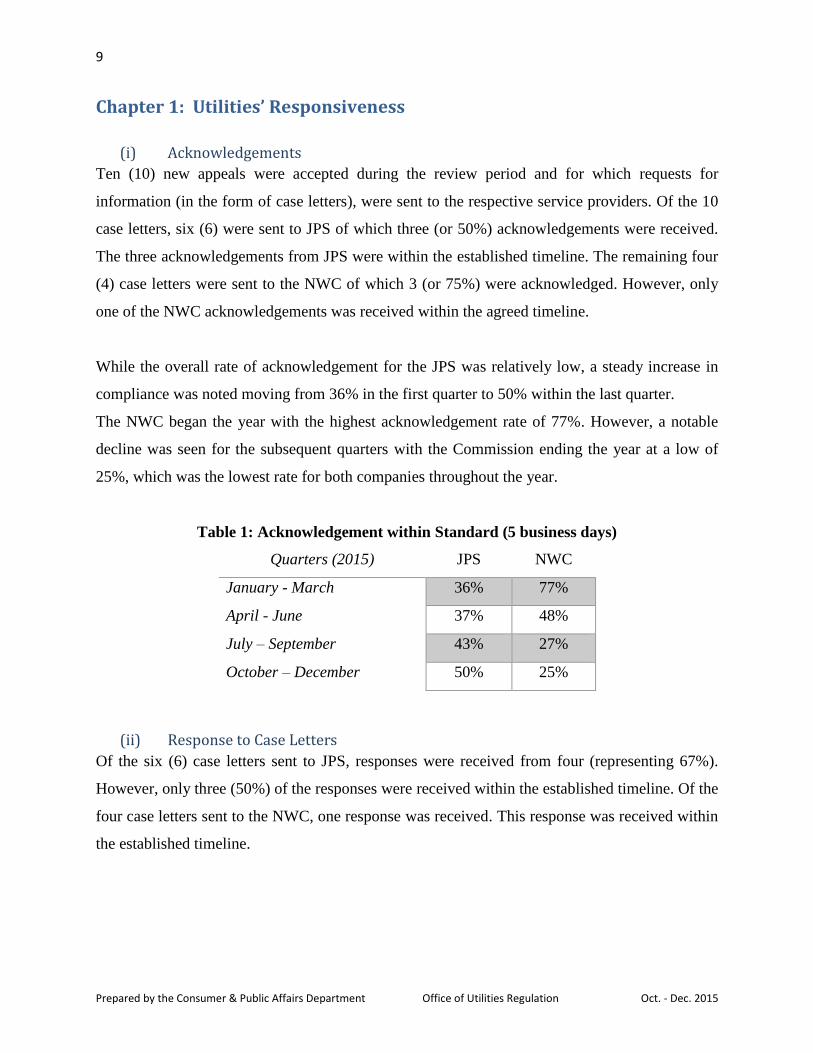
While the overall rate of acknowledgement for the JPS was relatively low, a steady increase in
compliance was noted moving from 36% in the first quarter to 50% within the last quarter.
The NWC began the year with the highest acknowledgement rate of 77%. However, a notable
decline was seen for the subsequent quarters with the Commission ending the year at a low of
25%, which was the lowest rate for both companies throughout the year.
Table 1: Acknowledgement within Standard (5 business days)
Quarters (2015) JPS NWC
January - March 36% 77%
April - June 37% 48%
July – September 43% 27%
October – December 50% 25%
(ii) Response to Case Letters
Of the six (6) case letters sent to JPS, responses were received from four (representing 67%).
However, only three (50%) of the responses were received within the established timeline. Of the
four case letters sent to the NWC, one response was received. This response was received within
the established timeline.
10
Prepared by the Consumer & Public Affairs Department Office of Utilities Regulation Oct. - Dec. 2015
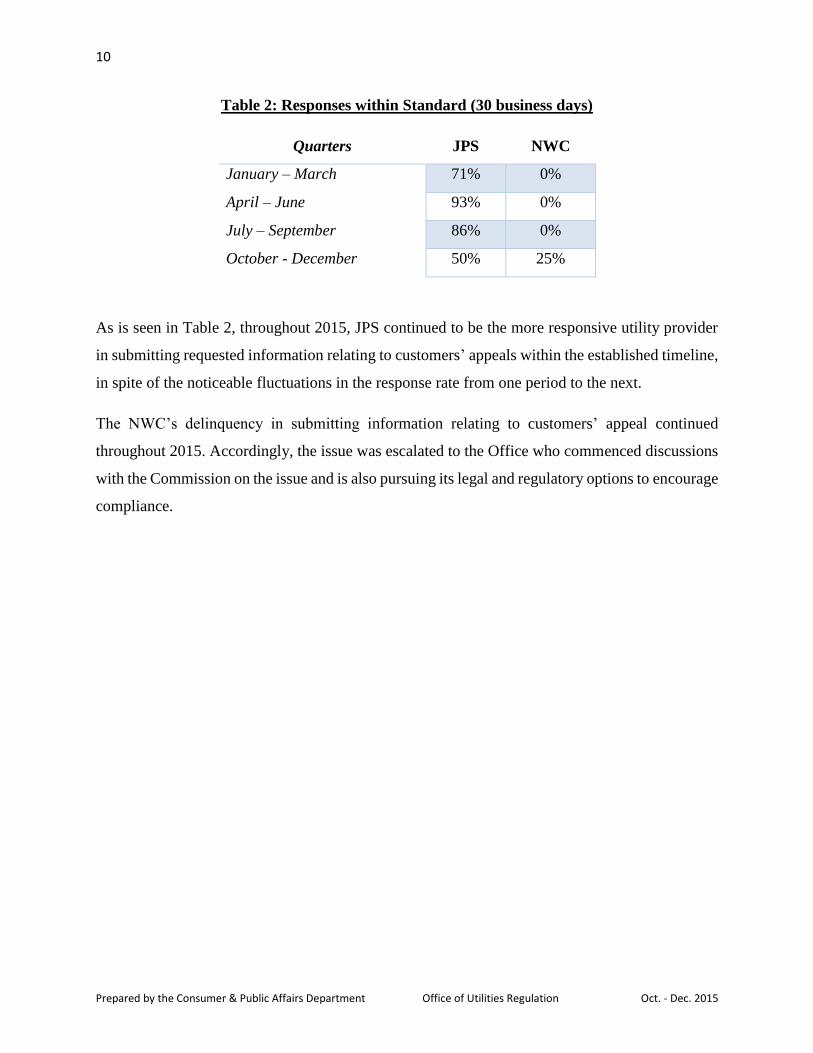
Table 2: Responses within Standard (30 business days)
Quarters JPS NWC
January – March 71% 0%
April – June 93% 0%
July – September 86% 0%
October - December 50% 25%
As is seen in Table 2, throughout 2015, JPS continued to be the more responsive utility provider
in submitting requested information relating to customers’ appeals within the established timeline,
in spite of the noticeable fluctuations in the response rate from one period to the next.
The NWC’s delinquency in submitting information relating to customers’ appeal continued
throughout 2015. Accordingly, the issue was escalated to the Office who commenced discussions
with the Commission on the issue and is also pursuing its legal and regulatory options to encourage
compliance.
11
Prepared by the Consumer & Public Affairs Department Office of Utilities Regulation Oct. - Dec. 2015
Chapter 2: Main Customer Concerns
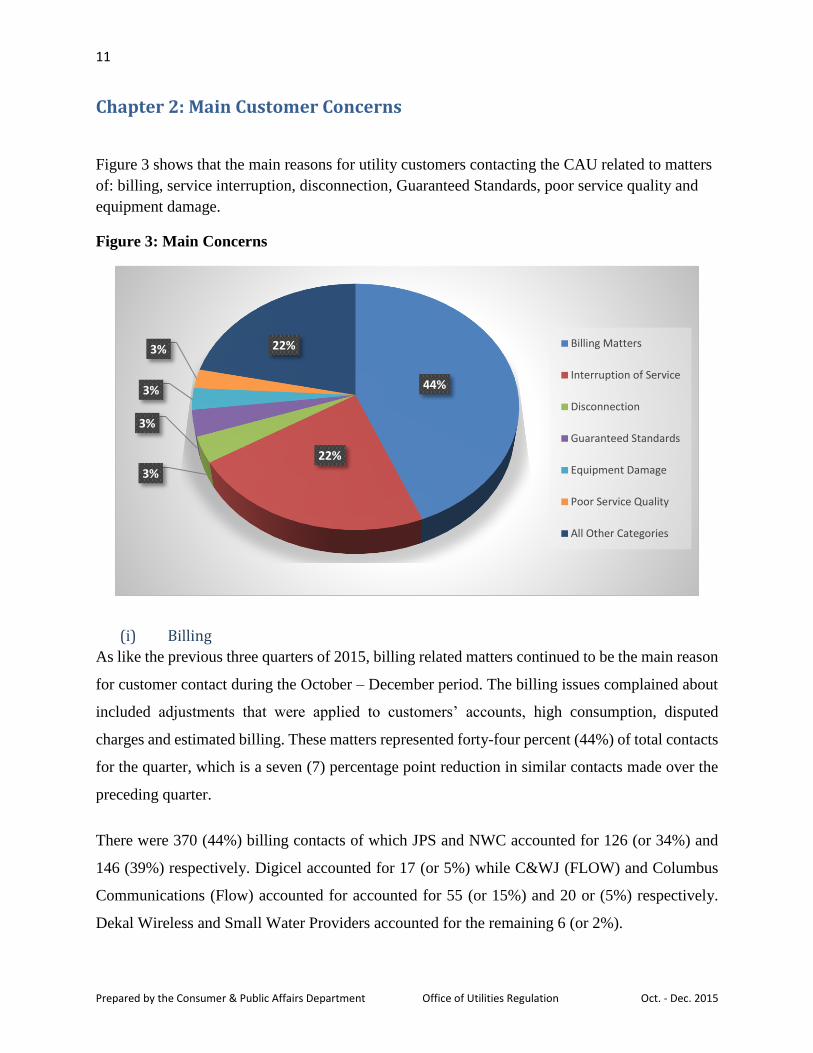
Figure 3 shows that the main reasons for utility customers contacting the CAU related to matters
of: billing, service interruption, disconnection, Guaranteed Standards, poor service quality and
equipment damage.
Figure 3: Main Concerns
(i) Billing
As like the previous three quarters of 2015, billing related matters continued to be the main reason
for customer contact during the October – December period. The billing issues complained about
included adjustments that were applied to customers’ accounts, high consumption, disputed
charges and estimated billing. These matters represented forty-four percent (44%) of total contacts
for the quarter, which is a seven (7) percentage point reduction in similar contacts made over the
preceding quarter.
There were 370 (44%) billing contacts of which JPS and NWC accounted for 126 (or 34%) and
146 (39%) respectively. Digicel accounted for 17 (or 5%) while C&WJ (FLOW) and Columbus
Communications (Flow) accounted for accounted for 55 (or 15%) and 20 or (5%) respectively.
Dekal Wireless and Small Water Providers accounted for the remaining 6 (or 2%).
44%
22%
3%
3%
3%
3% 22% Billing Matters
Interruption of Service
Disconnection
Guaranteed Standards
Equipment Damage
Poor Service Quality
All Other Categories
12
Prepared by the Consumer & Public Affairs Department Office of Utilities Regulation Oct. - Dec. 2015
Additionally, billing related matters accounted for 49% of total contacts throughout 2015, which
is a one percentage point increase over 2014. Details on the nature of the total contacts received
throughout the year is shown in Table 5.
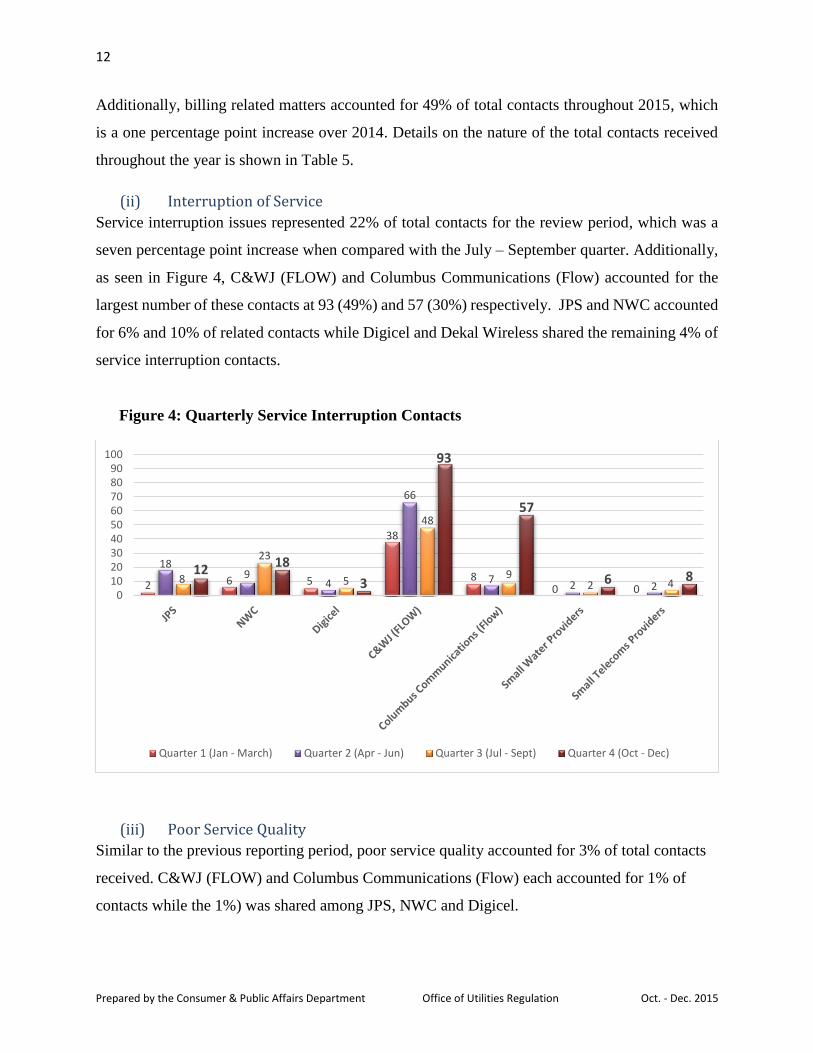
(ii) Interruption of Service
Service interruption issues represented 22% of total contacts for the review period, which was a
seven percentage point increase when compared with the July – September quarter. Additionally,
as seen in Figure 4, C&WJ (FLOW) and Columbus Communications (Flow) accounted for the
largest number of these contacts at 93 (49%) and 57 (30%) respectively. JPS and NWC accounted
for 6% and 10% of related contacts while Digicel and Dekal Wireless shared the remaining 4% of
service interruption contacts.
Figure 4: Quarterly Service Interruption Contacts
(iii) Poor Service Quality
Similar to the previous reporting period, poor service quality accounted for 3% of total contacts
received. C&WJ (FLOW) and Columbus Communications (Flow) each accounted for 1% of
contacts while the 1%) was shared among JPS, NWC and Digicel.
2 6 5
38
80 0
189
4
66
7 2 28
23
5
48
92 4
1218
3
93
57
6 80
102030405060708090
100
Quarter 1 (Jan - March) Quarter 2 (Apr - Jun) Quarter 3 (Jul - Sept) Quarter 4 (Oct - Dec)
13
Prepared by the Consumer & Public Affairs Department Office of Utilities Regulation Oct. - Dec. 2015
(iv) Disconnection
Disconnections also accounted for three percent (3%) of total contacts received. JPS and C&WJ
(FLOW) each accounted for 1% of disconnection related issues while the remaining 1% was shared
between Columbus Communications (Flow) and the NWC.
(v) Equipment Damage
Issues relating to equipment damage accounted for three percent (3%) of total contacts received.
These contacts also represented ten percent (10%) of contacts specific to the services provided by
JPS.
14
Prepared by the Consumer & Public Affairs Department Office of Utilities Regulation Oct. - Dec. 2015
Chapter 3: Guaranteed Standards Performance
(i) What are the Guaranteed Standards?
The Guaranteed Standards are performance measures that guide the provision of utility services
delivered by the National Water Commission (NWC), small water providers and the Jamaica
Public Service Company Ltd. If the companies fail to honour the agreement, the customer is
entitled to compensation which is applied as a credit to the account.
(ii) How are customers compensated?
NWC: Compensation for breach of a standard is four (4) times the applicable service charge OR
six (6) times the service charge for those in the special compensation category. Where applicable,
customers must submit their claims within 120 days of the breach. Breaches of individual standards
will attract compensation of up to six (6) periods of non-compliance.
JPS: Residential Customers: equivalent to the reconnection fee; Commercial Customers: four (4)
times the customer charge.
(iii) Quarterly Report of Breaches
The CAU fielded twenty-nine (29) contacts in relation to alleged breaches of the Guaranteed
Standards by the JPS and the NWC. This represented three percent (3%) of total contacts received
during the review period and a two percentage point drop over the preceding quarter. JPS
accounted for 20 (or 2%) while the NWC accounted for the remaining 9 (or 1%) of related contacts.
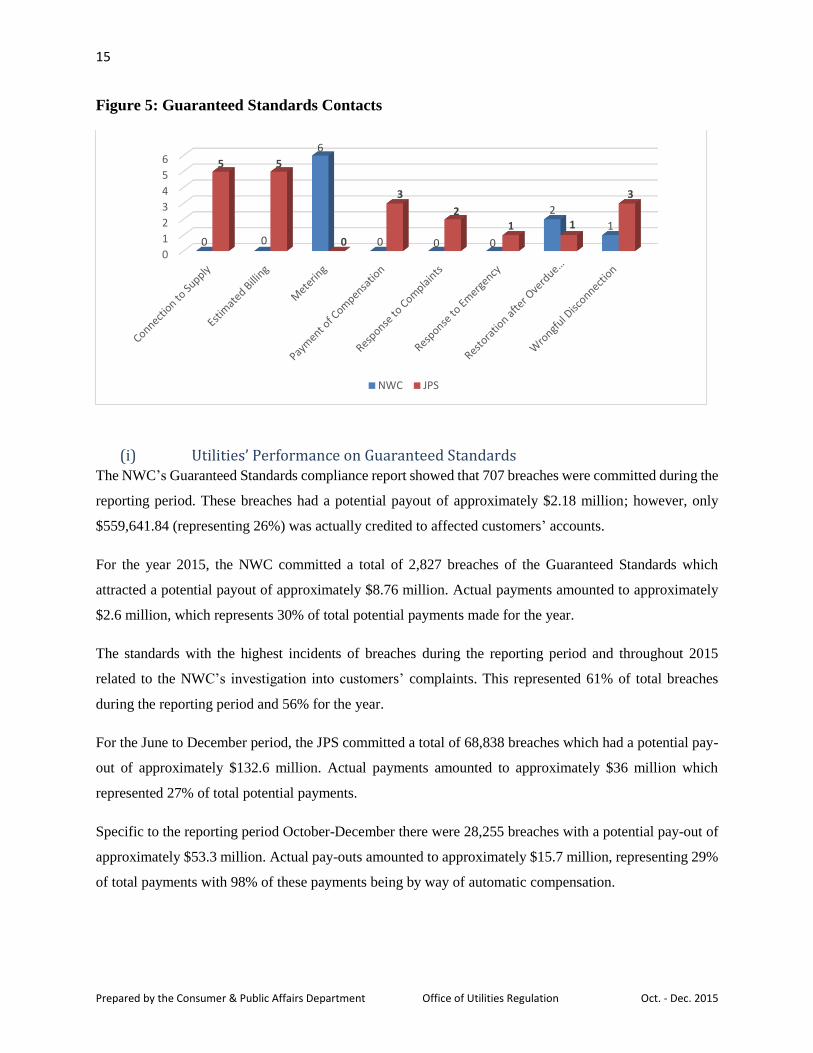
Figure 5 indicates that the highest number of contacts in relation to alleged Guaranteed Standards
breaches for JPS related to Connection to Supply and Estimated Billing. In the case of the NWC,
the highest number of contacts in relation to alleged breaches related to Metering.
15
Prepared by the Consumer & Public Affairs Department Office of Utilities Regulation Oct. - Dec. 2015
Figure 5: Guaranteed Standards Contacts
(i) Utilities’ Performance on Guaranteed Standards The NWC’s Guaranteed Standards compliance report showed that 707 breaches were committed during the
reporting period. These breaches had a potential payout of approximately $2.18 million; however, only
$559,641.84 (representing 26%) was actually credited to affected customers’ accounts.
For the year 2015, the NWC committed a total of 2,827 breaches of the Guaranteed Standards which
attracted a potential payout of approximately $8.76 million. Actual payments amounted to approximately
$2.6 million, which represents 30% of total potential payments made for the year.
The standards with the highest incidents of breaches during the reporting period and throughout 2015
related to the NWC’s investigation into customers’ complaints. This represented 61% of total breaches
during the reporting period and 56% for the year.
For the June to December period, the JPS committed a total of 68,838 breaches which had a potential pay-
out of approximately $132.6 million. Actual payments amounted to approximately $36 million which
represented 27% of total potential payments.
Specific to the reporting period October-December there were 28,255 breaches with a potential pay-out of
approximately $53.3 million. Actual pay-outs amounted to approximately $15.7 million, representing 29%
of total payments with 98% of these payments being by way of automatic compensation.
0
1
2
3
4
5
6
0 0
6
0 0 0
2
1
5 5
0
3
21 1
3
NWC JPS
16
Prepared by the Consumer & Public Affairs Department Office of Utilities Regulation Oct. - Dec. 2015
Additionally, sending its customers more than two consecutive estimated bills, at 73% during the reporting
period and 67% during the June to December period, accounted for the highest incidents of breaches for
the JPS.
17
Prepared by the Consumer & Public Affairs Department Office of Utilities Regulation Oct. - Dec. 2015
Chapter 4: Customer Contact Distribution
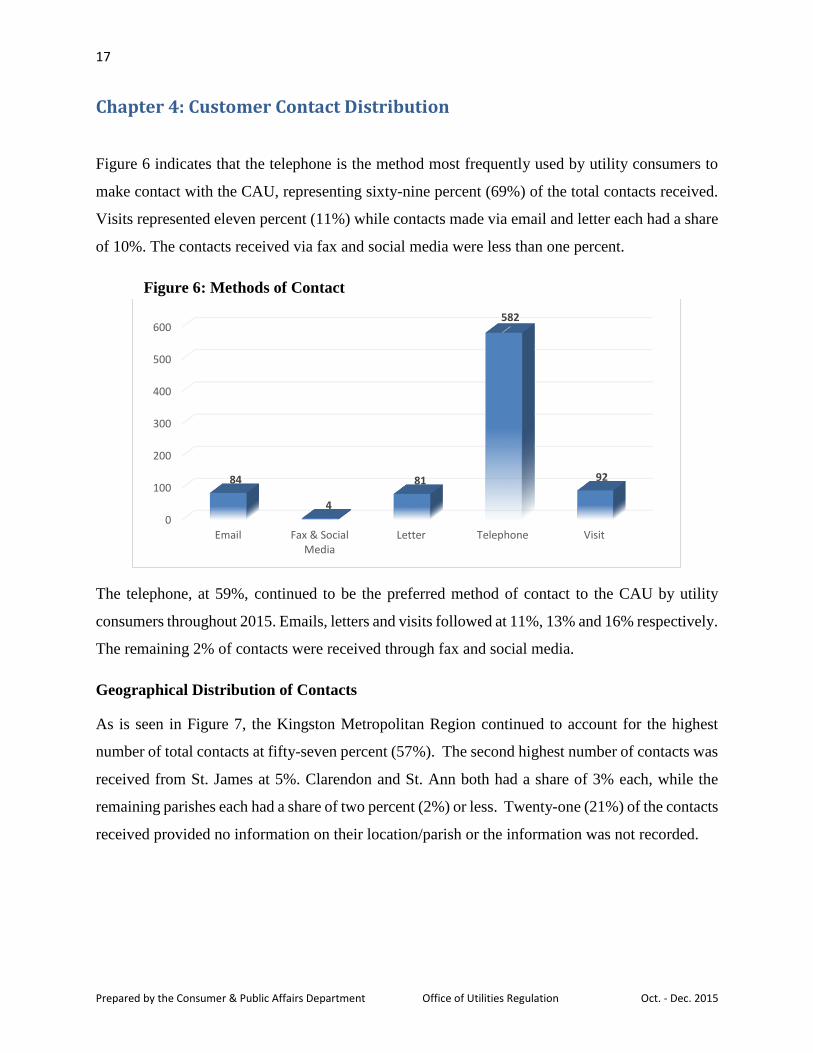
Figure 6 indicates that the telephone is the method most frequently used by utility consumers to
make contact with the CAU, representing sixty-nine percent (69%) of the total contacts received.
Visits represented eleven percent (11%) while contacts made via email and letter each had a share
of 10%. The contacts received via fax and social media were less than one percent.
Figure 6: Methods of Contact
The telephone, at 59%, continued to be the preferred method of contact to the CAU by utility
consumers throughout 2015. Emails, letters and visits followed at 11%, 13% and 16% respectively.
The remaining 2% of contacts were received through fax and social media.
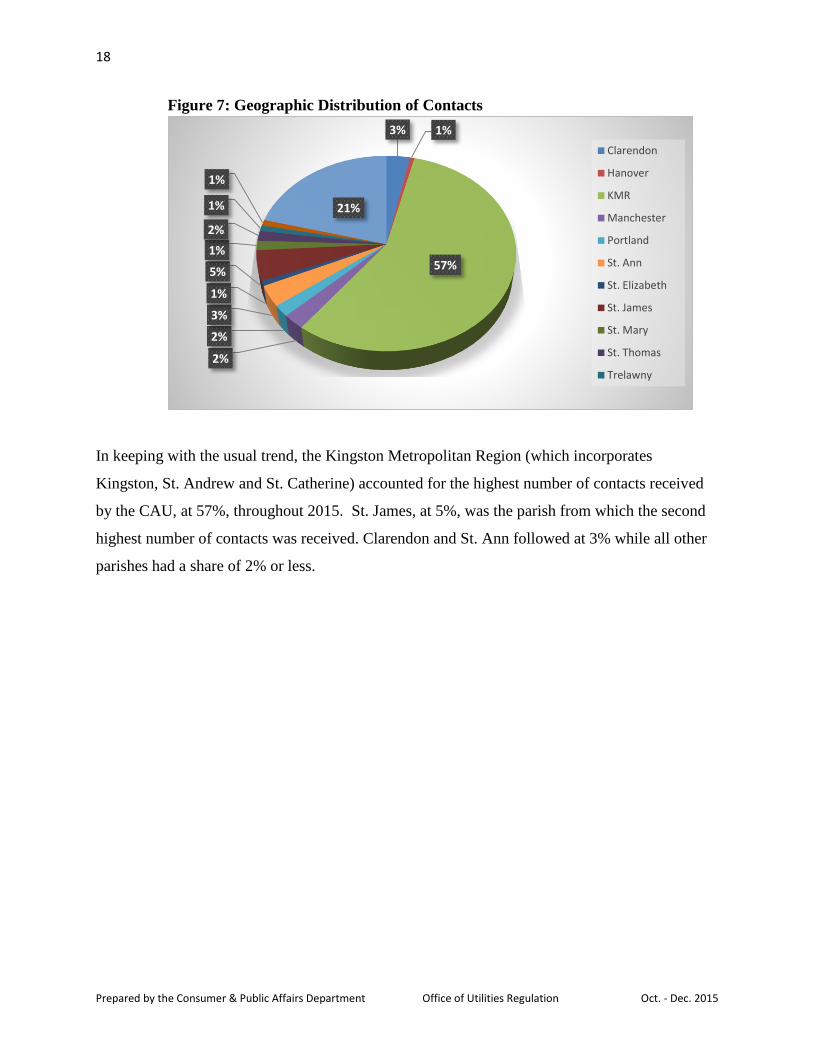
Geographical Distribution of Contacts
As is seen in Figure 7, the Kingston Metropolitan Region continued to account for the highest
number of total contacts at fifty-seven percent (57%). The second highest number of contacts was
received from St. James at 5%. Clarendon and St. Ann both had a share of 3% each, while the
remaining parishes each had a share of two percent (2%) or less. Twenty-one (21%) of the contacts
received provided no information on their location/parish or the information was not recorded.
0
100
200
300
400
500
600
Email Fax & SocialMedia
Letter Telephone Visit
84
4
81
582
92
18
Prepared by the Consumer & Public Affairs Department Office of Utilities Regulation Oct. - Dec. 2015
Figure 7: Geographic Distribution of Contacts
In keeping with the usual trend, the Kingston Metropolitan Region (which incorporates
Kingston, St. Andrew and St. Catherine) accounted for the highest number of contacts received
by the CAU, at 57%, throughout 2015. St. James, at 5%, was the parish from which the second
highest number of contacts was received. Clarendon and St. Ann followed at 3% while all other
parishes had a share of 2% or less.
3% 1%
57%
2%
2%
3%
1%
5%
1%
2%
1%
1%
21%
Clarendon
Hanover
KMR
Manchester
Portland
St. Ann
St. Elizabeth
St. James
St. Mary
St. Thomas
Trelawny
19
Prepared by the Consumer & Public Affairs Department Office of Utilities Regulation Oct. - Dec. 2015
Chapter 5: Appeals Performance
(i) Closure of Appeals 2
The CAU closed thirty-four (34) appeals during the review period. Of those closed, sixty-five
percent (65%) were in favour of the service providers while twenty-six percent (26%) were in
favour of the customer. The remaining 9% represents those appeals that were either withdrawn by
the customer or for which a compromise was arrived.
Thirty-two (32) of the closed appeals were carried forward from previous periods while the
remaining two closed appeals were received and resolved within the OUR-established standard of
sixty (65) working days.
(ii) Outstanding Appeals3
At the end of the reporting period, eighty-three (83) appeals remained outstanding, in that they
exceeded the established 65 business days for resolution. Of these appeals, 55 (or 66%) are
awaiting responses from the service providers. The remaining 28 (or 44%) are for OUR-action and
are either undergoing analysis, awaiting approval of final letters or are awaiting additional
information from the customer.
Of the 55 appeals for which the OUR is awaiting responses from the service provider, the NWC
accounts for 50 (or 91%) while the JPS accounts for 4 (or 7%). Columbus Communications (Flow)
accounts for the remaining 2% of outstanding responses.
Six percent (6%) and seventy-five percent (75%) of the outstanding appeals represent billing
complaints from JPS’ and NWC’s customers, respectively. Equipment damage appeals, which
relates specifically to JPS, account for 6% of outstanding matters. All other categories for which
the appeals are outstanding have a share of 2% or less.
2 Breakdown of Appeals Closures can be seen in Table 6 3 Breakdown of Outstanding Appeals can be seen in Table 7
20
Prepared by the Consumer & Public Affairs Department Office of Utilities Regulation Oct. - Dec. 2015
Appeals Process Resolution Rate
Of the 10 new appeals received during the review period, four provider responses were received
within the established timeline. Two of the four appeals for which all relevant information was
received were closed within the 65 business day timeline for the appeals process. This results in
a 20% resolution rate for all 10 appeals received and a 50% resolution rate for appeals for which
all relevant information was received.
Further information on the CAU’s performance on some key appeals process activity is provided
in Table 8.
21
Prepared by the Consumer & Public Affairs Department Office of Utilities Regulation Oct. - Dec. 2015
Chapter 5: Consumer Affairs Highlights
(i) Credits/Compensation
For the review period, $1,834,460.21 was secured for utility customers as a result of our
investigation into their appeals. JPS and NWC accounted for 38% and 62% of total credits
respectively.
For 2015, the total amount secured for utility consumers was $10,835,656.04. Of this total, JPS
accounted for 82% while the NWC accounted for the remaining 18%.
(ii) Increase in Service Interruption Contacts
In light of the noted increase in contacts to the CAU relating to service interruption issues,
particularly with C&WJ (FLOW) and Columbus Communications (Flow), the OUR met with the
senior representatives of the company. The discussions centred around the possible cause/s for the
frequent and prolonged interruption in service as well as the measures being taken to have the
issues addressed within the shortest possible time.
The discussions are ongoing and the OUR, through the CAU, has made recommendations to the
Company regarding efforts that can be made to improve on its management of the challenges being
faced with the service interruption and other related issues.
22
Prepared by the Consumer & Public Affairs Department Office of Utilities Regulation Oct. - Dec. 2015
List of Tables
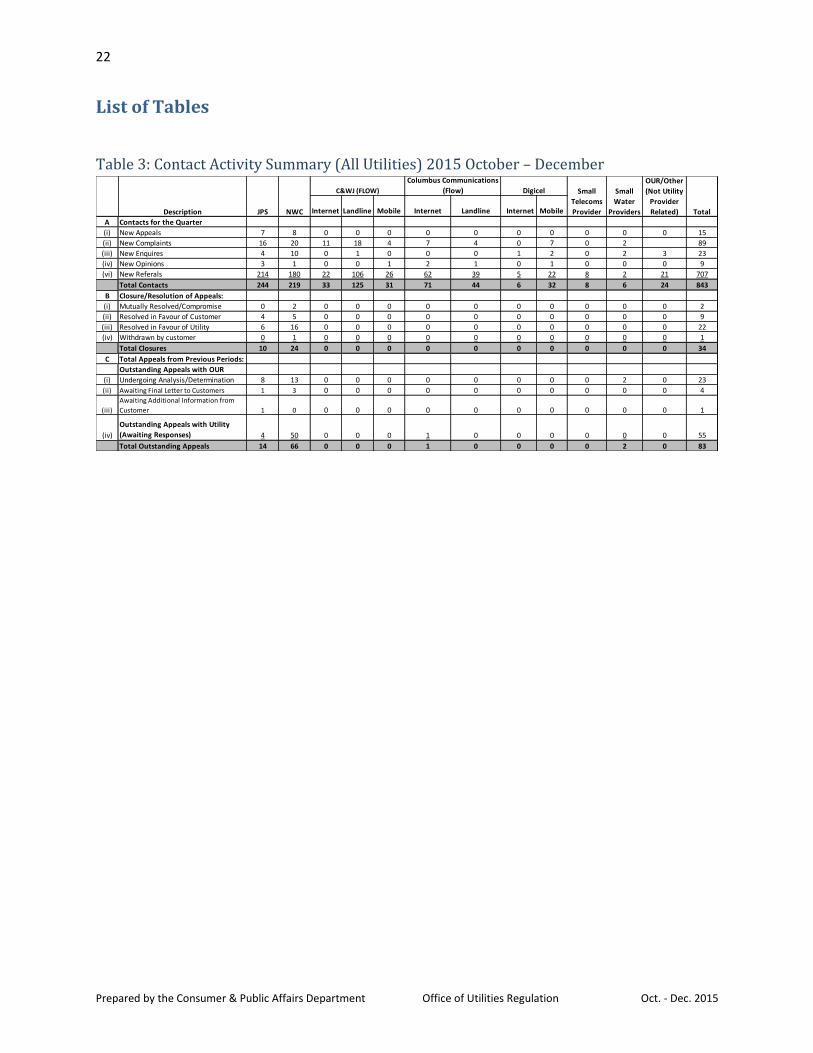
Table 3: Contact Activity Summary (All Utilities) 2015 October – December
Internet Landline Mobile Internet Landline Internet Mobile
A Contacts for the Quarter
(i) New Appeals 7 8 0 0 0 0 0 0 0 0 0 0 15
(ii) New Complaints 16 20 11 18 4 7 4 0 7 0 2 89
(iii) New Enquires 4 10 0 1 0 0 0 1 2 0 2 3 23
(iv) New Opinions 3 1 0 0 1 2 1 0 1 0 0 0 9
(vi) New Referals 214 180 22 106 26 62 39 5 22 8 2 21 707
Total Contacts 244 219 33 125 31 71 44 6 32 8 6 24 843
B Closure/Resolution of Appeals:
(i) Mutually Resolved/Compromise 0 2 0 0 0 0 0 0 0 0 0 0 2
(ii) Resolved in Favour of Customer 4 5 0 0 0 0 0 0 0 0 0 0 9
(iii) Resolved in Favour of Utility 6 16 0 0 0 0 0 0 0 0 0 0 22
(iv) Withdrawn by customer 0 1 0 0 0 0 0 0 0 0 0 0 1
Total Closures 10 24 0 0 0 0 0 0 0 0 0 0 34
C Total Appeals from Previous Periods:
Outstanding Appeals with OUR
(i) Undergoing Analysis/Determination 8 13 0 0 0 0 0 0 0 0 2 0 23
(ii) Awaiting Final Letter to Customers 1 3 0 0 0 0 0 0 0 0 0 0 4
(iii)
Awaiting Additional Information from
Customer 1 0 0 0 0 0 0 0 0 0 0 0 1
(iv)
Outstanding Appeals with Utility
(Awaiting Responses) 4 50 0 0 0 1 0 0 0 0 0 0 55
Total Outstanding Appeals 14 66 0 0 0 1 0 0 0 0 2 0 83
Total
Columbus Communications
(Flow) Digicel Small
Telecoms
Provider
Small
Water
Providers
OUR/Other
(Not Utility
Provider
Related)Description JPS NWC
C&WJ (FLOW)

23
Prepared by the Consumer & Public Affairs Department Office of Utilities Regulation Oct. - Dec. 2015
Table 4: Distribution of Contacts by Utilities
JPS NWC Digicel
Columbus
Communications
(Flow)
C&WJ
(FLOW)
Dekal
Wireless
Small
Water
Providers
(CanCara,
DEML, NIC
& RBWC)
OUR/Other
(not utility
related) Total
Billing Matters 126 146 17 20 55 2 4 0 370
Broken Main 0 4 0 0 0 0 0 0 4
Customer Service 0 1 0 3 4 0 0 0 8
Defective Street Lights 3 0 0 0 0 0 0 0 3
Disconnection 10 3 0 4 12 0 0 0 29
Equipment Damage 24 0 0 0 0 0 0 0 24
Guaranteed Standards 20 9 0 0 0 0 0 0 29
Health & Safety 3 2 0 0 0 0 0 0 5
Illegal Connections 4 0 0 0 0 0 0 0 4
Interruption of Service 12 18 3 57 93 5 0 0 188
Irregular Supply 1 9 0 0 0 0 0 0 10
Metering 2 6 0 0 0 0 0 0 8
Number Portability 0 0 3 1 2 0 0 0 6
Other 14 14 8 14 9 1 2 24 86
Payment Arrangement 2 2 0 0 0 0 0 0 4
Phone Cards 0 0 3 2 1 0 0 0 6
Poor Service Quality 2 1 3 8 7 0 0 0 21
Property Damage 1 1 0 0 0 0 0 0 2
RAMI Service Connection & CDU 12 0 0 0 0 0 0 0 12
Reconnection 2 0 0 0 1 0 0 0 3
Redress not Received 0 2 1 0 2 0 0 0 5
Removal of Pole 1 0 0 0 0 0 0 0 1
Service Connection 5 1 0 1 2 0 0 0 9Unable to get through to Service
Provider 0 0 0 5 1 0 0 0 6
Total 244 219 38 115 189 8 6 24 843
Complaint Category
Service Providers
24
Prepared by the Consumer & Public Affairs Department Office of Utilities Regulation Oct. - Dec. 2015
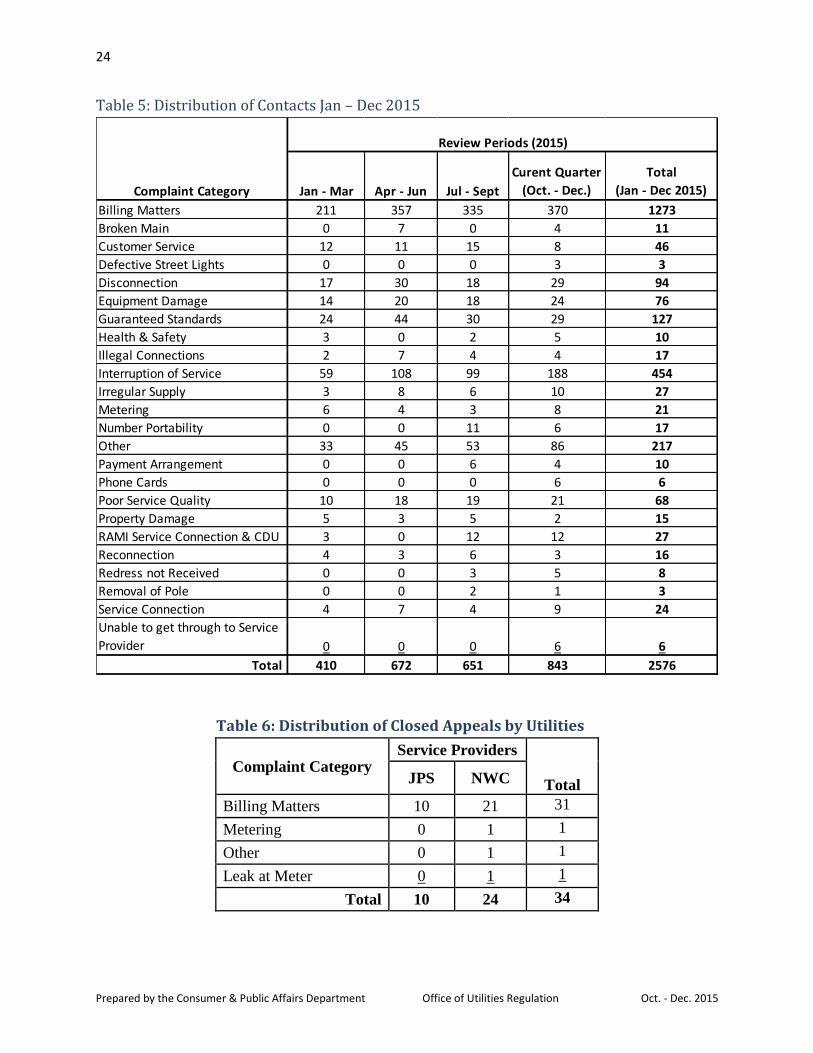
Table 5: Distribution of Contacts Jan – Dec 2015
Table 6: Distribution of Closed Appeals by Utilities
Complaint Category Service Providers
Total JPS NWC
Billing Matters 10 21 31
Metering 0 1 1
Other 0 1 1
Leak at Meter 0 1 1
Total 10 24 34
Jan - Mar Apr - Jun Jul - Sept
Curent Quarter
(Oct. - Dec.)
Total
(Jan - Dec 2015)
Billing Matters 211 357 335 370 1273
Broken Main 0 7 0 4 11
Customer Service 12 11 15 8 46
Defective Street Lights 0 0 0 3 3
Disconnection 17 30 18 29 94
Equipment Damage 14 20 18 24 76
Guaranteed Standards 24 44 30 29 127
Health & Safety 3 0 2 5 10
Illegal Connections 2 7 4 4 17
Interruption of Service 59 108 99 188 454
Irregular Supply 3 8 6 10 27
Metering 6 4 3 8 21
Number Portability 0 0 11 6 17
Other 33 45 53 86 217
Payment Arrangement 0 0 6 4 10
Phone Cards 0 0 0 6 6
Poor Service Quality 10 18 19 21 68
Property Damage 5 3 5 2 15
RAMI Service Connection & CDU 3 0 12 12 27
Reconnection 4 3 6 3 16
Redress not Received 0 0 3 5 8
Removal of Pole 0 0 2 1 3
Service Connection 4 7 4 9 24
Unable to get through to Service
Provider 0 0 0 6 6
Total 410 672 651 843 2576
Review Periods (2015)
Complaint Category
25
Prepared by the Consumer & Public Affairs Department Office of Utilities Regulation Oct. - Dec. 2015
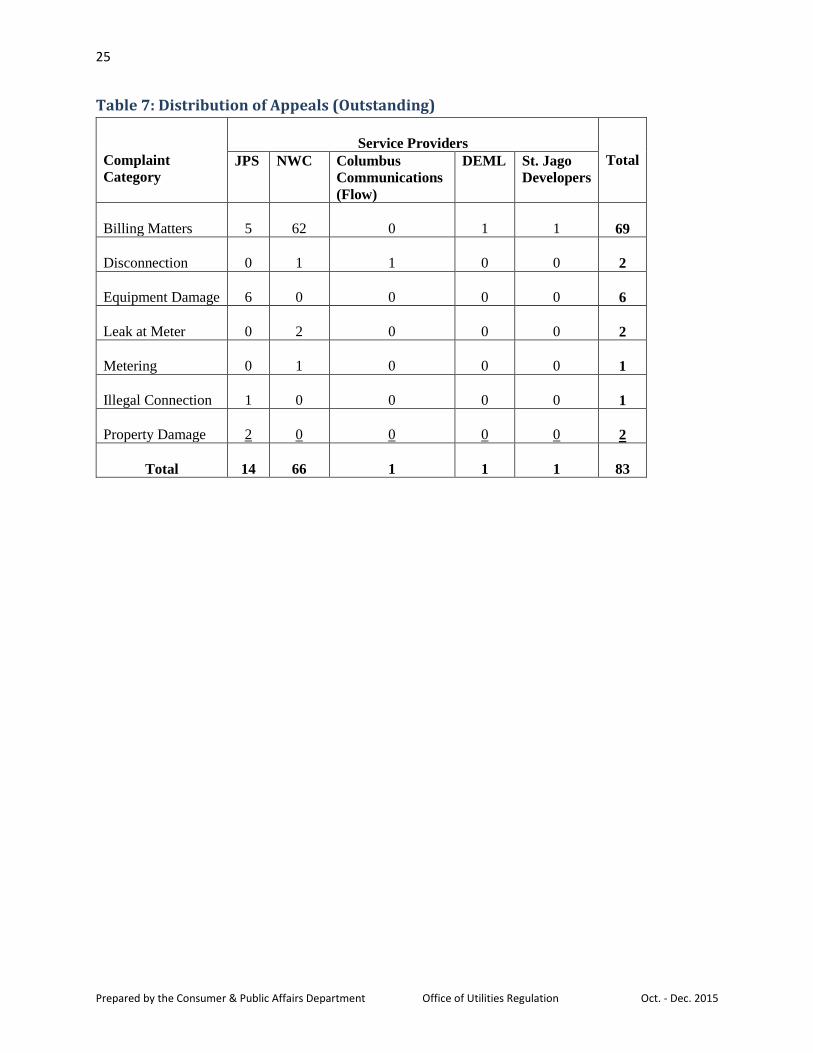
Table 7: Distribution of Appeals (Outstanding)
Complaint
Category
Service Providers
Total JPS NWC Columbus
Communications
(Flow)
DEML St. Jago
Developers
Billing Matters
5
62
0
1
1
69
Disconnection
0
1
1
0
0
2
Equipment Damage
6
0
0
0
0
6
Leak at Meter
0
2
0
0
0
2
Metering
0
1
0
0
0
1
Illegal Connection
1
0
0
0
0
1
Property Damage
2
0
0
0
0
2
Total
14
66
1
1
1
83
26
Prepared by the Consumer & Public Affairs Department Office of Utilities Regulation Oct. - Dec. 2015
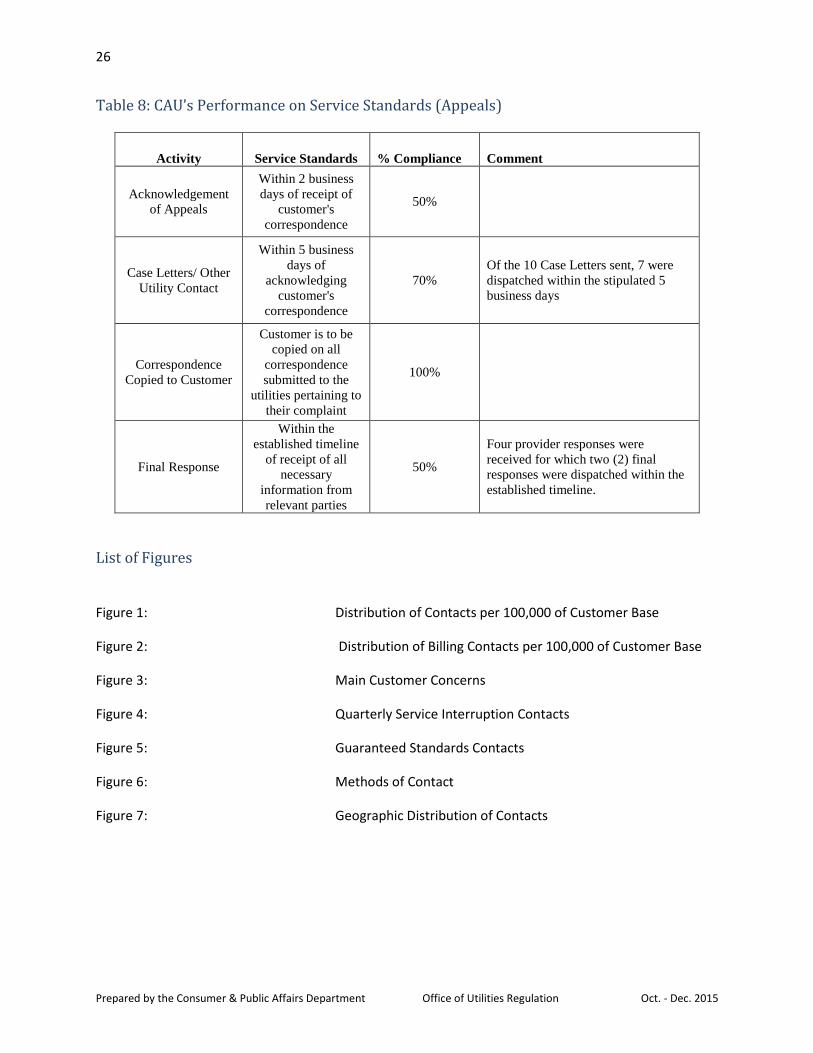
Table 8: CAU’s Performance on Service Standards (Appeals)
Activity Service Standards % Compliance Comment
Acknowledgement
of Appeals
Within 2 business
days of receipt of
customer's
correspondence
50%
Case Letters/ Other
Utility Contact
Within 5 business
days of
acknowledging
customer's
correspondence
70%
Of the 10 Case Letters sent, 7 were
dispatched within the stipulated 5
business days
Correspondence
Copied to Customer
Customer is to be
copied on all
correspondence
submitted to the
utilities pertaining to
their complaint
100%
Final Response
Within the
established timeline
of receipt of all
necessary
information from
relevant parties
50%
Four provider responses were
received for which two (2) final
responses were dispatched within the
established timeline.
List of Figures
Figure 1: Distribution of Contacts per 100,000 of Customer Base
Figure 2: Distribution of Billing Contacts per 100,000 of Customer Base
Figure 3: Main Customer Concerns
Figure 4: Quarterly Service Interruption Contacts
Figure 5: Guaranteed Standards Contacts
Figure 6: Methods of Contact
Figure 7: Geographic Distribution of Contacts
27
Prepared by the Consumer & Public Affairs Department Office of Utilities Regulation Oct. - Dec. 2015
Appendices
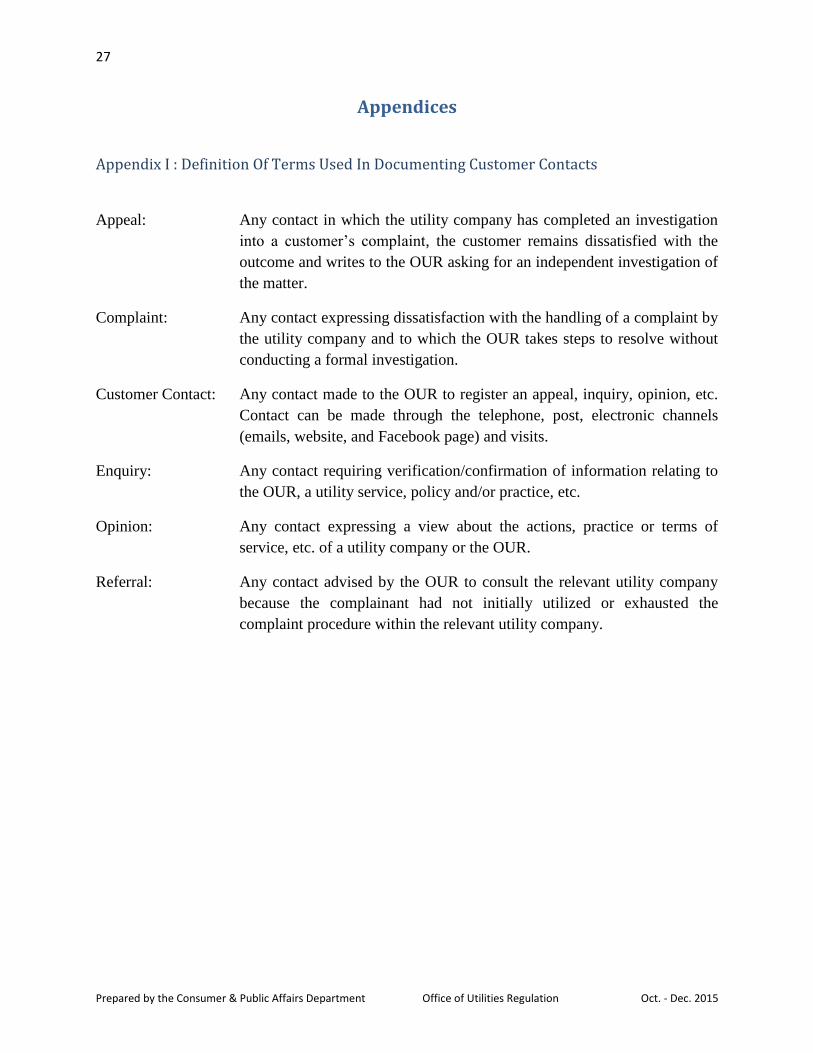
Appendix I : Definition Of Terms Used In Documenting Customer Contacts
Appeal: Any contact in which the utility company has completed an investigation
into a customer’s complaint, the customer remains dissatisfied with the
outcome and writes to the OUR asking for an independent investigation of
the matter.
Complaint: Any contact expressing dissatisfaction with the handling of a complaint by
the utility company and to which the OUR takes steps to resolve without
conducting a formal investigation.
Customer Contact: Any contact made to the OUR to register an appeal, inquiry, opinion, etc.
Contact can be made through the telephone, post, electronic channels
(emails, website, and Facebook page) and visits.
Enquiry: Any contact requiring verification/confirmation of information relating to
the OUR, a utility service, policy and/or practice, etc.
Opinion: Any contact expressing a view about the actions, practice or terms of
service, etc. of a utility company or the OUR.
Referral: Any contact advised by the OUR to consult the relevant utility company
because the complainant had not initially utilized or exhausted the
complaint procedure within the relevant utility company.
28
Prepared by the Consumer & Public Affairs Department Office of Utilities Regulation Oct. - Dec. 2015
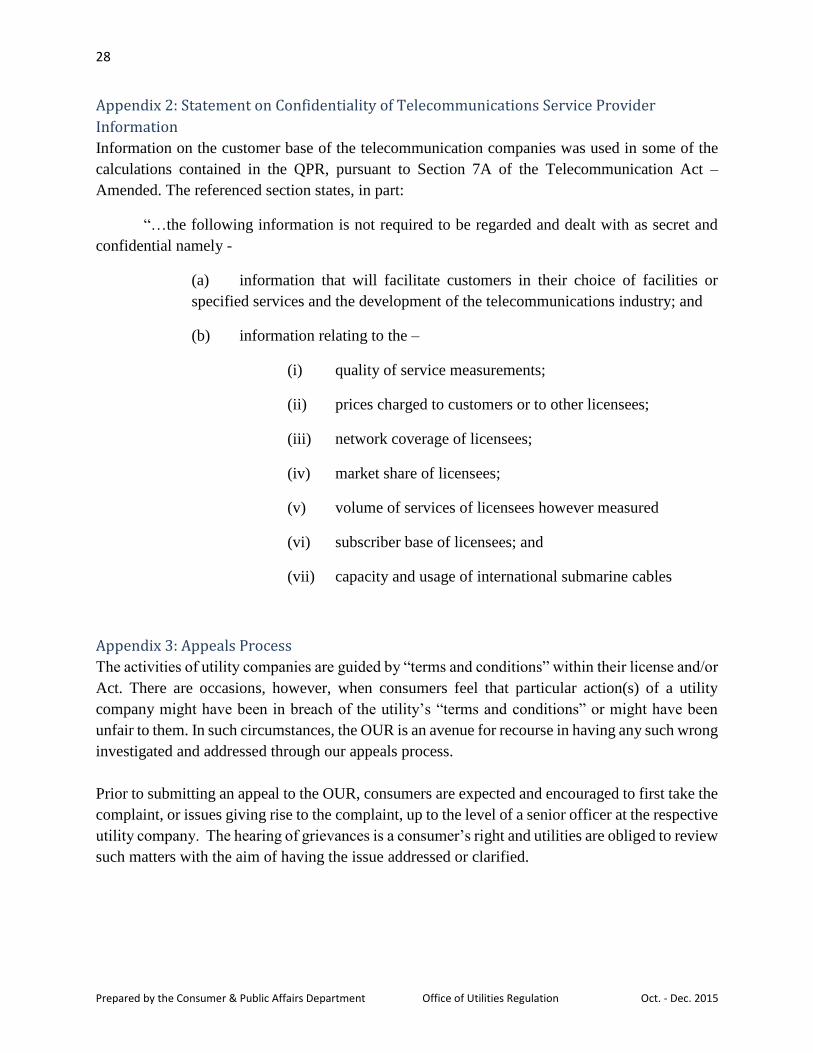
Appendix 2: Statement on Confidentiality of Telecommunications Service Provider
Information
Information on the customer base of the telecommunication companies was used in some of the
calculations contained in the QPR, pursuant to Section 7A of the Telecommunication Act –
Amended. The referenced section states, in part:
“…the following information is not required to be regarded and dealt with as secret and
confidential namely -
(a) information that will facilitate customers in their choice of facilities or
specified services and the development of the telecommunications industry; and
(b) information relating to the –
(i) quality of service measurements;
(ii) prices charged to customers or to other licensees;
(iii) network coverage of licensees;
(iv) market share of licensees;
(v) volume of services of licensees however measured
(vi) subscriber base of licensees; and
(vii) capacity and usage of international submarine cables
Appendix 3: Appeals Process
The activities of utility companies are guided by “terms and conditions” within their license and/or
Act. There are occasions, however, when consumers feel that particular action(s) of a utility
company might have been in breach of the utility’s “terms and conditions” or might have been
unfair to them. In such circumstances, the OUR is an avenue for recourse in having any such wrong
investigated and addressed through our appeals process.
Prior to submitting an appeal to the OUR, consumers are expected and encouraged to first take the
complaint, or issues giving rise to the complaint, up to the level of a senior officer at the respective
utility company. The hearing of grievances is a consumer’s right and utilities are obliged to review
such matters with the aim of having the issue addressed or clarified.
29
Prepared by the Consumer & Public Affairs Department Office of Utilities Regulation Oct. - Dec. 2015
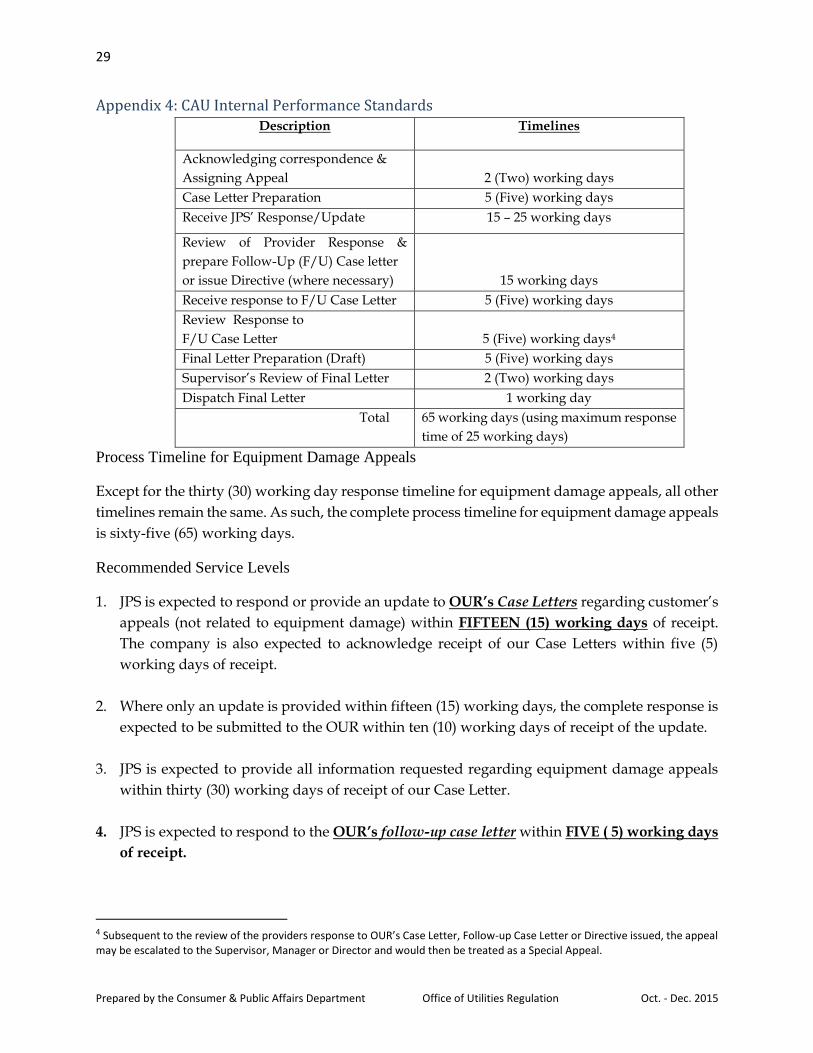
Appendix 4: CAU Internal Performance Standards Description Timelines
Acknowledging correspondence &
Assigning Appeal
2 (Two) working days
Case Letter Preparation 5 (Five) working days
Receive JPS’ Response/Update 15 – 25 working days
Review of Provider Response &
prepare Follow-Up (F/U) Case letter
or issue Directive (where necessary)
15 working days
Receive response to F/U Case Letter 5 (Five) working days
Review Response to
F/U Case Letter
5 (Five) working days4
Final Letter Preparation (Draft) 5 (Five) working days
Supervisor’s Review of Final Letter 2 (Two) working days
Dispatch Final Letter 1 working day
Total 65 working days (using maximum response
time of 25 working days)
Process Timeline for Equipment Damage Appeals
Except for the thirty (30) working day response timeline for equipment damage appeals, all other
timelines remain the same. As such, the complete process timeline for equipment damage appeals
is sixty-five (65) working days.
Recommended Service Levels
1. JPS is expected to respond or provide an update to OUR’s Case Letters regarding customer’s
appeals (not related to equipment damage) within FIFTEEN (15) working days of receipt.
The company is also expected to acknowledge receipt of our Case Letters within five (5)
working days of receipt.
2. Where only an update is provided within fifteen (15) working days, the complete response is
expected to be submitted to the OUR within ten (10) working days of receipt of the update.
3. JPS is expected to provide all information requested regarding equipment damage appeals
within thirty (30) working days of receipt of our Case Letter.
4. JPS is expected to respond to the OUR’s follow-up case letter within FIVE ( 5) working days
of receipt.
4 Subsequent to the review of the providers response to OUR’s Case Letter, Follow-up Case Letter or Directive issued, the appeal may be escalated to the Supervisor, Manager or Director and would then be treated as a Special Appeal.
30
Prepared by the Consumer & Public Affairs Department Office of Utilities Regulation Oct. - Dec. 2015
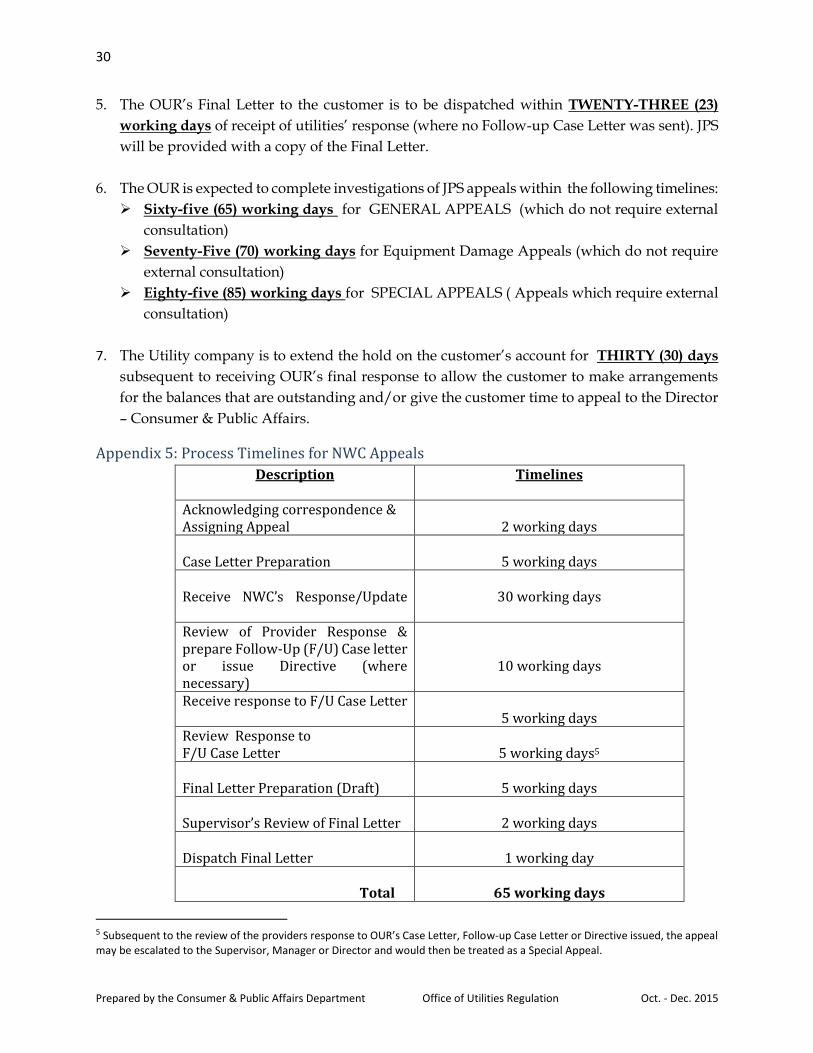
5. The OUR’s Final Letter to the customer is to be dispatched within TWENTY-THREE (23)
working days of receipt of utilities’ response (where no Follow-up Case Letter was sent). JPS
will be provided with a copy of the Final Letter.
6. The OUR is expected to complete investigations of JPS appeals within the following timelines:
Sixty-five (65) working days for GENERAL APPEALS (which do not require external
consultation)
Seventy-Five (70) working days for Equipment Damage Appeals (which do not require
external consultation)
Eighty-five (85) working days for SPECIAL APPEALS ( Appeals which require external
consultation)
7. The Utility company is to extend the hold on the customer’s account for THIRTY (30) days
subsequent to receiving OUR’s final response to allow the customer to make arrangements
for the balances that are outstanding and/or give the customer time to appeal to the Director
– Consumer & Public Affairs.
Appendix 5: Process Timelines for NWC Appeals
Description Timelines
Acknowledging correspondence & Assigning Appeal
2 working days
Case Letter Preparation
5 working days
Receive NWC’s Response/Update
30 working days
Review of Provider Response & prepare Follow-Up (F/U) Case letter or issue Directive (where necessary)
10 working days
Receive response to F/U Case Letter 5 working days
Review Response to F/U Case Letter
5 working days5
Final Letter Preparation (Draft)
5 working days
Supervisor’s Review of Final Letter
2 working days
Dispatch Final Letter
1 working day
Total
65 working days
5 Subsequent to the review of the providers response to OUR’s Case Letter, Follow-up Case Letter or Directive issued, the appeal may be escalated to the Supervisor, Manager or Director and would then be treated as a Special Appeal.
31
Prepared by the Consumer & Public Affairs Department Office of Utilities Regulation Oct. - Dec. 2015
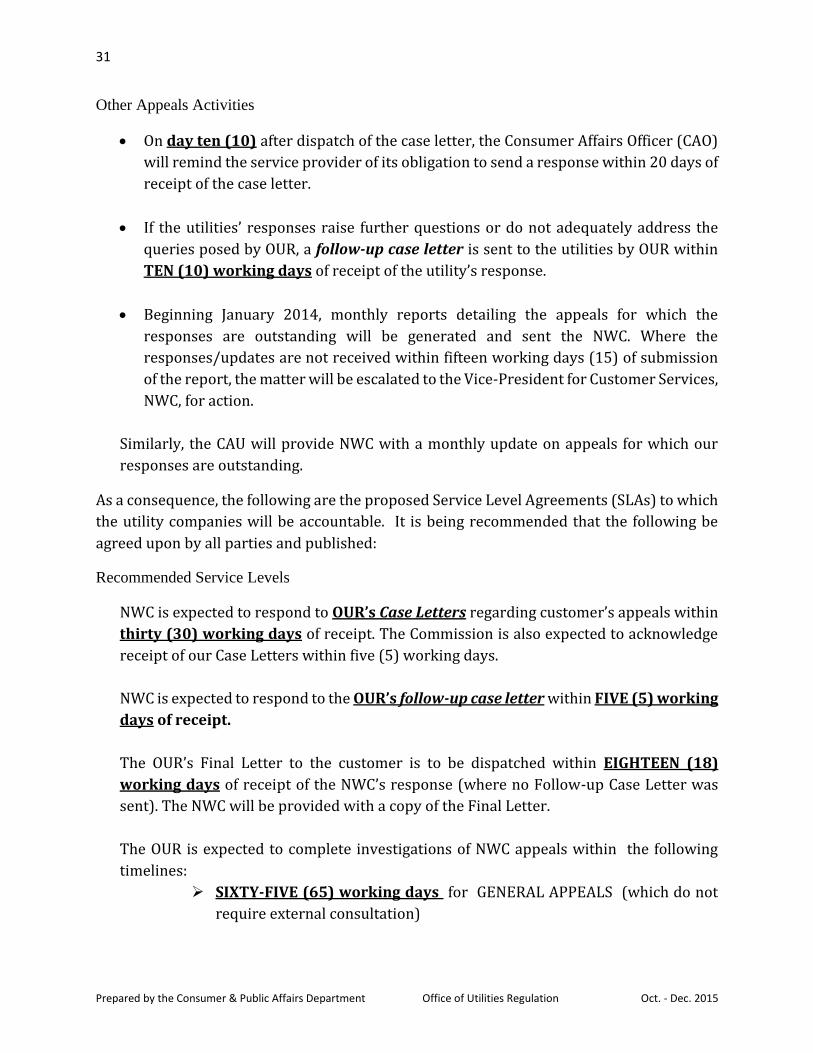
Other Appeals Activities
On day ten (10) after dispatch of the case letter, the Consumer Affairs Officer (CAO)
will remind the service provider of its obligation to send a response within 20 days of
receipt of the case letter.
If the utilities’ responses raise further questions or do not adequately address the
queries posed by OUR, a follow-up case letter is sent to the utilities by OUR within
TEN (10) working days of receipt of the utility’s response.
Beginning January 2014, monthly reports detailing the appeals for which the
responses are outstanding will be generated and sent the NWC. Where the
responses/updates are not received within fifteen working days (15) of submission
of the report, the matter will be escalated to the Vice-President for Customer Services,
NWC, for action.
Similarly, the CAU will provide NWC with a monthly update on appeals for which our
responses are outstanding.
As a consequence, the following are the proposed Service Level Agreements (SLAs) to which
the utility companies will be accountable. It is being recommended that the following be
agreed upon by all parties and published:
Recommended Service Levels
NWC is expected to respond to OUR’s Case Letters regarding customer’s appeals within
thirty (30) working days of receipt. The Commission is also expected to acknowledge
receipt of our Case Letters within five (5) working days.
NWC is expected to respond to the OUR’s follow-up case letter within FIVE (5) working
days of receipt.
The OUR’s Final Letter to the customer is to be dispatched within EIGHTEEN (18)
working days of receipt of the NWC’s response (where no Follow-up Case Letter was
sent). The NWC will be provided with a copy of the Final Letter.
The OUR is expected to complete investigations of NWC appeals within the following
timelines:
SIXTY-FIVE (65) working days for GENERAL APPEALS (which do not
require external consultation)
32
Prepared by the Consumer & Public Affairs Department Office of Utilities Regulation Oct. - Dec. 2015
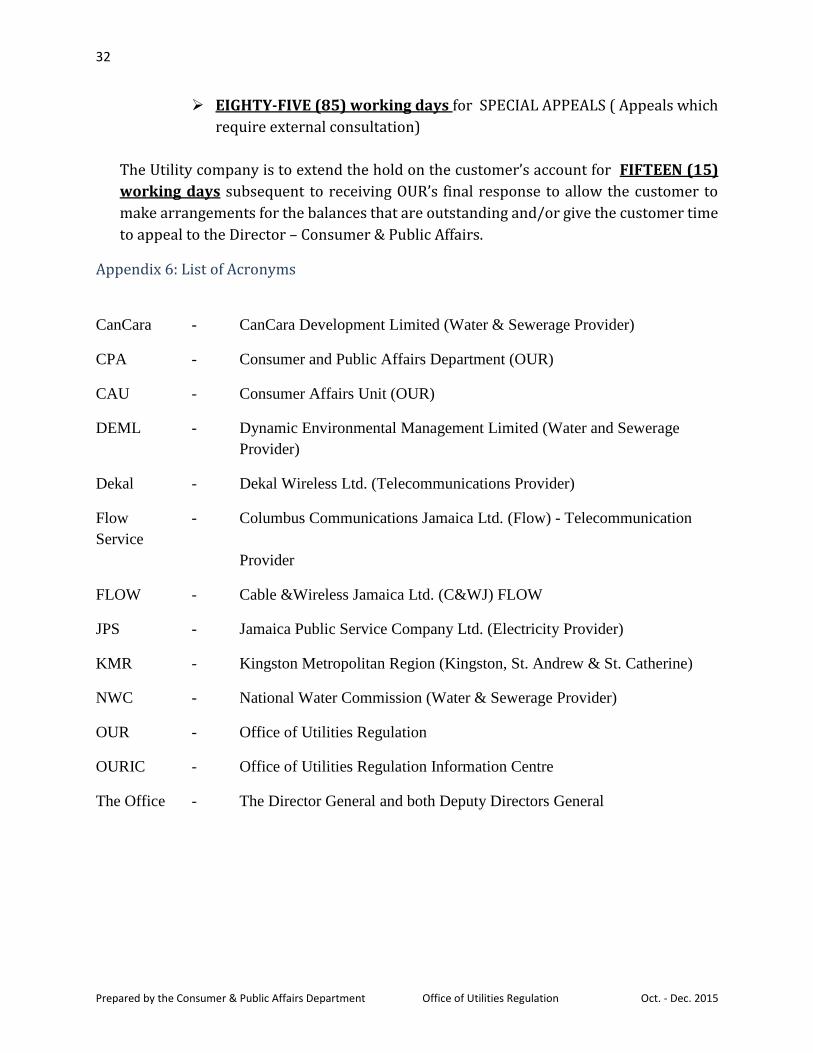
EIGHTY-FIVE (85) working days for SPECIAL APPEALS ( Appeals which
require external consultation)
The Utility company is to extend the hold on the customer’s account for FIFTEEN (15)
working days subsequent to receiving OUR’s final response to allow the customer to
make arrangements for the balances that are outstanding and/or give the customer time
to appeal to the Director – Consumer & Public Affairs.
Appendix 6: List of Acronyms
CanCara - CanCara Development Limited (Water & Sewerage Provider)
CPA - Consumer and Public Affairs Department (OUR)
CAU - Consumer Affairs Unit (OUR)
DEML - Dynamic Environmental Management Limited (Water and Sewerage
Provider)
Dekal - Dekal Wireless Ltd. (Telecommunications Provider)
Flow - Columbus Communications Jamaica Ltd. (Flow) - Telecommunication
Service
Provider
FLOW - Cable &Wireless Jamaica Ltd. (C&WJ) FLOW
JPS - Jamaica Public Service Company Ltd. (Electricity Provider)
KMR - Kingston Metropolitan Region (Kingston, St. Andrew & St. Catherine)
NWC - National Water Commission (Water & Sewerage Provider)
OUR - Office of Utilities Regulation
OURIC - Office of Utilities Regulation Information Centre
The Office - The Director General and both Deputy Directors General