Embed Size (px)
Citation preview
OFFSHORE RADIATION OBSERVATIONS FOR CLIMATE RESEARCH AT THE CERES OCEAN
VALIDATION EXPERIMENT
Submitted to BAMS, September 12, 2005
Charles K. Rutledge1, Gregory L. Schuster2, Thomas P. Charlock2, Frederick M. Denn1, William L. Smith Jr2, Bryan E. Fabbri1, James J. Madigan Jr1, Robert J. Knapp3,
1 Analytical Services and Materials, Inc., Hampton, VA 2 NASA Langley Research Center, Climate Sciences Branch, Hampton, VA 3 Science Applications International Corporation, Hampton, VA
Corresponding Author: Ken Rutledge
{ HYPERLINK "mailto:[email protected]" }Phone: 757-827-4643 FAX: 757-825-8659 Suite 300, One Enterprise Parkway Hampton, VA 23666
https://ntrs.nasa.gov/search.jsp?R=20080015664 2018-05-31T11:45:41+00:00Z
ABSTRACT
When radiometers on a satellite are pointed towards the planet with the goal of
understanding a phenomenon quantitatively, rather than just creating a pleasing image,
the task at hand is often problematic. The signal at the detector can be affected by
scattering, absorption, and emission; and these can be due to atmospheric consituents
(gases, clouds, and aerosols), the earth’s surface, and subsurface features. When targeting
surface phenomena, the remote sensing algorithm needs to account for the radiation
associated with the atmospheric constituents. Likewise, one needs to correct for the
radiation leaving the surface, when atmospheric phenomena are of interest. Rigorous
validation of such remote sensing products is a real challenge. In visible and near
infrared wavelengths, the jumble of effects on atmospheric radiation are best
accomplished over dark surfaces with fairly uniform reflective properties (spatial
homogeneity) in the satellite instrument’s field of view (FOV). The ocean’s surface
meets this criteria; land surfaces - which are brighter, more spatially inhomogeneous, and
more changeable with time - generally do not. NASA’s Clouds and the Earth’s Radiant
Energy System (CERES) project has used this backdrop to establish a radiation
monitoring site in Virginia’s coastal Atlantic Ocean. The project, called the CERES
Ocean Validation Experiment (COVE), is located on a rigid ocean platform allowing the
accurate measurement of radiation parameters that require precise leveling and pointing
unavailable from ships or buoys. The COVE site is an optimal location for verifying
radiative transfer models and remote sensing algorithms used in climate research;
because of the platform’s small size, there are no island wake effects; and suites of
sensors can be simultaneously trained both on the sky and directly on ocean itself. This
paper describes the site, the types of measurements made, multiple years of atmospheric
and ocean surface radiation observations, and satellite validation results.
CAPSULE SENTENCE: NASA’s CERES program is performing high quality surface radiation monitoring in support of climate change research on an ocean platform off of Virginia’s coast.
{PAGE }
INTRODUCTION. The retrieval of shortwave and longwave irradiance at the
planet's surface using satellite observations is an important and complicated business.
The surface, atmospheric and top of atmosphere (TOA) irradiances are the basic drivers
of climate and the hydrological cycle, and satellites are the only practical means of
obtaining global coverage. The retrieval is complicated because using satellite radiation
measurements to infer the surface irradiance requires an accounting for the effects of
aerosols, clouds, and optically-active gases in the atmosphere itself. Aerosols and clouds
are not easily measured. Fortunately, satellite retrievals of surface irradiance can be
validated with surface measurements obtained at various sites throughout the world. This
gives us confidence in the atmospheric correction algorithms and their associated input
parameters (water vapor, aerosols, clouds, etc.). After verifying these algorithms using
surface radiation observations (from various sites) we have more confidence in using
them over the remainder of the planet where surface observations do not exist.
A difficulty arises with the validation, however. Solar radiances at the satellite altitude
are sensitive to the surface albedo, which can vary significantly within a satellite
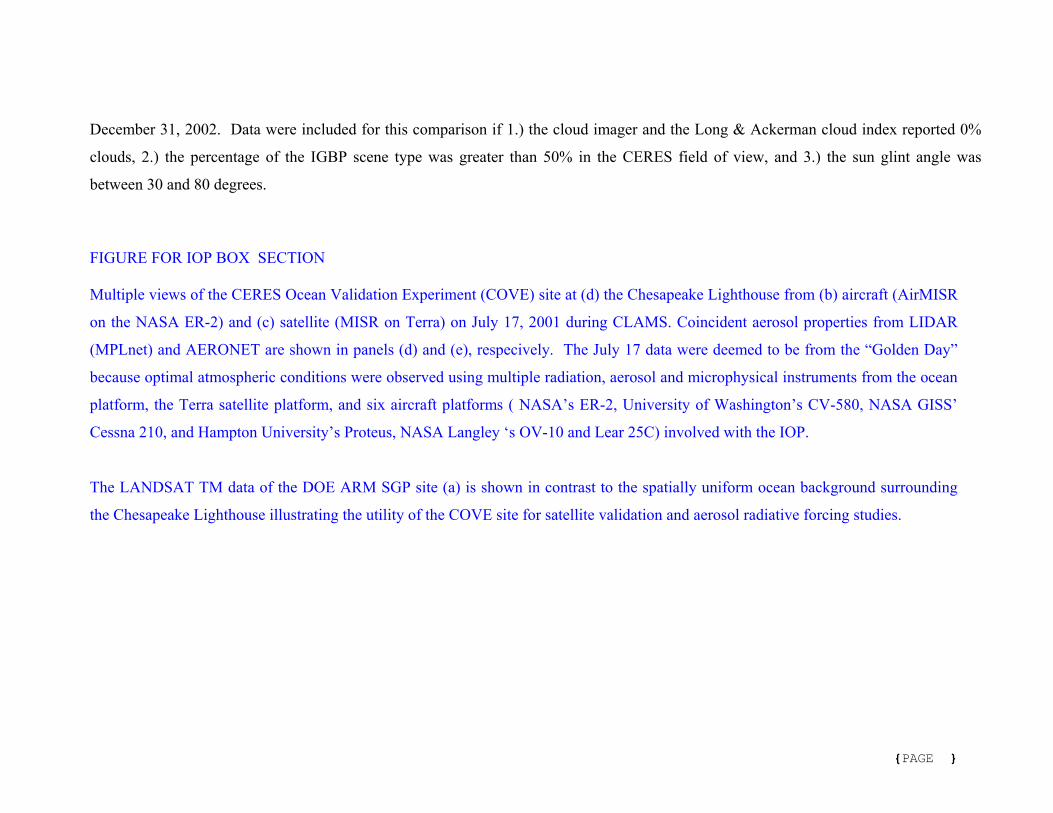
radiometer’s field of view (FOV); an example of variable surface albedo is shown in
Figure 1 for the Southern Great Plains site operated by the Department of Energy's
Atmospheric Radiation Measurement (ARM) program. Such variability in surface
properties is impractical to monitor with ground instrumentation, so at least some sites
that are representative of a single satellite FOV with more homogeneous surface
characteristics are desired for validation of the CERES (Wielicki et al., 1996) Surface and
Atmospheric Radiation Budget (SARB) products (Charlock and Alberta, 1996; Charlock
et al., 2005). The SARB products include surface and atmospheric estimates of
downwelling and upwelling shortwave and longwave irradiances. The ocean offers large
areas of homogeneity, and several island sites are part of the CERES validation program.
Islands can perturb the local meteorological field (Fig 2), however, leading to
discrepancies between the satellite and surface measurements (Nordeen et al., 2001,
McFarlane and Evans, 2003).
{PAGE }
The CERES Ocean Validation Experiment (COVE) was established in 1999 to allow
more optimum observations over ocean waters with minimal island affects. Accurate
radiation observations are continuously collected on the US Coast Guard's Chesapeake
Lighthouse, which is a rigid ocean-platform located in the Atlantic Ocean in Virginia’s
coastal waters (Fig 3). The nearby waters offer a broadband shortwave surface albedo
that is fairly spatially homogeneous over regions comparable to the size of the CERES
instrument FOV (~15 km at nadir); and relatively more homogenous for the smaller
FOVs of imagers like MODIS. The COVE observations are buttressed by the Coupled
Ocean Atmosphere Radiative Transfer Model (COART, Jin et al., 2002), a shortwave
(SW or solar wavelength) radiative transfer tool which runs on line (http://www-
cave.larc.nasa.gov).
PLATFORM DESCRIPTION. The Chesapeake Lighthouse ocean platform
is a multi-level steel structure that was built in 1965 by the US Coast Guard, and was
designed for a full time crew of eight to ten people. Although currently unmanned and
automated, the platform includes reasonable living accommodations for short term
deployments, including a kitchen (complete with a stove and refrigerator), a recreation
room, seven bedrooms, and a full bathroom. These amenities are powered by a 40 kW
diesel generator when necessary (typically after dark). In 1997, NASA Langley entered
into a fifteen year use agreement with the Coast Guard to allow the placement of
atmospheric and oceanic sensors on the platform; NASA personnel maintain these
sensors approximately every 14 days. The quarters building measures approximately 25 x 25 m, and is situated 22.3 m above
mean sea level on pylons that are embedded in the continental shelf. A tower is located
on the Southeast corner of the platform, hosting the atmospheric radiation sensors at 37.5
m above mean sea level. Oceanic irradiance sensors are mounted at a lower level on a
walkway that extends 8 m from the western-most side of the structure (22.3 m above
mean sea level). A helicopter landing deck is located on top of the quarters building at
25.3 m above mean sea level. The sandy bottom on the ocean floor is at a depth of 11.5 m
below mean sea level and is not visible with the naked eye from anywhere on the
{PAGE }
platform (except on extremely clear ocean water conditions). Such clear conditions have
has been observed once during the period associated with the COVE project.
Equipment is ferried to the COVE site by sling loading underneath a helicopter or by boat
transportation (in which case a one ton hoist lifts the equipment from the boat to the
quarters building). Electrical power for the instruments, computers and communication
equipment is provided by large battery banks, which are continuously recharged by solar
panels. Nighttime augmentation of the battery banks by a diesel generator is also possible
when natural resources are inadequate. Data are transmitted to the various instrument
owners by satellite or a fractional T1 Ethernet implemented over a microwave link to the
shore. Video cameras are used to identify presence or absence of recreational fishing
boats which may be in the FOV of the upwelling sensors.
OBSERVATIONS AT COVE. Long-term measurements are desirable so
large sample sizes remain when the datasets are parsed to highlight specific atmospheric
conditions (clear-sky, overcast, low aerosols, etc). Five years of continuous basic
radiation observations have been collected at the COVE site thus far.
The COVE site hosts five observation networks which we discuss in this section.
Broadband irradiance measurements are collected as part of the Baseline Surface
Radiation Network (BSRN) of the World Meteorological Organization (Ohmura et al.,
1998) at COVE. Aerosol optical depths and atmospheric radiance fields are collected as
part of NASA's Aerosol Robotic Network (AERONET; Holben et al., 1998). Aerosol
backscattering and extinction profiles are collected as part of NASA's Micro Pulse Lidar
Network (MPLNET: { HYPERLINK "http://mplnet.gsfc.nasa.gov/" } ). Total column
water vapor measurements are collected as part of NOAA's Ground-Based GPS
Meteorology network (GPS-MET: { HYPERLINK
"http://www.gpsmet.noaa.gov/jsp/index.jsp" }). Basic meteorology, wave energy and
water temperature are measured by NOAA's National Data Buoy Center (NDBC). Other
measurements at the COVE site include narrowband irradiance measurements of the
atmosphere and ocean, photosynthetically active radiation measurements of the
{PAGE }
atmosphere, and infrared pyrometer measurements of sea surface temperature. Ocean
optics observations and wet lab analyses are performed by the Center for Coastal and
Physical Oceanography (a research institute within Old Dominion University). Each of
these are discussed in the following sections.
COVE follows the calibration and operation protocols for all networked instrumentation
at Chesapeake Lighthouse. Sampling is continuous in time for all measurements except
the AERONET sunphotometer (night-time data are not sampled) and the scanning
spectral ocean optics observations. The various instruments have different sampling
intervals, ranging from seconds for the BSRN observations to about 15 minutes for the
AERONET observations.
CONTINUOUS ATMOSPHERIC MEASUREMENTS. The rigid construction of the
Chesapeake Lighthouse (i.e., non-floating) enables accurate radiance and irradiance
measurements in an ocean environment; a list of the continuous measurements at the
Chesapeake Lighthouse is presented in Table 1. The atmospheric instrumentation is
located on top of the lighthouse tower at 37.5 m above mean sea level (with the exception
of the Micro Pulse lidar, which is located on the helicopter landing deck). The ocean-
viewing instrumentation is located 22.3 m above mean sea level, well above the sea spray
associated with breaking waves hitting the structure’s pylons.
Both COVE and NOAA sponsor pressure, temperature, relative humidity, wind speed
and wind direction sensors at Chesapeake Lighthouse. Additionally, NOAA maintains
historical wave height and wave period data through November, 2004 at { HYPERLINK
"http://www.ndbc.noaa.gov/" }.
BSRN INSTRUMENT SUITE. The broadband radiation measurements conform to the
Baseline Surface Radiation Network (BSRN) calibration and sampling protocols
(Ohmura et al., 1998, McArthur, 2005). [Radiometers on ships and buoys, which are all
rocked by waves, simply do not meet the BSRN requirement of measurement from a
stable platform.] A pyrheliometer mounted on a solar tracker that points within 0.1
{PAGE }
degrees of the sun is used to obtain the direct solar irradiance. The same tracking system
provides a shading mechanism for a shortwave pyranometer (for the diffuse irradiance
measurement) and the longwave pyrgeometer (to prevent direct solar heating of the
instrument’s sensor dome). The direct measurements and the shading system for the
diffuse measurements have a 5 degree field of view, enabling the proper component
summation of direct and diffuse radiation (Iqbal, 1983). Ideally, this component
summation should be equal to an ideal global pyranometer measurement, which is not
shaded. The pyranometers and pyrgeometers are ventilated to reduce temperature
gradients within the instruments. Nighttime offset corrections to the pyranometer dataset
per BSRN requirements are performed. The pyrheliometer, up looking pyranometers,
and up looking pyrgeometers are cleaned nightly with an automated washing system.
Data for all BSRN instruments are collected every second and are stored as 1-minute
averages, standard deviations, maxima, and minima at { HYPERLINK
"http://bsrn.ethz.ch" } and at http://cove.larc.nasa.gov/ since July 2000.
The calibration of all COVE shortwave BSRN instrumentation is traceable to the World
Radiometric Reference (Frohlich, 1991). Once each year, we calibrate the operational
pyrheliometer and pyranometers (in place) using an absolute cavity pyrheliometer
(Forgan, 1996). The absolute cavity pyrheliometer is tied to the World Radiometric
Reference through the International Pyrheliometer Comparison at the World Radiation
Center every five years, and the Regional Pyrheliometer Comparison all other years.
Pyrgeometers are calibrated every other year at the World Radiation Center. A reference
pyrgeometer is also maintained by involvement in international intercomparisons carried
out every few years (Philipona et al, 2001).
NARROWBAND IRRADIANCE OBSERVATIONS. Additional atmospheric
measurements sponsored by CERES at COVE include total and diffuse narrowband
irradiance measurements, which are accomplished using a Multi-Filter Rotating
Shadowband Radiometer (MFRSR) and an UltraViolet-MFR (UV-MFR) manufactured
by Yankee Environmental Systems (Harrison et al., 1994). These units use a rotating
shadowband to periodically shade a horizontal detector, allowing intermittent
{PAGE }
measurements of diffuse and total irradiance. The irradiance difference (i.e., total -
diffuse) is used to calculate the direct irradiance. The aerosol optical depth, and total
column water vapor are calculated as described by Michalsky et al. (1995). MFRSR
instruments have been measuring visible downwelling flux almost continuously since the
beginning of July 1999 at the Chesapeake Lighthouse, and an UV-MFR has been in
service since May, 2001.
The MFRSR measures downwelling irradiance at six narrowband wavelengths (0.415,
0.496, 0.614, 0.671, 0.868, and 0.939 microns), while the UV-MFR measures
downwelling irradiance at 0.300, 0.306, 0.312, 0.318, 0.325, 0.332, and 0.368 microns.
The spectral width of the filters for the MFRSR are nominally 10 nm wide (full width at
half maximum) and the filter widths for the UV-MFR are nominally 2 nm wide (full
width half maximum).
We calibrate both the MFRSR and UV-MFR for aerosol optical depth by periodically
sending them to a mountaintop location where the aerosol loading is extremely low
(Mauna Loa, Hawaii). Langley analyses are used to calculate the TOA instrument
voltages, V0 (refs). Additionally, we also calculate the TOA irradiances associated with
the V0 for the UV-MFR by integrating the Solar Radiation and Climate Experiment
(SORCE) satellite measurements over the spectral response function of each UV-MFR
filter. In this way, we were able to determine absolute calibration factors for the UV-
MFR that are linked to the sun as a source. We have applied these calibration factors to
the spectral UV irradiance measurements obtained at the COVE site. Finally, we note that
these mountaintop measurements also indicate the stability of both instruments.
PHOTOSYNTHETICALLY ACTIVE RADIATION The photosynthetically active
radiation (PAR) sensor measures irradiance in the 0.4-0.7 micron spectral region.
Located on the lighthouse tower, data are available as milli-volts since March 2003. The
PAR sensor is calibrated every other year and the data are available at { HYPERLINK
"http://cove.larc.nasa.gov" } .
{PAGE }
NARROWBAND RADIANCE. The Cimel sunphotometer at the COVE site is part of
NASA’s Aerosol Robotic Network (AERONET), a ground based network of more than
245 (personal communication: Wayne Newcomb) radiometers located throughout the
world (Holben et al., 1998, 2001). The radiometers have a narrow field of view (1.2
degrees) and are mounted on programmable trackers enabling direct sun measurements as
well as sky radiance measurements. A filter wheel allows measurements in up to eight
spectral bands, typically centered at wavelengths of 0.34, 0.38, 0.44, 0.5, 0.67, 0.87, 0.94,
and 1.02 microns. Each band has a full width at half maximum (FWHM) of
approximately 0.01 microns. Instruments are calibrated on a yearly rotation schedule by
the AERONET team.
The direct sun measurements are used to infer multi-spectral aerosol optical depths and
total column precipitable water when the path between the instrument and the sun is free
from clouds (AOT refs; Bruegge et al., 1992; Smirnov et al., 2000). The sky radiance
scans are used to infer the columnar aerosol size distributions and refractive indices for
the 0.44, 0.67, 0.87, and 1.02 microns wavelengths (Dubovik and King, 2000; Dubovik et
al., 2000). Hence, the dataset is useful for validation of satellite aerosol optical depth
retrievals, as well as characterization of aerosol properties that are unavailable from
satellite sensors (i.e., size distributions and refractive index). The AERONET data
archive is supported by NASA's Earth Observing System, and available at {
HYPERLINK "http://aeronet.gsfc.nasa.gov/" } . The archive contains data from the
COVE site since October, 1999.
ACTIVE RADIATION MEASUREMENTS. COVE hosts two active radiation
measurements; a Micro Pulse lidar for NASA's Micro Pulse Lidar Network (MPLNET)
and a Global Positioning System (GPS) receiver for the National Oceanic and
Atmospheric Administration's GPS Integrated Precipitable Water (GPS-IPW) project.
The Micro Pulse lidar at the COVE site is an eye-safe system capable of continuously
determining the aerosol layer height, cloud layer height, and cloud structure (Welton et
al., 2001). The lidar operates at a wavelength of 0.523 microns with a vertical resolution
{PAGE }
of 75 m and a maximum range of 60 km. It is located inside of a temperature controlled
enclosure on the helicopter landing deck. Although the lidar is typically pointed
vertically, the enclosure can be rotated horizontally to accommodate calibration
measurements, which are performed approximately every 6 months. Data is available at {
HYPERLINK "http://mplnet.gsfc.nasa.gov/" } . The COVE record for MPL is not as long
or continuous as for the aforementioned passive irradiance instruments.
GPS technology may be used to determine the total column precipitable water vapor
(Businger et al., 1996, Duan et al., 1996). The basic principle is that a GPS microwave
radio signal suffers an atmospheric time delay in its transit from a satellite to the surface,
and the magnitude of the delay is dependent upon the amount of water vapor in the signal
path. A network of multiple GPS satellites can be used to estimate the magnitude of the
equivalent zenith tropospheric delay above any GPS receiver in the network.
Temperature and pressure data at the site are used to subtract the dry component of the
zenith tropospheric delay to obtain the zenith wet delay, which in turn is related to the
integrated precipitable water. Data is available at the NOAA Forecast Systems
Laboratory GPS Meteorology website ( { HYPERLINK "http://www.gpsmet.noaa.gov/" }
).
OCEAN RADIATION MEASUREMENTS. COVE supports continuous upwelling
irradiance measurements of broadband shortwave and longwave radiation. Additionally,
upwelling narrowband irradiances at the MFRSR wavelengths are monitored. These
measurements are obtained with down looking radiometers located on a walkway boom
that extends 8 m from the southwest side of the platform. The MFRSR is located 8.2 m
from the catwalk railing, and the broadband instrumentation is located 7.3 m from the
catwalk railing. These measurements may be used in conjunction with coincident
downwelling irradiance measurements to determine the shortwave broadband albedo,
narrowband albedo, and the net longwave radiation at the surface. Note that the
measurements of upwelling SW irradiance obtained in the morning are not representative
because the main lighthouse structure then shades the instrument FOV significantly;
{PAGE }
users seeking ocean albedo should thus be wary of morning records from the down
looking PSP and MFRSR at COVE. The downlooking broadband radiometers are
calibrated according to the BSRN standards and we periodically rotate the downlooking
MFRSR upward for relative calibrations with respect to the uplooking MFRSR. The
down looking pyranometers have been in place since May 2000, and the downlooking
MFRSR has been in place since July, 2001. All downlooking data is available at {
HYPERLINK "http://cove.larc.nasa.gov" } .
The upwelling irradiance measurements are corrupted each day prior to solar noon, when
the lighthouse structure itself casts a shadow in the vicinity of these sensors. These
irradiance sensors sample a full 2 pi steradian field which includes the ocean and a
portion of the lighthouse structure. A complete assessment of the effects of these field of
view issues is not complete to date although Jin et al. (2005) have compared afternoon
shortwave albedo observations to model calculations and found relative discrepancies to
be less than 8% over a wide angle of sun angles.
COVE also operates an infrared radiation pyrometer for measuring sea surface
temperature. The instrument is mounted on the tower top and points at the ocean's surface
on the east side of the lighthouse. The pyrometer is calibrated yearly by its manufacturer.
Old Dominion University's Center for Coastal and Physical Oceanography has collected
spectral water leaving radiance measurements continuosly, and in-water optics
observations for wet-lab analyses intermittently, since midyear 2001. These
measurements are used to test coastal zone retrieval algorithms for NASA’s Moderate
Resolution Imaging Spectrometer (MODIS) ocean color program.
INTENSIVE OBSERVATION PERIOD MEASUREMENTS. Several intensive observation periods (IOPs) have been held at the COVE site. The
Chesapeake Lighthouse and Aircraft's Measurements for Satellites (CLAMS) was a
month long experiment involving numerous NASA groups associated with specific Earth
Observing System (EOS) satellite sensors and several university researchers. Two six
{PAGE }
week IOPs were also performed in intervening years to validate NASA's Atmospheric
Infrared Sounder (AIRS) instrument aboard the Aqua satellite.
CHESAPEAKE LIGHTHOUSE AND AIRCRAFT MEASUREMENTS FOR
SATELLITES (CLAMS). The CLAMS field campaign was conducted in summer 2001
to validate aerosol and radiation products derived from the MODIS, Multiangle Imaging
SpectroRadiometer (MISR), and CERES instrument data taken from the EOS Terra
spacecraft (Smith Jr. et al., 2005). The synergy of a comprehensive field campaign with
multi-spectral imagery (MODIS), a multi-angle sensor (MISR), and broadband accuracy
(CERES) on a single spacecraft provides unprecedented data for diagnosing particular
aspects of aerosol radiative forcing (i.e., Jin et al., 2005, Levy et al., 2005, Remer et al.,
2005, Ignatov et al., 2005), which is a critical uncertainty factor in decadal scale climate
change.
The aircraft deployment around COVE during CLAMS included the MODIS airborne
simulator (Gatebe et al., 2005) and AirMISR (Kahn et al., 2005) on the ER-2 at 20 km; a
interferometer in the high resolution thermal infrared on the experimental Proteus for
sensing temperature, humidity, and aerosol effects (Smith Sr. et al., 2005); the Ames
Airborne Sunphotometer (AATS-14) remotely sensed spectral aerosol optical depth
(Redemann et al., 2005) and in situ measurements of aerosol physical (Magi et al., 2005)
and chemical (Castanho et al., 2005) properties on a CV-580 at various altitudes;
broadband PSPs on a low level OV-10 (Smith Jr et al., 2005); and a photopolarimeter on
a Cessna (Chowdhary et al., 2005). The ocean surface is the most ubiquitous boundary
condition for solar photons approaching the earth-atmosphere system, and both the brief
CLAMS campaign and the continuous COVE platform provide a rigorous testbed for the
remote sensing of aerosols and fluxes with Terra over that boundary condition.
CLAMS data can be obtained from the NASA Langley Atmospheric Sciences Data
Center ({ HYPERLINK "http://eosweb.larc.nasa.gov" } ). The analyses published to date
have only taken a first cut. For example, the extensive aerosol sampling in CLAMS,
combined with the airborne photopolarimeter measurements then also taken (Chowdhary
{PAGE }
et al., 2005), could be used to rigorously test the feasibility of combining measurements
of polarized spectral radiances with scalar broadband Terra radiances for aerosol forcing.
Given the 2004 launch of the French PARASOL (multidirectional polarized radiances) in
A-train orbit to observe in near space-time simultaneity with EOS Aqua (broadband
radiances from CERES and high spatial resolution MODIS), a succesful local test (with
the existing CLAMS 2001 database) could then confidently be applied over the globe
(with the current A-train).
AIRS BALTIMORE BOMEM ATMOSPHERIC EMITTED RADIANCE
INTERFEROMETER (BBAERI) OCEAN VALIDATION EXPERIMENT. The
AIRS BBAERI Ocean Validation Experiment (ABOVE) was conducted by the
University of Maryland Baltimore County during the summers of 2002 and 2003.
Correlative remote sensing and in situ measurements were deployed at Chesapeake
Lighthouse for validation of the AIRS instrument on the NASA EOS Aqua satellite. The
instrument suite included the BBAERI, Elastic Lidar Facility, radiosondes, ozonesondes,
carbon monoxide and ozone gas samplers. In addition to Aqua validation, ABOVE
measurements are being used for atmospheric pollution and transport process studies.
Information on the ABOVE project can be found at { HYPERLINK
"http://physics.umbc.edu/~mcmillan" } .
OTHER MEASUREMENT CAPABILITIES OF COVE. Additional CERES support
provided at the Chesapeake Lighthouse on an ``as needed" basis have included
radiosonde launches and multi-channel radiance measurements. Radiosonde launches
have been performed to support the CLAMS and INTEX (Intercontinental Chemical
Transport Experiment) field experiments, as well as AQUA, and GPS/MET. The
radiosondes return pressure, temperature, relative humidity and dewpoint readings from
the surface up to 30,000+ meters. Additionally, COVE owns two scanning
spectrophotometers that are programmed for specialized atmospheric and oceanic studies
(see Su et al., 2002, or Ross and Dion, 2004 for examples).
{PAGE }
CHARACTERIZATION OF THE OCEAN AND ATMO-
SPHERE NEAR COVE. In this section, we characterize the COVE site in
terms of its multi-year characteristics for ocean color, ocean albedo, aerosol volume
distributions, and cloud cover.
OCEAN COLOR CLIMATOLOGY. Several research programs have shown the
freshwater plume exiting the mouth of the Chesapeake Bay is important in modulating
many factors associated with the inner continental shelf areas of the Mid-Atlantic Bight
(physical: Boicourt, 1981 Roman and Boicourt, 1999, biological: Rutledge and Marshall,
1981, Grothues and Cowen, 1999, chemical: Bates and Hansell,1999). The dynamic
buoyant plume transports nutrients, biotic and abiotic materials from the bay into the
nearby coastal areas. These materials affect the ocean color of the involved water masses
(Johnson et al., 2001). Near the COVE site, the influence of the plume varies, primarily
depending on the rate of discharge from the bay’s mouth and the strength and direction of
the local winds steering the plume.
Historically, the ocean color community has classified natural waters into two categories
to indicate the complexity of the water relative to the water leaving radiances retrieved by
satellite sensors. In “case 1” waters, the water leaving radiances are primarily modulated
by chlorophyll-a and other components that naturally covary with it (other chlorophylls,
zooplankton and degradation products) . In “case 2” waters, chlorophyll, colored
dissolved organic matter (CDOM) and sediment loads combine to modulate the water
leaving radiances (Sathyendranath, 2000). In general, the variation of spectral radiances
associated with case 2 waters are more complicated than those associated with the case 1
waters. Suspended materials which originate from wave and tidal action in shallow water
(less than 30-50 m) and also from fast flowing streams and rivers are associated with case
2 waters. CDOM originates primarily from large quantities of decaying vegetation and is
also associated with river runoff. Consequently, regions of the open ocean far from
coastlines are typically classified as case 1 waters. Coastal regions can be case 1 or case 2
{PAGE }
water classes, depending upon the depth of the water and proximity to river runoff
(Morel and Antoine, 2000).
Since no long term observations exist for determining the classification of the water type
for the waters near the COVE site we used satellite retrieved information. Six years of
chlorophyll-a retrievals from the Sea-viewing Wide Field-of-view Sensor (SeaWiFS)
satellite were used to infer the optical properties of the water at the COVE site relative to
nearby locations shown in Fig 4. Assuming the water classification for the offshore
Atlantic ocean location is likely to be case 1 and the classification for the water in the
middle of the Chesapeake Bay is likely to be Case 2, we can characterize the COVE site
relative to these locations.
A qualitative result for comparison of these three sites, Fig 5, displays multi-year (clear
sky) chlorophyll-a concentrations using the SEAWIFS default algorithm. These are
averaged results from 9 pixels (3X3) centered over the three locations (bay, COVE and
open ocean). The results suggest the COVE site’s chlorophyll concentrations and hence
ocean color is more similar to the bay site than the open ocean site for much of the year.
During the midyear period, the chlorophyll-a and hence ocean color is distinctly different
from both the bay and offshore oceanic site. These results are not definitive since the
retreival algorithms for the case 2 region are not fully validated. They do although
represent the present state-of-the-art.
OCEAN ALBEDO CLIMATOLOGY. The ocean albedo is the ratio of the upwelling
shortwave irradiance (reflected irradiance plus emergent irradiance from beneath the
ocean’s surface) to the downwelling shortwave irradiance, and is an important parameter
for accurate radiative transfer calculations. The radiation components for deriving ocean
albedo has been monitored at the COVE site continuously since May 2000. Figure 6 shows the shortwave ocean albedo result as a contour of medians of thirty
minute irradiance observation averages; as a function of solar elevation angle and
atmospheric transmission. The data summary period was September 1999 through
December 2003 (inclusive). This time interval is the longest for such measurements in the
{PAGE }
open literature (from a stable ocean platform). Here, we have defined the transmission,
T, according to Payne (1972):
T = ID / ( S cosθ0/γ2) ,
where ID represents the downwelling shortwave irradiance, S is the solar constant, θ0 is
the solar zenith angle, and γ represents the ratio of actual to mean earth-sun separation.
The solar elevation angle and transmission data were binned and contoured to represent
albedo (forming 481 bins). Derived abedo from 11,080 observations of upwelling and
downwelling shortwave global irradiance are summarized in the contour result. The
largest albedo values observed occur when the sun is near the horizon in clear skies
(upper left area of Fig 6), caused by specular reflection of the sun glint. Hazy and cloudy
skies reduce the magnitude of the ocean sun glint, which results in lower ocean albedo.
Likewise, specular reflection is reduced at high sun elevation angles, which also reduces
the albedo.
These data lack a correction for the radiative effects of the influence of the ocean
platform structure on the upwelling SW irradiances. This correction is likely complicated
since it will vary with numerous factors important to the optical properties of the ocean,
atmosphere and ocean platform (scattering, reflection, and absorption). Work towards the
understanding of this complex correction for the ocean albedo is underway.
These COVE data have been used for validation purposes in a parameterization of ocean
albedo using the COART model ( Jin et al., 2004). The parameterization was developed
to allow global climate models access to a dynamic ocean albedo based on multi-year
observations of albedo as a function of five parameters (optical depth, solar cosine
zenith, windspeed and concentrations of chlorophyll-a). The ocean albedo
parameterization results may be obtained at the following website: { HYPERLINK
"http://snowdog.larc.nasa.gov/jin/getocnlut.html" } .
{PAGE }
AEROSOL CLIMATOLOGY. It is typical to classify mid-latitude atmospheric
aerosols according to their source location as continental, urban, desert, or maritime
(Hess et al., 1998). Aerosols size distributions are usually bimodal. Particles with radii
less than 0.6 microns are considered to be part of the “fine" mode, while particles with
radii greater than or equal to 0.6 microns are considered to be part of the “coarse" mode.
Urban and continental aerosol size distributions are typically dominated by fine mode
particle sizes, while desert and maritime aerosols are typically dominated by coarse mode
particle sizes. Spectral optical depth of a sample of small, fine mode sample decreases
quickly at longer wavelengths. Aerosol optical depths at COVE are measured using the
MFRSR and the AERONET sunphotometer during clear sky periods throughout the year.
Although the Chesapeake Lighthouse is located 25 km from the nearest land mass, the
aerosols at this location are generally dominated by small particle sizes; they are
consistent with urban/continental aerosols rather than the large particle sizes associated
with marine aerosols. The predominantly westerly winds cause aerosols from the North
American continent to pass over COVE regularly. Our back trajectory analysis for the
1999-2003 time period using NOAA's Hysplit model ( { HYPERLINK
"http://www.arl.noaa.gov/ready/hysplit4.html" } ) indicates that 67 percent of the one day
trajectories originate over the North East United States (defined as due West from
Chesapeake Lighthouse to 49 degrees East of true North) and another 23 percent of the
trajectories originate over the Southern United States (due South to due West).
Wintertime AODs at COVE typically correspond to clean conditions, with monthly
averages of about 0.08 at 0.5 micron (500 nm) during December through February. The
aerosol optical depth increases throughout the Spring until it peaks at monthly averaged
values of about 0.35 during the hazy summers months (June through August). The
summertime peak in aerosol optical thickness occurs during the same time of year that
the total column precipitable water vapor peaks, indicating that hygroscopic particles play
a significant role in solar attenuation for the summertime aerosols.
{PAGE }
The seasonal variability of the atmospheric aerosols at COVE is also exhibited in the
aerosol size distributions at the site. Fig 7 shows seasonal average aerosol size
distributions at the COVE site (data downloaded from the AERONET database). All of
the distributions are multi-modal, with a relative minimum at a radius of about 0.6
microns. The solid black line of Figure 7 corresponds to the relatively pristine conditions
of the winter months (December-February), with low concentrations of both the fine and
coarse modes. The spring months of March-May show an increase in both modes. The
hazy summer months (June-August) have the most pronounced fine mode.
CLOUD CLIMATOLOGY. The cloud conditions at any specific surface observation site
play an important part in modulating the downwelling SW and LW irradiances. We used
an algorithm developed by Long and Ackerman (2000) that is based on radiation
measured at the site to infer the percentage of sky (for example 0-3 percent = clear, 97-
100 percent = overcast) that is obscured by clouds. Fig 8 shows the monthly mean
percent clear, overcast and partly cloudiness for the September 2000 to January 2004
time period. The annual trend for clear skies show the summer months to have the fewest
periods of clear skies (June-August: approximately 10 percent), while the month of
October has the highest occurrence of clear skies (35 percent). May has the highest
occurrence of overcast skies, and the summer months (JJA) have the highest occurrence
of partly cloudy skies (approximately 60 percent).
SATELLITE VALIDATION. The CERES satellite instruments measure broadband
radiance at the top of the atmosphere to monitor climate change; these measurements are
also incorporated with additional satellite measurements and climatological datasets into
a fast radiative transfer code to infer surface irradiances (Fu and Liou, 1993; Charlock
and Alberta, 1996). This retrieval of broadband irradiance at the surface is important
because that is where we feel the impact of climate change. Below, we show how the
CERES retrieval of surface irradiance over the ocean at COVE compares to the retrieval
of irradiances over various land scenes classified by the International Geosphere-
Biosphere Programme (IGBP; Brasseur et al., 2005).
{PAGE }
Satellite retrievals of aerosol optical depth over land are plagued with uncertainties in the
often substantial surface albedo; the ground usually reflects more to space than do
aerosols - which is not the case over water. This adds additional uncertainty to the
retrievals over land (see below).
COMPARISON OF AEROSOL LOADING FROM SATELLITE RETREIVALS
AND SURFACE OBSERVATIONS. One of the most important parameters for
determining the radiative effects of aerosols is AOD, which can be measured precisely
from the spectral extinction of the direct solar beam with sunphotometers located at the
surface. Satellite retrievals of AOD, on the other hand, require input assumptions about
the aerosol size distributions and the refractive index, which affect directional scattering.
Erroneous input assumptions for directional scattering – or stray scattering by undetected
clouds - can result in large retrieval errors with satellite data. Nonetheless, satellite
retrievals of AOD are important because they provide the only means of obtaining global
coverage. Hence, aerosol scientists are constantly refining techniques to improve satellite
retrievals, in the hopes of providing the best results when compared to the ground
``truth." In this section, we compare the satellite-derived aerosol optical depth to surface
measurements over a land site and over the COVE site to determine the benefit of aerosol
optical depth measurements at the COVE site, choosing the Atmospheric Radiation
Measurement (ARM) program Southern Great Plains (SGP) site shown in Fig 9 as our
land site.
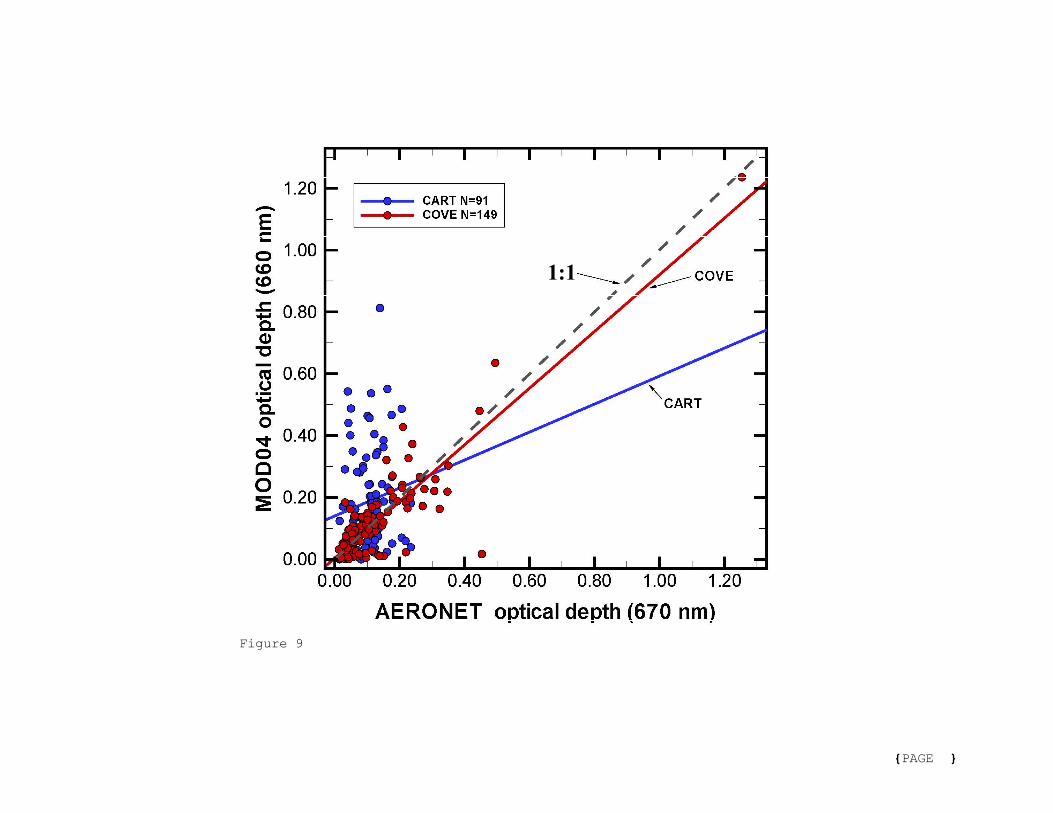
We use the MODIS aerosol optical thickness product at a wavelength of 660 nm
(MOD04/L2) for the satellite retrieval (Kaufman et al., 1997) and the AERONET product
at a wavelength of 670 nm for the surface measurement (Holben et al., 1998, 2001). Note
that the MODIS Atmospheres group uses different retrieval algorithms depending on
whether the retrieval is over land or over ocean, whereas surface measurements simply
utilize the extinction law at all locations worldwide (Shaw et al., 1973).
Figure 9 shows all MODIS and AERONET optical depths that are time synchronized to
within five minutes at the two sites during the 2000-2003 timeframe. Here, we see that
{PAGE }
the MODIS Atmospheres retrieval over ocean at COVE is performing appreciably better
than over land at the ARM SGP site, as indicated by the grouping of the data relative to
the line of agreement. The COVE comparison (blue circles) presents a dataset where the
points generally cluster along the agreement line, with higher variability observed at
optical depths greater than 0.15. The optical depth comparison over land (green squares)
shows a weak association of points grouping relative to the agreement line, and the
variability of the MODIS data are observed to be high through out the entire range of
AERONET optical depths. Remer et al. (2005) and Levy et al. (2005) also show that the
MODIS aerosol optical depth retrieval over ocean performs better than the MODIS
aerosol optical depth retrievals over land.
CERES BROADBAND IRRADIANCE RETRIEVAL AT THE SURFACE. One
component of CERES, the Surface and Atmosphere Radiation Budget (SARB) product
(Charlock et al., 2005), uses top of atmosphere (TOA) irradiances obtained from the
CERES satellite instrument and additional data in a modified version (Rose and
Charlock, 2002) of the Fu-Liou (1993) radiative transfer code to compute irradiances
throughout the atmospheric column. Inputs include cloud properties from either VIRS
(aboard TRMM) or MODIS (aboard Terra and Aqua), and gridded fields of temperature,
humidity, wind (GEOS 4, Bloom et al., 2005) and ozone (NCEP Stratospheric
Monitoring group Ozone Blended Analysis). Aerosols are incorporated from MODIS
retrievals when available (i.e., during clear skies) or from the Model of Atmospheric
Transport and Chemistry (MATCH) transport model.
No surface radiometric measurements are used to retrieve SARB, but they are used to
evaluate it through the CERES ARM Validation Experiment (CAVE, Rutan et al., 2001),
a web-accessible archive of time synchronized surface observations and CERES products
({ HYPERLINK "http://www-cave.larc.nasa.gov/cave/" }). CAVE uses the World
Meteorological Organization (WMO) Baseline Surface Radiation Network (BSRN;
Ohmura et al., 1998) and a selection of other high quality surface radiation measurement
sites. In this section, we use CAVE data to demonstrate that clear sky surface irradiances
inferred by CERES are more reliable at COVE than at sites on various land types.
{PAGE }
The SARB shortwave downwelling global irradiance retrievals at the surface are
compared to surface observations for nine IGBP scene types in Fig 10 (only IGBP scenes
that have sample sizes greater than or equal to the COVE site were chosen for this
figure). Here we use the Terra Edition 2B SARB products. The centerlines of the blue
boxes in Fig 10 represent the population medians, the box extents represent the upper and
lower first quartiles, and the whisker extents represent the upper and lower second
quartiles (after Tukey; 1975). The width of these boxes are proportional to the square
root of the sample sizes. The sample sizes range from 22 for the water bodies to 274 for
the woody savanna IGBP scene types.
The COVE data represents 91 percent of the validation data in the water bodies scene
type (all of which are ocean sites). The boxplots indicate that the best agreement for
despersion for these nine scene types are found for the ocean sites. The bias and
dispersion for the ocean validation data are smaller than all the other IGBP scene types
(as evidenced by the relative proximity of the group medians to the zero line and the size
of the boxes and whiskers). The relatively low albedo and high homogeneity of the
ocean scenes relative to the other sites are likely the reasons for this better agreement.
Conversely, the fresh snow scene type with a high albedo and high surface homogeneity
results in the largest bias and dispersion of all the scene types.
Conclusions NASA’s CERES program is performing high quality ocean environment SW and LW
radiation observations required for climate change research on a unique long-term
radiation monitoring site located on an ocean platform. Observation methods of the
BSRN are used to provide the most accurate ocean environment long-term radiation
measurements available. The co-location of NASA’s AERONET and MPLNET
observations along with NOAA’s GPS-MET and NDBC observations at the COVE site
provide valuable information for verifying algorithms associated with SW and LW
radiation transfer mechanisms within the ocean and atmosphere.
{PAGE }
The waters surrounding the COVE site are more indicative of the Case 2 water type than
the open ocean Case 1 water type. Aerosol load retreivals based on satellite measured
radiation (by NASA’s MODIS project) have demonstrated that the aerosol retrieval
process is superior over the COVE site compared to a typical land site. Both the small
magnitude of surface albedo over ocean, plus its relative spatial homogeneity when
compared with land sites, enables more accuate satellite retrievals of both aerosols and
surface insolation over water. Agreement between CERES SARB retrieved surface
shortwave parameters to the observed shortwave parameters obtained at the COVE ocean
site show negligible bias and have the smallest variability when compared to all other
IGBP scene types representing the planet’s surface.
Acknowledgements. The authors express gratitude for the support of Bruce
Wielicki (CERES PI) and the entire CERES science team in developing and working to
mature the CERES project to the level where a validation site like COVE was required.
Funding was provided through the NASA EOS program office through the CERES grant.
The radiative transfer modeling efforts of Zhonghai Jin (also from the SARB working
group) have led to many interesting validation/observation efforts and countless
interesting discussions on radiative transfer theory.
The COVE project has benefited significantly from working with numerous members of
the US Coast Guard’s Group Hampton Roads. Their guidance in marine safety and
assistance in the initial implementation at the site was and continues to be invaluable.
{PAGE }
REFERENCES Bates N. R. and D. A. Hansell, 1999: A high resolution study of surface layer
hydrographic and biogeochemical properties between Chesapeake Bay and Bermuda. Marine Chemistry, 67, 1–16.
Bloom, S., A. da Silva, D. Dee, M. Bosilovich, J.-D. Chern, S. Pawson, S. Schubert, M.
Sienkiewicz, I. Stajner, W.-W. Tan, M.-L. Wu, 2005: Documentation and Validation of the Goddard Earth Observing System (GEOS) Data Assimilation System - Version 4 . Technical Report Series on Global Modeling and Data Assimilation 104606 , 26. Document http://gmao.gsfc.nasa.gov/systems/geos4/
Brasseur, G. , W. Steffen, K. Noone, 2005: Earth System Focus for Geosphere-
Biosphere Program. Eos Transactions, American Geophysical Union, 86, 209-213. Bruegge, C.J., J.E. Conel, R.O. Green, R.O. Margolis, R.G. Holm, G. Toon, 1992: Water
vapor column abundance retrievals during FIFE. J. Geophys. Res., 97, 18759 - 18768. Boicourt, W. C., 1981: Circulation in the Chesapeake Bay entrance: estuary-shelf
interactions. In Proceedings of the Chesapeake Bay Plume Study, Superflux 1980. NASA Conf. Publication 2188, 61-78.
Businger, S., S.R. Chiswell, M. Bevis, J. Duan, R. Anthes, C. Rocken, R.W. Ware, M.
Exner, T. VanHove, F.S. Solheim, 1996: The promise of GPS in atmospheric monitoring, Bull. Amer. Meteor. Soc., 77.
Castanho, A. D. A., J. Vanderlei Martins, P. Artaxo, L. Remer, M. Yamasoe, 2005:
Chemical characterization of aerosols on the East Coast of the United States using aircraft and ground based stations during the CLAMS Experiment. J of Atmos. Sci., 62, 934-946 .
Charlock, T. P., and T. L. Alberta, 1996: The CERES/ARM/GEWEX Experiment
(CAGEX) for the retrieval of radiative fluxes with satellite data. Bull. Amer. Meteor. Soc., 77, 2673-2683.
Charlock, T. P., F. G. Rose, D. A. Rutan, L. H. Coleman, T. Caldwell, and S. Zentz,
2005: Global Multiyear Analysis of CERES Terra Observations and Radiative Transfer Calculations. Proceedings of ARM Science Team Meeting, 14-18 March 2005, Daytona Beach. Available at { HYPERLINK http://www.arm.gov } under “Publications”.
Charlock, T. P., F. G. Rose, D. A. Rutan, C. K. Rutledge, K. T. Larman, Y. Hu, S. Kato,
and M. Haeffelin, 2000: Clouds and the Earth’s Radient Energy System Calidation Document / Surface and Atmospheric Radiation Budget Validation Plan for CERES Subsystem 5.0 (Compute Surface and Atmospheric Fluxes), http://asd-www.larc.nasa.gov/validation/ceresval_r4.0_ss5.0.pdf
{PAGE }
Chowdhary, J., B. Cairns, M. I. Mishchenko, P. V. Hobbs, G. Cota, J. Redemann, K. Rutledge, B. N. Holben, and E. Russel, 2005: Retrieval of aerosol scattering and absorption properties from photo-polarimetric observations over the ocean during the CLAMS experiment. J of Atmos. Sci., 62, 1093-1117.
Duan, J., M. Bevis, P. Fang, Y. Bock, S. Chiswell, S. Businger, C. Rocken, F. Solheim,
T. van Hove, R. Ware, S. McClusky, T.A. Herring, R.W. King, 1996: GPS Meteorology: Direct estimation of the absolute value of precipitable water. J. Appl. Meteor., 35, 830-838.
Dubovik, O. and M. D. King, 2000: A flexible inversion algorithm for retrieval of aerosol
optical properties from Sun and sky radiance measurements. J. Geophys. Res., 105, 20673-20696.
Dubovik, O., A. Smirnov, B. N. Holben, M. D. King, Y.J. Kaufman, T. F. Eck, and I.
Slutsker, 2000: Accuracy assessments of aerosol optical properties retrieved from AERONET sun and sky-radiance measurements. J. Geophys. Res., 105, 9791-9806.
Forgan, B. W ., 1996: A new method for calibrating reference and field pyranometers.
Journal of Atmospheric and Oceanic Technology, 13, 638-645. Frolich, C., 1991: History of Solar Radiometry and the World Radiometric Referenc.e.
Metrologia, 28, 111-115. Fu, Q., and K.-N. Liou, 1993: Parameterization of the radiative properties of cirrus
clouds. J. Atmos. Sci., 50, 2008-2025. Gatabe, C. K., M. D. King, A. I. Lyapustin, G. T. Arnold, and J. Redemann, 2005:
Airborne spectral measuremens of ocean directional reflectance. J of Atmos. Sci., 62, 1072-1092.
Grothues T. M. and R. K. Cowen, 1999: Larval fish assemblages and water mass history
in a major faunal transition zone. Continental Shelf Research, 19, 1171-1198. Harrison, L., J. Michalsky, J. Berndt, 1994: Automated multifilter rotating shadow-band
radiometer: an instrument for optical depth and radiation measurements. Appl. Opt., 33, 5118-5125.
Hess, M., P. Koepke, I. Schult, 1998: Optical properties of aerosols and clouds: the
software package OPAC. Bull. Amer. Meterol. Soc., 79 , 831-844. Holben, B. N., T. F. Eck, I. Slutsker, D. Tanré, J. P. Buis, A. Setzer, E. Vermote, J. A.
Reagan, Y. Kaufman, T. Nakajima, F. Lavenu, I. Jankowiak, and A. Smirnov, 1998: AERONET- A federated instrument network and data archive for aerosol characterization. Rem.Sens.Environ., 66, 1-16.
{PAGE }
Holben, B.N. and D. Tanre and A. Smirnov and T.F. Eck and I. Slutsker and N. Abuhassan and W.W. Newcomb and J.S. Schafer and B. Chatenet and F. Lavenu and Y.J. Kaufman and J. Vande Castle and A. Setzer and B. Markham and D. Clark and R. Frouin and R. Halthore and A. Karneli and N.T. O'Neill and C. Pietras and R.T. Pinker and K. Voss and G. Zibordi, 2001: An emerging ground-based aerosol climatology: {A}erosol optical depth from {AERONET}. J. Geophys. Res., 106, D11, 12067-12097.
Ignatov, A., P. Minnis, N. Loeb, B. Wielicki, W. Miller, S. Sun-Mack, D. Tanre, L.
Remer, I. Laszlo, and E. Geier, 2005: Two MODIS aerosol products over ocean on the Terra and Aqua CERES SSF datasets. J of Atmos. Sci., 62, 1008-1031.
Iqbal, M., 1983: An Introduction to Solar Radiation, New York, Academic Press, p. 101. Jin, Z., T. P. Charlock, W. L. Smith Jr., K. Rutledge, 2004,: A parameterization of ocean
surface albedo. Geophys. Res. Ltrs., 31, 2004, 4 pp. Jin, Z., T. P. Charlock, W. L. Smith, Jr., K. Rutledge, G. Cota, R. Kahn, J. Redemann, T.
Zhang, D. A. Rutan, F. Rose, and B. N. Holben, 2005: Radiation measurement and model simulation for the CLAMS experiment. J of Atmos. Sci., 62, 1053-1071.
Jin, Z., T. P. Charlock, and C.K. Rutledge, 2002: Analysis of broadband solar radiation
and albedo over the ocean surface at COVE. J. of Atmospheric and Oceanic Technology, 19, 1585-1601.
Johnson, D. R., A. Weidemann, R. Arnone, and C. O. Davis, 2001: Chesapeake Bay
outflow plume and coastal upwelling events: Physical and optical properties. J. of Geophysical Research, 106, 11613-11622.
Kahn, R., W.-H. Li, J. Martonchik, C. Bruegge, D. J. Diner, B. Gaitely, W. Abou, O.
Dubovik, B. Holben, A. Smirnov, Z. Jin and D. Clark, 2005: MISR calibration and implications for low-light-level aerosol retrieval over dark water. J of Atmos. Sci., 62, 1032-1052.
Kaufman, Y.J., D. Tanre, 1997: Algorithm for remote sensing of tropospheric aerosol
from MODIS, ATBD-MOD-02. available at { HYPERLINK "http://modis.gsfc.nasa.gov/data/atbd/atbd_mod02.pdf" } .
Levy, R. C., L. A. Remer, J. V. Martins, Y. J. Kaufman, A. Plana-Fattori, J. Redemann,
and B. Wenny, 2005: Evaluation of the MODIS aerosol retrievals over ocean and land during CLAMS. J of Atmos. Sci., 62, 947-973.
Long, C.N., and T.P. Ackerman, 2000: Identification of clear skies from broadband
pyranometer measurements and calculation of downwelling shortwave cloud effects. J. Geophys. Res., 105, 15,609 –15,626, 2000
{PAGE }
Magi, B.I., P.V. Hobbs, T.W. Kirchstetter, T. Novakov, D. A. Hegg, S. Gao, J. Redemann, and Beat Schmid, 2005: Aerosol Properties and Chemical Apportionment of Aerosol Optical Depth at Locations off the United States East Coast in July and August 2000. J of Atmos. Sci., 62, 919-933.
McArthur L.J.B., 2005: Baseline Surface Radiation Network (BSRN). Operations
Manual. WMO/TD-No. 1274, WCRP/WMO. Sally A. McFarlane, S. A., and K. F. Evans, 2003: Clouds and Shortwave Fluxes at
Nauru. Part I: Retrieved Cloud Properties, J. of the Atmos. Sci., 61, 733–744. Michalsky, J.J., J.C. Liljegren, L.C. Harrison, 1995: A comparison of Sun photometer
derivations of total column water vapor and ozone to standard measures of the same at the Southern Great Plains Atmospheric Radiation Measurement site, J. Geophys. Res., 100 , 25995-26003.
Morel, A. and D. Antoine, 2000: MERIS ATBD - Pigment Index Retrieval in Case 1 Waters, PO-TN-MEL-GS-0005 available at { HYPERLINK "http://envisat.esa.int/instruments/meris/pdf/atbd_2_09.pdf" } . Nordeen, M. L., P. Minnis, D. R. Doeling, D. Pthewich and L. Nguyen, 2001: Satellite observations of cloud plumes generated by Nauru, Geophys. Res. Let., 28, 632-634. Ohmura A., H. Gilgen, H Hegner, G. Muller, M. Wild, E. Dutton, B. Forgan, C. Frolich,
R. Philipona, A. Heimo, G. Konig-Langlo, B. McArthur, R. Pinker, C. Whitlock, K., and K. Dehne, 1998: Baseline Surface Radiation Network (BSRN/WRMC), a new precision radiometryfor climate research. Bull. Amer. Meteor. Soc., 79, 2115-2136.
Payne, R.E., 1972: Albedo of the Sea Surface. J. of the Atmos. Sci., 29, 959-970. Philipona, R., E.G. Dutton, T. Stoffel, J. Michalsky, I. Reda, A. Stifter, P. Wendling, N.
Wood, S.A. Clough, E.J. Mlawer, G. Anderson, H.E. Revercomb, and T.R. Shippert, 2001: Atmospheric longwave irradiance uncertainty: Pyrgeometers compared to an absolute sky-scanning radiometer, the atmospheric emitted radiance interferometer, and radiative transfer model calculations. J. Geophys. Res., 106, 28129-28141.
Redemann, J., B. Schmid, J. A. Eilers, R. Kahn, R. C. Levy, P. B. Russell, J. M.
Livingston, P. V. Hobbs, W. L. Smith Jr., B. N. Holben, 2005: Suborbital measurements of spectral aerosol optical depth and its variability at sub-satellite-grid scales in support of CLAMS. J. Atmos. Sci., 62, 993-1007.
Remer, L. A., Y. J. Kaufman, D. Tanre, S. Mattoo, D. A. Chu, J. V. Martins, R.-R. Li, C.
Ichoku, R. D. Levy, R. G. Kleidman, T. F. Eck, E. Vermote, and B. N. Holben, 2005: The MODIS aerosol algorithm, products, and validation. J. Atmos. Sci., 62, 947-973.
{PAGE }
Roman, M. R., and W. C. Boicourt, 1999: Dispersion and Recruitment of Crab Larvae in the Chesapeake Bay Plume: Physical and Biological Controls. Estuaries, 22, pp. 563–574.
Rose, F. G., and T. P. Charlock, 2002: New Fu-Liou Code Tested with ARM Raman
Lidar and CERES in pre-CALIPSO Exercise. Extended abstract for 11th Conference on Atmospheric Radiation (AMS), 3-7 June 2002 in Ogden, Utah.
Ross, V. and D. Dion, 2004: Assessment of sea slope statistical models using a detailed
micro-facet BRDF and upwelling radiance measurements. Optics in Atmospheric Propagation and Adaptive Systems VII, J. D. Gonglewski and K. Stein, eds., SPIE,. 112-122.
Rutan, D. A., F. G. Rose, N. Smith, and T. P. Charlock, 2001: Validation Data Set for CERES Surface and Atmospheric Radiation Budget (SARB). GEWEX News, Vol. 11, No. 1 (February), pp. 11-12. Available at { HYPERLINK http://www.gewex.com } under “Newsletter”.
Rutledge, C. K. and H.G. Marshall, 1981: Use of ordination and classification procedures to evaluate phytoplankton communities during Superflux II, In Proceedings of the Chesapeake Bay Plume Study, Superflux 1980. NASA Conf. Publication 2188, 469-490.
Sathyendranath, S. (ed.), 2000: Remote Sensing of Ocean Colour in Coastal, and Other
Optically-Complex, Waters, IOCCG Report Number 3. Shaw, G.E., J.A. Reagan, B.M. Herman, 1973: Investigations of atmospheric extinction
using direct solar radiation measurements made with a multiple wavelength radiometer, J. Appl. Meteorol., 12, 374-380.
Smirnov, A., B.N. Holben, T.F. Eck, O. Dubovik, I. Slutsker, 2000: Cloud screening and quality control algorithms for the AERONET database, Rem. Sens. Env., 73, 337-349.
Smith, W. L. Jr., T.P. Charlock, R. Kahn, J.V. Martins, L.A. Remer, P.V. Hobbs, J.
Redemann, C.K. Rutledge, 2005: EOS-TERRA aerosol and radiative flux validation: An overview of the Chesapeake Lighthouse and Aircraft Measurements for Satellites (CLAMS) experiment. J of Atmos. Sci., 62, 903-918.
Smith, W. L. Sr., D. K. Zhou, A. M. Larar, S. A. Mango, H. B. Howell, R. O. Knuteson,
H. E. Revercomb, and W. L. Smith Jr., 2005: The NPOESS airborne sounding testbed interferometer remotely sensed surface and atmospheric conditions during CLAMS. J of Atmos. Sci., 62., 1118-1134.
Su, W., T. P. Charlock, and C.K. Rutledge, 2002: Observations of reflectance distribution
around sunglint from a coastal ocean platform, Applied Optics, 41, 7369-7383.
{PAGE }
Tukey, J. W. (1977). Exploratory data analysis. Reading, MA: Addison-Wesley Publishing Company.
Wielicki, B. A., B. R. Barkstrom, E. F. Harrison, B. B. Lee III, G. L. Smith, and J. E.
Cooper, 1996: Clouds and the Earth’s radiant energy system (CERES): an earth observing system experiment, Bull Amer. Meteor. Soc., 77, 853-868.
Welton, E.J., J.R. Campbell, J.D. Spinhirne, V.S. Scott, 2001: Global monitoring of
clouds and aerosols using a network of micro-pulse lidar systems, in Lidar Remote Sensing for Industry and Environmental Monitoring, U. N. Singh, T. Itabe, N.
Sugimoto, (eds.), Proc. SPIE, 4153, 151-158.
{PAGE }
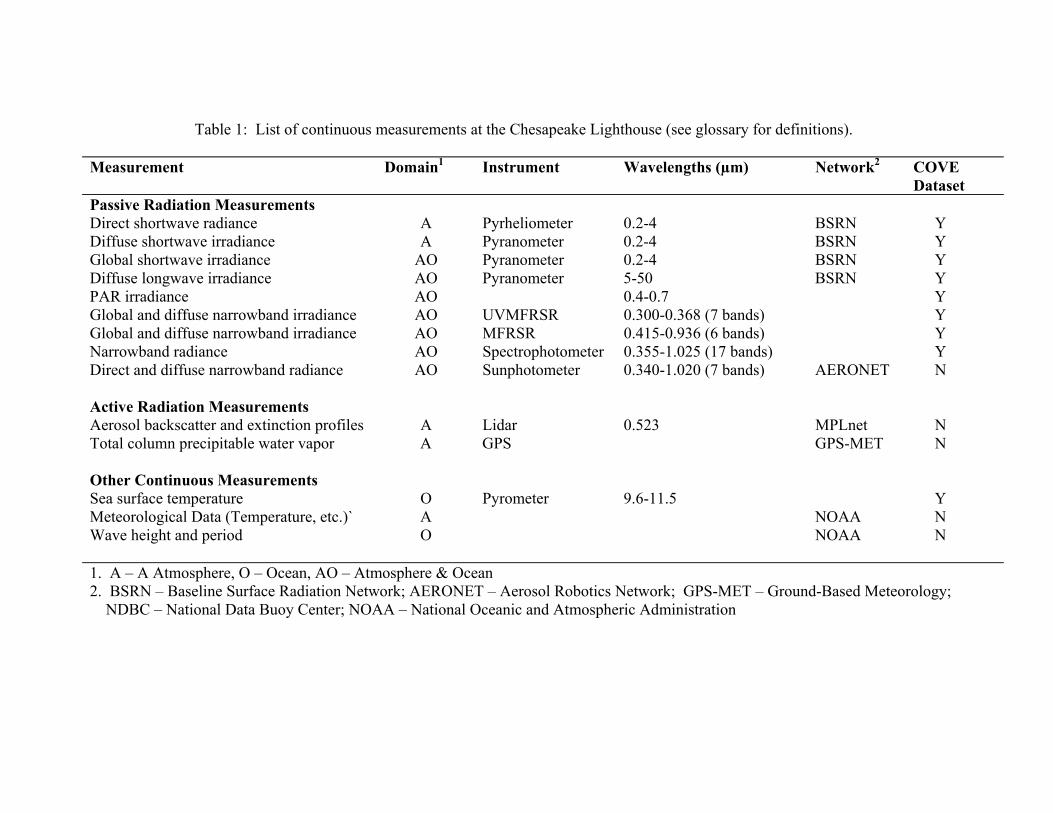
Table 1: List of continuous measurements at the Chesapeake Lighthouse (see glossary for definitions). Measurement Domain1 Instrument Wavelengths (µm) Network2 COVE
Dataset Passive Radiation Measurements Direct shortwave radiance A Pyrheliometer 0.2-4 BSRN Y Diffuse shortwave irradiance A Pyranometer 0.2-4 BSRN Y Global shortwave irradiance AO Pyranometer 0.2-4 BSRN Y Diffuse longwave irradiance AO Pyranometer 5-50 BSRN Y PAR irradiance AO 0.4-0.7 Y Global and diffuse narrowband irradiance AO UVMFRSR 0.300-0.368 (7 bands) Y Global and diffuse narrowband irradiance AO MFRSR 0.415-0.936 (6 bands) Y Narrowband radiance AO Spectrophotometer 0.355-1.025 (17 bands) Y Direct and diffuse narrowband radiance
AO Sunphotometer 0.340-1.020 (7 bands)
AERONET N
Active Radiation Measurements Aerosol backscatter and extinction profiles A Lidar 0.523 MPLnet N Total column precipitable water vapor
A GPS GPS-MET N
Other Continuous Measurements Sea surface temperature O Pyrometer 9.6-11.5 Y Meteorological Data (Temperature, etc.)` A NOAA N Wave height and period O NOAA N
1. A – A Atmosphere, O – Ocean, AO – Atmosphere & Ocean 2. BSRN – Baseline Surface Radiation Network; AERONET – Aerosol Robotics Network; GPS-MET – Ground-Based Meteorology; NDBC – National Data Buoy Center; NOAA – National Oceanic and Atmospheric Administration
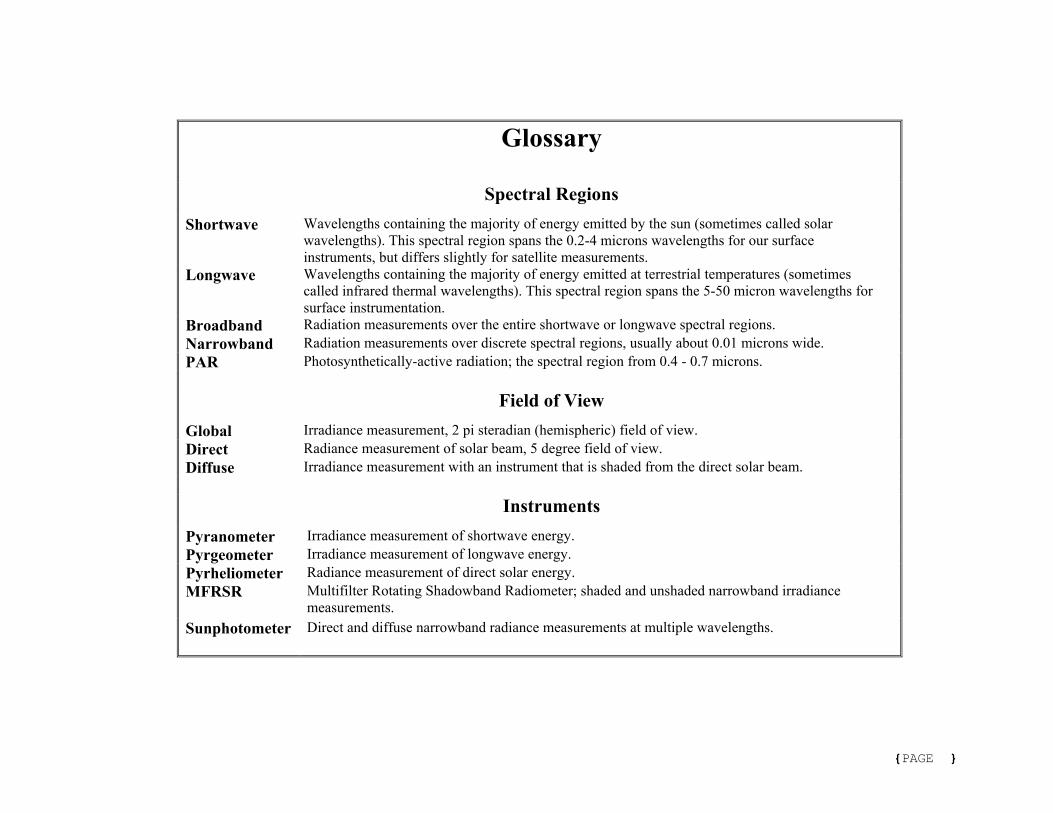
Glossary
Spectral Regions Shortwave Wavelengths containing the majority of energy emitted by the sun (sometimes called solar
wavelengths). This spectral region spans the 0.2-4 microns wavelengths for our surface instruments, but differs slightly for satellite measurements.
Longwave Wavelengths containing the majority of energy emitted at terrestrial temperatures (sometimes called infrared thermal wavelengths). This spectral region spans the 5-50 micron wavelengths for surface instrumentation.
Broadband Radiation measurements over the entire shortwave or longwave spectral regions. Narrowband Radiation measurements over discrete spectral regions, usually about 0.01 microns wide. PAR Photosynthetically-active radiation; the spectral region from 0.4 - 0.7 microns.
Field of View Global Irradiance measurement, 2 pi steradian (hemispheric) field of view. Direct Radiance measurement of solar beam, 5 degree field of view. Diffuse Irradiance measurement with an instrument that is shaded from the direct solar beam.
Instruments Pyranometer Irradiance measurement of shortwave energy. Pyrgeometer Irradiance measurement of longwave energy. Pyrheliometer Radiance measurement of direct solar energy. MFRSR
Multifilter Rotating Shadowband Radiometer; shaded and unshaded narrowband irradiance measurements.
Sunphotometer Direct and diffuse narrowband radiance measurements at multiple wavelengths.
{PAGE }
FIGURE CAPTIONS
Figure 1. Landsat image of an approximately 16x16 km region surrounding the ARM SGP site, illustrating the surface mosaic within a
satellite field of view (the CERES instruments onboard the Aqua and Terra satellites have a 20 km field of view at nadir). The image was
obtained on September 27, 1997. Changes in this vegetation map occur with the planting, harvesting, and burning of each individual field
during the annual cycle.
Figure 2. Sampling mismatches between satellite retrievals and island located surface measurements can be a problem for remote oceanic
island locations. Local winds and aerosols contributed by the island affect the local environment important to the radiation moving through
the atmosphere.
Figure3. The COVE site is located well beyond the surf zone, south of the mouth of the Chesapeake Bay, 25 km from the Virginia
coastline. North latitude is 36.905 and West longitude is 75.713. The steel structure stands in approximately 11 meters of water.
Figure 4 . An arbitrary site beyond the Gulf Stream waters off the North Carolina coast and a site in the middle of the lower Chesapeake
bay were chosen for representing Case 1 and Case 2 waters (respectively). An analysis of SEAWIFS ocean color data suggests the water
surrounding the COVE site should be classified as Case 2 water type.
Figure 5. Six years of chlorophyll-a concentrations derived from radiances measured by the SEAWIFS sensor aboard the SeaStar
spacecraft during clear sky conditions. The three sites yield distinct chlorophyll concentration groups during portions of the annual cycle.
{PAGE }
The COVE site is more similar to the bay site with respect to the chlorophyll concentrations (presumably Case 2). Validation for the
chlorophyll retreival algorithm used by SEAWIFS has only been validated for the Gulf Stream site (presumably Case 1 water type).
Figure 6. Contour plot of Payne (1972) empirical broadband shortwave ocean albedo (background) and medians of recent albedo
observations at COVE (results within white rectangles) as a function of SW atmospheric transmission and sun elevation angle. Sample
sizes for COVE median albedos range from 4 to 96.
Figure 7. Seasonal averages of aerosol volume distributions derived from AERONET observations made at the COVE site. Averages were
taken from 41 months of level 2 data (October 1999 to February 2005, inclusive). The fine mode variation is strongly correlated with
changes in the precipitable water (PW) within the atmospheric column; summer (JJA) has the highest precipitable water concentration,
winter (DJF) has the lowest precipitable water concentration.
Figure 8. Monthly cloud coverage (based on Long and Ackerman, 2000) derived from radiation observations made at the COVE site.
Clear, partly cloudy, and overcast conditions are based upon 15-minute radiation observations. Daytime only.
Figure 9. Comparison of satellite retrieval of aerosol optical depth (MODIS Atmospheres) to surface observations (AERONET) for a land
site (DOE ARM Southern Great Plains Central Facility) and the COVE ocean site.
Figure 10. Boxplots indicating distributions of differences between surface observations and CERES SARB estimates of downwelling SW
global radiation at the surface for nine IGBP scene types. Summary of time coincident data covering the period January 1, 2001 to
{PAGE }
December 31, 2002. Data were included for this comparison if 1.) the cloud imager and the Long & Ackerman cloud index reported 0%
clouds, 2.) the percentage of the IGBP scene type was greater than 50% in the CERES field of view, and 3.) the sun glint angle was
between 30 and 80 degrees.
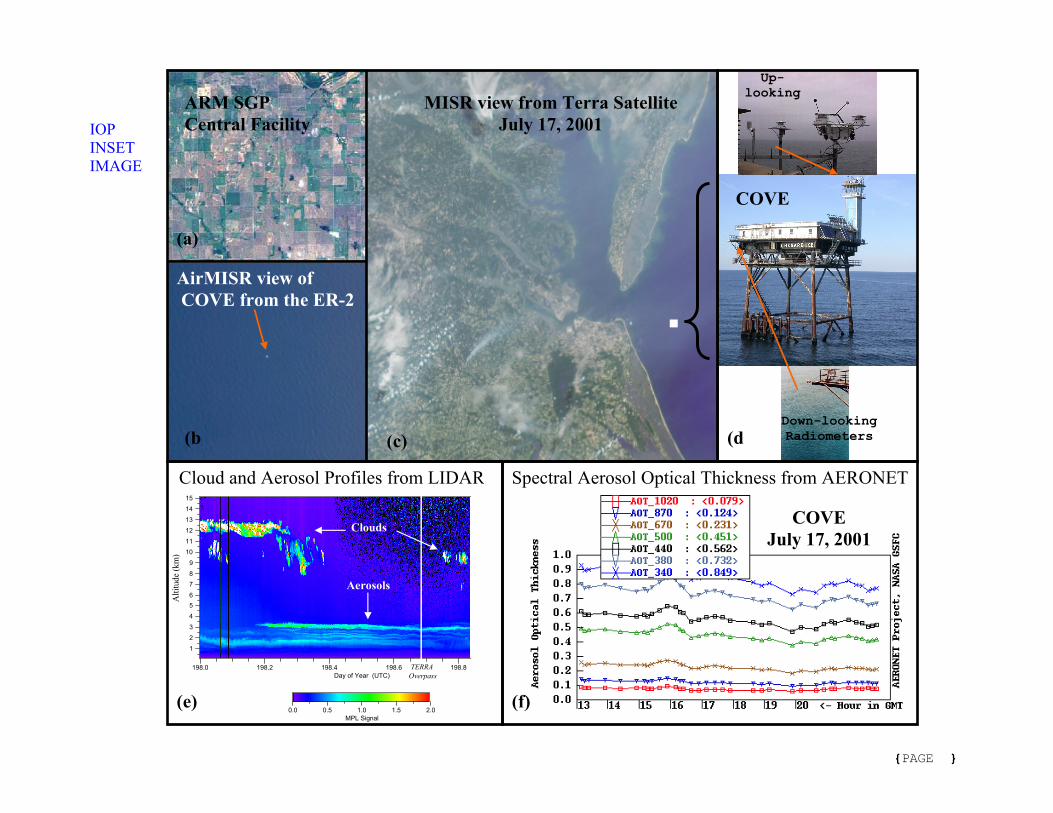
FIGURE FOR IOP BOX SECTION Multiple views of the CERES Ocean Validation Experiment (COVE) site at (d) the Chesapeake Lighthouse from (b) aircraft (AirMISR
on the NASA ER-2) and (c) satellite (MISR on Terra) on July 17, 2001 during CLAMS. Coincident aerosol properties from LIDAR
(MPLnet) and AERONET are shown in panels (d) and (e), respecively. The July 17 data were deemed to be from the “Golden Day”
because optimal atmospheric conditions were observed using multiple radiation, aerosol and microphysical instruments from the ocean
platform, the Terra satellite platform, and six aircraft platforms ( NASA’s ER-2, University of Washington’s CV-580, NASA GISS’
Cessna 210, and Hampton University’s Proteus, NASA Langley ‘s OV-10 and Lear 25C) involved with the IOP.
The LANDSAT TM data of the DOE ARM SGP site (a) is shown in contrast to the spatially uniform ocean background surrounding
the Chesapeake Lighthouse illustrating the utility of the COVE site for satellite validation and aerosol radiative forcing studies.
{PAGE }
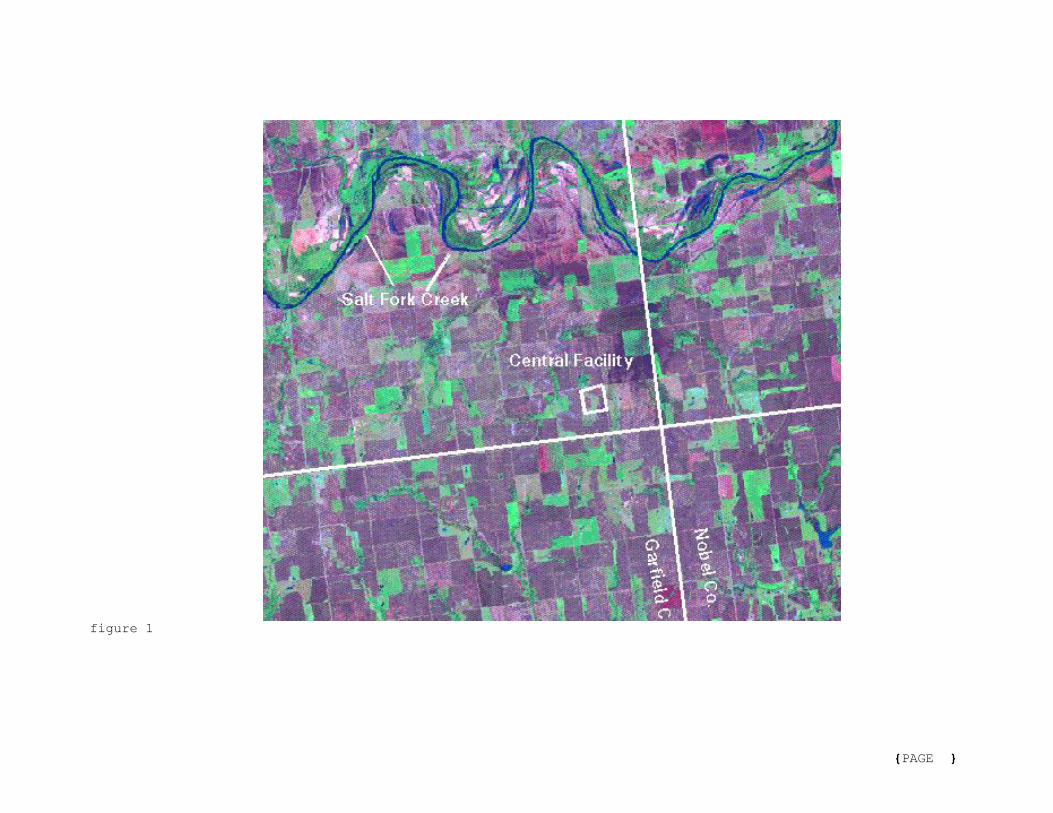
figure 1
{PAGE }
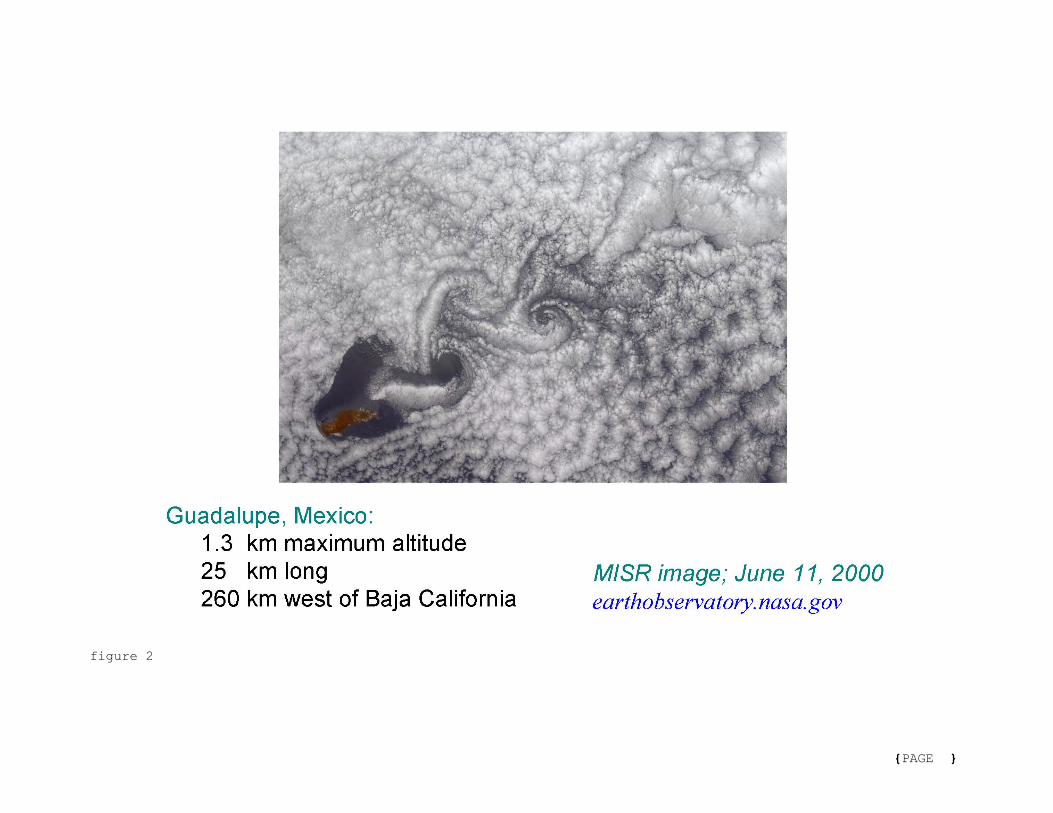
figure 2
{PAGE }
figure 3
{PAGE }
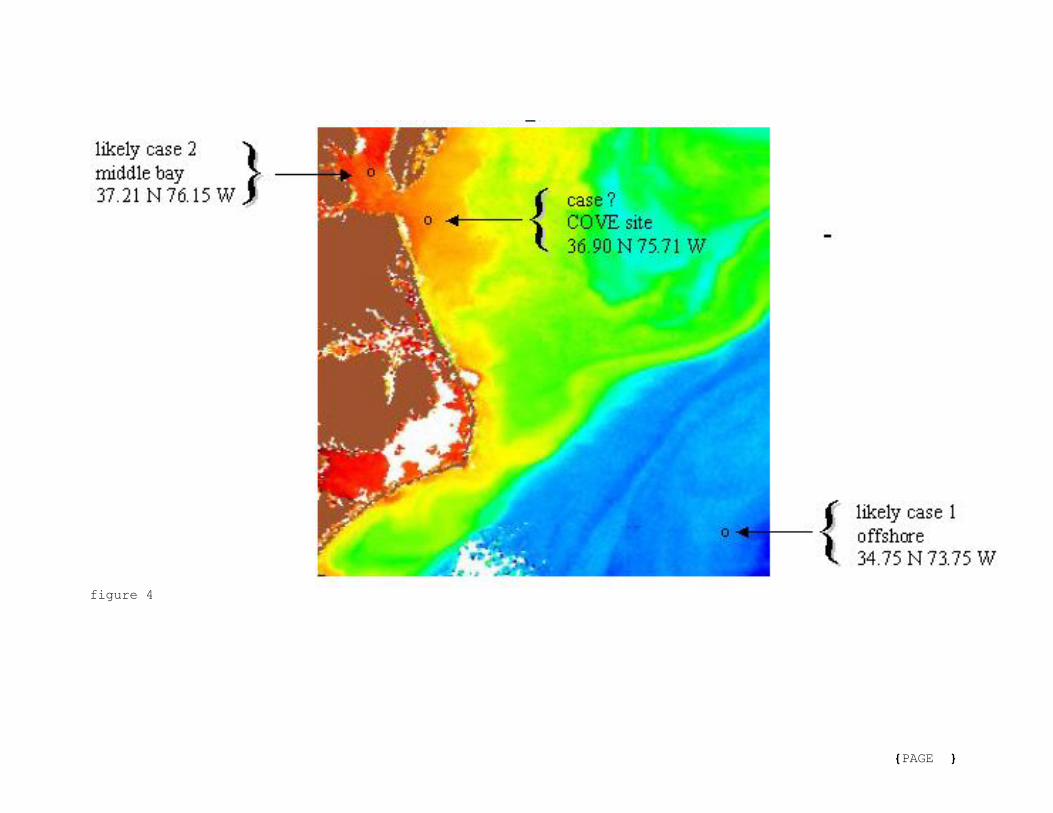
figure 4
{PAGE }
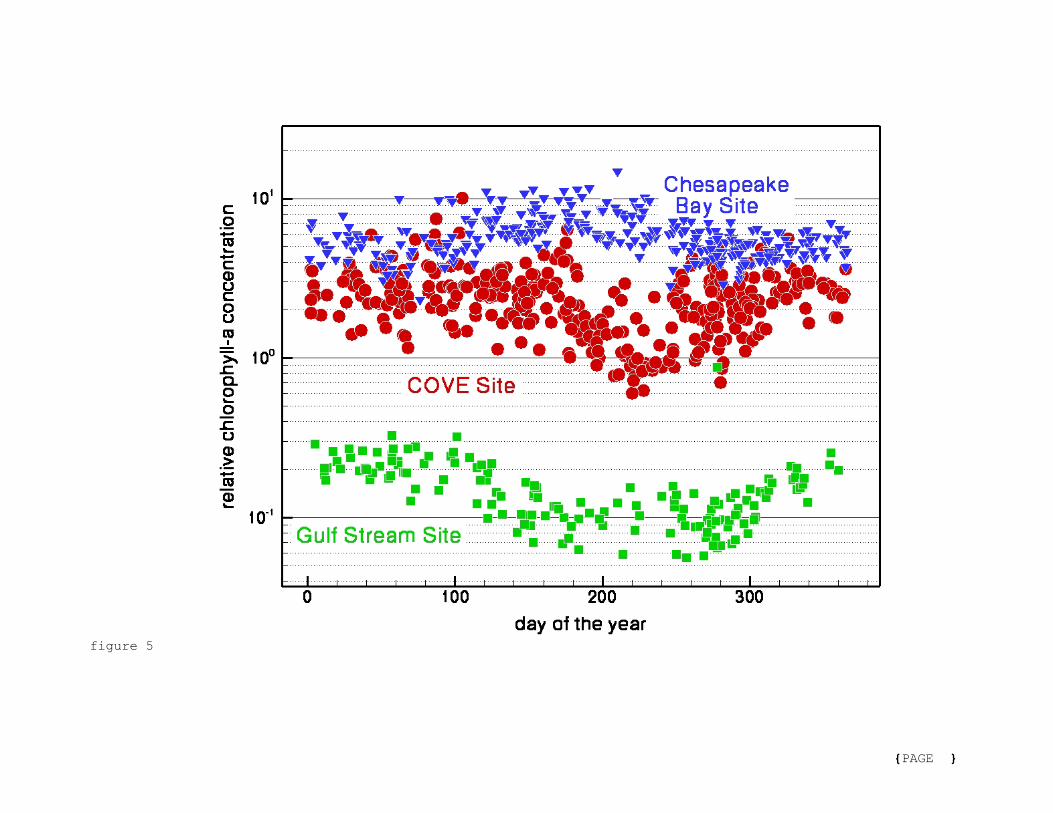
figure 5
{PAGE }
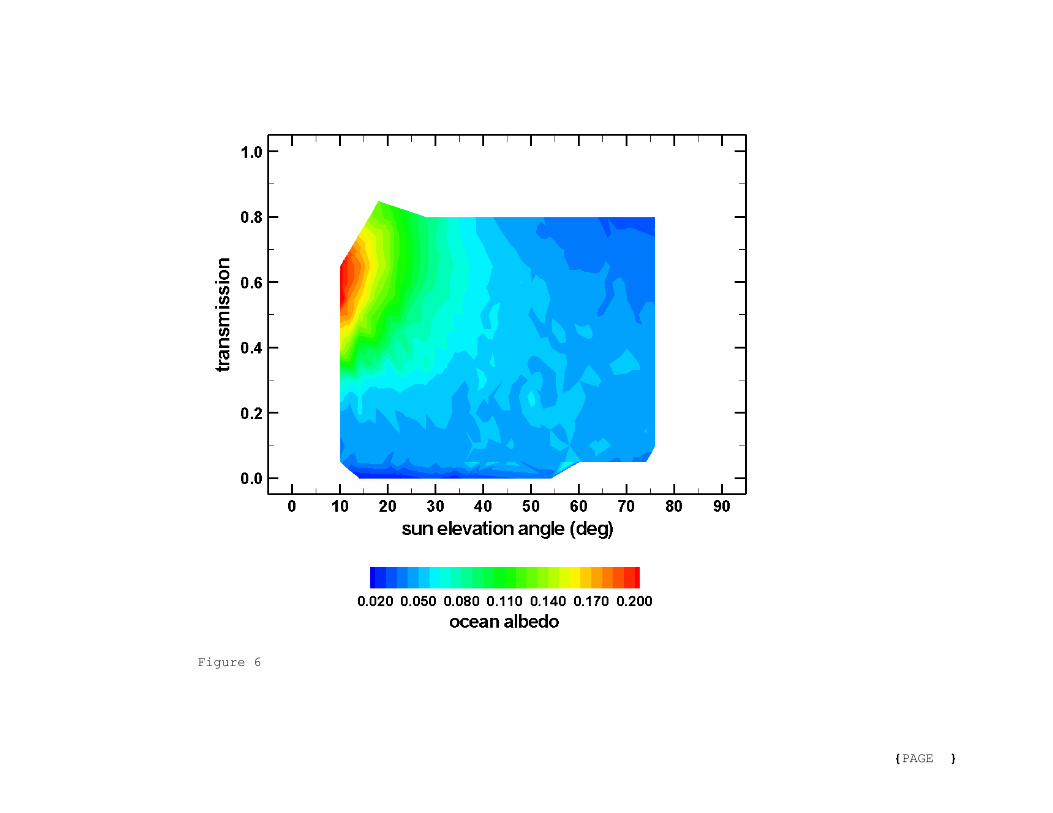
Figure 6
{PAGE }
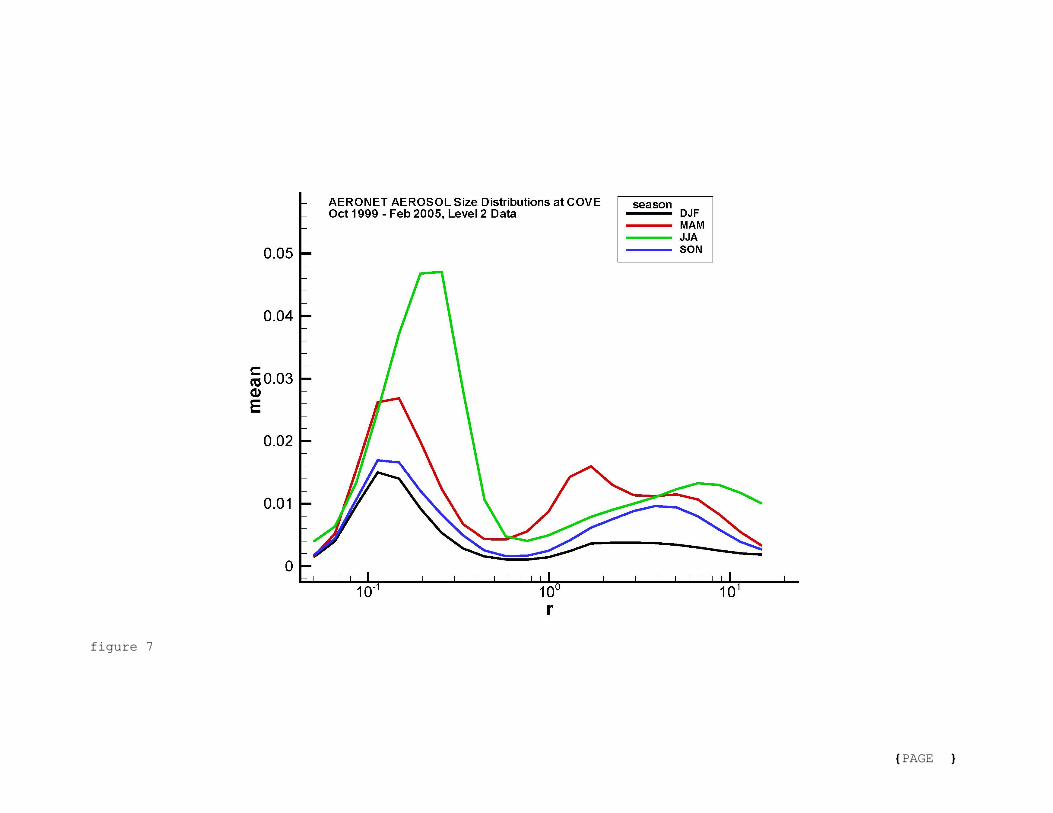
figure 7
{PAGE }
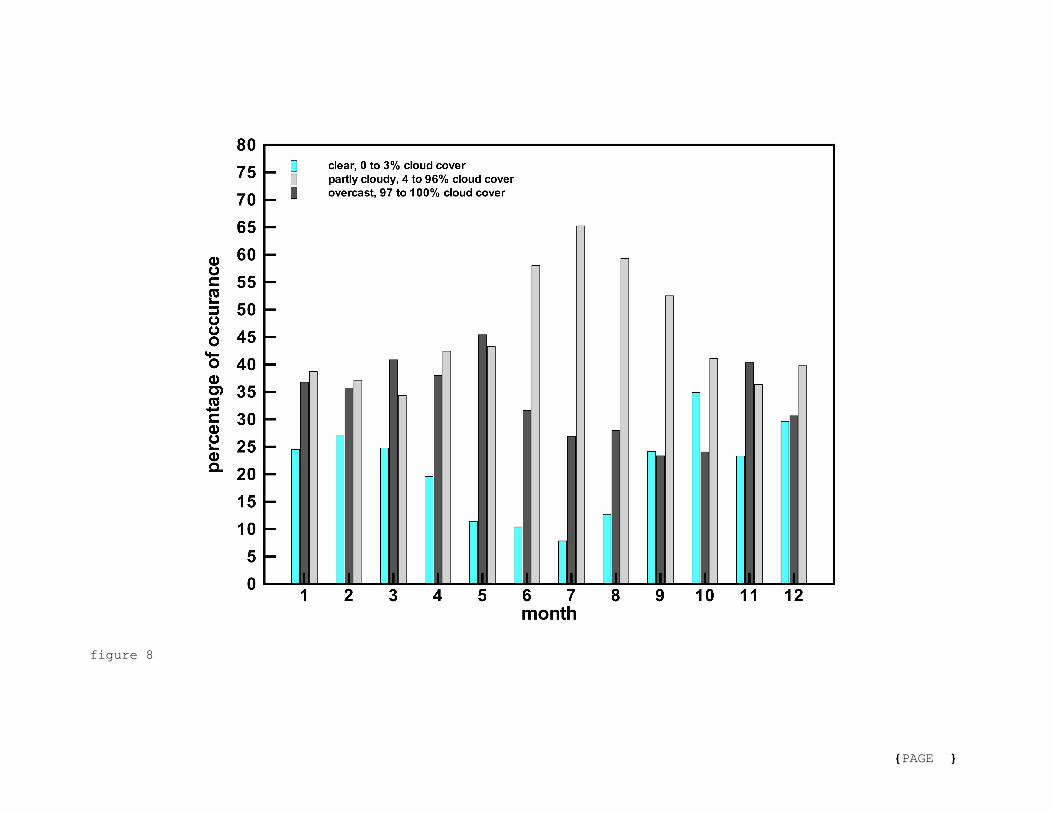
figure 8
{PAGE }
1:1
Figure 9
{PAGE }
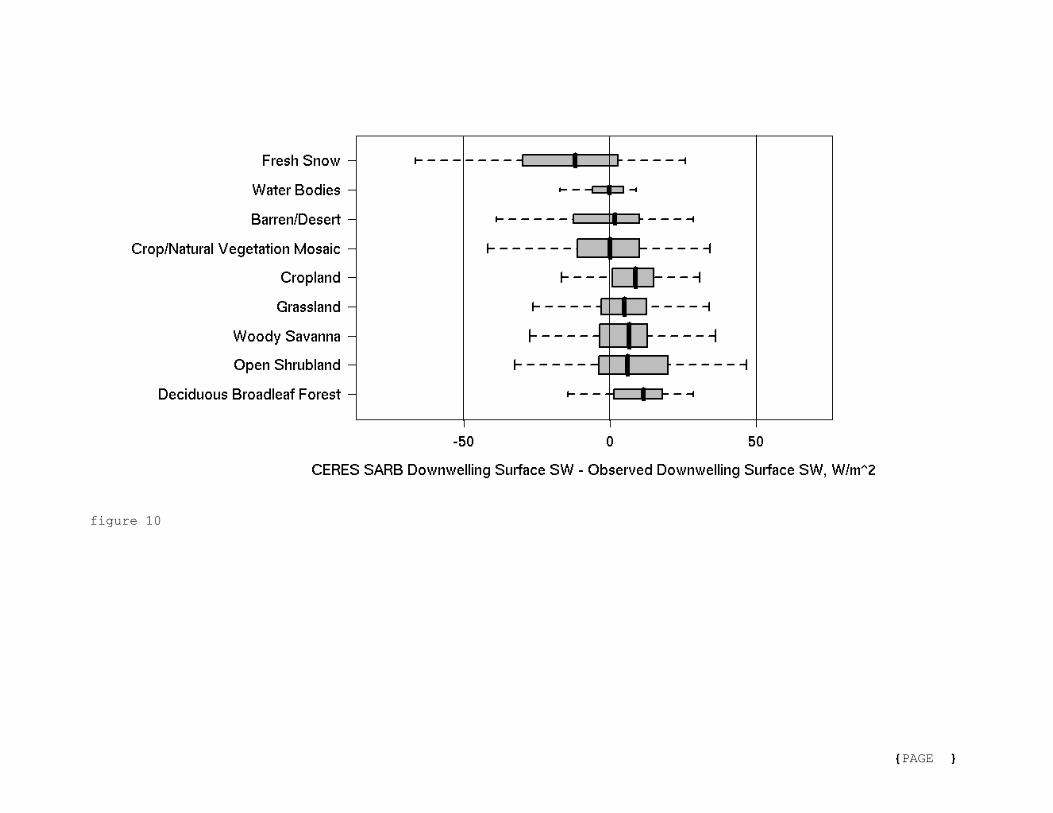
figure 10
{PAGE }
Up-looking
Down-lookingRadiometers
COVE
2AirMISR view of COVE from the ER-
MIS litelity
R view from Terra SatelJuly 17, 2001
ARM SGP FaciCentral
(a)
(c)(b (d
198.0 198.2 198.4 198.6 198.8
151413121110
987
654
321
Day of Year (UTC)
Altit
ude
(km
)
0.0 0.5 1.0 1.5 2.0MPL Signal
Clouds
Aerosols
TERRAOverpass
Alti
tude
(km
)
(e)
Cloud and Aerosol Profiles from LIDAR
COVE July 17, 2001
Spectral Aerosol Optical Thickness from AERONET
(f)
IOP INSET IMAGE
{PAGE }