Embed Size (px)
Citation preview
ClickHere
for
FullArticle
Use of POES SEM‐2 observations to examine radiation beltdynamics and energetic electron precipitation into the atmosphere
Craig J. Rodger,1 Mark A. Clilverd,2 Janet C. Green,3 and Mai Mai Lam2
Received 26 December 2008; revised 2 August 2009; accepted 3 November 2009; published 3 April 2010.
[1] The coupling of the Van Allen radiation belts to the Earth’s atmosphere throughprecipitating particles is an area of intense scientific interest. Currently, there aresignificant uncertainties surrounding the precipitating characteristics of medium energyelectrons (>20 keV), and even more uncertainties for relativistic electrons. In this paperwe examine roughly 10 years of measurements of trapped and precipitating electronsavailable from the Polar Orbiting Environmental Satellites (POES)/Space EnvironmentMonitor (SEM‐2), which has provided long‐term global data in this energy range. Weshow that the POES SEM‐2 detectors suffer from some contamination issues thatcomplicate the understanding of the measurements, but that the observations provideinsight into the precipitation of energetic electrons from the radiation belts, and may bedeveloped into a useful climatology for medium energy electrons. Electron contaminationalso allows POES/SEM‐2 to provide unintended observations of >700 keV relativisticelectrons. Finally, there is an energy‐dependent time delay observed in the POES/SEM‐2observations, with the relativistic electron enhancement (electrons >800 keV) delayed byapproximately one week relative to the >30 keV electron enhancement, probably dueto the timescales of the acceleration processes. Observations of trapped relativistic electronfluxes near the geomagnetic equator by GOES show similar delays, indicating a“coherency” to the radiation belts at high and low orbits, and also a strong link betweentrapped and precipitating particle fluxes. Such large delays should have consequences forthe timing of the atmospheric impact of geomagnetic storms.
Citation: Rodger, C. J., M. A. Clilverd, J. C. Green, and M. M. Lam (2010), Use of POES SEM‐2 observations to examineradiation belt dynamics and energetic electron precipitation into the atmosphere, J. Geophys. Res., 115, A04202,doi:10.1029/2008JA014023.
1. Introduction
[2] The coupling of the Van Allen radiation belts to theEarth’s atmosphere through precipitating particles is an areaof intense scientific interest, principally due to two differingresearch activities. One of these concerns the physics of theradiation belts, and primarily the evolution of energeticelectron fluxes during and after geomagnetic storms [e.g.,Reeves et al., 2003]. The other focuses on the response ofthe atmosphere to precipitating particles, with a possiblelinkage to climate variability [e.g., Turunen et al., 2009].Both scientific areas require increased understanding of thenature of the precipitation, particularly as to the precipitationdrivers, as well as the variation of the flux and energyspectrum for electrons lost from the outer radiation belts.[3] Essentially all geomagnetic storms substantially alter
the electron radiation belt populations, reflecting accelera-
tion, loss, and transport processes [Reeves et al., 2003,2009], in which precipitation losses into the atmosphereplay a major role [Green et al., 2004]. A significant fractionof all of the particles lost are precipitated into the atmo-sphere [Lorentzen et al., 2001; Horne, 2002; Friedel et al.,2002; Clilverd et al., 2006], although storm‐time nonadia-batic magnetic field changes also lead to losses throughmagnetopause shadowing [e.g., Ukhorskiy et al., 2006]. Thegeomagnetic activity which drives the radiation belt vari-ability [Friedel et al., 2002] may come from either high‐speed solar wind‐streams (HSSWS) in the solar wind or thearrival of interplanetary coronal mass ejections (ICMEs).While ICMEs are the main source of geomagnetic storms atsolar maximum, the declining and minimum phase of the11‐year solar activity cycle is characterized by an increase inthe occurrence rate of high‐speed (>500 km/s) solar wind‐streams emanating from coronal holes [Richardson et al.,2000].[4] Recently there has been much interest in the varying
responses of the radiation belt to HSSWS and ICMEs[Borovsky and Denton, 2006]. Although HSSWS events arenot typically associated with large signatures in the Dst
index (min > −50 nT), they do produce moderate levels of
1Department of Physics, University of Otago, Dunedin, New Zealand.2Physical Sciences Division, British Antarctic Survey, Cambridge,
UK.3Space Weather Prediction Center, NOAA, Boulder, Colorado, USA.
Copyright 2010 by the American Geophysical Union.0148‐0227/10/2008JA014023
JOURNAL OF GEOPHYSICAL RESEARCH, VOL. 115, A04202, doi:10.1029/2008JA014023, 2010
A04202 1 of 13
geomagnetic activity that persist for many days. In con-trast, ICME events are more transient, driving high geo-magnetic activity for typically only 1–2 days [Richardsonet al., 2000]. As such, the energy input to the magneto-sphere during HSSWS events is believed to be comparableto or to exceed the energy input to the magnetosphereduring ICMEs. It has been suggested that there are morelong‐lasting radiation belt electron flux enhancements inHSSWS‐driven storms compared to ICME‐driven storms[Miyoshi and Kataoka, 2005], that the flux of higher‐energyparticles peak later in time, and that many magnetosphericelectromagnetic wave processes are enhanced [Hilmer et al.,2000; Vassiliadis et al., 2007].[5] The impact of precipitating particles on the environ-
ment of the Earth is also an area of current scientific focus.Precipitating charged particles produce odd nitrogen NOx
(NO + NO2) in the Earth’s atmosphere, which can catalyt-ically destroy ozone [Brasseur and Solomon, 2005]. As aresult, energetic particle precipitation (EPP) events havebeen linked to significant decreases in polar ozone in theupper stratosphere [e.g., Randall et al., 2005]. Multipleobservations undertaken during the Arctic winter of 2003–2004 showed two periods of EPP‐linked polar ozone loss at∼40 km altitude, with decreases of ∼30% and ∼17%[Seppälä et al., 2007]. By influencing stratospheric ozonevariability, EPP can affect the stratospheric radiative balanceand may link to climate variability. Rozanov et al. [2005]imposed a NOx source calculated from 1987 NOAA TIROSspacecraft EEP measurements to represent this linkage intotheir chemistry‐climate model and found large (±2 K) var-iations in polar surface air temperatures. They concludedthat the magnitude of the atmospheric response to EEPevents can potentially exceed the effects from solar UVfluxes. Very recently, the pattern and magnitude of the polarsurface air temperature‐variability predicted by Rozanovet al. [2005] has been observed in European Centre forMedium‐Range Weather Forecast ERA‐40 reanalysis data,with the surface air temperature‐variability associated withgeomagnetic disturbances being roughly twice that associ-ated with solar cycle UV variability [Seppälä et al., 2009].[6] Few ground‐based data sets have the combination
of long time series and near‐global spatial coverage todescribe the variation in precipitation into the atmosphere.For example, the AARDDVARK array of subionosphericradio receivers [Clilverd et al., 2009] and the GLORIA
riometer array [Alfonsi et al., 2008] are examples of relevant,but currently limited, ground‐based instruments. There arealso few spacecraft measurements available that measureprecipitating electron fluxes and energy spectra in thebounce loss cone for the energy range >20 keV and whichhave flown for sufficiently long time periods. One spacecraftinstrument that has provided long‐term global data is theSpace Environment Monitor (SEM‐2) instrument packageonboard the Polar Orbiting Environmental Satellites(POES). In this paper we examine roughly 10 years ofmeasurements of trapped and precipitating electrons avail-able from POES. This data set includes both medium andrelativistic energy‐range measurements of trapped and pre-cipitating electrons, from the same spacecraft. While thedetectors suffer from some contamination issues that com-plicate the understanding of the measurements, we show thatthe POES/SEM‐2 observations provide additional insightinto the precipitation of energetic electrons from the radia-tion belts and may be developed into a useful climatology.While many radiation belt processes take place around thegeomagnetic equator and are best studied by instrumentsthat pass near this location, studies into the loss of particlesfrom the radiation belt through atmospheric are best exam-ined by instruments near the feet of the field lines. The lowaltitudes of the POES platforms make them well suited forviewing particles near or in the loss cone and hence allow afocus on the timescale of processes that drive particles intothe atmosphere.
2. POES Particle Instrumentation
[7] In this study we make use of particle measurements bythe SEM‐2 instrument package onboard the POES space-craft, which are in Sun‐synchronous orbits at ∼800–850 kmaltitudes. SEM‐2 includes the Medium Energy Proton andElectron Detector (MEPED) in addition to the Total EnergyDetector (TED). Together these instruments monitor elec-tron fluxes from 50 eV up to 2700 keV. For a detaileddescription of the SEM‐2 instruments, see Evans and Greer[2004]. The SEM‐2 package is a significant upgrade on theSEM‐1 package [Hill et al., 1985], which operated onboardthe NOAA Television and InfraRed Observation Satellite(TIROS) spacecraft from 1978 to 2004. We make use ofSEM‐2 observations from up to four POES spacecraft, fromthe earliest date of data availability up to 20 July 2008. Thestarting dates are 1 July 1998 for NOAA‐15, 10 January2001 for NOAA‐16, 12 July 2002 for NOAA‐17, and7 June 2005 for NOAA‐18. All POES data are availablefrom http://poes.ngdc.noaa.gov/data/; whereas the full‐resolution data has 2 s time resolution, we work with the16 s resolution ASCII files. Table 1 lists the SEM‐2 detectorsused in the current study, where “e” refers to electrondetectors and “P” proton detectors. The 0°‐pointing detectorsare mounted on the three‐axis stabilized POES spacecraft sothat the center of each detector field of view is outwardalong the local zenith, parallel to the Earth‐center‐to‐satel-lite radial vector. Another set of telescopes, termed the 90°detectors, are mounted approximately perpendicular to the0° detector. In addition, there is also a set of omnidirectionalmeasurements made from a dome detector that is mountedparallel to the 0° telescopes. The telescopes pointing in the
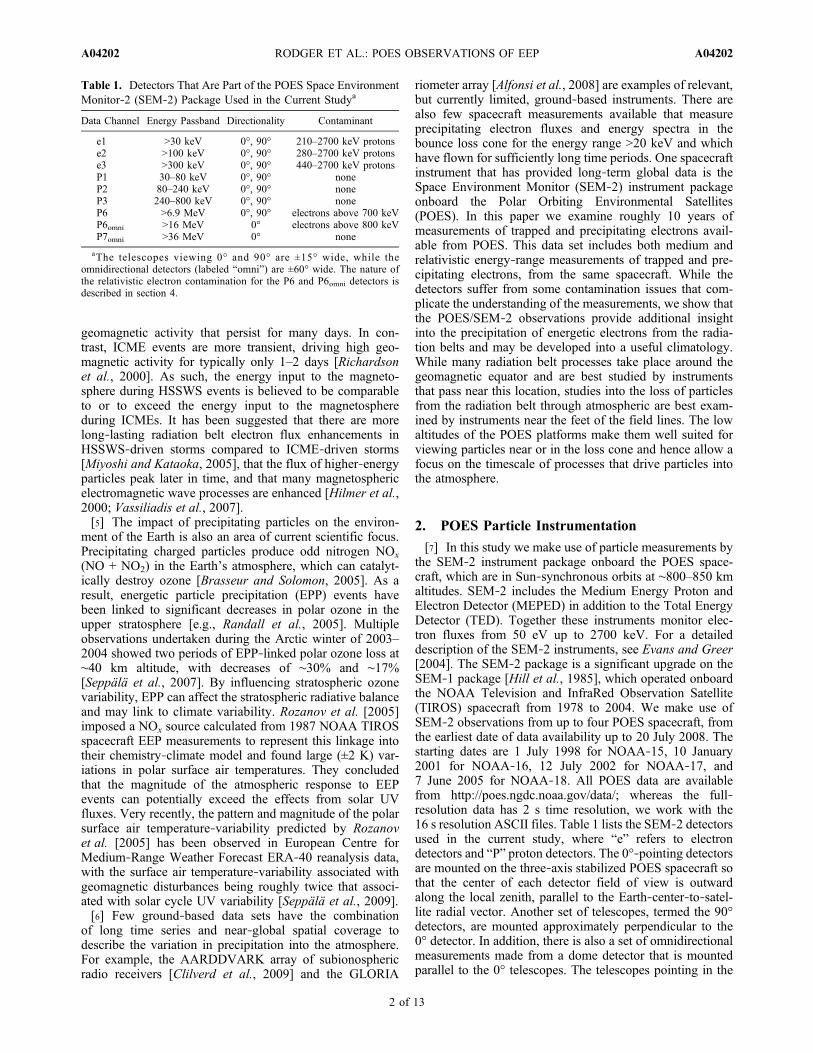
Table 1. Detectors That Are Part of the POES Space EnvironmentMonitor‐2 (SEM‐2) Package Used in the Current Studya
Data Channel Energy Passband Directionality Contaminant
e1 >30 keV 0°, 90° 210–2700 keV protonse2 >100 keV 0°, 90° 280–2700 keV protonse3 >300 keV 0°, 90° 440–2700 keV protonsP1 30–80 keV 0°, 90° noneP2 80–240 keV 0°, 90° noneP3 240–800 keV 0°, 90° noneP6 >6.9 MeV 0°, 90° electrons above 700 keVP6omni >16 MeV 0° electrons above 800 keVP7omni >36 MeV 0° none
aThe telescopes viewing 0° and 90° are ±15° wide, while theomnidirectional detectors (labeled “omni”) are ±60° wide. The nature ofthe relativistic electron contamination for the P6 and P6omni detectors isdescribed in section 4.
RODGER ET AL.: POES OBSERVATIONS OF EEP A04202A04202
2 of 13
0° and 90° directions are ±15° wide, while the omnidirec-tional dome detectors (labeled “omni”) are ±60° wide.[8] POES user information suggests that the 0° telescopes
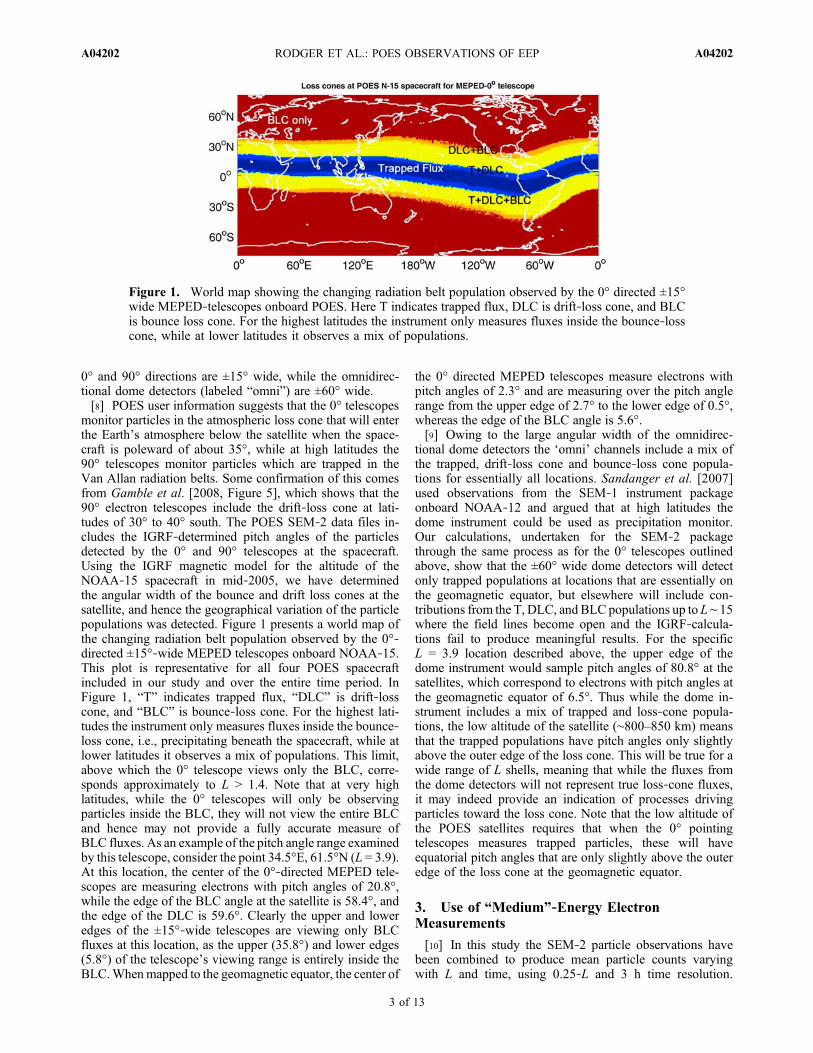
monitor particles in the atmospheric loss cone that will enterthe Earth’s atmosphere below the satellite when the space-craft is poleward of about 35°, while at high latitudes the90° telescopes monitor particles which are trapped in theVan Allan radiation belts. Some confirmation of this comesfrom Gamble et al. [2008, Figure 5], which shows that the90° electron telescopes include the drift‐loss cone at lati-tudes of 30° to 40° south. The POES SEM‐2 data files in-cludes the IGRF‐determined pitch angles of the particlesdetected by the 0° and 90° telescopes at the spacecraft.Using the IGRF magnetic model for the altitude of theNOAA‐15 spacecraft in mid‐2005, we have determinedthe angular width of the bounce and drift loss cones at thesatellite, and hence the geographical variation of the particlepopulations was detected. Figure 1 presents a world map ofthe changing radiation belt population observed by the 0°‐directed ±15°‐wide MEPED telescopes onboard NOAA‐15.This plot is representative for all four POES spacecraftincluded in our study and over the entire time period. InFigure 1, “T” indicates trapped flux, “DLC” is drift‐losscone, and “BLC” is bounce‐loss cone. For the highest lati-tudes the instrument only measures fluxes inside the bounce‐loss cone, i.e., precipitating beneath the spacecraft, while atlower latitudes it observes a mix of populations. This limit,above which the 0° telescope views only the BLC, corre-sponds approximately to L > 1.4. Note that at very highlatitudes, while the 0° telescopes will only be observingparticles inside the BLC, they will not view the entire BLCand hence may not provide a fully accurate measure ofBLC fluxes. As an example of the pitch angle range examinedby this telescope, consider the point 34.5°E, 61.5°N (L = 3.9).At this location, the center of the 0°‐directed MEPED tele-scopes are measuring electrons with pitch angles of 20.8°,while the edge of the BLC angle at the satellite is 58.4°, andthe edge of the DLC is 59.6°. Clearly the upper and loweredges of the ±15°‐wide telescopes are viewing only BLCfluxes at this location, as the upper (35.8°) and lower edges(5.8°) of the telescope’s viewing range is entirely inside theBLC.Whenmapped to the geomagnetic equator, the center of
the 0° directed MEPED telescopes measure electrons withpitch angles of 2.3° and are measuring over the pitch anglerange from the upper edge of 2.7° to the lower edge of 0.5°,whereas the edge of the BLC angle is 5.6°.[9] Owing to the large angular width of the omnidirec-
tional dome detectors the ‘omni’ channels include a mix ofthe trapped, drift‐loss cone and bounce‐loss cone popula-tions for essentially all locations. Sandanger et al. [2007]used observations from the SEM‐1 instrument packageonboard NOAA‐12 and argued that at high latitudes thedome instrument could be used as precipitation monitor.Our calculations, undertaken for the SEM‐2 packagethrough the same process as for the 0° telescopes outlinedabove, show that the ±60° wide dome detectors will detectonly trapped populations at locations that are essentially onthe geomagnetic equator, but elsewhere will include con-tributions from the T, DLC, and BLC populations up to L ∼ 15where the field lines become open and the IGRF‐calcula-tions fail to produce meaningful results. For the specificL = 3.9 location described above, the upper edge of thedome instrument would sample pitch angles of 80.8° at thesatellites, which correspond to electrons with pitch angles atthe geomagnetic equator of 6.5°. Thus while the dome in-strument includes a mix of trapped and loss‐cone popula-tions, the low altitude of the satellite (∼800–850 km) meansthat the trapped populations have pitch angles only slightlyabove the outer edge of the loss cone. This will be true for awide range of L shells, meaning that while the fluxes fromthe dome detectors will not represent true loss‐cone fluxes,it may indeed provide an indication of processes drivingparticles toward the loss cone. Note that the low altitude ofthe POES satellites requires that when the 0° pointingtelescopes measures trapped particles, these will haveequatorial pitch angles that are only slightly above the outeredge of the loss cone at the geomagnetic equator.
3. Use of “Medium”‐Energy ElectronMeasurements
[10] In this study the SEM‐2 particle observations havebeen combined to produce mean particle counts varyingwith L and time, using 0.25‐L and 3 h time resolution.
Figure 1. World map showing the changing radiation belt population observed by the 0° directed ±15°wide MEPED‐telescopes onboard POES. Here T indicates trapped flux, DLC is drift‐loss cone, and BLCis bounce loss cone. For the highest latitudes the instrument only measures fluxes inside the bounce‐losscone, while at lower latitudes it observes a mix of populations.
RODGER ET AL.: POES OBSERVATIONS OF EEP A04202A04202
3 of 13
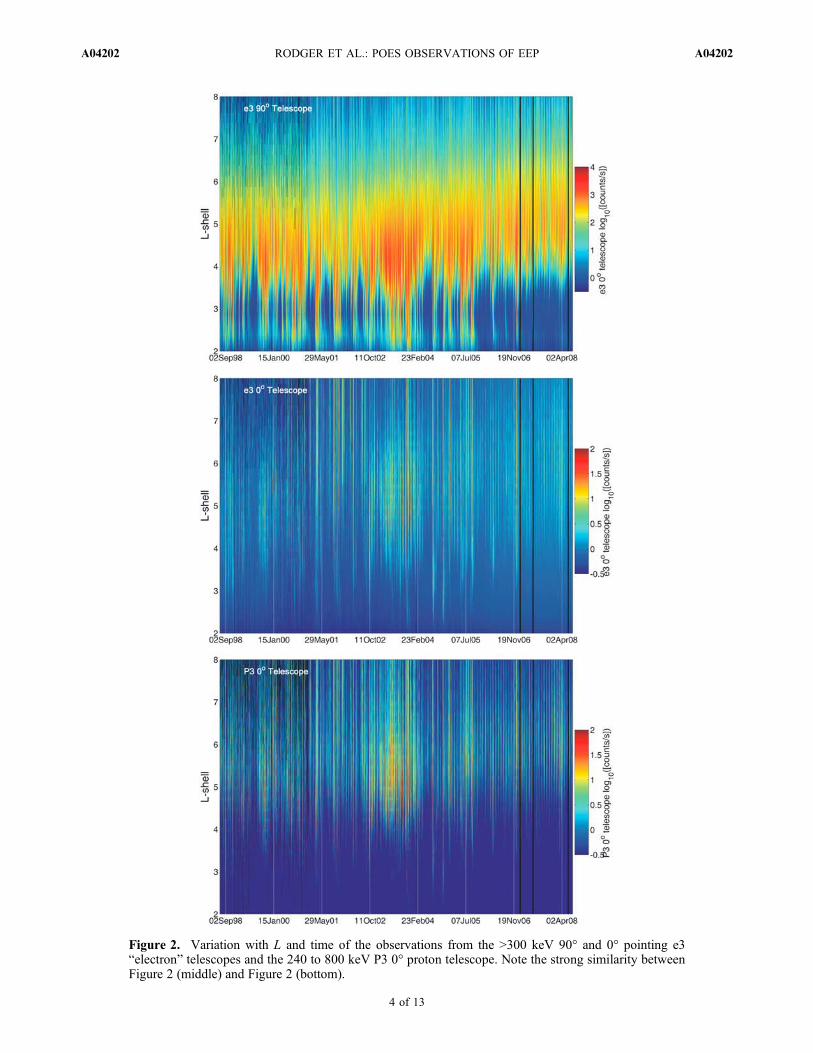
Figure 2. Variation with L and time of the observations from the >300 keV 90° and 0° pointing e3“electron” telescopes and the 240 to 800 keV P3 0° proton telescope. Note the strong similarity betweenFigure 2 (middle) and Figure 2 (bottom).
RODGER ET AL.: POES OBSERVATIONS OF EEP A04202A04202
4 of 13
Observations from inside the South Atlantic MagneticAnomaly are excluded before the measurements are com-bined. Figure 2 (top) shows the variation with L and time ofthe counts per second reported by the e3 0° and 90° pointingtelescopes, which nominally measure >300 keV electrons,while Figure 2 (bottom) shows the same data from the240–800 keV P3 0° proton telescope. This plot spans theentire period considered from 1 July 1998 to 20 July 2008;black strips early in the plot are due to a lack of spacecraftcoverage, as well as occasional data gaps that are presentin 2007.[11] Figure 2 (top) shows observations from the e3 90°
telescope (trapped electrons) behaving largely as expected,with the inner and outer radiation belts visible, and occa-sional short‐lived injections occurring through the slot‐region during intense geomagnetic storms. In addition, thereappears to be an overall outer radiation belt flux increaseduring the declining phase of the solar cycle from late2002 to mid‐2004, which is consistent with the variation ofgeomagnetic activity indices such as Ap during the recent11‐year solar cycle.[12] As noted in the final column of Table 1, the SEM‐2
e1, e2, and e3 telescopes suffer from contamination byrather low‐energy protons, with one proton in the correctenergy range leading to one count in the electron detector.The detector energy ranges given in Table 1 have been takenfrom Table 3.3.2 of Evans and Greer [2004], and wereexperimentally determined. In Figure 2 (bottom) there is astrong agreement between the variation and magnitude ofthe counts from the e3 and P3 0° detectors, which is sug-gestive of a significant contamination issue in this data set.This is also indicated by the otherwise surprisingly largeL‐range of >300 keV precipitation suggested by the e3 0°telescope, with large values extending to L = 8, well beyondthe extent of the outer of the outer radiation belt as observedby the e3 90° telescope (trapped electron fluxes). In order toquantify the level of contamination in the e1, e2, and e3telescopes, and estimate where the counts from the “elec-tron” telescopes are most likely to be dominated by elec-trons, we require that the counts reported by the electron
telescope be at least twice as large as the counts from the“contaminating” proton telescope because one “contami-nating” proton will produce one incorrect electron count.Under these conditions, we take the electron observations tobe “good” when the following hold:
e1 > 2� P2 ð1Þ
e2 > 2� P3 ð2Þ
e3 > 2� P3 ð3Þ
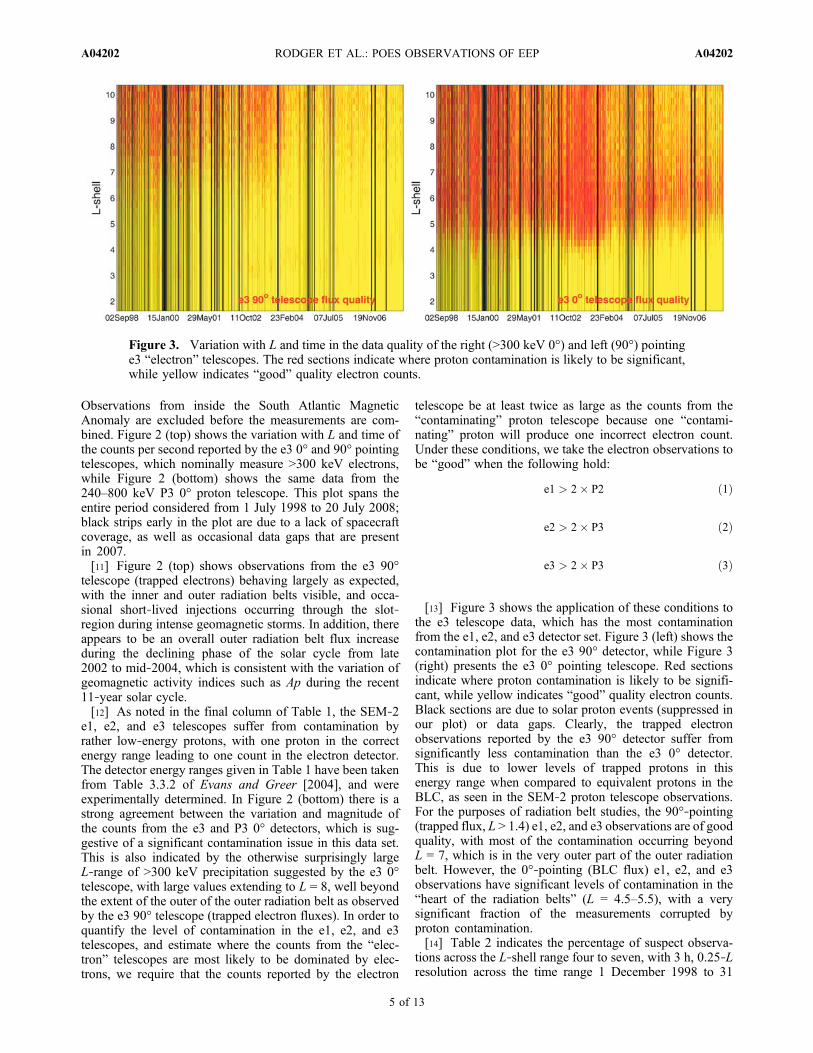
[13] Figure 3 shows the application of these conditions tothe e3 telescope data, which has the most contaminationfrom the e1, e2, and e3 detector set. Figure 3 (left) shows thecontamination plot for the e3 90° detector, while Figure 3(right) presents the e3 0° pointing telescope. Red sectionsindicate where proton contamination is likely to be signifi-cant, while yellow indicates “good” quality electron counts.Black sections are due to solar proton events (suppressed inour plot) or data gaps. Clearly, the trapped electronobservations reported by the e3 90° detector suffer fromsignificantly less contamination than the e3 0° detector.This is due to lower levels of trapped protons in thisenergy range when compared to equivalent protons in theBLC, as seen in the SEM‐2 proton telescope observations.For the purposes of radiation belt studies, the 90°‐pointing(trapped flux, L > 1.4) e1, e2, and e3 observations are of goodquality, with most of the contamination occurring beyondL = 7, which is in the very outer part of the outer radiationbelt. However, the 0°‐pointing (BLC flux) e1, e2, and e3observations have significant levels of contamination in the“heart of the radiation belts” (L = 4.5–5.5), with a verysignificant fraction of the measurements corrupted byproton contamination.[14] Table 2 indicates the percentage of suspect observa-
tions across the L‐shell range four to seven, with 3 h, 0.25‐Lresolution across the time range 1 December 1998 to 31
Figure 3. Variation with L and time in the data quality of the right (>300 keV 0°) and left (90°) pointinge3 “electron” telescopes. The red sections indicate where proton contamination is likely to be significant,while yellow indicates “good” quality electron counts.
RODGER ET AL.: POES OBSERVATIONS OF EEP A04202A04202
5 of 13

December 2007. The time range is limited by the availabilityof geomagnetic auroral electrojet (AE) index from the WDCfor Geomagnetism (http://wdc.kugi.kyoto‐u.ac.jp/). Duringdisturbed geomagnetic conditions (AE � 150 nT; followingMeredith et al. [2006]), more than 93% of the 90°‐telescopeobservations are good quality, with the primary contami-nation coming from the e3 detector. On average, only 3.5%of the data from this telescope suffers from contamination.The situation is considerably more serious for the 0°‐tele-scope observations necessary for describing energetic elec-tron precipitation. Overall contamination is present 42% ofthe time for the e3 0° telescope and can reach as much as55% during geomagnetically disturbed periods. Even inquiet periods nearly 30% of the >300 keV precipitationmeasurements are potentially contaminated.[15] The large levels of proton contamination present in
the SEM‐2 energetic electron precipitation observationsmay affect the quality of geomagnetically dependant pre-cipitation climatologies that have been developed from thisdata set [e.g., Wüest et al., 2005]. It is not clear from thereports published that observations dominated by protoncontamination have been removed before the climatologywas developed. The >30, >100, and >300 keV electrontelescopes in the earlier SEM‐1 package onboard the NOAATIROS spacecraft (1978–2004) also suffered from protoncontamination, although for differing energies (>135 keV[Hill et al., 1985]) due to the different instrument design.Precipitation climatologies developed using these data [e.g.,Codrescu et al., 1997] may also contain significant protonprecipitation masquerading as electron events. New proces-sing techniques are being developed to remove the protoncontamination from the POES SEM‐2 electron observations,rather than simply testing of contamination and excludingthat data as we have undertaken in a fundamentally con-servative approach. The reprocessed observations shouldallow new and accurate climatologies to be produced. Thesetechniques will be detailed in a future study.
4. SEM‐2 Observations of Relativistic Electrons
[16] As outlined in Table 1, SEM‐2 proton detectors alsosuffer from contamination, falsely responding to electronswith relativistic energies [Evans et al., 2008]. The P6 omni-directional dome detector, intended to measure protons withenergies >16 MeV, also responds to electrons with energies>800 keV [Sandanger et al., 2007]. The detection efficiencyof the P6 dome has a value of ∼0.5 for an incident electron of
energy ∼1.5 MeV and reaches 1 for incident electrons withenergy >2 MeV. As such while the P6omni detector respondsto electrons >800 keV, it is not strictly a >800 keV electrondetector due to the varying detection efficiency. While therelativistic electron observations from the omnidirectionalP6 dome detector may serve to complement those fromother spacecraft with relativistic electrons (e.g., SAMPEX),it is not well suited to understanding relativistic electronprecipitation (REP) because it responds to a mix of trapped‐and loss‐cone particles. However, the P6 telescope detec-tors, which are designed to measure >6.9 MeV protons, alsorespond to either trapped or BLC electrons (depending onL‐shell), with energies starting from 700 keV [Millan etal., 2008; R. Millan, personal communication, 2008].While the detection efficiency profile is not sharp, the twonear‐orthogonal P6 telescopes provide simultaneous in situobservations of both trapped and precipitating relativisticelectrons ∼700 keV, complicating the information on theenergy of the electrons included in the counts. Given thatthe SEM‐2 observations start from mid‐1998, it may bepossible in the future to produce an estimated precipitationclimatology using this data set combined with some addi-tional information on the energy spectra of the precipitatingparticles.[17] Figure 4 shows the variation with L and time of the
relativistic electrons at low altitudes reported by P6 90°detector. While these electrons are trapped, as they areobserved by the low‐altitude POES instruments they havepitch angles that are relatively close to the atmospheric losscone and as such represent the population of relativisticelectrons that are most easily available to pitch anglescatter into the atmosphere. The “primary” data productfrom the P6 telescope, >6.9 MeV protons during solarproton events (SPE), have been removed by using solarproton activity indications from the P7 omnidirectionaldetector, thus leaving only the relativistic electron counts.Superimposed on Figure 4 is the daily sunspot number(white line), and ICME events classified by the ACEspacecraft (red crosses). The pattern of relativistic electroncounts in the P6 90° detector resembles the variability in thee3 90° detector (Figure 2, top), with a strong enhancementduring the declining solar phase, but with observationsprimarily in the outer radiation belt. It is clear from Figure 4that SPE do not obscure the P6 90° relativistic electroncounts over significant time periods, suggesting that theSEM‐2 observations may serve as a useful database of rela-tivistic electron observations when solar proton levels are notsignificant.[18] We have attempted to contrast the “size” of the
enhancements described above, and particularly the P6‐detected relativistic electrons, which will penetrate mostdeeply into the atmosphere. The behavior of the T and BLCfluxes shows several characteristic features across the∼10 years of SEM‐2 relativistic electron observations. Ingeneral, there is a strong agreement in the variability of thetrapped and BLC relativistic electrons. While it appears thatthe sensitivity of the P6 0° detector (BLC electrons) is low,such that only rather enhanced relativistic electron precipi-tation periods appear in the record, there is strong agreementbetween the near‐perpendicular telescopes (not shown). Anumber of relativistic electron enhancements occur in boththe T and BLC fluxes that repeat in a periodic (∼27 day)
Table 2. Data Quality for the Energetic Electron Channels of theSEM‐2 Package From 1 December 1998 to 31 December 2007a
Data Channel Directionality AllQuiet
(AE � 150 nT)Disturbed
(AE > 150 nT)
e1 (>30 keV) 90° (trapped) 1.3% 0.5% 2.0%e2 (>100 keV) 90° (trapped) 0.4% 0.3% 0.6%e3 (>300 keV) 90° (trapped) 3.5% 0.7% 6.4%e1 (>30 keV) 0° (BLC) 22.7% 24.7% 20.6%e2 (>100 keV) 0° (BLC) 10.2% 8.91% 11.6%e3 (>300 keV) 0° (BLC) 41.7% 29.1% 55.0%
aThe percentage indicates the quantity of observations potentiallycontaminated by protons, for the L‐shell range 4 to 7, and 3 h, 0.25‐Lresolution.
RODGER ET AL.: POES OBSERVATIONS OF EEP A04202A04202
6 of 13
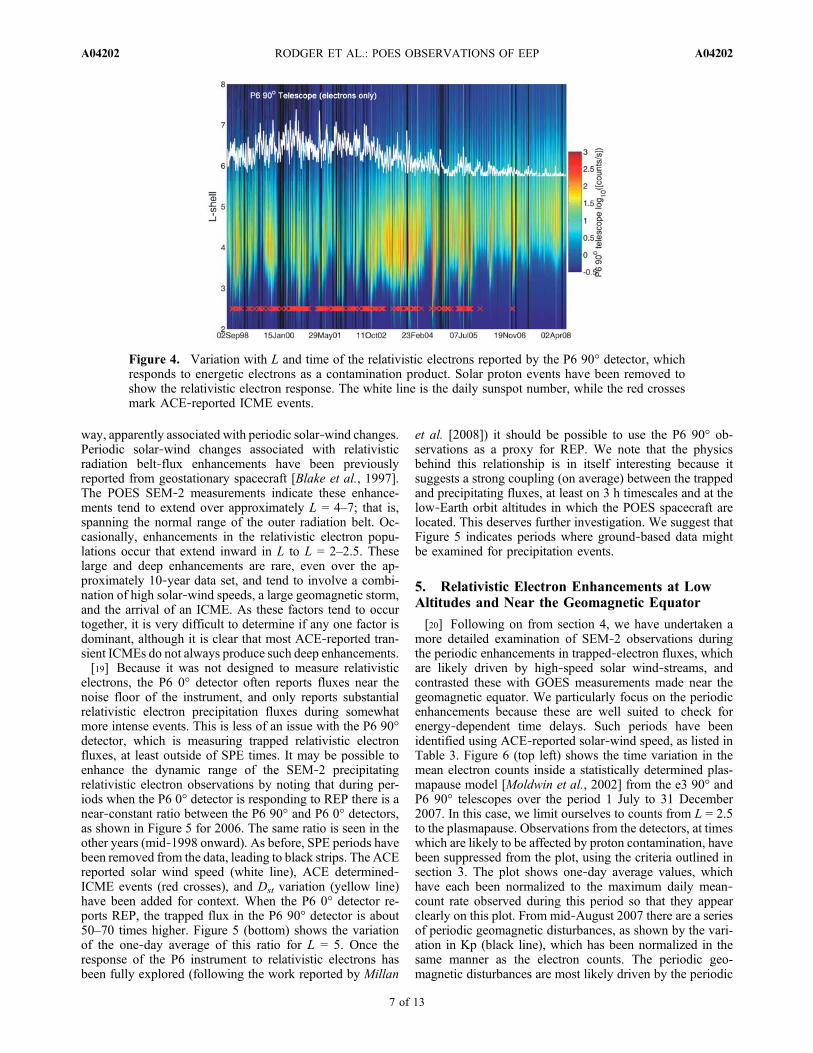
way, apparently associated with periodic solar‐wind changes.Periodic solar‐wind changes associated with relativisticradiation belt‐flux enhancements have been previouslyreported from geostationary spacecraft [Blake et al., 1997].The POES SEM‐2 measurements indicate these enhance-ments tend to extend over approximately L = 4–7; that is,spanning the normal range of the outer radiation belt. Oc-casionally, enhancements in the relativistic electron popu-lations occur that extend inward in L to L = 2–2.5. Theselarge and deep enhancements are rare, even over the ap-proximately 10‐year data set, and tend to involve a combi-nation of high solar‐wind speeds, a large geomagnetic storm,and the arrival of an ICME. As these factors tend to occurtogether, it is very difficult to determine if any one factor isdominant, although it is clear that most ACE‐reported tran-sient ICMEs do not always produce such deep enhancements.[19] Because it was not designed to measure relativistic
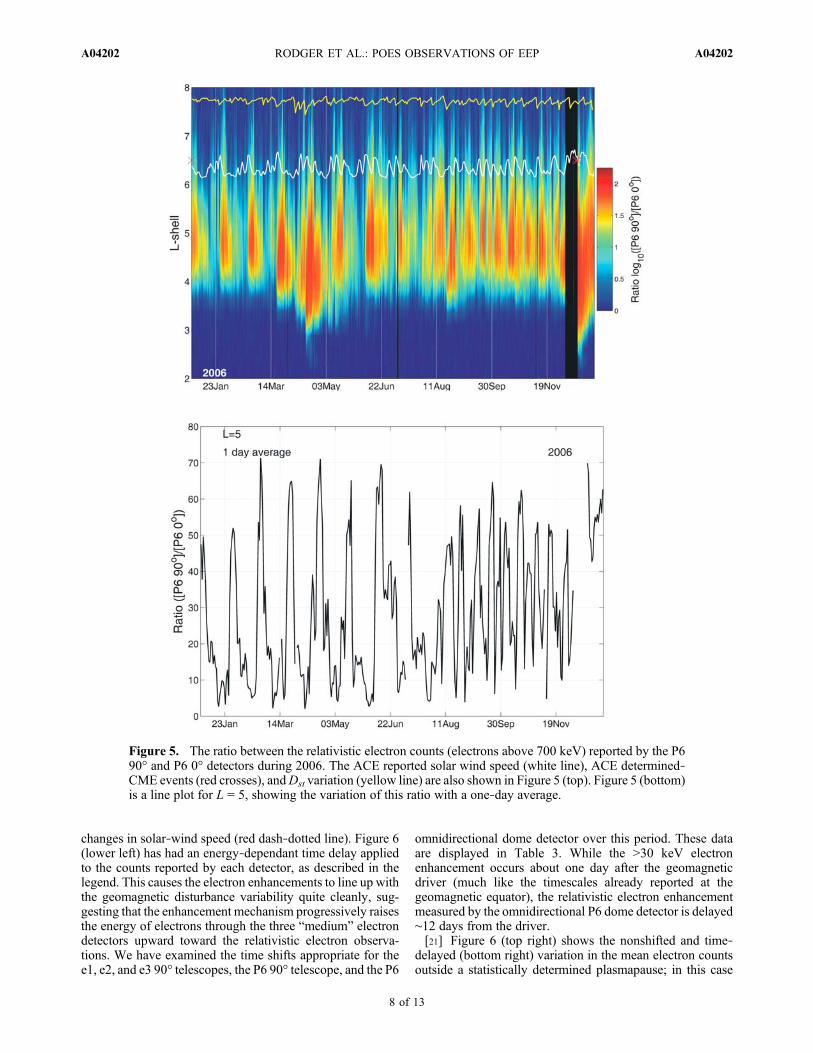
electrons, the P6 0° detector often reports fluxes near thenoise floor of the instrument, and only reports substantialrelativistic electron precipitation fluxes during somewhatmore intense events. This is less of an issue with the P6 90°detector, which is measuring trapped relativistic electronfluxes, at least outside of SPE times. It may be possible toenhance the dynamic range of the SEM‐2 precipitatingrelativistic electron observations by noting that during per-iods when the P6 0° detector is responding to REP there is anear‐constant ratio between the P6 90° and P6 0° detectors,as shown in Figure 5 for 2006. The same ratio is seen in theother years (mid‐1998 onward). As before, SPE periods havebeen removed from the data, leading to black strips. The ACEreported solar wind speed (white line), ACE determined‐ICME events (red crosses), and Dst variation (yellow line)have been added for context. When the P6 0° detector re-ports REP, the trapped flux in the P6 90° detector is about50–70 times higher. Figure 5 (bottom) shows the variationof the one‐day average of this ratio for L = 5. Once theresponse of the P6 instrument to relativistic electrons hasbeen fully explored (following the work reported by Millan
et al. [2008]) it should be possible to use the P6 90° ob-servations as a proxy for REP. We note that the physicsbehind this relationship is in itself interesting because itsuggests a strong coupling (on average) between the trappedand precipitating fluxes, at least on 3 h timescales and at thelow‐Earth orbit altitudes in which the POES spacecraft arelocated. This deserves further investigation. We suggest thatFigure 5 indicates periods where ground‐based data mightbe examined for precipitation events.
5. Relativistic Electron Enhancements at LowAltitudes and Near the Geomagnetic Equator
[20] Following on from section 4, we have undertaken amore detailed examination of SEM‐2 observations duringthe periodic enhancements in trapped‐electron fluxes, whichare likely driven by high‐speed solar wind‐streams, andcontrasted these with GOES measurements made near thegeomagnetic equator. We particularly focus on the periodicenhancements because these are well suited to check forenergy‐dependent time delays. Such periods have beenidentified using ACE‐reported solar‐wind speed, as listed inTable 3. Figure 6 (top left) shows the time variation in themean electron counts inside a statistically determined plas-mapause model [Moldwin et al., 2002] from the e3 90° andP6 90° telescopes over the period 1 July to 31 December2007. In this case, we limit ourselves to counts from L = 2.5to the plasmapause. Observations from the detectors, at timeswhich are likely to be affected by proton contamination, havebeen suppressed from the plot, using the criteria outlined insection 3. The plot shows one‐day average values, whichhave each been normalized to the maximum daily mean‐count rate observed during this period so that they appearclearly on this plot. From mid‐August 2007 there are a seriesof periodic geomagnetic disturbances, as shown by the vari-ation in Kp (black line), which has been normalized in thesame manner as the electron counts. The periodic geo-magnetic disturbances are most likely driven by the periodic
Figure 4. Variation with L and time of the relativistic electrons reported by the P6 90° detector, whichresponds to energetic electrons as a contamination product. Solar proton events have been removed toshow the relativistic electron response. The white line is the daily sunspot number, while the red crossesmark ACE‐reported ICME events.
RODGER ET AL.: POES OBSERVATIONS OF EEP A04202A04202
7 of 13
changes in solar‐wind speed (red dash‐dotted line). Figure 6(lower left) has had an energy‐dependant time delay appliedto the counts reported by each detector, as described in thelegend. This causes the electron enhancements to line up withthe geomagnetic disturbance variability quite cleanly, sug-gesting that the enhancement mechanism progressively raisesthe energy of electrons through the three “medium” electrondetectors upward toward the relativistic electron observa-tions. We have examined the time shifts appropriate for thee1, e2, and e3 90° telescopes, the P6 90° telescope, and the P6
omnidirectional dome detector over this period. These dataare displayed in Table 3. While the >30 keV electronenhancement occurs about one day after the geomagneticdriver (much like the timescales already reported at thegeomagnetic equator), the relativistic electron enhancementmeasured by the omnidirectional P6 dome detector is delayed∼12 days from the driver.[21] Figure 6 (top right) shows the nonshifted and time‐
delayed (bottom right) variation in the mean electron countsoutside a statistically determined plasmapause; in this case
Figure 5. The ratio between the relativistic electron counts (electrons above 700 keV) reported by the P690° and P6 0° detectors during 2006. The ACE reported solar wind speed (white line), ACE determined‐CME events (red crosses), andDst variation (yellow line) are also shown in Figure 5 (top). Figure 5 (bottom)is a line plot for L = 5, showing the variation of this ratio with a one‐day average.
RODGER ET AL.: POES OBSERVATIONS OF EEP A04202A04202
8 of 13
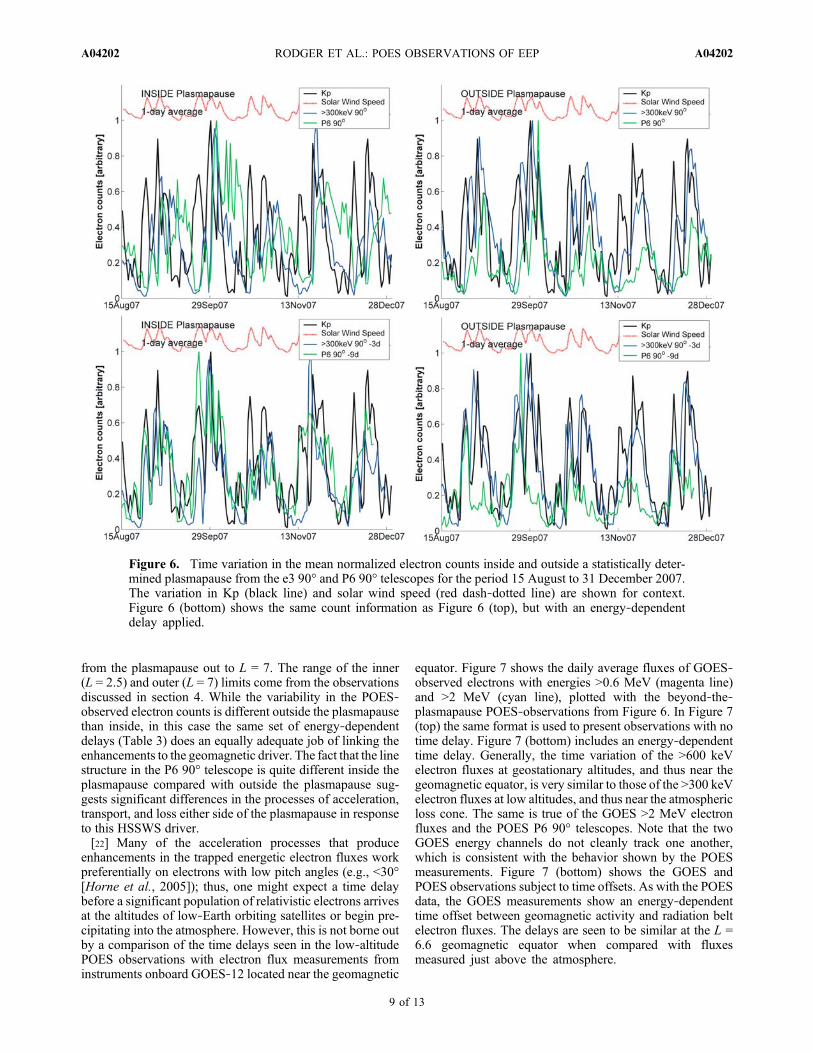
from the plasmapause out to L = 7. The range of the inner(L = 2.5) and outer (L = 7) limits come from the observationsdiscussed in section 4. While the variability in the POES‐observed electron counts is different outside the plasmapausethan inside, in this case the same set of energy‐dependentdelays (Table 3) does an equally adequate job of linking theenhancements to the geomagnetic driver. The fact that the linestructure in the P6 90° telescope is quite different inside theplasmapause compared with outside the plasmapause sug-gests significant differences in the processes of acceleration,transport, and loss either side of the plasmapause in responseto this HSSWS driver.[22] Many of the acceleration processes that produce
enhancements in the trapped energetic electron fluxes workpreferentially on electrons with low pitch angles (e.g., <30°[Horne et al., 2005]); thus, one might expect a time delaybefore a significant population of relativistic electrons arrivesat the altitudes of low‐Earth orbiting satellites or begin pre-cipitating into the atmosphere. However, this is not borne outby a comparison of the time delays seen in the low‐altitudePOES observations with electron flux measurements frominstruments onboard GOES‐12 located near the geomagnetic
equator. Figure 7 shows the daily average fluxes of GOES‐observed electrons with energies >0.6 MeV (magenta line)and >2 MeV (cyan line), plotted with the beyond‐the‐plasmapause POES‐observations from Figure 6. In Figure 7(top) the same format is used to present observations with notime delay. Figure 7 (bottom) includes an energy‐dependenttime delay. Generally, the time variation of the >600 keVelectron fluxes at geostationary altitudes, and thus near thegeomagnetic equator, is very similar to those of the >300 keVelectron fluxes at low altitudes, and thus near the atmosphericloss cone. The same is true of the GOES >2 MeV electronfluxes and the POES P6 90° telescopes. Note that the twoGOES energy channels do not cleanly track one another,which is consistent with the behavior shown by the POESmeasurements. Figure 7 (bottom) shows the GOES andPOES observations subject to time offsets. As with the POESdata, the GOES measurements show an energy‐dependenttime offset between geomagnetic activity and radiation beltelectron fluxes. The delays are seen to be similar at the L =6.6 geomagnetic equator when compared with fluxesmeasured just above the atmosphere.
Figure 6. Time variation in the mean normalized electron counts inside and outside a statistically deter-mined plasmapause from the e3 90° and P6 90° telescopes for the period 15 August to 31 December 2007.The variation in Kp (black line) and solar wind speed (red dash‐dotted line) are shown for context.Figure 6 (bottom) shows the same count information as Figure 6 (top), but with an energy‐dependentdelay applied.
RODGER ET AL.: POES OBSERVATIONS OF EEP A04202A04202
9 of 13

Table 3. Energy‐Dependent Time Delays in Days Between Geomagnetic Disturbances and POES SEM‐2 Observed Increases in EnergeticElectron Fluxes Inside and Outside a Statistical Model of the Plasmapausea
Time Period
Inside Plasmapause Outside Plasmapause
>30 keV >100 keV >300 keV P6 90° P6omni >30 keV >100 keV >300 keV P6 90° P6omni
Mid‐August to late October 1999 1 2 3 4 5 0 1 1 2 3Mid‐August 2003 to mid‐March 2004 1 1 2 5 6 1 1 2 3 4April 2006 0 1 1 3 3 0 0 1 2 5Mid‐March to late May 2007 0 1 2 5 8 0 1 1 3 6Mid‐August to end‐December 2007 1 2 3 9 12 1 2 3 9 12Average delay in days 1 1 2 5 7 0 1 2 4 6
aEnergy‐dependent.
Figure 7. Time variation in the mean normalized electron counts outside a statistically determined plas-mapause in the same format and time period as Figure 6. The magenta and cyan lines show the electronflux measurements from instruments onboard GOES‐12, near the geomagnetic equator.
RODGER ET AL.: POES OBSERVATIONS OF EEP A04202A04202
10 of 13
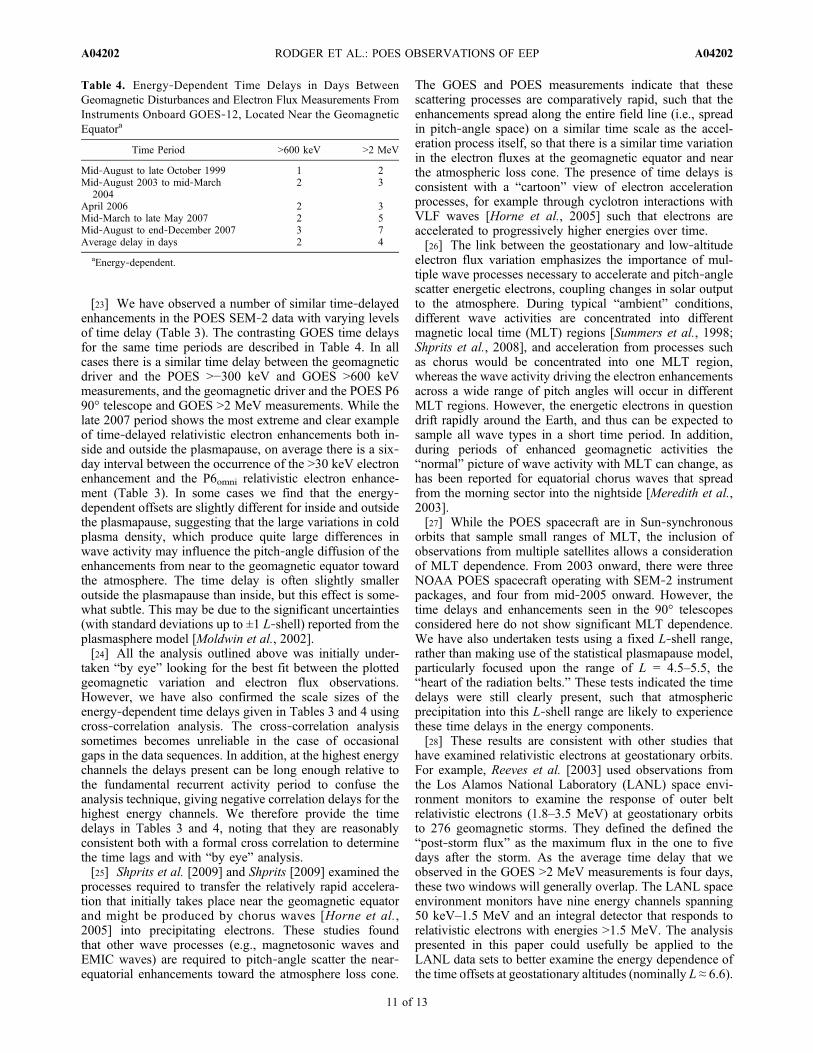
[23] We have observed a number of similar time‐delayedenhancements in the POES SEM‐2 data with varying levelsof time delay (Table 3). The contrasting GOES time delaysfor the same time periods are described in Table 4. In allcases there is a similar time delay between the geomagneticdriver and the POES >−300 keV and GOES >600 keVmeasurements, and the geomagnetic driver and the POES P690° telescope and GOES >2 MeV measurements. While thelate 2007 period shows the most extreme and clear exampleof time‐delayed relativistic electron enhancements both in-side and outside the plasmapause, on average there is a six‐day interval between the occurrence of the >30 keV electronenhancement and the P6omni relativistic electron enhance-ment (Table 3). In some cases we find that the energy‐dependent offsets are slightly different for inside and outsidethe plasmapause, suggesting that the large variations in coldplasma density, which produce quite large differences inwave activity may influence the pitch‐angle diffusion of theenhancements from near to the geomagnetic equator towardthe atmosphere. The time delay is often slightly smalleroutside the plasmapause than inside, but this effect is some-what subtle. This may be due to the significant uncertainties(with standard deviations up to ±1 L‐shell) reported from theplasmasphere model [Moldwin et al., 2002].[24] All the analysis outlined above was initially under-
taken “by eye” looking for the best fit between the plottedgeomagnetic variation and electron flux observations.However, we have also confirmed the scale sizes of theenergy‐dependent time delays given in Tables 3 and 4 usingcross‐correlation analysis. The cross‐correlation analysissometimes becomes unreliable in the case of occasionalgaps in the data sequences. In addition, at the highest energychannels the delays present can be long enough relative tothe fundamental recurrent activity period to confuse theanalysis technique, giving negative correlation delays for thehighest energy channels. We therefore provide the timedelays in Tables 3 and 4, noting that they are reasonablyconsistent both with a formal cross correlation to determinethe time lags and with “by eye” analysis.[25] Shprits et al. [2009] and Shprits [2009] examined the
processes required to transfer the relatively rapid accelera-tion that initially takes place near the geomagnetic equatorand might be produced by chorus waves [Horne et al.,2005] into precipitating electrons. These studies foundthat other wave processes (e.g., magnetosonic waves andEMIC waves) are required to pitch‐angle scatter the near‐equatorial enhancements toward the atmosphere loss cone.
The GOES and POES measurements indicate that thesescattering processes are comparatively rapid, such that theenhancements spread along the entire field line (i.e., spreadin pitch‐angle space) on a similar time scale as the accel-eration process itself, so that there is a similar time variationin the electron fluxes at the geomagnetic equator and nearthe atmospheric loss cone. The presence of time delays isconsistent with a “cartoon” view of electron accelerationprocesses, for example through cyclotron interactions withVLF waves [Horne et al., 2005] such that electrons areaccelerated to progressively higher energies over time.[26] The link between the geostationary and low‐altitude
electron flux variation emphasizes the importance of mul-tiple wave processes necessary to accelerate and pitch‐anglescatter energetic electrons, coupling changes in solar outputto the atmosphere. During typical “ambient” conditions,different wave activities are concentrated into differentmagnetic local time (MLT) regions [Summers et al., 1998;Shprits et al., 2008], and acceleration from processes suchas chorus would be concentrated into one MLT region,whereas the wave activity driving the electron enhancementsacross a wide range of pitch angles will occur in differentMLT regions. However, the energetic electrons in questiondrift rapidly around the Earth, and thus can be expected tosample all wave types in a short time period. In addition,during periods of enhanced geomagnetic activities the“normal” picture of wave activity with MLT can change, ashas been reported for equatorial chorus waves that spreadfrom the morning sector into the nightside [Meredith et al.,2003].[27] While the POES spacecraft are in Sun‐synchronous
orbits that sample small ranges of MLT, the inclusion ofobservations from multiple satellites allows a considerationof MLT dependence. From 2003 onward, there were threeNOAA POES spacecraft operating with SEM‐2 instrumentpackages, and four from mid‐2005 onward. However, thetime delays and enhancements seen in the 90° telescopesconsidered here do not show significant MLT dependence.We have also undertaken tests using a fixed L‐shell range,rather than making use of the statistical plasmapause model,particularly focused upon the range of L = 4.5–5.5, the“heart of the radiation belts.” These tests indicated the timedelays were still clearly present, such that atmosphericprecipitation into this L‐shell range are likely to experiencethese time delays in the energy components.[28] These results are consistent with other studies that
have examined relativistic electrons at geostationary orbits.For example, Reeves et al. [2003] used observations fromthe Los Alamos National Laboratory (LANL) space envi-ronment monitors to examine the response of outer beltrelativistic electrons (1.8–3.5 MeV) at geostationary orbitsto 276 geomagnetic storms. They defined the defined the“post‐storm flux” as the maximum flux in the one to fivedays after the storm. As the average time delay that weobserved in the GOES >2 MeV measurements is four days,these two windows will generally overlap. The LANL spaceenvironment monitors have nine energy channels spanning50 keV–1.5 MeV and an integral detector that responds torelativistic electrons with energies >1.5 MeV. The analysispresented in this paper could usefully be applied to theLANL data sets to better examine the energy dependence ofthe time offsets at geostationary altitudes (nominally L ≈ 6.6).
Table 4. Energy‐Dependent Time Delays in Days BetweenGeomagnetic Disturbances and Electron Flux Measurements FromInstruments Onboard GOES‐12, Located Near the GeomagneticEquatora
Time Period >600 keV >2 MeV
Mid‐August to late October 1999 1 2Mid‐August 2003 to mid‐March
20042 3
April 2006 2 3Mid‐March to late May 2007 2 5Mid‐August to end‐December 2007 3 7Average delay in days 2 4
aEnergy‐dependent.
RODGER ET AL.: POES OBSERVATIONS OF EEP A04202A04202
11 of 13
For example, Figure 5 of Longden et al. [2008] shows asuperposed epoch analysis of LANL flux data sets for bothICME and periodic HSSWS, and appears to show energy‐dependent offsets in the case of HSSWS‐driven storms. Weacknowledge that this data set is likely to provide a veryuseful source for such a study, although currently significanttime periods are not available for public dissemination(R. Friedel, personal communication, 2009).[29] The energy‐dependent time delays will make it more
difficult to produce a representative precipitation climatol-ogy, particularly for electron energies >100 keV. For ex-ample, the Codrescu et al. [1997] electron precipitationclimatology uses the TIROS/SEM‐1 observations to extendearlier climatologies beyond 30 keV, organized through ageomagnetic “activity index,” which is essentially binnedKp [Fuller‐Rowell and Evans, 1987]. However, this willmix low‐medium Kp periods before storms, when precipi-tating fluxes will be low, with low‐medium Kp periods afterstorm‐triggered injections, where precipitating fluxes of>100 keV electrons can be high due to delayed acceleration.
6. Summary and Conclusions
[30] Coupling between the Van Allen radiation belts andthe Earth’s ionosphere through precipitating particles is anarea of increased scientific interest due to a growing focuson the physics of the radiation belts and also the response ofthe atmosphere to precipitating particles. Outstanding issuessurround our understanding of the precipitation of “medium”(>20 keV) and highly energetic (relativistic) electrons, whichare needed for comparison with other experimental data sets,and also to drive theoretical models. In this paper we examineroughly 10 years of measurements of trapped and precipi-tating electrons available from the SEM‐2 instrument pack-age onboard the POES. This data set includes both mediumand relativistic energy‐range measurements of trapped andprecipitating electrons from the same spacecraft.[31] Here we have shown that the POES SEM‐2 detectors
suffer from some contamination issues that complicate theunderstanding of the measurements, but that the observationsprovide additional insight into the precipitation of energeticelectrons from the radiation belts andmay be developed into auseful climatology. In particular, the 0°‐directed MEPED‐telescopes view only the locally precipitating fluxes in theBLC from geomagnetic latitudes corresponding approxi-mately to L > 1.4.[32] As has been known for some time, the “medium”
electron energy channels in the SEM‐2 instrument cansuffer from contamination by rather low‐energy protons.The 90°‐pointing (trapped flux) >30, >100, and >300 keVelectron observations are not badly affected, with most ofthe contamination occurring beyond L = 7, which is in thevery outer part of the outer radiation belt. As such, theseobservations are well suited for the purposes of radiationbelt studies. However, the 0°‐pointing (BLC) electrons fromthese energies have significant levels of contamination inthe “heart of the radiation belts” (L = 4.5 to 5.5) with asignificant fraction of the measurements dominated byproton contamination. Contamination can reach 55% duringgeomagnetically disturbed periods. Even in quiet periodsnearly 30% of the >300 keV precipitation measurements arepotentially contaminated. The large levels of proton con-
tamination present in the SEM‐2 energetic electron precipi-tation observations may affect the quality of geomagneticallydependant precipitation climatologies that have been devel-oped from this data set. It is likely that similar issues apply tothe precipitation climatologies developed from the earlySEM‐1.[33] The SEM‐2 proton detectors also suffer from con-
tamination, responding to electrons at relativistic energies[Evans et al., 2008]. The P6 telescope detectors, which aredesigned to measure >6.9 MeV protons, also respond toelectrons with energies from 700 keV upward [Millan et al.,2008], providing simultaneous in situ observations of bothtrapped and precipitating relativistic electrons from mid‐1998. In contrast, the P6 0° detector only reports relativisticelectrons during somewhat more intense events. However,taking this into account there is very strong agreement be-tween the behavior of the trapped and precipitating relativ-istic electrons, at least on 3 h timescales. Relativisticelectron increases are associated with both ICME and pe-riodic HSSWS. It is clear from our investigation that solarproton events do not obscure the trapped relativistic electroncounts over significant time periods, and that the POES/SEM‐2 observations may serve as a useful database of newrelativistic electron observations and particularly, identify-ing periods of strong REP.[34] Finally, there is an energy‐dependent time delay
observed in the POES/SEM‐2 observations, with an almostone‐week delay between the >30 keV electron enhancementand the P6omni relativistic electron enhancement. One pos-sible interpretation of this is a two‐stage process, whererelatively rapid acceleration initially takes place near thegeomagnetic equator as predicted by theory and observedexperimentally. This is followed by a much slower process,where the relativistic electrons scatter toward the atmo-sphere loss cone at a rate that is energy dependent. Suchlarge delays should have consequences for the timing of theatmospheric impact of HSSWS‐triggered geomagneticstorms. While there appears to be some cold‐plasma densitydependence in the energy‐dependent delay, this effect is notparticularly strong, which may reflect the significant un-certainties associated with the statistical plasmaspheremodel we employ. In contrast, there are clearly significantdifferences in the variability of POES‐observed electroncounts inside the plasmapause when compared with outsidethe plasmapause, suggesting significant differences in theprocesses of acceleration, transport, and loss either side ofthe plasmapause in response to this HSSWS‐driver.
[35] Acknowledgments. C.J.R. would like to thank the BritishAntarctic Survey for hosting him during his sabbatical and Kirsten Franklinof Dunedin for her support during that time. The authors wish to thank theACE Science Center, the Kyoto World Data center, and many years’ worthof efforts from NOAA personnel, who developed, maintain, and operate theNOAA/POES spacecraft.[36] Zuyin Pu thanks Marit Sandanger, Reiner Friedel and Geoffrey
Reeves for their assistance in evaluating this paper.
ReferencesAlfonsi, L., et al. (2008), Probing the high latitude ionosphere fromground‐based observations: The state of current knowledge and capabil-ities during IPY (2007–2009), J. Atmos. Sol. Terr. Phys., 70(18), 2293–2308, doi:10.1016/j.jastp.2008.06.013.
RODGER ET AL.: POES OBSERVATIONS OF EEP A04202A04202
12 of 13
Blake, J. B., D. N. Baker, N. Turner, K. W. Ogilvie, and R. P. Lepping(1997), Correlation of changes in the outer‐zone relativistic‐electron pop-ulation with upstream solar wind and magnetic field measurements, Geo-phys. Res. Lett., 24(8), 927–929, doi:10.1029/97GL00859.
Borovsky, J. E., andM. H. Denton (2006), Differences between CME‐drivenstorms and CIR‐driven storms, J. Geophys. Res., 111, A07S08,doi:10.1029/2005JA011447.
Brasseur, G., and S. Solomon (2005), Aeronomy of the Middle Atmosphere,3rd ed., D. Reidel Dordrecht, Netherlands.
Clilverd, M. A., C. J. Rodger, and T. Ulich (2006), The importance ofatmospheric precipitation in storm‐time relativistic electron flux dropouts, Geophys. Res. Lett., 33, L01102, doi:10.1029/2005GL024661.
Clilverd, M. A., et al. (2009), Remote sensing space weather events: TheAARDDVARK network, Space Weather, 7, S04001, doi:10.1029/2008SW000412.
Codrescu, M. V., T. J. Fuller‐Rowell, R. G. Roble, and D. S. Evans (1997),Medium energy particle precipitation influences on the mesosphere andlower thermosphere, J. Geophys. Res., 102(A9), 19,977–19,987,doi:10.1029/97JA01728.
Evans, D. S., andM. S. Greer (2004), Polar Orbiting Environmental SatelliteSpace Environment Monitor–2 Instrument Descriptions and Archive DataDocumentation, NOAA Tech. Mem. 1.4, Space Environ. Lab., Boulder,Colorado.
Evans, D., H. Garrett, I. Jun, R. Evans, and J. Chow (2008), Long‐termobservations of the trapped high‐energy proton population (L < 4) bythe NOAA Polar Orbiting Environmental Satellites (POES), Adv. SpaceRes., 41(8), 1261–1268, doi:10.1016/j.asr.2007.11.028.
Friedel, R. H. W., G. D. Reeves, and T. Obara (2002), Relativistic electrondynamics in the inner magnetosphere–a review, J. Atmos. Sol. Terr.Phys., 64(2), 265–282, doi:10.1016/S1364-6826(01)00088-8.
Fuller‐Rowell, T., and D. Evans (1987), Height‐integrated Pedersen andHall conductivity patterns inferred from the TIROS‐NOAA satellite data,J. Geophys. Res., 92(A7), 7606–7618, doi:10.1029/JA092iA07p07606.
Gamble, R. J., C. J. Rodger, M. A. Clilverd, J. A. Sauvaud, N. R. Thomson,S. L. Stewart, R. J. McCormick, M. Parrot, and J.‐J. Berthelier (2008),Radiation belt electron precipitation by manmade VLF transmissions,J. Geophys. Res., 113, A10211, doi:10.1029/2008JA013369.
Green, J. C., T. G. Onsager, T. P. O’Brien, and D. N. Baker (2004), Testingloss mechanisms capable of rapidly depleting relativistic electron flux inthe Earth’s outer radiation belt, J. Geophys. Res., 109, A12211,doi:10.1029/2004JA010579.
Hill, V. J., D. S. Evans, and H. H. Sauer (1985), TIROS/NOAA SatellitesSpace Environment Monitor Archive Tape Documentation,NOAA Techni-cal Memorandum ERL SEL‐71, Space Environ. Lab., Boulder, Colorado.
Hilmer, R. V., G. P. Ginet, and T. E. Cayton (2000), Enhancement of equa-torial energetic electron fluxes near L = 4.2 as a result of high‐speed solarwind‐streams, J. Geophys. Res., 105(A10), 23,311–23,322, doi:10.1029/1999JA000380.
Horne, R. B. (2002), The contribution of wave‐particle interactions to elec-tron loss and acceleration in the Earth’s radiation belts during geomag-netic storms, in URSI Review of Radio Science 1999–2002, edited byW. R. Stone, pp. 801–828, John Wiley, Hoboken, N. J.
Horne, R. B., R. M. Thorne, S. A. Glauert, J. M. Albert, N. P. Meredith,and R. R. Anderson (2005), Timescale for radiation belt electron accel-eration by whistler mode chorus waves, J. Geophys. Res., 110,A03225, doi:10.1029/2004JA010811.
Longden, N., M. H. Denton, and F. Honary (2008), Particle precipitationduring ICME‐driven and CIR‐driven geomagnetic storms, J. Geophys.Res., 113, A06205, doi:10.1029/2007JA012752.
Lorentzen, K., M. Looper, and J. Blake (2001), Relativistic electron micro-bursts during the GEM storms, Geophys. Res. Lett., 28(13), 2573–2576,doi:10.1029/2001GL012926.
Meredith, N. P., R. B. Horne, R. M. Thorne, and R. R. Anderson (2003),Favored regions for chorus‐driven electron acceleration to relativistic ener-gies in the Earth’s outer radiation belt, Geophys. Res. Lett., 30(16),1871, doi:10.1029/2003GL017698.
Meredith, N. P., R. B. Horne, M. A. Clilverd, D. Horsfall, R. M. Thorne,and R. R. Anderson (2006), Origins of plasmaspheric hiss, J. Geophys.Res., 111, A09217, doi:10.1029/2006JA011707.
Millan, R. M., K. Yando, and J. C. Green (2008), NOAA POES observa-tions of relativistic electron precipitation during a radiation belt depletionevent, Eos Trans. AGU, 89(53), Fall Meet. Suppl., Abstract U13A–0043.
Miyoshi, Y., and R. Kataoka (2005), Ring current ions and radiation beltelectrons during geomagnetic storms driven by coronal mass ejectionsand corotating interaction regions, Geophys. Res. Lett., 32, L21105,doi:10.1029/2005GL024590.
Moldwin,M. B., L. Downward, H. K. Rassoul, R. Amin, and R. R. Anderson(2002), A new model of the location of the plasmapause: CRRES results,J. Geophys. Res., 107(A11), 1339, doi:10.1029/2001JA009211.
Randall, C. E., et al. (2005), Stratospheric effects of energetic particle pre-cipitation in 2003–2004, Geophys. Res. Lett., 32, L05802, doi:10.1029/2004GL022003.
Reeves, G. D., et al. (2003), Acceleration and loss of relativistic electronsduring geomagnetic storms, Geophys. Res. Lett., 30(10), 1529,doi:10.1029/2002GL016513.
Reeves, G., A. Chan, and C. J. Rodger (2009), Current understanding ofradiation belt dynamics and future challenges, Space Weather, 7,S07004, doi:10.1029/2008SW000436.
Richardson, I. G., E. W. Cliver, and H. V. Cane (2000), Sources of geo-magnetic activity over the solar cycle: Relative importance of coronalmass ejections, high‐speed streams, and slow solar wind, J. Geophys.Res., 105(A8), 18,203–18,213, doi:10.1029/1999JA000400.
Rozanov, E., L. Callis, M. Schlesinger, F. Yang, N. Andronova, andV. Zubov (2005), Atmospheric response to NOy source due to energeticelectron precipitation, Geophys. Res. Lett., 32, L14811, doi:10.1029/2005GL023041.
Sandanger, M., F. Søraas, K. Aarsnes, K. Oksavik, and D. S. Evans (2007),Loss of relativistic electrons: Evidence for pitch angle scattering by elec-tromagnetic ion cyclotron waves excited by unstable ring current protons,J. Geophys. Res., 112, A12213, doi:10.1029/2006JA012138.
Seppälä, A., M. A. Clilverd, and C. J. Rodger (2007), NOx enhancements inthe middle atmosphere during 2003–2004 polar winter: Relative signifi-cance of solar proton events and the aurora as a source, J. Geophys. Res.,112, D23303, doi:10.1029/2006JD008326.
Seppälä, A., C. E. Randall, M. A. Clilverd, E. Rozanov, and C. J. Rodger(2009), Geomagnetic activity and polar surface air temperature variabil-ity, J. Geophys. Res., 114, A10312, doi:10.1029/2008JA014029.
Shprits, Y. Y. (2009), Potential waves for pitch‐angle scattering of near‐equatorially mirroring energetic electrons due to the violation of the sec-ond adiabatic invariant, Geophys. Res. Lett., 36, L12106, doi:10.1029/2009GL038322.
Shprits, Y. Y., et al. (2008), Review of modeling of losses and sources ofrelativistic electrons in the outer radiation belt II: Local acceleration andloss, J. Atmos. Sol. Terr. Phys., 70(14), 1694–1713, doi:10.1016/j.jastp.2008.06.014.
Shprits, Y. Y., L. Chen, and R. M. Thorne (2009), Simulations of pitch anglescattering of relativistic electrons with MLT‐dependent diffusion coeffi-cients, J. Geophys. Res., 114, A03219, doi:10.1029/2008JA013695.
Summers, D., R. M. Thorne, and F. Xiao (1998), Relativistic theory ofwave‐particle resonant diffusion with application to electron accelerationin the magnetosphere, J. Geophys. Res., 103(A9), 20,487–20,500,doi:10.1029/98JA01740.
Turunen, E., P. T. Verronen, A. Seppälä, C. J. Rodger, M. A. Clilverd,J. Tamminen, C. F. Enell, and T. Ulich (2009), Impact of different energiesof precipitating particles on NOx generation in the middle and upper atmo-sphere during geomagnetic storms, J. Atmos. Sol. Terr. Phys., 71, 1176–1189, doi:10.1016/j.jastp.2008.07.005.
Ukhorskiy, A. Y., B. J. Anderson, P. C. Brandt, and N. A. Tsyganenko(2006), Storm time evolution of the outer radiation belt: Transport andlosses, J. Geophys. Res., 111, A11S03, doi:10.1029/2006JA011690.
Vassiliadis, D., I. R. Mann, S. F. Fung, and X. Shao (2007), Ground Pc3‐Pc5 wave power distribution and response to solar wind velocity varia-tions, Planet. Space Sci., 55(6), 743–754, doi:10.1016/j.pss.2006.03.012.
Wüest, M., R. A. Frahm, J. K. Jennings, and J. R. Sharber (2005), Forecast-ing electron precipitation based on predicted geomagnetic activity, Adv.Space Res., 36(12), 2445–2450, doi:10.1016/j.asr.2003.12.014.
M. A. Clilverd and M. M. Lam, Physical Sciences Division, BritishAntarctic Survey, High Cross, Madingley Road, Cambridge CB3 0ET, UK.J. C. Green, Space Environment Center, NOAA, 325 Broadway Blvd.,
Boulder, CO 80305, USA.C. J. Rodger, Department of Physics, University of Otago, PO Box 56,
Dunedin, New Zealand. ([email protected])
RODGER ET AL.: POES OBSERVATIONS OF EEP A04202A04202
13 of 13