Embed Size (px)
Citation preview

Joan Enric Ricart holds an MSc and a Ph.D. in Managerial Economics from the Kellog Graduate School of Management, Illinois, United States, a Ph.D. in Industrial Engineering from the Polytechnic University of Catalonia, Barcelona, Spain, and a Ph.D. in Business Administration and Economics from the Autonomous University of Barcelona (UAB). His areas of interest are: strategic management, corporate governance, organizational design, the economics of organizations and offshoring. Besides teaching Economics and Strategic Management, and being head of IESE Business School’s Strategic Management Department and associate director of faculty for the departments of Strategic Management, Production, Technology and Operations, and Entrepreneurship, he also holds IESE’s Carl Schroeder Chair of Strategic Management. He has published numerous books, and has authored articles in journals such as Econometrica, European Economic Review, Journal of Finance, Harvard Deusto Business Review, Papeles de Economía, and Revista Española de Economía.
While offshoring is not a new reality, the way it is being undertaken is. The aim of this book is to help managers deal with the organizational challenges arising from the offshoring boom that now awaits us.
The book presents both the economic and management-oriented perspective, discussing the latest literature in both fields, assessing the impact on labor markets, and describing the new wave of services offshoring and how managers are dealing with it. The arrival of the Internet and telecommuting has created a second generation of offshore services involving very different business processes and working relations from the traditional offshoring of manufacturing activities. Companies now have the potential to relocate business processes that, until recently, were regarded as classic white-collar jobs which could only be performed at home, leveraging their access to cheap and available well-trained workers.
In view of the difficulties of obtaining a direct measurement of offshoring, the heterogeneous nature of sources, and the lack of consensus around the terminology used, this study draws heavily on the content of commercial reports, adding and breaking down data. In particular, recent data from the OECD and ORN (a research and professional network to which the authors belong) were used for the European Union and, more specifically, for one of the chapters dealing with Spain, while FDI reports and ORN data were used to gather information about the U.S.
The study offers guidance to the three groups involved. Firstly, it advises governments not to hinder the “natural economic process”. Secondly, it advises companies to see offshoring as an integral part of their global strategy. And thirdly, it proposes flexibility and training in order to re-skill workers affected by the phenomenon of offshoring.
This book addresses both researchers in the field and government institutions and companies, to whom it may provide useful input for developing the appropriate global strategies.
offshoring in the global economymanagement Practices and Welfare implications
Joan E. Ricart (Ed.)
Joan E. Ricart (Ed.)o
ffsh
or
ing
in t
he
glo
ba
l ec
on
om
y
ma
na
gem
ent P
ractices a
nd
Welfa
re imp
licatio
ns
Offshoring in the Global Economy provides a much needed integration of economic and management perspectives on the phenomenon of offshoring. Academics, policy makers and managers looking to get a deep understanding of this phenomenon will find this book a fascinating read. Especially as offshoring turns to higher value added services as in global innovation chains, such a holistic perspective provides the reader with a more nuanced view on its overall effects for the economy and the managerial challenges companies face to get it to work.
Bruno CassimanProfessor of Strategy
IESE Business School and K.U.Leuven
This state-of-the-art book is a must read for researchers or consultants with an interest in the global sourcing of business services. The book is unique in its review and evaluation of both macroeconomic studies and micro firm-level decisions involving employment effects as well as firm competitive advantage.
Arie Y. LewinProfessor of Strategy and International Business
Duke University Fuqua School of Business
9 7 8 8 4 9 2 9 3 7 0 3 5
ISBN 978-84-92937-03-5
www.fbbva.es


offshoring in the global economy


Offshoring in the Global Economy
Management Practicesand Welfare Implications
Edited by
Joan E. Ricart
Pablo AgneseNiccolò Pisani
Tunji Adegbesan
The BBVA Foundation’s decision to publish this book does not imply any responsability
fot its content, or for the inclusion therein of any supplementary documents or
information facilitated by the authors.
No part of this publication, including the cover design, may be reproduced, stored in
a retrieval system or transmitted in any form or by any means, electronic, mechanical,
photocopying, recording or otherwise, without the prior written permission of the
copyright holder.
cataloguing-in-publication data
Offshoring in the global economy : management
practices and welfare implications / edited by Joan E.
Ricart ; Pablo Agnese, Niccolò Pisani, Tunji Adegbesan
— 1.ª ed. — Bilbao : Fundación BBVA, 2011.
322 p. ; 24 cm
isbn: 978-84-92937-03-5
1. Globalización 2. Estructura de producción
I. Ricart, Joan E., II. Agnese, Pablo, III. Pisani, Niccolò,
IV. Adegbesan, Tunji, V. Fundación BBVA, ed.
338.33
First published in February 2011
© the authors, 2011
© Fundación BBVA, 2011Plaza de San Nicolás, 4. 48005 Bilbao
cover illustration: © José Hernández, Vegap, Madrid, 2011Pórtico III (fragment), 1995Aquatint and etching, 300 x 240 mmCollection of Contemporary Graphic ArtFundación BBVA – Calcografía Nacional
isbn: 978-84-92937-03-5legal deposit no.: M-5222-2011
edition and production: Grupo Ibersaf
printed by Ibersaf Industrial, S.A.
Printed in Spain
This book is produced with 100% recycled paper made from recovered fibres, in conformity with the environmental standards required by the current European legislation.
c o N T E N T S
Introduction . . . . . . . . . . . . . . . . . . . . . . . . . . . . . . . . . . . . . . . . . . . . . . . . . . . . . . . . . . . . . . . . . . . . . . . . . . . . . . . . . . . . . 11
part oneSocioeconomic Effects of offshoring
1. Measurement and Effects 1.1. Measurement . . . . . . . . . . . . . . . . . . . . . . . . . . . . . . . . . . . . . . . . . . . . . . . . . . . . . . . . . . . . . . . . . . . . . . . . 23
1.1.1. A word about data quality . . . . . . . . . . . . . . . . . . . . . . . . . . . . . . . . . . . . . . . . . . . . 24
1.1.2. Measuring offshoring: indirect indicators . . . . . . . . . . . . . . . . . . . . 25
1.2. Possible effects of offshoring . . . . . . . . . . . . . . . . . . . . . . . . . . . . . . . . . . . . . . . . . . . . . . . . . 32
1.2.1. Employment effects . . . . . . . . . . . . . . . . . . . . . . . . . . . . . . . . . . . . . . . . . . . . . . . . . . . . . 33
1.2.2. Productivity effects . . . . . . . . . . . . . . . . . . . . . . . . . . . . . . . . . . . . . . . . . . . . . . . . . . . . . . 36
2. Making Sense of the Literature and Its Results 2.1. First steps . . . . . . . . . . . . . . . . . . . . . . . . . . . . . . . . . . . . . . . . . . . . . . . . . . . . . . . . . . . . . . . . . . . . . . . . . . . . . . . 40
2.2. A breakthrough . . . . . . . . . . . . . . . . . . . . . . . . . . . . . . . . . . . . . . . . . . . . . . . . . . . . . . . . . . . . . . . . . . . . . 45
2.3. Some aggregate evidence . . . . . . . . . . . . . . . . . . . . . . . . . . . . . . . . . . . . . . . . . . . . . . . . . . . . . . . 47
2.4. Some disaggregate evidence . . . . . . . . . . . . . . . . . . . . . . . . . . . . . . . . . . . . . . . . . . . . . . . . . . 53
2.5. Main theoretical contributions . . . . . . . . . . . . . . . . . . . . . . . . . . . . . . . . . . . . . . . . . . . . . . 58
2.6. General appraisal . . . . . . . . . . . . . . . . . . . . . . . . . . . . . . . . . . . . . . . . . . . . . . . . . . . . . . . . . . . . . . . . . . . 62
3. A World Overview 3.1. Offshoring intensity and country size . . . . . . . . . . . . . . . . . . . . . . . . . . . . . . . . . . . . . 66
3.2. Offshoring intensity and economic sector . . . . . . . . . . . . . . . . . . . . . . . . . . . . . . 81
3.3. Materials versus services offshoring . . . . . . . . . . . . . . . . . . . . . . . . . . . . . . . . . . . . . . . . . 88
3.4. Services offshoring: impending revolution? . . . . . . . . . . . . . . . . . . . . . . . . . . . . 91
3.5. The quality of the indices . . . . . . . . . . . . . . . . . . . . . . . . . . . . . . . . . . . . . . . . . . . . . . . . . . . . . . . 98
4. Effects on the Labor Market 4.1. Analytical framework: employment . . . . . . . . . . . . . . . . . . . . . . . . . . . . . . . . . . . . . . . . . 105
4.2. Analytical framework: productivity . . . . . . . . . . . . . . . . . . . . . . . . . . . . . . . . . . . . . . . . . . 109
4.3. An empirical application . . . . . . . . . . . . . . . . . . . . . . . . . . . . . . . . . . . . . . . . . . . . . . . . . . . . . . . . 111
4.3.1. Employment effects . . . . . . . . . . . . . . . . . . . . . . . . . . . . . . . . . . . . . . . . . . . . . . . . . . . . . 113
4.3.2. Productivity effects . . . . . . . . . . . . . . . . . . . . . . . . . . . . . . . . . . . . . . . . . . . . . . . . . . . . . . 117
5. The Socioeconomic Debate on Offshoring
part twoManagement Practices and offshoring
6. Business Process Offshoring: A Literature Review 6.1. Literature review . . . . . . . . . . . . . . . . . . . . . . . . . . . . . . . . . . . . . . . . . . . . . . . . . . . . . . . . . . . . . . . . . . . . . 128
6.2. Main theoretical frameworks used to investigate the offshoring
phenomenon . . . . . . . . . . . . . . . . . . . . . . . . . . . . . . . . . . . . . . . . . . . . . . . . . . . . . . . . . . . . . . . . . . . . . . . . . . 138
6.3. Methodology: current bias on conceptual and case-based
research . . . . . . . . . . . . . . . . . . . . . . . . . . . . . . . . . . . . . . . . . . . . . . . . . . . . . . . . . . . . . . . . . . . . . . . . . . . . . . . . . 145
6.4. Offshoring and labor markets: the emerging global sourcing
of talent . . . . . . . . . . . . . . . . . . . . . . . . . . . . . . . . . . . . . . . . . . . . . . . . . . . . . . . . . . . . . . . . . . . . . . . . . . . . . . . . . 147
6.5. Conclusion . . . . . . . . . . . . . . . . . . . . . . . . . . . . . . . . . . . . . . . . . . . . . . . . . . . . . . . . . . . . . . . . . . . . . . . . . . . . . 149
7. Main Findings of the Offshoring Research Network 7.1. Executive summary . . . . . . . . . . . . . . . . . . . . . . . . . . . . . . . . . . . . . . . . . . . . . . . . . . . . . . . . . . . . . . . . . 151
7.2. Structure and demographics . . . . . . . . . . . . . . . . . . . . . . . . . . . . . . . . . . . . . . . . . . . . . . . . . . . 153
7.3. Offshoring finally has the attention of the C-Suite . . . . . . . . . . . . . . . . . . 155
7.4. The globalization of innovation marches forward: ignore it at
your peril . . . . . . . . . . . . . . . . . . . . . . . . . . . . . . . . . . . . . . . . . . . . . . . . . . . . . . . . . . . . . . . . . . . . . . . . . . . . . . . . 161
7.5. Service providers are adapting their offerings to meet new
demands . . . . . . . . . . . . . . . . . . . . . . . . . . . . . . . . . . . . . . . . . . . . . . . . . . . . . . . . . . . . . . . . . . . . . . . . . . . . . . . . . 167
7.6. Small and medium businesses are increasingly outsourcing
processes . . . . . . . . . . . . . . . . . . . . . . . . . . . . . . . . . . . . . . . . . . . . . . . . . . . . . . . . . . . . . . . . . . . . . . . . . . . . . . . . 170
7.7. The changing constellation of service delivery models . . . . . . . . . . . . 176
7.8. Building global transformational capabilities . . . . . . . . . . . . . . . . . . . . . . . . . . 182
7.9. About this report . . . . . . . . . . . . . . . . . . . . . . . . . . . . . . . . . . . . . . . . . . . . . . . . . . . . . . . . . . . . . . . . . . . . 192
8. The Rationale for Business Process Offshoring: The Case of U.S. Firms, 1999–2003
8.1. Development of hypotheses . . . . . . . . . . . . . . . . . . . . . . . . . . . . . . . . . . . . . . . . . . . . . . . . . . . . . 198
8.2. Industry and country impact on BPO rationale . . . . . . . . . . . . . . . . . . . . . . . 204
8.3. Methods . . . . . . . . . . . . . . . . . . . . . . . . . . . . . . . . . . . . . . . . . . . . . . . . . . . . . . . . . . . . . . . . . . . . . . . . . . . . . . . . . . 206
8.4. Setting and data source . . . . . . . . . . . . . . . . . . . . . . . . . . . . . . . . . . . . . . . . . . . . . . . . . . . . . . . . . . . 206
8.5. Industry selection . . . . . . . . . . . . . . . . . . . . . . . . . . . . . . . . . . . . . . . . . . . . . . . . . . . . . . . . . . . . . . . . . . . . 207
8.6. Measures . . . . . . . . . . . . . . . . . . . . . . . . . . . . . . . . . . . . . . . . . . . . . . . . . . . . . . . . . . . . . . . . . . . . . . . . . . . . . . . . . 210
8.7. Model . . . . . . . . . . . . . . . . . . . . . . . . . . . . . . . . . . . . . . . . . . . . . . . . . . . . . . . . . . . . . . . . . . . . . . . . . . . . . . . . . . . 214
8.8. Results and discussion . . . . . . . . . . . . . . . . . . . . . . . . . . . . . . . . . . . . . . . . . . . . . . . . . . . . . . . . . . . . . 220
8.9. Conclusion . . . . . . . . . . . . . . . . . . . . . . . . . . . . . . . . . . . . . . . . . . . . . . . . . . . . . . . . . . . . . . . . . . . . . . . . . . . . . . 223
9. Offshoring and the Global Sourcing of Talent: Understanding the New Frontier of Internationalization
9.1. Hypotheses development . . . . . . . . . . . . . . . . . . . . . . . . . . . . . . . . . . . . . . . . . . . . . . . . . . . . . . . . 229
9.2. Methods . . . . . . . . . . . . . . . . . . . . . . . . . . . . . . . . . . . . . . . . . . . . . . . . . . . . . . . . . . . . . . . . . . . . . . . . . . . . . . . . . . 238
9.3. Model . . . . . . . . . . . . . . . . . . . . . . . . . . . . . . . . . . . . . . . . . . . . . . . . . . . . . . . . . . . . . . . . . . . . . . . . . . . . . . . . . . . . . 241
9.4. Results and discussion . . . . . . . . . . . . . . . . . . . . . . . . . . . . . . . . . . . . . . . . . . . . . . . . . . . . . . . . . . . . . 244
9.5. Conclusion . . . . . . . . . . . . . . . . . . . . . . . . . . . . . . . . . . . . . . . . . . . . . . . . . . . . . . . . . . . . . . . . . . . . . . . . . . . . . . 247
10. Offshoring in Spain: Evolution and Prospects of Service Offshoring in 2008
10.1. The ORN study . . . . . . . . . . . . . . . . . . . . . . . . . . . . . . . . . . . . . . . . . . . . . . . . . . . . . . . . . . . . . . . . . . . 252
10.2. The spanish sample . . . . . . . . . . . . . . . . . . . . . . . . . . . . . . . . . . . . . . . . . . . . . . . . . . . . . . . . . . . . . 253
10.3. Offshoring in Spain: survey results . . . . . . . . . . . . . . . . . . . . . . . . . . . . . . . . . . . . . . 256
10.4. Conclusions . . . . . . . . . . . . . . . . . . . . . . . . . . . . . . . . . . . . . . . . . . . . . . . . . . . . . . . . . . . . . . . . . . . . . . . . . 269
11. The Offshoring of High-Value Services and the Globalization of Capability Sourcing
11.1. From sweatshops to R&D labs . . . . . . . . . . . . . . . . . . . . . . . . . . . . . . . . . . . . . . . . . . . . . . 275
11.2. Coping with the globalization of capability sourcing . . . . . . . . . . . . 278
11.3. Conclusion: from the globalization of capability sourcing
to the globalization of innovation . . . . . . . . . . . . . . . . . . . . . . . . . . . . . . . . . . . . . . . . . 285
12. Concluding Thoughts . . . . . . . . . . . . . . . . . . . . . . . . . . . . . . . . . . . . . . . . . . . . . . . . . . . . . . . . . . . . . . 287
References . . . . . . . . . . . . . . . . . . . . . . . . . . . . . . . . . . . . . . . . . . . . . . . . . . . . . . . . . . . . . . . . . . . . . . . . . . . . . . . . . . . . . . . . . 293
List of Figures and Graphs . . . . . . . . . . . . . . . . . . . . . . . . . . . . . . . . . . . . . . . . . . . . . . . . . . . . . . . . . . . . . 305
List of Tables . . . . . . . . . . . . . . . . . . . . . . . . . . . . . . . . . . . . . . . . . . . . . . . . . . . . . . . . . . . . . . . . . . . . . . . . . . . . . . . . . . . . . 309
Index . . . . . . . . . . . . . . . . . . . . . . . . . . . . . . . . . . . . . . . . . . . . . . . . . . . . . . . . . . . . . . . . . . . . . . . . . . . . . . . . . . . . . . . . . . . . . . . . . . 311
About the Authors . . . . . . . . . . . . . . . . . . . . . . . . . . . . . . . . . . . . . . . . . . . . . . . . . . . . . . . . . . . . . . . . . . . . . . . . . . . 321

[ 11 ]
Introduction
Broadly defined, offshoring refers to a company’s practice of mi-grating activities to offshore locations outside of its country of ori-gin (Venkatraman 2004). Companies have traditionally adopted an offshore strategy for manufacturing work and blue-collar jobs, especially those in Western economies. However, recent advances in information and communication technologies (ICTs) have sig-nificantly lowered the so-called cost of distance (Ghemawat 2007) and provided new opportunities to create value remotely (Zaheer and Manrakhan 2001; Zaheer and Zaheer 2001), leading to the emergence of a novel type of offshoring. Companies now have the potential to relocate worldwide business processes that until recently were considered to be classic white-collar jobs performed exclusively in the home country. among these business activities are call-center customer support, transaction processing, and data management, to name a few.
although this second wave of offshoring was first limited to the migration of contact centers and administrative and IT functions, it now increasingly includes product development activities such as r&d, product design, and engineering services. The reloca-tion of these activities, conventionally considered to be the critical value-generating activities of most enterprises, represents a ma-jor geography-related change in the organization of corporations (Venkatraman 2004). as a matter of fact, this increasing phenom-enon has rapidly attracted the attention of the business world, wide media coverage, and diffuse political concern (Blinder 2006; Engardio, Bernstein and Kripalani 2003; Hamm 2007; Hubbard 2006; Mankiw and Swagel 2006; Taylor 2006).
low-cost emerging economies provide competitive alternative destinations for Western companies to relocate many value activi-ties that could previously only be performed in the home country (Farrell 2004; Karmarkar 2004). The more pessimistic Western analysts have suggested that the migration of these white-collar
[ 12 ] offshoring in the global economy
jobs to offshore countries is the beginning of an ill-fated service revolution that could hamper developed economies, both socially and economically (levy 2005; Samuelson 2004). The more opti-mistic analysts, on the other hand, focus instead on the increasing opportunities available to Western companies to boost their prof-its, and to their Western workers to upgrade their capabilities and remain competitive in a globalized labor market (Bhagwati et al. 2004; Farrell 2005; Feenstra and Hanson 1996a, 1996b, 1999).
The offshoring of manufacturing facilities and blue-collar jobs has been extensively studied by management and economics scholars, and is central to several international business theories on the for-eign direct investment of firms (Hennart 1982; Johanson and Vahlne 1977; Buckley and Casson 1976). With the current offshoring wave, after an initial period of limited consideration, scholars are now in-creasingly directing their research efforts towards this emerging phe-nomenon (amiti and Wei 2005, 2006; doh 2005; Farrell, laboissière and rosenfeld 2006; Parkhe 2007). In fact, a number of Special Issues focusing on this subject have recently appeared in leading journals. However, it has not been easy to develop a formal and widely accept-ed definition of offshoring. let us now look at why this is.
The term offshoring is generally used to describe a multitude of scenarios, and different authors provide different definitions of the term (Jahns, Hartmann and Bals 2006). The lack of a widely accepted definition certainly represents a barrier to the development of homogeneous incremental contributions aimed at furthering our understanding of this new phenomenon. For instance, Farrell et al. (2006) call offshoring the business practice that focuses on the relocation of labor-intensive service industry functions to locations remote to the business center, while robin-son and Kalakota (2004) assert that offshoring is often used sim-ply as a new term for outsourcing to very remote locations.
Three main areas of debate can be identified, especially in the managerial field. First, when talking about offshoring, some au-thors automatically exclude the relocation of manufacturing ac-tivities, restricting their focus to highly skilled service functions. While the majority of authors explain this restriction by providing a historical evolution of the international relocation of activities (Bunyaratavej, Hahn and doh 2005; dossani and Kenney 2003;
introduction [ 13 ]
Stringfellow et al. 2008), others associate the term offshoring di-rectly with the relocation of service activities (Farrell et al. 2006; robinson and Kalakota 2004).
Second, scholars often talk about offshoring only when the ac-tivities being relocated migrate from high-cost Western countries to low-cost geographically distant regions (Blinder 2006; Farrell et al. 2006). although recent research confirms that this repre-sents the bulk of the migration occurring, we should remember that companies also relocate their activities to closer countries that offer comparatively lower costs or better resources and that such migration should be considered part of the current offshor-ing phenomenon. as for cost differentials, it is misleading to re-duce the offshoring wave to a migration from high-cost to low-cost countries. Indian companies, for example, have already started reinvesting their earnings in foreign countries by opening subsidi-aries in key areas of the United States in order to exploit potential knowledge spillovers, increase their legitimacy within the indus-try, and thus attract more U.S. clients. as for the European Union, Southern and Eastern European countries represent a near-shore competitive alternative for several Northern European compa-nies that prefer to relocate their activities closer to their business centers (Marin 2006).
Third, many authors restrict offshoring to the international outsourcing of activities, thus excluding the captive solution as an offshoring alternative. It is true that the topic of offshoring is “deeply interrelated with the make-or-buy decision, as sourcing decisions in general have their origins in make/buy alterna-tives” (Jahns et al. 2006, 218). However, significant confusion arises from the lack of consensus on the terminology used. out- sourcing, a practice that currently represents a very important strategic option for companies (Gottfredson, Puryear and Phillips 2005; diromualdo and Gurbaxani 1998), basically consists of turning over selected parts of a firm’s processes or functions to an external third-party provider for an agreed period of time, usually for at least few years, in exchange for monetary payments (dutta and roy 2005; Pfannenstein and Tsai 2004). When the third-party provider is located in a foreign country, the terms generally used to describe this case are international outsourcing, offshoring out-
[ 14 ] offshoring in the global economy
sourcing, or cross-border outsourcing (arons, Clemons and reddy 2005; doh 2005; dutta and roy 2005). although limiting their research to the international outsourcing of services, some authors (Kedia and lahiri 2007) acknowledge that the spectrum of alternatives includes the practice of firms of setting up their own centers in foreign countries through captive offshoring, while others simply define offshoring with the international outsourcing alternative (Pfannenstein and Tsai 2004). This is particularly common in the information systems and operations management literature.
In summary, there is currently a lack of consensus on the termi-nology used to describe the increasing phenomenon of offshoring, most likely as a direct consequence of the early stage of the offshor-ing literature. The hope is that as the field consolidates, scholars will increasingly adopt a uniform terminology that will ease the understanding of the different contributions on the subject and, most importantly, lead to comparability across studies.
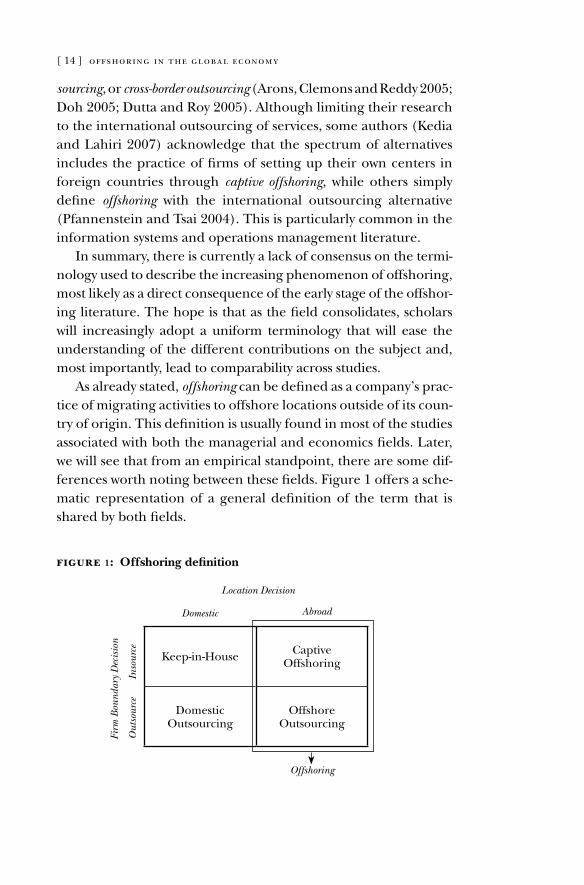
as already stated, offshoring can be defined as a company’s prac-tice of migrating activities to offshore locations outside of its coun-try of origin. This definition is usually found in most of the studies associated with both the managerial and economics fields. later, we will see that from an empirical standpoint, there are some dif-ferences worth noting between these fields. Figure 1 offers a sche-matic representation of a general definition of the term that is shared by both fields.
figure 1: Offshoring definition
Keep-in-House Captiveoffshoring
domesticoutsourcing
offshoreoutsourcing
Location Decision
Domestic
Firm
Bou
ndar
y D
ecis
ion
Out
sour
ceIn
sour
ce
Abroad
Offshoring
introduction [ 15 ]
Clearly, offshoring per se does not represent anything new in the international business scenario. In fact, Western companies started migrating manufacturing work and blue-collar jobs long ago. What is more recent is the shift abroad of a series of white-collar business processes that until a few decades ago could only be carried out in the home country (dossani and Kenney 2006).
recent technological developments have provided companies with new opportunities to create value by globally relocating indi-vidual activities where they can be most efficiently executed (Za-heer and Manrakhan 2001; Zaheer and Zaheer 2001). although functions like call-center customer support or transaction process-ing have been traditionally performed at home, recent techno-logical advances have made it possible for companies to relocate them offshore. Foreign locations, such as India or China, were selected on the basis of their capacity to offer well-trained work-ers that perform these tasks as well as, if not even better than, the corresponding white-collar workers at home, while offering more competitive wages. The term business process offshoring (BPo) has thus been increasingly used to refer to the practice of moving ICT-enabled back-office business processes to offshore locations, usually at a low-cost (dossani and Kenney 2003).
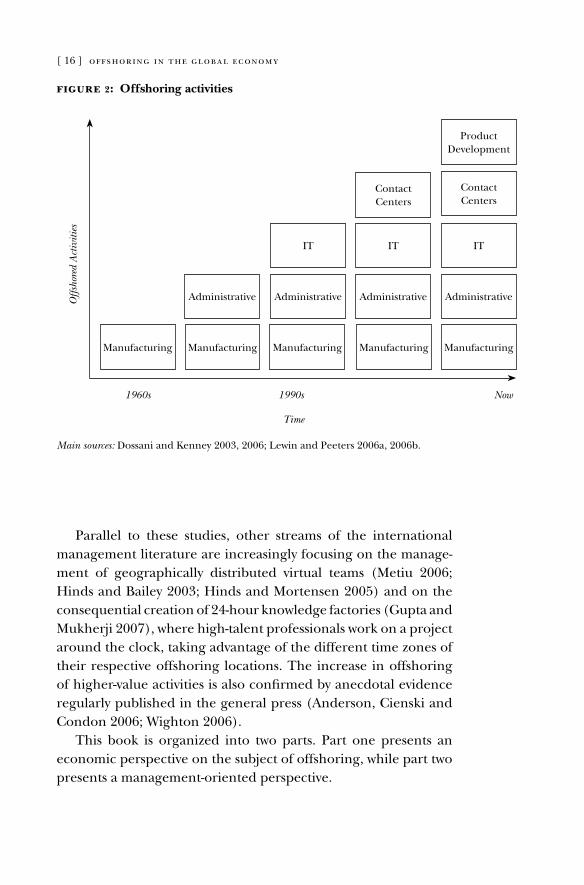
Starting with the relocation of fairly commoditized functions, companies soon discovered the potential of these unexploited pools of talents (Farrell 2004). Thus, they have rapidly started offshoring more complex and knowledge-intensive activities. Figure 2 summarizes insights from recent research (dossani and Kenney 2003, 2006; lewin and Peeters 2006b, 2006c) document-ing the rapid inclusion of product development activities (i. e., r&d, product design, and engineering services) in the offshor-ing wave.
This finding is consistent with other studies by dossani and Kenney (2007), Henley (2006) and levy (2005) and corrobo-rate that North american and Western European companies, which are responsible for most of the world’s offshoring prac-tices (agrawal, Farrell and remes 2003; Marin 2006), are in-creasingly moving higher-skilled knowledge-intensive activities abroad.
[ 16 ] offshoring in the global economy
Parallel to these studies, other streams of the international management literature are increasingly focusing on the manage-ment of geographically distributed virtual teams (Metiu 2006; Hinds and Bailey 2003; Hinds and Mortensen 2005) and on the consequential creation of 24-hour knowledge factories (Gupta and Mukherji 2007), where high-talent professionals work on a project around the clock, taking advantage of the different time zones of their respective offshoring locations. The increase in offshoring of higher-value activities is also confirmed by anecdotal evidence regularly published in the general press (anderson, Cienski and Condon 2006; Wighton 2006).
This book is organized into two parts. Part one presents an economic perspective on the subject of offshoring, while part two presents a management-oriented perspective.
figure 2: Offshoring activities
1960s 1990s
Time
Now
Productdevelopment
Contact Centers
Contact Centers
ITIT IT
Manufacturing
administrative administrativeadministrative administrative
Manufacturing Manufacturing Manufacturing Manufacturing
Offs
hore
d A
ctiv
ities
Main sources: dossani and Kenney 2003, 2006; lewin and Peeters 2006a, 2006b.
introduction [ 17 ]
The economic perspective section starts with some measure-ment observations in chapter 1. We will see here that it is not easy to measure offshoring directly, and may be more advisable to do so indirectly. Indeed, it is through the import content of trade that we usually get a comprehensive measurement of offshoring. Chapter 2 reviews the fundamental economic literature. Here we will show the heterogeneity of the contributions in the literature, and the ambiguity of the results. For the ease of exposition, we have divided contributions into those concerned with aggregate data (e. g., country, industry) and those dealing with disaggregate data (e. g., firms, individuals). Chapter 3 presents the evolution of materials and services offshoring over the past few decades. To do this, we rely on data from different countries using the organi-sation for Economic Co-operation and development (oECd) database (recently released) for the years 1995, 2000 and 2005. These data show that large economies have low-intensity indices on offshoring. First places are dominated by very small countries, but some special cases, such as Germany, Canada or Spain, are highlighted. as expected, offshoring is more consolidated in manufacturing industries than in service industries. Furthermore, service offshoring, while much smaller than material offshoring, is growing faster. Chapter 4 goes one step further and deals with the impact of offshoring on employment through econometric analysis.1 offshoring has a direct negative impact on employment but also has an indirect positive impact through improvements in productivity. The impact that ends up dominating is an empiri-cal issue that we will look at in this chapter. Contrary to common belief, the net employment effects of offshoring are negligible. on the other hand, positive productivity effects are potentially achievable. We conclude the economic perspective in chapter 5, with some reflections on the underlying socioeconomic debate on offshoring.
The second part of the book deals with the management per-spective. In chapter 6 we provide a review of the literature on this
1 Here we present the case for Japan, since other works have already covered oth-er major economies (e. g., the United States, Germany, France, United Kingdom or Spain).
[ 18 ] offshoring in the global economy
phenomenon and, again, have found a world of diversity. We will see, however, that the case study approach has become a major methodology on the subject so far. In chapter 7 we report the main findings of the offshoring research Network (orN) (an in-ternational network of researchers and practitioners to which our own group of researchers belongs) in a comparative fashion cov-ering the United States and several major European economies. Chapters 8 and 9 study the drivers of service offshoring in the United States and European Union, respectively. U.S. data come from foreign direct investment (FDI) information and looks at the increasing role of knowledge seeking versus efficiency seeking in the rationale for offshoring. The E.U. data comes from the orN and looks at the increasing scarcity of talent and the correspond-ing global sourcing as a motivation for offshoring of high-value-added service activities. Chapter 10 uses local data from the orN survey to study the evolution and prospects of offshoring in Spain. We close the second part of the book with chapter 11, where we offer some reflections on the capability development needed in companies to effectively deal with the increasingly important phe-nomenon of the offshoring of service activities. Finally, we present some concluding thoughts about the book.

ParT oNE
SoCIoECoNoMIC EFFECTS oF oFFSHorING

[ 21 ]
Measurement and Effects
a new and innovative way of doing business has emerged in recent times: offshoring. Usually offshoring comes hand-in-hand with some degree of outsourcing, so it is common to find real-life combinations of both business practices. all too often, the mass media warns us of the dangers these new practices could bring to globalized economies. These widespread fears entail, above all, the millions of jobs soon to be moved from developed economies to less developed ones or, more frequently, from high-wage to low-wage countries. Consequently, the underlying perspective here coincides with that of labor economics. We are interested in dissecting the insights gained from specialized literature while trying to assess offshoring and its relationship with labor markets. But first we have to define the concept as understood within the economics discipline.
offshoring, and its related counterpart, outsourcing, have long been in practice, mainly in the form of comparative advantages. If we define offshoring merely as the relocation of jobs outside of the national boundaries in search of lower wages, we can see how this eventually exploits comparative advantages through a cheaper workforce and cost savings. More precisely, offshoring refers to the geographic location where the service or production takes place, whereas outsourcing refers to the ownership of the means of pro-duction (in-house or third-party). In this context, we have become familiar with terms such as offshore outsourcing (or international out-sourcing) and in-house offshoring. These can also be referred to as offshoring in the broad and narrow (or strict) sense, respectively.
as policymakers, if we were left to decide whether our national production should be carried out abroad while local workers join the pool of unemployed, we might think twice. However, if we were to foresee increases in domestic productivity due to offshoring- related activities, we might face a more hopeful scenario. Indeed, productivity gains for companies engaged in any form of offshoring
1.
[ 22 ] offshoring in the global economy
could translate to price discounts and a boost in demand, thus positively affecting employment. But how long would it take for companies to seize the benefits, if any? and would an early set-back predispose people to see offshoring as a real threat?
These are interesting questions, but our focus lies mainly on la-bor issues. For this subject, empirical works have failed to provide a definite and clear answer. as proven by the relatively scarce, yet increasing, literature produced to date, the subject remains some-what of a mystery. Therefore, a thorough review on the evolution of the offshoring phenomenon and the methodologies involved, as well as the controversies surrounding the issue, is needed. For instance, properly measuring offshoring is still a difficult task when it comes to applied research.
In recent times it has been customary to interpret offshoring in terms of international trade, particularly intermediate trade (inputs), whether at the industry or firm level. For this purpose, a series of indices have been developed to account for the phe-nomenon in an extensive and somewhat homogeneous way. despite their limitations, all of these indices attempt to explain the process of offshoring through the import content of domestic variables such as total production or total inputs (Feenstra and Hanson 1996a, 1996b; Hummels et al. 2001, among many oth-ers). as a result, it is also possible to split the previous definition into the concepts of material (or production) offshoring and service off- shoring. Both are, respectively, the imported content of materials and services in the total production or total use of inputs.
The main concerns within the economics literature have to do with potential dislocations within labor markets and the resulting social unease. So far, these effects have been analyzed in terms of employment and productivity, yet the evidence still proves to be lacking and inconclusive. With the implementation of homogene-ous indices it is easy to overcome issues of comparability. However, as the subject reaches new horizons and different levels of aggre-gation are considered (e. g., industry, firm, establishment), the results become less and less comparable. This does not prevent, however, the realization that employment effects may not be so negative (or of a considerable size), while on the other hand pro-ductivity gains seem easily achievable.
measurement and effects [ 23 ]
It is therefore important to ask questions that could shed some light on the elusive subject of offshoring and its consequences. For instance, does the statement “bigger countries offshore the most” hold true (see amiti and Wei 2005)? If we stick to our previously mentioned definition, we might discover that smaller countries are more dependent on intermediate trade. Furthermore, does the manufacturing sector hold more weight over the services sector when it comes to offshoring? and what about the different kinds of offshoring that are taking place? do material and service off- shoring differ much in their reach? Moreover, what is to be said about the prophecy that service offshoring is the messiah of a new technological revolution (Blinder 2006)? a statistical analysis of this sort will help us frame the issue more clearly for what comes next.
additionally, an econometric analysis will provide solid ground for dissecting the employment and productivity effects of offshoring. For employment issues in particular, the literature has evolved towards different research interests. at first, studies focused on explaining the differences offshoring presented in terms of relative wages or employment shares of different skilled workers. later, once offshoring was better defined, empirical ef-forts headed towards a more direct understanding of the phenom-enon. What is the real impact of offshoring at the aggregate level? Should we expect productivity gains as a natural result? These two questions are the underlying riddle of the first part of this book.
1.1. Measurement
How should we define offshoring in empirical terms? In other words, how can we estimate the theoretical definition of offshoring in a quantitative manner? roughly speaking, offshoring can be mea- sured directly or indirectly, yet the lack of reliable official records suggests that indirect measures should be considered to a greater extent. Furthermore, given our research objectives and data con-straints, we might want to look at data from a variety of levels includ-ing industry, firm, plant, or even individual. of course, a somewhat washed out effect of offshoring is expected as we consider higher levels of aggregation, so the final effect would be the change in
[ 24 ] offshoring in the global economy
composition of employment among sectors. Conversely, the greater we look in detail (e. g., establishment level), the more offshoring would be negatively related to employment in the short term.
Media noise surrounding the subject of offshoring is con-stantly setting new trends and reshaping the way we do business. occasionally, it even changes the way policymakers address the issue, out of fear of political backlash. News about millions of jobs moving abroad can set off alarms in the political arena, or cause animal spirits to shake the economy unnecessarily in the private sector. We have a legitimate reason to believe that numbers and estimates should be looked at with special care.
Indeed, with offshoring the observer can change the object he or she observes.2
1.1.1. A word about data qualityIn the modern age of high-speed communications, words of-
ten lose their meaning and numbers can be misinterpreted. This is a pernicious yet natural side effect of globalization, and compels us to further analyze available data to get a clearer picture of the phenomenon. raw data are sometimes difficult to access, and with the little we are able to obtain, relevant facts can often remain hid-den. Before going over the different kinds of measures that could better approximate offshoring through indirect indicators, we will outline several data sources and their reliability.
Kirkegaard (2007) breaks down data sources for offshoring into three empirical hierarchies. The lowest tier encompasses the estimations and projections made by consulting companies. although these reports (Forrester 2004; McKinsey 2003, for in-stance) seek to set new trends using continuous feedback with the private sector, they often have a limited scope and are lacking in methodology. These studies often show selection bias in the interviews, and a resulting lack of representation in those small samples. a notable example is that by Forrester research (2004), which forecasts that 3.3 million U.S. jobs will move abroad by the
2 Interestingly, Von Mises and austrian scholars would say the economic discipline is in general subject to this fallacy. Humans are too complex and far too self-conscious to not change their behavior to some degree by the very act of observation.
measurement and effects [ 25 ]
year 2015. But 3.3 million is peanuts compared to the 160 million U.S. jobs projected by the Bureau of labor Statistics to be avail-able for the same year, and the 35 million jobs already created over the last decade in the U.S. labor market.
The second tier of data includes estimates made by the press, usually using public and verifiable sources. once a company makes a decision and is ready to implement it, it usually announces its plans publicly as part of its marketing campaign. However, in re-cent times and because of the negative connotation that equates offshoring with job loss, companies are more reluctant to publi-cize job shifts to foreign countries. In a related matter, politicians’ attention to offshoring is closely connected to the electoral cycle. Mankiw and Swagel (2006, 1030) unearthed a clear pattern of the ups and downs of offshoring and outsourcing in four major U.S. newspapers. according to the study, interest sharply peaked be-fore the 2004 election, only to drop to previous levels immediately afterward. In general, while not perfect, press releases represent a more objective group in this data hierarchy. The report presented by the European Foundation for the Improvement of living and Working Conditions (2004) is a good example.
Finally, the series of indirect measures discussed in section 1.1.2 are at the top of this ranking. as shown, official country records and renowned international organizations like the International Monetary Fund (IMF) or the oECd, supply the raw data needed to develop a reliable indirect measure of offshoring. although ac-ademic research to date lags behind that presented by the other two sources, it has recently been shown to be fairly productive and with many research possibilities. let us now turn to studying the tricky issue of measurement.
1.1.2. Measuring offshoring: indirect indicatorsassessing the direct impact of offshoring on labor markets is a
difficult, if not impossible, task. Just imagining what it would take to come up with a direct and comparable index for all industries (not to mention all firms) feels like a hopeless endeavor. a lack of official data and an ambiguous understanding of the subject pose the principal obstacles. The exhaustive oECd report (2007) lists most of the known direct and indirect measures of offshoring, yet
[ 26 ] offshoring in the global economy
as we will see, indirect measures may be more suitable (or feasi-ble) for research purposes.
Proposed direct indicators of offshoring, using the broad or narrow definition (and equally valid for production of goods and services), deal chiefly with data on production, number of employ-ees, FDI, exports, and imports. The point is to identify changes in any of these variables due to the relocation of workers. Keep in mind that creating new foreign jobs alone, without reducing do-mestic activity, is not a representation of offshoring or outsourcing. likewise, a job lost because of domestic outsourcing is necessarily gained in another sector of the domestic economy and, therefore, not part of the definition. This same report takes into account the many drawbacks in using direct measures to gauge the impact off offshoring on labor markets. aside from the fact that some data might overlook drops in the number of jobs due to offshoring, other important limitations exist. according to the oECd, some of these are: changes in the classification of firms, problems with confidentiality, subcontractors that go abroad with their clients, and successive small-scale relocations.
let us move on to examine the main indirect indicators pro-posed in the literature. an important decision researchers fre-quently face is choosing the level of aggregation to study. This is a bit arbitrary since, as mentioned previously, the more in depth we go the more we expect to find a negative relationship between employment and offshoring in the short-term. Furthermore, when looking at firm or establishment data, it is important not to lose sight of ownership status. as we later proceed to review major empirical contributions, we will see that offshoring measures are plentiful and not particularly homogeneous, especially at the dis-aggregate level. on the other hand, more aggregate figures may not take into account certain industries or companies that show a higher propensity to offshore. These phenomena are commonly referred to as aggregation and sector bias.3 Nevertheless, most of the
3 For sector bias see arndt (1997, 1998, 1999). Factor bias is yet another idea that refers to the propensity (or bias) of certain production factors to be outsourced. For instance, low-skill activities are more prone to go offshore due to potential labor cost gains (Feenstra and Hanson 1996a, 1996b, 1997, 1999). also, see Kohler (2001) for a specific-factors view on outsourcing. See also Krugman (2000) and leamer
measurement and effects [ 27 ]
time the analysis is constrained by data availability, and the picture sometimes gets blurry when handling extremely disaggregated data. Next, we will consider in detail several industry-level mea- sures. These measures were formerly conceived, display certain ho-mogeneity, and set a trend for future empirical works, for any level of data.
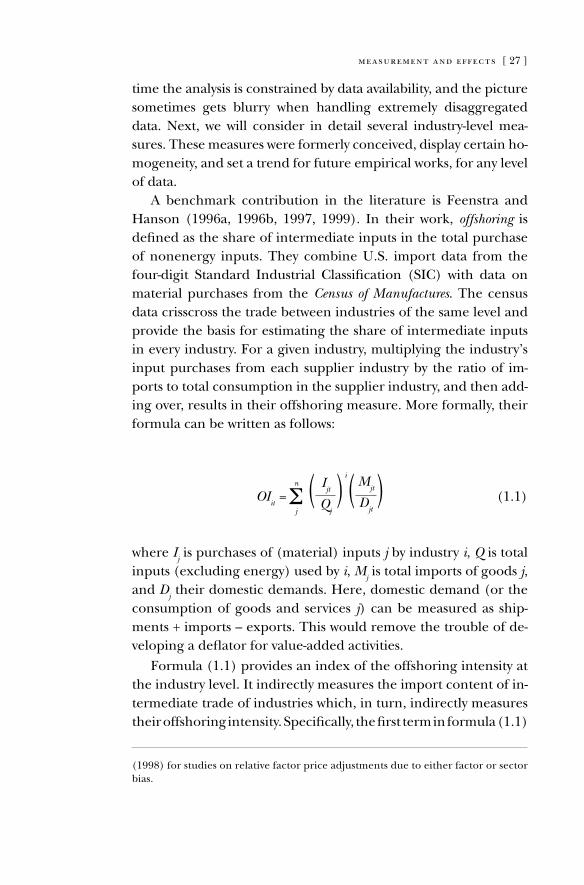
a benchmark contribution in the literature is Feenstra and Hanson (1996a, 1996b, 1997, 1999). In their work, offshoring is defined as the share of intermediate inputs in the total purchase of nonenergy inputs. They combine U.S. import data from the four-digit Standard Industrial Classification (SIC) with data on material purchases from the Census of Manufactures. The census data crisscross the trade between industries of the same level and provide the basis for estimating the share of intermediate inputs in every industry. For a given industry, multiplying the industry’s input purchases from each supplier industry by the ratio of im-ports to total consumption in the supplier industry, and then add-ing over, results in their offshoring measure. More formally, their formula can be written as follows:
OIit =
n
Σj
( Ijt
Qj
)i(Mjt
Djt) (1.1)
where Ij is purchases of (material) inputs j by industry i, Q is total
inputs (excluding energy) used by i, Mj is total imports of goods j,
and Dj their domestic demands. Here, domestic demand (or the
consumption of goods and services j) can be measured as ship-ments + imports – exports. This would remove the trouble of de-veloping a deflator for value-added activities.
Formula (1.1) provides an index of the offshoring intensity at the industry level. It indirectly measures the import content of in-termediate trade of industries which, in turn, indirectly measures their offshoring intensity. Specifically, the first term in formula (1.1)
(1998) for studies on relative factor price adjustments due to either factor or sector bias.
[ 28 ] offshoring in the global economy
stems from the census data (or input-output tables), while the sec-ond term, which is an economy-wide import share, is obtained from trade data. Conveniently, this expression serves as a measure for both the traditional offshoring of materials and the more fash-ionable offshoring of services (yet Feenstra and Hanson confine their analysis to the former).
It is also useful to split offshoring into narrow and broad mea- sures. The narrow measure is restricted to imported intermedi-ate inputs from the same two-digit industry, whereas the broad measure includes all other industries as well. In addition, the dif-ference between broad and narrow measures, which represents all imported intermediate inputs from outside the two-digit purchas-ing industry, is an alternative when it comes to capturing the true nature of offshoring.
But why should we use this particular definition? Nowadays, importing trade represents an important amount of intra- and interfirm trade. It is then a fair proxy of offshoring while data are relatively easy to find. However, a common drawback to all measures relying on import shares is that offshoring does not necessarily imply an increase of imports, or vice versa. In effect, if a local exporting firm decides to move part of its production abroad and continues exporting it from a foreign country, this would not translate into a drop in imports to the parent firm. rather, it would represent a drop in exports. likewise, an in-crease in a country’s imports due to more favorable terms of trade should not be linked in any way to an expansion of off- shoring from local firms. In the next section, we will show that the analyses by Feenstra and Hanson have motivated many others in the years following their studies. The basic idea of their work is that it is the composition of trade, and the share of intermedi-ate inputs in particular, that matters in the end for wages and employment. In their own words, “trade in intermediate inputs can have an impact on wages and employment that is much greater than for trade in final consumer goods” (Feenstra and Hanson 2001, 1).
Many of the latest Heckscher-ohlin type of trade models that consider a positive welfare effect of offshoring (yet ambigu-ous effects on factor prices) use Feenstra and Hanson’s analysis
measurement and effects [ 29 ]
as a starting point.4 The debate here continues, as Feenstra and Hanson claim that wage differentials might follow after “factor-bias in technological change” has taken place. other views hold sec-tor bias as the driving force behind wage differentials (see arndt 1997, 1998, 1999).
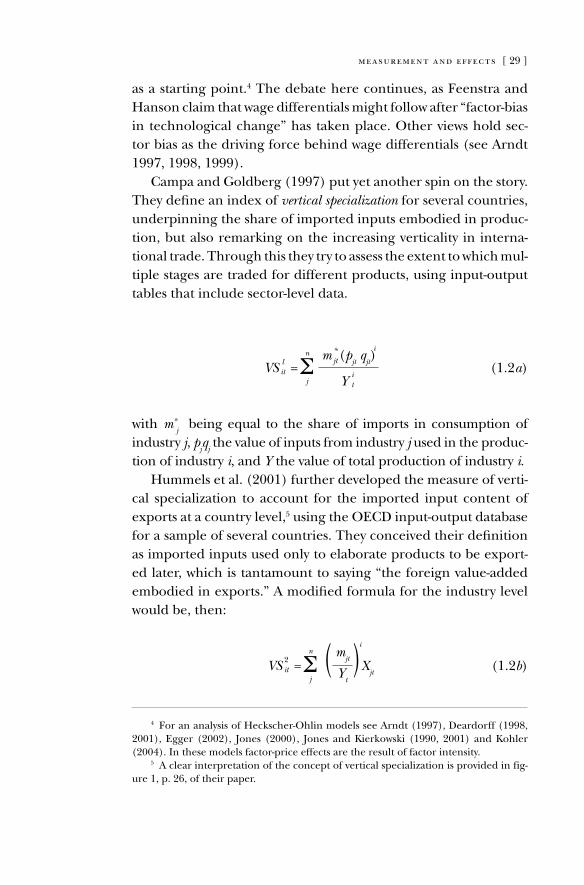
Campa and Goldberg (1997) put yet another spin on the story. They define an index of vertical specialization for several countries, underpinning the share of imported inputs embodied in produc-tion, but also remarking on the increasing verticality in interna-tional trade. Through this they try to assess the extent to which mul-tiple stages are traded for different products, using input-output tables that include sector-level data.
VS lit =
n
Σ j
m *
jt (pjt q
jt)i
Yit
(1.2a)
with m*j being equal to the share of imports in consumption of
industry j, pjq
j the value of inputs from industry j used in the produc-
tion of industry i, and Y the value of total production of industry i.Hummels et al. (2001) further developed the measure of verti-
cal specialization to account for the imported input content of exports at a country level,5 using the oECd input-output database for a sample of several countries. They conceived their definition as imported inputs used only to elaborate products to be export-ed later, which is tantamount to saying “the foreign value-added embodied in exports.” a modified formula for the industry level would be, then:
VS 2it =
n
Σ j
( mjt
Yt
)i
Xjt (1.2b)
4 For an analysis of Heckscher-ohlin models see arndt (1997), deardorff (1998, 2001), Egger (2002), Jones (2000), Jones and Kierkowski (1990, 2001) and Kohler (2004). In these models factor-price effects are the result of factor intensity.
5 a clear interpretation of the concept of vertical specialization is provided in fig-ure 1, p. 26, of their paper.
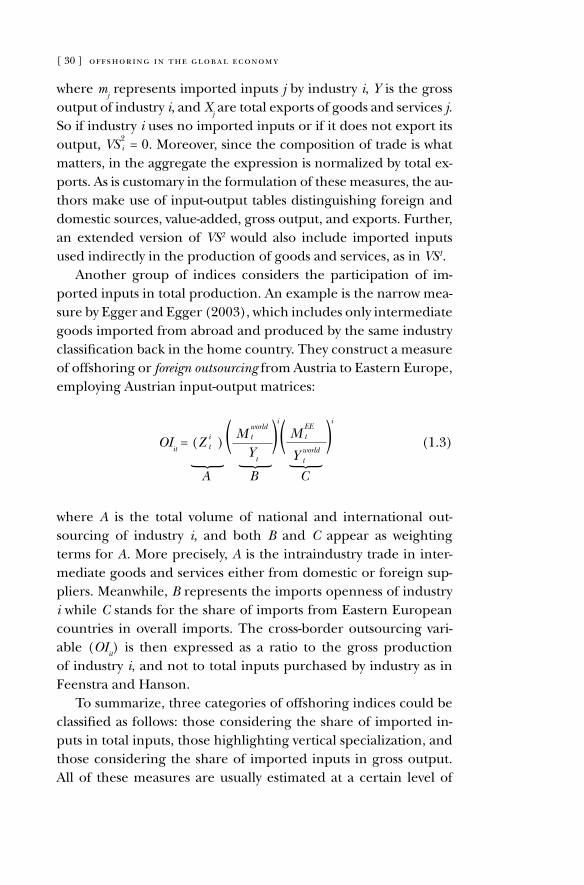
[ 30 ] offshoring in the global economy
where mj represents imported inputs j by industry i, Y is the gross
output of industry i, and Xj are total exports of goods and services j.
So if industry i uses no imported inputs or if it does not export its output, VS2
i = 0. Moreover, since the composition of trade is what matters, in the aggregate the expression is normalized by total ex-ports. as is customary in the formulation of these measures, the au-thors make use of input-output tables distinguishing foreign and domestic sources, value-added, gross output, and exports. Further, an extended version of VS2 would also include imported inputs used indirectly in the production of goods and services, as in VS1.
another group of indices considers the participation of im-ported inputs in total production. an example is the narrow mea- sure by Egger and Egger (2003), which includes only intermediate goods imported from abroad and produced by the same industry classification back in the home country. They construct a measure of offshoring or foreign outsourcing from austria to Eastern Europe, employing austrian input-output matrices:
OIit = (Z it )( M
worldt
Yt
)i( M EEt
Y worldt
)i
(1.3) {
A {
B {
C
where A is the total volume of national and international out-sourcing of industry i, and both B and C appear as weighting terms for A. More precisely, A is the intraindustry trade in inter-mediate goods and services either from domestic or foreign sup-pliers. Meanwhile, B represents the imports openness of industry i while C stands for the share of imports from Eastern European countries in overall imports. The cross-border outsourcing vari-able (OI
it) is then expressed as a ratio to the gross production
of industry i, and not to total inputs purchased by industry as in Feenstra and Hanson.
To summarize, three categories of offshoring indices could be classified as follows: those considering the share of imported in-puts in total inputs, those highlighting vertical specialization, and those considering the share of imported inputs in gross output. all of these measures are usually estimated at a certain level of
measurement and effects [ 31 ]
aggregation (country or industry),6 yet the literature has recently taken a widespread plunge into disaggregated data, which moves the analysis away from input-output tables. of course, future re-search around these measures is expected to be more dehomog-enized as a result of an increased sharing of studies being con-ducted at a disaggregated level. In these studies, evidence shows a pronounced heterogeneity about how to define offshoring.
Examples of these three indices are, respectively, equations (1.1), (1.2) and (1.3). Broadly speaking, all existing measures at the industry level would fall to some extent into one of the three groups. Horgos (2008) considers two additional measures that are not reproduced here: indices considering imported inputs in to-tal imports, and those considering the value added in production. He shows that these two perform rather poorly in a comparative study that considers all five types of indices. We undertake a simi-lar decomposition analysis in chapter 3 to gauge the suitability of the proposed indices.
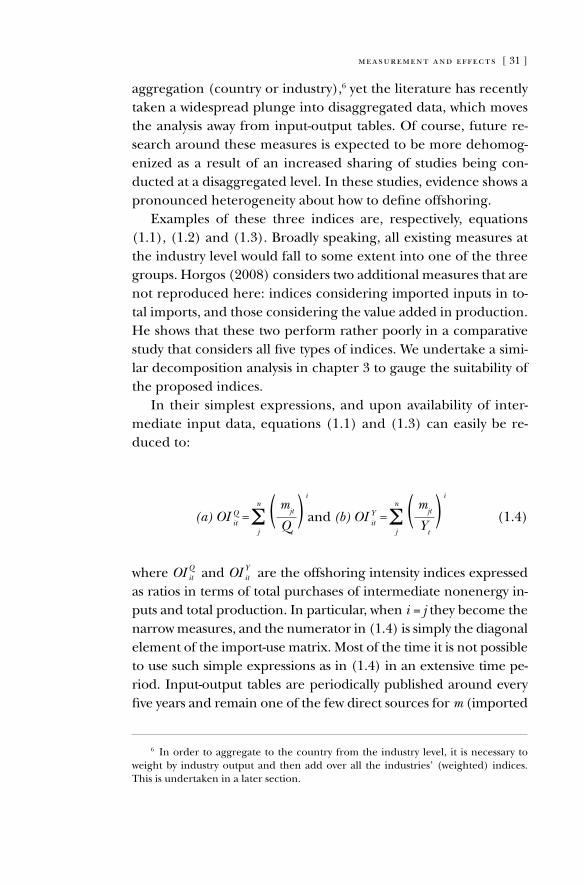
In their simplest expressions, and upon availability of inter-mediate input data, equations (1.1) and (1.3) can easily be re-duced to:
(a) OI Qit =n
Σ j
( mjt
Qt
)i
and (b) OI Yit =n
Σ j
( mjt
Yt
)i
(1.4)
where OI Qit and OI Yit are the offshoring intensity indices expressed as ratios in terms of total purchases of intermediate nonenergy in-puts and total production. In particular, when i = j they become the narrow measures, and the numerator in (1.4) is simply the diagonal element of the import-use matrix. Most of the time it is not possible to use such simple expressions as in (1.4) in an extensive time pe-riod. Input-output tables are periodically published around every five years and remain one of the few direct sources for m (imported
6 In order to aggregate to the country from the industry level, it is necessary to weight by industry output and then add over all the industries’ (weighted) indices. This is undertaken in a later section.
[ 32 ] offshoring in the global economy
intermediate inputs) so far. That is why the numerator in (1.4) is usually estimated through trade data, as in (1.1) and (1.3).
1.2. Possible effects of offshoring
offshoring has been around to some degree since the concept of economic advantage was first mentioned by adam Smith and then further elaborated by david ricardo.7 In fact, comparative advantages are believed to feed the animal spirits that eventually move Smith’s invisible hand; this does not apply to local business- people alone but to international trade as well. ricardo success-fully showed how specialization and trade would allow two na-tions producing the same output in isolation to produce more output using the same factor inputs as before. The importance of ricardo’s argument about comparative advantages could be summarized as follows: in doing what they do best, individuals, businesses, and nations can trade for the rest, therefore achieving efficiency and securing economic growth.
So, how is offshoring related to the good old concept of com-parative advantages? It is becoming evident with globalization that countries with less expensive labor are enjoying a comparative ad-vantage in labor-intensive industries. on the other hand, coun-tries displaying a larger pool of skilled workers, and thus higher relative wages, are prone to developing a comparative advantage in capital-intensive industries. In such a context, barriers to factor mobility, and especially to the labor factor, are surely to be expect-ed because of friction between and within countries. arguably, the subject goes beyond the realm of economics and touches both domestic and international politics. It therefore becomes very im-portant for the political layer of international economies to size up the potential gains from offshoring. accordingly, national gov-ernments could simply stay away and adopt a hands off policy in or-der to let the invisible hand lay out the basis for the countries’ com-parative advantages. Before going into depth about measurement
7 The quintessential references are, of course, “The Wealth of Nations” (1776) and “on the Principles of Political Economy and Taxation” (1817), respectively.
measurement and effects [ 33 ]
issues, let us spend a moment or two on the possible outcomes for employment and productivity.
1.2.1. Employment effectsEmployment goals and unemployment reduction policies are
at the top of government political agendas. Unemployment is one of the most important challenges an individual has to face. a per-son without a job is stripped of the skills that define him or her as a useful member of society. We believe that studying the channel through which employment is impacted by business decisions is well worth our while.
The 2007 oECd report describes offshoring as the result of the interactions between direct investment, subcontracting with nonaffiliated firms, and international trade. Furthermore, it lists all the known short-term employment effects, which can be nega-tive or neutral, direct or indirect. Negative effects occur when a company stops any of its activities in the home country, only to create or subcontract them abroad. Neutral effects cover cases in which direct investment or subcontracting takes place independ-ently of the company’s operations at home. direct effects, such as outright layoffs, are easy to identify, whereas indirect effects are more subtle. For instance, some local subcontractors might be compelled to follow their client abroad, thus potentially aggra- vating the downturn in domestic employment. another important indirect effect is that generated by intrafirm trade between com-panies and their foreign branches. Cheaper intermediate inputs are now available and have come to replace the production previ-ously carried out within national borders. as we will see later, this rationale is embedded in all indirect measures that try to estimate offshoring effects.
If we set a timeline the following premise holds true: the short-er the term considered, the greater the risk of job losses. as a result, this would likely have a negative impact on people’s opin-ion about offshoring. The challenge, then, is to realize the full benefits of offshoring and to be explicit about them, since many of these benefits usually go unnoticed and are not necessarily related to people whose jobs have been lost. This is part of the current heated debate in politics, the big business arena, and the
[ 34 ] offshoring in the global economy
media. However, we might yet discover that offshoring has more to do with plain economics than with business strategies or politi-cal conundrums.
In fact, it is possible to conceive offshoring as the utmost mod-ern expression of economic trade (Mankiw and Swagel 2006), and even in this light it still has a long way to go in order to grow to full maturity. There are, to date, a vast amount of services that would fall under the category of potentially offshoreable. It is indeed reasonable to think that a wider range of tradable goods and services means increased welfare one way or the other. Presumably then, there will be more social benefits to seize when offshoring really takes off. But this welfare improvement comes at the expense of short-run unemployment due to friction in the labor markets. In the immediate term, these social costs might even be greater than the benefits that stem from wage savings and a higher productivity rate.
So, the assumption that offshoring may increase welfare is a reasonable one as it makes previously nontraded services into tradable ones. This also provides opportunities for cheaper im-ported products and services to flood the economy, that is, the same products and services previously produced locally. The harmful effects of an expanding world supply of information tech-nology for the terms of trade of the source country have often been argued. Bhagwati et al. (2004), for example, assert contrarily that this hardly describes the reality of offshoring. Countries like China and India are most likely to remain focused on low-end informa-tion technologies already exported to more developed countries.
additionally, we can see how services are becoming a determi-nant player in this second-generation offshoring (which took over after a first generation chiefly centered on production), since they naturally represent a higher added value. Service activities also imply a considerable dynamic not seen with materials, and this might translate into employment opportunities being fulfilled more rapidly. But let us be clear, not all services can be offshored nor is every service bound to move abroad immediately.
on the other hand, we must not forget that the dynamics of glo-balization and offshoring is a two-way street or, rather, a multiple- lane highway linking far-off economies. Indeed, inshoring can
measurement and effects [ 35 ]
occur at the same time with the expected positive employment effects. relative comparative advantages lead us to believe that provided the country is (relatively) more developed, jobs cre-ated domestically would be higher-value and better paid jobs. as mentioned previously, this transition is not without a temporary adjustment, and if imperfect information or other imperfections should arise, frictional unemployment would follow. But, alas, structural unemployment would also sneak in as an uninvited guest. Not only might unemployment occur because of the move-ment of people between jobs, but also because of the mismatch between the types of jobs available and the skills of the people looking for them. It is then the structure of the economy that decides the extent and nature of the benefits of offshoring (see Bhagwati et al. 2004; and Samuelson 2004, for somewhat oppos-ing views).
Would more flexible markets adjust more easily to exogenous shocks brought about by offshoring? Under this perspective we might presume that anglo-Saxon labor markets with their flex-ible institutions and lenient employment laws ought to enjoy the benefits of offshoring more rapidly. on the other hand, continen-tal European countries have more powerful institutions, such as larger labor unions and strict employment laws, both of which would deter the full potential of productivity gains.8 Seemingly, labor institutions might affect comparative advantages and trade flows among countries (Helpman and Itskhoki 2009). Empirical evidence on this regard, however, is far from definitive.9
Therefore, we may ask ourselves if there is any role for the gov-ernment, aside from unemployment insurance, to cope with the problem of unemployment in a more efficient and sophisticated way. In other words, how can we figure out the existing mismatch while easing the hardships faced by those workers displaced as a result of offshoring? We will discuss this in chapter 5.
8 See for instance the different measures of labor market flexibility developed by Botero et al. (2004).
9 See, for example, the study by Jensen et al. (2006). a more formal approach is the one by Helpman and Itskhoki (2009), which builds on previous studies on trade and unemployment.
[ 36 ] offshoring in the global economy
1.2.2. Productivity effectsThis section focuses on the mid- to long-term, once companies
begin to reap the harvest of offshoring. It is understandable to see why this stage of offshoring commonly escapes the news headlines, as positive effects on employment might take some time to take ef-fect. But the truth is, employment gains and wage increases always follow productivity improvements, and the extent of the final ef-fect would depend on the firms’ wide array of determinants (the scale, the level of capital intensity, existing international links, and experience or know-how, to name a few). all of these determi-nants play their part in capitalizing on offshoring.
Employment creation in the shortest term (if any) as a re-sult of productivity gains is understood as taking place in a dif-ferent sector or, at least, a different activity undertaken by the same firm. Indeed, when firms become more productive they can produce with less (not more), be that capital or labor, while workers are faced with a real threat of unemployment. However, in the longer term, offshoring firms are faced with the scale ef-fect. That is, offshoring-related productivity increases can make firms more efficient and competitive after a while, increasing the demand for output and exerting a positive effect on labor. See olsen (2006) for a complete account of offshoring and produc-tivity.
If we consider reducing wage costs as the main reason to off-shore, we must seriously think about the price cuts likely to take place at home once savings abroad have been achieved. This can take a few months or even up to a couple of years, but it would eventually affect domestic demand and, as expected, the demand for labor. other drivers of offshoring might exert some pressure on productivity—perhaps not as direct as with wage costs—yet in the end, it is all about improving efficiency and productivity. However, the technology channels through which further produc-tivity gains are possible for offshoring companies remains, as these provide access to a larger variety of imported goods and services. Companies engaged in these practices can obtain more advanced technologies more rapidly through imported inputs. This transfer of technology could open new business opportunities, leading to an increase in domestic employment.
measurement and effects [ 37 ]
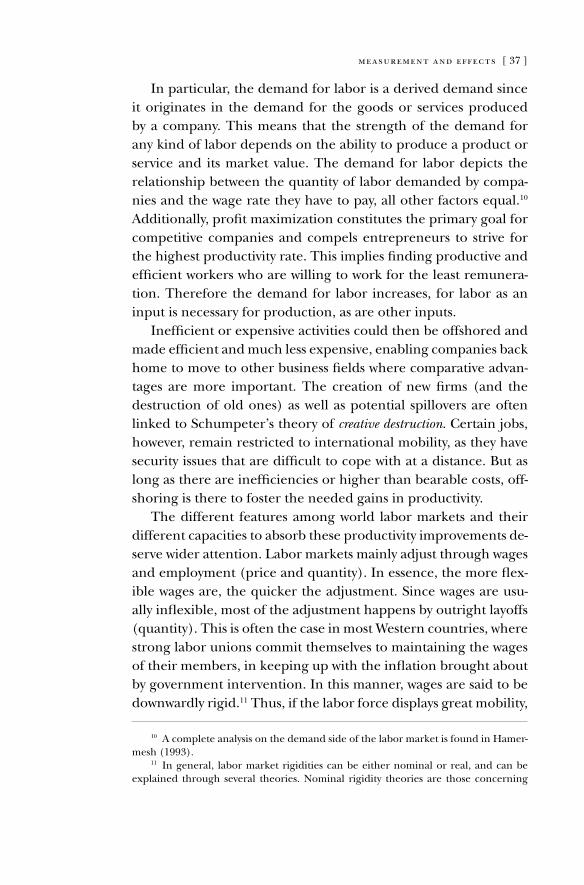
In particular, the demand for labor is a derived demand since it originates in the demand for the goods or services produced by a company. This means that the strength of the demand for any kind of labor depends on the ability to produce a product or service and its market value. The demand for labor depicts the relationship between the quantity of labor demanded by compa-nies and the wage rate they have to pay, all other factors equal.10 additionally, profit maximization constitutes the primary goal for competitive companies and compels entrepreneurs to strive for the highest productivity rate. This implies finding productive and efficient workers who are willing to work for the least remunera-tion. Therefore the demand for labor increases, for labor as an input is necessary for production, as are other inputs.
Inefficient or expensive activities could then be offshored and made efficient and much less expensive, enabling companies back home to move to other business fields where comparative advan-tages are more important. The creation of new firms (and the destruction of old ones) as well as potential spillovers are often linked to Schumpeter’s theory of creative destruction. Certain jobs, however, remain restricted to international mobility, as they have security issues that are difficult to cope with at a distance. But as long as there are inefficiencies or higher than bearable costs, off-shoring is there to foster the needed gains in productivity.
The different features among world labor markets and their different capacities to absorb these productivity improvements de-serve wider attention. labor markets mainly adjust through wages and employment (price and quantity). In essence, the more flex-ible wages are, the quicker the adjustment. Since wages are usu-ally inflexible, most of the adjustment happens by outright layoffs (quantity). This is often the case in most Western countries, where strong labor unions commit themselves to maintaining the wages of their members, in keeping up with the inflation brought about by government intervention. In this manner, wages are said to be downwardly rigid.11 Thus, if the labor force displays great mobility,
10 a complete analysis on the demand side of the labor market is found in Hamer-mesh (1993).
11 In general, labor market rigidities can be either nominal or real, and can be explained through several theories. Nominal rigidity theories are those concerning
[ 38 ] offshoring in the global economy
the better the employment level in the economy. also, a more educated and trained workforce clearly helps make workers more flexible and adaptable to occupational changes (Blinder 2006).
The lack of relative importance for wage flexibility should make policymakers focus intensely on labor turnover costs, which consist of hiring and firing costs. These are the in-and-out doors of the la-bor market, and, if not tended to adequately, could become rusty. Therefore, if economies let both costs grow significantly, it would hinder labor flexibility and possibly productivity and employment (Henry et al. 2000; Karanassou and Snower 1998).
It is now clear that concerns about employment and productiv-ity cannot be separated when dealing with offshoring. This holy trinity, as we shall see in chapter 2, is becoming a new creed in the fields of international and labor economics and in many areas of management. For the latter, potential language and cultural short-circuits are particularly interesting. We will now review the major studies in economics.
menu cost, wage-price staggering, and production lag models. real wage rigidities cope with efficiency wage models (moral hazard and adverse selection) and insider-outsider models (individualistic and union bargaining). Both theories are known as “market nonclearing” theories, since according to their model labor markets do not clear and unemployment can rise involuntarily.
[ 39 ]
Making Sense of the literature and Its results
IN new the review presented here, we have attempted to provide the most important contributions on the subject of offshoring and outsourcing and their effects on the labor market, and as such, some studies have been excluded. a complete account on the subject would be impossible and would not make sense. We have identified several groups of studies: the earlier works concentrate on aggregate data alone, while the later contributions are broadly separated into aggregate and disaggregate evidence. attention should be paid to the fact that all of the references cited below might belong to different strands of literature, perhaps with slightly different research goals and definitely with disparate data constraints. However, as we advance in this review, we will see how the evidence focuses on labor demand factors, since labor supply factors do not seem to play any major role in explaining, for in-stance, the relative changes in wages or employment as a result of offshoring.12 also, these relative changes in the labor market are thought to take place mostly within the same industry, and not between industries. reasonably enough, displaced workers would expect to find related jobs within the same branch of activities as the posts held before. More recently, a more direct effect of off-shoring on labor markets is being studied. as a result, only a small effect of offshoring is expected, if any, since it is total employment that occupies people’s attention (see Bhagwati et al. 2004).
12 This could refer to changes in the relative supply of skilled to unskilled labor. Evidence so far proves that a worldwide increase in this ratio is not reflected by a de-cline in relative wages, thus discarding the hypothesis of supply-side effects on wage inequality. See Strauss-Kahn (2004, 13).
2.
[ 40 ] offshoring in the global economy
2.1. First steps
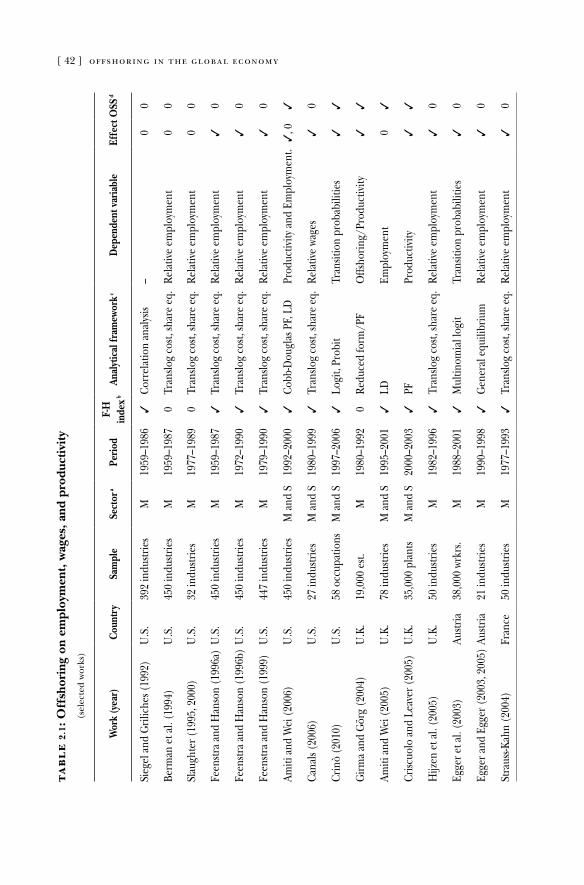
Perhaps the first studies formalizing a link between offshor-ing (formerly foreign outsourcing) and employment are those by Berman et al. (1994), Krugman (1995), lawrence and Slaughter (1993), leamer (1994), Siegel and Griliches (1992), and Slaughter (1995). In fact, a great part of this literature attempts to explain shifts in labor demand and their composition through variables other than total factor productivity (TFP). Thus, it is possible to avoid an overstatement of TFP while explaining, for instance, wage inequality or changes from nonskilled toward skilled labor. one way to widen the scope is by taking into account previously overlooked variables, for example, purchased services, foreign outsourcing, or investments in computers, which can now be add-ed to the analysis. Subsequently, the offshoring phenomenon and its relationship with employment (and unemployment) evolved to become a central issue in the trade and labor literature. let us go then through some of these initial attempts. Tables 2.1 and 2.2 summarize the evidence presented in the next few sections.
Siegel and Griliches (1992) estimate foreign outsourcing using product and material data from the Census of Manufactures and trade data from the NBEr. They calculate the shares of all prod-ucts in the industry’s total cost of materials, and multiply each share by its corresponding import share. The latter is the imports to domestic demand ratio. Next, they produce an estimate of for-eign materials after adding these values. Their correlation analysis at both the industry (450) and establishment (20,000) level for the U.S. manufacturing sector alone, suggests that the recovery in measured productivity during the 1977–1982 period can hardly be attributed to foreign outsourcing. More generally, “an industry’s propensity to outsource is unrelated to its acceleration in produc-tivity” (Siegel 1992). They hint that the measured improvements in productivity overestimated real productivity growth because of trends in foreign outsourcing, among others.
Using U.S. data drawn from the Annual Survey of Manufacturers, Berman et al. (1994) frame their definition to include only parts and items bought abroad, while excluding contract work. This definition limits itself to foreign activities of multinational
making sense of the literature and its results [ 41 ]
companies and solely involves material offshoring. according to this measure, the real impact of offshoring could be at times under- estimated. In investigating the shift in demand from unskilled to skilled labor in 450 four-digit U.S. manufacturing industries dur-ing 1979–1987, they discovered that foreign outsourcing does not explain the bulk of the observed change. relying on a translog cost function estimation and direct evidence on r&d and com- puter investments, they concluded that biased technological change embedded in the massive introduction of computers during the 1980s explains much of the skill upgrading. Berman et al. (1997) updated their previous calculations to confirm that out-sourcing cannot be responsible for the bulk of the observed changes in U.S. employment.
[ 42 ] offshoring in the global economyta
bl
e 2
.1: O
ffsh
orin
g on
em
ploy
men
t, w
ages
, and
pro
duct
ivit
y
(sel
ecte
d w
orks
)
Wor
k (y
ear)
Cou
ntry
Sam
ple
Sect
or a
Perio
dF-
H
inde
x bAn
alyt
ical
fram
ewor
k cD
epen
dent
var
iabl
eEf
fect
OSS
d
Sieg
el a
nd G
rilic
hes (
1992
)U
.S.
392
indu
strie
sM
1959
–198
6✓
Corr
elat
ion
anal
ysis
–0
0
Berm
an e
t al.
(199
4)U
.S.
450
indu
strie
sM
1959
–198
70
Tran
slog
cost,
shar
e eq
.re
lativ
e em
ploy
men
t0
0
Slau
ghte
r (19
95, 2
000)
U.S
.32
indu
strie
sM
1977
–198
90
Tran
slog
cost,
shar
e eq
.re
lativ
e em
ploy
men
t0
0
Feen
stra
and
Han
son
(199
6a)
U.S
.45
0 in
dustr
ies
M19
59–1
987
✓Tr
anslo
g co
st, sh
are
eq.
rela
tive
empl
oym
ent
✓0
Feen
stra
and
Han
son
(199
6b)
U.S
.45
0 in
dustr
ies
M19
72–1
990
✓Tr
anslo
g co
st, sh
are
eq.
rela
tive
empl
oym
ent
✓0
Feen
stra
and
Han
son
(199
9)U
.S.
447
indu
strie
sM
1979
–199
0✓
Tran
slog
cost,
shar
e eq
.re
lativ
e em
ploy
men
t✓
0
amiti
and
Wei
(20
06)
U.S
.45
0 in
dustr
ies
M a
nd S
1992
–200
0✓
Cobb
-dou
glas
PF,
ld
Prod
uctiv
ity a
nd E
mpl
oym
ent.
✓, 0
✓
Cana
ls (2
006)
U.S
.27
indu
strie
sM
and
S19
80–1
999
✓Tr
anslo
g co
st, sh
are
eq.
rela
tive
wage
s✓
0
Crin
ò (2
010)
U.S
.58
occ
upat
ions
M a
nd S
1997
–200
6✓
logi
t, Pr
obit
Tran
sitio
n pr
obab
ilitie
s✓
✓
Girm
a an
d G
örg
(200
4)U
.K.
19,0
00 e
st.M
1980
–199
20
redu
ced
form
/PF
offs
horin
g/Pr
oduc
tivity
✓✓
amiti
and
Wei
(20
05)
U.K
.78
indu
strie
sM
and
S19
95–2
001
✓ld
Empl
oym
ent
0✓
Crisc
uolo
and
lea
ver (
2005
)U
.K.
35,0
00 p
lant
sM
and
S20
00–2
003
✓PF
Prod
uctiv
ity✓
✓
Hijz
en e
t al.
(200
5)U
.K.
50 in
dustr
ies
M19
82–1
996
✓Tr
anslo
g co
st, sh
are
eq.
rela
tive
empl
oym
ent
✓0
Egge
r et a
l. (2
003)
austr
ia38
,000
wrk
rs.
M19
88–2
001
✓M
ultin
omia
l log
itTr
ansit
ion
prob
abili
ties
✓0
Egge
r and
Egg
er (
2003
, 200
5)au
stria
21 in
dustr
ies
M19
90–1
998
✓G
ener
al e
quili
briu
mre
lativ
e em
ploy
men
t✓
0
Stra
uss-K
ahn
(200
4)Fr
ance
50 in
dustr
ies
M19
77–1
993
✓Tr
anslo
g co
st, sh
are
eq.
rela
tive
empl
oym
ent
✓0

making sense of the literature and its results [ 43 ]
tab
le
2.1
(con
t.): O
ffsh
orin
g on
em
ploy
men
t, w
ages
, and
pro
duct
ivit
y
(sel
ecte
d w
orks
)
Wor
k (y
ear)
Cou
ntry
Sam
ple
Sect
or a
Perio
dF-
H
inde
x bAn
alyt
ical
fram
ewor
k cD
epen
dent
var
iabl
eEf
fect
OSS
d
Gei
shec
ker a
nd G
örg
(200
5)G
erm
any
1,61
2 wr
krs.
M19
91–2
000
✓W
age
equa
tion
rela
tive
wage
s✓
0
Gör
g an
d H
anle
y (20
05)
Ger
man
y80
pla
nts
Elec
.19
90–1
995
✓ld
Empl
oym
ent
✓✓
Cada
rso
et a
l. (2
008)
Spai
n93
indu
strie
sM
1993
–200
3✓
ldEm
ploy
men
t✓
, 00
Ekho
lm a
nd H
akka
la (
2006
)Sw
eden
20 in
dustr
ies
M a
nd S
1995
–200
0✓
Tran
slog
cost,
shar
e eq
.re
lativ
e em
ploy
men
t✓
, 00
Hak
kala
et a
l. (2
007)
Swed
en15
,000
firm
sM
and
S19
90–2
002
0ld
Empl
oym
ent
00
Hea
d an
d ri
es (
2002
)Ja
pan
1,07
0 fir
ms
M19
71–1
989
0Tr
anslo
g co
st, sh
are
eq.
rela
tive
empl
oym
ent
✓0
Tom
iura
(20
05)
Japa
n11
8,30
0 fir
ms
M19
980
Surv
ey/r
educ
ed fo
rmo
ffsho
ring
inte
nsity
–0
Hijz
en e
t al.
(200
6)Ja
pan
12,5
64 fi
rms
M19
94–2
000
0PF
Prod
uctiv
ity✓
0
Ito e
t al.
(200
7)Ja
pan
5,50
0 fir
ms
M20
060
Surv
ey–
–✓
a M
: man
ufac
turi
ng;
S: s
ervi
ces;
Ele
c.: e
lect
ron
ics;
b Fe
enst
ra-H
anso
n in
dex
or s
imila
r; c P
F: p
rodu
ctio
n fu
nct
ion
; ld
: lab
or d
eman
d; d
off
shor
ing
of
serv
ices
.
Not
e: T
he
colu
mn
labe
led
“Eff
ect”
ref
ers
to th
e ef
fect
of t
he
offs
hor
ing
vari
able
on
the
depe
nde
nt v
aria
ble
(✓ =
sig
nif
ican
ce; 0
= n
onsi
gnif
ican
ce).
Sour
ce: a
gnes
e (2
010)
.
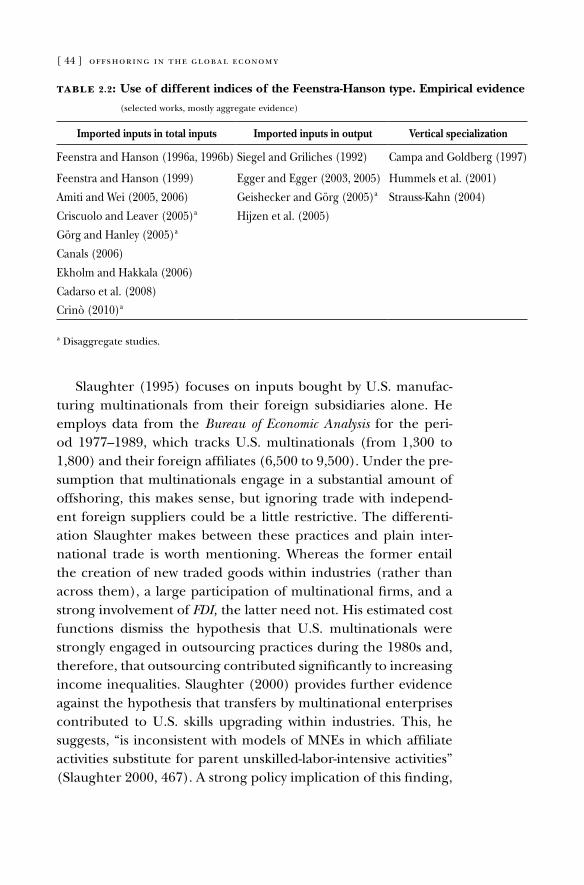
[ 44 ] offshoring in the global economy
Slaughter (1995) focuses on inputs bought by U.S. manufac-turing multinationals from their foreign subsidiaries alone. He employs data from the Bureau of Economic Analysis for the peri-od 1977–1989, which tracks U.S. multinationals (from 1,300 to 1,800) and their foreign affiliates (6,500 to 9,500). Under the pre-sumption that multinationals engage in a substantial amount of offshoring, this makes sense, but ignoring trade with independ-ent foreign suppliers could be a little restrictive. The differenti-ation Slaughter makes between these practices and plain inter-national trade is worth mentioning. Whereas the former entail the creation of new traded goods within industries (rather than across them), a large participation of multinational firms, and a strong involvement of FDI, the latter need not. His estimated cost functions dismiss the hypothesis that U.S. multinationals were strongly engaged in outsourcing practices during the 1980s and, therefore, that outsourcing contributed significantly to increasing income inequalities. Slaughter (2000) provides further evidence against the hypothesis that transfers by multinational enterprises contributed to U.S. skills upgrading within industries. This, he suggests, “is inconsistent with models of MNEs in which affiliate activities substitute for parent unskilled-labor-intensive activities” (Slaughter 2000, 467). a strong policy implication of this finding,
table 2.2: Use of different indices of the Feenstra-Hanson type. Empirical evidence
(selected works, mostly aggregate evidence)
Imported inputs in total inputs Imported inputs in output Vertical specialization
Feenstra and Hanson (1996a, 1996b) Siegel and Griliches (1992) Campa and Goldberg (1997)
Feenstra and Hanson (1999) Egger and Egger (2003, 2005) Hummels et al. (2001)
amiti and Wei (2005, 2006) Geishecker and Görg (2005)ª Strauss-Kahn (2004)
Criscuolo and leaver (2005)ª Hijzen et al. (2005)
Görg and Hanley (2005)ª
Canals (2006)
Ekholm and Hakkala (2006)
Cadarso et al. (2008)
Crinò (2010)ª
ª disaggregate studies.
making sense of the literature and its results [ 45 ]
he argues, is that restrictions on outward FDI would do little to deter skill upgrading within U.S. industries.13
2.2. A breakthrough
Feenstra and Hanson (1996b, 1997) produced evidence for the first time in favor of a shift towards skill-intensive activities within domestic industries due to foreign outsourcing. Their rationale is: if firms respond to import competition from low-wage coun-tries by moving nonskilled intensive activities abroad, then trade has to shift employment toward skilled workers in the domestic economy. In contrast to previous efforts, the authors contend that former calculations might have underestimated the real extent of outsourcing. They provide several reasons for this in one of their papers (Feestra and Hanson 1996a, 19), yet conclude that the way one defines the concept remains most important. In another pa-per (Feestra and Hanson 1996b), in turn, estimations suggest that foreign outsourcing, as defined in equation (1.1), can explain up to 31 percent of the increases in nonproduction wage share during the 1980s for the 450 U.S. manufacturing industries. The methodology here is rather similar to that in Berman et al. (1994), yet with a more sophisticated definition of foreign outsourcing. Conveniently, Feenstra and Hanson (1999) go even further and break this measure down into narrow and broad variations. The use of these new measures delivers adjusted estimates on the ef-fect of foreign outsourcing on the shift in labor demand. Total outsourcing (the narrow measure plus the difference between narrow and broad) now accounts for 13 to 23 percent of the shift toward nonproduction labor, which is still a significant number.
at the time of the Feenstra and Hanson analysis, several authors in the international trade literature chipped in with some interest-ing suggestions. For instance, Campa and Goldberg (1997) were interested in the role of exports, imports, and imported inputs, in
13 Krugman (1995) was yet another economist at the time arguing that out- sourcing and FDI through multinationals firms were too small to account for the ob-servable changes in wages and employment.
[ 46 ] offshoring in the global economy
the external orientation of a reduced group of countries during the 1980s and 1990s. Casting their doubts on the reliance of commonly used openness to trade indicators, they came up with their own mea- sure of vertical specialization. Even though a little off the subject, their measure in equation (1.2a) is useful for checking (interna-tional) vertical integration at the industry level, within and across countries. In particular, vertical integration describes a type of mana-gerial control where companies share a common owner while pro-ducing different products or services, or rather, are in charge of different production stages. Their empirical survey highlights the remarkable differences in the use of imported inputs among the industries of these countries which, they argue, can be explained by differences in the endowments of raw materials. For the four coun-tries of the study, Canadian and U.K. industries display higher ex-port shares and imported input shares than the United States. The Japanese economy, on the other hand, has fewer of these industries oriented to exporting, but these are rather intensive.
along similar lines, Hummels et al. (2001) conceived a defini-tion of vertical specialization, as in (1.2b), defined as imported in-puts used only to produce products to be later exported. In other words, their measure picks up the foreign added value embodied in exports. This supports the idea of undertaking this business practice for cost-advantage reasons, since exporting sectors must remain competitive internationally. They present evidence for various countries based on oECd input-output tables and reveal that, as of 1990, vertical specialization represented 20 percent of exports in the oECd countries. This figure even reached 40 per-cent in smaller countries (Ireland, Korea and Taiwan). Their simu- lation analysis shows that smaller countries trade a larger share of output and vertically trade a larger share of total trade, con-cluding that country size can affect the extent and composition of trade. Not surprisingly then, the vertical specialization share of countries such as the United States and Japan are to be found among the smaller ones. In turn, a model of multi-stage produc-tion shows that for any given decline in trade barriers, trade and the gains from trade are greater with vertical specialization.
The selected evidence in section 2.3 refers to a series of studies that appeared in the following years, as inspired by their benchmark
making sense of the literature and its results [ 47 ]
predecessors. It is by no means conclusive, but is elaborated em-pirically and with a wider research agenda.
2.3. Some aggregate evidence
Egger and Egger (2003) put forward the case of austria, reason-ing that, until now, the literature has neglected highly unionized economies. They assert that more pronounced employment effects are to be expected in continental Europe as a result of offshoring. The impact of trade liberalization between Western Europe and Eastern economies after the fall of the iron curtain are of special interest. Using a panel of 20 two-digit manufacturing industries for 1990–1998, they found that outsourcing to Eastern Europe was in search of low wages and due to decreasing trade barriers. In par-ticular, their estimates resulted in a shift of relative employment of about 0.08 to 0.12 percent in favor of highly skilled workers, when considering a 1 percent increase in outsourcing to Eastern countries.14 Furthermore, during the last decade, outsourcing to Eastern Europe explains one quarter of the changes in relative employment towards highly skilled workers.
Strauss-Kahn (2004) uses an index of vertical specialization for France in the spirit of Campa and Goldberg (1997). She uses data from the French National Institute of Statistics and Economic Studies (INSEE) for the period of 1977–1993. a cost-share equa-tion of a translog function (e. g., Berman et al. 1994; Feenstra and Hanson 1996a, 1996b, 1999) is implemented to explain the de-cline in the within-industry share of unskilled workers in 50 French manufacturing sectors. When considering two subsamples, the data show that international verticalization explains 11 to 15 percent of the drop in the share of unskilled workers in manufacturing em-ployment during 1977–1985, and 25 percent of the decline during 1985–1993.
14 It is theoretically more appropriate to rely on relative wage changes, since it results from the cost-minimization problem of firms, usually embedded in a (trans-log) cost function. The focus on relative employment rather than relative wages could respond to particularly inflexible aspects of the labor market under study. See also, among others, the work by Strauss-Kahn (2004) for France.
[ 48 ] offshoring in the global economy
Both benchmark contributions by amiti and Wei (2005, 2006) build on the measure by Feenstra and Hanson on an industry ba-sis. They put forth cases for the United Kingdom and the United States using conventional data from input-output tables and trade statistics from the IMF. of note is the stress put on the increasing importance of service offshoring for both countries. Whereas ma-terial offshoring is still predominant, service offshoring displays a rather steep trend during the whole of the 1990s and early 2000s. They also produce an economy-wide measure for studying the cross-border pattern among a large list of countries, relying exclu-sively on the trade of computers (and information services) and other business services from the IMF Balance of Payment Statistics Yearbook. as the authors state, both of these trade categories are most likely to encompass offshoring activities. These measures provide interesting insights into the relative importance of the offshoring phenomenon worldwide, which are consistent with the analysis provided earlier by Hummels et al. (2001). In effect, when it comes to absolute numbers both the biggest outsourcers and insourcers are found among larger countries (United States, Germany, Japan, etc.). In turn, when relative figures are consid-ered, smaller countries are at the top of the list (luxemburg, Belgium, Ireland, to name a few). This leads the authors to ask what the biggest surplus countries are (net insourcing, or insourc-ing minus outsourcing), only to find that there is no clear pattern of countries being in net surplus or deficit for the business ser- vices considered. The United States, United Kingdom, India and China, among the larger, and Hong Kong, Singapore, among the smaller, all appear at the top of the list of net surplus countries.
Both studies by amiti and Wei (2005, 2006) are among the first to introduce service offshoring into the econometric analysis, this time making use of a common empirical specification of labor demand (Hamermesh 1993) and taking into account its intrinsic endogeneity.15 amiti and Wei (2005) study the case of the United Kingdom, including data from 69 manufacturing industries and 9
15 The final formulation can also be expressed in first-time differences to control for any time-invariant, industry-specific effects such as industry technology differences. However, concerns materialize when taking first-time differences, as they may induce measurement error, especially when variables are aggregated at the industry level.
making sense of the literature and its results [ 49 ]
service industries from 1995 to 2001. In general, after trying sev-eral specifications for both manufacturing and services industries taken separately, they discovered that the offshoring of materials and services do not have a negative effect on employment at the sectoral level. Nevertheless, in their companion paper amiti and Wei (2006) show that if the U.S. economy is decomposed into 450 sectors, a negative effect on employment can be detected between the years of 1992 and 2000. When using a broader definition, they came up with 96 sectors and the effect of offshoring on employ-ment disappeared. Furthermore, they found a positive effect of offshoring on productivity, ranging from 11 to 13 percent of the productivity growth accounted for by service offshoring and 3 to 6 percent by material offshoring. These two pieces of work dis-credit two common beliefs in the offshoring debate. First, most developed countries are not more outsourcing intensive (when adjusted by economic size) than many developing countries, and second, the effect of service and material offshoring (especially the former) on employment has been largely exaggerated.
Egger and Egger (2005) then tried to stress the interdepen- dence among sectors of the economy in a general equilibrium setting. It is thus possible to find important feedback and spillo-ver effects from specific industries engaged in offshoring towards those that are not. decisions on whether to carry out an offshoring strategy depend on the production structure and factor intensities in other sectors. Therefore, if intersectoral multiplier effects are ignored, offshoring may be downward biased. They understand foreign outsourcing in a narrow sense (as described before), while spillovers of relative employment refer to the effects among industries due to changes in a particular industry. The transmis-sion channels through which these effects might take place are specified through national input-output relationships that, in turn, enter the relative labor demand function as weights. These spillover effects can be of two kinds. First, international outsourc-ing practices by a certain industry that might cause an impact on another due to input-output linkages, and second, national labor flows across industries. Their estimations using a panel data set of 21 two-digit austrian industries in the 1990s portray not only a significant and positive effect of offshoring towards highly skilled
[ 50 ] offshoring in the global economy
workers (9 to 10 percent), but an important role of intersectoral spillovers. The latter is argued to be of high importance in avoid-ing a substantial underestimation of the labor market effects of offshoring.
Hijzen et al. (2005) calculate their measure of international out-sourcing directly from import-use matrices from U.K. input-output tables (Office for National Statistics). This provides a better estimation of offshoring compared with Feenstra and Hanson’s estimation through trade data, since the measure is no longer driven by in-creased penetration of all goods, intermediates, and final goods. according to this, when a measure of offshoring includes final goods it may produce some bias. They argue too (like Feenstra and Hanson) that a narrow measure would be more suitable, as it comes closer to capturing the idea of fragmentation, which neces-sarily takes place within the industry. Since the shift in the demand for labor (from nonskilled to skilled) occurs largely within and not between industries, one should focus on changes of relative fac-tor demand. Furthermore, the authors refer to the New Earnings Survey Panel Data Set, which allows a more accurate measure of skills than that often used in previous works. The authors used infor-mation directly linked to occupational classifications, as opposed to the standard division between production and nonproduction workers, which corresponds to the basic nonskilled/skilled clas-sification. They extended the standard translog cost framework to analyze the impact of factor-biased technological change on rela-tive labor demand for 50 manufacturing industries from 1982 to 1996.16 In estimating a system of share equations (variable factor demands), the large set of elasticities produced show that interna-tional outsourcing has a strong negative impact on the demand for unskilled labor. Sometimes, the increase in the relative demand of skilled workers is bound to be interpreted as rising wage inequal-ity, especially in highly flexible labor markets. In a related paper, Hijzen (2005) concentrates on the productivity effects of out- sourcing on wages using the usual wage methodology.
16 Two measures of this factor-biased technological change are usually identified in translog function estimations: first, international outsourcing, and second, a mea- sure of r&d intensity to ensure the international outsourcing variable does not pick up the effects of technical change.
making sense of the literature and its results [ 51 ]
To explain the relative increase in wages for highly skilled workers, Canals (2006) carried out an accounting decomposition that is analogous to the growth decomposition within the pro-ductivity literature. Therefore, this wage gap can be explained by shifts in international outsourcing (or outsourcing-biased techno-logical change), shifts in biased technological change other than international outsourcing, and total technological change (which does not equal the sum of the former two). as opposed to the studies by Feenstra and Hanson, here offshoring or international outsourcing is a production factor and, thus, an endogenous vari-able. In spite of this, the author relies on Feenstra and Hanson’s definition using data from the Bureau of Economic Analysis and the Bureau of Labor Analysis for both the U.S. manufacturing and ser- vices sectors. In a sample of 27 industries (18 manufactures and 9 services) the author finds that between 1980 and 1999, inter-national outsourcing explained 28 percent of the observed wage change, while biased technological change explained 43 percent. These two forces, when considered together, explain 58 percent of the wage change, which is indeed a large share.
Ekholm and Hakkala (2006) elaborated the case for Sweden. Using direct information on imported inputs from input-output tables, combined with information from trade statistics, they de-veloped indirect estimates of offshoring for different groups of countries. The authors considered both the narrow and broad measures developed earlier by Feenstra and Hanson. an innova-tive contribution turns out to be the additional use of a measure accounting for in-house offshoring or the transfer of produc-tion within multinationals. They produced a ratio between the number of employees in foreign affiliates of multinationals in a certain industry over the number of employees at the Swedish parent companies belonging to that same industry. a common short-term translog cost function is considered in the econo- metric analysis.17 The results, using data from 20 industries for the 1995–2000 period, hint at an important contribution of offs- horing (in particular in low-income countries) in the shift of relative
17 Here, as in Hijzen et al. (2005), both international outsourcing and r&d intensity are used as the measures of factor-biased technological change.
[ 52 ] offshoring in the global economy
labor demand away from the group of workers with a higher sec-ondary education. They also found offshoring to high-income countries to be irrelevant and, most likely related to a more gen-eral fragmentation of production and not as the result of labor cost differentials.
Horgos (2008) discusses the case for Germany in a comparative study of different measures of offshoring: imported inputs in to-tal inputs, imported inputs in gross output, vertical specialization, imported inputs in total imports, and value added in production. In essence, he assessed the performance of the most common measures in the literature in an applied study for Germany. The German Socio-Economic Panel and input-output tables of the Federal Statistical office in Germany provided the data. different estimations of a relative labor demand for 1991–2000 confirmed that results of different indices depend strongly on the level of industry aggregation. The wage differential per industry was used as an endogenous variable to estimate several regressions utiliz-ing the five different indices. The regressions first considered the whole economy, then the manufacturing and service industries taken separately, and finally the high- and low-skill industries. The first three indices mentioned before perform much better than the other two when compared with previous evidence, yet the re-sults provided were not significant.
Cadarso et al. (2008) come up with an empirical work for Spain and the employment effects of foreign outsourcing to Central and Eastern Europe (CEE). The authors in this study relied on domestic and import-use matrices of input-output tables to cal-culate Feenstra and Hanson’s narrow measure of offshoring, in a straightforward fashion without using trade data. The narrow measure allowed for a two dimensional analysis, one related to global outsourcing for Spain and the other to outsourcing to dif-ferent country groups. The narrow measure (in terms of output) was then further restricted to imports from CEE countries; in oth-er words, it was weighted by the ratio of imports from CEE coun-tries of a certain commodity relative to total imports of the same commodity. Several alternative estimations were presented of an augmented labor demand equation that comprises 93 industries for the 1993–2003 period. The findings suggest that the effect of
making sense of the literature and its results [ 53 ]
outsourcing differs depending on the industry’s characteristics and the country of origin. They also imply a negative effect on labor which was significant for medium- and high-tech industries (when outsourcing comes from CEE countries) while it is non- significant for other countries and low-tech sectors.
2.4. Some disaggregate evidence
The study by Head and ries (2002) centers mainly around the influence of overseas production and offshore employment by Japanese multinationals on domestic skill intensity. They combine accounting data from the parent firm with information on for-eign affiliates listed in Japanese Overseas Investment (Toyo Keizai, Inc.) in a panel of 1,070 firms between 1971 and 1989. To address the subject, they used data on foreign affiliate employment from companies in low-income countries. Purportedly, this type of out-ward FDI employment raises domestic skill intensity. Specifically, Head and ries took the foreign affiliate share of firms’ worldwide employment to come up with a definition of offshoring that can be plugged into a translog cost function equation. results in a set of different specifications and samples show that changes in overseas employment shares can explain a 0.9 percentage point increase (9%) of the roughly 10 percent point increase in the share of nonproduction workers. Moreover, increasing domestic skill intensity proves to diminish as investment shifts towards high-income countries.
Egger et al. (2003) reviewed the effects of trade and out- sourcing on the transition probabilities of employment bet- ween sectors. data on austrian male workers (around 30,000) between 1988 and 2001 are implemented in a dynamic multinomi-al logit framework, with a special focus on the short-term. austrian social security records and trade data from Statistics austria pro-vided the data. This approach is useful for studying the transition probabilities of employment into other sectors, and accounts for intermediate steps into the pool of unemployed or out of the la-bor force. The results prove that international factors are impor-tant for labor market turnover, especially for what the authors call
[ 54 ] offshoring in the global economy
industries with a comparative disadvantage (net importing indus-tries). They remark that increases in imports, terms of trade and, more importantly, the share of international outsourcing in total trade, negatively affect the probability of staying in or changing into the manufacturing sector.
Girma and Görg (2004) analyzed the decision to go offshore and the effect of this decision on the establishment’s productivity in U.K. manufacturing industries. Since it is productivity they were interested in, the distinction between international and domes-tic outsourcing is superfluous. The Annual Respondents Database provided records of some 14,000–19,000 establishments in the United Kingdom for the period of 1980–1992. Here, offshoring is defined as the cost of industrial services received by every estab-lishment in a certain period of time. This includes activities such as processing of inputs, which are sent back to the establishment for final assembly or sales, maintenance of production machinery, and engineering or drafting services. First, the authors looked at the determinants of outsourcing, and found a strong persistence in the decision to outsource and that foreign establishments out-source more than domestic ones, ceteris paribus. Second, the au-thors studied whether outsourcing indeed has a positive effect on the productivity of establishments. The estimation of both a labor productivity augmented function and a TFP function shows that outsourcing has significant as well as positive effects.
Similarly to Feenstra and Hanson, Criscuolo and leaver (2005) chose to set their offshoring measure as the ratio of imported ser- vices to the total amount of nonenergy services purchased, leaving imported materials out for reasons of data availability. They use es-tablishment data from the Annual Respondents Database and other official sources, for both the manufacturing and services sectors in the United Kingdom (approximately 35,000 plants) during a short span (2000–2003). It should be noted that the difficulty with their measure is that it is of a “catch-all” nature, which ignores heterogeneity in the services imported and heterogeneity across the countries where the services are imported from. In estimating an augmented production function, they determined that a 10 percent point increase in (service) offshoring intensity is associ-ated with a 0.37 percent point increase in total factor productivity.
making sense of the literature and its results [ 55 ]
This effect comes mainly from domestic firms that are not globally engaged. Moreover, they found that multinationals are among the most productive firms, and the positive effects from offshoring ob-tained in the estimation cannot be deemed as driven by particular types of services or partner countries.
Geishecker and Görg (2005) discuss the common perception that growing globalization and particularly the increasing frag-mentation of production, leads to wage for low-skilled workers. defining offshoring (or international fragmentation) as the im-ported inputs share in the industry’s output value, they carried out a study for the manufacturing sector including 1,612 individu-als during the period between 1991 and 2000. Their data comes from the widely used German Socio-Economic Panel, which pro-vides the means to estimate a log wage equation for all the indi-viduals of the sample. The authors concluded that only low-skilled workers employed in low-skill intensive industries experience re-ductions in their real wages following fragmentation activity in those industries. The wage elasticity showed that a 1 percent point increase in fragmentation intensity leads to a reduction in aver-age wages of 3.6 percent. on the contrary, highly skilled work-ers in high-skill-intensive industries might expect an increase of 2.7 percent in average wages due to a 1 percent point increase in fragmentation.
relying on microdata from the Irish Economy Expenditure Survey (Forfás), Görg and Hanley (2005) take Feenstra and Hanson’s ra-tio to the plant level. In this study, the measure of offshoring stands for the ratio of imported materials and the ratio of imported ser- vices inputs over total wages, for about 650 observations during 1990–1995. They employ this measure within the Irish Electronics sector alone, which, they argue, experienced rapid expansion in the last decade, with offshoring playing an important role. Their findings support the idea that this significantly decreases labor de-mand in the short-term, even though with “arguably some poten-tial for employment switching among subsectors.” accordingly, the net effect of offshoring on employment is nonzero despite this potential intrasectoral employment switch. The estimation of labor demand functions provides evidence for this negative re-lation. The short-term elasticity of labor with respect to (total)
[ 56 ] offshoring in the global economy
offshoring suggests a fall of 0.27 percent in employment explained by a 1 percent increase in offshoring. They also report significant individual effects of material and service offshoring, with stronger effects seen with material offshoring. Elasticities were found to be –0.20 and –0.15, respectively.
Tomiura (2005) presents evidence for Japanese firms (a to-tal of 118,300) in all manufacturing industries. He reasons that industry-level measures have contributed largely to the literature, yet reality shows that a vast majority of firms are not involved in offshoring at all. deriving data from the Basic Survey of Commercial and Manufacturing Structure and Activity, it is possible to separate firms engaged in international outsourcing from those engaged in domestic outsourcing. The survey takes this into account with a di-rect question. Moreover, this powerful database does not impose any threshold on the firm sizes while covering all of the manufac-turing industries. This work defines foreign outsourcing by the yen value outsourced to firms located overseas. The survey, despite its wide scope, reveals some flaws highlighted by the author. among others, it is worth mentioning that the offshoring of nonproduc-tion overhead services is not covered, and that contracting out to a company’s own subsidiaries is not separated from plain out-sourcing. However, this sample accounts for nearly 98 percent of all Japanese manufacturing firms that are not outsourcing any of their production overseas. The very few engaged in foreign out-sourcing are those more likely to have a richer endowment of hu-man skills or experience with FDI. along the same lines, more pro-ductive firms or those whose products are more labor intensive, display more extensive outsourcing intensity across borders.
Hijzen et al. (2006) focus on the productivity effect in the Japanese economy. offshoring intensity is represented in this study by the ratio of expenditure on the subcontracting of prod-ucts, parts, and components to foreign providers to the value-added activities of the firm. Hence, they conclude that a 1 per-cent increase in offshoring intensity would increase productivity growth by 0.17 percent. Furthermore, for the average offshoring firm, this would imply a 1.8 percent increase in annual produc-tivity growth that it would not have experienced had it not en-gaged in offshoring. They also found that the potential extent for
making sense of the literature and its results [ 57 ]
productivity improvements depends negatively on the initial level of productivity of the firm. Thus, they suggest that “offshoring may be an effective channel in restoring the competitiveness of less productive firms” (Hijzen et al. 2006, 5). and also, “that spe-cializing in skill-intensive production stages through offshoring generates higher growth in productivity due to larger learning-by-doing effects.” (Hijzen et al. 2006, 7). on the same grounds, they found multinationals to be more important offshorers than purely domestic firms. Their study consists of firm-level data from 12,564 manufacturing firms during 1994–2000, taken from the Basic Survey of Enterprise Activities, and industry-level data from the Japan Industry Productivity database 2006 (JIP 2006).
a study by Crinò (2010) is among the first empirical efforts to strongly commit to discerning the effects of service offshoring on U.S. white-collar workers. To estimate service offshoring, he relies on the share of each industry in the level of imports from a set of categories of private services. Under the restrictive assump-tion that this share is constant, it is then applied to the time series of imports of these services to produce a time-varying estimate of the level of services in certain industry. The services include: finance, management and consulting, insurance, industrial engi-neering, computer and information, maintenance of equipment, r&d, legal, business and technical, operational leasing, advertis-ing, accounting, auditing and bookkeeping, telecommunication, and others. He presents a highly disaggregated set of estimated labor demand elasticities to services offshoring for 58 white-collar occupations in 144 U.S. industries for 1997–2002. This shows that service offshoring is skill-biased because, contrary to popular be-lief, it increases employment among highly-skilled occupations and lowers employment among medium- and low-skilled ones.
Hakkala et al. (2007) consider the ownership or change in the ownership of firms (from domestically owned to multinational, for example) as a major cause driving wage elasticities and employ-ment in general. Indeed, there is a striking concern about how an increasing worldwide FDI is leading to a larger share of workers being employed by affiliates of foreign-owned multinational en-terprises. They studied this internationalization of Swedish firms us-ing official data from Statistics Sweden, and estimated the effects
[ 58 ] offshoring in the global economy
on employment and wage elasticities through dummy variables representing firm ownership, for a sample set of around 15,000 observations. labor demand function estimations for 1990–2002 determined that are no differences between foreign and domestic firms, or between multinational and nonmultinational firms, with regards to wage elasticities in firms.
2.5. Main theoretical contributions
Kohler (2001) brings to light a theoretical attempt to step away from the series of Heckscher-ohlin models and rely on a specific- factors model. Both Heckscher-ohlin and specific-factors-type models show that the impact of international outsourcing on fac-tor prices may be similar to the impact of sector- and factor-biased technological change. However, the assumption of perfect mobil-ity for all factors in Heckscher-ohlin models makes them more suited for long-term analysis. The paper highlights the costs of international fragmentation and thus the possibility of a reduc-tion in welfare reduction in the home country. It also outlines the differences between outsourcing with and without FDI in terms of factor prices and income distribution. With FDI, domestic capital moves to work with foreign labor, thus creating the proper envi-ronment for domestic firms to capitalize on the cost advantage from offshoring. a two-sector model, one of which is a candidate for outsourcing, portrays an economy where labor is the mobile factor and capital is a sector-specific input. International fragmen-tation includes a fixed-cost element that implies that outsourcing may reduce welfare and that a discontinuity in domestic demand for foreign factors may arise; an equilibrium with outsourcing, therefore, may not exist.
Grossman and Helpman (2005) admit the difficulties and flaws implied by using indirect measures, although they assume that the trade of intermediate goods and business services is one of the most rapidly growing items in international trade. Thus, their definition of offshoring goes beyond the simple ac-counting exercise set by the purchase of raw materials and stan- dardized intermediate goods. It also means finding the partners
making sense of the literature and its results [ 59 ]
with which outsourcing or offshoring firms engage in bilateral re-lationships and all of the actions that come with it. They develop a framework to study firms’ decisions about where to outsource using a two-country general equilibrium model. The choices for firms are either to seek partners in the technologically and legally advanced north or the low-wage south.18 The main conclusion they draw is that uniform worldwide improvements in investment tech-nologies have had, in general, no effect on foreign outsourcing. This is not so when disproportionate improvements in the south occur, where the model predicts shifts in outsourcing activity from the north to the south. These sorts of models embody hypotheses about the relationships among firms and partners, and are usually represented through the incomplete contract theory. Empirical results are still scarce in this line of research.
Bhagwati et al. (2004) outline three alternative models that re-flect different aspects of trade in services. a first one-good two-factor model, where there is no initial motivation for trade, delivers the conventional welfare gains and distributive effects between the two factors when outsourcing is considered. In fact, outsourcing allows for trading labor services in exchange for the final goods. a second model with two goods and three factors shows that the country still wins from trade and outsourcing. The third model displays three goods and two factors, where two of the goods are traded and the third and nontraded good becomes tradable on-line. This results in welfare gains and both factors being better off, which opposes the tenet that outsourcing necessarily harms the real wages of particular production factors. In general, these models view offshoring as a trade phenomenon and, hence, ben-eficial overall. However, one cannot forget to take into account the potential effects of deterioration in the terms of trade and the concerns about displaced workers in certain sectors.
davidson et al. (2006) discuss a narrow subject: the outsourcing of highly skilled jobs. Studying the differences in the wage levels for both types of workers, they focus on the relocation of highly skilled workers to low-tech jobs within the economy due to the
18 antràs and Helpman (2003) develop a similar model placing the stress on several organizational forms.
[ 60 ] offshoring in the global economy
jobs being offshored to lower-wage countries. This switch in the behavior of these workers delivers interacting responses in their general equilibrium setting (consisting of a developed northern region and a not so developed south), with a favorable outcome to low-skill workers in the domestic economy. They also underline the proper modeling of labor market frictions, which should help in delivering such an outcome.
Karabay and Mclaren (2010) describe globalization as, essen-tially, free trade plus outsourcing. The authors set up three differ-ent scenarios, each expanding on the previous one. autarky, free trade (in which good markets are integrated but factor markets are not), and full integration (of good and factor markets) are the possibilities. offshoring here refers to the passage from the second to the third state. Under a general-equilibrium perspec-tive for a two-country model (United States and India), the au-thors investigated the volatility of wages and employment as an outcome of both free trade and outsourcing. In general, studies on how global outsourcing affects the volume of trade, wage lev-els, and environmental regulations abound. Nevertheless, little work exists on the implications of outsourcing for the variability (or volatility) of economic activity. along more empirical lines, Bergin et al. (2007) study the case of the maquiladora outsourc-ing industries in Mexico and the relationships with their counter-parts in the United States. The term maquiladora comes from the Mexican lingo for a foreign-owned factory in Mexico, at which, according to the Merriam-Webster dictionary, “imported parts are assembled by lower-paid workers into products for exports.” according to Bergin et al. (2007, 1), “the assembly plants, known as maquiladoras, are seen as a channel by which the U.S. exports to Mexico a portion of its employment fluctuations over the busi-ness cycle.” They were able to document a new empirical regular-ity: outsourcing industries in Mexico experience fluctuations in economic activity that are twice as volatile as the corresponding industries in the U.S.
Mitra and ranjan (2007) analyze offshoring in a two-sector gen-eral equilibrium model. In this study, offshoring takes place when firms replace their home labor in production activities for import-ed inputs that happen to fulfill the same uses. With offshoring
making sense of the literature and its results [ 61 ]
unemployment at the center of their study, the authors eventually found that contrary to the general perception, offshoring might produce the right conditions to bring about wage increases and a significant drop in sectoral unemployment, provided that there is labor mobility. They also hypothesized that sectoral unemploy-ment might drop due to the entry of new firms brought about by offshoring.
along very similar lines, the study by rodríguez-Clare (2010) draws attention to the positive productivity effect associated with increased gains from trade, under a ricardian analytical per-spective. However, it also looks at the potential negative terms of trade effect linked to the vanishing effect of distance on wages. also, the excess effects of fragmentation in the short-term, he concludes, lead to deterioration (improvement) in the real wage for the rich (poor) country. In contrast, the long-term analysis al-ways proves to be beneficial for the rich country due to increased offshoring.
Egger and Kreickemeier (2008) introduced the idea of effi-ciency wages to a standard model of international fragmentation. Contrary to the general perception, their model suggests that outsourcing need not harm unskilled workers. In fact, it might reduce unemployment and at the same time reduce the skill pre-mium if home production is sufficiently skill intensive overall. on policy implications, the study casts some doubts on the popular claim that increased international outsourcing makes scaling down the welfare state compulsory, to be sustainable in the global economy.
a further step in the theoretical literature considering the as-sumption of imperfect labor markets is that of Koskela and König (2008). In this study, the analysis mainly focuses on the concepts of strategic outsourcing and profit sharing, and the determina-tion of equilibrium unemployment. Since profit sharing has been recently incorporated into compensation schemes and, curiously, follows the trend of increased international outsourcing, the au-thors deem it important to introduce the idea somehow. They show that the wage elasticity of labor demand depends positively on the amount of outsourcing and on the wage, but negatively on the size of profit sharing. also, they argue that profit sharing could
[ 62 ] offshoring in the global economy
have ambiguous effects on equilibrium unemployment if the former constitutes an option for other outsourcing industries.
2.6. General appraisal
We will now comment on a few points. The first benchmark con-tributions appeared only at the industry level as a by-product of the trade and productivity-related literature. Unanimously, they found no decisive evidence of offshoring being a potential cul-prit of relative changes in employment composition or wage structure in the U.S. labor market. This was originally expected to have strong connotations for policymaking, since it encouraged a laissez-faire view on the subject, probably not to the liking of politi-cians.
The analysis by Feenstra and Hanson was the first to provide evidence suggesting that offshoring had some impact on the U.S. labor market. More precisely, they argued that international trade in intermediate inputs represents a possible candidate for explaining relative changes in the labor factor intensity. They de-veloped a more sophisticated measure of offshoring that, accord-ing to them, avoids underestimating the possible (factor) bias towards highly skilled workers. In fact, their results suggest that an important part of the change in the employment of this type of worker can be explained by international outsourcing. This can also be interpreted as a factor-biased technological change, in the sense that high-skilled employment results favored after offshoring takes effect.
Particularly, Feenstra and Hanson draw their analysis from a Heckscher-ohlin setting, seemingly defying the notion of cost-minimizing input substitution. Indeed, here an increase in the skill-intensity of production comes with an increase in the wage rate for highly skilled compared to low-skilled labor. Their answer for this is simple: offshoring. For example, if certain activities at the lower end in terms of skill intensity in the United States are offshored to Mexico, where they can be said to be in the upper end of the scale, then skill intensity increases in both countries. Therefore, an increased demand for highly skilled workers in
making sense of the literature and its results [ 63 ]
both countries is accompanied by an increase in their relative wage, and offshoring becomes a form of factor-biased technologi-cal change.
others measures of offshoring subsequently surfaced, espe-cially in the international trade literature (Campa and Goldberg 1997; Hummels et al. 2001), which were later accepted in studies related to offshoring. all of these measures, along with Feenstra and Hanson’s, showed some degree of reliability, yet emphasizing different features of intermediate trade as an indirect measure of aggregate offshoring. With a few exceptions, the aggregate evi-dence points to an influential role of offshoring (in a special form of trade) within the labor markets of developed economies. also, evidence about a positive effect of offshoring on productivity has been produced.
aggregation might yet hide the fact that even within the same industry there can be firms that engage in these practices more often than others (aggregation bias). disaggregate evidence might therefore be helpful at this point, since it allows a more in-detail analysis. In general, these results confirm to a large ex-tent the perception that low-skill workers are the most affected by offshoring practices, especially in low-skill intensive industries. one must be very careful at this point in defining the skill of the workers, since this too might disguise some relevant information. For instance, service offshoring is believed to affect high-skill em-ployment, yet we might discover that that depends on what we consider to be highly skilled workers (see Crinò 2010). as with ag-gregate evidence, disaggregate evidence stresses the importance of offshoring for increases in productivity. However, even though the disaggregate analysis seems to provide a clearer picture of the phenomenon and its consequences over the labor market, some loss of homogeneity in the definition of offshoring is expected. Offshoring, as we can see, is defined slightly differently among re-search studies, and sometimes with little tangible consensus. Some disaggregate studies, however, still estimate offshoring as an aggre-gate measure (see for example, Geishecker and Görg 2005).
as for theoretical contributions, there still seems to be very few in comparison to empirical contributions. Furthermore, the literature is apparently veering off from original trade models like
[ 64 ] offshoring in the global economy
Heckscher-ohlin, to rely on more original or sophisticated general equilibrium models. There is an urgent need for more theoretical approaches which, even building on the simpler Heckscher-ohlin model, could incorporate neglected particularities of the off- shoring phenomenon and grasp the idea more closely. another shortage in the literature is the lack of theoretical as well as em-pirical results concerning the offshoring of services, which has re-ceived much interest in recent years and is now being addressed empirically.
When using exhaustive databases, it is easier to carry out em-pirical exercises at a more disaggregate level. attempts have even been made to assess the effect of offshoring on individual workers. These databases are not easily available, and when they are, they do not usually cover a long period. despite the literature heading in this direction, there is still a long way to go before an unequivo-cal and solid conclusion is reached. Nevertheless, provided future evidence shows offshoring to be a major determinant of change in the labor market, it is not to say that as a consequence, govern-ment intervention should be required.
For the time being, in chapter 3 we will move on to an overview on the worldwide reach of the offshoring phenomenon at the ag-gregate level of the industry. We will review the most conventional indices the literature has produced so far, indirectly measuring offshoring intensities for a specific group of countries.
[ 65 ]
a World overview
IT is now time to take a look at the data. In this chapter, we present country evidence from calculations based on the indices reviewed in chapter 1. as stated previously, aggregate figures can hide industries or companies showing a higher propensity to offshore. We are aware that this further aggregation (from an industry to country level) entails a higher degree of potential bias, but our aim is to produce data that are both reliable and comparable among countries, despite this empirical nuisance. We will now address several issues that have been touched upon in the literature. our main focus will be the offshoring intensity among a representative sample of countries. The subject of in- shoring, that is, foreign firms relocating subsidiaries domestically, will be excluded in the present study (see amiti and Wei 2005).
The initial goal of this analysis is to see whether a pattern emerges with regards to offshoring and the relative sizes of coun-tries, as done previously by Hummels et al. (2001) and amiti and Wei (2005). at first, industries in larger and more industrialized economies would be expected to be relatively more prone to off-shore. However, as found in both studies, here too offshoring in-tensity (as indirectly estimated by relative trade in intermediate goods) is inversely related to country size. distinguishing the ex-tent to which manufacturing and services industries engage in off-shoring with a different intensity is also of interest. Traditionally, firms belonging to the manufacturing sector have been more inclined to offshore due to the kind of activities they undertake (i. e., manufacturing-related activities, which were initially easier to move abroad). another step towards a further understanding of the offshoring phenomenon is the separation between materials and services offshoring. This directly relates back to the previous step, and the evidence to date suggests that services offshoring, while growing exponentially, is still in its first stages. We analyzed the evidence for these three empirical questions in the following
3.
[ 66 ] offshoring in the global economy
sections. additionally, we will take a deeper look into services off-shoring, as it has been argued to be the ultimate manifestation of modern trade (Mankiw and Swagel 2006). Finally, we will provide a decomposition analysis to gauge the performance of the differ-ent indices.
3.1. Offshoring intensity and country size
We constructed a ranking system for the years 1995, 2000, and 2005, for a wide sample of countries, for which input-output tables from the oECd are available (tables 3.1 to 3.6). Three indices are reported, as defined earlier: imported inputs in total inputs, im-ported inputs in gross output, and a measure of vertical speciali-zation.19 The narrow measure considers only international trade among industries of the same classification as an indirect measure of in-house offshoring. This corresponds to the diagonal in the import use matrix. The broad measure, on the other hand, repre-sents all trade, both intra- and inter-industry and, thus, is a rough approximation of offshore outsourcing or international outsourc-ing. It is generally believed that the narrow measure better cap-tures the general idea of offshoring, yet the literature has reached no definite answer on this point. Needless to say, the broad mea- sure is, by definition, always bigger than the narrow one, since its index numerator is always bigger.
as seen in the following tables, smaller economies (i. e., in GdP terms) rank among the first ten according to the three indices us-ing both narrow and broad measures. Within this context, these countries would rely more strongly on offshoring as a form of in-ternational trade than their larger counterparts, in relative values. Countries like luxemburg, Ireland, Hungary, Taiwan, austria, Slovak republic, Czech republic, Estonia and Slovenia are some good examples. on the other hand, some of the larger economies perform consistently at the bottom; most strikingly, the United
19 The vertical specialization index by Hummels et al. (2001) is significantly higher than those presented here, in spite of both being calculated from the same data source (oECd), yet for slightly different years. The difference is that their index is weighted by merchandise exports alone, and ours is weighted by total exports.
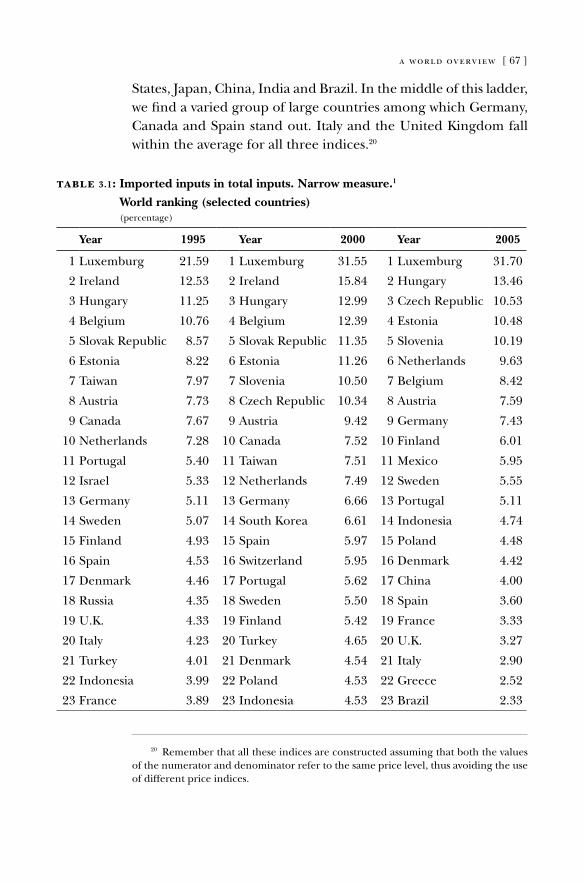
a world overview [ 67 ]
States, Japan, China, India and Brazil. In the middle of this ladder, we find a varied group of large countries among which Germany, Canada and Spain stand out. Italy and the United Kingdom fall within the average for all three indices.20
20 remember that all these indices are constructed assuming that both the values of the numerator and denominator refer to the same price level, thus avoiding the use of different price indices.
table 3.1: Imported inputs in total inputs. Narrow measure.1
World ranking (selected countries) (percentage)
Year 1995 Year 2000 Year 2005
1 luxemburg 21.59 1 luxemburg 31.55 1 luxemburg 31.70
2 Ireland 12.53 2 Ireland 15.84 2 Hungary 13.46
3 Hungary 11.25 3 Hungary 12.99 3 Czech republic 10.53
4 Belgium 10.76 4 Belgium 12.39 4 Estonia 10.48
5 Slovak republic 8.57 5 Slovak republic 11.35 5 Slovenia 10.19
6 Estonia 8.22 6 Estonia 11.26 6 Netherlands 9.63
7 Taiwan 7.97 7 Slovenia 10.50 7 Belgium 8.42
8 austria 7.73 8 Czech republic 10.34 8 austria 7.59
9 Canada 7.67 9 austria 9.42 9 Germany 7.43
10 Netherlands 7.28 10 Canada 7.52 10 Finland 6.01
11 Portugal 5.40 11 Taiwan 7.51 11 Mexico 5.95
12 Israel 5.33 12 Netherlands 7.49 12 Sweden 5.55
13 Germany 5.11 13 Germany 6.66 13 Portugal 5.11
14 Sweden 5.07 14 South Korea 6.61 14 Indonesia 4.74
15 Finland 4.93 15 Spain 5.97 15 Poland 4.48
16 Spain 4.53 16 Switzerland 5.95 16 denmark 4.42
17 denmark 4.46 17 Portugal 5.62 17 China 4.00
18 russia 4.35 18 Sweden 5.50 18 Spain 3.60
19 U.K. 4.33 19 Finland 5.42 19 France 3.33
20 Italy 4.23 20 Turkey 4.65 20 U.K. 3.27
21 Turkey 4.01 21 denmark 4.54 21 Italy 2.90
22 Indonesia 3.99 22 Poland 4.53 22 Greece 2.52
23 France 3.89 23 Indonesia 4.53 23 Brazil 2.33
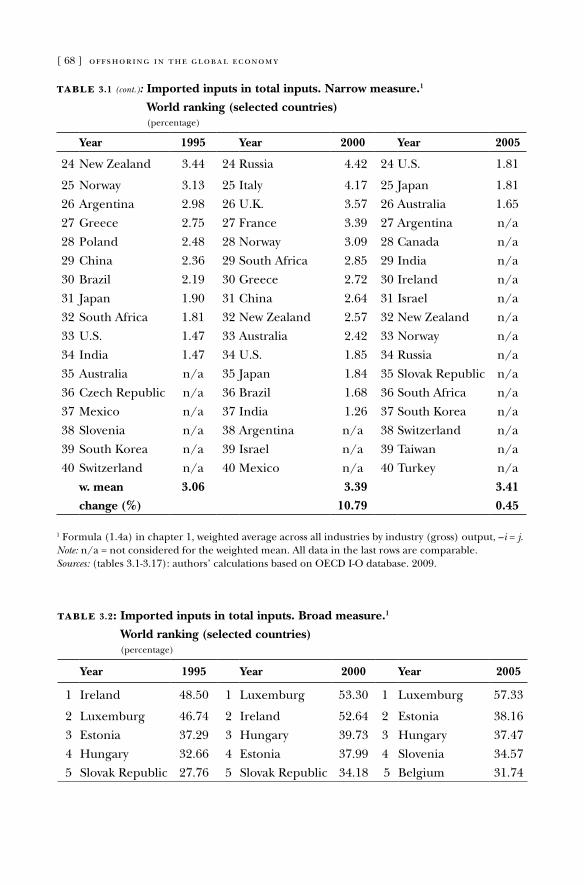
[ 68 ] offshoring in the global economy
table 3.1 (cont.): Imported inputs in total inputs. Narrow measure.1
World ranking (selected countries) (percentage)
Year 1995 Year 2000 Year 2005
24 New Zealand 3.44 24 russia 4.42 24 U.S. 1.81
25 Norway 3.13 25 Italy 4.17 25 Japan 1.81
26 argentina 2.98 26 U.K. 3.57 26 australia 1.65
27 Greece 2.75 27 France 3.39 27 argentina n/a
28 Poland 2.48 28 Norway 3.09 28 Canada n/a
29 China 2.36 29 South africa 2.85 29 India n/a
30 Brazil 2.19 30 Greece 2.72 30 Ireland n/a
31 Japan 1.90 31 China 2.64 31 Israel n/a
32 South africa 1.81 32 New Zealand 2.57 32 New Zealand n/a
33 U.S. 1.47 33 australia 2.42 33 Norway n/a
34 India 1.47 34 U.S. 1.85 34 russia n/a
35 australia n/a 35 Japan 1.84 35 Slovak republic n/a
36 Czech republic n/a 36 Brazil 1.68 36 South africa n/a
37 Mexico n/a 37 India 1.26 37 South Korea n/a
38 Slovenia n/a 38 argentina n/a 38 Switzerland n/a
39 South Korea n/a 39 Israel n/a 39 Taiwan n/a
40 Switzerland n/a 40 Mexico n/a 40 Turkey n/a
w. mean 3.06 3.39 3.41
change (%) 10.79 0.45
1 Formula (1.4a) in chapter 1, weighted average across all industries by industry (gross) output, –i = j.Note: n/a = not considered for the weighted mean. all data in the last rows are comparable.Sources: (tables 3.1-3.17): authors’ calculations based on oECd I-o database. 2009.
table 3.2: Imported inputs in total inputs. Broad measure.1
World ranking (selected countries) (percentage)
Year 1995 Year 2000 Year 2005
1 Ireland 48.50 1 luxemburg 53.30 1 luxemburg 57.33
2 luxemburg 46.74 2 Ireland 52.64 2 Estonia 38.16
3 Estonia 37.29 3 Hungary 39.73 3 Hungary 37.47
4 Hungary 32.66 4 Estonia 37.99 4 Slovenia 34.57
5 Slovak republic 27.76 5 Slovak republic 34.18 5 Belgium 31.74
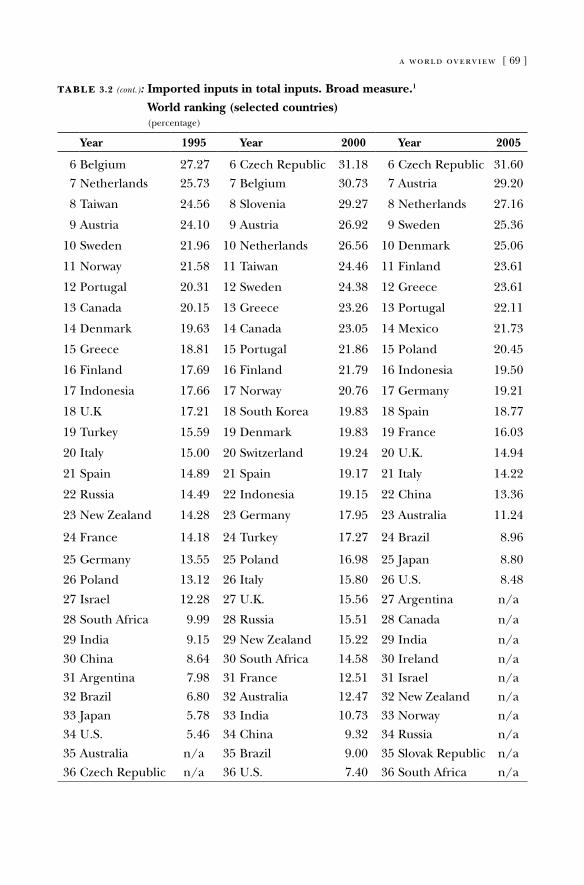
a world overview [ 69 ]
table 3.2 (cont.): Imported inputs in total inputs. Broad measure.1
World ranking (selected countries) (percentage)
Year 1995 Year 2000 Year 2005
6 Belgium 27.27 6 Czech republic 31.18 6 Czech republic 31.60
7 Netherlands 25.73 7 Belgium 30.73 7 austria 29.20
8 Taiwan 24.56 8 Slovenia 29.27 8 Netherlands 27.16
9 austria 24.10 9 austria 26.92 9 Sweden 25.36
10 Sweden 21.96 10 Netherlands 26.56 10 denmark 25.06
11 Norway 21.58 11 Taiwan 24.46 11 Finland 23.61
12 Portugal 20.31 12 Sweden 24.38 12 Greece 23.61
13 Canada 20.15 13 Greece 23.26 13 Portugal 22.11
14 denmark 19.63 14 Canada 23.05 14 Mexico 21.73
15 Greece 18.81 15 Portugal 21.86 15 Poland 20.45
16 Finland 17.69 16 Finland 21.79 16 Indonesia 19.50
17 Indonesia 17.66 17 Norway 20.76 17 Germany 19.21
18 U.K 17.21 18 South Korea 19.83 18 Spain 18.77
19 Turkey 15.59 19 denmark 19.83 19 France 16.03
20 Italy 15.00 20 Switzerland 19.24 20 U.K. 14.94
21 Spain 14.89 21 Spain 19.17 21 Italy 14.22
22 russia 14.49 22 Indonesia 19.15 22 China 13.36
23 New Zealand 14.28 23 Germany 17.95 23 australia 11.24
24 France 14.18 24 Turkey 17.27 24 Brazil 8.96
25 Germany 13.55 25 Poland 16.98 25 Japan 8.80
26 Poland 13.12 26 Italy 15.80 26 U.S. 8.48
27 Israel 12.28 27 U.K. 15.56 27 argentina n/a
28 South africa 9.99 28 russia 15.51 28 Canada n/a
29 India 9.15 29 New Zealand 15.22 29 India n/a
30 China 8.64 30 South africa 14.58 30 Ireland n/a
31 argentina 7.98 31 France 12.51 31 Israel n/a
32 Brazil 6.80 32 australia 12.47 32 New Zealand n/a
33 Japan 5.78 33 India 10.73 33 Norway n/a
34 U.S. 5.46 34 China 9.32 34 russia n/a
35 australia n/a 35 Brazil 9.00 35 Slovak republic n/a
36 Czech republic n/a 36 U.S. 7.40 36 South africa n/a
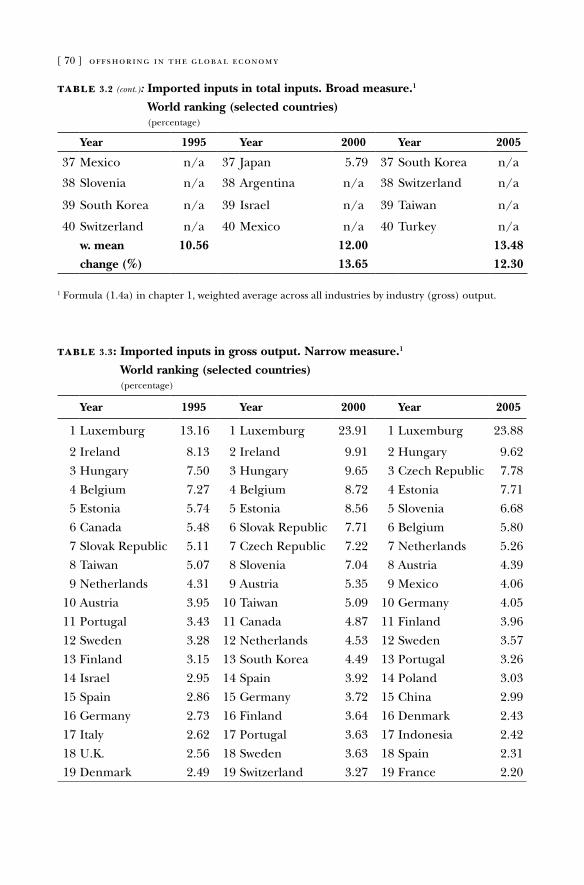
[ 70 ] offshoring in the global economy
table 3.2 (cont.): Imported inputs in total inputs. Broad measure.1
World ranking (selected countries) (percentage)
Year 1995 Year 2000 Year 2005
37 Mexico n/a 37 Japan 5.79 37 South Korea n/a
38 Slovenia n/a 38 argentina n/a 38 Switzerland n/a
39 South Korea n/a 39 Israel n/a 39 Taiwan n/a
40 Switzerland n/a 40 Mexico n/a 40 Turkey n/a
w. mean 10.56 12.00 13.48
change (%) 13.65 12.30
1 Formula (1.4a) in chapter 1, weighted average across all industries by industry (gross) output.
table 3.3: Imported inputs in gross output. Narrow measure.1
World ranking (selected countries) (percentage)
Year 1995 Year 2000 Year 2005
1 luxemburg 13.16 1 luxemburg 23.91 1 luxemburg 23.88
2 Ireland 8.13 2 Ireland 9.91 2 Hungary 9.62
3 Hungary 7.50 3 Hungary 9.65 3 Czech republic 7.78
4 Belgium 7.27 4 Belgium 8.72 4 Estonia 7.71
5 Estonia 5.74 5 Estonia 8.56 5 Slovenia 6.68
6 Canada 5.48 6 Slovak republic 7.71 6 Belgium 5.80
7 Slovak republic 5.11 7 Czech republic 7.22 7 Netherlands 5.26
8 Taiwan 5.07 8 Slovenia 7.04 8 austria 4.39
9 Netherlands 4.31 9 austria 5.35 9 Mexico 4.06
10 austria 3.95 10 Taiwan 5.09 10 Germany 4.05
11 Portugal 3.43 11 Canada 4.87 11 Finland 3.96
12 Sweden 3.28 12 Netherlands 4.53 12 Sweden 3.57
13 Finland 3.15 13 South Korea 4.49 13 Portugal 3.26
14 Israel 2.95 14 Spain 3.92 14 Poland 3.03
15 Spain 2.86 15 Germany 3.72 15 China 2.99
16 Germany 2.73 16 Finland 3.64 16 denmark 2.43
17 Italy 2.62 17 Portugal 3.63 17 Indonesia 2.42
18 U.K. 2.56 18 Sweden 3.63 18 Spain 2.31
19 denmark 2.49 19 Switzerland 3.27 19 France 2.20
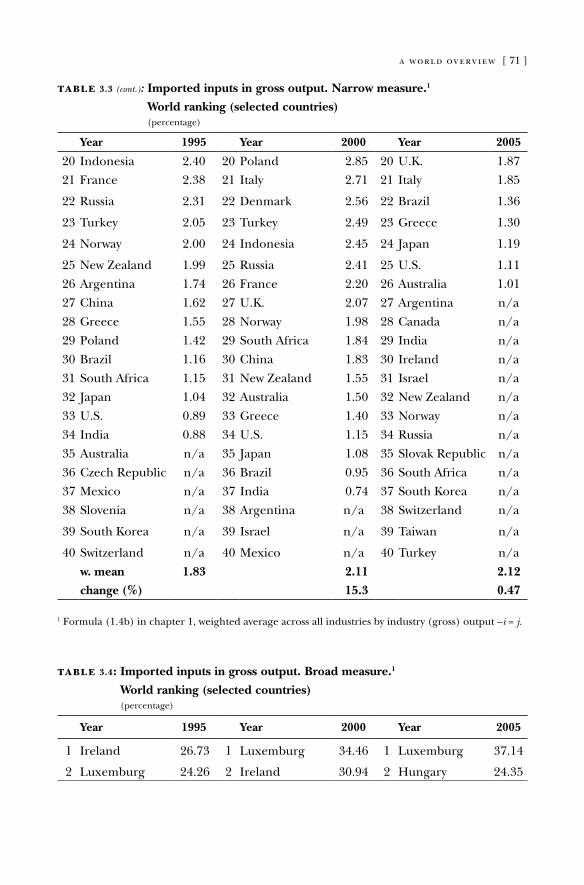
a world overview [ 71 ]
table 3.3 (cont.): Imported inputs in gross output. Narrow measure.1
World ranking (selected countries) (percentage)
Year 1995 Year 2000 Year 2005
20 Indonesia 2.40 20 Poland 2.85 20 U.K. 1.87
21 France 2.38 21 Italy 2.71 21 Italy 1.85
22 russia 2.31 22 denmark 2.56 22 Brazil 1.36
23 Turkey 2.05 23 Turkey 2.49 23 Greece 1.30
24 Norway 2.00 24 Indonesia 2.45 24 Japan 1.19
25 New Zealand 1.99 25 russia 2.41 25 U.S. 1.11
26 argentina 1.74 26 France 2.20 26 australia 1.01
27 China 1.62 27 U.K. 2.07 27 argentina n/a
28 Greece 1.55 28 Norway 1.98 28 Canada n/a
29 Poland 1.42 29 South africa 1.84 29 India n/a
30 Brazil 1.16 30 China 1.83 30 Ireland n/a
31 South africa 1.15 31 New Zealand 1.55 31 Israel n/a
32 Japan 1.04 32 australia 1.50 32 New Zealand n/a
33 U.S. 0.89 33 Greece 1.40 33 Norway n/a
34 India 0.88 34 U.S. 1.15 34 russia n/a
35 australia n/a 35 Japan 1.08 35 Slovak republic n/a
36 Czech republic n/a 36 Brazil 0.95 36 South africa n/a
37 Mexico n/a 37 India 0.74 37 South Korea n/a
38 Slovenia n/a 38 argentina n/a 38 Switzerland n/a
39 South Korea n/a 39 Israel n/a 39 Taiwan n/a
40 Switzerland n/a 40 Mexico n/a 40 Turkey n/a
w. mean 1.83 2.11 2.12
change (%) 15.3 0.47
1 Formula (1.4b) in chapter 1, weighted average across all industries by industry (gross) output –i = j.
table 3.4: Imported inputs in gross output. Broad measure.1
World ranking (selected countries) (percentage)
Year 1995 Year 2000 Year 2005
1 Ireland 26.73 1 luxemburg 34.46 1 luxemburg 37.14
2 luxemburg 24.26 2 Ireland 30.94 2 Hungary 24.35
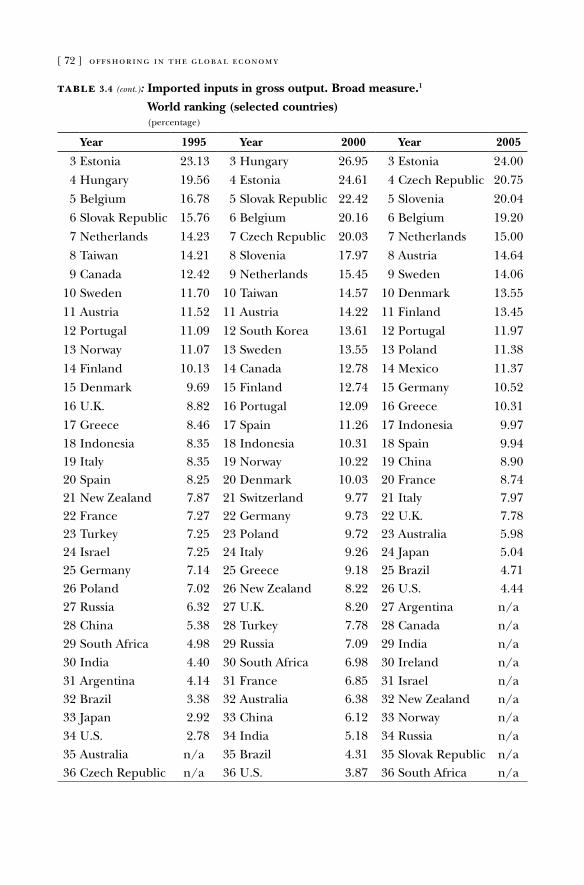
[ 72 ] offshoring in the global economy
table 3.4 (cont.): Imported inputs in gross output. Broad measure.1
World ranking (selected countries) (percentage)
Year 1995 Year 2000 Year 2005
3 Estonia 23.13 3 Hungary 26.95 3 Estonia 24.00
4 Hungary 19.56 4 Estonia 24.61 4 Czech republic 20.75
5 Belgium 16.78 5 Slovak republic 22.42 5 Slovenia 20.04
6 Slovak republic 15.76 6 Belgium 20.16 6 Belgium 19.20
7 Netherlands 14.23 7 Czech republic 20.03 7 Netherlands 15.00
8 Taiwan 14.21 8 Slovenia 17.97 8 austria 14.64
9 Canada 12.42 9 Netherlands 15.45 9 Sweden 14.06
10 Sweden 11.70 10 Taiwan 14.57 10 denmark 13.55
11 austria 11.52 11 austria 14.22 11 Finland 13.45
12 Portugal 11.09 12 South Korea 13.61 12 Portugal 11.97
13 Norway 11.07 13 Sweden 13.55 13 Poland 11.38
14 Finland 10.13 14 Canada 12.78 14 Mexico 11.37
15 denmark 9.69 15 Finland 12.74 15 Germany 10.52
16 U.K. 8.82 16 Portugal 12.09 16 Greece 10.31
17 Greece 8.46 17 Spain 11.26 17 Indonesia 9.9718 Indonesia 8.35 18 Indonesia 10.31 18 Spain 9.9419 Italy 8.35 19 Norway 10.22 19 China 8.9020 Spain 8.25 20 denmark 10.03 20 France 8.7421 New Zealand 7.87 21 Switzerland 9.77 21 Italy 7.9722 France 7.27 22 Germany 9.73 22 U.K. 7.7823 Turkey 7.25 23 Poland 9.72 23 australia 5.9824 Israel 7.25 24 Italy 9.26 24 Japan 5.0425 Germany 7.14 25 Greece 9.18 25 Brazil 4.7126 Poland 7.02 26 New Zealand 8.22 26 U.S. 4.4427 russia 6.32 27 U.K. 8.20 27 argentina n/a28 China 5.38 28 Turkey 7.78 28 Canada n/a29 South africa 4.98 29 russia 7.09 29 India n/a30 India 4.40 30 South africa 6.98 30 Ireland n/a31 argentina 4.14 31 France 6.85 31 Israel n/a32 Brazil 3.38 32 australia 6.38 32 New Zealand n/a33 Japan 2.92 33 China 6.12 33 Norway n/a34 U.S. 2.78 34 India 5.18 34 russia n/a35 australia n/a 35 Brazil 4.31 35 Slovak republic n/a36 Czech republic n/a 36 U.S. 3.87 36 South africa n/a
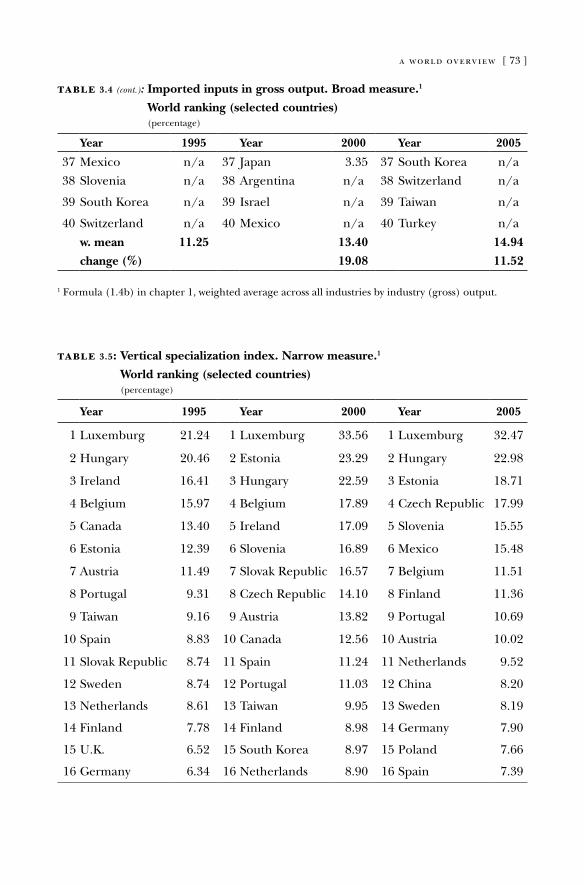
a world overview [ 73 ]
table 3.4 (cont.): Imported inputs in gross output. Broad measure.1
World ranking (selected countries) (percentage)
Year 1995 Year 2000 Year 2005
37 Mexico n/a 37 Japan 3.35 37 South Korea n/a
38 Slovenia n/a 38 argentina n/a 38 Switzerland n/a
39 South Korea n/a 39 Israel n/a 39 Taiwan n/a
40 Switzerland n/a 40 Mexico n/a 40 Turkey n/a
w. mean 11.25 13.40 14.94
change (%) 19.08 11.52
1 Formula (1.4b) in chapter 1, weighted average across all industries by industry (gross) output.
table 3.5: Vertical specialization index. Narrow measure.1
World ranking (selected countries) (percentage)
Year 1995 Year 2000 Year 2005
1 luxemburg 21.24 1 luxemburg 33.56 1 luxemburg 32.47
2 Hungary 20.46 2 Estonia 23.29 2 Hungary 22.98
3 Ireland 16.41 3 Hungary 22.59 3 Estonia 18.71
4 Belgium 15.97 4 Belgium 17.89 4 Czech republic 17.99
5 Canada 13.40 5 Ireland 17.09 5 Slovenia 15.55
6 Estonia 12.39 6 Slovenia 16.89 6 Mexico 15.48
7 austria 11.49 7 Slovak republic 16.57 7 Belgium 11.51
8 Portugal 9.31 8 Czech republic 14.10 8 Finland 11.36
9 Taiwan 9.16 9 austria 13.82 9 Portugal 10.69
10 Spain 8.83 10 Canada 12.56 10 austria 10.02
11 Slovak republic 8.74 11 Spain 11.24 11 Netherlands 9.52
12 Sweden 8.74 12 Portugal 11.03 12 China 8.20
13 Netherlands 8.61 13 Taiwan 9.95 13 Sweden 8.19
14 Finland 7.78 14 Finland 8.98 14 Germany 7.90
15 U.K. 6.52 15 South Korea 8.97 15 Poland 7.66
16 Germany 6.34 16 Netherlands 8.90 16 Spain 7.39
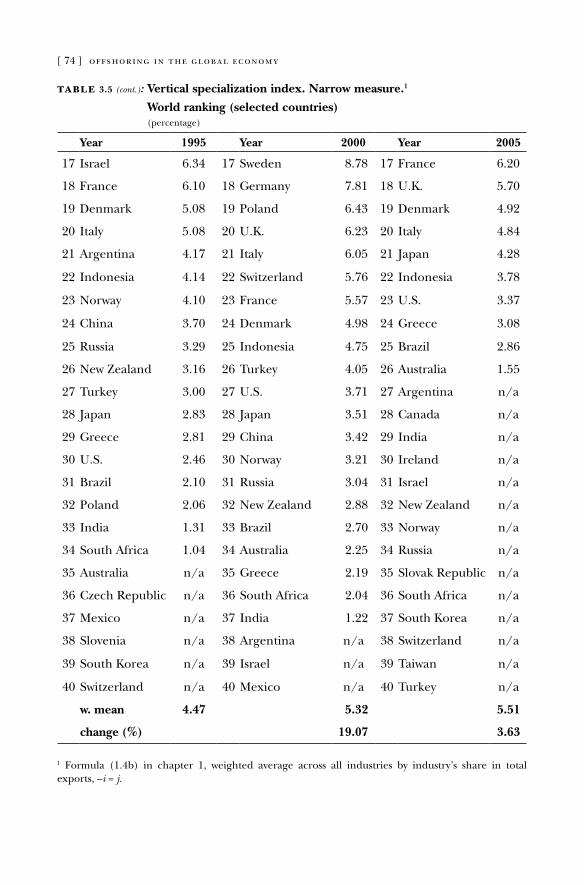
[ 74 ] offshoring in the global economy
table 3.5 (cont.): Vertical specialization index. Narrow measure.1
World ranking (selected countries) (percentage)
Year 1995 Year 2000 Year 2005
17 Israel 6.34 17 Sweden 8.78 17 France 6.20
18 France 6.10 18 Germany 7.81 18 U.K. 5.70
19 denmark 5.08 19 Poland 6.43 19 denmark 4.92
20 Italy 5.08 20 U.K. 6.23 20 Italy 4.84
21 argentina 4.17 21 Italy 6.05 21 Japan 4.28
22 Indonesia 4.14 22 Switzerland 5.76 22 Indonesia 3.78
23 Norway 4.10 23 France 5.57 23 U.S. 3.37
24 China 3.70 24 denmark 4.98 24 Greece 3.08
25 russia 3.29 25 Indonesia 4.75 25 Brazil 2.86
26 New Zealand 3.16 26 Turkey 4.05 26 australia 1.55
27 Turkey 3.00 27 U.S. 3.71 27 argentina n/a
28 Japan 2.83 28 Japan 3.51 28 Canada n/a
29 Greece 2.81 29 China 3.42 29 India n/a
30 U.S. 2.46 30 Norway 3.21 30 Ireland n/a
31 Brazil 2.10 31 russia 3.04 31 Israel n/a
32 Poland 2.06 32 New Zealand 2.88 32 New Zealand n/a
33 India 1.31 33 Brazil 2.70 33 Norway n/a
34 South africa 1.04 34 australia 2.25 34 russia n/a
35 australia n/a 35 Greece 2.19 35 Slovak republic n/a
36 Czech republic n/a 36 South africa 2.04 36 South africa n/a
37 Mexico n/a 37 India 1.22 37 South Korea n/a
38 Slovenia n/a 38 argentina n/a 38 Switzerland n/a
39 South Korea n/a 39 Israel n/a 39 Taiwan n/a
40 Switzerland n/a 40 Mexico n/a 40 Turkey n/a
w. mean 4.47 5.32 5.51
change (%) 19.07 3.63
1 Formula (1.4b) in chapter 1, weighted average across all industries by industry’s share in total exports, –i = j.
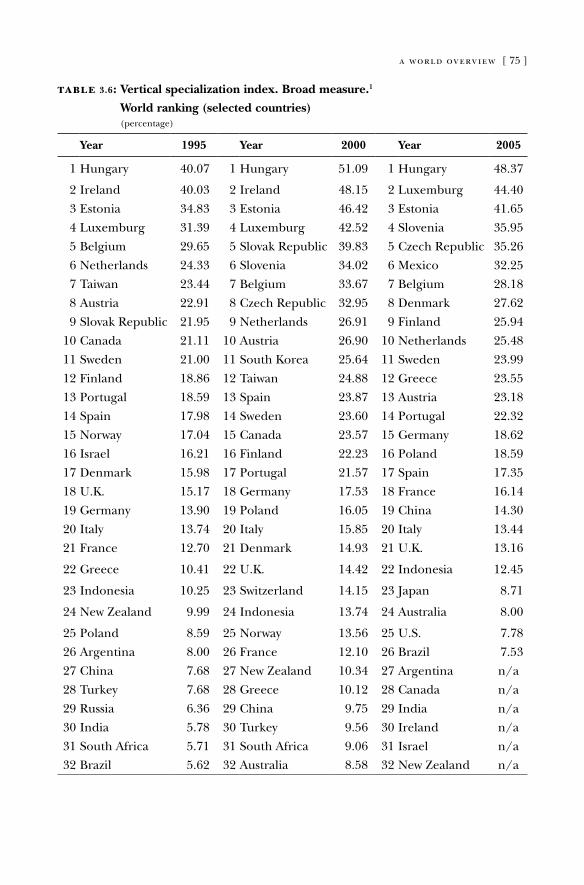
a world overview [ 75 ]
table 3.6: Vertical specialization index. Broad measure.1
World ranking (selected countries) (percentage)
Year 1995 Year 2000 Year 2005
1 Hungary 40.07 1 Hungary 51.09 1 Hungary 48.37
2 Ireland 40.03 2 Ireland 48.15 2 luxemburg 44.40
3 Estonia 34.83 3 Estonia 46.42 3 Estonia 41.65
4 luxemburg 31.39 4 luxemburg 42.52 4 Slovenia 35.95
5 Belgium 29.65 5 Slovak republic 39.83 5 Czech republic 35.26
6 Netherlands 24.33 6 Slovenia 34.02 6 Mexico 32.25
7 Taiwan 23.44 7 Belgium 33.67 7 Belgium 28.18
8 austria 22.91 8 Czech republic 32.95 8 denmark 27.62
9 Slovak republic 21.95 9 Netherlands 26.91 9 Finland 25.94
10 Canada 21.11 10 austria 26.90 10 Netherlands 25.48
11 Sweden 21.00 11 South Korea 25.64 11 Sweden 23.99
12 Finland 18.86 12 Taiwan 24.88 12 Greece 23.55
13 Portugal 18.59 13 Spain 23.87 13 austria 23.18
14 Spain 17.98 14 Sweden 23.60 14 Portugal 22.32
15 Norway 17.04 15 Canada 23.57 15 Germany 18.62
16 Israel 16.21 16 Finland 22.23 16 Poland 18.59
17 denmark 15.98 17 Portugal 21.57 17 Spain 17.35
18 U.K. 15.17 18 Germany 17.53 18 France 16.14
19 Germany 13.90 19 Poland 16.05 19 China 14.30
20 Italy 13.74 20 Italy 15.85 20 Italy 13.44
21 France 12.70 21 denmark 14.93 21 U.K. 13.16
22 Greece 10.41 22 U.K. 14.42 22 Indonesia 12.45
23 Indonesia 10.25 23 Switzerland 14.15 23 Japan 8.71
24 New Zealand 9.99 24 Indonesia 13.74 24 australia 8.00
25 Poland 8.59 25 Norway 13.56 25 U.S. 7.78
26 argentina 8.00 26 France 12.10 26 Brazil 7.53
27 China 7.68 27 New Zealand 10.34 27 argentina n/a
28 Turkey 7.68 28 Greece 10.12 28 Canada n/a
29 russia 6.36 29 China 9.75 29 India n/a
30 India 5.78 30 Turkey 9.56 30 Ireland n/a
31 South africa 5.71 31 South africa 9.06 31 Israel n/a
32 Brazil 5.62 32 australia 8.58 32 New Zealand n/a
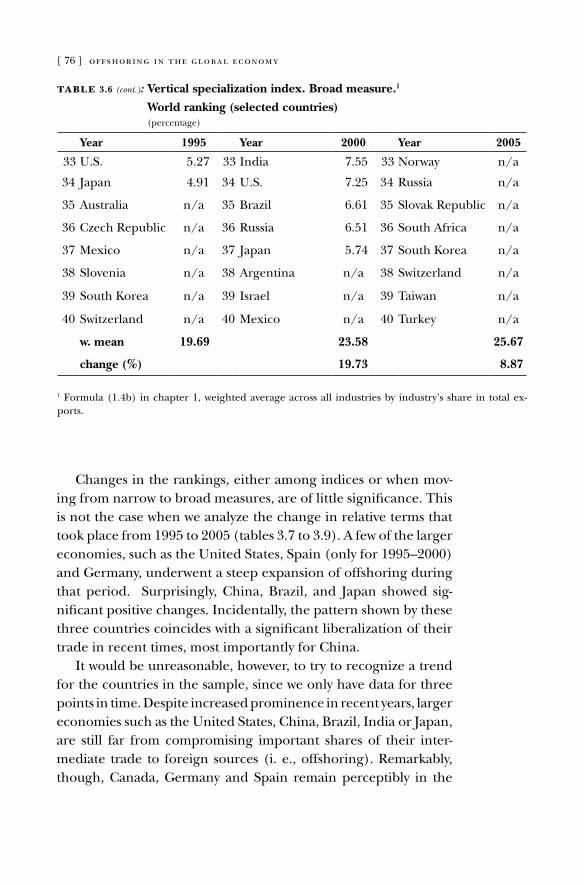
[ 76 ] offshoring in the global economy
Changes in the rankings, either among indices or when mov-ing from narrow to broad measures, are of little significance. This is not the case when we analyze the change in relative terms that took place from 1995 to 2005 (tables 3.7 to 3.9). a few of the larger economies, such as the United States, Spain (only for 1995–2000) and Germany, underwent a steep expansion of offshoring during that period. Surprisingly, China, Brazil, and Japan showed sig-nificant positive changes. Incidentally, the pattern shown by these three countries coincides with a significant liberalization of their trade in recent times, most importantly for China.
It would be unreasonable, however, to try to recognize a trend for the countries in the sample, since we only have data for three points in time. despite increased prominence in recent years, larger economies such as the United States, China, Brazil, India or Japan, are still far from compromising important shares of their inter-mediate trade to foreign sources (i. e., offshoring). remarkably, though, Canada, Germany and Spain remain perceptibly in the
table 3.6 (cont.): Vertical specialization index. Broad measure.1
World ranking (selected countries) (percentage)
Year 1995 Year 2000 Year 2005
33 U.S. 5.27 33 India 7.55 33 Norway n/a
34 Japan 4.91 34 U.S. 7.25 34 russia n/a
35 australia n/a 35 Brazil 6.61 35 Slovak republic n/a
36 Czech republic n/a 36 russia 6.51 36 South africa n/a
37 Mexico n/a 37 Japan 5.74 37 South Korea n/a
38 Slovenia n/a 38 argentina n/a 38 Switzerland n/a
39 South Korea n/a 39 Israel n/a 39 Taiwan n/a
40 Switzerland n/a 40 Mexico n/a 40 Turkey n/a
w. mean 19.69 23.58 25.67
change (%) 19.73 8.87
1 Formula (1.4b) in chapter 1, weighted average across all industries by industry’s share in total ex-ports.
a world overview [ 77 ]
margins.21 The reason for this performance in the three countries remains unknown, yet we may venture a logical explanation. In all cases the country of origin (or source country) is right at the bor-der of a vast and open market that is close geographically, cultural-ly, or both. a trading partnership between Canada and the United States dates back to when both nations were born. one should presume that Canadian and U.S. firms are easily relocating across the border, yet as it turns out, it seems relatively more significant for Canada. Similarly, Germany and Spain find unbeatable oppor-tunities in Eastern Europe and Northern africa, respectively. one should not to forget the tremendous business opportunities that latin american countries offer Spanish firms. although they do not share the same border, both territories share a cultural back-ground that allows a meaningful entrepreneurial understanding.
21 The figures for Germany are very similar to those in Horgos (2008), who relies on German data alone. For instance, his broad measure for 1995 and 2000, when weighting for total inputs, stands at 15 and 19 percent, respectively. When weighting for output these indices are 6 and 8 percent. our data show the following: 14 and 18 percent (table 3.2), and 7 and 10 percent (table 3.4). Furthermore, growth rates in his data and ours are also similar.
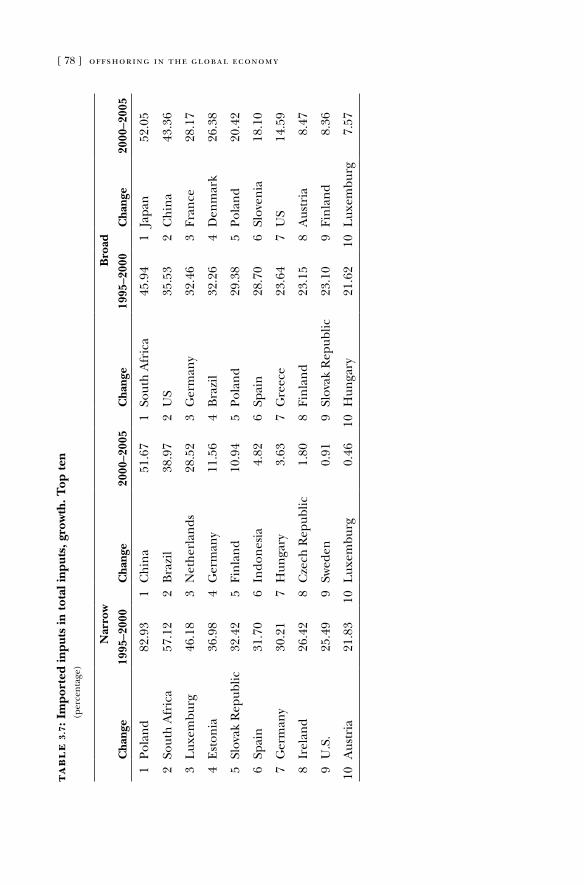
[ 78 ] offshoring in the global economyta
bl
e 3
.7: I
mpo
rted
inpu
ts in
tot
al in
puts
, gro
wth
. Top
ten
(p
erce
nta
ge)
Nar
row
Bro
ad
Cha
nge
1995
–200
0C
hang
e20
00–2
005
Cha
nge
1995
–200
0C
hang
e20
00–2
005
1Po
lan
d82
.93
1C
hin
a51
.67
1So
uth
afr
ica
45.9
41
Japa
n52
.05
2So
uth
afr
ica
57.1
22
Bra
zil
38.9
72
US
35.5
32
Ch
ina
43.3
6
3l
uxem
burg
46.1
83
Net
her
lan
ds28
.52
3G
erm
any
32.4
63
Fran
ce28
.17
4E
ston
ia36
.98
4G
erm
any
11.5
64
Bra
zil
32.2
64
den
mar
k26
.38
5Sl
ovak
rep
ublic
32.4
25
Fin
lan
d10
.94
5Po
lan
d29
.38
5Po
lan
d20
.42
6Sp
ain
31.7
06
Indo
nes
ia4.
826
Spai
n28
.70
6Sl
oven
ia18
.10
7G
erm
any
30.2
17
Hun
gary
3.63
7G
reec
e23
.64
7U
S14
.59
8Ir
elan
d26
.42
8C
zech
rep
ublic
1.80
8Fi
nla
nd
23.1
58
aus
tria
8.47
9U
.S.
25.4
99
Swed
en0.
919
Slov
ak r
epub
lic23
.10
9Fi
nla
nd
8.36
10a
ustr
ia21
.83
10l
uxem
burg
0.46
10H
unga
ry21
.62
10l
uxem
burg
7.57

a world overview [ 79 ]
tab
le
3.8
: Im
port
ed in
puts
in g
ross
out
put,
gro
wth
. Top
ten
(p
erce
nta
ge)
Nar
row
Bro
ad
Cha
nge
1995
–200
0C
hang
e20
00–2
005
Cha
nge
1995
–200
0C
hang
e20
00–2
005
1Po
lan
d10
0.70
1C
hin
a63
.39
1Sl
ovak
rep
ublic
42.2
91
Japa
n50
.55
2l
uxem
burg
81.6
92
Bra
zil
43.1
62
lux
embu
rg42
.03
2C
hin
a45
.45
3So
uth
afr
ica
60.0
03
Net
her
lan
ds16
.11
3So
uth
afr
ica
40.0
63
den
mar
k35
.05
4Sl
ovak
rep
ublic
50.8
84
Japa
n10
.19
4U
.S.
39.2
04
Fran
ce27
.56
5E
ston
ia49
.13
5G
erm
any
8.87
5Po
lan
d38
.46
5Po
lan
d17
.07
6Sp
ain
37.0
66
Fin
lan
d8.
796
Hun
gary
37.7
76
U.S
.14
.91
7G
erm
any
36.2
67
Cze
ch r
epub
lic7.
767
Spai
n36
.56
7G
reec
e12
.21
8a
ustr
ia35
.44
8Po
lan
d6.
328
Ger
man
y36
.25
8Sl
oven
ia11
.54
9U
.S.
29.2
19
Fran
ce0.
009
Bra
zil
27.6
29
Bra
zil
9.21
10H
unga
ry28
.67
10l
uxem
burg
–0.1
310
Fin
lan
d25
.82
10G
erm
any
8.10
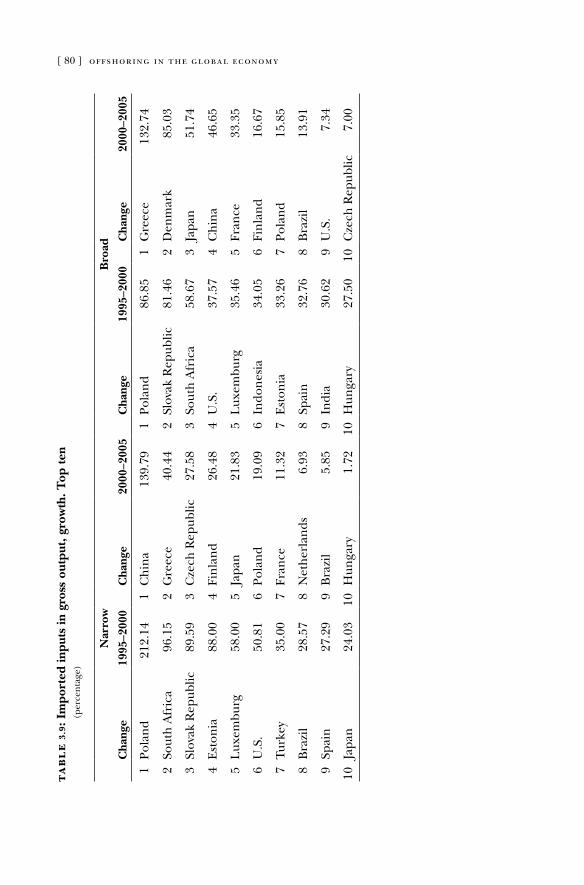
[ 80 ] offshoring in the global economyta
bl
e 3
.9: I
mpo
rted
inpu
ts in
gro
ss o
utpu
t, g
row
th. T
op t
en
(per
cen
tage
)
Nar
row
Bro
ad
Cha
nge
1995
–200
0C
hang
e20
00–2
005
Cha
nge
1995
–200
0C
hang
e20
00–2
005
1Po
lan
d21
2.14
1C
hin
a13
9.79
1Po
lan
d86
.85
1G
reec
e13
2.74
2So
uth
afr
ica
96.1
52
Gre
ece
40.4
42
Slov
ak r
epub
lic81
.46
2d
enm
ark
85.0
3
3Sl
ovak
rep
ublic
89.5
93
Cze
ch r
epub
lic27
.58
3So
uth
afr
ica
58.6
73
Japa
n51
.74
4E
ston
ia88
.00
4Fi
nla
nd
26.4
84
U.S
.37
.57
4C
hin
a46
.65
5l
uxem
burg
58.0
05
Japa
n21
.83
5l
uxem
burg
35.4
65
Fran
ce33
.35
6U
.S.
50.8
16
Pola
nd
19.0
96
Indo
nes
ia34
.05
6Fi
nla
nd
16.6
7
7Tu
rkey
35.0
07
Fran
ce11
.32
7E
ston
ia33
.26
7Po
lan
d15
.85
8B
razi
l28
.57
8N
eth
erla
nds
6.93
8Sp
ain
32.7
68
Bra
zil
13.9
1
9Sp
ain
27.2
99
Bra
zil
5.85
9In
dia
30.6
29
U.S
.7.
34
10Ja
pan
24.0
310
Hun
gary
1.72
10H
unga
ry27
.50
10C
zech
rep
ublic
7.00
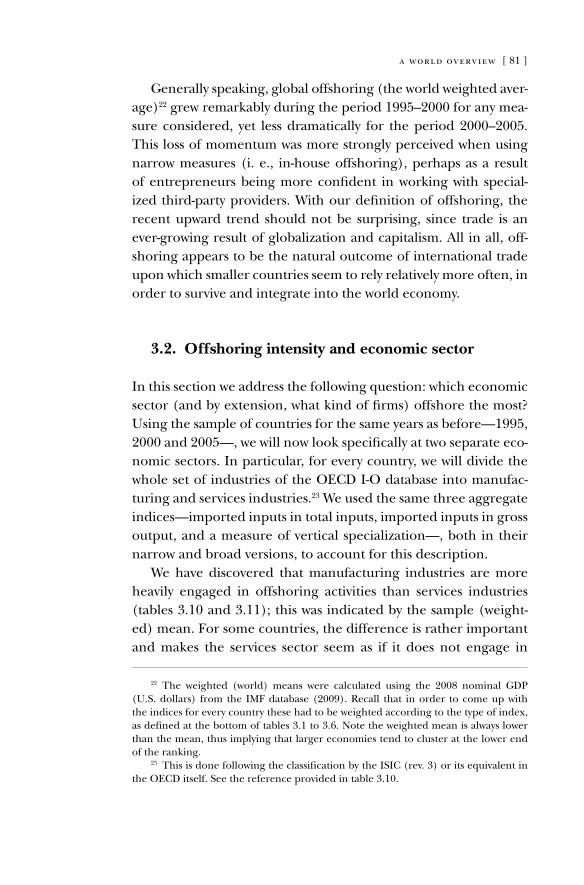
a world overview [ 81 ]
Generally speaking, global offshoring (the world weighted aver- age)22 grew remarkably during the period 1995–2000 for any mea- sure considered, yet less dramatically for the period 2000–2005. This loss of momentum was more strongly perceived when using narrow measures (i. e., in-house offshoring), perhaps as a result of entrepreneurs being more confident in working with special-ized third-party providers. With our definition of offshoring, the recent upward trend should not be surprising, since trade is an ever-growing result of globalization and capitalism. all in all, off-shoring appears to be the natural outcome of international trade upon which smaller countries seem to rely relatively more often, in order to survive and integrate into the world economy.
3.2. Offshoring intensity and economic sector
In this section we address the following question: which economic sector (and by extension, what kind of firms) offshore the most? Using the sample of countries for the same years as before—1995, 2000 and 2005—, we will now look specifically at two separate eco-nomic sectors. In particular, for every country, we will divide the whole set of industries of the oECd I-o database into manufac-turing and services industries.23 We used the same three aggregate indices—imported inputs in total inputs, imported inputs in gross output, and a measure of vertical specialization—, both in their narrow and broad versions, to account for this description.
We have discovered that manufacturing industries are more heavily engaged in offshoring activities than services industries (tables 3.10 and 3.11); this was indicated by the sample (weight-ed) mean. For some countries, the difference is rather important and makes the services sector seem as if it does not engage in
22 The weighted (world) means were calculated using the 2008 nominal GdP (U.S. dollars) from the IMF database (2009). recall that in order to come up with the indices for every country these had to be weighted according to the type of index, as defined at the bottom of tables 3.1 to 3.6. Note the weighted mean is always lower than the mean, thus implying that larger economies tend to cluster at the lower end of the ranking.
23 This is done following the classification by the ISIC (rev. 3) or its equivalent in the oECd itself. See the reference provided in table 3.10.

[ 82 ] offshoring in the global economy
international trade at all. This is seen more easily using the nar-row measure. For example, in argentina, China, Greece, and the United States, the offshoring intensity of the manufacturing sec-tor is, in general, overwhelmingly superior to that of the services sector. When considering the broad measure, the picture is now fairly homogeneous, with the intensity in manufacturing indus-tries only doubling or tripling that of services industries, for the whole sample.
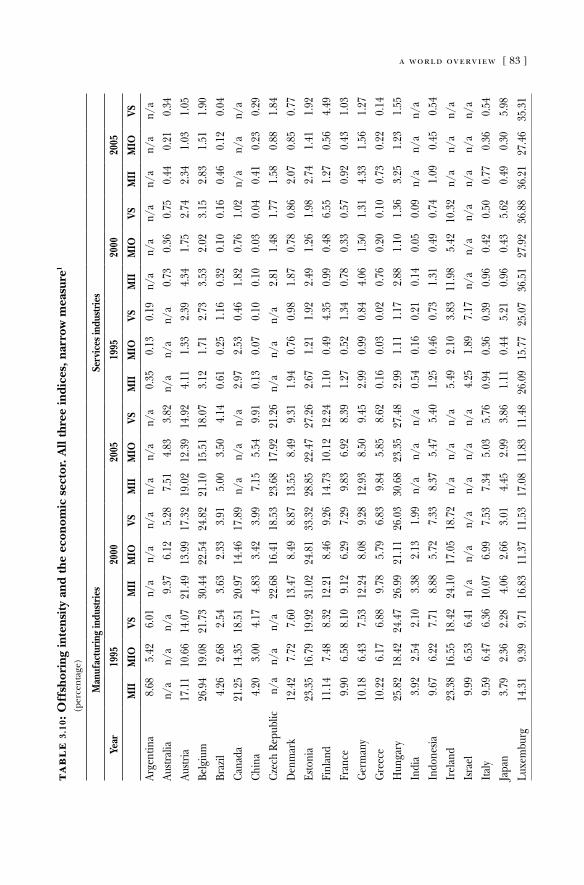
a world overview [ 83 ] ta
bl
e 3
.10:
Off
shor
ing
inte
nsit
y an
d th
e ec
onom
ic s
ecto
r. A
ll th
ree
indi
ces,
nar
row
mea
sure
1 (p
erce
nta
ge)
Man
ufac
turin
g in
dust
ries
Serv
ices
indu
strie
s
Year
1995
2000
2005
1995
2000
2005
MII
MIO
VSM
IIM
IOVS
MII
MIO
VSM
IIM
IOVS
MII
MIO
VSM
IIM
IOVS
arge
ntin
a8.
685.
426.
01n/
an/
an/
an/
an/
an/
a0.
350.
130.
19n/
an/
an/
an/
an/
an/
aau
stral
ian/
an/
an/
a9.
376.
125.
287.
514.
833.
82n/
an/
an/
a0.
730.
360.
750.
440.
210.
34
austr
ia17
.11
10.6
614
.07
21.4
913
.99
17.3
219
.02
12.3
914
.92
4.11
1.33
2.39
4.34
1.75
2.74
2.34
1.03
1.05
Belg
ium
26.9
419
.08
21.7
330
.44
22.5
424
.82
21.1
015
.51
18.0
73.
121.
712.
733.
532.
023.
152.
831.
511.
90
Braz
il4.
262.
682.
543.
632.
333.
915.
003.
504.
140.
610.
251.
160.
320.
100.
160.
460.
120.
04
Cana
da21
.25
14.3
518
.51
20.9
714
.46
17.8
9n/
an/
an/
a2.
972.
530.
461.
820.
761.
02n/
an/
an/
a
Chin
a4.
203.
004.
174.
833.
423.
997.
155.
549.
910.
130.
070.
100.
100.
030.
040.
410.
230.
29
Czec
h re
publ
icn/
an/
an/
a22
.68
16.4
118
.53
23.6
817
.92
21.2
6n/
an/
an/
a2.
811.
481.
771.
580.
881.
84
den
mar
k12
.42
7.72
7.60
13.4
78.
498.
8713
.55
8.49
9.31
1.94
0.76
0.98
1.87
0.78
0.86
2.07
0.85
0.77
Esto
nia
23.3
516
.79
19.9
231
.02
24.8
133
.32
28.8
522
.47
27.2
62.
671.
211.
922.
491.
261.
982.
741.
411.
92
Finl
and
11.1
47.
488.
3212
.21
8.46
9.26
14.7
310
.12
12.2
41.
100.
494.
350.
990.
486.
551.
270.
564.
49
Fran
ce9.
906.
588.
109.
126.
297.
299.
836.
928.
391.
270.
521.
340.
780.
330.
570.
920.
431.
03
Ger
man
y10
.18
6.43
7.53
12.2
48.
089.
2812
.93
8.50
9.45
2.99
0.99
0.84
4.06
1.50
1.31
4.33
1.56
1.27
Gre
ece
10.2
26.
176.
889.
785.
796.
839.
845.
858.
620.
160.
030.
020.
760.
200.
100.
730.
220.
14
Hun
gary
25.8
218
.42
24.4
726
.99
21.1
126
.03
30.6
823
.35
27.4
82.
991.
111.
172.
881.
101.
363.
251.
231.
55
Indi
a3.
922.
542.
103.
382.
131.
99n/
an/
an/
a0.
540.
160.
210.
140.
050.
09n/
an/
an/
a
Indo
nesia
9.67
6.22
7.71
8.88
5.72
7.33
8.37
5.47
5.40
1.25
0.46
0.73
1.31
0.49
0.74
1.09
0.45
0.54
Irel
and
23.3
816
.55
18.4
224
.10
17.0
518
.72
n/a
n/a
n/a
5.49
2.10
3.83
11.9
85.
4210
.32
n/a
n/a
n/a
Isra
el9.
996.
536.
41n/
an/
an/
an/
an/
an/
a4.
251.
897.
17n/
an/
an/
an/
an/
an/
a
Italy
9.59
6.47
6.36
10.0
76.
997.
537.
345.
035.
760.
940.
360.
390.
960.
420.
500.
770.
360.
54
Japa
n3.
792.
362.
284.
062.
663.
014.
452.
993.
861.
110.
445.
210.
960.
435.
620.
490.
305.
98
luxe
mbu
rg14
.31
9.39
9.71
16.8
311
.37
11.5
317
.08
11.8
311
.48
26.0
915
.77
25.0
736
.51
27.9
236
.88
36.2
127
.46
35.3
1
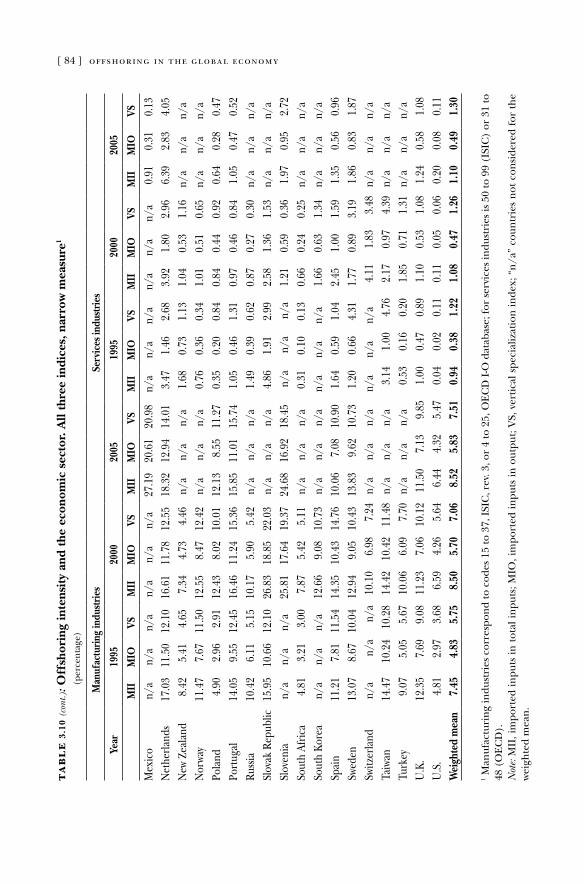
[ 84 ] offshoring in the global economyta
bl
e 3
.10
(con
t.): O
ffsh
orin
g in
tens
ity
and
the
econ
omic
sec
tor.
All
thre
e in
dice
s, n
arro
w m
easu
re1
(per
cen
tage
)
Man
ufac
turin
g in
dust
ries
Serv
ices
indu
strie
s
Year
1995
2000
2005
1995
2000
2005
MII
MIO
VSM
IIM
IOVS
MII
MIO
VSM
IIM
IOVS
MII
MIO
VSM
IIM
IOVS
Mex
ico
n/a
n/a
n/a
n/a
n/a
n/a
27.1
920
.61
20.9
8n/
an/
an/
an/
an/
an/
a0.
910.
310.
13N
ethe
rland
s17
.03
11.5
012
.10
16.6
111
.78
12.5
518
.32
12.9
414
.01
3.47
1.46
2.68
3.92
1.80
2.96
6.39
2.83
4.05
New
Zea
land
8.42
5.41
4.65
7.34
4.73
4.46
n/a
n/a
n/a
1.68
0.73
1.13
1.04
0.53
1.16
n/a
n/a
n/a
Nor
way
11.4
77.
6711
.50
12.5
58.
4712
.42
n/a
n/a
n/a
0.76
0.36
0.34
1.01
0.51
0.65
n/a
n/a
n/a
Pola
nd4.
902.
962.
9112
.43
8.02
10.0
112
.13
8.55
11.2
70.
350.
200.
840.
840.
440.
920.
640.
280.
47Po
rtug
al14
.05
9.55
12.4
516
.46
11.2
415
.36
15.8
511
.01
15.7
41.
050.
461.
310.
970.
460.
841.
050.
470.
52ru
ssia
10.4
26.
115.
1510
.17
5.90
5.42
n/a
n/a
n/a
1.49
0.39
0.62
0.87
0.27
0.30
n/a
n/a
n/a
Slov
ak r
epub
lic15
.95
10.6
612
.10
26.8
318
.85
22.0
3n/
an/
an/
a4.
861.
912.
992.
581.
361.
53n/
an/
an/
aSl
oven
ian/
an/
an/
a25
.81
17.6
419
.37
24.6
816
.92
18.4
5n/
an/
an/
a1.
210.
590.
361.
970.
952.
72So
uth
afric
a4.
813.
213.
007.
875.
425.
11n/
an/
an/
a0.
310.
100.
130.
660.
240.
25n/
an/
an/
aSo
uth
Kore
an/
an/
an/
a12
.66
9.08
10.7
3n/
an/
an/
an/
an/
an/
a1.
660.
631.
34n/
an/
an/
aSp
ain
11.2
17.
8111
.54
14.3
510
.43
14.7
610
.06
7.08
10.9
01.
640.
591.
042.
451.
001.
591.
350.
560.
96Sw
eden
13.0
78.
6710
.04
12.9
49.
0510
.43
13.8
39.
6210
.73
1.20
0.66
4.31
1.77
0.89
3.19
1.86
0.83
1.87
Switz
erla
ndn/
an/
an/
a10
.10
6.98
7.24
n/a
n/a
n/a
n/a
n/a
n/a
4.11
1.83
3.48
n/a
n/a
n/a
Taiw
an14
.47
10.2
410
.28
14.4
210
.42
11.4
8n/
an/
an/
a3.
141.
004.
762.
170.
974.
39n/
an/
an/
aTu
rkey
9.07
5.05
5.67
10.0
66.
097.
70n/
an/
an/
a0.
530.
160.
201.
850.
711.
31n/
an/
an/
aU
.K.
12.3
57.
699.
0811
.23
7.06
10.1
211
.50
7.13
9.85
1.00
0.47
0.89
1.10
0.53
1.08
1.24
0.58
1.08
U.S
.4.
812.
973.
686.
594.
265.
646.
444.
325.
470.
040.
020.
110.
110.
050.
060.
200.
080.
11W
eigh
ted
mea
n7.
454.
835.
758.
505.
707.
068.
525.
837.
510.
940.
381.
221.
080.
471.
261.
100.
491.
30
1 Man
ufac
turi
ng
indu
stri
es c
orre
spon
d to
cod
es 1
5 to
37,
ISI
C, r
ev. 3
, or
4 to
25,
oE
Cd
I-o
dat
abas
e; fo
r se
rvic
es in
dust
ries
is 5
0 to
99
(ISI
C)
or 3
1 to
48
(o
EC
d).
Not
e: M
II, i
mpo
rted
inpu
ts in
tot
al in
puts
; MIo
, im
port
ed in
puts
in o
utpu
t; V
S, v
erti
cal s
peci
aliz
atio
n in
dex;
“n
/a”
coun
trie
s n
ot c
onsi
dere
d fo
r th
e w
eigh
ted
mea
n.
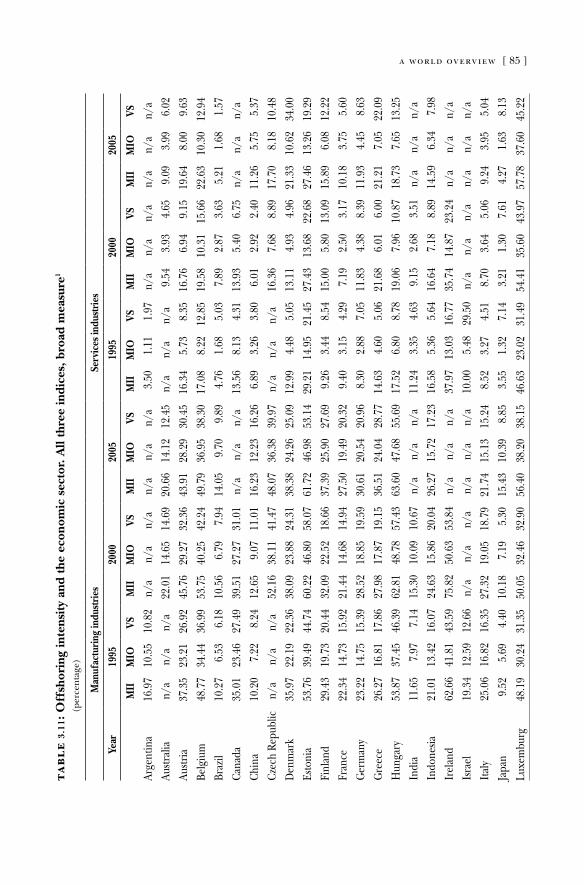
a world overview [ 85 ] ta
bl
e 3
.11:
Off
shor
ing
inte
nsit
y an
d th
e ec
onom
ic s
ecto
r. A
ll th
ree
indi
ces,
bro
ad m
easu
re1
(per
cen
tage
)
Man
ufac
turin
g in
dust
ries
Serv
ices
indu
strie
s
Year
1995
2000
2005
1995
2000
2005
MII
MIO
VSM
IIM
IOVS
MII
MIO
VSM
IIM
IOVS
MII
MIO
VSM
IIM
IOVS
arge
ntin
a16
.97
10.5
510
.82
n/a
n/a
n/a
n/a
n/a
n/a
3.50
1.11
1.97
n/a
n/a
n/a
n/a
n/a
n/a
austr
alia
n/a
n/a
n/a
22.0
114
.65
14.6
920
.66
14.1
212
.45
n/a
n/a
n/a
9.54
3.93
4.65
9.09
3.99
6.02
austr
ia37
.35
23.2
126
.92
45.7
629
.27
32.3
643
.91
28.2
930
.45
16.3
45.
738.
3516
.76
6.94
9.15
19.6
48.
009.
63
Belg
ium
48.7
734
.44
36.9
953
.75
40.2
542
.24
49.7
936
.95
38.3
017
.08
8.22
12.8
519
.58
10.3
115
.66
22.6
310
.30
12.9
4
Braz
il10
.27
6.53
6.18
10.5
66.
797.
9414
.05
9.70
9.89
4.76
1.68
5.03
7.89
2.87
3.63
5.21
1.68
1.57
Cana
da35
.01
23.4
627
.49
39.5
127
.27
31.0
1n/
an/
an/
a13
.56
8.13
4.31
13.9
35.
406.
75n/
an/
an/
a
Chin
a10
.20
7.22
8.24
12.6
59.
0711
.01
16.2
312
.23
16.2
66.
893.
263.
806.
012.
922.
4011
.26
5.75
5.37
Czec
h re
publ
icn/
an/
an/
a52
.16
38.1
141
.47
48.0
736
.38
39.9
7n/
an/
an/
a16
.36
7.68
8.89
17.7
08.
1810
.48
den
mar
k35
.97
22.1
922
.36
38.0
923
.88
24.3
138
.38
24.2
625
.09
12.9
94.
485.
0513
.11
4.93
4.96
21.3
310
.62
34.0
0
Esto
nia
53.7
639
.49
44.7
460
.22
46.8
058
.07
61.7
246
.98
53.1
429
.21
14.9
521
.45
27.4
313
.68
22.6
827
.46
13.2
619
.29
Finl
and
29.4
319
.73
20.4
432
.09
22.5
218
.66
37.3
925
.90
27.6
99.
263.
448.
5415
.00
5.80
13.0
915
.89
6.08
12.2
2
Fran
ce22
.34
14.7
315
.92
21.4
414
.68
14.9
427
.50
19.4
920
.32
9.40
3.15
4.29
7.19
2.50
3.17
10.1
83.
755.
60
Ger
man
y23
.22
14.7
515
.39
28.5
218
.85
19.5
930
.61
20.5
420
.96
8.30
2.88
7.05
11.8
34.
388.
3911
.93
4.45
8.63
Gre
ece
26.2
716
.81
17.8
627
.98
17.8
719
.15
36.5
124
.04
28.7
714
.63
4.60
5.06
21.6
86.
016.
0021
.21
7.05
22.0
9
Hun
gary
53.8
737
.45
46.3
962
.81
48.7
857
.43
63.6
047
.68
55.6
917
.52
6.80
8.78
19.0
67.
9610
.87
18.7
37.
6513
.25
Indi
a11
.65
7.97
7.14
15.3
010
.09
10.6
7n/
an/
an/
a11
.24
3.35
4.63
9.15
2.68
3.51
n/a
n/a
n/a
Indo
nesia
21.0
113
.42
16.0
724
.63
15.8
620
.04
26.2
715
.72
17.2
316
.58
5.36
5.64
16.6
47.
188.
8914
.59
6.34
7.98
Irel
and
62.6
641
.81
43.5
975
.82
50.6
353
.84
n/a
n/a
n/a
37.9
713
.03
16.7
735
.74
14.8
723
.24
n/a
n/a
n/a
Isra
el19
.34
12.5
912
.66
n/a
n/a
n/a
n/a
n/a
n/a
10.0
05.
4829
.50
n/a
n/a
n/a
n/a
n/a
n/a
Italy
25.0
616
.82
16.3
527
.32
19.0
518
.79
21.7
415
.13
15.2
48.
523.
274.
518.
703.
645.
069.
243.
955.
04
Japa
n9.
525.
694.
4010
.18
7.19
5.30
15.4
310
.39
8.85
3.55
1.32
7.14
3.21
1.30
7.61
4.27
1.63
8.13
luxe
mbu
rg48
.19
30.2
431
.35
50.0
532
.46
32.9
056
.40
38.2
038
.15
46.6
323
.02
31.4
954
.41
35.6
043
.97
57.7
837
.60
45.2
2
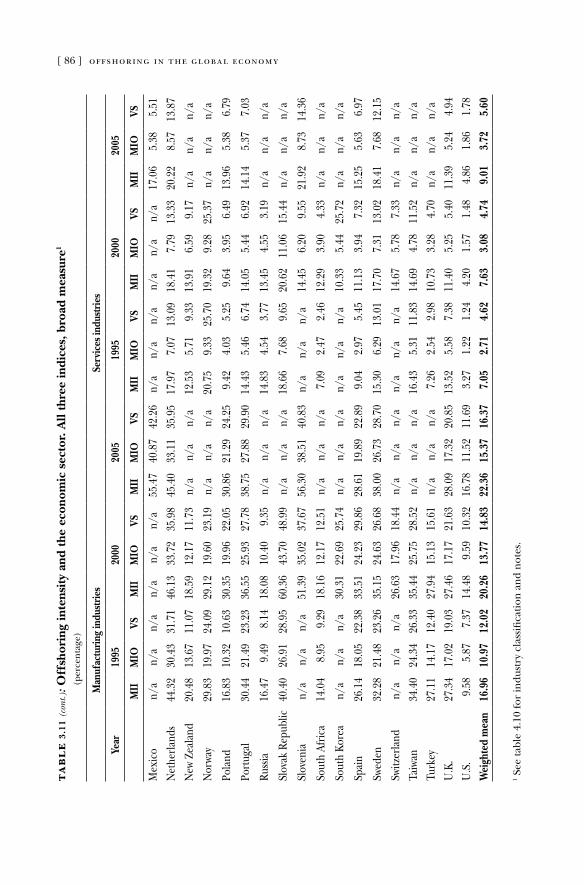
[ 86 ] offshoring in the global economyta
bl
e 3
.11
(con
t.): O
ffsh
orin
g in
tens
ity
and
the
econ
omic
sec
tor.
All
thre
e in
dice
s, b
road
mea
sure
1 (p
erce
nta
ge)
Man
ufac
turin
g in
dust
ries
Serv
ices
indu
strie
s
Year
1995
2000
2005
1995
2000
2005
MII
MIO
VSM
IIM
IOVS
MII
MIO
VSM
IIM
IOVS
MII
MIO
VSM
IIM
IOVS
Mex
ico
n/a
n/a
n/a
n/a
n/a
n/a
55.4
740
.87
42.2
6n/
an/
an/
an/
an/
an/
a17
.06
5.38
5.51
Net
herla
nds
44.3
230
.43
31.7
146
.13
33.7
235
.98
45.4
033
.11
35.9
517
.97
7.07
13.0
918
.41
7.79
13.3
320
.22
8.57
13.8
7
New
Zea
land
20.4
813
.67
11.0
718
.59
12.1
711
.73
n/a
n/a
n/a
12.5
35.
719.
3313
.91
6.59
9.17
n/a
n/a
n/a
Nor
way
29.8
319
.97
24.0
929
.12
19.6
023
.19
n/a
n/a
n/a
20.7
59.
3325
.70
19.3
29.
2825
.37
n/a
n/a
n/a
Pola
nd16
.83
10.3
210
.63
30.3
519
.96
22.0
530
.86
21.2
924
.25
9.42
4.03
5.25
9.64
3.95
6.49
13.9
65.
386.
79
Port
ugal
30.4
421
.49
23.2
336
.55
25.9
327
.78
38.7
527
.88
29.9
014
.43
5.46
6.74
14.0
55.
446.
9214
.14
5.37
7.03
russ
ia16
.47
9.49
8.14
18.0
810
.40
9.35
n/a
n/a
n/a
14.8
34.
543.
7713
.45
4.55
3.19
n/a
n/a
n/a
Slov
ak r
epub
lic40
.40
26.9
128
.95
60.3
643
.70
48.9
9n/
an/
an/
a18
.66
7.68
9.65
20.6
211
.06
15.4
4n/
an/
an/
a
Slov
enia
n/a
n/a
n/a
51.3
935
.02
37.6
756
.30
38.5
140
.83
n/a
n/a
n/a
14.4
56.
209.
5521
.92
8.73
14.3
6
Sout
h af
rica
14.0
48.
959.
2918
.16
12.1
712
.51
n/a
n/a
n/a
7.09
2.47
2.46
12.2
93.
904.
33n/
an/
an/
a
Sout
h Ko
rea
n/a
n/a
n/a
30.3
122
.69
25.7
4n/
an/
an/
an/
an/
an/
a10
.33
5.44
25.7
2n/
an/
an/
a
Spai
n26
.14
18.0
522
.38
33.5
124
.23
29.8
628
.61
19.8
922
.89
9.04
2.97
5.45
11.1
33.
947.
3215
.25
5.63
6.97
Swed
en32
.28
21.4
823
.26
35.1
524
.63
26.6
838
.00
26.7
328
.70
15.3
06.
2913
.01
17.7
07.
3113
.02
18.4
17.
6812
.15
Switz
erla
ndn/
an/
an/
a26
.63
17.9
618
.44
n/a
n/a
n/a
n/a
n/a
n/a
14.6
75.
787.
33n/
an/
an/
a
Taiw
an34
.40
24.3
426
.33
35.4
425
.75
28.5
2n/
an/
an/
a16
.43
5.31
11.8
314
.69
4.78
11.5
2n/
an/
an/
a
Turk
ey27
.11
14.1
712
.40
27.9
415
.13
15.6
1n/
an/
an/
a7.
262.
542.
9810
.73
3.28
4.70
n/a
n/a
n/a
U.K
.27
.34
17.0
219
.03
27.4
617
.17
21.6
328
.09
17.3
220
.85
13.5
25.
587.
3811
.40
5.25
5.40
11.3
95.
244.
94
U.S
.9.
585.
877.
3714
.48
9.59
10.3
216
.78
11.5
211
.69
3.27
1.22
1.24
4.20
1.57
1.48
4.86
1.86
1.78
Wei
ghte
d m
ean
16.9
610
.97
12.0
220
.26
13.7
714
.83
22.3
615
.37
16.3
77.
052.
714.
627.
633.
084.
749.
013.
725.
60
1 See
tabl
e 4.
10 fo
r in
dust
ry c
lass
ifica
tion
an
d n
otes
.
a world overview [ 87 ]
a reasonable explanation for this gap is that the services sector still lags behind (per the three-sector hypothesis) in developing a proper infrastructure or the particular know-how, as has long been the case for manufacturing industries. This seems odd for developed economies with mature high-tech industries and a strong investment in r&d, but there, too, the growing services sector commits a tiny share of its intermediate trade to interna-tional providers. Therefore, all three indices underlie the less relevant offshoring for services industries, something that holds true for both the narrow and broad measures. Nevertheless, as previously mentioned, there are still a great number of potentially offshoreable services that might eventually account for larger fig-ures. When this will occur is unknown.
as for the relative country size, the same pattern emerges here as before, yet is less evident in the manufacturing sector. Small economies rank at the top in both the manufacturing and services sectors, and for both the narrow and broad measures. also, sever-al of the fully developed economies now appear among the most intensive offshorers in this detailed breakdown. Canada, Belgium, austria, the Netherlands, and the Nordic countries are worth high-lighting for the manufacturing sector using both the narrow and broad measures. The same countries can be highlighted for the services sector using the narrow measure (and adding Germany), whereas for the broad measure the display is less disperse. among the larger economies, we should point some of the disappoint-ing performances, namely: the United States, Japan, China, Brazil and India. Their indices are far below the average.
If we look at the sample mean it is easy to recognize a positive change from 1995 to 2005, for all the measures considered. The short span of time for which we can produce the series of indices prevents us from making any further consideration on the evolu-tion of the offshoring phenomenon. It is enough to say that, with the exception of some outlier, the presence of offshoring is con-sistently and significantly more important in the manufacturing than in the services sector. as we shall see in section 3.3, this dif-ferentiation between sectors is closely related to the classification of materials versus services offshoring. Naturally, manufacturing industries have been more concerned with materials offshoring,
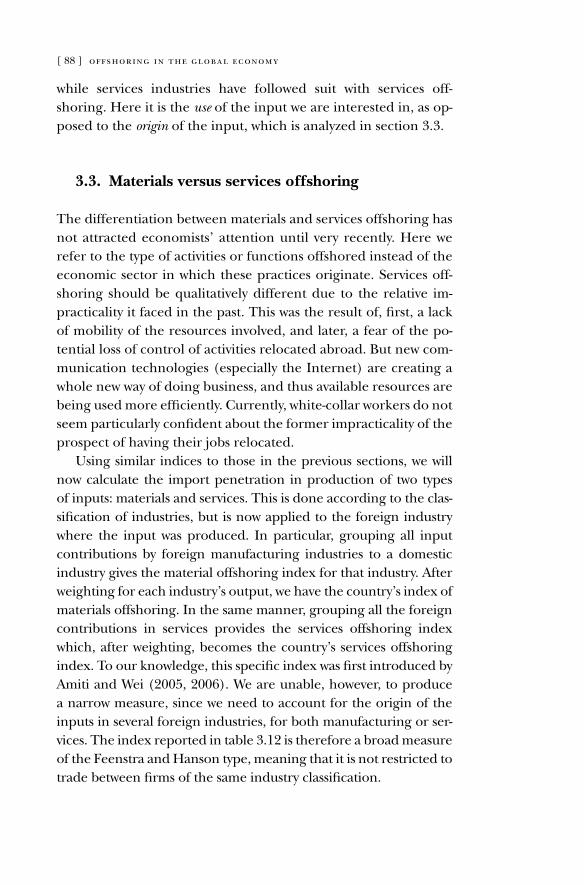
[ 88 ] offshoring in the global economy
while services industries have followed suit with services off- shoring. Here it is the use of the input we are interested in, as op-posed to the origin of the input, which is analyzed in section 3.3.
3.3. Materials versus services offshoring
The differentiation between materials and services offshoring has not attracted economists’ attention until very recently. Here we refer to the type of activities or functions offshored instead of the economic sector in which these practices originate. Services off-shoring should be qualitatively different due to the relative im-practicality it faced in the past. This was the result of, first, a lack of mobility of the resources involved, and later, a fear of the po-tential loss of control of activities relocated abroad. But new com-munication technologies (especially the Internet) are creating a whole new way of doing business, and thus available resources are being used more efficiently. Currently, white-collar workers do not seem particularly confident about the former impracticality of the prospect of having their jobs relocated.
Using similar indices to those in the previous sections, we will now calculate the import penetration in production of two types of inputs: materials and services. This is done according to the clas-sification of industries, but is now applied to the foreign industry where the input was produced. In particular, grouping all input contributions by foreign manufacturing industries to a domestic industry gives the material offshoring index for that industry. after weighting for each industry’s output, we have the country’s index of materials offshoring. In the same manner, grouping all the foreign contributions in services provides the services offshoring index which, after weighting, becomes the country’s services offshoring index. To our knowledge, this specific index was first introduced by amiti and Wei (2005, 2006). We are unable, however, to produce a narrow measure, since we need to account for the origin of the inputs in several foreign industries, for both manufacturing or ser- vices. The index reported in table 3.12 is therefore a broad measure of the Feenstra and Hanson type, meaning that it is not restricted to trade between firms of the same industry classification.
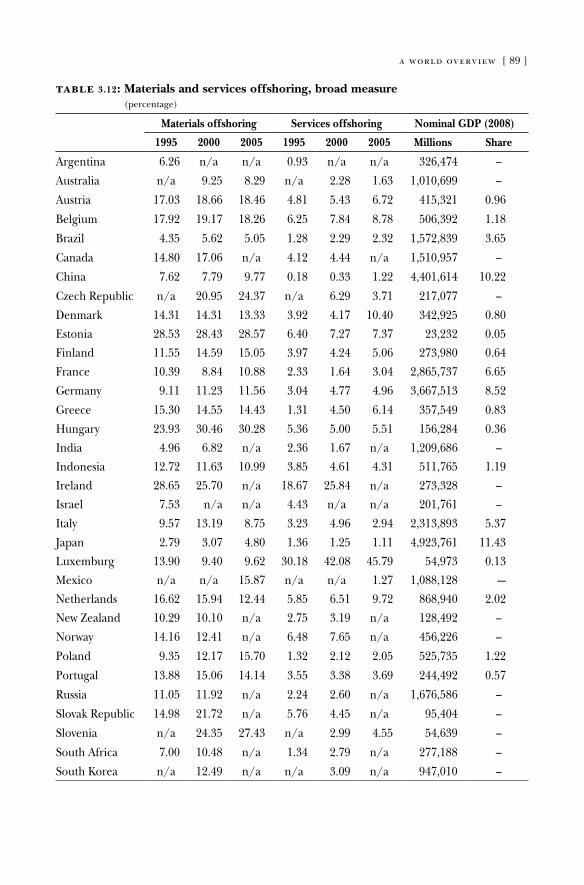
a world overview [ 89 ]
table 3.12: Materials and services offshoring, broad measure (percentage)
Materials offshoring Services offshoring Nominal GDP (2008)
1995 2000 2005 1995 2000 2005 Millions Share
argentina 6.26 n/a n/a 0.93 n/a n/a 326,474 –
australia n/a 9.25 8.29 n/a 2.28 1.63 1,010,699 –
austria 17.03 18.66 18.46 4.81 5.43 6.72 415,321 0.96
Belgium 17.92 19.17 18.26 6.25 7.84 8.78 506,392 1.18
Brazil 4.35 5.62 5.05 1.28 2.29 2.32 1,572,839 3.65
Canada 14.80 17.06 n/a 4.12 4.44 n/a 1,510,957 –
China 7.62 7.79 9.77 0.18 0.33 1.22 4,401,614 10.22
Czech republic n/a 20.95 24.37 n/a 6.29 3.71 217,077 –
denmark 14.31 14.31 13.33 3.92 4.17 10.40 342,925 0.80
Estonia 28.53 28.43 28.57 6.40 7.27 7.37 23,232 0.05
Finland 11.55 14.59 15.05 3.97 4.24 5.06 273,980 0.64
France 10.39 8.84 10.88 2.33 1.64 3.04 2,865,737 6.65
Germany 9.11 11.23 11.56 3.04 4.77 4.96 3,667,513 8.52
Greece 15.30 14.55 14.43 1.31 4.50 6.14 357,549 0.83
Hungary 23.93 30.46 30.28 5.36 5.00 5.51 156,284 0.36
India 4.96 6.82 n/a 2.36 1.67 n/a 1,209,686 –
Indonesia 12.72 11.63 10.99 3.85 4.61 4.31 511,765 1.19
Ireland 28.65 25.70 n/a 18.67 25.84 n/a 273,328 –
Israel 7.53 n/a n/a 4.43 n/a n/a 201,761 –
Italy 9.57 13.19 8.75 3.23 4.96 2.94 2,313,893 5.37
Japan 2.79 3.07 4.80 1.36 1.25 1.11 4,923,761 11.43
luxemburg 13.90 9.40 9.62 30.18 42.08 45.79 54,973 0.13
Mexico n/a n/a 15.87 n/a n/a 1.27 1,088,128 -–
Netherlands 16.62 15.94 12.44 5.85 6.51 9.72 868,940 2.02
New Zealand 10.29 10.10 n/a 2.75 3.19 n/a 128,492 –
Norway 14.16 12.41 n/a 6.48 7.65 n/a 456,226 –
Poland 9.35 12.17 15.70 1.32 2.12 2.05 525,735 1.22
Portugal 13.88 15.06 14.14 3.55 3.38 3.69 244,492 0.57
russia 11.05 11.92 n/a 2.24 2.60 n/a 1,676,586 –
Slovak republic 14.98 21.72 n/a 5.76 4.45 n/a 95,404 –
Slovenia n/a 24.35 27.43 n/a 2.99 4.55 54,639 –
South africa 7.00 10.48 n/a 1.34 2.79 n/a 277,188 –
South Korea n/a 12.49 n/a n/a 3.09 n/a 947,010 –
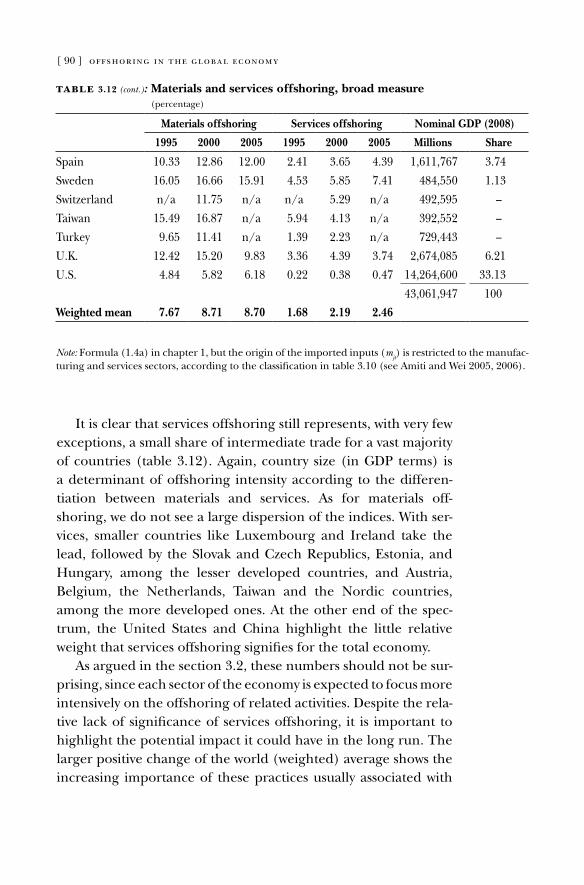
[ 90 ] offshoring in the global economy
It is clear that services offshoring still represents, with very few exceptions, a small share of intermediate trade for a vast majority of countries (table 3.12). again, country size (in GdP terms) is a determinant of offshoring intensity according to the differen- tiation between materials and services. as for materials off- shoring, we do not see a large dispersion of the indices. With ser- vices, smaller countries like luxembourg and Ireland take the lead, followed by the Slovak and Czech republics, Estonia, and Hungary, among the lesser developed countries, and austria, Belgium, the Netherlands, Taiwan and the Nordic countries, among the more developed ones. at the other end of the spec-trum, the United States and China highlight the little relative weight that services offshoring signifies for the total economy.
as argued in the section 3.2, these numbers should not be sur-prising, since each sector of the economy is expected to focus more intensively on the offshoring of related activities. despite the rela-tive lack of significance of services offshoring, it is important to highlight the potential impact it could have in the long run. The larger positive change of the world (weighted) average shows the increasing importance of these practices usually associated with
table 3.12 (cont.): Materials and services offshoring, broad measure (percentage)
Materials offshoring Services offshoring Nominal GDP (2008)
1995 2000 2005 1995 2000 2005 Millions Share
Spain 10.33 12.86 12.00 2.41 3.65 4.39 1,611,767 3.74
Sweden 16.05 16.66 15.91 4.53 5.85 7.41 484,550 1.13
Switzerland n/a 11.75 n/a n/a 5.29 n/a 492,595 –
Taiwan 15.49 16.87 n/a 5.94 4.13 n/a 392,552 –
Turkey 9.65 11.41 n/a 1.39 2.23 n/a 729,443 –
U.K. 12.42 15.20 9.83 3.36 4.39 3.74 2,674,085 6.21
U.S. 4.84 5.82 6.18 0.22 0.38 0.47 14,264,600 33.13
43,061,947 100Weighted mean 7.67 8.71 8.70 1.68 2.19 2.46
Note: Formula (1.4a) in chapter 1, but the origin of the imported inputs (mjt) is restricted to the manufac-
turing and services sectors, according to the classification in table 3.10 (see amiti and Wei 2005, 2006).
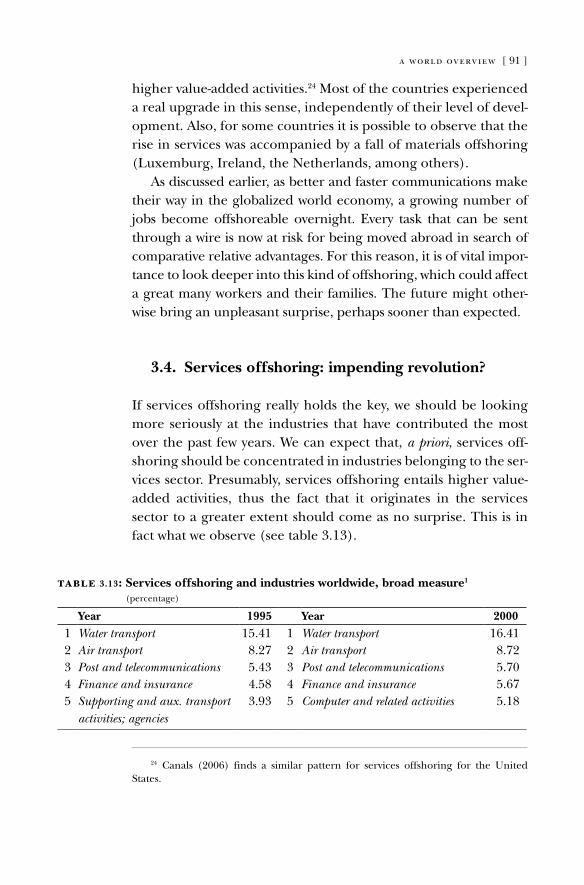
a world overview [ 91 ]
higher value-added activities.24 Most of the countries experienced a real upgrade in this sense, independently of their level of devel-opment. also, for some countries it is possible to observe that the rise in services was accompanied by a fall of materials offshoring (luxemburg, Ireland, the Netherlands, among others).
as discussed earlier, as better and faster communications make their way in the globalized world economy, a growing number of jobs become offshoreable overnight. Every task that can be sent through a wire is now at risk for being moved abroad in search of comparative relative advantages. For this reason, it is of vital impor-tance to look deeper into this kind of offshoring, which could affect a great many workers and their families. The future might other-wise bring an unpleasant surprise, perhaps sooner than expected.
3.4. Services offshoring: impending revolution?
If services offshoring really holds the key, we should be looking more seriously at the industries that have contributed the most over the past few years. We can expect that, a priori, services off-shoring should be concentrated in industries belonging to the ser- vices sector. Presumably, services offshoring entails higher value- added activities, thus the fact that it originates in the services sector to a greater extent should come as no surprise. This is in fact what we observe (see table 3.13).
24 Canals (2006) finds a similar pattern for services offshoring for the United States.
table 3.13: Services offshoring and industries worldwide, broad measure1 (percentage)
Year 1995 Year 20001 Water transport 15.41 1 Water transport 16.412 Air transport 8.27 2 Air transport 8.723 Post and telecommunications 5.43 3 Post and telecommunications 5.704 Finance and insurance 4.58 4 Finance and insurance 5.675 Supporting and aux. transport
activities; agencies3.93 5 Computer and related activities 5.18
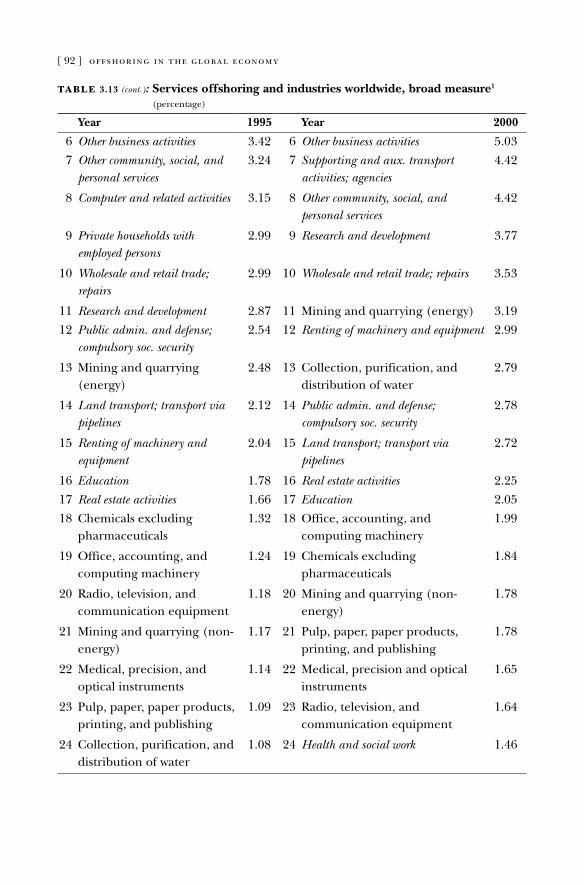
[ 92 ] offshoring in the global economy
table 3.13 (cont.): Services offshoring and industries worldwide, broad measure1 (percentage)
Year 1995 Year 2000
6 Other business activities 3.42 6 Other business activities 5.03
7 Other community, social, and personal services
3.24 7 Supporting and aux. transport activities; agencies
4.42
8 Computer and related activities 3.15 8 Other community, social, and personal services
4.42
9 Private households with employed persons
2.99 9 Research and development 3.77
10 Wholesale and retail trade; repairs
2.99 10 Wholesale and retail trade; repairs 3.53
11 Research and development 2.87 11 Mining and quarrying (energy) 3.19
12 Public admin. and defense; compulsory soc. security
2.54 12 Renting of machinery and equipment 2.99
13 Mining and quarrying (energy)
2.48 13 Collection, purification, and distribution of water
2.79
14 Land transport; transport via pipelines
2.12 14 Public admin. and defense; compulsory soc. security
2.78
15 Renting of machinery and equipment
2.04 15 Land transport; transport via pipelines
2.72
16 Education 1.78 16 Real estate activities 2.25
17 Real estate activities 1.66 17 Education 2.05
18 Chemicals excluding pharmaceuticals
1.32 18 office, accounting, and computing machinery
1.99
19 office, accounting, and computing machinery
1.24 19 Chemicals excluding pharmaceuticals
1.84
20 radio, television, and communication equipment
1.18 20 Mining and quarrying (non-energy)
1.78
21 Mining and quarrying (non-energy)
1.17 21 Pulp, paper, paper products, printing, and publishing
1.78
22 Medical, precision, and optical instruments
1.14 22 Medical, precision and optical instruments
1.65
23 Pulp, paper, paper products, printing, and publishing
1.09 23 radio, television, and communication equipment
1.64
24 Collection, purification, and distribution of water
1.08 24 Health and social work 1.46
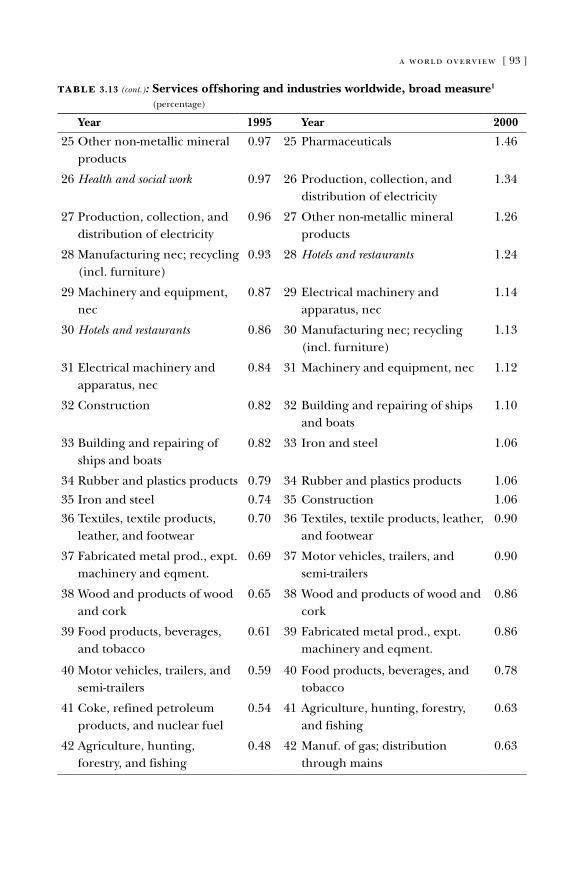
a world overview [ 93 ]
table 3.13 (cont.): Services offshoring and industries worldwide, broad measure1 (percentage)
Year 1995 Year 2000
25 other non-metallic mineral products
0.97 25 Pharmaceuticals 1.46
26 Health and social work 0.97 26 Production, collection, and distribution of electricity
1.34
27 Production, collection, and distribution of electricity
0.96 27 other non-metallic mineral products
1.26
28 Manufacturing nec; recycling (incl. furniture)
0.93 28 Hotels and restaurants 1.24
29 Machinery and equipment, nec
0.87 29 Electrical machinery and apparatus, nec
1.14
30 Hotels and restaurants 0.86 30 Manufacturing nec; recycling (incl. furniture)
1.13
31 Electrical machinery and apparatus, nec
0.84 31 Machinery and equipment, nec 1.12
32 Construction 0.82 32 Building and repairing of ships and boats
1.10
33 Building and repairing of ships and boats
0.82 33 Iron and steel 1.06
34 rubber and plastics products 0.79 34 rubber and plastics products 1.06
35 Iron and steel 0.74 35 Construction 1.06
36 Textiles, textile products, leather, and footwear
0.70 36 Textiles, textile products, leather, and footwear
0.90
37 Fabricated metal prod., expt. machinery and eqment.
0.69 37 Motor vehicles, trailers, and semi-trailers
0.90
38 Wood and products of wood and cork
0.65 38 Wood and products of wood and cork
0.86
39 Food products, beverages, and tobacco
0.61 39 Fabricated metal prod., expt. machinery and eqment.
0.86
40 Motor vehicles, trailers, and semi-trailers
0.59 40 Food products, beverages, and tobacco
0.78
41 Coke, refined petroleum products, and nuclear fuel
0.54 41 agriculture, hunting, forestry, and fishing
0.63
42 agriculture, hunting, forestry, and fishing
0.48 42 Manuf. of gas; distribution through mains
0.63
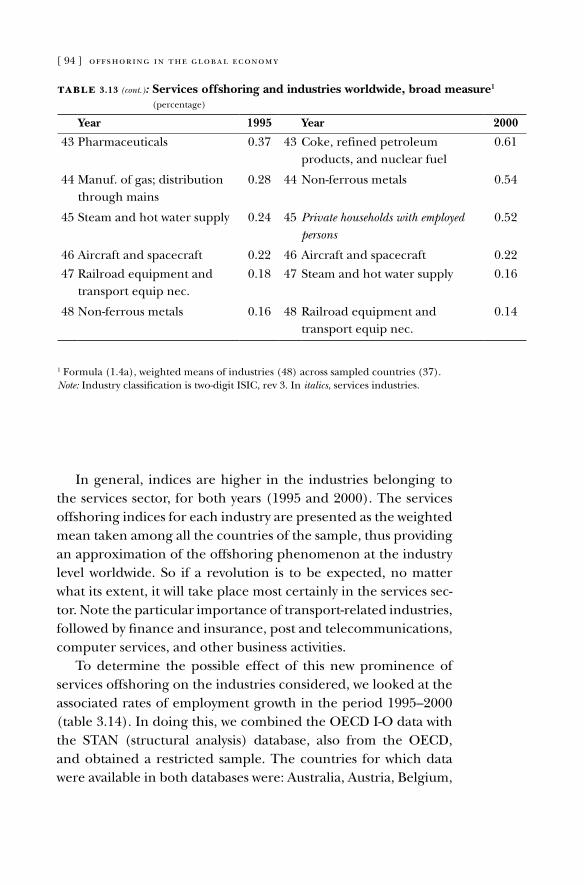
[ 94 ] offshoring in the global economy
In general, indices are higher in the industries belonging to the services sector, for both years (1995 and 2000). The services offshoring indices for each industry are presented as the weighted mean taken among all the countries of the sample, thus providing an approximation of the offshoring phenomenon at the industry level worldwide. So if a revolution is to be expected, no matter what its extent, it will take place most certainly in the services sec-tor. Note the particular importance of transport-related industries, followed by finance and insurance, post and telecommunications, computer services, and other business activities.
To determine the possible effect of this new prominence of services offshoring on the industries considered, we looked at the associated rates of employment growth in the period 1995–2000 (table 3.14). In doing this, we combined the oECd I-o data with the STaN (structural analysis) database, also from the oECd, and obtained a restricted sample. The countries for which data were available in both databases were: australia, austria, Belgium,
table 3.13 (cont.): Services offshoring and industries worldwide, broad measure1 (percentage)
Year 1995 Year 2000
43 Pharmaceuticals 0.37 43 Coke, refined petroleum products, and nuclear fuel
0.61
44 Manuf. of gas; distribution through mains
0.28 44 Non-ferrous metals 0.54
45 Steam and hot water supply 0.24 45 Private households with employed persons
0.52
46 aircraft and spacecraft 0.22 46 aircraft and spacecraft 0.22
47 railroad equipment and transport equip nec.
0.18 47 Steam and hot water supply 0.16
48 Non-ferrous metals 0.16 48 railroad equipment and transport equip nec.
0.14
1 Formula (1.4a), weighted means of industries (48) across sampled countries (37).Note: Industry classification is two-digit ISIC, rev 3. In italics, services industries.
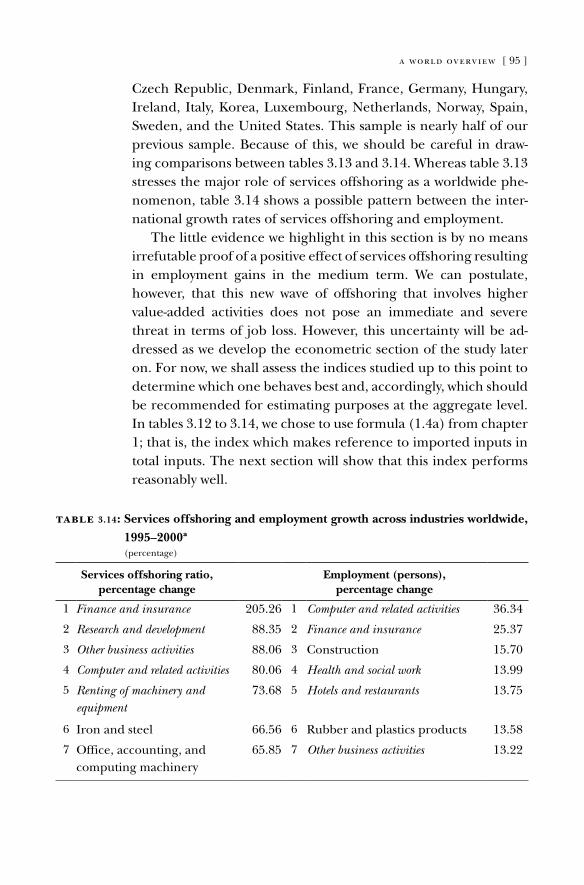
a world overview [ 95 ]
Czech republic, denmark, Finland, France, Germany, Hungary, Ireland, Italy, Korea, luxembourg, Netherlands, Norway, Spain, Sweden, and the United States. This sample is nearly half of our previous sample. Because of this, we should be careful in draw-ing comparisons between tables 3.13 and 3.14. Whereas table 3.13 stresses the major role of services offshoring as a worldwide phe-nomenon, table 3.14 shows a possible pattern between the inter-national growth rates of services offshoring and employment.
The little evidence we highlight in this section is by no means irrefutable proof of a positive effect of services offshoring resulting in employment gains in the medium term. We can postulate, however, that this new wave of offshoring that involves higher value-added activities does not pose an immediate and severe threat in terms of job loss. However, this uncertainty will be ad-dressed as we develop the econometric section of the study later on. For now, we shall assess the indices studied up to this point to determine which one behaves best and, accordingly, which should be recommended for estimating purposes at the aggregate level. In tables 3.12 to 3.14, we chose to use formula (1.4a) from chapter 1; that is, the index which makes reference to imported inputs in total inputs. The next section will show that this index performs reasonably well.
table 3.14: Services offshoring and employment growth across industries worldwide,
1995–2000ª (percentage)
Services offshoring ratio, percentage change
Employment (persons), percentage change
1 Finance and insurance 205.26 1 Computer and related activities 36.34
2 Research and development 88.35 2 Finance and insurance 25.37
3 Other business activities 88.06 3 Construction 15.70
4 Computer and related activities 80.06 4 Health and social work 13.99
5 Renting of machinery and equipment
73.68 5 Hotels and restaurants 13.75
6 Iron and steel 66.56 6 rubber and plastics products 13.58
7 office, accounting, and computing machinery
65.85 7 Other business activities 13.22
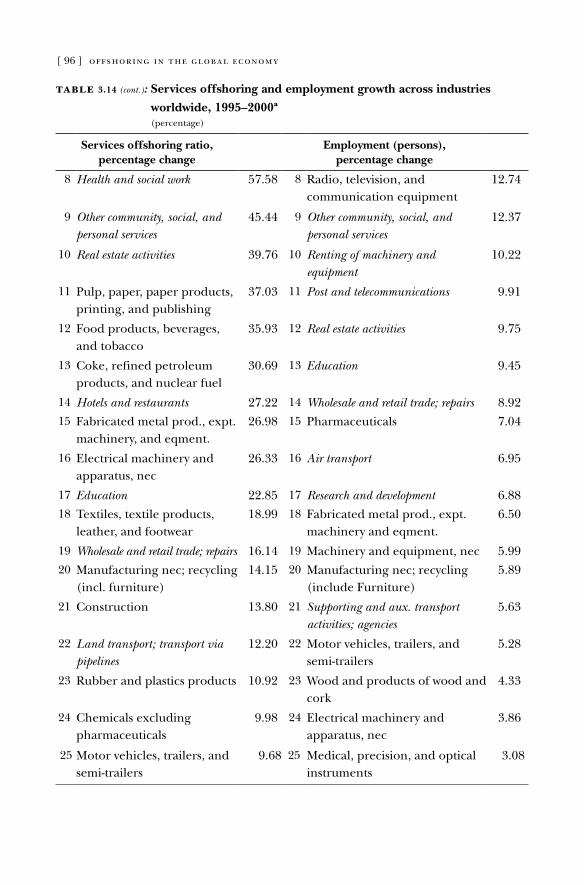
[ 96 ] offshoring in the global economy
table 3.14 (cont.): Services offshoring and employment growth across industries
worldwide, 1995–2000ª (percentage)
Services offshoring ratio, percentage change
Employment (persons), percentage change
8 Health and social work 57.58 8 radio, television, and communication equipment
12.74
9 Other community, social, and personal services
45.44 9 Other community, social, and personal services
12.37
10 Real estate activities 39.76 10 Renting of machinery and equipment
10.22
11 Pulp, paper, paper products, printing, and publishing
37.03 11 Post and telecommunications 9.91
12 Food products, beverages, and tobacco
35.93 12 Real estate activities 9.75
13 Coke, refined petroleum products, and nuclear fuel
30.69 13 Education 9.45
14 Hotels and restaurants 27.22 14 Wholesale and retail trade; repairs 8.9215 Fabricated metal prod., expt.
machinery, and eqment.26.98 15 Pharmaceuticals 7.04
16 Electrical machinery and apparatus, nec
26.33 16 Air transport 6.95
17 Education 22.85 17 Research and development 6.8818 Textiles, textile products,
leather, and footwear18.99 18 Fabricated metal prod., expt.
machinery and eqment.6.50
19 Wholesale and retail trade; repairs 16.14 19 Machinery and equipment, nec 5.9920 Manufacturing nec; recycling
(incl. furniture)14.15 20 Manufacturing nec; recycling
(include Furniture)5.89
21 Construction 13.80 21 Supporting and aux. transport activities; agencies
5.63
22 Land transport; transport via pipelines
12.20 22 Motor vehicles, trailers, and semi-trailers
5.28
23 rubber and plastics products 10.92 23 Wood and products of wood and cork
4.33
24 Chemicals excluding pharmaceuticals
9.98 24 Electrical machinery and apparatus, nec
3.86
25 Motor vehicles, trailers, and semi-trailers
9.68 25 Medical, precision, and optical instruments
3.08
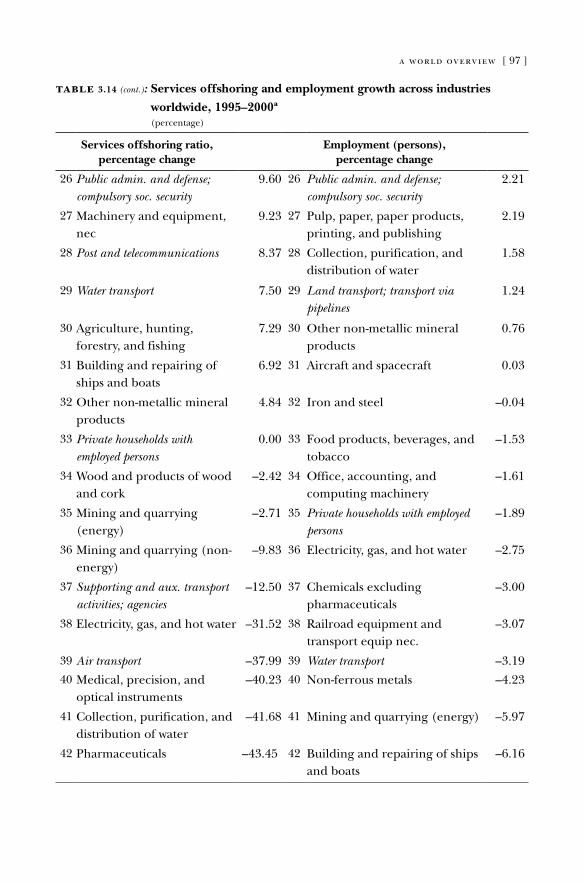
a world overview [ 97 ]
table 3.14 (cont.): Services offshoring and employment growth across industries
worldwide, 1995–2000ª (percentage)
Services offshoring ratio, percentage change
Employment (persons), percentage change
26 Public admin. and defense; compulsory soc. security
9.60 26 Public admin. and defense; compulsory soc. security
2.21
27 Machinery and equipment, nec
9.23 27 Pulp, paper, paper products, printing, and publishing
2.19
28 Post and telecommunications 8.37 28 Collection, purification, and distribution of water
1.58
29 Water transport 7.50 29 Land transport; transport via pipelines
1.24
30 agriculture, hunting, forestry, and fishing
7.29 30 other non-metallic mineral products
0.76
31 Building and repairing of ships and boats
6.92 31 aircraft and spacecraft 0.03
32 other non-metallic mineral products
4.84 32 Iron and steel –0.04
33 Private households with employed persons
0.00 33 Food products, beverages, and tobacco
–1.53
34 Wood and products of wood and cork
–2.42 34 office, accounting, and computing machinery
–1.61
35 Mining and quarrying (energy)
–2.71 35 Private households with employed persons
–1.89
36 Mining and quarrying (non-energy)
–9.83 36 Electricity, gas, and hot water –2.75
37 Supporting and aux. transport activities; agencies
–12.50 37 Chemicals excluding pharmaceuticals
–3.00
38 Electricity, gas, and hot water –31.52 38 railroad equipment and transport equip nec.
–3.07
39 Air transport –37.99 39 Water transport –3.1940 Medical, precision, and
optical instruments–40.23 40 Non-ferrous metals –4.23
41 Collection, purification, and distribution of water
–41.68 41 Mining and quarrying (energy) –5.97
42 Pharmaceuticals –43.45 42 Building and repairing of ships and boats
–6.16
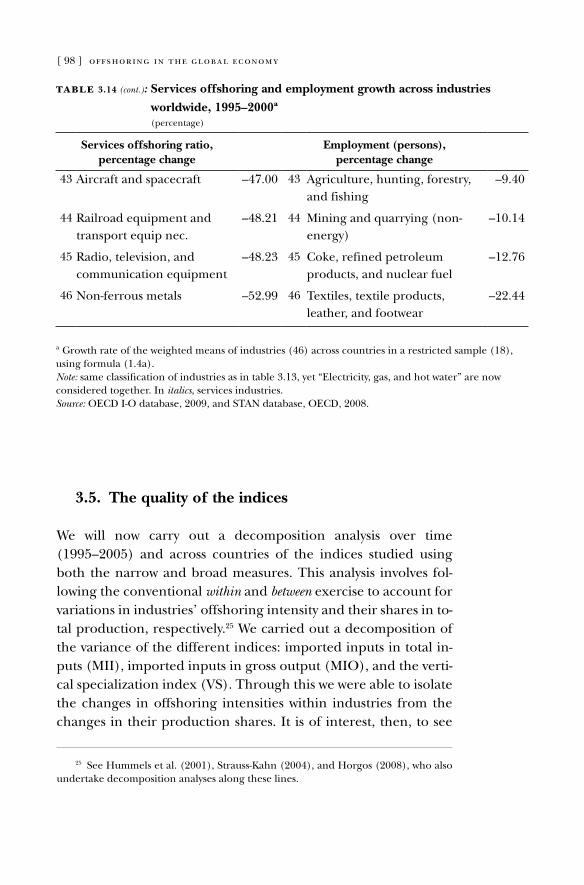
[ 98 ] offshoring in the global economy
3.5. The quality of the indices
We will now carry out a decomposition analysis over time (1995–2005) and across countries of the indices studied using both the narrow and broad measures. This analysis involves fol-lowing the conventional within and between exercise to account for variations in industries’ offshoring intensity and their shares in to-tal production, respectively.25 We carried out a decomposition of the variance of the different indices: imported inputs in total in-puts (MII), imported inputs in gross output (MIo), and the verti-cal specialization index (VS). Through this we were able to isolate the changes in offshoring intensities within industries from the changes in their production shares. It is of interest, then, to see
25 See Hummels et al. (2001), Strauss-Kahn (2004), and Horgos (2008), who also undertake decomposition analyses along these lines.
table 3.14 (cont.): Services offshoring and employment growth across industries
worldwide, 1995–2000ª (percentage)
Services offshoring ratio, percentage change
Employment (persons), percentage change
43 aircraft and spacecraft –47.00 43 agriculture, hunting, forestry, and fishing
–9.40
44 railroad equipment and transport equip nec.
–48.21 44 Mining and quarrying (non-energy)
–10.14
45 radio, television, and communication equipment
–48.23 45 Coke, refined petroleum products, and nuclear fuel
–12.76
46 Non-ferrous metals –52.99 46 Textiles, textile products, leather, and footwear
–22.44
ª Growth rate of the weighted means of industries (46) across countries in a restricted sample (18), using formula (1.4a).Note: same classification of industries as in table 3.13, yet “Electricity, gas, and hot water” are now considered together. In italics, services industries.Source: oECd I-o database, 2009, and STaN database, oECd, 2008.
a world overview [ 99 ]
that some of the industries that are strongly engaged in offshoring might alter the country indices more easily.
Therefore, to see to what extent the indices describe off- shoring accurately, we extracted the growth sources behind all three indices using the data in tables 3.1 to 3.6 and the following expression:
ΔΦ = Δn
Σi
θi δ
i =
n
Σi
–θ
i Δ δi +
n
Σi
–δ
i Δ θi; Φ = MII, MIO, VS (3.1)
where the change in the offshoring index of countries (Φ) is de-composed, throughout industries (i), into the change in the off-shoring intensity (the within term) and the change in the share of total production (the between term). The former fixes the struc-tural component of industries, also the share of industry output to total output (θ),26 to focus on the change in the offshoring inten-sity (δ). The latter, in contrast, fixes the offshoring component, thus capturing the contribution of the structural component to the change in the index. a bar over the variable defines the mean for the period under study.
Tables 3.15 to 3.17 display the results of the decomposition analysis. The within term corresponds to the first right-hand term in the decomposition formula above and the first column in the tables. The between term is, in turn, the second right-hand term and the second column in the tables. The overall change in the indices is presented in the column labeled as total, and is equal to the sum of the within and between terms, as shown in the de-composition formula. The overall change here coincides with the change, in percentage points, in the indices in tables 3.1 to 3.6. For example, let us consider the changes in the MII index for the United States during 1995–2005 (tables 3.1 and 3.2, narrow and broad measures, respectively). These changes amount to 0.34 per-centage points (the difference in table 3.1) and 3.02 percentage
26 Output refers here to gross output, as often found in the literature for this kind of analysis (see for instance, Horgos 2008). Moreover, for the vertical specialization index the structural component is different: the share of the industry’s exports in total exports.
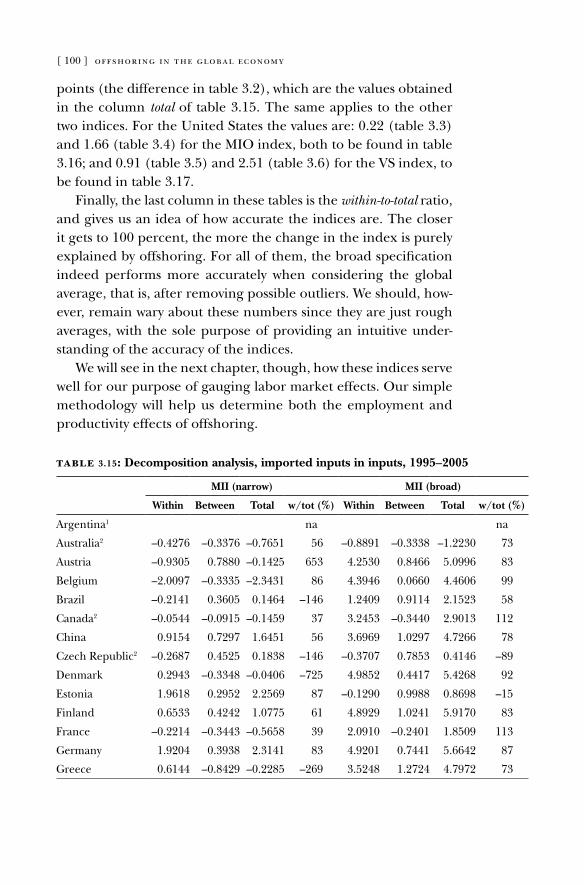
[ 100 ] offshoring in the global economy
points (the difference in table 3.2), which are the values obtained in the column total of table 3.15. The same applies to the other two indices. For the United States the values are: 0.22 (table 3.3) and 1.66 (table 3.4) for the MIo index, both to be found in table 3.16; and 0.91 (table 3.5) and 2.51 (table 3.6) for the VS index, to be found in table 3.17.
Finally, the last column in these tables is the within-to-total ratio, and gives us an idea of how accurate the indices are. The closer it gets to 100 percent, the more the change in the index is purely explained by offshoring. For all of them, the broad specification indeed performs more accurately when considering the global average, that is, after removing possible outliers. We should, how-ever, remain wary about these numbers since they are just rough averages, with the sole purpose of providing an intuitive under-standing of the accuracy of the indices.
We will see in the next chapter, though, how these indices serve well for our purpose of gauging labor market effects. our simple methodology will help us determine both the employment and productivity effects of offshoring.
table 3.15: Decomposition analysis, imported inputs in inputs, 1995–2005
MII (narrow) MII (broad)
Within Between Total w/tot (%) Within Between Total w/tot (%)
argentina1 na na
australia2 –0.4276 –0.3376 –0.7651 56 –0.8891 –0.3338 –1.2230 73
austria –0.9305 0.7880 –0.1425 653 4.2530 0.8466 5.0996 83
Belgium –2.0097 –0.3335 –2.3431 86 4.3946 0.0660 4.4606 99
Brazil –0.2141 0.3605 0.1464 –146 1.2409 0.9114 2.1523 58
Canada2 –0.0544 –0.0915 –0.1459 37 3.2453 –0.3440 2.9013 112
China 0.9154 0.7297 1.6451 56 3.6969 1.0297 4.7266 78
Czech republic2 –0.2687 0.4525 0.1838 –146 –0.3707 0.7853 0.4146 –89
denmark 0.2943 –0.3348 –0.0406 –725 4.9852 0.4417 5.4268 92
Estonia 1.9618 0.2952 2.2569 87 –0.1290 0.9988 0.8698 –15
Finland 0.6533 0.4242 1.0775 61 4.8929 1.0241 5.9170 83
France –0.2214 –0.3443 –0.5658 39 2.0910 –0.2401 1.8509 113
Germany 1.9204 0.3938 2.3141 83 4.9201 0.7441 5.6642 87
Greece 0.6144 –0.8429 –0.2285 –269 3.5248 1.2724 4.7972 73
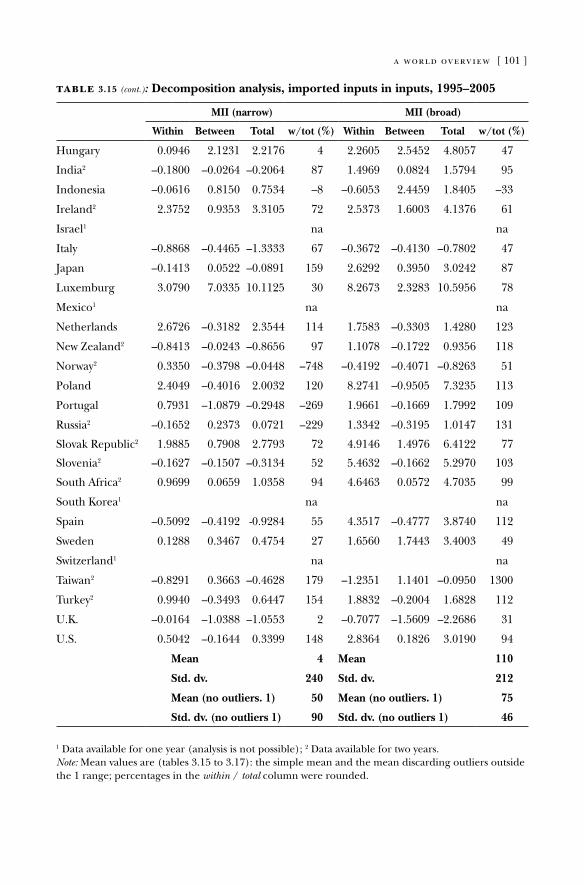
a world overview [ 101 ]
table 3.15 (cont.): Decomposition analysis, imported inputs in inputs, 1995–2005
MII (narrow) MII (broad)
Within Between Total w/tot (%) Within Between Total w/tot (%)
Hungary 0.0946 2.1231 2.2176 4 2.2605 2.5452 4.8057 47
India2 –0.1800 –0.0264 –0.2064 87 1.4969 0.0824 1.5794 95
Indonesia –0.0616 0.8150 0.7534 –8 –0.6053 2.4459 1.8405 –33
Ireland2 2.3752 0.9353 3.3105 72 2.5373 1.6003 4.1376 61
Israel1 na na
Italy –0.8868 –0.4465 –1.3333 67 –0.3672 –0.4130 –0.7802 47
Japan –0.1413 0.0522 –0.0891 159 2.6292 0.3950 3.0242 87
luxemburg 3.0790 7.0335 10.1125 30 8.2673 2.3283 10.5956 78
Mexico1 na na
Netherlands 2.6726 –0.3182 2.3544 114 1.7583 –0.3303 1.4280 123
New Zealand2 –0.8413 –0.0243 –0.8656 97 1.1078 –0.1722 0.9356 118
Norway2 0.3350 –0.3798 –0.0448 –748 –0.4192 –0.4071 –0.8263 51
Poland 2.4049 –0.4016 2.0032 120 8.2741 –0.9505 7.3235 113
Portugal 0.7931 –1.0879 –0.2948 –269 1.9661 –0.1669 1.7992 109
russia2 –0.1652 0.2373 0.0721 –229 1.3342 –0.3195 1.0147 131
Slovak republic2 1.9885 0.7908 2.7793 72 4.9146 1.4976 6.4122 77
Slovenia2 –0.1627 –0.1507 –0.3134 52 5.4632 –0.1662 5.2970 103
South africa2 0.9699 0.0659 1.0358 94 4.6463 0.0572 4.7035 99
South Korea1 na na
Spain –0.5092 –0.4192 -0.9284 55 4.3517 –0.4777 3.8740 112
Sweden 0.1288 0.3467 0.4754 27 1.6560 1.7443 3.4003 49
Switzerland1 na na
Taiwan2 –0.8291 0.3663 –0.4628 179 –1.2351 1.1401 –0.0950 1300
Turkey2 0.9940 –0.3493 0.6447 154 1.8832 –0.2004 1.6828 112
U.K. –0.0164 –1.0388 –1.0553 2 –0.7077 –1.5609 –2.2686 31
U.S. 0.5042 –0.1644 0.3399 148 2.8364 0.1826 3.0190 94
Mean 4 Mean 110
Std. dv. 240 Std. dv. 212
Mean (no outliers. 1) 50 Mean (no outliers. 1) 75
Std. dv. (no outliers 1) 90 Std. dv. (no outliers 1) 46
1 data available for one year (analysis is not possible); 2 data available for two years.Note: Mean values are (tables 3.15 to 3.17): the simple mean and the mean discarding outliers outside the 1 range; percentages in the within / total column were rounded.
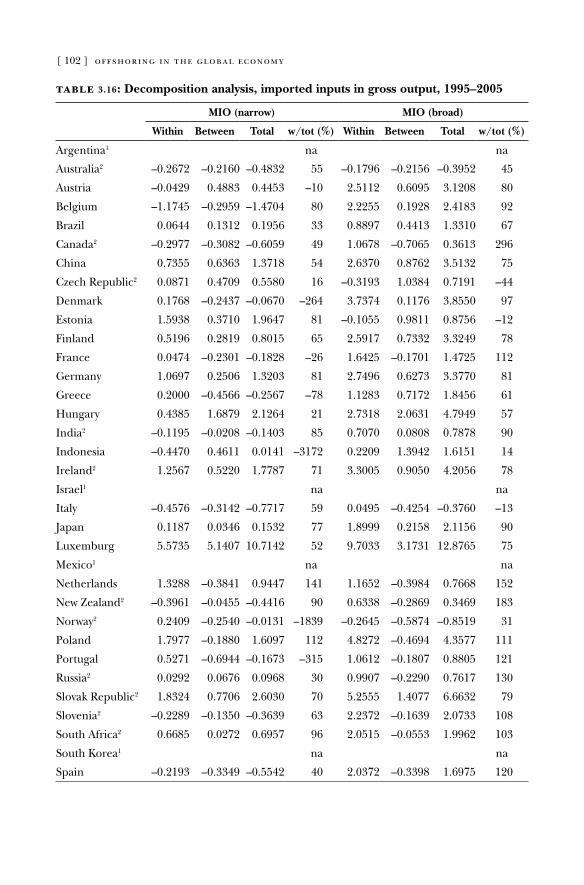
[ 102 ] offshoring in the global economy
table 3.16: Decomposition analysis, imported inputs in gross output, 1995–2005
MIO (narrow) MIO (broad)
Within Between Total w/tot (%) Within Between Total w/tot (%)
argentina1 na na
australia2 –0.2672 –0.2160 –0.4832 55 –0.1796 –0.2156 –0.3952 45
austria –0.0429 0.4883 0.4453 –10 2.5112 0.6095 3.1208 80
Belgium –1.1745 –0.2959 –1.4704 80 2.2255 0.1928 2.4183 92
Brazil 0.0644 0.1312 0.1956 33 0.8897 0.4413 1.3310 67
Canada2 –0.2977 –0.3082 –0.6059 49 1.0678 –0.7065 0.3613 296
China 0.7355 0.6363 1.3718 54 2.6370 0.8762 3.5132 75
Czech republic2 0.0871 0.4709 0.5580 16 –0.3193 1.0384 0.7191 –44
denmark 0.1768 –0.2437 –0.0670 –264 3.7374 0.1176 3.8550 97
Estonia 1.5938 0.3710 1.9647 81 –0.1055 0.9811 0.8756 –12
Finland 0.5196 0.2819 0.8015 65 2.5917 0.7332 3.3249 78
France 0.0474 –0.2301 –0.1828 –26 1.6425 –0.1701 1.4725 112
Germany 1.0697 0.2506 1.3203 81 2.7496 0.6273 3.3770 81
Greece 0.2000 –0.4566 –0.2567 –78 1.1283 0.7172 1.8456 61
Hungary 0.4385 1.6879 2.1264 21 2.7318 2.0631 4.7949 57
India2 –0.1195 –0.0208 –0.1403 85 0.7070 0.0808 0.7878 90
Indonesia –0.4470 0.4611 0.0141 –3172 0.2209 1.3942 1.6151 14
Ireland2 1.2567 0.5220 1.7787 71 3.3005 0.9050 4.2056 78
Israel1 na na
Italy –0.4576 –0.3142 –0.7717 59 0.0495 –0.4254 –0.3760 –13
Japan 0.1187 0.0346 0.1532 77 1.8999 0.2158 2.1156 90
luxemburg 5.5735 5.1407 10.7142 52 9.7033 3.1731 12.8765 75
Mexico1 na na
Netherlands 1.3288 –0.3841 0.9447 141 1.1652 –0.3984 0.7668 152
New Zealand2 –0.3961 –0.0455 –0.4416 90 0.6338 –0.2869 0.3469 183
Norway2 0.2409 –0.2540 –0.0131 –1839 –0.2645 –0.5874 –0.8519 31
Poland 1.7977 –0.1880 1.6097 112 4.8272 –0.4694 4.3577 111
Portugal 0.5271 –0.6944 –0.1673 –315 1.0612 –0.1807 0.8805 121
russia2 0.0292 0.0676 0.0968 30 0.9907 –0.2290 0.7617 130
Slovak republic2 1.8324 0.7706 2.6030 70 5.2555 1.4077 6.6632 79
Slovenia2 –0.2289 –0.1350 –0.3639 63 2.2372 –0.1639 2.0733 108
South africa2 0.6685 0.0272 0.6957 96 2.0515 –0.0553 1.9962 103
South Korea1 na na
Spain –0.2193 –0.3349 –0.5542 40 2.0372 –0.3398 1.6975 120
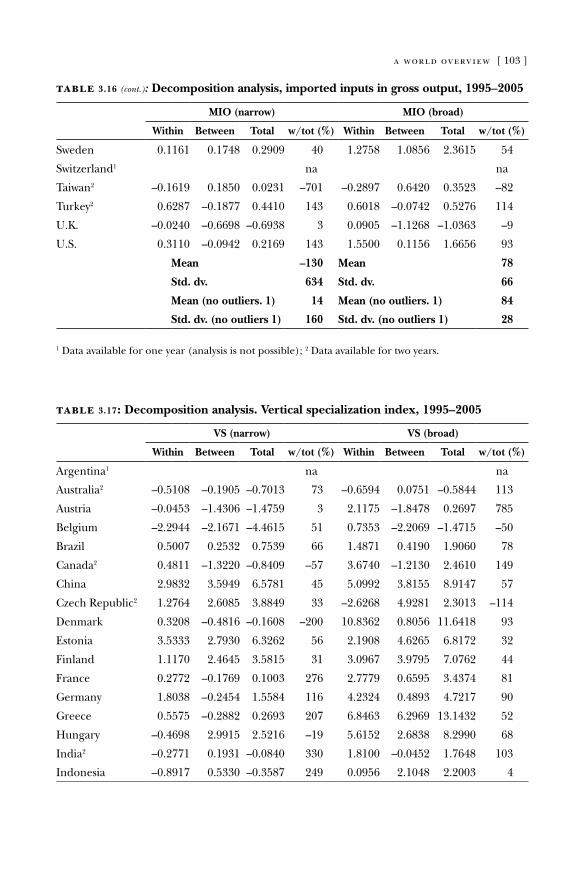
a world overview [ 103 ]
table 3.16 (cont.): Decomposition analysis, imported inputs in gross output, 1995–2005
MIO (narrow) MIO (broad)
Within Between Total w/tot (%) Within Between Total w/tot (%)
Sweden 0.1161 0.1748 0.2909 40 1.2758 1.0856 2.3615 54
Switzerland1 na na
Taiwan2 –0.1619 0.1850 0.0231 –701 –0.2897 0.6420 0.3523 –82
Turkey2 0.6287 –0.1877 0.4410 143 0.6018 –0.0742 0.5276 114
U.K. –0.0240 –0.6698 –0.6938 3 0.0905 –1.1268 –1.0363 –9
U.S. 0.3110 –0.0942 0.2169 143 1.5500 0.1156 1.6656 93
Mean –130 Mean 78
Std. dv. 634 Std. dv. 66
Mean (no outliers. 1) 14 Mean (no outliers. 1) 84
Std. dv. (no outliers 1) 160 Std. dv. (no outliers 1) 28
1 data available for one year (analysis is not possible); 2 data available for two years.
table 3.17: Decomposition analysis. Vertical specialization index, 1995–2005
VS (narrow) VS (broad)
Within Between Total w/tot (%) Within Between Total w/tot (%)
argentina1 na na
australia2 –0.5108 –0.1905 –0.7013 73 –0.6594 0.0751 –0.5844 113
austria –0.0453 –1.4306 –1.4759 3 2.1175 –1.8478 0.2697 785
Belgium –2.2944 –2.1671 –4.4615 51 0.7353 –2.2069 –1.4715 –50
Brazil 0.5007 0.2532 0.7539 66 1.4871 0.4190 1.9060 78
Canada2 0.4811 –1.3220 –0.8409 –57 3.6740 –1.2130 2.4610 149
China 2.9832 3.5949 6.5781 45 5.0992 3.8155 8.9147 57
Czech republic2 1.2764 2.6085 3.8849 33 –2.6268 4.9281 2.3013 –114
denmark 0.3208 –0.4816 –0.1608 –200 10.8362 0.8056 11.6418 93
Estonia 3.5333 2.7930 6.3262 56 2.1908 4.6265 6.8172 32
Finland 1.1170 2.4645 3.5815 31 3.0967 3.9795 7.0762 44
France 0.2772 –0.1769 0.1003 276 2.7779 0.6595 3.4374 81
Germany 1.8038 –0.2454 1.5584 116 4.2324 0.4893 4.7217 90
Greece 0.5575 –0.2882 0.2693 207 6.8463 6.2969 13.1432 52
Hungary –0.4698 2.9915 2.5216 –19 5.6152 2.6838 8.2990 68
India2 –0.2771 0.1931 –0.0840 330 1.8100 –0.0452 1.7648 103
Indonesia –0.8917 0.5330 –0.3587 249 0.0956 2.1048 2.2003 4
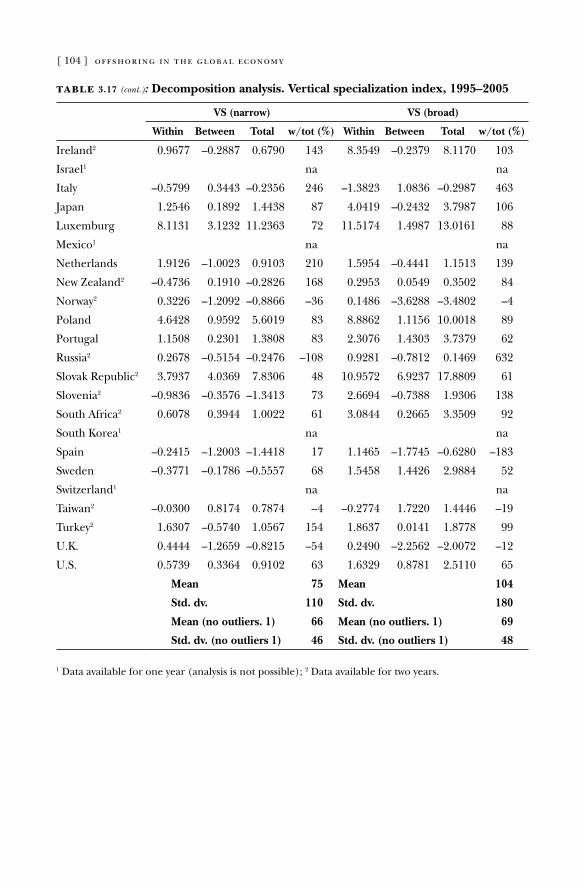
[ 104 ] offshoring in the global economy
table 3.17 (cont.): Decomposition analysis. Vertical specialization index, 1995–2005
VS (narrow) VS (broad)
Within Between Total w/tot (%) Within Between Total w/tot (%)
Ireland2 0.9677 –0.2887 0.6790 143 8.3549 –0.2379 8.1170 103
Israel1 na na
Italy –0.5799 0.3443 –0.2356 246 –1.3823 1.0836 –0.2987 463
Japan 1.2546 0.1892 1.4438 87 4.0419 –0.2432 3.7987 106
luxemburg 8.1131 3.1232 11.2363 72 11.5174 1.4987 13.0161 88
Mexico1 na na
Netherlands 1.9126 –1.0023 0.9103 210 1.5954 –0.4441 1.1513 139
New Zealand2 –0.4736 0.1910 –0.2826 168 0.2953 0.0549 0.3502 84
Norway2 0.3226 –1.2092 –0.8866 –36 0.1486 –3.6288 –3.4802 –4
Poland 4.6428 0.9592 5.6019 83 8.8862 1.1156 10.0018 89
Portugal 1.1508 0.2301 1.3808 83 2.3076 1.4303 3.7379 62
russia2 0.2678 –0.5154 –0.2476 –108 0.9281 –0.7812 0.1469 632
Slovak republic2 3.7937 4.0369 7.8306 48 10.9572 6.9237 17.8809 61
Slovenia2 –0.9836 –0.3576 –1.3413 73 2.6694 –0.7388 1.9306 138
South africa2 0.6078 0.3944 1.0022 61 3.0844 0.2665 3.3509 92
South Korea1 na na
Spain –0.2415 –1.2003 –1.4418 17 1.1465 –1.7745 –0.6280 –183
Sweden –0.3771 –0.1786 –0.5557 68 1.5458 1.4426 2.9884 52
Switzerland1 na na
Taiwan2 –0.0300 0.8174 0.7874 –4 –0.2774 1.7220 1.4446 –19
Turkey2 1.6307 –0.5740 1.0567 154 1.8637 0.0141 1.8778 99
U.K. 0.4444 –1.2659 –0.8215 –54 0.2490 –2.2562 –2.0072 –12
U.S. 0.5739 0.3364 0.9102 63 1.6329 0.8781 2.5110 65
Mean 75 Mean 104
Std. dv. 110 Std. dv. 180
Mean (no outliers. 1) 66 Mean (no outliers. 1) 69
Std. dv. (no outliers 1) 46 Std. dv. (no outliers 1) 48
1 data available for one year (analysis is not possible); 2 data available for two years.
[ 105 ]
Effects on the labor Market
NoW that we have studied the reach of the offshoring phenom-enon, we must look at its socioeconomic implications. as stated in our introductory chapters, we are particularly interested in two kinds of effects on the labor market. First, we are interested in how domestic employment reacts to changes in the offshoring intensity, both of materials and services. In other words, how much job destruc-tion are we to expect? or, in contrast, can offshoring be seen as a source of new opportunities, both for workers and entrepreneurs? and moreover, is there any difference in the size (and direction) of the effects, according to the type of offshoring? Second, we will deal with the direct effects of offshoring on total factor productiv-ity, further accounting for the possible ways of measuring the latter. That is, should we expect any improvements in the productivity level of industries after offshoring takes place? let us now go over the usual econometric aspects found in the literature.
4.1. Analytical framework: employment
departing from a Cobb-douglas technology for the industry, we have:
Yi = A(t)K
αi L
βi (4.1)
where K is capital and L is labor, and are the factor shares, and A is the Hicks-neutral technology shifter. accepting that the industry can be represented as a single profit-maximizing firm, from our knowl-edge of the production function we can derive the cost function:
Ci = φr
αi w
βi Z
i (4.2)
φ being a constant, r and w the factor prices (the interest rate and wages, for instance), and Z a vector of other exogenous variables.
4.
[ 106 ] offshoring in the global economy
as we can see, the cost function and the production function are both sides of the same coin. With exogenous input prices, the production function and the cost function contain virtually the same information.
Keep in mind at this point that, particularly in former efforts, it was most appealing to specify a translog cost and production func-tions. This provided a more flexible framework with regards to cross elasticities that led to the estimation of a factor-share equa-tion. We should also keep in mind, however, that the original de-bate was primarily focused on explaining the wage gap (i. e., the wage skill premium) or the shifts in relative employment of both nonskilled and skilled labor, due essentially to some form of tech-nological change (see Berman et al. 1994; Feenstra and Hanson 1996b, most representatively). Some of the current efforts, how-ever, try to make sense of a more direct incidence of offshoring on total employment as in, for example, amiti and Wei (2005, 2006) or Cadarso et al. (2008), who implicitly assume a Cobb-douglas technology. In this context, cost minimization, which entails the optimal demand for inputs given a certain level of output, is char-acterized by the conditional demand for labor augmented by oth-er factor prices.
Following Hamermesh (1993), minimizing total costs in (4.2) subject to (4.1) and using Shephard’s lemma (Hicks 1939; Samuelson 1947; Shephard 1953) yields the factor demand func-tions for K and L. For the labor factor we have:
Li = Γ(w
i, p
i, Z
i) (4.3)
where the demand for labor depends on wages w, other factor prices p, and a vector of controls Z. among input prices other than r, we can identify the price of foreign labor services, follow-ing amiti and Wei (2005, 2006). These pose as a substitute for domestic labor and enter the labor equation:
Li = Γ(w
i, p '
i , p os
i Zi) (4.4)
where p’ is a vector of factor prices other than those of foreign services. Since data on p os
i are often hard to obtain, these authors
effects on the labor market [ 107 ]
propose the offshoring intensity indices as an inverse approxima-tion of the price of these imported intermediate inputs. Equation (4.4) then becomes:
Li = Γ(w
i, p
i, Z
i, OSS
i,OSM
i) | A(OSS
i, OSM
i) (4.5)
where OSSi and OSM
i are the services and manufacturing off-
shoring indices, and is the technology shifter dependent on offshoring. amiti and Wei (2005, 2006) identify three channels through which offshoring comes to shake the labor demand. First, a possible substitution effect between labor and prices of import-ed inputs (services or materials); a drop in the latter or, equiva-lently, an increase in the offshoring indices, would lead to a fall in the demand for labor. Second, a possible short-term productivity effect of offshoring negatively impacts employment. and third, the scale effect, which might positively affect labor, provided firms are more efficient and competitive in the long run due to previ-ous productivity gains. Thus, log-linearizing (4.5), we are left with a widely used equation in the recent literature:
ln Lit = β
o + β
l L
it –1
+ β2OSS
it + β
3OSM
it + β
4 ln w
it +
+ β5 ln p
it + β
6 ln Z
it + δ
i d
i + δ
t d
t (4.6)
labor is regressed on its lagged value and a set of variables which include, respectively: the services and materials offshoring intensity indices OSS and OSM, real wages w, other factor prices p (such as r), and a vector Z of other control variables among which we can con-sider an output variable (volume or value), the capital stock, or some measure of r&d investment. Industry and years fixed effects also enter the equation through the dummy variables, d
i and d
t.
Error terms are omitted throughout for the benefit of exposition.on the expected signs of the coefficients, we have that β
4 < 0
(a downward sloping demand curve), β5 > 0 (if inputs are gross
substitutes), or β5 < 0 (if inputs are gross complements). as for
β2 and β
3 their signs are inconclusive, since it is not clear whether
the scale effects are large enough to outweigh the substitution and productivity effects. as previously stated, the output may be increased in response to offshoring-related productivity gains.
[ 108 ] offshoring in the global economy
We should reiterated a couple of remarks by amiti and Wei (2006). First, relying on the assumption of perfect labor mobility across industries, we have seen that wages are exogenously deter-mined. If that is not the case, then wages are endogenous. Provided that these potential rents are unchanged over time, we can assume that they would be absorbed by the industry fixed effects (δ
i and δ
'i ),
so the results would still be unbiased. and second, the price for other inputs (such as imported inputs and the rental on capital) are considered to be a function of time, so they are captured by the time fixed effects (δ
t and δ
't ).
a potential problem with equation (4.6) is the strong endog-eneity of the output variable Y (in vector Z). Even though most empirical work employs this expression on a regular basis, it re-mains a doubtful interpretation, as the measured coefficient on the real wage represents a partial elasticity and not a total elastic-ity (Webster 2003).27 For this reason, the exogenously determined capital stock variable is made explicit in our final estimating equa-tion with no output variable (whether it is the volume or value version):
ln Lit = θ
o + θ
l L
it –1
+ θ2 OSS
it + θ
3 OSM
it + θ
4 ln w
it + θ
5 ln K
it +
+ δ *i
di + δ *
t d
t (4.7)
Notwithstanding the previous assumptions in the last two para-graphs, the estimation of equation (4.7) in its static or dynamic forms still entails potential endogeneity problems due to the off-shoring variables. a potential bias in olS estimates is expected and should make us consider the implementation of instrumental variables techniques.
27 Webster (2003, 135, footnote 5) states: “a total elasticity includes the full effects on employment, once the effects on intermediate variables such as output have been worked through. Partial elasticities are the effects if one or more of these intermediate variables are artificially held constant. Partial elasticities are artificial ‘thought experi-ments,’ as in real life it is not possible to control most variables.”
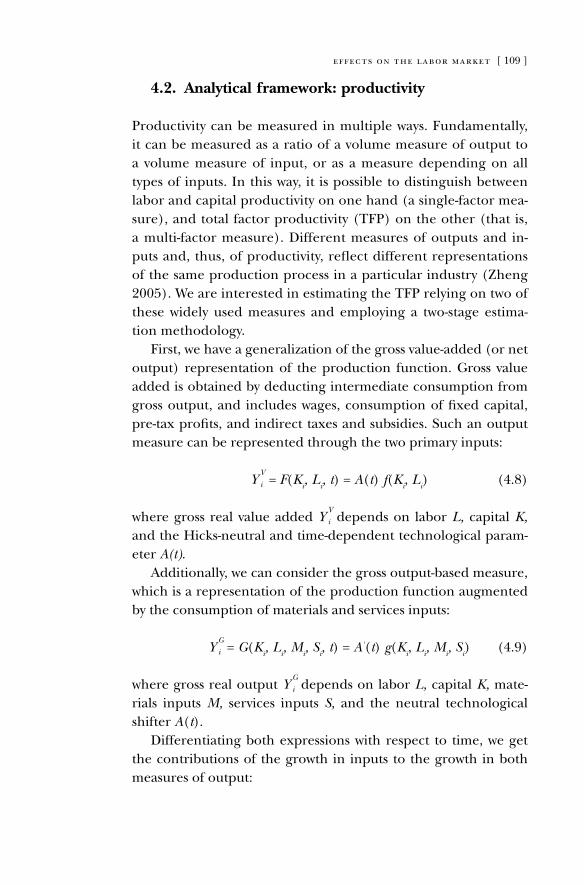
effects on the labor market [ 109 ]
4.2. Analytical framework: productivity
Productivity can be measured in multiple ways. Fundamentally, it can be measured as a ratio of a volume measure of output to a volume measure of input, or as a measure depending on all types of inputs. In this way, it is possible to distinguish between labor and capital productivity on one hand (a single-factor mea- sure), and total factor productivity (TFP) on the other (that is, a multi-factor measure). different measures of outputs and in-puts and, thus, of productivity, reflect different representations of the same production process in a particular industry (Zheng 2005). We are interested in estimating the TFP relying on two of these widely used measures and employing a two-stage estima-tion methodology.
First, we have a generalization of the gross value-added (or net output) representation of the production function. Gross value added is obtained by deducting intermediate consumption from gross output, and includes wages, consumption of fixed capital, pre-tax profits, and indirect taxes and subsidies. Such an output measure can be represented through the two primary inputs:
Y V
i = F(Ki, L
i, t) = A(t) f(K
i, L
i) (4.8)
where gross real value added Y V
i depends on labor L, capital K, and the Hicks-neutral and time-dependent technological param-eter A(t).
additionally, we can consider the gross output-based measure, which is a representation of the production function augmented by the consumption of materials and services inputs:
Y G
i = G(Ki, L
i, M
i, S
i, t) = A'(t) g(K
i, L
i, M
i, S
i) (4.9)
where gross real output Y G
i depends on labor L, capital K, mate-rials inputs M, services inputs S, and the neutral technological shifter A(t).
differentiating both expressions with respect to time, we get the contributions of the growth in inputs to the growth in both measures of output:
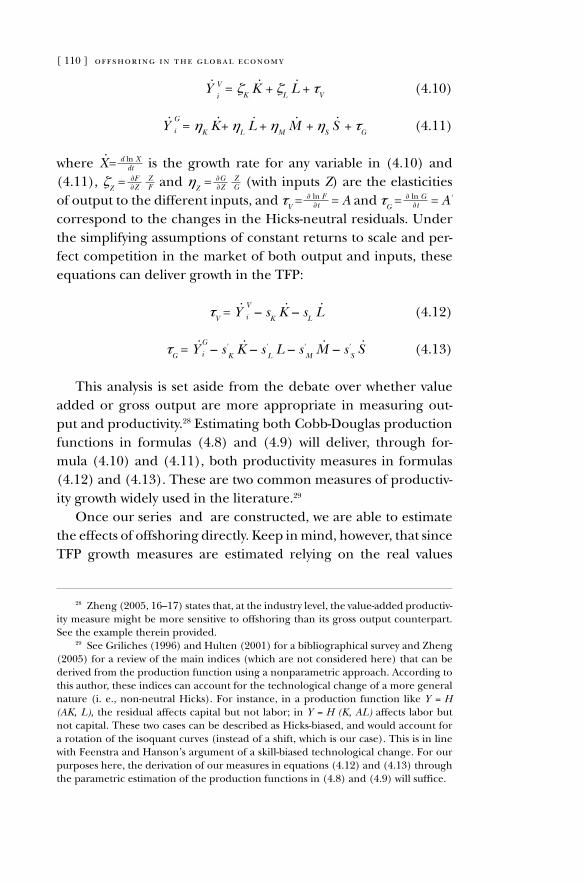
[ 110 ] offshoring in the global economy
Y. V
i= ζ
K K
. + ζ
L L
. + τ
V (4.10)
Y.
G
i = ηK K
. + η
L L
. + η
M M
. + η
S S
. + τ
G (4.11)
where X. = d ln X
dt is the growth rate for any variable in (4.10) and (4.11), ζ
Z = ∂F
∂Z ZF and η
Z = ∂G
∂Z ZG (with inputs Z) are the elasticities
of output to the different inputs, and τV = ∂ ln F
∂t = A and τG = ∂ ln G
∂t = A' correspond to the changes in the Hicks-neutral residuals. Under the simplifying assumptions of constant returns to scale and per-fect competition in the market of both output and inputs, these equations can deliver growth in the TFP:
τV = Y
.
V
i – sK K
. – s
L L
. (4.12)
τG = Y
. G
i – s'K K
. – s'
L L – s'
M M
. – s'
S S. (4.13)
This analysis is set aside from the debate over whether value added or gross output are more appropriate in measuring out-put and productivity.28 Estimating both Cobb-douglas production functions in formulas (4.8) and (4.9) will deliver, through for-mula (4.10) and (4.11), both productivity measures in formulas (4.12) and (4.13). These are two common measures of productiv-ity growth widely used in the literature.29
once our series and are constructed, we are able to estimate the effects of offshoring directly. Keep in mind, however, that since TFP growth measures are estimated relying on the real values
28 Zheng (2005, 16–17) states that, at the industry level, the value-added productiv-ity measure might be more sensitive to offshoring than its gross output counterpart. See the example therein provided.
29 See Griliches (1996) and Hulten (2001) for a bibliographical survey and Zheng (2005) for a review of the main indices (which are not considered here) that can be derived from the production function using a nonparametric approach. according to this author, these indices can account for the technological change of a more general nature (i. e., non-neutral Hicks). For instance, in a production function like Y = H (AK, L), the residual affects capital but not labor; in Y = H (K, AL) affects labor but not capital. These two cases can be described as Hicks-biased, and would account for a rotation of the isoquant curves (instead of a shift, which is our case). This is in line with Feenstra and Hanson’s argument of a skill-biased technological change. For our purposes here, the derivation of our measures in equations (4.12) and (4.13) through the parametric estimation of the production functions in (4.8) and (4.9) will suffice.
effects on the labor market [ 111 ]
of inputs and output, the cost-saving motive usually attached to offshoring is left out of the analysis. The second stage estimating equations are simply:
τVit
= Ω (OSSit, OSM
it) (4.14)
τGit
= Λ (OSSit, OSM
it) (4.15)
We expect the coefficients associated with both OSS and OSM to be positive in both specifications. according to amiti and Wei (2006), offshoring can increase productivity due either to com-positional or structural changes. First, relocating inefficient parts of the production process to another country could increase the productivity of the remaining workers. and second, due to access to new inputs, productivity increases are also likely, yet with larger effects arising from services offshoring.
as with employment, potential endogeneity of offshoring is also present in both of these equations. Either more productive industries self-select into offshoring or, conversely, industries that expect a fall in productivity growth increase their levels of off- shoring in the hope of increasing their productivity (amiti and Wei 2006). Here again, instrumental variables should be considered.
4.3. An empirical application
It is now time to gauge the effects of offshoring on labor markets. For this, we will review Japan’s experience with the objective of de-termining, at the industry level, the effects of offshoring on both domestic employment and productivity.30 We rely on the method-ology laid out in previous sections and on the Japanese Industry
30 other than being a main subject of study in Pablo agnese’s doctoral thesis, the interest in Japan arises from the need to account for some interesting yet puzzling facts: (i) Japan is still the second largest economy in GdP terms, yet it has been badly represented in the research field; (ii) the slump during the 1990s is still felt even today, and we cannot help but wonder how this lost decade of growth came to represent a word of warning and anticipation with regards to the current world crisis; and (iii) the Japanese labor market displays quite distinctive characteristics when compared to the industrialized economies of the Western hemisphere.
[ 112 ] offshoring in the global economy
Productivity database (JIP), which consists of 108 industries cover-ing the whole economy. due to data cleaning, we are left with 83 industries for 1980–2005.
relatively little literature has been produced on the particular case of Japan. This is unfair, since Japan’s economy entered the developed world many years ago and has held its highly esteemed status for decades. Still, while Japan is the second largest economy, its offshoring experience remains in the shadows, as is the case for much of the subject so far and much of Japan’s puzzling per- formance in the 1990s.
Under our industry setting we should expect, a priori, that we are dealing with a heterogeneous dataset in the sense that there are perceptible differences between estimated cross-sections (i. e., different constants) that could be exploited. Heterogeneity bias usually implies the inclusion of either fixed or random effects, which can capture these differences better than a pooled estima-tion. Finally, addressing the endogeneity of the offshoring variable becomes important since the industries that engage more in this practice might not be random. If the same industries engage in offshoring all over the sample, then industry fixed effects should work fine. That is hardly the case though, and the endogeneity of the offshoring variable is further magnified due to the presence of measurement errors. For this reason, we deem it necessary to rely on GMM estimation since the former could be biased and incon-sistent. Therefore, to remove these permanent industry-specific effects, we need to transform the equations into first-differences (arellano and Bond 1991) or orthogonal deviations (arellano and Bover 1995). Potential measurement problems underlying the offshoring index would lead us to opt for the latter, since first-differencing tends to amplify such problems through larger vari-ances.
The GMM specifications have been re-parametrized to show the total effects concentrated in period t.31 Furthermore, some equations include time dummies to control for period-specific shocks common to all industries. These time dummies are also
31 Joint Wald tests are presented along all estimations in order to assure that this is possible.
effects on the labor market [ 113 ]
used as additional instruments and, in addition to the predeter-mined instruments, we also consider exogenous ones.32 The valid-ity of the instrument set and of the overidentifying restrictions are tested using the conventional Sargan test. The consistency of the GMM estimates also depends on the absence of serial correlation in the errors. Using estimates from the model in orthogonal de-viations, we tested the absence of second-order serial correlation in the residuals, as proposed by arellano and Bond (1991).
4.3.1. Employment effectsIn table 4.1 we present the results of the estimation of the labor
demand equation in (4.7), which omits the output variables and includes the real stock of capital. The equation is characterized by a large persistence coefficient, indicating a strong inertia in the industries’ aggregate level of employment.33 our variables of interest are OSS and OSM, and since these are not transformed into logarithms, they should be interpreted as semi-elasticities. We see that services offshoring affects employment positively in both estimations, without and with period dummies, with a short-term semi-elasticity of 1.03 and 0.53 percent, and long-term semi-elas-ticities of around 20 percent (no period dummies) and 10 percent (period dummies), respectively. on the other hand, materials off-shoring affects employment with a negative sign. Short-term elas-ticities are –0.33 percent (no period dummies) and –0.23 (period dummies) percent, and long-run elasticities stand at –6.6 percent (no period dummies) and –4.6 percent (period dummies).
32 Predetermined variables used as instruments for the labor demand equation were: L
it –2, L
it –3, w
it –2, w
it –3, K
it –2, K
it –3, all in logs. For total factor productivity we use
TFPit –2
, TFPit –3
. Exogenous instruments for all GMM estimations were the office and production workers industry shares (also from the JIP database). office workers are thought to be more related with services offshoring whereas production workers are often linked to materials offshoring.
33 The Wald test for the lagged employment coefficient being equal to 1 is re-jected. Moreover, Im-Pesaran-Shin tests for the existence of unitary roots were run individually on the cross-sections residuals, rejecting in most cases the null of a root process (the results of these tests are available on request). related to this, agnese and Sala (2009) estimate a system for Japan consisting of a labor demand and a labor supply equations. Even though offshoring is not considered there, the labor demand equation appears with a persistence coefficient of 0.89.
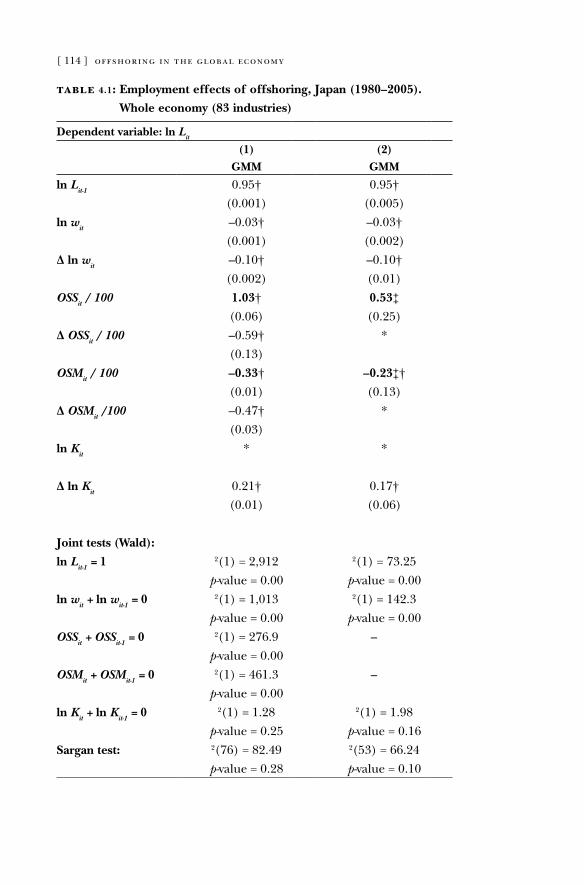
[ 114 ] offshoring in the global economy
table 4.1: Employment effects of offshoring, Japan (1980–2005).
Whole economy (83 industries)
Dependent variable: ln Lit
(1)GMM
(2)GMM
ln Lit-1
0.95† 0.95†
(0.001) (0.005)
ln wit
–0.03† –0.03†
(0.001) (0.002)
Δ ln wit
–0.10† –0.10†
(0.002) (0.01)
OSSit / 100 1.03† 0.53‡
(0.06) (0.25)
Δ OSSit / 100 –0.59† *
(0.13)
OSMit / 100 –0.33† –0.23‡†
(0.01) (0.13)
Δ OSMit /100 –0.47† *
(0.03)
ln Kit
* *
Δ ln Kit
0.21† 0.17†
(0.01) (0.06)
Joint tests (Wald):
ln Lit-1
= 1 2(1) = 2,912 2(1) = 73.25
p-value = 0.00 p-value = 0.00
ln wit + ln w
it-1 = 0 2(1) = 1,013 2(1) = 142.3
p-value = 0.00 p-value = 0.00
OSSit + OSS
it-1 = 0 2(1) = 276.9 –
p-value = 0.00
OSMit + OSM
it-1 = 0 2(1) = 461.3 –
p-value = 0.00
ln Kit + ln K
it-1 = 0 2(1) = 1.28 2(1) = 1.98
p-value = 0.25 p-value = 0.16
Sargan test: 2(76) = 82.49 2(53) = 66.24
p-value = 0.28 p-value = 0.10
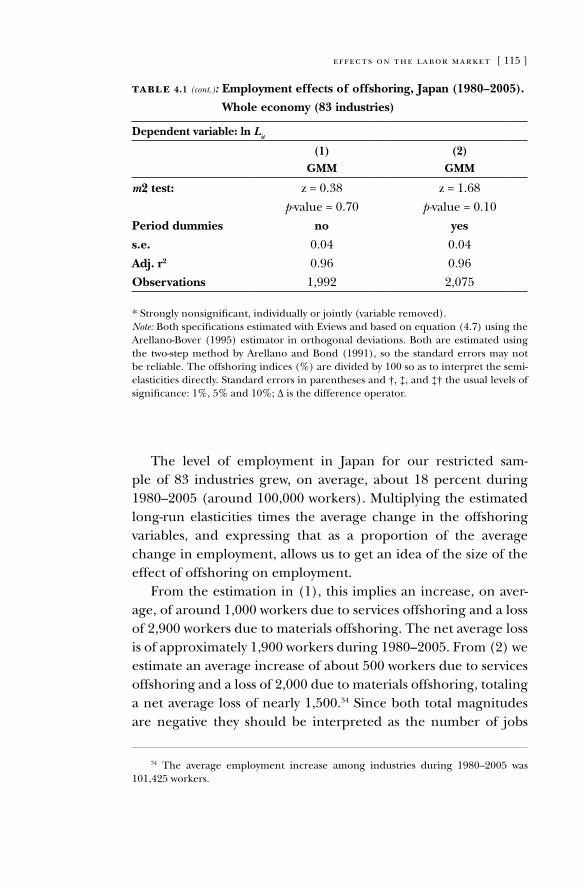
effects on the labor market [ 115 ]
The level of employment in Japan for our restricted sam-ple of 83 industries grew, on average, about 18 percent during 1980–2005 (around 100,000 workers). Multiplying the estimated long-run elasticities times the average change in the offshoring variables, and expressing that as a proportion of the average change in employment, allows us to get an idea of the size of the effect of offshoring on employment.
From the estimation in (1), this implies an increase, on aver-age, of around 1,000 workers due to services offshoring and a loss of 2,900 workers due to materials offshoring. The net average loss is of approximately 1,900 workers during 1980–2005. From (2) we estimate an average increase of about 500 workers due to services offshoring and a loss of 2,000 due to materials offshoring, totaling a net average loss of nearly 1,500.34 Since both total magnitudes are negative they should be interpreted as the number of jobs
34 The average employment increase among industries during 1980–2005 was 101,425 workers.
table 4.1 (cont.): Employment effects of offshoring, Japan (1980–2005).
Whole economy (83 industries)
Dependent variable: ln Lit
(1)GMM
(2)GMM
m2 test: z = 0.38 z = 1.68
p-value = 0.70 p-value = 0.10
Period dummies no yes
s.e. 0.04 0.04
Adj. r2 0.96 0.96
Observations 1,992 2,075
* Strongly nonsignificant, individually or jointly (variable removed).Note: Both specifications estimated with Eviews and based on equation (4.7) using the arellano-Bover (1995) estimator in orthogonal deviations. Both are estimated using the two-step method by arellano and Bond (1991), so the standard errors may not be reliable. The offshoring indices (%) are divided by 100 so as to interpret the semi-elasticities directly. Standard errors in parentheses and †, ‡, and ‡† the usual levels of significance: 1%, 5% and 10%; Δ is the difference operator.
[ 116 ] offshoring in the global economy
that fail to open due to offshoring. Indeed, they only represent a small fraction of the total increase in employment: between 1.9 percent in specification formula (1) to 1.5 percent in formula (2). aggregating these figures, our estimations suggest that, dur-ing 1980–2005, the total loss of jobs as a result of offshoring was negligible: from 160,000 in specification formula (1) to 125,000 in (2).
Furthermore, the results are robust to the presence of outliers whereas potential endogeneity issues are minimized not only by the use of the GMM technique, but by ruling out all output variables on the right-hand side of the equation. However, due to the high level of aggregation entailed in this empirical exercise, the results are to be treated with great caution. Indeed, preliminary results on an industry-by-industry basis seem to show that the final effects of offshoring on domestic employment may be rather disparate and ambiguous. a brief account follows.
out of a total of 108 industries in the original database, we are left with 83 where the data behaves as expected. In 29 of these industries, the long-term elasticity of services offshoring (OSS) is positively signed, in 41, it is zero, and in 13 it is negative. on the other hand, for the coefficient of materials offshoring (OSM) we observe that long-term elasticities are positive in 14 industries, zero in 37, and negative in 32. In summary, according to our data for Japan, services offshoring appears to be much friendlier than materials offshoring with regards to employment creation domes-tically.
out of those 29 industries with a positive effect of oSS on employment, we distinguish six industries from the services sec-tor, three from the primary sector plus energy, and 20 from the manufacturing sector. among these we should highlight the retail and the finance (services) industries, which account for relatively large shares of the GdP (5 percent and 3.35 percent according to JIP, ranking them fourth and seventh out of 108). among those that have grown the most (i. e., compound annual growth rate) we have the following industries: semiconductor devices (first), of-fice rental (third), information and internet services (sixth), and telegraph and telephone (10th). That is, one manufacturing and three services industries.
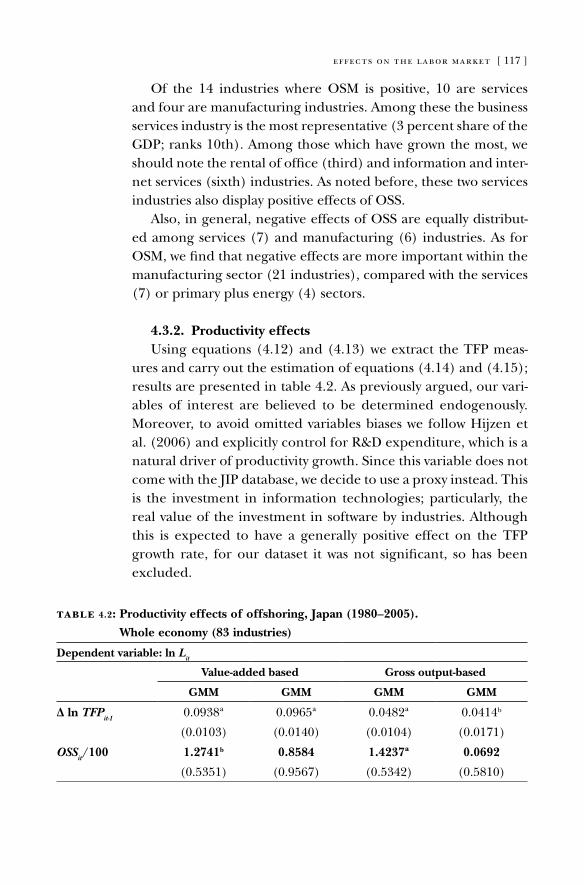
effects on the labor market [ 117 ]
of the 14 industries where oSM is positive, 10 are services and four are manufacturing industries. among these the business services industry is the most representative (3 percent share of the GdP; ranks 10th). among those which have grown the most, we should note the rental of office (third) and information and inter-net services (sixth) industries. as noted before, these two services industries also display positive effects of oSS.
also, in general, negative effects of oSS are equally distribut-ed among services (7) and manufacturing (6) industries. as for oSM, we find that negative effects are more important within the manufacturing sector (21 industries), compared with the services (7) or primary plus energy (4) sectors.
4.3.2. Productivity effectsUsing equations (4.12) and (4.13) we extract the TFP meas-
ures and carry out the estimation of equations (4.14) and (4.15); results are presented in table 4.2. as previously argued, our vari-ables of interest are believed to be determined endogenously. Moreover, to avoid omitted variables biases we follow Hijzen et al. (2006) and explicitly control for r&d expenditure, which is a natural driver of productivity growth. Since this variable does not come with the JIP database, we decide to use a proxy instead. This is the investment in information technologies; particularly, the real value of the investment in software by industries. although this is expected to have a generally positive effect on the TFP growth rate, for our dataset it was not significant, so has been excluded.
table 4.2: Productivity effects of offshoring, Japan (1980–2005).
Whole economy (83 industries)
Dependent variable: ln Lit
Value-added based Gross output-based
GMM GMM GMM GMM
Δ ln TFPit-1
0.0938ª 0.0965ª 0.0482ª 0.0414b
(0.0103) (0.0140) (0.0104) (0.0171)
OSSit/100 1.2741b 0.8584 1.4237ª 0.0692
(0.5351) (0.9567) (0.5342) (0.5810)
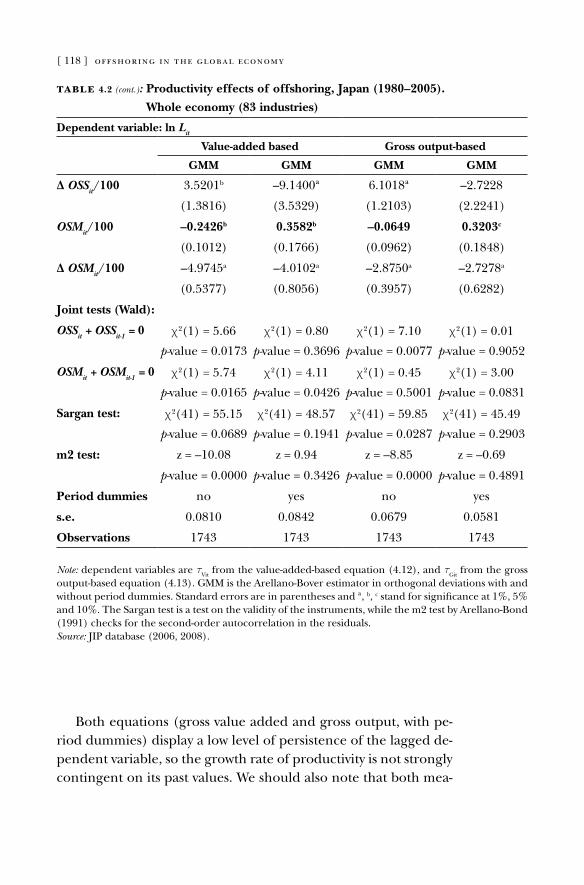
[ 118 ] offshoring in the global economy
Both equations (gross value added and gross output, with pe-riod dummies) display a low level of persistence of the lagged de-pendent variable, so the growth rate of productivity is not strongly contingent on its past values. We should also note that both mea-
table 4.2 (cont.): Productivity effects of offshoring, Japan (1980–2005).
Whole economy (83 industries)
Dependent variable: ln Lit
Value-added based Gross output-based
GMM GMM GMM GMM
Δ OSSit/100 3.5201b –9.1400ª 6.1018ª –2.7228
(1.3816) (3.5329) (1.2103) (2.2241)
OSMit/100 –0.2426b 0.3582b –0.0649 0.3203c
(0.1012) (0.1766) (0.0962) (0.1848)
Δ OSMit/100 –4.9745a –4.0102a –2.8750a –2.7278a
(0.5377) (0.8056) (0.3957) (0.6282)
Joint tests (Wald):
OSSit + OSS
it-1 = 0 c2(1) = 5.66 c2(1) = 0.80 c2(1) = 7.10 c2(1) = 0.01
p-value = 0.0173 p-value = 0.3696 p-value = 0.0077 p-value = 0.9052
OSMit + OSM
it-1 = 0 c2(1) = 5.74 c2(1) = 4.11 c2(1) = 0.45 c2(1) = 3.00
p-value = 0.0165 p-value = 0.0426 p-value = 0.5001 p-value = 0.0831
Sargan test: c2(41) = 55.15 c2(41) = 48.57 c2(41) = 59.85 c2(41) = 45.49
p-value = 0.0689 p-value = 0.1941 p-value = 0.0287 p-value = 0.2903
m2 test: z = –10.08 z = 0.94 z = –8.85 z = –0.69
p-value = 0.0000 p-value = 0.3426 p-value = 0.0000 p-value = 0.4891
Period dummies no yes no yes
s.e. 0.0810 0.0842 0.0679 0.0581
Observations 1743 1743 1743 1743
Note: dependent variables are tVit
from the value-added-based equation (4.12), and tGit
from the gross output-based equation (4.13). GMM is the arellano-Bover estimator in orthogonal deviations with and without period dummies. Standard errors are in parentheses and ª, b, c stand for significance at 1%, 5% and 10%. The Sargan test is a test on the validity of the instruments, while the m2 test by arellano-Bond (1991) checks for the second-order autocorrelation in the residuals.Source: JIP database (2006, 2008).
effects on the labor market [ 119 ]
sures put the stress on different dimensions of the production process.35
In analyzing the estimation of the value-added measure through equation (4.14) we found that, for the specification without period effects, services offshoring is large and significant while materials offshoring shows a significant negative sign with a rather small net effect. If we add period dummies, we end up with both kinds of offshoring showing a positive effect on productivity growth, yet only materials offshoring was significant. Moreover, the estimation entertaining period dummies loosely passes both the Sargan and m2 test. Here, a 1 percentage point increase in materials offshoring index yields a 0.35 percent increase in the TFP growth rate.
In the estimation of the TFP output-based measure in equation (4.15) we have a similar picture. Services offshoring appears with a large positive effect in the specification without period effects, yet there is some evidence of second-order autocorrelation. as for the estimation considering period effects, materials offshoring is positive and significant and again, the data easily pass both the Sargan and m2 test. according to this, a 1 percentage point ex-pansion in materials offshoring would bring about a 0.32 percent increase in the TFP growth rate.
of course, these are very preliminary results on a rather ag-gregate level. a natural next step would be, as with employment, to look at the behavior of industries one by one. This disaggrega-tion might yield interesting yet disparate results, depending on the industry. In the next chapter, we conclude the first part of the book, with some remarks about the socioeconomic impact of offshoring.
35 The correlation coefficient, however, is 0.90.

[ 121 ]
The Socioeconomic debate on offshoring
rECENT breakthroughs in telecommunications have opened doors to more dynamic business practices. offshoring, which has been widely accepted in most of the business world owing to potential gains in productivity, stands out among these new prac-tices. However, offshoring remains to be fully understood, both within and outside of the business world (especially within the political mainstream and in terms of public opinion).
Without a doubt, the expansion of the Internet has been a key factor in company relocation strategies over the past few decades. It is often said that every task that can now be put through a wire is liable to be moved abroad. In particular, a new or second- generation services-oriented offshoring has taken shape in more recent years. Even though the numbers are still far from those associated with materials (or production) offshoring, services off-shoring is expected to take over very soon as a natural outcome of growth and globalization.
offshoring in general and services offshoring in particular seem to be relatively new phenomena. But to what extent are they really new? after all, since the era of Smith and ricardo entre-preneurs have been maximizing their profits through trade. and certainly the invisible hand is as in force today as it was back then. For this reason, should we not think of offshoring as a particu-lar form of trade (i. e., intermediate trade)? In this regard, some modern economists have shed some light on the issue as they de-fine offshoring as the ultimate manifestation of trade (Mankiw and Swagel 2006) from which the world as a whole cannot lose (Blinder 2006). and, as in basic ricardian theory, it can be said that there are two sides (offshoring and hosting partners) that can mutually benefit from this particular exchange.
of course, adjustment costs for some workers and firms are a harsh reality. It has been argued that widespread fears on the sub-ject usually revolve around the millions of jobs soon to be relocated
5.
[ 122 ] offshoring in the global economy
from developed economies into developing ones, resulting in a significant welfare cost in developed economies due to employment destruction. But the other side of the story is that productivity gains and price cuts could lead to a gradual stimulation of the domestic demand for goods and services.
Therefore, it might not be the quantity of workers that should worry economists and decision makers in the end. Perhaps, it is the employment composition across industries or sectors of the economy that we should focus on with more intensity. Shifts in this composition due to offshoring are commonly addressed as a form of sector bias (arndt 1997, 1998, 1999).
another alternative is to interpret offshoring as a factor-bias change within labor markets (Feenstra and Hanson 1996, 1999). Here, high-skilled employment results favored after offshoring takes place because low-skill activities are more prone to go off-shore because of potential labor cost gains. This might result in an increase in the skill intensity of production that comes with an increase in the wage rate for high- to low-skilled labor. one way or the other, total numbers might be negligible when it comes to assessing the total welfare loss implied by offshoring practices.
Consequently, it remains of utter importance to measure off-shoring properly, especially for what it might represent for labor markets. In this first part of the book we have seen that at least in the economics literature, it has become usual to consider inter-mediate trade as a way of approaching a more rigorous definition. This sort of trade represents an important share of the current total trade for industries, which is also said to affect the relative demand for different kinds of labor more than the trade in final goods (Feenstra and Hanson 2001).
accordingly, using our empirical analysis above, we tried to produce a new understanding of widely held preconceptions. First, offshoring is not all about large and highly developed econ-omies relocating jobs to far-off countries. despite the fears held by many, the evidence suggests that offshoring is a widespread phenomenon. Furthermore, according to the indices presented, smaller economies rank consistently among the most intensive offshorers in relative terms. This is in part a result of our indi-rect estimations of offshoring through intermediate trade. The
the socioeconomic debate on offshoring [ 123 ]
growth rates show, however, a significant increment in later times for some large economies.
another issue we addressed is the difference in reach for the two broad sectors of the economy: manufacturing and ser- vices. The numbers here make it clear that offshoring still holds a stronger grip for manufacturing. a first wave of relocations around production activities took place in the manufacturing sector worldwide back in the 1960s and 1970s, when it became necessary to compete with foreign producers. at that time, mov-ing production workers abroad was not only possible but neces- sary. But with improvements in communications and the Internet revolution, a second wave of offshoring focused on the services sector has recently gained more attention. The evidence here re-flects this change.
another point we raised deals with the different kinds of off-shoring. This is certainly in close connection to the previous analy- sis. In terms of the indices produced, we are now interested in the type of input being imported, whereas previously, we inquired about the destiny of the same input. Here the growth rate of the world (weighted) average seems to be significantly higher for services offshoring. For this reason, we also carried out a detailed analysis on services offshoring.
For this we presented a breakdown of the industries engaged in services offshoring. We noticed that in effect services offshoring concentrates on services industries, and that the industries at the top traditionally imply relatively high value-added activities that could eventually result in higher growth and new employment opportunities. We showed the growth rates in the services off- shoring intensities for every industry considered with their associ-ated growth rates of employment. Not surprisingly, fast-growing industries like finance and insurance, computer and related ac-tivities, or business activities in general, experience high rates of both services offshoring and employment.
later, and complementing the statistical analysis, we presented the case of Japan relying on widely used econometric techniques. Here we argued that the final effect of offshoring on employment could be positive as well as negative. It depends on whether the long-term productivity effect overcomes both the substitution and

[ 124 ] offshoring in the global economy
short-term productivity effects. our results indicate that, at least at the aggregate level, positive elasticities can be expected when it comes to services offshoring. However, this simple exercise should be taken with caution, and only as a reference that the final effects of offshoring are ambiguous.
Throughout the debate on offshoring, inflated numbers have been reported both by consulting companies and the media. This usually influences politicians and the public (unions, most repre-sentatively) in the same direction. according to these agents, off-shoring is necessarily bad for domestic employment, since those jobs previously performed within the national borders are now taken to other horizons (for them, one job offshored is one job lost). However, a short-sighted reading such as this could prevent a real understanding of the subject. Entrepreneurs, in reducing their costs (or maximizing their profits for that matter), are just fulfilling a social function. It is then natural that they look into the global pool of employment seeking to exploit the geograph-ic comparative advantages (i. e., cheaper labor) whenever they deem it appropriate.
Politicians, employers, and workers must realize, once and for all, that economics is certainly not a zero-sum game. Negative as well as positive effects of offshoring are natural and offset forces that dwell in the realm of international trade. In opposing off-shoring, hampering forces like unions and regulations would do nothing but harm the very individuals they are so intent on pro-tecting.
our empirical analysis seems to point towards the potential gains of offshoring. However, the current crisis predisposes eco-nomic agents to find scapegoats where there are none. as men-tioned before, negative welfare effects for a group of people as a result of offshoring are certainly one gloomy possibility. But this also holds true for all entrepreneurial practices known to date and, by extension, all economic activities undertaken by rational individuals. Underlying our research, there is a compelling neces-sity to keep this discussion current and alive, for what it represents for all economic agents alike. only by discussing it will our under-standing of the offshoring phenomenon truly be expanded.

ParT TWo
MaNaGEMENT PraCTICES aNd oFFSHorING

[ 127 ]
Business Process offshoring: a literature review
aS in part one of this book, we will start part II by providing a brief review of the state of the literature, as well as highlight the main frameworks and methodologies currently in use. We will also describe other topics of interest in the management field such as the effects of what has been called the global race for talent (i. e., competition for skilled workers) on labor mar-kets.
This chapter thus surveys academic publications that focus on this recent wave of BPo, from the initial relocation of fairly com-moditized back-office activities to the latest migration of sensitive knowledge-intensive functions such as r&d and engineering ser- vices.
as a natural consequence of the variety of issues related to the recent wave of BPo, the academic works published on the topic are scattered among very different streams of the wide range of management literature. Given that the offshoring phenomenon is by definition an international phenomenon, we restricted our analysis to articles that belong to purely international man-agement research. In other words, we deliberately confined our analysis to those papers that focus on the international aspects of management that do not apply to domestic enterprises (ricks 1991; Werner 2002). In particular, we investigated how the recent practice of offshoring represents a novel opportunity to manage firms in a multinational context. obviously, the selected articles belong to very different streams of the international management literature, as they focus on different facets of the offshoring phe-nomenon, ranging from virtual teams to information systems, from industry drivers to firm-level considerations. The purpose of this chapter is to organize such contributions organically and highlight emerging trends.
6.
[ 128 ] offshoring in the global economy
6.1. Literature review
Table 6.1 schematically maps the 38 articles discussed in this liter-ature review, ordered by year of publication. Given the academic emphasis of this review, we excluded books, book reviews, and edi-torials, as well as articles published in the Harvard Business Review, the Sloan Management Review and the California Management Review due to their lack of focus on academic research. In order to pro-vide a comprehensive portrait of the current offshoring literature, we also excluded working papers as well as unpublished articles presented at international conferences.
reddy’s paper, published in 1997, can be rightly considered the first major contribution to the understanding of what we now call BPo. Though written over 10 years ago, the author already identi-fied some of the key driving forces of what would become a wave of internationalization that many analysts now consider to be a true service revolution: the recent technological progress and its rapid international diffusion, the cost differentials among developed and developing countries, and the presence of a significant global mismatch between local output from institutes of higher education and the needs of local industries represent the conditions that fos-tered the emergence of a new offshoring model for multinational companies. In addition, reddy also accurately anticipated that the forthcoming globalization was not only going to serve fairly com-moditized back-office functions, but also higher-skilled core func-tions such as r&d. reddy’s particular focus on India as a privileged destination for the relocation of these high-value activities was also farsighted, evidenced by the fact that India today represents the most important recipient of offshored functions from U.S. and Eu-ropean companies (lewin and Peeters 2006a).
as for the other 37 articles analyzed, we can clearly see an ex-ponential growth in interest for the topic starting in 2003. off- shoring began to attract the attention of several scholars from a va-riety disciplines partly thanks to a number of special issues focused on the topic in leading management journals such as the Journal of Management Studies, the Journal of Management Information Sys-tems, the Journal of International Management, and the Journal of Op-erations Management. a number of focused academic conferences
business process offshoring: a literature review [ 129 ]
organized by leading academic institutions36 has also emerged in the past few years, further validating the increased attention on this important area of research. By analyzing the articles with specific consideration for the topics discussed and research meth-odologies used, as well as the works cited within each article, we reached several conclusions discussed below.
36 among others, in 2007 duke University organized the first annual research conference and workshops on offshoring. That same year, the Indian Institute of Management in Bangalore hosted the second international conference on management of globally distributed work. In 2008 Bocconi University organized an international conference focused on offshoring and outsourcing.

[ 130 ] offshoring in the global economyta
bl
e 6
.1: M
appi
ng t
he o
ffsh
orin
g lit
erat
ure
Aut
hors
(ye
ar)
Titl
eLi
tera
ture
of
ref
eren
ceLe
vel
of a
naly
sis
Met
hodo
logy
ty
peK
ey f
indi
ngs
red
dy (
1997
)“N
ew tr
ends
in g
loba
lizat
ion
of
corp
orat
e r
&d
and
impl
icat
ions
for
inno
vatio
n ca
pabi
lity
in h
ost c
ount
ries
: a
surv
ey fr
om In
dia.
”
Inte
rnat
iona
l bu
sine
ssFi
rmEm
piri
cal
surv
ey –
qu
estio
nnai
re
Prim
ary
driv
ing
forc
e fo
r lo
catin
g r
&d
in In
dia
is te
chno
logy
-re
late
d. T
he a
vaila
bilit
y of
tale
nt
in th
e of
fsho
re lo
catio
n is
als
o de
term
inan
t in
the
deci
sion
to
relo
cate
r&
d.
dos
sani
and
K
enne
y (2
003)
“lift
and
shift
: mov
ing
the
back
off
ice
to I
ndia
.”In
form
atio
n sy
stem
sIn
dust
ry –
fir
mC
ase
stud
ies
ove
rvie
w o
f off
shor
ing
indu
stry
in
Indi
a. a
naly
sis o
f six
key
fact
ors t
o be
con
side
red
befo
re o
ffsh
orin
g.H
inds
and
Bai
ley
(200
3)“o
ut o
f sig
ht, o
ut o
f syn
c:
unde
rsta
ndin
g co
nflic
t in
dist
ribu
ted
team
s.”
org
aniz
atio
n be
havi
orTe
amC
once
ptua
l re
view
dev
elop
a th
eory
-bas
ed
expl
anat
ion
of h
ow g
eogr
aphi
cally
di
stri
bute
d vi
rtua
l tea
ms a
re
diff
eren
t fro
m tr
aditi
onal
team
s.Pf
anne
nste
in a
nd
Tsai
(20
04)
“off
shor
e ou
tsou
rcin
g: c
urre
nt
and
futu
re e
ffec
ts o
n a
mer
ican
IT
indu
stry
.”
Info
rmat
ion
syst
ems
Indu
stry
rev
iew
of
prev
ious
re
port
s
The
mai
n dr
iver
of I
T o
utso
urci
ng
is lo
wer
labo
r co
sts,
how
ever
co
mpa
nies
als
o w
ant t
o fo
cus o
n th
eir
core
bus
ines
ses a
nd c
reat
e va
lue
for
thei
r sh
areh
olde
rs.
Bun
yara
tave
j, H
ahn
and
doh
(2
005)
“Int
erna
tiona
l off
shor
ing
of se
rvic
es: a
pa
rity
stud
y.”In
tern
atio
nal
busi
ness
Cou
ntry
Empi
rica
l an
alys
is –
FD
I da
ta
Wag
e di
ffer
ence
s are
not
the
only
fa
ctor
s beh
ind
the
offs
hori
ng
deci
sion
. Cul
tura
l sim
ilari
ty,
educ
atio
n le
vel a
nd p
oten
tial
serv
ice
qual
ity is
sues
als
o m
atte
r.N
achu
m a
nd
Zahe
er (
2005
)“T
he p
ersi
sten
ce o
f dis
tanc
e? T
he
impa
ct o
f tec
hnol
ogy
on M
NE
mot
ivat
ions
for
fore
ign
inve
stm
ent.”
Inte
rnat
iona
l bu
sine
ssIn
dust
ryEm
piri
cal
anal
ysis
– F
DI
data
off
shor
ing
(out
war
d flo
w in
hig
hly
info
rmat
ion-
inte
nsiv
e in
dust
ries
) is
on
ly a
bout
eff
icie
ncy
seek
ing,
i. e
., co
st sa
ving
s
doh
(20
05)
“off
shor
e ou
tsou
rcin
g: im
plic
atio
ns
for
inte
rnat
iona
l bus
ines
s and
stra
tegi
c m
anag
emen
t the
ory
and
prac
tice.
”
rB
V –
dyn
amic
ca
pabi
litie
s -st
ages
mod
el
Gen
eral
–
polic
yC
once
ptua
l re
view
off
shor
ing
chal
leng
es k
ey
man
agem
ent t
heor
ies a
nd c
alls
for
polic
y im
plic
atio
ns.

business process offshoring: a literature review [ 131 ] ta
bl
e 6
.1 (
cont
.): M
appi
ng t
he o
ffsh
orin
g lit
erat
ure
Aut
hors
(ye
ar)
Titl
eLi
tera
ture
of
ref
eren
ceLe
vel
of a
naly
sis
Met
hodo
logy
ty
peK
ey f
indi
ngs
Farr
ell (
2005
)“o
ffsh
orin
g: v
alue
cre
atio
n th
roug
h ec
onom
ic c
hang
e.”
McK
inse
y G
loba
l In
stitu
te’s
stud
ies
Gen
eral
–
polic
yC
ase
stud
ies
off
shor
ing
crea
tes w
ealth
in
Wes
tern
cou
ntri
es (
cost
savi
ngs,
repa
tria
ted
earn
ings
, new
re
venu
es).
lev
y (2
005)
“off
shor
ing
in th
e ne
w g
loba
l pol
itica
l ec
onom
y.”Ec
onom
ic
geog
raph
yG
ener
al –
po
licy
Con
cept
ual
revi
ewo
ffsh
orin
g cr
eate
s glo
bal
com
mod
ity m
arke
ts th
at d
estr
oy
valu
e in
Wes
tern
cou
ntri
es.
aro
n, C
lem
ons
and
red
di (
2005
)“J
ust r
ight
out
sour
cing
; und
erst
andi
ng
and
man
agin
g ri
sk.”
Info
rmat
ion
syst
ems –
TC
E
Firm
Cas
e st
udie
sd
evel
op a
tech
niqu
e, c
alle
d st
rate
gic
chun
kific
atio
n, th
at
allo
ws c
ompa
nies
to m
inim
ize
offs
hore
ris
ks.
lew
in a
nd P
eete
rs
(200
6a)
“off
shor
ing
wor
k: b
usin
ess h
ype
or th
e on
set o
f fun
dam
enta
l tr
ansf
orm
atio
n?”
Inte
rnat
iona
l bu
sine
ssFi
rmEm
piri
cal
surv
ey –
qu
estio
nnai
re
off
shor
ing
impl
icat
ions
: co
mm
oditi
zatio
n, e
mer
ging
gl
obal
sour
cing
of h
uman
cap
ital,
bott
om-u
p ph
enom
enon
.d
ossa
ni a
nd
Ken
ney
(200
6)“r
efle
ctio
ns u
pon
‘Siz
ing
the
emer
ging
glo
bal l
abor
mar
ket.’
”M
cKin
sey
Glo
bal
Inst
itute
’s st
udie
s
Gen
eral
–
indu
stry
Cas
e st
udie
sa
pro
foun
d tr
ansf
orm
atio
n of
the
empl
oym
ent a
nd w
age
stru
ctur
e in
th
e U
.S. i
s und
erw
ay.
Farr
ell,
labo
issi
ere
and
ros
enfe
ld
(200
6)
“Siz
ing
the
emer
ging
glo
bal l
abor
m
arke
t.”M
cKin
sey
Glo
bal
Inst
itute
’s st
udie
s
Gen
eral
–
indu
stry
Cas
e st
udie
so
ffsh
orin
g w
ill im
pact
a r
elat
ivel
y sm
all f
ract
ion
of W
este
rn jo
bs.
off
shor
e w
ages
will
ris
e bu
t will
no
t rea
ch U
.S. l
evel
s. T
here
is
inef
ficie
nt m
atch
ing.
Mar
in (
2006
)“a
new
inte
rnat
iona
l div
isio
n of
labo
r in
Eur
ope:
out
sour
cing
and
off
shor
ing
to E
aste
rn E
urop
e.”
Inte
rnat
iona
l ec
onom
ics
Firm
Empi
rica
l su
rvey
–
ques
tionn
aire
dis
cuss
ion
of d
rive
rs o
f the
new
di
visi
on o
f lab
or in
Eur
ope.
Fal
ling
trad
e co
sts a
nd r
educ
ed le
vel o
f co
rrup
tion
are
mak
ing
it ea
sier
to
offs
hore
to E
aste
rn E
urop
e.

[ 132 ] offshoring in the global economyta
bl
e 6
.1 (
cont
.): M
appi
ng t
he o
ffsh
orin
g lit
erat
ure
Aut
hors
(ye
ar)
Titl
eLi
tera
ture
of
ref
eren
ceLe
vel
of a
naly
sis
Met
hodo
logy
ty
peK
ey f
indi
ngs
Jahn
s, H
artm
ann
and
Bal
s (20
06)
“off
shor
ing:
dim
ensi
ons a
nd d
iffus
ion
of a
new
bus
ines
s con
cept
.”In
tern
atio
nal
busi
ness
Gen
eral
Con
cept
ual
revi
ewo
verv
iew
of o
ffsh
orin
g st
udie
s. G
eogr
aphi
c an
d co
ntra
ctua
l/le
gal d
imen
sion
s are
hig
hlig
hted
fo
r de
finin
g of
fsho
ring
. En
viro
nmen
tal,
polit
ical
and
so
cio-
dem
ogra
phic
fact
ors a
re a
lso
cons
ider
ed.
Har
riso
n an
d M
cMill
an (
2006
)“d
ispe
lling
som
e m
yths
abo
ut
offs
hori
ng.”
Inte
rnat
iona
l bu
sine
ssFi
rmEm
piri
cal
Surv
ey –
de
scri
ptiv
e st
atis
tics
rev
iew
of
resu
lts o
f pre
viou
s st
udie
s plu
s th
e ad
ditio
n of
ne
w r
esul
ts sh
ow th
at in
crea
ses
in e
mpl
oym
ent i
n lo
w-in
com
e co
untr
ies c
an h
urt e
mpl
oym
ent a
t ho
me.
Blin
der
(200
6)“o
ffsh
orin
g: th
e ne
xt in
dust
rial
re
volu
tion?
”In
tern
atio
nal
econ
omic
sG
ener
alC
once
ptua
lEc
onom
ists
app
lyin
g th
e pr
inci
ple
of c
ompa
rativ
e ad
vant
age
unde
rest
imat
e th
e im
port
ance
of
off
shor
ing
and
its d
isru
ptiv
e ef
fect
s.M
ehta
et a
l. (2
006)
“Cha
lleng
es a
nd o
ppor
tuni
ties o
f bu
sine
ss p
roce
ss o
utso
urci
ng in
Indi
a.”
Stra
tegi
c m
anag
emen
t –
TC
E, r
BV
and
re
latio
nal v
iew
Indu
stry
Cas
e st
udie
s –
inte
rvie
ws
and
cont
ent
anal
ysis
Hum
an r
esou
rces
- and
or
gani
zatio
n-re
late
d ch
alle
nges
are
th
e m
ost c
ritic
al is
sues
. Kno
wle
dge
outs
ourc
ing
is th
e m
ain
unco
vere
d fu
ture
opp
ortu
nity
. Sec
onda
ry
data
supp
ort t
he fi
ndin
gs.
Hen
ley
(200
6)“o
utso
urci
ng th
e pr
ovis
ion
of so
ftw
are
and
IT-e
nabl
ed se
rvic
es to
Indi
a.”
Info
rmat
ion
syst
ems
Indu
stry
rev
iew
Cos
t con
side
ratio
ns a
re n
ot th
e on
ly r
elev
ant d
rive
rs. N
ew b
usin
ess
mod
els,
as w
ell a
s the
par
ticul
ar
Indi
an c
onte
xt, s
houl
d al
so b
e co
nsid
ered
.

business process offshoring: a literature review [ 133 ] ta
bl
e 6
.1 (
cont
.): M
appi
ng t
he o
ffsh
orin
g lit
erat
ure
Aut
hors
(ye
ar)
Titl
eLi
tera
ture
of
ref
eren
ceLe
vel
of a
naly
sis
Met
hodo
logy
ty
peK
ey f
indi
ngs
dos
sani
and
K
enne
y (2
007)
“The
nex
t wav
e of
glo
baliz
atio
n:
relo
catin
g se
rvic
e pr
ovis
ion
to In
dia.
”In
form
atio
n sy
stem
s –
stra
tegi
c m
anag
emen
t
Firm
Cas
e st
udie
sa
taxo
nom
y of
mar
ket p
artic
ipan
ts
is p
rese
nted
. Hig
hlig
hts t
he
incr
easi
ng o
ffsh
orin
g of
hig
hly
skill
ed p
ositi
ons a
nd th
e ac
tive
role
of s
mal
l ent
repr
eneu
rial
U.S
. fir
ms.
Gup
ta a
nd
Muk
herj
i (20
07)
“off
shor
ing:
the
tran
sitio
n fr
om
econ
omic
dri
vers
tow
ard
stra
tegi
c gl
obal
par
tner
ship
and
24-
hour
kn
owle
dge
fact
ory.”
Info
rmat
ion
syst
ems
Firm
Cas
e st
udie
sd
escr
iptio
n of
the
24-h
our
know
ledg
e fa
ctor
y: a
sust
aina
ble
glob
al m
odel
to c
aptu
re v
alue
th
roug
h th
e of
fsho
ring
of c
ompl
ex
task
s.C
onna
ught
on a
nd
Shuf
fler
(200
7)“M
ultin
atio
nal a
nd m
ultic
ultu
ral
dist
ribu
ted
team
s: a
revi
ew a
nd fu
ture
ag
enda
.”
org
aniz
atio
n be
havi
orTe
amC
once
ptua
l re
view
Futu
re r
esea
rch
on th
e to
pic
mus
t br
oade
n its
con
cept
ualiz
atio
n of
cul
ture
, con
side
r va
riou
s co
mpl
exiti
es a
nd in
vest
igat
e ho
w
cultu
re a
nd d
istr
ibut
ion
affe
ct
perf
orm
ance
.K
edia
and
lah
iri
(200
7)“I
nter
natio
nal o
utso
urci
ng o
f ser
vice
s: a
part
ners
hip
mod
el.”
Inte
rnat
iona
l al
lianc
es –
rB
V
– re
latio
nal v
iew
Firm
The
oret
ical
Inte
rnat
iona
l out
sour
cing
of
serv
ices
par
tner
ship
s var
y in
term
s of
val
ue p
ropo
sitio
n an
d de
gree
of
invo
lvem
ent.
Trus
twor
thin
ess
and
cultu
ral d
ista
nce
sign
ifica
ntly
in
fluen
ce th
e pa
rtne
rshi
p.K
shet
ri (
2007
)“I
nstit
utio
nal f
acto
rs a
ffec
ting
offs
hore
bu
sine
ss p
roce
ss a
nd in
form
atio
n te
chno
logy
out
sour
cing
.”
Inst
itutio
nal
theo
ryIn
stitu
tiona
l –
indu
stry
The
oret
ical
ana
lysi
s of h
ow th
e re
gula
tive,
no
rmat
ive
and
cogn
itive
in
stitu
tions
of h
ome
and
host
co
untr
ies i
nflu
ence
the
patt
erns
of
glob
al fl
ow o
f off
shor
e B
P an
d IT
ou
tsou
rcin
g.

[ 134 ] offshoring in the global economyta
bl
e 6
.1 (
cont
.): M
appi
ng t
he o
ffsh
orin
g lit
erat
ure
Aut
hors
(ye
ar)
Titl
eLi
tera
ture
of
ref
eren
ceLe
vel
of a
naly
sis
Met
hodo
logy
ty
peK
ey f
indi
ngs
Gro
te a
nd T
aube
(2
007)
“Whe
n ou
tsou
rcin
g is
not
an
optio
n:
inte
rnat
iona
l rel
ocat
ion
of in
vest
men
t ba
nk r
esea
rch
– or
isn’
t it?
”
TC
E an
d m
odul
arity
lit
erat
ure
Indu
stry
Cas
e st
udie
s in
terv
iew
s –
new
spap
er
surv
ey
For
the
inve
stm
ent b
ank
indu
stry
, th
ere
is li
ttle
scop
e fo
r ou
tsou
rcin
g bu
t mor
e po
tent
ial f
or lo
w-le
vel
rese
arch
act
iviti
es to
be
offs
hore
d to
low
-cos
t cou
ntri
es.
youn
gdah
l and
r
amas
wam
y (2
008)
“off
shor
ing
know
ledg
e an
d se
rvic
e w
ork:
a c
once
ptua
l mod
el a
nd
rese
arch
age
nda.
”
ope
ratio
ns
man
agem
ent
Gen
eral
Con
cept
ual
Two
conc
eptu
al m
odel
s are
pr
opos
ed to
take
into
acc
ount
the
com
plex
ities
of o
ffsh
orin
g se
rvic
e an
d kn
owle
dge
wor
k.Fi
fare
k et
al.
(200
8)“o
ffsh
orin
g te
chno
logy
inno
vatio
n: a
ca
se st
udy
of r
are-
eart
h te
chno
logy
.”St
rate
gic
man
agem
ent
Cou
ntry
Empi
rica
l –
pate
nts
anal
ysis
off
shor
ing
prac
tices
hav
e ad
vers
e ef
fect
s on
inno
vatio
n at
the
natio
nal h
ome
base
.a
ksin
and
Mas
ini
(200
8)“E
ffec
tive
stra
tegi
es fo
r in
tern
al
outs
ourc
ing
and
offs
hori
ng o
f bus
ines
s se
rvic
es: a
n em
piri
cal i
nves
tigat
ion.
”
ope
ratio
ns
man
agem
ent
Firm
Empi
rica
l –
clus
ter
anal
ysis
The
eff
ectiv
enes
s of a
shar
ed
serv
ices
pro
ject
dep
ends
on
the
degr
ee o
f com
plem
enta
rity
be
twee
n th
e ne
eds a
risi
ng fr
om
the
envi
ronm
ent a
nd th
e sp
ecifi
c ca
pabi
litie
s dev
elop
ed.
li e
t al.
(200
8)“T
rans
form
atio
nal o
ffsh
ore
outs
ourc
ing:
em
piri
cal e
vide
nce
from
al
lianc
es in
Chi
na.”
Kno
wle
dge
man
agem
ent
Firm
Empi
rica
l su
rvey
–
ques
tionn
aire
Exam
inat
ion
of th
e re
latio
nshi
p am
ong
the
mot
ive
to a
cqui
re ta
cit
know
ledg
e fr
om o
utso
urci
ng
part
ners
, the
con
trol
mec
hani
sms
and
the
inno
vatio
n ou
tcom
es,
findi
ng th
at th
e fir
st tw
o pr
edic
t inc
rem
enta
l and
rad
ical
in
nova
tion
outc
omes

business process offshoring: a literature review [ 135 ] ta
bl
e 6
.1 (
cont
.): M
appi
ng t
he o
ffsh
orin
g lit
erat
ure
Aut
hors
(ye
ar)
Titl
eLi
tera
ture
of
ref
eren
ceLe
vel
of a
naly
sis
Met
hodo
logy
ty
peK
ey f
indi
ngs
Stra
tman
(20
08)
“Fac
ilita
ting
offs
hori
ng w
ith e
nter
pris
e te
chno
logi
es: r
educ
ing
oper
atio
nal
fric
tion
in th
e go
vern
ance
and
pr
oduc
tion
of se
rvic
es.”
Stra
tegi
c m
anag
emen
t –
TC
E,
com
petit
ive
capa
bilit
y
Firm
Con
cept
ual
Prop
osal
s are
dev
elop
ed o
n ho
w
the
stan
dard
ized
tran
sact
iona
l in
fras
truc
ture
of e
nter
pris
e te
chno
logi
es c
an h
elp
low
er
tran
sact
ion
cost
s rel
ativ
e to
the
offs
hori
ng o
f ser
vice
pro
cess
es.
Bal
akri
shna
n et
al.
(200
8)“o
utso
urci
ng o
f fro
nt-e
nd b
usin
ess
proc
esse
s: qu
ality
, inf
orm
atio
n, a
nd
cust
omer
con
tact
.”
Stra
tegi
c m
anag
emen
t –
info
rmat
ion
syst
ems
Firm
Con
cept
ual
Usi
ng a
mat
hem
atic
al m
odel
, the
au
thor
s det
erm
ine
the
fact
ors t
hat
favo
r th
e ou
tsou
rcin
g of
fron
t-end
pr
oces
ses.
res
ults
find
the
vend
or
can
fore
cast
the
task
env
iron
men
t an
d ga
in so
phis
ticat
ion
in
inte
rpre
ting
cont
ract
term
s.
Met
ters
and
Ver
ma
(200
8)“H
isto
ry o
f off
shor
ing
know
ledg
e se
rvic
es.”
off
shor
ing
liter
atur
eG
ener
alC
once
ptua
lr
evie
w o
f ser
vice
off
shor
ing
in
the
1980
s and
ana
lysi
s of t
he
com
bina
tion
of fa
ctor
s tha
t hav
e cr
eate
d th
e sp
ecifi
c se
rvic
es
offs
hori
ng c
onfig
urat
ion
of to
day.
Ellr
am e
t al.
(200
8)“o
ffsh
ore
outs
ourc
ing
of p
rofe
ssio
nal
serv
ices
: a tr
ansa
ctio
n co
st e
cono
mic
s pe
rspe
ctiv
es.”
TC
EFi
rmC
ase
stud
ies –
in
terv
iew
sU
sing
the
tena
nts o
f TC
E,
post
ulat
es th
at th
e fix
ed c
osts
of
est
ablis
hing
the
rela
tions
hip
dom
inat
e th
e va
riab
le c
osts
of
day-
to-d
ay tr
ansa
ctio
ns, a
nd th
at
orga
niza
tions
will
not
off
shor
e ou
tsou
rce
area
s whe
re th
ere
is a
hi
gh p
erce
ived
leve
l of r
isk.

[ 136 ] offshoring in the global economyta
bl
e 6
.1 (
cont
.): M
appi
ng t
he o
ffsh
orin
g lit
erat
ure
Aut
hors
(ye
ar)
Titl
eLi
tera
ture
of
ref
eren
ceLe
vel
of a
naly
sis
Met
hodo
logy
ty
peK
ey f
indi
ngs
Stri
ngfe
llow
et a
l. (2
008)
“Inv
isib
le c
osts
in o
ffsh
orin
g se
rvic
es
wor
k.”
ope
ratio
ns
man
agem
ent
Firm
Con
cept
ual
dev
elop
men
t of a
con
cept
ual
fram
ewor
k fo
r un
ders
tand
ing
serv
ices
off
shor
ing,
org
aniz
ed
arou
nd in
tera
ctio
n in
tens
ity a
nd
inte
ract
ion
dist
ance
. Inv
isib
le
cost
s ste
m m
ainl
y fr
om th
e un
ique
ch
arac
teri
stic
s of s
ervi
ces.
Viv
ek e
t al.
(200
8)“a
naly
sis
of in
tera
ctio
ns a
mon
g co
re,
tran
sact
ion
and
rela
tions
hip-
spec
ific
inve
stm
ents
: the
cas
e of
off
shor
ing.
”
TC
E an
d r
BV
Firm
Cas
e st
udie
s (g
roun
ded
– th
eory
bu
ildin
g ap
proa
ch)
Sugg
ests
that
alth
ough
the
prop
ositi
ons o
f TC
E m
ight
ex
plai
n th
e of
fsho
ring
alli
ance
s in
thei
r na
scen
t sta
ges,
natu
re
of in
vest
men
ts in
a m
atur
ed
offs
hori
ng a
llian
ce m
ay b
e ex
plic
able
mor
e th
roug
h th
e pr
opos
ition
s mad
e by
the
rB
V.
Met
ters
(20
08)
“a ty
polo
gy o
f off
shor
ing
and
outs
ourc
ing
in e
lect
roni
cally
tr
ansm
itted
serv
ices
.”
ope
ratio
ns
man
agem
ent
Gen
eral
–
indu
stry
Con
cept
ual
Pres
enta
tion
of a
typo
logy
to
appl
y to
off
shor
ing
proc
esse
s. Su
ch ty
polo
gy im
plie
s tha
t whi
le
offs
hori
ng is
a v
iabl
e op
tion
for
man
y fir
ms,
a pr
opor
tion
of
the
serv
ice
proc
esse
s now
bei
ng
offs
hore
d w
ill r
emai
n in
hig
h-w
age
coun
trie
s.

business process offshoring: a literature review [ 137 ]
tab
le
6.1
(co
nt.): M
appi
ng t
he o
ffsh
orin
g lit
erat
ure
Aut
hors
(ye
ar)
Titl
eLi
tera
ture
of
ref
eren
ceLe
vel
of a
naly
sis
Met
hodo
logy
ty
peK
ey f
indi
ngs
aro
n et
al.
(200
8)“M
onito
ring
pro
cess
qua
lity
in
offs
hore
out
sour
cing
: a m
odel
and
fin
ding
s fr
om m
ulti-
coun
try
surv
ey.”
TC
E –
gam
e th
eory
Firm
Empi
rica
l su
rvey
Con
stru
ctio
n of
a g
ame-
theo
retic
m
odel
of t
he d
ynam
ics o
f the
bu
yer-s
uppl
ier
inte
ract
ion
in th
e pr
esen
ce o
f mor
al h
azar
d an
d in
com
plet
e co
ntra
ctin
g: fi
rms a
re
mor
e lik
ely
to in
spec
t rou
tine
and
less
com
plex
pro
cess
es th
an th
e m
ore
com
plex
one
s with
hig
her
cost
s of i
nspe
ctio
n.
Bha
lla e
t al.
(200
8)“I
s mor
e IT
off
shor
ing
bett
er?:
an
exp
lora
tory
stud
y of
Wes
tern
co
mpa
nies
off
shor
ing
to S
outh
east
a
sia.
”
Info
rmat
ion
syst
ems
Firm
Empi
rica
l an
alys
is o
f pu
blic
ly
avai
labl
e da
ta –
clus
ter
anal
ysis
No
clea
r lin
k be
twee
n co
mpa
ny
perf
orm
ance
and
the
exte
nt
of o
ffsh
orin
g is
foun
d, th
us
sugg
estin
g th
at fu
rthe
r st
udy
is
need
ed to
und
erst
and
whe
n an
d ho
w to
off
shor
e.
[ 138 ] offshoring in the global economy
6.2. Main theoretical frameworks used to investigate the offshoring phenomenon
The current offshoring wave is a complex phenomenon that can be approached from different angles using different levels of analysis. as a natural consequence of this complexity, we found a great variety of studies in terms of the sources of their references and branches of literature used within the previously defined international management field across the 38 articles reviewed. If we look at the most often cited theoretical frameworks used to address offshoring issues, we can make the following observa-tions. First, transaction cost economics (TCE), the resource-based view of the firm, and international business theories appear most often as the dominant perspectives. Second, institutional theory and organizational behavior approaches are used to contextualize the offshoring phenomenon at the institutional and group levels, respectively. Finally, a considerable amount of research focuses on important operational issues relative to offshoring and mainly refers to the information systems and operations management lit-erature.
Strategic management literature related to offshoring mostly deals with how two dominant theories are applied in the field: TCE and the resource-based view (rBV) of the firm. TCE repre-sents an insightful approach for analyzing the transactional costs associated with the practice of offshoring and provides a basis for deciding the most appropriate organizational form to adopt in order to minimize those costs. In distinguishing between offshore outsourcing, the so-called buy option and FDI, the equivalent for the captive option, several authors have investigated the conditions under which one organizational form should be preferred over the other. In particular, the authors focus on the bilateral hold-up problem that can emerge if the local offshore vendor has to make an up-front investment in customization (e. g., asset specificity), as is generally the case when accepting to provide the buyer with a se-lected service. The core idea, which goes back to the heart of TCE (Williamson 1975), is that the parties cannot specify all possible future contingencies, especially when a Western firm is operating in an unfamiliar foreign environment, as could be the case with
business process offshoring: a literature review [ 139 ]
a country like India. The decision to offshore outsourcing or use FDI depends, then, on the degree of hold-up, which in turn main-ly depends on the outside options available to the offshore service provider and on the quality of contract-enforcement institutions such as the legal system in the offshore country (Trefler 2005). research by Mehta et al. (2006) and Stratman (2008) shows that the greater the process customization and complexity, the higher the associated transaction risks to generate the hold-up problem. Stratman (2008) also argues that certain enterprise technologies can significantly reduce offshore transaction costs by standardiz-ing and structuring system processes between the Western client and the offshore vendor. Ellram et al. (2008) also utilize the TCE framework and show that the fixed costs of establishing the re-lationship dominate the variable costs of day-to-day transactions. Furthermore, they conclude, organizations will not outsource to offshore vendors located in areas where there is a perceived high degree of unmanageable risk. aron et al. (2005) also focus on the potential risk of opportunistic behavior in the case of offshore outsourcing and use the TCE framework to develop a technique, called strategic chunkification, that allows companies to minimize such risk by dividing entire business processes into chunks that can be separately outsourced (or not) in a much more convenient and safe manner.
Vivek et al. (2008), on the other hand, utilize the TCE frame-work to investigate offshore alliances. Their study interestingly shows that the logic of TCE seems very well suited to explain in-vestments in offshoring alliances in the initial stages. according to the classic TCE framework, alliances are generally seen as falling in the intermediate state between markets and hierarchies (Wil-liamson 1991). Western clients that are aware of the risk of op-portunism in offshore alliances make initial transactional invest-ments, thus controlling the chances of negative consequences. However, as the alliance evolves, TCE appears to be limited in explaining the observed investment in offshore alliances, as it ne-glects the interdependent focus on the capabilities of the alliance. Consequently, for later evolved stages, the authors argue that the rBV perspective seems better equipped to explain the behavior of offshore alliances, as it “focuses on the ability of the firm to
[ 140 ] offshoring in the global economy
create core competencies through capabilities rather than avoid negative market conditions” (Vivek et al. 2008, 194). Mehta et al. (2006) and Kedia and lahiri (2007) make very similar arguments for the necessity to integrate the TCE approach with more com-petence-based views in order to properly model the evolution of offshoring partnerships models.
rBV has emerged as a relevant new conceptualization in the field of strategic management, mainly thanks to the work of Wern-erfelt (1984) and Barney (1991). Thus, it should not come as a surprise that many researchers have adopted the rBV framework to investigate how organizations strive to acquire and develop stra-tegic resources through the practice of offshoring. From a theo-retical standpoint, the founding idea (Penrose 1959) is that a firm can be conceptualized as a bundle of resources and that these re-sources are heterogeneously dispersed across firms. Based on this, rBV predicts that when companies create a pool of resources that are valuable, rare, inimitable and nonsubstitutable (e. g., the so-called VrIN attributes), they can achieve a sustainable competitive advantage given that their strategies based on such resources are difficult to imitate for competitors (Barney 1991). applying rBV to strategic problems has rapidly become a standard approach in the mainstream strategic management field (acedo, Barroso and Galan 2006), and insights gained from the concept have also been increasingly used in the international business domain to explain the sources of competitive advantage for multinational corpora-tions (Peng 2001).
When framing the offshoring phenomenon through the rBV lens, doh (2005, 700) argues that “offshoring, both as internal process and business strategy, could be an outcome of success-ful management or resources, and may itself represent a direct application of firm-level capabilities as envisioned by the rBV.” However, scholars using rBV to explain offshoring processes unanimously agree that, within the realm of rBV, the more tra-ditional concepts (Barney 1991) appear to have less power when it comes to understanding how offshoring can be used to achieve competitive advantage today. This is due, first of all, to the over-all static nature of the original rBV theoretical framework, which pays scant attention to the mechanisms used to turn resources
business process offshoring: a literature review [ 141 ]
into competitive advantage, especially in dynamic markets (Eisen-hardt and Martin 2000) where offshoring is having the biggest impact. Second, the offshoring scheme is often cited as one of the main causes of the commoditization of a number of white-collar productive functions that can now be more easily imitable and accessible by competitors on a global scale (doh 2005; levy 2005), and thus goes against the traditional rBV prescription to invest and focus on resources that are rare and inimitable. Third, because rBV explains very little about how to acquire and manage resources shared with other partners, it becomes difficult to apply to the offshore outsourcing and alliance alternatives. In response to such concerns, scholars have integrated the rBV perspective with other theoretical frameworks in order to provide more com-pelling models that better explain current offshoring practices. For instance, doh (2005) argues that we should consider the dy-namic capabilities view of competitive strategy (Teece et al. 1997) to fully understand how companies acquire and synthesize knowl-edge resources in rapidly changing offshore environments. Mehta et al. (2006), li et al. (2008) and Kedia and lahiri (2007) invoke a relational view (dyer and Singh 1998) to explain how firms create value in their offshore ventures through different forms of partnerships. In their argument, those “relational rents” that are created “when partners share, combine, or invest their assets, knowledge, or capabilities, or employ effective governance to lower their transaction costs or improve synergies” (Mehta et al. 2006, 327), are critical for the success in later evolved stages of the offshore partnerships.
International business (IB) theories obviously represent prop-er frameworks for contextualizing offshoring. In fact, the articles reviewed exhibit a number of contributions that use IB concepts to frame the current offshoring wave. In particular, doh (2005) reviews a variety of established IB theories and discusses the main implications of introducing offshoring practices. Most relevantly, doh points to the need to reassess some of the applications of the olI theory and the stages model of internationalization. re-garding the first paradigm, we can say that the emergence of the knowledge-based economy, the progress achieved by information technologies, and the subsequent spread of offshoring practices
[ 142 ] offshoring in the global economy
have been responsible for the changing character and bounda-ries of the advantages specific to ownership (doh 2005; dunning 2000). Since the 1960s three main kinds of firm- or ownership- specific competitive advantages have been identified: those rela-tive to the control and exploitation of monopoly power (Hymer 1976; Porter 1980); those relative to the possession of a set of valu-able, scarce, idiosyncratic and inimitable resources (Barney 1991); and those relative to a manager’s skills to identify, evaluate, and exploit resources and capabilities on a global scale (Prahalad and doz 1987; Bartlett and Ghoshal 1989). The recent emergence of a knowledge-based economy, where wealth-creating activities have become much more knowledge intensive than before (Santos, doz and Williamson 2004), has altered the relative significance of these three kinds of firm-specific advantages in favor of the third one. Whereas 20 years ago the competitive advantage of firms was predominantly based on their capacity to internally produce and organize proprietary assets and purposefully match them to lo-cal market needs, in the past few years “the emphasis is more on their capabilities to access and organize knowledge intensive as-sets from throughout the world, and to integrate these not only with their existing competitive advantages, but with those of other firms engaging in complementary value added activities” (dun-ning 2000, 169).
as for the challenges to the stages model of internationaliza-tion, we can argue that the current process of internationaliza-tion in conjunction with the offshoring of knowledge-intensive work presents important differences with the Uppsala stage model of internationalization (Johanson and Vahlne 1977), an established framework that has dominated the IB field in the last decades. rooted in uncertainty reduction and experiential learn-ing, the Uppsala stage model hypothesizes that firms incremen-tally increase their commitment to their foreign operations. This staged process interests a company’s value chain and its partial relocation to foreign countries (from export to sales offices to production facilities to full value-chain subsidiaries), its mode of operations (from arm’s length transactions through partner-ships with locals to wholly-owned operations), and its geographi-cal distribution (from more familiar to less familiar countries)
business process offshoring: a literature review [ 143 ]
(Westney and Zaheer 2001). recent research (doh 2005; dos-sani and Kenney 2006, 2007; lewin and Peeters 2006a) on this matter shows that companies offshoring innovation work today are redistributing their value activities worldwide in a way that is radically different from the relocation of international activities that characterized previous waves of internationalization. Small-er entrepreneurial firms are entering into accelerated processes of internationalization in which they rapidly relocate their core knowledge-activities to offshore locations where those activities can be best performed.
other IB studies also focus on the liabilities of foreignness —defined as the social, political and economic costs of doing busi-ness in a foreign country (Zaheer 1995)—and investigate how they affect choosing a location for offshore activities. Education and cultural distance emerge as important factors in determining the offshore location (Bunyaratavej et al. 2005; Kedia and lahiri 2007). other works concentrate on the driving factors that lie behind the decision of firms to pursue offshoring ventures. The results show that the vast majority of companies relocate activities in order to increase efficiency and save on labor costs (lewin and Peeters 2006a; Marin 2006; Nachum and Zaheer 2005).
out of the 38 articles surveyed, we found two studies that use institutional theory to analyze how the regulative, normative and cognitive institutions of home and host countries influence offshoring patterns, while two other research studies draw from the organization behavior literature to better understand group level dynamics and the organization of geographically distributed teams. as for the use of institutional theory to frame offshoring processes, its main implications are the following. offshoring firms tend to prefer for their investments countries with similar institutional structures and regimes to the home country. In West-ern countries, messy political schemes and widespread concern related to offshoring have produced pressures against it. In devel-oping regions, on the other hand, isomorphic pressures from cli-ent firms and professional organizations have brought important institutional changes that are contributing to an increase in off-shoring investments in such countries (Bunyaratavej et al. 2005; Kshetri 2007).
[ 144 ] offshoring in the global economy
as for the organizational behavior literature, two research studies investigate an important implication of the offshoring phenomenon: the exponential growth in multinational firms of geographically distributed teams. as a consequence of the rapid globalization of activities, multinational firms are now increasingly managed by multicultural teams whose members are geographical-ly scattered and face highly heterogeneous cultural environments. The increasing standardization of technical knowledge and the predominance of the English language in a number of technical fields have played important roles in facilitating efficient inter-actions among individuals with different cultural backgrounds in remote locations. Many industries are now seeing a prevalence of teams that span multiple geographic and cultural boundaries. as a result, multinational multicultural distributed teams have become an integral part of numerous organizations and scholars have begun studying their peculiarities (Connaughton and Shuf-fler 2007; Hinds and Bailey 2003).
Finally, a number of reviewed articles belong to the informa-tion systems and operations management literature. as for the first type of literature of reference, most of the studies concen-trate on the american IT industry and consider India to be a preferred location for outsourced activities. dossani and Kenney (2003) provide an interesting overview of the offshoring indus-try structure in India and formulate a list of internal factors that should be considered before offshoring an activity, in addition to environmental considerations. Henley (2006) analyzes the origins and development of the Indian software and IT-enabled servic-es sector, highlighting the political and socio-economic context that has favored its growth, such as the heavy investment in sci-entific and engineering manpower development. Pfannenstein and Tsai (2004) take a deeper look at the american IT industry and review the main benefits, costs and risks involved in offshore outsourcing. More operational in nature are the two other contri-butions to the information systems literature. Gupta and Mukher-ji (2007) develop an analytical model for achieving a strategic advantage from offshoring that results in an integrated 24-hour knowledge factory. Balakrishnan et al. (2008) use a mathematical model to determine how incomplete information, task assignment
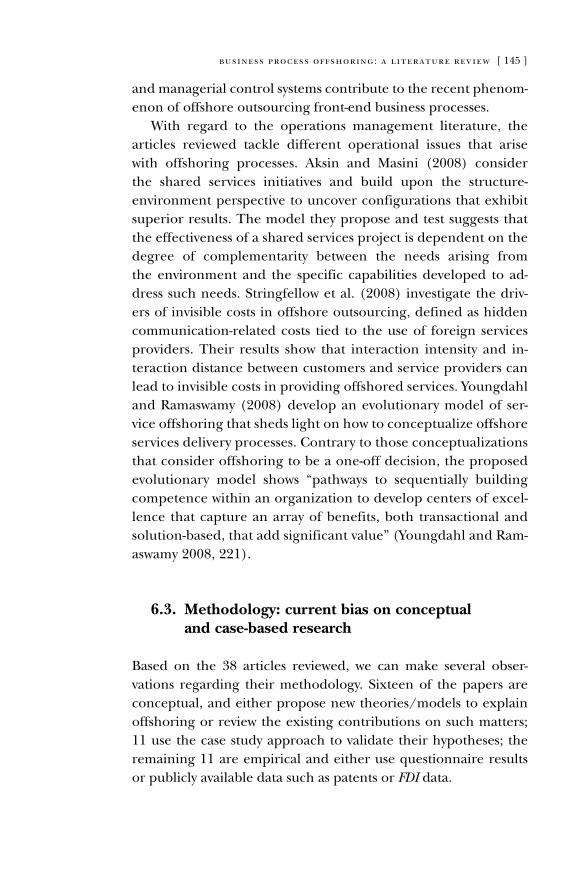
business process offshoring: a literature review [ 145 ]
and managerial control systems contribute to the recent phenom-enon of offshore outsourcing front-end business processes.
With regard to the operations management literature, the articles reviewed tackle different operational issues that arise with offshoring processes. aksin and Masini (2008) consider the shared services initiatives and build upon the structure- environment perspective to uncover configurations that exhibit superior results. The model they propose and test suggests that the effectiveness of a shared services project is dependent on the degree of complementarity between the needs arising from the environment and the specific capabilities developed to ad-dress such needs. Stringfellow et al. (2008) investigate the driv-ers of invisible costs in offshore outsourcing, defined as hidden communication-related costs tied to the use of foreign services providers. Their results show that interaction intensity and in-teraction distance between customers and service providers can lead to invisible costs in providing offshored services. youngdahl and ramaswamy (2008) develop an evolutionary model of ser- vice offshoring that sheds light on how to conceptualize offshore services delivery processes. Contrary to those conceptualizations that consider offshoring to be a one-off decision, the proposed evolutionary model shows “pathways to sequentially building competence within an organization to develop centers of excel-lence that capture an array of benefits, both transactional and solution-based, that add significant value” (youngdahl and ram-aswamy 2008, 221).
6.3. Methodology: current bias on conceptual and case-based research
Based on the 38 articles reviewed, we can make several obser-vations regarding their methodology. Sixteen of the papers are conceptual, and either propose new theories/models to explain offshoring or review the existing contributions on such matters; 11 use the case study approach to validate their hypotheses; the remaining 11 are empirical and either use questionnaire results or publicly available data such as patents or FDI data.
[ 146 ] offshoring in the global economy
The distribution of articles analyzed in this literature review confirms offshoring literature is in its early stages. It appears that the majority of scholars studying offshoring are still trying to make sense of the phenomenon using traditional theoretical frameworks and developing useful models to help conceptualize offshoring processes. That there are many review articles can also suggest an attempt to introduce offshoring as a legitimate topic in established literature.
almost one third of the articles rely on case studies. only one article makes an explicit link to grounded-theory building ap-proach (Vivek et al. 2008), while most of the other articles do not seem to be as rigorous in their case selection. Interviews with senior executives provide information that reinforce arguments, or simply offer examples on particular offshoring issues. Since off-shoring is still a nascent phenomenon—still unfamiliar or only partially implemented by companies—scholars are making an invaluable contribution to understanding this new wave of inter-nationalization simply by offering real examples and testimonies from an industry level.
Finally, only 11 articles are empirical studies of the offshoring phenomenon. a few (five) of them use firm-level questionnaire results, while the other six utilize publicly available country- or industry-level data such as patents or FDI databases. These results confirm the current lack of research using fine-grained informa-tion to study the offshoring phenomenon. Country- and industry-level data are certainly useful in providing macro trends and in picturing the overall offshoring situation; however, they cannot be used to offer detailed analysis of the firm-level processes that take place when companies initiate and pursue offshoring ventures. This bias is most likely due to the early stage of the phenomenon and the resulting difficulty for scholars to collect accurate and extensive data.
on a final note, we should highlight that only two studies (ak-sin and Masini 2008; Marin 2006) are fully based on European data. despite the fact that European firms represent important and active players in the current offshoring wave, as of today we must acknowledge that the phenomenon seems understudied in Europe.
business process offshoring: a literature review [ 147 ]
6.4. Offshoring and labor markets: the emerging global sourcing of talent
In a press conference for the 2004 Economic Report of the President, Harvard Professor Gregory Mankiw pointed out that U.S. off- shoring is good for the U.S. economy, as the increased hiring in the overseas affiliates of U.S. multinationals is associated with more employment in the U.S.-based parent companies. Not only that, he argued, but the recent offshoring phenomenon is nothing more than the latest manifestation of trade gains that have been studied by economists since the time of adam Smith. although “economists lined up to support his claim that offshoring is simply international business as usual” (Blinder 2006, 116), a number of scholars have discarded this analysis as a misleading oversimplifi-cation of reality (Blinder 2006). as for media coverage of the off- shoring phenomenon, alarming perceptions of the offshoring trend have vastly dominated the public arena. Media coverage such as the article “Is your Job Next?” by Engardio et al. (2003), which appeared on the cover of Business Week, have contributed to reinforcing the generalized fear of job loss in Western countries.
It is quite clear that offshoring has attracted considerable me-dia attention not so much for its current dimension, since the practice is still relatively new and not widely used, but for its fore-casted future impact on the global realignment of jobs (Blinder 2006; doh 2005; Harrison and McMillan 2006; Karmarkar 2004). In the past few years, scholars have tried to estimate the nature of this impact, with different positions emerging. Farrell et al. (2006) concluded that offshoring will continue to create a relatively small global labor market, as only 11 percent of service jobs around the world can be carried out remotely. They also highlighted a po-tential mismatch between supply and demand for offshore tal-ent, with demand outstripping supply only in a few developing regions where a significant rise in wages will occur. Their study also showed that, despite the fact that only about 10 percent of today’s university graduates in low-wage nations are suitable for jobs in Western multinationals, supply in low-cost countries will continue to exceed demand in future years. dossani and Kenney (2006) argued instead that a much more profound transformation
[ 148 ] offshoring in the global economy
of the employment and wage structure in the U.S. labor market will follow the diffusion of offshoring practices. according to the authors, U.S.-based college-educated engineers and accountants, among others, will have to compete with similarly trained gradu-ates in low-wage economies, which will likely bring a remarkable turn of events in upcoming years.
lewin and Peeters (2006a) also share a line of thought. They document how U.S. companies are increasingly relocating not only lower-skilled commoditized service functions to offshore lo-cations, but also knowledge-intensive activities that require tech-nical talent to be performed such as r&d and product design. The authors also showed that the current shortage of technical talent in the United States due to a 2003 cutback in H1B visas is one of the driving forces behind this emerging global race for tal-ent. Such a rise in global sourcing of human capital is therefore considered to be the implication of offshoring that will have the most disruptive consequence on Western labor markets (dossani and Kenney 2007).
In sum, it is difficult to accurately predict the future impact of offshoring, although it is clear there will be a significant redis-tribution of labor on a global scale. Using Blinder’s (2006, 120) words:
We are now in the early stages of a third Industrial revo-
lution, the information age. The cheap and easy flow of in-
formation around the globe has vastly expanded the scope of
tradable services, and there is much more to come. Industrial
revolutions are big deals. and just like the previous two, the
third Industrial revolution will require vast and unsettling ad-
justments in the way americans and residents of other devel-
oped countries work, live, and educate their children.
The kinds of jobs that can be moved offshore will not disap-
pear entirely in high-cost developed countries, but their shares
of the work force will substantially diminish. offshoring will
certainly not lead to massive unemployment, as it did not hap-
pen for agricultural and manufacturing works in the two previ-
ous industrial revolutions, however massive transitions across
sectors in Western labor markets will likely occur.
business process offshoring: a literature review [ 149 ]
6.5. Conclusion
The objective of this review was to organize the academic contribu-tions that have been published to date in relation to the emerging phenomenon of BPo. as the total number of articles confirms, offshoring represents today an emerging international topic that is attracting increasing interest in the management scholar com-munity. Thus, one of our main conclusions from the review is that the diversity of studies encountered in the literature demonstrates the complexity of the phenomenon.
researchers have used different approaches and methodolo-gies to try to make sense of a phenomenon whose peculiarities are still not fully understood. In fact, the prevalence of theoreti-cal/conceptual articles supports the perception that management scholars are still working on a theoretical contextualization of this phenomenon, which in many ways challenges established para-digms. In addition, bias towards the case study approach and the resulting lack of valid empirical databases, especially for the Eu-ropean context, further places difficulty on researchers to collect sound and accurate information.
as previously discussed, the hope is to move towards a homoge-nized terminology. This would aid the creation of a sound theoreti-cal framework that integrates the different contributions through-out the literature. Several aspects of the offshoring phenomenon have still not received proper attention in the literature. BPo to-day is the means by which companies are reorganizing their value activities on a global scale. The 38 articles identified in this review represent the first contributions in a stream of literature that is expected to grow exponentially in the coming years.
The next chapter discusses a comprehensive study developed by a consortium of universities and offshoring practitioners known as the offshoring research Network (orN). This study was car-ried out to serve as an overview of the subject from a managerial perspective.

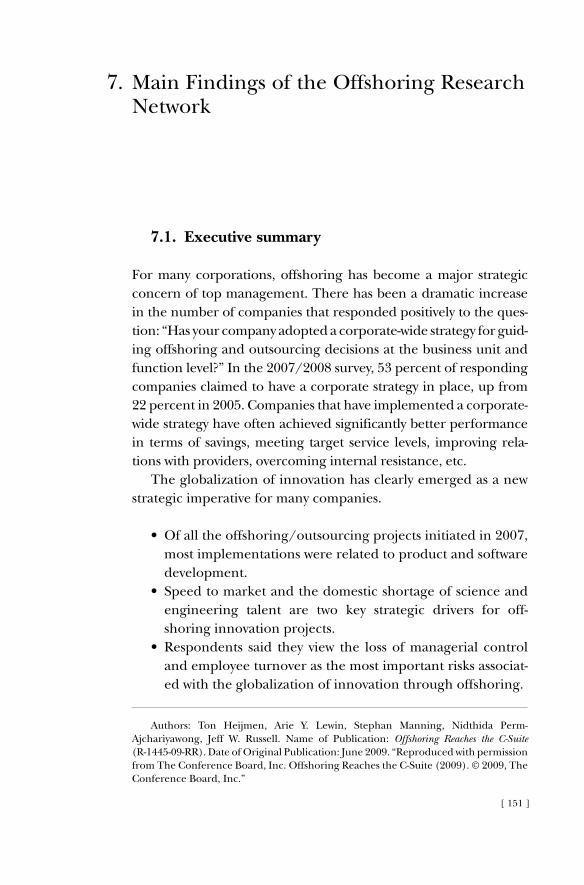
[ 151 ]
Main Findings of the offshoring research Network38
7.1. Executive summary
For many corporations, offshoring has become a major strategic concern of top management. There has been a dramatic increase in the number of companies that responded positively to the ques-tion: “Has your company adopted a corporate-wide strategy for guid-ing offshoring and outsourcing decisions at the business unit and function level?” In the 2007/2008 survey, 53 percent of responding companies claimed to have a corporate strategy in place, up from 22 percent in 2005. Companies that have implemented a corporate-wide strategy have often achieved significantly better performance in terms of savings, meeting target service levels, improving rela-tions with providers, overcoming internal resistance, etc.
The globalization of innovation has clearly emerged as a new strategic imperative for many companies.
• Of all the offshoring/outsourcing projects initiated in 2007, most implementations were related to product and software development.
• Speed to market and the domestic shortage of science and engineering talent are two key strategic drivers for off- shoring innovation projects.
• Respondents said they view the loss of managerial control and employee turnover as the most important risks associat-ed with the globalization of innovation through offshoring.
authors: Ton Heijmen, arie y. lewin, Stephan Manning, Nidthida Perm-ajchariyawong, Jeff W. russell. Name of Publication: Offshoring Reaches the C-Suite (r-1445-09-rr). date of original Publication: June 2009. “reproduced with permission from The Conference Board, Inc. offshoring reaches the C-Suite (2009). © 2009, The Conference Board, Inc.”
7.
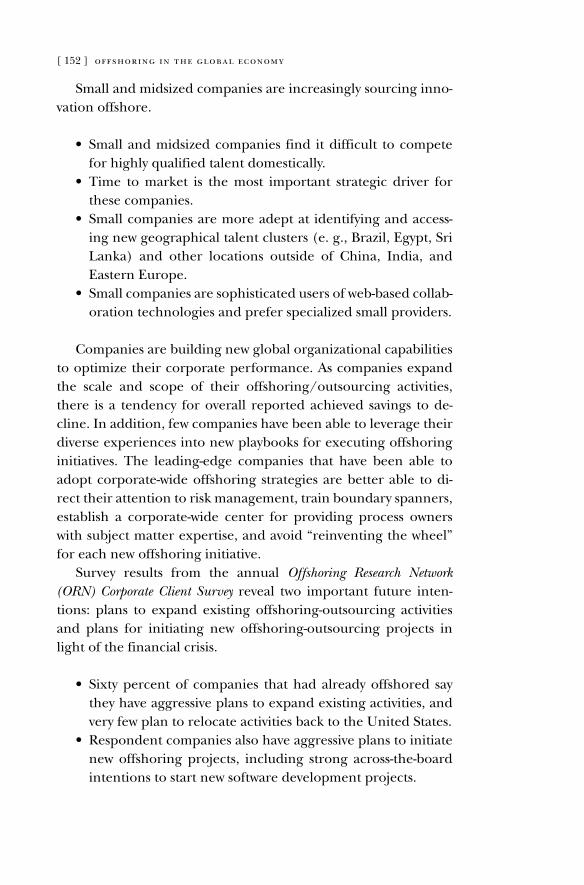
[ 152 ] offshoring in the global economy
Small and midsized companies are increasingly sourcing inno-vation offshore.
• Small and midsized companies find it difficult to compete for highly qualified talent domestically.
• Time to market is the most important strategic driver for these companies.
• Small companies are more adept at identifying and access-ing new geographical talent clusters (e. g., Brazil, Egypt, Sri lanka) and other locations outside of China, India, and Eastern Europe.
• Small companies are sophisticated users of web-based collab-oration technologies and prefer specialized small providers.
Companies are building new global organizational capabilities to optimize their corporate performance. as companies expand the scale and scope of their offshoring/outsourcing activities, there is a tendency for overall reported achieved savings to de-cline. In addition, few companies have been able to leverage their diverse experiences into new playbooks for executing offshoring initiatives. The leading-edge companies that have been able to adopt corporate-wide offshoring strategies are better able to di-rect their attention to risk management, train boundary spanners, establish a corporate-wide center for providing process owners with subject matter expertise, and avoid “reinventing the wheel” for each new offshoring initiative.
Survey results from the annual Offshoring Research Network (ORN) Corporate Client Survey reveal two important future inten-tions: plans to expand existing offshoring-outsourcing activities and plans for initiating new offshoring-outsourcing projects in light of the financial crisis.
• Sixty percent of companies that had already offshored say they have aggressive plans to expand existing activities, and very few plan to relocate activities back to the United States.
• Respondent companies also have aggressive plans to initiate new offshoring projects, including strong across-the-board intentions to start new software development projects.
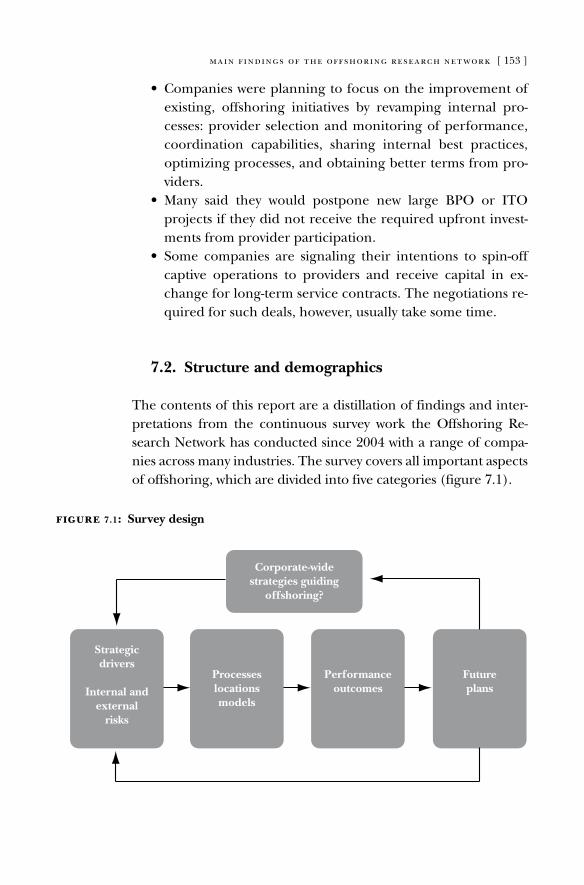
main findings of the offshoring research network [ 153 ]
• Companies were planning to focus on the improvement of existing, offshoring initiatives by revamping internal pro- cesses: provider selection and monitoring of performance, coordination capabilities, sharing internal best practices, optimizing processes, and obtaining better terms from pro- viders.
• Many said they would postpone new large BPO or ITO projects if they did not receive the required upfront invest-ments from provider participation.
• Some companies are signaling their intentions to spin-off captive operations to providers and receive capital in ex-change for long-term service contracts. The negotiations re-quired for such deals, however, usually take some time.
7.2. Structure and demographics
The contents of this report are a distillation of findings and inter-pretations from the continuous survey work the offshoring re-search Network has conducted since 2004 with a range of compa-nies across many industries. The survey covers all important aspects of offshoring, which are divided into five categories (figure 7.1).
figure 7.1: Survey design
Strategicdrivers
Internal andexternal
risks
Processeslocationsmodels
Performanceoutcomes
Futureplans
Corporate-widestrategies guiding
offshoring?
[ 154 ] offshoring in the global economy
1. Drivers. Examples of strategic drivers include cost consider- ations (labor arbitrage as well as other costs), competitive position relative to other companies, and acquisition of a new skill or capability.
2. Risks. These include risks both internally (insufficient re-sources, inability to execute the offshoring plan, and lack of buy-in) and externally (the suitability of an offshoring service provider, the socioeconomic and political conditions of the target country, deteriorating labor force conditions, and weak intellectual property protection regimes).
3. Location and Delivery Model. In addition to inquiring about countries and regions, the survey asks respondents to describe and define their current service delivery arrangement—captive, third party, hybrid, etc. For example: Is the hybrid delivery model a joint venture? If the company chose a third-party service provider, what kind of provider is it? International or local? Is it a specialist in the company’s business process domain?
4. Performance Outcomes. This section requests information about a variety of outcomes including the level of cost re-ductions the organizations expected, the savings they cap-tured, and if they achieved the target levels they set.
5. Future Plans. respondents are asked about their organiza-tions’ future plans for expanding existing offshoring ap-plications as well as their plans for initiating entirely new offshoring projects. The responses to the questions in this section have proven very valuable in projecting new off- shoring developments. For example, the duke team was able to anticipate in the 2006 report the rapid acceleration of offshoring innovation work and the emerging global competition for science and engineering talent.
Survey profileUnlike other offshoring studies, the orN project tracks off-
shoring strategies and location and delivery model choices by size of company. The survey also includes responses from companies that are already offshoring, those that are just considering the practice, and those that have decided not to offshore (graph 7.1).
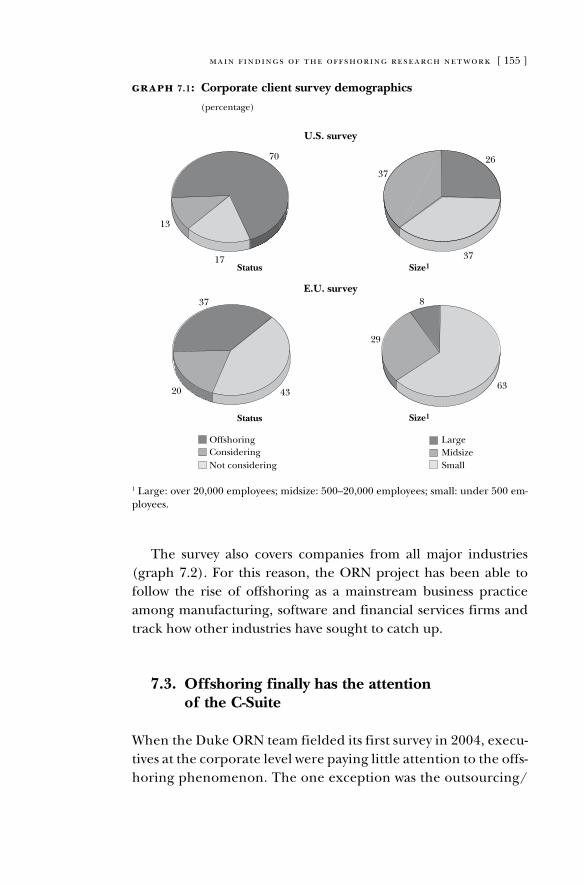
main findings of the offshoring research network [ 155 ]
1 large: over 20,000 employees; midsize: 500–20,000 employees; small: under 500 em-ployees.
graph 7.1: Corporate client survey demographics
(percentage)
70
17
13
37
37
26
Status
U.S. survey
E.U. survey
Size1
37
20 43
Status
63
8
29
Size1
OffshoringConsideringNot considering
LargeMidsizeSmall
The survey also covers companies from all major industries (graph 7.2). For this reason, the orN project has been able to follow the rise of offshoring as a mainstream business practice among manufacturing, software and financial services firms and track how other industries have sought to catch up.
7.3. Offshoring finally has the attention of the C-Suite
When the duke orN team fielded its first survey in 2004, execu-tives at the corporate level were paying little attention to the offs- horing phenomenon. The one exception was the outsourcing/
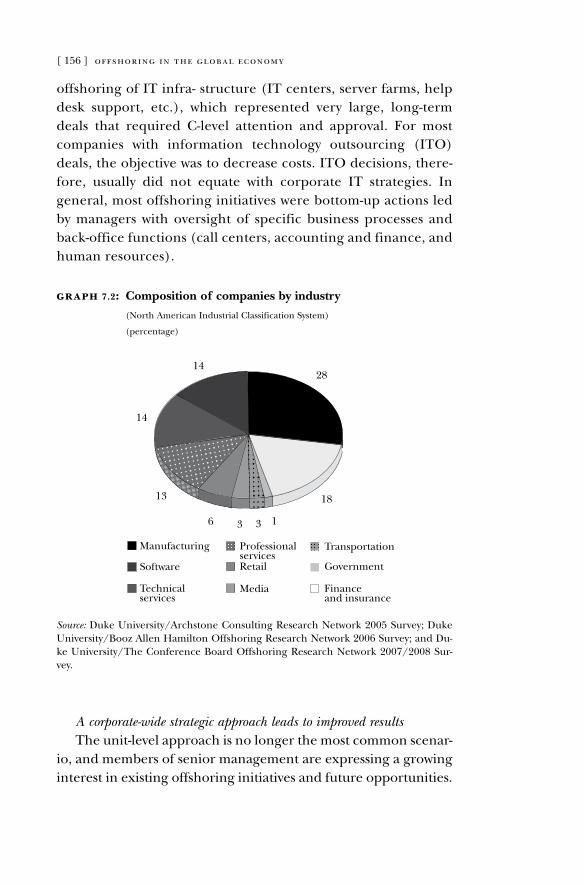
[ 156 ] offshoring in the global economy
offshoring of IT infra- structure (IT centers, server farms, help desk support, etc.), which represented very large, long-term deals that required C-level attention and approval. For most companies with information technology outsourcing (ITo) deals, the objective was to decrease costs. ITo decisions, there-fore, usually did not equate with corporate IT strategies. In general, most offshoring initiatives were bottom-up actions led by managers with oversight of specific business processes and back-office functions (call centers, accounting and finance, and human resources).
Source: duke University/archstone Consulting research Network 2005 Survey; duke University/Booz allen Hamilton offshoring research Network 2006 Survey; and du- ke University/The Conference Board offshoring research Network 2007/2008 Sur-vey.
graph 7.2: Composition of companies by industry
(North american Industrial Classification System)
(percentage)
1428
18
3 136
13
14
Government
Finance and insurance
TransportationManufacturing
Software
Technicalservices
Retail
Media
Professionalservices
A corporate-wide strategic approach leads to improved resultsThe unit-level approach is no longer the most common scenar-
io, and members of senior management are expressing a growing interest in existing offshoring initiatives and future opportunities.
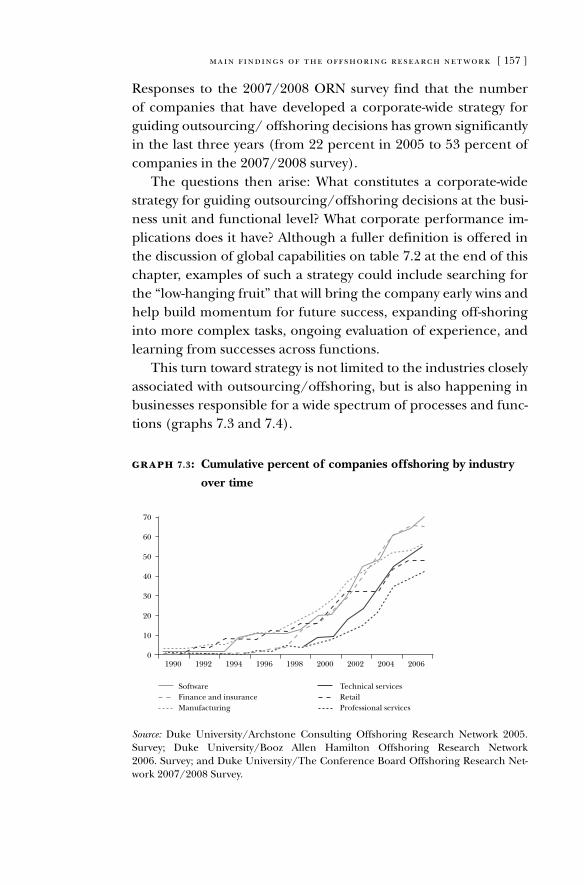
main findings of the offshoring research network [ 157 ]
responses to the 2007/2008 orN survey find that the number of companies that have developed a corporate-wide strategy for guiding outsourcing/ offshoring decisions has grown significantly in the last three years (from 22 percent in 2005 to 53 percent of companies in the 2007/2008 survey).
The questions then arise: What constitutes a corporate-wide strategy for guiding outsourcing/offshoring decisions at the busi-ness unit and functional level? What corporate performance im-plications does it have? although a fuller definition is offered in the discussion of global capabilities on table 7.2 at the end of this chapter, examples of such a strategy could include searching for the “low-hanging fruit” that will bring the company early wins and help build momentum for future success, expanding off-shoring into more complex tasks, ongoing evaluation of experience, and learning from successes across functions.
This turn toward strategy is not limited to the industries closely associated with outsourcing/offshoring, but is also happening in businesses responsible for a wide spectrum of processes and func-tions (graphs 7.3 and 7.4).
Source: duke University/archstone Consulting offshoring research Network 2005. Survey; duke University/Booz allen Hamilton offshoring research Network 2006. Survey; and duke University/The Conference Board offshoring research Net-work 2007/2008 Survey.
graph 7.3: Cumulative percent of companies offshoring by industry
over time
0
70
60
50
40
30
20
10
1990 1992 1994 1996 1998 2000 2002 2004 2006
SoftwareFinance and insuranceManufacturing
Technical servicesRetailProfessional services
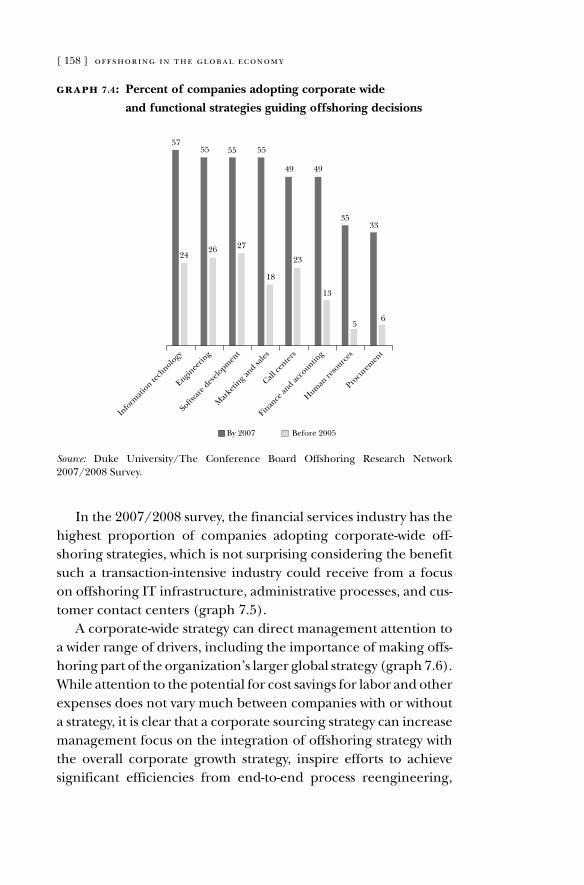
[ 158 ] offshoring in the global economy
Source: duke University/The Conference Board offshoring research Network 2007/2008 Survey.
graph 7.4: Percent of companies adopting corporate wide
and functional strategies guiding offshoring decisions
Info
rmati
on tech
nology
By 2007 Before 2005
57
24
55
26 27
55 55
18
49
23
49
13
35
5
33
6
Enginee
ring
Softw
are d
evelo
pmen
t
Mar
ketin
g and sa
les
Call ce
nters
Finan
ce an
d acco
unting
Human
reso
urces
Procu
rem
ent
In the 2007/2008 survey, the financial services industry has the highest proportion of companies adopting corporate-wide off-shoring strategies, which is not surprising considering the benefit such a transaction-intensive industry could receive from a focus on offshoring IT infrastructure, administrative processes, and cus-tomer contact centers (graph 7.5).
a corporate-wide strategy can direct management attention to a wider range of drivers, including the importance of making offs- horing part of the organization’s larger global strategy (graph 7.6). While attention to the potential for cost savings for labor and other expenses does not vary much between companies with or without a strategy, it is clear that a corporate sourcing strategy can increase management focus on the integration of offshoring strategy with the overall corporate growth strategy, inspire efforts to achieve significant efficiencies from end-to-end process reengineering,
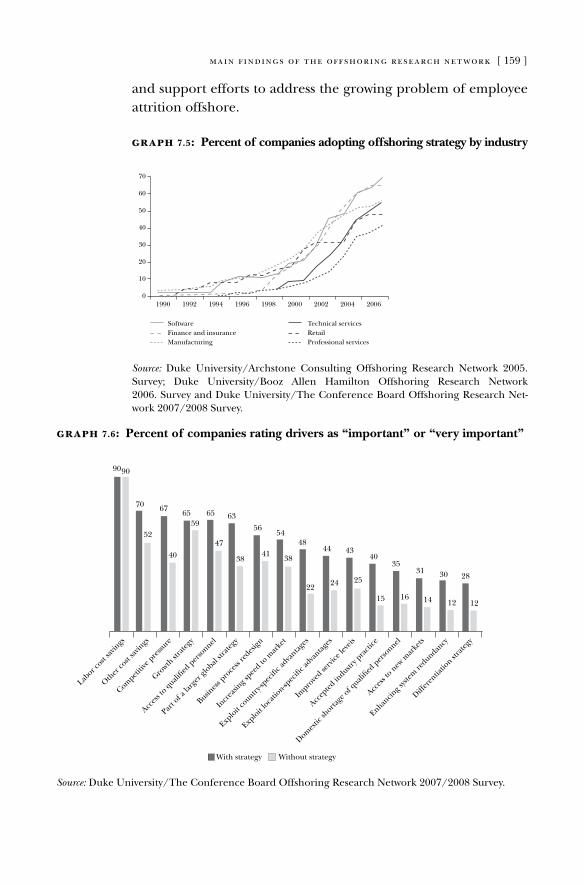
main findings of the offshoring research network [ 159 ]
and support efforts to address the growing problem of employee attrition offshore.
Source: duke University/archstone Consulting offshoring research Network 2005. Survey; duke University/Booz allen Hamilton offshoring research Network 2006. Survey and duke University/The Conference Board offshoring research Net-work 2007/2008 Survey.
graph 7.5: Percent of companies adopting offshoring strategy by industry
0
70
60
50
40
30
20
10
1990 1992 1994 1996 1998 2000 2002 2004 2006
SoftwareFinance and insuranceManufacturing
Technical servicesRetailProfessional services
Source: duke University/The Conference Board offshoring research Network 2007/2008 Survey.
graph 7.6: Percent of companies rating drivers as “important” or “very important”
Labor c
ost sa
vings
With strategy Without strategy
Other
cost
savin
gs
Competi
tive p
ressu
re
Growth
stra
tegy
Acces
s to quali
fied p
erso
nnel
Part o
f a la
rger
global
strate
gy
Busines
s pro
cess
redes
ign
Incr
easin
g spee
d to m
arke
t
Explo
it co
untry-sp
ecifi
c adva
ntages
Explo
it lo
catio
n-spec
ific a
dvantag
es
Impro
ved se
rvice
leve
is
Accep
ted in
dustry p
racti
ce
Domes
tic sh
ortage
of quali
fied p
erso
nnel
Acces
s to n
ew m
arke
ts
Enhancin
g syst
em re
dundancy
Differ
entia
tion st
rateg
y
9090
70
52
40
67 6559
65
47
63
38
56
41
54
38
48
22
44
24
43
25
40
15
35
16
31
14
30
12
28
12
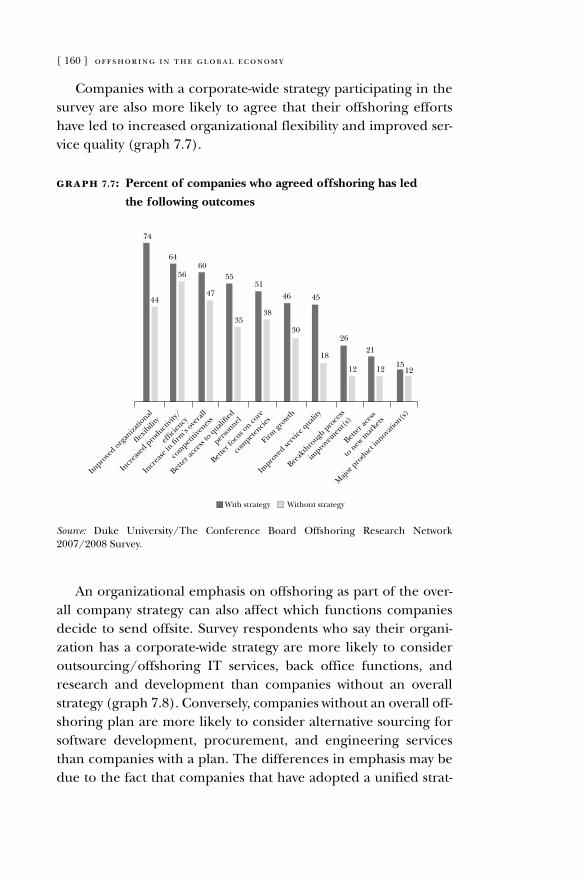
[ 160 ] offshoring in the global economy
Companies with a corporate-wide strategy participating in the survey are also more likely to agree that their offshoring efforts have led to increased organizational flexibility and improved ser- vice quality (graph 7.7).
Source: duke University/The Conference Board offshoring research Network 2007/2008 Survey.
graph 7.7: Percent of companies who agreed offshoring has led
the following outcomes
Impro
ved org
aniza
tional
flexib
ility
Incr
ease
d pro
ductivit
y/
efficie
ncy
Incr
ease
in fi
rm's
overa
ll
com
petitiv
enes
s
Better
acce
ss to
qualified
perso
nnel
Better
focu
s on co
re
com
petencie
s
Firm
growth
Impro
ved se
rvice
quality
Break
thro
ugh p
roce
ss
impro
vem
ent(s
)
Better
aces
s
to n
ew m
arke
ts
Majo
r pro
duct in
novatio
n(s)
74
64
5660
47
55
35
51
38
46
30
45
18
26
12
21
1215
12
44
With strategy Without strategy
an organizational emphasis on offshoring as part of the over-all company strategy can also affect which functions companies decide to send offsite. Survey respondents who say their organi-zation has a corporate-wide strategy are more likely to consider outsourcing/offshoring IT services, back office functions, and research and development than companies without an overall strategy (graph 7.8). Conversely, companies without an overall off-shoring plan are more likely to consider alternative sourcing for software development, procurement, and engineering services than companies with a plan. The differences in emphasis may be due to the fact that companies that have adopted a unified strat-
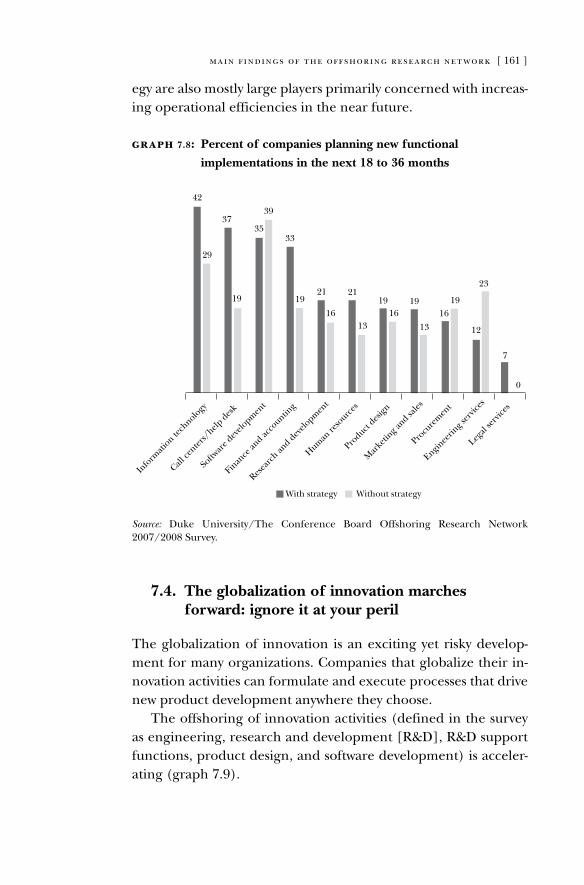
main findings of the offshoring research network [ 161 ]
egy are also mostly large players primarily concerned with increas-ing operational efficiencies in the near future.
Source: duke University/The Conference Board offshoring research Network 2007/2008 Survey.
graph 7.8: Percent of companies planning new functional
implementations in the next 18 to 36 months
Info
rmati
on tech
nology
With strategy Without strategy
42
29
37
19
35
39
33
1921
16
21
13
1916
19
13
1619
12
23
7
0
Call ce
nters/
help d
esk
Softw
are d
evelo
pmen
t
Finan
ce an
d acco
unting
Resea
rch an
d dev
elopm
ent
Human
reso
urces
Product
design
Mar
ketin
g and sa
les
Procu
rem
ent
Enginee
ring s
ervic
es
Legal
serv
ices
7.4. The globalization of innovation marches forward: ignore it at your peril
The globalization of innovation is an exciting yet risky develop-ment for many organizations. Companies that globalize their in-novation activities can formulate and execute processes that drive new product development anywhere they choose.
The offshoring of innovation activities (defined in the survey as engineering, research and development [r&d], r&d support functions, product design, and software development) is acceler-ating (graph 7.9).
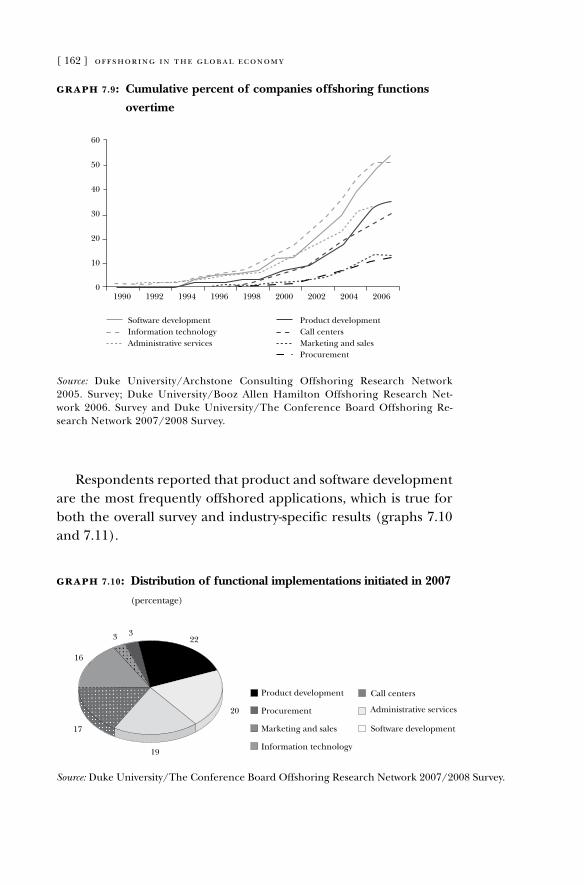
[ 162 ] offshoring in the global economy
Source: duke University/archstone Consulting offshoring research Network 2005. Survey; duke University/Booz allen Hamilton offshoring research Net-work 2006. Survey and duke University/The Conference Board offshoring re-search Network 2007/2008 Survey.
graph 7.9: Cumulative percent of companies offshoring functions
overtime
0
60
50
40
30
20
10
1990 1992 1994 1996 1998 2000 2002 2004 2006
Software developmentInformation technologyAdministrative services
Product developmentCall centersMarketing and salesProcurement
respondents reported that product and software development are the most frequently offshored applications, which is true for both the overall survey and industry-specific results (graphs 7.10 and 7.11).
Source: duke University/The Conference Board offshoring research Network 2007/2008 Survey.
graph 7.10: Distribution of functional implementations initiated in 2007
(percentage)
3 322
20
19
17
16
Software development
Administrative servicesProcurement
Marketing and sales
Information technology
Call centersProduct development
3 322
20
19
17
16
Software development
Administrative servicesProcurement
Marketing and sales
Information technology
Call centersProduct development
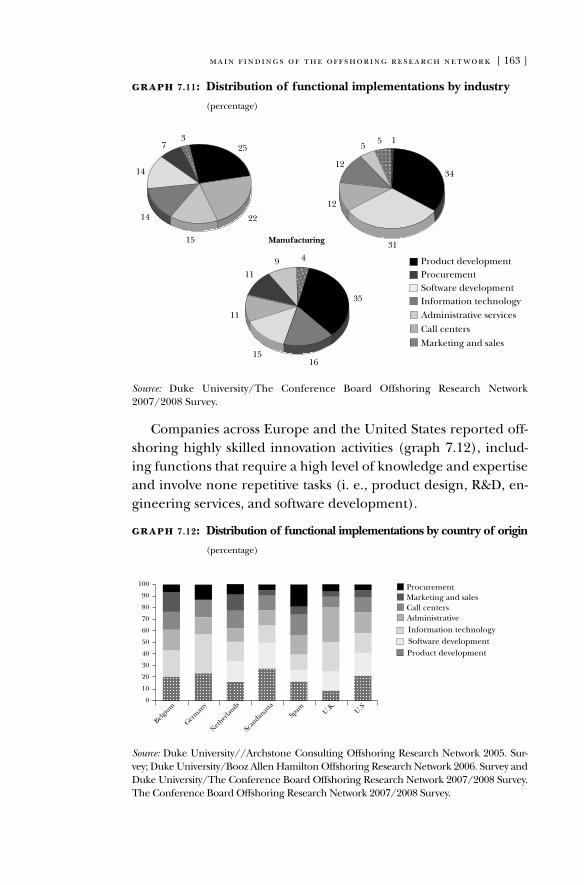
main findings of the offshoring research network [ 163 ]
Source: duke University/The Conference Board offshoring research Network 2007/2008 Survey.
graph 7.11: Distribution of functional implementations by industry
(percentage)
34
31
12
12
5 5 125
22
15
14
14
73
Administrative servicesCall centersMarketing and sales
Technical services Software
ProcurementSoftware developmentInformation technology
Product development
49
11
11
1516
35
Manufacturing
34
31
12
12
5 5 125
22
15
14
14
73
Administrative servicesCall centersMarketing and sales
Technical services Software
ProcurementSoftware developmentInformation technology
Product development
49
11
11
1516
35
Manufacturing
34
31
12
12
5 5 125
22
15
14
14
73
Administrative servicesCall centersMarketing and sales
Technical services Software
ProcurementSoftware developmentInformation technology
Product development
49
11
11
1516
35
Manufacturing
Companies across Europe and the United States reported off-shoring highly skilled innovation activities (graph 7.12), includ-ing functions that require a high level of knowledge and expertise and involve none repetitive tasks (i. e., product design, r&d, en-gineering services, and software development).
Source: duke University//archstone Consulting offshoring research Network 2005. Sur-vey; duke University/Booz allen Hamilton offshoring research Network 2006. Survey and duke University/The Conference Board offshoring research Network 2007/2008 Survey.The Conference Board offshoring research Network 2007/2008 Survey.
graph 7.12: Distribution of functional implementations by country of origin
(percentage)
80
90
100
60
70
40
50
10
20
30
Belgiu
m
Nether
lands
Germ
any
Scan
danav
iaU.K
.
Spain U.S
0
Procurement
Administrative
Marketing and salesCall centers
Software developmentInformation technology
Product development
80
90
100
60
70
40
50
10
20
30
Belgiu
m
Nether
lands
Germ
any
Scan
danav
iaU.K
.
Spain U.S
0
Procurement
Administrative
Marketing and salesCall centers
Software developmentInformation technology
Product development
80
90
100
60
70
40
50
10
20
30
Belgiu
m
Nether
lands
Germ
any
Scan
danav
iaU.K
.
Spain U.S
0
Procurement
Administrative
Marketing and salesCall centers
Software developmentInformation technology
Product development
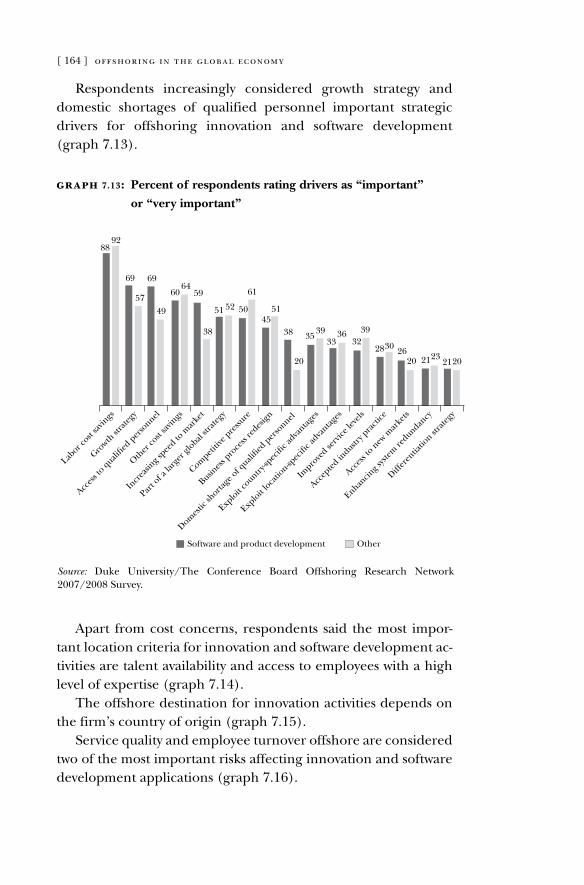
[ 164 ] offshoring in the global economy
respondents increasingly considered growth strategy and domestic shortages of qualified personnel important strategic drivers for offshoring innovation and software development (graph 7.13).
Source: duke University/The Conference Board offshoring research Network 2007/2008 Survey.
graph 7.13: Percent of respondents rating drivers as “important”
or “very important”
Software and product development Other
Labor c
ost sa
vings
8892
69
57
69
49
6064
59
38
51 52 50
61
4551
38
20
3539
3336
3239
2830 2620 2123
2120
Growth
stra
tegy
Acces
s to quali
�ed p
erso
nnel
Other
cost
savin
gs
Incr
easin
g spee
d to m
arke
t
Part o
f a la
rger
global
strate
gy
Competi
tive p
ressu
re
Busines
s pro
cess
redes
ign
Domes
tic sh
ortage
of quali
�ed p
erso
nnel
Explo
it co
untry-sp
eci�
c adva
ntages
Explo
it lo
catio
n-spec
i�c a
dvantag
es
Impro
ved se
rvice
leve
ls
Accep
ted in
dustry p
racti
ce
Acces
s to n
ew m
arke
ts
Enhancin
g syst
em re
dundancy
Differ
entia
tion st
rateg
y
apart from cost concerns, respondents said the most impor-tant location criteria for innovation and software development ac-tivities are talent availability and access to employees with a high level of expertise (graph 7.14).
The offshore destination for innovation activities depends on the firm’s country of origin (graph 7.15).
Service quality and employee turnover offshore are considered two of the most important risks affecting innovation and software development applications (graph 7.16).
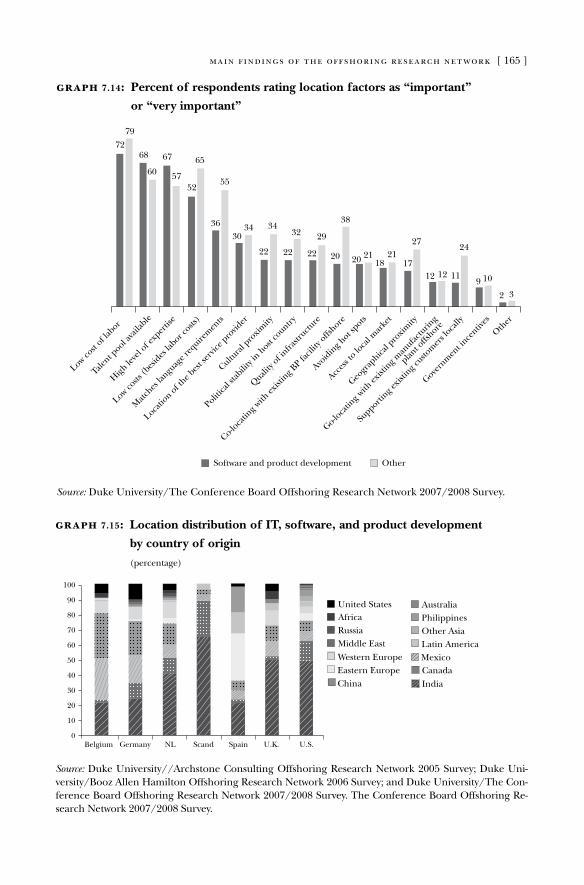
main findings of the offshoring research network [ 165 ]
Source: duke University/The Conference Board offshoring research Network 2007/2008 Survey.
graph 7.14: Percent of respondents rating location factors as “important”
or “very important”
Software and product development Other
Low cost
of lab
or
72
79
68
60
67
5752
65
55
3630
34
22
34
22
32
22
29
20
38
20 2118
2117
27
12 12 11
24
9 10
2 3
Talent p
ool ava
ilable
High le
vel o
f exp
ertis
e
Low costs
(bes
ides
labor c
osts)
Matc
hes la
nguag
e req
uirem
ents
Locatio
n of the b
est s
ervic
e pro
vider
Cultura
l pro
ximity
Politica
l stab
ility
in h
ost co
untry
Quality
of infra
structu
re
Co-loca
ting w
ith ex
istin
g BP fa
cility
offshore
Avoid
ing h
ot spots
Acces
s to lo
cal m
arke
t
Geogr
aphica
l pro
ximity
Go-loca
ting w
ith ex
istin
g man
ufactu
ring
plant o
ffshore
Supporti
ng exis
ting c
ustom
ers l
ocally
Govern
men
t ince
ntives
Other
Source: duke University//archstone Consulting offshoring research Network 2005 Survey; duke Uni-versity/Booz allen Hamilton offshoring research Network 2006 Survey; and duke University/The Con-ference Board offshoring research Network 2007/2008 Survey. The Conference Board offshoring re-search Network 2007/2008 Survey.
graph 7.15: Location distribution of IT, software, and product development
by country of origin
(percentage)
100
90
80
70
60
50
40
30
20
Belgium Germany NL Scand Spain U.K. U.S.
10
0
AustraliaPhilippinesOther AsiaLatin America
United StatesAfricaRussiaMiddle East
Western EuropeEastern EuropeChinaMexico
CanadaIndia
100
90
80
70
60
50
40
30
20
Belgium Germany NL Scand Spain U.K. U.S.
10
0
AustraliaPhilippinesOther AsiaLatin America
United StatesAfricaRussiaMiddle East
Western EuropeEastern EuropeChinaMexico
CanadaIndia
100
90
80
70
60
50
40
30
20
Belgium Germany NL Scand Spain U.K. U.S.
10
0
AustraliaPhilippinesOther AsiaLatin America
United StatesAfricaRussiaMiddle East
Western EuropeEastern EuropeChinaMexico
CanadaIndia
100
90
80
70
60
50
40
30
20
Belgium Germany NL Scand Spain U.K. U.S.
10
0
AustraliaPhilippinesOther AsiaLatin America
United StatesAfricaRussiaMiddle East
Western EuropeEastern EuropeChinaMexico
CanadaIndia
100
90
80
70
60
50
40
30
20
Belgium Germany NL Scand Spain U.K. U.S.
10
0
AustraliaPhilippinesOther AsiaLatin America
United StatesAfricaRussiaMiddle East
Western EuropeEastern EuropeChinaMexico
CanadaIndia
100
90
80
70
60
50
40
30
20
Belgium Germany NL Scand Spain U.K. U.S.
10
0
AustraliaPhilippinesOther AsiaLatin America
United StatesAfricaRussiaMiddle East
Western EuropeEastern EuropeChinaMexico
CanadaIndia
100
90
80
70
60
50
40
30
20
Belgium Germany NL Scand Spain U.K. U.S.
10
0
AustraliaPhilippinesOther AsiaLatin America
United StatesAfricaRussiaMiddle East
Western EuropeEastern EuropeChinaMexico
CanadaIndia
100
90
80
70
60
50
40
30
20
Belgium Germany NL Scand Spain U.K. U.S.
10
0
AustraliaPhilippinesOther AsiaLatin America
United StatesAfricaRussiaMiddle East
Western EuropeEastern EuropeChinaMexico
CanadaIndia
100
90
80
70
60
50
40
30
20
Belgium Germany NL Scand Spain U.K. U.S.
10
0
AustraliaPhilippinesOther AsiaLatin America
United StatesAfricaRussiaMiddle East
Western EuropeEastern EuropeChinaMexico
CanadaIndia
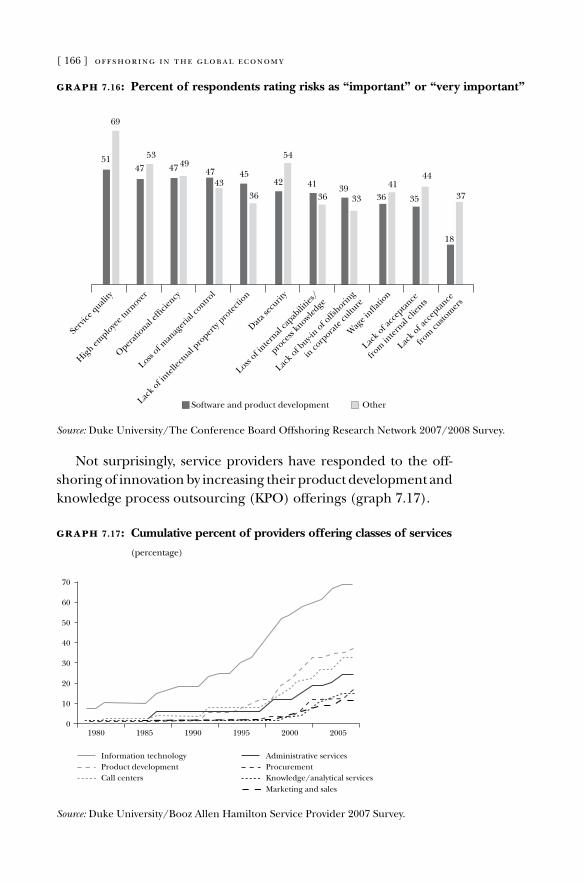
[ 166 ] offshoring in the global economy
Source: duke University/The Conference Board offshoring research Network 2007/2008 Survey.
graph 7.16: Percent of respondents rating risks as “important” or “very important”
Software and product development Other
Serv
ice quali
ty
51
69
53
47 47 4947
4345
36
42
54
4136
3933 36
41
35
44
18
High em
ploye
e turn
over
37
Operati
onal ef�
ciency
Loss of m
anag
erial
contro
l
Lack o
f intel
lectu
al pro
perty
protec
tion
Data se
curit
y
Loss of i
nternal
capab
ilitie
s/
proce
ss kn
owledge
Lack o
f buy-i
n of offs
horing
in co
rpora
te cu
lture
Wag
e in�ati
on
Lack o
f acc
eptan
ce
from
inter
nal cli
ents
Lack o
f acc
eptan
ce
from
custo
mer
s
Not surprisingly, service providers have responded to the off-shoring of innovation by increasing their product development and knowledge process outsourcing (KPo) offerings (graph 7.17).
Source: duke University/Booz allen Hamilton Service Provider 2007 Survey.
graph 7.17: Cumulative percent of providers offering classes of services
(percentage)
0
70
60
50
40
30
20
10
1980 1985 1990 1995 2000 2005
Information technologyProduct developmentCall centers
Administrative servicesProcurementKnowledge/analytical servicesMarketing and sales
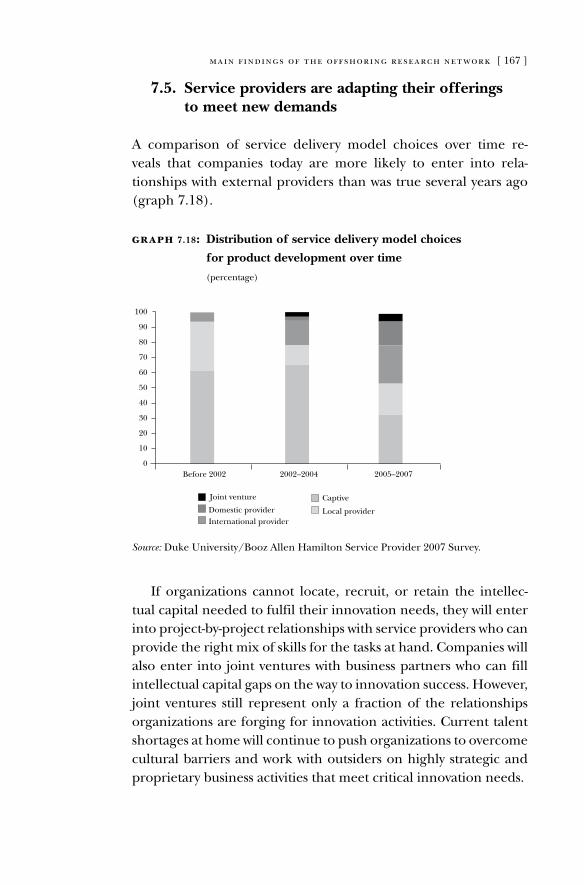
main findings of the offshoring research network [ 167 ]
7.5. Service providers are adapting their offerings to meet new demands
a comparison of service delivery model choices over time re-veals that companies today are more likely to enter into rela-tionships with external providers than was true several years ago (graph 7.18).
Source: duke University/Booz allen Hamilton Service Provider 2007 Survey.
graph 7.18: Distribution of service delivery model choices
for product development over time
(percentage)
70
80
90
100
60
50
40
30
20
10
Before 2002 2002–2004 2005–20070
CaptiveJoint venture
Domestic providerInternational provider
Local provider
If organizations cannot locate, recruit, or retain the intellec-tual capital needed to fulfil their innovation needs, they will enter into project-by-project relationships with service providers who can provide the right mix of skills for the tasks at hand. Companies will also enter into joint ventures with business partners who can fill intellectual capital gaps on the way to innovation success. However, joint ventures still represent only a fraction of the relationships organizations are forging for innovation activities. Current talent shortages at home will continue to push organizations to overcome cultural barriers and work with outsiders on highly strategic and proprietary business activities that meet critical innovation needs.
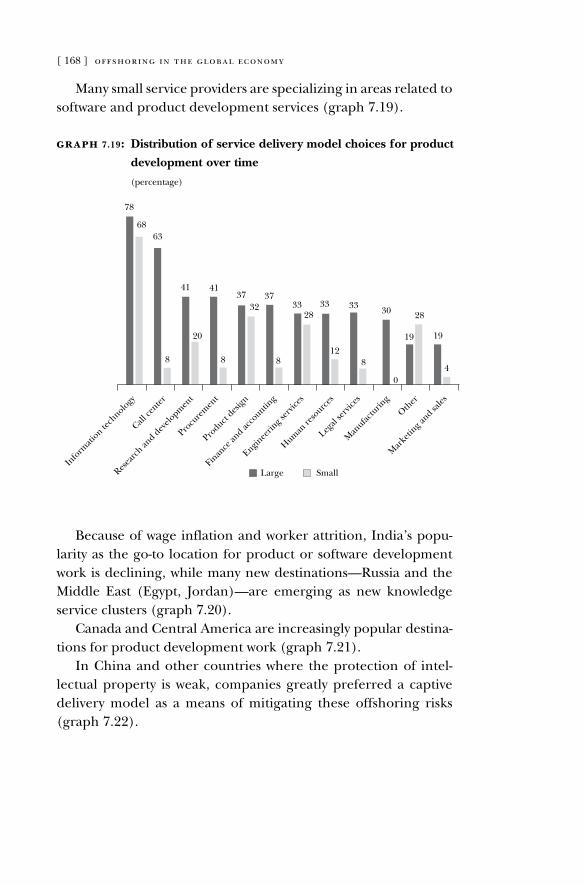
[ 168 ] offshoring in the global economy
Many small service providers are specializing in areas related to software and product development services (graph 7.19).
graph 7.19: Distribution of service delivery model choices for product
development over time
(percentage)
Large SmallIn
form
ation te
chnolo
gy
78
68
8
63
41
20
41
8
3732
37
8
3328
33
12
33
8
30
0
19 19
4
28
Call ce
nter
Resea
rch an
d dev
elopm
ent
Procu
rem
ent
Product
design
Finan
ce an
d acco
unting
Enginee
ring s
ervic
es
Human
reso
urces
Legal
serv
ices
Man
ufactu
ring
Other
Mar
ketin
g and sa
les
Because of wage inflation and worker attrition, India’s popu-larity as the go-to location for product or software development work is declining, while many new destinations—russia and the Middle East (Egypt, Jordan)—are emerging as new knowledge service clusters (graph 7.20).
Canada and Central america are increasingly popular destina-tions for product development work (graph 7.21).
In China and other countries where the protection of intel-lectual property is weak, companies greatly preferred a captive delivery model as a means of mitigating these offshoring risks (graph 7.22).
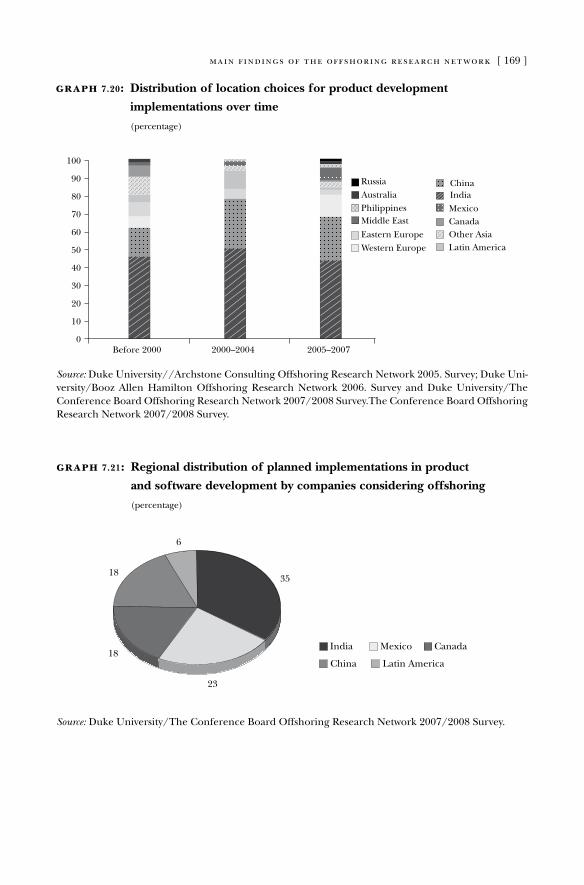
main findings of the offshoring research network [ 169 ]
Source: duke University//archstone Consulting offshoring research Network 2005. Survey; duke Uni-versity/Booz allen Hamilton offshoring research Network 2006. Survey and duke University/The Conference Board offshoring research Network 2007/2008 Survey.The Conference Board offshoring research Network 2007/2008 Survey.
graph 7.20: Distribution of location choices for product development
implementations over time
(percentage)
100
90
80
70
60
50
40
30
20
Before 2000 2000–2004 2005–2007
10
0
AustraliaPhilippines
Russia
Middle EastOther AsiaLatin America
MexicoCanada Western Europe
Eastern Europe
ChinaIndia
100
90
80
70
60
50
40
30
20
Before 2000 2000–2004 2005–2007
10
0
AustraliaPhilippines
Russia
Middle EastOther AsiaLatin America
MexicoCanada Western Europe
Eastern Europe
ChinaIndia
100
90
80
70
60
50
40
30
20
Before 2000 2000–2004 2005–2007
10
0
AustraliaPhilippines
Russia
Middle EastOther AsiaLatin America
MexicoCanada Western Europe
Eastern Europe
ChinaIndia
100
90
80
70
60
50
40
30
20
Before 2000 2000–2004 2005–2007
10
0
AustraliaPhilippines
Russia
Middle EastOther AsiaLatin America
MexicoCanada Western Europe
Eastern Europe
ChinaIndia
100
90
80
70
60
50
40
30
20
Before 2000 2000–2004 2005–2007
10
0
AustraliaPhilippines
Russia
Middle EastOther AsiaLatin America
MexicoCanada Western Europe
Eastern Europe
ChinaIndia
100
90
80
70
60
50
40
30
20
Before 2000 2000–2004 2005–2007
10
0
AustraliaPhilippines
Russia
Middle EastOther AsiaLatin America
MexicoCanada Western Europe
Eastern Europe
ChinaIndia
100
90
80
70
60
50
40
30
20
Before 2000 2000–2004 2005–2007
10
0
AustraliaPhilippines
Russia
Middle EastOther AsiaLatin America
MexicoCanada Western Europe
Eastern Europe
ChinaIndia
Source: duke University/The Conference Board offshoring research Network 2007/2008 Survey.
graph 7.21: Regional distribution of planned implementations in product
and software development by companies considering offshoring
(percentage)
35
23
18
18
6
China Latin AmericaIndia Mexico Canada
35
23
18
18
6
China Latin AmericaIndia Mexico Canada
35
23
18
18
6
China Latin AmericaIndia Mexico Canada
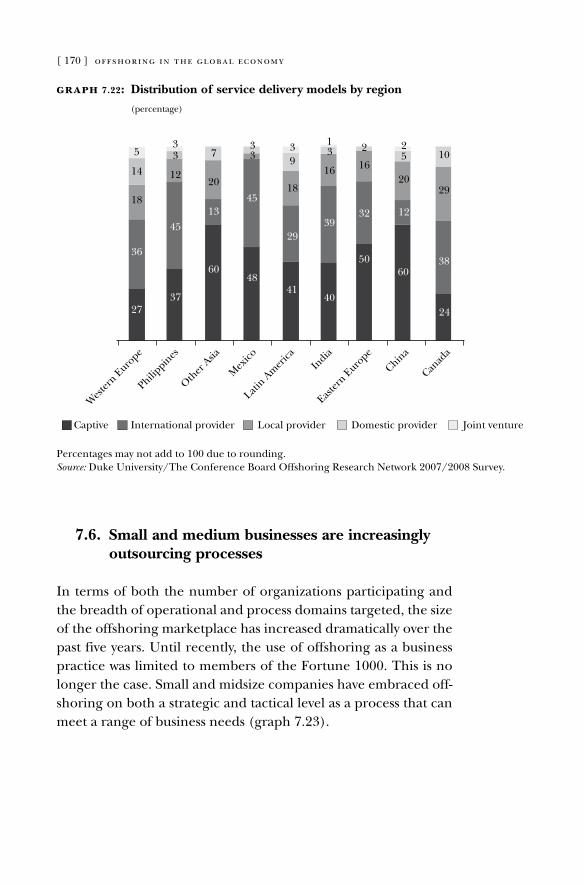
[ 170 ] offshoring in the global economy
Wes
tern E
urope
2737
60
1345
4841
40
5060
24
38
29
10
12
20
522
16
3239
29
18
93
16
31
20
7
45
12
33
33
36
18
14
5
Philippin
es
Other
Asia
Mex
ico
Latin A
mer
icaIn
dia
Easter
n Euro
pe
China
Canad
a
Captive International provider Local provider Domestic provider Joint venture
Percentages may not add to 100 due to rounding.Source: duke University/The Conference Board offshoring research Network 2007/2008 Survey.
graph 7.22: Distribution of service delivery models by region
(percentage)
7.6. Small and medium businesses are increasingly outsourcing processes
In terms of both the number of organizations participating and the breadth of operational and process domains targeted, the size of the offshoring marketplace has increased dramatically over the past five years. Until recently, the use of offshoring as a business practice was limited to members of the Fortune 1000. This is no longer the case. Small and midsize companies have embraced off-shoring on both a strategic and tactical level as a process that can meet a range of business needs (graph 7.23).
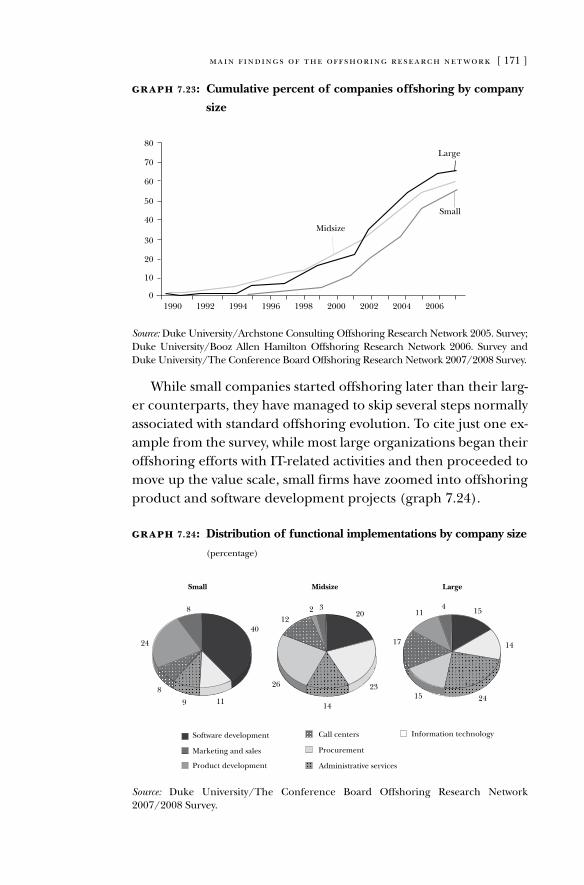
main findings of the offshoring research network [ 171 ]
Source: duke University/archstone Consulting offshoring research Network 2005. Survey; duke University/Booz allen Hamilton offshoring research Network 2006. Survey and duke University/The Conference Board offshoring research Network 2007/2008 Survey.
graph 7.23: Cumulative percent of companies offshoring by company
size
80
60
70
40
50
1990 1992 1994 1996 1998 2000
Midsize
Small
Large
2002 2004 2006
20
30
0
10
While small companies started offshoring later than their larg-er counterparts, they have managed to skip several steps normally associated with standard offshoring evolution. To cite just one ex-ample from the survey, while most large organizations began their offshoring efforts with IT-related activities and then proceeded to move up the value scale, small firms have zoomed into offshoring product and software development projects (graph 7.24).
Source: duke University/The Conference Board offshoring research Network 2007/2008 Survey.
graph 7.24: Distribution of functional implementations by company size
(percentage)
Small Midsize Large
20 15
23
14
2415
17
114
14
26
122 3
Procurement
Call centers Information technology
Administrative services
Software development
Product development
Marketing and sales
40
119
8
24
8
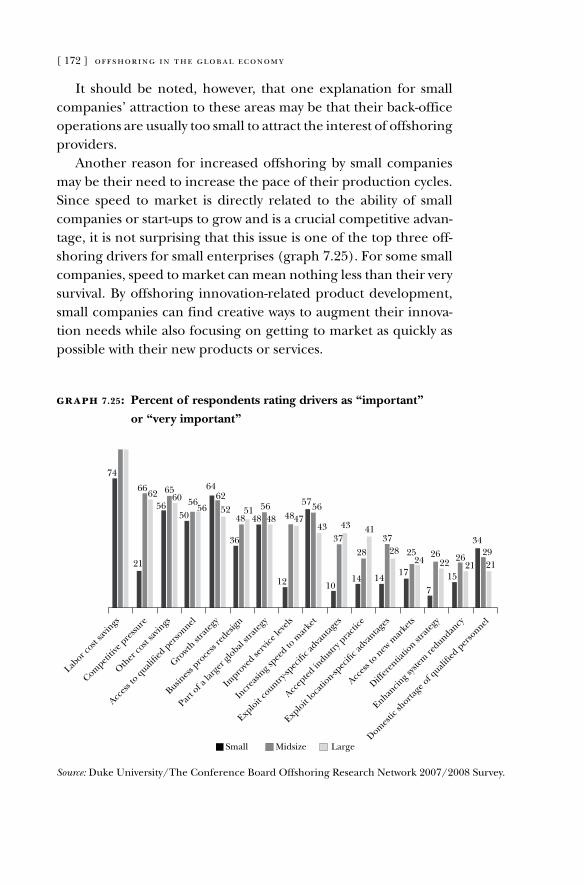
[ 172 ] offshoring in the global economy
It should be noted, however, that one explanation for small companies’ attraction to these areas may be that their back-office operations are usually too small to attract the interest of offshoring providers.
another reason for increased offshoring by small companies may be their need to increase the pace of their production cycles. Since speed to market is directly related to the ability of small companies or start-ups to grow and is a crucial competitive advan-tage, it is not surprising that this issue is one of the top three off-shoring drivers for small enterprises (graph 7.25). For some small companies, speed to market can mean nothing less than their very survival. By offshoring innovation-related product development, small companies can find creative ways to augment their innova-tion needs while also focusing on getting to market as quickly as possible with their new products or services.
Source: duke University/The Conference Board offshoring research Network 2007/2008 Survey.
graph 7.25: Percent of respondents rating drivers as “important”
or “very important”
Small Midsize Large
Labor c
ost sa
vings
74
21
6662 65
60 5656
6462
5248 48 4847
5756
43
10
43
14
3728
17
2524
7
2622
15
2621
41
12
5651
Competi
tive p
ressu
re
Other
cost
savin
gs
Acces
s to quali
�ed p
erso
nnel
Growth
stra
tegy
Busines
s pro
cess
redes
ign
Part o
f a la
rger
global
strate
gy
Impro
ved se
rvice
leve
ls
Incr
easin
g spee
d to m
arke
t
Explo
it co
untry-sp
eci�
c adva
ntages
Accep
ted in
dustry p
racti
ce
Explo
it lo
catio
n-spec
i�c a
dvantag
es
Acces
s to n
ew m
arke
ts
Differ
entia
tion st
rateg
y
Enhancin
g syst
em re
dundancy
Domes
tic sh
ortage
of quali
�ed p
erso
nnel
342921
485056
36 37
14
28
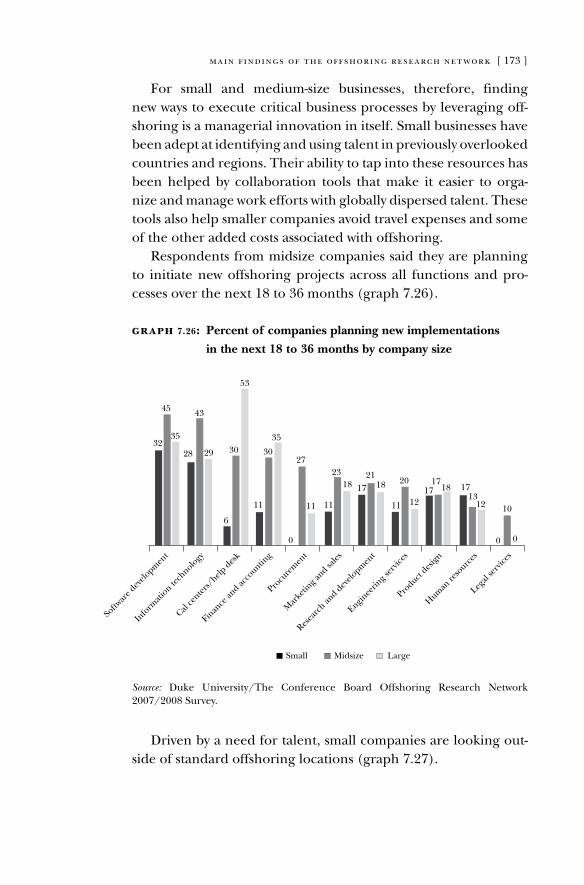
main findings of the offshoring research network [ 173 ]
For small and medium-size businesses, therefore, finding new ways to execute critical business processes by leveraging off- shoring is a managerial innovation in itself. Small businesses have been adept at identifying and using talent in previously overlooked countries and regions. Their ability to tap into these resources has been helped by collaboration tools that make it easier to orga- nize and manage work efforts with globally dispersed talent. These tools also help smaller companies avoid travel expenses and some of the other added costs associated with offshoring.
respondents from midsize companies said they are planning to initiate new offshoring projects across all functions and pro- cesses over the next 18 to 36 months (graph 7.26).
Source: duke University/The Conference Board offshoring research Network 2007/2008 Survey.
graph 7.26: Percent of companies planning new implementations
in the next 18 to 36 months by company size
Small Midsize Large
Softw
are d
evelo
pmen
t
32
45
35
28
43
29
6
30
53
11
30
35
0
27
11 11
2318 17
2118
11
20
1217
1718 17
1312
0
10
0
Info
rmati
on tech
nology
Cal ce
nters/
help d
esk
Finan
ce an
d acco
unting
Procu
rem
ent
Mar
ketin
g and sa
les
Resea
rch an
d dev
elopm
ent
Enginee
ring s
ervic
es
Product
design
Human
reso
urces
Legal
serv
ices
driven by a need for talent, small companies are looking out-side of standard offshoring locations (graph 7.27).
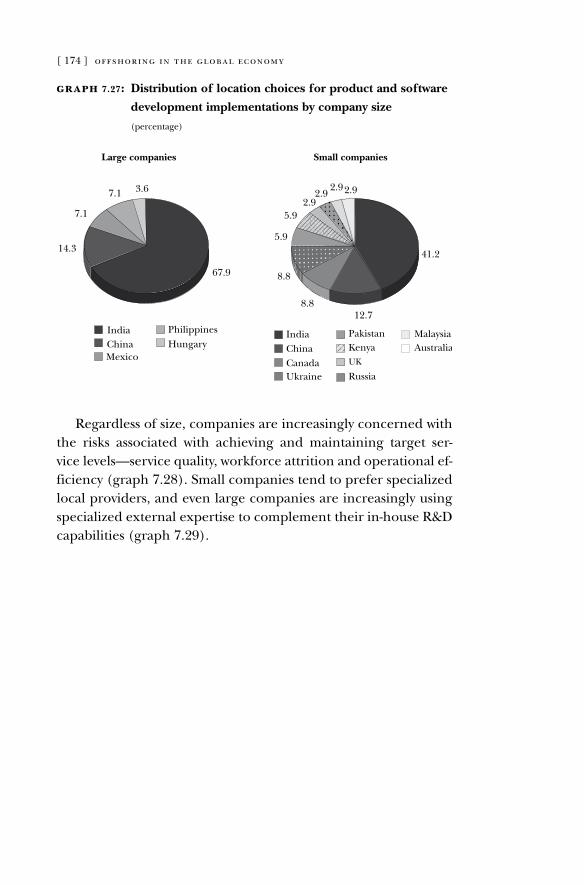
[ 174 ] offshoring in the global economy
graph 7.27: Distribution of location choices for product and software
development implementations by company size
(percentage)
41.2
12.78.8
8.8
5.9
5.92.9
2.92.92.9
CanadaUkraine
PakistanKenyaUK
Russia
MalaysiaAustralia
IndiaChina
Small companies
67.9
14.3
7.1
7.1
India
3.6
Hungary
Large companies
Philippines
MexicoChina
regardless of size, companies are increasingly concerned with the risks associated with achieving and maintaining target ser- vice levels—service quality, workforce attrition and operational ef-ficiency (graph 7.28). Small companies tend to prefer specialized local providers, and even large companies are increasingly using specialized external expertise to complement their in-house r&d capabilities (graph 7.29).
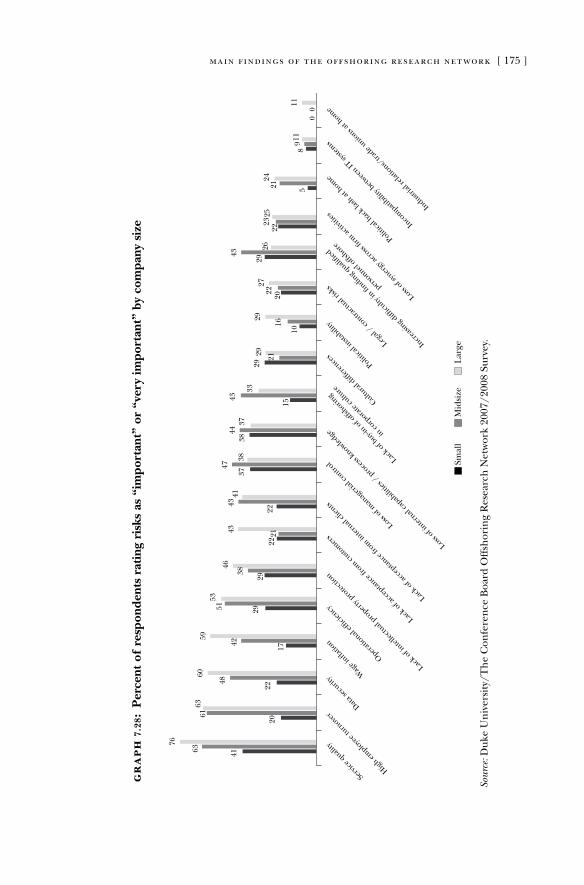
main findings of the offshoring research network [ 175 ]
gr
ap
h 7
.28:
Per
cent
of
resp
onde
nts
rati
ng r
isks
as
“im
port
ant”
or
“ver
y im
port
ant”
by
com
pany
siz
e
Smal
lM
idsi
zeL
arge
Serv
ice quali
ty
High em
ploye
e turn
over
Data se
curit
y Wag
e in�ati
on
Operati
onal ef�
ciency
Lack o
f intel
lectu
al pro
perty
protec
tion
Lack o
f acc
eptan
ce fr
om cu
stom
ers
Lack o
f acc
eptan
ce fr
om in
ternal
clien
ts
Loss of m
anag
erial
contro
l
4163
76
20
6163
22
48
60
17
42
59
295153
29
46
22
43
22
4341
37
47
38
Loss of i
nternal
capab
ilitie
s / p
roce
ss kn
owledge
3844
37
15
43
3329
29
10
29
2022
2729
43
2622
2325
521
89
11
00
11
24
Lack o
f buy-i
n of offs
horing
in co
rpora
te cu
lture
Cultura
l diff
eren
ces
Politica
l insta
bility
Legal
/ contra
ctual
risks
Incr
easin
g dif�
culty
in �
nding q
uali�ed
perso
nnel offs
hore
Loss of s
yner
gy ac
ross
�rm ac
tiviti
es
Politica
l bac
k las
h at h
ome
Industr
ial re
latio
ns/tra
de unio
ns at h
ome
Inco
mpati
bility
betwee
n IT sy
stem
s
21
38
2116
Sour
ce: d
uke
Un
iver
sity
/Th
e C
onfe
ren
ce B
oard
off
shor
ing
res
earc
h N
etw
ork
2007
/200
8 Su
rvey
.
Smal
lM
idsi
zeL
arge
Serv
ice quali
ty
High em
ploye
e turn
over
Data se
curit
y Wag
e in�ati
on
Operati
onal ef�
ciency
Lack o
f intel
lectu
al pro
perty
protec
tion
Lack o
f acc
eptan
ce fr
om cu
stom
ers
Lack o
f acc
eptan
ce fr
om in
ternal
clien
ts
Loss of m
anag
erial
contro
l
4163
76
20
6163
22
48
60
17
42
59
295153
29
46
22
43
22
4341
37
47
38
Loss of i
nternal
capab
ilitie
s / p
roce
ss kn
owledge
3844
37
15
43
3329
29
10
29
2022
2729
43
2622
2325
521
89
11
00
11
24
Lack o
f buy-i
n of offs
horing
in co
rpora
te cu
lture
Cultura
l diff
eren
ces
Politica
l insta
bility
Legal
/ contra
ctual
risks
Incr
easin
g dif�
culty
in �
nding q
uali�ed
perso
nnel offs
hore
Loss of s
yner
gy ac
ross
�rm ac
tiviti
es
Politica
l bac
k las
h at h
ome
Industr
ial re
latio
ns/tra
de unio
ns at h
ome
Inco
mpati
bility
betwee
n IT sy
stem
s21
38
2116
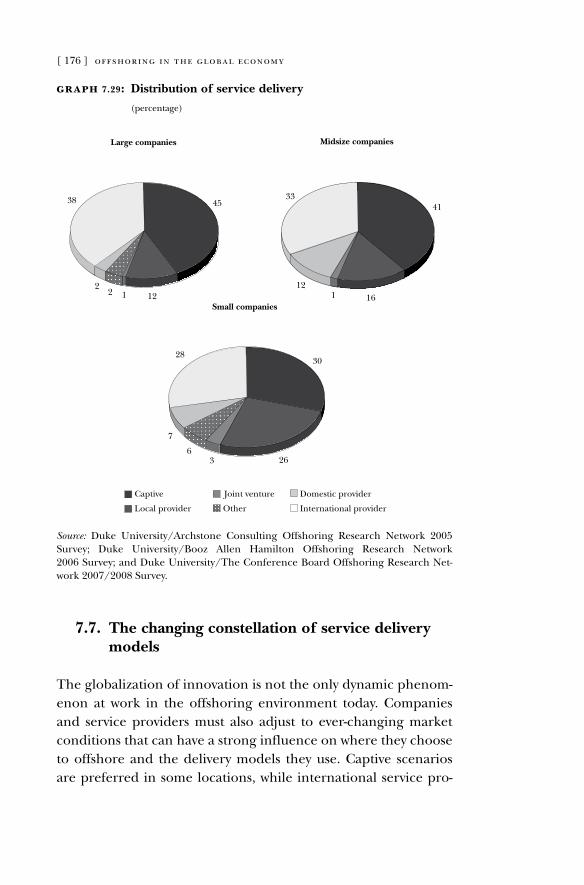
[ 176 ] offshoring in the global economy
7.7. The changing constellation of service delivery models
The globalization of innovation is not the only dynamic phenom-enon at work in the offshoring environment today. Companies and service providers must also adjust to ever-changing market conditions that can have a strong influence on where they choose to offshore and the delivery models they use. Captive scenarios are preferred in some locations, while international service pro-
graph 7.29: Distribution of service delivery
(percentage)
Source: duke University/archstone Consulting offshoring research Network 2005 Survey; duke University/Booz allen Hamilton offshoring research Network 2006 Survey; and duke University/The Conference Board offshoring research Net-work 2007/2008 Survey.
Large companies
45
12
38
22 1
Midsize companies
4133
121 16
Small companies
30
36
7
28
26
Local provider
Captive
Other
Joint venture
International provider
Domestic provider
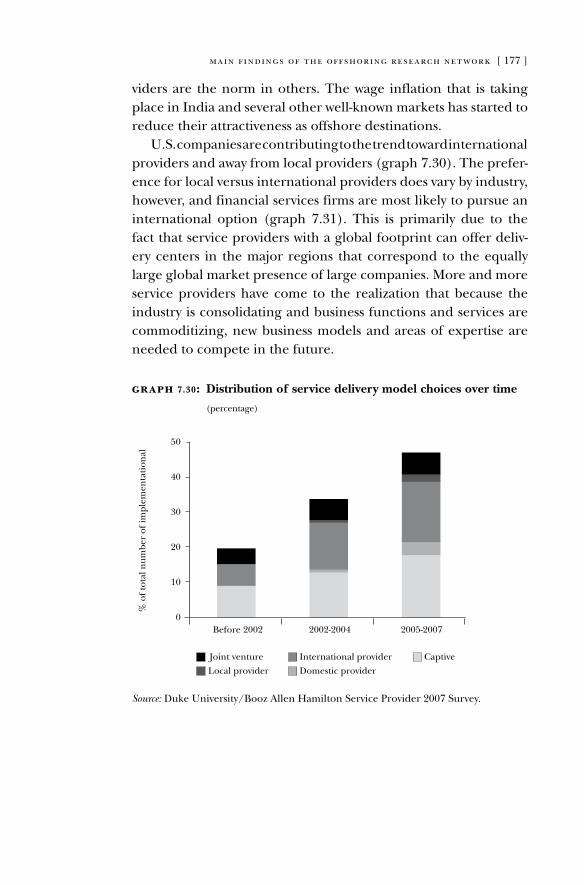
main findings of the offshoring research network [ 177 ]
viders are the norm in others. The wage inflation that is taking place in India and several other well-known markets has started to reduce their attractiveness as offshore destinations.
U.S. companies are contributing to the trend toward international providers and away from local providers (graph 7.30). The prefer-ence for local versus international providers does vary by industry, however, and financial services firms are most likely to pursue an international option (graph 7.31). This is primarily due to the fact that service providers with a global footprint can offer deliv-ery centers in the major regions that correspond to the equally large global market presence of large companies. More and more service providers have come to the realization that because the industry is consolidating and business functions and services are commoditizing, new business models and areas of expertise are needed to compete in the future.
Source: duke University/Booz allen Hamilton Service Provider 2007 Survey.
graph 7.30: Distribution of service delivery model choices over time
(percentage)
40
50
30
20
% o
f tot
al n
umbe
r of
impl
emen
tati
onal
10
Before 2002 2002-2004 2005-20070
CaptiveJoint venture
Domestic provider
International provider
Local provider
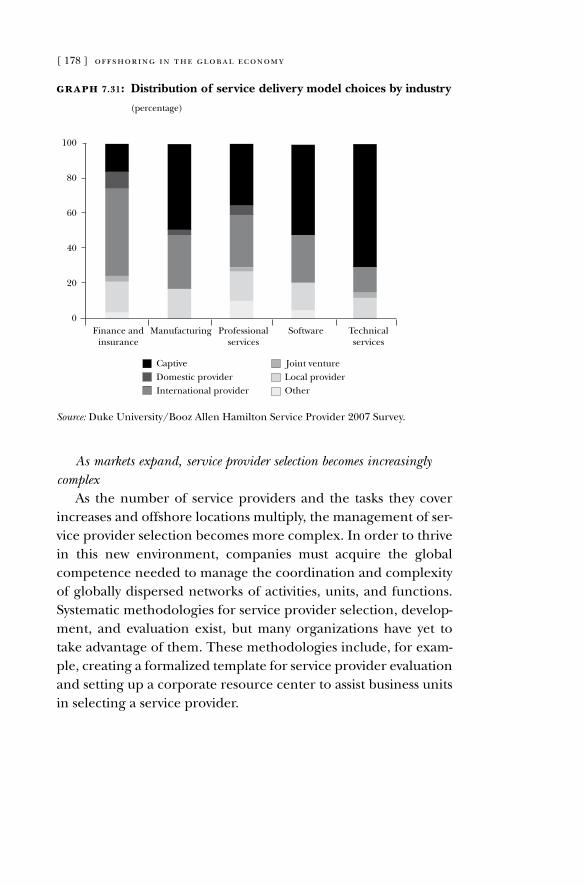
[ 178 ] offshoring in the global economy
Source: duke University/Booz allen Hamilton Service Provider 2007 Survey.
graph 7.31: Distribution of service delivery model choices by industry
(percentage)
80
100
60
40
20
Finance andinsurance
Manufacturing Professionalservices
Software Technicalservices
0
Captive
Other
Joint ventureDomestic providerInternational provider
Local provider
As markets expand, service provider selection becomes increasingly complex
as the number of service providers and the tasks they cover increases and offshore locations multiply, the management of ser- vice provider selection becomes more complex. In order to thrive in this new environment, companies must acquire the global competence needed to manage the coordination and complexity of globally dispersed networks of activities, units, and functions. Systematic methodologies for service provider selection, develop-ment, and evaluation exist, but many organizations have yet to take advantage of them. These methodologies include, for exam-ple, creating a formalized template for service provider evaluation and setting up a corporate resource center to assist business units in selecting a service provider.
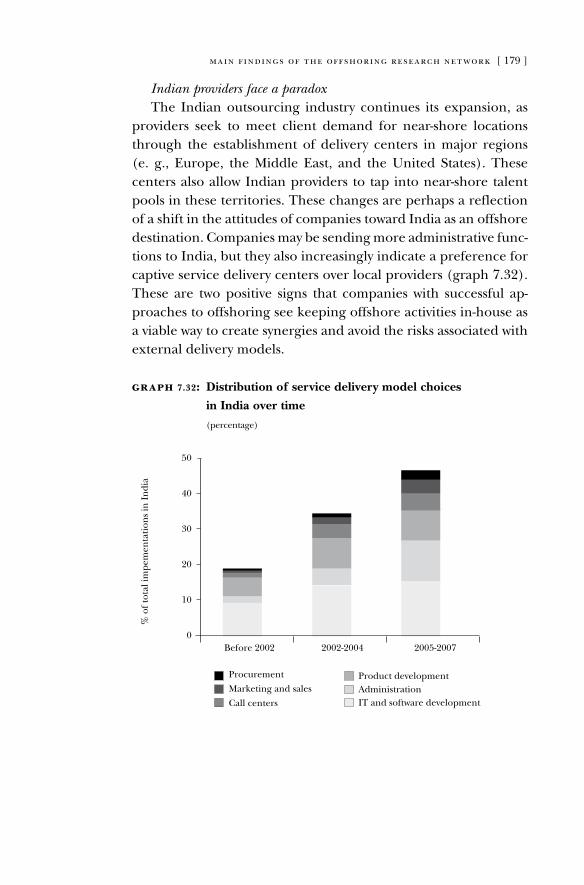
main findings of the offshoring research network [ 179 ]
Indian providers face a paradoxThe Indian outsourcing industry continues its expansion, as
providers seek to meet client demand for near-shore locations through the establishment of delivery centers in major regions (e. g., Europe, the Middle East, and the United States). These centers also allow Indian providers to tap into near-shore talent pools in these territories. These changes are perhaps a reflection of a shift in the attitudes of companies toward India as an offshore destination. Companies may be sending more administrative func-tions to India, but they also increasingly indicate a preference for captive service delivery centers over local providers (graph 7.32). These are two positive signs that companies with successful ap-proaches to offshoring see keeping offshore activities in-house as a viable way to create synergies and avoid the risks associated with external delivery models.
graph 7.32: Distribution of service delivery model choices
in India over time
(percentage)
40
50
30
20
% o
f tot
al im
pem
enta
tion
s in
In
dia
10
Before 2002 2002-2004 2005-20070
Administration
Procurement Product development
Call centers
Marketing and salesIT and software development
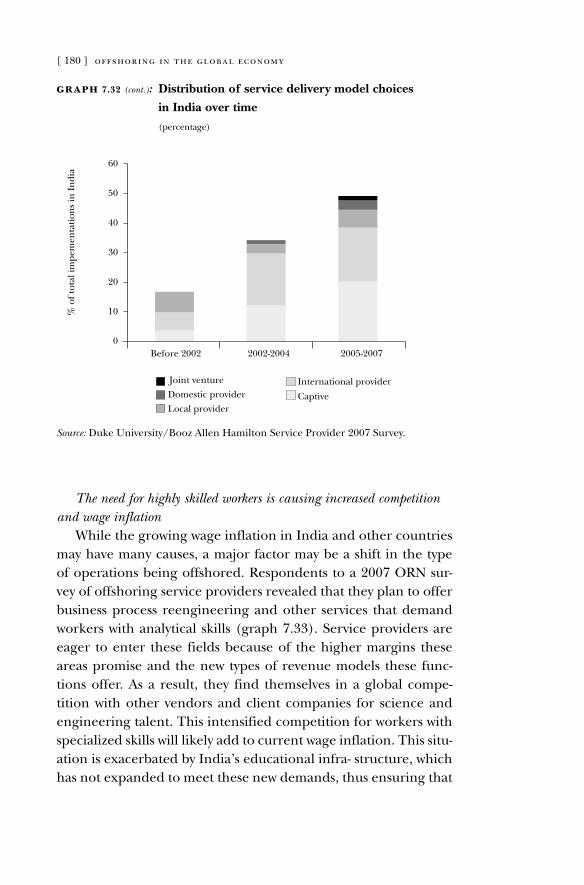
[ 180 ] offshoring in the global economy
Source: duke University/Booz allen Hamilton Service Provider 2007 Survey.
50
60
40
20
30
% o
f tot
al im
pem
enta
tion
s in
In
dia
10
Before 2002 2002-2004 2005-20070
Captive
Joint venture International provider
Local provider
Domestic provider
graph 7.32 (cont.): Distribution of service delivery model choices
in India over time
(percentage)
The need for highly skilled workers is causing increased competition and wage inflation
While the growing wage inflation in India and other countries may have many causes, a major factor may be a shift in the type of operations being offshored. respondents to a 2007 orN sur-vey of offshoring service providers revealed that they plan to offer business process reengineering and other services that demand workers with analytical skills (graph 7.33). Service providers are eager to enter these fields because of the higher margins these areas promise and the new types of revenue models these func-tions offer. as a result, they find themselves in a global compe-tition with other vendors and client companies for science and engineering talent. This intensified competition for workers with specialized skills will likely add to current wage inflation. This situ-ation is exacerbated by India’s educational infra- structure, which has not expanded to meet these new demands, thus ensuring that
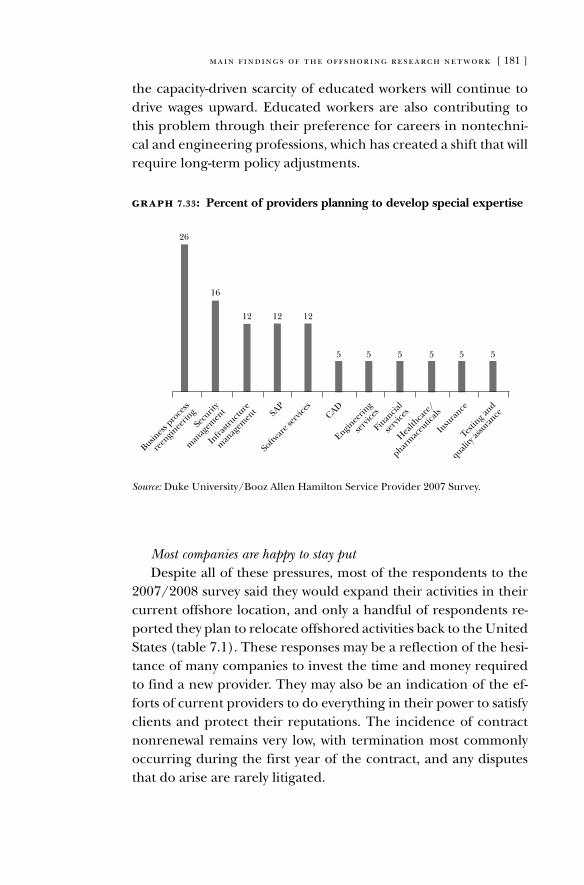
main findings of the offshoring research network [ 181 ]
the capacity-driven scarcity of educated workers will continue to drive wages upward. Educated workers are also contributing to this problem through their preference for careers in nontechni-cal and engineering professions, which has created a shift that will require long-term policy adjustments.
Source: duke University/Booz allen Hamilton Service Provider 2007 Survey.
graph 7.33: Percent of providers planning to develop special expertise
Busines
s pro
cess
reen
ginee
ringSe
curit
y
man
agem
ent
Infra
structu
re
man
agem
ent SA
P
Softw
are s
ervic
esCAD
Enginee
ring
serv
ices
Finan
cial
serv
ices
Health
care
/
pharm
aceu
ticals
26
16
12 12 12
5 5 5 5 5 5
Insu
rance
Testin
g and
quality
assu
rance
Most companies are happy to stay putdespite all of these pressures, most of the respondents to the
2007/2008 survey said they would expand their activities in their current offshore location, and only a handful of respondents re-ported they plan to relocate offshored activities back to the United States (table 7.1). These responses may be a reflection of the hesi-tance of many companies to invest the time and money required to find a new provider. They may also be an indication of the ef-forts of current providers to do everything in their power to satisfy clients and protect their reputations. The incidence of contract nonrenewal remains very low, with termination most commonly occurring during the first year of the contract, and any disputes that do arise are rarely litigated.
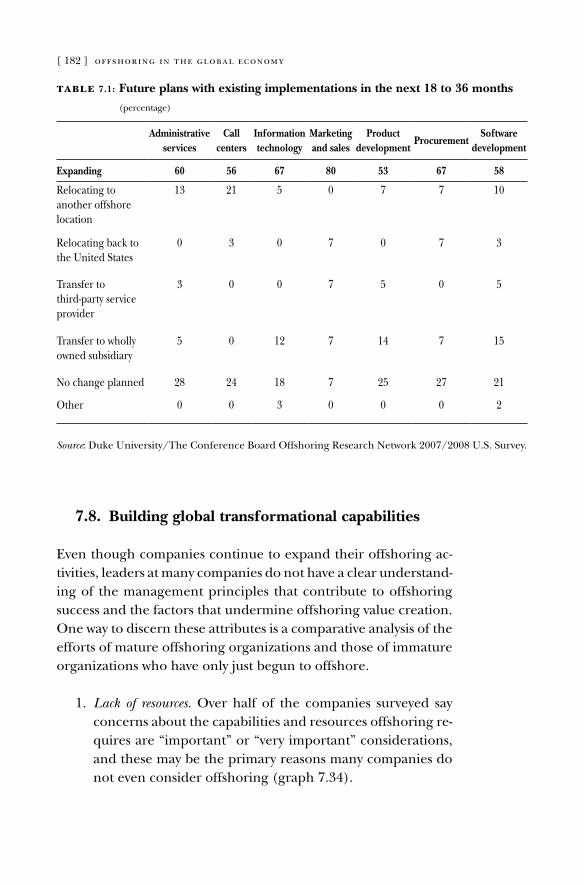
[ 182 ] offshoring in the global economy
table 7.1: Future plans with existing implementations in the next 18 to 36 months
(percentage)
Administrative services
Call centers
Information technology
Marketing and sales
Product development
ProcurementSoftware
development
Expanding 60 56 67 80 53 67 58
relocating to another offshore location
13 21 5 0 7 7 10
relocating back to the United States
0 3 0 7 0 7 3
Transfer to third-party service provider
3 0 0 7 5 0 5
Transfer to wholly owned subsidiary
5 0 12 7 14 7 15
No change planned 28 24 18 7 25 27 21
other 0 0 3 0 0 0 2
Source: duke University/The Conference Board offshoring research Network 2007/2008 U.S. Survey.
7.8. Building global transformational capabilities
Even though companies continue to expand their offshoring ac-tivities, leaders at many companies do not have a clear understand-ing of the management principles that contribute to offshoring success and the factors that undermine offshoring value creation. one way to discern these attributes is a comparative analysis of the efforts of mature offshoring organizations and those of immature organizations who have only just begun to offshore.
1. Lack of resources. over half of the companies surveyed say concerns about the capabilities and resources offshoring re-quires are “important” or “very important” considerations, and these may be the primary reasons many companies do not even consider offshoring (graph 7.34).
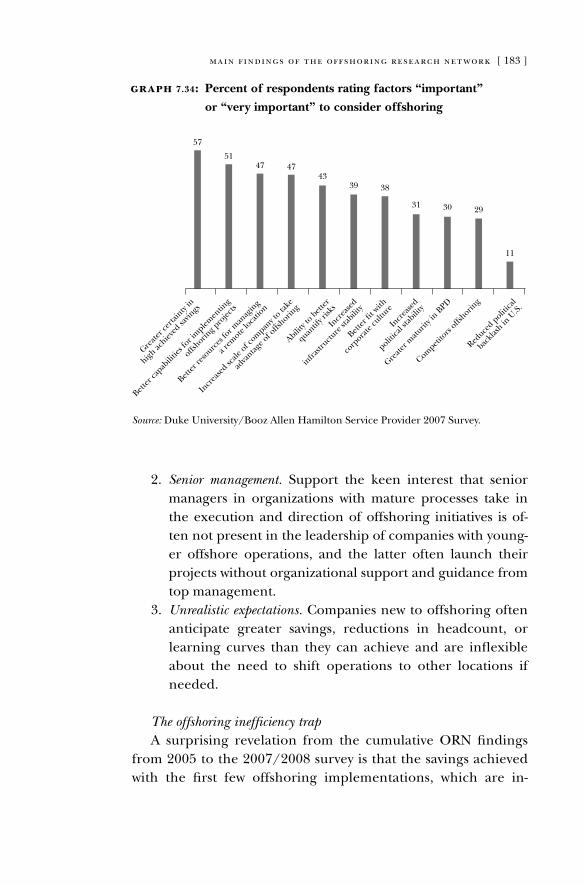
main findings of the offshoring research network [ 183 ]
Source: duke University/Booz allen Hamilton Service Provider 2007 Survey.
graph 7.34: Percent of respondents rating factors “important”
or “very important” to consider offshoring
Greate
r cer
tainty
in
high ac
hieved
savin
gs
Better
capab
ilitie
s for i
mplem
entin
g
offshorin
g pro
jects
Better
reso
urces
for m
anag
ing
a rem
ote lo
catio
n
Incr
ease
d scale
of com
pany t
o take
adva
ntage o
f offs
horing
Ability
to bett
er
quantif
y risk
s
Incr
ease
d
infra
structu
re st
abili
ty
Better
fit w
ith
corp
orate
cultu
re
Incr
ease
d
politica
l stab
ility
Greate
r matu
rity i
n BPD
Competi
tors
offshorin
g
Reduce
d polit
ical
backla
sh in
U.S.
57
5147 47
4339 38
31 30 29
11
2. Senior management. Support the keen interest that senior managers in organizations with mature processes take in the execution and direction of offshoring initiatives is of-ten not present in the leadership of companies with young-er offshore operations, and the latter often launch their projects without organizational support and guidance from top management.
3. Unrealistic expectations. Companies new to offshoring often anticipate greater savings, reductions in headcount, or learning curves than they can achieve and are inflexible about the need to shift operations to other locations if needed.
The offshoring inefficiency trapa surprising revelation from the cumulative orN findings
from 2005 to the 2007/2008 survey is that the savings achieved with the first few offshoring implementations, which are in-
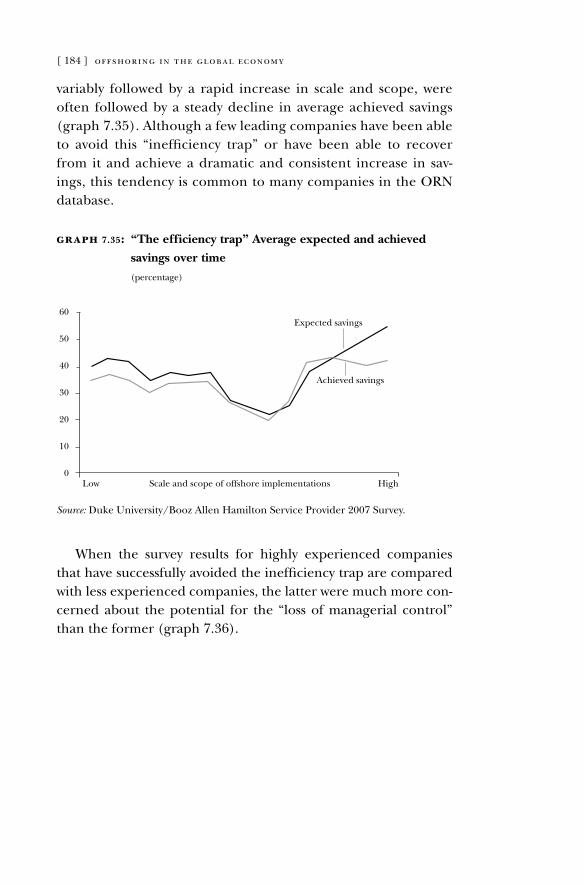
[ 184 ] offshoring in the global economy
variably followed by a rapid increase in scale and scope, were often followed by a steady decline in average achieved savings (graph 7.35). although a few leading companies have been able to avoid this “inefficiency trap” or have been able to recover from it and achieve a dramatic and consistent increase in sav-ings, this tendency is common to many companies in the orN database.
Source: duke University/Booz allen Hamilton Service Provider 2007 Survey.
graph 7.35: “The efficiency trap” Average expected and achieved
savings over time
(percentage)
0
60
50
40
30
20
10
Low HighScale and scope of offshore implementations
Expected savings
Achieved savings
When the survey results for highly experienced companies that have successfully avoided the inefficiency trap are compared with less experienced companies, the latter were much more con-cerned about the potential for the “loss of managerial control” than the former (graph 7.36).
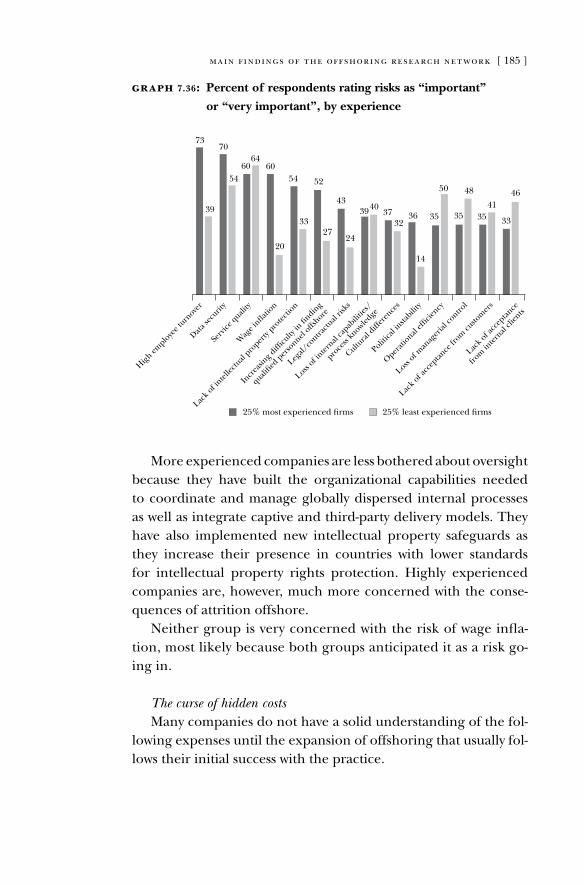
main findings of the offshoring research network [ 185 ]
graph 7.36: Percent of respondents rating risks as “important”
or “very important”, by experience
High em
ploye
e turn
over
Data se
curit
y
Serv
ice quali
ty
Wag
e inflati
on
Lack o
f intel
lectu
al pro
perty
protec
tion
Incr
easin
g diffi
culty
in fi
nding
qualified
per
sonnel
offshore
Legal/
contra
ctual
risks
Loss of i
nternal
capab
ilitie
s/
proce
ss kn
owledge
Cultura
l diff
eren
ces
Politica
l insta
bility
Operati
onal effi
ciency
25% most experienced firms 25% least experienced firms
Loss of m
anag
erial
contro
l
Lack o
f acc
eptan
ce fr
om cu
stom
ers
Lack o
f acc
eptan
ce
from
inter
nal cli
ents
73
39
70
5460
6460
20
54
33
52
27
43
24
394037
3236
14
35
50
35
48
3541
33
46
More experienced companies are less bothered about oversight because they have built the organizational capabilities needed to coordinate and manage globally dispersed internal processes as well as integrate captive and third-party delivery models. They have also implemented new intellectual property safeguards as they increase their presence in countries with lower standards for intellectual property rights protection. Highly experienced companies are, however, much more concerned with the conse- quences of attrition offshore.
Neither group is very concerned with the risk of wage infla-tion, most likely because both groups anticipated it as a risk go-ing in.
The curse of hidden costsMany companies do not have a solid understanding of the fol-
lowing expenses until the expansion of offshoring that usually fol-lows their initial success with the practice.
[ 186 ] offshoring in the global economy
1. Travel. In addition to the travel of those directly involved, executives must often conduct on-site visits of potential ser- vice providers offshore to see the facilities themselves.
2. Training. This can include educating boundary spanners in cross-cultural communication effectiveness.
3. Coordination. These are expenses involved in establishing a local, focused organizational entity at either a country or regional level to recruit and retain staff and oversee re-lationships with government agencies and service provid-ers.
4. Expatriate staff. Many companies feel the need to staff off-shore top and second-level management positions with ex-patriates rather than local managers for an indefinite time period or even permanently.
What can be learned from successful companies?organizations that understand and effectively implement off-
shoring share a number of attributes:
• A senior-level executive offshoring champion who receives explicit and total support from the CEo;
• Investment in the time needed to develop an offshoring op-erational plan and obtain advice from a consultant about how to construct a service provider selection model;
• Traveling to conduct regular on-site visits of offshore loca-tions and meet with service providers;
• An understanding of the core elements of a master service agreement;
• A belief in the importance of obtaining crucial internal buy-in from critical stakeholders in the organization whose professional lives might change by virtue of business process offshoring; and
• The establishment and staffing of a global corporate off- shoring resource center.
all of these qualities allow individual process owners (e. g., managers of the treasury function) to more closely focus on
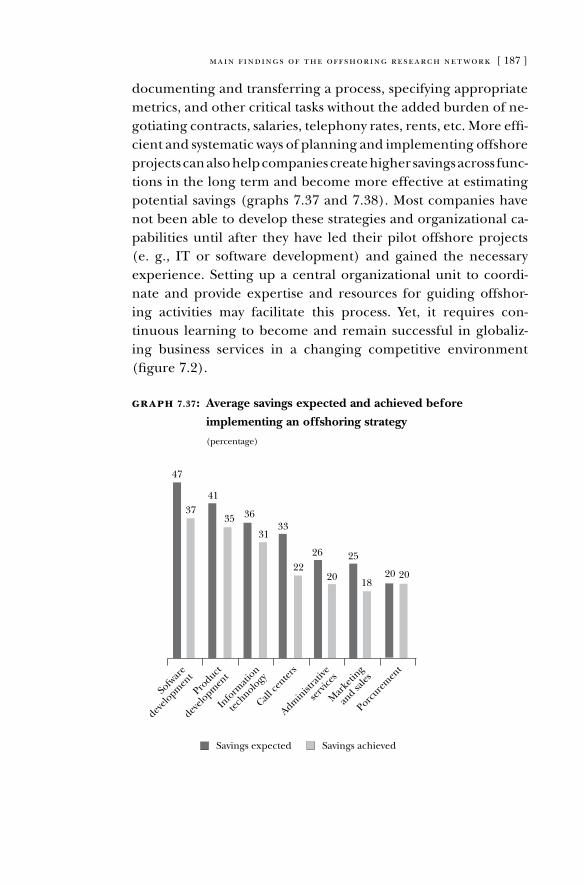
main findings of the offshoring research network [ 187 ]
documenting and transferring a process, specifying appropriate metrics, and other critical tasks without the added burden of ne-gotiating contracts, salaries, telephony rates, rents, etc. More effi-cient and systematic ways of planning and implementing offshore projects can also help companies create higher savings across func-tions in the long term and become more effective at estimating potential savings (graphs 7.37 and 7.38). Most companies have not been able to develop these strategies and organizational ca-pabilities until after they have led their pilot offshore projects (e. g., IT or software development) and gained the necessary experience. Setting up a central organizational unit to coordi-nate and provide expertise and resources for guiding offshor-ing activities may facilitate this process. yet, it requires con-tinuous learning to become and remain successful in globaliz-ing business services in a changing competitive environment (figure 7.2).
graph 7.37: Average savings expected and achieved before
implementing an offshoring strategy
(percentage)
Sofw
are
develo
pmen
t
Product
develo
pmen
t
Info
rmati
on
technolo
gy
Call ce
nters
Admin
istra
tive
serv
ices
Mar
ketin
g
and sa
les
Porcure
men
t
47
3741
35 36
3133
2226
20
25
1820 20
Savings expected Savings achieved
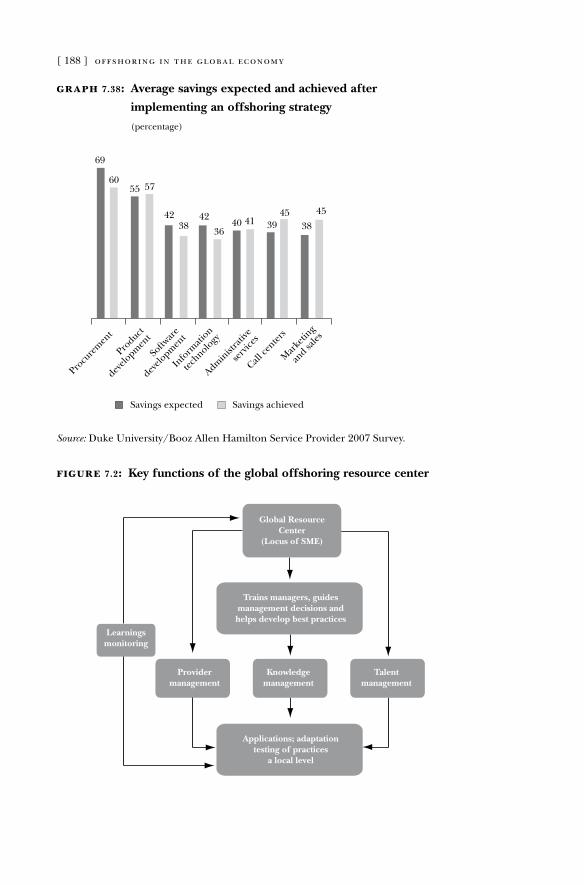
[ 188 ] offshoring in the global economy
Source: duke University/Booz allen Hamilton Service Provider 2007 Survey.
graph 7.38: Average savings expected and achieved after
implementing an offshoring strategy
(percentage)
Procu
rem
ent
Product
develo
pmen
t
Info
rmati
on
technolo
gy
Call ce
nters
Admin
istra
tive
serv
ices
Mar
ketin
g
and sa
les
Softw
are
develo
pmen
t
69
6055 57
4238
42
3640 41 39
4538
45
Savings expected Savings achieved
figure 7.2: Key functions of the global offshoring resource center
Applications; adaptationtesting of practices
a local level
Providermanagement
Knowledgemanagement
Trains managers, guidesmanagement decisions andhelps develop best practices
Learningsmonitoring
Global ResourceCenter
(Locus of SME)
Talentmanagement
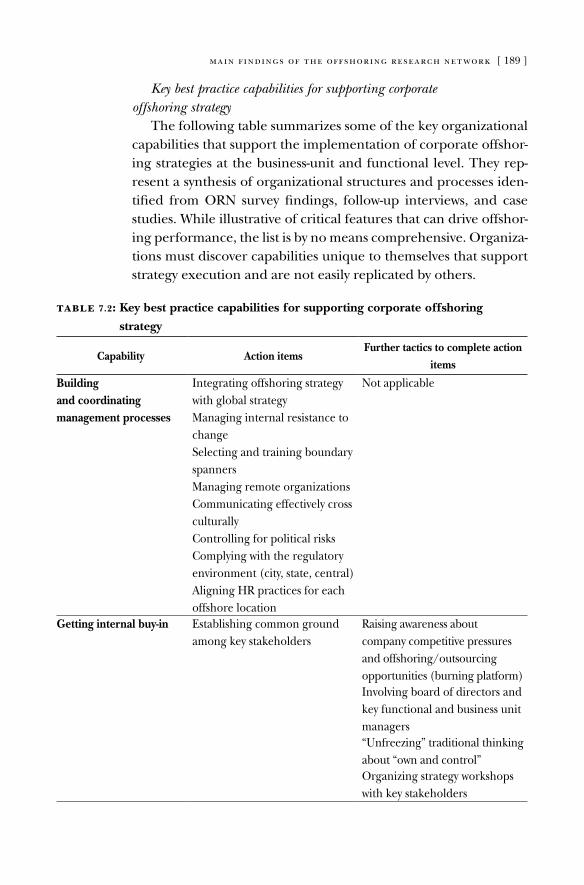
main findings of the offshoring research network [ 189 ]
Key best practice capabilities for supporting corporate offshoring strategy
The following table summarizes some of the key organizational capabilities that support the implementation of corporate offshor-ing strategies at the business-unit and functional level. They rep-resent a synthesis of organizational structures and processes iden-tified from orN survey findings, follow-up interviews, and case studies. While illustrative of critical features that can drive offshor-ing performance, the list is by no means comprehensive. organiza-tions must discover capabilities unique to themselves that support strategy execution and are not easily replicated by others.
table 7.2: Key best practice capabilities for supporting corporate offshoring
strategy
Capability Action itemsFurther tactics to complete action
items
Building and coordinating management processes
Integrating offshoring strategy with global strategyManaging internal resistance to changeSelecting and training boundary spannersManaging remote organizationsCommunicating effectively cross culturallyControlling for political risksComplying with the regulatory environment (city, state, central)aligning Hr practices for each offshore location
Not applicable
Getting internal buy-in Establishing common ground among key stakeholders
raising awareness about company competitive pressures and offshoring/outsourcing opportunities (burning platform)Involving board of directors and key functional and business unit managers“Unfreezing” traditional thinking about “own and control”organizing strategy workshops with key stakeholders
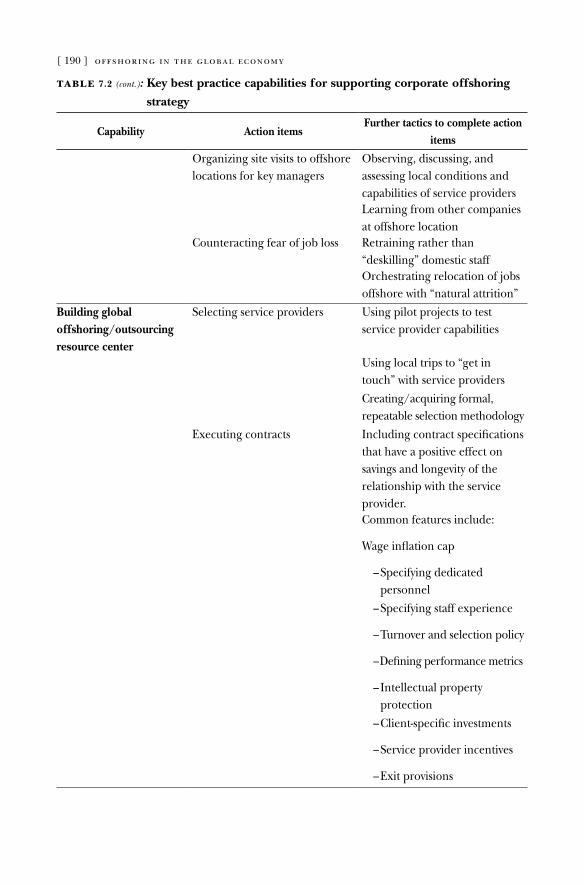
[ 190 ] offshoring in the global economy
table 7.2 (cont.): Key best practice capabilities for supporting corporate offshoring
strategy
Capability Action itemsFurther tactics to complete action
items
organizing site visits to offshore locations for key managers
observing, discussing, and assessing local conditions and capabilities of service providerslearning from other companies at offshore location
Counteracting fear of job loss retraining rather than “deskilling” domestic stafforchestrating relocation of jobs offshore with “natural attrition”
Building global offshoring/outsourcing resource center
Selecting service providers Using pilot projects to test service provider capabilities
Using local trips to “get in touch” with service providersCreating/acquiring formal, repeatable selection methodology
Executing contracts Including contract specifications that have a positive effect on savings and longevity of the relationship with the service provider.Common features include:
Wage inflation cap
– Specifying dedicated personnel
– Specifying staff experience
– Turnover and selection policy
– defining performance metrics
– Intellectual property protection
– Client-specific investments
– Service provider incentives
– Exit provisions
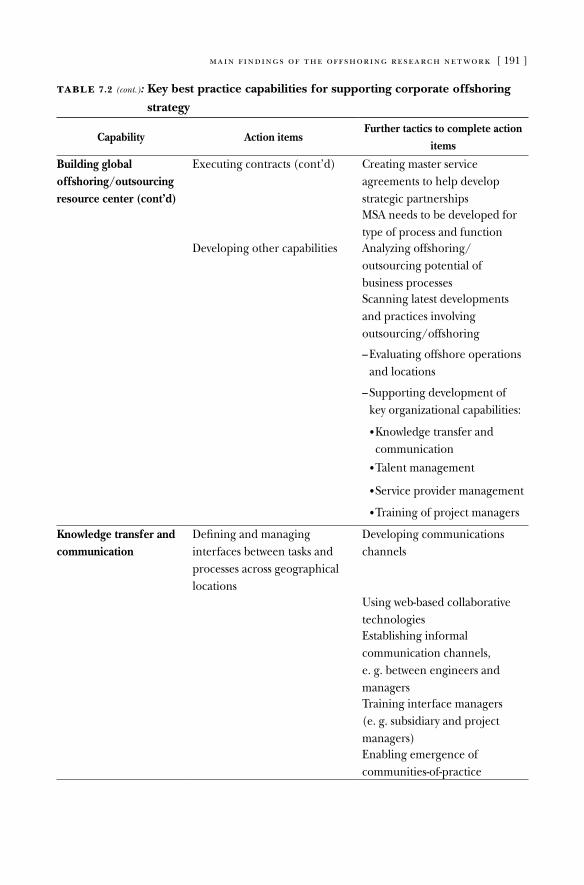
main findings of the offshoring research network [ 191 ]
table 7.2 (cont.): Key best practice capabilities for supporting corporate offshoring
strategy
Capability Action itemsFurther tactics to complete action
items
Building global offshoring/outsourcing resource center (cont’d)
Executing contracts (cont’d) Creating master service agreements to help develop strategic partnershipsMSa needs to be developed for type of process and function
developing other capabilities analyzing offshoring/outsourcing potential of business processesScanning latest developments and practices involving outsourcing/offshoring
– Evaluating offshore operations and locations
– Supporting development of key organizational capabilities:
• Knowledge transfer and communication
• Talent management
• Service provider management
• Training of project managers
Knowledge transfer and communication
defining and managing interfaces between tasks and processes across geographical locations
developing communications channels
Using web-based collaborative technologiesEstablishing informal communication channels, e. g. between engineers and managersTraining interface managers (e. g. subsidiary and project managers)Enabling emergence of communities-of-practice
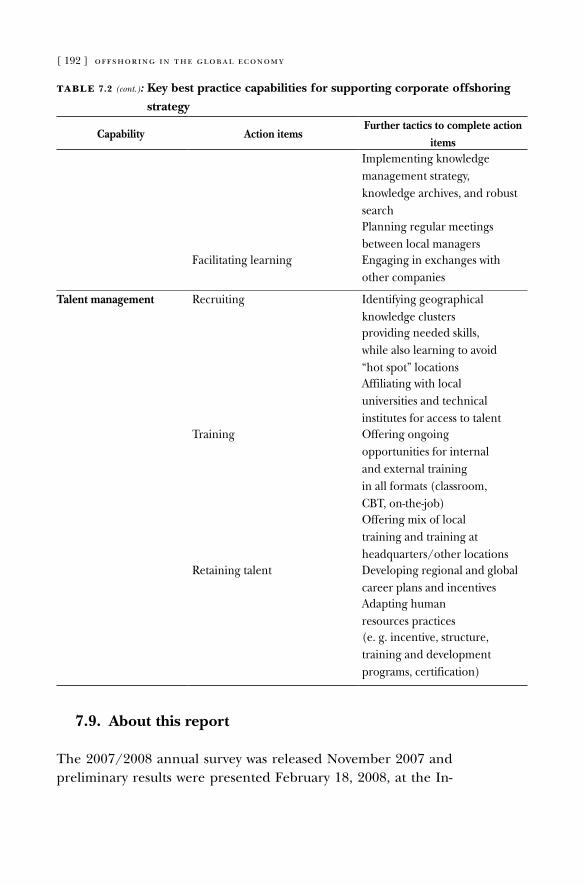
[ 192 ] offshoring in the global economy
7.9. About this report
The 2007/2008 annual survey was released November 2007 and preliminary results were presented February 18, 2008, at the In-
table 7.2 (cont.): Key best practice capabilities for supporting corporate offshoring
strategy
Capability Action itemsFurther tactics to complete action
itemsImplementing knowledge management strategy, knowledge archives, and robust searchPlanning regular meetings between local managers
Facilitating learning Engaging in exchanges with other companies
Talent management recruiting Identifying geographical knowledge clustersproviding needed skills, while also learning to avoid “hot spot” locationsaffiliating with local universities and technical institutes for access to talent
Training offering ongoing opportunities for internal and external training in all formats (classroom, CBT, on-the-job)offering mix of local training and training at headquarters/other locations
retaining talent developing regional and global career plans and incentivesadapting human resources practices(e. g. incentive, structure, training and development programs, certification)
main findings of the offshoring research network [ 193 ]
ternational association of outsourcing Professionals Conference. The final data extraction was completed June 4, 2008, and addi-tional fine-grained, cross-tabular analyses were conducted prior to the publication of this report.
The survey included respondent companies from the United States and the European Union. Copenhagen Business School (denmark), WHU University (Germany), rotterdam School of Management, Erasmus University (Netherlands), IESE (Spain), Solvay Business School (Belgium), and Manchester Business School (United Kingdom) were partner educational institutions that helped conduct the study in Europe.
The construction of the sample involved multiple strategies. over the past four years, duke orN has developed an extensive network of research participants, which was the primary source of the sample. For companies not already involved in this research, Fuqua alumni were asked to identify and solicit responses from individuals within their companies who are responsible for off-shoring strategy or for offshoring implementation. In addition, the following organizations invited their members to complete the survey:
• The Conference Board;• International Association of Outsourcing Professionals
(IaoP);• Centers for International Business Education and Research
(CIBEr);• Council for Entrepreneurial Development;• Enterprise Software Roundtable;• Information Technology Association of America (ITAA);• Software Information Industry Association.
Finally, some participants found the survey via Internet search-es. This overview was presented with the sole idea of illustrating the main concerns the entrepreneurs are now facing, both in the U.S. and Europe. Now it would be truly advantageous for our un-derstanding of the phenomenon if we turn our attention to the particular case of the U.S., this time endorsing a more rigorous methodology. We do this in the next chapter.

[ 195 ]
The rationale for Business Process offshoring: The Case of U.S. Firms, 1999–2003
BUSINESS process offshoring (BPo) refers to the recent prac-tice of firms to migrate selected ICT-enabled white-collar activities to offshore locations. What motivates firms to do so? In this chap-ter, we developed several hypotheses on the possible rationale for this type of foreign investment and tested them in a study of U.S. outward FDI in high information-intensive industries. The main findings illustrate an evolution of motivations over time. In the first offshoring wave during the 1990s efficiency-seeking was the only driver. In recent years, however, companies have begun searching for new knowledge when relocating activities to offshore destina-tions, predominantly in low-cost countries.
Companies, mainly in Western economies, have historically adopted an offshore strategy predominantly for manufacturing work and blue-collar jobs. recent advances in ICT and the re-lated decrease in telecommunication costs have significantly al-tered the competitive landscape, creating the opportunity for a novel type of offshoring (Farrell 2004). Nowadays, in fact, com-panies have the potential to relocate a number of business proc-esses throughout the world, which, until a few decades ago, were performed exclusively at home (e. g., call-center customer sup-port, transaction processing and data management) (dossani and Kenney 2006).
8.
This chapter is taken almost completely from Niccoló Pisani’s doctoral thesis: “offshoring and the global sourcing of talent: Three essays on the frontier of interna-tional management,” defended in May 2008, IESE Business School, University of Nava- rra. The author is grateful to BBVa Foundation for financial support through project grant 162/06.
[ 196 ] offshoring in the global economy
The term BPo37 refers thus to the practice of firms to migrate selected ICT-enabled white-collar activities to offshore locations (usually low cost). This migration importantly differs from the pre-vious manufacturing-oriented wave of internationalization. It re-quires the organizational and technological ability to orchestrate a geographically dispersed network of not only blue-collar jobs but also white-collar highly-skilled activities (doh 2005; levy 2005; Venkatraman 2004). This new kind of offshoring can be still con-sidered a nascent phenomenon, as the proportion of actual versus potential offshored business processes remains small (agrawal, Far-rell and remes 2003). Nevertheless, the forecasted future impact of offshoring on the global realignment of jobs (doh 2005; Kar-markar 2004) urges us to investigate it thoroughly.
In this chapter, we focused on a particular aspect of BPo: its rationale. In other words, we concentrate on the motivations that drive firms to relocate selected business processes to offshore lo-cations. More specifically, we examine whether such motivations have changed over time and whether they vary depending on the industry of the offshoring company and the selected country of destination. In building the hypotheses related to BPo motivations and their potential variations, we drew insights from international business theory on the rationale for foreign investment (Behr- man 1974; Chung and alcacer 2002; dunning 1993; Graham 1998; Kobrin 1991; Kuemmerle 1999; Zaheer and Manrakhan 2001). a primary concern in international management research has always been to investigate the motivations for firms to expand internationally (dunning 1993). Understanding the drivers be-hind any kind of international activity is essential to appreciate the activity’s peculiarities, model it, and offer a better prediction on its future evolution. This is particularly relevant for the case of BPo, a rising phenomenon that still has little theoretical explana-tion, especially with regard to its current evolution and its future consequences on the organization of corporations.
This study contributes to the existing literature on two lev-els. First, we examined whether motivations behind BPo have
37 BPo generally stands for business process outsourcing. However, given the objec-tive and focus of this paper, here it stands for business process offshoring.
the rationale for business process offshoring [ 197 ]
changed over time. While previous studies addressing the ratio- nale behind BPo did not provide a thorough analysis on its po-tential time variation, this chapter offers a complete examination of the BPo rationale over the past decade, highlighting changes over time. The second contribution is related to the focus on the variation in BPo motivations across industries and countries. The inclusion of these variables markedly improves our understanding of the BPo phenomenon and of its peculiarities with respect to previous waves of internationalization. our findings confirm the relevance of including these motivations, and provide an insight-ful interpretation of how companies use offshoring solutions.
We tested our hypotheses as described below. For the study of the variation of BPo motivations over time, we used more recent data (1999–2003) to reproduce the same empirical specification developed by Nachum and Zaheer (2005). These two researchers examined how variations in the cost of distance due to techno-logical developments affected U.S. firms’ rationale for foreign in-vestment in high information-intensive industries during the pe-riod 1990–1998. Their findings provide a detailed analysis on the key drivers behind BPo in the 1990s with regard to U.S. outward FDI in high information-intensive industries. By replicating the Nachum and Zaheer model with a more recent pool of informa-tion from the same source, we can compare results across the two studies and identify variations over time. In this way, we provide a complete longitudinal analysis of BPo motivations over a signifi-cant time period. For the second part of our research on possible variations across industries and countries, we tested an improved version of the Nachum and Zaheer model (2005) on the more recent dataset, and included additional variables to account for industry and country variations.
The results provide substantial corroborating evidence that ef-ficiency seeking continues to be a key driver for BPo. as already shown by Nachum and Zaheer (2005), the search for efficiency and cost minimization is the main raison d'être of migrating ICT-enabled business processes to offshore locations. However, while the 1990–1998 Nachum and Zaheer (2005) study was only able to empirically prove that efficiency seeking was the relevant mo-tivation, the refined model in the 1999–2003 panel revealed that
[ 198 ] offshoring in the global economy
knowledge seeking is also a significant motivation behind the deci-sion to offshore business processes. This important empirical finding suggests that an evolution in motivations for pursuing offshoring initiatives is taking place. While the initial wave of off-shoring documented by Nachum and Zaheer (2005) was charac-terized by a narrow cost-cutting perspective strictly in line with an efficiency-seeking motivation, the current wave is also increasingly driven by the search for new knowledge-intensive resources (Far-rell 2004; lewin and Peeters 2006a). as for the variation of BPo motivations across industries and countries, the usage of the re-fined model confirms the relevance of including these additional motivations, as they shed light on other aspects of BPo. The re-sults show that efficiency seeking matters only to service-oriented industries, while knowledge seeking becomes significant only when the offshoring investment is directed to low-cost countries.
The global redistribution of labor shepherded through BPo significantly differs from any other previous wave of internation-alization that the international research community has studied. This study illustrates some of BPo’s novel elements by providing a rigorous conceptualization of its rationale, its particular evolu-tion over time, and its variation across industries and countries. In section 8.1, we develop hypotheses on BPo motivations and its key variations. Next, we discuss the methods and results. Finally, we highlight the major findings, discuss future research, and form conclusions.
8.1. Development of hypotheses
The objective of this chapter is to develop and test a number of hypotheses on the current rationale for BPo and how it varies across industries and countries. The primary concern in FDI re-search has always been to investigate the motivations for firms to expand internationally (dunning 1993). Scholars have identified five major motivations that drive firms to initiate international in-vestments: resource seeking, market seeking, efficiency seeking, knowledge seeking and competitive pressure (Nachum and Za-heer 2005). resource and market seeking can be contextualized
the rationale for business process offshoring [ 199 ]
as the more traditional motivations behind the first wave of inter-nationalization that primarily interested manufacturing activities (Venkatraman 2004). as transportation infrastructures improved in an economy where the key determinant of success was the own-ership of tangible assets, companies began expanding abroad in search, on one hand, for physical, immobile resources that were either missing or too expensive in their home countries and, on the other hand, for new markets to produce and sell their prod-ucts (dunning 1993).
Transnational intra-firm integration was subsequently rec-ognized as a potential source for competitive advantage (Fayer- weather 1969), leading to efficiency seeking being increasing cited as a possible alternative motivation for foreign investments (Kobrin 1991). Focusing instead on the strategic interdepend-ence of firms, other researchers emphasized the role of external competitive pressures as determinants for international expansion (Graham 1998; Knickerbocker 1973; yu and Ito 1988). The more recent maturation of the knowledge-based economy (dunning 2000), together with the theoretical recognition of knowledge as a key determinant for the very existence of the multinational firm (Kogut and Zander 1993; Santos, doz and Williamson, 2004), has led to an increasing number of studies showing that the search for new capabilities can also significantly motivate FDI (Chung and alcacer 2002; Kuemmerle 1999).
In light of this literature, we will develop hypotheses related to these five foreign investment motivations. The first five hypoth-eses will focus on the motivations behind the current BPo wave of internationalization. The other two will investigate how such motivations vary depending on the industry and the offshore des-tination selected.
Resource seekingInternational expansion driven by the resource-seeking moti-
vation is designed to gain access to natural resources such as min-erals, land or agricultural products (dunning 2000). It is a supply-oriented investment, as its underlying rationale is to have access to tangible resources that are either missing or too expensive in the home country. The resource’s immobility makes it necessary
[ 200 ] offshoring in the global economy
to invest in the foreign country in order to access them (dun-ning 1993). From relocating basic contact centers to migrating the firm’s more complex activities, firms investing in BPo are not driven by the simple quest for tangible resources that are lacking at home. as we will formally argue later on, in today’s knowledge economy it is a host country’s cultivated endowment that attracts BPo investments and not its supply of natural resources. Thus, we posit:
Hypothesis 1. Resource seeking is not a significant motivation for business process offshoring.
Market seekingWhile investment in resource seeking is supply oriented, market
seeking motivates a demand-oriented foreign investment (dun-ning 2000). Market-seeking investments are actually designed to serve a foreign market by means of local production and/or distri-bution. Thus, they typically involve “the physical location of down-stream (e. g., marketing) and, in some cases, production activities in a particular country” (Zaheer and Manrakhan 2001, 673).
demand-oriented foreign investment is driven by three main reasons (Nachum and Zaheer 2005), none of which are relevant to BPo. The first deals with market failures, for example, high tar-iff barriers on foreign-made goods. In order to avoid these tariffs, firms interested in entering a foreign market may be driven to invest in local activities. With regard to BPo, government inter-vention has had very little impact on market failure. on the con-trary, several emerging countries are actually competing among themselves in order to attract offshoring initiatives from foreign companies by investing in education and training and by trying to create local clusters specialized in specific offshoring activities (Farrell 2006; lewin and Peeters 2006a). The second reason for demand-oriented foreign investment is cost reduction, especially in transportation, which can motivate firms to invest in foreign ac-tivities closer to the targeted markets. as a matter of fact, BPo has arisen specifically as a consequence of the plummeting transpor-tation costs thanks to information digitization; thus the need to reduce this type of costs cannot be a motivation. The third reason
the rationale for business process offshoring [ 201 ]
is the need for physical proximity to actual and potential custom-ers, which can drive firms to invest in foreign local presence in order to acquire better customer knowledge and provide a more responsive after-sales service (Nachum and Zaheer 2005; Zaheer and Manrakhan 2001). This reason does not play a role in the de-cision to invest in BPo. In fact, the countries where business proc-esses are being offshored are generally not the final targets for their products or services. Instead, such a practice is often respon-sible for certain activities to migrate away from final customers towards far-off locations that offer more competitive solutions for their efficient processing (Zaheer and Manrakhan 2001). Thus, we posit:
Hypothesis 2. Market seeking is not a significant motivation for business process offshoring.
Efficiency seeking“Efficiency-seeking investment is driven by the intention to
spread value-adding activities geographically in order to take ad-vantage of differences in the availability and cost of factor endow-ments in different locations” (Nachum and Zaheer 2005, 750). accordingly, efficiency seeking entails the disaggregation of the value chain and the relocation of individual activities to where they can be most efficiently executed (Buckley and Mucchieli 1997; leamer and Storper 2001). Such a globally dispersed network of highly interconnected capabilities and relationships (Venkatra-man 2004) can represent an economically viable option for com-panies only if its coordination costs do not outweigh the savings that can be achieved by this more efficient global redistribution of labor. recent ICT progress has precisely lowered such coordina-tion costs, vastly increasing the potential for local specialization of value-adding activities (Zaheer and Manrakhan 2001). This is especially true for high information-intensive industries, where companies are most active in implementing offshoring strategies. In such industries both input and output can now be “transferred rapidly and reliably at negligible cost between distant locations, enabling firms to coordinate and control their geographically dis-persed activities more effectively” (Nachum and Zaheer 2005, 751).
[ 202 ] offshoring in the global economy
BPo has thus emerged as a strategic and economically viable al-ternative for firms to redistribute their activities more efficiently on a global scale. recent survey-based studies confirm that the quest for superior efficiency and cost reduction is a key driver for BPo investments (agrawal et al. 2003; lewin and Peeters 2006a). Thus, we posit:
Hypothesis 3. Efficiency seeking is a significant motivation for business process offshoring.
Knowledge seekingFirms investing abroad who are motivated by knowledge seeking
are in search of new resources that allow them to upgrade their own existing pool of capabilities. Thus, such firms will value locations close to potentially interesting knowledge sources. Such locations generally offer more technical activity, highly-skilled labor, patent generation or r&d intensity (Chung and alcacer 2002; Kuemmer-le 1999). local foreign presence is required in these cases because part of the knowledge source is tacit and difficult to codify and thus in order to be accessed needs close and frequent interactions (Kogut and Zander 1993; Martin and Salomon 2003).
Initially, BPo was not driven by the quest for new knowledge. Companies started offshoring simple and codifiable business processes with a relatively low degree of knowledge intensity (e. g., data entry and transaction processing). However, in response to the high quality of the work in the offshore locations, companies quickly began to also offshore high-skilled knowledge-intensive ac-tivities such as r&d and engineering to low-wage countries (Far-rell 2004; lewin and Peeters 2006a). In consideration of this rapid evolution and given that a certain degree of knowledge intensity is by definition always present in any of the white-collar business processes offshored (dossani and Kenney 2003), in particular in those high information-intensive industries where knowledge re-sources have replaced tangible assets as the most critical resource (Nachum and Zaheer 2005), we posit:
Hypothesis 4. Knowledge seeking is a significant motivation for business process offshoring.
the rationale for business process offshoring [ 203 ]
Competitive pressureCompanies can also decide to expand abroad as a response to
competitors’ moves. The decision to imitate a competitor’s for-eign investment strategy can be generally explained as an effort not to lose sight of rival activities and thus to hinder their access to new markets and/or low-cost resources (Graham 1998; Karnani and Wernerfelt 1985; Knickerbocker 1973). Competitors follow-ing industry pioneers in foreign market entry can also take ad-vantage of the valuable information generated by a similar firm’s initial expansion. The understanding of potential opportunities and threats in the host market emerges as especially valuable in those rapidly changing environments characterized by high levels of uncertainty (Head, Mayer and ries 2002; Martin, Swaminathan and Mitchell 1998; Nachum and Zaheer 2005). The high informa-tion-intensive industries where BPo is currently taking place are undoubtedly representative of these uncertain competitive arenas (Karmarkar 2004) and therefore are appropriate backdrops for considering competitive pressure. Thus, we posit:
Hypothesis 5a. Competitive pressure is a significant motivation for business process offshoring.
However, there seems to be a market attractiveness constraint on the number of firms that are likely to imitate industry pioneers in foreign expansion activities (Martin et al. 1998). as the number of domestic competitors that invest in a host country increases, the level of competition also increases, thus making potential en-try less attractive. Studies on this matter have reported a wave-like pattern, with the number of new entrants first increasing and then decreasing as more domestic competitors expand (Knickerbocker 1973; Martin et al. 1998; yu and Ito 1988). This is particularly ap-plicable to the offshoring phenomenon. offshoring pioneers of the early 1990s such as General Electric and British airways lo-cated their activities in a handful of cities with optimal conditions for taking advantage of a high-skilled low-wage pool of workers. once realizing the cost advantages of this strategy, competitors soon began investing in the same cities and regions. The recent overheating of these few very popular offshoring destinations
[ 204 ] offshoring in the global economy
(e. g., Hyderabad, Bangalore, and delhi) is turning them into less attractive offshore locations characterized by escalating wages and accelerating turnovers. as a consequence, companies are now starting to invest in new areas such as South africa and Brazil, where better conditions and less local competitive pressures exist (Farrell 2006). Thus, we argue:
Hypothesis 5b. The relationship between the competitive pressure motivation and the business process offshoring intensity is U inverted.
8.2. Industry and country impact on BPO rationale
The five hypotheses offered so far investigate the specific ratio- nale for investing abroad using a BPo strategy. The main argument is that the mix of motivations behind this innovative kind of for-eign investment is different from the one characterizing previous waves of internationalization, and thus requires specific treatment in the literature. The objective of this subsection is to take our knowledge of BPo motivations one step further, by investigating whether BPo motivations are influenced by a set of key variables. This kind of analysis has already been considered for other types of international expansion. Several other studies have investigat-ed the similarities that are relevant in predicting behavior across firms following the same foreign investment strategy. results have shown, for example, that companies belonging to the same busi-ness groups tend to invest in the same region (Chang 1995; Guil-len 2002), or that firms in the same industry tend to share the same foreign expansion strategy (Martin et al. 1998). at the coun-try level, research has shown that the relative strength and inten-sity of the science industry in both the home and host countries influence the foreign investment decision and the firm’s motiva-tion to either try to exploit existing firm-specific advantages or try to create new ones (Chung and alcacer 2002; Kuemmerle 1999).
For the aim of this study, it is therefore relevant to present fur-ther variables in order to offer a thorough analysis of the motiva-tions that drive BPo investments. Using this logic, there are two characteristics that are often cited as defining attributes of the
the rationale for business process offshoring [ 205 ]
BPo phenomenon and that must be taken into account when ar-guing about the motivations behind offshoring. The first is the predominance of BPo in service sectors. BPo is clearly of interest to service firms. This is so because recent ICT progress has en- abled the creation of authentic global information assembly lines where information can be conveniently and efficiently standard-ized, stored, sent, and produced in remote locations. This has given companies the opportunity to reconfigure entire processes behind their services. Examples of these radical reconfigurations range from the diagnostic imaging to the packaged software in-dustries (dossani and Kenney 2006; Karmarkar 2004). Therefore, building on the previous hypotheses that identified the search for efficiency and knowledge as the two key motivations behind BPo, we posit:
Hypothesis 6. Service-oriented firms, in contrast to manufacturing-oriented firms, offshore more and have a stronger focus on efficiency and knowledge seeking when relocating business processes.
The second defining attribute of BPo is the selection of low-cost countries as destinations for their offshored activities. as an example, India is currently the leading recipient of offshored ser- vice jobs (dossani and Kenney 2007; lewin and Peeters 2006a). Thanks to its developed software sector, its relatively favorable regulatory and institutional environment, and the presence of a vast pool of well-educated English-speaking labor force, India has been the preferred and most competitive destination for the relo-cation of service work abroad (dossani and Kenney 2007; lewin and Peeters 2006a). lower labor costs continue to be the major driver behind BPo. Following this same logic, India, China, the Philippines and latin america currently represent the major sup-pliers of low-cost white-collar workers. Nonetheless, it is worth stressing that data preparation and information processing com-moditized in the global information assembly line are not the only processes being offshored. recent research shows that knowledge-intensive activities are also being relocated to offshore locations such as India and China (dossani and Kenney 2007; lewin and Peeters 2006a). Therefore, we posit:
[ 206 ] offshoring in the global economy
Hypothesis 7. Firms offshore more to low-cost countries and have a stronger focus on efficiency and knowledge seeking when relocating business processes there.
8.3. Methods
We employed a few different methods to test the hypotheses. For the first five hypotheses, we replicated the same empirical specifi-cation developed by Nachum and Zaheer (2005) using more re-cent data (1999–2003). The two researchers previously used pan-el data from 1990–1998 to examine how variation in the cost of distance due to technological developments affected U.S. firms’ rationale for foreign investment in high information-intensive in-dustries. We replicated their work for two main reasons. First, they developed a sound methodology to identify the motivations for BPo, which can be appropriately related to the U.S. outward FDI flow in high information-intensive industries. Second, the replica-tion allows a comparison between the two studies to thoroughly analyze how BPo motivations have changed over time.
For the last two hypotheses, which consider industry and coun-try characteristics, we developed an improved version of the model used for the first part of the analysis and tested it using the 1999–2003 dataset. Since we replicated a previous study (Nachum and Zaheer 2005) for the first part of the analysis, we closely followed their methodology used for determining the setting and for constructing the variables. We will thus refer to their work each time we make use of concepts and assumptions formulated in their research.
8.4. Setting and data source
To create the dataset, we concentrated on information on the FDI of U.S. firms collected by the Bureau of Economic analysis (Nachum and Zaheer 2005). american firms are a suitable empirical context because in 2003 they accounted, together with British firms, for about 70 percent of the global business process offshoring market (agrawal et al. 2003). For the analysis we used outward FDI, which
the rationale for business process offshoring [ 207 ]
corresponds to U.S. controlling equity investments in foreign es-tablishments. although BPo also takes place through offshore out-sourcing (dutta and roy 2005), the issue of restricting the study to FDI as foreign investment, because of data availability, does not seem to harm the generalizability of the findings. In fact, the majority of BPo implementations are run as captive centers owned by investing U.S. firms (dossani and Kenney 2003; lewin and Peeters 2006a).
The time range selected for the study is 1999–2003. The most recent year for which data was provided at the time of the analysis is 2003. In addition, 1999 is the first year that annual and benchmark survey data on U.S. direct investment abroad were collected using the new North american Industry Classification System (NaICS), which has supplanted the 1987 Standard Industrial Classification (SIC). The usage of data based on NaICS is especially appealing for this study, as its introduction theoretically provides a better reflection of new and emerging industries, such as those involved in the creation and handling of advanced technologies (U.S. Bureau of Economic analysis 2004), which emerge as determinant for BPo. The data are collected at the industry level and majority-owned (i. e., more than 50 percent owned) non-bank affiliates of non-bank U.S. parents are used for the analysis. The combined number of observations of the panel is 100, that is, 20 industries observed over five years.
We should further explain the reasoning behind using indus-try-level data for exploring the motivations for what is fundamen-tally a firm-level decision, namely the choice of pursuing a foreign investment through BPo. While it is clear that there are firm-level heterogeneities that influence the decision to initiate BPo activi-ties, it is also true that many of them can be captured at the industry- level, in consideration of the many similarities that characterize firms belonging to the same industry. Hence, industry averages can meaningfully “correspond to a ‘representative’ firm in the in-dustry” (Nachum and Zaheer 2005, 753).
8.5. Industry selection
BPo is mostly of interest to high information-intensive industries. It is predominantly in such industries where, thanks to recent ICT
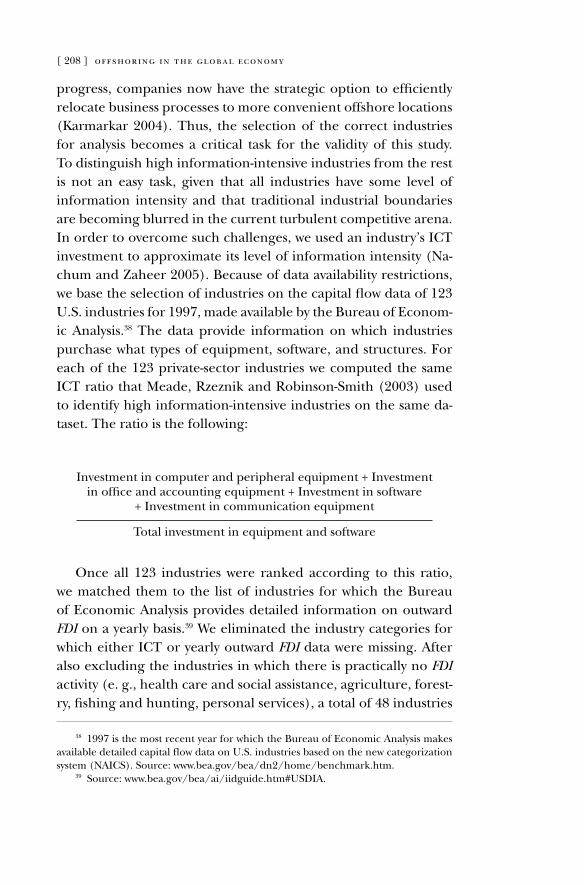
[ 208 ] offshoring in the global economy
progress, companies now have the strategic option to efficiently relocate business processes to more convenient offshore locations (Karmarkar 2004). Thus, the selection of the correct industries for analysis becomes a critical task for the validity of this study. To distinguish high information-intensive industries from the rest is not an easy task, given that all industries have some level of information intensity and that traditional industrial boundaries are becoming blurred in the current turbulent competitive arena. In order to overcome such challenges, we used an industry’s ICT investment to approximate its level of information intensity (Na-chum and Zaheer 2005). Because of data availability restrictions, we base the selection of industries on the capital flow data of 123 U.S. industries for 1997, made available by the Bureau of Econom-ic analysis.38 The data provide information on which industries purchase what types of equipment, software, and structures. For each of the 123 private-sector industries we computed the same ICT ratio that Meade, rzeznik and robinson-Smith (2003) used to identify high information-intensive industries on the same da-taset. The ratio is the following:
Investment in computer and peripheral equipment + Investment in office and accounting equipment + Investment in software
+ Investment in communication equipment
Total investment in equipment and software
once all 123 industries were ranked according to this ratio, we matched them to the list of industries for which the Bureau of Economic analysis provides detailed information on outward FDI on a yearly basis.39 We eliminated the industry categories for which either ICT or yearly outward FDI data were missing. after also excluding the industries in which there is practically no FDI activity (e. g., health care and social assistance, agriculture, forest-ry, fishing and hunting, personal services), a total of 48 industries
38 1997 is the most recent year for which the Bureau of Economic analysis makes available detailed capital flow data on U.S. industries based on the new categorization system (NaICS). Source: www.bea.gov/bea/dn2/home/benchmark.htm.
39 Source: www.bea.gov/bea/ai/iidguide.htm#USdIa.
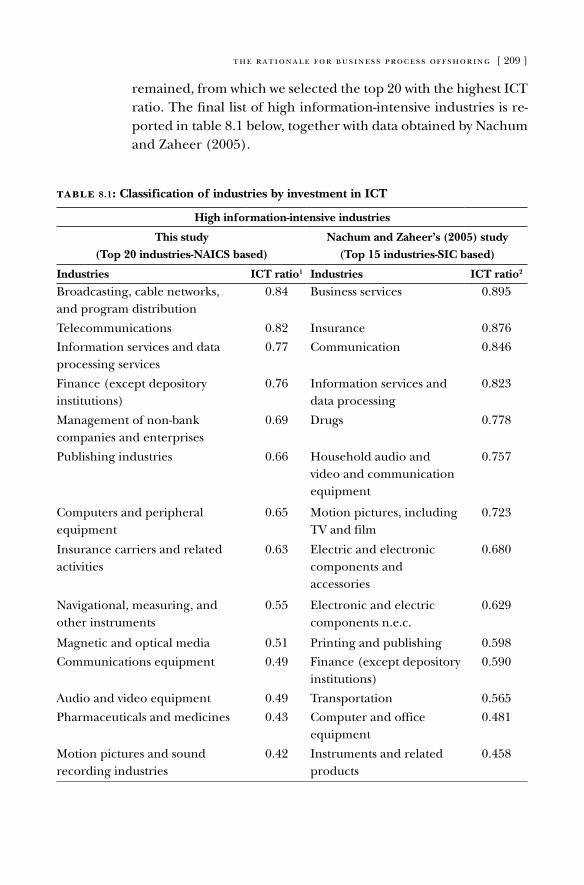
the rationale for business process offshoring [ 209 ]
remained, from which we selected the top 20 with the highest ICT ratio. The final list of high information-intensive industries is re-ported in table 8.1 below, together with data obtained by Nachum and Zaheer (2005).
table 8.1: Classification of industries by investment in ICT
High information-intensive industries
This study(Top 20 industries-NAICS based)
Nachum and Zaheer’s (2005) study(Top 15 industries-SIC based)
Industries ICT ratio1 Industries ICT ratio2
Broadcasting, cable networks, and program distribution
0.84 Business services 0.895
Telecommunications 0.82 Insurance 0.876
Information services and data processing services
0.77 Communication 0.846
Finance (except depository institutions)
0.76 Information services and data processing
0.823
Management of non-bank companies and enterprises
0.69 drugs 0.778
Publishing industries 0.66 Household audio and video and communication equipment
0.757
Computers and peripheral equipment
0.65 Motion pictures, including TV and film
0.723
Insurance carriers and related activities
0.63 Electric and electronic components and accessories
0.680
Navigational, measuring, and other instruments
0.55 Electronic and electric components n.e.c.
0.629
Magnetic and optical media 0.51 Printing and publishing 0.598
Communications equipment 0.49 Finance (except depository institutions)
0.590
audio and video equipment 0.49 Transportation 0.565
Pharmaceuticals and medicines 0.43 Computer and office equipment
0.481
Motion pictures and sound recording industries
0.42 Instruments and related products
0.458
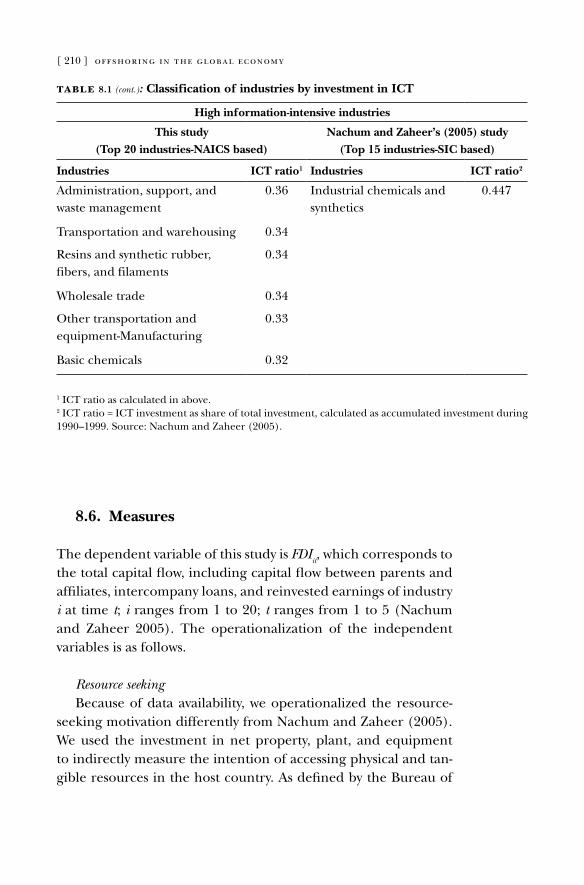
[ 210 ] offshoring in the global economy
8.6. Measures
The dependent variable of this study is FDIit, which corresponds to
the total capital flow, including capital flow between parents and affiliates, intercompany loans, and reinvested earnings of industry i at time t; i ranges from 1 to 20; t ranges from 1 to 5 (Nachum and Zaheer 2005). The operationalization of the independent variables is as follows.
Resource seekingBecause of data availability, we operationalized the resource-
seeking motivation differently from Nachum and Zaheer (2005). We used the investment in net property, plant, and equipment to indirectly measure the intention of accessing physical and tan-gible resources in the host country. as defined by the Bureau of
table 8.1 (cont.): Classification of industries by investment in ICT
High information-intensive industries
This study(Top 20 industries-NAICS based)
Nachum and Zaheer’s (2005) study(Top 15 industries-SIC based)
Industries ICT ratio1 Industries ICT ratio2
administration, support, and waste management
0.36 Industrial chemicals and synthetics
0.447
Transportation and warehousing 0.34
resins and synthetic rubber, fibers, and filaments
0.34
Wholesale trade 0.34
other transportation and equipment-Manufacturing
0.33
Basic chemicals 0.32
1 ICT ratio as calculated in above.2 ICT ratio = ICT investment as share of total investment, calculated as accumulated investment during 1990–1999. Source: Nachum and Zaheer (2005).
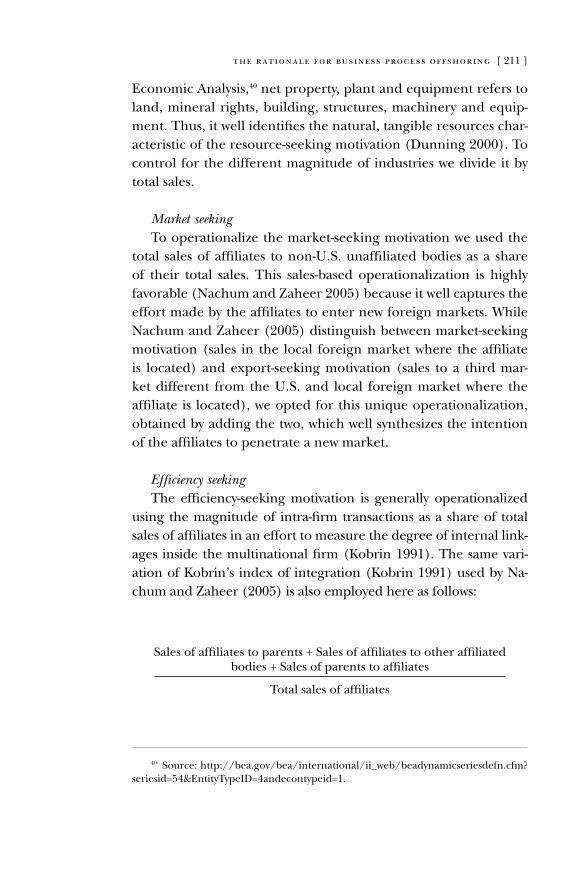
the rationale for business process offshoring [ 211 ]
Economic analysis,40 net property, plant and equipment refers to land, mineral rights, building, structures, machinery and equip-ment. Thus, it well identifies the natural, tangible resources char-acteristic of the resource-seeking motivation (dunning 2000). To control for the different magnitude of industries we divide it by total sales.
Market seekingTo operationalize the market-seeking motivation we used the
total sales of affiliates to non-U.S. unaffiliated bodies as a share of their total sales. This sales-based operationalization is highly favorable (Nachum and Zaheer 2005) because it well captures the effort made by the affiliates to enter new foreign markets. While Nachum and Zaheer (2005) distinguish between market-seeking motivation (sales in the local foreign market where the affiliate is located) and export-seeking motivation (sales to a third mar-ket different from the U.S. and local foreign market where the affiliate is located), we opted for this unique operationalization, obtained by adding the two, which well synthesizes the intention of the affiliates to penetrate a new market.
Efficiency seekingThe efficiency-seeking motivation is generally operationalized
using the magnitude of intra-firm transactions as a share of total sales of affiliates in an effort to measure the degree of internal link-ages inside the multinational firm (Kobrin 1991). The same vari-ation of Kobrin’s index of integration (Kobrin 1991) used by Na-chum and Zaheer (2005) is also employed here as follows:
Sales of affiliates to parents + Sales of affiliates to other affiliated bodies + Sales of parents to affiliates
Total sales of affiliates
40 Source: http://bea.gov/bea/international/ii_web/beadynamicseriesdefn.cfm?seriesid=54&EntityTypeId=4andecontypeid=1.
[ 212 ] offshoring in the global economy
Knowledge seekingas in the study of Nachum and Zaheer (2005), the knowledge-
seeking motivation is operationalized using two measures:
1. The level of compensation per employee. The argument generally cited here is that high salaries correspond to a re-liance on highly skilled workers. Thus, we used the average compensation per employee across all countries (Nachum and Zaheer 2005).
2. r&d intensity, obtained dividing the r&d investment of af-filiates by their total sales. This type of operationalization has been extensively used in extant research to estimate the search of knowledge in foreign locations (Chung and al-cacer 2002).
While the second measure seems to be a reliable predictor of the role of knowledge seeking as a driver behind the offshor-ing investment (Chung and alcacer 2002), the first presents a major problem. The assumption that more skilled employees are paid more than less skilled employees makes sense. How-ever, the measure used does not include any consideration of the major differences across average salaries paid to similar em-ployees in different offshore regions. In other words, while U.S. $40,000 could be a high salary for an Indian engineer working in Bangalore, the same wage would be considered very low by a German engineer working on similar tasks in Munich. Thus, the simple inclusion of average salaries paid abroad by U.S. companies without including purchasing power considerations does not help identify the search for highly skilled employees. on the contrary, it can be better interpreted as an estimate for the efficiency-seeking motivation, for which the lower the wages paid in host countries, the more cost considerations drive BPo investment. That said, we decided to include both operationali-zations of the knowledge-seeking motivations in order to prop-erly replicate Nachum and Zaheer’s (2005) work. later, in the discussion on the significance of the corresponding coefficients, we will return to these considerations in order to properly inter-pret the findings.
the rationale for business process offshoring [ 213 ]
Competitive pressureTo account for the role of competitive pressure as a possible de-
terminant of BPo activities we used the same measures employed by Nachum and Zaheer (2005). Thus, we used the number of new affiliates entering foreign markets each year, expressed as a share of the total number of affiliates in an industry; we also included the quadratic form of this measure to account for the nonlinear relationship previously hypothesized.
When refining the Nachum and Zaheer (2005) model, we made use of the following two measures.
Service orientationTo account for the service orientation of the affiliates we creat-
ed a dummy with the following tenet. Industries whose proportion of sales of services over total sales was at least 50 percent scored 1 on the dummy. all of the others, which thus sell more goods than services, scored 0.
Country destinationTo investigate where offshored business processes are being relo-
cated we created the following dummy. Industries which sold at least 25 percent of their services from low-cost countries scored 1 on the dummy, while all others scored 0. Given the availability of data pro-vided by the Bureau of Economic analysis, we considered sales com-ing from low-cost countries if they were made from the asian Pacific area (excluding australia and Japan), Brazil, Mexico or africa.
We also included a series of control variables, following the Na-chum and Zaheer (2005) model.
Ownership advantagesThe advantages specific to the ownership of the enterprise
seeking to engage in FDI are determinant when analyzing the pro-pensity of certain firms relative to others to engage in internation-al expansion (dunning 2000). We used profitability to estimate the ownership of such advantages.
Size and growthExtant research confirms that both size and growth influence
FDI flow (Grubaugh 1987). We measured size by the number of
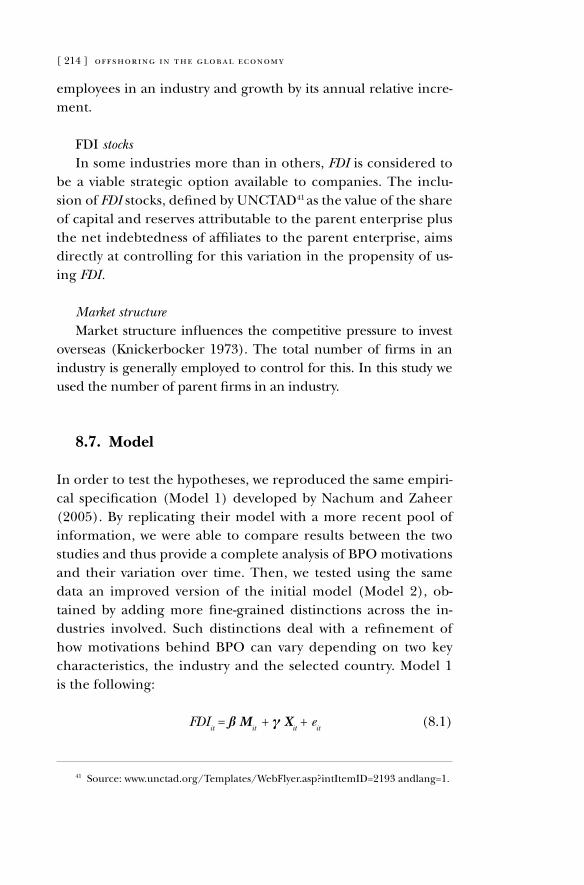
[ 214 ] offshoring in the global economy
employees in an industry and growth by its annual relative incre-ment.
FdI stocksIn some industries more than in others, FDI is considered to
be a viable strategic option available to companies. The inclu-sion of FDI stocks, defined by UNCTad41 as the value of the share of capital and reserves attributable to the parent enterprise plus the net indebtedness of affiliates to the parent enterprise, aims directly at controlling for this variation in the propensity of us-ing FDI.
Market structureMarket structure influences the competitive pressure to invest
overseas (Knickerbocker 1973). The total number of firms in an industry is generally employed to control for this. In this study we used the number of parent firms in an industry.
8.7. Model
In order to test the hypotheses, we reproduced the same empiri-cal specification (Model 1) developed by Nachum and Zaheer (2005). By replicating their model with a more recent pool of information, we were able to compare results between the two studies and thus provide a complete analysis of BPo motivations and their variation over time. Then, we tested using the same data an improved version of the initial model (Model 2), ob-tained by adding more fine-grained distinctions across the in-dustries involved. Such distinctions deal with a refinement of how motivations behind BPo can vary depending on two key characteristics, the industry and the selected country. Model 1 is the following:
FDIit = ß M
it + γ X
it + e
it (8.1)
41 Source: www.unctad.org/Templates/WebFlyer.asp?intItemId=2193 andlang=1.
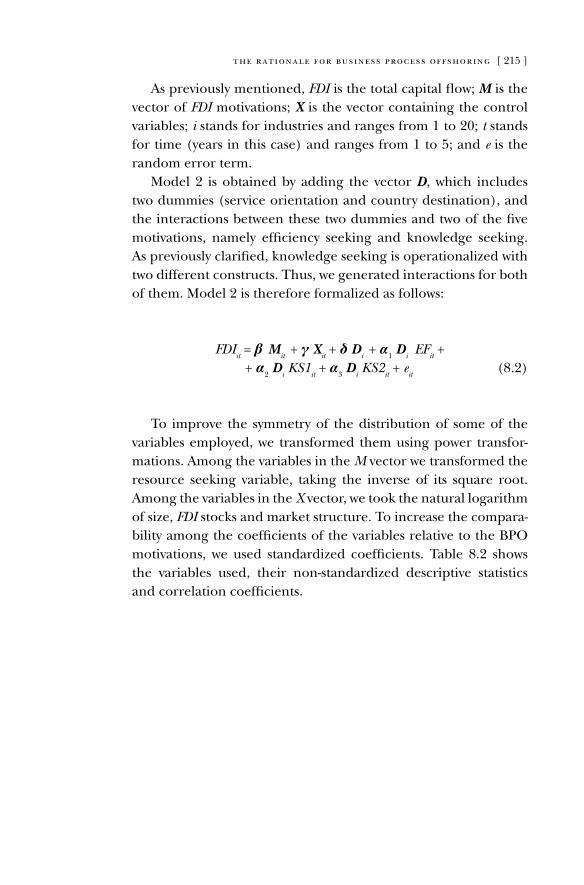
the rationale for business process offshoring [ 215 ]
as previously mentioned, FDI is the total capital flow; M is the vector of FDI motivations; X is the vector containing the control variables; i stands for industries and ranges from 1 to 20; t stands for time (years in this case) and ranges from 1 to 5; and e is the random error term.
Model 2 is obtained by adding the vector D, which includes two dummies (service orientation and country destination), and the interactions between these two dummies and two of the five motivations, namely efficiency seeking and knowledge seeking. as previously clarified, knowledge seeking is operationalized with two different constructs. Thus, we generated interactions for both of them. Model 2 is therefore formalized as follows:
FDIit = β
M
it + γ X
it + δ D
i + α
1 D
i EF
it +
+ α2 D
i KS1
it + α
3 D
i KS2
it + e
it (8.2)
To improve the symmetry of the distribution of some of the variables employed, we transformed them using power transfor-mations. among the variables in the M vector we transformed the resource seeking variable, taking the inverse of its square root. among the variables in the X vector, we took the natural logarithm of size, FDI stocks and market structure. To increase the compara-bility among the coefficients of the variables relative to the BPo motivations, we used standardized coefficients. Table 8.2 shows the variables used, their non-standardized descriptive statistics and correlation coefficients.
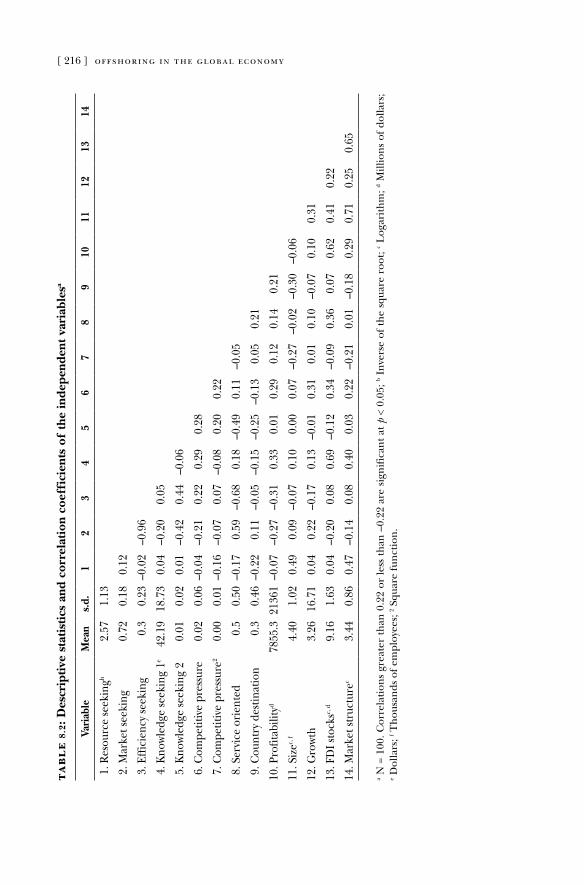
[ 216 ] offshoring in the global economyta
bl
e 8
.2: D
escr
ipti
ve s
tati
stic
s an
d co
rrel
atio
n co
effi
cien
ts o
f th
e in
depe
nden
t va
riab
lesa
Vari
able
Mea
ns.
d.1
23
45
67
89
1011
1213
14
1. r
esou
rce
seek
ingb
2.57
1.13
2. M
arke
t see
king
0.72
0.18
0.12
3. E
ffici
ency
seek
ing
0.3
0.23
–0.0
2–0
.96
4. K
nowl
edge
seek
ing
1e42
.19
18.7
30.
04–0
.20
0.05
5. K
nowl
edge
seek
ing
20.
010.
020.
01–0
.42
0.44
–0.0
6
6. C
ompe
titiv
e pr
essu
re0.
020.
06–0
.04
–0.2
10.
220.
290.
28
7. C
ompe
titiv
e pr
essu
re2
0.00
0.01
–0.1
6–0
.07
0.07
–0.0
80.
200.
22
8. S
ervi
ce o
rien
ted
0.5
0.50
–0.1
70.
59–0
.68
0.18
–0.4
90.
11–0
.05
9. C
ount
ry d
estin
atio
n0.
30.
46–0
.22
0.11
–0.0
5–0
.15
–0.2
5–0
.13
0.05
0.21
10. P
rofit
abili
tyd
7855
.321
361
–0.0
7–0
.27
–0.3
10.
330.
010.
290.
120.
140.
21
11. S
izec,
f4.
401.
020.
490.
09–0
.07
0.10
0.00
0.07
–0.2
7–0
.02
–0.3
0–0
.06
12. G
rowt
h3.
2616
.71
0.04
0.22
–0.1
70.
13–0
.01
0.31
0.01
0.10
–0.0
70.
100.
31
13. F
dI s
tock
sc, d
9.16
1.63
0.04
–0.2
00.
080.
69–0
.12
0.34
–0.0
90.
360.
070.
620.
410.
22
14. M
arke
t str
uctu
rec
3.44
0.86
0.47
–0.1
40.
080.
400.
030.
22–0
.21
0.01
–0.1
80.
290.
710.
250.
65
a N =
100
. Cor
rela
tion
s gr
eate
r th
an 0
.22
or le
ss t
han
–0.
22 a
re s
ign
ific
ant
at p
< 0
.05;
b In
vers
e of
th
e sq
uare
roo
t; c l
ogar
ith
m; d
Mill
ion
s of
dol
lars
; e d
olla
rs; f T
hou
san
ds o
f em
ploy
ees;
2 Squ
are
fun
ctio
n.
the rationale for business process offshoring [ 217 ]
Most of the correlation coefficients are low and do not exceed the cut-off point of 0.5. Thus, they present no harm in assum-ing independency among the different independent variables. The only problematic correlation coefficient that needs to be ad-dressed is the one between efficiency seeking and market seek-ing (–0.96). It is worth noting that this high negative correlation makes sense from a theoretical standpoint, and is in line with the literature previously discussed and the hypotheses developed in this study. as a matter of fact, the more attention a firm pays to the internal efficient integration of activities among its affiliates and headquarters, the less likely it is to focus on external market considerations. For the analysis, we corrected this by regressing efficiency seeking on market seeking; we then calculated the residuals of this regression and introduced them into the final regression as a substitute for market seeking. These residuals rep-resent an additional contribution of such variables that is not ex-plained by efficiency seeking. Nachum and Zaheer (2005) used a similar methodology to correct for high correlation coefficients in their panel. That said, the results do not change in either model if market seeking is directly eliminated.
To deal with the missing values of the dataset, we performed an independent sample t-test and found that the missing values were not randomly scattered in the dataset. Next, we estimated the missing values using available observations, by testing a model based on all available observations and using it to estimate the missing values (Nachum and Zaheer 2005).42
The two models were estimated using STaTa software, using a panel data analysis (Greene 2003). The advantage of a panel data analysis is that it allows for improvement of the estimation obtained by simply pooling the data and performing an olS regression on them. It also allows for the introduction of different intercepts to test for industry and time effects. We tested the null hypothesis of no in-dustry effects, performing an F test on the two following models: the pooled model with a single intercept and the least squares dummy
42 To estimate the values we used the STaTa command impute. This command fills in missing values using an olS regression. It requires as a dependent variable the variable whose missing values are to be imputed and as independent variables those variables on which the imputation is to be based.
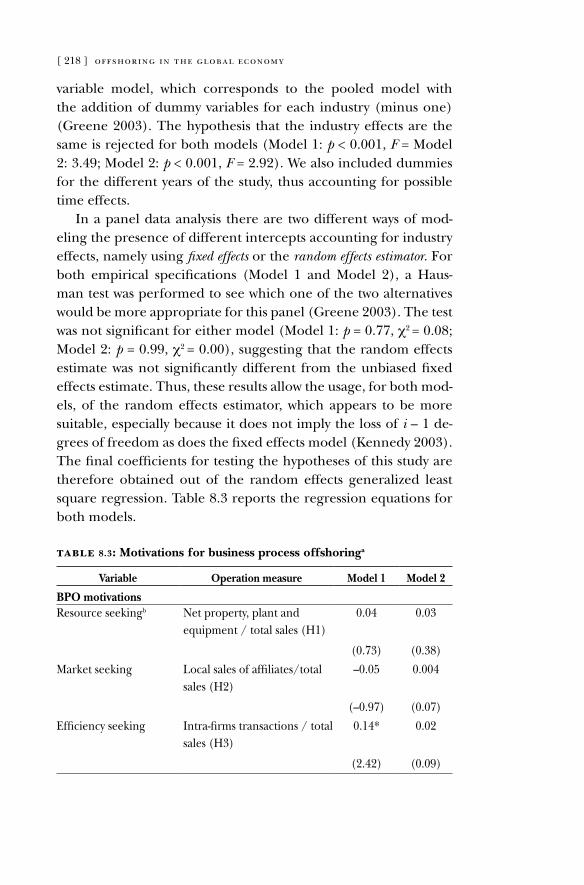
[ 218 ] offshoring in the global economy
variable model, which corresponds to the pooled model with the addition of dummy variables for each industry (minus one) (Greene 2003). The hypothesis that the industry effects are the same is rejected for both models (Model 1: p < 0.001, F = Model 2: 3.49; Model 2: p < 0.001, F = 2.92). We also included dummies for the different years of the study, thus accounting for possible time effects.
In a panel data analysis there are two different ways of mod-eling the presence of different intercepts accounting for industry effects, namely using fixed effects or the random effects estimator. For both empirical specifications (Model 1 and Model 2), a Haus-man test was performed to see which one of the two alternatives would be more appropriate for this panel (Greene 2003). The test was not significant for either model (Model 1: p = 0.77, χ2 = 0.08; Model 2: p = 0.99, χ2 = 0.00), suggesting that the random effects estimate was not significantly different from the unbiased fixed effects estimate. Thus, these results allow the usage, for both mod-els, of the random effects estimator, which appears to be more suitable, especially because it does not imply the loss of i – 1 de-grees of freedom as does the fixed effects model (Kennedy 2003). The final coefficients for testing the hypotheses of this study are therefore obtained out of the random effects generalized least square regression. Table 8.3 reports the regression equations for both models.
table 8.3: Motivations for business process offshoringa
Variable Operation measure Model 1 Model 2
BPO motivationsresource seekingb Net property, plant and
equipment / total sales (H1)0.04 0.03
(0.73) (0.38)
Market seeking local sales of affiliates/total sales (H2)
–0.05 0.004
(–0.97) (0.07)
Efficiency seeking Intra-firms transactions / total sales (H3)
0.14* 0.02
(2.42) (0.09)
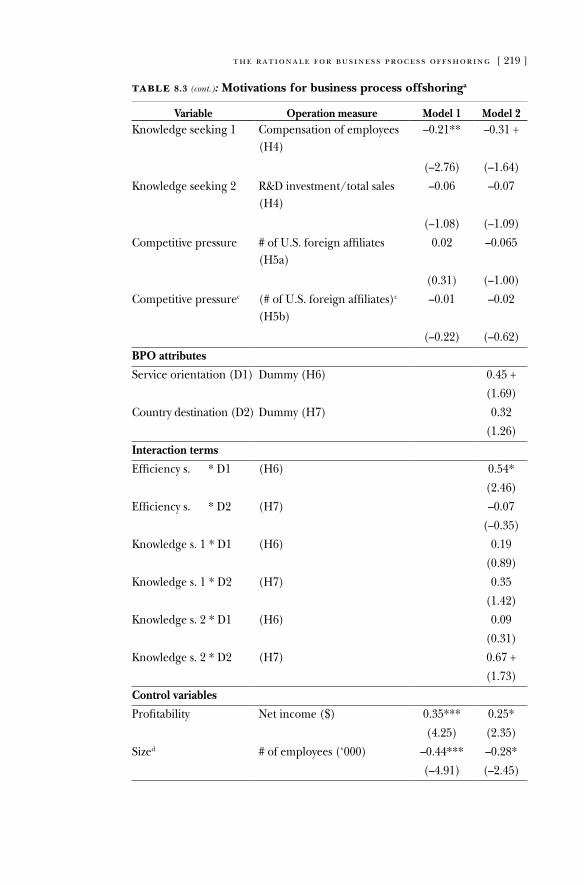
the rationale for business process offshoring [ 219 ]
table 8.3 (cont.): Motivations for business process offshoringa
Variable Operation measure Model 1 Model 2Knowledge seeking 1 Compensation of employees
(H4)–0.21** –0.31 +
(–2.76) (–1.64)
Knowledge seeking 2 r&d investment/total sales (H4)
–0.06 –0.07
(–1.08) (–1.09)
Competitive pressure # of U.S. foreign affiliates (H5a)
0.02 –0.065
(0.31) (–1.00)
Competitive pressurec (# of U.S. foreign affiliates)c (H5b)
–0.01 –0.02
(–0.22) (–0.62)
BPO attributes
Service orientation (d1) dummy (H6) 0.45 +
(1.69)
Country destination (d2) dummy (H7) 0.32
(1.26)
Interaction terms
Efficiency s. * d1 (H6) 0.54*
(2.46)
Efficiency s. * d2 (H7) –0.07
(–0.35)
Knowledge s. 1 * d1 (H6) 0.19
(0.89)
Knowledge s. 1 * d2 (H7) 0.35
(1.42)
Knowledge s. 2 * d1 (H6) 0.09
(0.31)
Knowledge s. 2 * d2 (H7) 0.67 +
(1.73)
Control variables
Profitability Net income ($) 0.35*** 0.25*
(4.25) (2.35)
Sized # of employees (‘000) –0.44*** –0.28*
(–4.91) (–2.45)
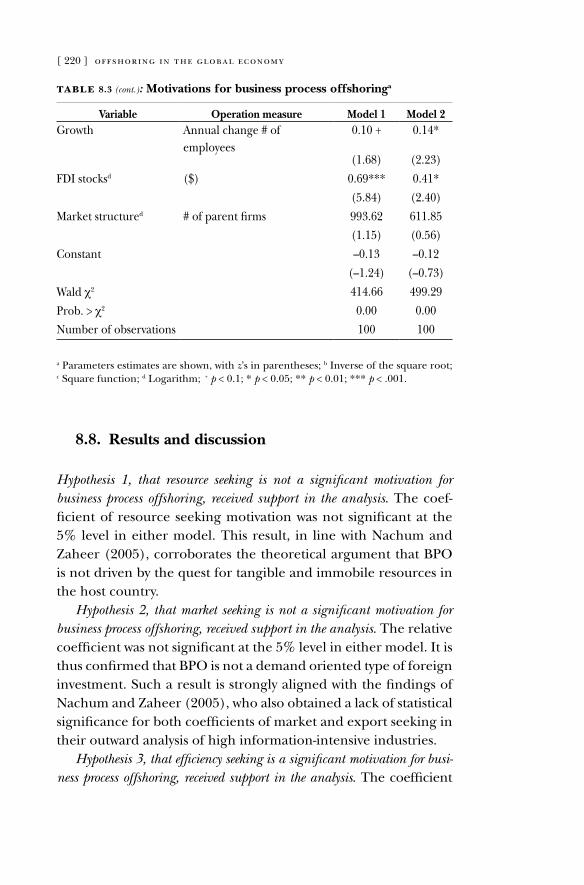
[ 220 ] offshoring in the global economy
table 8.3 (cont.): Motivations for business process offshoringa
Variable Operation measure Model 1 Model 2Growth annual change # of
employees0.10 + 0.14*
(1.68) (2.23)
FdI stocksd ($) 0.69*** 0.41*
(5.84) (2.40)
Market structured # of parent firms 993.62 611.85
(1.15) (0.56)
Constant –0.13 –0.12
(–1.24) (–0.73)
Wald χ2 414.66 499.29
Prob. > χ2 0.00 0.00
Number of observations 100 100
a Parameters estimates are shown, with z’s in parentheses; b Inverse of the square root; c Square function; d logarithm; + p < 0.1; * p < 0.05; ** p < 0.01; *** p < .001.
8.8. Results and discussion
Hypothesis 1, that resource seeking is not a significant motivation for business process offshoring, received support in the analysis. The coef-ficient of resource seeking motivation was not significant at the 5% level in either model. This result, in line with Nachum and Zaheer (2005), corroborates the theoretical argument that BPo is not driven by the quest for tangible and immobile resources in the host country.
Hypothesis 2, that market seeking is not a significant motivation for business process offshoring, received support in the analysis. The relative coefficient was not significant at the 5% level in either model. It is thus confirmed that BPo is not a demand oriented type of foreign investment. Such a result is strongly aligned with the findings of Nachum and Zaheer (2005), who also obtained a lack of statistical significance for both coefficients of market and export seeking in their outward analysis of high information-intensive industries.
Hypothesis 3, that efficiency seeking is a significant motivation for busi-ness process offshoring, received support in the analysis. The coefficient
the rationale for business process offshoring [ 221 ]
relative to the efficiency seeking motivation was significant at the 5% level and positive in Model 1, thus corroborating the theoreti-cal argument that companies initiate BPo investments in order to increase internal efficiency and minimize costs. In Model 2, the insertion of the interaction terms proved that efficiency seeking is highly significant only for service oriented enterprises. This result is extremely important in confirming the generalized perception that companies practice BPo, predominantly in the service sector, in or-der to reduce costs by taking advantage of a more efficient global re-distribution of labor. This finding is also consistent with that of Na-chum and Zaheer (2005), who found in their panel that efficiency seeking was the only significant motivation explaining the outward flow of FDI in high information-intensive industries. The strong ho-mogeneity of the results obtained across the two studies leads to the conclusion that efficiency seeking is a key determinant for the rise of BPo as a strategic option for international expansion.
Hypothesis 4, that knowledge seeking is a significant motivation for business process offshoring, received mixed support in the analysis. In Model 1, only the first of the two coefficients related to knowl-edge seeking motivation was significant, with a very small p-value (0.006). The significant coefficient is related to the average salaries paid in host countries and is thus subject to the critiques already discussed in the methods section. In line with such considerations, the significance of its negative sign should be interpreted as a con-firmation of the efficiency seeking motivation, as it focuses on the arbitrage opportunities that emerge with decreasing average sala-ries in offshore countries. When refining the empirical specifica-tion using Model 2, the results offer a different analysis of the 1999–2003 period. While the two standard coefficients of knowl-edge seeking continue to show one to be negative and significant and the other to be nonsignificant, interaction of the r&d-based measure of knowledge seeking with the country selection is posi-tive and significant, showing that the search for new capabilities really matters when deciding to pursue a BPo strategy.
The interpretation of the findings substantiates that knowl-edge seeking represents a critical motivation behind BPo, prima-rily when investing in low-cost countries. This result is important for two reasons. First, it shows an important evolution in terms of
[ 222 ] offshoring in the global economy
motivations for initiating BPo. While for the first wave of BPo, documented in the study of Nachum and Zaheer (2005), the only significant driver was to increase efficiency and minimize costs, in this more recent wave knowledge seeking also significantly influ-ences the decision of companies to practice BPo. Second, it goes against the generalized perception that companies mainly relocate white-collar jobs to developing countries exclusively to cut costs. The results show in fact that the more companies want to access new capabilities, the more they decide to offshore to low-cost re-gions. This finding corroborates some of the latest studies (lewin, Massini, and Peeters 2007) assessing the recent emergence of vast unexploited pools of highly-skilled talent in developing countries that are increasingly being targeted by Western companies.
Hypotheses 5a and 5b, that competitive pressure is a significant mo-tivation for business process offshoring, received no support in the analy- sis. Both the linear and quadratic measures of this motivation were highly insignificant in the analysis in both models. Nachum and Zaheer’s (2005) results with respect to this motivation for the outward analysis of high information-intensive industries are also insignificant. The fact that both studies failed to provide em-pirical support to the hypothesis in terms of competitive pressure further opens the question raised by Nachum and Zaheer (2005) of whether the operationalization employed is accurate for test-ing such hypotheses. The operationalization generally used for the competitive pressure motivation is traditionally centered on the structure of the home market (Knickerbocker 1973). accord-ingly, in both studies the number of new U.S. affiliates entering foreign markets each year was employed to measure this con-struct. However, as competition is increasingly taking place on a global rather than a domestic basis, including only local rivals in the home country, in this case the U.S., in the analysis will likely oversimplify the picture. Firms’ most relevant competitors are in fact often located in different countries. If the moves of these global rivals are not taken into account, the entire analysis of the competitive pressure faced by single companies could be jeopardized.
Hypothesis 6, that service oriented firms, as opposed to manufacturing oriented firms, offshore more and have a stronger focus on efficiency and
the rationale for business process offshoring [ 223 ]
knowledge seeking when relocating business processes, received support in the analysis. In Model 2, the coefficient of the dummy variable that distinguishes service oriented firms from manufacturing oriented firms was positive and significant at the 10% level. This categoriza-tion is also highly relevant when discussing the efficiency seeking motivation, with service oriented firms offshoring considerably more for this reason.
Hypothesis 7, that firms offshore more to low-cost countries and have a stronger focus on efficiency and knowledge seeking when relocating business processes there, received weak support in the analysis. The coefficient of the dummy variable that distinguishes firms that substantially off-shore to low-cost countries from firms that do so only marginally was positive, but not significant. However, this categorization is relevant and statistically significant when investigating the knowl-edge seeking motivation. according to the findings, firms that offshore to low-cost countries are the ones that invest more in knowledge seeking motivation, specifically by relocating processes related to their r&d activities. as previously mentioned when dis-cussing knowledge seeking motivation, this happens to be a major finding that substantiates the presence of an evolution of BPo motivations over time and confirms the rising role of developing countries as a source of talent for U.S. companies.
8.9. Conclusion
The objective of this study was to develop and test hypotheses on the rationale for BPo using the United States as an exam-ple. The starting point of this study was the acknowledgment of the emergence of BPo as a radically new and yet understudied strategic option available to companies seeking to expand inter-nationally (Venkatraman 2004). In light of this, the objective of this chapter was to center the debate on offshoring and focus on the motivations that lay behind it. In particular, the purpose was to determine whether the drivers behind this flow of inter-national investments have changed over time and to understand the role of industries and selected countries in influencing them. To test the hypotheses formulated, we first replicated the same
[ 224 ] offshoring in the global economy
methodology of Nachum and Zaheer (2005) using a more recent pool of data in order to compare results and offer a complete analysis of BPo motivations over a significant time period. Then, using the same dataset, we tested an improved version of the initial model, obtained by adding more fine-grained distinctions across the industries and countries involved.
The key finding of this study is that BPo is currently motivated not only by the search for efficiency but also by the quest for new knowledge. academic works as well as general press articles on BPo (dossani and Kenney 2003; Engardio, Bernstein, and Kripal-ani 2003; Farrell 2004; lewin and Peeters 2006a) often identify the quest for cost minimization through a more efficient global redistribution of labor as the key motivation behind the rise of BPo. Consistent with this generalized perception and with the findings of Nachum and Zaheer (2005), the results of this study provide substantial corroborating evidence that efficiency seek-ing is indeed the key significant driver for BPo. That said, the findings obtained also showed something that Nachum and Za-heer (2005) failed to empirically prove: knowledge seeking is also a significant motivation behind the decision to offshore business processes. This important empirical finding confirms that an evo-lution in terms of motivations for BPo is currently taking place. While the initial wave of offshoring (1990–1998) documented by Nachum and Zaheer (2005) was characterized by a narrow cost-cutting perspective strictly in line with an efficiency seeking moti-vation, the more recent wave (1999–2003) shown in this study is also increasingly driven by the search for new knowledge inten-sive resources. Furthermore, the additional analysis integrated in this study allowed a detailed appreciation of the knowledge seek-ing motivation. results show that when searching for new knowl-edge, companies invest mainly in developing countries. While in the past, low-cost countries were only considered for their sup-ply of cheap blue-collar labor, the results of this study show that companies are now migrating their knowledge-intensive activities. The appreciation of this change in the international flow of these high-value activities is crucial to understanding the potential ma-jor impact that BPo can have on the geographical reorganization of Western corporations.
the rationale for business process offshoring [ 225 ]
The findings obtained have important theoretical implications and open up relevant avenues for future research. They substanti-ates that BPo represents a new type of international expansion. The results that resource and market motivations fail to be signifi-cant drivers behind BPo confirms that this current wave of inter-nationalization radically differs from previous waves of geography-related changes in the organization of corporations (Venkatraman 2004). recent ICT progress is deeply altering the way companies globally organize their activities (Zaheer and Manrakhan 2001), and are modifying the rationale for foreign investment across industries and countries (Nachum and Zaheer 2005). BPo thus emerges as an innovative practice in the international business scenario that responds to specific new competitive dynamics and requires a different theoretical contextualization from previous waves of internationalization. By explicitly assessing the rationale for BPo, this study is the first step towards a more complete un-derstanding of this emerging phenomenon.
different scholars have already argued that competitive advan-tage is incrementally based on how companies globally source sin-gle activities in the value chain (Gottfredson, Puryear and Phillips 2005) and on how they innovate global learning by leveraging di-verse skills and capabilities across dispersed subsidiaries (Santos et al. 2004). BPo represents the means by which this global redistri-bution of labor is currently taking place. Future research should focus on deepening our understanding of this new strategic alter-native of international expansion through a more complete and rigorous theoretical conceptualization. a first effort in this direc-tion is presented in chapter 9.

[ 227 ]
offshoring and the Global Sourcing of Talent: Understanding the New Frontier of Internationalization
IN this chapter we discuss important theoretical novelties that arise from the current process of internationalization and by the offshoring of innovation work. The extensive collection of interna-tional management (IM) literature, most of which is based on the stages model of internationalization (Johanson and Vahlne 1977), examines the rationale behind a firm’s international expansion and the key variables influencing this process. In this study, we seek to add to this literature by offering insights into how the re-cent practice of product development offshoring (Pdo) current-ly functions. We make this extension because firms that currently offshore innovation work globally redistribute their value activi-ties differently from how they did so in the past (Venkatraman 2004).
The purpose of this study, therefore, is to investigate why and how firms currently offshore product development activities. We deliberately focused on the relocation of knowledge-intensive functions that require technical talent because it represents the latest and most innovative evolution of offshoring (lewin and Peeters 2006c). It is also the change in the international organiza-tion of corporations that is expected to have the most significant impact on the global realignment of qualified jobs (Karmarkar 2004). We developed hypotheses on this specific international redistribution of activities and tested them using a fine-grained database containing 262 offshore implementations initiated by 71 Western European companies.
This study contributes to the existing literature on two lev-els. First, we examined the motivations behind the current off- shoring of product development activities and show that compa-nies relocate higher-skilled knowledge-intensive functions with the
9.
[ 228 ] offshoring in the global economy
sole objective of accessing talent and thus expanding their pool of capabilities (Chung and alcacer 2002). labor cost arbitrage is not a relevant driver in this decision, contrary to generalized per-ception, which views the search for efficiency and cost reduction as its only raison d'être when migrating ICT-enabled functions to offshore locations (lewin et al. 2007). We speculate on the cur-rent shortage of technical talent in Western Europe as a possible determining factor of these results. The second contribution is related to the process model currently used by firms that source higher-skilled talent abroad. The dominant stages model of inter-nationalization (Johanson and Vahlne 1977) suggests that firms gradually increase their international commitment. as a result of the large amount of uncertainty linked to their international op-erations, firms tend to increasingly build on their international investment experience in two main ways: starting from cultural-ly and geographically close countries and then moving to more distant ones; and following a staged investment path that begins with exporting and ends with a wholly-owned production facility (davidson 1980). We argue that the global competitive landscape is changing and that firms are now following innovative dynamic models when internationalizing their activities. recent technolog-ical advances have significantly modified how firms evaluate dis-tances and the related costs of operating remotely. as a result, the decision to offshore product development activities is no longer the product of a linear model. Firms look at cultural and geo-graphic distances differently from the past; international experi-ence and firm size are no longer reliable predictors of high-value foreign investments. Companies continuously search for agile and flexible innovation processes. recent technological advances have given them the opportunity to disaggregate their value chain and redistribute single activities, leveraging diverse skills and capabili-ties across dispersed locations (Santos et al. 2004). This study aims to investigate why and how Western firms do this.
Section 9.1 develops hypotheses related to the rationale be-hind Pdo and the process used for internationalization. We then present the methods and results of our research. Finally, we high-light the major findings obtained, discuss areas for future research and discuss our conclusions.
offshoring and the global sourcing of talent [ 229 ]
9.1. Hypotheses development
The extensive IM literature examines the rationale behind a firm’s international expansion and the key variables influencing this process. over the years, scholars have proposed, tested, and expanded on models describing the internationalization process of firms. among this vast amount of research, two sub-strands can be identified. one focuses on the motivations that drive the de-cision to invest abroad. The other is more process oriented and concentrates on the foreign investment path followed by firms and on the key variables that influence it. We will keep these two strands separated when developing our hypotheses relative to Pdo.
Motivations for product development offshoringIM scholars have identified five major motivations that
can drive firms to initiate international investments: resource seeking, market seeking, efficiency seeking, knowledge seek-ing and competitive pressure (Nachum and Zaheer 2005). resource and market seeking can be contextualized as the more traditional motivations, mostly explaining the first wave of internationalization that predominantly interested manufac-turing activities (Venkatraman 2004). With improvements in trans-portation infrastructures, companies began expanding abroad to search, on one hand, for tangible resources that were either missing or too expensive at home and, on the other hand, for new markets to produce and sell their products (dunning 1993). The recognition of transnational intra-firm integration as a potential source for competitive advantage (Fayerweather 1969) led to the increasing inclusion of efficiency seeking as an alternati- ve motivation for foreign investments (Kobrin 1991). Concentrating on the strategic interdependences of firms, other researchers emphasized the role of external competitive pressures as determinants for international expansion (Knickerbocker 1973). The recognition of knowledge as a key determinant for the very existence of the multinational firm (Kogut and Zander 1993) has led to several studies that showed the search for new capabilities can also represent the main motivation behind
[ 230 ] offshoring in the global economy
international investments (Chung and alcacer 2002; Kuemmerle 1999).
recent studies have already advanced hypotheses regarding the main drivers behind the current wave of offshoring (lewin et al. 2007; Nachum and Zaheer 2005; Pisani 2007). Their findings prove that resource and market seeking are clearly not significant motivations behind the current offshoring of business processes (Nachum and Zaheer 2005; Pisani 2007). Companies relocating white-collar activities abroad are not in search of tangible resources, such as land or minerals, or new geographic areas to produce and sell their products. By focusing on Pdo and the search for new markets, we can hypothesize that the search for local custom-ers does not represent a key driver behind offshoring innovation work. Hence, we posit:
Hypothesis 1. Market seeking is not a significant motivation in the decision to offshore product development activities.
labor cost differentials have always been cited as the major mo-tivation behind the impressive increase of offshoring to low-cost economies (agrawal et al. 2003; aron and Singh 2005). Previous studies corroborate that efficiency seeking is the determinant driver behind the relocation of white-collar activities (Nachum and Zaheer 2005; Pisani 2007). However, these studies do not dif-ferentiate between lower- and higher-skilled offshored activities. In other words, no distinction is made between the relocation of fairly commoditized activities, like administrative functions, and more knowledge-intensive activities, like product development tasks that require specific technical talent. Building on such a distinction, lewin et al. (2007) argue that, while labor cost arbi-trage remains a fundamental driver for the migration of IT, ad-ministrative and other back-office functions, it does not play a role when relocating innovation work abroad. Building on their argument (lewin et al. 2007), we hypothesize that labor cost dif-ferentials do not drive the decision to initiate Pdo. Therefore, we hypothesize:
offshoring and the global sourcing of talent [ 231 ]
Hypothesis 2. Efficiency seeking is not a significant motivation in the decision to offshore product development activities.
The relocation of innovation work is generally linked to the search for new knowledge (Cantwell 1989). Firms motivated by knowledge seeking that invest abroad are searching for new re-sources in order to upgrade their own existing pool of capabili-ties. These firms will primarily value locations close to sources of relevant knowledge. The chosen locations generally offer a com-petitive mix of highly-skilled labor, greater r&d intensity and a constant production of new patents in the region (almeida and Kogut 1999; Chung and alcacer 2002; Kuemmerle 1999). a local presence is required in these areas in order to access the specific knowledge resources. Since a proportion of knowledge remains tacit and difficult to codify, close and frequent interactions are necessary in order to acquire it (Kogut and Zander 1993; Martin and Salomon 2003). local proximity is thus considered to be a key facilitator for acquiring such new knowledge.
Pdo is clearly motivated by the search for new knowledge. The decision to relocate product development activities abroad such as r&d, product design or engineering services, indicates the desire to access new capabilities that can help improve a company’s innova-tion processes. Firms initiating Pdo highly value the presence of a competitive and diverse pool of technical talent in the offshor-ing region. The possibility of hiring new technical talent offshore can become particularly necessary when there is a corresponding shortage at home. lewin et al. (2007) document that this is precisely the case in the United States. The 2003 cutback in H1B visas cre-ated a shortage of talented higher-skilled employees entering the country. a similar investigation in several of the key members of the European Union (e. g., United Kingdom, Netherlands and Spain) confirms that the supply of Master and Phd graduates in mathemat-ics, science and technology has never consistently exceeded demand over the past few years. Graph 9.1 illustrates the market for talent in these countries. The graph shows how the situation radically chang-es when considering the recent expansion of the European Union.
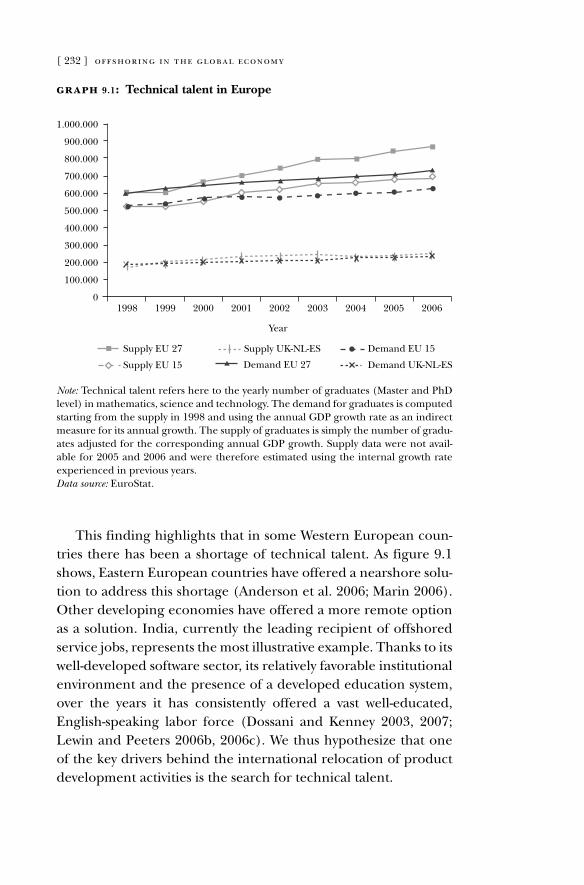
[ 232 ] offshoring in the global economy
Note: Technical talent refers here to the yearly number of graduates (Master and Phd level) in mathematics, science and technology. The demand for graduates is computed starting from the supply in 1998 and using the annual GdP growth rate as an indirect measure for its annual growth. The supply of graduates is simply the number of gradu-ates adjusted for the corresponding annual GdP growth. Supply data were not avail-able for 2005 and 2006 and were therefore estimated using the internal growth rate experienced in previous years.Data source: EuroStat.
graph 9.1: Technical talent in Europe
0
1.000.000
900.000
800.000
700.000
600.000
500.000
400.000
300.000
200.000
100.000
1998 1999 2000 2001 2002
Year
2003 2004 2005 2006
Supply EU 27
Supply EU 15
Supply UK-NL-ES
Demand EU 27
Demand EU 15
Demand UK-NL-ES
This finding highlights that in some Western European coun-tries there has been a shortage of technical talent. as figure 9.1 shows, Eastern European countries have offered a nearshore solu-tion to address this shortage (anderson et al. 2006; Marin 2006). other developing economies have offered a more remote option as a solution. India, currently the leading recipient of offshored service jobs, represents the most illustrative example. Thanks to its well-developed software sector, its relatively favorable institutional environment and the presence of a developed education system, over the years it has consistently offered a vast well-educated, English-speaking labor force (dossani and Kenney 2003, 2007; lewin and Peeters 2006b, 2006c). We thus hypothesize that one of the key drivers behind the international relocation of product development activities is the search for technical talent.
offshoring and the global sourcing of talent [ 233 ]
Hypothesis 3. Knowledge seeking is a significant motivation in the decision to offshore product development activities.
Companies can also decide to offshore product development functions as a reaction to competitors’ moves. The main objec-tive behind the decision to imitate a competitor’s foreign invest-ment strategy is to not lose sight of rivals’ activities, thus depriv-ing them of problem-free access to new markets and/or low-cost resources (Karnani and Wernerfelt 1985; Knickerbocker 1973; Nachum and Zaheer 2005). Companies following their competi-tors can also take advantage of the positive externalities gener-ated by the industry pioneers in the offshore destinations. These arguments seem particularly pertinent when analyzing the deci-sion to offshore product development activities. Therefore, we hypothesize:
Hypothesis 4: Competitive pressure is a significant motivation in the decision to offshore product development activities.
The process of product development offshoringThe extensive literature based on the stages model of inter-
nationalization (Johanson and Vahlne 1977) examines the in-ternational expansion process of firms. The theoretical base of the model, also called the Uppsala stage model, is in the be-havioral theory of the firm (Cyert and March 1963). rooted in uncertainty reduction and experiential learning, the model stages of internationalization hypothesizes that firms incremen-tally increase their commitment to their foreign operations. This staged process interests the company’s value chain and its partial relocation to foreign countries (beginning from export and pro-gressing to sales offices, then production facilities, and finally, full value-chain subsidiaries), its mode of operations (from arm’s length transaction through partnerships with locals to wholly-owned operations), and its geographical distribution (from more familiar to less familiar countries) (Westney and Zaheer 2001). The model has been extensively tested. Several studies focused on the incremental commitment hypothesized in the model and test-ed whether international experience is a reliable predictor of the
[ 234 ] offshoring in the global economy
international commitment of firms. Johanson and Wiedersheim-Paul (1975), Juul and Walters (1987), Chang (1995), and Chang and rosenzweig (2001) confirmed that inexperienced firms make limited resource commitments in early expansion operations and that such firms tend to commit more resources in their succes-sive international investments. However, various other studies (Nordstrom 1991; Sullivan and Bauerschmidt 1990; Turnbull 1987; Welch and loustarinen 1988) found exceptions to the mod-el’s general rule that commitment increases in successive stages.
other scholars concentrated on testing the geographic im-plications of the model, which predicts that companies tend to invest first in proximate countries and then move to less famil-iar ones. Geographic, cultural, linguistic and institutional factors have been considered in defining the relative proximity of re-gions. While Barkema et al. (1996), davidson (1980, 1983), and denis and depelteau (1985) found empirical support for this hypothesis, other studies (Engwall and Wallenstål 1988; Sullivan and Bauerschmidt 1990) were not able to reach the same conclu-sion.
over time scholars have extended the model in order to in-corporate other relevant factors and thus improve its empirical validity. among other issues, the level of competition of the host country (Vahlne and Nordström 1993), changes in government regulation (Sullivan 1994), cultural entry barriers (Kwon and Hu 1995), initial firm size (oviatt and Mcdougall 1994), and politi-cal environment (delios and Henisz 2003) have been included in the stages model of internationalization. although quantitative empirical evidence has not always supported the model (Kalnins 2007), the stages model of internationalization remains an intui-tively appealing model (delios and Henisz 2003) in which qualita-tive work has proved insightful in terms of understanding a firm’s decisions with regard to international expansion (Sullivan and Bauerschmidt 1990). The model’s overall relevance is confirmed by the fact that as of November 2007 it has been cited 502 times in the Institute for Scientific Information’s (ISI) Web of Knowledge database.
The current process of internationalization and a firm’s sub-sequent offshoring of innovation work presents important theo-
offshoring and the global sourcing of talent [ 235 ]
retical novelties when compared to the Uppsala stage model of internationalization. Companies that currently offshore innova-tion work are globally redistributing their value activities in a way that is radically different from the relocation of international activities characterized by previous waves of internationalization (Venkatraman 2004). We thus hypothesize that, while some of the insights of the stage model of internationalization still hold, oth-ers aspects need to be reassessed in order to properly model this current offshoring wave.
First of all, we argue that the current process of internation-alization is no longer linear as hypothesized by the stage model. recent technological advances have markedly reduced the costs of operating remotely (Zaheer and Manrakhan 2001; Zaheer and Zaheer 2001). Companies competing in turbulent environments have entered into processes of accelerated internationalization that have led to a rapid relocation of strategic functions to off-shore locations (Gottfredson et al. 2005). The notion of a born-glo-bal firm, which is defined as the “business organization that, from inception, seeks to derive significant competitive advantage from the use of resources and the sale of outputs in multiple countries,” has been increasingly cited in the mainstream IM literature (oviatt and Mcdougall 1994, 31). The born-global firm’s capacity to succeed stems from their entrepreneurial use of those technological advances that have dramatically in-creased the speed, quality and efficiency of international com-munications and on the firm’s superior organizational capacity to manage and coordinate knowledge-based resources (Knight and Cavusgil 2004; oviatt and Mcdougall 1994). Hence, we posit:
Hypothesis 5. International experience is not a significant factor in the decision to offshore product development activities.
The reduction of the costs of distance, made possible by the in-troduction of new information technologies, has also altered the perception of geographic distances. While in the past, the physi-cal proximity of a familiar country was a major factor in being selected for offshoring, significant improvements in the transpor-
[ 236 ] offshoring in the global economy
tation sector and in communication technologies have greatly altered the perception of distance. The introduction of broad-band technologies has enabled authentic information assembly lines to be created where information can be easily and efficient-ly standardized, stored, sent and processed in remote locations (Karmarkar 2004). Improvements in the transportation sector have greatly facilitated the relocation of resources and employees around the world.
Improved offshore location accessibility has also altered the perception of cultural distances. Multinational firms are increas-ingly managed by multicultural teams whose members are used to working in highly heterogeneous cultural environments. Teams that span multiple geographic and cultural boundaries have in fact become prevalent in many industries. as a result, multinational, multicultural distributed teams have become an integral part of numerous organizations (Connaughton and Shuffler 2007). The increasing standardization of technical knowledge and the predominance of the English language in a number of technical fields have played important roles in facili-tating efficient interaction among individuals with different cul-tural backgrounds. It is worth stressing that cultural differences continue to matter, especially in low-wage economies, where only a small percentage of university graduates are suitable for jobs in Western multinationals (Farrell et al. 2006). However, we argue that in the decision to offshore product development activities, cultural issues are not as significant as they were in the past for foreign expansion strategies. Given a sufficient supply of technical talent prepared to work at international standards in the offshore environment, we hypothesize that cultural differ-ences do not represent a major factor in determining the Pdo process:
Hypothesis 6. Geographic and cultural distances are not signifi-cant factors in the decision to offshore product development activi-ties.
What continues to be significant in defining a firm’s interna-tional expansion strategy is the public policy environment of the
offshoring and the global sourcing of talent [ 237 ]
offshore country. a host government’s ability to credibly commit to a set of policies is important for those companies willing to en-ter the country. It has been shown that in those countries where policy credibility is low, firms tend to minimize commitments or even avoid investment altogether (Henisz and delios 2001). as a matter of fact, when there is a high uncertainty in the poli-cymaking structure of a country, difficulties emerge in terms of collecting and organizing the information needed for a success-ful venture, and the level of regulatory safeguards guaranteed to foreign investors is greatly reduced. In those environments, often defined as politically hazardous, policies are extremely volatile in response to exogenous shocks, to changes in the identity of policymakers and to the direct lobbying of host country local competitors or incumbents. a recent study (delios and Henisz 2003) confirms that political hazards matter in the stage model and should therefore be considered when studying the process of firm internationalization.
In line with such findings, the political environment deeply influences a firm’s Pdo process. The political stability of the off-shore country is critical in securing a healthy regulative environ-ment where the most critical knowledge-intensive activities can be safely relocated. Indeed, some of the strongest environmental pressures that a foreign company faces in the offshore country are the host country’s legal regulations (rosenzweig and Singh 1991). We expect firms investing in Pdo to be particularly sensitive to the potential lack of appropriate intellectual property protection in the offshore country. Policy uncertainty with regard to intel-lectual property rights could in fact deeply jeopardize the entire Pdo investment. Hence:
Hypothesis 7. Uncertainty in an offshore country’s policies is a significant factor in the decision to offshore product development ac-tivities.
Finally, we argue that the stage model still holds when pre-dicting that, as firms increase their commitment in the foreign country, they will tend to increasingly internalize their opera-tions (Johanson and Vahlne 1977; Westney and Zaheer 2001).
[ 238 ] offshoring in the global economy
We posit that this is especially the case for Pdo, which focuses on the relocation of strategic knowledge-intensive activities whose externalization presents intrinsic hold-up problems (Trefler 2005). Extensive literature on the transaction-cost based theory of the firm (Williamson 1975) has studied the different costs of organizing international interdependencies through captive offshoring or offshore outsourcing. In particu-lar, several studies have addressed the potential risks of oppor-tunistic behavior in the case of offshore outsourcing (aron et al. 2005; Trefler 2005). Those risks are of particular concern when externalizing product development activities. local ex-ternal providers can in fact opportunistically exploit the know-how shared by the buyer as a legitimate part of the contract, for example, by reverse engineering critical proprietary processes (aron et al. 2005).
although they criticize the transaction cost model, Kogut and Zander (1993) arrive at the same conclusion, claiming that mul-tinationals arise out of their superior efficiency as organizational vehicles by which to transfer knowledge across borders, especially when it is tacit. The existence of multinationals is thus consid-ered the result of their specialization in the creation and internal transfer of knowledge. Captive offshoring is confirmed to be the only reasonable way of relocating knowledge-intensive activities abroad. Therefore, we posit:
Hypothesis 8. When offshoring product development activities, firms organize their international interdependencies through captive offshoring rather than through offshore outsourcing.
9.2. Methods
Setting and data sourceTo test the eight hypotheses we used data collected through
the offshoring research Network (orN) project, an interna-tional research program launched by duke University in 2004. In 2004 and 2005, the project focused on surveying the offshoring practices of U.S.-based companies. In 2006, the survey broadened
offshoring and the global sourcing of talent [ 239 ]
the research to Europe by involving six European Universities.43 The key unique features of this research project are the follow-ing. First, we utilized contextual commonality and a centralized online administration for a high degree of comparability across surveys collected in the different countries involved. Second, the level of the analysis is limited to specific offshore imple-mentation, not a company’s broad experience with offshoring. This results in an extremely fine-grained and unique database, which enables key differences across individual implementa-tions to be grasped, even when initiated from the same company. Furthermore, the survey includes not only companies that are already offshoring, but also those that are considering offshor-ing but have not started yet. For the purposes of this study, we use the 2006 orN surveys of three European countries, namely the United Kingdom, the Netherlands and Spain. These three countries were selected out of the six available in Europe owing to their accessible and comprehensive corresponding records at the time of the analysis. after eliminating single incomplete surveys, a total of 262 implementations executed by a total of 71 companies were left.
MeasuresThe dependent variable of this study is product development
activity, expressed as PDi, which is a dummy that scores 1 when
implementation i involves a product development activity (e. g., r&d, product design and engineering services) and 0 otherwise. as for the independent variables:
1. Market seeking. We operationalized market seeking using the answers to the survey question in which respondents were asked to rate, using a five-point likert scale, the degree to which access to new markets for products and services mat-tered as a strategic driver for their offshore implementa-tion.
43 Partner Universities include Copenhagen Business School, otto Beisheim School of Management, rSM Erasmus University, IESE Business School, Manchester Business School and Solvay Business School.
[ 240 ] offshoring in the global economy
2. Efficiency seeking. To operationalize the efficiency seeking motivation we used the answers to the survey question in which respondents were asked to rate, using a five-point likert scale, how much labor cost savings mattered as strate-gic driver for their offshore implementation.
3. Knowledge seeking. We operationalized knowledge seeking us-ing the answers to the survey question in which respondents were asked to rate, using a five-point likert scale, to what degree access to qualified personnel mattered as a strategic driver for their offshore implementation.
4. Competitive pressure. To operationalize the competitive pres-sure motivation we used the answers to the survey question in which respondents were asked to rate, using a five-point likert scale, to what degree competitive pressure mattered as a strategic driver for their offshore implementation.
5. International experience. To operationalize the level of inter-national experience of a firm pursuing implementation i we measured it with the total number of implementations of the company. The higher this number, the more the com-pany is committed in foreign markets.
6. Cultural and geographic distances. To operationalize cultur-al distance we used the answers to the survey question in which respondents were asked to rate, using a five-point likert scale, to what degree cultural differences with em-ployees in an offshore location were considered a risk for implementing offshoring activities. We operationalized ge-ographic distance using four dummies related to four key offshoring destinations (India, China, latin america and Eastern Europe). Each dummy scores 1 when activities were relocated to one of the four corresponding regions and 0 otherwise.
7. Policy uncertainty. We operationalized policy uncertainty using the answers to two survey questions. In the first, re-spondents were asked to rate, using a five-point likert scale, to what degree the political instability of the host country is considered a risk for implementing offshore ac-tivities (PolICy1). In the second, respondents were asked to rate, using a five-point likert scale, to what degree the

offshoring and the global sourcing of talent [ 241 ]
lack of intellectual property protection in the host country is considered a risk for implementing offshoring activities (PolICy2).
8. Offshoring model. To take into account the offshoring model, we used a dummy that scores 1 when the implementation is done through a captive subsidiary and 0 otherwise.
We also included a series of control variables for the size of the companies, their country of origin (dummies included for the United Kingdom, the Netherlands and Spain) and their main industry categorization (dummies included for telecommunica-tions, IT and service providers).
9.3. Model
To test our hypotheses we ran the following logit model:
PDi = β
0 + β
1 MARKET
I + β
2 EFFICIENCY
I + β
3 KNOWLEDGE
I +
+ β4 COMPETITION
I + β
5 INTEXP
I + β
6 CULTURE
I +
+ β7 POLICY1
I + β
8 POLICY2
I + β
9 MODEL
I + β
10 SIZE
I +
+ δ DCOUDESTINATIONi + γ DCOUORIGIN
i +
η DINDUSTRY
i + e
i
Table 9.1 reports the variables used, their descriptive statistics, and correlation coefficients.
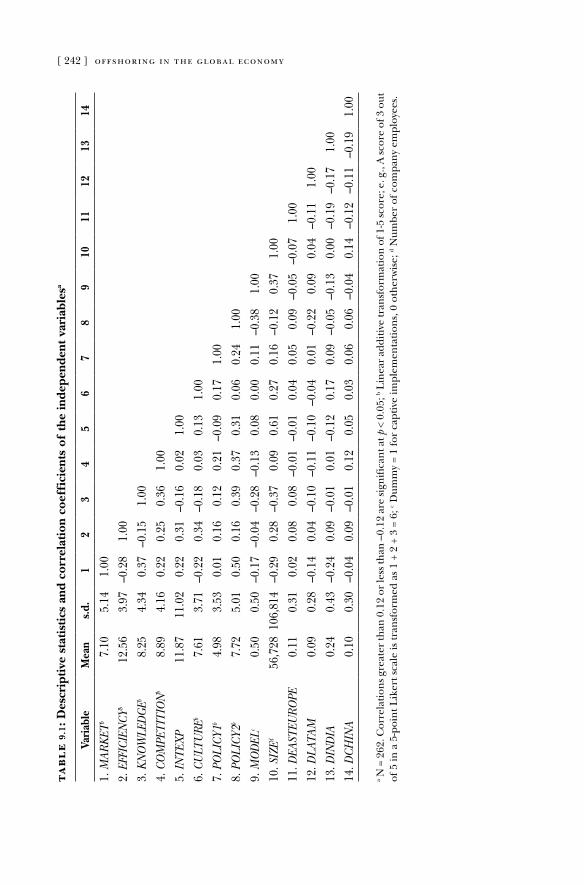
[ 242 ] offshoring in the global economyta
bl
e 9
.1: D
escr
ipti
ve s
tati
stic
s an
d co
rrel
atio
n co
effi
cien
ts o
f th
e in
depe
nden
t va
riab
lesa
Vari
able
Mea
ns.
d.1
23
45
67
89
1011
1213
14
1. M
ARK
ETb
7.10
5.14
1.00
2. E
FFIC
IEN
CYb
12.5
63.
97–0
.28
1.00
3. K
NO
WLE
DG
Eb8.
254.
340.
37–0
.15
1.00
4. C
OM
PETI
TIO
Nb
8.89
4.16
0.22
0.25
0.36
1.00
5. IN
TEXP
11.8
711
.02
0.22
0.31
–0.1
60.
021.
00
6. C
ULT
URE
b7.
613.
71–0
.22
0.34
–0.1
80.
030.
131.
00
7. P
OLI
CY1b
4.98
3.53
0.01
0.16
0.12
0.21
–0.0
90.
171.
00
8. P
OLI
CY2b
7.72
5.01
0.50
0.16
0.39
0.37
0.31
0.06
0.24
1.00
9. M
OD
ELc
0.50
0.50
–0.1
7–0
.04
–0.2
8–0
.13
0.08
0.00
0.11
–0.3
81.
00
10. S
IZEd
56,7
2810
6,81
4–0
.29
0.28
–0.3
70.
090.
610.
270.
16–0
.12
0.37
1.00
11. D
EAST
EURO
PE0.
110.
310.
020.
080.
08–0
.01
–0.0
10.
040.
050.
09–0
.05
–0.0
71.
00
12. D
LATA
M0.
090.
28–0
.14
0.04
–0.1
0–0
.11
–0.1
0–0
.04
0.01
–0.2
20.
090.
04–0
.11
1.00
13. D
IND
IA0.
240.
43–0
.24
0.09
–0.0
10.
01–0
.12
0.17
0.09
–0.0
5–0
.13
0.00
–0.1
9–0
.17
1.00
14. D
CHIN
A0.
100.
30–0
.04
0.09
–0.0
10.
120.
050.
030.
060.
06–0
.04
0.14
–0.1
2–0
.11
–0.1
91.
00
a N =
262
. Cor
rela
tion
s gre
ater
than
0.1
2 or
less
than
–0.
12 a
re si
gnif
ican
t at p
< 0
.05;
b lin
ear
addi
tive
tran
sfor
mat
ion
of 1
-5 sc
ore;
e. g
., a
scor
e of
3 o
ut
of 5
in a
5-p
oin
t lik
ert s
cale
is tr
ansf
orm
ed a
s 1
+ 2
+ 3
= 6;
c dum
my
= 1
for
capt
ive
impl
emen
tati
ons,
0 o
ther
wis
e; d N
umbe
r of
com
pan
y em
ploy
ees.
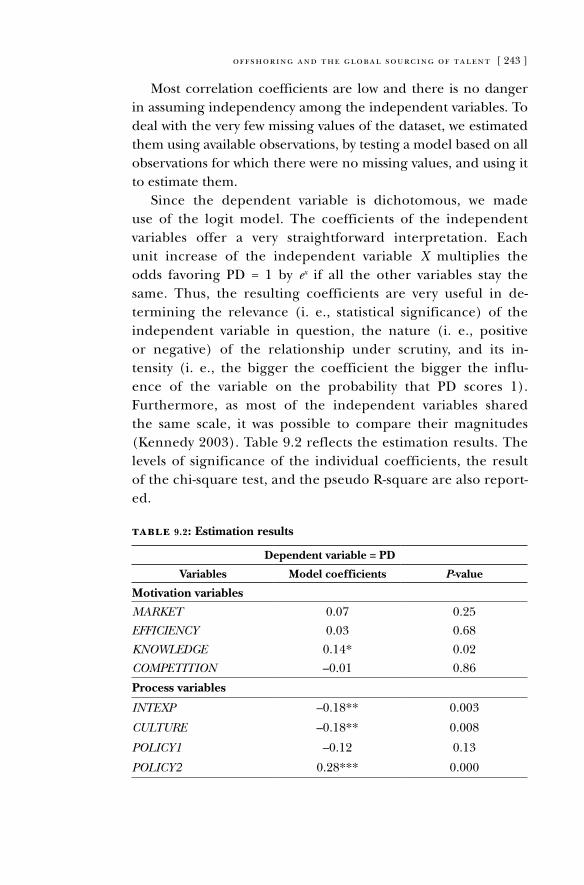
offshoring and the global sourcing of talent [ 243 ]
Most correlation coefficients are low and there is no danger in assuming independency among the independent variables. To deal with the very few missing values of the dataset, we estimated them using available observations, by testing a model based on all observations for which there were no missing values, and using it to estimate them.
Since the dependent variable is dichotomous, we made use of the logit model. The coefficients of the independent variables offer a very straightforward interpretation. Each unit increase of the independent variable X multiplies the odds favoring Pd = 1 by ex if all the other variables stay the same. Thus, the resulting coefficients are very useful in de-termining the relevance (i. e., statistical significance) of the independent variable in question, the nature (i. e., positive or negative) of the relationship under scrutiny, and its in-tensity (i. e., the bigger the coefficient the bigger the influ-ence of the variable on the probability that Pd scores 1). Furthermore, as most of the independent variables shared the same scale, it was possible to compare their magnitudes (Kennedy 2003). Table 9.2 reflects the estimation results. The levels of significance of the individual coefficients, the result of the chi-square test, and the pseudo r-square are also report-ed.
table 9.2: Estimation results
Dependent variable = PD
Variables Model coefficients P-value
Motivation variables
MARKET 0.07 0.25
EFFICIENCY 0.03 0.68
KNOWLEDGE 0.14* 0.02
COMPETITION –0.01 0.86
Process variables
INTEXP –0.18** 0.003
CULTURE –0.18** 0.008
POLICY1 –0.12 0.13
POLICY2 0.28*** 0.000
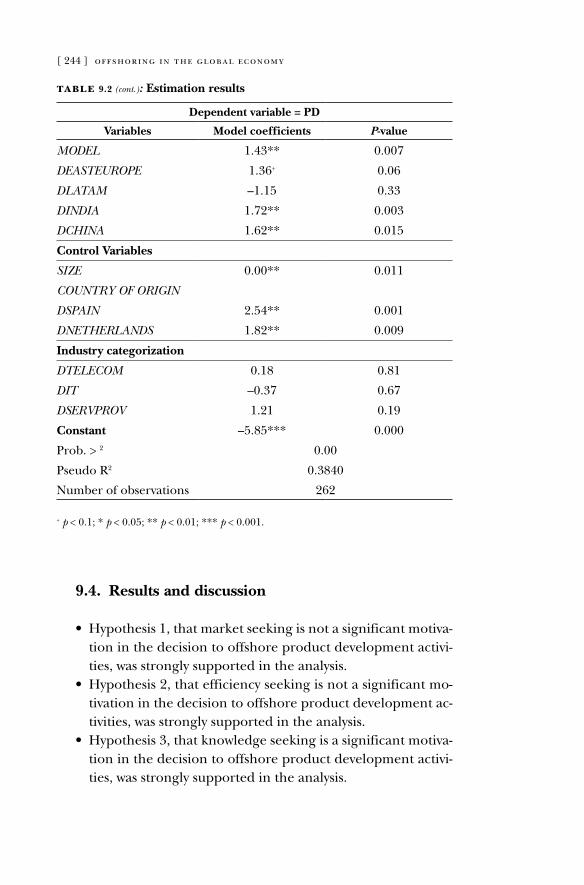
[ 244 ] offshoring in the global economy
table 9.2 (cont.): Estimation results
Dependent variable = PD
Variables Model coefficients P-value
MODEL 1.43** 0.007
DEASTEUROPE 1.36+ 0.06
DLATAM –1.15 0.33
DINDIA 1.72** 0.003
DCHINA 1.62** 0.015
Control Variables
SIZE 0.00** 0.011
COUNTRY OF ORIGIN
DSPAIN 2.54** 0.001
DNETHERLANDS 1.82** 0.009
Industry categorization
DTELECOM 0.18 0.81
DIT –0.37 0.67
DSERVPROV 1.21 0.19
Constant –5.85*** 0.000
Prob. > 2 0.00
Pseudo r2 0.3840
Number of observations 262
+ p < 0.1; * p < 0.05; ** p < 0.01; *** p < 0.001.
9.4. Results and discussion
• Hypothesis 1, that market seeking is not a significant motiva-tion in the decision to offshore product development activi-ties, was strongly supported in the analysis.
• Hypothesis 2, that efficiency seeking is not a significant mo-tivation in the decision to offshore product development ac-tivities, was strongly supported in the analysis.
• Hypothesis 3, that knowledge seeking is a significant motiva-tion in the decision to offshore product development activi-ties, was strongly supported in the analysis.
offshoring and the global sourcing of talent [ 245 ]
• Hypothesis 4, that competitive pressure is a significant moti-vation in the decision to offshore product development ac-tivities, was not supported in the analysis.
• Hypothesis 5, that international experience is not a signifi-cant factor in the decision to offshore product development activities, was strongly supported in the analysis.
• Hypothesis 6, that geographic and cultural distances are not significant factors in the decision to offshore product devel-opment activities, was strongly supported in the analysis.
• Hypothesis 7, that uncertainty in an offshore country’s poli-cies is a significant factor in the decision to offshore prod-uct development activities, was somewhat supported in the analysis.
• Hypothesis 8, which predicts that when offshoring product development activities, firms organize their international interdependencies through captive offshoring rather than through offshore outsourcing, was strongly supported in the analysis.
The results related to the control variables used also offer some interesting insights. The variable accounting for company size has a significant coefficient of zero. This means that bigger firms do not manifest any higher propensity to initiate Pdo than smaller ones. This result is worth stressing because established models of internationalization have often hypothesized that bigger firms were more likely to expand internationally (Chandler 1986; dunning 1981). The high positive correlation found between the size and international experience of firms (0.61) would seem to support this argument. However, the results obtained clearly show that these two variables do not have a significant role in the process of relocating innovation work abroad. While in the past large experi-enced companies were commonly considered to be the best can-didates for managing complex international activities, nowadays smaller, younger and more agile firms seem to also be at the fore-front of the internationalization process (oviatt and Mcdougall 1994). regarding the other control variables, those related to in-dustry categorizations were not significant, while those related to the countries of origin of the companies surveyed were both posi-
[ 246 ] offshoring in the global economy
tive and significant. For instance, Spanish companies seem to have a higher propensity to initiate Pdo than dutch companies.
This study has some limitations. For instance, both dependent and independent variables come from the same survey. In order to limit potential common method bias, we used fairly objective information provided by the respondents as the dependent var- iable. as a matter of fact, for each implementation, the survey asked to specify the kind of activities being relocated offshore using a provided list. The dummy used as dependent variable assigned 1 to the r&d, product design and engineering services catego-ries, and 0 otherwise. We reckon that the level of subjectivity in answering this question is very limited. We cannot double check the entries obtained using an alternative source of data as the im-plementation level is so specific that no other publicly available database offers the same detailed information. However, we feel confident that the query was very straightforward with very little room for ambiguity in understanding and answering the question with the desired information.
another limitation of this study is the lack of information regarding other important Western European countries. For Germany we had to exclude the data because of a large amount of missing data, while in France and Italy the survey has not been launched yet. The information collected in these countries will be extremely useful for testing the hypotheses formulated in this study, offering a more complete analysis of the European context. The survey’s commonality presents a great advantage when com-paring results and understanding similarities across regions rela-tive to the current offshoring wave. as a matter of fact, our focus on European companies presents interesting considerations when compared with the results of another study (lewin et al. 2007) that investigates the offshoring of product development activi-ties in the United States using data from the same orN project. Interestingly, although lewin et al.’s model presents differences from the one used in our study, some of their results confirm key findings obtained here. access to talent, that is, our operation-alization for the knowledge seeking motivation, was also the key driver behind Pdo in the U.S. sample; labor cost savings, on the other hand, did not have a significant role behind the relocation
offshoring and the global sourcing of talent [ 247 ]
of innovation work. Furthermore, U.S. companies vastly preferred captive solutions when offshoring product development activities; finally, international experience and size were not good predic-tors of Pdo propensity compared with other factors, in the U.S. sample.
as a result, Western companies seem to be following a similar pat-tern when pursuing their offshore initiatives related to knowledge- intensive activities. These findings are significant in that the process model currently followed by firms sourcing higher-skilled talent abroad presents important commonalities across regions. In addition, the process is significantly different from the reloca-tion of international activities that characterized previous waves of internationalization. Future research should concentrate on the important theoretical novelties that underlie the actual off- shoring wave, incorporating insights and extending established models. It is our hope that the research presented here has opened the way to a proliferation in studies that will critically reassess the dominant models of internationalization in order to evaluate their usefulness in representing the current international relocation of value activities undertaken by Western firms.
9.5. Conclusion
Companies in developed, high-cost economies are increasingly migrating white-collar activities to offshore locations. recent stud-ies consistently show that enterprises are progressively sourcing higher-skilled technical, engineering, and scientific jobs abroad. The purpose of this chapter was to investigate why and how Western firms currently offshore product development activities. our main argument is that the current process of offshoring in-novation work radically differs from previous waves of internation-alization. Thus, this study contributes to the existing IM literature on two grounds. First, it shows that the only driver for the actual offshoring of knowledge-intensive activities is the search for tal-ent. Contrary to the general perception that offshoring is gaining popularity as a means to take advantage of labor cost differentials, the results obtained clearly show that Western companies, when
[ 248 ] offshoring in the global economy
engaging in Pdo, are seeking new talent to expand their skill pool and not as a way to cut labor costs. This finding corroborates the hypothesis that accessing global talent pools and reducing costs are two different offshoring strategies that companies pursue in different circumstances (lewin et al. 2007). While labor cost ar-bitrage remains a fundamental driver in migration related to IT, and administrative and other back office functions (Nachum and Zaheer 2005; Pisani 2007), it does not play a role when relocating higher-skilled innovation work.
The second contribution of this study is related to the process model currently followed by firms engaging in Pdo. While the dominant model of internationalization (Johanson and Vahlne 1977) predicts that firms gradually increase their international commitment based on their international investment experience, and thus on their increasing magnitude of operations in less fa-miliar environments, we showed that the current process of off- shoring follows a different pattern. While some of the insights of the stages model still hold nowadays, others need to be reassessed. For instance, international experience is no longer a reliable pre-dictor for understanding the level of international commitment of a company. younger, relatively inexperienced firms that are characterized by high levels of flexibility and propensity to inno-vation (Knight and Cavusgil 2004) are leveraging current techno-logical advances to source, locate, and organize human capital on a global scale. Cultural differences are also no longer a source of major concern for those firms willing to create geographically dis-tributed teams of talented professionals. Moreover, our findings show that the size of the company does not influence the com-plexity of its international activities as it did in the past (Chandler 1986). on the other hand, policy uncertainty of the offshore en-vironment continues to play a major role in shaping the offshor-ing of innovation work. Furthermore, companies involved in the creation and transfer of knowledge across borders also continue to choose captive models for their international activities.
a final note: how should we interpret these findings in terms of policy implications for the Western labor market? developing regions are becoming competitive sources of talent for Western companies. High-cost developed countries need to focus on the
offshoring and the global sourcing of talent [ 249 ]
creation and retention of talent at home if they want to remain competitive in the production of innovation work. The generalized perception that higher-skilled jobs are being relocated offshore for an arbitrage opportunity on labor cost differentials is danger-ously misleading. This study shows that cost is not a major factor for companies relocating product development activities abroad. Those companies that invest in a global source of talent do so with the goal of creating new knowledge and not to merely substitute workers at home. In other words, the offshoring of higher-skilled talent initiated by Western companies should not be classified simply as negative for the home economies. rather, it should be considered an important opportunity to update and improve the ability to innovate at home.
For this reason, in chapter 10 we discuss the Spanish case as drawn from the orN study. This is an issue of significant domestic concern, both for Spanish entrepreneurs and policymakers alike.

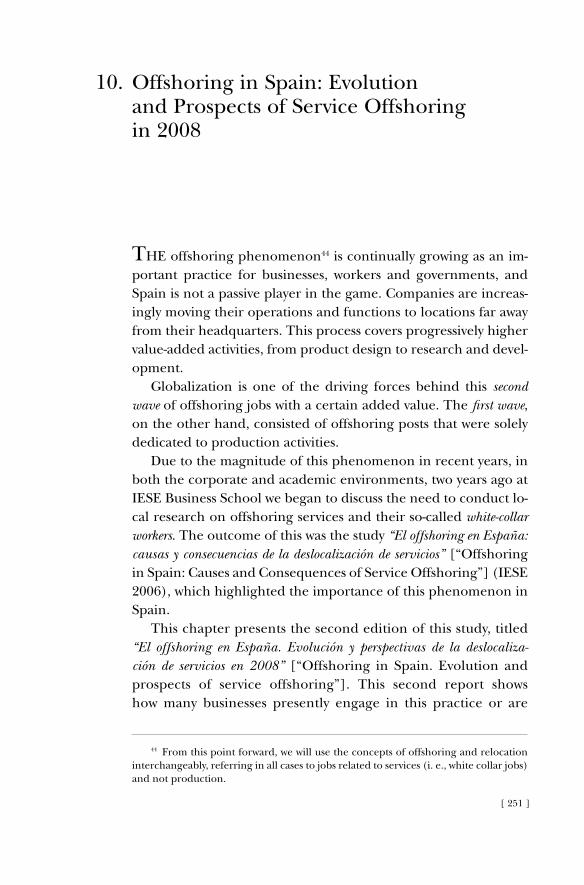
[ 251 ]
offshoring in Spain: Evolution and Prospects of Service offshoring in 2008
THE offshoring phenomenon44 is continually growing as an im-portant practice for businesses, workers and governments, and Spain is not a passive player in the game. Companies are increas-ingly moving their operations and functions to locations far away from their headquarters. This process covers progressively higher value-added activities, from product design to research and devel-opment.
Globalization is one of the driving forces behind this second wave of offshoring jobs with a certain added value. The first wave, on the other hand, consisted of offshoring posts that were solely dedicated to production activities.
due to the magnitude of this phenomenon in recent years, in both the corporate and academic environments, two years ago at IESE Business School we began to discuss the need to conduct lo-cal research on offshoring services and their so-called white-collar workers. The outcome of this was the study “El offshoring en España: causas y consecuencias de la deslocalización de servicios” [“offshoring in Spain: Causes and Consequences of Service offshoring”] (IESE 2006), which highlighted the importance of this phenomenon in Spain.
This chapter presents the second edition of this study, titled “El offshoring en España. Evolución y perspectivas de la deslocaliza-ción de servicios en 2008” [“offshoring in Spain. Evolution and prospects of service offshoring”]. This second report shows how many businesses presently engage in this practice or are
44 From this point forward, we will use the concepts of offshoring and relocation interchangeably, referring in all cases to jobs related to services (i. e., white collar jobs) and not production.
10.
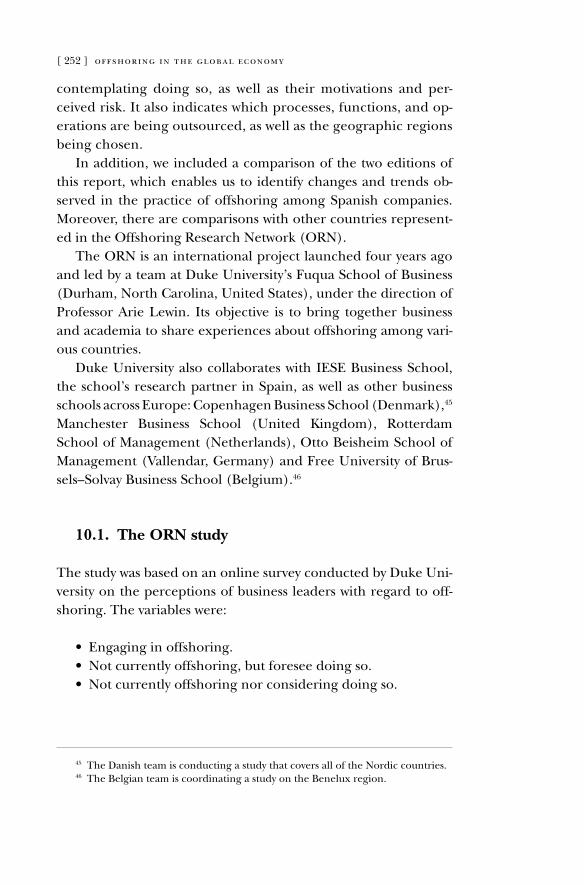
[ 252 ] offshoring in the global economy
contemplating doing so, as well as their motivations and per-ceived risk. It also indicates which processes, functions, and op-erations are being outsourced, as well as the geographic regions being chosen.
In addition, we included a comparison of the two editions of this report, which enables us to identify changes and trends ob-served in the practice of offshoring among Spanish companies. Moreover, there are comparisons with other countries represent-ed in the offshoring research Network (orN).
The orN is an international project launched four years ago and led by a team at duke University’s Fuqua School of Business (durham, North Carolina, United States), under the direction of Professor arie lewin. Its objective is to bring together business and academia to share experiences about offshoring among vari-ous countries.
duke University also collaborates with IESE Business School, the school’s research partner in Spain, as well as other business schools across Europe: Copenhagen Business School (denmark),45 Manchester Business School (United Kingdom), rotterdam School of Management (Netherlands), otto Beisheim School of Management (Vallendar, Germany) and Free University of Brus-sels–Solvay Business School (Belgium).46
10.1. The ORN study
The study was based on an online survey conducted by duke Uni-versity on the perceptions of business leaders with regard to off-shoring. The variables were:
• Engaging in offshoring.• Not currently offshoring, but foresee doing so.• Not currently offshoring nor considering doing so.
45 The danish team is conducting a study that covers all of the Nordic countries.46 The Belgian team is coordinating a study on the Benelux region.
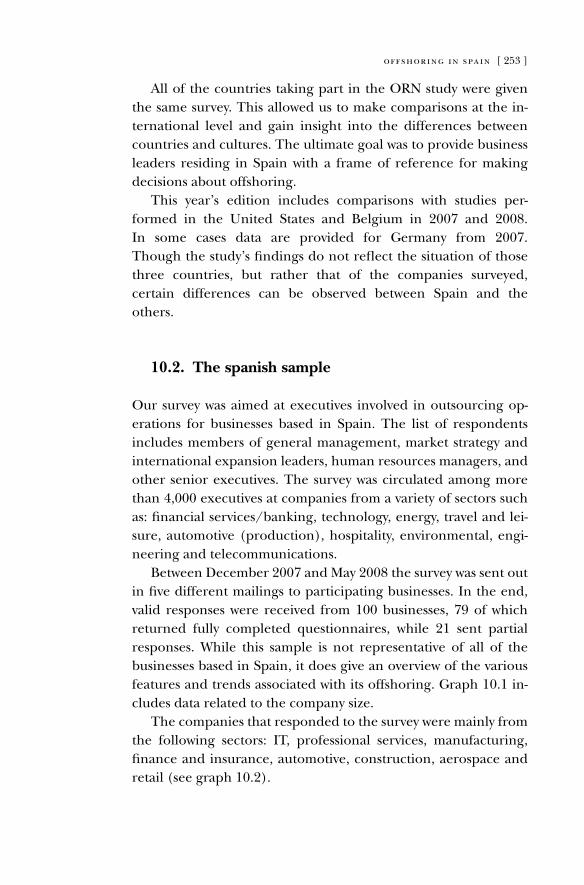
offshoring in spain [ 253 ]
all of the countries taking part in the orN study were given the same survey. This allowed us to make comparisons at the in-ternational level and gain insight into the differences between countries and cultures. The ultimate goal was to provide business leaders residing in Spain with a frame of reference for making decisions about offshoring.
This year’s edition includes comparisons with studies per-formed in the United States and Belgium in 2007 and 2008. In some cases data are provided for Germany from 2007. Though the study’s findings do not reflect the situation of those three countries, but rather that of the companies surveyed, certain differences can be observed between Spain and the others.
10.2. The spanish sample
our survey was aimed at executives involved in outsourcing op-erations for businesses based in Spain. The list of respondents includes members of general management, market strategy and international expansion leaders, human resources managers, and other senior executives. The survey was circulated among more than 4,000 executives at companies from a variety of sectors such as: financial services/banking, technology, energy, travel and lei-sure, automotive (production), hospitality, environmental, engi-neering and telecommunications.
Between december 2007 and May 2008 the survey was sent out in five different mailings to participating businesses. In the end, valid responses were received from 100 businesses, 79 of which returned fully completed questionnaires, while 21 sent partial responses. While this sample is not representative of all of the businesses based in Spain, it does give an overview of the various features and trends associated with its offshoring. Graph 10.1 in-cludes data related to the company size.
The companies that responded to the survey were mainly from the following sectors: IT, professional services, manufacturing, finance and insurance, automotive, construction, aerospace and retail (see graph 10.2).
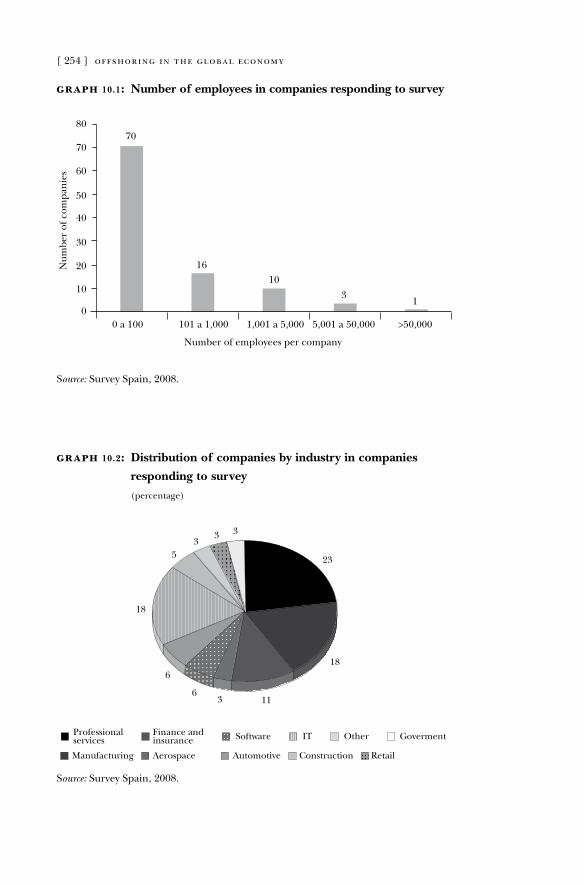
[ 254 ] offshoring in the global economy
Source: Survey Spain, 2008.
graph 10.1: Number of employees in companies responding to survey
70
80
60
40
50
Num
ber
of c
ompa
nie
s
30
20
10
0 a 100 101 a 1,000
Number of employees per company
1,001 a 5,000 5,001 a 50,000 >50,000
70
1610
31
0
Source: Survey Spain, 2008.
graph 10.2: Distribution of companies by industry in companies
responding to survey
(percentage)
23
18
1136
6
18
53
3 3
IT Other GovermentProfessionalservices
Finance andinsurance Software
Construction RetailManufacturing Aerospace Automotive
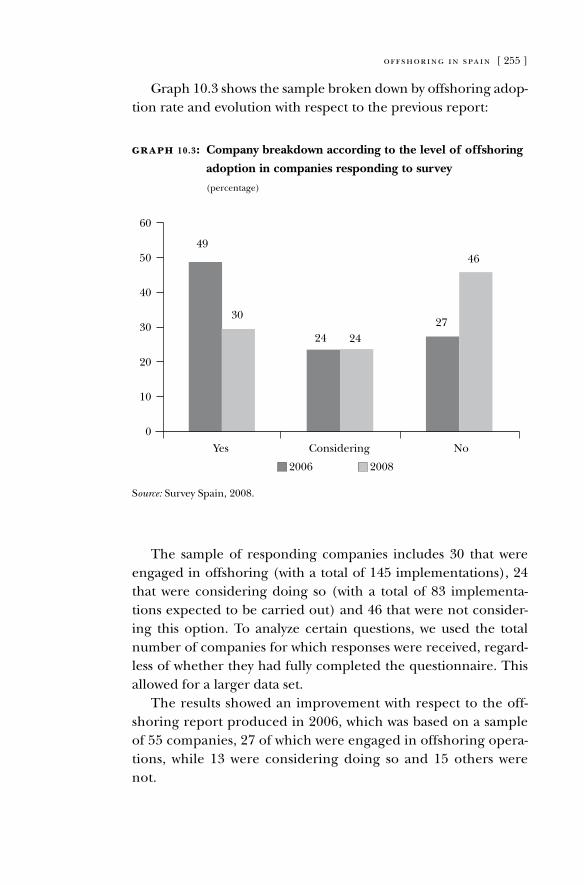
offshoring in spain [ 255 ]
Graph 10.3 shows the sample broken down by offshoring adop-tion rate and evolution with respect to the previous report:
Source: Survey Spain, 2008.
graph 10.3: Company breakdown according to the level of offshoring
adoption in companies responding to survey
(percentage)
60
49
30
24 2427
4650
40
30
20
10
Yes
2006 2008
Considering No0
The sample of responding companies includes 30 that were engaged in offshoring (with a total of 145 implementations), 24 that were considering doing so (with a total of 83 implementa-tions expected to be carried out) and 46 that were not consider-ing this option. To analyze certain questions, we used the total number of companies for which responses were received, regard-less of whether they had fully completed the questionnaire. This allowed for a larger data set.
The results showed an improvement with respect to the off-shoring report produced in 2006, which was based on a sample of 55 companies, 27 of which were engaged in offshoring opera-tions, while 13 were considering doing so and 15 others were not.
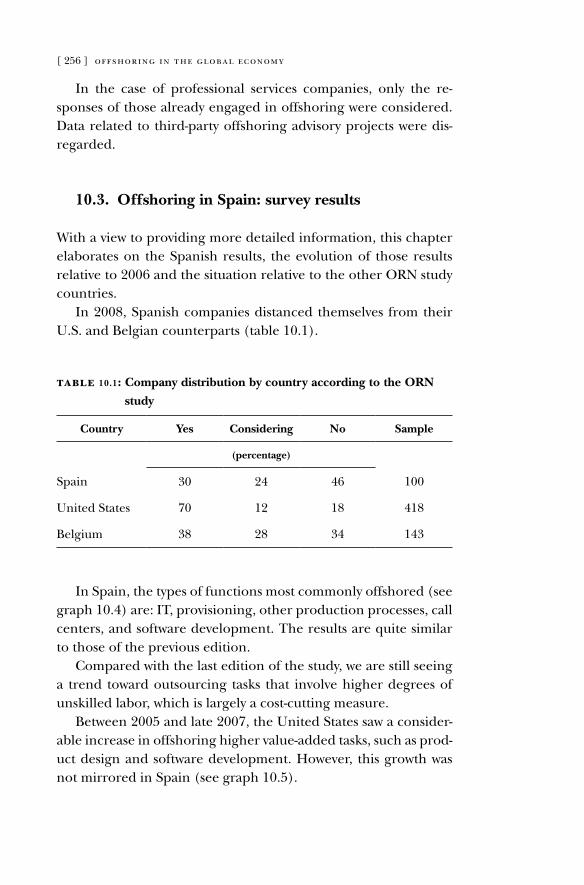
[ 256 ] offshoring in the global economy
In the case of professional services companies, only the re-sponses of those already engaged in offshoring were considered. data related to third-party offshoring advisory projects were dis-regarded.
10.3. Offshoring in Spain: survey results
With a view to providing more detailed information, this chapter elaborates on the Spanish results, the evolution of those results relative to 2006 and the situation relative to the other orN study countries.
In 2008, Spanish companies distanced themselves from their U.S. and Belgian counterparts (table 10.1).
table 10.1: Company distribution by country according to the ORN
study
Country Yes Considering No Sample
(percentage)
Spain 30 24 46 100
United States 70 12 18 418
Belgium 38 28 34 143
In Spain, the types of functions most commonly offshored (see graph 10.4) are: IT, provisioning, other production processes, call centers, and software development. The results are quite similar to those of the previous edition.
Compared with the last edition of the study, we are still seeing a trend toward outsourcing tasks that involve higher degrees of unskilled labor, which is largely a cost-cutting measure.
Between 2005 and late 2007, the United States saw a consider-able increase in offshoring higher value-added tasks, such as prod-uct design and software development. However, this growth was not mirrored in Spain (see graph 10.5).
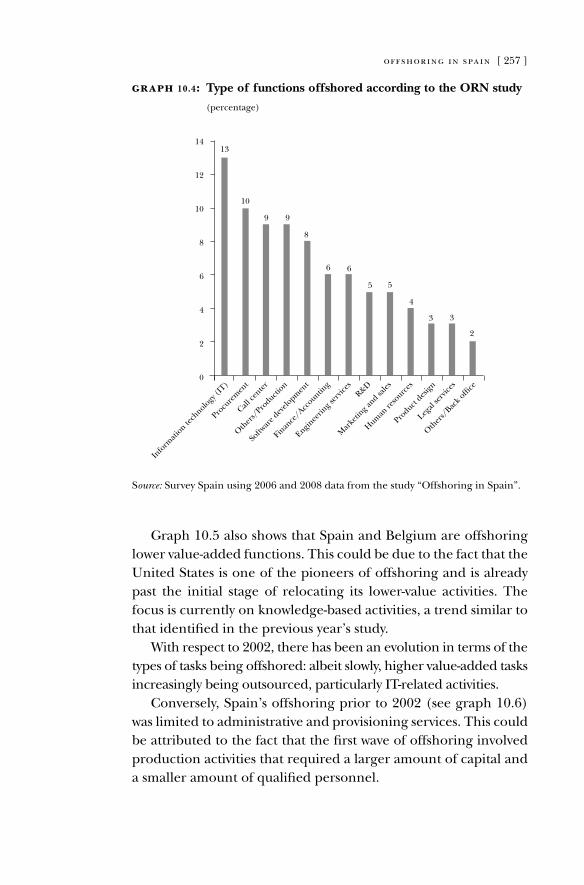
offshoring in spain [ 257 ]
Source: Survey Spain using 2006 and 2008 data from the study “offshoring in Spain”.
graph 10.4: Type of functions offshored according to the ORN study
(percentage)
Info
rmati
on tech
nology
(IT)
Procu
rem
ent
Call ce
nter
13
10
9 9
8
6 6
5 5
4
3 3
2
0
2
4
6
8
10
12
14
Other
s/Pro
duction
Softw
are d
evelo
pmen
t
Finan
ce/Acc
ounting
Enginee
ring s
ervic
esR&D
Mar
ketin
g and sa
les
Human
reso
urces
Product
design
Legal
serv
ices
Other
s/Bac
k of�
ce
Graph 10.5 also shows that Spain and Belgium are offshoring lower value-added functions. This could be due to the fact that the United States is one of the pioneers of offshoring and is already past the initial stage of relocating its lower-value activities. The focus is currently on knowledge-based activities, a trend similar to that identified in the previous year’s study.
With respect to 2002, there has been an evolution in terms of the types of tasks being offshored: albeit slowly, higher value-added tasks increasingly being outsourced, particularly IT-related activities.
Conversely, Spain’s offshoring prior to 2002 (see graph 10.6) was limited to administrative and provisioning services. This could be attributed to the fact that the first wave of offshoring involved production activities that required a larger amount of capital and a smaller amount of qualified personnel.
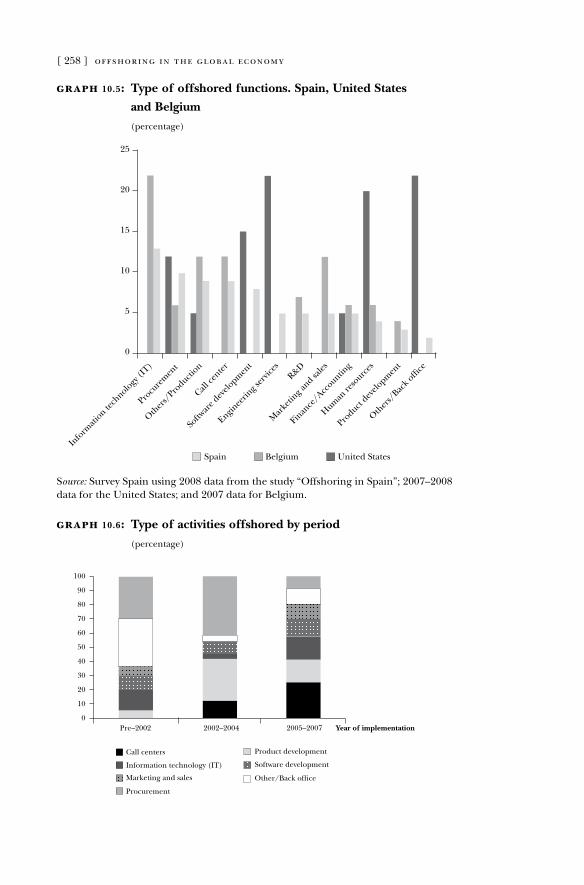
[ 258 ] offshoring in the global economy
Source: Survey Spain using 2008 data from the study “offshoring in Spain”; 2007–2008 data for the United States; and 2007 data for Belgium.
graph 10.5: Type of offshored functions. Spain, United States
and Belgium
(percentage)
Info
rmati
on tech
nology
(IT)
Procu
rem
ent
0
5
10
15
20
25
Other
s/Pro
duction
Softw
are d
evelo
pmen
t
Call ce
nter
Enginee
ring s
ervic
esR&D
Mar
ketin
g and sa
les
Human
reso
urces
Finan
ce/Acc
ounting
Product
develo
pmen
t
Other
s/Bac
k offi
ce
Spain Belgium United States
graph 10.6: Type of activities offshored by period
(percentage)
80
100
60
40
20
10
30
50
70
90
Pre–2002 2002–2004 2005–2007 Year of implementation0
Call centers
Other/Back of�ce
Product development
Information technology (IT)
Marketing and sales
Software development
Procurement
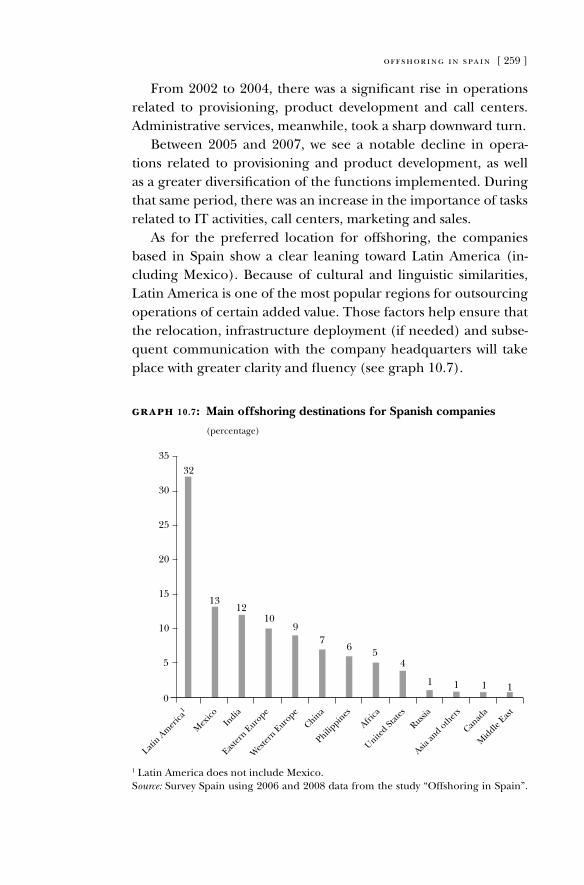
offshoring in spain [ 259 ]
From 2002 to 2004, there was a significant rise in operations related to provisioning, product development and call centers. administrative services, meanwhile, took a sharp downward turn.
Between 2005 and 2007, we see a notable decline in opera-tions related to provisioning and product development, as well as a greater diversification of the functions implemented. during that same period, there was an increase in the importance of tasks related to IT activities, call centers, marketing and sales.
as for the preferred location for offshoring, the companies based in Spain show a clear leaning toward latin america (in-cluding Mexico). Because of cultural and linguistic similarities, latin america is one of the most popular regions for outsourcing operations of certain added value. Those factors help ensure that the relocation, infrastructure deployment (if needed) and subse-quent communication with the company headquarters will take place with greater clarity and fluency (see graph 10.7).
1 latin america does not include Mexico.Source: Survey Spain using 2006 and 2008 data from the study “offshoring in Spain”.
graph 10.7: Main offshoring destinations for Spanish companies
(percentage)
Latin A
mer
ica1
Mex
ico
32
1213
109
76 5
4
1 1 10
5
10
15
20
25
30
35
India
Wes
tern E
urope
Easter
n Euro
pe
China
Philippin
es
Africa
Russia
United St
ates
Asia an
d other
s
Canad
a
Mid
dle Eas
t
1
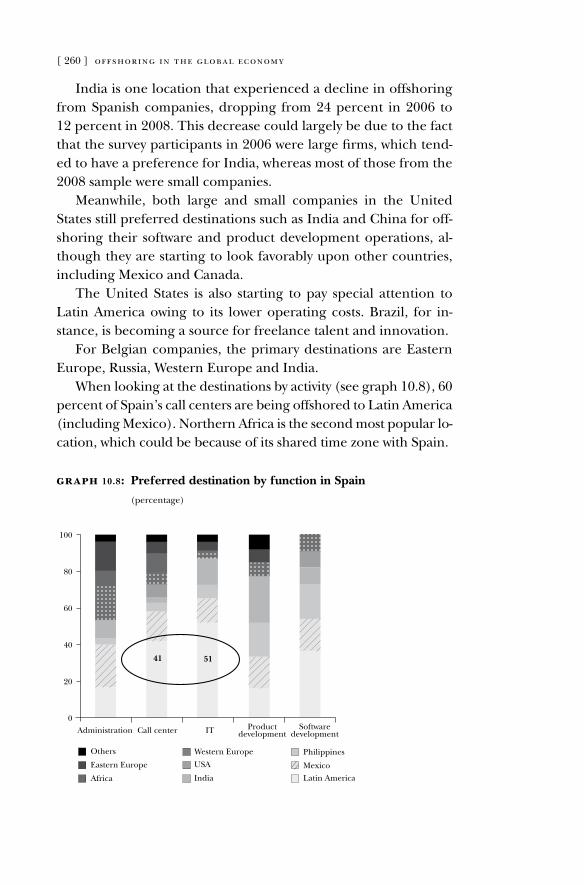
[ 260 ] offshoring in the global economy
India is one location that experienced a decline in offshoring from Spanish companies, dropping from 24 percent in 2006 to 12 percent in 2008. This decrease could largely be due to the fact that the survey participants in 2006 were large firms, which tend-ed to have a preference for India, whereas most of those from the 2008 sample were small companies.
Meanwhile, both large and small companies in the United States still preferred destinations such as India and China for off-shoring their software and product development operations, al-though they are starting to look favorably upon other countries, including Mexico and Canada.
The United States is also starting to pay special attention to latin america owing to its lower operating costs. Brazil, for in-stance, is becoming a source for freelance talent and innovation.
For Belgian companies, the primary destinations are Eastern Europe, russia, Western Europe and India.
When looking at the destinations by activity (see graph 10.8), 60 percent of Spain’s call centers are being offshored to latin america (including Mexico). Northern africa is the second most popular lo-cation, which could be because of its shared time zone with Spain.
graph 10.8: Preferred destination by function in Spain
(percentage)
100
80
60
40
20
Administration Call center IT Productdevelopment
Softwaredevelopment
0
Others
Eastern Europe
Africa
USA
India
Western Europe Philippines
Mexico
Latin America
41 51
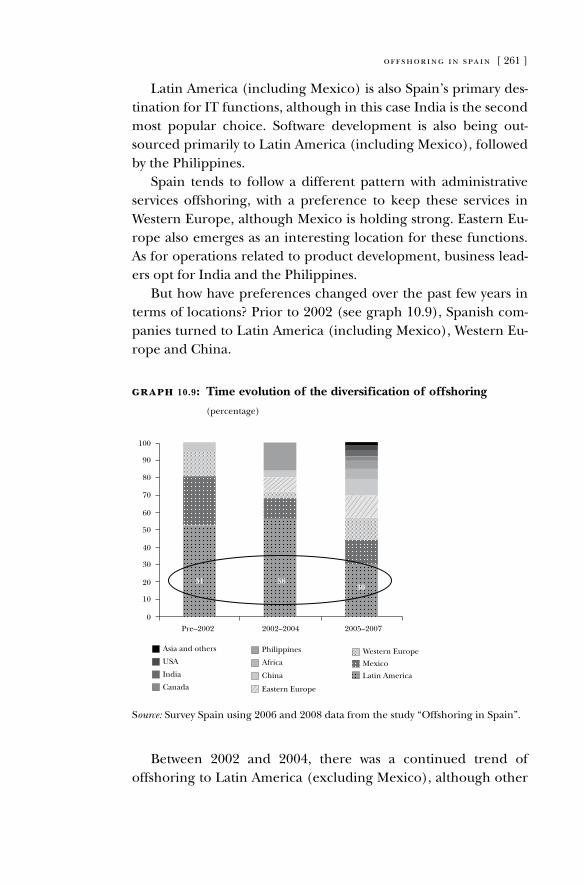
offshoring in spain [ 261 ]
latin america (including Mexico) is also Spain’s primary des-tination for IT functions, although in this case India is the second most popular choice. Software development is also being out-sourced primarily to latin america (including Mexico), followed by the Philippines.
Spain tends to follow a different pattern with administrative services offshoring, with a preference to keep these services in Western Europe, although Mexico is holding strong. Eastern Eu-rope also emerges as an interesting location for these functions. as for operations related to product development, business lead-ers opt for India and the Philippines.
But how have preferences changed over the past few years in terms of locations? Prior to 2002 (see graph 10.9), Spanish com-panies turned to latin america (including Mexico), Western Eu-rope and China.
Source: Survey Spain using 2006 and 2008 data from the study “offshoring in Spain”.
graph 10.9: Time evolution of the diversification of offshoring
(percentage)
100
90
80
70
60
50
40
20
10
30
Pre–2002 2005–20072002–20040
Asia and others
USA
India
Philippines
Africa
CanadaChina
Eastern Europe
Western Europe
Mexico
Latin America
51 5630
Between 2002 and 2004, there was a continued trend of offshoring to latin america (excluding Mexico), although other
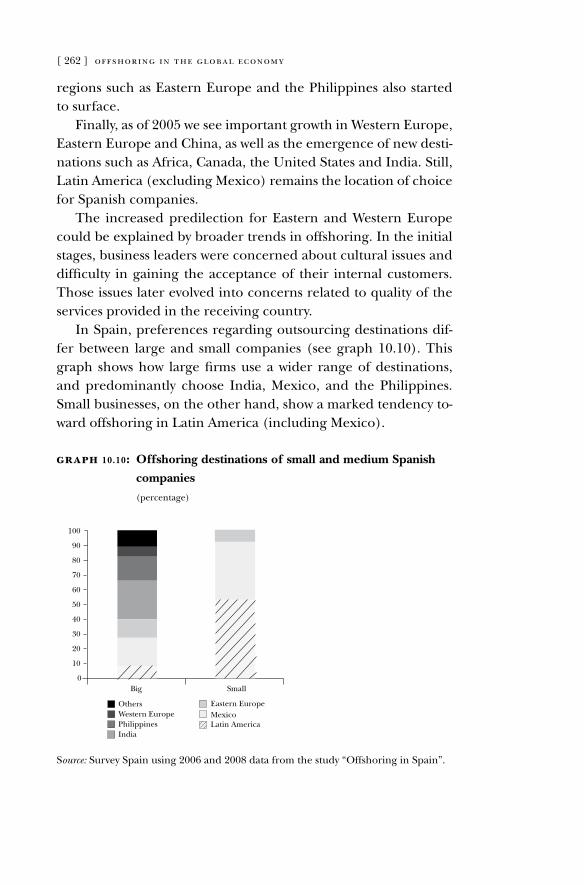
[ 262 ] offshoring in the global economy
regions such as Eastern Europe and the Philippines also started to surface.
Finally, as of 2005 we see important growth in Western Europe, Eastern Europe and China, as well as the emergence of new desti-nations such as africa, Canada, the United States and India. Still, latin america (excluding Mexico) remains the location of choice for Spanish companies.
The increased predilection for Eastern and Western Europe could be explained by broader trends in offshoring. In the initial stages, business leaders were concerned about cultural issues and difficulty in gaining the acceptance of their internal customers. Those issues later evolved into concerns related to quality of the services provided in the receiving country.
In Spain, preferences regarding outsourcing destinations dif-fer between large and small companies (see graph 10.10). This graph shows how large firms use a wider range of destinations, and predominantly choose India, Mexico, and the Philippines. Small businesses, on the other hand, show a marked tendency to-ward offshoring in latin america (including Mexico).
Source: Survey Spain using 2006 and 2008 data from the study “offshoring in Spain”.
graph 10.10: Offshoring destinations of small and medium Spanish
companies
(percentage)
70
80
90
100
60
50
40
30
20
10
Big Small
OthersWestern EuropePhilippinesIndia
Eastern EuropeMexicoLatin America
0
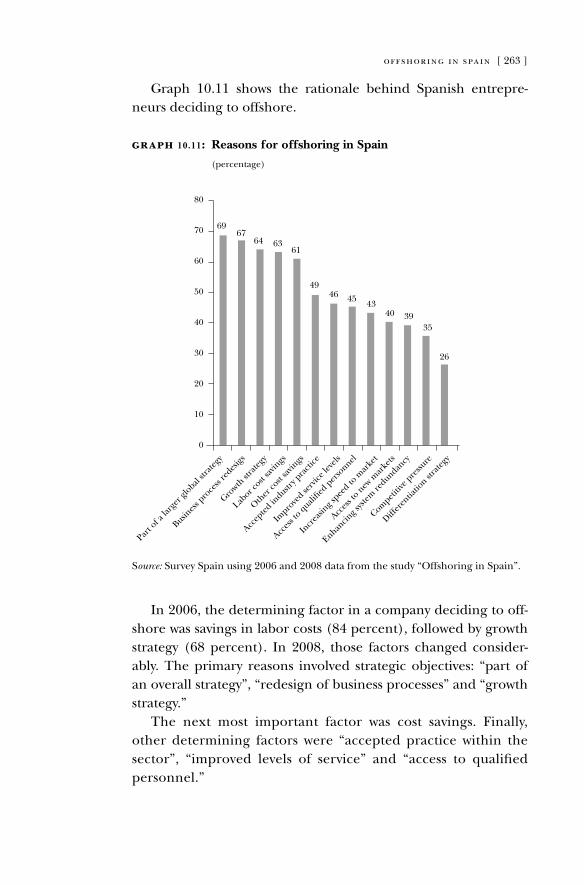
offshoring in spain [ 263 ]
Graph 10.11 shows the rationale behind Spanish entrepre-neurs deciding to offshore.
Source: Survey Spain using 2006 and 2008 data from the study “offshoring in Spain”.
graph 10.11: Reasons for offshoring in Spain
(percentage)
Part o
f a la
rger
global
strate
gy
6967
6461
63
49
454643
40 3935
26
Busines
s pro
cess
redes
igs
Growth
stra
tegy
Labor c
ost sa
vings
Other
cost
savin
gs
Accep
ted in
dustry p
racti
ce
Impro
ved se
rvice
leve
ls
Acces
s to quali
fied p
erso
nnel
Incr
easin
g spee
d to m
arke
t
Acces
s to n
ew m
arke
ts
Enhancin
g syst
em re
dundancy
Competi
tive p
ressu
re
Differ
entia
tion st
rateg
y
0
10
20
30
40
50
60
70
80
In 2006, the determining factor in a company deciding to off-shore was savings in labor costs (84 percent), followed by growth strategy (68 percent). In 2008, those factors changed consider-ably. The primary reasons involved strategic objectives: “part of an overall strategy”, “redesign of business processes” and “growth strategy.”
The next most important factor was cost savings. Finally, other determining factors were “accepted practice within the sector”, “improved levels of service” and “access to qualified personnel.”
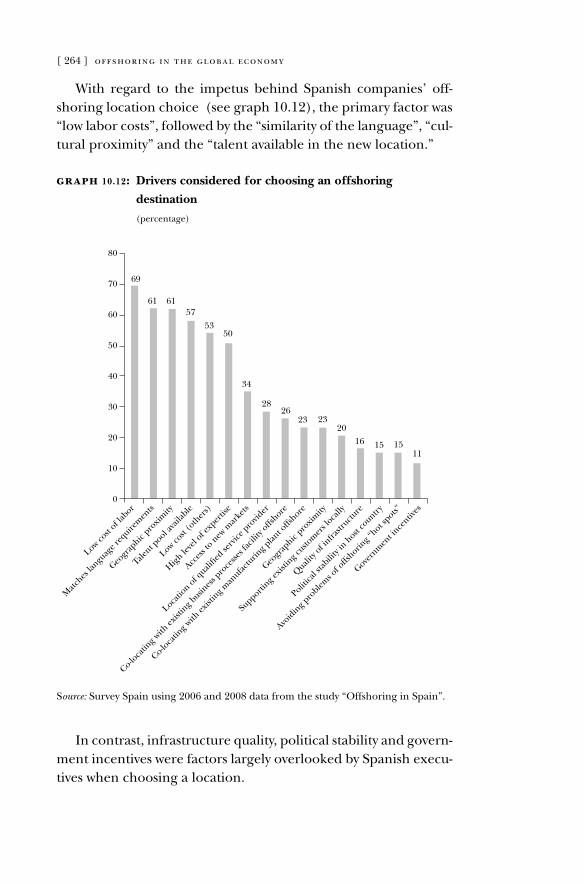
[ 264 ] offshoring in the global economy
With regard to the impetus behind Spanish companies’ off-shoring location choice (see graph 10.12), the primary factor was “low labor costs”, followed by the “similarity of the language”, “cul-tural proximity” and the “talent available in the new location.”
Source: Survey Spain using 2006 and 2008 data from the study “offshoring in Spain”.
graph 10.12: Drivers considered for choosing an offshoring
destination
(percentage)
Low cost
of lab
or
Matc
hes la
nguag
e req
uirem
ents
Geogr
aphic
proxim
ity
Talent p
ool ava
ilable
Low cost
(oth
ers)
High le
vel o
f exp
ertis
e
Acces
s to n
ew m
arke
ts
Locatio
n of quali
fied se
rvice
pro
vider
Co-loca
ting w
ith ex
istin
g busin
ess p
roce
sses f
acili
ty offs
hore
Co-loca
ting w
ith ex
istin
g man
ufactu
ring p
lant o
ffshore
Geogr
aphic
proxim
ity
Supporti
ng exis
ting c
ustom
ers l
ocally
Quality
of infra
structu
re
Politica
l stab
ility
in h
ost co
untry
Avoid
ing p
roblem
s of o
ffshorin
g “hot s
pots”
Govern
men
t ince
ntives
69
61 61
50
57
53
34
2623 23
20
16 15 1511
28
70
0
10
20
30
40
50
60
80
In contrast, infrastructure quality, political stability and govern-ment incentives were factors largely overlooked by Spanish execu-tives when choosing a location.
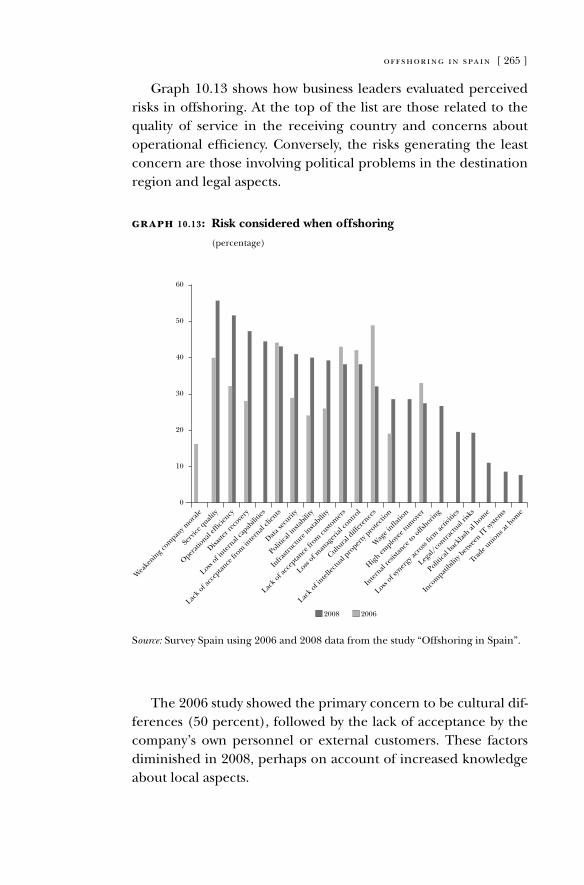
offshoring in spain [ 265 ]
Graph 10.13 shows how business leaders evaluated perceived risks in offshoring. at the top of the list are those related to the quality of service in the receiving country and concerns about operational efficiency. Conversely, the risks generating the least concern are those involving political problems in the destination region and legal aspects.
Source: Survey Spain using 2006 and 2008 data from the study “offshoring in Spain”.
graph 10.13: Risk considered when offshoring
(percentage)
Wea
kenin
g com
pany m
orale
Serv
ice quali
ty0
10
20
30
40
50
60
Operati
onal effi
ciency
Disaste
r rec
overy
Lack o
f acc
eptan
ce fr
om in
ternal
clien
ts
Data se
curit
y
Loss of i
nternal
capab
ilitie
s
Politica
l insta
bility
Infra
structu
re in
stabili
ty
Lack o
f acc
eptan
ce fr
om cu
stom
ers
Loss of m
anag
erial
contro
l
Lack o
f intel
lectu
al pro
perty
protec
tion
Cultura
l diff
eren
ces
Wag
e inflati
on
High em
ploye
e tum
over
Inter
nal re
sistan
ce to
offshorin
g
Loss of s
yner
gy ac
ross
firm ac
tiviti
es
Legal/
contra
ctual
risks
Politica
l bac
klash
al h
ome
Inco
mpati
bility
betwee
n IT sy
stem
s
Trade u
nions a
t hom
e
2008 2006
The 2006 study showed the primary concern to be cultural dif-ferences (50 percent), followed by the lack of acceptance by the company’s own personnel or external customers. These factors diminished in 2008, perhaps on account of increased knowledge about local aspects.
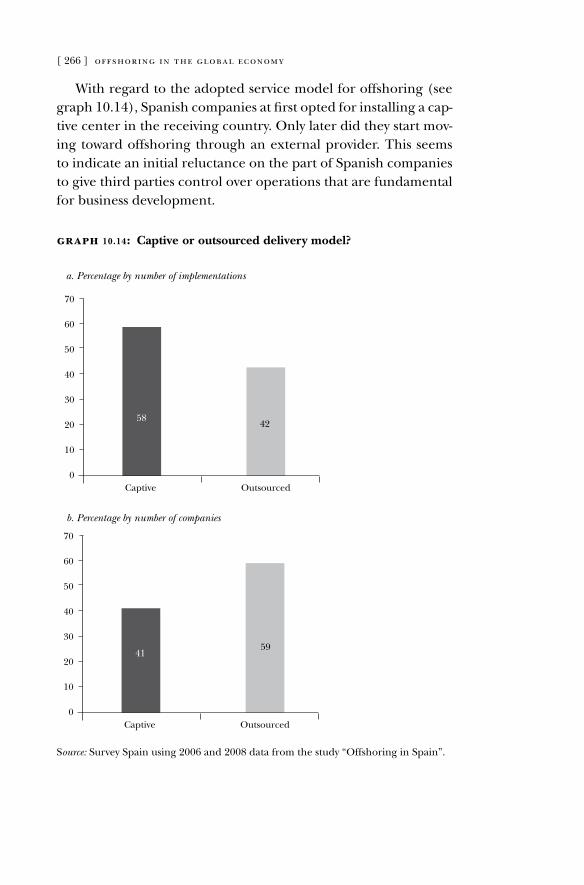
[ 266 ] offshoring in the global economy
With regard to the adopted service model for offshoring (see graph 10.14), Spanish companies at first opted for installing a cap-tive center in the receiving country. only later did they start mov-ing toward offshoring through an external provider. This seems to indicate an initial reluctance on the part of Spanish companies to give third parties control over operations that are fundamental for business development.
Source: Survey Spain using 2006 and 2008 data from the study “offshoring in Spain”.
70
60
50
40
30
20
10
Captive Outsourced
5941
0
b. Percentage by number of companies
graph 10.14: Captive or outsourced delivery model?
70
60
50
40
30
20
10
Captive Outsourced
4258
0
a. Percentage by number of implementations
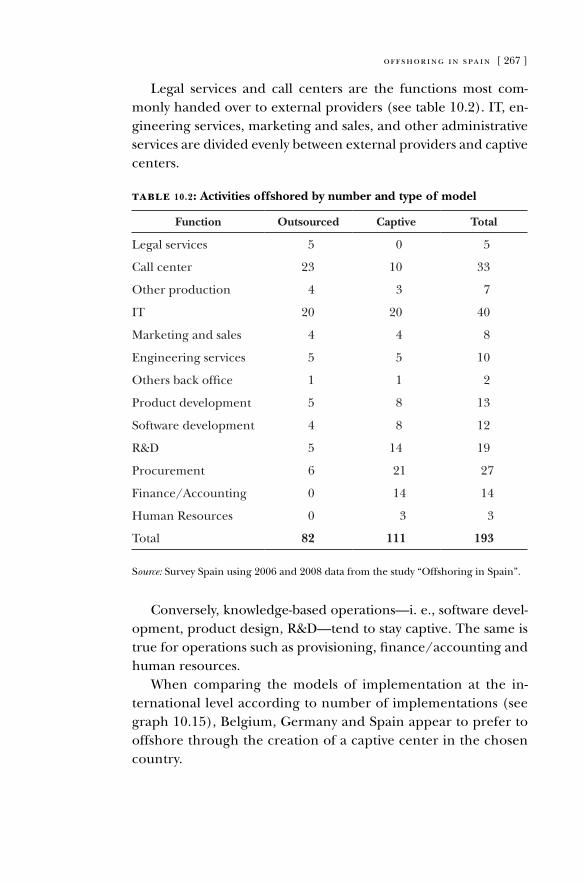
offshoring in spain [ 267 ]
legal services and call centers are the functions most com-monly handed over to external providers (see table 10.2). IT, en-gineering services, marketing and sales, and other administrative services are divided evenly between external providers and captive centers.
table 10.2: Activities offshored by number and type of model
Function Outsourced Captive Total
legal services 5 0 5
Call center 23 10 33
other production 4 3 7
IT 20 20 40
Marketing and sales 4 4 8
Engineering services 5 5 10
others back office 1 1 2
Product development 5 8 13
Software development 4 8 12
r&d 5 14 19
Procurement 6 21 27
Finance/accounting 0 14 14
Human resources 0 3 3
Total 82 111 193
Source: Survey Spain using 2006 and 2008 data from the study “offshoring in Spain”.
Conversely, knowledge-based operations—i. e., software devel-opment, product design, r&d—tend to stay captive. The same is true for operations such as provisioning, finance/accounting and human resources.
When comparing the models of implementation at the in-ternational level according to number of implementations (see graph 10.15), Belgium, Germany and Spain appear to prefer to offshore through the creation of a captive center in the chosen country.
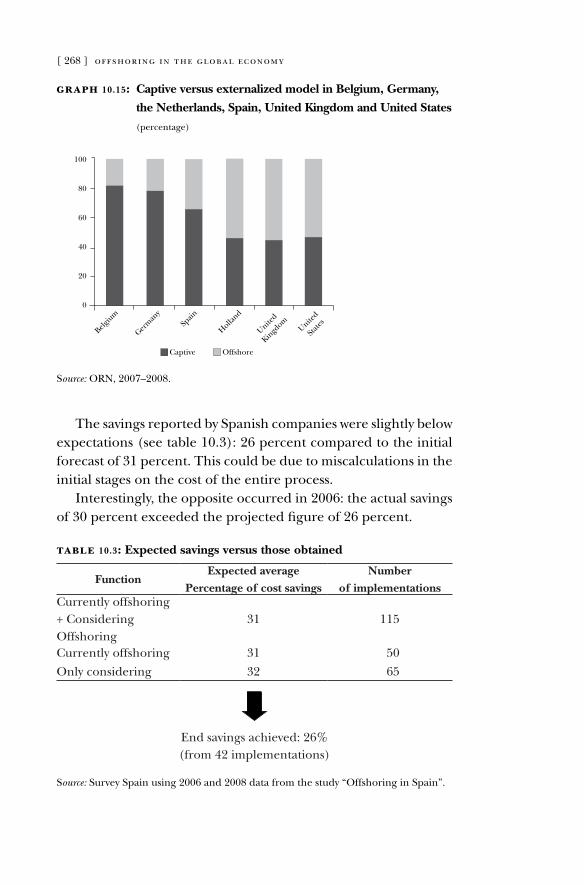
[ 268 ] offshoring in the global economy
graph 10.15: Captive versus externalized model in Belgium, Germany,
the Netherlands, Spain, United Kingdom and United States
(percentage)
80
100
60
40
20
Captive Offshore
Belgiu
m
Germ
any
Spain
Holland
United
Kingd
omUnite
d
State
s
0
Source: orN, 2007–2008.
The savings reported by Spanish companies were slightly below expectations (see table 10.3): 26 percent compared to the initial forecast of 31 percent. This could be due to miscalculations in the initial stages on the cost of the entire process.
Interestingly, the opposite occurred in 2006: the actual savings of 30 percent exceeded the projected figure of 26 percent.
table 10.3: Expected savings versus those obtained
FunctionExpected average
Percentage of cost savingsNumber
of implementationsCurrently offshoring + Considering offshoring
31 115
Currently offshoring 31 50
only considering 32 65
End savings achieved: 26%(from 42 implementations)
Source: Survey Spain using 2006 and 2008 data from the study “offshoring in Spain”.
offshoring in spain [ 269 ]
10.4. Conclusions
The data gathered by the orN along with the comparison of the questionnaires of 2006 and 2008 allow for a number of general conclusions to be drawn about the evolution of offshoring and the trends that we are seeing in this field. Moreover, these con-clusions were discussed in a work session with executives from a variety of companies and service providers involved in offshoring operations. The impressions from that session can be summed up in the following points:
Spain is moving swiftly1. despite getting off to a late start with offshoring, Spain is
now advancing quickly. large Spanish firms have already systematized the process and integrated it into their over-all strategy, encouraging local service providers to also offer offshoring opportunities.
2. Meanwhile, small- and medium-sized businesses have al-ready jumped on the offshoring bandwagon, particularly when it comes to IT-related services, where it is increasingly hard to find good professionals at a reasonable cost.
Customer service and basic IT functions are the most commonSpanish companies tend to outsource lower added value tasks
such as IT and call centers more often compared to the United States.
Latin America is the preferred destination1. latin america (including Mexico) is the primary receiv-
er of outsourcing for the above-mentioned operations. This is primarily due to the low labor costs (69 percent), language similarity (61 percent), cultural proximity (61 percent) and available appropriately skilled talent (57 per-cent).
2. Nevertheless, we are seeing notable differences in out- sourcing selection among the region’s various countries, which is mainly due to the varying states of key offshoring issues, such as the inherent risk of the country.
[ 270 ] offshoring in the global economy
3. Brazil has become a major global force in offshoring, de-spite the language factor, which acts as a limitation for cer-tain processes and operations to be offshored.
4. additionally, there is a progressive relocation from large cities to smaller cities, which have the advantage of more flexible laws in addition to skilled personnel, which is in-creasingly scarce in metropolises. one example of this can be seen in argentina, where migration is taking place from Buenos aires to inland cities such as Córdoba and rosa-rio, now in the midst of becoming important technological centers.
Size does mattera very significant trend based on company size is develop-
ing with respect to offshoring preferences. large firms show a marked tendency toward offshoring in India, Mexico and the Philippines, whereas smaller companies prefer latin america (including Mexico).
Appearance of new regions1. Current implementation trends reveal that latin america is
losing momentum as a receiver of offshoring operations, to the benefit of emerging regions such as Eastern and West-ern Europe. The latter region has become receiver of pri-marily administrative functions, which is likely due to the physical proximity and ease of relocation.
2. Meanwhile, africa is emerging as an alternative destination for outsourcing call centers, although its limited supply of skilled labor still constitutes a significant operational risk. However, it is worth noting that training opportunities are being made available, similar to internship grants in East-ern countries.
3. In the coming years, China could evolve into a highly attrac-tive outsourcing destination.
Three reasons for offshoringThe determining factors for offshoring can be broken down
into three levels. The first level, when strategy is the major con-
offshoring in spain [ 271 ]
cern, is the most important: “following an overall strategy” (69 per-cent), “business redesign” (67 percent) and “growth strategy” (64 percent). The second level involves “saving on labor costs” (63 per-cent). The third cites offshoring as an “accepted practice within the sector” (49 percent), claims that it enables companies to offer “improved levels of service” (46 percent) or that it provides “access to qualified personnel” (45 percent).
Costs, language and talent: keys when choosing a locationWhen choosing between different offshoring destinations,
Spanish companies primarily look for those with “low labor costs” (69 percent). Secondly, they value “cultural similarity and proxim-ity” (61 percent) and, to a lesser extent, the “available talent” (57 percent).
New concernsThe offshoring risks perceived by business leaders changed
from 2006 to 2008. The results from 2008 indicate that they are less concerned about cultural factors. Conversely, Spanish execu-tives are more interested in the quality of service (56 percent) and operational efficiency of the receiving country (51 percent).
The captive center is the first step toward offshoringThe model most chosen by Spanish companies during the first
stage was offshoring through a captive center, which allowed them to retain complete control of the operations. They are now mov-ing toward offshoring through external providers.
External providers for lower-value tasks Spanish companies tend to assign lower-added-value tasks to
external provider offshoring such as legal services and call cen- ters. However, knowledge-based operations, such as product de-velopment, software design and r&d, tend to stay captive.
Savings lower than expectedactual savings were lower than the estimated figure (about 26
percent versus 31 percent).

[ 272 ] offshoring in the global economy
Image of complexityWhether in Spain or the United States, offshoring is an increas-
ingly complex undertaking for businesses. In order to shed this image, the sector should focus not only on keeping prices down, but also on operating with total transparency for the end custom-ers and ensuring they receive the required service carried out to their expectations.
Having described the Spanish scenario, we will conclude part two with practical recommendations for both the Spanish and in-ternational business communities.
[ 273 ]
The offshoring of High-Value Services and the Globalization of Capability Sourcing
WE end this book with some thoughts on the offshoring of high-value services, and the globalization of resources for these ac-tivities. offshoring used to be synonymous with the pursuit of a low-cost strategy. In traditional or first-generation business process offshoring, firms would send highly standardized or highly repeti-tive low-skill business processes to workers in countries with sig-nificantly lower labor costs. as such, any labor-intensive tasks that could be codified and transmitted over long distances were can-didates for the offshorer’s axe, in firms faced with increasing cost pressures in their home markets. However, recent surveys repeat-edly show that there are significant changes happening in terms of why and how firms offshore services.
as technological advances have made working across geographi-cally dispersed locations increasingly easier, and emerging-economy governments have increased investments in infrastructure and education, pools of skilled workers are being accessed and brought online all over the world. Many firms are beginning to discover un-expected pools of untapped talent in countries previously consid-ered uninteresting, and a global scramble for talent appears to be on the verge of taking off. as a result, managers are increasingly citing the desire to access pools of high-quality talent across the globe as one of the prime drivers of their offshoring initiatives.
These developments have very important implications for the future performance of firms that are already engaged in offshoring
11.
acknowledgments: The authors are grateful to BBVa Foundation for financial support through project grant 162/06. This chapter was prepared as a technical note of the Center for Globalization and Strategy, IESE Business School. No part of this chapter may be reproduced without written permission from IESE Business School.
[ 274 ] offshoring in the global economy
and/or outsourcing, as well as for those that are yet to implement such initiatives.
Early movers have had an advantage up to now in terms of ac-cess to high-quality talent (sometimes better than that available at home), at substantially lower costs than in their home countries. However, they are increasingly faced with significant challenges such as coordinating and managing globally dispersed workforces, managerial and employee satisfaction and motivation, and the complexity of making multifaceted decisions regarding the best locations for setting up operations and sourcing capabilities.
Firms that are only now beginning to join this second generation of offshoring are also faced with the challenge of deciding how to adapt to changes in pattern of global capability sourcing. Importantly, the question of where best to obtain which high-quality talent remains a challenge. as the rush for hotspot locations begins to cause some la-bor markets to overheat, second-movers have to carefully decide how to identify possible locations, how and where to invest, and how to create distinctive value. Thus, both early and late movers need to carefully articulate and execute their global strategies.
at the political level, countries on both ends of the spec-trum are challenged by current trends in services offshoring. Specifically, while developed countries are faced with the chal-lenge of replacing their dwindling science and engineering work-forces, emerging-market governments are faced either with the need to retain their country’s competitiveness in the face of new offshoring destinations or to compete with more established and well-known locations.
Consequently, it seems that the emerging trend towards off-shoring high-value services will have an important multi-level im-pact across the parties involved. From the business manager point of view, however, it does not seem too far-fetched to suggest that we might be witnessing the birth of a (relatively) global market for high-value capabilities. If competitive advantage and long-term business success are underpinned by the deployment of special-ized resources and capabilities, then the implication is that the ability to tackle the challenges raised by this emergent situation will go a long way in determining which firms will win and which ones will lose in the coming century.
the offshoring of high-value services… [ 275 ]
In this chapter, we delineate the origins and drivers of this in-cipient global scramble for talent, as well as identify current ma-jor managerial challenges for firms. Managers that are better pre-pared to face these challenges will more likely be able to lead their firms to superior performance in the face of the semi-globalization of capability sourcing.
The next section considers the drivers of the current evolution from low- to high-value-added offshoring of services and then dis-cusses some of the challenges high-value-added offshoring brings with it.
11.1. From sweatshops to R&D labs
recalling that offshoring refers to the practice of migrating com-pany activities to locations outside of their countries of origin, it is therefore a decision based on geographic boundaries rather than company boundaries (as is the case of outsourcing).
offshoring per se is not a new phenomenon. It dates back to the 1960s and 1970s when Western manufacturing jobs began to be relocated abroad in search of lower production costs. By locating operations in low-labor-cost countries, Western manufacturing firms attempted to rein in escalating costs and to maintain their competitiveness in the face of cheaper, quality imports. Countries like Taiwan and Korea thus benefited from early offshoring invest-ments. although such countries initially added little value beyond low labor costs, some were able to build on foreign direct invest-ments to raise standards to world-class manufacturing levels.
The late 1980s and early 1990s witnessed the birth of the core competence revolution, along with a continuing need to con-tain costs in the face of low-priced, high-quality foreign goods. as Western businesses sought to focus on their core competencies, business process outsourcing came into its own. outsourcing firms sought to deliver cost and efficiency benefits by performing a re-duced number of functions in high volume across many clients.
However, as technology and communications infrastructures began to improve in previously underdeveloped nations, some business process outsourcing started to give way to business process
[ 276 ] offshoring in the global economy
offshoring. at the turn of the century, countries like India benefited from technology and telecommunications investments occasioned by the dot-com bubble and worries over the y2K (year 2000) bug. It thus became increasingly attractive to send some outsourcing or captive work to such countries (preeminently India in this first phase) where advancements in collaboration technologies were beginning to unlock access to hordes of skilled, English-speaking workers. at this stage though, the focus remained on lower-skill, high-volume operations such as credit card processing, call cen- ters and routine software development.
In recent times, however, several surveys have shown that ac-cess to high-quality skills is becoming an increasingly important reason for offshoring. While cost reduction was initially the pre-dominant driver of offshoring, indications are that labor arbitrage is becoming less common as a primary driver of second-generation offshoring as access to talent becomes more important.
Companies are beginning to create competitive advantage by strategically leveraging offshoring. This seems to be happening for a number of reasons. First, those Western firms that had been involved in offshoring the longest began to realize that merely earning more and spending less was not enough to remain com-petitive. They also needed to offer high-quality products that were internationally competitive, and so the search for highly qualified teams capable of quality product development in offshore loca-tions became a strategic imperative. Simultaneously, as these com-panies began to realize that local workers were often able to offer some higher-value skills while retaining their cost advantage, local service providers began to move upmarket and to offer more value- added services to their multinational clients. as a result, many offshoring companies began in earnest to include access to high-quality talent as a strategic variable in their offshoring decisions.
Currently, however, two additional reasons seem to be convert-ing this aspect of second-generation offshoring into an urgent strategic necessity for innovative companies. on the one hand, as the supply of qualified scientific talent has grown significantly in developing markets such as India and China, it has been steadily declining in more advanced economies like Germany, the United Kingdom and the United States. For instance, surveys show that
the offshoring of high-value services… [ 277 ]
the number of U.S. residents graduating with Master’s and Phd degrees in engineering has steadily decreased over the past five years, while, at the same time, demand for engineering talent has been growing. In the same period, the annual cap on H1B visas for foreign workers coming into the United States was slashed from 195,000 to 65,000. also in that same period, however, the supply of science and engineering talent has been growing in countries like India and China.
on the other hand, many developing countries have begun to invest more heavily in infrastructure and in their educational systems. as a result, while the supply and demand for scientific and engineering talent has been moving in opposite directions in many advanced economies, supply has been growing in both quantity and quality in a number of emerging economies. In de-veloping countries, government investments in infrastructure and higher-quality education have further reduced difficulties of do-ing business while improving access to higher-quality workforces. Thus, as labor markets in popular hotspot cities have begun to overheat, new city and/or country players have started to appear, often with specialized workforces and/or attractive fiscal incen-tives. Consequently, although the appearance of new locations in-creases the choice and leverage of current offshoring companies, it also makes the benefits of second-generation offshoring more widely available to second-movers who missed out on, or chose to stay out of, the first generation of offshoring.
Thus, as all these factors converge, instead of a value proposi-tion solely centered on low-cost operations, many companies are faced with offshoring locations that can simultaneously offer highly skilled workers, relatively low wages, and attractive fiscal incentives. First-movers therefore, have begun to venture beyond lower-value services and into the establishment of r&d centers, new prod-uct development operations and other higher-value knowledge- intensive operations. However, as competition intensifies in many markets, and managers recognize the primacy of knowledge-based assets, more and more companies are beginning to seriously consider possibilities for the global sourcing of high-quality capabilities.
Some commentators have therefore begun to speak about how second-generation offshoring will revolutionize the global
[ 278 ] offshoring in the global economy
sourcing of capabilities. although the complete globalization of a seamless and competitive market for geographically dispersed talent is unlikely to happen very soon, managers still need to start thinking about how to react to these changes. The pressures of competition and innovation in many markets will make access to talented workers increasingly more important for competitive ad-vantage. While pressures are already intense in many science and engineering-based industries, firms in other industries less im-pacted (for now) also need to ask themselves what the emergent globalization of capability sourcing portends for them, and what they can/should do about it.
11.2. Coping with the globalization of capability sourcing
according to a recent report by duke University and consulting firm Booz allen Hamilton (Couto et al. 2006, 1):
offshoring is becoming less about moving jobs elsewhere,
and more about sourcing talent everywhere. What began with
rules-based, ‘follow the book’, codified tasks now encompasses
procurement, Hr, legal services, engineering services, r&d,
and product design. and what used to be a tactical labor cost-
saving exercise is now a strategic imperative of competing for
talent globally.
However, the reality of a semi-globalized world where global opera-tions are not yet seamless means that managers have to cope with a number of issues in attempting to build upon these emerging op-portunities. The challenges they face can be grouped into two major sets of issues: on the one hand, there is the challenge of articulating a coherent global strategy and, on the other hand, there is a host of internal organizational issues that offshoring brings to the fore.
Getting global strategy rightIf strategy is always important, it is even more so when firms are
faced with fundamental changes in their business environments.
the offshoring of high-value services… [ 279 ]
Managers need to avoid knee-jerk reactions if they do not want to offshore their way to failure. Therefore, when considering off-shoring of high-value services, it must be evaluated within the context of a firm’s overall global strategy in general and its overall sourcing strategy in particular. Specifically, it is important to think carefully about what to source externally and what to do in-house, as well as where best to locate each activity and where best to source each capability. approaching these issues in a manner that is inconsistent with a firm’s overall strategy is most likely a recipe for rapid failure. In particular, some issues related to offshoring that need to be addressed by a firm’s global strategy include the following:
1. What goes in, what goes out? Many firms take a piecemeal ap-proach to offshoring and outsourcing, without specifying upfront the kinds of activities they wish to perform themselves (domestically or internationally), and the kinds of activities they want to outsource (domestically or internationally). In addition, they often do not critically consider what specific capabilities they require from external partners and/or in-ternational locations before deciding upon offshoring ini-tiatives.
one approach suggested by Uday Karmakar (2004) is for companies to base firm and geographic boundary deci-sions on an evaluation of the complexity of the services they render and the customer needs they satisfy.
Companies that use complex processes to provide highly cus-tomized services (e. g., personal financial planning, expert medical diagnosis, relationship marketing, etc.) will likely want to keep many of these activities in-house and localized. In this way, they will be able to maintain direct control over service quality and customer information. However, if vol-ume permits, they may consider decoupling and selectively outsourcing some simple stages in their value chains in or-der to increase efficiency and reduce costs. on the other hand, companies that use relatively simple processes to pro-vide customized services (e. g., retail sales, web design, techni-cal support, etc.) will want to actively consider outsourcing
[ 280 ] offshoring in the global economy
the non-core stages of their value chains. If volume permits, they may also consider captive offshoring in order to main-tain control over customer information and leverage accu-mulated experience and customer relationships.
For firms that use complex processes to deliver standardized services (e. g., credit analysis, software development, tax prep-aration, etc.) captive offshoring will often provide the bene-fits of leveraging in-house capabilities and experience while delivering lower costs and higher volumes. Nevertheless, as skill levels in offshore locations rise, these kinds of services may increasingly be provided through offshore outsourcing. Finally, standardized services that are delivered through sim-ple processes have historically been the first to be delivered through offshore outsourcing, and it is unlikely they will be delivered in any other way in the near future.
In summary, regardless of the analytical framework utilized, companies that want to take advantage of globally dispersed talent should not make decisions on offshoring independ-ently of their global sourcing strategy. Nevertheless, it should be pointed out that the decision of what tasks to keep in-house, to outsource, or to offshore is not independent of the capabilities the various candidate vendors and locations have to offer. Thus, this decision is interlinked with an analysis of the best locations for carrying out various activities or for sourcing various capabilities. We will now look at this issue.
2. Which capabilities from which locations? Historically, the vast majority of offshore service jobs have gone to a hand-ful of cities in India, Eastern Europe and russia; notably, Hyderabad, Bangalore, delhi and Mumbai; Budapest and Prague; and Moscow, respectively. among these locations, many surveys show that Indian Tier 1 cities occupy a unique position in terms of providing very highly qualified talent, along with (until recently at least) some of the lowest labor costs in the world.
In recent times, however, some popular hotspot cities have be-come somewhat less attractive as the number of firms piling into them have pushed up labor costs and caused a strain on local infrastructure. Consequently, forward-looking firms are
the offshoring of high-value services… [ 281 ]
now beginning to cast their nets more widely, at the same time that many new contending cities are appearing on the scene.
Many of these new locations are trying to build on unique strengths and advantages. For example, dubai, United arab Emirates, stresses its multinational, skilled and stable workforce, robust infrastructure, zero taxes and five-star amenities; Cape Town, South africa, emphasizes its quali-fied workers, its unusually high number of actuaries, good business services, and well-developed telecommunications and IT infrastructure; Morocco is home to customer care and back-office operations for a number of major French and Spanish companies requiring fluent speakers of their home languages; Vietnam offers graduates that are well schooled in mathematics, speak French, English, German, or russian, and don’t demand high wages; and so on. In fact, a 2003 study by the McKinsey Global Institute (MGI) found that there were 6.4 million young professionals across 28 low-wage countries who were suitable47 for employment by multinational companies (Farrell 2006).
Given the increasing breadth of options, the authors of the MGI report suggest that managers should follow a struc-tured approach to location choice. They should first start by drawing up a list of candidate locations, define weight-ed decision criteria and then rank the candidate locations along the identified criteria. Important decision criteria to consider include the following:
• Cost: Especially labor, infrastructure, real estate and taxa-tion.
• Availability of skills: The immediate labor pool as well as the local vendor community providing IT services and other business functions.
• Market potential: local markets as well as adjacent markets in nearby regions or countries.
47 Suitable professionals were defined as “university graduates with up to seven years of experience who have the skills and attributes (language skills, technical knowledge, ability to interact successfully in a corporate environment) that multinationals want.”

[ 282 ] offshoring in the global economy
• Quality of infrastructure: Especially telecommunication and IT, real estate, transportation and power supply.
• Risk profile: Security, regulatory, macroeconomic and in-tellectual property risks.
• Environment: Including the degree of government sup-port, the business environment, the living environment and the location’s accessibility.
These criteria have to be explicitly weighted in order to take into account the relative importance of each factor given different company strategies and risk profiles. once the lo-cations have been ranked, a decision can then be taken, al-ways bearing in mind location dynamics and possible future changes in each of the criteria.
Getting global organization righta second set of issues facing offshoring companies are organiza-
tional and managerial in nature. although broader questions like the global sourcing strategy and location selection are important, surveys show that the most common problems bedeviling offshoring initiatives are internal organizational ones. as such, there are at least three major sets of issues that managers have to plan for in at-tempting to benefit from the globalization of capability sourcing.
1. Organizational and operational challenges. Many managers un-derestimate the amount of work that needs to be done to transform an offshoring decision into an efficient business operation. In addition to the detailed analysis that precedes the offshoring decision, its implementation also requires a long list of detailed tasks that need to be carried out. Consequently, inadequate planning can cause offshoring implementations to run into problems.
Furthermore, many firms (especially smaller ones) do not have clearly defined processes, standard operating pro-cedures or control parameters that are robust enough to guide and enable offshoring. Therefore, when these com-panies try to move a function or task offshore, they lack the organizational tools and skill set to manage the transition
the offshoring of high-value services… [ 283 ]
and to establish appropriate metrics for measuring and controlling this work once it is being performed remotely —often by a third party.
In addition, internal processes often need significant modifica-tion in order to be adapted to global operations. For example, employees may have to document procedures and establish performance benchmarks before processes can be sent off-shore; and it often takes between 12 and 24 months before offshore performance stabilizes and the volume of work ramps up, which slows payoffs.
In summary, therefore, before embarking on an offshoring initiative, firms need to critically analyze their current busi-ness processes to see whether they are structured and de-fined well enough to be adapted to global operations. If this internal analysis is neglected, the returns to global sourcing initiatives may be seriously hampered by organizational dif-ficulties.
2. Recruiting, developing and retaining global talent. Companies with greater offshoring experience are beginning to discov-er that initial access to talent is not sufficient to stay compet-itive. In particular, employee turnover rates are becoming a major challenge for many companies running offshore operations. as initial subsistence concerns subside, many workers in low-wage countries start to pay more attention to career development and personal fulfillment. demanding jobs that are not perceived to substantially enhance long-term career prospects (e. g., call center operatives) are among the hardest hit by high employee turnover in coun-tries like India. In response, companies are beginning to experiment with developing global career programs and incentive systems that integrate offshore talent into their global workforces.
one important driver of the increasing difficulty of retain-ing high-quality talent around hotspot locations is the grow-ing competition for talent, as more companies arrive in in-creasingly crowded hotspots. Consequently, although many risk-averse companies follow the pack by investing in hotspot locations such as Bangalore or Shanghai, other companies
[ 284 ] offshoring in the global economy
try to avoid these hotspots and to invest in second-tier loca-tions that can provide access to pools of qualified people at lower costs. However, because of lower standards of educa-tion and work experience, the actual qualification of many of these workers is more difficult to evaluate and often is considered to be below the requirements of Western com-panies.
In response, some companies have entered into strategic alliances with local universities or technical institutes to qualify talent for their particular needs and to secure access to these talent pools in the long run. In turn, some universi-ties in offshore locations have recruited multiple Western partners and sponsors to provide customized programs. all these players contribute to, and partly compete for, further development, segmentation and accessibility of global tal-ent pools.
3. Coordination and collaboration capabilities. Finally, as more com-panies begin to turn to offshoring for the global sourcing of high-value innovative capabilities, they are being faced with the very significant challenge of managing global collabo-ration and knowledge-sharing processes across multiple lo-cations, languages, cultures and disciplinary backgrounds. In order to reap maximum benefits from global capability sourcing, firms therefore need to integrate dispersed, di-verse talent pools, in order to focus their capabilities on or-ganizational innovation objectives. This is no easy task, and companies are still experimenting with various solutions to this problem.
Some approaches include: modifying organizational struc-ture to permit collaboration and knowledge-sharing; using web-based collaboration tools; increasing direct coordina-tion; setting up innovation competitions between global r&d locations; and utilizing modular organizing structures that facilitate work in dispersed teams. Some firms have im-plemented so-called global innovation networks designed to facilitate knowledge-sharing and collaboration across geographic boundaries. These networks connect r&d labs and local teams in different countries, and serve as social
the offshoring of high-value services… [ 285 ]
infrastructures for diffusing knowledge from local hubs of innovation. other initiatives attempt to enhance r&d pro-ductivity by collecting ideas from suppliers, collaborating scientists, lead customers and global partners.
Nevertheless, the creation and sharing of knowledge across global innovation networks remain a major challenge, and will possibly remain the trickiest impediment to reaping maximum benefit from the global sourcing of innovative capabilities.
11.3. Conclusion: from the globalization of capability sourcing to the globalization of innovation
In summary, we are beginning to see very significant changes in the way companies approach offshoring. With growing pools of high-quality, low-wage talent in multiple locations, firms are in-creasingly looking beyond labor arbitrage to the reinforcement or growth of their strategic capabilities. However, in order to navigate this new environment beneficially, managers will need to think carefully about their global strategies, while navigating the organizational challenges deriving from the coordination of geographically dispersed knowledge workers.
as unique resources and capabilities become more critical for business success, and competition becomes more knowledge based, the ability to source and retain superior talent will become more critical for long-term business success. Firms best able to navigate the next generation of global sourcing and the globaliza-tion of innovation will be best placed for long-term success.

[ 287 ]
Concluding Thoughts
alTHoUGH the world is globalizing, distance still matters. How-ever, with offshoring it matters far less than it used to. Now firms can move a whole unit of production or a particular service depart-ment as far as communication technologies allow. a call-center unit relocated to the Moon? Why not? The future will tell. yet the truth is that, back on Earth, offshoring may disrupt employees’ lives (and that of their families). But there are also benefits to be reaped.
With the communications revolution, which was due, in part, to the growth and development of the Internet, there is currently an increasing number of jobs at risk of being relocated. and this is not only true about production-related (i. e., blue-collar) jobs —the trend towards services-based offshoring (i. e., white collar jobs) is changing as well.
as we have seen, offshoring is a natural development of eco-nomic progress, and is as beneficial for a country as commercial trade. Currently, we predict higher growth rates for services off-shoring than production-related offshoring, even though produc-tion will remain bigger in the total numbers. The offshoring of services is an entirely new phenomenon for various reasons:
1. This new offshoring entails highly skilled service workers who are usually not engaged in highly repetitive tasks, as in the manufacturing sector.
2. offshoring of services is not as visible as the conventional offshoring of production. There is no sudden shuttering of factories, but rather, the relocation process is more gradual.
3. With services, there is an additional appeal from a mana-gerial perspective to compete for worldwide talent, beyond the short-term cost-benefit analysis.
4. New and enhanced communication technologies allow a much faster pace of offshoring of services around the world.
12.
[ 288 ] offshoring in the global economy
5. Thanks to the fast development and dynamic nature of ser- vices offshoring, companies are in a better position to de-velop their own capabilities and to address their strategies from a global point of view.
on the other hand, at an individual level, offshoring comes as a loss for the domestic workers whose jobs are relocated. In the case of services offshoring, this has set off alarms for highly skilled workers, since now everybody in the world is equally at risk of having their jobs relocated to a destination thousands of miles away. These individuals are the potential visible victims of off- shoring. But we should keep in mind that, in trying to cope with this visible effect, governments might hinder a natural economic process, which would generate further not-so-visible victims, both at the entrepreneur and worker levels. and, it is usually the case that these people are disperse and cannot exercise the same political power that the visible victims might.
But there is also a positive side to the story, especially with re-gard to services offshoring. as illustrated in this book, the direct employment effects are less extreme here, as we expect highly skilled workers to adapt more easily to the requirements of new job opportunities. Moreover, positive productivity effects can re-sult from both traditional offshoring and, to a greater extent, the new services offshoring.
as a consequence, for services offshoring the effects on em-ployment are less disruptive. In fact, the offshoring of services may encourage activities to be upgraded domestically (e. g., call cen- ters may upgrade to business processes and then to product devel-opment), thus enhancing domestic productivity and opening the door to many offshorable jobs in the future.
Cost advantages are surely among the most important drivers for this business practice (the one and only driver, an economist would say, or “comparative advantages in full force”). But with the advent of the Internet and telecommuting become a feasible op-tion, firms are positioned to take full advantage of the pool of cheap and available well-trained workers. Indeed, the communi-cations revolution permits firms to select the best of the best from a vast worldwide pool of well-trained workers. likewise, workers
concluding thoughts [ 289 ]
around the world can benefit, including in those regions in which their more traditional activities are being moved abroad.
However, as we have demonstrated, the amount of offshoring in the services industry is relatively small compared with that of manufacturing activities, despite a much higher growth rate. We should expect to see a change over the years, as the world be-comes more interconnected and the challenge posed by distance becomes a vestige of the past.
Empirically, while the socioeconomic impact of offshoring is still unclear, in practice, services offshoring is very important for companies and their value chains. It is becoming a key factor for global strategies, and not just a mere isolated managerial quan-dary. Moreover, socioeconomic considerations are especially im-portant in dealing with aggregation, adaptation, and arbitration issues (Ghemawat’s triple-a framework; see Ghemawat 2007).
More than ever, improvements in efficiency are becoming a necessity in today’s business activities, since overhead costs are significantly increasing. overhead expenses refer to ongoing expenses that are necessary to the continued functioning of the business but that cannot be immediately associated with the com-pany’s products or services. offshoring of services might be a pos-sible solution.
So, what have we learned about offshoring? What word of ad-vice, if any, can academia offer? Clearly, there are several econom-ic agents, such as governments, firms and workers, that should be consulted as well.
First of all, we could ask a radical question:48 What would be the effect of a political decision imposing an outright ban on off- shoring to protect national employment? at first this might seem like a well-meaning policy that merely seeks to protect the visible victims of offshoring and, therefore, a socially desirable objec-tive with no negative impact on the people. However, if we delve beyond the surface of this argument, we will see that this is not necessarily the case. Something else belies this scenario, something strongly embedded in basic economic principles, and that is that
48 Extreme hypothetical situations are usually very helpful in delivering a clear answer to an elusive and complex issue.

[ 290 ] offshoring in the global economy
the world as a whole cannot lose from trade. and by extension, the world as a whole cannot lose from offshoring (which is, in a sense, a specific kind of trade).
Indeed, if governments leave offshoring on its own, other countries experiencing an increase in employment will eventu-ally return the favor as a natural result of growth by increasing their demand for goods and services, many of which will be produced abroad, and some of which will even be produced in the country from which its activities had been relocated. That is, to produce these new goods and services and thus meet the increased inter-national demand, more labor will be certainly needed. Therefore, directly prohibiting offshoring would eventually prevent invis-ible local workers from getting jobs created by the potential in-crease in the international demand for local goods and services. Furthermore, offshoring is more than a one-way street, since in-shoring (the inflow of jobs from relocating international firms) is yet another reality of the business world.
Second, firms must soon begin to address the reality of offshor-ing and start thinking of it as an intricate part of a global strategy. otherwise, they are liable to lose terrain on other more willing firms, both locally and internationally. True, many have already bought into the new offshoring hype without the proper know-how, with unsuccessful and regrettable results. But the message here should be clear: keep your eyes on services offshoring as you accumulate enough knowledge to make the leap.
In addition, staying flexible and efficient in managing the workforce is imperative for business practices worldwide, where offshoring could be seen as another brick in the human resources wall. Those firms that, through their human resources division, invest much of their time and resources in finding the right strat-egy to train and shape their staff, are in a much better position when the time arrives to finally go offshore. Career-long learning, career planning, staff development and skill renewal are just a few of the possible strategies that can help firms and their workers adapt to the new offshoring reality.
Finally, one piece of advice should be given to those work-ers who might suffer the offshoring stigma and are not skillful enough to be assigned to another job within the same firm, or are

concluding thoughts [ 291 ]
not lucky enough to find another job outside. Having geographic mobility is as much an advantage today as it was, for instance, dur-ing the time of the american colonies. The Britons who settled in the virgin soil of Northeast america never imagined the economic success laid out ahead of them.
all in all, offshoring in general and the offshoring of services are activities naturally associated with the fast development of eco-nomic activities. as such, there is much to be gained by both savvy executives and flexible workers and, subsequently, the society as a whole. one should not forget about those who, through no fault of their own, find themselves at risk for having their job relocated. However, we must be wary of well-intentioned government inter-vention that could curtail the positive effects of offshoring. We must attempt to keep the offshoring debate among political forc-es and social actors active and alive.

[ 293 ]
references
acedo, F. J., C. Barroso and J. l. Galan. “The resource-based theory: dissemination and main trends.” Strategic Management Journal 27 (2006): 621–36.
agnese, P. Japan and her dealings with offshoring: an empirical analysis with aggregate data. IESE Working Paper. Barcelona: IESE Business School, 2010.
agnese, P. and H. Sala. “The fading 1990s in Japan: driving forces behind the unem-ployment upsurge.” International Review of Economics and Finance. 18, no. 3 (2009): 428–39.
agrawal, V. and d. Farrell. “Who wins in offshoring.” The McKinsey Quarterly 4 (2003): 36–41.
agrawal, V., d. Farrell and J. K. remes. “offshoring and beyond.” The McKinsey Quarterly 4 (2003): 24–35.
aksin, o. and a. Masini. “Effective strategies for internal outsourcing and offshoring of business services: an empirical investigation.” Journal of Operations Management 26, no. 2 (2008): 239–256.
almeida, P. and B. Kogut. “localization of knowledge and the mobility of engineers in regional networks.” Management Science 45 (1999): 905–917.
amiti, M. and S-J. Wei. “Fear of service outsourcing: is it justified?” Economic Policy 20, no. 42 (2005): 308–347.
—. “Service offshoring, productivity, and employment: evidence from the United States.” CEPR Discussion Paper 5475. Cambridge, Ma: National Bureau of Economic research, 2006.
anderson, r., J. Cienski and C. Condon. “Central and Eastern Europe: skilled work-ers fuel investment.” Financial Times, december 15, 2006.
antràs, P. and E. Helpman. “Global Sourcing”. NBER Working Paper 10082 (2003).arellano, M. and S. Bond, S. “Some tests of specification for panel data: Monte Carlo
evidence and an application to employment equations.” Review of Economic Studies 58, no. 2 (1991): 277–297.
arellano, M. and o. Bover. “another look at the instrumental variable estimation of error-components models.” Journal of Econometrics 68, no. 1 (1995): 29–51.
arndt, S. “Globalization and the open economy.” North American Journal of Economics and Finance 8, no. 1 (1997): 71–79.
—. “Super-specialization and the gains from trade.” Contemporary Economic Policy 16, no. 4 (1998): 480–485.
—. “Globalization and economic development.” Journal of International Trade and Economic Development 8, no. 3 (1999): 309–318.
aron, r. and J. V. Singh. “Getting offshoring right.” Harvard Business Review 83, no. 12 (2005): 135–143.
aron, r., S. Bandyopadhyay, S. Jayanty and P. Pathak. “Monitoring process quality in off-shore outsourcing: a model and findings from multi-country survey.” Journal of Operations Management 26, no. 2 (2008): 303–321.
[ 294 ] offshoring in the global economy
aron, r., E. Clemons and S. reddi. “Just right outsourcing; Understanding and man-aging risk.” Journal of Management Information Systems 22, no. 2 (2005): 37–55.
Balakrishnan, K., U. Mohan and S. Seshadri. “outsourcing of front-end busi-ness processes: Quality, information, and customer contact.” Journal of Operations Management 26, no. 2 (2008): 288–302.
Barkema, H. G., J. H. Bell and J. M. Pennings. “Foreign entry, cultural barriers, and learning.” Strategic Management Journal 17 (1996): 151–166.
Barney, J. B. “Firm resources and sustained competitive advantage.” Journal of Management 17, no. 1 (1991): 99–120.
Bartlett, C. a. and S. Ghoshal. Managing Across Borders: The Transnational Solution. Boston, Ma: Harvard Business School Press, 1989.
Behrman, J. N. Decision criteria for foreign direct investment in Latin America. New york: Council of the americas, 1974.
Bergin, P., r. Feenstra and G. Hanson. Outsourcing and Volatility. NBEr Working Paper 13144, 2007.
Berman, E., J. Bound and Z. Griliches. “Changes in the demand for skilled labor within U.S. manufacturing: evidence from the annual Survey of Manufacturers.” The Quarterly Journal of Economics 109, no. 2 (1994): 367–397.
Bhagwati, J. In Defense of Globalization. oxford: oxford University Press, 2004.Bhalla, a., M. S. Sodhi and B. G. Son. “Is more IT offshoring better?: an exploratory
study of western companies offshoring to South East asia.” Journal of Operations Management 26, no. 2 (2008): 322–335.
Blinder, a. “offshoring: the next industrial revolution?” Foreign Affairs 85, no. 2 (2006): 113–128.
Botero, J., S. djankov, r. la Porta and F. lópez de Silanes. “The regulation of labor”. The Quarterly Journal of Economics 119 (4) (2004): 1339–1382.
Buckley, P. and M. Casson. The Future of the Multinational Enterprise. london: MacMillan, 1976.
Buckley, P. J. and J. Mucchieli. Multinational Firms and International Relocation. Cheltenham, U.K.: Edward Elgar, 1997.
Bunyaratavej, K., E. d. Hahn and J. doh. “International offshoring of services: a par-ity study.” Journal of International Management 13 (2007): 7–21.
Cadarso, M., N. Gómez, l. lópez and M. Tobarra. “The EU enlargement and the impact of outsourcing on industrial employment in Spain, 1993–2003.” Structural Change and Economic Dynamics 19, no. 1 (2008): 95–108.
Campa, J. and l. Goldberg. “The evolving external orientation of manufacturing in-dustries: evidence from four countries.” Federal Reserve Bank of New York Economic Policy Review 4 (1997): 79–99.
Canals, C. What Explains the Widening Wage Gap? Outsourcing vs. Technology. la Caixa Working Paper Series 01/2006. Barcelona: la Caixa, 2006.
Cantwell, J. Technological Innovation and Multinational Corporations. oxford, U.K.: Basil Blackwell, 1989.
Chandler, a. d. “The evolution of modern global competition.” In M. E. Porter, ed. Competition in Global Industries. Boston, Ma: Harvard Business School Press, 1986.
Chang, S. J. “International expansion strategy of Japanese firms: capability building through sequential entry.” Academy of Management Journal 38, no. 2 (1995): 383–407.
Chang, S. J. and P. M. rosenzweig. “The choice of entry mode in sequential foreign direct investment.” Strategic Management Journal 22 (2001): 747–776.
references [ 295 ]
Chung, W. and J. alcacer. “Knowledge seeking and location choices of foreign direct investment in the United States.” Management Science 48, no. 12 (2002): 1534–1554.
Connaughton, S. l. and M. Shuffler. “Multinational and multicultural distributed teams: a review and future agenda.” Small Group Research 38, 3 (2007): 387–412.
Couto, V., M. Mani, a. y. lewin and C. Peeters. The Globalization of White-Collar Work. duke University/Booz allen Hamilton offshoring research Network Survey, 2006.
Crinò, r. “Service offshoring and white-collar employment.” The Review of Economic Studies 77, no. 2 (2010).
Criscuolo, C. and M. leaver. Offshore Outsourcing and Productivity. mimeo, 2005.Cyert, r. M. and J. G. March. A Behavioral Theory of the Firm. Malden, Ma: Blackwell
Publishing ltd., 1963. davidson, W. H. “The location of foreign investment activity: country characteristics
and experience effects.” Journal of International Business Studies 11 (1980): 9–22.—. “Market similarity and market selection: implications of international marketing
strategy.” Journal of Business Research 11 (1983): 439–456.deardoff, a. Fragmentation Across Cones. The University of Michigan discussion Paper
427, 1998.—. “Fragmentation in simple trade models.” North American Journal of Economics and
Finance 12, no. 2 (2001): 121–137.delios, a. and W. J. Henisz. “Political hazards, experience, and sequential entry
strategies: the international expansion of Japanese firms, 1980-1998.” Strategic Management Journal 24 (2003): 1153–1164.
denis, J. E. and d. depelteau. “Market knowledge, diversification and export expan-sion.” Journal of International Business Studies 16 (1985): 77–89.
diromualdo, a. and V. Gurbaxani. “Strategic Intent for IT outsourcing”. Mit Sloan Management Review July 15 (1998).
doh, J. P. “offshore outsourcing: implications for international business and strategic management theory and practice.” Journal of Management Studies, 42, no. 3 (2005): 695–704.
dossani, r. and M. Kenney. “lift and shift: moving the back office to India.” Information Technologies and International Development 1, no. 2 (2003): 21–37.
—. “reflections upon ‘Sizing the emerging global labor market’.” Academy of Management Perspectives 20, no. 4 (2006): 35–41.
—. “The next wave of globalization: relocating service provision to India.” World Development 35, no. 5 (2007): 772–791.
dunning, J. H. International Production and the Multinational Enterprise. london, U.K.: George allen and Unwin, 1981.
—. Multinational Enterprises and the Global Economy. Wokingham, U.K.: addison-Wesley, 1993.
—. “The eclectic paradigm as an envelope for economic and business theories of MNE activity.” International Business Review 9 (2000): 163–190.
dutta, a. and r. roy. “offshore outsourcing: a dynamic causal model of counteract-ing forces.” Journal of Management Information Systems 22, no. 2 (2005): 15–35.
dyer, J. and H. Singh. “The relational view: cooperative strategy and sources of inter-organizational competitive advantage.” Academy of Management Review 23 (1998): 660–679.
Egger, H. “International outsourcing in a two-sector Heckscher-ohlin model.” Journal of Economic Integration 17, no. 4 (2002): 687–709.
[ 296 ] offshoring in the global economy
Egger, H. and P. Egger. “outsourcing and skill-specific employment in a small econ-omy: austria after the fall of the Iron Curtain.” Oxford Economic Papers 55, no. 4 (2003): 625–643.
—. “labor market effects of outsourcing under industrial interdependence.” International Review of Economics and Finance 14, no. 3 (2005): 349–363.
Egger, H. and U. Kreickemeier. Fairness, Trade, and Inequality. CESifo Working Paper Series. Munich: CESifo Group, 2008.
Egger, P., F. Pfaffermayr and a. Weber. Sectoral Adjustment of Employment: The Impact of Outsourcing and Trade at the Micro Level. Vienna: Institute for advanced Studies Economics Series 145, 2003.
Eisenhardt, K. M. and J. a. Martin. “dynamic capabilities: what are they?” Strategic Management Journal 21 (2000): 1105–1121.
Ekholm, K. and K. Hakkala. The Effect of Offshoring on Labor Demand: Evidence from Sweden. The research Institute of Industrial Economics Working Paper 654. Sweden: The research Institute of Industrial Economics, 2006.
Ellram, l. M., W. l. Tate and C. Billington. “offshore outsourcing of profes-sional services: a transaction cost economics perspective.” Journal of Operations Management 26, no. 2 (2008): 148–163.
Engardio, P., a. Bernstein and M. Kripalani. “The new global job shift.” Business Week (February 3, 2003).
Engwall, l. and M. Wallenstål. “Tit for tat in small steps: the internationalization of Swedish banks.” Scandinavian Journal of Management 4 (1988): 147–155.
Farrell, d. “Beyond offshoring: assess your company’s global potential.” Harvard Business Review 82, no. 12 (2004): 82–90.
—. “offshoring: value creation through economic change.” Journal of Management Studies 42, no. 3 (2005): 675–683.
—. “Smarter offshoring.” Harvard Business Review 84, no. 6 (2006): 84–92.Farrell, d., M. a. laboissière and J. rosenfeld. “Sizing the emerging global labor
market.” Academy of Management Perspectives 20 (2006): 23–34.Fayerweather, J. International Business Management: A Conceptual Framework. New york:
McGraw-Hill, 1969.Feenstra, r. and G. Hanson. “Foreign investment, outsourcing, and relative wages.”
In r. Feenstra, G. Grossman, and d. Irwin, eds. The Political Economy of Trade Policy: Papers in Honor of Jagdish Bhagwati. Cambridge, Ma: MIT Press, 1996a: 89–127.
—. “Globalization, outsourcing, and wage inequality.” The American Economic Review 86, no. 2 (1996b): 240–245.
—. “Foreign direct investment and relative wages: evidence from Mexico's maquilado-ras.” Journal of International Economics 42, nos. 3/4 (1997): 371–393.
—. “The impact of outsourcing and high-technology capital on wages: estimates for the United States, 1979-1990.” The Quarterly Journal of Economics 114, no. 3 (1999): 907–940.
—. “Global production sharing and rising inequality: a survey of trade and wages.” In K. Choi, and J. Harrigan, eds. Handbook of International Trade. Malden, Ma: Blackwell, 2003.
Fifarek, B. J., F. M. Veloso and C. I. davidson. “offshoring technology innovation: a case study of rare-earth technology.” Journal of Operations Management 26, no. 2 (2008): 222–238.
references [ 297 ]
Forrester research. Near-term Growth of Offshoring Accelerating. Cambridge, Ma: Forrester research, 2004.
Geishecker, I. and H. Görg. “do unskilled workers always lose from fragmentation?” North American Journal of Economics and Finance 16, no. 1 (2005): 81–92.
Ghemawat, P. Redefining Global Strategy: Crossing Borders in a World Where Differences Still Matter. Boston, Ma: Harvard Business School Press Books, 2007.
Girma, S. and H. Görg. “outsourcing, foreign ownership, and productivity: evidence from UK establishment-level data.” Review of International Economics 12, no. 5 (2004): 817–832.
Görg, H. and a. Hanley. “labour demand effects of international outsourcing: evi-dence from plant-level data.” International Review of Economics and Finance 14, no. 3 (2005): 365–376.
Gottfredson, M., r. Puryear and S. Phillips. “Strategic sourcing - from periphery to the core.” Harvard Business Review (February 2005): 132–139.
Graham, E. M. “Market structure and the multinational enterprise: a game-theoretical approach.” Journal of International Business Studies 29, no. 1 (1998): 67–84.
Greene, W. H. Econometric Analysis. 5th ed. Upper Saddle river, NJ: Prentice Hall, 2003.
Greenhaus, J. H., S. Parasuraman, W. M. Wormley. “Effects of race on organiza-tional experiences, job performance evaluations, and career outcomes.” Academy of Management Journal 33 (1990): 64–86.
Griliches, Z. “The discovery of the residual: a historical note.” Journal of Economic Literature 34, no. 3 (1996): 1324–1330.
Grossman, G. and E. Helpman. “outsourcing in a Global Economy”. Review of Economic Studies, 72 (2005): 135–159.
Grote, M. H. and F. a. Taube. “When outsourcing is not an option: international relocation of investment bank research — or isn’t it?” Journal of International Management, 13 (2007): 57–77.
Grubaugh, S. G. “determinants of direct foreign investment.” Review of Economics and Statistics 69 (1987): 149–151.
Guillen, M. F. “Structural inertia, imitation, and foreign expansion: South Korean firms and business groups in China, 1987–1995.” Academy of Management Journal 45, no. 3 (2002): 509–525.
Gupta, a. and S. Mukherji. “offshoring: the transition from economic drivers toward strategic global partnership and 24–hour knowledge factory.” Journal of Electronic Commerce in Organizations 5, no. 2 (2007): 1–23.
Hakkala, K., F. Heyman and F. Sjöholm. Cross-Border Acquisitions, Multinationals and Wage Elasticities. IFN Working Paper 709. Stockholm, Sweden: research Institute of Industrial Economics, 2007.
Hamermesh, d. Labour Demand. Princeton, NJ: Princeton University Press, 1993.Hamm, S. “Guess who’s hiring in america”. Business Week, June 25 (2007).Harrison, a. E. and M. S. McMillan. “dispelling some myths about offshoring.”
Academy of Management Perspectives 20, no. 4 (2006): 6–22.Head, K. and J. ries. “offshore production and skill upgrading by Japanese manufac-
turing firms.” Journal of International Economics 58, no. 1 (2002): 81–105.Head, K., T. Mayer and J. ries. “revisiting oligopolistic reaction: are decisions on for-
eign direct investment strategic complements?” Journal of Economics and Management Strategy 11, no. 3 (2002): 453–472.
[ 298 ] offshoring in the global economy
Helpman, E. and o. Itskhoki. “labor Market rigidities, Trade and Unemployment”. CEPR Discussion Papers 7502 (2009).
Henisz, W. J. and a. delios. “Uncertainty, imitation, and plant location: Japanese multinational corporations, 1990–1996.” Administrative Science Quarterly 46 (2001): 443–475.
Henley, J. “outsourcing the provision of software and IT-enabled services to India.” International Studies of Management and Organization 36 (2006): 111–131.
Hennart, J.-F. A Theory of the Multinational Enterprise. ann arbor: University of Michigan Press, 1982.
Henry, S., M. Karanassou and d. Snower. “adjustment dynamics and the Natural rate: an account of the UK Unemployment”. Oxford Economic Papers 52 (2000): 178–203.
Hicks, J. Value and Capital: An Inquiry into Some Fundamental Principles of Economic Theory. oxford, U.K.: Clarendon Press, 1939.
Hijzen, a., Görg, H. and r. Hine. “International outsourcing and the skill structure of labour demand in the United Kingdom.” The Economic Journal 115 (2005): 860–878.
Hijzen, a., Tomohiko, I. and y. Todo. Does Offshoring Pay? Firm-Level Evidence from Japan. rIETI discussion Paper 07-E-005. Tokyo, Japan: research Institute of Economy 2006.
Hinds, P. J. and d. E. Bailey. “out of sight, out of sync: understanding conflict in distributed teams.” Organization Science 14, no. 6 (2003): 615–632.
Hinds, P. and M. Mortensen. “Understanding conflict in geographically distributed teams: The moderating effects of shared identity, shared context, and spontaneous communication”. Organization Science 16 (2005): 290–307.
Horgos, d. “labor market effects of international outsourcing: how measurement matters.” International Review of Economics and Finance 18, no. 4 (2009): 611–623.
Hubbard, G. “offshoring can benefit workers of all skill levels.” Financial Times, September 28, 2006.
Hulten, C. “Total factor productivity: a short biography.” In: Hulten, dean and Harper, eds. New Development in Productivity Analysis. Chicago, Il: University of Chicago Press for the National Bureau of Economic research, 2001.
Hummels, d., J. Ishii and K.-M. yi. “The nature and growth of vertical specialization in world trade.” Journal of International Economics 54, no. 1 (2001): 75–96.
Hymer, S. The International Operations of National Firms. Cambridge, Ma: MIT Press, 1976.IMF World Economic Outlook Database, 2009. Washington dC: IMF.Ito, B., E. Tomiura and r. Wakasugi. Dissecting Offshore Outsourcing and R&D: A Survey
of Japanese Manufacturing Firms. rIETI discussion Paper 07-E-060. Tokyo, Japan: research Institute of Economy, Trade and Industry, 2007.
Jahns, C., E. Hartmann and l. Bals. “offshoring: dimensions and diffusion of a new business concept.” Journal of Purchasing and Supply Management 12, 2006: 218–231.
Jensen, P., J. Kirkegaard and N. laugesen. “offshoring in Europe. Evidence of a Two-Way Street from denmark, Institute for International Economics”. Working Paper 06 (3) (2006).
JIP Database, 2006, 2008. Hitotsubashi University: rIETI; Japan: ESrI.Johanson, J. and J. E. Vahlne. “The internationalization process of the firm: a model
of knowledge development and increasing foreign market commitments.” Journal of International Business Studies 8, no. 1 (1977): 23–32.
references [ 299 ]
Johanson, J. and F. Wiedersheim-Paul. “The internationalization of the firm: four Swedish cases.” Journal of Management Studies 12 (1975): 305–322.
Jones, r. Globalization and the Theory of Input Trade. Cambridge, Ma: MIT Press, 2000.Jones, r. and H. Kierkowski. “The role of services in production and internation-
al trade: a theoretical framework.” In r. Jones and a. Krueger, eds. The Political Economy of International Trade. oxford, U.K.: Blackwell, 1990: 31–48.
—. “a framework for fragmentation.” In S. arndt and H. Kierzkowski, eds. Fragmentation: New Production Patterns in the World Economy. oxford, U.K.: oxford University Press, 2001: 17–34.
Juul, M. and P. Walters. “The internationalization of Norwegian firms: a study of the UK expertise.” Management International Review 27 (1987): 58–66.
Kaka, N. “a choice of models.” The McKinsey Quarterly 4 (2003): 46–47.Kalnins, a. “Sample selection and theory development: implications of firms' varying
abilities to appropriately select new ventures.” Academy of Management Review 32 (2007): 1246–1264.
Karabay, B. and J. Mclaren. “Trade, offshoring, and the Invisible Handshake”. Journal of International Economics, 82 (1) (2010): 26–34.
Karanassou, M. and d. Snower. “How labour Market Flexibility affects Unemployment: long-Term Implications of the Chain reaction Theory”. Economic Journal 108 (1998): 832–849.
Karmarkar, U. “Will you survive the services revolution?” Harvard Business Review 82, no. 6 (2004): 100–107.
Karnani, a. and B. Wernerfelt. “Multiple point competition.” Strategic Management Journal 6 (1985): 87–96.
Kedia, B. l. and S. lahiri. “International outsourcing of services: a partnership mod-el.” Journal of International Management 13 (2007): 22–37.
Kennedy, P. A Guide to Econometrics. 5th ed. Malden, Ma: Blackwell Publishing ltd., 2003.
Kirkegaard, J. Offshoring, outsourcing and production relocation. Labor market effects in the OECD countries and developing Asia. IIE Working Paper 07-02. Washington, dC: Peterson Institute for International Economics, 2007.
Knickerbocker, F. T. Oligopolistic reaction and multinational enterprise. Boston, Ma: Harvard University Press, 1973.
Knight, G. a. and S. T. Cavusgil. “Innovation, organizational capabilities, and the born-global firm.” Journal of International Business Studies 35, 2004: 124–141.
Kobrin, S. J. “an empirical analysis of the determinants of global integration.” Strategic Management Journal Summer Special Issue 12 (1991): 17–31.
Kogut, B. and U. Zander. “Knowledge of the firm and the evolutionary theory of the multinational corporation.” Journal of International Business Studies 24, no. 4 (1993): 625–645.
Kohler, W. “International outsourcing and factor prices with multistage production.” Economic Journal 114, no. 494 (2004): 166–185.
Koskela, E. and J. Koenig. Flexible Outsourcing, Profit Sharing and Equilibrium Unemployment. CESifo Working Paper Series no. 2382. Munich: CESifo Group, 2008.
Krugman, P. “Growing world trade: causes and consequences.” Brookings Papers on Economic Activity 1, 1995.
—. “Technology, trade, and factor prices.” Journal of International Economics 50, no. 1 (2000): 51–71.
[ 300 ] offshoring in the global economy
Kshetri, N. “Institutional factors affecting offshore business process and informa-tion technology outsourcing.” Journal of International Management 13 (2007): 38–56.
Kuemmerle, W. “The drivers of foreign direct investment into research and develop-ment: an empirical investigation.” Journal of International Business Studies 30, no. 1 (1999): 1–24.
Kwon, y. and M. Hu. “Comparative analysis of export-oriented and foreign production- oriented firms’ foreign market entry decisions.” Management International Review 35, (1995): 325–336.
lawrence, r., Slaughter, M. and r. Hall. “International trade and american wages in the 1980s: giant sucking sound or small hiccup?” Brookings Papers on Economic Activity 1 (1993): 161–226.
leamer, E. Trade wages and revolving door ideas. NBEr Working Paper 4716. Cambridge, Ma: NBEr, 1994.
—. “In search of Stolper-Samuelson linkages between international trade and lower wages.” In Susan M. Collins, ed. Imports, Exports, and the American Worker. Washington, dC: Brookings Institution, 1998: 141–203.
leamer, E. E. and M. Storper. “The economic geography of the Internet age.” Journal of International Business Studies 32, no. 4 (2001): 641–666.
levy, d. l. “offshoring in the new global political economy.” Journal of Management Studies 42, no. 3 (2005): 685–693.
lewin, a. y. and C. Peeters. “offshoring work: business hype or the onset of funda-mental transformation?” Long Range Planning 39 (2006a): 221–239.
—. “The top-line allure of offshoring.” Harvard Business Review 84, no. 3 (2006): 22–23.
—. “The top-line allure of offshoring.” Harvard Business Review [provide volume] (2006b): 22–23.
—. “offshoring work: business hype or the onset of fundamental transformation?” Long Range Planning 39 (2006c): 221–239.
lewin, a. y., S. Massini and C. Peeters. “From offshoring to globalization of human capital and innovation.” Paper presented at the annual meeting of the academy of International Business, Indianapolis, IN, June 25–27, 2007.
li, y., y. liu, M. li and H. Wu. “Transformational offshore outsourcing: empirical evi-dence from alliances in China.” Journal of Operations Management 26, no. 2 (2008): 257–274.
Mankiw, N. and P. Swagel. “The politics and economics of offshore outsourcing”. Journal of Monetary Economics 53 (2006): 1027–1056.
Marin, d. “a new international division of labor in Europe: outsourcing and offshor-ing to Eastern Europe.” Journal of the European Economic Association 4, nos. 2–3 (2006): 612–622.
Martin, X. and r. Salomon. “Tacitness, learning and international expansion: a study of foreign direct investment in a knowledge intensive industry.” Organization Science 14, no. 3 (2003): 297–311.
Martin, X., a. Swaminathan and W. Mitchell. “organizational evolution in the inter- organizational environment: incentives and constraints on international expan-sion strategy.” Administrative Science Quarterly 43, no. 3 (1998): 566–601.
McKinsey Global Institute. “Who wins in offshoring.” The McKinsey Quarterly 4 (2003).
references [ 301 ]
Mcleod, P. l. and S. a. lobel. “The effects of ethnic diversity on idea generation in small groups.” Academy of Management Best Paper Proceedings (1992): 227–231.
Meade, d. S., S. J. rzeznik and d. C. robinson-Smith. “Business investment by in-dustry in the U.S. economy for 1997.” Survey of Current Business 83, no. 11 (2003): 18–70.
Mehta, a., a. armenakis, N. Mehta and F. Irani. “Challenges and opportunities of business process outsourcing in India.” Journal of Labor Research 27 (2006): 323–338.
Metiu, a. “owning the code: Status closure in distributed groups”. Organization Science, 17 (4) (2006): 418–435.
Metters, r. “a typology of offshoring and outsourcing in electronically transmitted services.” Journal of Operations Management 26, no. 2 (2008): 198–211.
Metters, r. and r. Verma. “History of offshoring knowledge services.” Journal of Operations Management 26, no. 2 (2008): 141–147.
Milliken, F. and l. Martins. “Searching for common threads: understanding the multiple effects of diversity in organizational groups.” Academy of Management Review 21 (1996): 402–433.
Mitra, d. and P. ranjan. Offshoring and Unemployment. IZa discussion Paper 2805. Bonn: IZa, 2007.
Nachum, l. and S. Zaheer. “The persistence of distance? The impact of technology on MNE motivations for foreign investment.” Strategic Management Journal 26, no. 8 (2005): 747–767.
Nordström, K. a. The Internationalization Process of the Firm: Searching for New Patterns and Explanations. Stockholm, Sweden: Institute of International Business, Stockholm School of Economics, 1991.
OECD Input-Output Database, 2009. Paris: oECd.OECD Offshoring and employment. Trends and impacts, 2007. Paris: oECd.OECD STAN Database, 2008. Paris: oECd.olsen, K. Productivity Impacts of Offshoring and Outsourcing: A Review. oECd STI Working
Paper 2006/1. Paris: oECd, 2006.oviatt, B. and P. P. Mcdougall. “Toward a theory of international new ventures.”
Journal of International Business Studies 25 (1994): 45–64.Parkhe, a. “International outsourcing of services: Introduction to the special issue”.
Journal of International Management 13 (2007): 3–6.Peng, M. W. “The resource-based view and international business.” Journal of
Management 27, no. 6 (2001): 803–829.Penrose, E. T. The theory of the growth of the firm. New york: Wiley, 1959.Pfannenstein, l. l. and r. J. Tsai. “offshore outsourcing: current and future effects
on american IT industry.” Information Systems Management 21, no. 4 (2004): 72–80.Pisani, N. The Rationale for Business Process Offshoring: The Case of U.S. Firms, 1999–2003.
Paper presented at the Conference on Management of Globally distributed Work. Bangalore, India: Indian Institute of Management, 2007.
Pisani, N. and J. E. ricart. Offshoring and the Global Sourcing of Talent: Understanding the New Frontier of Internationalization. Centre for Globalisation and Strategy. Barcelona, Spain: IESE Business School, 2008.
Porter, M. E. Competitive Strategy: Techniques for Analyzing Industries and Competition. New york: Free Press, 1980.
Prahalad, C. K. and y. l. doz. The Multinational Mission: Balancing Local Demands and Global Vision. New york: Free Press, 1987.
[ 302 ] offshoring in the global economy
reddy, P. “New trends in globalization of corporate r&d and implications for innova-tion capability in host countries: a survey from India.” World Development 25, no. 11 (1997): 1821–1837.
ricart, Joan Enric, and Pablo agnese. El offshoring en España. Causas y consecuencias de la deslocalización de servicios. Barcelona: IESE Business School, 2006.
ricks, d. a. “letter from the Editor-in-Chief.” Journal of International Business Studies 22 (1991): 1–4.
robinson, M. and r. Kalakota. Offshore outsourcing. Business models, ROI and best prac-tices (second ed.), alpharetta: Mivar Press, 2004.
rodríguez-Clare, a. “offshoring in a ricardian World”. American Economic Journal: Macroeconomics, 2 (2) (2010): 227–258.
rosenzweig, P. M. and J. V. Singh. “organizational environments and the multina-tional enterprise.” Academy of Management Review 16 (1991): 340–361.
Samuelson, P. Foundations of Economic Analysis. Cambridge, Ma: Harvard University Press, 1947.
Santos, J., y. doz and P. Williamson. “Is your innovation process global?” Sloan Management Review 4 (2004): 31–37.
Shephard, r. Theory of Cost and Production Functions. Princeton, NJ: Princeton University Press, 1953.
Siegel, d. and Z. Griliches. “Purchased services, outsourcing, computers, and pro-ductivity in manufacturing.” In Z. Griliches, E. r. Berndt, T. F. Bresnahan, M. E. Manser, eds. Output Measurement in the Service Sectors. National Bureau of Economic research (NBEr) Studies in Income and Wealth 56, Chicago, Il: The University of Chicago Press, 1992: 429–460.
Slaughter, M. Multinational Corporations, Outsourcing, and American Wage Divergence. NBEr Working Paper 5253. Cambridge, Ma: NBEr, 1995.
—. “Production transfer within multinational enterprises and american wages.” Journal of International Economics 50, no. 2 (2000): 449–472.
Stratman, J. K. “Facilitating offshoring with enterprise technologies: reducing opera-tional friction in the governance and production of services.” Journal of Operations Management 26, no. 2 (2008): 275–287.
Strauss-Kahn, V. “The role of globalization in the within-industry shift away from unskilled workers in France.” In r. Baldwin and a. Winters, eds. Challenges to Globalization. Chicago: University of Chicago Press, 2004.
Stringfellow, a., M. B. Teagarden and W. Nie. “Invisible costs in offshoring services work.” Journal of Operations Management 26, no. 2 (2008): 164–179.
Sullivan, d. “The threshold of internationalization: replication, extension, and re-interpretation.” Management International Review 34 (1994): 165–186.
Sullivan, d. and a. Bauerschmidt. “Incremental internationalization: a test of Johnason and Vahlne's thesis.” Management International Review 30 (1990): 19–30.
Taylor, a. “Public Concern over offshoring rises”. Financial Times, November 28 (2006).
Teece, d., G. Pisano and a. Shuen. “dynamic capabilities and strategic management.” Strategic Management Journal 18, no. 7 (1997): 509–533.
Tomiura, E. “Foreign outsourcing and firm-level characteristics: evidence from Japanese manufacturers.” Journal of the Japanese International Economics 19, no. 2 (2005): 255–271.
references [ 303 ]
Trefler, d. “offshoring: threats and opportunities.” Paper presented at the ‘The offshoring of Services: Issues and Implications’. Washington d.C.: Brookings Trade Forum, May 12–13, 2005.
Turnbull, P. W. “a challenge to the stages theory of the internationalization process.” In P. J. rosson and S. d. reid, eds. Managing Export Entry and Expansion. New york: Praeger, 1987.
U.S. Bureau of Economic analysis. U.S. Direct Investment Abroad: Final Results from the 1999 Benchmark Survey. Washington, dC: U.S. Government Printing office, 2004.
Vahlne, J. and K. a. Nordström. “The internationalization process: impact of compe-tition and experience.” International Trade Journal 7 (1993): 529–548.
Venkatraman, N. V. “offshoring without guilt.” Sloan Management Review 45, no. 3 (2004): 14–16.
Vivek, S., d. K. Banwet and r. Shankar. “analysis of interactions among core, trans-action and relationship-specific investments: The case of offshoring.” Journal of Operations Management 26, no. 2 (2008): 180–197.
Watson, W., K. Kumar and l. Michaelsen. “Cultural diversity's impact on interaction processes and performance: comparing homogeneous and diverse task groups.” Academy of Management Journal 36 (1993): 590–602.
Webster, E. “The effects of wages on aggregate employment: a brief summary of em-pirical studies.” The Australian Economic Review 36, no. 1 (2003): 134–142.
Welch, l. and r. luostarinen. “Internationalization: evolution of a concept.” Journal of General Management 14 (1988): 34–55.
Werner, S. “recent developments in international management research: a review of 20 top management journals.” Journal of Management 28, no. 3 (2002): 277–305.
Wernerfelt, B. “a resource-based view of the firm.” Strategic Management Journal 14, no. 5 (1984): 171–180.
Westney, d. E. and S. Zaheer. “The multination enterprise as an organization.” In a. M. rugman and T. l. Brewer, eds. Oxford Handbook of International Business. oxford: oxford University Press, 2001.
Wighton, d. “offshoring: relentlessly jumping up the skills chain”. Financial Times, January 24 (2006).
Williamson, o. E. Markets and Hierarchies: Analysis and Antitrust Implications. New york: Free Press, 1975.
—. “Comparative economic organization: the analysis of discrete structural alterna-tives.” Administrative Science Quarterly 36 (1991): 269–296.
youngdahl, W. and K. ramaswamy. “offshoring knowledge and service work: a con-ceptual model and research agenda.” Journal of Operations Management 26, no. 2 (2008): 212–221.
yu, J. and K. Ito. “oligopolistic reaction and foreign direct investment: the case of the U.S. tire and textile industries.” Journal of International Business Studies Fall (1988): 449–460.
Zaheer, S. “overcoming the liability of foreignness.” Academy of Management Journal 38, no. 2 (1995): 341–363.
Zaheer, S. and S. Manrakhan. “Concentration and dispersion in global industries: re-mote electronic access and the location of economic activity.” Journal of International Business Studies 32, no. 4 (2001): 667–686.

[ 304 ] offshoring in the global economy
Zaheer, S. and a. Zaheer. “Market microstructure in a global B2B network.” Strategic Management Journal 22 (2001): 859–873.
Zheng, S. Estimating Industry Level Multifactor Productivity: Methods and Experimental Results. aBS Working Paper, 1351.055.004. Perth: aBS, 2005.
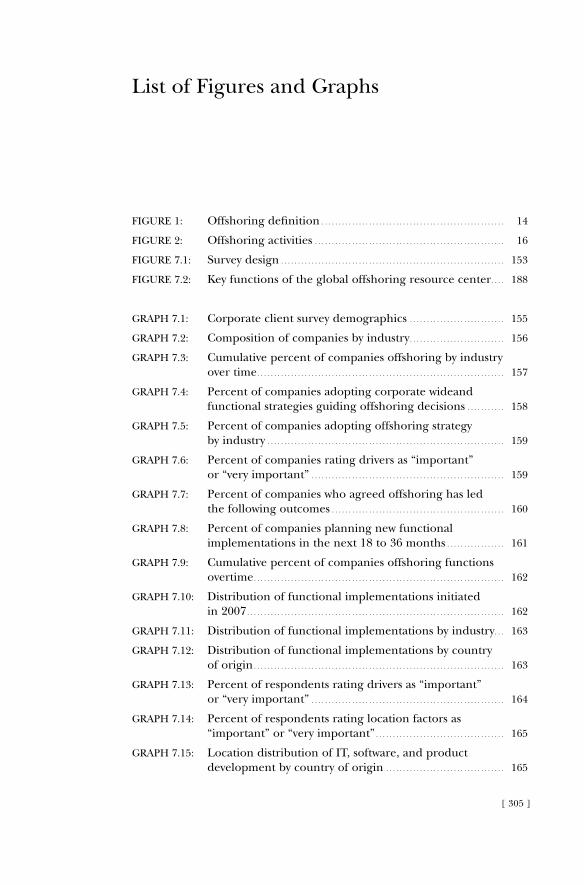
[ 305 ]
list of Figures and Graphs
FIGUrE 1: offshoring definition . . . . . . . . . . . . . . . . . . . . . . . . . . . . . . . . . . . . . . . . . . . . . . . . . . . . . . 14
FIGUrE 2: offshoring activities . . . . . . . . . . . . . . . . . . . . . . . . . . . . . . . . . . . . . . . . . . . . . . . . . . . . . . . . 16
FIGUrE 7.1: Survey design . . . . . . . . . . . . . . . . . . . . . . . . . . . . . . . . . . . . . . . . . . . . . . . . . . . . . . . . . . . . . . . . . . 153
FIGUrE 7.2: Key functions of the global offshoring resource center . . . . 188
GraPH 7.1: Corporate client survey demographics . . . . . . . . . . . . . . . . . . . . . . . . . . . . 155
GraPH 7.2: Composition of companies by industry . . . . . . . . . . . . . . . . . . . . . . . . . . . . 156
GraPH 7.3: Cumulative percent of companies offshoring by industry over time . . . . . . . . . . . . . . . . . . . . . . . . . . . . . . . . . . . . . . . . . . . . . . . . . . . . . . . . . . . . . . . . . . . . . . . . . 157
GraPH 7.4: Percent of companies adopting corporate wideand functional strategies guiding offshoring decisions . . . . . . . . . . . 158
GraPH 7.5: Percent of companies adopting offshoring strategy by industry . . . . . . . . . . . . . . . . . . . . . . . . . . . . . . . . . . . . . . . . . . . . . . . . . . . . . . . . . . . . . . . . . . . . . . 159
GraPH 7.6: Percent of companies rating drivers as “important” or “very important” . . . . . . . . . . . . . . . . . . . . . . . . . . . . . . . . . . . . . . . . . . . . . . . . . . . . . . . . . 159
GraPH 7.7: Percent of companies who agreed offshoring has led the following outcomes . . . . . . . . . . . . . . . . . . . . . . . . . . . . . . . . . . . . . . . . . . . . . . . . . . . 160
GraPH 7.8: Percent of companies planning new functional implementations in the next 18 to 36 months . . . . . . . . . . . . . . . . . 161
GraPH 7.9: Cumulative percent of companies offshoring functions overtime . . . . . . . . . . . . . . . . . . . . . . . . . . . . . . . . . . . . . . . . . . . . . . . . . . . . . . . . . . . . . . . . . . . . . . . . . . 162
GraPH 7.10: distribution of functional implementations initiated in 2007 . . . . . . . . . . . . . . . . . . . . . . . . . . . . . . . . . . . . . . . . . . . . . . . . . . . . . . . . . . . . . . . . . . . . . . . . . . . . 162
GraPH 7.11: distribution of functional implementations by industry . . . 163
GraPH 7.12: distribution of functional implementations by country of origin . . . . . . . . . . . . . . . . . . . . . . . . . . . . . . . . . . . . . . . . . . . . . . . . . . . . . . . . . . . . . . . . . . . . . . . . . . 163
GraPH 7.13: Percent of respondents rating drivers as “important” or “very important” . . . . . . . . . . . . . . . . . . . . . . . . . . . . . . . . . . . . . . . . . . . . . . . . . . . . . . . . . 164
GraPH 7.14: Percent of respondents rating location factors as “important” or “very important” . . . . . . . . . . . . . . . . . . . . . . . . . . . . . . . . . . . . . . 165
GraPH 7.15: location distribution of IT, software, and product development by country of origin . . . . . . . . . . . . . . . . . . . . . . . . . . . . . . . . . . . 165
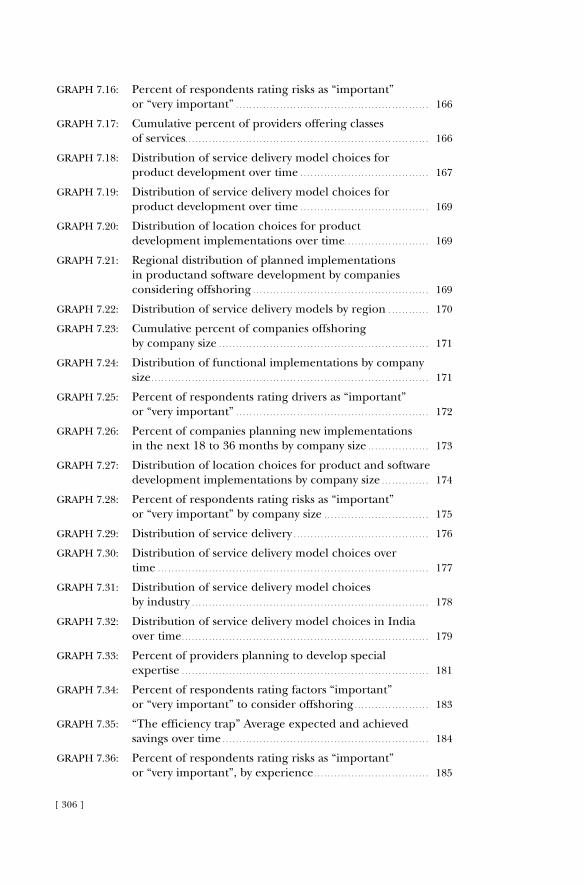
[ 306 ]
GraPH 7.16: Percent of respondents rating risks as “important” or “very important” . . . . . . . . . . . . . . . . . . . . . . . . . . . . . . . . . . . . . . . . . . . . . . . . . . . . . . . . . 166
GraPH 7.17: Cumulative percent of providers offering classes of services. . . . . . . . . . . . . . . . . . . . . . . . . . . . . . . . . . . . . . . . . . . . . . . . . . . . . . . . . . . . . . . . . . . . . . . . 166
GraPH 7.18: distribution of service delivery model choices for product development over time . . . . . . . . . . . . . . . . . . . . . . . . . . . . . . . . . . . . . . 167
GraPH 7.19: distribution of service delivery model choices for product development over time . . . . . . . . . . . . . . . . . . . . . . . . . . . . . . . . . . . . . . 169
GraPH 7.20: distribution of location choices for product development implementations over time . . . . . . . . . . . . . . . . . . . . . . . . . 169
GraPH 7.21: regional distribution of planned implementations in productand software development by companies considering offshoring . . . . . . . . . . . . . . . . . . . . . . . . . . . . . . . . . . . . . . . . . . . . . . . . . . . . 169
GraPH 7.22: distribution of service delivery models by region . . . . . . . . . . . . 170
GraPH 7.23: Cumulative percent of companies offshoring by company size . . . . . . . . . . . . . . . . . . . . . . . . . . . . . . . . . . . . . . . . . . . . . . . . . . . . . . . . . . . . . . 171
GraPH 7.24: distribution of functional implementations by company size . . . . . . . . . . . . . . . . . . . . . . . . . . . . . . . . . . . . . . . . . . . . . . . . . . . . . . . . . . . . . . . . . . . . . . . . . . . . . . . . . . 171
GraPH 7.25: Percent of respondents rating drivers as “important” or “very important” . . . . . . . . . . . . . . . . . . . . . . . . . . . . . . . . . . . . . . . . . . . . . . . . . . . . . . . . . 172
GraPH 7.26: Percent of companies planning new implementations in the next 18 to 36 months by company size . . . . . . . . . . . . . . . . . . 173
GraPH 7.27: distribution of location choices for product and software development implementations by company size . . . . . . . . . . . . . . 174
GraPH 7.28: Percent of respondents rating risks as “important” or “very important” by company size . . . . . . . . . . . . . . . . . . . . . . . . . . . . . . . 175
GraPH 7.29: distribution of service delivery . . . . . . . . . . . . . . . . . . . . . . . . . . . . . . . . . . . . . . . . 176
GraPH 7.30: distribution of service delivery model choices over time . . . . . . . . . . . . . . . . . . . . . . . . . . . . . . . . . . . . . . . . . . . . . . . . . . . . . . . . . . . . . . . . . . . . . . . . . . . . . . . . 177
GraPH 7.31: distribution of service delivery model choices by industry . . . . . . . . . . . . . . . . . . . . . . . . . . . . . . . . . . . . . . . . . . . . . . . . . . . . . . . . . . . . . . . . . . . . . . 178
GraPH 7.32: distribution of service delivery model choices in India over time . . . . . . . . . . . . . . . . . . . . . . . . . . . . . . . . . . . . . . . . . . . . . . . . . . . . . . . . . . . . . . . . . . . . . . . . . 179
GraPH 7.33: Percent of providers planning to develop special expertise . . . . . . . . . . . . . . . . . . . . . . . . . . . . . . . . . . . . . . . . . . . . . . . . . . . . . . . . . . . . . . . . . . . . . . . . . 181
GraPH 7.34: Percent of respondents rating factors “important” or “very important” to consider offshoring . . . . . . . . . . . . . . . . . . . . . . 183
GraPH 7.35: “The efficiency trap” average expected and achieved savings over time . . . . . . . . . . . . . . . . . . . . . . . . . . . . . . . . . . . . . . . . . . . . . . . . . . . . . . . . . . . . . 184
GraPH 7.36: Percent of respondents rating risks as “important” or “very important”, by experience . . . . . . . . . . . . . . . . . . . . . . . . . . . . . . . . . . 185
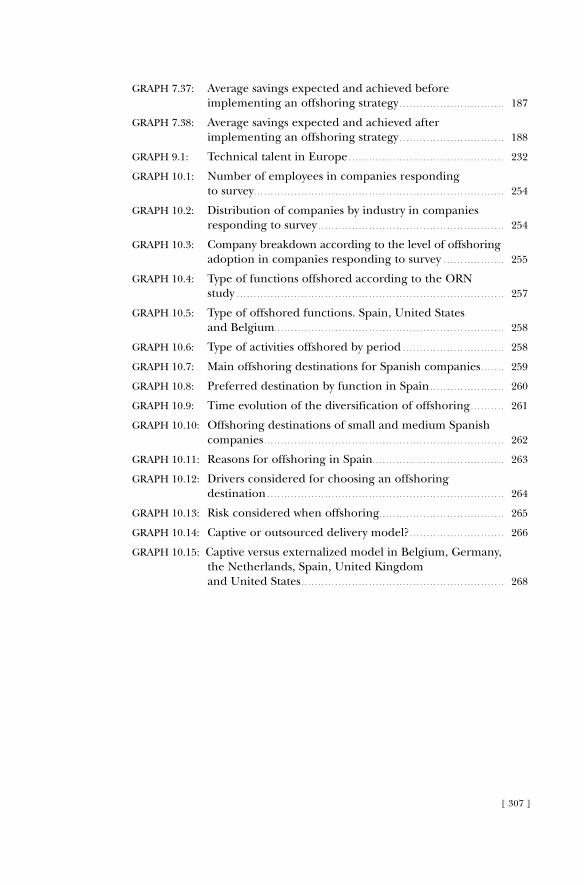
[ 307 ]
GraPH 7.37: average savings expected and achieved before implementing an offshoring strategy . . . . . . . . . . . . . . . . . . . . . . . . . . . . . . . 187
GraPH 7.38: average savings expected and achieved after implementing an offshoring strategy . . . . . . . . . . . . . . . . . . . . . . . . . . . . . . . 188
GraPH 9.1: Technical talent in Europe . . . . . . . . . . . . . . . . . . . . . . . . . . . . . . . . . . . . . . . . . . . . . . 232
GraPH 10.1: Number of employees in companies responding to survey . . . . . . . . . . . . . . . . . . . . . . . . . . . . . . . . . . . . . . . . . . . . . . . . . . . . . . . . . . . . . . . . . . . . . . . . . . 254
GraPH 10.2: distribution of companies by industry in companies responding to survey . . . . . . . . . . . . . . . . . . . . . . . . . . . . . . . . . . . . . . . . . . . . . . . . . . . . . . . 254
GraPH 10.3: Company breakdown according to the level of offshoring adoption in companies responding to survey . . . . . . . . . . . . . . . . . . 255
GraPH 10.4: Type of functions offshored according to the orN study . . . . . . . . . . . . . . . . . . . . . . . . . . . . . . . . . . . . . . . . . . . . . . . . . . . . . . . . . . . . . . . . . . . . . . . . . . . . . . . 257
GraPH 10.5: Type of offshored functions. Spain, United States and Belgium. . . . . . . . . . . . . . . . . . . . . . . . . . . . . . . . . . . . . . . . . . . . . . . . . . . . . . . . . . . . . . . . . . . . 258
GraPH 10.6: Type of activities offshored by period . . . . . . . . . . . . . . . . . . . . . . . . . . . . . . 258
GraPH 10.7: Main offshoring destinations for Spanish companies . . . . . . . 259
GraPH 10.8: Preferred destination by function in Spain . . . . . . . . . . . . . . . . . . . . . . 260
GraPH 10.9: Time evolution of the diversification of offshoring . . . . . . . . . . 261
GraPH 10.10: offshoring destinations of small and medium Spanish companies . . . . . . . . . . . . . . . . . . . . . . . . . . . . . . . . . . . . . . . . . . . . . . . . . . . . . . . . . . . . . . . . . . . . . . . 262
GraPH 10.11: reasons for offshoring in Spain . . . . . . . . . . . . . . . . . . . . . . . . . . . . . . . . . . . . . . . 263
GraPH 10.12: drivers considered for choosing an offshoring destination . . . . . . . . . . . . . . . . . . . . . . . . . . . . . . . . . . . . . . . . . . . . . . . . . . . . . . . . . . . . . . . . . . . . . . 264
GraPH 10.13: risk considered when offshoring . . . . . . . . . . . . . . . . . . . . . . . . . . . . . . . . . . . . . 265
GraPH 10.14: Captive or outsourced delivery model? . . . . . . . . . . . . . . . . . . . . . . . . . . . . 266
GraPH 10.15: Captive versus externalized model in Belgium, Germany, the Netherlands, Spain, United Kingdom and United States . . . . . . . . . . . . . . . . . . . . . . . . . . . . . . . . . . . . . . . . . . . . . . . . . . . . . . . . . . . . 268

[ 309 ]
list of Tables
TaBlE 2.1: offshoring on employment, wages, and productivity . . . . . . . 42
TaBlE 2.2: Use of different indices of the Feenstra-Hanson type. Empirical evidence . . . . . . . . . . . . . . . . . . . . . . . . . . . . . . . . . . . . . . . . . . . . . . . . . . . . . . . . . . 44
TaBlE 3.1: Imported inputs in total inputs. Narrow measure. World ranking (selected countries) . . . . . . . . . . . . . . . . . . . . . . . . . . . . . . . . . 67
TaBlE 3.2: Imported inputs in total inputs. Broad measure. World ranking (selected countries) . . . . . . . . . . . . . . . . . . . . . . . . . . . . . . . . . 68
TaBlE 3.3: Imported inputs in gross output. Narrow measure. World ranking (selected countries) . . . . . . . . . . . . . . . . . . . . . . . . . . . . . . . . . 70
TaBlE 3.4: Imported inputs in gross output. Broad measure. World ranking (selected countries) . . . . . . . . . . . . . . . . . . . . . . . . . . . . . . . . . 71
TaBlE 3.5: Vertical specialization index. Narrow measure. World ranking (selected countries) . . . . . . . . . . . . . . . . . . . . . . . . . . . . . . . . . 73
TaBlE 3.6: Vertical specialization index. Broad measure. World ranking (selected countries) . . . . . . . . . . . . . . . . . . . . . . . . . . . . . . . . . 75
TaBlE 3.7: Imported inputs in total inputs, growth. Top ten . . . . . . . . . . . . . 78
TaBlE 3.8: Imported inputs in gross output, growth. Top ten . . . . . . . . . . . 79
TaBlE 3.9: Imported inputs in gross output, growth. Top ten . . . . . . . . . . . 80
TaBlE 3.10: offshoring intensity and the economic sector. all three indices, narrow measure . . . . . . . . . . . . . . . . . . . . . . . . . . . . . . . . . . . . . . . . . . . . . . . . . . 83
TaBlE 3.11: offshoring intensity and the economic sector. all three indices, broad measure . . . . . . . . . . . . . . . . . . . . . . . . . . . . . . . . . . . . . . . . . . . . . . . . . . . 85
TaBlE 3.12: Materials and services offshoring, broad measure . . . . . . . . . . . . 89
TaBlE 3.13: Services offshoring and industries worldwide, broad measure . . . . . . . . . . . . . . . . . . . . . . . . . . . . . . . . . . . . . . . . . . . . . . . . . . . . . . . . . . . . . . . . . . . . . . . . . . 91
TaBlE 3.14: Services offshoring and employment growth across industries worldwide, 1995–2000 . . . . . . . . . . . . . . . . . . . . . . . . . . . . . . . . . . . . . 95
TaBlE 3.15: decomposition analysis, imported inputs in inputs, 1995–2005 . . . . . . . . . . . . . . . . . . . . . . . . . . . . . . . . . . . . . . . . . . . . . . . . . . . . . . . . . . . . . . . . . . . . . . . 100
TaBlE 3.16: decomposition analysis, imported inputs in gross output, 1995–2005 . . . . . . . . . . . . . . . . . . . . . . . . . . . . . . . . . . . . . . . . . . . . . . . . . . . . . . . . . . . . . . . . . . . . . . . 102
TaBlE 3.17: decomposition analysis. Vertical specialization index, 1995–2005 . . . . . . . . . . . . . . . . . . . . . . . . . . . . . . . . . . . . . . . . . . . . . . . . . . . . . . . . . . . . . . . . . . . . . . . 103
[ 310 ]
TaBlE 4.1: Employment effects of offshoring, Japan (1980–2005). Whole economy (83 industries) . . . . . . . . . . . . . . . . . . . . . . . . . . . . . . . . . . . . . . 114
TaBlE 4.2: Productivity effects of offshoring, Japan (1980–2005). Whole economy (83 industries) . . . . . . . . . . . . . . . . . . . . . . . . . . . . . . . . . . . . . . 117
TaBlE 6.1: Mapping the offshoring literature . . . . . . . . . . . . . . . . . . . . . . . . . . . . . . . . . . . 130
TaBlE 7.1: Future plans with existing implementations in the next 18 to 36 months . . . . . . . . . . . . . . . . . . . . . . . . . . . . . . . . . . . . . . . . . . . . . . . . . . . . . . . . . . . . . . 182
TaBlE 7.2: Key best practice capabilities for supporting corporate offshoring strategy . . . . . . . . . . . . . . . . . . . . . . . . . . . . . . . . . . . . . . . . . . . . . . . . . . . . . . . . . . . 189
TaBlE 8.1: Classification of industries by investment in ICT . . . . . . . . . . . . . 209
TaBlE 8.2: descriptive statistics and correlation coefficients of the independent variablesa . . . . . . . . . . . . . . . . . . . . . . . . . . . . . . . . . . . . . . . . . . . . . . . . . . . 216
TaBlE 8.3: Motivations for business process offshoring . . . . . . . . . . . . . . . . . . . . . 218
TaBlE 9.1: descriptive statistics and correlation coefficients of the independent variables . . . . . . . . . . . . . . . . . . . . . . . . . . . . . . . . . . . . . . . . . . . . . . . . . . . . . 242
TaBlE 9.2: Estimation results . . . . . . . . . . . . . . . . . . . . . . . . . . . . . . . . . . . . . . . . . . . . . . . . . . . . . . . . . . . . 243
TaBlE 10.1: Company distribution by country according to the orN study . . . . . . . . . . . . . . . . . . . . . . . . . . . . . . . . . . . . . . . . . . . . . . . . . . . . . . . . . . . . . . . . . . . . . . . . . . . . . . . 256
TaBlE 10.2: activities offshored by number and type of model . . . . . . . . . . . 267
TaBlE 10.3: Expected savings versus those obtaine . . . . . . . . . . . . . . . . . . . . . . . . . . . . . 268
[ 311 ]
acedo, F. J., 140activities
knowledge-intensive, 15,148, 202, 224, 230, 237–238, 247
by number and type of model (Spain), 267tskill-intensive, 45, 55, 57value, 11, 16, 128, 143, 149, 224, 227, 235,
247, 257 advantages
comparative, 21, 32, 35, 37, 91, 124, 288cost, 46, 58, 203, 276, 288competitive, 140–142, 172, 199, 225, 229,
235, 274, 276, 278economic, 32location, 159g, 164g, 172gownership, 213strategic, 144
aggregation, 22–23, 26, 63, 65, 289level of, 26, 30–31, 52, 116
agnese, P., 43t, 111n, 113nagrawal, V., 15, 196, 202, 206, 230aksin, o., 134t, 145–146 alcacer, J., 196, 199, 202, 204, 212, 228, 230–
231almeida, P., 231amiti, M., 12, 23, 42t, 44t, 48–49, 65, 88, 106–
108anderson, r., 16, 232 animal spirits, 24, 32 annual Survey of Manufacturers, 40, 294 antràs, P., 59narellano, M., 112–113, 115t, 118tarndt, S., 26n, 29, 29n, 122aron, r., 14, 131t, 137t, 139, 230, 238
Bailey, d. E., 16, 130t, 143Balakrishnan, K., 135t, 144 Bals, l., 12, 132t Barkema, H. G., 234
Barney, J. B., 140, 142Barroso, C., 140Bartlett, C. a., 142 Bauerschmidt, a., 234Behrman, J. N., 196Bergin, P., 60Berman, E., 40–41, 42t, 45, 47, 106 Bernstein, a., 11, 224 Bhagwati, J., 12, 34–35, 39, 59Bhalla, a., 137Blinder, a., 11, 13, 23, 38, 121, 132t, 147–148Bond, J., 112–113, 115t, 118tBotero, J., 35nBover, o., 112, 115t, 118tBuckley, P. J., 12, 201Bunyaratavej, K., 12, 130t, 143Bureau of Economic analysis, 44, 51, 206–208,
208n, 213, 302 Bureau of labor Statistics, 25 business process offshoring (BPo), 15, 127–
129, 149, 153, 186first generation, 273, 277motivations, 197–198, 204, 206, 214, 215,
218t–220t, 220–224, 230predominance in service sectors, 205, 221rationale, 195–225, 301
industry and country impact on, 204–206and selection of low-cost countries, 205— the United States, 195–225, 301
business processes, white-collar, 11, 15, 57, 88, 195–196, 202, 205, 222, 230, 247, 251, 295. See also services-based offshoring
Cadarso, M., 43t–44t, 52, 106 Campa, J., 29, 44t, 45, 47, 63Canals, C., 42t, 44t, 51, 91nCantwell, J., 231capability
best practices, 153
Index
[ 312 ]
of coordination and collaboration, 284–285
global transformational, 182–192pool of, 202, 228, 231sourcing, globalization of, 273–285types, 279 from which locations, 280
call center, 11, 15, 156, 158, 161g–163g, 166g, 168g, 171g, 182t, 187g, 195, 256, 257g–258g, 259–260, 260g, 267, 267t, 269–271, 276, 283, 287–288
captivecenters, 179, 207, 266–267, 271offshoring, 14, 14f, 238, 245, 280solution, 13, 247 versus externalized model in Belgium, Ger-
many, the Netherlands, Spain, U.K., and U.S., 268g
Casson, M., 12Cavusgil, S. T., 235, 248Census of Manufactures, 27, 40 Chandler, a. d., 245, 248Chang, S. J., 204, 234 Chung, W., 196, 199, 202, 204, 212, 228, 230–
231chunkification, strategic, 131, 139 Cienski, J., 16 Clemons, E., 14, 131tcompany
size, 171g, 173–175g, 245, 253, 270success, lessons learned from, 186
compensation, level per employee, 212, 219tCondon, C., 16Connaughton, S. l., 133t, 144 control variables, 107, 213, 215, 219, 241, 244t,
245coordination, 153, 178, 186, 284–285
costs of, 201core competence revolution, 275cost, 11, 21, 26n, 34, 37–38, 38n, 40-41, 42t–
43t, 44, 46–47, 47n, 50–51, 53–54, 58, 62, 105–106, 111, 121–122, 130t–132t, 135t–137t, 138–139, 141, 143–145, 154, 156, 158, 159g, 164, 164g- 165g, 172g, 173, 185, 197-198, 200-201, 203, 205–206, 212, 221, 225, 228, 230, 238, 240, 246, 248, 256, 263–264, 263g–264g, 268t, 268–269, 273–276, 278, 280–281, 284, 287–289, 296, 301
differentials, 13, 52, 128, 230, 247, 249hidden, 145, 185–186high-,13, 148, 247–248of labor turnover, 38 and language and talent as determining fac-
tors, 271low-, 11, 13, 15, 134t, 147, 165g, 195–196,
198, 203, 205–206, 213, 221–224, 230, 233, 235, 273, 275, 277
reduction, 124, 154, 200, 202, 221–222, 228, 235, 248, 276, 279
wage (reduction of), 36country
developed, 34, 49, 90, 128, 148, 248, 274low-labor cost, 275size, and offshoring intensity, 66–81
Couto, V., 278creative destruction, 37Crinò, r., 42t, 44t, 57, 63Criscuolo, C., 42t, 44t, 54 customer service, 269Cyert, r. M., 233
davidson, W. H., 59, 228, 234 deardorff, a., 29ndelios, a., 234, 237 demand-oriented foreign investment, 200denis, J. E., 234 depelteau, d., 234destination
country, 195–196, 205, 213, 216t, 219t destruction
creative, 37of jobs, 105
diromualdo, a., 13distinctive value, creating, 274distribution of companies by industry (Spain),
254g doh, J. P., 12, 14, 130t, 140–143, 147, 196domestic skill intensity, 53 dossani, r., 12, 15, 16f, 130t–131t, 133t, 143–
144, 148, 195, 202, 205, 207, 224, 232 doz, y. l., 142, 199 drivers, 18, 36, 117, 127, 130t–133t, 145, 151–
152, 153f, 154, 158, 172, 195–197, 205, 212, 222–225, 228, 230, 232, 239–240, 246–248, 273,275–276, 283 288, 297, 299See also motivations
[ 313 ]
importance of, 159g, 164, 164g, 172g, 288in Spanish companies, 264g
dunning, J. H., 142, 196, 198–200, 211, 213, 229, 245
dutta, a., 13–14, 207dyer, J., 141
economicadvantage, 32sector, and offshoring intensity, 81–88,
83t–86ttransaction cost, 135, 138–139, 141, 296
economies, unionized, 47 efficiency
seeking, 18, 130t,195, 197–199, 201–202, 205–206, 211–212, 215, 216t, 217, 218t-219t, 220–221, 223–224, 229–231, 240, 244
trap, 183–184, 184gEgger, H., 29n, 30, 42t, 44t, 47, 49, 61 Egger, P., 30, 42t, 44t, 47, 49, 53 Eisenhardt, K. M., 141Ekholm, K., 43t–44t, 51 Ellram, l. M., 135t, 139 emerging-market governments, 274employment
between sectors, transition probabilities, 53effects, 17, 22, 33–35, 47, 52, 113–117, 288
short–term, 26, 33, 113, 124goals, 33
Engardio, P., 11, 147, 224Engwall, l., 234 European Foundation for the Improvement of
living and Working Conditions, 25 expatriate staff, 186expectations, unrealistic, 183external provider, 167, 238, 266–267, 271
versus captive, model, 266g, 267, 267t, 268g, 271
Farrell, d., 11–13, 15, 131t, 147, 195–196, 198, 200, 202, 204, 224, 281
Fayerweather, J., 199, 229Feenstra, r., 12, 22, 26n, 27–28, 30, 42t–44t,
45, 47, 50–51, 54–55, 62, 88, 106, 110n, 122Fifarek, B. J., 134tforeign direct investment (FdI), 12, 18, 26,
44–45, 45n, 53, 56–58, 130t, 138–139, 145–146, 195, 197–199, 206–208, 210, 213–215,
216t, 220t, 221, 275, 294, 296–297, 299–300, 302as foreign investment, 207stocks, 214–215, 216t, 220 U.S. outward, 195, 197, 206
Forrester research, 24fragmentation, international, model of, 61French National Institute of Statistics and Eco-
nomic Studies (INSEE), 47Fuqua School of Business (duke University),
129n, 156g–167g, 169g–173g, 175g–178g, 180g–184g, 188g, 238, 252, 278, 295
Galan, J. l., 140Geishecker, I., 43t–44t, 55, 63 Ghemawat, P., 11, 289Ghoshal, S., 142Girma, S., 42t, 54global race for talent, 127, 148
origins and drivers, 275global sourcing, 18, 131t,147–148, 195n, 227–
249, 277, 280, 282–285, 301globalization of resources, 273GMM specifications, 112Goldberg, l., 29, 44t, 45, 47, 63 Görg, H., 42t–44t, 54–55, 63 Gottfredson, M., 13, 225, 235Graham, E. M., 196, 199, 203Greene, W. H., 217–218Griliches, Z., 40, 42t, 44t, 110nGrossman, G., 58 Grote, M. H., 134t Grubaugh, S. G., 213Guillen, M. F., 204Gupta, a., 16, 133t, 144Gurbaxani, V., 13
Hahn, E. d., 12, 130t Hakkala, K., 43t–44t, 51, 57 Hamermesh, d., 37n, 48, 106Hamm, S., 11 Hanley, a. 43t–44t, 55 Hanson, G., 12, 22, 26n, 27–28, 30, 42t–44t,
45, 47, 50–51, 54–55, 62, 88, 106, 110n, 122Harrison, a. E., 132t, 147 Hartmann, E., 12, 132tHead, K., 43t, 53, 203 Heckscher-ohlin model, 28, 29n, 58, 62, 64, 295
[ 314 ]
Heijmen, T., 151nHelpman, E., 35, 35n, 58, 59n Henisz, W. J., 234, 237Henley, J., 15, 132t, 144Hennart, J.-F., 12Henry, S., 38 Hicks, J., 106, 110nHigh-value services, 273–285Hijzen, a., 42t–44t, 50, 51n, 56–57 Hinds, P. J., 16, 130t, 144 Horgos, d., 31, 52, 77n, 98n–99nHu, M., 234Hubbard, G., 11Hulten, C., 110nHummels, d., 22, 29, 44t, 46, 48, 63, 65, 66n,
98nHymer, S., 142hotspot locations, 274, 277, 280, 283–284
IESE Business School, 193, 195n, 239n, 251–252, 273n, 293, 301
implementationmodels of, 267plans of, 161g, 169g, 173g, 182t
import content, 17, 22, 27penetration in production, 88
India, 15, 34, 48, 60, 67, 68t–69t, 71t–72t, 74t–76t, 76, 80t, 83t, 85t, 87, 89t, 101t–103t, 128, 129n, 130t, 132t–133t, 139, 144, 152, 165g, 168, 169g–170g, 174g, 177, 179, 179g–180g, 180, 205, 232, 240, 242t, 244t, 259g, 260–261, 261g, 262, 270, 276–277, 280, 283, 295, 297, 300–301
industrycomposition according to, 155–157selection, 207–210
information and communication technologies (ICT), 11, 15, 195–197, 201, 205, 207–209, 209t–210t, 225, 228 migrating ICT–enabled business processes
to offshore locations, 197, 228information-intensive industries, 130t, 195,
197, 201–203, 205–209, 209t–210t, 220–222innovation, 130t, 134t, 143, 151, 154, 160g,
167, 172–173, 227–228, 230–231, 234–235, 245, 247–249,260, 278, 284–285, 294, 296, 299–301
globalization of, 151, 161–166, 177, 285by small and mid-sized companies, 152
inputs, 22, 27–33, 36–37, 44t, 44–46, 51–52, 54–55, 60, 62, 66, 67t–73t, 77n, 78t–80t, 81, 84t, 88, 90t, 93, 98, 100t–103t, 106–111See also intermediate inputs
inshoring, 34, 64, 290 insourcing, net, 48 intentions, future, 152–153interdependence of firms, strategic, 199intermediate
inputs, 27–28, 32–33, 62, 107trade, 22–23, 27, 63, 76, 87, 90, 121–122See intermediate inputs
International Monetary Fund (IMF), 25, 48, 81n, 298
invisible hand, 32, 121Ito, B., 43t, 199, 203 Itskhoki, o., 35, 35n
Jahns, C. 12–13, 132tJensen, P., 35njob destruction, 105Johanson, J., 12, 142, 227–228, 233–234, 237,
248Jones, r., 29nJuul, M., 234
Kalakota, r., 12–13Kalnins, a., 234Karabay, B., 60 Karanassou, M., 38Karmarkar, U., 11, 147, 196, 203, 205, 208,
227, 279Karnani, a., 203, 233Kedia, B. l., 14, 133t, 140–141,143Kennedy, P., 218Kenney, M., 12, 15, 16f, 130t–131t, 133t, 143–
144, 147–148, 195, 202, 205, 207, 224, 232 Kierkowski, H., 29nKirkegaard, J., 24Knickerbocker, F. T., 199, 203, 214, 222, 229,
233Knight, G. a., 235, 248knowledge
-based operations, 267, 271-intensive activities, 15,148, 202, 224, 230,
237–238, 247
[ 315 ]
seeking, 18, 198, 202, 205–206, 212, 215, 216t, 219t, 221–224, 229, 231, 233, 240, 244, 246, 294
-sharing, 284–285sources, 202
Kobrin, S. J., 196, 199, 211, 229Kobrin’s index of integration, 211Kogut, B., 199, 202, 229, 231, 238 Kohler, W., 26n, 29n, 58 König, J., 61Koskela, E., 61Kreickemeier, U., 61Kripalani, M., 11, 224Krugman, P., 26n, 40, 45nKshetri, N., 133t, 143Kuemmerle, W., 196, 199, 202, 204, 230–231Kwon, y., 234
laboissière, M. a., 12, 131tlabor
demand, 37, 39–40, 43t, 45, 48–50, 52, 55, 57–58, 61, 107, 113, 113n, 296
-intensive tasks, 273low cost, 264, 264g, 269, 271, 275 market, 12, 21–22, 25–26, 34–35, 35n, 37,
37n, 38, 38n, 39, 47n, 50, 53, 60–64, 100, 105–119, 122, 127, 131t, 147–148, 248, 274, 277, 295–296, 298–299
supply, 39, 113n, 224, 231, 270, 276–277turnover costs, 38unskilled, 39n, 41, 44, 50, 256
lahiri, S., 14, 133t, 140–141, 143latin america, 77, 165g, 169g–170g, 205, 240,
259–262, 259g–262g, 269–270, 294lawrence, r., 40leamer, E., 26n, 40, 201leaver, M., 42t, 44t, 54levy, d. l., 12, 15, 131t, 141, 196lewin, a. y., 15, 16f, 128, 131t, 143, 148, 151n,
198, 200, 202, 205, 207, 222, 224, 227–228, 230–232, 246, 248
li, y., 134t, 141location
and delivery model, 154distribution, 165g, 169g, 174gimportance of factors, 164g
loustarinen, r., 234low-cost countries, selection of, 205–206
management research, international, 127, 196, 302 senior, 156, 183
Mankiw, N., 11, 25, 34, 66, 121Mankiw, G., 147Manning, S., 151nManrakhan, S., 11, 15, 196, 200–201, 225,
235manufacturing
jobs, Western, 275-oriented firms, 205, 222–223sector, 23, 40, 47, 54–55, 65, 82, 87, 116–117,
123, 287March, J. G., 233Marin, d., 13, 15, 131t, 143, 146, 232market
attractiveness constraint, 203potential, 281seeking, 198, 200–201, 211, 216t, 217, 218t,
220, 229–230, 239, 244structure, 214–215, 216t, 220t, 297time to —, 152
Martin, J. a., 141Martin, X., 202–204, 231Masini, a., 134t, 145–146, 222Massini, S., 222materials offshoring
import penetration in production, 88and services offshoring, differentiation be-
tween, 17, 65, 87–91, 89t–90t, 121Mayer, T., 203 Mcdougall, P. P., 234–235, 245McKinsey Global Institute (MGI), 131t, 281, 300Mclaren, J., 60 McMillan, M. S., 132t, 147 Meade, d. S., 208Mehta, a., 132t, 139–141 Metiu, a., 16Metters, r., 135t–136t migration
from high-cost to low-cost countries, 13 of ICT-enabled business processes to off-
shore locations, 197Mitchell, W., 203Mitra, d., 60model
captive versus externalized, 268g
[ 316 ]
Heckscher-ohlin. See Heckscher-ohlin mo- del
of international fragmentation, 61location and delivery, 154Nachum and Zaheer, 197of present study, 214–215, 241–244— service delivery, 167, 167g–168g, 170g,
176, 177g–180gMortensen, M., 16motivation
for product development offshoring, 229–233competitive pressure, 203–204, 219, 222,
229, 233, 240, 245efficiency seeking, 195, 197–199, 201–
202, 211–212, 215, 218t, 220–221, 223–224, 229–231, 240, 244
knowledge seeking, 198, 202, 212, 215, 216t, 219, 221, 223–224, 229, 231, 233, 240, 244, 246
market seeking, 198, 200–201, 211, 218t, 220, 229–230, 244
moverearly, 274second, 274, 277
Mucchieli, J., 201Mukherji, S., 16, 133t, 144
Nachum, l., 130t, 143, 197–198, 200–203, 206–210, 210t, 211–214, 217, 220–222, 224–225, 229–230, 233, 248
Nachum and Zaheer model, 197, 206, 213–214, 217, 220
network, geographically dispersed, 196 Nordstrom, K. a., 234 North american Industry Classification System
(NaICS), 156g, 207, 208n, 209t–210t
offshoringaggregate, 63direct and indirect measures of, 25evolution of, 140, 227, 269index, 88, 99, 112, 119
quality of, 98–104initial wave of, 198, 224intensity, 27, 31, 43t, 54, 56, 65, 82, 83t–86t,
90, 98–99, 105, 107, 204 and country size, 66–81— economic sector, 81–88
material (or production), 17, 22, 41, 48–50, 56, 88, 121and services offshoring, differentiation
between, 88–91overheating of destination, 203second generation, 34, 274, 276–277of services, 28, 43t, 64, 130t, 275, 287–289,
291, 294, 302unemployment, 40, 60–61, 148, 300washed out effect of, 23
offshoring research Network (orN), 18, 19, 151–193, 238–239, 246, 249, 252–253, 256, 256t, 257g, 268g, 269, 295, 299
olsen, K., 36openness to trade indicators, 46 organisation for Economic Co-operation and
development (oECd), 17, 25–26, 29,33,46, 66, 66n, 68t, 81, 81n, 84t, 94, 98t, 299–300
organizationcapabilities, 152, 185, 187, 189, 191, 284,
299emphasis on, 160global, 152, 282–285and operational challenges, 282
outsourcing cross-border, 14, 30determinants of, 54foreign, 30, 40–1, 45, 49, 52, 56, 59, 302in-house, 21international, 13–14, 21, 30, 49–51, 50n–
51n, 54, 56, 58, 61–62, 66, 133t, 295, 297–299, 301
offshoring, 13, 14f, 21, 66, 130t, 134t–135t, 137t, 138–139, 141, 144–145, 151–152, 155–157, 160, 189t–191t, 207, 238, 245, 279–280, 293, 295–296, 298–302
overheating, of offshoring destination, 203 oviatt, B., 234–235, 245 ownership, 21, 26, 57, 199, 297
advantages, 142, 213change in, of firms, 57–58
Parkhe, a., 12Peeters, C., 15, 16f, 128, 131t, 143, 148, 198,
200, 202, 205, 207, 222, 224, 227, 232 Peng, M. V., 140Penrose, E. T., 140performance outcomes, 153f, 154
[ 317 ]
Perm-ajchariyawong, N., 151n Pfannenstein, l. l., 13–14, 130t, 144Phillips, S., 13, 225Pisani, N., 230, 248Porter, M. E., 142Prahalad, C. K., 142 pressure, competitive, 159g, 164g, 172g, 189t,
198–199, 203–204, 213–214, 216t, 219, 222, 229, 233, 240, 245, 263g
processesinternal, 153, 185, 283 of outsourcing, 170–176— product development offshoring, 233–
238product development offshoring (Pdo), 227–
231, 236–238, 245–248decision factorsgeographic and cultural distances, 228, 236,
245international experience, 228, 232, 235,
240, 245, 247uncertainty in country’s policies, 237, 245and international dependencies, 238, 245
production function, 43t, 54, 105–106, 109–110, 110n, 302
productivity, 17, 21–23, 33–35, 40, 42t–43t, 49, 51, 54, 62–63, 121–122, 160g, 285, 288, 293, 295, 297–298, 301, 302, 304effects, 17, 23, 36–38, 50, 56–57, 61–63,
100, 107, 109 –111, 117, 117t–118t, 119, 123–124, 288
of establishments, effect on, 54total factor productivity (TFP), 54, 105,
113nPuryear, r., 13, 225
ramaswamy, K., 134t, 145–146 ranjan, P., 60r&d intensity, 50n–51n, 202, 231reddy, S., 14, 130t–131tredistribution of labor, global, 148, 198, 201,
221, 224–225 relocation of manufacturing activities, 12remes, J. K., 15, 196resource
lack of, 182seeking, 198–200, 210–211, 215, 216t, 218t,
220, 229
ricardo, d., 32, 121ricks, d. a., 127ries, J., 43t, 53, 203 risks, 122
importance of, 136, 144, 154considered by Spanish companies, 221
robinson, M., 12–13 robinson-Smith, d. C., 208rodríguez-Clare, a., 61rosenfeld, J., 12, 131trosenzweig, P. M., 234, 237roy, r., 13–14, 207russell, J. W., 151nrzeznik, S. J., 208
Sala, H., 113n salary. See wagesSalomon, r., 202, 231Samuelson, P., 12, 35, 106 Santos, J., 142, 199, 225, 228savings, 21, 34, 36, 130t–131t, 151–152, 158,
159g, 164, 172g, 183g, 183–184, 184g, 187, 187g–188g, 190t, 201, 240, 246, 263, 263g, 268, 268t, 271expected vs. obtained, 154, 184g, 187g
in Spain, 268tSchumpeter’s theory of creative destruction,
37sector bias, 26, 26n–27n, 29, 122service
delivery models, 170, 176–182distribution of — delivery, 167g–168g,
170g, 176g–180gorientation, 213, 215, 219tproviders, 145, 166–170, 176–178, 180, 186,
190t, 241, 269, 276selection of, 150
services high–value, 273–285import penetration in production, 88offshoring, 17, 57, 65–66, 87, 91–98, 111,
113, 113n, 115–116, 119, 121, 123–124, 135t–136t, 261, 274, 287–290and materials offshoring, differentia-
tion between, 88–91sector, 23, 51, 54, 81–82, 87, 90t, 91, 94,
116, 123, 144Shephard, r., 106

[ 318 ]
Shuffler, M., 133t, 144Siegel, d., 40, 42t, 44tSingh, H., 141, 230, 237size and growth, as a variable, 213–214Slaughter, M., 40, 42t, 44Smith, a., 32, 121Snower, d., 38 Spain, 17, 57, 65–66, 87, 91–98, 111, 113, 113n,
115–116, 119, 121, 123–124, 135t–136t, 261, 274, 287–290and company distribution, 256tconclusion of orN study, 269–272and delivery model, 266g— destination for offshoring, 259g–260g,
260–262, 262g, 264g, 269–271— diversification, 259, 261g— latin america, 259, 259g–260g. 260–261,
261g, 262, 268, 269–270— reasons for offshoring, 263g, 269–270— risk considered, 265g— type of function offshored, 256–257,
257g–258gspillover effects, 49 Standard Industrial Classification (SIC), 27,
207, 209t–210tStorper, M., 201strategy
corporate-wide, 151–152, 153f, 156–161global, 158, 159g, 164g, 172g, 189t, 263g,
278–282, 290, 297of innovation, 151–152, 172–173
Stratman, J. K., 135t, 139 Strauss-Kahn, V., 42t, 44t, 47, 47n, 98nStringfellow, a., 13, 136t, 145Sullivan, d., 234 surplus countries, net, 48 Swagel, P., 11, 25, 34, 66, 121Swaminathan, a., 203
talentgeographically dispersed, 278global race for, 127, 148
origins and drivers, 275initial access to, 283recruitment, development and retention of,
192t, 249, 283–284in science and engineering, 151, 154, 180,
278
technical in Europe, 228, 232, 232t Taube, F. a., 134t Taylor, a., 11technical change. See technological change technological change, 29, 41, 50, 50n, 51, 51n,
58, 62–63, 105, 110n Teece, d., 141terminology, consensus on, 13–14third-party provider, 13, 81Tomiura, E., 43t, 56 total factor productivity (TFP), 40, 54, 105,
109–110, 113n, 117, 117t, 119, 298training, 186, 189t–192t, 200, 270transaction-cost based theory, 238 transnational intra-firm integration, 199, 229travel, 173, 186, 253Trefler, d., 139, 238Tsai, r. J., 13–14, 130t, 144Turnbull, P. W., 234
unemployment, 33–35, 35n, 38, 38n, 40, 61–62, 148, 292, 298–299, 301reduction, 33, 61
United Statesand BPo, 195–225— competitive pressure, 203–204, 213, 222— country destination, 213— efficiency seeking, 201–202, 211, 223— industry selection, 207–210— knowledge seeking, 202, 212, 216, 205–
206, 221— market seeking, 200–201, 211, 230— motivations, 196, 218t–220t, 220, 222–225— ownership advantages, 213— resource seeking, 199, 210–211, 220— service orientation, 213, 215, 219t
value chain, 142, 201, 225, 228, 233, 279–280, 289
Vahlne, J., 12, 142, 227–228, 233–234, 237, 248
Venkatraman, N. V., 11, 196, 199, 201, 223, 225, 227, 229, 235
Verma, r., 135tvertical specialization, 29, 29n, 30, 44t, 46–47,
52, 66, 66n, 73t–76t, 81, 84t, 98, 99n, 103t–104t, 298
Vivek, S., 136t, 139–140, 146

[ 319 ]
wage average, 55, 212costs, reduction of, 55efficiency, 38n, 61flexibility, 38gap, 51low–—, high-skill workers, 21, 45, 47, 59,
147–148, 202–203, 236, 277, 281, 283, 285
relative, 23, 32, 39n, 42t–43t, 47n, 63, 296Wallenstål, M., 234 Walters, P., 234Webster, E., 108Wei, S. J., 12, 23, 42t, 44t, 48–49, 65, 88,
106–108Welch, l., 234Werner, S., 127Wernerfelt, B., 140, 203, 233
Westney, d. E., 143, 233, 237Wiedersheim-Paul, F., 234Wighton, d., 16Williamson, o. E., 138–139, 238Williamson, P., 142, 199workers, highly skilled, 47–51, 55, 57, 59,
62–63, 133t, 163, 180, 196, 202, 277, 287–288See also capability
youngdahl, W., 134t, 145–146yu, J., 199, 203
Zaheer, S., 11, 15, 130t, 143, 196–198, 200–203, 206–210, 210t, 211-214, 217, 220–222, 224–225, 229–230, 233, 235, 237, 248
Zander, U., 199, 202, 231, 238 Zheng, S., 109, 110n

about the authors
Adetunji Adegbesan has a First Class Honors degree in Electronic
Engineering from the University of Nigeria, Nsukka, and a Ph.d. in Strategic
Management from IESE Business School, Barcelona, Spain. He is a member
of the faculty of the lagos Business School, Nigeria, where he leads sessions
on Competitive Strategy and Strategic Innovation. His current research
seeks to shed light on the resource market dynamics that lie at the origins
of competitive advantage. He is the global representative for africa and a
member of the research Committee of the Strategy division of the academy
of Management, as well as a visiting scholar and associate researcher at the
Center for Globalization and Strategy at IESE Business School.
Pablo Agnese holds both an MSc and Ph.d. in Economics from the auto-
nomous University of Barcelona (UaB), Spain. His current research interests
include labor macroeconomics, offshoring, and East asian economies. He is
also a granted researcher at IESE Business School, where he is involved in a
project that studies the effects of offshoring on labor markets. He also teaches
labor Economics and Quantitative Methods at Pompeu Fabra University,
Barcelona, and has published articles in the International Review of Economics
and Finance and in the Asian Pacific Journal of Economics and Business.
Niccolò Pisani holds a Ph.d. in Management from IESE Business School,
Barcelona, Spain, and an MSc in Economics and Management from
the Pompeu Fabra University, Barcelona. His research is focused on the
international strategies of firms, in particular on the current global relocation
of service and higher-skilled activities. He has presented his works in leading
international conferences and in 2009 published a review of international
management research in the Journal of Management.
Joan Enric Ricart holds an MSc and a Ph.d. in Managerial Economics
from the Kellog Graduate School of Management, Illinois, United States,
a Ph.d. in Industrial Engineering from the Polytechnic University of
Catalonia, Barcelona, Spain, and a Ph.d. in Business administration and
Economics from the autonomous University of Barcelona (UaB). His areas
of interest are: strategic management, corporate governance, organizational
design, the economics of organizations and offshoring. Besides teaching
Economics and Strategic Management, and being head of IESE Business
School’s Strategic Management department and associate director of faculty
for the departments of Strategic Management, Production, Technology and
operations, and Entrepreneurship, he also holds IESE’s Carl Schroeder
Chair of Strategic Management. He has published numerous books, and has
authored articles in journals such as Econometrica, European Economic Review,
Journal of Finance, Harvard Deusto Business Review, Papeles de Economía, and
Revista Española de Economía.