Embed Size (px)
Citation preview
Oil and democracy in Russia
Russia is often considered a perfect example of the so‐called “resource curse”—the argument that natural resource wealth tends to undermine democracy. Given high oil prices, some observers see the country as virtually condemned to authoritarian government for the foreseeable future. Reexamining various data, I show that such fears are exaggerated. Evidence from around the world suggests that for countries like Russia with an established oil industry, even large increases in the scale of mineral incomes have only a minor effect on the political regime. In addition, Russia—a country with an industrialized economy, a highly educated, urbanized population, and an oil sector that remains majority private‐owned—is unlikely to be susceptible to most of the hypothesized pernicious effects of resource dependence.
Daniel Treisman
Department of Political Science
University of California, Los Angeles
January 2010
Preliminary draft; comments welcome
Russia is often thought to be a classic case of the so‐called “resource curse”—the idea that
natural resource wealth tends to impair democracy.1 Indeed, some see the country as virtually
doomed to authoritarian politics by its enormous endowments of oil and gas. “Russia’s future
will be defined as much by the geology of its subsoil as by the ideology of its leaders,” writes
Moisés Naím, Editor‐in‐Chief of Foreign Policy magazine, and a former trade and industry
minister of petroleum‐rich Venezuela. “A lot of oil combined with weak public institutions
produces poverty, inequality, and corruption. It also undermines democracy.”2 The New York
Times columnist Tom Friedman sees a close relationship between world commodity prices and
the extent of liberty in resource‐rich states: a higher oil price means less freedom. Russia, from
Gorbachev to Putin, seems to him to fit perfectly.3
This view has an immediate plausibility. There is no question that oil and gas have been
at the core of Russia’s political economy in recent decades. The plunge in petroleum prices in
the 1980s helped create the economic crisis that the last Soviet governments failed to
overcome.4 Surging commodity prices after 1998 coincided with the re‐centralization of power
1 In fact, there are several “resource curse” arguments, asserting respectively that resource wealth: (a) slows economic growth, (b) fosters civil wars, and (c) impairs the quality of governance and erodes democracy. I focus here exclusively on (c). 2 Moisés Naím, “Russia’s Oily Future: Overcoming geology, not ideology, will become Moscow’s greatest challenge,” Foreign Policy, January/February 2004, 94‐5. 3 Thomas L. Friedman, “The First Law of Petropolitics,” Foreign Policy, May‐June, 2006, 28‐36.
2
under Putin, the reassertion of Kremlin control over national television, the spread of credible
reports of electoral fraud, and the harrassment of independent social and political
organizations. The leading state‐controlled oil and gas companies even served as the regime’s
favored tool for chipping away at civic freedoms. It was the Kremlin‐led gas monopoly Gazprom
that, with a mixture of business maneuvers and administrative muscle, took over previously
critical media outlets. And it was the state‐owned oil company Rosneft that swallowed assets
owned by the oligarch Mikhail Khodorokovsky, who had been funding the political opposition
and civil society groups.
Still, arguments that seem to fit so well deserve particular scrutiny. Were oil and gas—
and the fluctuations in their prices—as central to determining the course of political
development in Russia as advocates of this view suggest? If so, by what pathways did the
resource curse operate? Is Russia condemned to endure authoritarian government—in the
worst case, to degenerate into the kind of oil‐fueled autocracy characteristic of the Persian
Gulf? In this paper, I briefly examine the evidence for the resource curse worldwide and apply
estimates of the effect of resource wealth on political institutions derived from cross‐national
analysis to Russia.
The evidence is consistent with the claim that Russia would be somewhat more
democratic if it had no oil or gas. However, international comparisons also suggest that very
little of the variation over time in Russia’s political regime since 1985 can be attributed to
changes in its oil and gas income or reserves. When studied systematically, international
4 Yegor Gaidar, Collapse of an Empire: Lessons for Modern Russia, Washington, DC: Brookings Institution Press, 2007.
3
experience suggests that for countries like Russia with an established petroleum industry even
large gyrations in oil revenues have a relatively minor impact. The evidence suggests that there
is little reason to fear that mineral wealth will cause Russia to sink deep into autocracy even if
oil prices rise to unprecedented heights.
1 What do we know about the “oil curse”?
In the last decade, scholars have used statistical methods to test the hypothesis that oil and gas
wealth is inimical to democracy. Most believe there is evidence of a statistically significant
relationship, although there are some dissenters.5 At the same time, recognition has been
growing that the effects of oil can be quite different in different types of countries and in
different periods.
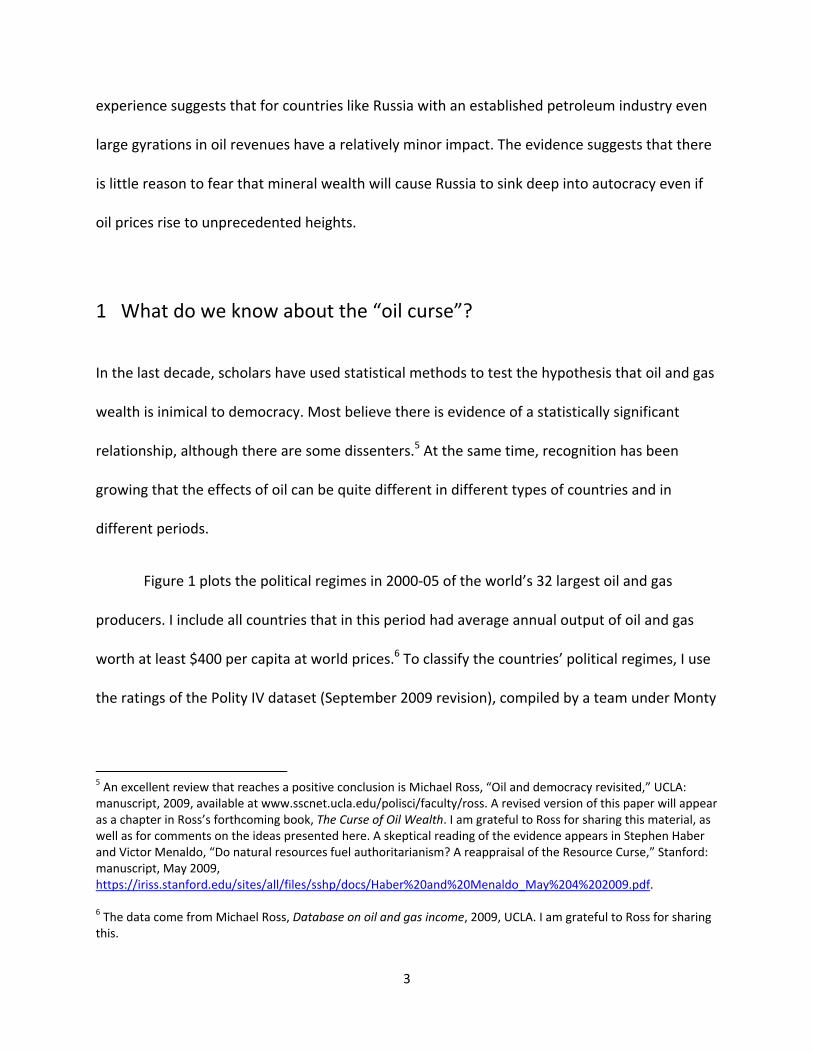
Figure 1 plots the political regimes in 2000‐05 of the world’s 32 largest oil and gas
producers. I include all countries that in this period had average annual output of oil and gas
worth at least $400 per capita at world prices.6 To classify the countries’ political regimes, I use
the ratings of the Polity IV dataset (September 2009 revision), compiled by a team under Monty
5 An excellent review that reaches a positive conclusion is Michael Ross, “Oil and democracy revisited,” UCLA: manuscript, 2009, available at www.sscnet.ucla.edu/polisci/faculty/ross. A revised version of this paper will appear as a chapter in Ross’s forthcoming book, The Curse of Oil Wealth. I am grateful to Ross for sharing this material, as well as for comments on the ideas presented here. A skeptical reading of the evidence appears in Stephen Haber and Victor Menaldo, “Do natural resources fuel authoritarianism? A reappraisal of the Resource Curse,” Stanford: manuscript, May 2009, https://iriss.stanford.edu/sites/all/files/sshp/docs/Haber%20and%20Menaldo_May%204%202009.pdf. 6 The data come from Michael Ross, Database on oil and gas income, 2009, UCLA. I am grateful to Ross for sharing this.
4
Marshall and Keith Jaggers, at George Mason University. The scale runs from ‐10 to +10. Scores
of ‐10 to ‐6 represent autocracies, and scores of 6 to 10 represent democracies.
A first point to note is the great variation in types of regime among the major oil
producers. Their political systems range from consolidated autocracies (like Saudi Arabia and
Qatar) to consolidated democracies (like Norway and Trinidad and Tobago). Moreover, the
Algeria
Angola
Argentina
Australia
AzerbaijanBahrain
Canada
Congo
Denmark
Ecuador
Equatorial Guinea
Gabon
Iran
Iraq
Kazakhstan
KuwaitLibya
Malaysia
Mexico
NetherlandsNorway
Oman
Qatar
Russia
Saudi Arabia
Trinidad
Turkmenistan
UAE
UKUSA
Uzbekistan
Venezuela
‐12
‐10
‐8
‐6
‐4
‐2
0
2
4
6
8
10
12
400 4000 40000
Average Polity score (‐10 = pure autocracy, 1 0= pure democracy),
2000‐05
Average national income per capita from oil and gas, 2000‐05, logarithmic scale
Figure 1 Political regimes of major oil and gas producers, 2000‐05
Sources: Michael Ross, Database on oil and gas income, UCLA, 2009; Polity IV, 2009 update. "Muslim world": countries where more than 40 percent of the population were Muslim adherents in 2000 (Barrett 2000 as in Robert Barro, Religion Adherence Dataset, www.economics.harvard.edu/faculty/barro/data_sets_barro.) Major oil and gas producers: where annual income from oil and gas > $400 per capita.
Muslim world
Sub‐Saharan Africa
Latin America
Highly‐developedcountries
5
pattern looks anything but random. With one exception, the countries fall naturally into four
groups. First, there are the highly industrialized countries of Western Europe, North America,
and Oceania. Major oil producers in this category such as Norway, Canada, and Denmark are
stable liberal democracies. Research confirms that they are not subject to any resource curse.7
Second, there are the oil‐rich states of Latin America such as Venezuela, Mexico, and Trinidad
and Tobago. These are also classified by Polity as democracies, although some are closer to the
category’s bottom edge. As Dunning has shown, not only is there no evidence of a resource
curse in Latin America, there appears to be a resource blessing. The oil‐rich countries in that
region have actually been more democratic on average than their peers. Dictatorships in Latin
America that had oil were more likely to democratize than those that did not.8
The third group consists of oil‐producers in Sub‐Saharan Africa, which are found
between ‐6 and ‐2 on the 21‐point scale, intermediate regimes just above the range of
“autocracy.” In this region, scholars have found evidence that greater resource dependence
renders democracies more vulnerable.9 Fourth, there are the countries of the Muslim world. It
is striking that all the countries at the bottom of Figure 1 have large Muslim communities. (The
converse is not true: some Muslim oil producers like Malaysia are closer to democracy than
dictatorship.) Indeed, among the major oil producers, the only ones that Polity classified as
autocracies, with scores of ‐6 or lower, were countries in which Muslim adherents made up
7 Ross (“Oil and Democracy Revisited,”) finds, for instance, that greater oil and gas income is not associated with a greater chance of democratic failure in countries with income per capita above $5,000. 8 Thad Dunning, Crude Democracy: Natural Resource Wealth and Political Regimes (New York: Cambridge University Press, 2008). See also Ross, “Oil and Democracy Revisited,” 8‐9. 9 Nathan Jensen and Leonard Wantchekon, “Resource Wealth and Political Regimes in Africa,” Comparative Political Studies, 2004, 37 (9), 816‐841.
6
more than three quarters of the population. Of course, this is merely an observation about the
pattern rather than a claim about what causes what. Some evidence presented below suggests
that, once all the differences among countries are taken into account, the effects of oil and gas
are just as strong in non‐Muslim as in Muslim countries.
Finally, there is the one country that does not belong in any of these groups—Russia—
which, in Figure 1, appears to blend in with Latin America.
Some simple statistics help to elucidate the patterns in the data. In Table 1, I show a
series of regressions of countries’ Polity scores on the natural log of their per capita income
from oil and gas. In all regressions, I control for the natural log of countries’ gross domestic
product per capita (at purchasing power parity, from the Penn World Tables), since a great deal
of work suggests that more developed countries tend to be more democratic. All regressions
are run on panels that include all countries for which data were available in the period from
1960 to 2005. To reduce autocorrelation, I follow established practice and use only
observations from every fifth year, starting in 1960.10 In all regressions, I include a full set of
year dummies. In models 1 to 9, I also include country fixed effects, which control for any
unchanging characteristics of the country. Thus, these regressions pick up the way in which,
within given countries, changing levels of oil and gas income correlate over time with the
nature of those countries’ political regimes. In models 10‐18, I do not include country fixed
effects, but include a one‐period autoregressive process to correct for autocorrelation. Thus,
these models capture both correlations between petroleum income and regimes over time and
10 See Ross, “Oil and Demcoracy Revisited;” Daron Acemoglu, Simon Johnson, James Robinson, and Pierre Yared, “Income and Democracy,” American Economic Review, 2008, 98 (3), 808‐842.
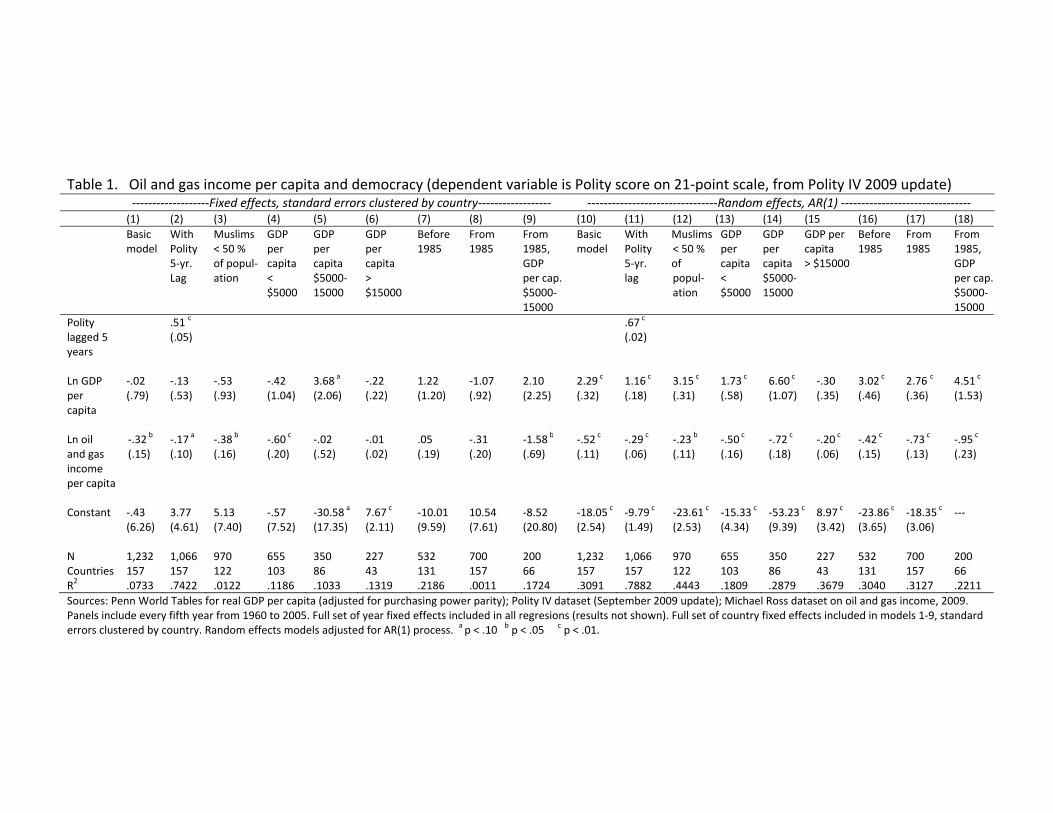
Table 1. Oil and gas income per capita and democracy (dependent variable is Polity score on 21‐point scale, from Polity IV 2009 update) ‐‐‐‐‐‐‐‐‐‐‐‐‐‐‐‐‐‐‐Fixed effects, standard errors clustered by country‐‐‐‐‐‐‐‐‐‐‐‐‐‐‐‐‐‐ ‐‐‐‐‐‐‐‐‐‐‐‐‐‐‐‐‐‐‐‐‐‐‐‐‐‐‐‐‐‐‐‐Random effects, AR(1) ‐‐‐‐‐‐‐‐‐‐‐‐‐‐‐‐‐‐‐‐‐‐‐‐‐‐‐‐‐‐‐‐
(1) (2) (3) (4) (5) (6) (7) (8) (9) (10) (11) (12) (13) (14) (15 (16) (17) (18)
Basic model
With Polity 5‐yr. Lag
Muslims < 50 % of popul‐ation
GDP per capita < $5000
GDP per capita $5000‐ 15000
GDP per capita > $15000
Before 1985
From 1985
From 1985, GDP per cap. $5000‐ 15000
Basic model
With Polity 5‐yr. lag
Muslims < 50 % of popul‐ation
GDP per capita < $5000
GDP per capita $5000‐15000
GDP per capita > $15000
Before 1985
From 1985
From 1985, GDP per cap. $5000‐ 15000
Polity lagged 5 years
.51 c
(.05) .67
c (.02)
Ln GDP per capita
‐.02 (.79)
‐.13 (.53)
‐.53 (.93)
‐.42 (1.04)
3.68a
(2.06) ‐.22 (.22)
1.22 (1.20)
‐1.07 (.92)
2.10 (2.25)
2.29 c (.32)
1.16 c (.18)
3.15 c (.31)
1.73 c (.58)
6.60 c (1.07)
‐.30 (.35)
3.02 c (.46)
2.76 c
(.36) 4.51 c (1.53)
Ln oil and gas income per capita
‐.32 b
(.15) ‐.17 a (.10)
‐.38 b (.16)
‐.60 c (.20)
‐.02 (.52)
‐.01 (.02)
.05 (.19)
‐.31 (.20)
‐1.58 b (.69)
‐.52 c (.11)
‐.29 c (.06)
‐.23 b (.11)
‐.50 c (.16)
‐.72 c (.18)
‐.20 c (.06)
‐.42 c (.15)
‐.73 c (.13)
‐.95 c (.23)
Constant ‐.43
(6.26) 3.77 (4.61)
5.13 (7.40)
‐.57 (7.52)
‐30.58a
(17.35) 7.67 c (2.11)
‐10.01 (9.59)
10.54 (7.61)
‐8.52 (20.80)
‐18.05 c (2.54)
‐9.79 c (1.49)
‐23.61 c
(2.53) ‐15.33 c
(4.34) ‐53.23 c
(9.39) 8.97 c (3.42)
‐23.86 c
(3.65) ‐18.35 c
(3.06) ‐‐‐
N 1,232 1,066 970 655 350 227 532 700 200 1,232 1,066 970 655 350 227 532 700 200 Countries 157 157 122 103 86 43 131 157 66 157 157 122 103 86 43 131 157 66 R2 .0733 .7422 .0122 .1186 .1033 .1319 .2186 .0011 .1724 .3091 .7882 .4443 .1809 .2879 .3679 .3040 .3127 .2211
Sources: Penn World Tables for real GDP per capita (adjusted for purchasing power parity); Polity IV dataset (September 2009 update); Michael Ross dataset on oil and gas income, 2009. Panels include every fifth year from 1960 to 2005. Full set of year fixed effects included in all regresions (results not shown). Full set of country fixed effects included in models 1‐9, standard errors clustered by country. Random effects models adjusted for AR(1) process.
a p < .10 b p < .05 c p < .01.
correlations between these variables across countries. Since the correlations across countries
may be caused by other factors left out of the regressions, these models may overestimate the
true effects of oil.
Columns 1 and 10 show that, looking at all countries for the full period from 1960 to
2005, there is a statistically significant relationship between higher oil and gas income and less
democratic government. This is so whether one looks just at change over time (model 1) or
both variation over time and across countries (model 10). If one controls for the nature of the
regime five years earlier, the effect of oil and gas income is still significant, but only a little more
than half as large (models 2 and 11). Thus, the short run effect of an increase in resource
income may be smaller than the total effect. Although the effect of oil and gas appears weaker
in predominantly Muslim countries if we look at the random effects models (compare the
coefficients of ‐.23 in column 12 and ‐.52 in column 10), controlling for all countries’ fixed
characteristics, more oil and gas income is associated with just as large a decrease in democracy
in non‐Muslim countries (columns 3 and 1).11
Controlling for country characteristics, and looking at the full period, it is only among
very poor countries that oil and gas income correlates over time with less democracy. If one
looks also at the cross‐country variation, however, the strongest correlation is among countries
at intermediate levels of development (GDP per capita at PPP between $5,000 and $15,000).
Ross has noted that the relationship between resource wealth and less democracy does not
appear in data from before the early 1980s. Up to that point, oil and gas did not appear to have
11 It could be, however, that the fixed effect regressions underestimate the impact of changes in oil and gas income on democracy in Muslim countries because a good number of the major Muslim oil producers were from early on at the bottom of Polity’s scale, with nowhere further to drop.
9
any negative effect. It was in the “Third Wave” of democracy, which culminated in the East
European transition from communism, that major oil producers started to stand out,
democratizing less than their oil‐poor neighbors. The regressions in Table 1 confirm this. In the
fixed effects regressions, there is no effect of oil in the period before 1985, and in the random
effects models the earlier effect is weaker (columns 7, 8, 16, and 17).
The impact of oil at different income levels also appears to change after 1985. In the
later period, it was actually the countries at intermediate income levels that showed the
strongest effect of mineral wealth. I therefore present one final pair of models (colums 9 and
18) that include only countries with intermediate income levels in the post‐1985 period. These
models show the largest estimated effects of oil and gas income on democracy that I have been
able to find by experimenting with different specifications.
In short, the regressions illustrate and confirm the results of earlier work on the
relationship between mineral wealth and democracy. Since the early 1980s—but not before
that—poor and middle income countries outside Latin America that earned large amounts of
income from oil and gas have tended to become less democratic.
2 What does this imply about Russia?
Most of the models in Table 1 suggest a statistically significant negative relationship between
petroleum income and democracy. It is difficult to be sure how large the effect is given the wide
range of estimates across different specifications. But the pattern of evidence worldwide is
10
generally consistent with the claim that Russia would be more democratic today if it had no oil
or gas at all.
What about the effect of changes in Russia’s oil and gas income since the late Soviet
period? Between 1985 and 1998, the value of Russia’s oil and gas output fell from $2,207 per
capita to $476 per capita, by Ross’s estimates. By 2006, the value had risen again to $2,765. As
many observers have pointed out, the fall and rise in Russia’s oil receipts mirror the rise and fall
in political freedom in the country under the consecutive leadership of Gorbachev, Yeltsin, and
Putin. Can oil explain Russia’s political trajectory?
The answer appears to be: only a small part of it. The true effect of petroleum income
probably lies somewhere within the range defined by the coefficients in the various models of
Table 1. It turns out that whichever of these one uses, the implied effect of Russia’s changing oil
and gas income is surprisingly small. A low estimate is the coefficient of ‐.32 in model 1. The
highest estimate is the coefficient of ‐1.58 in model 9. Applying these to the Russian data, the
drop in oil and gas earnings after 1985 predicts an increase in Russia’s Polity score of between
0.5 and 2.4 points on the 21‐point Polity scale. The increase in oil and gas income after 1998
implies a fall in the country’s Polity score of 0.6 to 2.8 points. Figure 2 shows the predicted path
of Russia’s score based on just the variation over time in its oil and gas income.
Clearly, if the experience of other countries is a guide, the ups and downs of Russia’s
petroleum income can explain at most a small fraction of the changes in its political regime over
the last 25 years. This, too, is consistent with what previous research has shown about the
“resource curse”. As Ross pointed out in a seminal article in 2001, the marginal effect of oil on
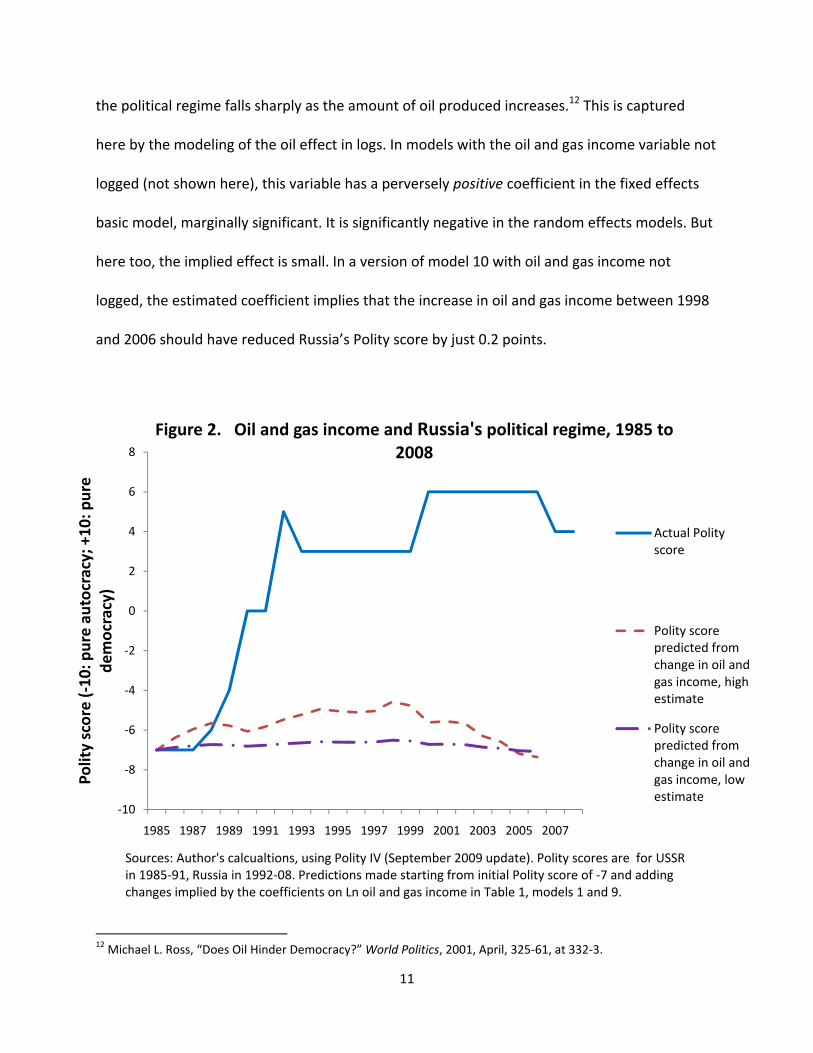
11
the political regime falls sharply as the amount of oil produced increases.12 This is captured
here by the modeling of the oil effect in logs. In models with the oil and gas income variable not
logged (not shown here), this variable has a perversely positive coefficient in the fixed effects
basic model, marginally significant. It is significantly negative in the random effects models. But
here too, the implied effect is small. In a version of model 10 with oil and gas income not
logged, the estimated coefficient implies that the increase in oil and gas income between 1998
and 2006 should have reduced Russia’s Polity score by just 0.2 points.
12 Michael L. Ross, “Does Oil Hinder Democracy?” World Politics, 2001, April, 325‐61, at 332‐3.
‐10
‐8
‐6
‐4
‐2
0
2
4
6
8
1985 1987 1989 1991 1993 1995 1997 1999 2001 2003 2005 2007
Polity score (‐10: p
ure autocracy; +10: p
ure
democracy)
Figure 2. Oil and gas income and Russia's political regime, 1985 to 2008
Actual Polity score
Polity score predicted from change in oil and gas income, high estimate
Polity score predicted from change in oil and gas income, low estimate
Sources: Author's calcualtions, using Polity IV (September 2009 update). Polity scores are for USSR in 1985‐91, Russia in 1992‐08. Predictions made starting from initial Polity score of ‐7 and adding changes implied by the coefficients on Ln oil and gas income in Table 1, models 1 and 9.
12
The effects of oil are not always tiny. For a country that starts producing a large amount
of oil from scratch, the implied effect on the regime can be sizeable. In Equatorial Guinea,
between 1990 and 2005, oil and gas income increased from nothing to $13,674 per capita.
Since the country’s GDP per capita started out well below $5,000, I use the estimated
coefficient of ‐.60 from model 4 in Table 1. The model predicts a fall in Equatorial Guinea’s
Polity score of almost six points. The diminishing marginal effect of oil also implies an
asymmetry worth keeping in mind. Were Russia’s oil and gas income to increase from its
present level, the models suggest this would lead to only a very small further deterioration in its
politics. By contrast, were Russia’s oil and gas income to dry up completely, the implied
increase in democracy would be much larger.
The small size of the estimated effect in Russia is not just an idiosyncracy of my analysis.
Applying the estimates of other scholars yields similar results. For instance, Silje Aslaksen
estimates the relationship between the value of countries’ oil production (as a share of GDP)
and democracy, as measured by both Polity and Freedom House.13 Using either democracy
measure, she finds coefficients of ‐.002 to ‐.004, depending on the specification, where the
dependent variable, democracy, is normalized to range between 0 and 1. Using the same data
(from the World Bank’s Adjusted Saving Database), I find that Russia’s oil production as a share
of GDP rose from about 11 percent in 1998 to about 23 percent in 2006, an increase of 12
percentage points. Applying Aslaksen’s estimated coefficients, this increase would result in a
decrease in democracy of between 2.4 and 4.8 points on a 100‐point scale. On the Polity scale,
running from ‐10 to +10, that corresponds to a change of just 0.5 to 1 point.
13 Silje Aslaksen, “Oil and Democracy—More than a Cross‐Country Correlation?” Journal of Peace Research, forthcoming, available at http://www.oekonomi.uio.no/ansatte/Div./silje/oil_for%20hompage.pdf.
13
In another paper, Egorov, Guriev, and Sonin demonstrate that among autocracies and
imperfect democracies, greater proven oil reserves correlate with lower media freedom, as
judged by the organization Freedom House.14 This relationship holds both cross‐nationally and
over time. However, again the oil variable enters logarithmically, which implies that for
countries like Russia the effect of recent changes is very small. Using the largest negative
coefficient the authors obtained (‐2.87, from their Model 5, Table 1), I calculate that the
massive increase in the value of Russia’s proven oil reserves from $710 billion in 1998 to $7.68
trillion in 2008 should have reduced press freedom by seven points on a 100‐point scale—
roughly equivalent to the gap in press freedom between the US and Norway.
In short, the pattern of evidence from around the world suggests that the ups and
downs in Russia’s oil and gas income in recent decades have had only a minor influence on its
regime. Given that, by almost any measure, very large changes occurred in Russia’s political
system during the last 25 years, one must look to other factors to explain these changes. Of
course, oil and gas revenues may have been more important in certain years, but on average
they apear to have played a secondary role.
3 Specific pathways
The apparently limited impact of oil on politics in Russia makes sense when one considers the
various mechanisms by which scholars have argued that natural resource wealth blocks or
14 Georgy Egorov, Sergei Guriev, and Konstantin Sonin, “Why Resource‐Poor Dictators Allow Freer Media: Theory and Evidence from Panel Data,” American Political Science Review, 2009, November.
14
erodes democracy. It is hard to find much evidence of these mechanisms at work in Russia.
There are five main arguments.
A. Fiscal bargains
The argument that has found the most support is that large mineral endowments obviate the
need for rulers to come to agreement with their subjects over fiscal issues. Democracy
developed in Europe, according to one popular view, because rulers were forced to grant
representation to at least some classes of the population in return for taxation. By contrast, in
resource‐rich states, rulers can live as “rentiers,” spending their revenues from the sale of
minerals rather than relying on taxes.
This fits the situation in the Persian Gulf, where the burden of taxation is, indeed,
unusually low. In Bahrain, tax revenues make up just four or five percent of GDP; in Kuwait,
they come to about one percent.15 Qatar has no personal income tax, no tax on personal
property, and no value added or sales tax. Despite not paying much tax at all, the country’s
population receives a remarkable set of benefits from the state—from free education,
healthcare, and telephone service to guaranteed jobs in the civil service upon graduation from
high school, housing allowances, and free plots of land.16 Overwhelmed with royal largesse,
most Qataris have been reluctant to campaign for political rights.
Of course, the “rentier” argument assumes that there are sufficient rents to keep the
public at bay. Yet oil states differ greatly in how large their oil revenues are in per capita terms.
15 World Bank, World Development Indicators, 2009.
16 Mehran Kemrava, “Royal Factionalism and Political Liberalization in Qatar,” The Middle East Journal, 63, 3, 2009.
15
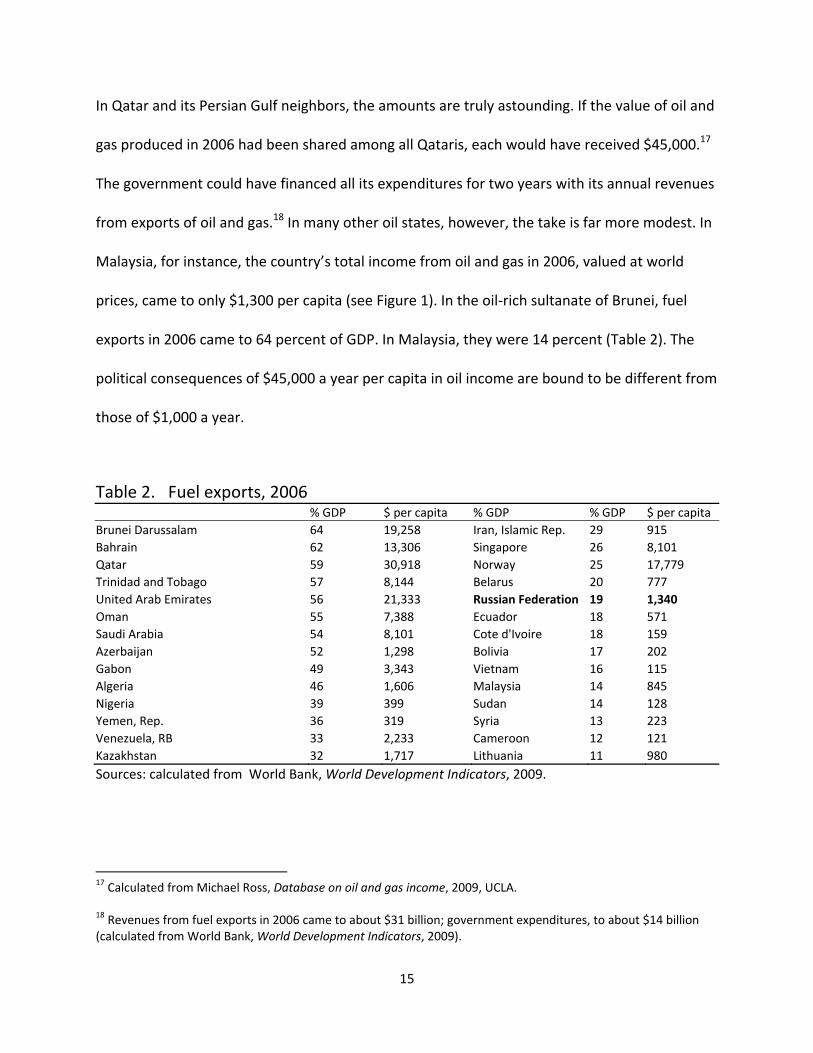
In Qatar and its Persian Gulf neighbors, the amounts are truly astounding. If the value of oil and
gas produced in 2006 had been shared among all Qataris, each would have received $45,000.17
The government could have financed all its expenditures for two years with its annual revenues
from exports of oil and gas.18 In many other oil states, however, the take is far more modest. In
Malaysia, for instance, the country’s total income from oil and gas in 2006, valued at world
prices, came to only $1,300 per capita (see Figure 1). In the oil‐rich sultanate of Brunei, fuel
exports in 2006 came to 64 percent of GDP. In Malaysia, they were 14 percent (Table 2). The
political consequences of $45,000 a year per capita in oil income are bound to be different from
those of $1,000 a year.
Table 2. Fuel exports, 2006 % GDP $ per capita % GDP % GDP $ per capita
Brunei Darussalam 64 19,258 Iran, Islamic Rep. 29 915
Bahrain 62 13,306 Singapore 26 8,101
Qatar 59 30,918 Norway 25 17,779
Trinidad and Tobago 57 8,144 Belarus 20 777
United Arab Emirates 56 21,333 Russian Federation 19 1,340
Oman 55 7,388 Ecuador 18 571
Saudi Arabia 54 8,101 Cote d'Ivoire 18 159
Azerbaijan 52 1,298 Bolivia 17 202
Gabon 49 3,343 Vietnam 16 115
Algeria 46 1,606 Malaysia 14 845
Nigeria 39 399 Sudan 14 128
Yemen, Rep. 36 319 Syria 13 223
Venezuela, RB 33 2,233 Cameroon 12 121
Kazakhstan 32 1,717 Lithuania 11 980
Sources: calculated from World Bank, World Development Indicators, 2009.
17 Calculated from Michael Ross, Database on oil and gas income, 2009, UCLA. 18 Revenues from fuel exports in 2006 came to about $31 billion; government expenditures, to about $14 billion (calculated from World Bank, World Development Indicators, 2009).
16
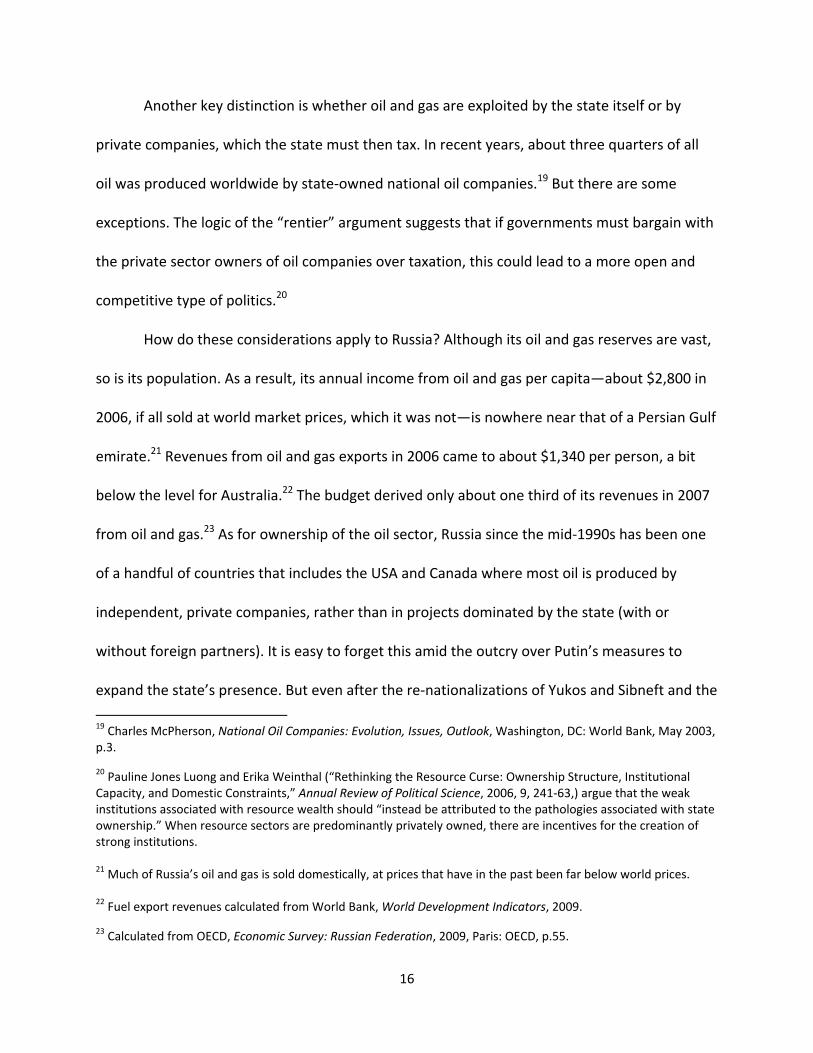
Another key distinction is whether oil and gas are exploited by the state itself or by
private companies, which the state must then tax. In recent years, about three quarters of all
oil was produced worldwide by state‐owned national oil companies.19 But there are some
exceptions. The logic of the “rentier” argument suggests that if governments must bargain with
the private sector owners of oil companies over taxation, this could lead to a more open and
competitive type of politics.20
How do these considerations apply to Russia? Although its oil and gas reserves are vast,
so is its population. As a result, its annual income from oil and gas per capita—about $2,800 in
2006, if all sold at world market prices, which it was not—is nowhere near that of a Persian Gulf
emirate.21 Revenues from oil and gas exports in 2006 came to about $1,340 per person, a bit
below the level for Australia.22 The budget derived only about one third of its revenues in 2007
from oil and gas.23 As for ownership of the oil sector, Russia since the mid‐1990s has been one
of a handful of countries that includes the USA and Canada where most oil is produced by
independent, private companies, rather than in projects dominated by the state (with or
without foreign partners). It is easy to forget this amid the outcry over Putin’s measures to
expand the state’s presence. But even after the re‐nationalizations of Yukos and Sibneft and the
19 Charles McPherson, National Oil Companies: Evolution, Issues, Outlook, Washington, DC: World Bank, May 2003, p.3.
20 Pauline Jones Luong and Erika Weinthal (“Rethinking the Resource Curse: Ownership Structure, Institutional Capacity, and Domestic Constraints,” Annual Review of Political Science, 2006, 9, 241‐63,) argue that the weak institutions associated with resource wealth should “instead be attributed to the pathologies associated with state ownership.” When resource sectors are predominantly privately owned, there are incentives for the creation of strong institutions. 21 Much of Russia’s oil and gas is sold domestically, at prices that have in the past been far below world prices. 22 Fuel export revenues calculated from World Bank, World Development Indicators, 2009.
23 Calculated from OECD, Economic Survey: Russian Federation, 2009, Paris: OECD, p.55.
17
revision of terms on the Sakhalin II project, estimates of the share of oil produced in majority
state‐owned companies ranged from 37 to 42 percent.24 In the gas sector, the state’s stake in
Gazprom was increased to just over 50 percent through the repurchase of shares. But at the
same time it became legal for foreigners to own shares directly.
As a result, although the oil and gas sectors contribute a great deal to the budget, most
revenues come from other sectors. And much of the oil and gas revenues have to be extracted
in the form of taxes from privately owned companies. The government cannot live off its rents.
Nor does it have remotely enough oil wealth to keep the population cocooned in a Persian‐
Gulf‐style system of cradle‐to‐grave benefits. As a result, the government must enter into
negotiations with the private sector—in the 1990s, the level of ad hoc bargaining was
considered a scandal—and it has worked to create a modern tax system, with personal income
taxes, VAT, and payroll taxes. Tax revenues of the consolidated budget came to about 30
percent of GDP in 2007.25
B. Repression
A second argument is that revenues from oil and gas enable governments to repress their
populations. Mineral rents provide the cash to hire more policemen, train security services, and
24 Philip Hanson, “The Resistible Rise of State Control in the Russian Oil Industry,” Eurasian Geography and Economics, 2009, 50, 1, pp.14‐27, at p.15; OECD, Economic Survey: Russia, 2006, p.38; Peter Rutland, “Putin’s Economic Record: Is the Oil Boom Sustainable?” Europe‐Asia Studies, 2008, 60, 6, 1051‐72. Rutland points out that not only does Russia have a sizeable private oil sector, it also has competition among its domestic oil producers.
25 Calculated from Goskomstat RF, Rossiisky statistichesky yezhegodnik, 2008. See also William Tompson, “A Frozen Venezuela? The ‘Resource Curse’ and Russian Politics,” Paris, OECD, 2005.
18
monitor citizens with high technology equipment. The huge stakes involved might also make
incumbents more determined to use violence to crush political opposition.
Ross examined this, using as a measure of repression the annual frequencies of torture,
extrajudicial killings, political imprisonment, and disappearances attributable to the
government, as collected from US State Department human rights reports by Cingranelli and
Richards.26 He found that, in fact, controlling for regime type, oil producers were no more
repressive than non‐oil producers.27
C. Oil and modernization
An influential tradition of thought argues that democratization tends to occur only after
societies are transformed by modernization. The spread of education, industrialization,
urbanization, occupational specialization, and modern mass media prompt new popular
demands for government accountability. However, if countries grow rich by extracting oil or
other minerals, the social changes associated with modernization in Western Europe and North
America may not take place. Minerals can be extracted in enclaves, often staffed by foreigners,
while the surrounding society remains predominantly traditional.
Whether such social transformations are necessary or sufficient conditions for
democratization is debated. But, regardless, this argument does not apply well to countries that
were already industrialized when they discovered oil or when the oil boom of the 1970s
occurred, creating massive rents for petroleum producers. Oil rich states began from very
26 David L. Cingranelli and David L. Richards, Cingranelli‐Richards (CIRI) Human Rights Dataset 2008, www.humanrightsdata.org. 27 Ross, “Oil and Democracy Revisited.”
19
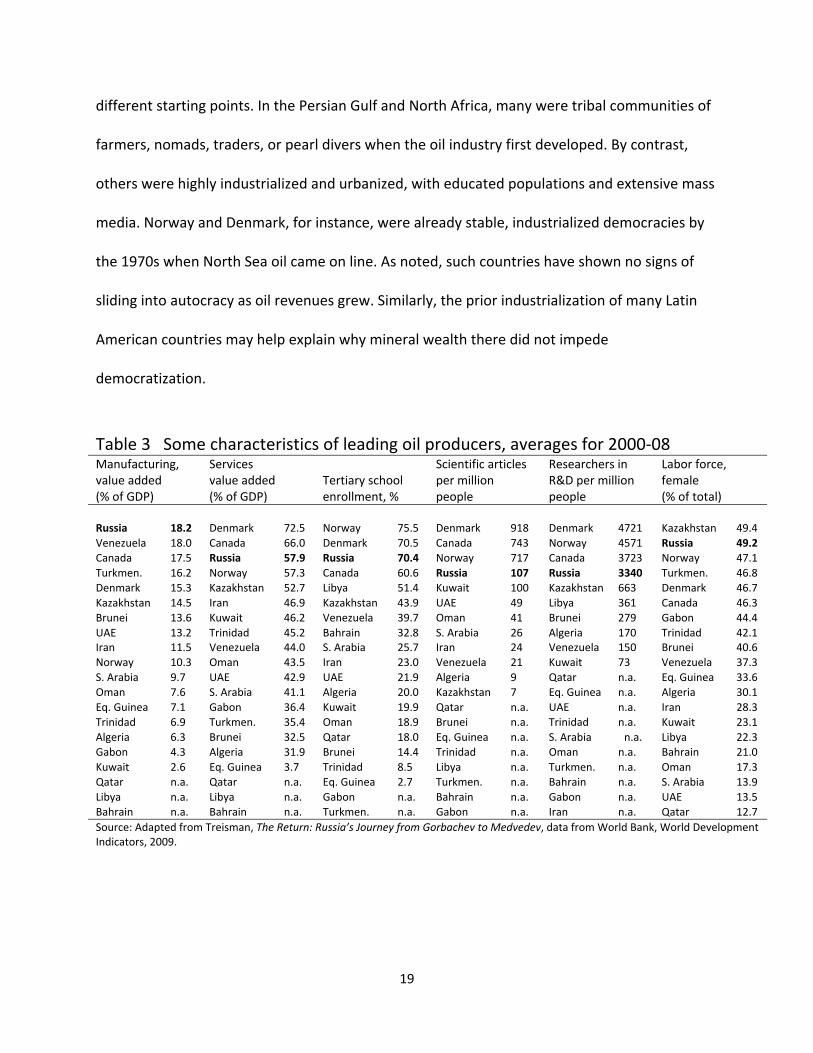
different starting points. In the Persian Gulf and North Africa, many were tribal communities of
farmers, nomads, traders, or pearl divers when the oil industry first developed. By contrast,
others were highly industrialized and urbanized, with educated populations and extensive mass
media. Norway and Denmark, for instance, were already stable, industrialized democracies by
the 1970s when North Sea oil came on line. As noted, such countries have shown no signs of
sliding into autocracy as oil revenues grew. Similarly, the prior industrialization of many Latin
American countries may help explain why mineral wealth there did not impede
democratization.
Table 3 Some characteristics of leading oil producers, averages for 2000‐08 Manufacturing, value added (% of GDP)
Services value added (% of GDP)
Tertiary school enrollment, %
Scientific articles per million people
Researchers in R&D per million people
Labor force, female (% of total)
Russia 18.2 Denmark 72.5 Norway 75.5 Denmark 918 Denmark 4721 Kazakhstan 49.4
Venezuela 18.0 Canada 66.0 Denmark 70.5 Canada 743 Norway 4571 Russia 49.2 Canada 17.5 Russia 57.9 Russia 70.4 Norway 717 Canada 3723 Norway 47.1
Turkmen. 16.2 Norway 57.3 Canada 60.6 Russia 107 Russia 3340 Turkmen. 46.8 Denmark 15.3 Kazakhstan 52.7 Libya 51.4 Kuwait 100 Kazakhstan 663 Denmark 46.7
Kazakhstan 14.5 Iran 46.9 Kazakhstan 43.9 UAE 49 Libya 361 Canada 46.3 Brunei 13.6 Kuwait 46.2 Venezuela 39.7 Oman 41 Brunei 279 Gabon 44.4
UAE 13.2 Trinidad 45.2 Bahrain 32.8 S. Arabia 26 Algeria 170 Trinidad 42.1 Iran 11.5 Venezuela 44.0 S. Arabia 25.7 Iran 24 Venezuela 150 Brunei 40.6 Norway 10.3 Oman 43.5 Iran 23.0 Venezuela 21 Kuwait 73 Venezuela 37.3
S. Arabia 9.7 UAE 42.9 UAE 21.9 Algeria 9 Qatar n.a. Eq. Guinea 33.6 Oman 7.6 S. Arabia 41.1 Algeria 20.0 Kazakhstan 7 Eq. Guinea n.a. Algeria 30.1
Eq. Guinea 7.1 Gabon 36.4 Kuwait 19.9 Qatar n.a. UAE n.a. Iran 28.3 Trinidad 6.9 Turkmen. 35.4 Oman 18.9 Brunei n.a. Trinidad n.a. Kuwait 23.1
Algeria 6.3 Brunei 32.5 Qatar 18.0 Eq. Guinea n.a. S. Arabia n.a. Libya 22.3 Gabon 4.3 Algeria 31.9 Brunei 14.4 Trinidad n.a. Oman n.a. Bahrain 21.0
Kuwait 2.6 Eq. Guinea 3.7 Trinidad 8.5 Libya n.a. Turkmen. n.a. Oman 17.3 Qatar n.a. Qatar n.a. Eq. Guinea 2.7 Turkmen. n.a. Bahrain n.a. S. Arabia 13.9
Libya n.a. Libya n.a. Gabon n.a. Bahrain n.a. Gabon n.a. UAE 13.5 Bahrain n.a. Bahrain n.a. Turkmen. n.a. Gabon n.a. Iran n.a. Qatar 12.7
Source: Adapted from Treisman, The Return: Russia’s Journey from Gorbachev to Medvedev, data from World Bank, World Development Indicators, 2009.
20
In this regard, Russia looks like one of the oil producers least likely to fall victim to the
curse. Although just a middle‐income country, Russia was even more industrialized than many
of the Latin American mineral‐rich states when oil prices first spiked. Developed in the
distinctive Soviet manner, it has rates of educational and scientific achievement more
comparable to those of developed countries (see Table 3). Along with the other former Soviet
oil producers, it has an unusually high rate of female labor participation. Maintaining political
control over a literate, highly educated population, rich in scientists, where women are
integrated into the workforce, is bound to be more challenging than imposing an authoritarian
regime on traditional communities of farmers and local traders.
D. Media Freedom
As already mentioned, Egorov et al. find a relationship between oil reserves and lower media
freedom. However, as also noted, the effects of new reserves or increases in the oil price turn
out to be small for countries that already had significant proven reserves. The implied effect for
Russia was tiny.
E. Corruption
Finally, resource wealth is often thought to foster corruption, which might in turn erode
democracy or perpetuate dictatorship. Widespread graft is likely to discredit democratic
21
officials and may make them eager to reduce the transparency of government. Steven Fish
argues that this was a main reason for Russia’s stalled democratization.28
Is there a relationship between oil income and corruption? Where oil and gas are
abundant, corruption is perceived to be higher. Various scholars, using indexes of perceived
corruption compiled by polling international businessmen and experts, have found a
relationship between perceived corruption as captured by such indexes and natural resource
wealth.29 Oil rich states such as Qatar and Equatorial Guinea are perceived to be considerably
more corrupt than most others at their income level. Russia is perceived to be somewhat more
corrupt than one would expect given its gdp per capita.
However, perceptions are sensitive to how countries are portrayed in the world media.
In a previous paper, I showed that measures of perceived corruption did not always coincide
with measures of corruption based on surveys in which individuals or businesses were asked
concrete questions about whether members of their family or “firms like theirs” had been
expected to make unofficial payments during the previous year.30 In the data from such
experience‐based surveys, evidence of a link between oil and higher corruption is far weaker,
and often non‐existent. For instance, using reports on the frequency of bribery from the World
Bank’s World Business Environment Survey (which surveyed firm managers) and the
organization Transparency International’s Global Corruption Barometer Survey (which
28 M. Steven Fish, Democracy Derailed in Russia: The Failure of Open Politics, New York: Cambridge University Press, 2005, p.134.
29 The first study to find this was Alberto Ades and Rafael Di Tella, “Rents, Competition, and Corruption,” American Economic Review, 1999, 89, No. 4, 982‐994. 30 Daniel Treisman, “What Have We Learned about the Causes of Corruption from Ten Years of Cross‐National Empirical Research?” Annual Review of Political Science, 2007, 10, 211‐44.
22
interviewed individuals), I found little or no relationship, even controlling for income. In Russia,
reports of bribery were not more frequent on average than in other countries around its
income level.
These surveys inevitably focus more on low level corruption than on kleptocracy at the
top. Low level officials do not appear to be more corrupt in countries with mineral wealth. But
the story might be different for government ministers. In Russia, as the oil price rose after 1999,
stories circulated of brazen venality at the highest levels involving mind‐boggling sums. Such
stories may very well be true. Unfortunately, there is little way to know—and to compare the
scope of such corruption in Russia to that in other countries that lack oil. Nor is it clear whether
or not corruption itself undermines democracy. There are some suggestive arguments to this
effect, but as yet little empirical evidence to back them up.
4 Conclusion
Russia’s oil and gas income—even at the height of the recent price surge—was nowhere near
enough to fund the kind of politically enervating welfare state found in the Persian Gulf.
Moreover, much of the government’s share of oil revenues still has to be extracted in the form
of taxes from the private magnates who control most of the country’s oil production. Unlike in
Qatar or Kuwait, the Russian state will have to continue taxing the population, and dealing with
the discontent that engenders. Nor can Russia’s oil preclude modernization since the country is
in most ways already modernized. Rising oil prices since 1999 may have prompted a reduction
in press freedom, but, judging from experience elsewhere, only by a very small amount. Oil‐rich
23
states like Russia are perceived to be more corrupt. But, although it is certainly possible that
they are, there is little reliable evidence to this effect.
If Russia’s oil and gas do not doom the country to autocracy, they do nevertheless play a
part in a more complicated process. Surging oil prices have in certain periods stimulated
economic growth. As in many other countries, improving economic conditions buy the
president greater popular support.31 At moments of overwhelming popularity, a president has
the opportunity to make significant changes to the system, pushing it towards either more or
less democracy. President Putin, with an approval rating close to 80 percent, chose the latter.
This was not inevitable; had the Kremlin candidate in 2000 been a more committed democrat,
one can imagine that the subsequent boom might have helped sustain support for further
democratic reforms. At the same time, the price of oil, although important, was not the only
determinant of Russia’s growth rate. Studies suggest that higher oil prices explain between one
third and one half of the total growth since 1999.32 The impact of oil prices was apparently
stronger in 2005‐9 than in 1999‐2001, when growth was fueled by the effects of devaluation,
and 2001‐4, when higher output of oil and minerals—mostly achieved by private companies—
was at least as important as higher prices. Thus, the path from oil prices to weaker democracy
in Russia since 1999 has been somewhat indirect and contingent.
31 Daniel Treisman, “Presidential Popularity in a Young Democracy: Russia under Yeltsin and Putin,” University of California, Los Angeles: manuscript, November 2009. This paragraph draws on my book The Return: Russia’s Journey from Gorbachev to Medvedev, New York: The Free Press, forthcoming 2010. 32 Paavo Suni, “Oil Prices and the Russian Economy: Some Simulation Studies with NiGEM,” (Helsinki: Research Institute of the Finnish Economy, 2007) estimates that higher oil prices explain about 2.5 points (38 percent) of the 6.5 percent average growth rate in 2001‐06. Roland Beck, Annette Kamps and Elitza Mileva, “Long‐term Growth Prospects for the Russian Economy,” (Frankfurt: European Central Bank, 2007), reviewing previous studies, note estimated long‐run elasticities of GDP to permanent increases in the oil price of .15 to .20. Using the monthly prices of European Brent oil, these elasticities imply that the change in oil prices in 1999‐2007 can explain 25 to 33 points of the 72 percent increase in GDP (measured in constant rubles) between those years—or, in other words, 35 to 46 percent of the total growth.
24
More generally, resource endowments have two effects. First, they may provide rents
that, if controlled by the government, can be used for political purposes. Second, dependence
on commodity exports subjects countries to sometimes extreme economic gyrations as the
prices of commodities are more volatile than those of manufactured products and services.33 In
countries for which the rents are large relative to the volatility, natural resources may enable
incumbent rulers to entrench themselves and avoid sharing power. In those for which the
volatility is large relative to the rents, the main political consequence of resource dependence is
likely to be not so much authoritarianism as instability.
Such instability may not always be bad for democracy. If the instability is moderate, it
may help facilitate turnover at the top of the state. Turnover does not by itself create
democracy, but from alternation of elites democracy can emerge. On the other hand, extreme
instability may discredit and incapacitate the state, leading to civil conflict rather than peaceful
alternation. From this perspective, the second rank oil producers of Latin America and Asia
(Argentina, Mexico, Ecuador, Indonesia, Malaysia) may have a combination of rents and
volatility that is consistent with—or even conducive to—democratization, while the major oil
producers like Qatar and Brunei have such high rents that the volatility is hardly felt. To the
extent this is correct, Russia fits best into the first category, along with Latin American peers
like Mexico and Venezuela. Its mineral wealth adds an element of periodic turbulence to its
political economy, which will sometimes disrupt—but could at times even catalyze—democratic
transition.
33 David S. Jacks, Kevin H. O'Rourke, and Jeffrey G. Williamson, “Commodity Price Volatility and World Market Integration since 1700,” NBER Working Paper No. 14748, February 2009