Embed Size (px)
Citation preview

1
Please note that this is an author-produced PDF of an article accepted for publication following peer review. The definitive publisher-authenticated version is available on the publisher Web site.
Journal Of Industrial Ecology February 2016, Volume 20 Issue 1 Pages 145-153 http://dx.doi.org/10.1111/jiec.12272 http://archimer.ifremer.fr/doc/00323/43459/ © 2015 by Yale University
Achimer http://archimer.ifremer.fr
Oil for Fish: An Energy Return on Investment Analysis of Selected European Union Fishing Fleets
Guillen Jordi 1, 2, *
, Cheilari Anna 3, Damalas Dimitrios
4, Barbas Thomas
4
1 CSIC, Inst Ciencies Mar, Psg Maritim Barceloneta 37-49, E-08003 Barcelona, Spain.
2 IFREMER, Unite Economie Maritime, Plouzane, France.
3 DG Environment European Commiss, Brussels, Belgium.
4 Commiss European Communities, Joint Res Ctr, Maritime Affairs Unit, I-21020 Ispra, Italy.
* Corresponding author Jordi Guillen, email address : [email protected]
Abstract : World food production has increased substantially in the past century, thanks mostly to the increase in the use of oil as input in the production processes. This growing use of fossil fuels has negative effects, both on the environment and the production costs. Fishing is a fuel consuming food production activity, and its energy efficiency performance has worsened over time. World-wide fisheries are also suffering from overexploitation, which contributes to the poor efficiency performance, adding more pressure and criticism on this economic activity. In this paper we analyzed the energy efficiency performance of more than 20,000 European Union (EU) fishing vessels for the period 2002-2008, using the edible energy return on investment (EROI) indicator. The vessels analyzed, grouped in 49 different fleets, represented 25% of the vessels and 33% of the landings of the EU fishing sector. These EU fishing fleets' average EROI for 2008 was 0.11, which translates to an energy content of the fuel burned that is 9 times greater than the edible energy content of the catch. Hence, the significance of this study arises from the use of time-series data on a relevant part of the EU fleet that showed stable or even slight improvements on the EROI over time. Moreover, results showed that the energy efficiency of the different fleets varied significantly (from 0.02 to 1.12), mainly depending on the fishing gear and the vessel length. The performance of the most efficient fleets, such as large pelagic trawlers and seiners, was comparable to many agricultural production activities. The plausible drivers behind these trends are further considered.
Keywords : energy efficiency, energy return on investment (EROI), fisheries, fishing fleet, fuel consumption, industrial ecology
1
Introduction
World food production has increased substantially in the past century, as has calorie
intake per capita (Nellemann et al. 2009). But this has happened at the cost of increasing the use
of oil as input in the food production process. “Eating Oil” is the title of a book published in
1978 that investigates the extent to which food supply in industrialized countries relies on fossil
fuels (Green 1978). Not surprisingly, most studies on energy efficiency for food production were
realized during the 70s and 80s, after the first oil crisis in 1973 (i.e. Leach 1976; Pimentel and
Pimentel 1979; Pimentel et al. 1983; Cleveland et al. 1984; Hall et al. 1986). Nowadays, food
supply worldwide is even more dependent on oil, and a lot more studies have populated the
scientific literature (i.e. Dutilh and Kramer 2000; Tyedmers 2001, 2004; Pelletier and Tyedmers
2007; Pelletier 2008; Schau et al. 2009; Fet et al. 2010, Pelletier et al. 2010a, 2010b).
The energy return on investment (EROI) is the ratio of the energy delivered by a process
to the energy used directly and indirectly in that process (Leach 1976; Pimentel and Pimentel
1979; Pimentel et al. 1983; Cleveland et al. 1984; Hall et al. 1986). The EROI is generally used
for measuring the efficiency of different technologies and sources of energy, expressed as the
ratio of the gross energy return to the amount of energy invested (Mulder and Hagens 2008).
Other names used for this concept are energy profit ratio, energy efficiency, energy gain (Tainter
et al. 2003), net energy (Odum 1973) and energy payback (Keoleian 1998).
Although originally the EROI indicator was a measure of the efficiency of different
energy sources, the EROI ratio has also been used in food production processes to compare the
energy extracted from the edible content of the food and the energy in the form of input
requested for their production. The EROI analysis provides a quantitative result that can be

2
easily compared with other similar calculations (Murphy et al. 2011). Therefore, the EROI
indicator provides an objective measurement of the nourishment that can be produced by unit of
energy spent (i.e. fuel combustion). This allows to compare the energy efficiency of different
fleets without dependence on landing weights (that can provide partial vision due to large non
edible contents, i.e. in mussels) or on their monetary values, and consequently, results can be
objectively compared worldwide. It also allows comparison of the fishing sector with other
sectors, such as livestock or aquaculture (i.e. Tyedmers 2004; Tyedmers et al. 2005). Indeed, the
ratio has been used in agriculture (i.e. Pimentel and Pimentel 1979; Pimentel et al. 1983), cattle
farming (i.e., Pelletier 2008), fisheries (i.e. Tyedmers 2001, 2004) and aquaculture (i.e. Pelletier
and Tyedmers 2007).
Fisheries have often been considered one of the less efficient food production activities
(Wilson 1999); however, this generalization is not supported by the work of several authors (i.e.
Tyedmers et al. 2005). It has been estimated that fishing fleets around the world burn between 38
and 42.5 million tons of oil per year, accounting for about 1.2% of global oil consumption
(Tyedmers et al. 2005; World Bank and FAO 2008). Moreover, a general tendency of energy
performance becoming poorer over time is evident from a number of fisheries around the world
(i.e. Tyedmers 2001, 2004). Fisheries are suffering from poor profitability, mainly due to
increasing fuel costs, as well as the increasing stocks overexploitation (i.e. Csirke 2005;
Abernethy et al. 2010). This implies that in order to extract the same amount of fish it is
necessary to consume more oil. The energy efficiency of the different existing fleet segments
varies significantly. Both the fishing gear/technique and the vessel length that characterize each

3
fleet segment affect the energy performance of the fleets (Thrane 2004; Ziegler and Valentinsson
2008; Driscoll and Tyedmers 2010).
Because fuel combustion has adverse environmental impacts and also raises production
costs, it is advisable to reduce fuel consumption, or at least consume it in the most efficient way
possible. This is also valid for fisheries, where fuel often is the most important cost (FAO 1995;
Dahou et al. 2001; Reddy 2004; FERM 2004; Sumaila et al. 2007; STECF 2010; Sumaila et al.
2010). Under the Europe 2020 Strategy for smart, sustainable and inclusive growth (EC 2010),
EU Member States have committed themselves to reducing greenhouse gas emissions (GHG) by
20% compared to 1990 levels , increasing the share of renewable sources in the EU's energy mix
to 20%, and achieving a 20% increase in energy efficiency by 2020.
In this paper, by using public and comprehensive time series data we analyze the energy
profiles of different EU fishing fleets with the edible Energy Return on Investment ratio. By
doing this we do not just estimate the evolution of the EROI for different EU fleets, but we are in
a position to identify the most efficient fishing techniques from the nourishment perspective.
Besides the obvious economic incentives, the use of more efficient fishing gears can contribute
to the environmental sustainability.
Materials & Methods
Data included in the 2010 Annual Economic Report (AER) on the EU fishing fleet
(STECF 2010) was used for this analysis. The AER provides the most complete compilation of
statistics on the economic performance of the EU Member States fishing fleets. The report
contains an economic and structural analysis of the European Union fishing fleets with data

4
collected under the Data Collection Framework (DCF) (EC 2008). To the authors knowledge,
there is no other publication worldwide that periodically reports fisheries production and cost
data at such levels of detail.
For the current analysis, we considered only data for those fleet segments (a group of
vessels belonging to the same length class and having the same predominant fishing gear during
the year) for which full time series data for all the relevant variables (fuel consumption and
weight of landings per species by fleet) were available. The analysis was performed at the fleet
segment level and data from different countries were aggregated together. All main fleet
segments were covered by the study: trawls and seines (demersal and pelagic), dredges, hooks,
nets, pots and traps. The fleet segmentation follows the EU segmentation (EC 2001) by fishing
technique and vessel length class (the codes used can be found below the table 2 and figures).
Fuel consumption and landing weights by species covering the years 2002 to 2008, were
used for the calculation of the EROI. Data used originated from more than 20,000 fishing vessels
grouped in 49 fleet segments of seven countries (Belgium, Germany, Denmark, France, Italy,
Netherland and Sweden), representing 25% in terms of number of vessels and 33% in terms of
landings’ weight of the EU-27 for the time period studied.
For the calculation of the edible EROI we divided the energy extracted from the edible
content of the fishi by the energy consumed in the production process (equation 1). The former is
calculated by multiplying the landings from each fleet by the energy content and the edible
content of each fish species. The energy content of fresh seafood per species was assigned
according to Dorosz (2010) and when no value for a species was reported, the value of 1,116
Kcal/kg was used as the average energy content (MAPA 1999). Because not all the parts of a fish

5
are edible, different edible fractions by species have been applied (Tyedmers, personal
communication, 2010ii). Therefore, the boundary of this study is the EROI1,d as classified in
Murphy et al. (2011)iii.
The edible EROI for a fleet on a given year is calculated according to the following
formula:
∑
(1)
Where LW stands for the landings weight in Kg, FC for the fuel consumption in liters,
EC for the energy content in Kcal per kg, EdC for the edible content of the fish expressed as a
percentage, f indexes the fishing fleet, s the species and t the year. One liter of fuel is estimated
to contain around 38.66 MJ (Schau et al. 2009), and one Kcal is approximately 4.187 kJ.
Only the energy content of the edible content of fresh seafood has been accounted for in
this study. This implies that co-product allocation (the use of fish parts not suitable or edible for
human consumption, i.e. use in animal feeds) has not been taken into account. This is because
data on the different consumption and processing patterns depend mostly on country/region and
fleet (i.e. consumer preferences to buy the whole fish or fillets), as well as the processes co-
products are exposed. Consequently this data is rather difficult to obtain for such a diverse
number of fleets. Therefore, the EROI estimated in this study corresponds to the EROI measure
related to human-edible food energy return on industrially-mediated energy investment specified
in Pelletier et al. (2011).
Indirect energy use was excluded from the analysis due to the lack of data and only direct
fuel consumption was used to calculate the relevant indicator. This is not a major shortcoming as

6
direct fuel use in fisheries account between 75 and 90%, regardless of the fishing gear used or
the species targeted (Ziegler et al. 2003; Tyedmers 2004; Hospido and Tyedmers 2005; Pelletier
et al. 2011). Depending on the fishery, the remaining 10 to 25% is generally composed of other
energy inputs associated with vessel construction and maintenance, the provision of labor,
fishing gear, bait and ice, fish processing and transportation to the market (Rawitscher 1978;
Watanabe and Uchida 1984; Tyedmers 2000; Andersen 2002; Ziegler et al. 2003; Fet et al.
2010). Moreover, we are interested in the comparison between fishing fleets and especially in
trends in energy use and efficiency over time. Thus, the exclusion of indirect energy should not
bias the results, but it should be noted that the estimated indicators are conservative with respect
to the studies that consider also indirect energy use, by a magnitude of 10 to 25%.
Results
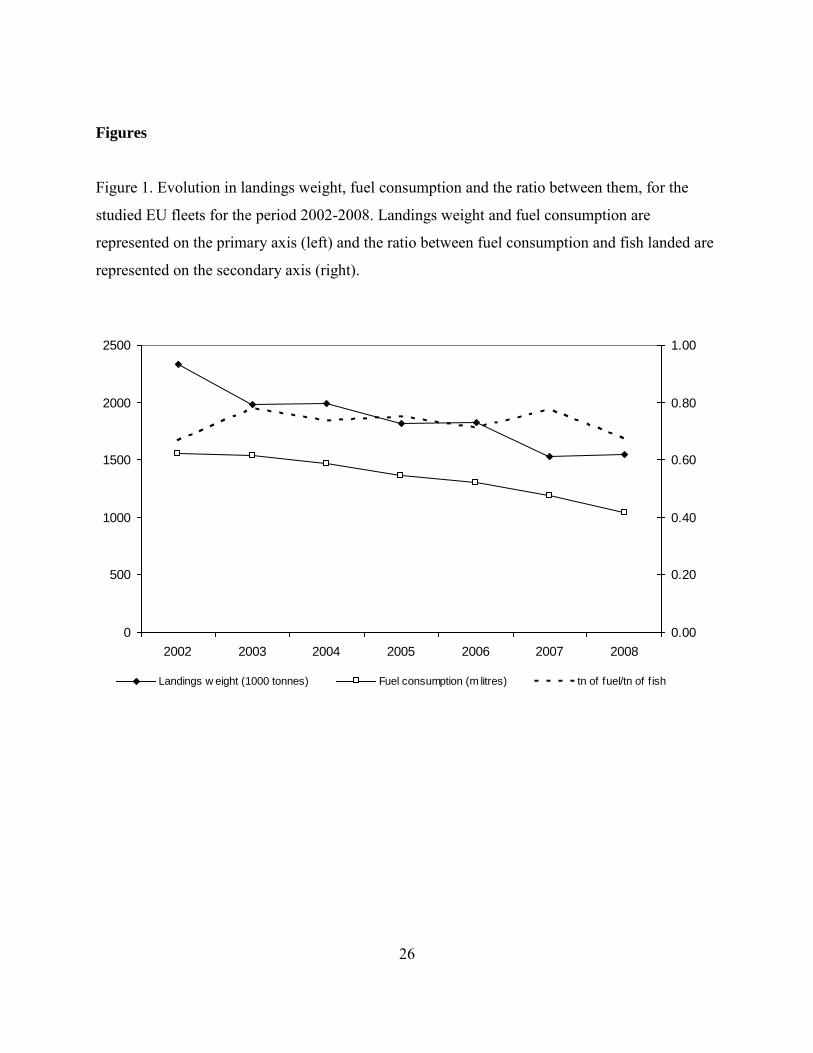
For the analyzed fleet segments, the landings weight and the fuel consumption have been
decreasing over time, reaching in 2008 almost two thirds of the values recorded in 2002 (Figure
1). The decrease in the fuel consumption is almost monotonic, whereas in the weight of landings
the decreasing trend appears more scaled. The distribution of the landings and fuel consumption
by fishing technique for the studied fishing fleets for the year 2008 are presented in Figures 2
and 3.
An overview of the EROI estimated for the different fleets is presented in Table 1. The
weighted average edible EROI for 2008 was 0.11, ranging between 0.09 and 0.11 for the period
of the analysis. That is to say that the average energy content of the fuel burned by the studied

7
European fleets was nine times greater than the edible energy content of the resulting catch in
2008.
The different EU fishing fleets analyzed demonstrated important differences in the EROI
levels (see table 2). Gears using hooks (0.04 in 2008), and beam trawlers between 24 and 40
meters and larger than 40 meters (0.02) had the lowest EROI values, followed by polyvalent
passive gears (0.04), demersal trawls and seiners (0.05), and driftnets and fixed nets (0.07).
Pelagic trawlers and seiners larger than 40 meters (1.12) had the highest EROI values estimated.
High values were also observed for dredges lower than 12 meters (0.20) and small vessels
equipped with passive gears (0.38).
These important differences in the ratio between fishing gears and vessel lengths was in
accordance with Thrane (2004), who presented different energy consumption levels for nine
Danish fleets. The edible EROI values were in line with those reported in Tyedmers (2004) for
29 North Atlantic and Pacific fisheries from several studies. The values varied from 0.019 for the
trawl fishing targeting shrimps and the trawl fishing targeting flatfish to an EROI of 0.56 for the
purse seine fishing for herring and mackerel. Similarly, beam trawlers between 24 and 40 meters
and beam trawlers larger than 40 meters had an EROI for 2008 of 0.020 and 0.016, respectively.
These fleets target mainly sole, plaice (flatfishes) and shrimps which are species with high
commercial value. On the other hand, pelagic trawlers and seiners larger than 40 meters,
targeting low-value species such as herring, mackerel, sand-eels and sprat, had an EROI of 1.12.
From the results it can also be concluded that for each fishing technique, there was an
optimal vessel length class, as can be seen in table 2. For pelagic and demersal trawlers and
8
seiners, the larger vessels were more energy efficient; whereas the opposite was occurring for
beam trawlers and dredges.
Discussion
The reduction of greenhouse gas emissions and the efficient use of resources have
become important political objectives in the agenda of the European Union. Clear incentives to
reduce fuel consumption, or at least consume it in the most efficient way possible, start to appear
in many sectors, including fisheries and food production.
Continued technological advances in fishing fleets increase catch efficiency directly
affecting fish stocks. It is commonly perceived that with the advent of modern fish-catching
technologies, fleets would become more catch efficient. This phenomenon known also as
technological creep or, simply, creep of the fleet is usually positively related to the increase in
skipper skills, investments in auxiliary equipment, more efficient gear and materials, replacement
of old vessels by new ones and, to a lesser extent, upgraded engines (Rijnsdorp et al. 2006).
Creep has been estimated to be as much as 10% per year (i.e. Ellis and Wang 2007; Marchal et
al. 2007). Meanwhile, many fish stocks are at a very low level in relation to the sustainability
criteria. Worm et al. (2009) estimated that 63% of assessed fish stocks worldwide are
overexploited, and so, they require rebuilding. In the EU, 88% of assessed stocks are
overexploited, 30% of these stocks being outside safe biological limits (EC 2009). The European
fishing industry is experiencing smaller catches and facing an uncertain future. As a result,
changes in fleet catch efficiency may reflect shifts in effort and or trends in fish abundance. But
in comparison to the beginning of the study, the decrease observed lately in the fuel consumption

9
(-33%) is proportional to the one observed in the landings (-34%). The poor situation of the fish
stocks is probably prevailing over advances in technology.
A general tendency for poorer outcomes on the energy performance of the fishing fleets
over time has been documented (Tyedmers 2001, 2004). Mitchell and Cleveland (1993), for the
New Bedford fishery, studied the evolution of the EROI ratio in 20 years (between 1968 and
1988) and concluded that it went from 0.18 down to 0.03. Instead, our results show that the
selected EU fleets efficiency remained practically stable or even had a slight increaseiv.
Tyedmers et al. (2005) estimated the energy content of the fuel burned by the fisheries
globally to be 12.5 times greater than the edible energy content of the catch. The European
fishing fleet seems to be relatively more fuel efficient than the global fisheries, with an estimated
energy content of the fuel burned nine times greater than the edible energy content of the
resulting catchv. The difference between the two estimations could be attributed either to
different energetic performances of the fishing fleets, or a different composition of the fishing
fleets represented in the datasets herein and worldwide. This is an interesting topic that needs to
be further investigated; one could deduce that given the current overexploitation of most EU fish
stocks (EC 2009) the energy performance of the fleets exploiting them should be worse than the
global one. This can at least in part be explained by the high fuel prices in the EU that works as
an incentive to improve the energy efficiency (Cheilari et al. 2013).
Although fisheries have been considered a fuel intensive food production process as
stated by Wilson (1999), our results confirm Tyedmers (2004) and Tyedmers et al. (2005)
conclusions that fisheries are not among the less fuel efficient food production activities. This
conclusion does not change even if we consider a potential 25% overestimation on our results

10
due to not accounting for the indirect energy uses (Pelletier et al. 2007). Comparing to other food
production activities (table 3), fisheries EROI ratios tend to be lower. However, certain fleet
segments (i.e., pelagic trawlers and seiners larger than 40 meters, pelagic trawlers and seiners
between 24 and 40 meters and vessels smaller than 12 meters using passive gears), are more
energy efficient than some agricultural processes. While compared to livestock and aquaculture
production EU fishing fleets show a better energy performance, as they have on average a higher
EROI, even if the results from this study are underestimated compared to studies that consider
embodied energy.
Different fleets have different energy profiles. Pelagic trawls and seiners targeting pelagic
fish can be among the most energy efficient production systems. Based on these results one
could be tempted to incentivize pelagic trawls and seiners in detriment of less efficient fishing
gears. However, not all fishing gears target the same species. Thus, comparison could only be
feasible for those gears with same target species, such as demersal trawlers versus beam trawlers
or pelagic trawlers versus pelagic purse seiners. Unfortunately, these data is not yet available in
detail, but improvements in the data availability have been achieved during the last years and the
European Union publishes data on fuel consumption and landings’ weights per fleet and country
(i.e. STECF 2010). Data by vessel could prove very important to determine what factors can help
to improve energy efficiency (i.e. particular investments or fishing strategies), however, such
studies require a more limited sample than the one used in this study. Currently data on landings
and fuel consumption by vessel can only be available at the national and regional
administrations. Similarly, data on material and energetic demands of fishing fleets (Pelletier et
al. 2007) for such a large number of fleets is also lacking (except on direct energy use). More
11
efforts should be allocated to collect these data at a larger scale, and not only on a case study
basis, in order to be able to extract sound conclusions and recommendations for fisheries
practices and management.
Nevertheless, we should not ignore that fishing is an economic activity, and fishers
decide to use a fishing technique based on economic incentives. Because fuel costs are an
important part of the total costs, fishers are also interested in energy efficiency. But fuel costs are
not the only driver to this decision. Other important factors, such as the relative price of potential
target species, catchability between techniques (selectivity), other costs and previous investments
in vessel and gears, may define the choice, at least in the short term and should be taken into
consideration during the development of management strategies that can reduce the fuel
consumption of the fishing industry.
The proposal for the financial tool of the EU’s Common Fisheries Policy (CFP), the
European Maritime and Fisheries Fund (EMFF), has made provisions for supporting measures
that will increase energy efficiency, reduce emissions and contribute to the Europe 2020 target
on climate change. However, it is not clear yet which specific innovations will be eligible for
funding within the new EMFF. A non-exhaustive list could include areas such as: engines with
reduced emissions (e.g. hybrid engines); bio-fuels; vessel design and technology; vessel
operation (maintenance of hulls and engines); use of alternative/renewable energy sources (wind,
H2 fuel cells); efficient fishing gears (e.g. reduced gear drag); fishing tactics and techniques; fuel
management systems; energy audits. Energy audit can serve as a tool for assessing the
performance of the fleets as well as the success of the innovative techniques applied (Notti et al.
2012). So far energy audits have proven to be quite effective in reducing consumption and

12
increasing efficiency (Danish Ministry of Food, Agriculture and Fisheries 2011; Sala et al.
2011). Other more hypothetical measures to improve energy efficiency not related with this fund
could be the inclusion of fisheries in a carbon emission quota system (i.e. the European Union
Emissions Trading System) or changes in the taxation of fuel for fisheries. Then, the EROI
indicator could be a good measure to monitor energy efficiency performance for vessels and
fleets (when targeting different species), as well as one of the criteria to allocate funds.
References
Abernethy, K. E., P. Trebilcock, B. Kebede, E. H. Allison, and N. K. Dulvy. 2010.
Fuelling the decline in UK fishing communities? ICES Journal of Marine Science 67: 1076-85.
Andersen, O. 2002. Transport of fish from Norway: energy analysis using industrial
ecology as the framework. Journal of Cleaner Production 10: 581-588.
Bykov, V. P. 1985. Marine fishes: Chemical composition and processing properties. In:
Russian translation series. A. A. Balkema. Rotterdam, Netherlands.
Cheilari, A., J. Guillen, D. Damalas, and T. Barbas. 2013. Effects of the Fuel Price Crisis
on the Energy Efficiency and the Economic Performance of the European Union Fishing Fleets.
Marine Policy 40: 18-24.
Cleveland, C. J., R. Costanza, C. A. S. Hall, and R. Kaufmann. 1984. Energy and the
U.S. economy: a biophysical perspective. Science 225: 890-897.
Crapo, C., B. Paust, and J. Babbit. 1993. Recoveries and yields from Pacific fish and
shellfish. Alaska Sea Grant College Program. University of Alaska Fairbanks. Fairbanks, USA.
36 pp.

13
Csirke, J. 2005. Global production and state of marine fishery resources. In Review of the
State of World Marine Fishery Resources. FAO Fisheries technical paper No. 457. Rome, FAO.
Dahou, K., M. Deme, and A. Dioum. 2001. Socio-economic and Environmental Impact
of Senegalese Fishery Support Mechanisms. UNEP, Geneva. 34 pp.
Danish Ministry of Food, Agriculture and Fisheries. 2011. Energy Reductions in Fishing
Vessels. Danish Fishermen's Association. Denmark. Available at: https://energyefficiency-
fisheries.jrc.ec.europa.eu/c/document_library/get_file?uuid=ce9cbad2-36f6-4e91-87a1-
2a00aeefb995&groupId=12762.
Dorosz, Ph. 2010. Tabla de calorias. [Calories Table]. Hispano Europea. Barcelone
(Spain). Translated from Table des calories. 1996. Editions Maloine. Paris (France).
Driscoll, J. and P. Tyedmers. 2010. Fuel use and greenhouse gas emission implications of
fisheries management: the case of the New England Atlantic herring fishery. Marine Policy 34:
353-359.
Dutilh, C. E. and K. J. Kramer. 2000. Energy consumption in the food chain. Ambio
29(2): 98-101.
EC (European Commission). 2001. Commission Regulation of 25th of July 2001
(1639/2001) amending Regulation (EC) No 1639/2001 establishing the minimum and extended
Community programmes for the collection of data in the fisheries sector and laying down
detailed rules for the application of Council Regulation (EC) No 1543/2000. OJ L 289,
10.9.2004, p. 6–53 Available at: http://eur-
lex.europa.eu/Notice.do?val=387870:cs&lang=en&list=485445:cs,387870:cs,&pos=2&page=1&
nbl=2&pgs=10&hwords=.

14
EC (European Commission). 2008. Commission Decision of 6th of November 2008
(2008/949/EC) adopting a multiannual Community programme pursuant to Council Regulation
(EC) No 199/2008 establishing a Community framework for the collection, management and use
of data in the fisheries sector and support for scientific advice regarding the common fisheries
policy. OJ L 346, 23.12.2008, p. 37–88. Available at: http://eur-
lex.europa.eu/LexUriServ/LexUriServ.do?uri=CELEX:32008D0949:en:NOT.
EC (European Commission). 2009. Green Paper - Reform of the Common Fisheries
Policy. COM/2009/0163 final. Available at: http://eur-
lex.europa.eu/LexUriServ/LexUriServ.do?uri=CELEX:52009DC0163:EN:NOT.
EC (European Commission). 2010. EUROPE 2020: A strategy for smart, sustainable and
inclusive growth. Communication from the Commission. Brussels, Belgium. 35 pp. Available at:
http://eur-lex.europa.eu/LexUriServ/LexUriServ.do?uri=COM:2010:2020:FIN:EN:PDF.
Ellis, N. and Y.G. Wang. 2007. Effects of fish density distribution and effort distribution
on catchability. ICES Journal of Marine Science 64(1): 178-191.
FAO. 1995. Summary report of the CRODT/FAO CECAF ad hoc technical meeting on
economic aspects of the exploitation of sardinellas and other small pelagic species off the
Northwest African coast. CRODT, Dakar 1-3 December 1993. FAO. Rome.
Fet, A. M., E. M. Schau, and C. Haskins. 2010. A Framework for Environmental
Analyses of Fish Food Production Systems Based on Systems Engineering Principles. Systems
Engineering 13(2): 109-118.

15
FERM. 2004. ITQs, ageing boats, and the price of fish. Profitability and autonomous
adjustment in the South East Trawl Fishery. Fisheries Economics Research and Management
Pty. Ltd. November 2004. 61 pp.
Green, B. M. 1978. Eating Oil - Energy Use in Food Production. Westview Press,
Boulder, CO. 1978.
Hall, C. A. S., C. J. Cleveland, and R. Kaufmann. 1986. Energy and Resource Quality:
The Ecology of the Economic Process. New York. Wiley Interscience.
Hospido, A. and P. Tyedmers. 2005. Life cycle environmental impacts of Spanish tuna
fisheries. Fisheries Research 76: 174-186.
Keoleian, G. 1998. Application of life cycle energy analysis to photovoltaic module
design. Progress in Voltaics 5: 287-300.
Leach, G. 1976. Energy and Food Production. IPC Science and Technology Press Ltd.
Guildford.137 pp.
Marchal, P., B. Andersen, B. Caillart, O. Eigaard, O. Guyader, H. Hovgaard, A. Iriondo,
F. Le Fur, J. Sacchi, and Santurtun, M. 2007. Impact of technological creep on fishing effort and
fishing mortality, for a selection of European fleets. ICES Journal of Marine Science 64: 192-
209.
M.A.P.A. 1999. La alimentación en España. [Food consumption in Spain]. Madrid:
Secretaria General de Agricultura y Alimentación. 485 pp.
Mitchell, C. and C.J. Cleveland. 1993. Resource Scarcity, Energy Use and Environmental
Impact: A Case study of the New Bedford, Massachusetts, USA, Fisheries. Environmental
Management 17(3): 305-317.

16
Mulder, K. and N. J. Hagens. 2008. Energy return on investment: toward a consistent
framework. Ambio 37(2): 74-79.
Murphy, D. J., C. A. S. Hall, M. Dale, and C. Cleveland. 2011. Order from Chaos: A
Preliminary Protocol for Determining the EROI of Fuels. Sustainability 3(10): 1888-1907.
Nellemann, C., M. MacDevette, T. Manders, B. Eickhout, B. Svihus, A. G. Prins, and B.
P. Kaltenborn (Eds). 2009. The environmental food crisis – The environment’s role in averting
future food crises. A UNEP rapid response assessment. United Nations Environment
Programme, GRID-Arendal. ISBN: 978-82-7701-054-0.
Notti, E., G. Buglioni, and A. Sala. 2012. An Energy Audit tool for increasing fishing
efficiency. Paper proceedings of the Second International Symposium on Fishing Vessel Energy
Efficiency E-Fishing. Vigo, Spain, May 2012: 9-14.
Odum, H.T. 1973. Energy, ecology, and economics. Ambio 2: 220-227.
Pelletier, N. and P. Tyedmers. 2007. Feeding farmed salmon: Is organic better?
Aquaculture 272(1-4): 399-416.
Pelletier, N. L., N. W. Ayer, P. H. Tyedmers, S. A. Kruse, A. Flysjo, G. Robillard, F.
Ziegler, A. J. Scholz, and U. Sonesson. 2007. Impact Categories for Life Cycle Assessment
Research of Seafood Production Systems: Review and Prospectus. International Journal of Life
Cycle Assessment 12 (6): 414-421.
Pelletier N., P. Lammers, D. Stender, and R. Pirog. 2010a. Life cycle assessment of high-
and low-profitability commodity and deep-bedded niche swine production systems in the Upper
Midwestern United States. Agricultural Systems 103(9): 599-608.

17
Pelletier, N., R. Pirog, and R. Rasmussen. 2010b. Comparative life cycle environmental
impacts of three beef production strategies in the Upper Midwestern United States. Agricultural
Systems 103(6): 380-389.
Pelletier, N. 2008. Environmental performance in the US broiler poultry sector: Life
cycle energy use and greenhouse gas, ozone depleting, acidifying and eutrophying emissions.
Agricultural Systems 98(2): 67-73.
Pelletier, N., E. Audsley, S. Brodt, T. Garnett, P. Henriksson, A. Kendall, K. J. Kramer,
D. Murphy, T. Nemecek, and M. Troell. 2011. Energy intensity of agriculture and food systems.
Annual Review of Environment and Resources 36: 223-246.
Pimentel, D. 2004. Livestock production and energy use. In: Encyclopedia of Energy.
Cleveland, C. (ed.). Elsevier, San Diego, vol. 3, pp. 671–676.
Pimentel, D. and M. Pimentel. 1979. Food, energy, and society. Edward Arnold, London.
Pimentel, D., G. Berardi, and S. Fast. 1983. Energy efficiency of farming systems:
organic and conventional agriculture. Agriculture Ecosystems and Environment 9: 359-372.
Rawitscher, M. A. 1978. Energy cost of nutrients in the American Diet. Ph.D. Thesis,
University of Connecticut, Storrs, United States.
Reddy, M. 2004. Economic analysis of artisanal fisheries in Fiji: issues of profitability
and sustainability. South Pacific Studies 25: 35-48.
Rijnsdorp, A. D., N. Daan, and W. Dekker. 2006. Partial fishing mortality per fishing
trip: a useful indicator of effective fishing effort in mixed demersal fisheries. ICES Journal of
Marine Science 63(3): 556-566.

18
Sala, A., E. Notti, and G. Buglioni. 2011. Audit Energetici nel settore della pesca (e-
Audit). Progetto FEP 02ACO201109, CNR-ISMAR, Ancona, Italy. Available at:
https://energyefficiency-fisheries.jrc.ec.europa.eu/c/document_library/get_file?uuid=55588e44-
b4a0-4d68-87ed-470b76fb2d84&groupId=12762.
Schau, E. M., H. Ellingsen, A. Endal, and S. Aa. Aanondsen. 2009. Energy consumption
in the Norwegian Fisheries. Journal of Cleaner Production 17: 325-334.
Scientific, Technical and Economic Committee for Fisheries (STECF). 2010. The 2010
Annual Economic Report on the European Fishing Fleet. Anderson, J. and J. Guillen (eds.).
Publications Office of the European Union. Luxembourg. JRC59885. ISSN 1018-5593.ISBN
978-92-79-17117-8.
Sumaila, U. R., W. W. L. Cheung, and L. Teh. 2007. Rebuilding Hong Kong’s marine
fisheries: an evaluation of management options. Fisheries Centre, University of British
Columbia, Vancouver. 134 pp.
Sumaila, U. R., A. Khan, L. Teh, R. Watson, P. Tyedmers, and D. Pauly. 2010. Subsidies
to high seas bottom trawl fleets and the sustainability of deep-sea demersal fish stocks. Marine
Policy 34(3): 495-497.
Tainter, J. A., T. F. H. Allen, A. Little, and T. W. Hoekstra. 2003. Resource transitions
and energy gain: contexts of organization. Conservation Ecology 7(3): 4.
Thrane, M. 2004. Energy Consumption in the Danish Fishery: Identification of Key
Factors. Journal of Industrial Ecology 8(1-2): 223-239.
Torry Research Station. 1989. Yield and nutritional value of the commercially more
important fish species. FAO Fisheries Technical Paper No. 309. FAO, Rome, Italy. 187 pp.

19
Troell, M., P. Tyedmers, N. Kautsky, and P. Ronnback. 2004. Aquaculture and energy
use. In: Encyclopaedia of Energy. Cleveland, C. (ed.). Elsevier, San Diego, vol.1, pp. 97-108.
Tyedmers, P. H. 2000. Salmon and sustainability: The biophysical Cost of Producing
Salmon through the Commercial Salmon Fishery and the Intensive Salmon Culture Industry.
Ph.D. Thesis, University of British Columbia, Vancouver, Canada.
Tyedmers, P. H. 2001. Energy consumed by North Atlantic Fisheries, In Fisheries
Impacts on North Atlantic Ecosystems: Catch, Effort and National/Regional Datasets. Zeller, D.,
R. Watson, and D. Pauly (eds.). Fisheries Centre Research Reports 9(3): 12-34.
Tyedmers, P. H. 2004. Fisheries and energy use. In Encyclopedia of Energy. Cleveland,
C. (ed.). Elsevier, San Diego, vol. 2, pp. 683-693.
Tyedmers, P. H. 2010. Personnal communication. 14-17 September 2010.
Tyedmers, P. H., R. Watson, and D. Pauly. 2005. Fueling global fishing fleets. Ambio
34(8): 635-638.
Watanabe, H. and J. Uchida. 1984. An estimation of direct and indirect energy input in
catching fish for fish paste products. Bulletin of Japanese Society of Scientific Fisheries 53(9):
417-423.
Wilson, J. D. K. 1999. Fuel and financial savings for operators of small fishing vessels.
FAO Fisheries Technical Paper No. 383. Rome, FAO. 46 pp.
Wiviott, D. J. and S. B. Mathews. 1975. Energy efficiency comparison between the
Washington and Japanese otter trawl fisheries of the northeast Pacific. Marine Fisheries Reviews
37 (4): 21-24.
20
World Bank and FAO. 2008. The sunken billions. The economic justification for fisheries
reform. Agriculture and Rural Development Department, The World Bank, Washington, DC.
Worm B., R. Hilborn, J. K. Baum, T. A. Branch, J. S. Collie, C. Costello, M. J. Fogarty,
E. A. Fulton, J. A. Hutchings, S. Jennings, O. P. Jensen, H. K. Lotze, P. M. Mace, T. R.
McClanahan, C. Minto, S. R. Palumbi, A. M. Parma, D. Ricard, A. A. Rosenberg, R. Watson,
and D. Zeller. 2009. Rebuilding global fisheries. Science 325: 578-585.
Ziegler F., P. Nilsson, B. Mattsson, and Y. Walther. 2003. Life Cycle Assessment of
frozen cod fillets including fishery-specific environmental impacts. International Journal of Life
Cycle Assessment 8(1): 39-47.
Ziegler, F. and D. Valentinsson. 2008. Environmental life cycle assessment of Norway
lobster (Nephrops norvegicus) caught along the Swedish west coast by creels and conventional
trawls - LCA methodology with case study. International Journal of Life Cycle Assessment
13(6): 487-497.

21
Tables
Table 1. EROI values by fleet (main gear) for the period 2002-2008 (Source: own calculations
from STECF 2010 data).
Fleet (gear) 2002 2003 2004 2005 2006 2007 2008 Drift nets and Fixed Nets 0.058 0.052 0.055 0.047 0.042 0.060 0.067 Dredges 0.126 0.092 0.120 0.106 0.083 0.087 0.071 Demersal Trawl and demersal Seiner 0.036 0.037 0.039 0.046 0.047 0.045 0.051 Pots and traps 0.105 0.124 0.163 0.119 0.095 0.084 0.122 Gears using hooks 0.013 0.014 0.023 0.019 0.025 0.034 0.041 Passive gears 0.285 0.391 0.317 0.276 0.288 0.392 0.376 Polyvalent passive gears 0.038 0.040 0.040 0.045 0.051 0.050 0.044 Combining mobile & passive gears 0.078 0.082 0.081 0.205 0.154 0.134 0.111 Pelagic Trawls and Seiners 0.534 0.417 0.461 0.541 0.560 0.536 0.617 Beam Trawl 0.021 0.021 0.022 0.022 0.023 0.024 0.027 Total Average 0.102 0.091 0.097 0.110 0.111 0.103 0.114
22
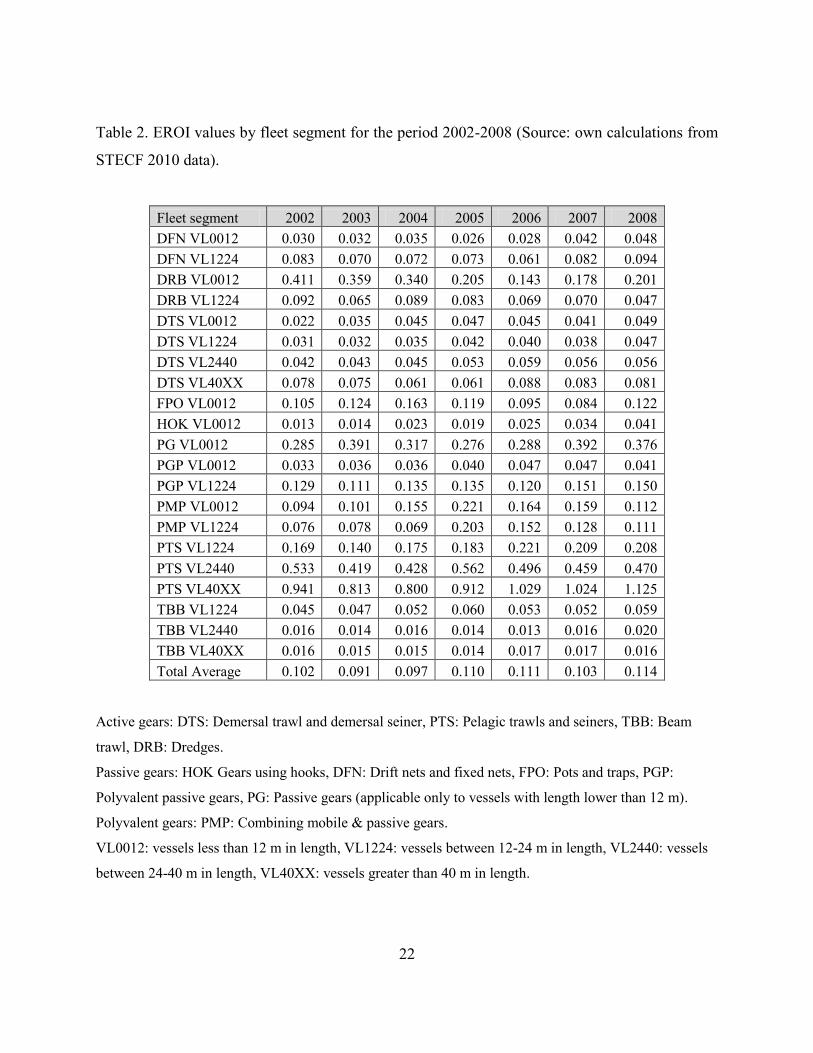
Table 2. EROI values by fleet segment for the period 2002-2008 (Source: own calculations from
STECF 2010 data).
Fleet segment 2002 2003 2004 2005 2006 2007 2008 DFN VL0012 0.030 0.032 0.035 0.026 0.028 0.042 0.048 DFN VL1224 0.083 0.070 0.072 0.073 0.061 0.082 0.094 DRB VL0012 0.411 0.359 0.340 0.205 0.143 0.178 0.201 DRB VL1224 0.092 0.065 0.089 0.083 0.069 0.070 0.047 DTS VL0012 0.022 0.035 0.045 0.047 0.045 0.041 0.049 DTS VL1224 0.031 0.032 0.035 0.042 0.040 0.038 0.047 DTS VL2440 0.042 0.043 0.045 0.053 0.059 0.056 0.056 DTS VL40XX 0.078 0.075 0.061 0.061 0.088 0.083 0.081 FPO VL0012 0.105 0.124 0.163 0.119 0.095 0.084 0.122 HOK VL0012 0.013 0.014 0.023 0.019 0.025 0.034 0.041 PG VL0012 0.285 0.391 0.317 0.276 0.288 0.392 0.376 PGP VL0012 0.033 0.036 0.036 0.040 0.047 0.047 0.041 PGP VL1224 0.129 0.111 0.135 0.135 0.120 0.151 0.150 PMP VL0012 0.094 0.101 0.155 0.221 0.164 0.159 0.112 PMP VL1224 0.076 0.078 0.069 0.203 0.152 0.128 0.111 PTS VL1224 0.169 0.140 0.175 0.183 0.221 0.209 0.208 PTS VL2440 0.533 0.419 0.428 0.562 0.496 0.459 0.470 PTS VL40XX 0.941 0.813 0.800 0.912 1.029 1.024 1.125 TBB VL1224 0.045 0.047 0.052 0.060 0.053 0.052 0.059 TBB VL2440 0.016 0.014 0.016 0.014 0.013 0.016 0.020 TBB VL40XX 0.016 0.015 0.015 0.014 0.017 0.017 0.016 Total Average 0.102 0.091 0.097 0.110 0.111 0.103 0.114
Active gears: DTS: Demersal trawl and demersal seiner, PTS: Pelagic trawls and seiners, TBB: Beam
trawl, DRB: Dredges.
Passive gears: HOK Gears using hooks, DFN: Drift nets and fixed nets, FPO: Pots and traps, PGP:
Polyvalent passive gears, PG: Passive gears (applicable only to vessels with length lower than 12 m).
Polyvalent gears: PMP: Combining mobile & passive gears.
VL0012: vessels less than 12 m in length, VL1224: vessels between 12-24 m in length, VL2440: vessels
between 24-40 m in length, VL40XX: vessels greater than 40 m in length.

23
Table 3. EROI values from other studies.
Product EROI Source Soy bean 4.92 Pelletier (2008) Corn 0.81 Pelletier (2008) Wheat 0.89 Pelletier and Tyedmers (2007) Swine 0.071 Pimentel (2004) Beef (pasture-based) 0.05 Pimentel (2004) Beef (feedlot) 0.025 Pimentel (2004) Lamb 0.018 Pimentel (2004) Broiler poultry 0.177 Pelletier (2008) Farmed salmon 0.114 Pelletier and Tyedmers (2007) Carp (aquaculture) 1.00 - 0.084 Troell et al. (2004) Mussels (aquaculture) 0.10 - 0.05 Troell et al. (2004) Tilapia (aquaculture) 0.13 - 0.025 Troell et al. (2004) Catfish (aquaculture) 0.04 Troell et al. (2004) Atlantic salmon (aquaculture) 0.025 - 0.02 Troell et al. (2004) Chinook salmon (aquaculture) 0.02 Troell et al. (2004) Shrimps (aquaculture) 0.025 - 0.014 Troell et al. (2004) Sea bass (aquaculture) 0.015 Troell et al. (2004) Redfish spp. (trawl) 0.11 Tyedmers (2004) Cod/flatfish spp. (Danish seine) 0.10 Tyedmers (2004) Cod/haddock (longline) 0.091 Tyedmers (2004) Cod/saithe (trawl) 0.084 Tyedmers (2004) Flatfish spp (trawl) 0.019 Tyedmers (2004) Herring/mackerel (purse seine) 0.56 Tyedmers (2004) Herring/saithe (Danish seine) 0.35 Tyedmers (2004) Swordfish/tuna (longline) 0.042 Tyedmers (2004) Crab (trap) 0.057 Tyedmers (2004) Scallop (dredge) 0.027 Tyedmers (2004) Shrimp (trawl) 0.058 Tyedmers (2004) Norway lobster (trawl) 0.026 Tyedmers (2004) Shrimp (trawl) 0.019 Tyedmers (2004)

24
Supplementary information file
Table 1 Supplementary. EROI values by fleet segment for the period 2002-2008, taking into
account the indirect energy use.
Fleet segment 2002 2003 2004 2005 2006 2007 2008 Drift nets and Fixed Nets 0.044 0.039 0.042 0.036 0.032 0.045 0.051 DFN VL0012 0.023 0.024 0.027 0.020 0.021 0.032 0.036 DFN VL1224 0.063 0.053 0.055 0.055 0.046 0.062 0.071 Dredges 0.096 0.070 0.091 0.080 0.063 0.066 0.054 DRB VL0012 0.312 0.272 0.258 0.155 0.108 0.135 0.152 DRB VL1224 0.070 0.049 0.067 0.063 0.052 0.053 0.036 Demersal Trawl and demersal Seiner 0.027 0.028 0.030 0.035 0.036 0.034 0.039 DTS VL0012 0.017 0.027 0.034 0.036 0.034 0.031 0.037 DTS VL1224 0.023 0.024 0.027 0.032 0.030 0.029 0.036 DTS VL2440 0.032 0.033 0.034 0.040 0.045 0.042 0.042 DTS VL40XX 0.059 0.057 0.046 0.046 0.067 0.063 0.061 Pots and traps 0.080 0.094 0.124 0.090 0.072 0.064 0.092 FPO VL0012 0.080 0.094 0.124 0.090 0.072 0.064 0.092 Gears using hooks 0.010 0.011 0.017 0.014 0.019 0.026 0.031 HOK VL0012 0.010 0.011 0.017 0.014 0.019 0.026 0.031 Passive gears 0.216 0.296 0.240 0.209 0.218 0.297 0.285 PG VL0012 0.216 0.296 0.240 0.209 0.218 0.297 0.285 Polyvalent passive gears 0.029 0.030 0.030 0.034 0.039 0.038 0.033 PGP VL0012 0.025 0.027 0.027 0.030 0.036 0.036 0.031 PGP VL1224 0.098 0.084 0.102 0.102 0.091 0.114 0.114 Combining mobile & passive gears 0.059 0.062 0.061 0.155 0.117 0.102 0.084 PMP VL0012 0.071 0.077 0.117 0.168 0.124 0.121 0.085 PMP VL1224 0.058 0.059 0.052 0.154 0.115 0.097 0.084 Pelagic Trawls and Seiners 0.405 0.316 0.349 0.410 0.425 0.406 0.468 PTS VL1224 0.128 0.106 0.133 0.139 0.168 0.158 0.158 PTS VL2440 0.404 0.318 0.324 0.426 0.376 0.348 0.356 PTS VL40XX 0.713 0.616 0.606 0.691 0.780 0.776 0.853

25
Beam Trawl 0.016 0.016 0.017 0.017 0.017 0.018 0.020 TBB VL1224 0.034 0.036 0.039 0.045 0.040 0.039 0.045 TBB VL2440 0.012 0.011 0.012 0.011 0.010 0.012 0.015 TBB VL40XX 0.012 0.011 0.011 0.011 0.013 0.013 0.012 Total Average 0.077 0.069 0.074 0.083 0.084 0.078 0.086
Active gears: DTS: Demersal trawl and demersal seiner, PTS: Pelagic trawls and seiners, TBB: Beam
trawl, DRB: Dredges.
Passive gears: HOK Gears using hooks, DFN: Drift nets and fixed nets, FPO: Pots and traps, PGP:
Polyvalent passive gears, PG: Passive gears (applicable only to vessels with length lower than 12 m).
Polyvalent gears: PMP: Combining mobile & passive gears.
VL0012: vessels less than 12 m in length, VL1224: vessels between 12-24 m in length, VL2440: vessels
between 24-40 m in length, VL40XX: vessels greater than 40 m in length.
26
Figures
Figure 1. Evolution in landings weight, fuel consumption and the ratio between them, for the
studied EU fleets for the period 2002-2008. Landings weight and fuel consumption are
represented on the primary axis (left) and the ratio between fuel consumption and fish landed are
represented on the secondary axis (right).
0
500
1000
1500
2000
2500
2002 2003 2004 2005 2006 2007 2008
0.00
0.20
0.40
0.60
0.80
1.00
Landings w eight (1000 tonnes) Fuel consumption (m litres) tn of fuel/tn of f ish

27
Figure 2. Distribution of the landings by fishing technique for the studied EU fishing fleets in the
year 2008.
Active gears: DTS: Demersal trawl and demersal seiner, PTS: Pelagic trawls and seiners, TBB: Beam
trawl, DRB: Dredges.
Passive gears: DFN: Drift nets and fixed nets, PGP: Polyvalent passive gears FPO: Pots and traps, PG:
Passive gears (applicable only to vessels with length lower than 12 m).
Polyvalent gears: PMP: Combining mobile & passive gears.
DFN
2%
DRB
5%
TBB
6%
DTS
29%
PTS
52%
PGP
3%PMP
1%
FPO
1%PG
1%

28
Figure 3. Distribution of fuel consumption by fishing technique for the studied EU fishing fleets
in the year 2008.
Active gears: DTS: Demersal trawl and demersal seiner, PTS: Pelagic trawls and seiners, TBB: Beam
trawl, DRB: Dredges.
Passive gears: HOK Gears using hooks, DFN: Drift nets and fixed nets, PGP: Polyvalent passive gears.
Polyvalent gears: PMP: Combining mobile & passive gears.
i The term fish refers to all aquatic organisms harvested by the fisheries: fish, mollusks, crustaceans. ii Includes data from Wiviot and Mathews 1975, Bykov 1985, Torry Research Station 1989, and Crapo, Paust and Babbit 1993. iii Boundary for energy inputs is direct energy and material inputs, while the boundary for energy outputs is extraction. iv A 2.6% annual increase of the overall EROI is statistically significant at a 10% level, but not at a 5% level. v EROI values of the EU fleet taking into account the indirect energy use, which refers to the cumulative energy required in upstream processes associated with the production and delivery of such inputs, are
DFN
2%
DRB
4%
TBB
20%
DTS
54%
PTS
12%
PMP
1%
PGP
6%HOK
1%

29
24% lower than the ones reported in this study considering only direct energy use. When estimating a life cycle energy demand factor applying the cumulative energy demand method of the EcoInvent process for “Heavy fuel oil, at regional storage” (51 MJ/kg) replaces the energy that a liter of fuel contains (38.66M/J). The values of the EROI considering the indirect energy use are reported in the supplementary information file.


![Pensacola Journal. (Pensacola, Florida) 1907-05-12 [p ].ufdcimages.uflib.ufl.edu/UF/00/07/59/11/00849/00323.pdf · customary authorized attaching seriously yesterday Bellinger disposing](https://img.pdfslide.net/doc/110x75/5b63e4907f8b9af5448c8cd4/pensacola-journal-pensacola-florida-1907-05-12-p-customary-authorized.jpg)