Embed Size (px)
Citation preview

DO GREAT THINGS EVERY DAY
ANNUAL FINANCIAL STATEMENTSOLD MUTUAL LIFE ASSURANCE COMPANY (SOUTH AFRICA) LIMITED
Consolidated and Separate
For the year ended 31 December 2020
Index to the Annual Financial Statements
Index Page
Directors’ Responsibility Statement 2
Certificate by the Company Secretary 3
Directors’ Report 4
Corporate Governance Report 6
Audit Committee Report 7
Independent Auditors’ Report 12
Separate and consolidated income statements 17
Separate and consolidated statements of comprehensive income 18
Separate and consolidated statements of financial position 19
Separate and consolidated statements of cash flows 20
Separate and consolidated statements of changes in equity 21
Notes to the separate and consolidated financial statements 22
A: Significant accounting policies 22
B: Segment information 25
C: Separate and consolidated income statement notes 28
D: Financial assets and liabilities 35
E: Financial risk and capital management 51
F: Analysis of financial assets and liabilities 64
G: Non-financial assets and liabilities 82
H: Interests in subsidiaries, associates and joint ventures 98
I: Other notes 111
J: Standards, amendments to standards, and interpretations adopted in the 2020 separate and consolidated financial statements 120
K: Directors’ and Prescribed officers emoluments 122
L: Biographical information on the directors’ 141
The consolidated and separate financial statements were audited in terms of the Companies Act 71 of 2008. The preparation of the consolidated and separate annual financial statements was supervised by the Group Chief Financial Officer, Casper Troskie CA(SA).
OMLACSA Separate and Consolidated Annual Financial Statements for the year ended 31 December 2020 1
The directors of Old Mutual Life Assurance Company (South Africa) Limited (the Company) are required by the South African Companies Act, 71 of 2008, as amended (the Companies Act) to maintain adequate accounting records and are responsible for the content and integrity of the consolidated and separate annual financial statements and related financial and non-financial information included in this report.
The directors are responsible for the preparation and fair presentation of the consolidated and separate annual financial statements of the Company, comprising the statement of financial position at 31 December 2020 and the income statement, statement of comprehensive income, changes in equity and cash flows for the year then ended, and the notes thereto, which include accounting policy elections and other explanatory notes in accordance with International Financial Reporting Standards (IFRS), as issued by the IASB, including interpretations to IFRS as issued by the IFRS Interpretations Committee (IFRIC), the Financial Reporting Pronouncements as issued by the Financial Reporting Standards Council, the South African Institute of Chartered Accountants (SAICA) Financial Reporting Guides as issued by the Accounting Practices Committee, the JSE Listings Requirements, and requirements of the Companies Act, no 71 of 2008 (Companies Act). In addition, the directors are responsible for the preparation of the directors’ report.
The directors are also ultimately responsible for such internal controls as they determine are necessary to enable the preparation of the consolidated and separate annual financial statements that are free from material misstatement, whether due to fraud or error, and for maintaining adequate accounting records in addition to reducing the risk of loss or error cost-effectively and effective risk management. An effective system of internal financial controls provides reasonable assurance as to the reliability of financial information being reported. To the best of their knowledge and belief the directors are satisfied that the system of internal controls provides reasonable assurance that reliance can be placed on financial records used in the preparation of the consolidated and separate financial statements during the financial year ended 31 December 2020. The directors have considered the proposed and completed remedial actions in respect of the identified control deficiencies.
The directors have made an assessment of the ability of the Group and Company to continue as a going concern and have no reason to believe that the business will not be a going concern in the year ahead.
It is the responsibility of the Company’s independent external auditors to report on the fair presentation of the consolidated and separate financial statements. These financial statements have been audited in terms of section 29(1) of the Companies Act. Their unmodified report is included within these annual financial statements.
Approval of consolidated and separate annual financial statementsThe consolidated and separate annual financial statements of Old Mutual Life Assurance Company (South Africa) Limited, as identified in the first paragraph, were approved by the board of directors on 22 March 2021 and signed on their behalf by:
T A Manuel I G Williamson
Chairman Chief Executive Officer
Sandton22 March 2021
In terms of Section 88(2)(e) of the South African Companies Act, 71 of 2008, as amended, I certify that Old Mutual Life Assurance Company (South Africa) Limited has lodged with the Commissioner, all such returns and notices as required by the Companies Act for the year ended 31 December 2020, and that all such returns and notices appear to be true, correct and up to date.
Ms E M Kirsten
Company Secretary
22 March 2021
Directors’ Responsibility Statement Certificate by the Company Secretary
OMLACSA Separate and Consolidated Annual Financial Statements for the year ended 31 December 2020 OMLACSA Separate and Consolidated Annual Financial Statements for the year ended 31 December 20202 3
Directors’ report
The directors of Old Mutual Life Assurance Company (South Africa) Limited have pleasure in submitting their report on the consolidated and separate annual financial statements for the year ended 31 December 2020.
1. Review of activitiesThe principal activity of the Group is the transaction of all classes of life assurance, savings and retirement funding business. The Group underwrites life insurance risks associated with death and disability. It also issues a diversified portfolio of investment contracts and earns fee income from investment management service contracts.
The operating results and financial position of the Group and company are set out in the income statements, statements of comprehensive income, statements of financial position, statements of changes in equity, statements of cash flows and accompanying notes.
Loss before tax for the Group was R8,402 million (2019 profit of R10,650 million), and loss after tax was R10,151 million (2019: profit of R6,942 million).
Loss before tax for the company was R4,628 million (2019 profit of R4,365 million), and loss after tax was R6,816 million (2019: profit of R367 million).
2. Consolidated and Separate annual financial statementsIn terms of International Financial Reporting Standards (IFRS), the company is required to produce consolidated financial statements as its subordinated debt instruments are traded in a public market.
In the company financial statements, the company’s investments in its subsidiaries, joint ventures, associate companies and structured entities are accounted for as financial assets at fair value through profit or loss and dividends are recognised when receivable.
Details of the financial results are set out on pages 17 to 144 of the consolidated and separate annual financial statements.
The directors have approved the consolidated and separate annual financial statements as reflected on pages 17 to 144, including the certificate by the Company Secretary on page 3 and the Audit committee report for the 2020 financial year on page 7.
3. Holding CompanyThe company’s holding company is Old Mutual Emerging Markets (Pty) Limited incorporated in South Africa.
Ultimate holding CompanyThe company’s ultimate holding company is Old Mutual Limited incorporated in South Africa and listed on the Johannesburg Stock Exchange, with secondary listings in Zimbabwe, Namibia and Malawi and a standard listing on the London Stock Exchange.
4. Share capitalOn 18 June 2020 the Company’s authorised share capital was increased by 10,000,000 (ten million) cumulative, non-participating, non-convertible, redeemable, no par value preference shares. The authorised redeemable preference shares of no par value were approved at the Annual General Meeting on 29 May 2020. Refer to note G9 for more information.
Aside from the matter above, there were no changes in the authorised or issued ordinary share capital of the Company during the year.
5. DividendsDividends on ordinary shares amounting to R13,042 million (2019: R2,439 million) and dividends on preference shares amounting to Rnil million (2019: Rnil million) were declared during the year by the Company. Of the total dividend, R4,768 million was paid in cash and R8,274 million was a dividend in specie related to the disposal of Nedbank to Old Mutual Emerging Markets (Pty) Ltd. Refer to note H2(c) for more information. Total dividend per share was 163,025.93 per share.
The directors of the company acknowledged, that it had applied the solvency and liquidity requirements of the Companies Act and Insurance Act prior to the dividend declaration and reasonably concluded that the company will satisfy same immediately after completing the distribution.
6. DirectorsDetails of the members of the Board who served during the year and at the reporting date have been provided below.
During the year Ms O Ighodaro was appointed to the Board, in accordance with the Board’s appointment policy. The issuer is required, by the Insurance Act, to annually evaluate the performance of the board of directors of the issuer and that of its committees, its chair and its individual directors as set out by the King Code. The Board hereby confirms that it has performed a performance assessment for the reporting year, which assessment was performed by an independent service provider (The Board Practice). The biographical information of the current directors can be found in note L and on the Group’s website. The directors’ interests in ordinary shares in Old Mutual Limited are set out in the 2020 Remuneration Report. This report can be accessed on https://www.oldmutual.com/investor-relations/reporting-centre/reports. The directors had no third party or company responsible for managing any business activities of the Group. Refer to note I3 for detailed related party disclosure.
Name Position as director Appointment date Resignation date
Mr TA Manuel c Independent Non-Executive Director 05.03.2018
Mr PC Baloyi a, r Non-Executive Director 05.03.2018 09.06.2020
Mr PG de Beyer a, r, c, ac Independent Non-Executive Director 05.03.2018
Mr AK Essien r, c Independent Non-Executive Director 05.03.2018
Ms Funke Ighodaro a, ac, r Independent Non-Executive Director 22.09.2020
Mr I Kgaboesele a, ac Independent Non-Executive Director 05.03.2018
Mr JR Lister a, r, ac Independent Non-Executive Director 05.03.2018
Dr SM Magwentshu-Rensburg c Independent Non-Executive Director 05.03.2018
Ms TM Mokgosi-Mwantembe Non-Executive Director 05.03.2018
Ms CWN Molope a, r, ac Independent Non-Executive Director 05.03.2018
Mr BM Rapiya r, c Non-Executive Director 05.03.2018
Mr CG Troskie Executive Director 27.03.2018
Mr IG Williamson Executive Director 27.05.2019
a Member of the Audit Committee. r Member of the Risk Committee.c Member of the Committee for Customer Affairsac Member of the Actuarial Committee
7. Company secretaryThe competence, qualifications and experience of the Company Secretary has been evaluated in terms of the required annual Board evaluation process. The Board confirms that the Company Secretary is not a Board member, is suitably qualified and experienced and has maintained an arms length relationship with the Board.Ms EM Kirsten is the company secretary.
8. AuditorsDuring the year Deloitte & Touche and KPMG Inc. have been the joint auditors of the Group and the Company. The auditors’ engagement is in accordance with section 90 of the Companies Act of South Africa. The Audit Committee confirms that it has complied with Par 7.3(e ) III and IV of the JSE Debt Listing requirements, in that it has obtained the information detailed in paragraph 22.15(h) of Section 22 of the JSE Listings Requirements in their assessment of the suitability for re-appointment of the audit firm and designated individual partner, and secondly, that it has ensured that the auditors are re-appointed at the Annual General Meeting of shareholders.
9. Debt OfficerThe Board has, with effect from 31 October 2020, appointed Mr M van der Walt as the Debt Officer, pursuant to considering the JSE Debt Listing Requirements. The Board has considered and is satisfied with the competence, qualifications and experience of the appointed debt officer.
Directors’ report
OMLACSA Separate and Consolidated Annual Financial Statements for the year ended 31 December 2020 OMLACSA Separate and Consolidated Annual Financial Statements for the year ended 31 December 20204 5
Corporate governance report
Corporate Governance FrameworkOld Mutual Life Assurance Company (South Africa) Limited (OMLACSA) is a licensed life insurer and wholly-owned subsidiary of the Old Mutual Limited which is a JSE listed entity. Old Mutual Limited established a Group Governance Framework (GGF) which adheres to King IV™. This framework outlines the minimum governance requirements for the Group and its subsidiary entities.
The Group is in compliance with King IV™ and requires that its subsidiaries comply with the King IV™ governance outcomes through application of the principles as set out in the code.
The OMLACSA board is satisfied that during 2020, it complied with the GGF, and has applied the King IV™ principles on the same basis as the Group. Refer to the full Governance Report 2020 on our corporate website https://www.oldmutual.com/investor-relations/reporting-centre/reports for details of the application and explanation of the GGF principles and King IV™ requirements.
Going concernThe Board has satisfied itself that the Group and Company has adequate resources to continue in operation for the foreseeable future. The Company’s financial statements have accordingly been prepared on a going concern basis.
Audit Committee report
This Audit committee report has been prepared based on the requirements of the SA Companies Act, 71 of 2008, as amended (‘Companies Act’), the King Code of Governance for SA (‘King IV’), the JSE Listings Requirements and other applicable regulatory requirements.
This report sets out how the Audit committee has satisfied its various statutory obligations during the year, as well as some of the focus areas considered and how these have been addressed by the committee.
Role and mandateThe committee’s main role is to assist the Board in fulfilling its oversight responsibilities, in particular with regard to the integrity of the Group’s financial statements, effectiveness of the systems of internal control, financial reporting and risk management.
In addition, the committee is responsible for assessing the effectiveness of the internal audit function, the Chief Financial Officer and the independence and effectiveness of the Group’s external auditors.
These responsibilities are in terms of the mandate of the Audit committee as defined in section 94(7) of the Companies Act and its terms of reference, which are available at www.oldmutual/about/governance/board-committees.
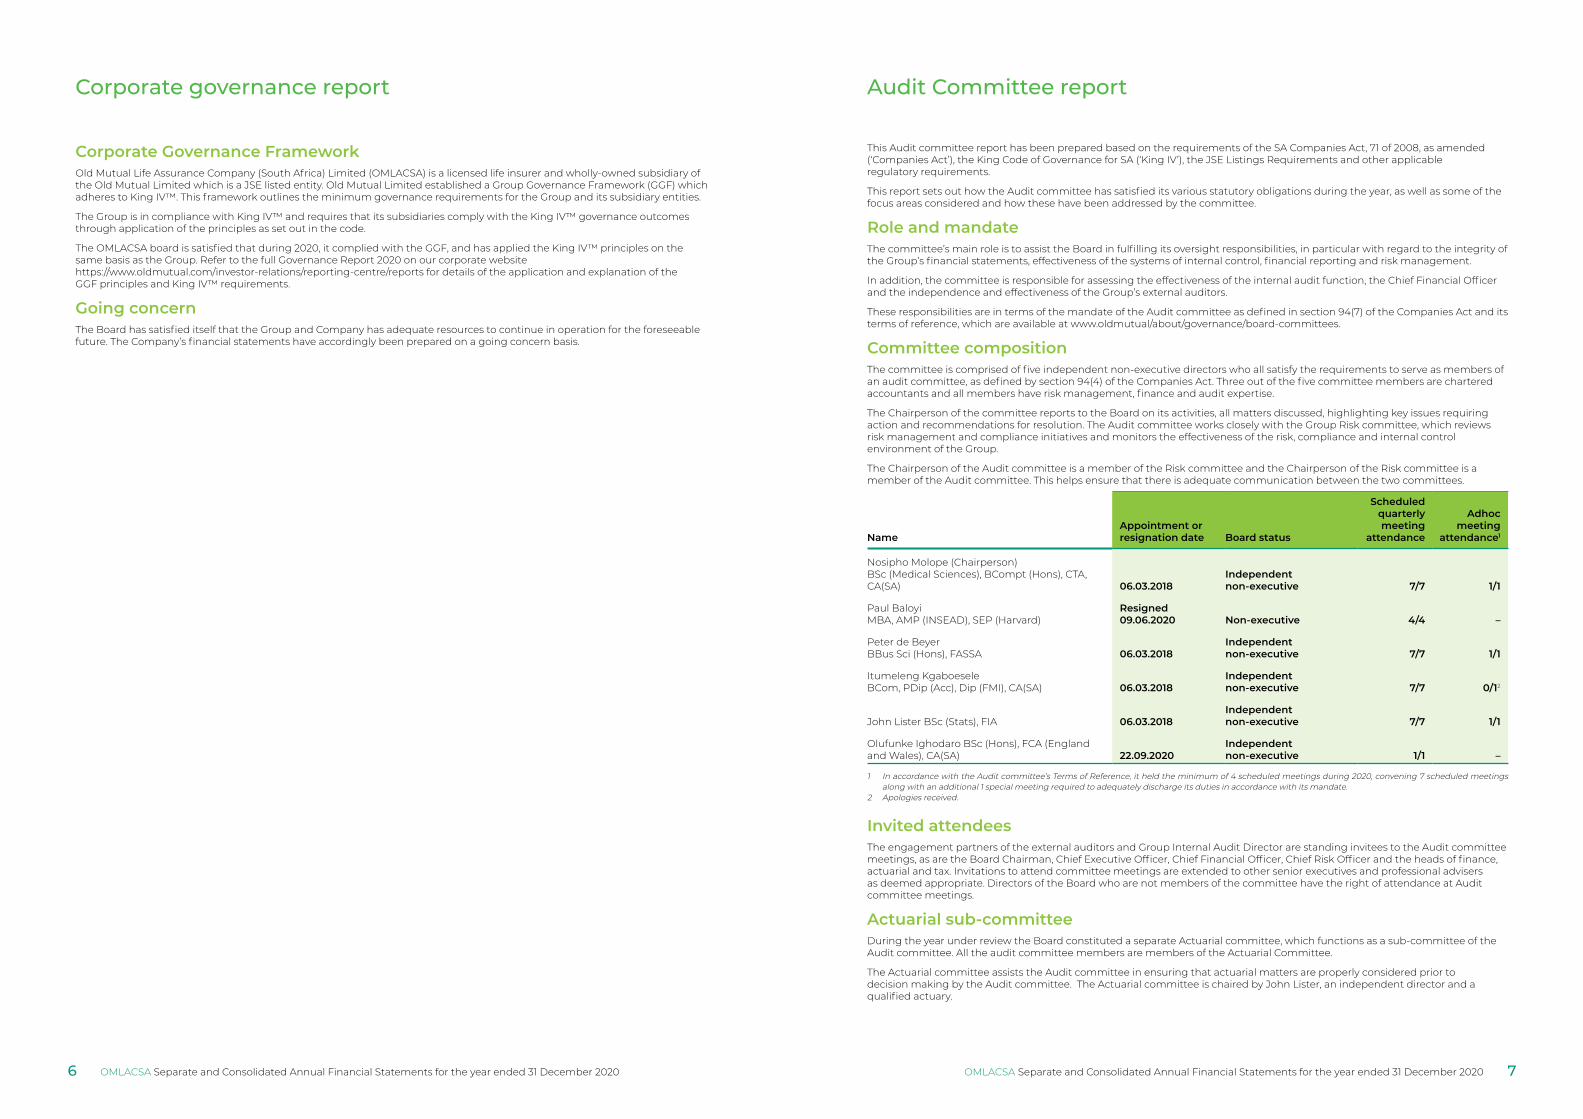
Committee compositionThe committee is comprised of five independent non-executive directors who all satisfy the requirements to serve as members of an audit committee, as defined by section 94(4) of the Companies Act. Three out of the five committee members are chartered accountants and all members have risk management, finance and audit expertise.
The Chairperson of the committee reports to the Board on its activities, all matters discussed, highlighting key issues requiring action and recommendations for resolution. The Audit committee works closely with the Group Risk committee, which reviews risk management and compliance initiatives and monitors the effectiveness of the risk, compliance and internal control environment of the Group.
The Chairperson of the Audit committee is a member of the Risk committee and the Chairperson of the Risk committee is a member of the Audit committee. This helps ensure that there is adequate communication between the two committees.
NameAppointment orresignation date Board status
Scheduledquarterlymeeting
attendance
Adhocmeeting
attendance1
Nosipho Molope (Chairperson)BSc (Medical Sciences), BCompt (Hons), CTA, CA(SA) 06.03.2018
Independent non‑executive 7/7 1/1
Paul BaloyiMBA, AMP (INSEAD), SEP (Harvard)
Resigned 09.06.2020 Non‑executive 4/4 –
Peter de BeyerBBus Sci (Hons), FASSA 06.03.2018
Independent non‑executive 7/7 1/1
Itumeleng KgaboeseleBCom, PDip (Acc), Dip (FMI), CA(SA) 06.03.2018
Independent non‑executive 7/7 0/12
John Lister BSc (Stats), FIA 06.03.2018Independent non‑executive 7/7 1/1
Olufunke Ighodaro BSc (Hons), FCA (England and Wales), CA(SA) 22.09.2020
Independent non‑executive 1/1 –
1 In accordance with the Audit committee’s Terms of Reference, it held the minimum of 4 scheduled meetings during 2020, convening 7 scheduled meetings along with an additional 1 special meeting required to adequately discharge its duties in accordance with its mandate.
2 Apologies received.
Invited attendeesThe engagement partners of the external auditors and Group Internal Audit Director are standing invitees to the Audit committee meetings, as are the Board Chairman, Chief Executive Officer, Chief Financial Officer, Chief Risk Officer and the heads of finance, actuarial and tax. Invitations to attend committee meetings are extended to other senior executives and professional advisers as deemed appropriate. Directors of the Board who are not members of the committee have the right of attendance at Audit committee meetings.
Actuarial sub‑committeeDuring the year under review the Board constituted a separate Actuarial committee, which functions as a sub-committee of the Audit committee. All the audit committee members are members of the Actuarial Committee.
The Actuarial committee assists the Audit committee in ensuring that actuarial matters are properly considered prior to decision making by the Audit committee. The Actuarial committee is chaired by John Lister, an independent director and a qualified actuary.
OMLACSA Separate and Consolidated Annual Financial Statements for the year ended 31 December 2020 OMLACSA Separate and Consolidated Annual Financial Statements for the year ended 31 December 20206 7
Our commitment to independence, transparency and collaborationThe Audit committee encourages continuous improvement of and fosters adherence to the Group’s policies, procedures and practices at all levels of the organisation.
Application of these policies encourages open communication with assurance providers, including the external auditors, senior management, internal audit, compliance, the risk functions and the Board.
The Group Internal Audit Director also has a direct reporting line to the committee with unrestricted access to the committee chairperson.
The independence of the committee is key to its effective functioning, whilst ensuring that it does not assume the functions of management.
As part of its mandate, it has the authority to investigate matters within the scope of its defined responsibility and to request information or explanations necessary for the performance of its functions.
Areas of focus during the yearSignificant audit mattersThe Audit committee routinely considers audit matters, as raised by the external auditors relating to the annual financial statements.
Audit matter How the Audit committee addressed the matter
Assumptions related to policyholder liabilities
The committee reviewed reports from the Group Chief Actuary and the external auditors on actuarial assumptions and basis changes, including extensive discussions on the impact of COVID-19 on key assumptions and provisions.
Valuation of property assets The committee reviewed the appropriateness of property asset valuations, with specific focus on property assets in South Africa.
Appropriateness of asset valuations
The impact of the COVID-19 pandemic on business operations and cash flows is considered a potential impairment indicator for non-financial assets that are not recognised at fair value. The committee reviewed the assets’ valuations and the subsequent adjustments, including the valuation of Nedbank.
Valuation of investments and securities
Considered the appropriateness of investments and securities valuations, with focus on level 3 instruments.
Goodwill and intangible valuations and impairments
The committee reviewed the goodwill and intangible assets impairment reviews that were based on the latest business planning inputs. The committee considered the sensitivity of the outcomes to declining growth rates and increasing discount rates.
Financial statements and integrated reporting processDuring the year under review the Audit committee:
• Monitored the impact of the COVID-19 pandemic and noted that the finance function continued to operate effectively throughout the lockdown period, without any material impacts on productivity
• Reviewed the Key Audit Matters identified by the Auditors and monitored the appropriateness of the management actions taken in addressing the Key Audit Matters.
• Reviewed and debated key accounting, actuarial and tax judgements including external audit’s Key Audit Matters and were satisfied with how these were addressed.
• Analysed financial information included in the Group’s interim and year end results announcements to ensure the accuracy and integrity of financial data disclosed externally.
• Reviewed the Head of Actuarial Function reports concluding that the actuarial control function operated effectively.• Remained appraised of key updates, policy and methodology decisions and upcoming milestones on the IFRS17 programme. • Reviewed and assessed the audited annual financial statements, and found the controls and financial reporting processes
underpinning its compilation to be appropriate and effective, despite the disruptions caused by the COVID-19 pandemic.• Recommended to the Board for approval of the annual financial statements, interim and annual results and the financial
information included in the 2020 Integrated Report. Assessed and confirmed the appropriateness of the going concern assumption used in the interim and annual financial statements.
• Reviewed the interim and final dividend proposals, and supported the deferral of the interim dividend in view of the impact of COVID-19 on earnings, and ensured that the Group had sufficient resources to make these distributions, before recommending them to the Board.
• Reviewed and approved the final dividend proposal and recommend this to the Board.• Approved the application for submission to the Prudential Authority for the use of the iterative risk margin approach to
calculate the Solvency Capital Requirement and Risk Margin across all OMLACSA products.
• Recommend to the Board for approval the application for submission to the Prudential Authority for the use of the Accounting Consolidation method across the specified South African insurers and their subsidiaries when assessing the financial soundness of the Group.
• Reviewed reports from the Head of Actuarial Function and the joint external auditors on actuarial assumptions and the reliability and adequacy of the financial soundness results of Old Mutual Life Assurance Company (South Africa) at 31 December 2020.
• Reviewed and recommended for approval the issuance of up to R 2billion of subordinated debt by OMLACSA, subject to Prudential Authority (PA) approval in terms of the Group consolidated multi-issuer note programme.
Internal controls and risk managementThe Audit committee is responsible for reviewing the effectiveness of systems for internal control, financial reporting and risk management, and for considering the findings of any major internal investigations into control weaknesses, fraud or misconduct, and management’s response thereto.
The Audit and Risk committees delegate the duty to management to continuously identify, assess, mitigate and manage risks within the existing and changing risk profile of our operating environment. Mitigating controls are formulated to address the risks and the Board is kept abreast of progress on the Group’s risk management plan
During the year under review the committee considered control issues identified from the various reports reviewed by the committee in the context of the overall effectiveness of internal controls.
During the year under review the committee considered control issues identified from the various reports reviewed by the committee in the context of the overall effectiveness of internal controls. These reports included internal and external audit reports, reports from the Board’s Risk committee as well as specific internal control reports from management, relating to internal attestation of financial and other controls. Areas of heightened risk as a result of the COVID-19 pandemic received particular focus. Where deficient controls or matters were raised, the committee reviewed the remediation plans in place and were satisfied that any material impact on the Group’s annual financial statements had appropriately been mitigated by management. The committee will monitor and evaluate the implementation of the remediation plans presented.
Having considered, analysed, reviewed and discussed information provided by management, other Board committees, Internal Audit and the external auditors, the Audit committee is of the opinion that the internal controls of the Group had been effective in all material aspects, throughout the year under review.
Internal AuditInternal Audit is the third line of assurance in the assurance model, and provides independent assurance over the first and second lines of assurance operations and oversight functions.
Group internal audit is accountable to the Audit committee and has unrestricted access to the Chairperson of the Audit committee.
Group internal audit meets with the Audit committee at least once a year without management being present, and has frequent interactions with the chairperson of the Audit committee.
The Audit committee approves the internal audit plan and neither the Group Internal Audit Director nor the internal audit function reports into the executive committee rather than from an administrative perspective. Group internal audit is also independent from the activities it audits and from the day-to-day management of the Group. This maintains the functional and financial independence of the internal audit function.
During the year under review the Audit committee:
• Reviewed and approved the internal audit terms of reference and charter.• Reviewed and approved the proposal to transition the internal audit function in South Africa from the current outsourced
model to an operating model that is largely in-house. Professional services firms and consultants will be utilised to source specialist and necessary skills as part of its operating model.
• Evaluated the independence, effectiveness and performance of the Internal Audit function and compliance with its terms of reference.
• Reviewed and approved the annual internal audit plan in consultation with the Group internal audit director, ensuring that material risk areas were included, that the coverage of risks and business processes was acceptable.
• Reviewed and discussed with the Group internal audit director the scope of work of the internal audit function, the issues identified as a result of its work and management’s responsiveness to issues raised and agreed action plans.
• Ensured coordination and cooperation between internal audit and the risk management and compliance functions.• An independent review of the effectiveness of Group internal audit was conducted during year, with no concerns raised.
The Audit committee is satisfied with the appropriateness of the expertise, experience and resources of the internal audit function and that of the audit director.
Audit Committee report
OMLACSA Separate and Consolidated Annual Financial Statements for the year ended 31 December 2020 OMLACSA Separate and Consolidated Annual Financial Statements for the year ended 31 December 20208 9
Chief Financial OfficerDuring the year under review the Audit committee reviewed the performance and confirmed the suitability and appropriateness of the expertise and experience of the Chief Financial Officer, Casper Troskie, and the resources, expertise, succession planning and experience of the Group’s finance function.
External auditorsThe Audit committee is responsible for the appointment, compensation and oversight of the external auditors for the Group, namely Deloitte and Touche and KPMG Inc.
During the year under review the Audit committee:
• Assessed the suitability for re-appointment of the audit firms and designated audit partners, considering the relevant legislative and regulatory requirements and presented and included the appointment of the Auditors. Ensured that the appointment and the independence of the external auditors were in compliance with the Companies Act and all other regulatory and legal requirements.
• Considered and recommended to the Board the re-appointment of the joint external auditors Deloitte and Touche (with Alex Arterton as designated registered auditor and joint signing partner of Old Mutual Limited and OMLACSA) and KPMG Inc. (with Pierre Fourie as designated registered auditor and joint signing partner for Old Mutual Limited and Mark Danckwerts as the joint signing partner for OMLACSA).
• Monitored the effectiveness of the external auditors in terms of their audit quality, expertise and independence, as well as the execution of the audit plan.
• Approved the joint external auditors’ annual audit plan and ensured that all statutory and financial reporting requirements were met and material risks were identified and appropriately addressed.
• The committee approved the audit fees for the 2020 year under review. • Reviewed the information provided by the auditors as detailed in paragraph 3.84(g)(iii), as read with section 22.15(h) of the JSE
Listings Requirements.• Monitored and ensured that fees for non-audit services were in line with the Group’s policy on non-audit services, which is
summarised in the Corporate Governance section of our website.• Reviewed the external auditors findings and recommendations and ensured that matters raised were resolved appropriately.• Ensured coordination and cooperation between the external and internal auditors.• Convened with the external audit team, without management being present and was assured that there were no unresolved
areas of disagreement with management, satisfaction was expressed with the skills and expertise in Group Finance and confirmed that throughout the audit there was good support from the management teams.
• Reviewed the arrangements in place to ensure appropriate rotation of the designated external audit partners as required in terms of Section 92 of the Companies Act.
• Confirmed that no reportable irregularities were identified and reported by the external auditors in terms of the Auditing Profession Act, 26 of 2005.
The Audit committee reviewed and approved the non-audit Services policy, which governs the type, value and scope of non-audit services that the external auditors are able to perform for the Group. Only those non-audit services that do not impact the external auditors’ independence and where it is best placed for the auditors to perform the services are permitted under the policy.
The Audit committee is satisfied with the appropriateness of the expertise, experience and resources of the external auditors, the external audit partners and the quality of the external audit.
Combined assuranceThe Audit committee is responsible for overseeing combined assurance activities and ensuring that these are effective in achieving its objectives.
The Group’s Combined Assurance framework establishes integrated and coordinated assurance activities between the three lines of assurance across all levels of the organisation. There is continued and ongoing focus on increased collaboration and sharing of information as well as reducing duplication of activities. The committee reviewed and approved the combined assurance plan for the Group.
In accordance with the principle of proportionality of our Group Governance Framework, both the boards of non-operating holding companies and holding companies with own operations are required to adopt the Combined Assurance Framework and ensure that the framework is implemented within their entity. Any areas of concern are escalated to the Audit committee.
The Audit committee is satisfied that assurance activities result in an adequate, effective control environment and the integrity of reports can be relied upon for decision making.
Committee TrainingAs a part of the ongoing training for directors, the committee members received training on the new insurance accounting standard IFRS 17, Return on Net Asset Value (RoNAV) methodology, Accounting Consolidation Methodology and the Iterative Risk Margin methodology.
Audit Committee report
Committee performanceThe performance of the committee is reviewed annually as part of the effectiveness review of the Board and all its committees. The externally facilitated review performed during 2020 concluded that the committee operated effectively and successfully discharged its responsibilities and duties during the year under review.
Key focus areas for 2021• Monitoring and evaluation of the Group’s preparation for the implementation of IFRS 17.• Focus on ensuring that the Group’s financial processes and controls operate effectively and are proportionate with the
Group’s complexity.• Monitor the Group’s response to the impact and mitigation of the COVID-19 pandemic• Continue to monitor, with the Technology and Platforms committee, the finance modernisation and transformation
initiatives, supporting the drive for simplifying and conforming finance data to further enhance the quality of the Group’s financial reporting
• Monitor the implementation of other new accounting standards• Monitor the levels of the various capital measures in the Group, ensuring that they are within acceptable ranges and continued
monitoring of the functioning of the Group’s internal controls • Review the Group’s long term actuarial assumptions ensuring appropriateness for current operating environment• Monitor methodology and assumptions used to calculate the Group’s liabilities and Solvency Capital Ratio• Succession planning with a focus on further complementing the skills on the Committee
ConclusionThe Audit committee is satisfied that it has complied with all statutory duties as well as its duties under its terms of reference for the reporting period.
The Audit committee reviewed the Group Annual Financial Statements for the year ended 31 December 2020 and recommended them for approval to the Board on 22 March 2021.
On behalf of the Audit committee
Nosipho Molope
Audit committee Chairperson
22 March 2021Sandton
OMLACSA Separate and Consolidated Annual Financial Statements for the year ended 31 December 2020 OMLACSA Separate and Consolidated Annual Financial Statements for the year ended 31 December 202010 11
Independent auditors’ report To the shareholders of Old Mutual Life Assurance Company (South Africa) LimitedReport on the audit of the consolidated and separate financial statements
Opinion We have audited the consolidated and separate financial statements of Old Mutual Life Assurance Company (South Africa) Limited (the Group and Company) set out on pages 17 to 144, which comprise the separate and consolidated statements of financial position at 31 December 2020,the separate and consolidated income statements, the separate and consolidated statements of comprehensive income, , the separate and consolidated statements of changes in equity and separate and consolidated statements of cash flows for the year ended 31 December 2020 and the notes to the separate and consolidated financial statements, including a summary of significant accounting policies, but excluding information marked as “unaudited”.
In our opinion, the consolidated and separate financial statements present fairly, in all material respects, the consolidated and separate financial position of Old Mutual Life Assurance Company (South Africa) Limited at 31 December 2020, and its consolidated and separate financial performance and consolidated and separate cash flows for the year then ended in accordance with International Financial Reporting Standards (IFRS) and the requirements of the Companies Act of South Africa.
Basis for opinion We conducted our audit in accordance with International Standards on Auditing (ISAs). Our responsibilities under those standards are further described in the Auditors’ responsibilities for the audit of the consolidated and separate financial statements section of our report. We are independent of the Group and Company in accordance with the Independent Regulatory Board for Auditors’ Code of Professional Conduct for Registered Auditors (the IRBA Code) and other independence requirements applicable to performing audits of financial statements in South Africa. We have fulfilled our other ethical responsibilities in accordance with the IRBA Code and in accordance with other ethical requirements applicable to performing audits in South Africa. The IRBA Code is consistent with the corresponding sections of the International Ethics Standards Board for Accountants’ International Code of Ethics for Professional Accountants (including International Independence Standards). We believe that the audit evidence we have obtained is sufficient and appropriate to provide a basis for our opinion.
Key audit matters Key audit matters are those matters that, in our professional judgement, were of most significance in our audit of the consolidated and separate financial statements of the current period. These matters were addressed in the context of our audit of the consolidated and separate financial statements as a whole, and in forming our opinion thereon, and we do not provide a separate opinion on these matters.
The key audit matters set out below relate to our audit of the consolidated and separate financial statements.
Valuation of life insurance contract liabilities and investment contract liabilities with discretionary participating features (“policyholder liabilities for life insurance risk”) – R314,9 billion (separate financial statements) and R315,2 billion (consolidated financial statements)
Refer to the accounting policy elections note A1 and note F2.
Key audit matter How the matter was addressed in our audit
Our procedures included:
At 31 December 2020, the value of the policyholder liabilities for life insurance risk was R314,9 billion, being R134,5 billion for life insurance contract liabilities and R180,4 billion for investment contract liabilities with discretionary participating features in respect of the separate financial statements and R315,5 billion being R135,2 billion for life insurance contract liabilities and R180,0 billion for investment contract liabilities with discretionary participating features in respect of the consolidated financial statements. These policyholder liabilities are measured in accordance with actuarial guidance in Standard of Actuarial Practice (SAP) 104 and in a manner allowed under IFRS 4 – Insurance Contracts (IFRS 4) in the consolidated and separate financial statements.
The valuation of policyholder liabilities for life insurance risk requires significant judgement and estimation driven by a number of inputs based on a variety of uncertain future outcomes. Judgements also include the policies for creating and releasing discretionary margins. Inputs into the valuation of these policyholder liabilities include actuarial assumptions such as mortality and morbidity rates, lapse rates and other key assumptions including discount rates and maintenance expenses.
The valuation of policyholder liabilities for life insurance risk involves the use of complex models applied to and dependent on complete and accurate contract and external data. This data also drives experience studies applied in forming key assumption decisions.
• Evaluating the design and implementation of controls over: › the actuarial reserving processes that ensure the appropriateness of key assumptions applied; and
› the assessment thereof by the actuarial review function and the directors of the final measurement of policyholder liabilities for life insurance risk.
• Verifying the completeness and accuracy of data included in the valuation models through:
› evaluating and concluding on the design, implementation and operating effectiveness of associated controls;
› verifying on a sample basis the policyholder data inputs to source documentation; and
› using data analytics to reconcile the data between policy administration and accounting systems and investigating any anomalies.
Key audit matter How the matter was addressed in our audit
With our actuarial audit specialists:
In addition, uncertainty associated with the COVID-19 pandemic has resulted in additional judgement relating to assumptions applied in the measurement of these policyholder liabilities. The directors have considered the potential impact of COVID-19 on the Company and Group and have established a short term pandemic reserve to allow for this additional uncertainty associated with mortality, morbidity and lapses.
Due to the significant judgement and estimation uncertainty involved in the determination of the policyholder liabilities for life insurance risk, the valuation of these policyholder liabilities for life insurance risk is considered a key audit matter.
› Assessing the appropriateness of the methodologies and assumptions applied to value the policyholder liabilities for life insurance risk against industry standards, IFRS 4, SAP 104 and where relevant, market practice;
› Challenging key assumptions and the methodologies and processes used to determine and update these assumptions through comparison with externally observable data and our assessment of the Company’s and Group’s analysis of experience to date. Our challenge focused on the following assumptions; mortality, morbidity and lapse rates, maintenance expenses, valuation discount rates.
› Assessing the consistency of the data used in experience reviews supporting key changes in assumptions with other audited information and evaluating the results of experience reviews ensuring they are appropriately applied in the valuations;
› Evaluating the appropriateness of discretionary margins applied to ensure they are consistent with actuarial guidance, the Company’s and the Group’s policies and IFRS;
› Assessing the appropriateness and accuracy of key models used to value the policyholder liabilities. This included testing of relevant IT controls, re-calculation of certain outputs and assessing the consistency of model outputs with our expectations and the Company’s and the Group’s analysis of profits;
Testing the methodology and basis for the directors’ establishment of the COVID-19 short term pandemic reserve specifically related to the worsening mortality, morbidity and lapses. Our work included analysing the Company’s and the Group’s COVID-19 claims and lapse experience data, comparing it with nationally published statistics and challenging the Company’s and the Group’s judgements applied in determining the provisions as well as their compliance with IFRS 4 and SAP 104; and
• Considering whether the associated disclosures are compliant with IFRS 4 and with the methodologies and assumptions approved by the directors.
Valuation of investments and securities – R681,2 billion (separate financial statements) and R730,5 billion (consolidated financial statements)
Refer to the accounting policy on note A1 and disclosure notes D1, D2, D3 and F1.
Key audit matter How the matter was addressed in our audit
Our procedures included:
At 31 December 2020, investments and securities (financial instruments) carried at fair value through profit or loss represented 93,6% of total assets in the separate financial statements and 89,1% in the consolidated financial statements. Level 1 investments and securities amount to R332,7 billion in the separate financial statements (R400,8 billion consolidated) and represent 48,1% of the total balance (54% in the consolidated financial statements).
As level 1 investments and securities are valued using quoted market prices, we do not consider these to include a high risk of significant misstatement, or to be subject to a significant level of judgement. However, due to their significance in the context of the financial statements as a whole, they are considered to be one of the areas which had the greatest effect on our overall audit strategy and allocation of resources in planning and completing our audit.
• Evaluating the design and implementation of controls over the valuation of investments and securities to ensure the accuracy of inputs, the appropriateness of methodologies and the assessment by the directors of the final measurement of the investments and securities;
• For level 1 and level 2 investments, verifying observable valuation inputs against independent data for a sample of the investments; and
• Selecting a sample of level 2 and 3 financial instruments and performing the following procedures together with our valuation audit specialists:
› Challenging and assessing the key inputs and assumptions used in the valuation models, such as estimated cash flows, growth rates and discount rates, and critically assessing the valuation methodologies against current market practice and industry standards;
OMLACSA Separate and Consolidated Annual Financial Statements for the year ended 31 December 2020 OMLACSA Separate and Consolidated Annual Financial Statements for the year ended 31 December 202012 13
Independent auditors’ report To the shareholders of Old Mutual Life Assurance Company (South Africa) LimitedReport on the audit of the consolidated and separate financial statements
Key audit matter How the matter was addressed in our audit
Level 2 investments and securities amount to R293,0 billion and represented 43,3% of the total balance in the separate financial statements and R294,7 billion (40,3% of the total balance) in the consolidated financial statements. The valuations of level 2 financial instruments are determined using models where all significant inputs are observable. The valuations of level 3 financial instruments amounting to R55,5 billion in the separate financial statements (R35,0 billion in the consolidated financial statements) are determined using techniques where one or more significant inputs are unobservable. The significant unobservable inputs include adjustments to the discount rate such as equity risk premiums, liquidity discounts, and price earnings ratios (PE ratio/multiple). Consequently, the determination of the fair value of investments and securities classified as level 2 and 3 financial instruments is more complex and/or judgemental, with a higher level of estimation uncertainty. These valuations were more challenging due to the impact of COVID-19 on the global economy and the unpredictability of the timing of the economic recovery.
Due to the significance of level 1 investments and securities, the estimation uncertainty involved in determining the fair value of investments and securities classified as level 2 and 3 financial instruments and the audit work effort involved, the valuation of investments and securities is considered to be a key audit matter.
› Comparing the valuation models and assumptions applied, ensuring consistency across the Company and the Group;
› Assessing the reasonableness of the estimated cash flows by performing retrospective testing and comparing actual financial performance against previous forecasts;
› Assessing the appropriateness of the pricing multiples used in certain valuations by comparing them with comparable listed companies, adjusted for comparability differences, size and liquidity; and
› Performing independent valuations of the investments to ascertain a reasonable range of outcomes and determining whether management’s determined value falls within this range;
• Recalculating disclosure items from source data and assessing whether the disclosures in relation to the fair value hierarchy of the investments and securities and the disclosures around the estimation uncertainty are complete, appropriate and in compliance with IFRS.
Valuation of investment property – R28,8 billion in the consolidated financial statements
Refer to the accounting policy and disclosure note G2 (b).
Key audit matter How the matter was addressed in our audit
The Group’s investment property is predominantly concentrated in Old Mutual Real Estate Holding Company Group (OMREHC).
The investment properties are geographically dispersed throughout South Africa, Africa, Romania and Bulgaria.
The Group’s investment property balance comprises mainly income generating properties in the office, retail and industrial sectors. The Group has substantially all of its properties valued by independent, external valuers at least once every three years. Given the uncertainties due to COVID-19, all material properties were subjected to an external review in the current year. The valuation technique applied by the Group is dependent on the nature and circumstances of the specific property. However, the majority of the high value investment properties are valued using the income approach.
The key inputs with the most significant impact on the investment property valuations are:
• Vacancy rates;• Discount rates;• Capitalisation rates; and • Market rentals.
In evaluating the fair values of the investment properties that were performed by management, with the use of independent valuers and reviewed by the directors of OMREHC, focus was placed on the key inputs into the valuations as these areas required significant judgement.
Our procedures included:
• Evaluating the design and implementation of controls related to the determination of the fair values of the investment properties including controls related to the appropriate review and approval of the investment property valuations, and the forecasts submitted by management to the external valuers;
• Assessing the competence, capabilities and objectivity of the independent valuers;
• Assessing the scope of the independent valuers work and reviewing the terms of the engagement to determine that there were no matters that affected their independence and objectivity, or inappropriately limited the scope of their work;
• Confirming that the approaches used by the independent valuers are consistent with IFRS and industry norms;
• Evaluating and challenging the judgements applied by the independent valuers in determining the fair value of the investment property, in particular the models and significant assumptions used in performing the valuations;
Key audit matter How the matter was addressed in our audit
The external valuers have issued their valuation reports with a material valuation uncertainty clause due to the impact of the COVID-19 pandemic on the market activity and the economy which results in more estimation uncertainty related to the fair values of the investment properties.
The valuation of investment property is considered to be a key audit matter due to the large degree of subjectivity and judgement included in the determination of the fair value exacerbated by the economic consequences and uncertainty as a result of COVID-19.
• Engaging a suitably qualified auditor’s expert to independently assess the reasonability and appropriateness of the valuation models, methodologies and inputs used by the independent valuers on a sample basis;
• Performing further procedures based on a profile of the investment property population including an assessment of the valuation techniques used, the appropriateness of the forecast period in respect of rental income, comparison of rental income to the market and comparison of capitalisation and discount rates to those available in industry publications; and
Assessing whether the disclosures in the consolidated and separate financial statements are appropriate and in accordance with IFRS 13: Fair Value Measurement and IAS 40: Investment property.
Other information The directors are responsible for the other information. The other information comprises the information included in the document titled “Old Mutual Life Assurance Company (South Africa) Limited Annual Financial Statements Consolidated and Separate for the year ended 31 December 2020”, which includes the Directors’ Report, the Audit Committee report, the Certificate by the Company Secretary as required by the Companies Act of South Africa, and information marked as “unaudited” in the consolidated and separate financial statements. The other information does not include the consolidated and separate financial statements and our auditors’ report thereon.
Our opinion on the consolidated and separate financial statements does not cover the other information and we do not and will not express an audit opinion or any form of assurance conclusion thereon.
In connection with our audit of the consolidated and separate financial statements, our responsibility is to read the other information and, in doing so, consider whether the other information is materially inconsistent with the consolidated and separate financial statements or our knowledge obtained in the audit, or otherwise appears to be materially misstated.. We have nothing to report in this regard.
Responsibilities of the directors for the consolidated and separate financial statementsThe directors are responsible for the preparation and fair presentation of the consolidated and separate financial statements in accordance with International Financial Reporting Standards and the requirements of the Companies Act of South Africa, and for such internal control as the directors determine is necessary to enable the preparation of consolidated and separate financial statements that are free from material misstatement, whether due to fraud or error.
In preparing the consolidated and separate financial statements, the directors are responsible for assessing the Group’s and Company’s ability to continue as a going concern, disclosing, as applicable, matters related to going concern and using the going concern basis of accounting unless the directors either intend to liquidate the Group and/or the Company or to cease operations, or have no realistic alternative but to do so.
Auditors’ responsibilities for the audit of the consolidated and separate financial statementsOur objectives are to obtain reasonable assurance about whether the consolidated and separate financial statements as a whole are free from material misstatement, whether due to fraud or error, and to issue an auditors’ report that includes our opinion. Reasonable assurance is a high level of assurance, but is not a guarantee that an audit conducted in accordance with ISAs will always detect a material misstatement when it exists. Misstatements can arise from fraud or error and are considered material if, individually or in the aggregate, they could reasonably be expected to influence the economic decisions of users taken on the basis of these consolidated and separate financial statements.
As part of an audit in accordance with ISAs, we exercise professional judgement and maintain professional scepticism throughout the audit. We also:
• Identify and assess the risks of material misstatement of the consolidated and separate financial statements, whether due to fraud or error, design and perform audit procedures responsive to those risks, and obtain audit evidence that is sufficient and appropriate to provide a basis for our opinion. The risk of not detecting a material misstatement resulting from fraud is higher than for one resulting from error, as fraud may involve collusion, forgery, intentional omissions, misrepresentations, or the override of internal control.
• Obtain an understanding of internal control relevant to the audit in order to design audit procedures that are appropriate in the circumstances, but not for the purpose of expressing an opinion on the effectiveness of the Group’s and Company’s internal control.
OMLACSA Separate and Consolidated Annual Financial Statements for the year ended 31 December 2020 OMLACSA Separate and Consolidated Annual Financial Statements for the year ended 31 December 202014 15
• Evaluate the appropriateness of accounting policies used and the reasonableness of accounting estimates and related disclosures made by the directors.
• Conclude on the appropriateness of the directors’ use of the going concern basis of accounting and based on the audit evidence obtained, whether a material uncertainty exists related to events or conditions that may cast significant doubt on the Group’s and Company’s ability to continue as a going concern. If we conclude that a material uncertainty exists, we are required to draw attention in our auditors’ report to the related disclosures in the consolidated and separate financial statements or, if such disclosures are inadequate, to modify our opinion. Our conclusions are based on the audit evidence obtained up to the date of our auditors’ report. However, future events or conditions may cause the Group and/or the Company to cease to continue as a going concern.
• Evaluate the overall presentation, structure and content of the consolidated and separate financial statements, including the disclosures, and whether the consolidated and separate financial statements represent the underlying transactions and events in a manner that achieves fair presentation.
• Obtain sufficient appropriate audit evidence regarding the financial information of the entities or business activities within the group to express an opinion on the consolidated financial statements. We are responsible for the direction, supervision and performance of the group audit. We remain solely responsible for our audit opinion.
We communicate with the directors regarding, among other matters, the planned scope and timing of the audit and significant audit findings, including any significant deficiencies in internal control that we identify during our audit.
We also provide the directors with a statement that we have complied with relevant ethical requirements regarding independence, and communicate with them all relationships and other matters that may reasonably be thought to bear on our independence, and where applicable, actions taken to eliminate threats or safeguards applied.
From the matters communicated with the directors, we determine those matters that were of most significance in the audit of the consolidated and separate financial statements of the current period and are therefore the key audit matters. We describe these matters in our auditors’ report unless law or regulation precludes public disclosure about the matter or when, in extremely rare circumstances, we determine that a matter should not be communicated in our report because the adverse consequences of doing so would reasonably be expected to outweigh the public interest benefits of such communication.
Report on other legal and regulatory requirementsIn terms of the IRBA Rule published in Government Gazette Number 39475 dated 4 December 2015, we report that KPMG Inc. has been the auditor of Old Mutual Life Assurance Company (South Africa) Limited for thirty years and Deloitte & Touche has been the auditor of Old Mutual Life Assurance Company (South Africa) Limited for three years.
KPMG Inc. Deloitte & Touche
Registered Auditor Registered Auditor
Per Mark Danckwerts Per Alex Arterton
Chartered Accountant (SA) Chartered Accountant (SA)
Registered Auditor Registered Auditor
Director Partner
23 March 2021 23 March 2021
85 Empire Road The Ridge Building
Parktown 6 Marina Road
2193 Portswood District
V&A Waterfront
8000
Independent auditors’ report To the shareholders of Old Mutual Life Assurance Company (South Africa) LimitedReport on the audit of the consolidated and separate financial statements
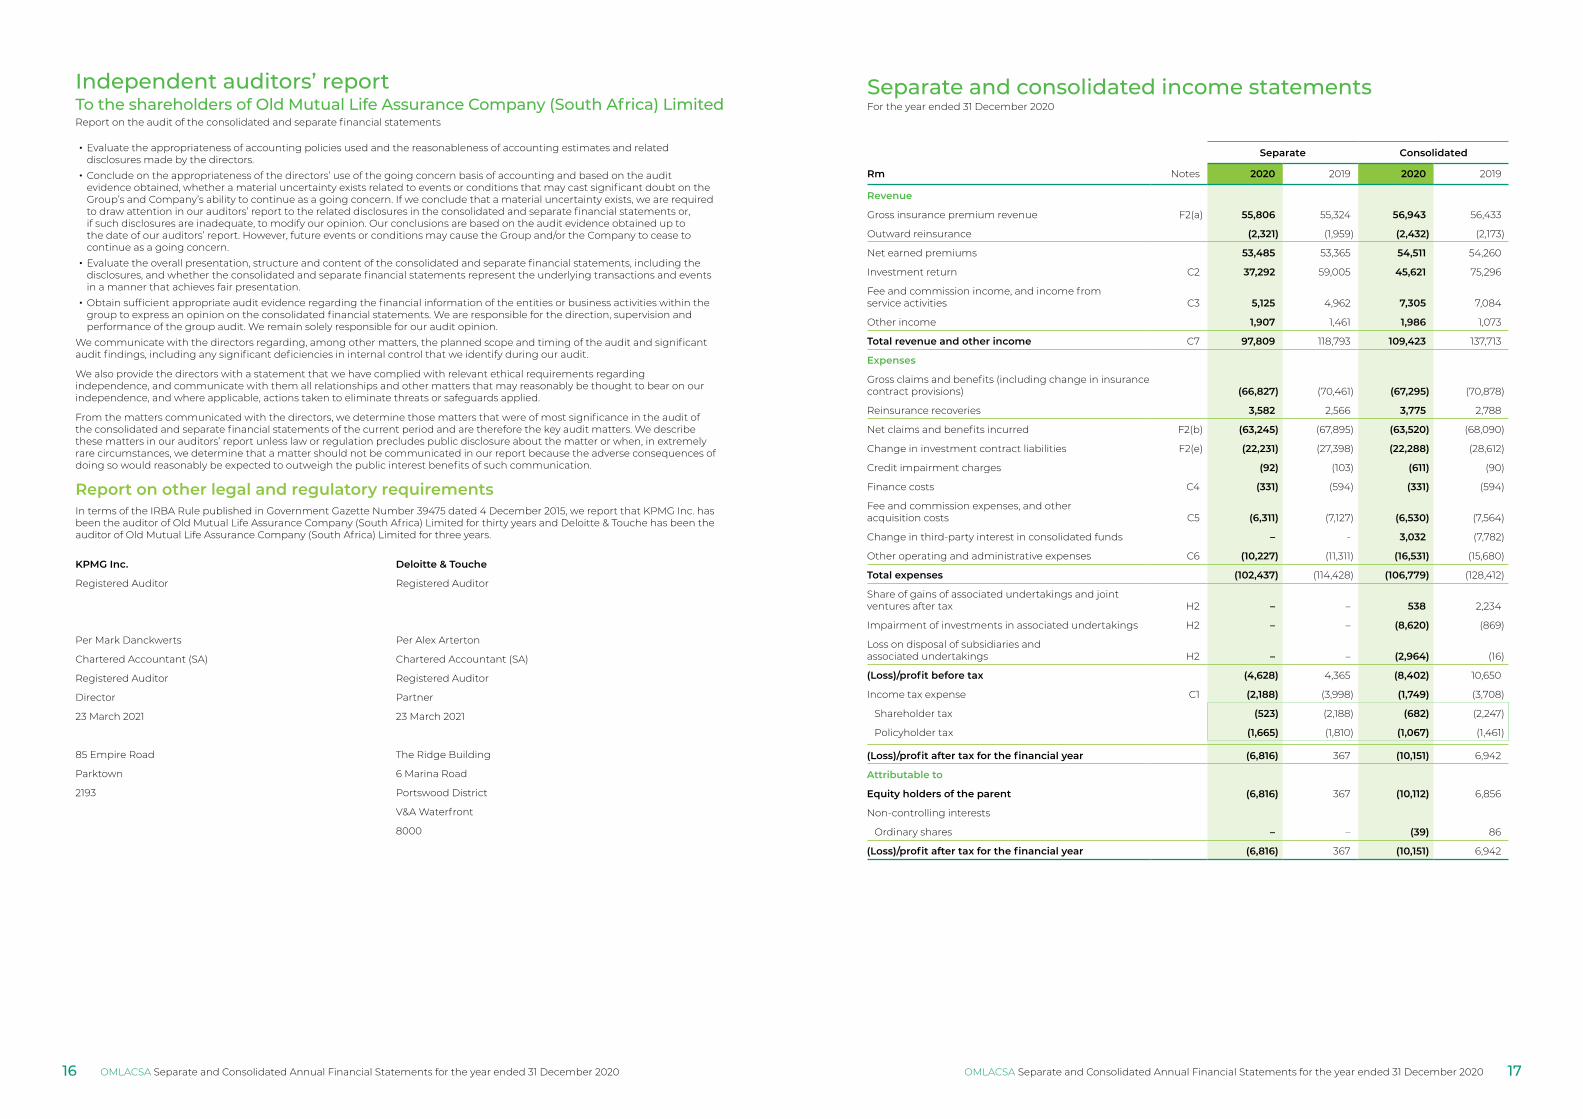
Separate and consolidated income statementsFor the year ended 31 December 2020
Separate Consolidated
Rm Notes 2020 2019 2020 2019
Revenue
Gross insurance premium revenue F2(a) 55,806 55,324 56,943 56,433
Outward reinsurance (2,321) (1,959) (2,432) (2,173)
Net earned premiums 53,485 53,365 54,511 54,260
Investment return C2 37,292 59,005 45,621 75,296
Fee and commission income, and income from service activities C3 5,125 4,962 7,305 7,084
Other income 1,907 1,461 1,986 1,073
Total revenue and other income C7 97,809 118,793 109,423 137,713
Expenses
Gross claims and benefits (including change in insurance contract provisions) (66,827) (70,461) (67,295) (70,878)
Reinsurance recoveries 3,582 2,566 3,775 2,788
Net claims and benefits incurred F2(b) (63,245) (67,895) (63,520) (68,090)
Change in investment contract liabilities F2(e) (22,231) (27,398) (22,288) (28,612)
Credit impairment charges (92) (103) (611) (90)
Finance costs C4 (331) (594) (331) (594)
Fee and commission expenses, and other acquisition costs C5 (6,311) (7,127) (6,530) (7,564)
Change in third-party interest in consolidated funds – - 3,032 (7,782)
Other operating and administrative expenses C6 (10,227) (11,311) (16,531) (15,680)
Total expenses (102,437) (114,428) (106,779) (128,412)
Share of gains of associated undertakings and joint ventures after tax H2 – – 538 2,234
Impairment of investments in associated undertakings H2 – – (8,620) (869)
Loss on disposal of subsidiaries and associated undertakings H2 – – (2,964) (16)
(Loss)/profit before tax (4,628) 4,365 (8,402) 10,650
Income tax expense C1 (2,188) (3,998) (1,749) (3,708)
Shareholder tax (523) (2,188) (682) (2,247)
Policyholder tax (1,665) (1,810) (1,067) (1,461)
(Loss)/profit after tax for the financial year (6,816) 367 (10,151) 6,942
Attributable to
Equity holders of the parent (6,816) 367 (10,112) 6,856
Non-controlling interests
Ordinary shares – – (39) 86
(Loss)/profit after tax for the financial year (6,816) 367 (10,151) 6,942
OMLACSA Separate and Consolidated Annual Financial Statements for the year ended 31 December 2020 OMLACSA Separate and Consolidated Annual Financial Statements for the year ended 31 December 202016 17
Separate Consolidated
Rm Notes 2020 2019 2020 2019
(Loss)/profit after tax for the financial year (6,816) 367 (10,151) 6,942
Other comprehensive income for the financial year
Items that will not be reclassified to profit or loss
(Losses)/gains on property revaluations (472) 183 (472) 183
Remeasurement (losses)/gains on defined benefit plans I2 (247) (388) 177 109
Fair value movements related to own credit risk on borrowed funds (130) (62) (130) (62)
Share of other comprehensive income from associated undertakings and Joint ventures and joint ventures – – 57 68
Shadow accounting1 220 (130) 220 (130)
Income tax on items that will not be reclassified to profit or loss C1(c) 69 93 (50) (46)
(560) (304) (198) 122
Items that may be reclassified to profit or loss
Currency translation differences on translating foreign operations (26) 2 220 (91)
Other comprehensive income recycled to profit or loss on disposal of associate – – 166 –
Share of other comprehensive income from associated undertakings and joint ventures – – 118 (284)
(26) 2 504 (375)
Total other comprehensive (loss)/income for the financial year (586) (302) 306 (253)
Total comprehensive (loss)/income for the financial year (7,402) 65 (9,845) 6,689
Attributable to
Equity holders of the parent (7,402) 65 (9,836) 6,603
Non-controlling interests
Ordinary shares – – (9) 86
Total comprehensive (loss)/income for the financial year (7,402) 65 (9,845) 6,689
1 Shadow accounting is applied to policyholder liabilities where the underlying measurement of the policyholder liability depends directly on the fair value of the Group’s owner occupied properties. Shadow accounting is an adjustment, permitted by IFRS 4 ‘Insurance contracts’, to allow for the impact of recognising unrealised gains or losses on insurance assets and liabilities in a consistent manner to the recognition of the unrealised gain or loss on assets that have a direct effect on the measurement of the related insurance assets and liabilities.
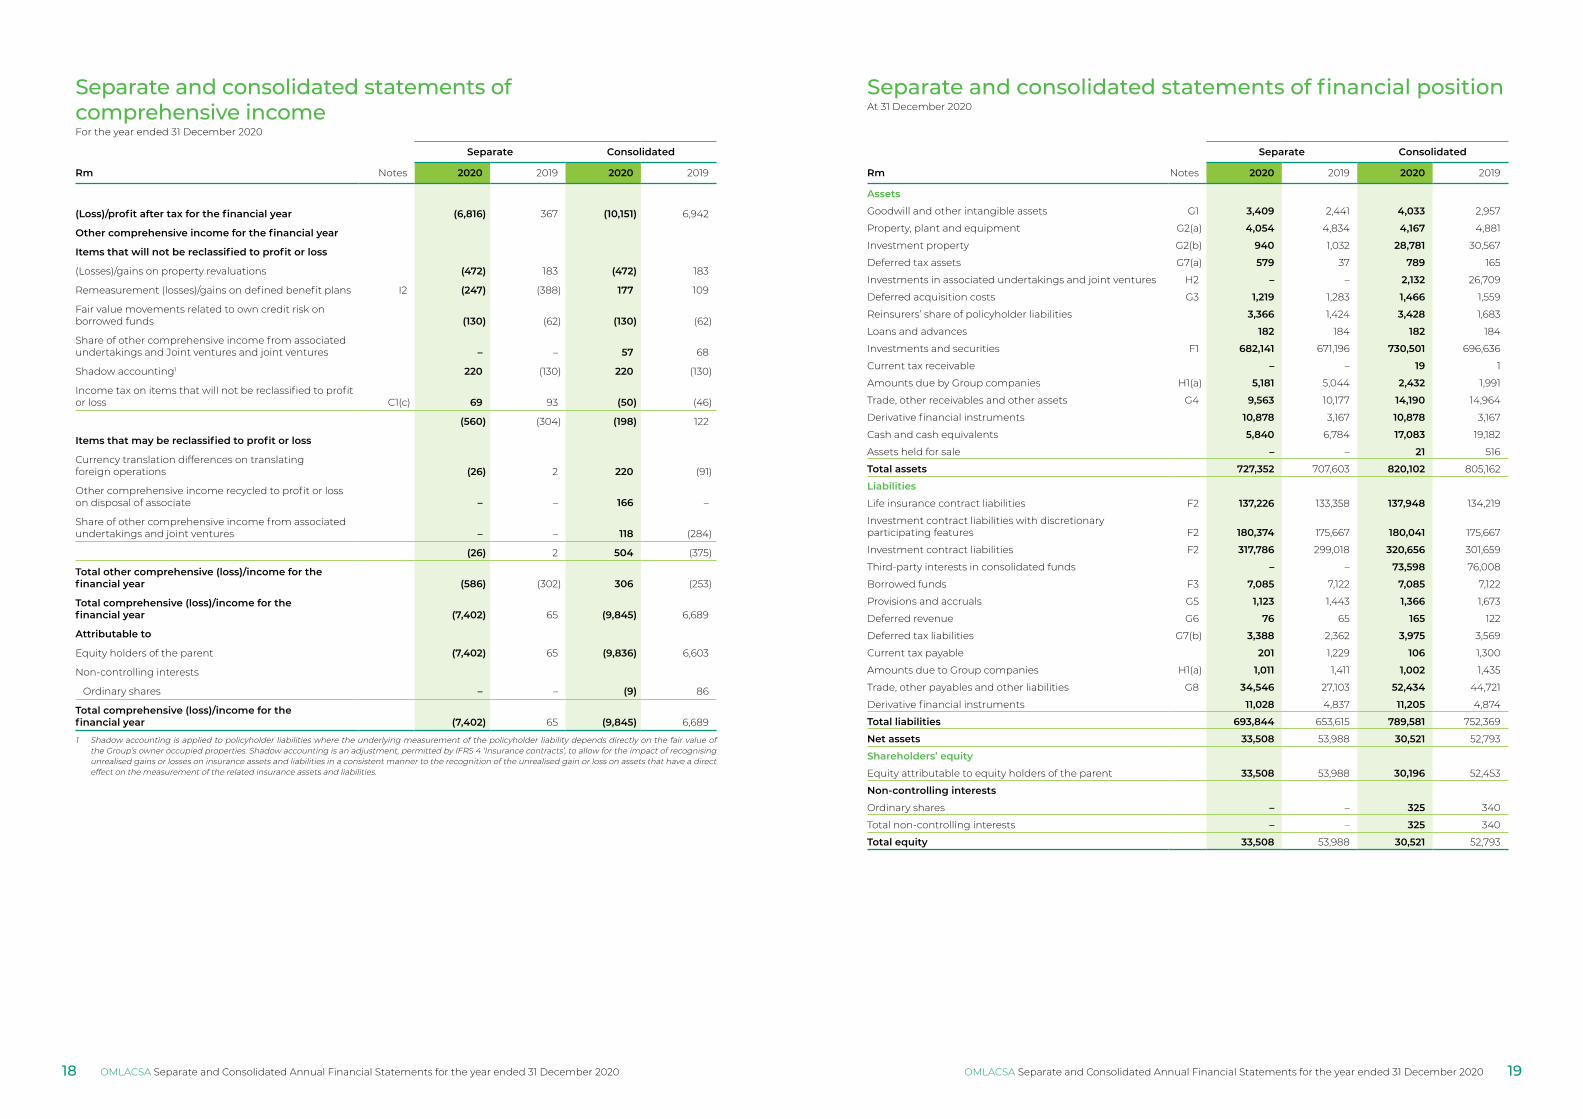
Separate and consolidated statements of comprehensive incomeFor the year ended 31 December 2020
Separate and consolidated statements of financial positionAt 31 December 2020
Separate Consolidated
Rm Notes 2020 2019 2020 2019
Assets
Goodwill and other intangible assets G1 3,409 2,441 4,033 2,957
Property, plant and equipment G2(a) 4,054 4,834 4,167 4,881
Investment property G2(b) 940 1,032 28,781 30,567
Deferred tax assets G7(a) 579 37 789 165
Investments in associated undertakings and joint ventures H2 – – 2,132 26,709
Deferred acquisition costs G3 1,219 1,283 1,466 1,559
Reinsurers’ share of policyholder liabilities 3,366 1,424 3,428 1,683
Loans and advances 182 184 182 184
Investments and securities F1 682,141 671,196 730,501 696,636
Current tax receivable – – 19 1
Amounts due by Group companies H1(a) 5,181 5,044 2,432 1,991
Trade, other receivables and other assets G4 9,563 10,177 14,190 14,964
Derivative financial instruments 10,878 3,167 10,878 3,167
Cash and cash equivalents 5,840 6,784 17,083 19,182
Assets held for sale – – 21 516
Total assets 727,352 707,603 820,102 805,162
Liabilities
Life insurance contract liabilities F2 137,226 133,358 137,948 134,219
Investment contract liabilities with discretionary participating features F2 180,374 175,667 180,041 175,667
Investment contract liabilities F2 317,786 299,018 320,656 301,659
Third-party interests in consolidated funds – – 73,598 76,008
Borrowed funds F3 7,085 7,122 7,085 7,122
Provisions and accruals G5 1,123 1,443 1,366 1,673
Deferred revenue G6 76 65 165 122
Deferred tax liabilities G7(b) 3,388 2,362 3,975 3,569
Current tax payable 201 1,229 106 1,300
Amounts due to Group companies H1(a) 1,011 1,411 1,002 1,435
Trade, other payables and other liabilities G8 34,546 27,103 52,434 44,721
Derivative financial instruments 11,028 4,837 11,205 4,874
Total liabilities 693,844 653,615 789,581 752,369
Net assets 33,508 53,988 30,521 52,793
Shareholders’ equity
Equity attributable to equity holders of the parent 33,508 53,988 30,196 52,453
Non‑controlling interests
Ordinary shares – – 325 340
Total non-controlling interests – – 325 340
Total equity 33,508 53,988 30,521 52,793
OMLACSA Separate and Consolidated Annual Financial Statements for the year ended 31 December 2020 OMLACSA Separate and Consolidated Annual Financial Statements for the year ended 31 December 202018 19
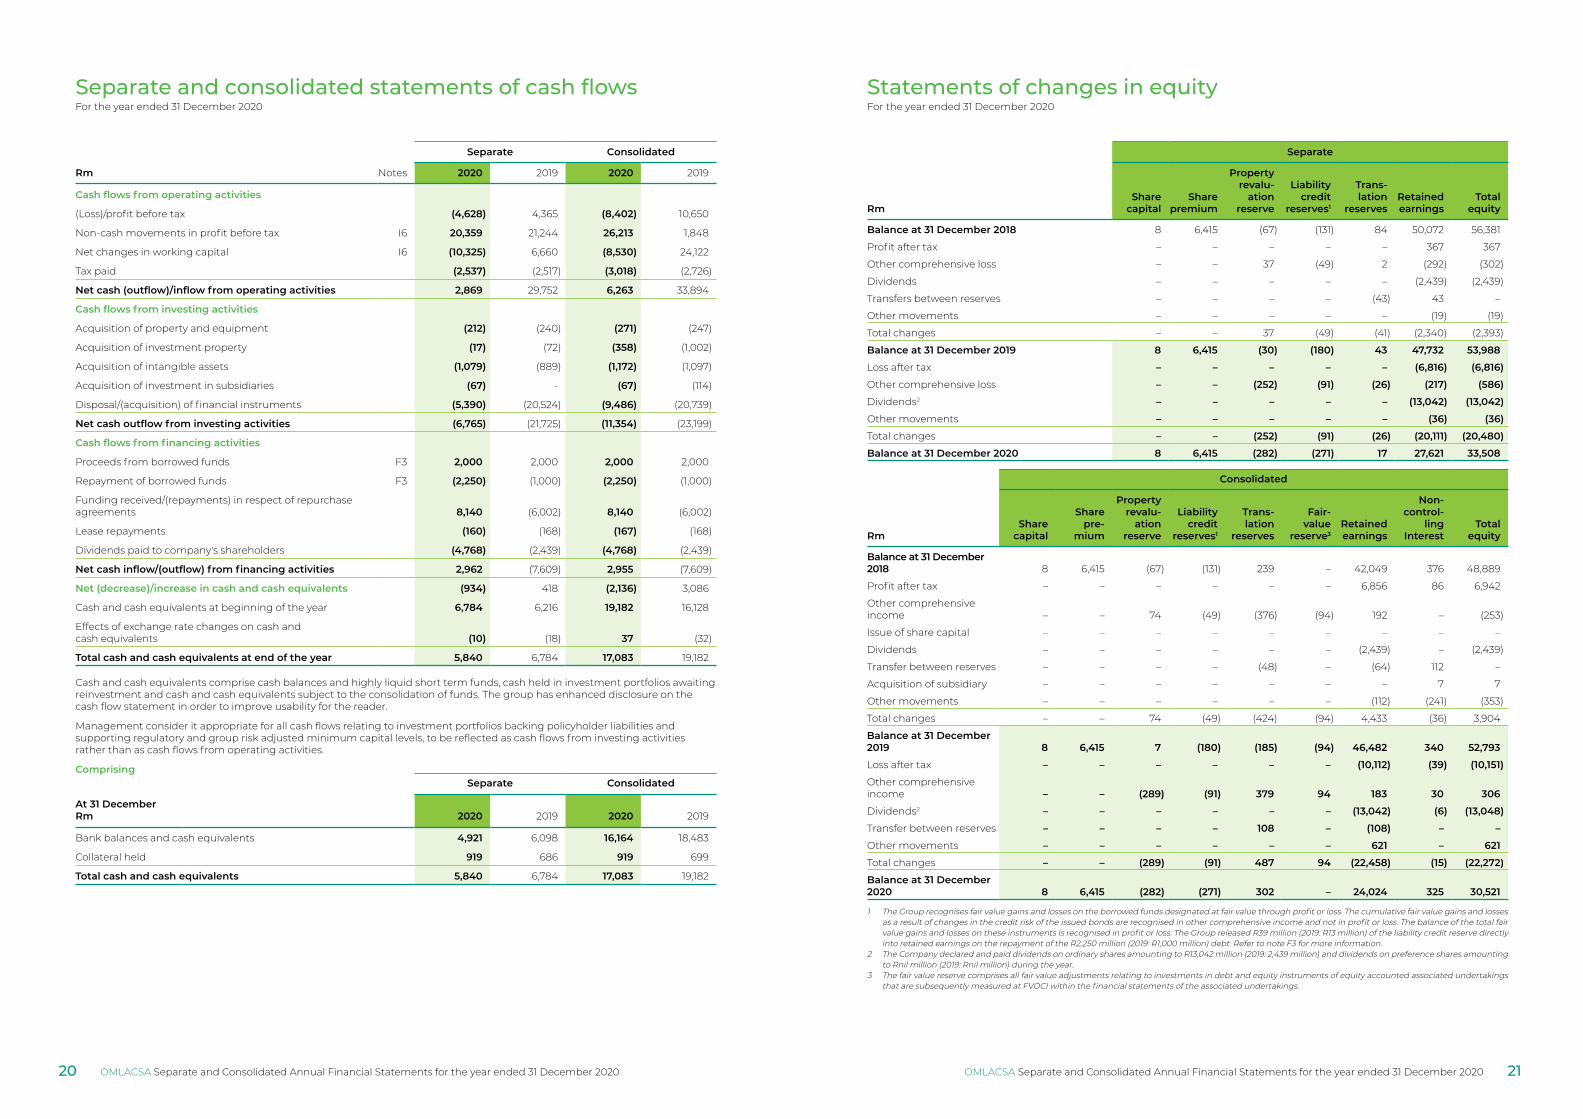
Separate and consolidated statements of cash flowsFor the year ended 31 December 2020
Separate Consolidated
Rm Notes 2020 2019 2020 2019
Cash flows from operating activities
(Loss)/profit before tax (4,628) 4,365 (8,402) 10,650
Non-cash movements in profit before tax I6 20,359 21,244 26,213 1,848
Net changes in working capital I6 (10,325) 6,660 (8,530) 24,122
Tax paid (2,537) (2,517) (3,018) (2,726)
Net cash (outflow)/inflow from operating activities 2,869 29,752 6,263 33,894
Cash flows from investing activities
Acquisition of property and equipment (212) (240) (271) (247)
Acquisition of investment property (17) (72) (358) (1,002)
Acquisition of intangible assets (1,079) (889) (1,172) (1,097)
Acquisition of investment in subsidiaries (67) - (67) (114)
Disposal/(acquisition) of financial instruments (5,390) (20,524) (9,486) (20,739)
Net cash outflow from investing activities (6,765) (21,725) (11,354) (23,199)
Cash flows from financing activities
Proceeds from borrowed funds F3 2,000 2,000 2,000 2,000
Repayment of borrowed funds F3 (2,250) (1,000) (2,250) (1,000)
Funding received/(repayments) in respect of repurchase agreements 8,140 (6,002) 8,140 (6,002)
Lease repayments (160) (168) (167) (168)
Dividends paid to company's shareholders (4,768) (2,439) (4,768) (2,439)
Net cash inflow/(outflow) from financing activities 2,962 (7,609) 2,955 (7,609)
Net (decrease)/increase in cash and cash equivalents (934) 418 (2,136) 3,086
Cash and cash equivalents at beginning of the year 6,784 6,216 19,182 16,128
Effects of exchange rate changes on cash and cash equivalents (10) (18) 37 (32)
Total cash and cash equivalents at end of the year 5,840 6,784 17,083 19,182
Cash and cash equivalents comprise cash balances and highly liquid short term funds, cash held in investment portfolios awaiting reinvestment and cash and cash equivalents subject to the consolidation of funds. The group has enhanced disclosure on the cash flow statement in order to improve usability for the reader.
Management consider it appropriate for all cash flows relating to investment portfolios backing policyholder liabilities and supporting regulatory and group risk adjusted minimum capital levels, to be reflected as cash flows from investing activities rather than as cash flows from operating activities.
ComprisingSeparate Consolidated
At 31 DecemberRm 2020 2019 2020 2019
Bank balances and cash equivalents 4,921 6,098 16,164 18,483
Collateral held 919 686 919 699
Total cash and cash equivalents 5,840 6,784 17,083 19,182
Statements of changes in equityFor the year ended 31 December 2020
Separate
RmShare
capitalShare
premium
Propertyrevalu‑
ationreserve
Liabilitycredit
reserves1
Trans‑lation
reservesRetainedearnings
Totalequity
Balance at 31 December 2018 8 6,415 (67) (131) 84 50,072 56,381
Profit after tax – – – – – 367 367
Other comprehensive loss – – 37 (49) 2 (292) (302)
Dividends – – – – – (2,439) (2,439)
Transfers between reserves – – – – (43) 43 –
Other movements – – – – – (19) (19)
Total changes – – 37 (49) (41) (2,340) (2,393)
Balance at 31 December 2019 8 6,415 (30) (180) 43 47,732 53,988
Loss after tax – – – – – (6,816) (6,816)
Other comprehensive loss – – (252) (91) (26) (217) (586)
Dividends2 – – – – – (13,042) (13,042)
Other movements – – – – – (36) (36)
Total changes – – (252) (91) (26) (20,111) (20,480)
Balance at 31 December 2020 8 6,415 (282) (271) 17 27,621 33,508
Consolidated
RmShare
capital
Sharepre‑
mium
Propertyrevalu‑
ationreserve
Liabilitycredit
reserves1
Trans‑lation
reserves
Fair‑value
reserve3Retainedearnings
Non‑control‑
lingInterest
Totalequity
Balance at 31 December 2018 8 6,415 (67) (131) 239 – 42,049 376 48,889
Profit after tax – – – – – – 6,856 86 6,942
Other comprehensive income – – 74 (49) (376) (94) 192 – (253)
Issue of share capital – – – – – – – – –
Dividends – – – – – – (2,439) – (2,439)
Transfer between reserves – – – – (48) – (64) 112 –
Acquisition of subsidiary – – – – – – – 7 7
Other movements – – – – – – (112) (241) (353)
Total changes – – 74 (49) (424) (94) 4,433 (36) 3,904
Balance at 31 December 2019 8 6,415 7 (180) (185) (94) 46,482 340 52,793
Loss after tax – – – – – – (10,112) (39) (10,151)
Other comprehensive income – – (289) (91) 379 94 183 30 306
Dividends2 – – – – – – (13,042) (6) (13,048)
Transfer between reserves – – – – 108 – (108) – –
Other movements – – – – – – 621 – 621
Total changes – – (289) (91) 487 94 (22,458) (15) (22,272)
Balance at 31 December 2020 8 6,415 (282) (271) 302 – 24,024 325 30,521
1 The Group recognises fair value gains and losses on the borrowed funds designated at fair value through profit or loss. The cumulative fair value gains and losses as a result of changes in the credit risk of the issued bonds are recognised in other comprehensive income and not in profit or loss. The balance of the total fair value gains and losses on these instruments is recognised in profit or loss. The Group released R39 million (2019: R13 million) of the liability credit reserve directly into retained earnings on the repayment of the R2,250 million (2019: R1,000 million) debt. Refer to note F3 for more information.
2 The Company declared and paid dividends on ordinary shares amounting to R13,042 million (2019: 2,439 million) and dividends on preference shares amounting to Rnil million (2019: Rnil million) during the year.
3 The fair value reserve comprises all fair value adjustments relating to investments in debt and equity instruments of equity accounted associated undertakings that are subsequently measured at FVOCI within the financial statements of the associated undertakings.
OMLACSA Separate and Consolidated Annual Financial Statements for the year ended 31 December 2020 OMLACSA Separate and Consolidated Annual Financial Statements for the year ended 31 December 202020 21
Notes to the separate and consolidated financial statementsFor the year ended 31 December 2020
A: Significant accounting policiesA1: Basis of preparation
1.1 Statement of compliance
Old Mutual Life Assurance Company (South Africa) Limited (the Company) is a company incorporated in South Africa.
The financial statements for the year ended 31 December 2020 consolidate the results of the Company and its subsidiaries (together ‘the Group’) and equity account the Group’s interest in associates and joint ventures (other than those held by investment-linked insurance funds and investments in venture capital divisions which are accounted for as investments at fair value through profit or loss).
The consolidated and separate financial statements (financial statements) comprise the consolidated and separate statements of financial position at 31 December 2020, the consolidated and separate income statement, the consolidated and separate statements of comprehensive income, the consolidated and separate statements of changes in equity and the consolidated and separate statements of cash flows for the year ended 31 December 2020 and explanatory notes to the consolidated and separate financial statements (including the consolidated supplementary income statement). The financial statements are prepared on the going concern basis, which the directors believe is appropriate, taking into account the Group’s most recent business plan and the capital and liquidity position. The financial statements were approved by the board of directors on 22 March 2021.
The financial statements have been prepared in accordance with International Financial Reporting Standards (IFRS), as issued by the IASB, including interpretations to IFRS as issued by the IFRS Interpretations Committee (IFRIC), the Financial Reporting Pronouncements as issued by the Financial Reporting Standards Council, the SAICA Financial Reporting Guides as issued by the Accounting Practices Committee, the JSE Listings Requirements, and requirements of the Companies Act, no 71 of 2008 (Companies Act).
The Group has prepared the financial statements in accordance with its detailed accounting policies which can be found at www.oldmutual.com/investor-relations/reporting-centre/reports. The significant accounting policies are contained in the financial statements and are included in the specific notes to which they relate. The accounting policies applied in the preparation of these financial statements are consistent with those applied in the preparation of the Group’s 2019 consolidated financial statements. A number of new standards, amendments to standards and interpretations are effective from 1 January 2020 but they do not have a material effect on the Group’s consolidated financial statements.
1.2 Comparative information
Comparative information presented at and for the year ended 31 December 2019 within these financial statements has been correctly extracted from the Group’s audited consolidated financial statements for the year ended 31 December 2019 (prior year financial statements), except for those notes that have been restated.
1.3 Accounting policy elections
The following significant accounting policy elections have been made by the Group:
Area Details
Financial instruments The Group has elected to designate certain financial assets and liabilities at fair value through profit or loss to reduce the accounting mismatch that would arise otherwise.This measurement election is typically utilised in respect of financial assets held to support liabilities in respect of contracts with policyholders.Regular way purchases or sales of financial assets are recognised and derecognised using trade date accounting.
Investment properties The Group has elected to recognise all investment properties at fair value, with changes in fair value being recognised in profit or loss.
Property, plant and equipment Land and buildings are stated at revalued amounts, being fair value less subsequent depreciation and impairment.Revaluation surpluses are recognised in equity, through other comprehensive income.When the property is disposed of, the cumulative revaluation surplus is transferred directly to retained earnings.Plant and equipment are carried at cost less accumulated depreciation.
Investment in venture capital divisions and investment‑linked insurance funds
In venture capital divisions and investment-linked insurance funds, the Group has elected to carry associate and joint-venture entities at fair value through profit or loss.
Policyholder liabilities: insurance contracts and investment contracts with discretionary participating features
Although not an accounting policy election, the measurement of policyholder liabilities under IFRS 4 Insurance Contracts currently refers to existing local practice. In South Africa, the valuation basis of such policyholder liabilities is made in accordance with the Financial Soundness Valuation basis as set out in actuarial guidance issued by the Actuarial Society of South Africa in Standard of Actuarial Practice (SAP) 104. Under this guidance, provisions are valued using realistic expectations of future experience, with margins for prudence and deferral of profit emergence. For territories outside of South Africa, local actuarial practices and methodologies are applied.
Notes to the separate and consolidated financial statementsFor the year ended 31 December 2020
1.4 Going concern
A detailed going concern assessment has been performed as part of the 2020 year end reporting process. This assessment has relied on the Group’s 2021 to 2023 business plan and has considered the profitability and solvency projections over the plan period. Due to the unprecedented impact on our operating environment, the Group focussed on key priorities and management actions to ensure that were able to appropriately respond to what can be considered a 1-in-100 year event. This along with various economic scenarios modelled during 2020 helped provide appropriate inputs into the Group’s business plan. As part of the planning process, a downside scenario has also been modelled that factored into account a second wave of infections, with no economic growth until 2022 as well as lower expected market levels. The outcomes of this scenario have shown that the Group remains sufficiently capitalised with appropriate levels of liquidity and no material uncertainty in relation to the going concern has been identified in the base business plan as well as the downside scenario.
A comprehensive and mature risk management framework is in place which is based on a three lines of assurance model. This ensures disciplined risk based decision making in the Group and active control over risk exposures to which earnings and capital are exposed. A comprehensive suite of risk policies is in place to direct how specific risks should be managed and controlled. Appropriate escalation mechanisms are in place for risk events and any breaches in risk limits and targets. A forward looking Own Risk and Solvency Assessment (ORSA) is conducted annually. This assesses the robustness of the balance sheet in modelled severe conditions and supports the maintenance of strong solvency capital and liquidity positions.
Subsequent to year end and up to the date of assessment, there have been no significant change in circumstances which suggest the above reviews are no longer valid.
Based on the above reviews, no material uncertainties that would require disclosure have been identified in relation to the ability of the group to remain a going concern for at least the next 12 months. The directors therefore consider it appropriate for the going concern basis to be adopted in preparing the annual financial statements.
1.5 Foreign currency translation
Translation of foreign operations into the Group’s presentation currency
The assets and liabilities held by foreign branches to support liabilities in respect of contracts with policyholders are translated from their respective functional currencies into the Group’s presentation currency, using the period-end exchange rates, and their income and expenses using the average exchange rates for the year. Cumulative unrealised gains or losses resulting from translation of functional currencies to the presentation currency are included as a separate component of shareholders’ equity. Upon the disposal of subsidiaries, the cumulative amount of exchange differences deferred in shareholders’ equity, net of attributable amounts in relation to hedged net investments, is recognised in profit or loss.
The exchange rates used to translate the operating results, assets and liabilities of key foreign businesses to rand are:
Year ended 31 December 2020 Year ended 31 December 2019
Income statement
(average rate)
Statement of financial position
(closing rate)
Income statement
(average rate)
Statement of financial position
(closing rate)
Pound sterling 21.1126 20.0650 18.4482 18.5598
US dollar 16.4597 14.6836 14.4492 14.0000
OMLACSA Separate and Consolidated Annual Financial Statements for the year ended 31 December 2020 OMLACSA Separate and Consolidated Annual Financial Statements for the year ended 31 December 202022 23OMLACSA Separate and Consolidated Annual Financial Statements for the year ended 31 December 2020OMLACSA Separate and Consolidated Annual Financial Statements for the year ended 31 December 2020
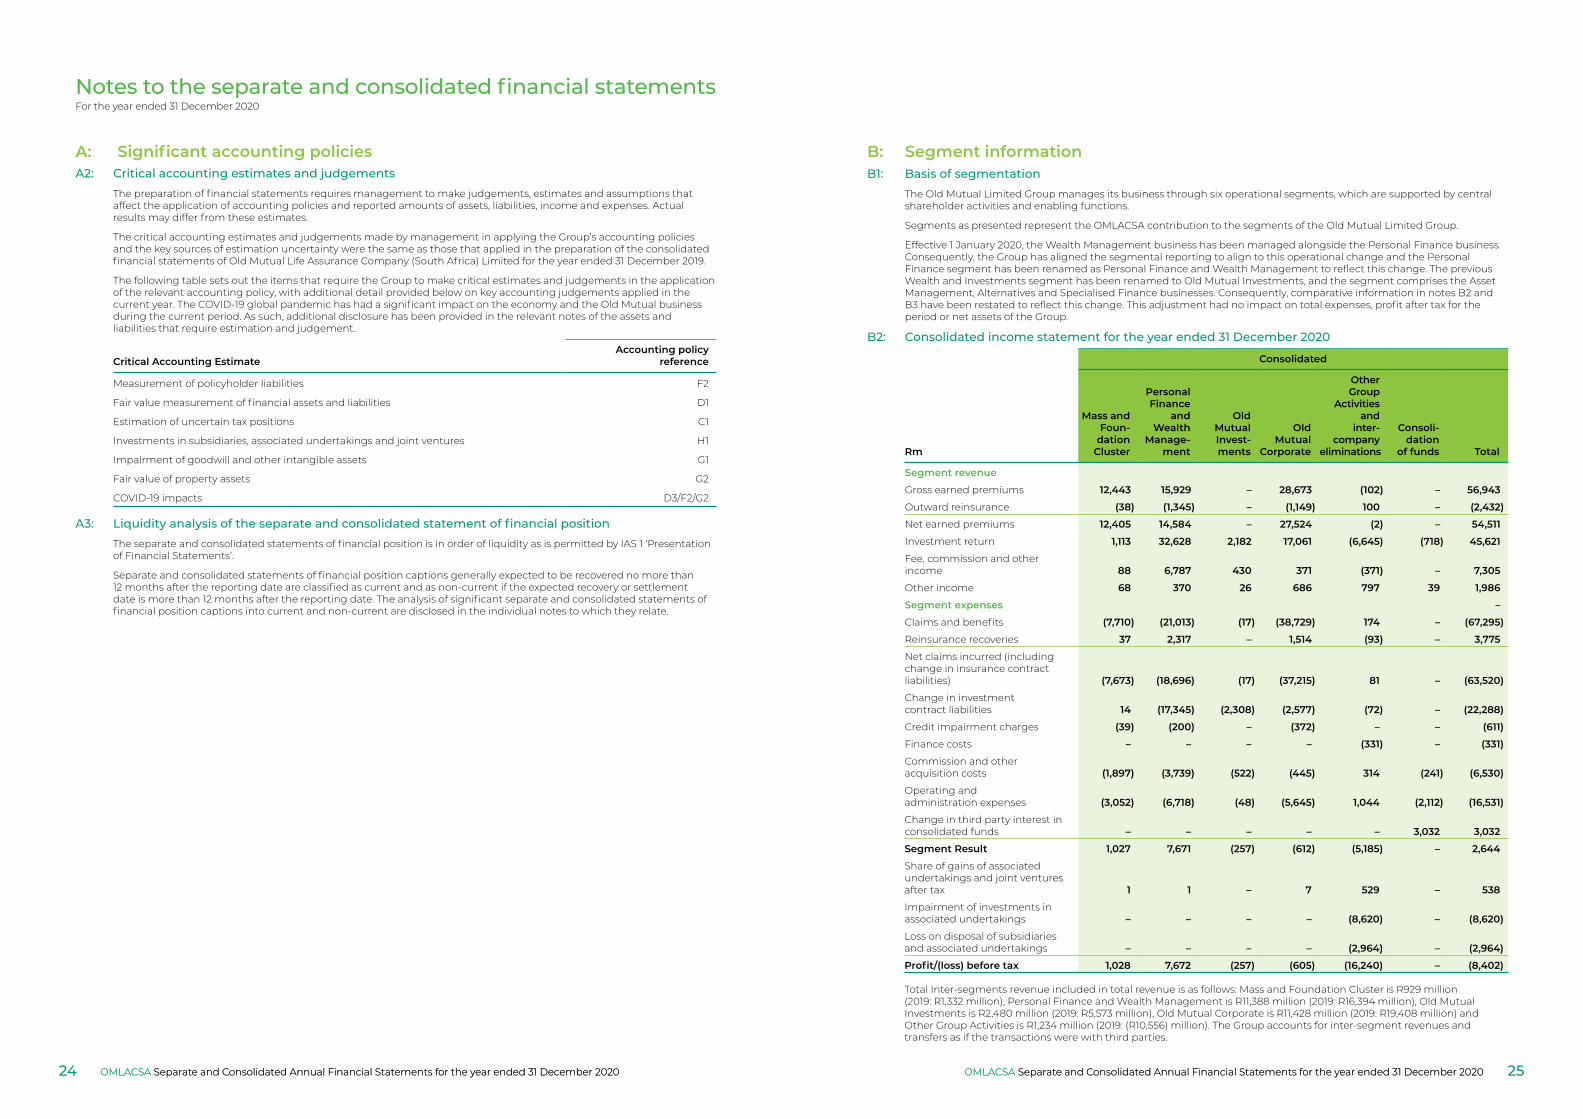
Notes to the separate and consolidated financial statementsFor the year ended 31 December 2020
A2: Critical accounting estimates and judgementsThe preparation of financial statements requires management to make judgements, estimates and assumptions that affect the application of accounting policies and reported amounts of assets, liabilities, income and expenses. Actual results may differ from these estimates.
The critical accounting estimates and judgements made by management in applying the Group’s accounting policies and the key sources of estimation uncertainty were the same as those that applied in the preparation of the consolidated financial statements of Old Mutual Life Assurance Company (South Africa) Limited for the year ended 31 December 2019.
The following table sets out the items that require the Group to make critical estimates and judgements in the application of the relevant accounting policy, with additional detail provided below on key accounting judgements applied in the current year. The COVID-19 global pandemic has had a significant impact on the economy and the Old Mutual business during the current period. As such, additional disclosure has been provided in the relevant notes of the assets and liabilities that require estimation and judgement.
Critical Accounting EstimateAccounting policy
reference
Measurement of policyholder liabilities F2
Fair value measurement of financial assets and liabilities D1
Estimation of uncertain tax positions C1
Investments in subsidiaries, associated undertakings and joint ventures H1
Impairment of goodwill and other intangible assets G1
Fair value of property assets G2
COVID-19 impacts D3/F2/G2
A3: Liquidity analysis of the separate and consolidated statement of financial positionThe separate and consolidated statements of financial position is in order of liquidity as is permitted by IAS 1 ‘Presentation of Financial Statements’.
Separate and consolidated statements of financial position captions generally expected to be recovered no more than 12 months after the reporting date are classified as current and as non-current if the expected recovery or settlement date is more than 12 months after the reporting date. The analysis of significant separate and consolidated statements of financial position captions into current and non-current are disclosed in the individual notes to which they relate.
B: Segment informationB1: Basis of segmentation
The Old Mutual Limited Group manages its business through six operational segments, which are supported by central shareholder activities and enabling functions.
Segments as presented represent the OMLACSA contribution to the segments of the Old Mutual Limited Group.
Effective 1 January 2020, the Wealth Management business has been managed alongside the Personal Finance business. Consequently, the Group has aligned the segmental reporting to align to this operational change and the Personal Finance segment has been renamed as Personal Finance and Wealth Management to reflect this change. The previous Wealth and Investments segment has been renamed to Old Mutual Investments, and the segment comprises the Asset Management, Alternatives and Specialised Finance businesses. Consequently, comparative information in notes B2 and B3 have been restated to reflect this change. This adjustment had no impact on total expenses, profit after tax for the period or net assets of the Group.
B2: Consolidated income statement for the year ended 31 December 2020
Consolidated
Rm
Mass andFoun‑
dationCluster
PersonalFinance
andWealth
Manage‑ment
OldMutualInvest‑ments
OldMutual
Corporate
OtherGroup
Activitiesand
inter‑company
eliminations
Consoli‑dation
of funds Total
Segment revenue
Gross earned premiums 12,443 15,929 – 28,673 (102) – 56,943
Outward reinsurance (38) (1,345) – (1,149) 100 – (2,432)
Net earned premiums 12,405 14,584 – 27,524 (2) – 54,511
Investment return 1,113 32,628 2,182 17,061 (6,645) (718) 45,621
Fee, commission and other income 88 6,787 430 371 (371) – 7,305
Other income 68 370 26 686 797 39 1,986
Segment expenses –
Claims and benefits (7,710) (21,013) (17) (38,729) 174 – (67,295)
Reinsurance recoveries 37 2,317 – 1,514 (93) – 3,775
Net claims incurred (including change in insurance contract liabilities) (7,673) (18,696) (17) (37,215) 81 – (63,520)
Change in investment contract liabilities 14 (17,345) (2,308) (2,577) (72) – (22,288)
Credit impairment charges (39) (200) – (372) – – (611)
Finance costs – – – – (331) – (331)
Commission and other acquisition costs (1,897) (3,739) (522) (445) 314 (241) (6,530)
Operating and administration expenses (3,052) (6,718) (48) (5,645) 1,044 (2,112) (16,531)
Change in third party interest in consolidated funds – – – – – 3,032 3,032
Segment Result 1,027 7,671 (257) (612) (5,185) – 2,644
Share of gains of associated undertakings and joint ventures after tax 1 1 – 7 529 – 538
Impairment of investments in associated undertakings – – – – (8,620) – (8,620)
Loss on disposal of subsidiaries and associated undertakings – – – – (2,964) – (2,964)
Profit/(loss) before tax 1,028 7,672 (257) (605) (16,240) – (8,402)
Total Inter-segments revenue included in total revenue is as follows: Mass and Foundation Cluster is R929 million (2019: R1,332 million), Personal Finance and Wealth Management is R11,388 million (2019: R16,394 million), Old Mutual Investments is R2,480 million (2019: R5,573 million), Old Mutual Corporate is R11,428 million (2019: R19,408 million) and Other Group Activities is R1,234 million (2019: (R10,556) million). The Group accounts for inter-segment revenues and transfers as if the transactions were with third parties.
A: Significant accounting policies
OMLACSA Separate and Consolidated Annual Financial Statements for the year ended 31 December 2020 OMLACSA Separate and Consolidated Annual Financial Statements for the year ended 31 December 202024 25OMLACSA Separate and Consolidated Annual Financial Statements for the year ended 31 December 2020OMLACSA Separate and Consolidated Annual Financial Statements for the year ended 31 December 2020
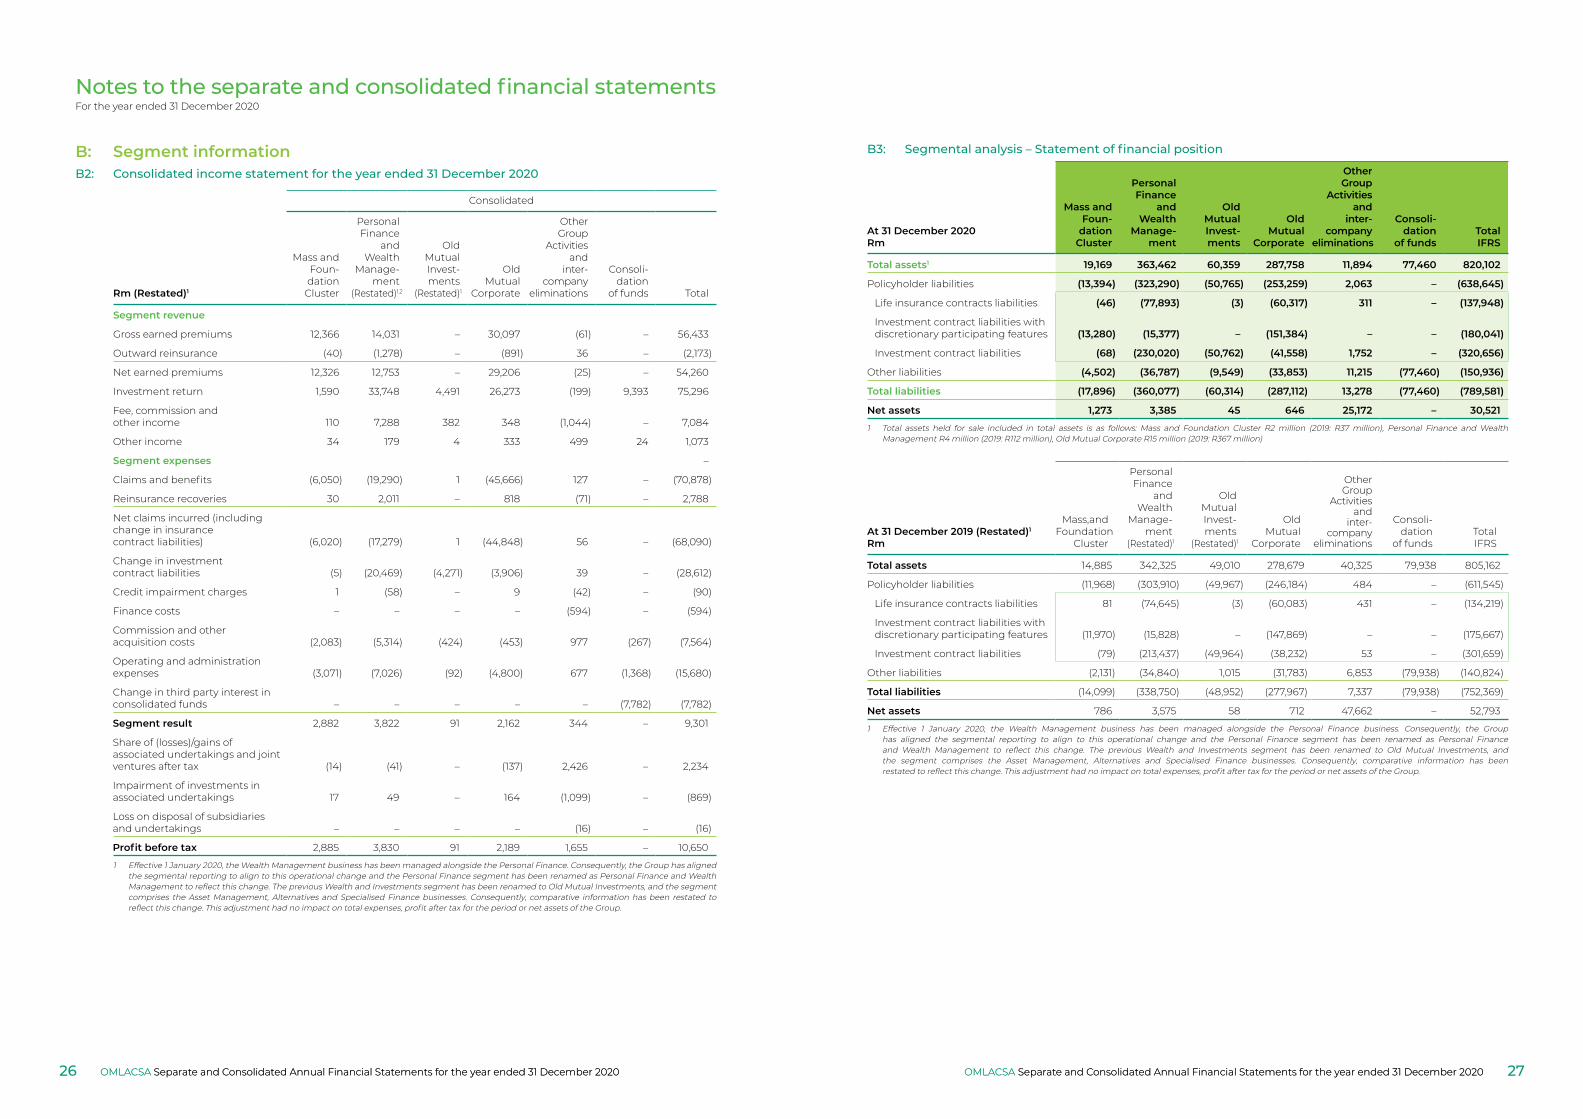
Notes to the separate and consolidated financial statementsFor the year ended 31 December 2020
B3: Segmental analysis – Statement of financial position
At 31 December 2020Rm
Mass andFoun‑
dationCluster
PersonalFinance
andWealth
Manage‑ment
OldMutualInvest‑ments
OldMutual
Corporate
OtherGroup
Activitiesand
inter‑company
eliminations
Consoli‑dation
of fundsTotalIFRS
Total assets1 19,169 363,462 60,359 287,758 11,894 77,460 820,102
Policyholder liabilities (13,394) (323,290) (50,765) (253,259) 2,063 – (638,645)
Life insurance contracts liabilities (46) (77,893) (3) (60,317) 311 – (137,948)
Investment contract liabilities with discretionary participating features (13,280) (15,377) – (151,384) – – (180,041)
Investment contract liabilities (68) (230,020) (50,762) (41,558) 1,752 – (320,656)
Other liabilities (4,502) (36,787) (9,549) (33,853) 11,215 (77,460) (150,936)
Total liabilities (17,896) (360,077) (60,314) (287,112) 13,278 (77,460) (789,581)
Net assets 1,273 3,385 45 646 25,172 – 30,521
1 Total assets held for sale included in total assets is as follows: Mass and Foundation Cluster R2 million (2019: R37 million), Personal Finance and Wealth Management R4 million (2019: R112 million), Old Mutual Corporate R15 million (2019: R367 million)
At 31 December 2019 (Restated)1
Rm
Mass,andFoundation
Cluster
PersonalFinance
andWealth
Manage-ment
(Restated)1
OldMutualInvest-ments
(Restated)1
OldMutual
Corporate
OtherGroup
Activitiesand
inter-company
eliminations
Consoli-dation
of fundsTotalIFRS
Total assets 14,885 342,325 49,010 278,679 40,325 79,938 805,162
Policyholder liabilities (11,968) (303,910) (49,967) (246,184) 484 – (611,545)
Life insurance contracts liabilities 81 (74,645) (3) (60,083) 431 – (134,219)
Investment contract liabilities with discretionary participating features (11,970) (15,828) – (147,869) – – (175,667)
Investment contract liabilities (79) (213,437) (49,964) (38,232) 53 – (301,659)
Other liabilities (2,131) (34,840) 1,015 (31,783) 6,853 (79,938) (140,824)
Total liabilities (14,099) (338,750) (48,952) (277,967) 7,337 (79,938) (752,369)
Net assets 786 3,575 58 712 47,662 – 52,793
1 Effective 1 January 2020, the Wealth Management business has been managed alongside the Personal Finance business. Consequently, the Group has aligned the segmental reporting to align to this operational change and the Personal Finance segment has been renamed as Personal Finance and Wealth Management to reflect this change. The previous Wealth and Investments segment has been renamed to Old Mutual Investments, and the segment comprises the Asset Management, Alternatives and Specialised Finance businesses. Consequently, comparative information has been restated to reflect this change. This adjustment had no impact on total expenses, profit after tax for the period or net assets of the Group.
B: Segment informationB2: Consolidated income statement for the year ended 31 December 2020
Consolidated
Rm (Restated)1
Mass andFoun-dation
Cluster
PersonalFinance
andWealth
Manage-ment
(Restated)1,2
OldMutualInvest-ments
(Restated)1
OldMutual
Corporate
OtherGroup
Activitiesand
inter-company
eliminations
Consoli-dation
of funds Total
Segment revenue
Gross earned premiums 12,366 14,031 – 30,097 (61) – 56,433
Outward reinsurance (40) (1,278) – (891) 36 – (2,173)
Net earned premiums 12,326 12,753 – 29,206 (25) – 54,260
Investment return 1,590 33,748 4,491 26,273 (199) 9,393 75,296
Fee, commission and other income 110 7,288 382 348 (1,044) – 7,084
Other income 34 179 4 333 499 24 1,073
Segment expenses –
Claims and benefits (6,050) (19,290) 1 (45,666) 127 – (70,878)
Reinsurance recoveries 30 2,011 – 818 (71) – 2,788
Net claims incurred (including change in insurance contract liabilities) (6,020) (17,279) 1 (44,848) 56 – (68,090)
Change in investment contract liabilities (5) (20,469) (4,271) (3,906) 39 – (28,612)
Credit impairment charges 1 (58) – 9 (42) – (90)
Finance costs – – – – (594) – (594)
Commission and other acquisition costs (2,083) (5,314) (424) (453) 977 (267) (7,564)
Operating and administration expenses (3,071) (7,026) (92) (4,800) 677 (1,368) (15,680)
Change in third party interest in consolidated funds – – – – – (7,782) (7,782)
Segment result 2,882 3,822 91 2,162 344 – 9,301
Share of (losses)/gains of associated undertakings and joint ventures after tax (14) (41) – (137) 2,426 – 2,234
Impairment of investments in associated undertakings 17 49 – 164 (1,099) – (869)
Loss on disposal of subsidiaries and undertakings – – – – (16) – (16)
Profit before tax 2,885 3,830 91 2,189 1,655 – 10,650
1 Effective 1 January 2020, the Wealth Management business has been managed alongside the Personal Finance. Consequently, the Group has aligned the segmental reporting to align to this operational change and the Personal Finance segment has been renamed as Personal Finance and Wealth Management to reflect this change. The previous Wealth and Investments segment has been renamed to Old Mutual Investments, and the segment comprises the Asset Management, Alternatives and Specialised Finance businesses. Consequently, comparative information has been restated to reflect this change. This adjustment had no impact on total expenses, profit after tax for the period or net assets of the Group.
OMLACSA Separate and Consolidated Annual Financial Statements for the year ended 31 December 2020 OMLACSA Separate and Consolidated Annual Financial Statements for the year ended 31 December 202026 27OMLACSA Separate and Consolidated Annual Financial Statements for the year ended 31 December 2020OMLACSA Separate and Consolidated Annual Financial Statements for the year ended 31 December 2020
Notes to the separate and consolidated financial statementsFor the year ended 31 December 2020
C: Separate and consolidated income statement notesAccounting policies
The Group provides financial services, such as insurance and asset management services to customers. Fees and commission from asset management services is accounted for as revenue from contracts with customers, while revenue from insurance contracts are accounted for in accordance with the accounting policies for gross insurance premium revenue (F2). Investment returns (fair value gains or losses, interest income and dividend income) earned on behalf of shareholders and customers are recognised in accordance with the accounting policies for financial instruments (note D).
Basic revenue recognition principle
The Group recognises revenue from contracts with customers based on the amount expected to be received from customers when the performance obligations agreed to by the Group have been satisfied. Performance obligations are satisfied through the transfer of the promised services to the customer. The Group transfers the promised service over time or at a point in time depending on the nature of the promised services. In the majority of instances, the performance obligations are satisfied as the Group renders the agreed financial services to our customers over time.
Asset management
Revenue from asset management consists of asset management fees, performance fees and administration fees. Fees are recognised as revenue over time as the Group provides the services. When the Group receives up-front payments for services to be rendered in the future, the payments are accounted for as contract liabilities (deferred revenue liabilities).
If the amount of the fee can be reliably estimated, the Group recognises revenue over time as the services are rendered. If the fee cannot be reliably estimated, the recognition of fees based variables are delayed until significant uncertainty regarding the Group’s entitlement to the fee and the measurement of the fee have been resolved.
Fee and commission income is earned through providing asset management and related investment administration services to our customers.
Fee and commission income is primarily based on funds-under-management and investment commitment values. Fee and commission income is generally recognised over time, on a monthly basis, as the services are rendered. Fee and commission income earned from collective investment schemes is recognised over time, on a daily basis, as the services are rendered.
Fee and commission income is generally realised during the first work week of the month succeeding the period of service. In some instances, fee and commission income is realised between 30 and 45 days in arrears or as agreed with customers. Fee and commission income is realised through a reduction from client’s investment portfolio or through a separate invoice and collection process.
In some instances, an initial fee is charged to our clients when entering into an investment agreement with the Group. The initial fee is collected as a reduction from the initial amount invested with the Group or through a separate payment made by the client. Initial fees, which exceed the level of recurring fees and relate to the future provision of services are deferred and amortised over periods between five and 10 years as the services are rendered.
The Group earns transaction fees from assisting customers with specific transactions on their portfolios. These fees are recognised when the transaction has been completed and are realised through a reduction in the client portfolio.
The Group earns a performance fee if certain performance thresholds and other criteria are met. The performance fee is deducted from the portfolio or is invoiced separately as per the terms of the contract.
The rate that the fee and commission income is charged at is agreed with customers in investment mandates.
Contract assets and contract liabilities
A contract asset exists if the Group has recognised revenue, but the amount expected to be received is not yet due from the customer. Contract assets are measured at the amount of revenue recognised.
A contract liability (deferred revenue liability) exists if the Group has received or is entitled to consideration in advance of the Group satisfying the performance obligation. The contract liability represents the obligation to provide the agreed services to the customer. The contract liability is recognised as revenue as the Group satisfies the related performance obligation to the customer.
Costs incurred in acquiring investment management service contracts
Incremental costs that are directly attributable to securing an investment management service contract are recognised as assets if the costs can be identified separately, measured reliably and it is probable that the costs will be recovered.
Deferred acquisition costs represent the contractual right to benefit from providing investment management services and are amortised as the related revenue is recognised.
C1: Income tax expense
Current tax
Included within the tax charge are charges relating to:
• Current and deferred income tax
• Taxes payable on behalf of policyholders
• Withholding tax
Current tax is the expected tax payable on the taxable income for the year, using tax rates enacted or substantively enacted at the reporting date, and any adjustment to tax payable in respect of previous years. The Group is subject to income taxes in numerous jurisdictions and the calculation of the Group’s tax charge and provisions for income tax necessarily involves a degree of estimation and judgement. At any given time the Group typically has a number of open tax returns with various tax authorities and engages in active dialogue to resolve this. Taxation provisions relating to these open items are recognised based on the Group’s estimate of the most likely outcome, after taking into account external advice where appropriate. Where the final tax outcome of these matters is different from the amounts that were initially recorded, such differences will impact profit or loss, current and deferred income tax assets and liabilities in the period such determination is made.
Deferred tax
Deferred tax is recognised in respect of temporary differences between the carrying amounts of assets and liabilities for financial reporting purposes and the amounts used for taxation purposes. The amount of deferred tax provided is based on the expected manner of realisation or settlement of the carrying amount of assets and liabilities using tax rates enacted or substantively enacted at the reporting date. Deferred tax assets are recognised for tax losses carried forward only to the extent that realisation of the related tax benefit is probable, where on the basis of all available evidence, it is considered more likely than not that there will be suitable taxable profits against which the reversal of the deferred tax asset can be deducted. In certain circumstances, as permitted by accounting guidance, deferred tax balances are not recognised. In particular, where the liability relates to the initial recognition of goodwill, or transactions that are not a business combination and at the time of their occurrence affect neither accounting nor taxable profits.
Significant accounting estimate and judgements – uncertain tax positions
The Group is committed to conducting its tax affairs in accordance with the tax legislation of the jurisdictions in which the Group operates. All interpretations by management, are made with reference to the specific facts and circumstances of the transaction and in the context of relevant legislation, practice and directives.
Business and tax law complexity may result in the Group entering into transactions that expose the Group to tax, legal and business risks. The Group exercises judgement to determine whether the ultimate treatment of a transaction or matter is uncertain. This judgement is dependent on the facts and circumstances that exist at the time of assessment. The Revenue authorities in various jurisdictions in which the Group operates routinely review historic transactions undertaken and tax law interpretations made by the Group.
There are occasions where the Group’s interpretation of tax law may be challenged by the Revenue authorities. The financial statements include provisions that reflect the Group’s assessment of liabilities which might reasonably be expected to materialise as part of their review.
The Group is satisfied that adequate provisions have been made to cater for the resolution of uncertain tax matters and that the resources required to fund such potential settlements, where necessary, are sufficient. Due to the level of estimation required in determining tax provisions amounts eventually payable may differ from the provision recognised.
IFRIC 23 Uncertainty over Income Tax Treatments
The Group records and evaluate tax positions in terms of IFRIC 23 – Uncertainty over Income Tax Treatments, IAS 37 – Provisions, Contingent Liabilities and Contingent Assets and IAS 12 – Income Taxes, which sets out how to determine the accounting tax position, when there is uncertainty over income tax treatments. Uncertain tax positions are based on the most likely outcome of the liability based on a probability weighted average approach and scenario analysis. Where applicable, the impact of IFRIC 23 on the respective legal entities in the Group have been considered and adequate amounts provided..
OMLACSA Separate and Consolidated Annual Financial Statements for the year ended 31 December 2020 OMLACSA Separate and Consolidated Annual Financial Statements for the year ended 31 December 202028 29OMLACSA Separate and Consolidated Annual Financial Statements for the year ended 31 December 2020OMLACSA Separate and Consolidated Annual Financial Statements for the year ended 31 December 2020
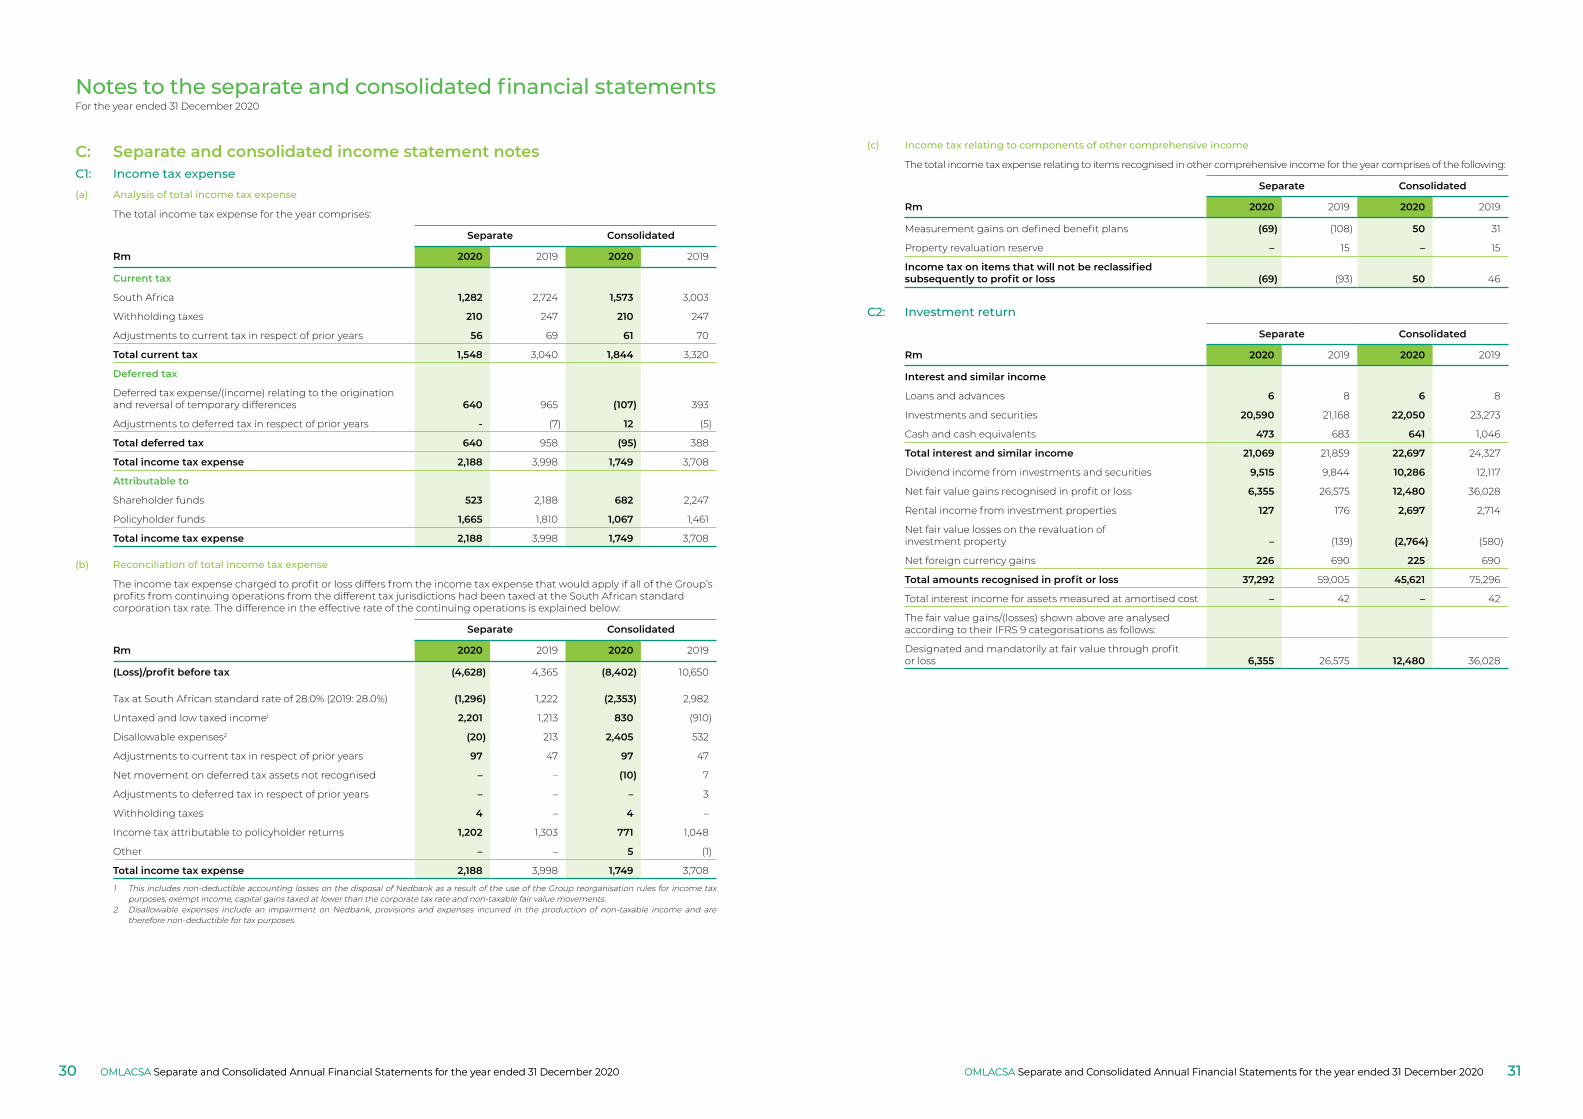
Notes to the separate and consolidated financial statementsFor the year ended 31 December 2020
(a) Analysis of total income tax expense
The total income tax expense for the year comprises:
Separate Consolidated
Rm 2020 2019 2020 2019
Current tax
South Africa 1,282 2,724 1,573 3,003
Withholding taxes 210 247 210 247
Adjustments to current tax in respect of prior years 56 69 61 70
Total current tax 1,548 3,040 1,844 3,320
Deferred tax
Deferred tax expense/(income) relating to the origination and reversal of temporary differences 640 965 (107) 393
Adjustments to deferred tax in respect of prior years ‑ (7) 12 (5)
Total deferred tax 640 958 (95) 388
Total income tax expense 2,188 3,998 1,749 3,708
Attributable to
Shareholder funds 523 2,188 682 2,247
Policyholder funds 1,665 1,810 1,067 1,461
Total income tax expense 2,188 3,998 1,749 3,708
(b) Reconciliation of total income tax expense
The income tax expense charged to profit or loss differs from the income tax expense that would apply if all of the Group’s profits from continuing operations from the different tax jurisdictions had been taxed at the South African standard corporation tax rate. The difference in the effective rate of the continuing operations is explained below:
Separate Consolidated
Rm 2020 2019 2020 2019
(Loss)/profit before tax (4,628) 4,365 (8,402) 10,650
Tax at South African standard rate of 28.0% (2019: 28.0%) (1,296) 1,222 (2,353) 2,982
Untaxed and low taxed income1 2,201 1,213 830 (910)
Disallowable expenses2 (20) 213 2,405 532
Adjustments to current tax in respect of prior years 97 47 97 47
Net movement on deferred tax assets not recognised – – (10) 7
Adjustments to deferred tax in respect of prior years – – – 3
Withholding taxes 4 – 4 –
Income tax attributable to policyholder returns 1,202 1,303 771 1,048
Other – – 5 (1)
Total income tax expense 2,188 3,998 1,749 3,708
1 This includes non-deductible accounting losses on the disposal of Nedbank as a result of the use of the Group reorganisation rules for income tax purposes, exempt income, capital gains taxed at lower than the corporate tax rate and non-taxable fair value movements.
2. Disallowable expenses include an impairment on Nedbank, provisions and expenses incurred in the production of non-taxable income and are therefore non-deductible for tax purposes.
(c) Income tax relating to components of other comprehensive income
The total income tax expense relating to items recognised in other comprehensive income for the year comprises of the following:
Separate Consolidated
Rm 2020 2019 2020 2019
Measurement gains on defined benefit plans (69) (108) 50 31
Property revaluation reserve – 15 – 15
Income tax on items that will not be reclassified subsequently to profit or loss (69) (93) 50 46
C2: Investment return
Separate Consolidated
Rm 2020 2019 2020 2019
Interest and similar income
Loans and advances 6 8 6 8
Investments and securities 20,590 21,168 22,050 23,273
Cash and cash equivalents 473 683 641 1,046
Total interest and similar income 21,069 21,859 22,697 24,327
Dividend income from investments and securities 9,515 9,844 10,286 12,117
Net fair value gains recognised in profit or loss 6,355 26,575 12,480 36,028
Rental income from investment properties 127 176 2,697 2,714
Net fair value losses on the revaluation of investment property – (139) (2,764) (580)
Net foreign currency gains 226 690 225 690
Total amounts recognised in profit or loss 37,292 59,005 45,621 75,296
Total interest income for assets measured at amortised cost – 42 – 42
The fair value gains/(losses) shown above are analysed according to their IFRS 9 categorisations as follows:
Designated and mandatorily at fair value through profit or loss 6,355 26,575 12,480 36,028
C: Separate and consolidated income statement notesC1: Income tax expense
OMLACSA Separate and Consolidated Annual Financial Statements for the year ended 31 December 2020 OMLACSA Separate and Consolidated Annual Financial Statements for the year ended 31 December 202030 31OMLACSA Separate and Consolidated Annual Financial Statements for the year ended 31 December 2020OMLACSA Separate and Consolidated Annual Financial Statements for the year ended 31 December 2020
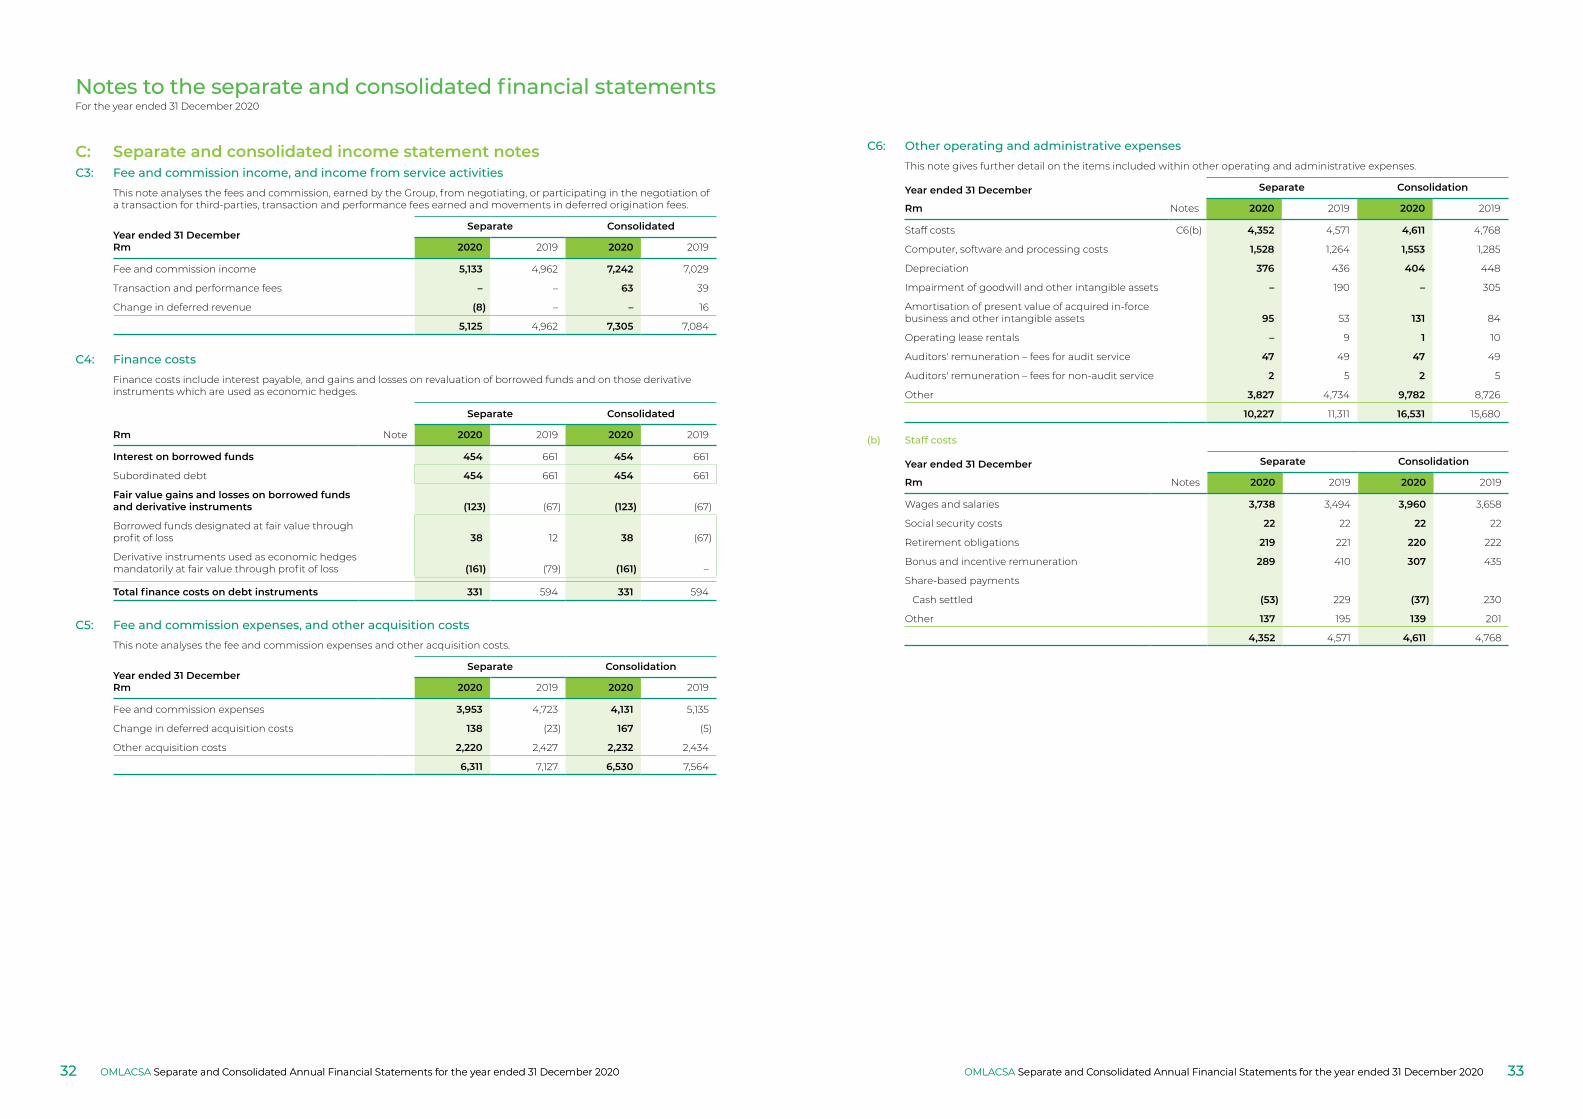
Notes to the separate and consolidated financial statementsFor the year ended 31 December 2020
C3: Fee and commission income, and income from service activitiesThis note analyses the fees and commission, earned by the Group, from negotiating, or participating in the negotiation of a transaction for third-parties, transaction and performance fees earned and movements in deferred origination fees.
Year ended 31 DecemberRm
Separate Consolidated
2020 2019 2020 2019
Fee and commission income 5,133 4,962 7,242 7,029
Transaction and performance fees – – 63 39
Change in deferred revenue (8) – – 16
5,125 4,962 7,305 7,084
C4: Finance costsFinance costs include interest payable, and gains and losses on revaluation of borrowed funds and on those derivative instruments which are used as economic hedges.
Separate Consolidated
Rm Note 2020 2019 2020 2019
Interest on borrowed funds 454 661 454 661
Subordinated debt 454 661 454 661
Fair value gains and losses on borrowed funds and derivative instruments (123) (67) (123) (67)
Borrowed funds designated at fair value through profit of loss 38 12 38 (67)
Derivative instruments used as economic hedges mandatorily at fair value through profit of loss (161) (79) (161) –
Total finance costs on debt instruments 331 594 331 594
C5: Fee and commission expenses, and other acquisition costsThis note analyses the fee and commission expenses and other acquisition costs.
Year ended 31 DecemberRm
Separate Consolidation
2020 2019 2020 2019
Fee and commission expenses 3,953 4,723 4,131 5,135
Change in deferred acquisition costs 138 (23) 167 (5)
Other acquisition costs 2,220 2,427 2,232 2,434
6,311 7,127 6,530 7,564
C6: Other operating and administrative expensesThis note gives further detail on the items included within other operating and administrative expenses.
Year ended 31 December Separate Consolidation
Rm Notes 2020 2019 2020 2019
Staff costs C6(b) 4,352 4,571 4,611 4,768
Computer, software and processing costs 1,528 1,264 1,553 1,285
Depreciation 376 436 404 448
Impairment of goodwill and other intangible assets – 190 – 305
Amortisation of present value of acquired in-force business and other intangible assets 95 53 131 84
Operating lease rentals – 9 1 10
Auditors' remuneration – fees for audit service 47 49 47 49
Auditors' remuneration – fees for non-audit service 2 5 2 5
Other 3,827 4,734 9,782 8,726
10,227 11,311 16,531 15,680
(b) Staff costs
Year ended 31 December Separate Consolidation
Rm Notes 2020 2019 2020 2019
Wages and salaries 3,738 3,494 3,960 3,658
Social security costs 22 22 22 22
Retirement obligations 219 221 220 222
Bonus and incentive remuneration 289 410 307 435
Share-based payments
Cash settled (53) 229 (37) 230
Other 137 195 139 201
4,352 4,571 4,611 4,768
C: Separate and consolidated income statement notes
OMLACSA Separate and Consolidated Annual Financial Statements for the year ended 31 December 2020 OMLACSA Separate and Consolidated Annual Financial Statements for the year ended 31 December 202032 33OMLACSA Separate and Consolidated Annual Financial Statements for the year ended 31 December 2020OMLACSA Separate and Consolidated Annual Financial Statements for the year ended 31 December 2020
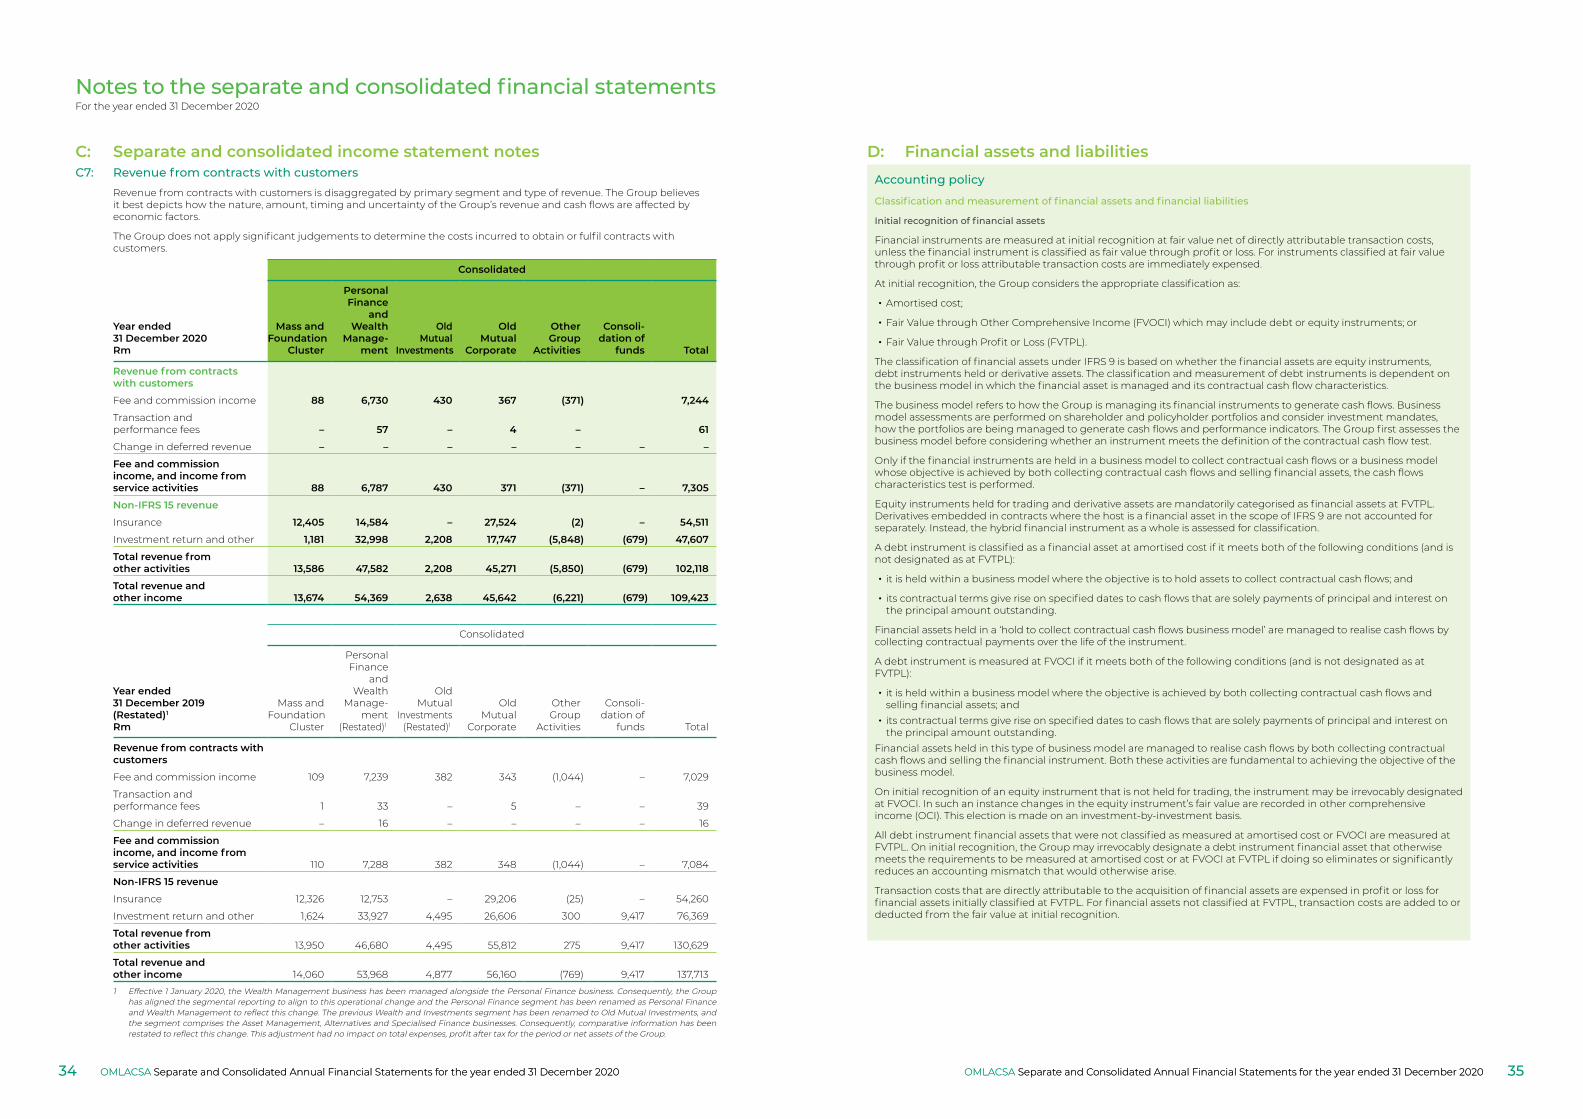
Notes to the separate and consolidated financial statementsFor the year ended 31 December 2020
C7: Revenue from contracts with customersRevenue from contracts with customers is disaggregated by primary segment and type of revenue. The Group believes it best depicts how the nature, amount, timing and uncertainty of the Group’s revenue and cash flows are affected by economic factors.
The Group does not apply significant judgements to determine the costs incurred to obtain or fulfil contracts with customers.
Consolidated
Year ended31 December 2020Rm
Mass andFoundation
Cluster
PersonalFinance
andWealth
Manage‑ment
OldMutual
Investments
OldMutual
Corporate
OtherGroup
Activities
Consoli‑dation of
funds Total
Revenue from contracts with customers
Fee and commission income 88 6,730 430 367 (371) 7,244
Transaction and performance fees – 57 – 4 – 61
Change in deferred revenue – – – – – – –
Fee and commission income, and income from service activities 88 6,787 430 371 (371) – 7,305
Non‑IFRS 15 revenue
Insurance 12,405 14,584 – 27,524 (2) – 54,511
Investment return and other 1,181 32,998 2,208 17,747 (5,848) (679) 47,607
Total revenue from other activities 13,586 47,582 2,208 45,271 (5,850) (679) 102,118
Total revenue and other income 13,674 54,369 2,638 45,642 (6,221) (679) 109,423
Consolidated
Year ended31 December 2019(Restated)1
Rm
Mass andFoundation
Cluster
PersonalFinance
andWealth
Manage-ment
(Restated)1
OldMutual
Investments(Restated)1
OldMutual
Corporate
OtherGroup
Activities
Consoli-dation of
funds Total
Revenue from contracts with customers
Fee and commission income 109 7,239 382 343 (1,044) – 7,029
Transaction and performance fees 1 33 – 5 – – 39
Change in deferred revenue – 16 – – – – 16
Fee and commission income, and income from service activities 110 7,288 382 348 (1,044) – 7,084
Non‑IFRS 15 revenue
Insurance 12,326 12,753 – 29,206 (25) – 54,260
Investment return and other 1,624 33,927 4,495 26,606 300 9,417 76,369
Total revenue from other activities 13,950 46,680 4,495 55,812 275 9,417 130,629
Total revenue and other income 14,060 53,968 4,877 56,160 (769) 9,417 137,713
1 Effective 1 January 2020, the Wealth Management business has been managed alongside the Personal Finance business. Consequently, the Group has aligned the segmental reporting to align to this operational change and the Personal Finance segment has been renamed as Personal Finance and Wealth Management to reflect this change. The previous Wealth and Investments segment has been renamed to Old Mutual Investments, and the segment comprises the Asset Management, Alternatives and Specialised Finance businesses. Consequently, comparative information has been restated to reflect this change. This adjustment had no impact on total expenses, profit after tax for the period or net assets of the Group.
D: Financial assets and liabilities
Accounting policy
Classification and measurement of financial assets and financial liabilities
Initial recognition of financial assets
Financial instruments are measured at initial recognition at fair value net of directly attributable transaction costs, unless the financial instrument is classified as fair value through profit or loss. For instruments classified at fair value through profit or loss attributable transaction costs are immediately expensed.
At initial recognition, the Group considers the appropriate classification as:
• Amortised cost;
• Fair Value through Other Comprehensive Income (FVOCI) which may include debt or equity instruments; or
• Fair Value through Profit or Loss (FVTPL).
The classification of financial assets under IFRS 9 is based on whether the financial assets are equity instruments, debt instruments held or derivative assets. The classification and measurement of debt instruments is dependent on the business model in which the financial asset is managed and its contractual cash flow characteristics.
The business model refers to how the Group is managing its financial instruments to generate cash flows. Business model assessments are performed on shareholder and policyholder portfolios and consider investment mandates, how the portfolios are being managed to generate cash flows and performance indicators. The Group first assesses the business model before considering whether an instrument meets the definition of the contractual cash flow test.
Only if the financial instruments are held in a business model to collect contractual cash flows or a business model whose objective is achieved by both collecting contractual cash flows and selling financial assets, the cash flows characteristics test is performed.
Equity instruments held for trading and derivative assets are mandatorily categorised as financial assets at FVTPL. Derivatives embedded in contracts where the host is a financial asset in the scope of IFRS 9 are not accounted for separately. Instead, the hybrid financial instrument as a whole is assessed for classification.
A debt instrument is classified as a financial asset at amortised cost if it meets both of the following conditions (and is not designated as at FVTPL):
• it is held within a business model where the objective is to hold assets to collect contractual cash flows; and
• its contractual terms give rise on specified dates to cash flows that are solely payments of principal and interest on the principal amount outstanding.
Financial assets held in a ‘hold to collect contractual cash flows business model’ are managed to realise cash flows by collecting contractual payments over the life of the instrument.
A debt instrument is measured at FVOCI if it meets both of the following conditions (and is not designated as at FVTPL):
• it is held within a business model where the objective is achieved by both collecting contractual cash flows and selling financial assets; and
• its contractual terms give rise on specified dates to cash flows that are solely payments of principal and interest on the principal amount outstanding.
Financial assets held in this type of business model are managed to realise cash flows by both collecting contractual cash flows and selling the financial instrument. Both these activities are fundamental to achieving the objective of the business model.
On initial recognition of an equity instrument that is not held for trading, the instrument may be irrevocably designated at FVOCI. In such an instance changes in the equity instrument’s fair value are recorded in other comprehensive income (OCI). This election is made on an investment-by-investment basis.
All debt instrument financial assets that were not classified as measured at amortised cost or FVOCI are measured at FVTPL. On initial recognition, the Group may irrevocably designate a debt instrument financial asset that otherwise meets the requirements to be measured at amortised cost or at FVOCI at FVTPL if doing so eliminates or significantly reduces an accounting mismatch that would otherwise arise.
Transaction costs that are directly attributable to the acquisition of financial assets are expensed in profit or loss for financial assets initially classified at FVTPL. For financial assets not classified at FVTPL, transaction costs are added to or deducted from the fair value at initial recognition.
C: Separate and consolidated income statement notes
OMLACSA Separate and Consolidated Annual Financial Statements for the year ended 31 December 2020 OMLACSA Separate and Consolidated Annual Financial Statements for the year ended 31 December 202034 35OMLACSA Separate and Consolidated Annual Financial Statements for the year ended 31 December 2020OMLACSA Separate and Consolidated Annual Financial Statements for the year ended 31 December 2020
Notes to the separate and consolidated financial statementsFor the year ended 31 December 2020
Accounting policy
Subsequent measurement of financial assets
The following accounting policies apply to the subsequent measurement of financial assets.
Financial assets at FVTPL These assets are subsequently measured at fair value. Net gains and losses, including any interest or dividend income, are recognised in profit or loss.
Financial assets at amortised cost
These assets are subsequently measured at amortised cost using the effective interest method. The amortised cost is reduced by impairment losses. Interest income, foreign exchange gains and losses and impairment are recognised in profit or loss. Any gain or loss on derecognition is recognised in profit or loss.
Debt investments at FVOCI These assets are subsequently measured at fair value. Interest income calculated using the effective interest method, foreign exchange gains and losses and impairment are recognised in profit or loss. Other net gains and losses are recognised in OCI. On derecognition, gains and losses accumulated in OCI are reclassified to profit or loss.
Derecognition of financial assets
The Group derecognises a financial asset when:
• the contractual rights to the cash flows from the financial asset expire; or• it transfers the rights to receive the contractual cash flows in a transaction in which either:
› substantially all of the risks and rewards of ownership of the financial asset are transferred; or › the Group neither transfers nor retains substantially all of the risks and rewards of ownership and it does not
retain control of the financial asset.The Group enters into transactions whereby it transfers assets recognised in its statement of financial position, but retains either all or substantially all of the risks and rewards of the transferred assets. In these cases, the transferred assets are not derecognised.
Initial recognition of financial liabilities
Financial liabilities not measured at FVTPL on initial recognition are measured at fair value less transaction costs that are incremental and directly attributable to the issue of the financial liability. Transaction costs of financial liabilities carried at FVTPL are expensed in profit or loss.
Subsequent measurement of financial liabilities
Fair value movements attributable to changes in the credit risk of a financial liability designated at FVTPL are recorded in other comprehensive income and not recycled to profit or loss. On derecognition of the financial liability, the amount included in other
Financial liabilities at amortised cost
These liabilities are subsequently measured at amortised cost using the effective interest method. Interest expense and foreign currency exchange gains and losses are recognised in profit or loss. Any gain or loss on derecognition is recognised in profit or loss.
Financial liabilities at fair value through profit or loss
These liabilities are subsequently measured at fair value. Net fair value gains and losses, including any interest expense are recognised in profit or loss.
Financial guarantee contracts Financial guarantee contracts are subsequently measured at the higher of the expected credit loss allowance and the amount initially recognised, less cumulative income recognised to date.
Derecognition of financial liabilities
The Group derecognises a financial liability when its contractual obligations are discharged or cancelled, or expire. The Group also derecognises a financial liability when its terms are modified and the cash flows of the modified liability are substantially different, in which case a new financial liability based on the modified terms is recognised at fair value.
On derecognition of a financial liability, the difference between the carrying amount extinguished and the consideration paid (including any non-cash assets transferred or liabilities assumed) is recognised in profit or loss.
D: Financial assets and liabilities Accounting policy
Expected credit losses
The expected credit loss (ECL) model applies to financial assets measured at amortised cost (for example mandatory reserve deposits with central banks, trade and other receivables, cash and cash equivalents and debt securities held by the Group) and debt investments measured at FVOCI.
The ECL impairment loss allowance is an unbiased, probability-weighted amount determined by evaluating a range of possible outcomes that reflects reasonable and supportable information that is available without undue cost or effort of past events, current conditions and forecasts of forward-looking economic conditions.
The Group has elected to apply the IFRS 9 simplified approach in measuring expected credit losses for all trade receivables, contract assets and lease receivables. In terms of the simplified approach the ECL provision is calculated using lifetime expected credit losses. The Group made use of the provision matrix to calculate the lifetime expected loss allowance.
The Group elected to make use of the low credit risk exemption and consequently financial assets that are deemed of low credit risk are automatically allocated to stage 1 of the expected credit loss model. The consequence of this simplification is that entities are not required to assess whether a significant increase in credit risk since origination took place on these assets. At every reporting date the Group assesses whether the low credit risk exemption can still be applied to the relevant financial instruments. A financial instrument is considered to qualify for the low credit risk exemption if it has a credit rating equivalent to ‘investment grade’ quality assets.
ECLs on financial assets that are not credit-impaired at the reporting date are measured as the present value of all cash shortfalls (i.e. the difference between the cash flows due to the Group in accordance with the contract and the cash flows that the Group expects to receive). ECLs are discounted at the effective interest rate of the financial asset. ECLs on financial assets that are credit-impaired at the reporting date are measured as the difference between the gross carrying amount and the present value of estimated future cash flows
For presentation on the statement of financial position, the ECL allowances are deducted from the gross carrying amount of the assets as disclosed. ECLs are presented separately in the consolidated income statement.
The analysis of financial assets and liabilities of the Group’s continuing businesses into their categories as defined in IFRS 9 is set out in the tables below. Assets and liabilities of a non-financial nature, or financial assets and liabilities that are specifically excluded from the scope of IFRS 9, are reflected in the non-financial assets and liabilities category.
OMLACSA Separate and Consolidated Annual Financial Statements for the year ended 31 December 2020 OMLACSA Separate and Consolidated Annual Financial Statements for the year ended 31 December 202036 37OMLACSA Separate and Consolidated Annual Financial Statements for the year ended 31 December 2020OMLACSA Separate and Consolidated Annual Financial Statements for the year ended 31 December 2020
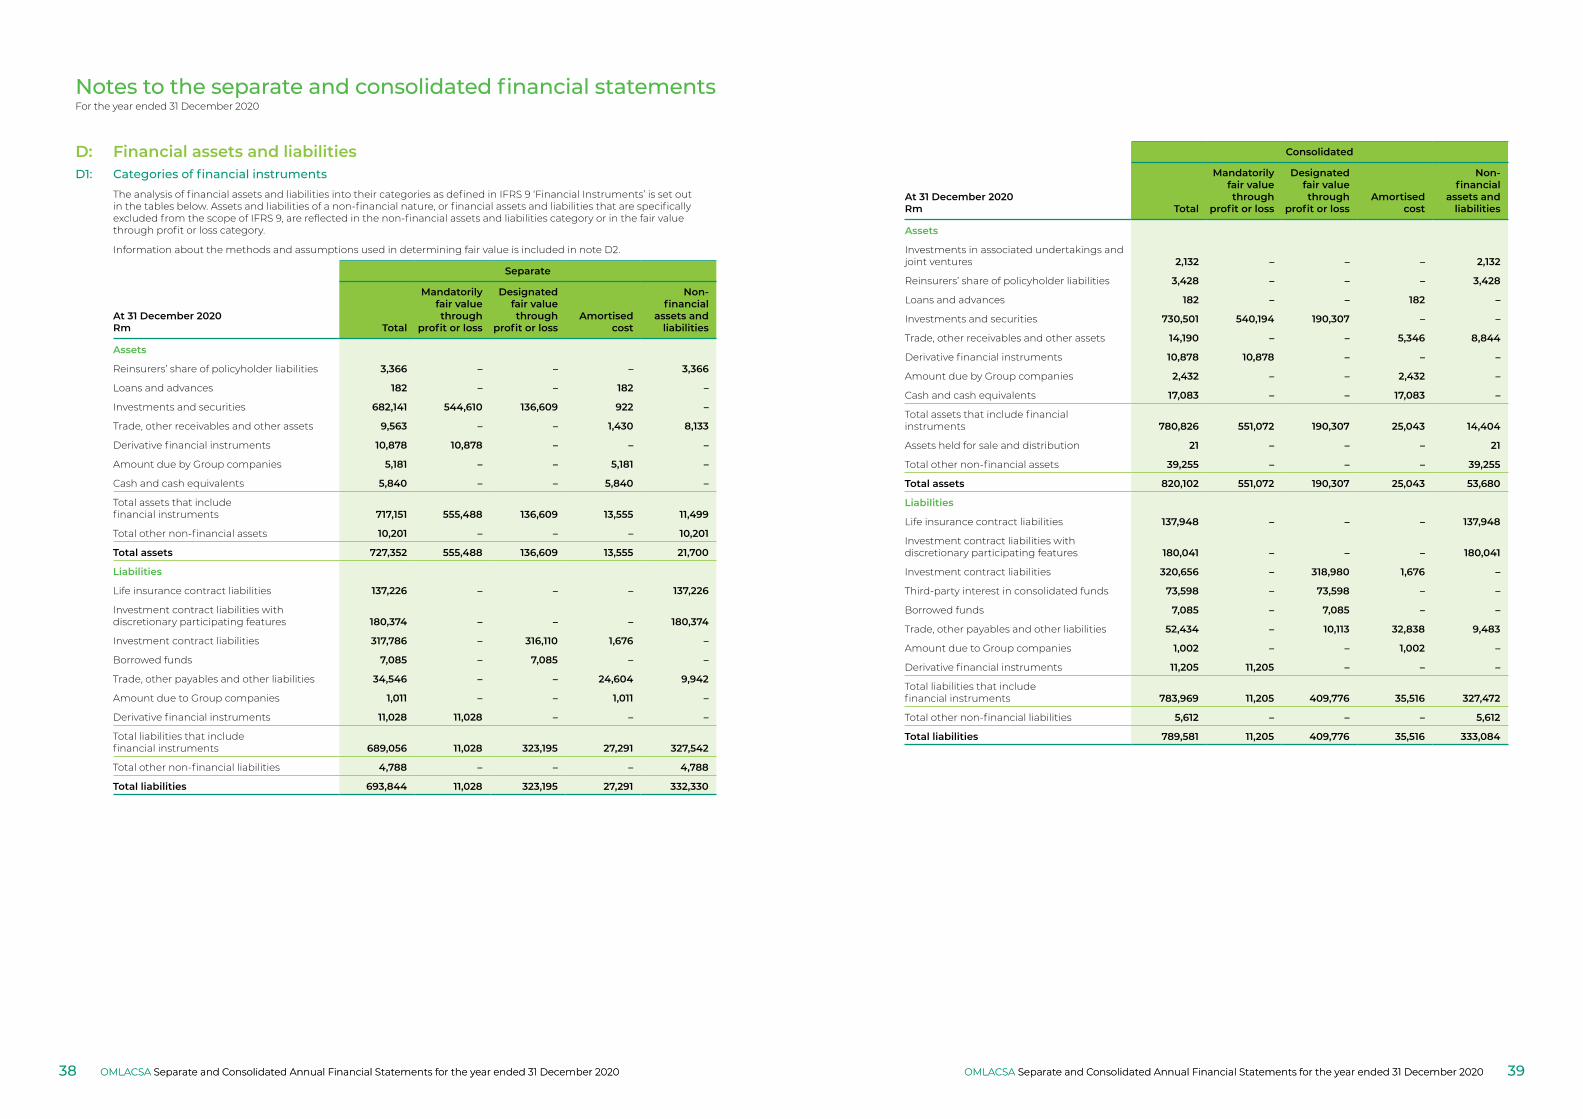
Notes to the separate and consolidated financial statementsFor the year ended 31 December 2020
D1: Categories of financial instrumentsThe analysis of financial assets and liabilities into their categories as defined in IFRS 9 ‘Financial Instruments’ is set out in the tables below. Assets and liabilities of a non-financial nature, or financial assets and liabilities that are specifically excluded from the scope of IFRS 9, are reflected in the non-financial assets and liabilities category or in the fair value through profit or loss category.
Information about the methods and assumptions used in determining fair value is included in note D2.
Separate
At 31 December 2020Rm Total
Mandatorilyfair valuethrough
profit or loss
Designatedfair valuethrough
profit or lossAmortised
cost
Non‑financial
assets andliabilities
Assets
Reinsurers’ share of policyholder liabilities 3,366 – – – 3,366
Loans and advances 182 – – 182 –
Investments and securities 682,141 544,610 136,609 922 –
Trade, other receivables and other assets 9,563 – – 1,430 8,133
Derivative financial instruments 10,878 10,878 – – –
Amount due by Group companies 5,181 – – 5,181 –
Cash and cash equivalents 5,840 – – 5,840 –
Total assets that include financial instruments 717,151 555,488 136,609 13,555 11,499
Total other non-financial assets 10,201 – – – 10,201
Total assets 727,352 555,488 136,609 13,555 21,700
Liabilities
Life insurance contract liabilities 137,226 – – – 137,226
Investment contract liabilities with discretionary participating features 180,374 – – – 180,374
Investment contract liabilities 317,786 – 316,110 1,676 –
Borrowed funds 7,085 – 7,085 – –
Trade, other payables and other liabilities 34,546 – – 24,604 9,942
Amount due to Group companies 1,011 – – 1,011 –
Derivative financial instruments 11,028 11,028 – – –
Total liabilities that include financial instruments 689,056 11,028 323,195 27,291 327,542
Total other non-financial liabilities 4,788 – – – 4,788
Total liabilities 693,844 11,028 323,195 27,291 332,330
Consolidated
At 31 December 2020Rm Total
Mandatorilyfair valuethrough
profit or loss
Designatedfair valuethrough
profit or lossAmortised
cost
Non‑financial
assets andliabilities
Assets
Investments in associated undertakings and joint ventures 2,132 – – – 2,132
Reinsurers’ share of policyholder liabilities 3,428 – – – 3,428
Loans and advances 182 – – 182 –
Investments and securities 730,501 540,194 190,307 – –
Trade, other receivables and other assets 14,190 – – 5,346 8,844
Derivative financial instruments 10,878 10,878 – – –
Amount due by Group companies 2,432 – – 2,432 –
Cash and cash equivalents 17,083 – – 17,083 –
Total assets that include financial instruments 780,826 551,072 190,307 25,043 14,404
Assets held for sale and distribution 21 – – – 21
Total other non-financial assets 39,255 – – – 39,255
Total assets 820,102 551,072 190,307 25,043 53,680
Liabilities
Life insurance contract liabilities 137,948 – – – 137,948
Investment contract liabilities with discretionary participating features 180,041 – – – 180,041
Investment contract liabilities 320,656 – 318,980 1,676 –
Third-party interest in consolidated funds 73,598 – 73,598 – –
Borrowed funds 7,085 – 7,085 – –
Trade, other payables and other liabilities 52,434 – 10,113 32,838 9,483
Amount due to Group companies 1,002 – – 1,002 –
Derivative financial instruments 11,205 11,205 – – –
Total liabilities that include financial instruments 783,969 11,205 409,776 35,516 327,472
Total other non-financial liabilities 5,612 – – – 5,612
Total liabilities 789,581 11,205 409,776 35,516 333,084
D: Financial assets and liabilities
OMLACSA Separate and Consolidated Annual Financial Statements for the year ended 31 December 2020 OMLACSA Separate and Consolidated Annual Financial Statements for the year ended 31 December 202038 39OMLACSA Separate and Consolidated Annual Financial Statements for the year ended 31 December 2020OMLACSA Separate and Consolidated Annual Financial Statements for the year ended 31 December 2020
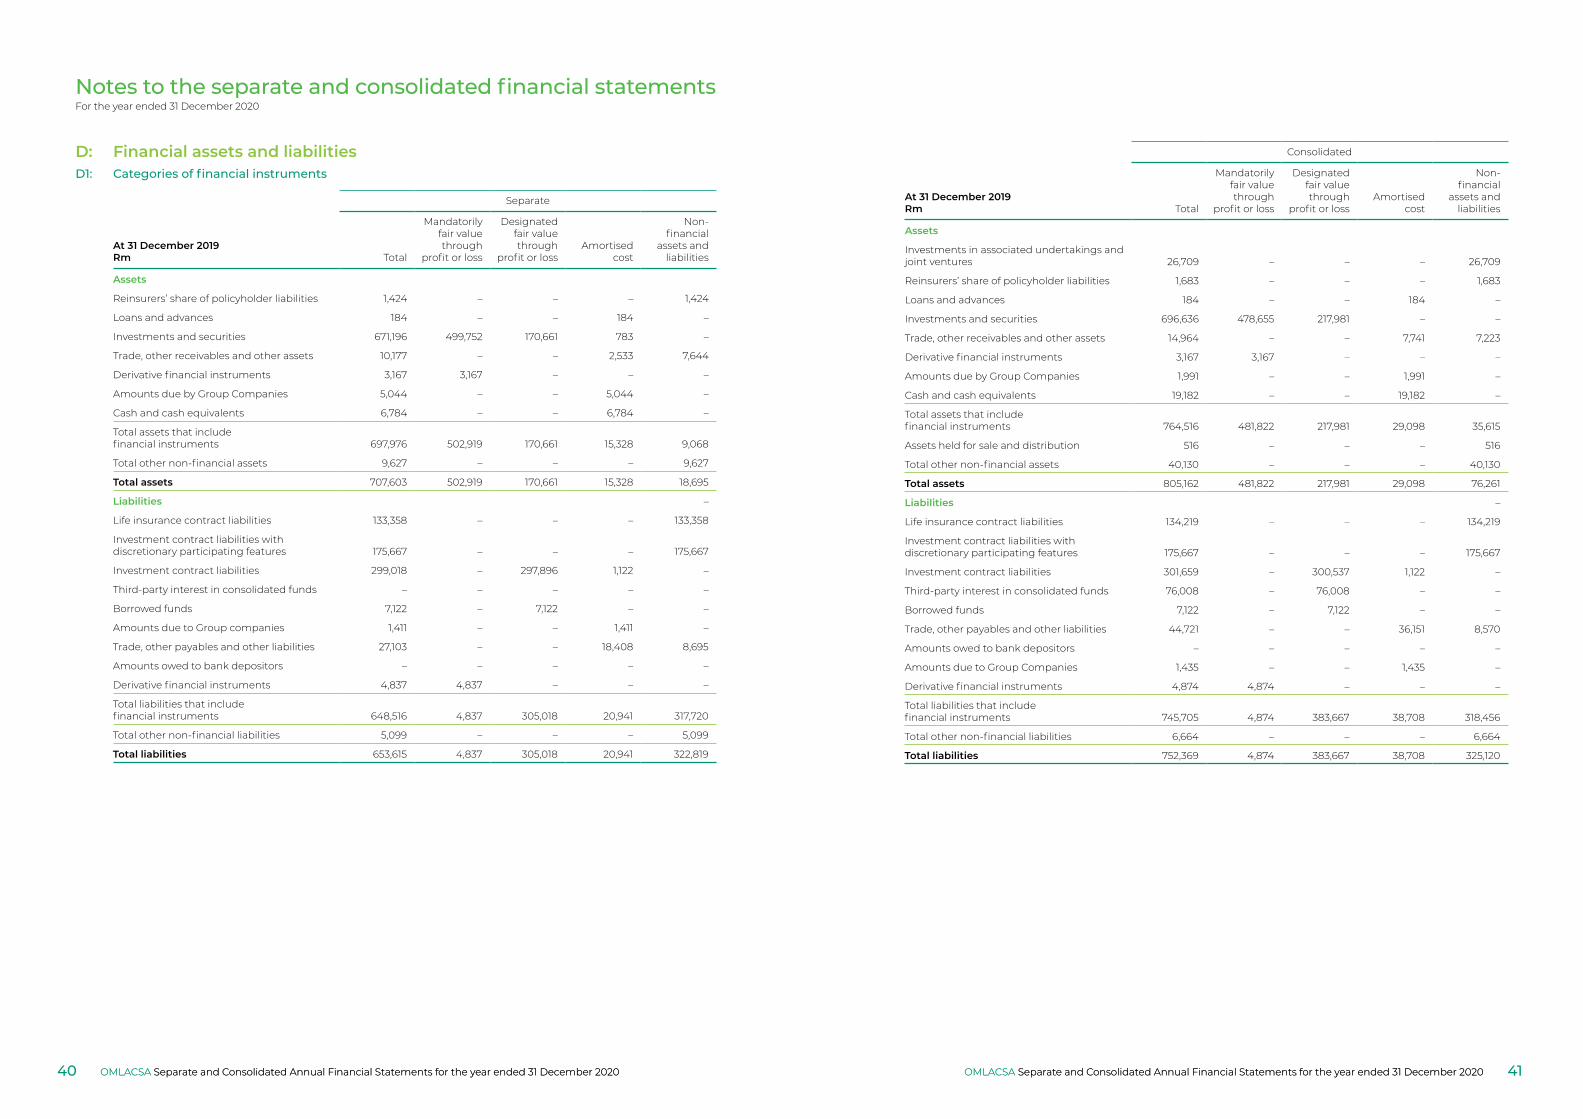
Notes to the separate and consolidated financial statementsFor the year ended 31 December 2020
Separate
At 31 December 2019Rm Total
Mandatorilyfair valuethrough
profit or loss
Designatedfair valuethrough
profit or lossAmortised
cost
Non-financial
assets andliabilities
Assets
Reinsurers’ share of policyholder liabilities 1,424 – – – 1,424
Loans and advances 184 – – 184 –
Investments and securities 671,196 499,752 170,661 783 –
Trade, other receivables and other assets 10,177 – – 2,533 7,644
Derivative financial instruments 3,167 3,167 – – –
Amounts due by Group Companies 5,044 – – 5,044 –
Cash and cash equivalents 6,784 – – 6,784 –
Total assets that include financial instruments 697,976 502,919 170,661 15,328 9,068
Total other non-financial assets 9,627 – – – 9,627
Total assets 707,603 502,919 170,661 15,328 18,695
Liabilities –
Life insurance contract liabilities 133,358 – – – 133,358
Investment contract liabilities with discretionary participating features 175,667 – – – 175,667
Investment contract liabilities 299,018 – 297,896 1,122 –
Third-party interest in consolidated funds – – – – –
Borrowed funds 7,122 – 7,122 – –
Amounts due to Group companies 1,411 – – 1,411 –
Trade, other payables and other liabilities 27,103 – – 18,408 8,695
Amounts owed to bank depositors – – – – –
Derivative financial instruments 4,837 4,837 – – –
Total liabilities that include financial instruments 648,516 4,837 305,018 20,941 317,720
Total other non-financial liabilities 5,099 – – – 5,099
Total liabilities 653,615 4,837 305,018 20,941 322,819
Consolidated
At 31 December 2019Rm Total
Mandatorilyfair valuethrough
profit or loss
Designatedfair valuethrough
profit or lossAmortised
cost
Non-financial
assets andliabilities
Assets
Investments in associated undertakings and joint ventures 26,709 – – – 26,709
Reinsurers’ share of policyholder liabilities 1,683 – – – 1,683
Loans and advances 184 – – 184 –
Investments and securities 696,636 478,655 217,981 – –
Trade, other receivables and other assets 14,964 – – 7,741 7,223
Derivative financial instruments 3,167 3,167 – – –
Amounts due by Group Companies 1,991 – – 1,991 –
Cash and cash equivalents 19,182 – – 19,182 –
Total assets that include financial instruments 764,516 481,822 217,981 29,098 35,615
Assets held for sale and distribution 516 – – – 516
Total other non-financial assets 40,130 – – – 40,130
Total assets 805,162 481,822 217,981 29,098 76,261
Liabilities –
Life insurance contract liabilities 134,219 – – – 134,219
Investment contract liabilities with discretionary participating features 175,667 – – – 175,667
Investment contract liabilities 301,659 – 300,537 1,122 –
Third-party interest in consolidated funds 76,008 – 76,008 – –
Borrowed funds 7,122 – 7,122 – –
Trade, other payables and other liabilities 44,721 – – 36,151 8,570
Amounts owed to bank depositors – – – – –
Amounts due to Group Companies 1,435 – – 1,435 –
Derivative financial instruments 4,874 4,874 – – –
Total liabilities that include financial instruments 745,705 4,874 383,667 38,708 318,456
Total other non-financial liabilities 6,664 – – – 6,664
Total liabilities 752,369 4,874 383,667 38,708 325,120
D: Financial assets and liabilitiesD1: Categories of financial instruments
OMLACSA Separate and Consolidated Annual Financial Statements for the year ended 31 December 2020 OMLACSA Separate and Consolidated Annual Financial Statements for the year ended 31 December 202040 41OMLACSA Separate and Consolidated Annual Financial Statements for the year ended 31 December 2020OMLACSA Separate and Consolidated Annual Financial Statements for the year ended 31 December 2020
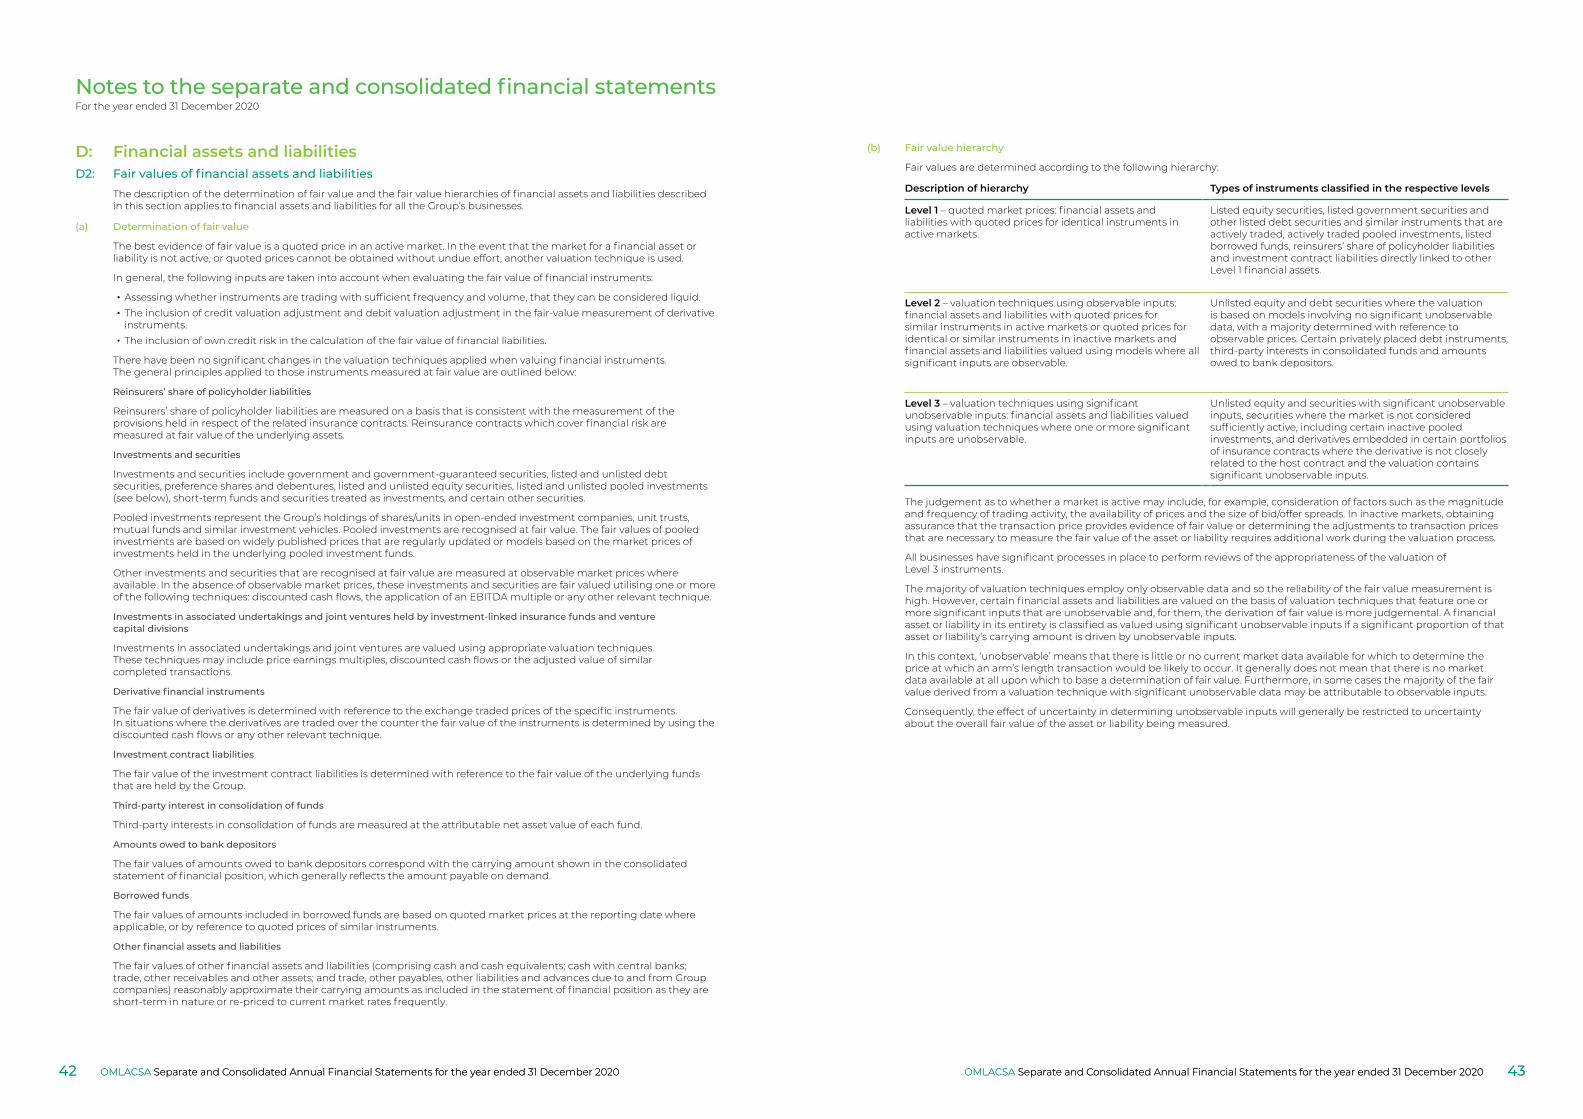
Notes to the separate and consolidated financial statementsFor the year ended 31 December 2020
D2: Fair values of financial assets and liabilitiesThe description of the determination of fair value and the fair value hierarchies of financial assets and liabilities described in this section applies to financial assets and liabilities for all the Group’s businesses.
(a) Determination of fair value
The best evidence of fair value is a quoted price in an active market. In the event that the market for a financial asset or liability is not active, or quoted prices cannot be obtained without undue effort, another valuation technique is used.
In general, the following inputs are taken into account when evaluating the fair value of financial instruments:
• Assessing whether instruments are trading with sufficient frequency and volume, that they can be considered liquid.• The inclusion of credit valuation adjustment and debit valuation adjustment in the fair-value measurement of derivative
instruments.• The inclusion of own credit risk in the calculation of the fair value of financial liabilities.
There have been no significant changes in the valuation techniques applied when valuing financial instruments. The general principles applied to those instruments measured at fair value are outlined below:
Reinsurers’ share of policyholder liabilities
Reinsurers’ share of policyholder liabilities are measured on a basis that is consistent with the measurement of the provisions held in respect of the related insurance contracts. Reinsurance contracts which cover financial risk are measured at fair value of the underlying assets.
Investments and securities
Investments and securities include government and government-guaranteed securities, listed and unlisted debt securities, preference shares and debentures, listed and unlisted equity securities, listed and unlisted pooled investments (see below), short-term funds and securities treated as investments, and certain other securities.
Pooled investments represent the Group’s holdings of shares/units in open-ended investment companies, unit trusts, mutual funds and similar investment vehicles. Pooled investments are recognised at fair value. The fair values of pooled investments are based on widely published prices that are regularly updated or models based on the market prices of investments held in the underlying pooled investment funds.
Other investments and securities that are recognised at fair value are measured at observable market prices where available. In the absence of observable market prices, these investments and securities are fair valued utilising one or more of the following techniques: discounted cash flows, the application of an EBITDA multiple or any other relevant technique.
Investments in associated undertakings and joint ventures held by investment-linked insurance funds and venture capital divisions
Investments in associated undertakings and joint ventures are valued using appropriate valuation techniques. These techniques may include price earnings multiples, discounted cash flows or the adjusted value of similar completed transactions.
Derivative financial instruments
The fair value of derivatives is determined with reference to the exchange traded prices of the specific instruments. In situations where the derivatives are traded over the counter the fair value of the instruments is determined by using the discounted cash flows or any other relevant technique.
Investment contract liabilities
The fair value of the investment contract liabilities is determined with reference to the fair value of the underlying funds that are held by the Group.
Third-party interest in consolidation of funds
Third-party interests in consolidation of funds are measured at the attributable net asset value of each fund.
Amounts owed to bank depositors
The fair values of amounts owed to bank depositors correspond with the carrying amount shown in the consolidated statement of financial position, which generally reflects the amount payable on demand.
Borrowed funds
The fair values of amounts included in borrowed funds are based on quoted market prices at the reporting date where applicable, or by reference to quoted prices of similar instruments.
Other financial assets and liabilities
The fair values of other financial assets and liabilities (comprising cash and cash equivalents; cash with central banks; trade, other receivables and other assets; and trade, other payables, other liabilities and advances due to and from Group companies) reasonably approximate their carrying amounts as included in the statement of financial position as they are short-term in nature or re-priced to current market rates frequently.
(b) Fair value hierarchy
Fair values are determined according to the following hierarchy:
Description of hierarchy Types of instruments classified in the respective levels
Level 1 – quoted market prices: financial assets and liabilities with quoted prices for identical instruments in active markets.
Listed equity securities, listed government securities and other listed debt securities and similar instruments that are actively traded, actively traded pooled investments, listed borrowed funds, reinsurers’ share of policyholder liabilities and investment contract liabilities directly linked to other Level 1 financial assets.
Level 2 – valuation techniques using observable inputs: financial assets and liabilities with quoted prices for similar instruments in active markets or quoted prices for identical or similar instruments in inactive markets and financial assets and liabilities valued using models where all significant inputs are observable.
Unlisted equity and debt securities where the valuation is based on models involving no significant unobservable data, with a majority determined with reference to observable prices. Certain privately placed debt instruments, third-party interests in consolidated funds and amounts owed to bank depositors.
Level 3 – valuation techniques using significant unobservable inputs: financial assets and liabilities valued using valuation techniques where one or more significant inputs are unobservable.
Unlisted equity and securities with significant unobservable inputs, securities where the market is not considered sufficiently active, including certain inactive pooled investments, and derivatives embedded in certain portfolios of insurance contracts where the derivative is not closely related to the host contract and the valuation contains significant unobservable inputs.
The judgement as to whether a market is active may include, for example, consideration of factors such as the magnitude and frequency of trading activity, the availability of prices and the size of bid/offer spreads. In inactive markets, obtaining assurance that the transaction price provides evidence of fair value or determining the adjustments to transaction prices that are necessary to measure the fair value of the asset or liability requires additional work during the valuation process.
All businesses have significant processes in place to perform reviews of the appropriateness of the valuation of Level 3 instruments.
The majority of valuation techniques employ only observable data and so the reliability of the fair value measurement is high. However, certain financial assets and liabilities are valued on the basis of valuation techniques that feature one or more significant inputs that are unobservable and, for them, the derivation of fair value is more judgemental. A financial asset or liability in its entirety is classified as valued using significant unobservable inputs if a significant proportion of that asset or liability’s carrying amount is driven by unobservable inputs.
In this context, ‘unobservable’ means that there is little or no current market data available for which to determine the price at which an arm’s length transaction would be likely to occur. It generally does not mean that there is no market data available at all upon which to base a determination of fair value. Furthermore, in some cases the majority of the fair value derived from a valuation technique with significant unobservable data may be attributable to observable inputs.
Consequently, the effect of uncertainty in determining unobservable inputs will generally be restricted to uncertainty about the overall fair value of the asset or liability being measured.
D: Financial assets and liabilities
OMLACSA Separate and Consolidated Annual Financial Statements for the year ended 31 December 2020 OMLACSA Separate and Consolidated Annual Financial Statements for the year ended 31 December 202042 43OMLACSA Separate and Consolidated Annual Financial Statements for the year ended 31 December 2020OMLACSA Separate and Consolidated Annual Financial Statements for the year ended 31 December 2020
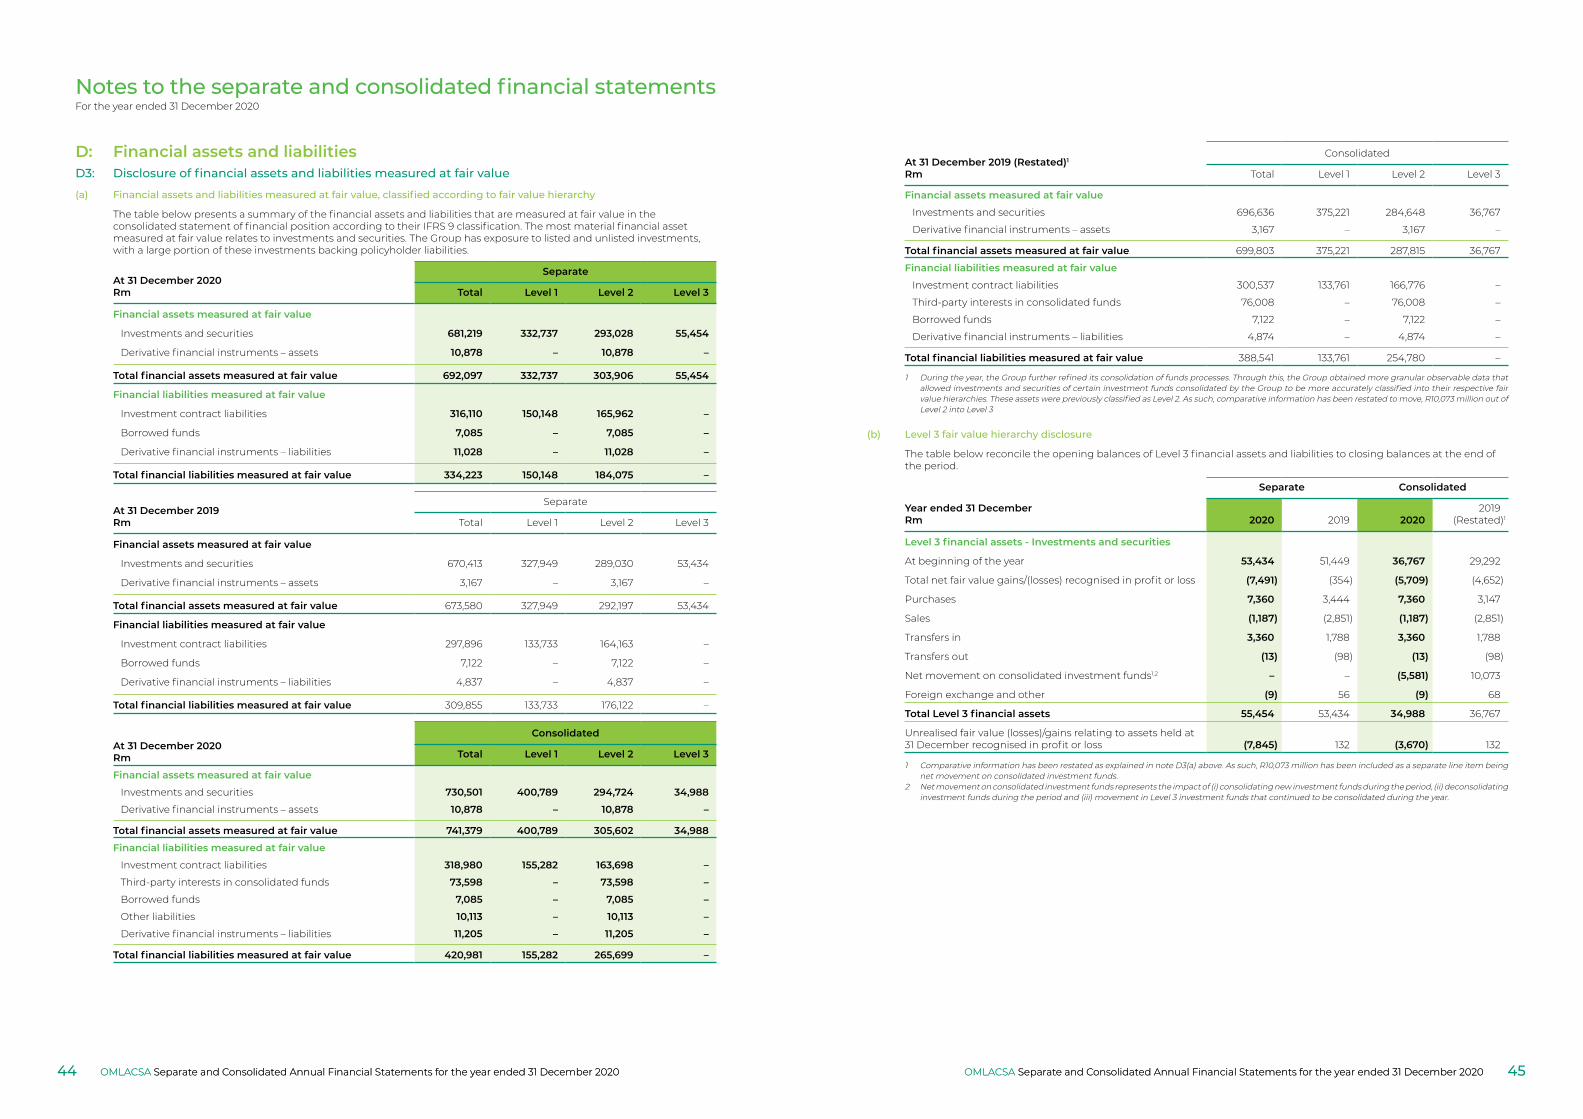
Notes to the separate and consolidated financial statementsFor the year ended 31 December 2020
D: Financial assets and liabilitiesD3: Disclosure of financial assets and liabilities measured at fair value
(a) Financial assets and liabilities measured at fair value, classified according to fair value hierarchy
The table below presents a summary of the financial assets and liabilities that are measured at fair value in the consolidated statement of financial position according to their IFRS 9 classification. The most material financial asset measured at fair value relates to investments and securities. The Group has exposure to listed and unlisted investments, with a large portion of these investments backing policyholder liabilities.
At 31 December 2020Rm
Separate
Total Level 1 Level 2 Level 3
Financial assets measured at fair value
Investments and securities 681,219 332,737 293,028 55,454
Derivative financial instruments – assets 10,878 – 10,878 –
Total financial assets measured at fair value 692,097 332,737 303,906 55,454
Financial liabilities measured at fair value
Investment contract liabilities 316,110 150,148 165,962 –
Borrowed funds 7,085 – 7,085 –
Derivative financial instruments – liabilities 11,028 – 11,028 –
Total financial liabilities measured at fair value 334,223 150,148 184,075 –
At 31 December 2019Rm
Separate
Total Level 1 Level 2 Level 3
Financial assets measured at fair value
Investments and securities 670,413 327,949 289,030 53,434
Derivative financial instruments – assets 3,167 – 3,167 –
Total financial assets measured at fair value 673,580 327,949 292,197 53,434
Financial liabilities measured at fair value
Investment contract liabilities 297,896 133,733 164,163 –
Borrowed funds 7,122 – 7,122 –
Derivative financial instruments – liabilities 4,837 – 4,837 –
Total financial liabilities measured at fair value 309,855 133,733 176,122 –
At 31 December 2020Rm
Consolidated
Total Level 1 Level 2 Level 3
Financial assets measured at fair value
Investments and securities 730,501 400,789 294,724 34,988
Derivative financial instruments – assets 10,878 – 10,878 –
Total financial assets measured at fair value 741,379 400,789 305,602 34,988
Financial liabilities measured at fair value
Investment contract liabilities 318,980 155,282 163,698 –
Third-party interests in consolidated funds 73,598 – 73,598 –
Borrowed funds 7,085 – 7,085 –
Other liabilities 10,113 – 10,113 –
Derivative financial instruments – liabilities 11,205 – 11,205 –
Total financial liabilities measured at fair value 420,981 155,282 265,699 –
At 31 December 2019 (Restated)1
Rm
Consolidated
Total Level 1 Level 2 Level 3
Financial assets measured at fair value
Investments and securities 696,636 375,221 284,648 36,767
Derivative financial instruments – assets 3,167 – 3,167 –
Total financial assets measured at fair value 699,803 375,221 287,815 36,767
Financial liabilities measured at fair value
Investment contract liabilities 300,537 133,761 166,776 –
Third-party interests in consolidated funds 76,008 – 76,008 –
Borrowed funds 7,122 – 7,122 –
Derivative financial instruments – liabilities 4,874 – 4,874 –
Total financial liabilities measured at fair value 388,541 133,761 254,780 –
1 During the year, the Group further refined its consolidation of funds processes. Through this, the Group obtained more granular observable data that allowed investments and securities of certain investment funds consolidated by the Group to be more accurately classified into their respective fair value hierarchies. These assets were previously classified as Level 2. As such, comparative information has been restated to move, R10,073 million out of Level 2 into Level 3
(b) Level 3 fair value hierarchy disclosure
The table below reconcile the opening balances of Level 3 financial assets and liabilities to closing balances at the end of the period.
Year ended 31 DecemberRm
Separate Consolidated
2020 2019 20202019
(Restated)1
Level 3 financial assets ‑ Investments and securities
At beginning of the year 53,434 51,449 36,767 29,292
Total net fair value gains/(losses) recognised in profit or loss (7,491) (354) (5,709) (4,652)
Purchases 7,360 3,444 7,360 3,147
Sales (1,187) (2,851) (1,187) (2,851)
Transfers in 3,360 1,788 3,360 1,788
Transfers out (13) (98) (13) (98)
Net movement on consolidated investment funds1,2 – – (5,581) 10,073
Foreign exchange and other (9) 56 (9) 68
Total Level 3 financial assets 55,454 53,434 34,988 36,767
Unrealised fair value (losses)/gains relating to assets held at 31 December recognised in profit or loss (7,845) 132 (3,670) 132
1 Comparative information has been restated as explained in note D3(a) above. As such, R10,073 million has been included as a separate line item being net movement on consolidated investment funds.
2 Net movement on consolidated investment funds represents the impact of (i) consolidating new investment funds during the period, (ii) deconsolidating investment funds during the period and (iii) movement in Level 3 investment funds that continued to be consolidated during the year.
OMLACSA Separate and Consolidated Annual Financial Statements for the year ended 31 December 2020 OMLACSA Separate and Consolidated Annual Financial Statements for the year ended 31 December 202044 45OMLACSA Separate and Consolidated Annual Financial Statements for the year ended 31 December 2020OMLACSA Separate and Consolidated Annual Financial Statements for the year ended 31 December 2020
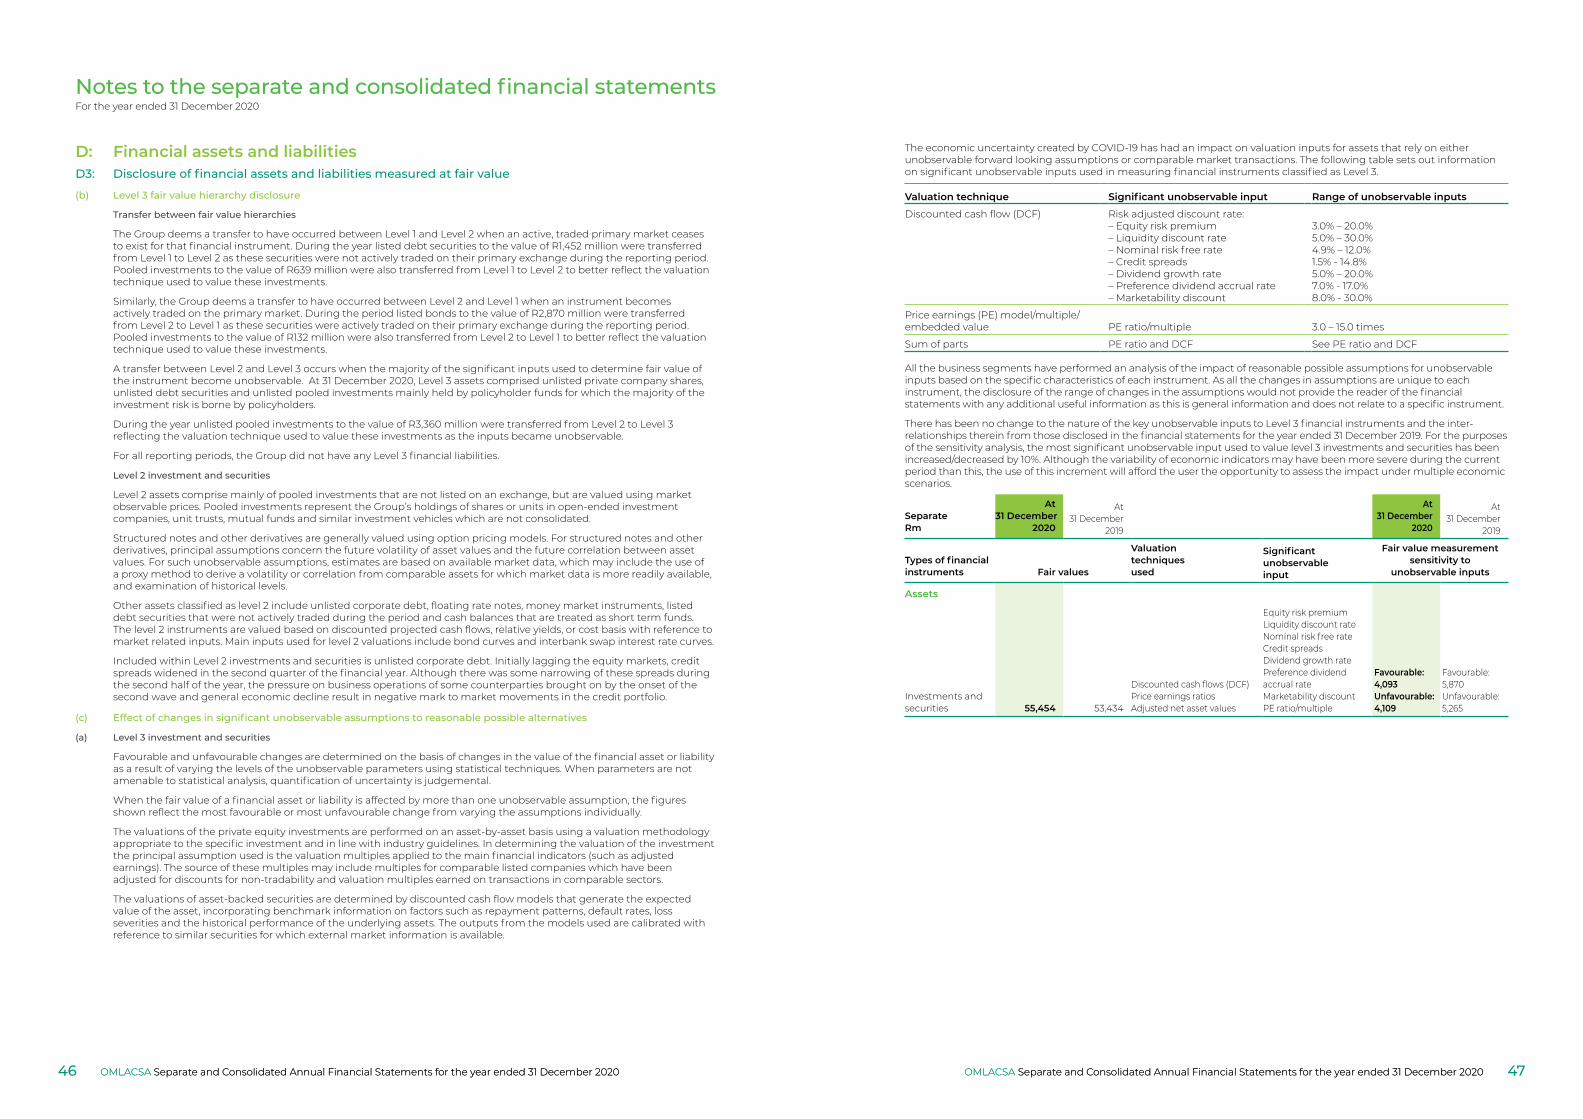
Notes to the separate and consolidated financial statementsFor the year ended 31 December 2020
Transfer between fair value hierarchies
The Group deems a transfer to have occurred between Level 1 and Level 2 when an active, traded primary market ceases to exist for that financial instrument. During the year listed debt securities to the value of R1,452 million were transferred from Level 1 to Level 2 as these securities were not actively traded on their primary exchange during the reporting period. Pooled investments to the value of R639 million were also transferred from Level 1 to Level 2 to better reflect the valuation technique used to value these investments.
Similarly, the Group deems a transfer to have occurred between Level 2 and Level 1 when an instrument becomes actively traded on the primary market. During the period listed bonds to the value of R2,870 million were transferred from Level 2 to Level 1 as these securities were actively traded on their primary exchange during the reporting period. Pooled investments to the value of R132 million were also transferred from Level 2 to Level 1 to better reflect the valuation technique used to value these investments.
A transfer between Level 2 and Level 3 occurs when the majority of the significant inputs used to determine fair value of the instrument become unobservable. At 31 December 2020, Level 3 assets comprised unlisted private company shares, unlisted debt securities and unlisted pooled investments mainly held by policyholder funds for which the majority of the investment risk is borne by policyholders.
During the year unlisted pooled investments to the value of R3,360 million were transferred from Level 2 to Level 3 reflecting the valuation technique used to value these investments as the inputs became unobservable.
For all reporting periods, the Group did not have any Level 3 financial liabilities.
Level 2 investment and securities
Level 2 assets comprise mainly of pooled investments that are not listed on an exchange, but are valued using market observable prices. Pooled investments represent the Group’s holdings of shares or units in open-ended investment companies, unit trusts, mutual funds and similar investment vehicles which are not consolidated.
Structured notes and other derivatives are generally valued using option pricing models. For structured notes and other derivatives, principal assumptions concern the future volatility of asset values and the future correlation between asset values. For such unobservable assumptions, estimates are based on available market data, which may include the use of a proxy method to derive a volatility or correlation from comparable assets for which market data is more readily available, and examination of historical levels.
Other assets classified as level 2 include unlisted corporate debt, floating rate notes, money market instruments, listed debt securities that were not actively traded during the period and cash balances that are treated as short term funds. The level 2 instruments are valued based on discounted projected cash flows, relative yields, or cost basis with reference to market related inputs. Main inputs used for level 2 valuations include bond curves and interbank swap interest rate curves.
Included within Level 2 investments and securities is unlisted corporate debt. Initially lagging the equity markets, credit spreads widened in the second quarter of the financial year. Although there was some narrowing of these spreads during the second half of the year, the pressure on business operations of some counterparties brought on by the onset of the second wave and general economic decline result in negative mark to market movements in the credit portfolio.
(c) Effect of changes in significant unobservable assumptions to reasonable possible alternatives
(a) Level 3 investment and securities
Favourable and unfavourable changes are determined on the basis of changes in the value of the financial asset or liability as a result of varying the levels of the unobservable parameters using statistical techniques. When parameters are not amenable to statistical analysis, quantification of uncertainty is judgemental.
When the fair value of a financial asset or liability is affected by more than one unobservable assumption, the figures shown reflect the most favourable or most unfavourable change from varying the assumptions individually.
The valuations of the private equity investments are performed on an asset-by-asset basis using a valuation methodology appropriate to the specific investment and in line with industry guidelines. In determining the valuation of the investment the principal assumption used is the valuation multiples applied to the main financial indicators (such as adjusted earnings). The source of these multiples may include multiples for comparable listed companies which have been adjusted for discounts for non-tradability and valuation multiples earned on transactions in comparable sectors.
The valuations of asset-backed securities are determined by discounted cash flow models that generate the expected value of the asset, incorporating benchmark information on factors such as repayment patterns, default rates, loss severities and the historical performance of the underlying assets. The outputs from the models used are calibrated with reference to similar securities for which external market information is available.
The economic uncertainty created by COVID-19 has had an impact on valuation inputs for assets that rely on either unobservable forward looking assumptions or comparable market transactions. The following table sets out information on significant unobservable inputs used in measuring financial instruments classified as Level 3.
Valuation technique Significant unobservable input Range of unobservable inputs
Discounted cash flow (DCF) Risk adjusted discount rate:– Equity risk premium– Liquidity discount rate– Nominal risk free rate– Credit spreads– Dividend growth rate– Preference dividend accrual rate– Marketability discount
3.0% – 20.0%5.0% – 30.0%4.9% – 12.0%1.5% - 14.8%5.0% – 20.0%7.0% - 17.0%8.0% - 30.0%
Price earnings (PE) model/multiple/embedded value PE ratio/multiple 3.0 – 15.0 times
Sum of parts PE ratio and DCF See PE ratio and DCF
All the business segments have performed an analysis of the impact of reasonable possible assumptions for unobservable inputs based on the specific characteristics of each instrument. As all the changes in assumptions are unique to each instrument, the disclosure of the range of changes in the assumptions would not provide the reader of the financial statements with any additional useful information as this is general information and does not relate to a specific instrument.
There has been no change to the nature of the key unobservable inputs to Level 3 financial instruments and the inter- relationships therein from those disclosed in the financial statements for the year ended 31 December 2019. For the purposes of the sensitivity analysis, the most significant unobservable input used to value level 3 investments and securities has been increased/decreased by 10%. Although the variability of economic indicators may have been more severe during the current period than this, the use of this increment will afford the user the opportunity to assess the impact under multiple economic scenarios.
SeparateRm
At 31 December
2020
At31 December
2019
At 31 December
2020
At31 December
2019
Types of financial instruments Fair values
Valuationtechniquesused
Significantunobservableinput
Fair value measurementsensitivity to
unobservable inputs
Assets
Investments and securities 55,454 53,434
Discounted cash flows (DCF)Price earnings ratiosAdjusted net asset values
Equity risk premiumLiquidity discount rateNominal risk free rateCredit spreadsDividend growth ratePreference dividend accrual rateMarketability discountPE ratio/multiple
Favourable: 4,093Unfavourable: 4,109
Favourable: 5,870Unfavourable: 5,265
D: Financial assets and liabilitiesD3: Disclosure of financial assets and liabilities measured at fair value
(b) Level 3 fair value hierarchy disclosure
OMLACSA Separate and Consolidated Annual Financial Statements for the year ended 31 December 2020 OMLACSA Separate and Consolidated Annual Financial Statements for the year ended 31 December 202046 47OMLACSA Separate and Consolidated Annual Financial Statements for the year ended 31 December 2020OMLACSA Separate and Consolidated Annual Financial Statements for the year ended 31 December 2020
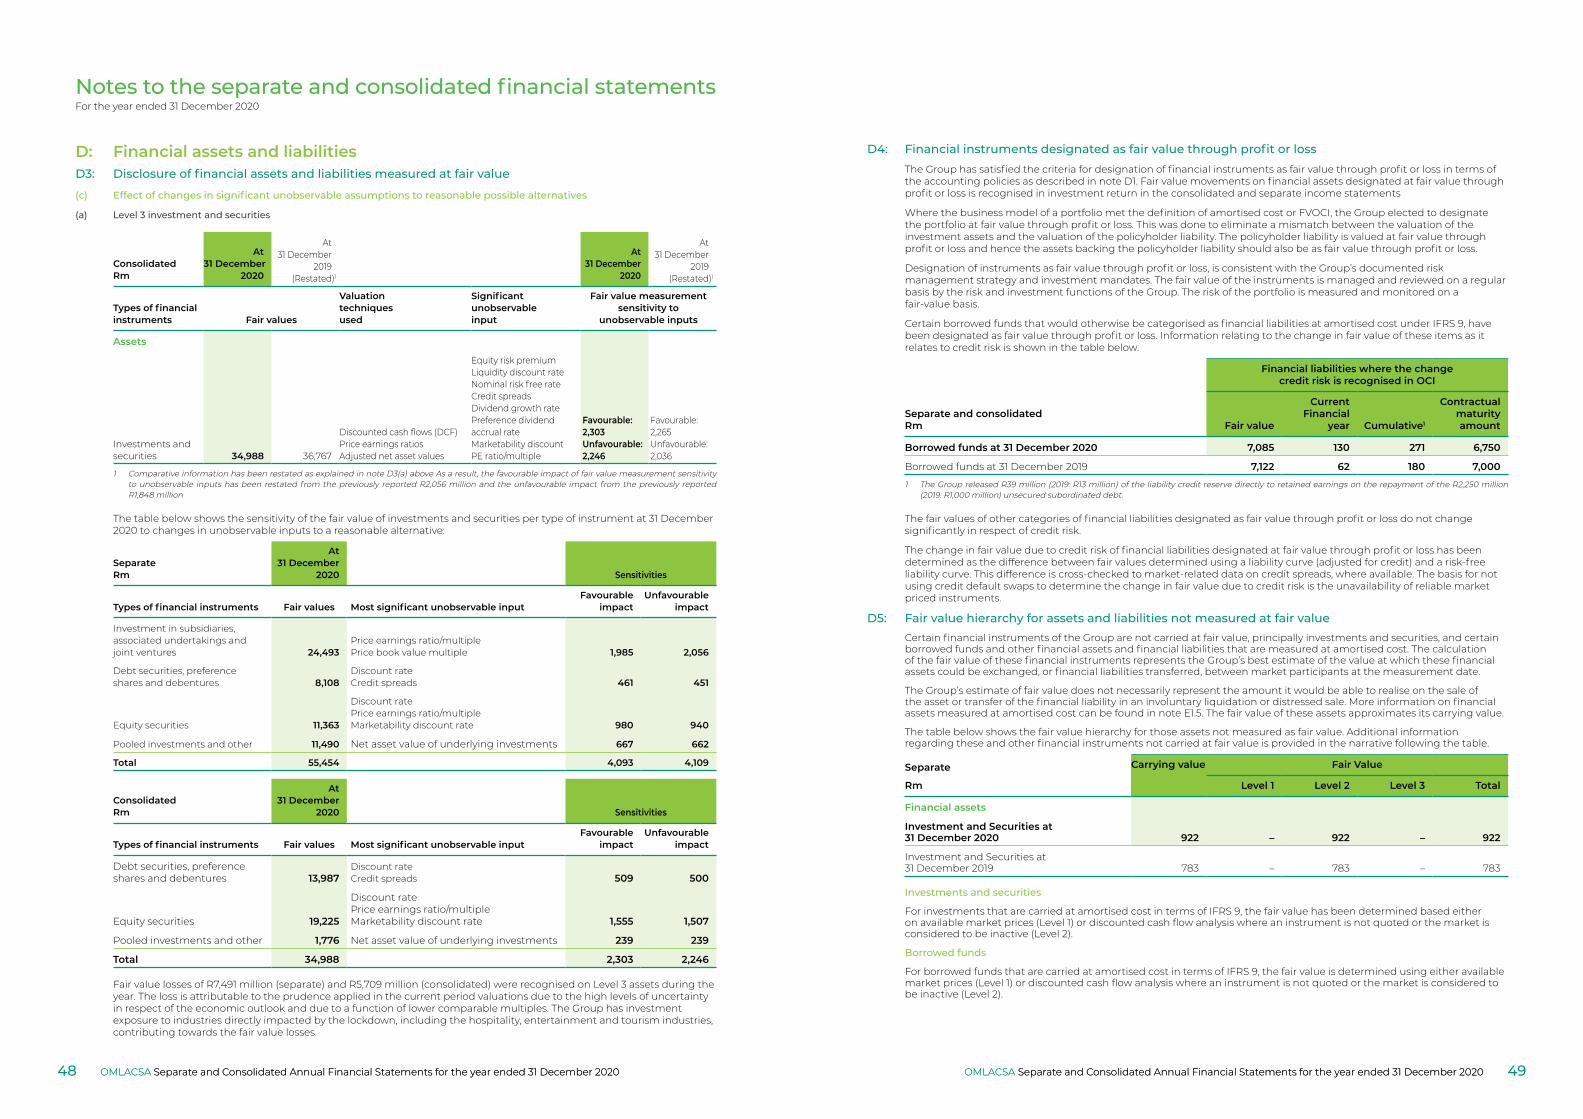
Notes to the separate and consolidated financial statementsFor the year ended 31 December 2020
ConsolidatedRm
At 31 December
2020
At31 December
2019(Restated)1
At 31 December
2020
At31 December
2019(Restated)1
Types of financial instruments Fair values
Valuationtechniquesused
Significantunobservableinput
Fair value measurementsensitivity to
unobservable inputs
Assets
Investments and securities 34,988 36,767
Discounted cash flows (DCF)Price earnings ratiosAdjusted net asset values
Equity risk premiumLiquidity discount rateNominal risk free rateCredit spreadsDividend growth ratePreference dividend accrual rateMarketability discountPE ratio/multiple
Favourable: 2,303Unfavourable: 2,246
Favourable: 2,265Unfavourable: 2,036
1 Comparative information has been restated as explained in note D3(a) above As a result, the favourable impact of fair value measurement sensitivity to unobservable inputs has been restated from the previously reported R2,056 million and the unfavourable impact from the previously reported R1,848 million
The table below shows the sensitivity of the fair value of investments and securities per type of instrument at 31 December 2020 to changes in unobservable inputs to a reasonable alternative:
SeparateRm
At 31 December
2020 Sensitivities
Types of financial instruments Fair values Most significant unobservable inputFavourable
impactUnfavourable
impact
Investment in subsidiaries, associated undertakings and joint ventures 24,493
Price earnings ratio/multiplePrice book value multiple 1,985 2,056
Debt securities, preference shares and debentures 8,108
Discount rateCredit spreads 461 451
Equity securities 11,363
Discount ratePrice earnings ratio/multipleMarketability discount rate 980 940
Pooled investments and other 11,490 Net asset value of underlying investments 667 662
Total 55,454 4,093 4,109
ConsolidatedRm
At 31 December
2020 Sensitivities
Types of financial instruments Fair values Most significant unobservable inputFavourable
impactUnfavourable
impact
Debt securities, preference shares and debentures 13,987
Discount rateCredit spreads 509 500
Equity securities 19,225
Discount ratePrice earnings ratio/multipleMarketability discount rate 1,555 1,507
Pooled investments and other 1,776 Net asset value of underlying investments 239 239
Total 34,988 2,303 2,246
Fair value losses of R7,491 million (separate) and R5,709 million (consolidated) were recognised on Level 3 assets during the year. The loss is attributable to the prudence applied in the current period valuations due to the high levels of uncertainty in respect of the economic outlook and due to a function of lower comparable multiples. The Group has investment exposure to industries directly impacted by the lockdown, including the hospitality, entertainment and tourism industries, contributing towards the fair value losses.
D4: Financial instruments designated as fair value through profit or lossThe Group has satisfied the criteria for designation of financial instruments as fair value through profit or loss in terms of the accounting policies as described in note D1. Fair value movements on financial assets designated at fair value through profit or loss is recognised in investment return in the consolidated and separate income statements
Where the business model of a portfolio met the definition of amortised cost or FVOCI, the Group elected to designate the portfolio at fair value through profit or loss. This was done to eliminate a mismatch between the valuation of the investment assets and the valuation of the policyholder liability. The policyholder liability is valued at fair value through profit or loss and hence the assets backing the policyholder liability should also be as fair value through profit or loss.
Designation of instruments as fair value through profit or loss, is consistent with the Group’s documented risk management strategy and investment mandates. The fair value of the instruments is managed and reviewed on a regular basis by the risk and investment functions of the Group. The risk of the portfolio is measured and monitored on a fair-value basis.
Certain borrowed funds that would otherwise be categorised as financial liabilities at amortised cost under IFRS 9, have been designated as fair value through profit or loss. Information relating to the change in fair value of these items as it relates to credit risk is shown in the table below.
Separate and consolidatedRm
Financial liabilities where the changecredit risk is recognised in OCI
Fair value
CurrentFinancial
year Cumulative1
Contractualmaturityamount
Borrowed funds at 31 December 2020 7,085 130 271 6,750
Borrowed funds at 31 December 2019 7,122 62 180 7,000
1 The Group released R39 million (2019: R13 million) of the liability credit reserve directly to retained earnings on the repayment of the R2,250 million (2019: R1,000 million) unsecured subordinated debt.
The fair values of other categories of financial liabilities designated as fair value through profit or loss do not change significantly in respect of credit risk.
The change in fair value due to credit risk of financial liabilities designated at fair value through profit or loss has been determined as the difference between fair values determined using a liability curve (adjusted for credit) and a risk-free liability curve. This difference is cross-checked to market-related data on credit spreads, where available. The basis for not using credit default swaps to determine the change in fair value due to credit risk is the unavailability of reliable market priced instruments.
D5: Fair value hierarchy for assets and liabilities not measured at fair valueCertain financial instruments of the Group are not carried at fair value, principally investments and securities, and certain borrowed funds and other financial assets and financial liabilities that are measured at amortised cost. The calculation of the fair value of these financial instruments represents the Group’s best estimate of the value at which these financial assets could be exchanged, or financial liabilities transferred, between market participants at the measurement date.
The Group’s estimate of fair value does not necessarily represent the amount it would be able to realise on the sale of the asset or transfer of the financial liability in an involuntary liquidation or distressed sale. More information on financial assets measured at amortised cost can be found in note E1.5. The fair value of these assets approximates its carrying value.
The table below shows the fair value hierarchy for those assets not measured as fair value. Additional information regarding these and other financial instruments not carried at fair value is provided in the narrative following the table.
Separate Carrying value Fair Value
Rm Level 1 Level 2 Level 3 Total
Financial assets
Investment and Securities at 31 December 2020 922 – 922 – 922
Investment and Securities at 31 December 2019 783 – 783 – 783
Investments and securities
For investments that are carried at amortised cost in terms of IFRS 9, the fair value has been determined based either on available market prices (Level 1) or discounted cash flow analysis where an instrument is not quoted or the market is considered to be inactive (Level 2).
Borrowed funds
For borrowed funds that are carried at amortised cost in terms of IFRS 9, the fair value is determined using either available market prices (Level 1) or discounted cash flow analysis where an instrument is not quoted or the market is considered to be inactive (Level 2).
D: Financial assets and liabilitiesD3: Disclosure of financial assets and liabilities measured at fair value
(c) Effect of changes in significant unobservable assumptions to reasonable possible alternatives
(a) Level 3 investment and securities
OMLACSA Separate and Consolidated Annual Financial Statements for the year ended 31 December 2020 OMLACSA Separate and Consolidated Annual Financial Statements for the year ended 31 December 202048 49OMLACSA Separate and Consolidated Annual Financial Statements for the year ended 31 December 2020OMLACSA Separate and Consolidated Annual Financial Statements for the year ended 31 December 2020
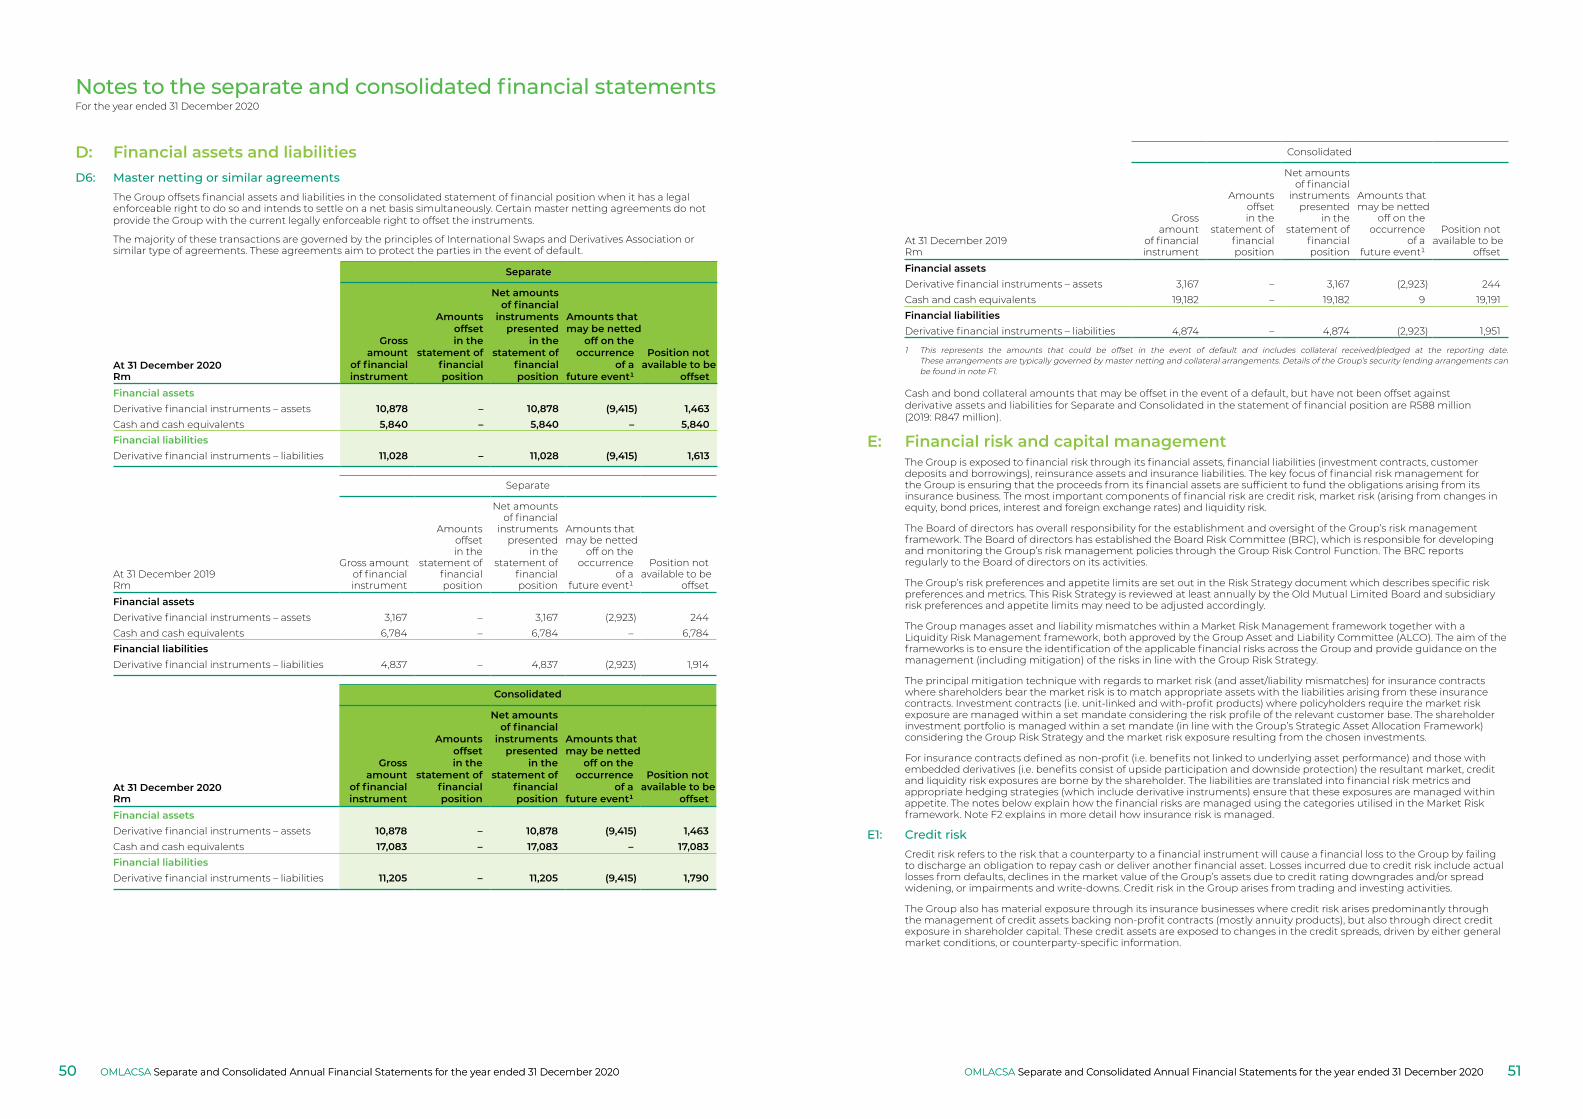
Notes to the separate and consolidated financial statementsFor the year ended 31 December 2020
D6: Master netting or similar agreementsThe Group offsets financial assets and liabilities in the consolidated statement of financial position when it has a legal enforceable right to do so and intends to settle on a net basis simultaneously. Certain master netting agreements do not provide the Group with the current legally enforceable right to offset the instruments.
The majority of these transactions are governed by the principles of International Swaps and Derivatives Association or similar type of agreements. These agreements aim to protect the parties in the event of default.
Separate
At 31 December 2020Rm
Gross amount
of financialinstrument
Amountsoffsetin the
statement offinancialposition
Net amountsof financial
instrumentspresented
in thestatement of
financialposition
Amounts thatmay be netted
off on theoccurrence
of afuture event¹
Position notavailable to be
offsetFinancial assetsDerivative financial instruments – assets 10,878 – 10,878 (9,415) 1,463Cash and cash equivalents 5,840 – 5,840 – 5,840Financial liabilitiesDerivative financial instruments – liabilities 11,028 – 11,028 (9,415) 1,613
Separate
At 31 December 2019Rm
Gross amountof financialinstrument
Amountsoffsetin the
statement offinancialposition
Net amountsof financial
instrumentspresented
in thestatement of
financialposition
Amounts thatmay be netted
off on theoccurrence
of afuture event¹
Position notavailable to be
offset
Financial assetsDerivative financial instruments – assets 3,167 – 3,167 (2,923) 244Cash and cash equivalents 6,784 – 6,784 – 6,784Financial liabilitiesDerivative financial instruments – liabilities 4,837 – 4,837 (2,923) 1,914
Consolidated
At 31 December 2020Rm
Gross amount
of financialinstrument
Amountsoffsetin the
statement offinancialposition
Net amountsof financial
instrumentspresented
in thestatement of
financialposition
Amounts thatmay be netted
off on theoccurrence
of afuture event¹
Position notavailable to be
offsetFinancial assetsDerivative financial instruments – assets 10,878 – 10,878 (9,415) 1,463Cash and cash equivalents 17,083 – 17,083 – 17,083Financial liabilitiesDerivative financial instruments – liabilities 11,205 – 11,205 (9,415) 1,790
Consolidated
At 31 December 2019Rm
Gross amount
of financialinstrument
Amountsoffsetin the
statement offinancialposition
Net amountsof financial
instrumentspresented
in thestatement of
financialposition
Amounts thatmay be netted
off on theoccurrence
of afuture event¹
Position notavailable to be
offset
Financial assetsDerivative financial instruments – assets 3,167 – 3,167 (2,923) 244Cash and cash equivalents 19,182 – 19,182 9 19,191Financial liabilitiesDerivative financial instruments – liabilities 4,874 – 4,874 (2,923) 1,951
1 This represents the amounts that could be offset in the event of default and includes collateral received/pledged at the reporting date. These arrangements are typically governed by master netting and collateral arrangements. Details of the Group’s security lending arrangements can be found in note F1.
Cash and bond collateral amounts that may be offset in the event of a default, but have not been offset against derivative assets and liabilities for Separate and Consolidated in the statement of financial position are R588 million (2019: R847 million).
E: Financial risk and capital managementThe Group is exposed to financial risk through its financial assets, financial liabilities (investment contracts, customer deposits and borrowings), reinsurance assets and insurance liabilities. The key focus of financial risk management for the Group is ensuring that the proceeds from its financial assets are sufficient to fund the obligations arising from its insurance business. The most important components of financial risk are credit risk, market risk (arising from changes in equity, bond prices, interest and foreign exchange rates) and liquidity risk.
The Board of directors has overall responsibility for the establishment and oversight of the Group’s risk management framework. The Board of directors has established the Board Risk Committee (BRC), which is responsible for developing and monitoring the Group’s risk management policies through the Group Risk Control Function. The BRC reports regularly to the Board of directors on its activities.
The Group’s risk preferences and appetite limits are set out in the Risk Strategy document which describes specific risk preferences and metrics. This Risk Strategy is reviewed at least annually by the Old Mutual Limited Board and subsidiary risk preferences and appetite limits may need to be adjusted accordingly.
The Group manages asset and liability mismatches within a Market Risk Management framework together with a Liquidity Risk Management framework, both approved by the Group Asset and Liability Committee (ALCO). The aim of the frameworks is to ensure the identification of the applicable financial risks across the Group and provide guidance on the management (including mitigation) of the risks in line with the Group Risk Strategy.
The principal mitigation technique with regards to market risk (and asset/liability mismatches) for insurance contracts where shareholders bear the market risk is to match appropriate assets with the liabilities arising from these insurance contracts. Investment contracts (i.e. unit-linked and with-profit products) where policyholders require the market risk exposure are managed within a set mandate considering the risk profile of the relevant customer base. The shareholder investment portfolio is managed within a set mandate (in line with the Group’s Strategic Asset Allocation Framework) considering the Group Risk Strategy and the market risk exposure resulting from the chosen investments.
For insurance contracts defined as non-profit (i.e. benefits not linked to underlying asset performance) and those with embedded derivatives (i.e. benefits consist of upside participation and downside protection) the resultant market, credit and liquidity risk exposures are borne by the shareholder. The liabilities are translated into financial risk metrics and appropriate hedging strategies (which include derivative instruments) ensure that these exposures are managed within appetite. The notes below explain how the financial risks are managed using the categories utilised in the Market Risk framework. Note F2 explains in more detail how insurance risk is managed.
E1: Credit riskCredit risk refers to the risk that a counterparty to a financial instrument will cause a financial loss to the Group by failing to discharge an obligation to repay cash or deliver another financial asset. Losses incurred due to credit risk include actual losses from defaults, declines in the market value of the Group’s assets due to credit rating downgrades and/or spread widening, or impairments and write-downs. Credit risk in the Group arises from trading and investing activities.
The Group also has material exposure through its insurance businesses where credit risk arises predominantly through the management of credit assets backing non-profit contracts (mostly annuity products), but also through direct credit exposure in shareholder capital. These credit assets are exposed to changes in the credit spreads, driven by either general market conditions, or counterparty-specific information.
D: Financial assets and liabilities
OMLACSA Separate and Consolidated Annual Financial Statements for the year ended 31 December 2020 OMLACSA Separate and Consolidated Annual Financial Statements for the year ended 31 December 202050 51OMLACSA Separate and Consolidated Annual Financial Statements for the year ended 31 December 2020OMLACSA Separate and Consolidated Annual Financial Statements for the year ended 31 December 2020
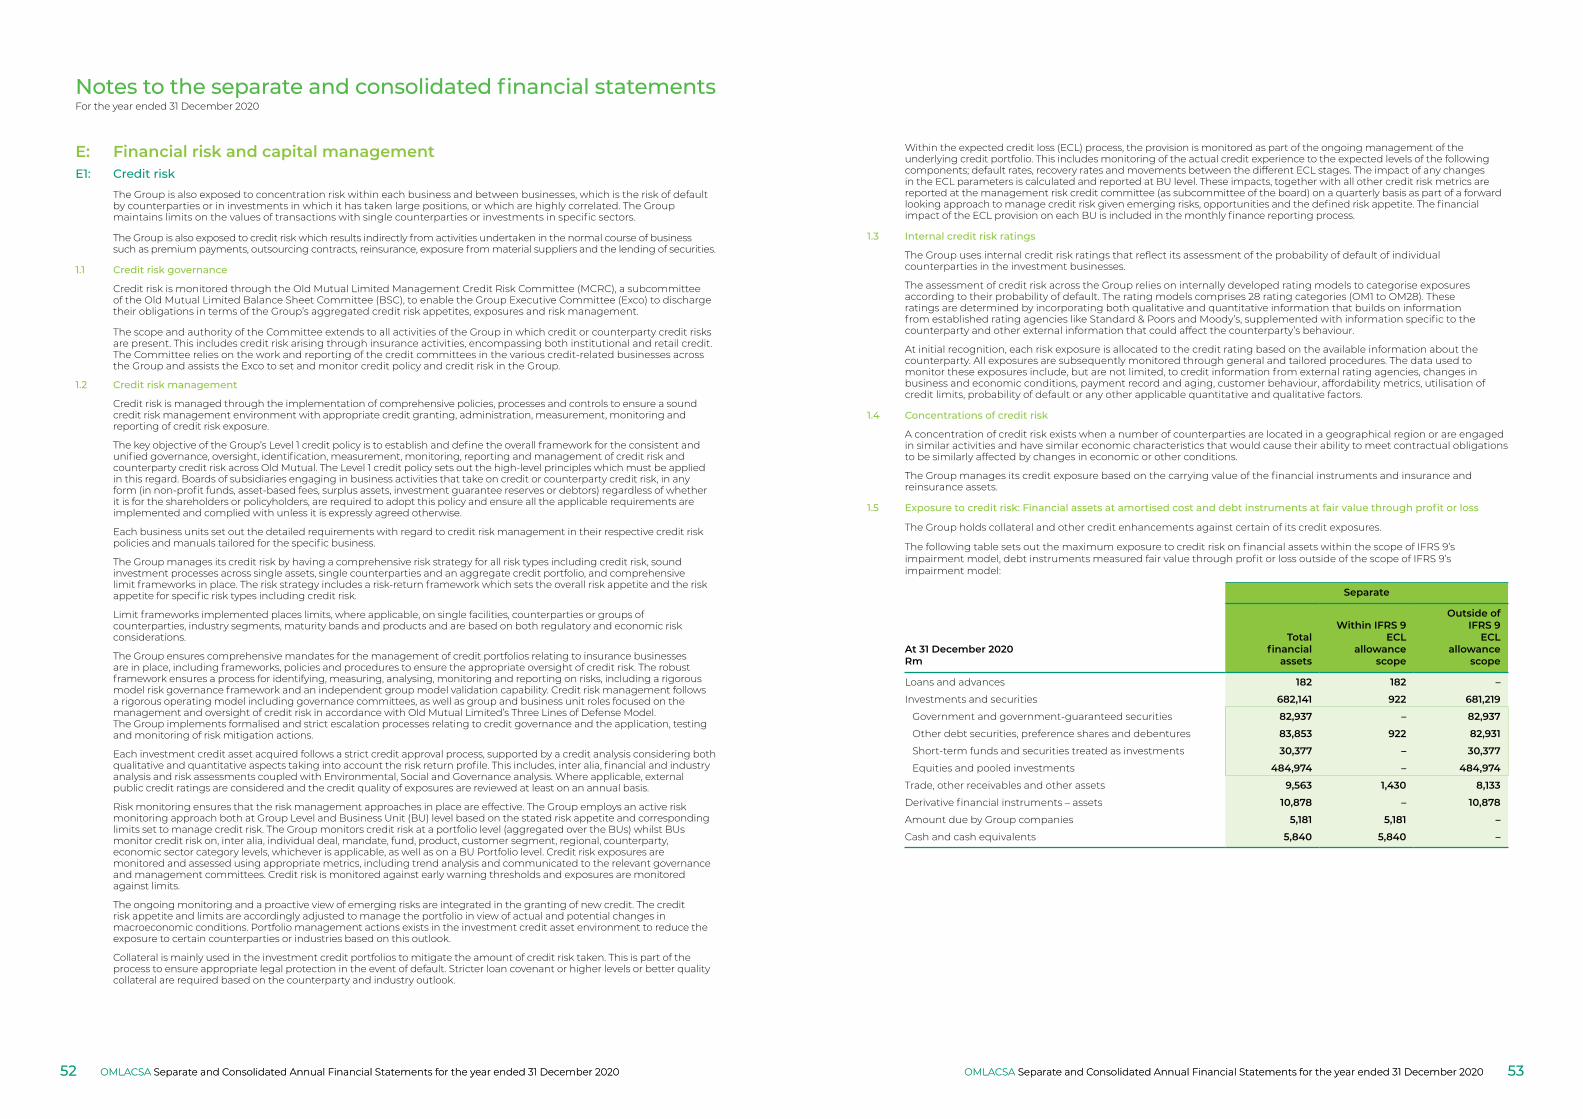
Notes to the separate and consolidated financial statementsFor the year ended 31 December 2020
The Group is also exposed to concentration risk within each business and between businesses, which is the risk of default by counterparties or in investments in which it has taken large positions, or which are highly correlated. The Group maintains limits on the values of transactions with single counterparties or investments in specific sectors.
The Group is also exposed to credit risk which results indirectly from activities undertaken in the normal course of business such as premium payments, outsourcing contracts, reinsurance, exposure from material suppliers and the lending of securities.
1.1 Credit risk governance
Credit risk is monitored through the Old Mutual Limited Management Credit Risk Committee (MCRC), a subcommittee of the Old Mutual Limited Balance Sheet Committee (BSC), to enable the Group Executive Committee (Exco) to discharge their obligations in terms of the Group’s aggregated credit risk appetites, exposures and risk management.
The scope and authority of the Committee extends to all activities of the Group in which credit or counterparty credit risks are present. This includes credit risk arising through insurance activities, encompassing both institutional and retail credit. The Committee relies on the work and reporting of the credit committees in the various credit-related businesses across the Group and assists the Exco to set and monitor credit policy and credit risk in the Group.
1.2 Credit risk management
Credit risk is managed through the implementation of comprehensive policies, processes and controls to ensure a sound credit risk management environment with appropriate credit granting, administration, measurement, monitoring and reporting of credit risk exposure.
The key objective of the Group’s Level 1 credit policy is to establish and define the overall framework for the consistent and unified governance, oversight, identification, measurement, monitoring, reporting and management of credit risk and counterparty credit risk across Old Mutual. The Level 1 credit policy sets out the high-level principles which must be applied in this regard. Boards of subsidiaries engaging in business activities that take on credit or counterparty credit risk, in any form (in non-profit funds, asset-based fees, surplus assets, investment guarantee reserves or debtors) regardless of whether it is for the shareholders or policyholders, are required to adopt this policy and ensure all the applicable requirements are implemented and complied with unless it is expressly agreed otherwise.
Each business units set out the detailed requirements with regard to credit risk management in their respective credit risk policies and manuals tailored for the specific business.
The Group manages its credit risk by having a comprehensive risk strategy for all risk types including credit risk, sound investment processes across single assets, single counterparties and an aggregate credit portfolio, and comprehensive limit frameworks in place. The risk strategy includes a risk-return framework which sets the overall risk appetite and the risk appetite for specific risk types including credit risk.
Limit frameworks implemented places limits, where applicable, on single facilities, counterparties or groups of counterparties, industry segments, maturity bands and products and are based on both regulatory and economic risk considerations.
The Group ensures comprehensive mandates for the management of credit portfolios relating to insurance businesses are in place, including frameworks, policies and procedures to ensure the appropriate oversight of credit risk. The robust framework ensures a process for identifying, measuring, analysing, monitoring and reporting on risks, including a rigorous model risk governance framework and an independent group model validation capability. Credit risk management follows a rigorous operating model including governance committees, as well as group and business unit roles focused on the management and oversight of credit risk in accordance with Old Mutual Limited’s Three Lines of Defense Model. The Group implements formalised and strict escalation processes relating to credit governance and the application, testing and monitoring of risk mitigation actions.
Each investment credit asset acquired follows a strict credit approval process, supported by a credit analysis considering both qualitative and quantitative aspects taking into account the risk return profile. This includes, inter alia, financial and industry analysis and risk assessments coupled with Environmental, Social and Governance analysis. Where applicable, external public credit ratings are considered and the credit quality of exposures are reviewed at least on an annual basis.
Risk monitoring ensures that the risk management approaches in place are effective. The Group employs an active risk monitoring approach both at Group Level and Business Unit (BU) level based on the stated risk appetite and corresponding limits set to manage credit risk. The Group monitors credit risk at a portfolio level (aggregated over the BUs) whilst BUs monitor credit risk on, inter alia, individual deal, mandate, fund, product, customer segment, regional, counterparty, economic sector category levels, whichever is applicable, as well as on a BU Portfolio level. Credit risk exposures are monitored and assessed using appropriate metrics, including trend analysis and communicated to the relevant governance and management committees. Credit risk is monitored against early warning thresholds and exposures are monitored against limits.
The ongoing monitoring and a proactive view of emerging risks are integrated in the granting of new credit. The credit risk appetite and limits are accordingly adjusted to manage the portfolio in view of actual and potential changes in macroeconomic conditions. Portfolio management actions exists in the investment credit asset environment to reduce the exposure to certain counterparties or industries based on this outlook.
Collateral is mainly used in the investment credit portfolios to mitigate the amount of credit risk taken. This is part of the process to ensure appropriate legal protection in the event of default. Stricter loan covenant or higher levels or better quality collateral are required based on the counterparty and industry outlook.
Within the expected credit loss (ECL) process, the provision is monitored as part of the ongoing management of the underlying credit portfolio. This includes monitoring of the actual credit experience to the expected levels of the following components; default rates, recovery rates and movements between the different ECL stages. The impact of any changes in the ECL parameters is calculated and reported at BU level. These impacts, together with all other credit risk metrics are reported at the management risk credit committee (as subcommittee of the board) on a quarterly basis as part of a forward looking approach to manage credit risk given emerging risks, opportunities and the defined risk appetite. The financial impact of the ECL provision on each BU is included in the monthly finance reporting process.
1.3 Internal credit risk ratings
The Group uses internal credit risk ratings that reflect its assessment of the probability of default of individual counterparties in the investment businesses.
The assessment of credit risk across the Group relies on internally developed rating models to categorise exposures according to their probability of default. The rating models comprises 28 rating categories (OM1 to OM28). These ratings are determined by incorporating both qualitative and quantitative information that builds on information from established rating agencies like Standard & Poors and Moody’s, supplemented with information specific to the counterparty and other external information that could affect the counterparty’s behaviour.
At initial recognition, each risk exposure is allocated to the credit rating based on the available information about the counterparty. All exposures are subsequently monitored through general and tailored procedures. The data used to monitor these exposures include, but are not limited, to credit information from external rating agencies, changes in business and economic conditions, payment record and aging, customer behaviour, affordability metrics, utilisation of credit limits, probability of default or any other applicable quantitative and qualitative factors.
1.4 Concentrations of credit risk
A concentration of credit risk exists when a number of counterparties are located in a geographical region or are engaged in similar activities and have similar economic characteristics that would cause their ability to meet contractual obligations to be similarly affected by changes in economic or other conditions.
The Group manages its credit exposure based on the carrying value of the financial instruments and insurance and reinsurance assets.
1.5 Exposure to credit risk: Financial assets at amortised cost and debt instruments at fair value through profit or loss
The Group holds collateral and other credit enhancements against certain of its credit exposures.
The following table sets out the maximum exposure to credit risk on financial assets within the scope of IFRS 9’s impairment model, debt instruments measured fair value through profit or loss outside of the scope of IFRS 9’s impairment model:
Separate
At 31 December 2020Rm
Totalfinancial
assets
Within IFRS 9ECL
allowancescope
Outside ofIFRS 9
ECLallowance
scope
Loans and advances 182 182 –
Investments and securities 682,141 922 681,219
Government and government-guaranteed securities 82,937 – 82,937
Other debt securities, preference shares and debentures 83,853 922 82,931
Short-term funds and securities treated as investments 30,377 – 30,377
Equities and pooled investments 484,974 – 484,974
Trade, other receivables and other assets 9,563 1,430 8,133
Derivative financial instruments – assets 10,878 – 10,878
Amount due by Group companies 5,181 5,181 –
Cash and cash equivalents 5,840 5,840 –
E: Financial risk and capital managementE1: Credit risk
OMLACSA Separate and Consolidated Annual Financial Statements for the year ended 31 December 2020 OMLACSA Separate and Consolidated Annual Financial Statements for the year ended 31 December 202052 53OMLACSA Separate and Consolidated Annual Financial Statements for the year ended 31 December 2020OMLACSA Separate and Consolidated Annual Financial Statements for the year ended 31 December 2020
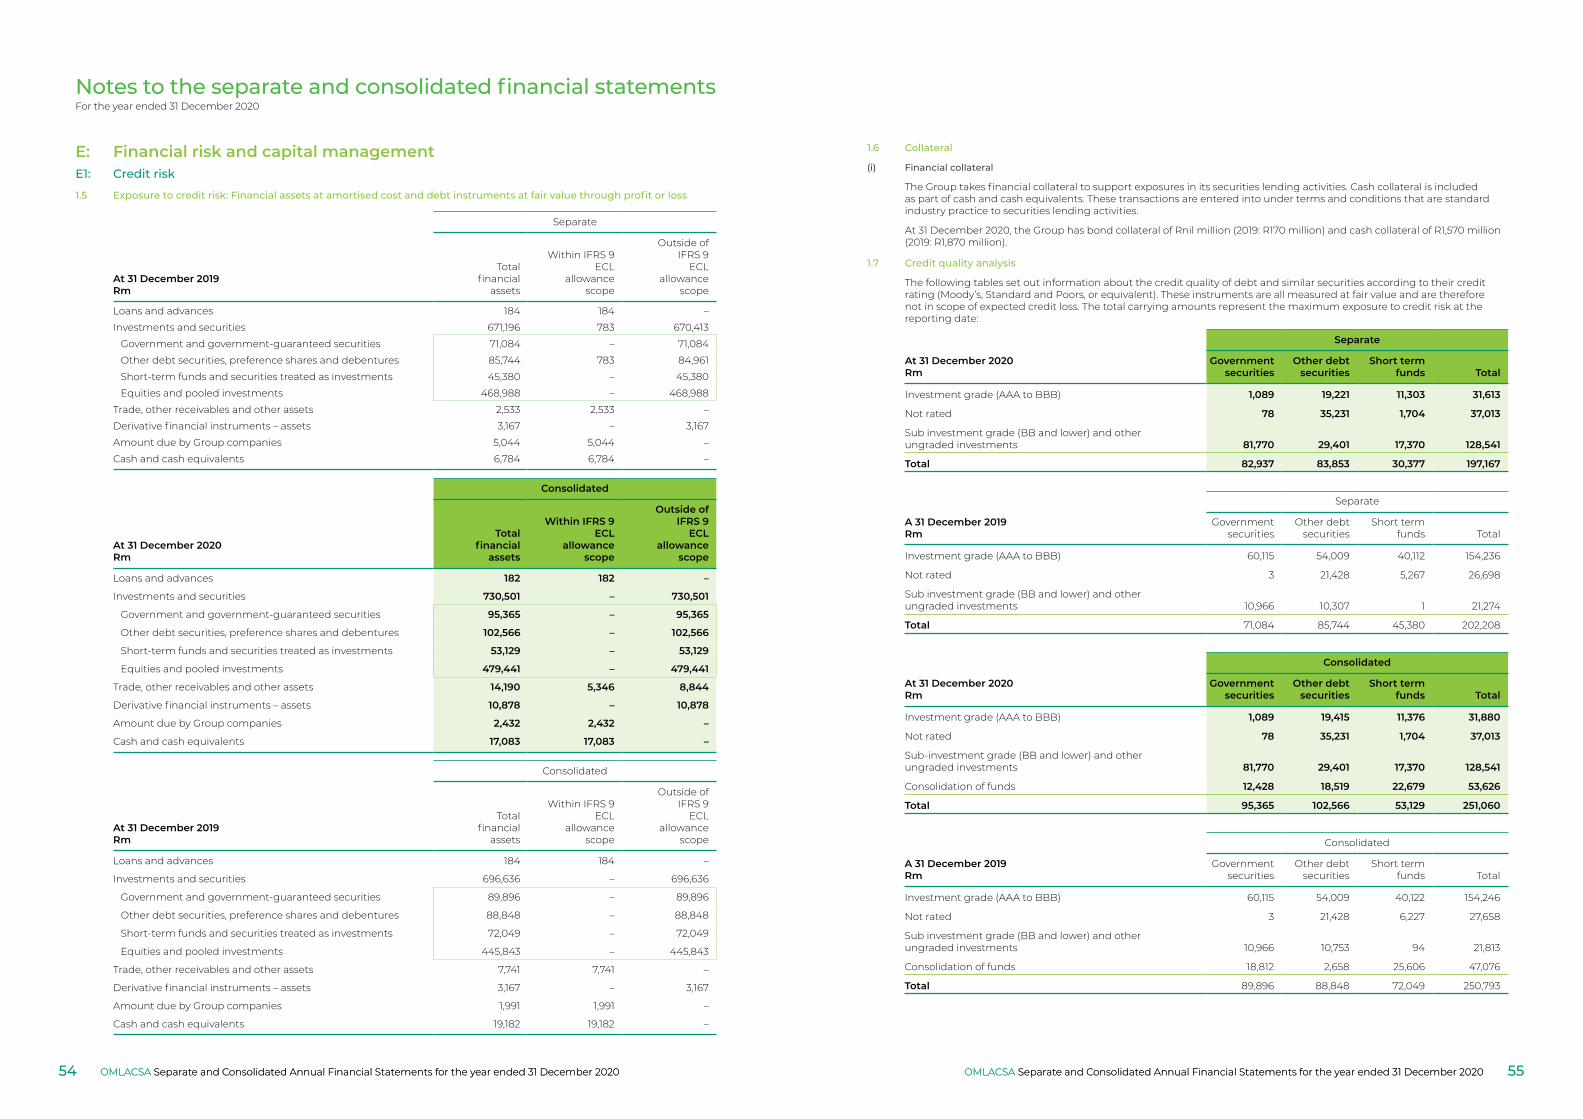
Notes to the separate and consolidated financial statementsFor the year ended 31 December 2020
Separate
At 31 December 2019Rm
Totalfinancial
assets
Within IFRS 9ECL
allowancescope
Outside ofIFRS 9
ECLallowance
scope
Loans and advances 184 184 –
Investments and securities 671,196 783 670,413
Government and government-guaranteed securities 71,084 – 71,084
Other debt securities, preference shares and debentures 85,744 783 84,961
Short-term funds and securities treated as investments 45,380 – 45,380
Equities and pooled investments 468,988 – 468,988
Trade, other receivables and other assets 2,533 2,533 –
Derivative financial instruments – assets 3,167 – 3,167
Amount due by Group companies 5,044 5,044 –
Cash and cash equivalents 6,784 6,784 –
Consolidated
At 31 December 2020Rm
Totalfinancial
assets
Within IFRS 9ECL
allowancescope
Outside ofIFRS 9
ECLallowance
scope
Loans and advances 182 182 –
Investments and securities 730,501 – 730,501
Government and government-guaranteed securities 95,365 – 95,365
Other debt securities, preference shares and debentures 102,566 – 102,566
Short-term funds and securities treated as investments 53,129 – 53,129
Equities and pooled investments 479,441 – 479,441
Trade, other receivables and other assets 14,190 5,346 8,844
Derivative financial instruments – assets 10,878 – 10,878
Amount due by Group companies 2,432 2,432 –
Cash and cash equivalents 17,083 17,083 –
Consolidated
At 31 December 2019Rm
Totalfinancial
assets
Within IFRS 9ECL
allowancescope
Outside ofIFRS 9
ECLallowance
scope
Loans and advances 184 184 –
Investments and securities 696,636 – 696,636
Government and government-guaranteed securities 89,896 – 89,896
Other debt securities, preference shares and debentures 88,848 – 88,848
Short-term funds and securities treated as investments 72,049 – 72,049
Equities and pooled investments 445,843 – 445,843
Trade, other receivables and other assets 7,741 7,741 –
Derivative financial instruments – assets 3,167 – 3,167
Amount due by Group companies 1,991 1,991 –
Cash and cash equivalents 19,182 19,182 –
1.6 Collateral
(i) Financial collateral
The Group takes financial collateral to support exposures in its securities lending activities. Cash collateral is included as part of cash and cash equivalents. These transactions are entered into under terms and conditions that are standard industry practice to securities lending activities.
At 31 December 2020, the Group has bond collateral of Rnil million (2019: R170 million) and cash collateral of R1,570 million (2019: R1,870 million).
1.7 Credit quality analysis
The following tables set out information about the credit quality of debt and similar securities according to their credit rating (Moody’s, Standard and Poors, or equivalent). These instruments are all measured at fair value and are therefore not in scope of expected credit loss. The total carrying amounts represent the maximum exposure to credit risk at the reporting date:
At 31 December 2020Rm
Separate
Governmentsecurities
Other debtsecurities
Short termfunds Total
Investment grade (AAA to BBB) 1,089 19,221 11,303 31,613
Not rated 78 35,231 1,704 37,013
Sub investment grade (BB and lower) and other ungraded investments 81,770 29,401 17,370 128,541
Total 82,937 83,853 30,377 197,167
A 31 December 2019Rm
Separate
Governmentsecurities
Other debtsecurities
Short termfunds Total
Investment grade (AAA to BBB) 60,115 54,009 40,112 154,236
Not rated 3 21,428 5,267 26,698
Sub investment grade (BB and lower) and other ungraded investments 10,966 10,307 1 21,274
Total 71,084 85,744 45,380 202,208
At 31 December 2020Rm
Consolidated
Governmentsecurities
Other debtsecurities
Short termfunds Total
Investment grade (AAA to BBB) 1,089 19,415 11,376 31,880
Not rated 78 35,231 1,704 37,013
Sub-investment grade (BB and lower) and other ungraded investments 81,770 29,401 17,370 128,541
Consolidation of funds 12,428 18,519 22,679 53,626
Total 95,365 102,566 53,129 251,060
A 31 December 2019Rm
Consolidated
Governmentsecurities
Other debtsecurities
Short termfunds Total
Investment grade (AAA to BBB) 60,115 54,009 40,122 154,246
Not rated 3 21,428 6,227 27,658
Sub investment grade (BB and lower) and other ungraded investments 10,966 10,753 94 21,813
Consolidation of funds 18,812 2,658 25,606 47,076
Total 89,896 88,848 72,049 250,793
E: Financial risk and capital managementE1: Credit risk
1.5 Exposure to credit risk: Financial assets at amortised cost and debt instruments at fair value through profit or loss
OMLACSA Separate and Consolidated Annual Financial Statements for the year ended 31 December 2020 OMLACSA Separate and Consolidated Annual Financial Statements for the year ended 31 December 202054 55OMLACSA Separate and Consolidated Annual Financial Statements for the year ended 31 December 2020OMLACSA Separate and Consolidated Annual Financial Statements for the year ended 31 December 2020
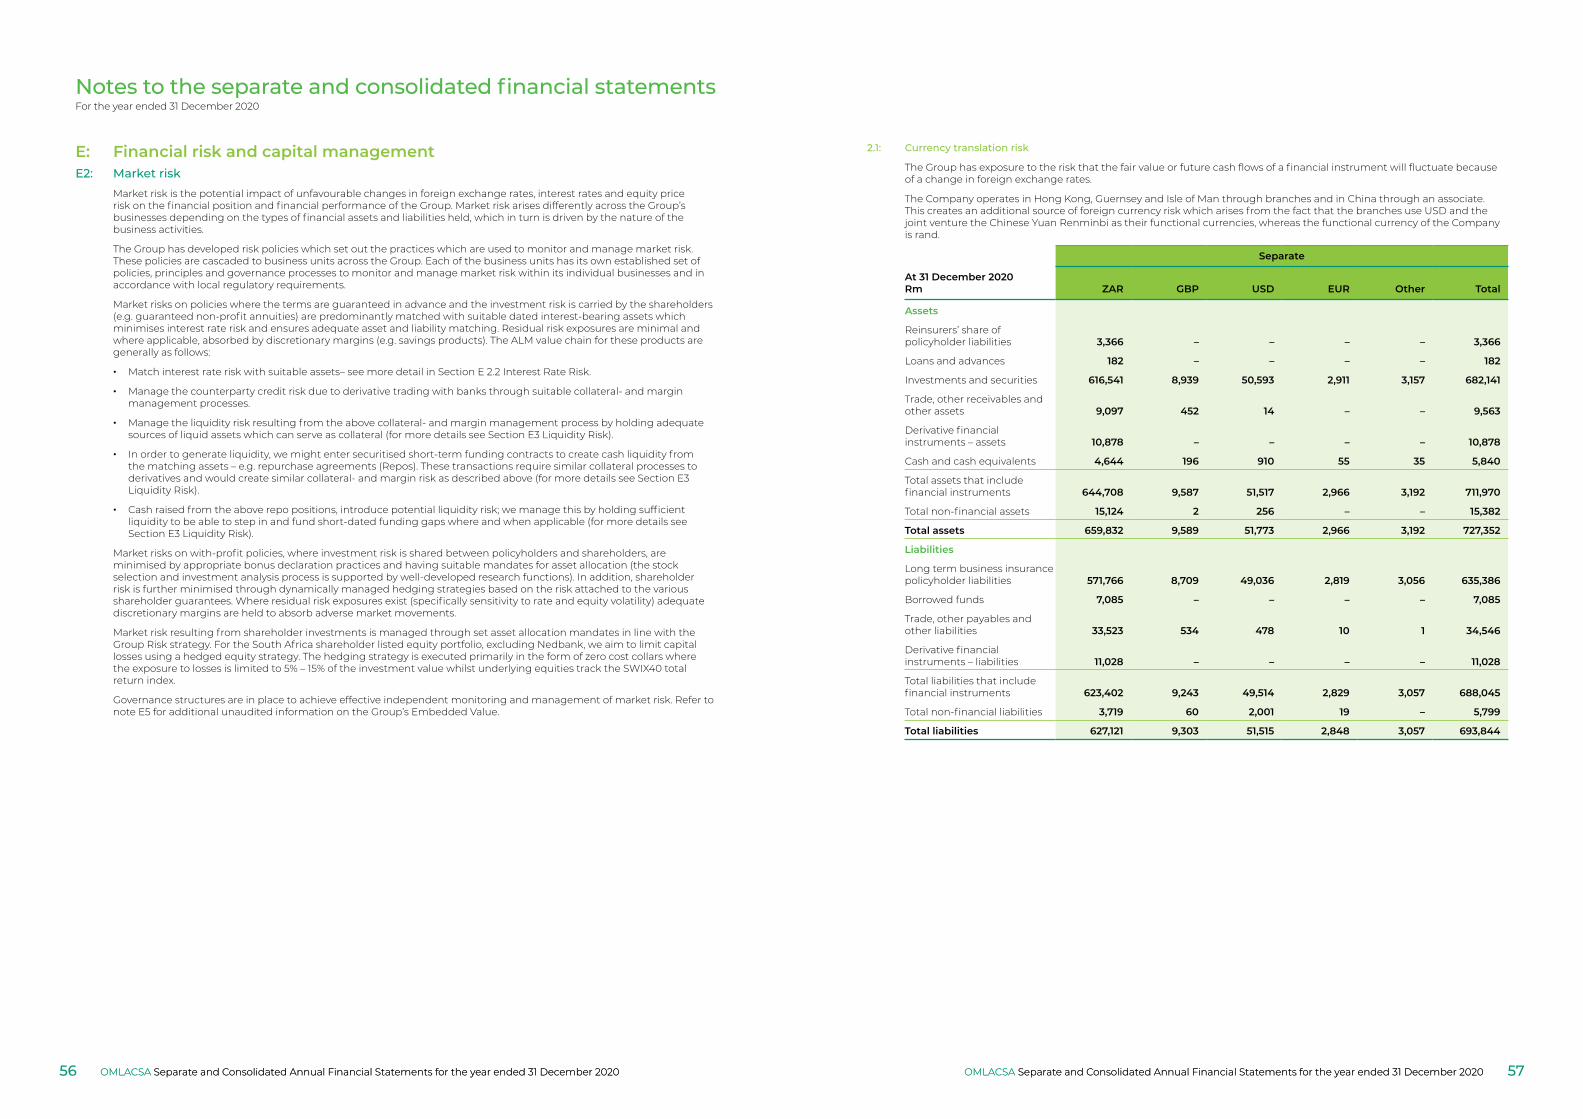
Notes to the separate and consolidated financial statementsFor the year ended 31 December 2020
2.1: Currency translation risk
The Group has exposure to the risk that the fair value or future cash flows of a financial instrument will fluctuate because of a change in foreign exchange rates.
The Company operates in Hong Kong, Guernsey and Isle of Man through branches and in China through an associate. This creates an additional source of foreign currency risk which arises from the fact that the branches use USD and the joint venture the Chinese Yuan Renminbi as their functional currencies, whereas the functional currency of the Company is rand.
Separate
At 31 December 2020Rm ZAR GBP USD EUR Other Total
Assets
Reinsurers’ share of policyholder liabilities 3,366 – – – – 3,366
Loans and advances 182 – – – – 182
Investments and securities 616,541 8,939 50,593 2,911 3,157 682,141
Trade, other receivables and other assets 9,097 452 14 – – 9,563
Derivative financial instruments – assets 10,878 – – – – 10,878
Cash and cash equivalents 4,644 196 910 55 35 5,840
Total assets that include financial instruments 644,708 9,587 51,517 2,966 3,192 711,970
Total non-financial assets 15,124 2 256 – – 15,382
Total assets 659,832 9,589 51,773 2,966 3,192 727,352
Liabilities
Long term business insurance policyholder liabilities 571,766 8,709 49,036 2,819 3,056 635,386
Borrowed funds 7,085 – – – – 7,085
Trade, other payables and other liabilities 33,523 534 478 10 1 34,546
Derivative financial instruments – liabilities 11,028 – – – – 11,028
Total liabilities that include financial instruments 623,402 9,243 49,514 2,829 3,057 688,045
Total non-financial liabilities 3,719 60 2,001 19 – 5,799
Total liabilities 627,121 9,303 51,515 2,848 3,057 693,844
E: Financial risk and capital managementE2: Market risk
Market risk is the potential impact of unfavourable changes in foreign exchange rates, interest rates and equity price risk on the financial position and financial performance of the Group. Market risk arises differently across the Group’s businesses depending on the types of financial assets and liabilities held, which in turn is driven by the nature of the business activities.
The Group has developed risk policies which set out the practices which are used to monitor and manage market risk. These policies are cascaded to business units across the Group. Each of the business units has its own established set of policies, principles and governance processes to monitor and manage market risk within its individual businesses and in accordance with local regulatory requirements.
Market risks on policies where the terms are guaranteed in advance and the investment risk is carried by the shareholders (e.g. guaranteed non-profit annuities) are predominantly matched with suitable dated interest-bearing assets which minimises interest rate risk and ensures adequate asset and liability matching. Residual risk exposures are minimal and where applicable, absorbed by discretionary margins (e.g. savings products). The ALM value chain for these products are generally as follows:
• Match interest rate risk with suitable assets– see more detail in Section E 2.2 Interest Rate Risk.
• Manage the counterparty credit risk due to derivative trading with banks through suitable collateral- and margin management processes.
• Manage the liquidity risk resulting from the above collateral- and margin management process by holding adequate sources of liquid assets which can serve as collateral (for more details see Section E3 Liquidity Risk).
• In order to generate liquidity, we might enter securitised short-term funding contracts to create cash liquidity from the matching assets – e.g. repurchase agreements (Repos). These transactions require similar collateral processes to derivatives and would create similar collateral- and margin risk as described above (for more details see Section E3 Liquidity Risk).
• Cash raised from the above repo positions, introduce potential liquidity risk; we manage this by holding sufficient liquidity to be able to step in and fund short-dated funding gaps where and when applicable (for more details see Section E3 Liquidity Risk).
Market risks on with-profit policies, where investment risk is shared between policyholders and shareholders, are minimised by appropriate bonus declaration practices and having suitable mandates for asset allocation (the stock selection and investment analysis process is supported by well-developed research functions). In addition, shareholder risk is further minimised through dynamically managed hedging strategies based on the risk attached to the various shareholder guarantees. Where residual risk exposures exist (specifically sensitivity to rate and equity volatility) adequate discretionary margins are held to absorb adverse market movements.
Market risk resulting from shareholder investments is managed through set asset allocation mandates in line with the Group Risk strategy. For the South Africa shareholder listed equity portfolio, excluding Nedbank, we aim to limit capital losses using a hedged equity strategy. The hedging strategy is executed primarily in the form of zero cost collars where the exposure to losses is limited to 5% – 15% of the investment value whilst underlying equities track the SWIX40 total return index.
Governance structures are in place to achieve effective independent monitoring and management of market risk. Refer to note E5 for additional unaudited information on the Group’s Embedded Value.
OMLACSA Separate and Consolidated Annual Financial Statements for the year ended 31 December 2020 OMLACSA Separate and Consolidated Annual Financial Statements for the year ended 31 December 202056 57OMLACSA Separate and Consolidated Annual Financial Statements for the year ended 31 December 2020OMLACSA Separate and Consolidated Annual Financial Statements for the year ended 31 December 2020
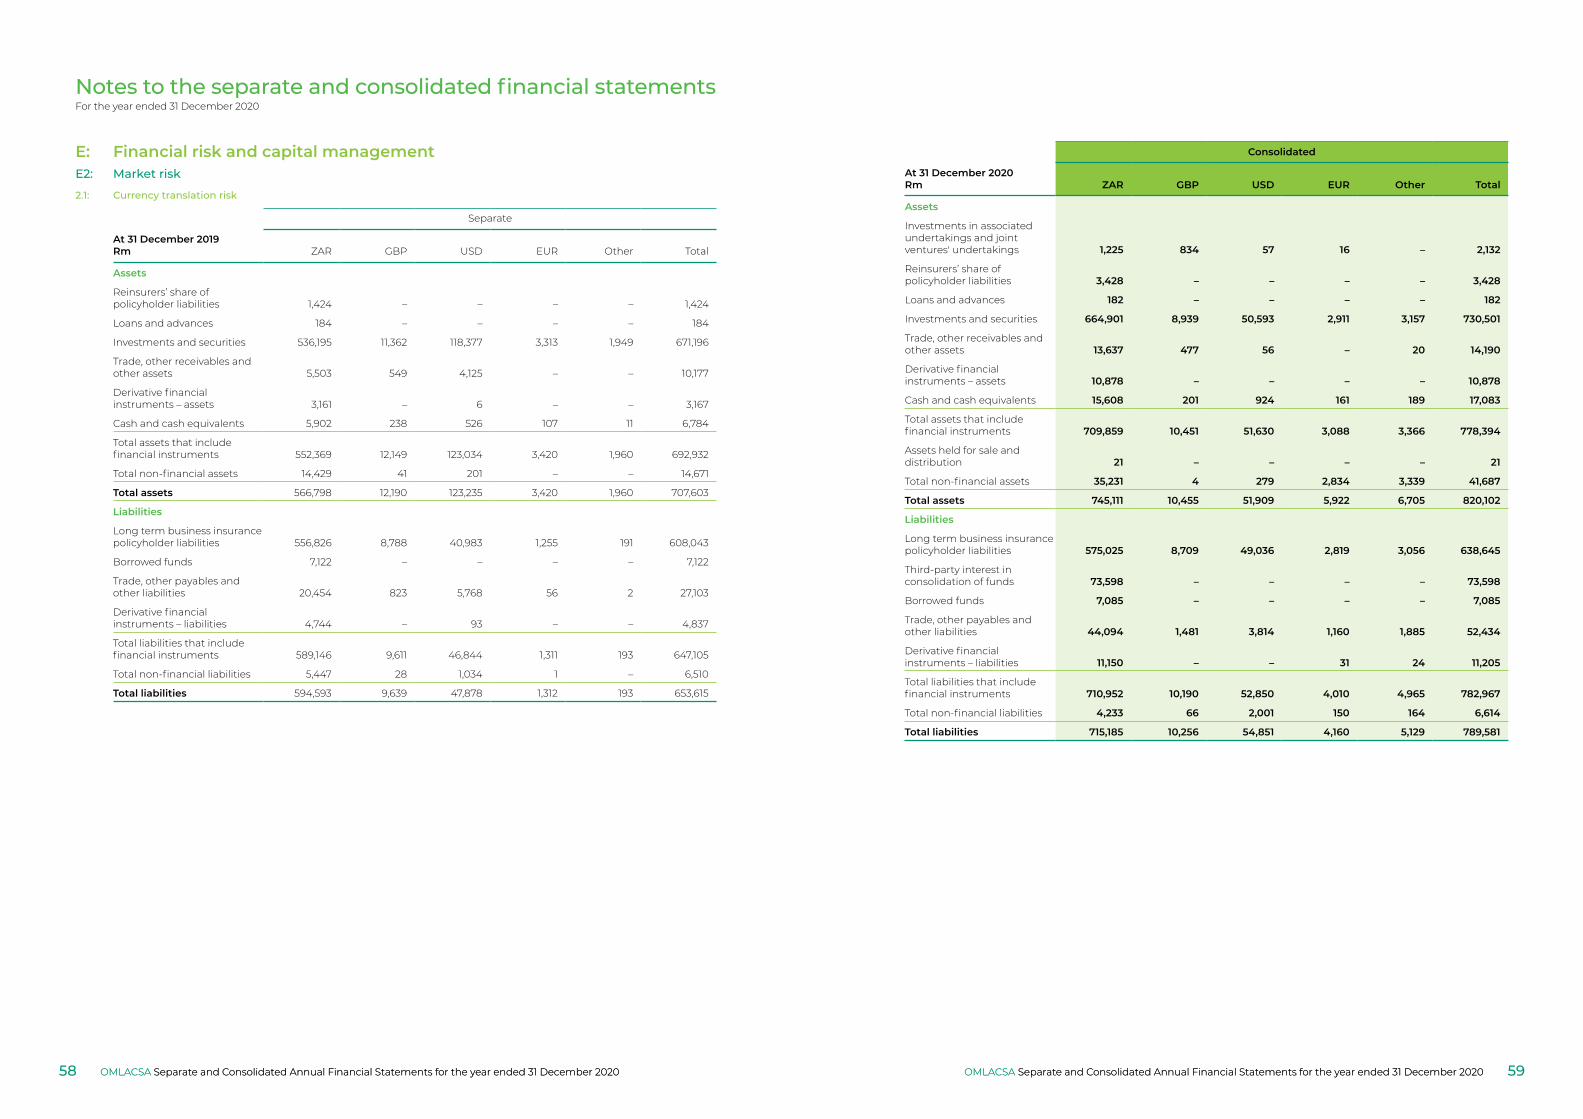
Notes to the separate and consolidated financial statementsFor the year ended 31 December 2020
Consolidated
At 31 December 2020Rm ZAR GBP USD EUR Other Total
Assets
Investments in associated undertakings and joint ventures' undertakings 1,225 834 57 16 – 2,132
Reinsurers’ share of policyholder liabilities 3,428 – – – – 3,428
Loans and advances 182 – – – – 182
Investments and securities 664,901 8,939 50,593 2,911 3,157 730,501
Trade, other receivables and other assets 13,637 477 56 – 20 14,190
Derivative financial instruments – assets 10,878 – – – – 10,878
Cash and cash equivalents 15,608 201 924 161 189 17,083
Total assets that include financial instruments 709,859 10,451 51,630 3,088 3,366 778,394
Assets held for sale and distribution 21 – – – – 21
Total non-financial assets 35,231 4 279 2,834 3,339 41,687
Total assets 745,111 10,455 51,909 5,922 6,705 820,102
Liabilities
Long term business insurance policyholder liabilities 575,025 8,709 49,036 2,819 3,056 638,645
Third-party interest in consolidation of funds 73,598 – – – – 73,598
Borrowed funds 7,085 – – – – 7,085
Trade, other payables and other liabilities 44,094 1,481 3,814 1,160 1,885 52,434
Derivative financial instruments – liabilities 11,150 – – 31 24 11,205
Total liabilities that include financial instruments 710,952 10,190 52,850 4,010 4,965 782,967
Total non-financial liabilities 4,233 66 2,001 150 164 6,614
Total liabilities 715,185 10,256 54,851 4,160 5,129 789,581
E: Financial risk and capital managementE2: Market risk
2.1: Currency translation risk
Separate
At 31 December 2019Rm ZAR GBP USD EUR Other Total
Assets
Reinsurers’ share of policyholder liabilities 1,424 – – – – 1,424
Loans and advances 184 – – – – 184
Investments and securities 536,195 11,362 118,377 3,313 1,949 671,196
Trade, other receivables and other assets 5,503 549 4,125 – – 10,177
Derivative financial instruments – assets 3,161 – 6 – – 3,167
Cash and cash equivalents 5,902 238 526 107 11 6,784
Total assets that include financial instruments 552,369 12,149 123,034 3,420 1,960 692,932
Total non-financial assets 14,429 41 201 – – 14,671
Total assets 566,798 12,190 123,235 3,420 1,960 707,603
Liabilities
Long term business insurance policyholder liabilities 556,826 8,788 40,983 1,255 191 608,043
Borrowed funds 7,122 – – – – 7,122
Trade, other payables and other liabilities 20,454 823 5,768 56 2 27,103
Derivative financial instruments – liabilities 4,744 – 93 – – 4,837
Total liabilities that include financial instruments 589,146 9,611 46,844 1,311 193 647,105
Total non-financial liabilities 5,447 28 1,034 1 – 6,510
Total liabilities 594,593 9,639 47,878 1,312 193 653,615
OMLACSA Separate and Consolidated Annual Financial Statements for the year ended 31 December 2020 OMLACSA Separate and Consolidated Annual Financial Statements for the year ended 31 December 202058 59OMLACSA Separate and Consolidated Annual Financial Statements for the year ended 31 December 2020OMLACSA Separate and Consolidated Annual Financial Statements for the year ended 31 December 2020
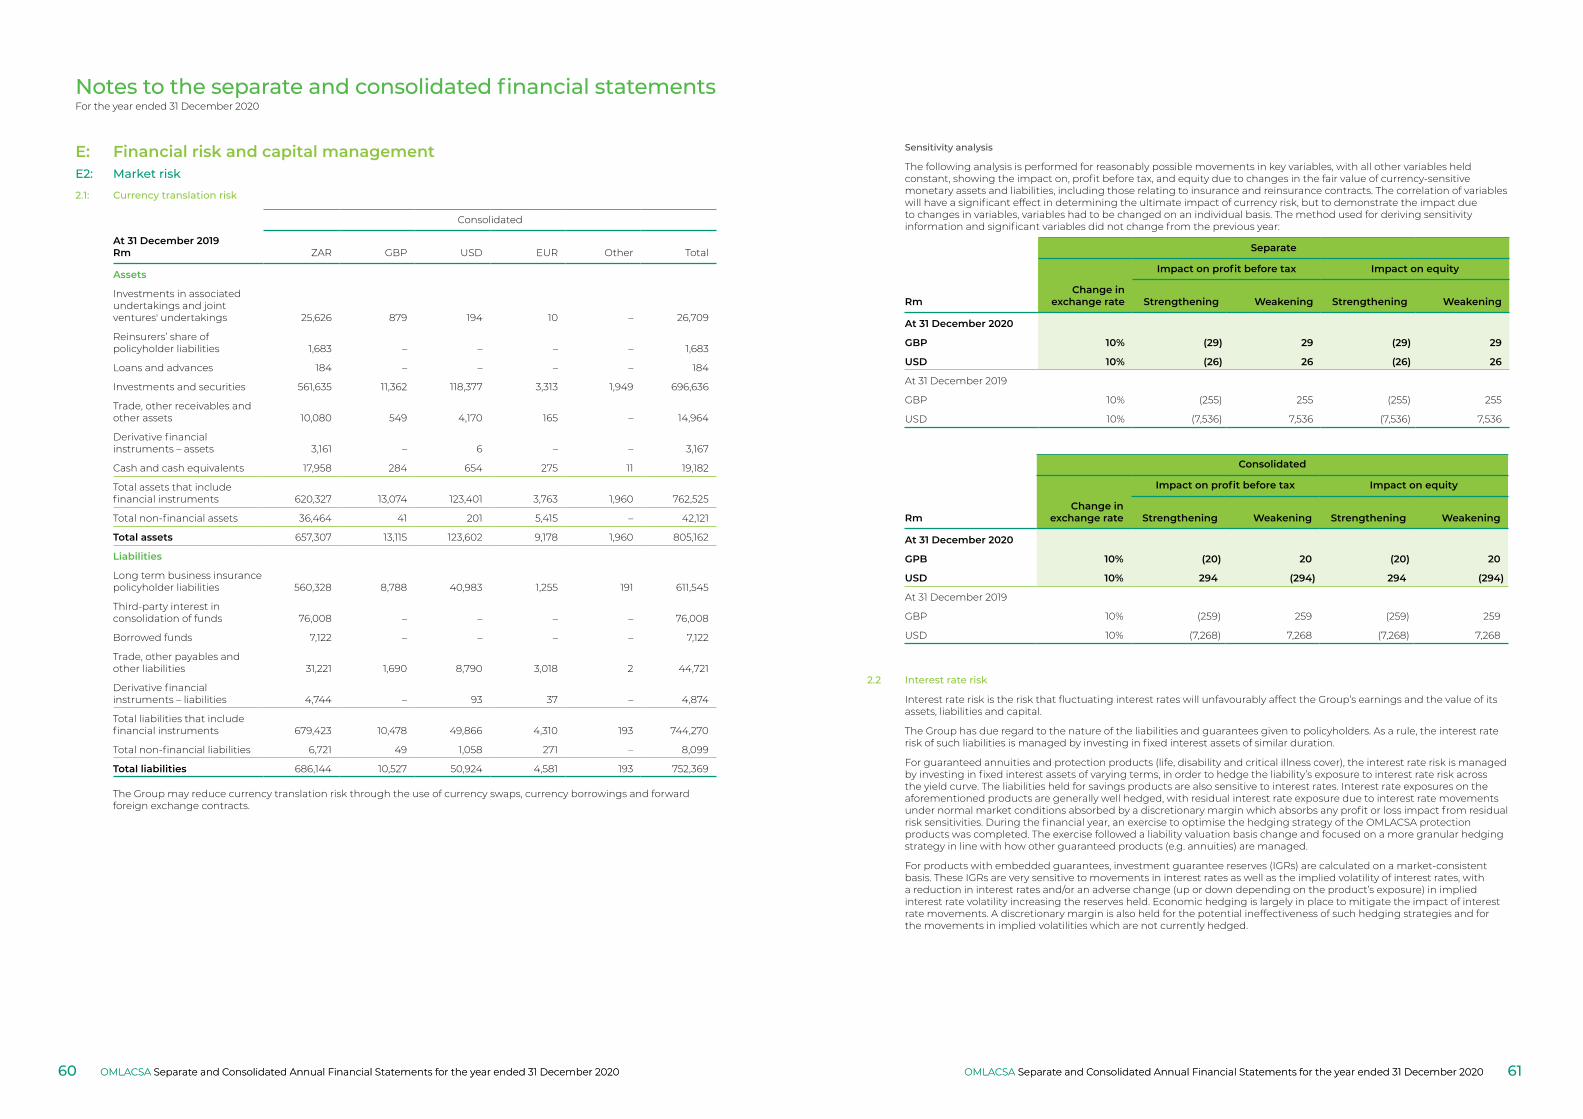
Notes to the separate and consolidated financial statementsFor the year ended 31 December 2020
Consolidated
At 31 December 2019Rm ZAR GBP USD EUR Other Total
Assets
Investments in associated undertakings and joint ventures' undertakings 25,626 879 194 10 – 26,709
Reinsurers’ share of policyholder liabilities 1,683 – – – – 1,683
Loans and advances 184 – – – – 184
Investments and securities 561,635 11,362 118,377 3,313 1,949 696,636
Trade, other receivables and other assets 10,080 549 4,170 165 – 14,964
Derivative financial instruments – assets 3,161 – 6 – – 3,167
Cash and cash equivalents 17,958 284 654 275 11 19,182
Total assets that include financial instruments 620,327 13,074 123,401 3,763 1,960 762,525
Total non-financial assets 36,464 41 201 5,415 – 42,121
Total assets 657,307 13,115 123,602 9,178 1,960 805,162
Liabilities
Long term business insurance policyholder liabilities 560,328 8,788 40,983 1,255 191 611,545
Third-party interest in consolidation of funds 76,008 – – – – 76,008
Borrowed funds 7,122 – – – – 7,122
Trade, other payables and other liabilities 31,221 1,690 8,790 3,018 2 44,721
Derivative financial instruments – liabilities 4,744 – 93 37 – 4,874
Total liabilities that include financial instruments 679,423 10,478 49,866 4,310 193 744,270
Total non-financial liabilities 6,721 49 1,058 271 – 8,099
Total liabilities 686,144 10,527 50,924 4,581 193 752,369
The Group may reduce currency translation risk through the use of currency swaps, currency borrowings and forward foreign exchange contracts.
Sensitivity analysis
The following analysis is performed for reasonably possible movements in key variables, with all other variables held constant, showing the impact on, profit before tax, and equity due to changes in the fair value of currency-sensitive monetary assets and liabilities, including those relating to insurance and reinsurance contracts. The correlation of variables will have a significant effect in determining the ultimate impact of currency risk, but to demonstrate the impact due to changes in variables, variables had to be changed on an individual basis. The method used for deriving sensitivity information and significant variables did not change from the previous year:
Separate
Impact on profit before tax Impact on equity
RmChange in
exchange rate Strengthening Weakening Strengthening Weakening
At 31 December 2020
GBP 10% (29) 29 (29) 29
USD 10% (26) 26 (26) 26
At 31 December 2019
GBP 10% (255) 255 (255) 255
USD 10% (7,536) 7,536 (7,536) 7,536
Consolidated
Impact on profit before tax Impact on equity
RmChange in
exchange rate Strengthening Weakening Strengthening Weakening
At 31 December 2020
GPB 10% (20) 20 (20) 20
USD 10% 294 (294) 294 (294)
At 31 December 2019
GBP 10% (259) 259 (259) 259
USD 10% (7,268) 7,268 (7,268) 7,268
2.2 Interest rate risk
Interest rate risk is the risk that fluctuating interest rates will unfavourably affect the Group’s earnings and the value of its assets, liabilities and capital.
The Group has due regard to the nature of the liabilities and guarantees given to policyholders. As a rule, the interest rate risk of such liabilities is managed by investing in fixed interest assets of similar duration.
For guaranteed annuities and protection products (life, disability and critical illness cover), the interest rate risk is managed by investing in fixed interest assets of varying terms, in order to hedge the liability’s exposure to interest rate risk across the yield curve. The liabilities held for savings products are also sensitive to interest rates. Interest rate exposures on the aforementioned products are generally well hedged, with residual interest rate exposure due to interest rate movements under normal market conditions absorbed by a discretionary margin which absorbs any profit or loss impact from residual risk sensitivities. During the financial year, an exercise to optimise the hedging strategy of the OMLACSA protection products was completed. The exercise followed a liability valuation basis change and focused on a more granular hedging strategy in line with how other guaranteed products (e.g. annuities) are managed.
For products with embedded guarantees, investment guarantee reserves (IGRs) are calculated on a market-consistent basis. These IGRs are very sensitive to movements in interest rates as well as the implied volatility of interest rates, with a reduction in interest rates and/or an adverse change (up or down depending on the product’s exposure) in implied interest rate volatility increasing the reserves held. Economic hedging is largely in place to mitigate the impact of interest rate movements. A discretionary margin is also held for the potential ineffectiveness of such hedging strategies and for the movements in implied volatilities which are not currently hedged.
E: Financial risk and capital managementE2: Market risk
2.1: Currency translation risk
OMLACSA Separate and Consolidated Annual Financial Statements for the year ended 31 December 2020 OMLACSA Separate and Consolidated Annual Financial Statements for the year ended 31 December 202060 61OMLACSA Separate and Consolidated Annual Financial Statements for the year ended 31 December 2020OMLACSA Separate and Consolidated Annual Financial Statements for the year ended 31 December 2020
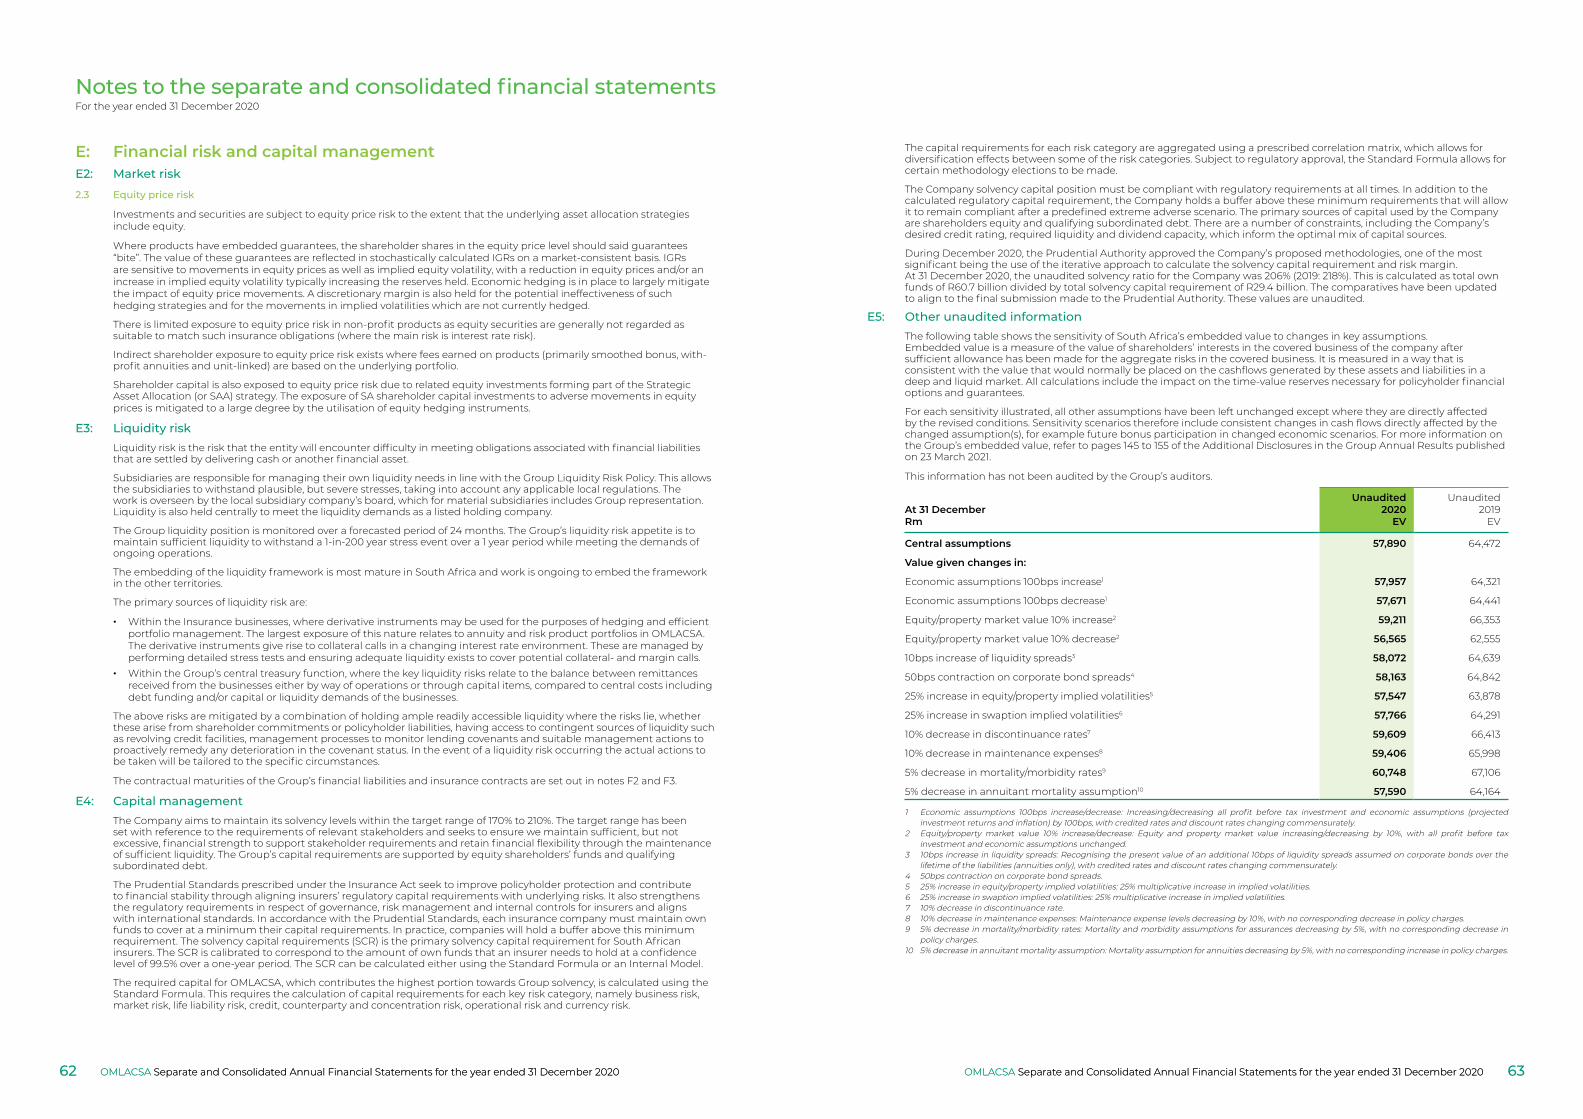
Notes to the separate and consolidated financial statementsFor the year ended 31 December 2020
2.3 Equity price risk
Investments and securities are subject to equity price risk to the extent that the underlying asset allocation strategies include equity.
Where products have embedded guarantees, the shareholder shares in the equity price level should said guarantees “bite”. The value of these guarantees are reflected in stochastically calculated IGRs on a market-consistent basis. IGRs are sensitive to movements in equity prices as well as implied equity volatility, with a reduction in equity prices and/or an increase in implied equity volatility typically increasing the reserves held. Economic hedging is in place to largely mitigate the impact of equity price movements. A discretionary margin is also held for the potential ineffectiveness of such hedging strategies and for the movements in implied volatilities which are not currently hedged.
There is limited exposure to equity price risk in non-profit products as equity securities are generally not regarded as suitable to match such insurance obligations (where the main risk is interest rate risk).
Indirect shareholder exposure to equity price risk exists where fees earned on products (primarily smoothed bonus, with-profit annuities and unit-linked) are based on the underlying portfolio.
Shareholder capital is also exposed to equity price risk due to related equity investments forming part of the Strategic Asset Allocation (or SAA) strategy. The exposure of SA shareholder capital investments to adverse movements in equity prices is mitigated to a large degree by the utilisation of equity hedging instruments.
E3: Liquidity riskLiquidity risk is the risk that the entity will encounter difficulty in meeting obligations associated with financial liabilities that are settled by delivering cash or another financial asset.
Subsidiaries are responsible for managing their own liquidity needs in line with the Group Liquidity Risk Policy. This allows the subsidiaries to withstand plausible, but severe stresses, taking into account any applicable local regulations. The work is overseen by the local subsidiary company’s board, which for material subsidiaries includes Group representation. Liquidity is also held centrally to meet the liquidity demands as a listed holding company.
The Group liquidity position is monitored over a forecasted period of 24 months. The Group’s liquidity risk appetite is to maintain sufficient liquidity to withstand a 1-in-200 year stress event over a 1 year period while meeting the demands of ongoing operations.
The embedding of the liquidity framework is most mature in South Africa and work is ongoing to embed the framework in the other territories.
The primary sources of liquidity risk are:
• Within the Insurance businesses, where derivative instruments may be used for the purposes of hedging and efficient portfolio management. The largest exposure of this nature relates to annuity and risk product portfolios in OMLACSA. The derivative instruments give rise to collateral calls in a changing interest rate environment. These are managed by performing detailed stress tests and ensuring adequate liquidity exists to cover potential collateral- and margin calls.
• Within the Group’s central treasury function, where the key liquidity risks relate to the balance between remittances received from the businesses either by way of operations or through capital items, compared to central costs including debt funding and/or capital or liquidity demands of the businesses.
The above risks are mitigated by a combination of holding ample readily accessible liquidity where the risks lie, whether these arise from shareholder commitments or policyholder liabilities, having access to contingent sources of liquidity such as revolving credit facilities, management processes to monitor lending covenants and suitable management actions to proactively remedy any deterioration in the covenant status. In the event of a liquidity risk occurring the actual actions to be taken will be tailored to the specific circumstances.
The contractual maturities of the Group’s financial liabilities and insurance contracts are set out in notes F2 and F3.
E4: Capital managementThe Company aims to maintain its solvency levels within the target range of 170% to 210%. The target range has been set with reference to the requirements of relevant stakeholders and seeks to ensure we maintain sufficient, but not excessive, financial strength to support stakeholder requirements and retain financial flexibility through the maintenance of sufficient liquidity. The Group’s capital requirements are supported by equity shareholders’ funds and qualifying subordinated debt.
The Prudential Standards prescribed under the Insurance Act seek to improve policyholder protection and contribute to financial stability through aligning insurers’ regulatory capital requirements with underlying risks. It also strengthens the regulatory requirements in respect of governance, risk management and internal controls for insurers and aligns with international standards. In accordance with the Prudential Standards, each insurance company must maintain own funds to cover at a minimum their capital requirements. In practice, companies will hold a buffer above this minimum requirement. The solvency capital requirements (SCR) is the primary solvency capital requirement for South African insurers. The SCR is calibrated to correspond to the amount of own funds that an insurer needs to hold at a confidence level of 99.5% over a one-year period. The SCR can be calculated either using the Standard Formula or an Internal Model.
The required capital for OMLACSA, which contributes the highest portion towards Group solvency, is calculated using the Standard Formula. This requires the calculation of capital requirements for each key risk category, namely business risk, market risk, life liability risk, credit, counterparty and concentration risk, operational risk and currency risk.
The capital requirements for each risk category are aggregated using a prescribed correlation matrix, which allows for diversification effects between some of the risk categories. Subject to regulatory approval, the Standard Formula allows for certain methodology elections to be made.
The Company solvency capital position must be compliant with regulatory requirements at all times. In addition to the calculated regulatory capital requirement, the Company holds a buffer above these minimum requirements that will allow it to remain compliant after a predefined extreme adverse scenario. The primary sources of capital used by the Company are shareholders equity and qualifying subordinated debt. There are a number of constraints, including the Company’s desired credit rating, required liquidity and dividend capacity, which inform the optimal mix of capital sources.
During December 2020, the Prudential Authority approved the Company’s proposed methodologies, one of the most significant being the use of the iterative approach to calculate the solvency capital requirement and risk margin. At 31 December 2020, the unaudited solvency ratio for the Company was 206% (2019: 218%). This is calculated as total own funds of R60.7 billion divided by total solvency capital requirement of R29.4 billion. The comparatives have been updated to align to the final submission made to the Prudential Authority. These values are unaudited.
E5: Other unaudited informationThe following table shows the sensitivity of South Africa’s embedded value to changes in key assumptions. Embedded value is a measure of the value of shareholders’ interests in the covered business of the company after sufficient allowance has been made for the aggregate risks in the covered business. It is measured in a way that is consistent with the value that would normally be placed on the cashflows generated by these assets and liabilities in a deep and liquid market. All calculations include the impact on the time-value reserves necessary for policyholder financial options and guarantees.
For each sensitivity illustrated, all other assumptions have been left unchanged except where they are directly affected by the revised conditions. Sensitivity scenarios therefore include consistent changes in cash flows directly affected by the changed assumption(s), for example future bonus participation in changed economic scenarios. For more information on the Group’s embedded value, refer to pages 145 to 155 of the Additional Disclosures in the Group Annual Results published on 23 March 2021.
This information has not been audited by the Group’s auditors.
At 31 DecemberRm
Unaudited2020
EV
Unaudited2019
EV
Central assumptions 57,890 64,472
Value given changes in:
Economic assumptions 100bps increase1 57,957 64,321
Economic assumptions 100bps decrease1 57,671 64,441
Equity/property market value 10% increase2 59,211 66,353
Equity/property market value 10% decrease2 56,565 62,555
10bps increase of liquidity spreads3 58,072 64,639
50bps contraction on corporate bond spreads4 58,163 64,842
25% increase in equity/property implied volatilities5 57,547 63,878
25% increase in swaption implied volatilities6 57,766 64,291
10% decrease in discontinuance rates7 59,609 66,413
10% decrease in maintenance expenses8 59,406 65,998
5% decrease in mortality/morbidity rates9 60,748 67,106
5% decrease in annuitant mortality assumption10 57,590 64,164
1 Economic assumptions 100bps increase/decrease: Increasing/decreasing all profit before tax investment and economic assumptions (projected investment returns and inflation) by 100bps, with credited rates and discount rates changing commensurately.
2 Equity/property market value 10% increase/decrease: Equity and property market value increasing/decreasing by 10%, with all profit before tax investment and economic assumptions unchanged.
3 10bps increase in liquidity spreads: Recognising the present value of an additional 10bps of liquidity spreads assumed on corporate bonds over the lifetime of the liabilities (annuities only), with credited rates and discount rates changing commensurately.
4 50bps contraction on corporate bond spreads.5 25% increase in equity/property implied volatilities: 25% multiplicative increase in implied volatilities.6 25% increase in swaption implied volatilities: 25% multiplicative increase in implied volatilities.7 10% decrease in discontinuance rate.8 10% decrease in maintenance expenses: Maintenance expense levels decreasing by 10%, with no corresponding decrease in policy charges.9 5% decrease in mortality/morbidity rates: Mortality and morbidity assumptions for assurances decreasing by 5%, with no corresponding decrease in
policy charges.10 5% decrease in annuitant mortality assumption: Mortality assumption for annuities decreasing by 5%, with no corresponding increase in policy charges.
E: Financial risk and capital managementE2: Market risk
OMLACSA Separate and Consolidated Annual Financial Statements for the year ended 31 December 2020 OMLACSA Separate and Consolidated Annual Financial Statements for the year ended 31 December 202062 63OMLACSA Separate and Consolidated Annual Financial Statements for the year ended 31 December 2020OMLACSA Separate and Consolidated Annual Financial Statements for the year ended 31 December 2020
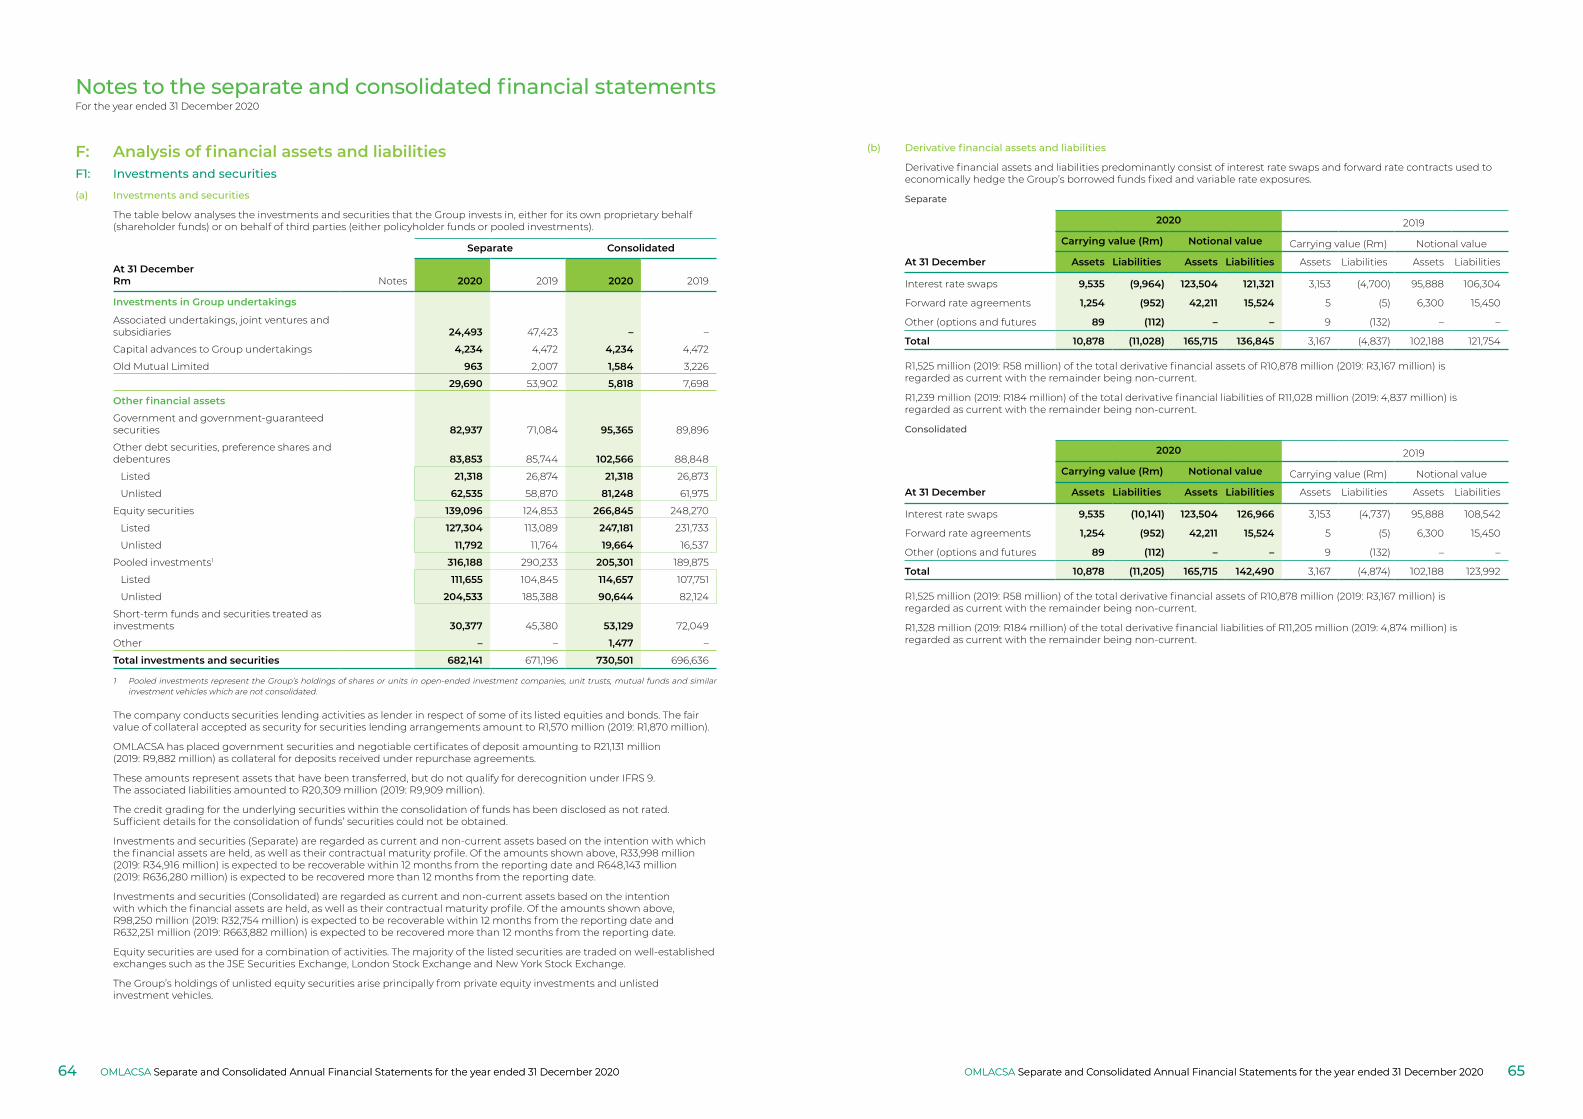
Notes to the separate and consolidated financial statementsFor the year ended 31 December 2020
F: Analysis of financial assets and liabilitiesF1: Investments and securities
(a) Investments and securities
The table below analyses the investments and securities that the Group invests in, either for its own proprietary behalf (shareholder funds) or on behalf of third parties (either policyholder funds or pooled investments).
Separate Consolidated
At 31 DecemberRm Notes 2020 2019 2020 2019
Investments in Group undertakings
Associated undertakings, joint ventures and subsidiaries 24,493 47,423 – –
Capital advances to Group undertakings 4,234 4,472 4,234 4,472
Old Mutual Limited 963 2,007 1,584 3,226
29,690 53,902 5,818 7,698
Other financial assets
Government and government-guaranteed securities 82,937 71,084 95,365 89,896
Other debt securities, preference shares and debentures 83,853 85,744 102,566 88,848
Listed 21,318 26,874 21,318 26,873
Unlisted 62,535 58,870 81,248 61,975
Equity securities 139,096 124,853 266,845 248,270
Listed 127,304 113,089 247,181 231,733
Unlisted 11,792 11,764 19,664 16,537
Pooled investments1 316,188 290,233 205,301 189,875
Listed 111,655 104,845 114,657 107,751
Unlisted 204,533 185,388 90,644 82,124
Short-term funds and securities treated as investments 30,377 45,380 53,129 72,049
Other – – 1,477 –
Total investments and securities 682,141 671,196 730,501 696,636
1 Pooled investments represent the Group’s holdings of shares or units in open-ended investment companies, unit trusts, mutual funds and similar investment vehicles which are not consolidated.
The company conducts securities lending activities as lender in respect of some of its listed equities and bonds. The fair value of collateral accepted as security for securities lending arrangements amount to R1,570 million (2019: R1,870 million).
OMLACSA has placed government securities and negotiable certificates of deposit amounting to R21,131 million (2019: R9,882 million) as collateral for deposits received under repurchase agreements.
These amounts represent assets that have been transferred, but do not qualify for derecognition under IFRS 9. The associated liabilities amounted to R20,309 million (2019: R9,909 million).
The credit grading for the underlying securities within the consolidation of funds has been disclosed as not rated. Sufficient details for the consolidation of funds’ securities could not be obtained.
Investments and securities (Separate) are regarded as current and non-current assets based on the intention with which the financial assets are held, as well as their contractual maturity profile. Of the amounts shown above, R33,998 million (2019: R34,916 million) is expected to be recoverable within 12 months from the reporting date and R648,143 million (2019: R636,280 million) is expected to be recovered more than 12 months from the reporting date.
Investments and securities (Consolidated) are regarded as current and non-current assets based on the intention with which the financial assets are held, as well as their contractual maturity profile. Of the amounts shown above, R98,250 million (2019: R32,754 million) is expected to be recoverable within 12 months from the reporting date and R632,251 million (2019: R663,882 million) is expected to be recovered more than 12 months from the reporting date.
Equity securities are used for a combination of activities. The majority of the listed securities are traded on well-established exchanges such as the JSE Securities Exchange, London Stock Exchange and New York Stock Exchange.
The Group’s holdings of unlisted equity securities arise principally from private equity investments and unlisted investment vehicles.
(b) Derivative financial assets and liabilities
Derivative financial assets and liabilities predominantly consist of interest rate swaps and forward rate contracts used to economically hedge the Group’s borrowed funds fixed and variable rate exposures.
Separate
2020 2019
Carrying value (Rm) Notional value Carrying value (Rm) Notional value
At 31 December Assets Liabilities Assets Liabilities Assets Liabilities Assets Liabilities
Interest rate swaps 9,535 (9,964) 123,504 121,321 3,153 (4,700) 95,888 106,304
Forward rate agreements 1,254 (952) 42,211 15,524 5 (5) 6,300 15,450
Other (options and futures 89 (112) – – 9 (132) – –
Total 10,878 (11,028) 165,715 136,845 3,167 (4,837) 102,188 121,754
R1,525 million (2019: R58 million) of the total derivative financial assets of R10,878 million (2019: R3,167 million) is regarded as current with the remainder being non-current.
R1,239 million (2019: R184 million) of the total derivative financial liabilities of R11,028 million (2019: 4,837 million) is regarded as current with the remainder being non-current.
Consolidated
2020 2019
Carrying value (Rm) Notional value Carrying value (Rm) Notional value
At 31 December Assets Liabilities Assets Liabilities Assets Liabilities Assets Liabilities
Interest rate swaps 9,535 (10,141) 123,504 126,966 3,153 (4,737) 95,888 108,542
Forward rate agreements 1,254 (952) 42,211 15,524 5 (5) 6,300 15,450
Other (options and futures 89 (112) – – 9 (132) – –
Total 10,878 (11,205) 165,715 142,490 3,167 (4,874) 102,188 123,992
R1,525 million (2019: R58 million) of the total derivative financial assets of R10,878 million (2019: R3,167 million) is regarded as current with the remainder being non-current.
R1,328 million (2019: R184 million) of the total derivative financial liabilities of R11,205 million (2019: 4,874 million) is regarded as current with the remainder being non-current.
OMLACSA Separate and Consolidated Annual Financial Statements for the year ended 31 December 2020 OMLACSA Separate and Consolidated Annual Financial Statements for the year ended 31 December 202064 65OMLACSA Separate and Consolidated Annual Financial Statements for the year ended 31 December 2020OMLACSA Separate and Consolidated Annual Financial Statements for the year ended 31 December 2020
Notes to the separate and consolidated financial statementsFor the year ended 31 December 2020
F2: Insurance and investment contracts
Life assurance
Classification of contracts
Life assurance contracts are categorised into insurance contracts, contracts with a discretionary participation feature or investment contracts, in accordance with the classification criteria set out in the paragraphs below.
For the Group’s unit-linked assurance business, contracts are separated into an insurance component and an investment component (known as unbundling) and each unbundled component is accounted for separately in accordance with the accounting policy for that component.
Contracts under which the Group accepts significant insurance risk from another party (the policyholder) by agreeing to compensate the policyholder or other beneficiary if a specified uncertain future event (the insured event) adversely affects the policyholder are classified as insurance contracts. Insurance risk is risk other than financial risk. Contracts accounted for as insurance contracts include life assurance contracts and savings contracts providing more than an insignificant amount of life assurance protection.
Financial risks are the risks of a possible future change in one or more of a specific interest rate, financial instrument price, commodity price, foreign exchange rate, index of prices or rates, a credit rating or credit index, or other variable, provided, in the case of a non-financial variable, that the variable is not specific to a party to the contract.
Contracts with discretionary participation features are those under which the policyholder holds a contractual right to receive additional payments as a supplement to guaranteed minimum payments. These additional payments, the amount and timing of which is at the Group’s discretion, represent a significant portion of the total contractual payments.
These are contractually based on (i) the performance of a specified pool of contracts or a specified type of contract, (ii) realised and/or unrealised investment returns on a specified pool of assets held by the Group or (iii) the profit or loss of the Group. Investment contracts with discretionary participation features, which have no life assurance protection in the policy terms, are accounted for in the same manner as insurance contracts.
Contracts under which the transfer of insurance risk to the Group from the policyholder is not significant (or there is no transfer of insurance risk) and where there is no discretionary participation are classified as investment contracts. Such contracts include unit-linked savings and/or investment contracts sold without life assurance protection and are classified as financial instruments.
Premiums on life assurance
Premiums and annuity considerations receivable under insurance contracts and investment contracts with a discretionary participation feature are stated gross of commission and exclude taxes and levies. Premiums in respect of unit-linked insurance contracts are recognised when the liability is established. Premiums in respect of insurance contracts and investment contracts with a discretionary participation feature are recognised when due for payment.
Amounts received under investment contracts, other than those with a discretionary participation feature, and unit-linked assurance contracts are not recorded through profit or loss, except for fee income and investment income attributable to those contracts, but are accounted for directly through the consolidated statement of financial position as an adjustment to investment contract liabilities.
Claims paid on life assurance
Claims paid under insurance contracts and investment contracts with a discretionary participating feature include maturities, annuities, surrenders, death and disability payments.
Maturity and annuity claims are recorded as they fall due for payment. Death and disability claims and surrenders are accounted for in profit or loss when notified.
Reinsurance are recoveries in profit or loss are recognised in profit or loss in the same period as the related claim.
Amounts paid under investment contracts other than those with a discretionary participating feature are recorded as reductions of the investment contract liabilities.
Life insurance contract liabilities
Provisions in respect of South African business are made in accordance with the Financial Soundness Valuation basis as set out in the latest version of the guidelines issued by the Actuarial Society of South Africa in Standard of Actuarial Practice (SAP) 104.
Under these guidelines, provisions are valued using realistic expectations of future experience, with margins for prudence and deferral of profit emergence.
Provisions for investment contracts with a discretionary participating feature are also computed using the gross premium valuation method in accordance with the Financial Soundness Valuation basis. Surplus allocated to policyholders but not yet distributed related to these contracts is included as part of life insurance contract liabilities.
Reserves for immediate annuities and other guaranteed payments are computed on the prospective method, which produces reserves equal to the present value of future benefit payments.
Derivative instruments embedded in a life insurance contract are not separated and measured at fair value if the embedded derivative itself qualifies for recognition as a life insurance contract. In this case the entire contract is measured as described above.
The Group performs liability adequacy testing at a business unit level on its insurance liabilities and financial guarantee contracts to ensure that the carrying amount of its liabilities (less related deferred acquisition costs and intangible assets) is sufficient in view of estimated future cash flows. When performing the liability adequacy test, the Group discounts all contractual cash flows and compares this amount to the carrying value of the liability at discount rates appropriate to the business in question. Where a shortfall is identified, an additional provision is made by increasing the liability held. The provision assumptions and estimation techniques are periodically reviewed, with any changes in estimates reflected in profit or loss as they occur.
In respect of the South African life assurance business, shadow accounting is applied to life insurance contract liabilities where the underlying measurement of the policyholder liability depends directly on the value of owner-occupied property and the unrealised gains or losses on such property, which are recognised in other comprehensive income. The shadow accounting adjustment to life insurance contract liabilities is recognised in other comprehensive income to the extent that the unrealised gains or losses on owner-occupied property backing life insurance contract liabilities are also recognised directly in other comprehensive income.
Financial guarantees embedded in insurance contracts are recognised as part of the overall measurement of insurance contracts.
Investment contract liabilities
Investment contract liabilities in respect of the Group’s business other than unit-linked business are recorded at amortised cost unless they are designated at fair value through profit or loss in order to eliminate or significantly reduce a measurement or recognition inconsistency, for example where the corresponding assets are recorded at fair value through profit or loss.
Investment contract liabilities in respect of the Group’s unit-linked business are recorded at fair value. For such liabilities, including the deposit component of unbundled unit-linked assurance contracts, fair value is calculated as the account balance, which is the value of the units allocated to the policyholder, based on the bid price of the assets in the underlying fund (adjusted for tax).
Investment contract liabilities measured at fair value are subject to a ‘deposit floor’ such that the liability established cannot be less than the amount repayable on demand.
Acquisition costs
Acquisition costs for insurance contracts comprise all direct and indirect costs arising from the sale of insurance contracts.
As the gross premium valuation method used in South Africa to determine insurance contract liabilities makes implicit allowance for the deferral of acquisition costs, no explicit deferred acquisition cost asset is recognised in the consolidated statement of financial position for the contracts issued in these areas.
Deferral of costs on insurance business is limited to the extent that they are deemed recoverable from available future margins.
Reinsurance
The Group cedes reinsurance in the normal course of business for the purpose of limiting its net loss potential through the diversification of its risks. Assets, liabilities and income and expense arising from ceded reinsurance contracts are presented separately from the related assets, liabilities, income and expense from the related insurance contracts because the reinsurance arrangements do not relieve the Group from its direct obligations to its policyholders.
Only rights under contracts that give rise to a significant transfer of insurance risk are accounted for as reinsurance assets.
Rights under contracts that do not transfer significant insurance risk are accounted for as financial instruments.
Reinsurance premiums for ceded reinsurance are recognised as an expense on a basis that is consistent with the recognition basis for the premiums on the related insurance contracts.
The amounts recognised as reinsurance assets are measured on a basis that is consistent with the measurement of the insurance liabilities held in respect of the related insurance contracts. Reinsurance assets include recoveries due from reinsurance companies in respect of claims paid.
Reinsurance assets are assessed for impairment at each reporting date. An asset is deemed impaired if there is objective evidence, as a result of an event that occurred after its initial recognition, that the Group may not recover all amounts due, and that the event has a reliably measurable impact on the amounts that the Group will receive from the reinsurer.
F: Analysis of financial assets and liabilities
OMLACSA Separate and Consolidated Annual Financial Statements for the year ended 31 December 2020 OMLACSA Separate and Consolidated Annual Financial Statements for the year ended 31 December 202066 67OMLACSA Separate and Consolidated Annual Financial Statements for the year ended 31 December 2020OMLACSA Separate and Consolidated Annual Financial Statements for the year ended 31 December 2020
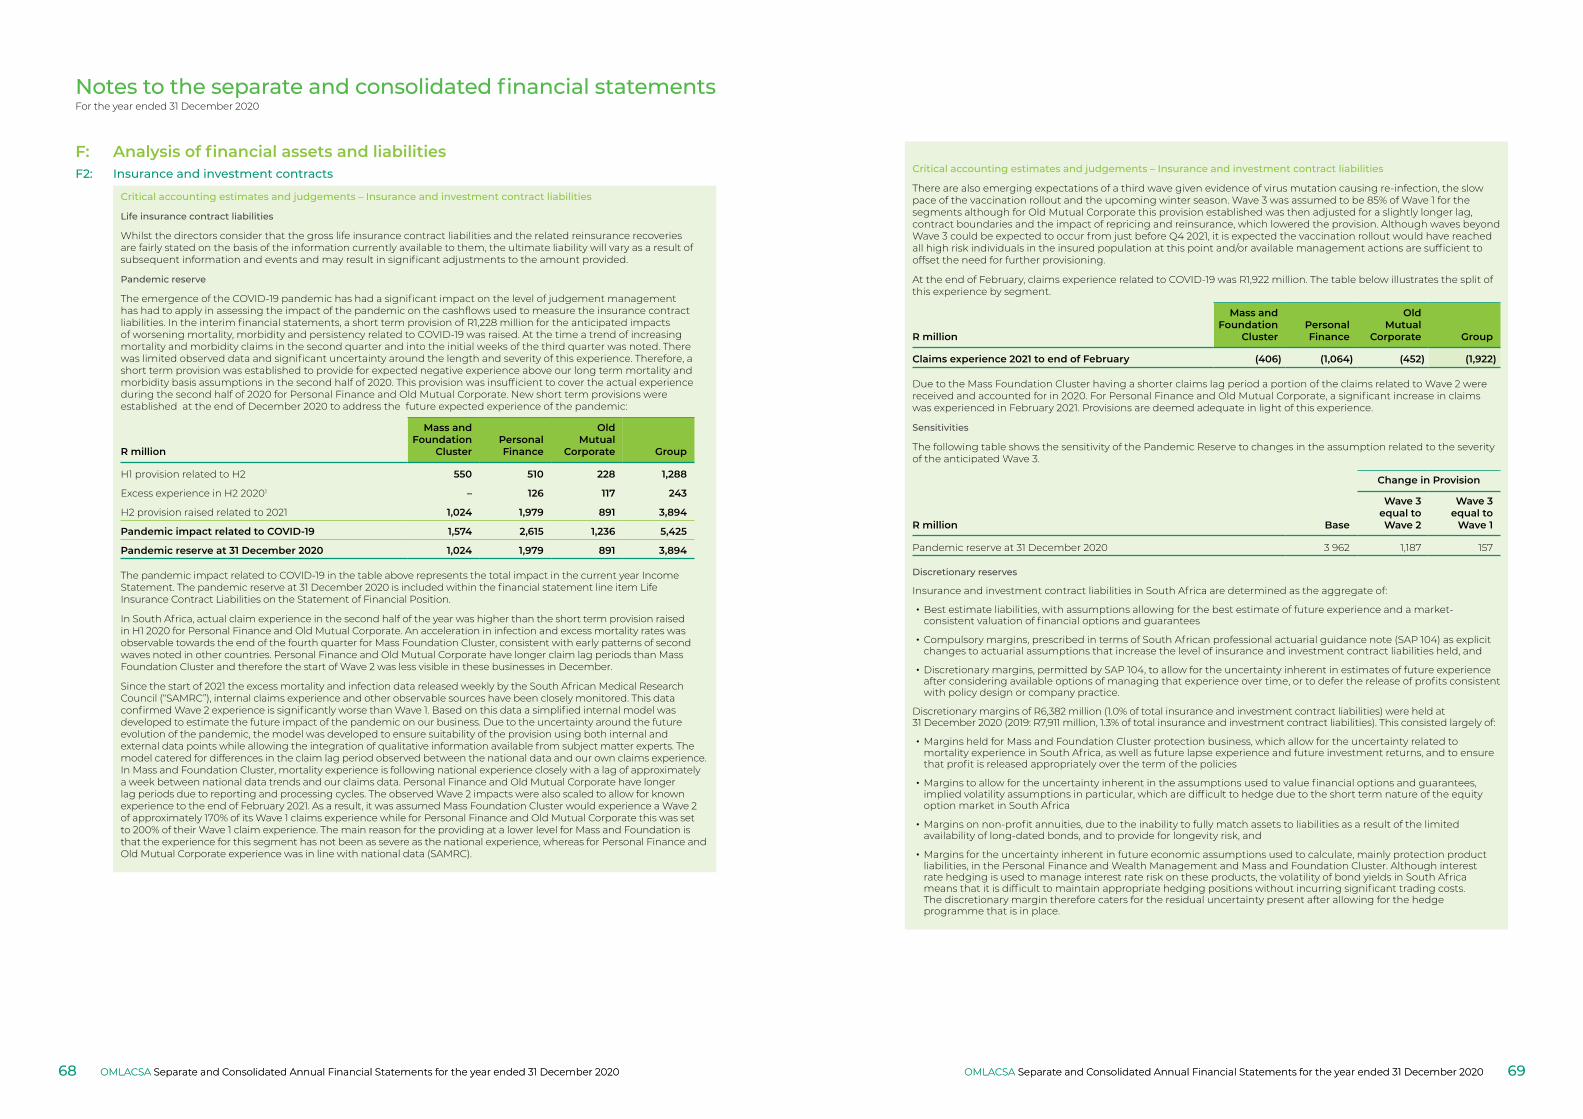
Notes to the separate and consolidated financial statementsFor the year ended 31 December 2020
Critical accounting estimates and judgements – Insurance and investment contract liabilities
Life insurance contract liabilities
Whilst the directors consider that the gross life insurance contract liabilities and the related reinsurance recoveries are fairly stated on the basis of the information currently available to them, the ultimate liability will vary as a result of subsequent information and events and may result in significant adjustments to the amount provided.
Pandemic reserve
The emergence of the COVID-19 pandemic has had a significant impact on the level of judgement management has had to apply in assessing the impact of the pandemic on the cashflows used to measure the insurance contract liabilities. In the interim financial statements, a short term provision of R1,228 million for the anticipated impacts of worsening mortality, morbidity and persistency related to COVID-19 was raised. At the time a trend of increasing mortality and morbidity claims in the second quarter and into the initial weeks of the third quarter was noted. There was limited observed data and significant uncertainty around the length and severity of this experience. Therefore, a short term provision was established to provide for expected negative experience above our long term mortality and morbidity basis assumptions in the second half of 2020. This provision was insufficient to cover the actual experience during the second half of 2020 for Personal Finance and Old Mutual Corporate. New short term provisions were established at the end of December 2020 to address the future expected experience of the pandemic:
R million
Mass andFoundation
ClusterPersonalFinance
OldMutual
Corporate Group
H1 provision related to H2 550 510 228 1,288
Excess experience in H2 20201 – 126 117 243
H2 provision raised related to 2021 1,024 1,979 891 3,894
Pandemic impact related to COVID‑19 1,574 2,615 1,236 5,425
Pandemic reserve at 31 December 2020 1,024 1,979 891 3,894
The pandemic impact related to COVID-19 in the table above represents the total impact in the current year Income Statement. The pandemic reserve at 31 December 2020 is included within the financial statement line item Life Insurance Contract Liabilities on the Statement of Financial Position.
In South Africa, actual claim experience in the second half of the year was higher than the short term provision raised in H1 2020 for Personal Finance and Old Mutual Corporate. An acceleration in infection and excess mortality rates was observable towards the end of the fourth quarter for Mass Foundation Cluster, consistent with early patterns of second waves noted in other countries. Personal Finance and Old Mutual Corporate have longer claim lag periods than Mass Foundation Cluster and therefore the start of Wave 2 was less visible in these businesses in December.
Since the start of 2021 the excess mortality and infection data released weekly by the South African Medical Research Council (“SAMRC”), internal claims experience and other observable sources have been closely monitored. This data confirmed Wave 2 experience is significantly worse than Wave 1. Based on this data a simplified internal model was developed to estimate the future impact of the pandemic on our business. Due to the uncertainty around the future evolution of the pandemic, the model was developed to ensure suitability of the provision using both internal and external data points while allowing the integration of qualitative information available from subject matter experts. The model catered for differences in the claim lag period observed between the national data and our own claims experience. In Mass and Foundation Cluster, mortality experience is following national experience closely with a lag of approximately a week between national data trends and our claims data. Personal Finance and Old Mutual Corporate have longer lag periods due to reporting and processing cycles. The observed Wave 2 impacts were also scaled to allow for known experience to the end of February 2021. As a result, it was assumed Mass Foundation Cluster would experience a Wave 2 of approximately 170% of its Wave 1 claims experience while for Personal Finance and Old Mutual Corporate this was set to 200% of their Wave 1 claim experience. The main reason for the providing at a lower level for Mass and Foundation is that the experience for this segment has not been as severe as the national experience, whereas for Personal Finance and Old Mutual Corporate experience was in line with national data (SAMRC).
Critical accounting estimates and judgements – Insurance and investment contract liabilities
There are also emerging expectations of a third wave given evidence of virus mutation causing re-infection, the slow pace of the vaccination rollout and the upcoming winter season. Wave 3 was assumed to be 85% of Wave 1 for the segments although for Old Mutual Corporate this provision established was then adjusted for a slightly longer lag, contract boundaries and the impact of repricing and reinsurance, which lowered the provision. Although waves beyond Wave 3 could be expected to occur from just before Q4 2021, it is expected the vaccination rollout would have reached all high risk individuals in the insured population at this point and/or available management actions are sufficient to offset the need for further provisioning.
At the end of February, claims experience related to COVID-19 was R1,922 million. The table below illustrates the split of this experience by segment.
R million
Mass andFoundation
ClusterPersonalFinance
OldMutual
Corporate Group
Claims experience 2021 to end of February (406) (1,064) (452) (1,922)
Due to the Mass Foundation Cluster having a shorter claims lag period a portion of the claims related to Wave 2 were received and accounted for in 2020. For Personal Finance and Old Mutual Corporate, a significant increase in claims was experienced in February 2021. Provisions are deemed adequate in light of this experience.
Sensitivities
The following table shows the sensitivity of the Pandemic Reserve to changes in the assumption related to the severity of the anticipated Wave 3.
Change in Provision
R million Base
Wave 3 equal toWave 2
Wave 3equal to
Wave 1
Pandemic reserve at 31 December 2020 3 962 1,187 157
Discretionary reserves
Insurance and investment contract liabilities in South Africa are determined as the aggregate of:
• Best estimate liabilities, with assumptions allowing for the best estimate of future experience and a market-consistent valuation of financial options and guarantees
• Compulsory margins, prescribed in terms of South African professional actuarial guidance note (SAP 104) as explicit changes to actuarial assumptions that increase the level of insurance and investment contract liabilities held, and
• Discretionary margins, permitted by SAP 104, to allow for the uncertainty inherent in estimates of future experience after considering available options of managing that experience over time, or to defer the release of profits consistent with policy design or company practice.
Discretionary margins of R6,382 million (1.0% of total insurance and investment contract liabilities) were held at 31 December 2020 (2019: R7,911 million, 1.3% of total insurance and investment contract liabilities). This consisted largely of:
• Margins held for Mass and Foundation Cluster protection business, which allow for the uncertainty related to mortality experience in South Africa, as well as future lapse experience and future investment returns, and to ensure that profit is released appropriately over the term of the policies
• Margins to allow for the uncertainty inherent in the assumptions used to value financial options and guarantees, implied volatility assumptions in particular, which are difficult to hedge due to the short term nature of the equity option market in South Africa
• Margins on non-profit annuities, due to the inability to fully match assets to liabilities as a result of the limited availability of long-dated bonds, and to provide for longevity risk, and
• Margins for the uncertainty inherent in future economic assumptions used to calculate, mainly protection product liabilities, in the Personal Finance and Wealth Management and Mass and Foundation Cluster. Although interest rate hedging is used to manage interest rate risk on these products, the volatility of bond yields in South Africa means that it is difficult to maintain appropriate hedging positions without incurring significant trading costs. The discretionary margin therefore caters for the residual uncertainty present after allowing for the hedge programme that is in place.
F: Analysis of financial assets and liabilitiesF2: Insurance and investment contracts
OMLACSA Separate and Consolidated Annual Financial Statements for the year ended 31 December 2020 OMLACSA Separate and Consolidated Annual Financial Statements for the year ended 31 December 202068 69OMLACSA Separate and Consolidated Annual Financial Statements for the year ended 31 December 2020OMLACSA Separate and Consolidated Annual Financial Statements for the year ended 31 December 2020
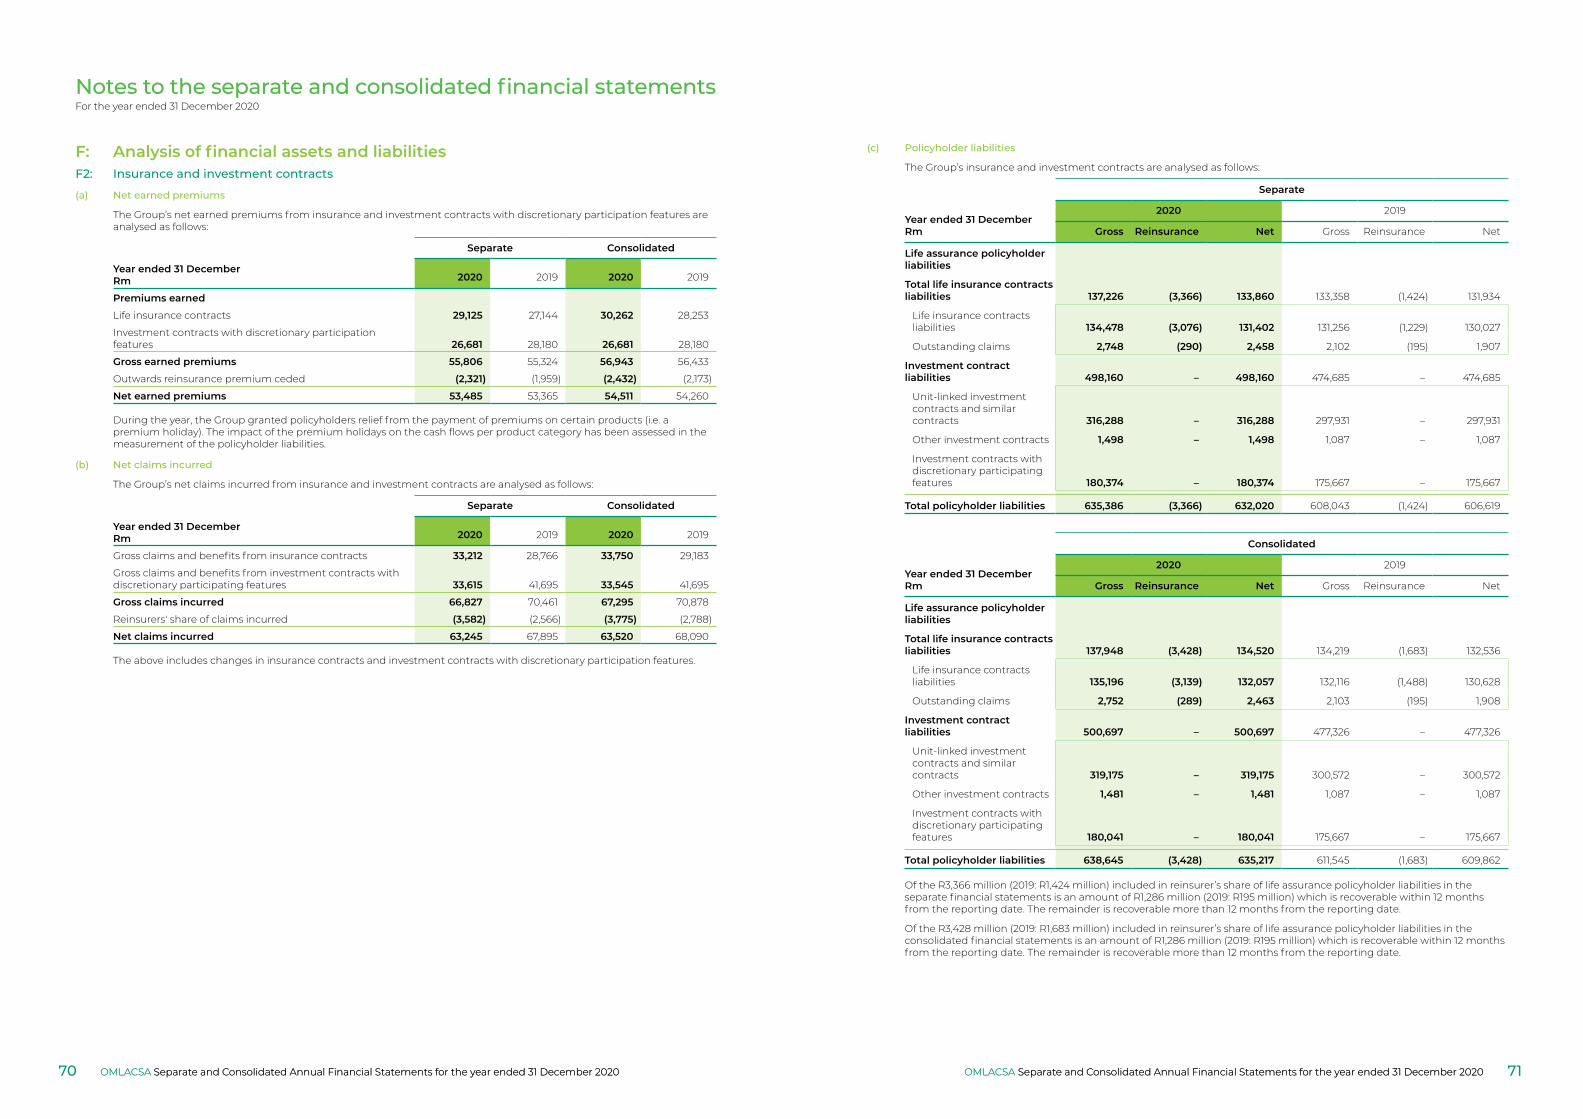
Notes to the separate and consolidated financial statementsFor the year ended 31 December 2020
(a) Net earned premiums
The Group’s net earned premiums from insurance and investment contracts with discretionary participation features are analysed as follows:
Separate Consolidated
Year ended 31 DecemberRm 2020 2019 2020 2019
Premiums earned
Life insurance contracts 29,125 27,144 30,262 28,253
Investment contracts with discretionary participation features 26,681 28,180 26,681 28,180
Gross earned premiums 55,806 55,324 56,943 56,433
Outwards reinsurance premium ceded (2,321) (1,959) (2,432) (2,173)
Net earned premiums 53,485 53,365 54,511 54,260
During the year, the Group granted policyholders relief from the payment of premiums on certain products (i.e. a premium holiday). The impact of the premium holidays on the cash flows per product category has been assessed in the measurement of the policyholder liabilities.
(b) Net claims incurred
The Group’s net claims incurred from insurance and investment contracts are analysed as follows:
Separate Consolidated
Year ended 31 DecemberRm 2020 2019 2020 2019
Gross claims and benefits from insurance contracts 33,212 28,766 33,750 29,183
Gross claims and benefits from investment contracts with discretionary participating features 33,615 41,695 33,545 41,695
Gross claims incurred 66,827 70,461 67,295 70,878
Reinsurers' share of claims incurred (3,582) (2,566) (3,775) (2,788)
Net claims incurred 63,245 67,895 63,520 68,090
The above includes changes in insurance contracts and investment contracts with discretionary participation features.
(c) Policyholder liabilities
The Group’s insurance and investment contracts are analysed as follows:
Separate
Year ended 31 DecemberRm
2020 2019
Gross Reinsurance Net Gross Reinsurance Net
Life assurance policyholder liabilities
Total life insurance contracts liabilities 137,226 (3,366) 133,860 133,358 (1,424) 131,934
Life insurance contracts liabilities 134,478 (3,076) 131,402 131,256 (1,229) 130,027
Outstanding claims 2,748 (290) 2,458 2,102 (195) 1,907
Investment contract liabilities 498,160 – 498,160 474,685 – 474,685
Unit-linked investment contracts and similar contracts 316,288 – 316,288 297,931 – 297,931
Other investment contracts 1,498 – 1,498 1,087 – 1,087
Investment contracts with discretionary participating features 180,374 – 180,374 175,667 – 175,667
Total policyholder liabilities 635,386 (3,366) 632,020 608,043 (1,424) 606,619
Consolidated
Year ended 31 DecemberRm
2020 2019
Gross Reinsurance Net Gross Reinsurance Net
Life assurance policyholder liabilities
Total life insurance contracts liabilities 137,948 (3,428) 134,520 134,219 (1,683) 132,536
Life insurance contracts liabilities 135,196 (3,139) 132,057 132,116 (1,488) 130,628
Outstanding claims 2,752 (289) 2,463 2,103 (195) 1,908
Investment contract liabilities 500,697 – 500,697 477,326 – 477,326
Unit-linked investment contracts and similar contracts 319,175 – 319,175 300,572 – 300,572
Other investment contracts 1,481 – 1,481 1,087 – 1,087
Investment contracts with discretionary participating features 180,041 – 180,041 175,667 – 175,667
Total policyholder liabilities 638,645 (3,428) 635,217 611,545 (1,683) 609,862
Of the R3,366 million (2019: R1,424 million) included in reinsurer’s share of life assurance policyholder liabilities in the separate financial statements is an amount of R1,286 million (2019: R195 million) which is recoverable within 12 months from the reporting date. The remainder is recoverable more than 12 months from the reporting date.
Of the R3,428 million (2019: R1,683 million) included in reinsurer’s share of life assurance policyholder liabilities in the consolidated financial statements is an amount of R1,286 million (2019: R195 million) which is recoverable within 12 months from the reporting date. The remainder is recoverable more than 12 months from the reporting date.
F: Analysis of financial assets and liabilitiesF2: Insurance and investment contracts
OMLACSA Separate and Consolidated Annual Financial Statements for the year ended 31 December 2020 OMLACSA Separate and Consolidated Annual Financial Statements for the year ended 31 December 202070 71OMLACSA Separate and Consolidated Annual Financial Statements for the year ended 31 December 2020OMLACSA Separate and Consolidated Annual Financial Statements for the year ended 31 December 2020
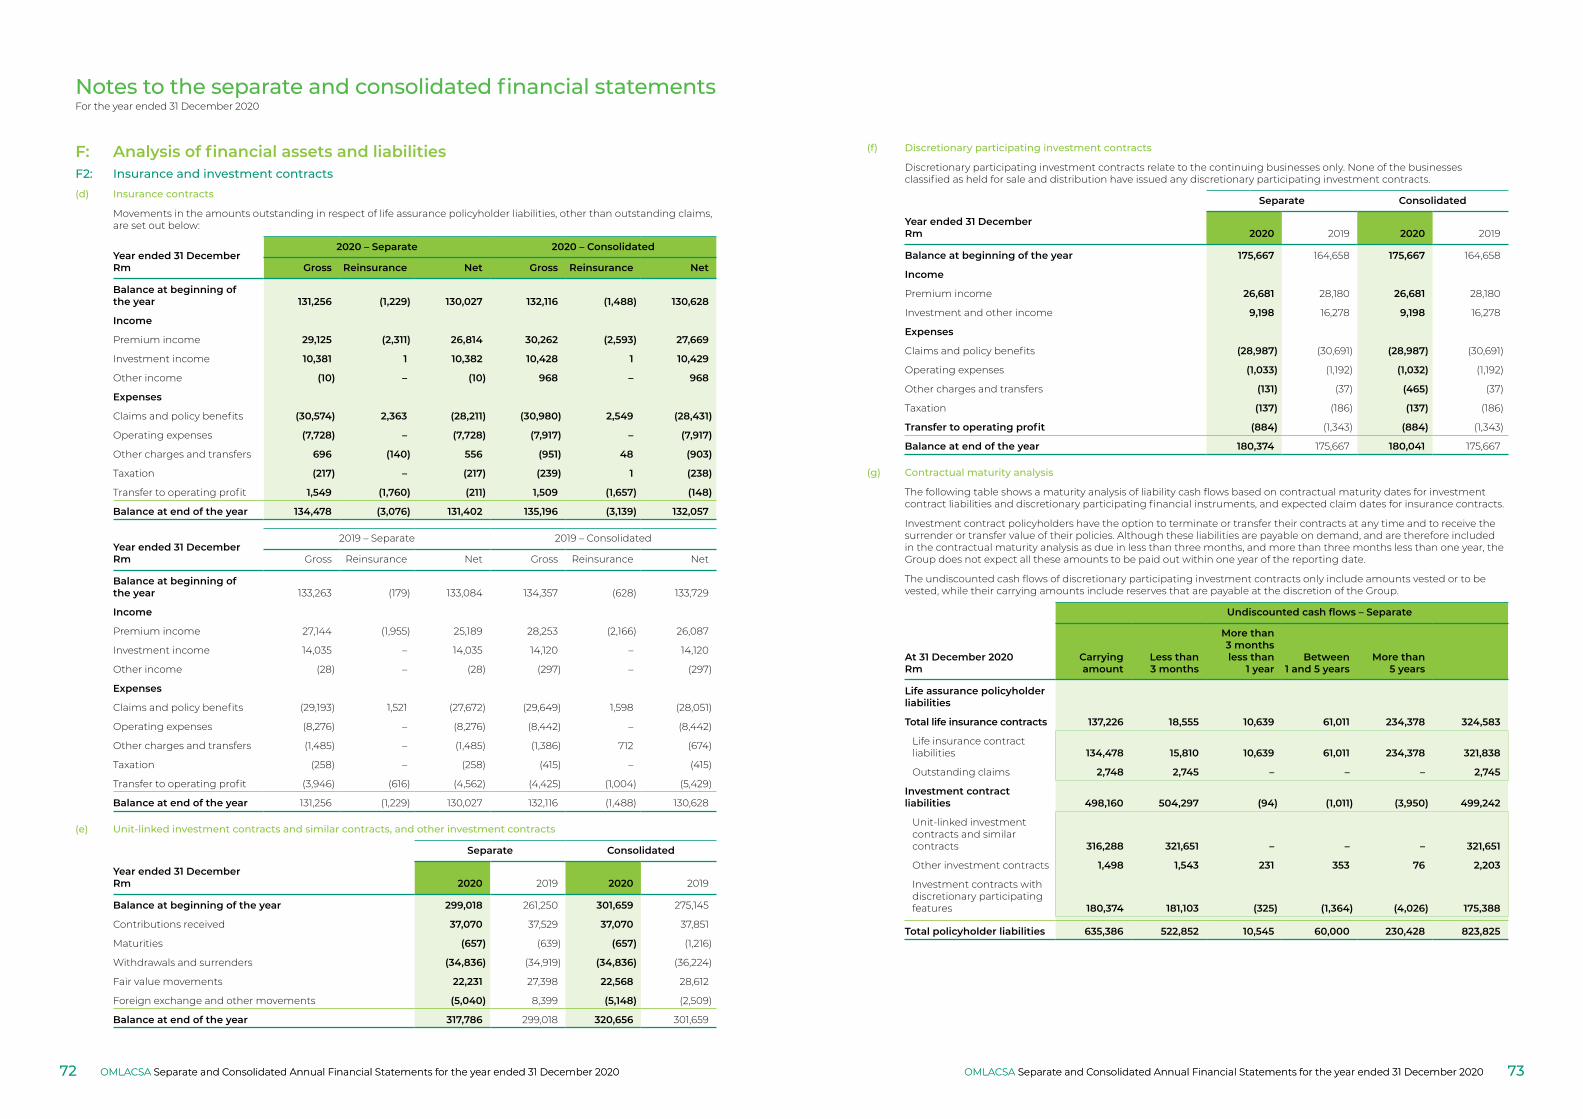
Notes to the separate and consolidated financial statementsFor the year ended 31 December 2020
(d) Insurance contracts
Movements in the amounts outstanding in respect of life assurance policyholder liabilities, other than outstanding claims, are set out below:
Year ended 31 DecemberRm
2020 – Separate 2020 – Consolidated
Gross Reinsurance Net Gross Reinsurance Net
Balance at beginning of the year 131,256 (1,229) 130,027 132,116 (1,488) 130,628
Income
Premium income 29,125 (2,311) 26,814 30,262 (2,593) 27,669
Investment income 10,381 1 10,382 10,428 1 10,429
Other income (10) – (10) 968 – 968
Expenses
Claims and policy benefits (30,574) 2,363 (28,211) (30,980) 2,549 (28,431)
Operating expenses (7,728) – (7,728) (7,917) – (7,917)
Other charges and transfers 696 (140) 556 (951) 48 (903)
Taxation (217) – (217) (239) 1 (238)
Transfer to operating profit 1,549 (1,760) (211) 1,509 (1,657) (148)
Balance at end of the year 134,478 (3,076) 131,402 135,196 (3,139) 132,057
Year ended 31 DecemberRm
2019 – Separate 2019 – Consolidated
Gross Reinsurance Net Gross Reinsurance Net
Balance at beginning of the year 133,263 (179) 133,084 134,357 (628) 133,729
Income
Premium income 27,144 (1,955) 25,189 28,253 (2,166) 26,087
Investment income 14,035 – 14,035 14,120 – 14,120
Other income (28) – (28) (297) – (297)
Expenses
Claims and policy benefits (29,193) 1,521 (27,672) (29,649) 1,598 (28,051)
Operating expenses (8,276) – (8,276) (8,442) – (8,442)
Other charges and transfers (1,485) – (1,485) (1,386) 712 (674)
Taxation (258) – (258) (415) – (415)
Transfer to operating profit (3,946) (616) (4,562) (4,425) (1,004) (5,429)
Balance at end of the year 131,256 (1,229) 130,027 132,116 (1,488) 130,628
(e) Unit-linked investment contracts and similar contracts, and other investment contracts
Separate Consolidated
Year ended 31 DecemberRm 2020 2019 2020 2019
Balance at beginning of the year 299,018 261,250 301,659 275,145
Contributions received 37,070 37,529 37,070 37,851
Maturities (657) (639) (657) (1,216)
Withdrawals and surrenders (34,836) (34,919) (34,836) (36,224)
Fair value movements 22,231 27,398 22,568 28,612
Foreign exchange and other movements (5,040) 8,399 (5,148) (2,509)
Balance at end of the year 317,786 299,018 320,656 301,659
(f) Discretionary participating investment contracts
Discretionary participating investment contracts relate to the continuing businesses only. None of the businesses classified as held for sale and distribution have issued any discretionary participating investment contracts.
Separate Consolidated
Year ended 31 DecemberRm 2020 2019 2020 2019
Balance at beginning of the year 175,667 164,658 175,667 164,658
Income
Premium income 26,681 28,180 26,681 28,180
Investment and other income 9,198 16,278 9,198 16,278
Expenses
Claims and policy benefits (28,987) (30,691) (28,987) (30,691)
Operating expenses (1,033) (1,192) (1,032) (1,192)
Other charges and transfers (131) (37) (465) (37)
Taxation (137) (186) (137) (186)
Transfer to operating profit (884) (1,343) (884) (1,343)
Balance at end of the year 180,374 175,667 180,041 175,667
(g) Contractual maturity analysis
The following table shows a maturity analysis of liability cash flows based on contractual maturity dates for investment contract liabilities and discretionary participating financial instruments, and expected claim dates for insurance contracts.
Investment contract policyholders have the option to terminate or transfer their contracts at any time and to receive the surrender or transfer value of their policies. Although these liabilities are payable on demand, and are therefore included in the contractual maturity analysis as due in less than three months, and more than three months less than one year, the Group does not expect all these amounts to be paid out within one year of the reporting date.
The undiscounted cash flows of discretionary participating investment contracts only include amounts vested or to be vested, while their carrying amounts include reserves that are payable at the discretion of the Group.
Undiscounted cash flows – Separate
At 31 December 2020Rm
Carryingamount
Less than3 months
More than3 monthsless than
1 yearBetween
1 and 5 yearsMore than
5 years Total
Life assurance policyholder liabilities
Total life insurance contracts 137,226 18,555 10,639 61,011 234,378 324,583
Life insurance contract liabilities 134,478 15,810 10,639 61,011 234,378 321,838
Outstanding claims 2,748 2,745 – – – 2,745
Investment contract liabilities 498,160 504,297 (94) (1,011) (3,950) 499,242
Unit-linked investment contracts and similar contracts 316,288 321,651 – – – 321,651
Other investment contracts 1,498 1,543 231 353 76 2,203
Investment contracts with discretionary participating features 180,374 181,103 (325) (1,364) (4,026) 175,388
Total policyholder liabilities 635,386 522,852 10,545 60,000 230,428 823,825
F: Analysis of financial assets and liabilitiesF2: Insurance and investment contracts
OMLACSA Separate and Consolidated Annual Financial Statements for the year ended 31 December 2020 OMLACSA Separate and Consolidated Annual Financial Statements for the year ended 31 December 202072 73OMLACSA Separate and Consolidated Annual Financial Statements for the year ended 31 December 2020OMLACSA Separate and Consolidated Annual Financial Statements for the year ended 31 December 2020
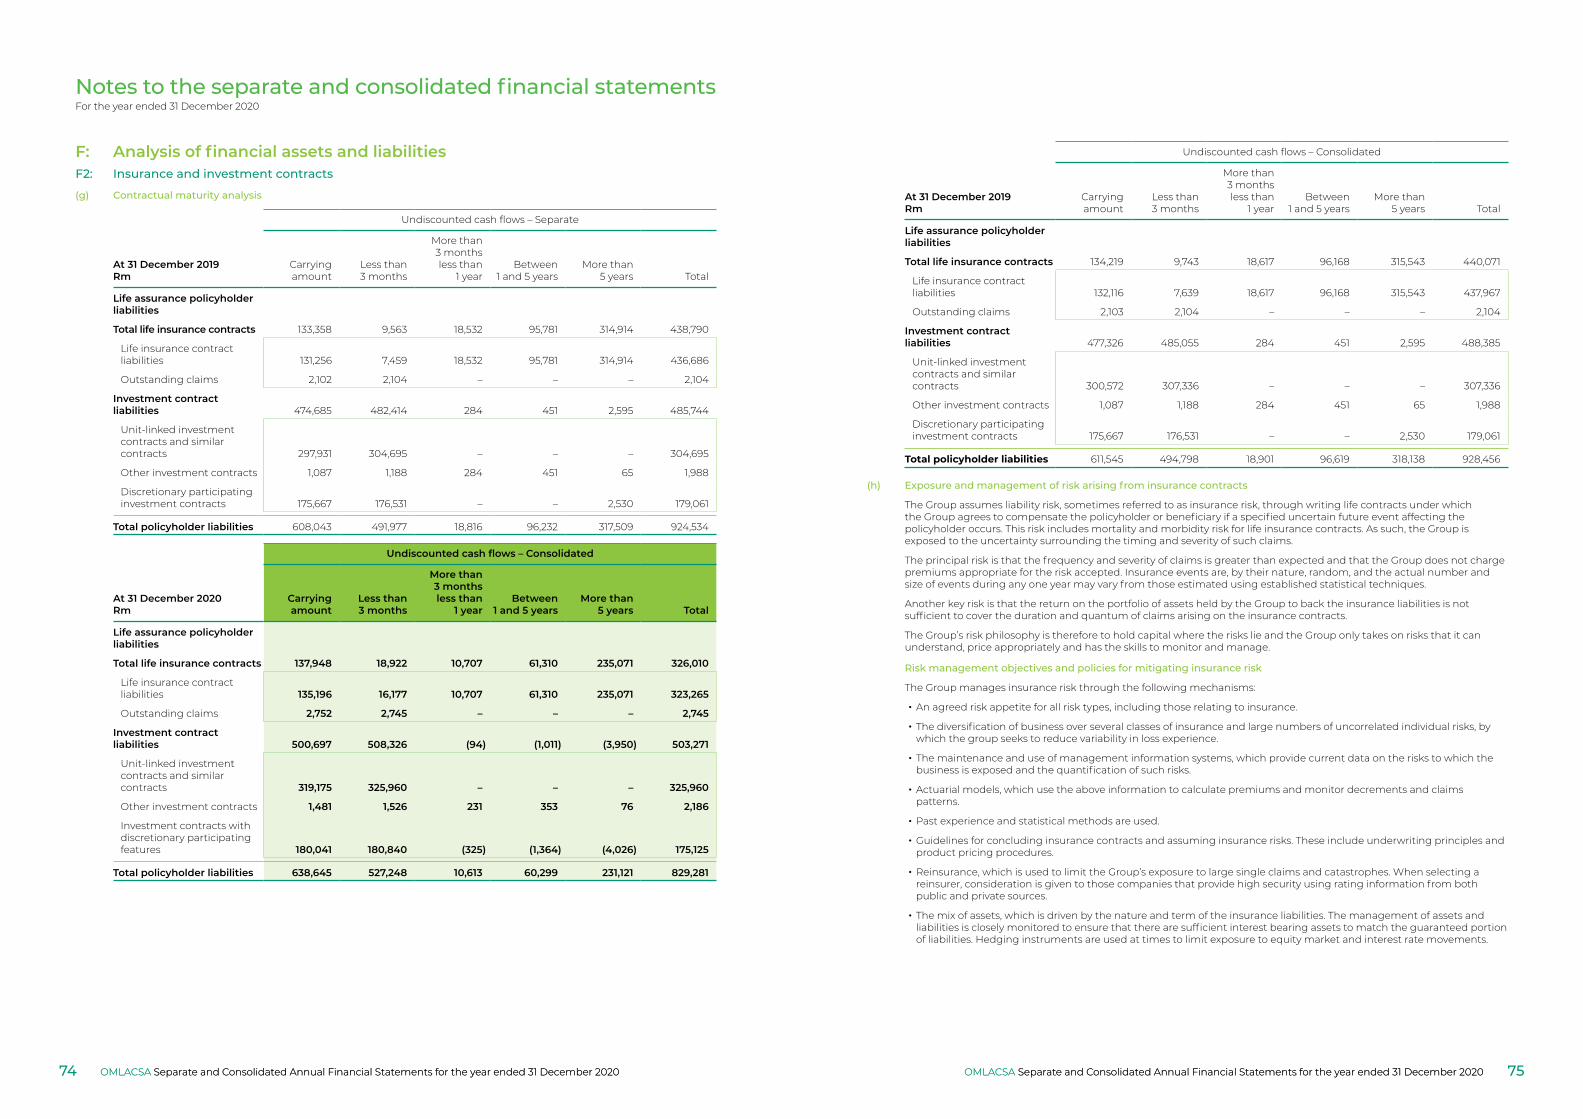
Notes to the separate and consolidated financial statementsFor the year ended 31 December 2020
Undiscounted cash flows – Consolidated
At 31 December 2019Rm
Carryingamount
Less than3 months
More than3 monthsless than
1 yearBetween
1 and 5 yearsMore than
5 years Total
Life assurance policyholder liabilities
Total life insurance contracts 134,219 9,743 18,617 96,168 315,543 440,071
Life insurance contract liabilities 132,116 7,639 18,617 96,168 315,543 437,967
Outstanding claims 2,103 2,104 – – – 2,104
Investment contract liabilities 477,326 485,055 284 451 2,595 488,385
Unit-linked investment contracts and similar contracts 300,572 307,336 – – – 307,336
Other investment contracts 1,087 1,188 284 451 65 1,988
Discretionary participating investment contracts 175,667 176,531 – – 2,530 179,061
Total policyholder liabilities 611,545 494,798 18,901 96,619 318,138 928,456
(h) Exposure and management of risk arising from insurance contracts
The Group assumes liability risk, sometimes referred to as insurance risk, through writing life contracts under which the Group agrees to compensate the policyholder or beneficiary if a specified uncertain future event affecting the policyholder occurs. This risk includes mortality and morbidity risk for life insurance contracts. As such, the Group is exposed to the uncertainty surrounding the timing and severity of such claims.
The principal risk is that the frequency and severity of claims is greater than expected and that the Group does not charge premiums appropriate for the risk accepted. Insurance events are, by their nature, random, and the actual number and size of events during any one year may vary from those estimated using established statistical techniques.
Another key risk is that the return on the portfolio of assets held by the Group to back the insurance liabilities is not sufficient to cover the duration and quantum of claims arising on the insurance contracts.
The Group’s risk philosophy is therefore to hold capital where the risks lie and the Group only takes on risks that it can understand, price appropriately and has the skills to monitor and manage.
Risk management objectives and policies for mitigating insurance risk
The Group manages insurance risk through the following mechanisms:
• An agreed risk appetite for all risk types, including those relating to insurance.
• The diversification of business over several classes of insurance and large numbers of uncorrelated individual risks, by which the group seeks to reduce variability in loss experience.
• The maintenance and use of management information systems, which provide current data on the risks to which the business is exposed and the quantification of such risks.
• Actuarial models, which use the above information to calculate premiums and monitor decrements and claims patterns.
• Past experience and statistical methods are used.
• Guidelines for concluding insurance contracts and assuming insurance risks. These include underwriting principles and product pricing procedures.
• Reinsurance, which is used to limit the Group’s exposure to large single claims and catastrophes. When selecting a reinsurer, consideration is given to those companies that provide high security using rating information from both public and private sources.
• The mix of assets, which is driven by the nature and term of the insurance liabilities. The management of assets and liabilities is closely monitored to ensure that there are sufficient interest bearing assets to match the guaranteed portion of liabilities. Hedging instruments are used at times to limit exposure to equity market and interest rate movements.
F: Analysis of financial assets and liabilitiesF2: Insurance and investment contracts
(g) Contractual maturity analysis
Undiscounted cash flows – Separate
At 31 December 2019Rm
Carryingamount
Less than3 months
More than3 monthsless than
1 yearBetween
1 and 5 yearsMore than
5 years Total
Life assurance policyholder liabilities
Total life insurance contracts 133,358 9,563 18,532 95,781 314,914 438,790
Life insurance contract liabilities 131,256 7,459 18,532 95,781 314,914 436,686
Outstanding claims 2,102 2,104 – – – 2,104
Investment contract liabilities 474,685 482,414 284 451 2,595 485,744
Unit-linked investment contracts and similar contracts 297,931 304,695 – – – 304,695
Other investment contracts 1,087 1,188 284 451 65 1,988
Discretionary participating investment contracts 175,667 176,531 – – 2,530 179,061
Total policyholder liabilities 608,043 491,977 18,816 96,232 317,509 924,534
Undiscounted cash flows – Consolidated
At 31 December 2020Rm
Carryingamount
Less than3 months
More than3 monthsless than
1 yearBetween
1 and 5 yearsMore than
5 years Total
Life assurance policyholder liabilities
Total life insurance contracts 137,948 18,922 10,707 61,310 235,071 326,010
Life insurance contract liabilities 135,196 16,177 10,707 61,310 235,071 323,265
Outstanding claims 2,752 2,745 – – – 2,745
Investment contract liabilities 500,697 508,326 (94) (1,011) (3,950) 503,271
Unit-linked investment contracts and similar contracts 319,175 325,960 – – – 325,960
Other investment contracts 1,481 1,526 231 353 76 2,186
Investment contracts with discretionary participating features 180,041 180,840 (325) (1,364) (4,026) 175,125
Total policyholder liabilities 638,645 527,248 10,613 60,299 231,121 829,281
OMLACSA Separate and Consolidated Annual Financial Statements for the year ended 31 December 2020 OMLACSA Separate and Consolidated Annual Financial Statements for the year ended 31 December 202074 75OMLACSA Separate and Consolidated Annual Financial Statements for the year ended 31 December 2020OMLACSA Separate and Consolidated Annual Financial Statements for the year ended 31 December 2020
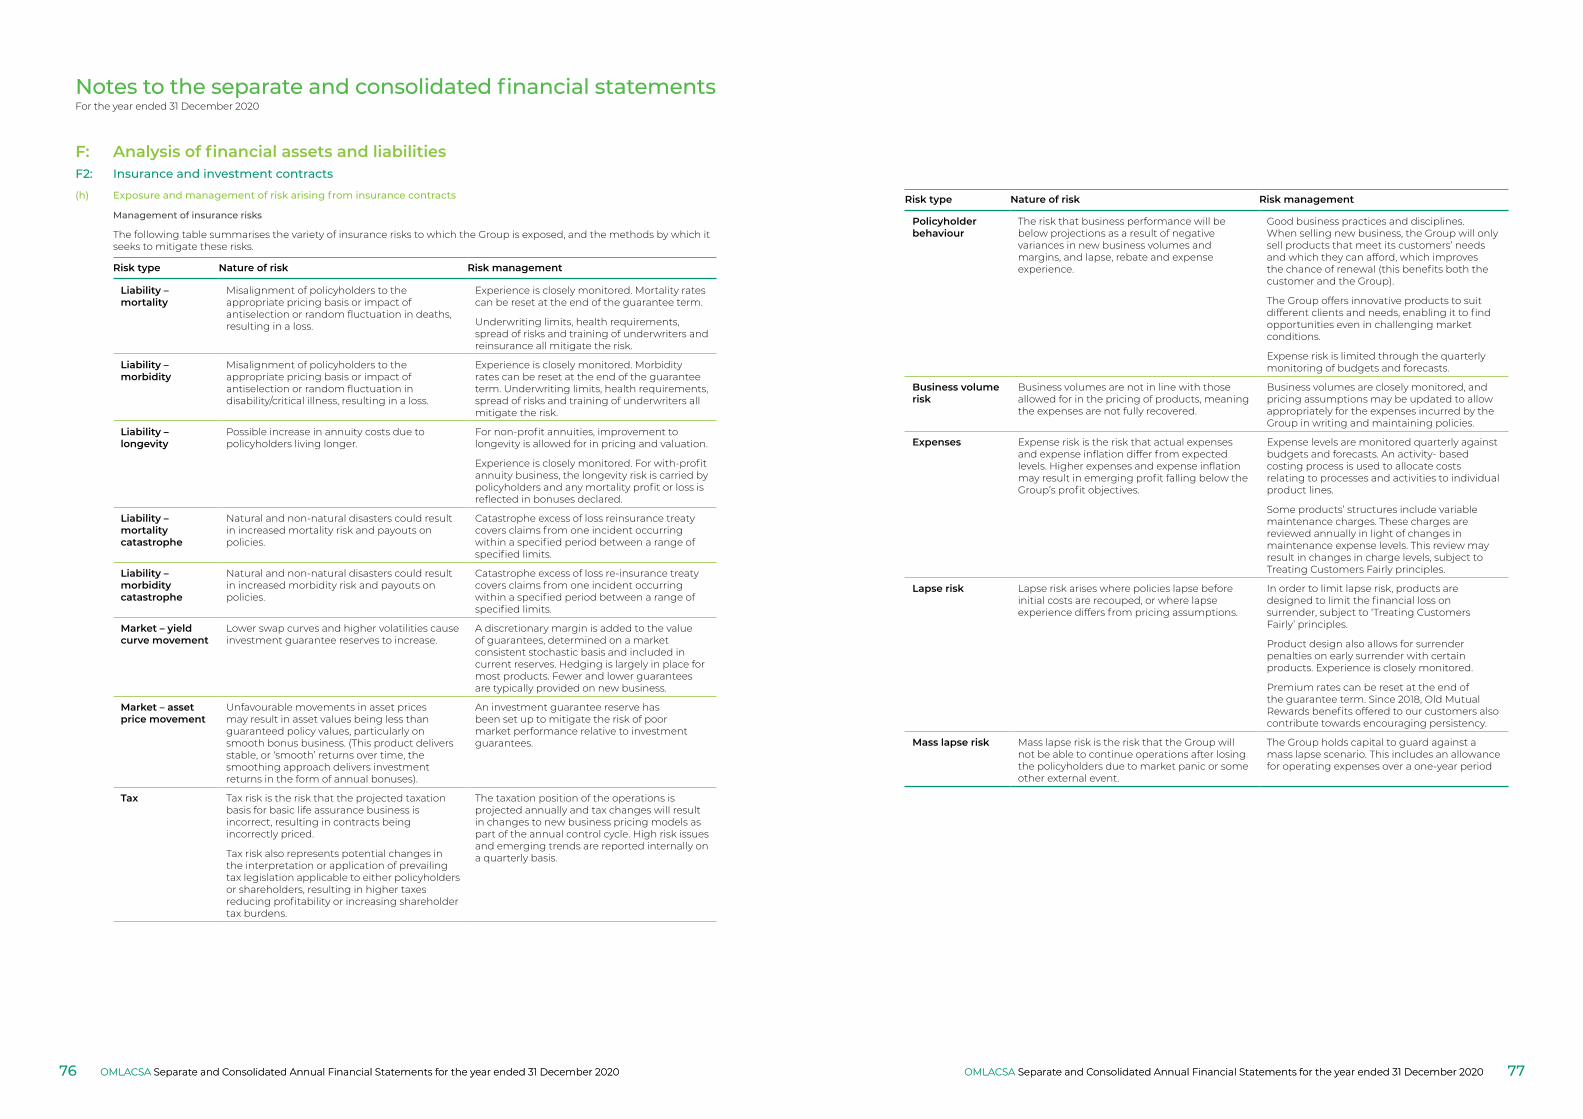
Notes to the separate and consolidated financial statementsFor the year ended 31 December 2020
Management of insurance risks
The following table summarises the variety of insurance risks to which the Group is exposed, and the methods by which it seeks to mitigate these risks.
Risk type Nature of risk Risk management
Liability – mortality
Misalignment of policyholders to the appropriate pricing basis or impact of antiselection or random fluctuation in deaths, resulting in a loss.
Experience is closely monitored. Mortality rates can be reset at the end of the guarantee term.
Underwriting limits, health requirements, spread of risks and training of underwriters and reinsurance all mitigate the risk.
Liability – morbidity
Misalignment of policyholders to the appropriate pricing basis or impact of antiselection or random fluctuation in disability/critical illness, resulting in a loss.
Experience is closely monitored. Morbidity rates can be reset at the end of the guarantee term. Underwriting limits, health requirements, spread of risks and training of underwriters all mitigate the risk.
Liability – longevity
Possible increase in annuity costs due to policyholders living longer.
For non-profit annuities, improvement to longevity is allowed for in pricing and valuation.
Experience is closely monitored. For with-profit annuity business, the longevity risk is carried by policyholders and any mortality profit or loss is reflected in bonuses declared.
Liability – mortality catastrophe
Natural and non-natural disasters could result in increased mortality risk and payouts on policies.
Catastrophe excess of loss reinsurance treaty covers claims from one incident occurring within a specified period between a range of specified limits.
Liability – morbidity catastrophe
Natural and non-natural disasters could result in increased morbidity risk and payouts on policies.
Catastrophe excess of loss re-insurance treaty covers claims from one incident occurring within a specified period between a range of specified limits.
Market – yield curve movement
Lower swap curves and higher volatilities cause investment guarantee reserves to increase.
A discretionary margin is added to the value of guarantees, determined on a market consistent stochastic basis and included in current reserves. Hedging is largely in place for most products. Fewer and lower guarantees are typically provided on new business.
Market – asset price movement
Unfavourable movements in asset prices may result in asset values being less than guaranteed policy values, particularly on smooth bonus business. (This product delivers stable, or ‘smooth’ returns over time, the smoothing approach delivers investment returns in the form of annual bonuses).
An investment guarantee reserve has been set up to mitigate the risk of poor market performance relative to investment guarantees.
Tax Tax risk is the risk that the projected taxation basis for basic life assurance business is incorrect, resulting in contracts being incorrectly priced.
Tax risk also represents potential changes in the interpretation or application of prevailing tax legislation applicable to either policyholders or shareholders, resulting in higher taxes reducing profitability or increasing shareholder tax burdens.
The taxation position of the operations is projected annually and tax changes will result in changes to new business pricing models as part of the annual control cycle. High risk issues and emerging trends are reported internally on a quarterly basis.
F: Analysis of financial assets and liabilitiesF2: Insurance and investment contracts
(h) Exposure and management of risk arising from insurance contracts Risk type Nature of risk Risk management
Policyholder behaviour
The risk that business performance will be below projections as a result of negative variances in new business volumes and margins, and lapse, rebate and expense experience.
Good business practices and disciplines. When selling new business, the Group will only sell products that meet its customers’ needs and which they can afford, which improves the chance of renewal (this benefits both the customer and the Group).
The Group offers innovative products to suit different clients and needs, enabling it to find opportunities even in challenging market conditions.
Expense risk is limited through the quarterly monitoring of budgets and forecasts.
Business volume risk
Business volumes are not in line with those allowed for in the pricing of products, meaning the expenses are not fully recovered.
Business volumes are closely monitored, and pricing assumptions may be updated to allow appropriately for the expenses incurred by the Group in writing and maintaining policies.
Expenses Expense risk is the risk that actual expenses and expense inflation differ from expected levels. Higher expenses and expense inflation may result in emerging profit falling below the Group’s profit objectives.
Expense levels are monitored quarterly against budgets and forecasts. An activity- based costing process is used to allocate costs relating to processes and activities to individual product lines.
Some products’ structures include variable maintenance charges. These charges are reviewed annually in light of changes in maintenance expense levels. This review may result in changes in charge levels, subject to Treating Customers Fairly principles.
Lapse risk Lapse risk arises where policies lapse before initial costs are recouped, or where lapse experience differs from pricing assumptions.
In order to limit lapse risk, products are designed to limit the financial loss on surrender, subject to ‘Treating Customers Fairly’ principles.
Product design also allows for surrender penalties on early surrender with certain products. Experience is closely monitored.
Premium rates can be reset at the end of the guarantee term. Since 2018, Old Mutual Rewards benefits offered to our customers also contribute towards encouraging persistency.
Mass lapse risk Mass lapse risk is the risk that the Group will not be able to continue operations after losing the policyholders due to market panic or some other external event.
The Group holds capital to guard against a mass lapse scenario. This includes an allowance for operating expenses over a one-year period
OMLACSA Separate and Consolidated Annual Financial Statements for the year ended 31 December 2020 OMLACSA Separate and Consolidated Annual Financial Statements for the year ended 31 December 202076 77OMLACSA Separate and Consolidated Annual Financial Statements for the year ended 31 December 2020OMLACSA Separate and Consolidated Annual Financial Statements for the year ended 31 December 2020
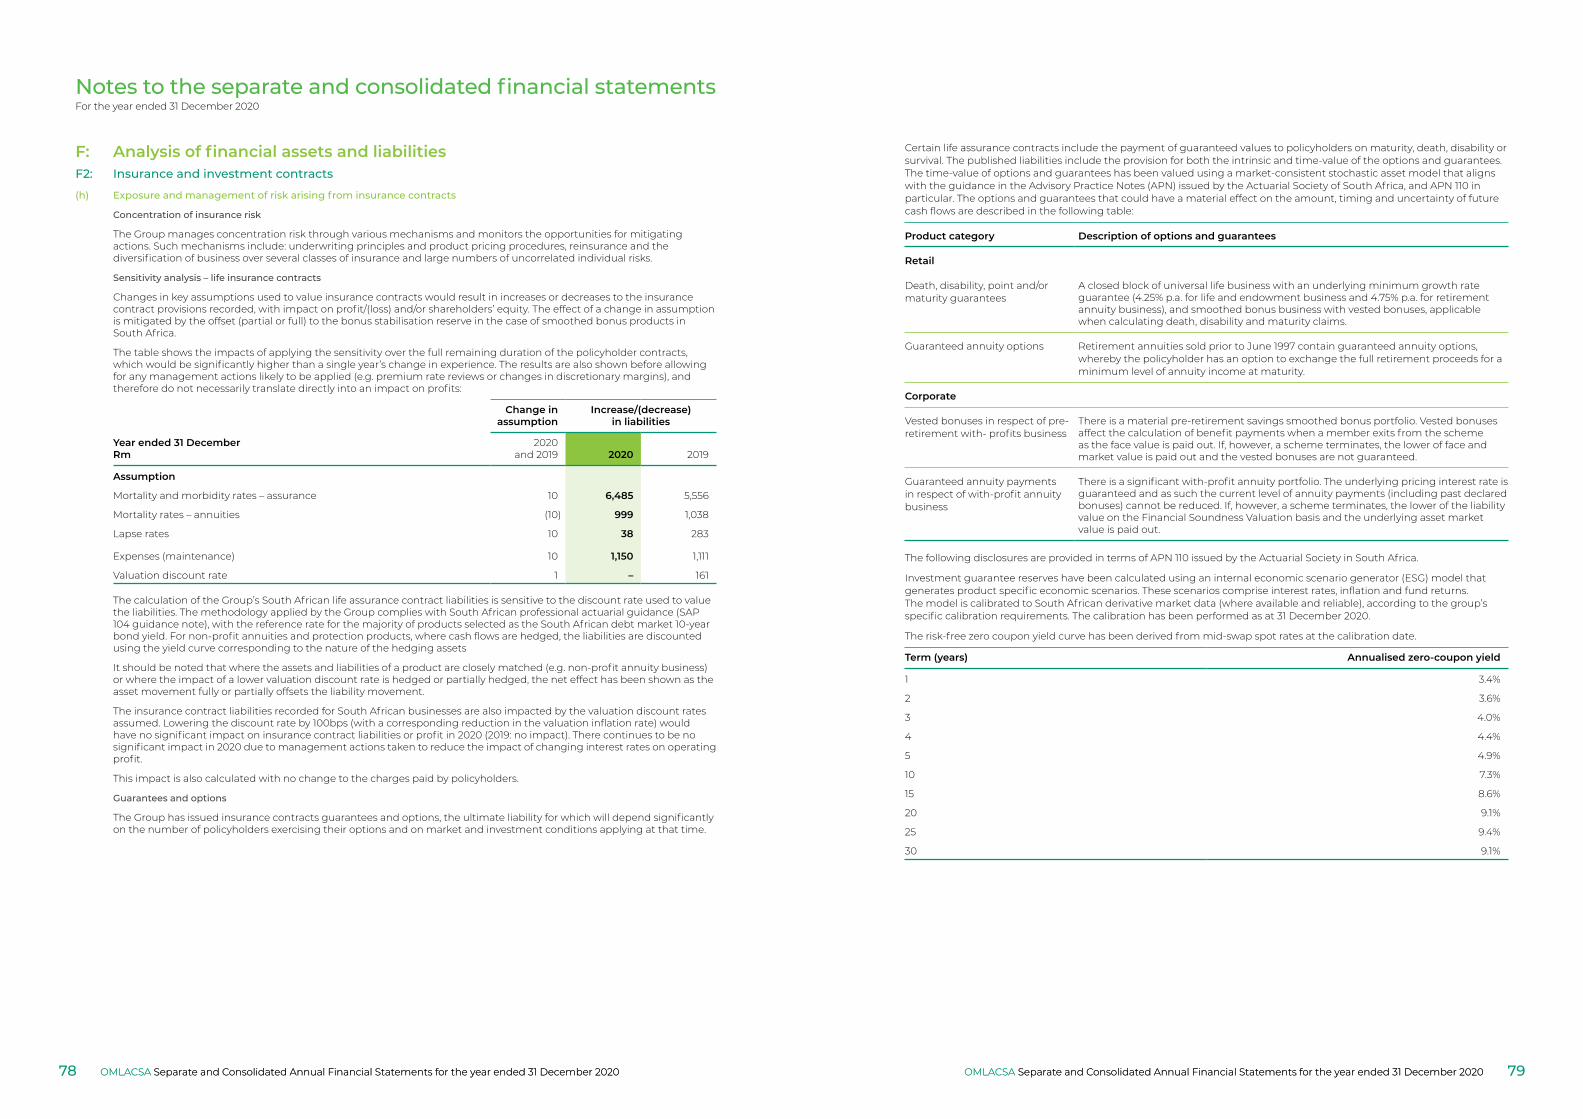
Notes to the separate and consolidated financial statementsFor the year ended 31 December 2020
Concentration of insurance risk
The Group manages concentration risk through various mechanisms and monitors the opportunities for mitigating actions. Such mechanisms include: underwriting principles and product pricing procedures, reinsurance and the diversification of business over several classes of insurance and large numbers of uncorrelated individual risks.
Sensitivity analysis – life insurance contracts
Changes in key assumptions used to value insurance contracts would result in increases or decreases to the insurance contract provisions recorded, with impact on profit/(loss) and/or shareholders’ equity. The effect of a change in assumption is mitigated by the offset (partial or full) to the bonus stabilisation reserve in the case of smoothed bonus products in South Africa.
The table shows the impacts of applying the sensitivity over the full remaining duration of the policyholder contracts, which would be significantly higher than a single year’s change in experience. The results are also shown before allowing for any management actions likely to be applied (e.g. premium rate reviews or changes in discretionary margins), and therefore do not necessarily translate directly into an impact on profits:
Year ended 31 DecemberRm
Change inassumption
Increase/(decrease)in liabilities
2020and 2019 2020 2019
Assumption
Mortality and morbidity rates – assurance 10 6,485 5,556
Mortality rates – annuities (10) 999 1,038
Lapse rates 10 38 283
Expenses (maintenance) 10 1,150 1,111
Valuation discount rate 1 – 161
The calculation of the Group’s South African life assurance contract liabilities is sensitive to the discount rate used to value the liabilities. The methodology applied by the Group complies with South African professional actuarial guidance (SAP 104 guidance note), with the reference rate for the majority of products selected as the South African debt market 10-year bond yield. For non-profit annuities and protection products, where cash flows are hedged, the liabilities are discounted using the yield curve corresponding to the nature of the hedging assets
It should be noted that where the assets and liabilities of a product are closely matched (e.g. non-profit annuity business) or where the impact of a lower valuation discount rate is hedged or partially hedged, the net effect has been shown as the asset movement fully or partially offsets the liability movement.
The insurance contract liabilities recorded for South African businesses are also impacted by the valuation discount rates assumed. Lowering the discount rate by 100bps (with a corresponding reduction in the valuation inflation rate) would have no significant impact on insurance contract liabilities or profit in 2020 (2019: no impact). There continues to be no significant impact in 2020 due to management actions taken to reduce the impact of changing interest rates on operating profit.
This impact is also calculated with no change to the charges paid by policyholders.
Guarantees and options
The Group has issued insurance contracts guarantees and options, the ultimate liability for which will depend significantly on the number of policyholders exercising their options and on market and investment conditions applying at that time.
F: Analysis of financial assets and liabilitiesF2: Insurance and investment contracts
(h) Exposure and management of risk arising from insurance contracts
Certain life assurance contracts include the payment of guaranteed values to policyholders on maturity, death, disability or survival. The published liabilities include the provision for both the intrinsic and time-value of the options and guarantees. The time-value of options and guarantees has been valued using a market-consistent stochastic asset model that aligns with the guidance in the Advisory Practice Notes (APN) issued by the Actuarial Society of South Africa, and APN 110 in particular. The options and guarantees that could have a material effect on the amount, timing and uncertainty of future cash flows are described in the following table:
Product category Description of options and guarantees
Retail
Death, disability, point and/or maturity guarantees
A closed block of universal life business with an underlying minimum growth rate guarantee (4.25% p.a. for life and endowment business and 4.75% p.a. for retirement annuity business), and smoothed bonus business with vested bonuses, applicable when calculating death, disability and maturity claims.
Guaranteed annuity options Retirement annuities sold prior to June 1997 contain guaranteed annuity options, whereby the policyholder has an option to exchange the full retirement proceeds for a minimum level of annuity income at maturity.
Corporate
Vested bonuses in respect of pre-retirement with- profits business
There is a material pre-retirement savings smoothed bonus portfolio. Vested bonuses affect the calculation of benefit payments when a member exits from the scheme as the face value is paid out. If, however, a scheme terminates, the lower of face and market value is paid out and the vested bonuses are not guaranteed.
Guaranteed annuity payments in respect of with-profit annuity business
There is a significant with-profit annuity portfolio. The underlying pricing interest rate is guaranteed and as such the current level of annuity payments (including past declared bonuses) cannot be reduced. If, however, a scheme terminates, the lower of the liability value on the Financial Soundness Valuation basis and the underlying asset market value is paid out.
The following disclosures are provided in terms of APN 110 issued by the Actuarial Society in South Africa.
Investment guarantee reserves have been calculated using an internal economic scenario generator (ESG) model that generates product specific economic scenarios. These scenarios comprise interest rates, inflation and fund returns. The model is calibrated to South African derivative market data (where available and reliable), according to the group’s specific calibration requirements. The calibration has been performed as at 31 December 2020.
The risk-free zero coupon yield curve has been derived from mid-swap spot rates at the calibration date.
Term (years) Annualised zero‑coupon yield
1 3.4%
2 3.6%
3 4.0%
4 4.4%
5 4.9%
10 7.3%
15 8.6%
20 9.1%
25 9.4%
30 9.1%
OMLACSA Separate and Consolidated Annual Financial Statements for the year ended 31 December 2020 OMLACSA Separate and Consolidated Annual Financial Statements for the year ended 31 December 202078 79OMLACSA Separate and Consolidated Annual Financial Statements for the year ended 31 December 2020OMLACSA Separate and Consolidated Annual Financial Statements for the year ended 31 December 2020
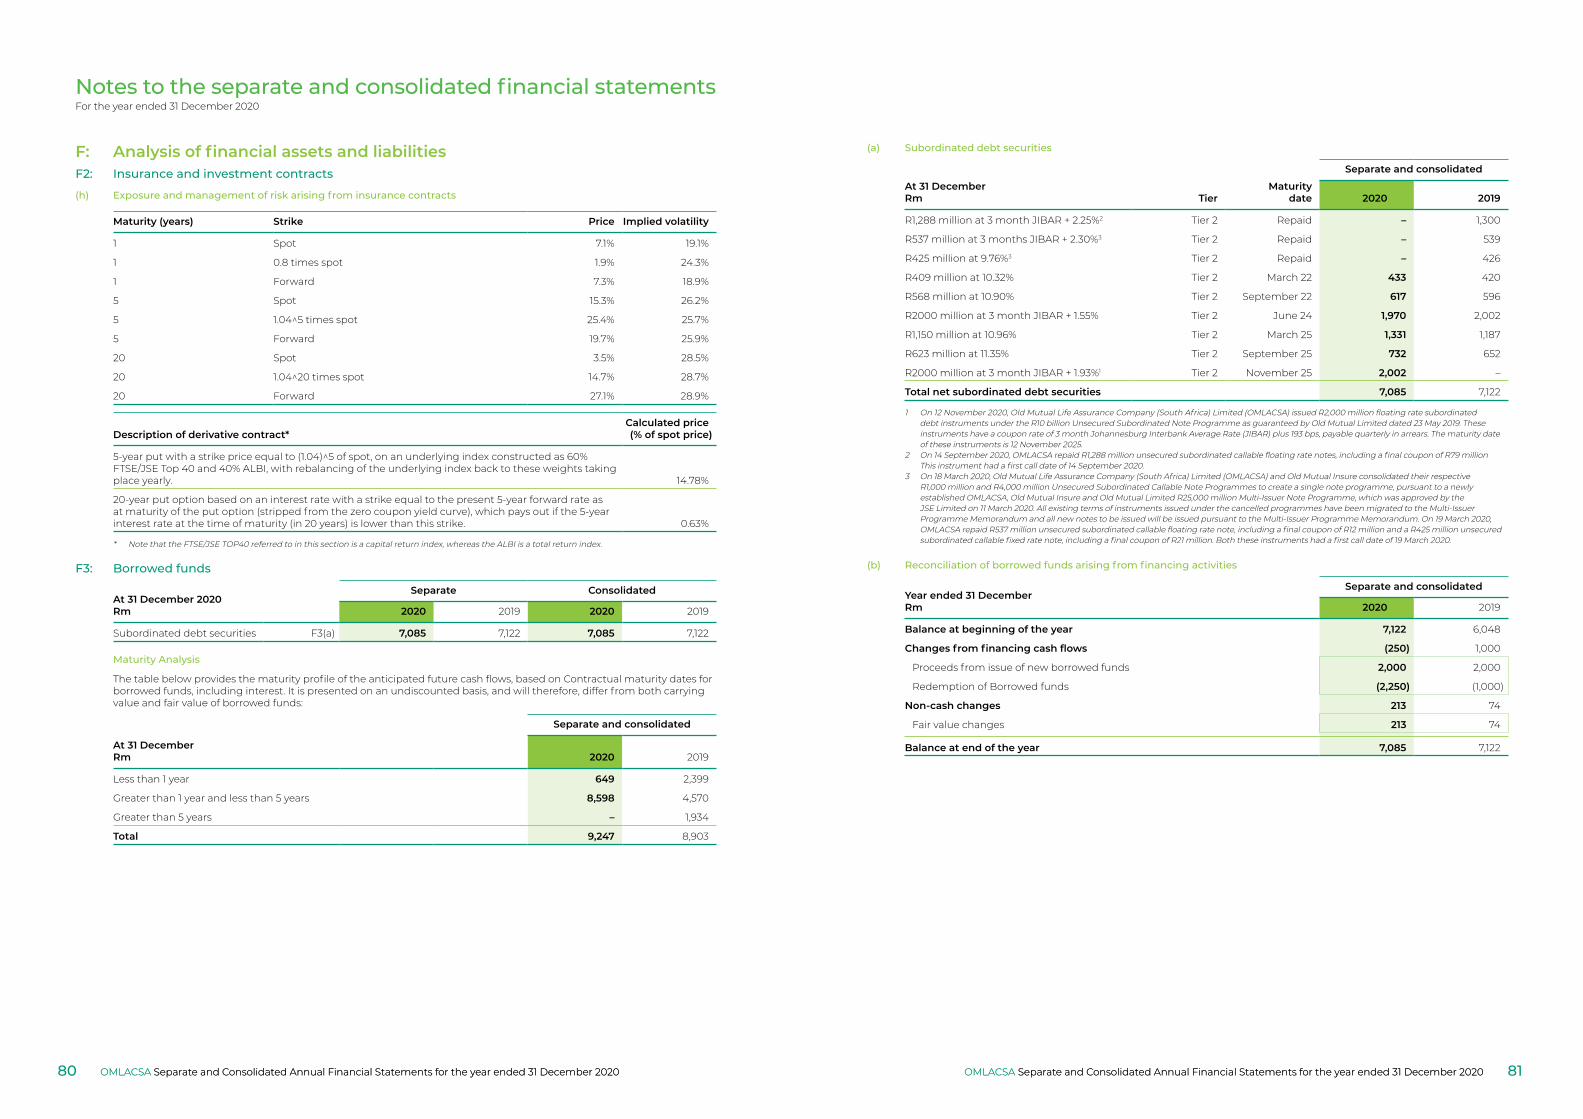
Notes to the separate and consolidated financial statementsFor the year ended 31 December 2020
Maturity (years) Strike Price Implied volatility
1 Spot 7.1% 19.1%
1 0.8 times spot 1.9% 24.3%
1 Forward 7.3% 18.9%
5 Spot 15.3% 26.2%
5 1.04^5 times spot 25.4% 25.7%
5 Forward 19.7% 25.9%
20 Spot 3.5% 28.5%
20 1.04^20 times spot 14.7% 28.7%
20 Forward 27.1% 28.9%
Description of derivative contract*Calculated price(% of spot price)
5-year put with a strike price equal to (1.04)^5 of spot, on an underlying index constructed as 60% FTSE/JSE Top 40 and 40% ALBI, with rebalancing of the underlying index back to these weights taking place yearly. 14.78%
20-year put option based on an interest rate with a strike equal to the present 5-year forward rate as at maturity of the put option (stripped from the zero coupon yield curve), which pays out if the 5-year interest rate at the time of maturity (in 20 years) is lower than this strike. 0.63%
* Note that the FTSE/JSE TOP40 referred to in this section is a capital return index, whereas the ALBI is a total return index.
F3: Borrowed funds
At 31 December 2020Rm
Separate Consolidated
2020 2019 2020 2019
Subordinated debt securities F3(a) 7,085 7,122 7,085 7,122
Maturity Analysis
The table below provides the maturity profile of the anticipated future cash flows, based on Contractual maturity dates for borrowed funds, including interest. It is presented on an undiscounted basis, and will therefore, differ from both carrying value and fair value of borrowed funds:
Separate and consolidated
At 31 DecemberRm 2020 2019
Less than 1 year 649 2,399
Greater than 1 year and less than 5 years 8,598 4,570
Greater than 5 years – 1,934
Total 9,247 8,903
F: Analysis of financial assets and liabilitiesF2: Insurance and investment contracts
(h) Exposure and management of risk arising from insurance contracts
(a) Subordinated debt securities
At 31 DecemberRm
Separate and consolidated
TierMaturity
date 2020 2019
R1,288 million at 3 month JIBAR + 2.25%2 Tier 2 Repaid – 1,300
R537 million at 3 months JIBAR + 2.30%3 Tier 2 Repaid – 539
R425 million at 9.76%3 Tier 2 Repaid – 426
R409 million at 10.32% Tier 2 March 22 433 420
R568 million at 10.90% Tier 2 September 22 617 596
R2000 million at 3 month JIBAR + 1.55% Tier 2 June 24 1,970 2,002
R1,150 million at 10.96% Tier 2 March 25 1,331 1,187
R623 million at 11.35% Tier 2 September 25 732 652
R2000 million at 3 month JIBAR + 1.93%1 Tier 2 November 25 2,002 –
Total net subordinated debt securities 7,085 7,122
1 On 12 November 2020, Old Mutual Life Assurance Company (South Africa) Limited (OMLACSA) issued R2,000 million floating rate subordinated debt instruments under the R10 billion Unsecured Subordinated Note Programme as guaranteed by Old Mutual Limited dated 23 May 2019. These instruments have a coupon rate of 3 month Johannesburg Interbank Average Rate (JIBAR) plus 193 bps, payable quarterly in arrears. The maturity date of these instruments is 12 November 2025.
2 On 14 September 2020, OMLACSA repaid R1,288 million unsecured subordinated callable floating rate notes, including a final coupon of R79 million This instrument had a first call date of 14 September 2020.
3 On 18 March 2020, Old Mutual Life Assurance Company (South Africa) Limited (OMLACSA) and Old Mutual Insure consolidated their respective R1,000 million and R4,000 million Unsecured Subordinated Callable Note Programmes to create a single note programme, pursuant to a newly established OMLACSA, Old Mutual Insure and Old Mutual Limited R25,000 million Multi-Issuer Note Programme, which was approved by the JSE Limited on 11 March 2020. All existing terms of instruments issued under the cancelled programmes have been migrated to the Multi-Issuer Programme Memorandum and all new notes to be issued will be issued pursuant to the Multi-Issuer Programme Memorandum. On 19 March 2020, OMLACSA repaid R537 million unsecured subordinated callable floating rate note, including a final coupon of R12 million and a R425 million unsecured subordinated callable fixed rate note, including a final coupon of R21 million. Both these instruments had a first call date of 19 March 2020.
(b) Reconciliation of borrowed funds arising from financing activities
Year ended 31 DecemberRm
Separate and consolidated
2020 2019
Balance at beginning of the year 7,122 6,048
Changes from financing cash flows (250) 1,000
Proceeds from issue of new borrowed funds 2,000 2,000
Redemption of Borrowed funds (2,250) (1,000)
Non‑cash changes 213 74
Fair value changes 213 74
Balance at end of the year 7,085 7,122
OMLACSA Separate and Consolidated Annual Financial Statements for the year ended 31 December 2020 OMLACSA Separate and Consolidated Annual Financial Statements for the year ended 31 December 202080 81OMLACSA Separate and Consolidated Annual Financial Statements for the year ended 31 December 2020OMLACSA Separate and Consolidated Annual Financial Statements for the year ended 31 December 2020
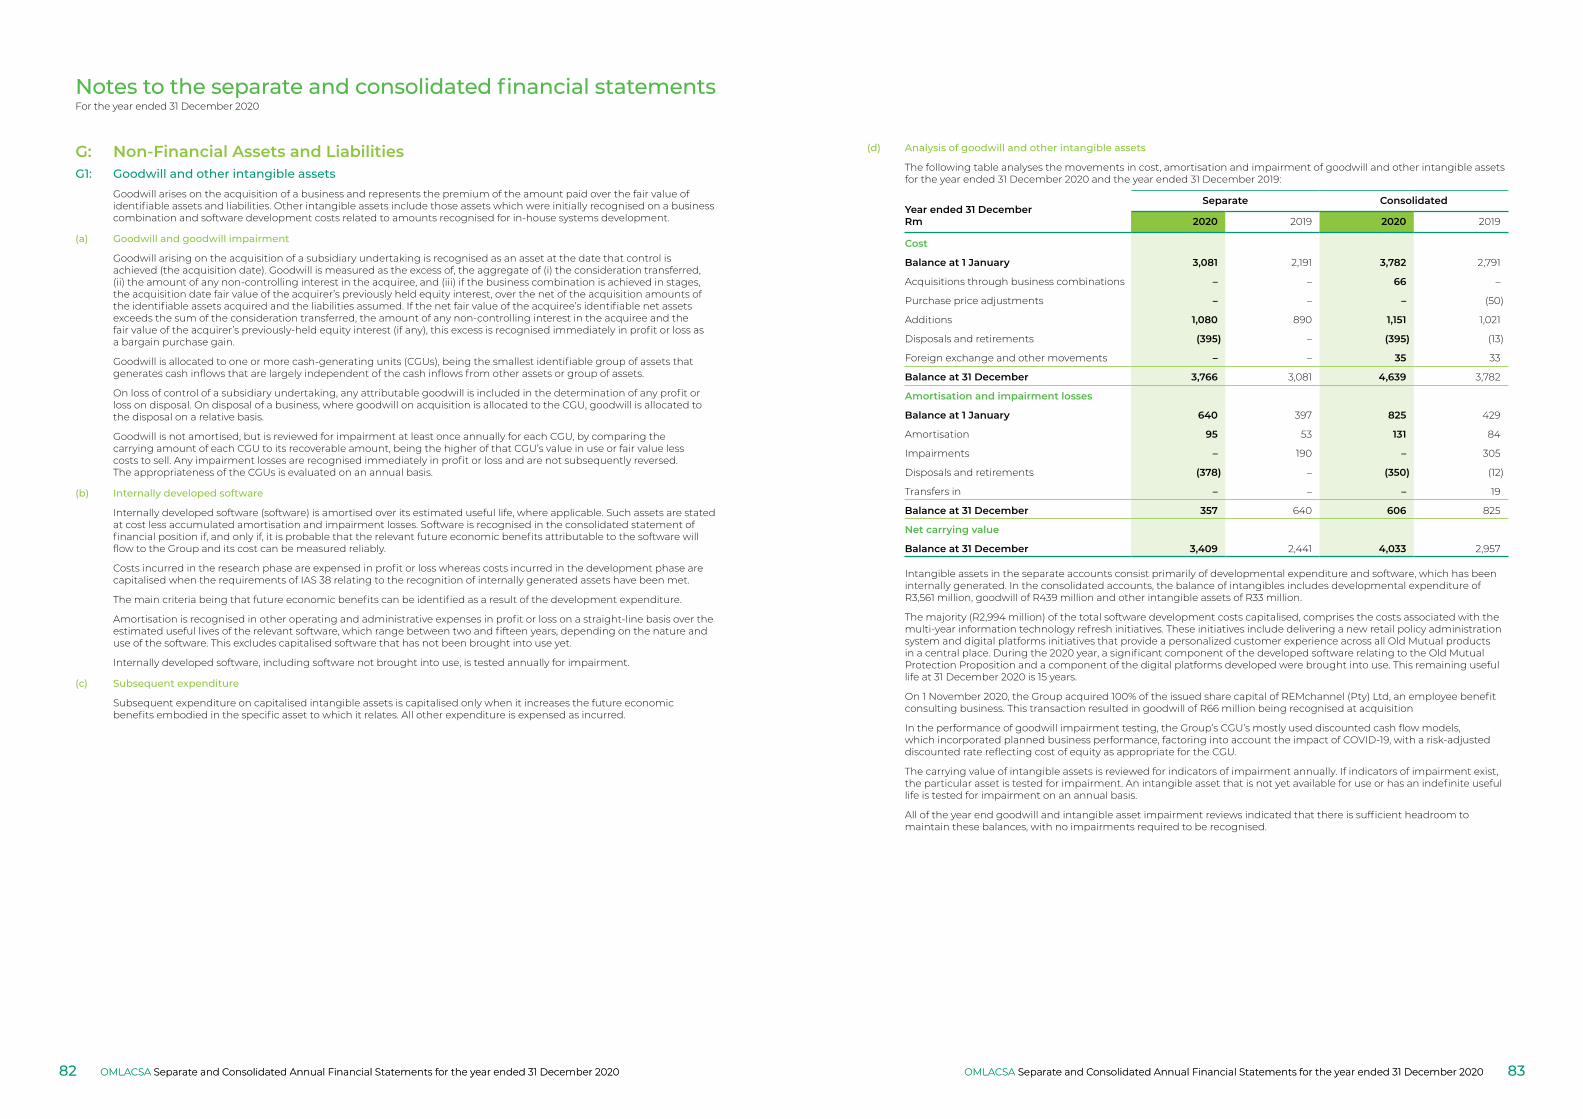
Notes to the separate and consolidated financial statementsFor the year ended 31 December 2020
G: Non‑Financial Assets and LiabilitiesG1: Goodwill and other intangible assets
Goodwill arises on the acquisition of a business and represents the premium of the amount paid over the fair value of identifiable assets and liabilities. Other intangible assets include those assets which were initially recognised on a business combination and software development costs related to amounts recognised for in-house systems development.
(a) Goodwill and goodwill impairment
Goodwill arising on the acquisition of a subsidiary undertaking is recognised as an asset at the date that control is achieved (the acquisition date). Goodwill is measured as the excess of, the aggregate of (i) the consideration transferred, (ii) the amount of any non-controlling interest in the acquiree, and (iii) if the business combination is achieved in stages, the acquisition date fair value of the acquirer’s previously held equity interest, over the net of the acquisition amounts of the identifiable assets acquired and the liabilities assumed. If the net fair value of the acquiree’s identifiable net assets exceeds the sum of the consideration transferred, the amount of any non-controlling interest in the acquiree and the fair value of the acquirer’s previously-held equity interest (if any), this excess is recognised immediately in profit or loss as a bargain purchase gain.
Goodwill is allocated to one or more cash-generating units (CGUs), being the smallest identifiable group of assets that generates cash inflows that are largely independent of the cash inflows from other assets or group of assets.
On loss of control of a subsidiary undertaking, any attributable goodwill is included in the determination of any profit or loss on disposal. On disposal of a business, where goodwill on acquisition is allocated to the CGU, goodwill is allocated to the disposal on a relative basis.
Goodwill is not amortised, but is reviewed for impairment at least once annually for each CGU, by comparing the carrying amount of each CGU to its recoverable amount, being the higher of that CGU’s value in use or fair value less costs to sell. Any impairment losses are recognised immediately in profit or loss and are not subsequently reversed. The appropriateness of the CGUs is evaluated on an annual basis.
(b) Internally developed software
Internally developed software (software) is amortised over its estimated useful life, where applicable. Such assets are stated at cost less accumulated amortisation and impairment losses. Software is recognised in the consolidated statement of financial position if, and only if, it is probable that the relevant future economic benefits attributable to the software will flow to the Group and its cost can be measured reliably.
Costs incurred in the research phase are expensed in profit or loss whereas costs incurred in the development phase are capitalised when the requirements of IAS 38 relating to the recognition of internally generated assets have been met.
The main criteria being that future economic benefits can be identified as a result of the development expenditure.
Amortisation is recognised in other operating and administrative expenses in profit or loss on a straight-line basis over the estimated useful lives of the relevant software, which range between two and fifteen years, depending on the nature and use of the software. This excludes capitalised software that has not been brought into use yet.
Internally developed software, including software not brought into use, is tested annually for impairment.
(c) Subsequent expenditure
Subsequent expenditure on capitalised intangible assets is capitalised only when it increases the future economic benefits embodied in the specific asset to which it relates. All other expenditure is expensed as incurred.
(d) Analysis of goodwill and other intangible assets
The following table analyses the movements in cost, amortisation and impairment of goodwill and other intangible assets for the year ended 31 December 2020 and the year ended 31 December 2019:
Year ended 31 DecemberRm
Separate Consolidated
2020 2019 2020 2019
Cost
Balance at 1 January 3,081 2,191 3,782 2,791
Acquisitions through business combinations – – 66 –
Purchase price adjustments – – – (50)
Additions 1,080 890 1,151 1,021
Disposals and retirements (395) – (395) (13)
Foreign exchange and other movements – – 35 33
Balance at 31 December 3,766 3,081 4,639 3,782
Amortisation and impairment losses
Balance at 1 January 640 397 825 429
Amortisation 95 53 131 84
Impairments – 190 – 305
Disposals and retirements (378) – (350) (12)
Transfers in – – – 19
Balance at 31 December 357 640 606 825
Net carrying value
Balance at 31 December 3,409 2,441 4,033 2,957
Intangible assets in the separate accounts consist primarily of developmental expenditure and software, which has been internally generated. In the consolidated accounts, the balance of intangibles includes developmental expenditure of R3,561 million, goodwill of R439 million and other intangible assets of R33 million.
The majority (R2,994 million) of the total software development costs capitalised, comprises the costs associated with the multi-year information technology refresh initiatives. These initiatives include delivering a new retail policy administration system and digital platforms initiatives that provide a personalized customer experience across all Old Mutual products in a central place. During the 2020 year, a significant component of the developed software relating to the Old Mutual Protection Proposition and a component of the digital platforms developed were brought into use. This remaining useful life at 31 December 2020 is 15 years.
On 1 November 2020, the Group acquired 100% of the issued share capital of REMchannel (Pty) Ltd, an employee benefit consulting business. This transaction resulted in goodwill of R66 million being recognised at acquisition
In the performance of goodwill impairment testing, the Group’s CGU’s mostly used discounted cash flow models, which incorporated planned business performance, factoring into account the impact of COVID-19, with a risk-adjusted discounted rate reflecting cost of equity as appropriate for the CGU.
The carrying value of intangible assets is reviewed for indicators of impairment annually. If indicators of impairment exist, the particular asset is tested for impairment. An intangible asset that is not yet available for use or has an indefinite useful life is tested for impairment on an annual basis.
All of the year end goodwill and intangible asset impairment reviews indicated that there is sufficient headroom to maintain these balances, with no impairments required to be recognised.
OMLACSA Separate and Consolidated Annual Financial Statements for the year ended 31 December 2020 OMLACSA Separate and Consolidated Annual Financial Statements for the year ended 31 December 202082 83OMLACSA Separate and Consolidated Annual Financial Statements for the year ended 31 December 2020OMLACSA Separate and Consolidated Annual Financial Statements for the year ended 31 December 2020
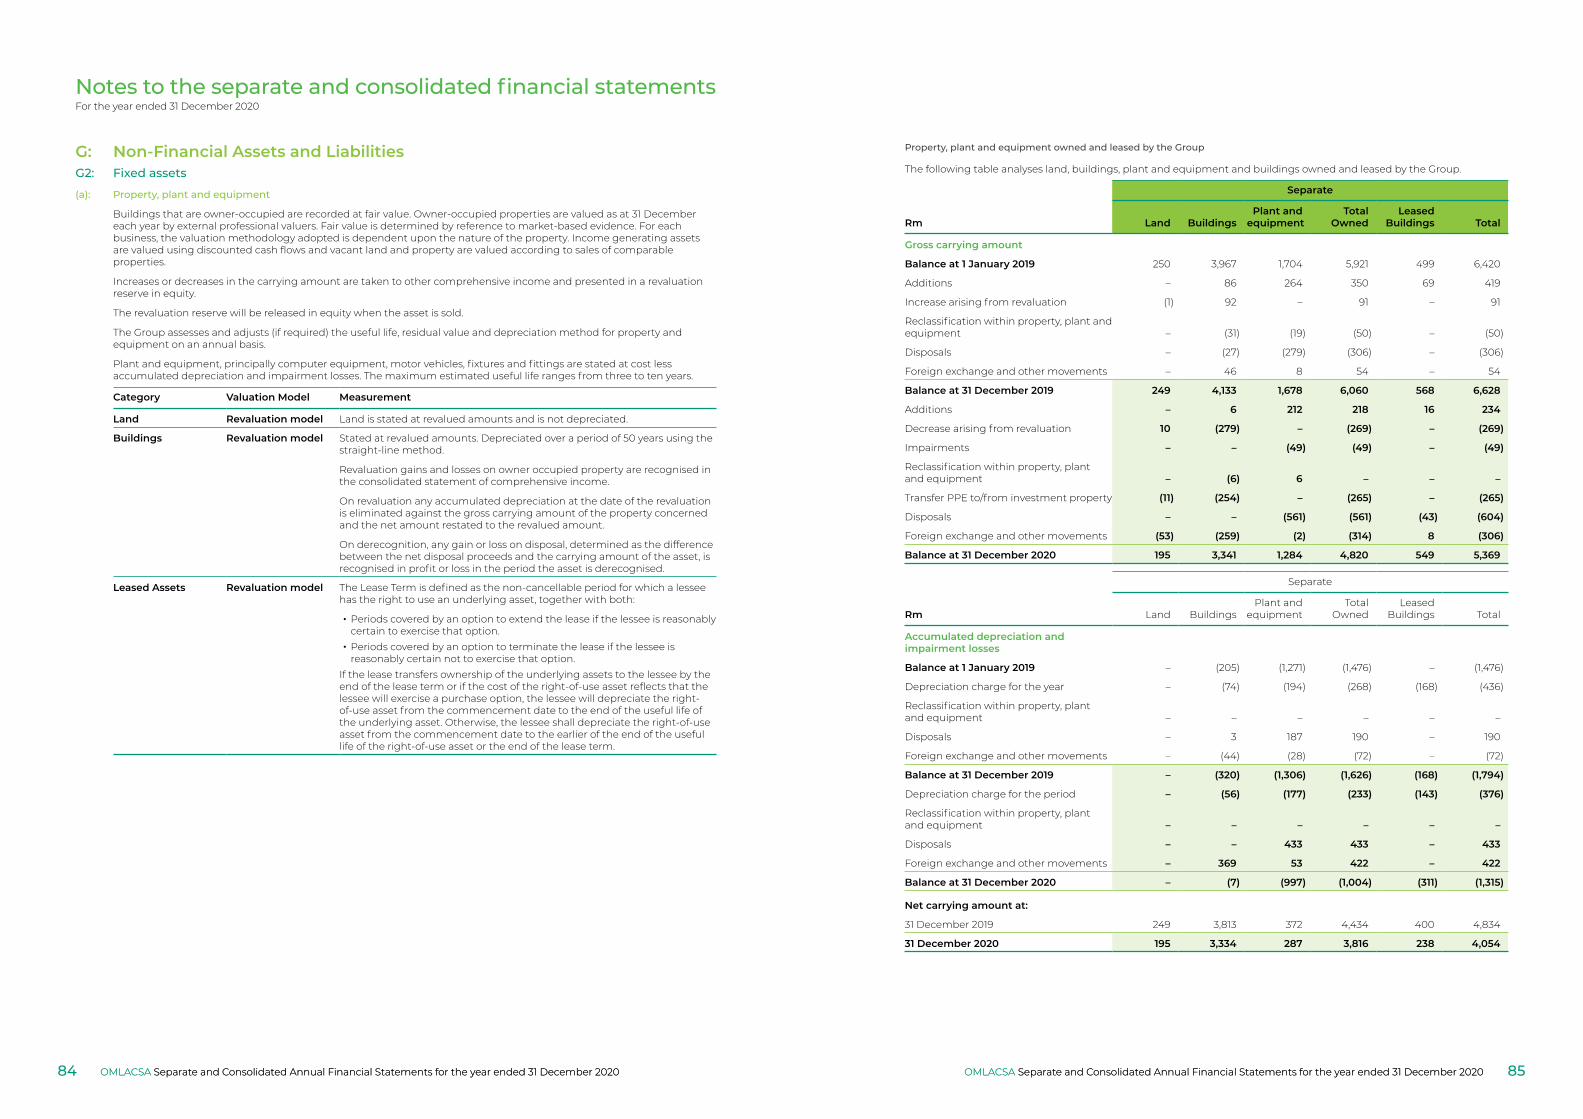
Notes to the separate and consolidated financial statementsFor the year ended 31 December 2020
G2: Fixed assets
(a): Property, plant and equipment
Buildings that are owner-occupied are recorded at fair value. Owner-occupied properties are valued as at 31 December each year by external professional valuers. Fair value is determined by reference to market-based evidence. For each business, the valuation methodology adopted is dependent upon the nature of the property. Income generating assets are valued using discounted cash flows and vacant land and property are valued according to sales of comparable properties.
Increases or decreases in the carrying amount are taken to other comprehensive income and presented in a revaluation reserve in equity.
The revaluation reserve will be released in equity when the asset is sold.
The Group assesses and adjusts (if required) the useful life, residual value and depreciation method for property and equipment on an annual basis.
Plant and equipment, principally computer equipment, motor vehicles, fixtures and fittings are stated at cost less accumulated depreciation and impairment losses. The maximum estimated useful life ranges from three to ten years.
Category Valuation Model Measurement
Land Revaluation model Land is stated at revalued amounts and is not depreciated.
Buildings Revaluation model Stated at revalued amounts. Depreciated over a period of 50 years using the straight-line method.
Revaluation gains and losses on owner occupied property are recognised in the consolidated statement of comprehensive income.
On revaluation any accumulated depreciation at the date of the revaluation is eliminated against the gross carrying amount of the property concerned and the net amount restated to the revalued amount.
On derecognition, any gain or loss on disposal, determined as the difference between the net disposal proceeds and the carrying amount of the asset, is recognised in profit or loss in the period the asset is derecognised.
Leased Assets Revaluation model The Lease Term is defined as the non-cancellable period for which a lessee has the right to use an underlying asset, together with both:
• Periods covered by an option to extend the lease if the lessee is reasonably certain to exercise that option.
• Periods covered by an option to terminate the lease if the lessee is reasonably certain not to exercise that option.
If the lease transfers ownership of the underlying assets to the lessee by the end of the lease term or if the cost of the right-of-use asset reflects that the lessee will exercise a purchase option, the lessee will depreciate the right-of-use asset from the commencement date to the end of the useful life of the underlying asset. Otherwise, the lessee shall depreciate the right-of-use asset from the commencement date to the earlier of the end of the useful life of the right-of-use asset or the end of the lease term.
G: Non‑Financial Assets and Liabilities Property, plant and equipment owned and leased by the Group
The following table analyses land, buildings, plant and equipment and buildings owned and leased by the Group.
Separate
Rm Land BuildingsPlant and
equipmentTotal
OwnedLeased
Buildings Total
Gross carrying amount
Balance at 1 January 2019 250 3,967 1,704 5,921 499 6,420
Additions – 86 264 350 69 419
Increase arising from revaluation (1) 92 – 91 – 91
Reclassification within property, plant and equipment – (31) (19) (50) – (50)
Disposals – (27) (279) (306) – (306)
Foreign exchange and other movements – 46 8 54 – 54
Balance at 31 December 2019 249 4,133 1,678 6,060 568 6,628
Additions – 6 212 218 16 234
Decrease arising from revaluation 10 (279) – (269) – (269)
Impairments – – (49) (49) – (49)
Reclassification within property, plant and equipment – (6) 6 – – –
Transfer PPE to/from investment property (11) (254) – (265) – (265)
Disposals – – (561) (561) (43) (604)
Foreign exchange and other movements (53) (259) (2) (314) 8 (306)
Balance at 31 December 2020 195 3,341 1,284 4,820 549 5,369
Separate
Rm Land BuildingsPlant and
equipmentTotal
OwnedLeased
Buildings Total
Accumulated depreciation and impairment losses
Balance at 1 January 2019 – (205) (1,271) (1,476) – (1,476)
Depreciation charge for the year – (74) (194) (268) (168) (436)
Reclassification within property, plant and equipment – – – – – –
Disposals – 3 187 190 – 190
Foreign exchange and other movements – (44) (28) (72) – (72)
Balance at 31 December 2019 – (320) (1,306) (1,626) (168) (1,794)
Depreciation charge for the period – (56) (177) (233) (143) (376)
Reclassification within property, plant and equipment – – – – – –
Disposals – – 433 433 – 433
Foreign exchange and other movements – 369 53 422 – 422
Balance at 31 December 2020 – (7) (997) (1,004) (311) (1,315)
Net carrying amount at:
31 December 2019 249 3,813 372 4,434 400 4,834
31 December 2020 195 3,334 287 3,816 238 4,054
OMLACSA Separate and Consolidated Annual Financial Statements for the year ended 31 December 2020 OMLACSA Separate and Consolidated Annual Financial Statements for the year ended 31 December 202084 85OMLACSA Separate and Consolidated Annual Financial Statements for the year ended 31 December 2020OMLACSA Separate and Consolidated Annual Financial Statements for the year ended 31 December 2020
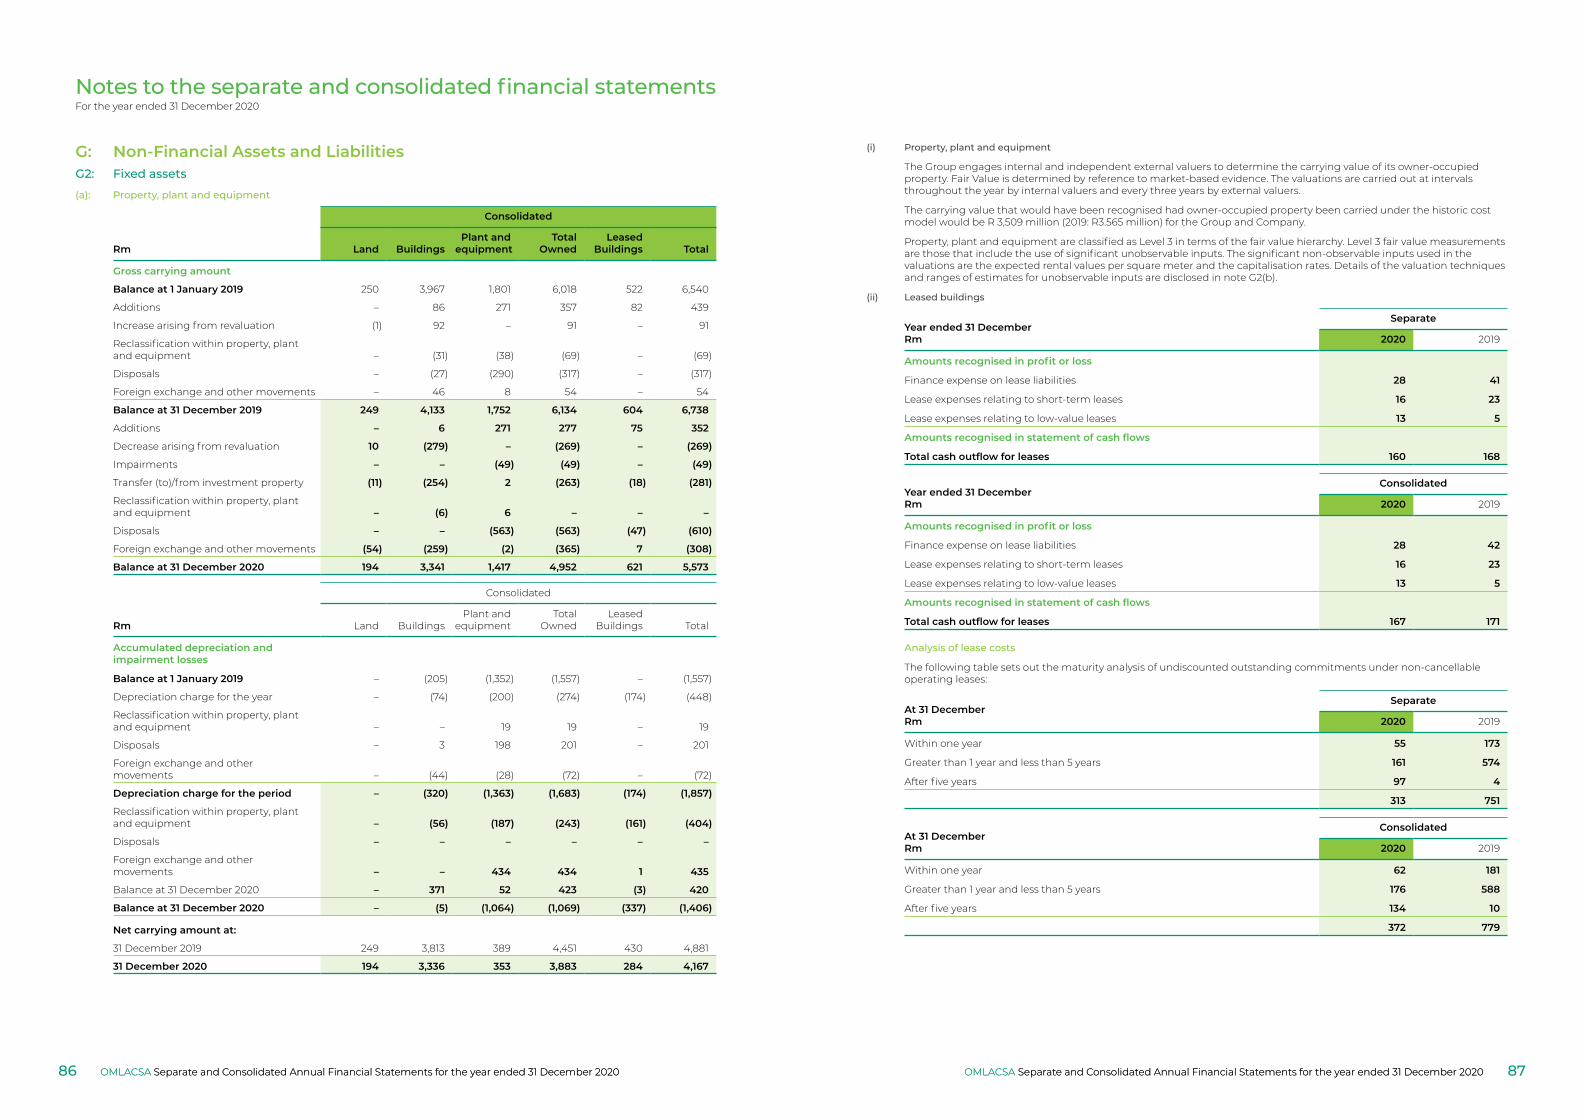
Notes to the separate and consolidated financial statementsFor the year ended 31 December 2020
(a): Property, plant and equipment
Consolidated
Rm Land BuildingsPlant and
equipmentTotal
OwnedLeased
Buildings Total
Gross carrying amount
Balance at 1 January 2019 250 3,967 1,801 6,018 522 6,540
Additions – 86 271 357 82 439
Increase arising from revaluation (1) 92 – 91 – 91
Reclassification within property, plant and equipment – (31) (38) (69) – (69)
Disposals – (27) (290) (317) – (317)
Foreign exchange and other movements – 46 8 54 – 54
Balance at 31 December 2019 249 4,133 1,752 6,134 604 6,738
Additions – 6 271 277 75 352
Decrease arising from revaluation 10 (279) – (269) – (269)
Impairments – – (49) (49) – (49)
Transfer (to)/from investment property (11) (254) 2 (263) (18) (281)
Reclassification within property, plant and equipment – (6) 6 – – –
Disposals – – (563) (563) (47) (610)
Foreign exchange and other movements (54) (259) (2) (365) 7 (308)
Balance at 31 December 2020 194 3,341 1,417 4,952 621 5,573
Consolidated
Rm Land BuildingsPlant and
equipmentTotal
OwnedLeased
Buildings Total
Accumulated depreciation and impairment losses
Balance at 1 January 2019 – (205) (1,352) (1,557) – (1,557)
Depreciation charge for the year – (74) (200) (274) (174) (448)
Reclassification within property, plant and equipment – – 19 19 – 19
Disposals – 3 198 201 – 201
Foreign exchange and other movements – (44) (28) (72) – (72)
Depreciation charge for the period – (320) (1,363) (1,683) (174) (1,857)
Reclassification within property, plant and equipment – (56) (187) (243) (161) (404)
Disposals – – – – – –
Foreign exchange and other movements – – 434 434 1 435
Balance at 31 December 2020 – 371 52 423 (3) 420
Balance at 31 December 2020 – (5) (1,064) (1,069) (337) (1,406)
Net carrying amount at:
31 December 2019 249 3,813 389 4,451 430 4,881
31 December 2020 194 3,336 353 3,883 284 4,167
G: Non‑Financial Assets and LiabilitiesG2: Fixed assets
(i) Property, plant and equipment
The Group engages internal and independent external valuers to determine the carrying value of its owner-occupied property. Fair Value is determined by reference to market-based evidence. The valuations are carried out at intervals throughout the year by internal valuers and every three years by external valuers.
The carrying value that would have been recognised had owner-occupied property been carried under the historic cost model would be R 3,509 million (2019: R3.565 million) for the Group and Company.
Property, plant and equipment are classified as Level 3 in terms of the fair value hierarchy. Level 3 fair value measurements are those that include the use of significant unobservable inputs. The significant non-observable inputs used in the valuations are the expected rental values per square meter and the capitalisation rates. Details of the valuation techniques and ranges of estimates for unobservable inputs are disclosed in note G2(b).
(ii) Leased buildings
Year ended 31 DecemberRm
Separate
2020 2019
Amounts recognised in profit or loss
Finance expense on lease liabilities 28 41
Lease expenses relating to short-term leases 16 23
Lease expenses relating to low-value leases 13 5
Amounts recognised in statement of cash flows
Total cash outflow for leases 160 168
Year ended 31 DecemberRm
Consolidated
2020 2019
Amounts recognised in profit or loss
Finance expense on lease liabilities 28 42
Lease expenses relating to short-term leases 16 23
Lease expenses relating to low-value leases 13 5
Amounts recognised in statement of cash flows
Total cash outflow for leases 167 171
Analysis of lease costs
The following table sets out the maturity analysis of undiscounted outstanding commitments under non-cancellable operating leases:
At 31 DecemberRm
Separate
2020 2019
Within one year 55 173
Greater than 1 year and less than 5 years 161 574
After five years 97 4
313 751
At 31 DecemberRm
Consolidated
2020 2019
Within one year 62 181
Greater than 1 year and less than 5 years 176 588
After five years 134 10
372 779
OMLACSA Separate and Consolidated Annual Financial Statements for the year ended 31 December 2020 OMLACSA Separate and Consolidated Annual Financial Statements for the year ended 31 December 202086 87OMLACSA Separate and Consolidated Annual Financial Statements for the year ended 31 December 2020OMLACSA Separate and Consolidated Annual Financial Statements for the year ended 31 December 2020
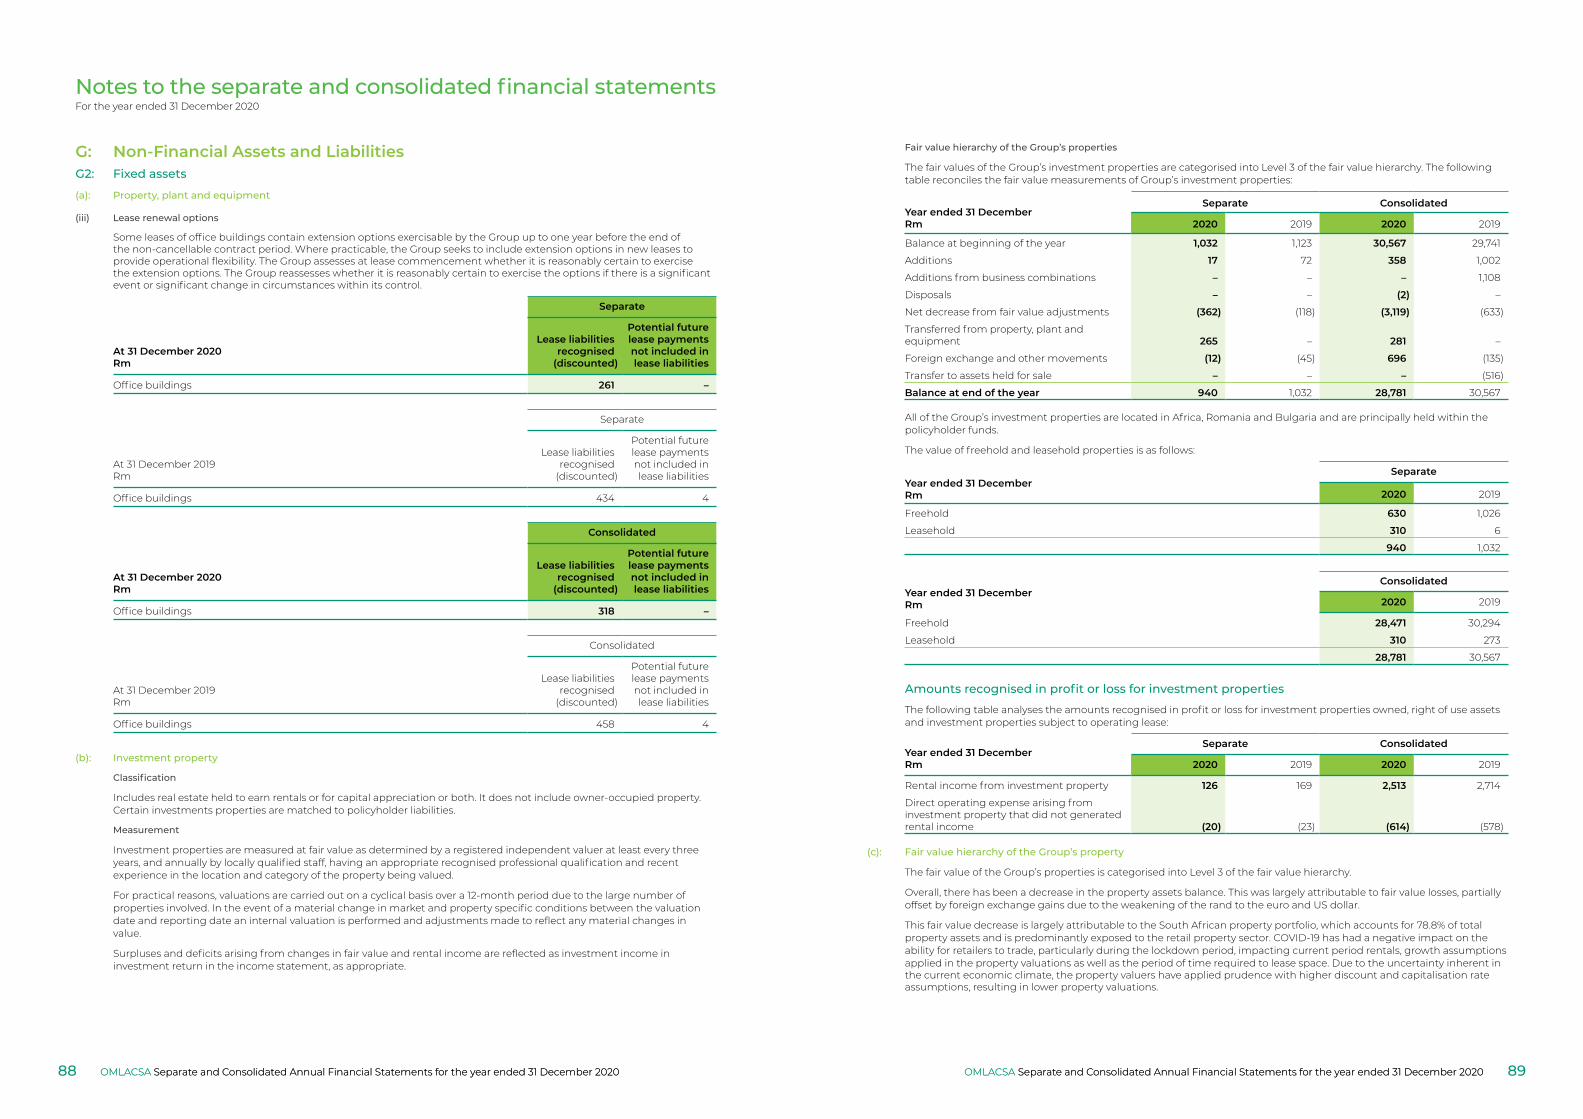
Notes to the separate and consolidated financial statementsFor the year ended 31 December 2020
(iii) Lease renewal options
Some leases of office buildings contain extension options exercisable by the Group up to one year before the end of the non-cancellable contract period. Where practicable, the Group seeks to include extension options in new leases to provide operational flexibility. The Group assesses at lease commencement whether it is reasonably certain to exercise the extension options. The Group reassesses whether it is reasonably certain to exercise the options if there is a significant event or significant change in circumstances within its control.
Separate
At 31 December 2020Rm
Lease liabilities recognised
(discounted)
Potential future lease payments not included in lease liabilities
Office buildings 261 –
Separate
At 31 December 2019Rm
Lease liabilities recognised
(discounted)
Potential future lease payments not included in lease liabilities
Office buildings 434 4
Consolidated
At 31 December 2020Rm
Lease liabilities recognised
(discounted)
Potential future lease payments not included in lease liabilities
Office buildings 318 –
Consolidated
At 31 December 2019Rm
Lease liabilities recognised
(discounted)
Potential future lease payments not included in lease liabilities
Office buildings 458 4
(b): Investment property
Classification
Includes real estate held to earn rentals or for capital appreciation or both. It does not include owner-occupied property. Certain investments properties are matched to policyholder liabilities.
Measurement
Investment properties are measured at fair value as determined by a registered independent valuer at least every three years, and annually by locally qualified staff, having an appropriate recognised professional qualification and recent experience in the location and category of the property being valued.
For practical reasons, valuations are carried out on a cyclical basis over a 12-month period due to the large number of properties involved. In the event of a material change in market and property specific conditions between the valuation date and reporting date an internal valuation is performed and adjustments made to reflect any material changes in value.
Surpluses and deficits arising from changes in fair value and rental income are reflected as investment income in investment return in the income statement, as appropriate.
G: Non‑Financial Assets and LiabilitiesG2: Fixed assets
(a): Property, plant and equipment
Fair value hierarchy of the Group’s properties
The fair values of the Group’s investment properties are categorised into Level 3 of the fair value hierarchy. The following table reconciles the fair value measurements of Group’s investment properties:
Year ended 31 DecemberRm
Separate Consolidated
2020 2019 2020 2019
Balance at beginning of the year 1,032 1,123 30,567 29,741
Additions 17 72 358 1,002
Additions from business combinations – – – 1,108
Disposals – – (2) –
Net decrease from fair value adjustments (362) (118) (3,119) (633)
Transferred from property, plant and equipment 265 – 281 –
Foreign exchange and other movements (12) (45) 696 (135)
Transfer to assets held for sale – – – (516)
Balance at end of the year 940 1,032 28,781 30,567
All of the Group’s investment properties are located in Africa, Romania and Bulgaria and are principally held within the policyholder funds.
The value of freehold and leasehold properties is as follows:
Year ended 31 DecemberRm
Separate
2020 2019
Freehold 630 1,026
Leasehold 310 6
940 1,032
Year ended 31 DecemberRm
Consolidated
2020 2019
Freehold 28,471 30,294
Leasehold 310 273
28,781 30,567
Amounts recognised in profit or loss for investment properties
The following table analyses the amounts recognised in profit or loss for investment properties owned, right of use assets and investment properties subject to operating lease:
Year ended 31 DecemberRm
Separate Consolidated
2020 2019 2020 2019
Rental income from investment property 126 169 2,513 2,714
Direct operating expense arising from investment property that did not generated rental income (20) (23) (614) (578)
(c): Fair value hierarchy of the Group’s property
The fair value of the Group’s properties is categorised into Level 3 of the fair value hierarchy.
Overall, there has been a decrease in the property assets balance. This was largely attributable to fair value losses, partially offset by foreign exchange gains due to the weakening of the rand to the euro and US dollar.
This fair value decrease is largely attributable to the South African property portfolio, which accounts for 78.8% of total property assets and is predominantly exposed to the retail property sector. COVID-19 has had a negative impact on the ability for retailers to trade, particularly during the lockdown period, impacting current period rentals, growth assumptions applied in the property valuations as well as the period of time required to lease space. Due to the uncertainty inherent in the current economic climate, the property valuers have applied prudence with higher discount and capitalisation rate assumptions, resulting in lower property valuations.
OMLACSA Separate and Consolidated Annual Financial Statements for the year ended 31 December 2020 OMLACSA Separate and Consolidated Annual Financial Statements for the year ended 31 December 202088 89OMLACSA Separate and Consolidated Annual Financial Statements for the year ended 31 December 2020OMLACSA Separate and Consolidated Annual Financial Statements for the year ended 31 December 2020
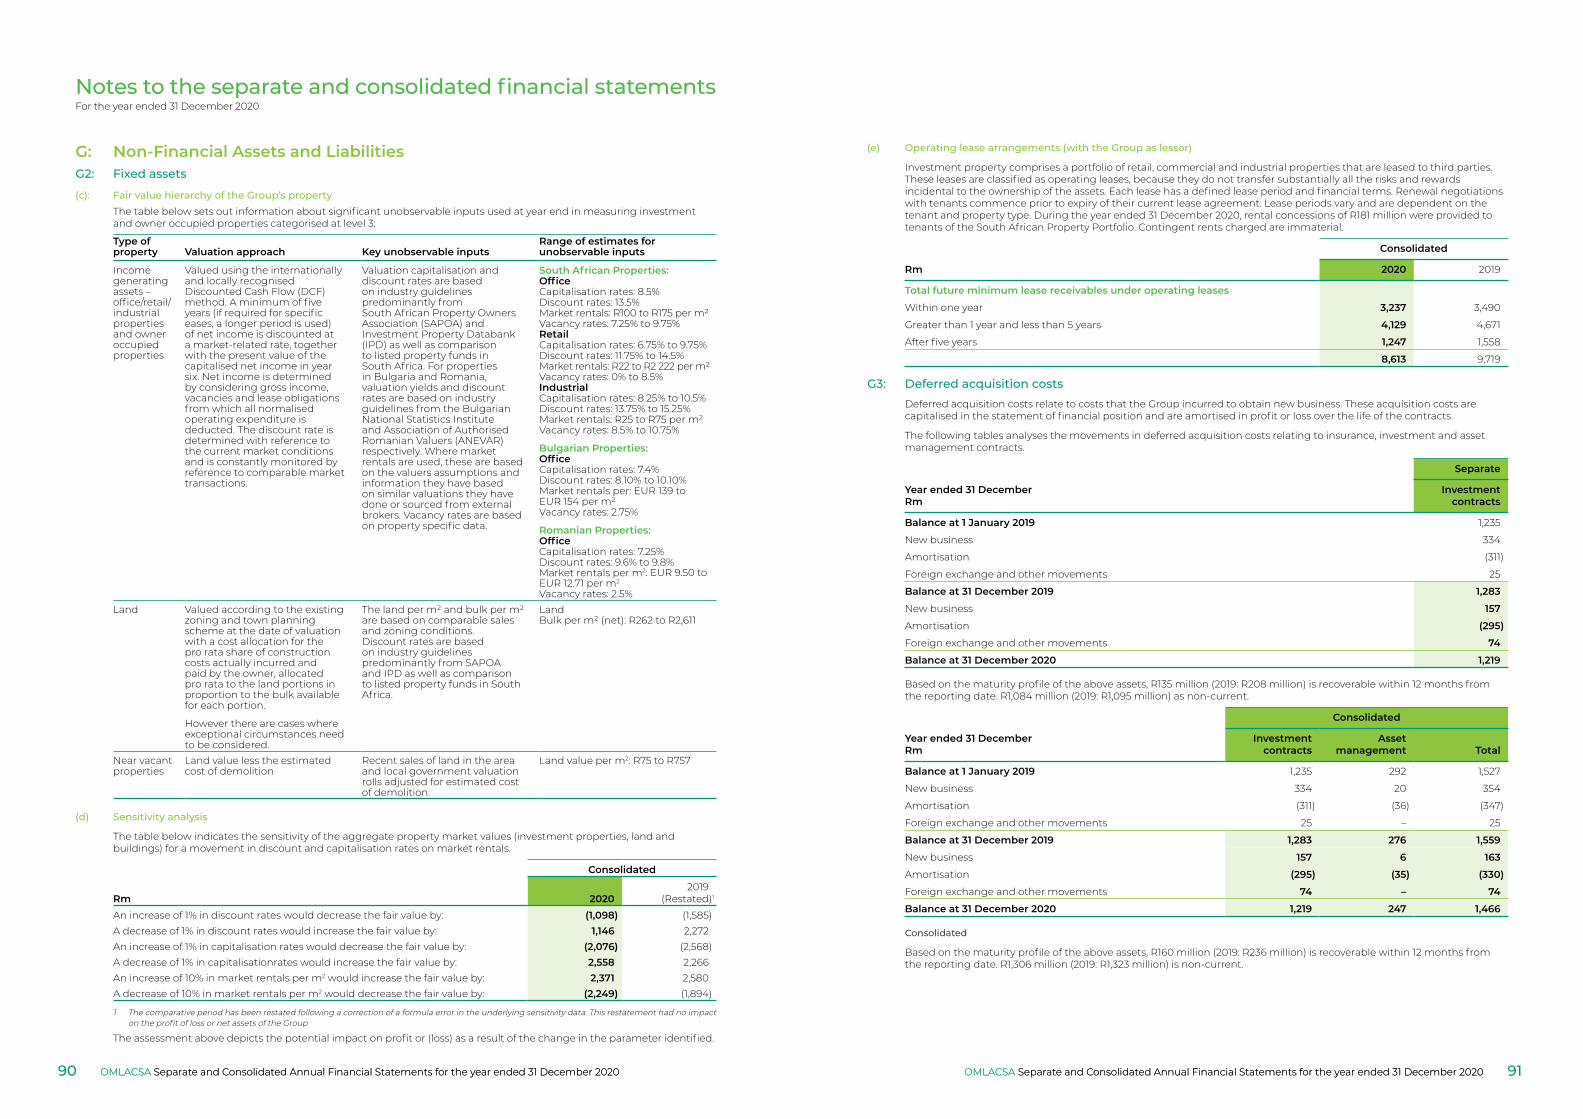
Notes to the separate and consolidated financial statementsFor the year ended 31 December 2020
G: Non‑Financial Assets and LiabilitiesG2: Fixed assets
(c): Fair value hierarchy of the Group’s propertyThe table below sets out information about significant unobservable inputs used at year end in measuring investment and owner occupied properties categorised at level 3:
Type of property Valuation approach Key unobservable inputs
Range of estimates for unobservable inputs
Income generating assets – office/retail/ industrial properties and owner occupied properties
Valued using the internationally and locally recognised Discounted Cash Flow (DCF) method. A minimum of five years (if required for specific eases, a longer period is used) of net income is discounted at a market-related rate, together with the present value of the capitalised net income in year six. Net income is determined by considering gross income, vacancies and lease obligations from which all normalised operating expenditure is deducted. The discount rate is determined with reference to the current market conditions and is constantly monitored by reference to comparable market transactions.
Valuation capitalisation and discount rates are based on industry guidelines predominantly from South African Property Owners Association (SAPOA) and Investment Property Databank (IPD) as well as comparison to listed property funds in South Africa. For properties in Bulgaria and Romania, valuation yields and discount rates are based on industry guidelines from the Bulgarian National Statistics Institute and Association of Authorised Romanian Valuers (ANEVAR) respectively. Where market rentals are used, these are based on the valuers assumptions and information they have based on similar valuations they have done or sourced from external brokers. Vacancy rates are based on property specific data.
South African Properties: OfficeCapitalisation rates: 8.5% Discount rates: 13.5%Market rentals: R100 to R175 per m²Vacancy rates: 7.25% to 9.75%RetailCapitalisation rates: 6.75% to 9.75%Discount rates: 11.75% to 14.5%Market rentals: R22 to R2 222 per m²Vacancy rates: 0% to 8.5%IndustrialCapitalisation rates: 8.25% to 10.5%Discount rates: 13.75% to 15.25%Market rentals: R25 to R75 per m²Vacancy rates: 8.5% to 10.75%
Bulgarian Properties:OfficeCapitalisation rates: 7.4%Discount rates: 8.10% to 10.10%Market rentals per: EUR 139 toEUR 154 per m²Vacancy rates: 2.75%
Romanian Properties:OfficeCapitalisation rates: 7.25% Discount rates: 9.6% to 9.8%Market rentals per m2: EUR 9.50 to EUR 12.71 per m2
Vacancy rates: 2.5%Land Valued according to the existing
zoning and town planning scheme at the date of valuation with a cost allocation for the pro rata share of construction costs actually incurred and paid by the owner, allocated pro rata to the land portions in proportion to the bulk available for each portion.
However there are cases where exceptional circumstances need to be considered.
The land per m² and bulk per m² are based on comparable sales and zoning conditions. Discount rates are based on industry guidelines predominantly from SAPOA and IPD as well as comparison to listed property funds in South Africa.
LandBulk per m² (net): R262 to R2,611
Near vacant properties
Land value less the estimated cost of demolition
Recent sales of land in the area and local government valuation rolls adjusted for estimated cost of demolition.
Land value per m2: R75 to R757
(d) Sensitivity analysis
The table below indicates the sensitivity of the aggregate property market values (investment properties, land and buildings) for a movement in discount and capitalisation rates on market rentals.
Consolidated
Rm 20202019
(Restated)1
An increase of 1% in discount rates would decrease the fair value by: (1,098) (1,585)A decrease of 1% in discount rates would increase the fair value by: 1,146 2,272An increase of 1% in capitalisation rates would decrease the fair value by: (2,076) (2,568)A decrease of 1% in capitalisationrates would increase the fair value by: 2,558 2,266An increase of 10% in market rentals per m2 would increase the fair value by: 2,371 2,580A decrease of 10% in market rentals per m2 would decrease the fair value by: (2,249) (1,894)
1 The comparative period has been restated following a correction of a formula error in the underlying sensitivity data. This restatement had no impact on the profit of loss or net assets of the Group
The assessment above depicts the potential impact on profit or (loss) as a result of the change in the parameter identified.
(e) Operating lease arrangements (with the Group as lessor)
Investment property comprises a portfolio of retail, commercial and industrial properties that are leased to third parties. These leases are classified as operating leases, because they do not transfer substantially all the risks and rewards incidental to the ownership of the assets. Each lease has a defined lease period and financial terms. Renewal negotiations with tenants commence prior to expiry of their current lease agreement. Lease periods vary and are dependent on the tenant and property type. During the year ended 31 December 2020, rental concessions of R181 million were provided to tenants of the South African Property Portfolio. Contingent rents charged are immaterial.
Consolidated
Rm 2020 2019
Total future minimum lease receivables under operating leases
Within one year 3,237 3,490
Greater than 1 year and less than 5 years 4,129 4,671
After five years 1,247 1,558
8,613 9,719
G3: Deferred acquisition costsDeferred acquisition costs relate to costs that the Group incurred to obtain new business. These acquisition costs are capitalised in the statement of financial position and are amortised in profit or loss over the life of the contracts.
The following tables analyses the movements in deferred acquisition costs relating to insurance, investment and asset management contracts.
Year ended 31 DecemberRm
Separate
Investment contracts
Balance at 1 January 2019 1,235
New business 334
Amortisation (311)
Foreign exchange and other movements 25
Balance at 31 December 2019 1,283
New business 157
Amortisation (295)
Foreign exchange and other movements 74
Balance at 31 December 2020 1,219
Based on the maturity profile of the above assets, R135 million (2019: R208 million) is recoverable within 12 months from the reporting date. R1,084 million (2019: R1,095 million) as non-current.
Year ended 31 DecemberRm
Consolidated
Investment contracts
Asset management Total
Balance at 1 January 2019 1,235 292 1,527
New business 334 20 354
Amortisation (311) (36) (347)
Foreign exchange and other movements 25 – 25
Balance at 31 December 2019 1,283 276 1,559
New business 157 6 163
Amortisation (295) (35) (330)
Foreign exchange and other movements 74 – 74
Balance at 31 December 2020 1,219 247 1,466
Consolidated
Based on the maturity profile of the above assets, R160 million (2019: R236 million) is recoverable within 12 months from the reporting date. R1,306 million (2019: R1,323 million) is non-current.
OMLACSA Separate and Consolidated Annual Financial Statements for the year ended 31 December 2020 OMLACSA Separate and Consolidated Annual Financial Statements for the year ended 31 December 202090 91OMLACSA Separate and Consolidated Annual Financial Statements for the year ended 31 December 2020OMLACSA Separate and Consolidated Annual Financial Statements for the year ended 31 December 2020
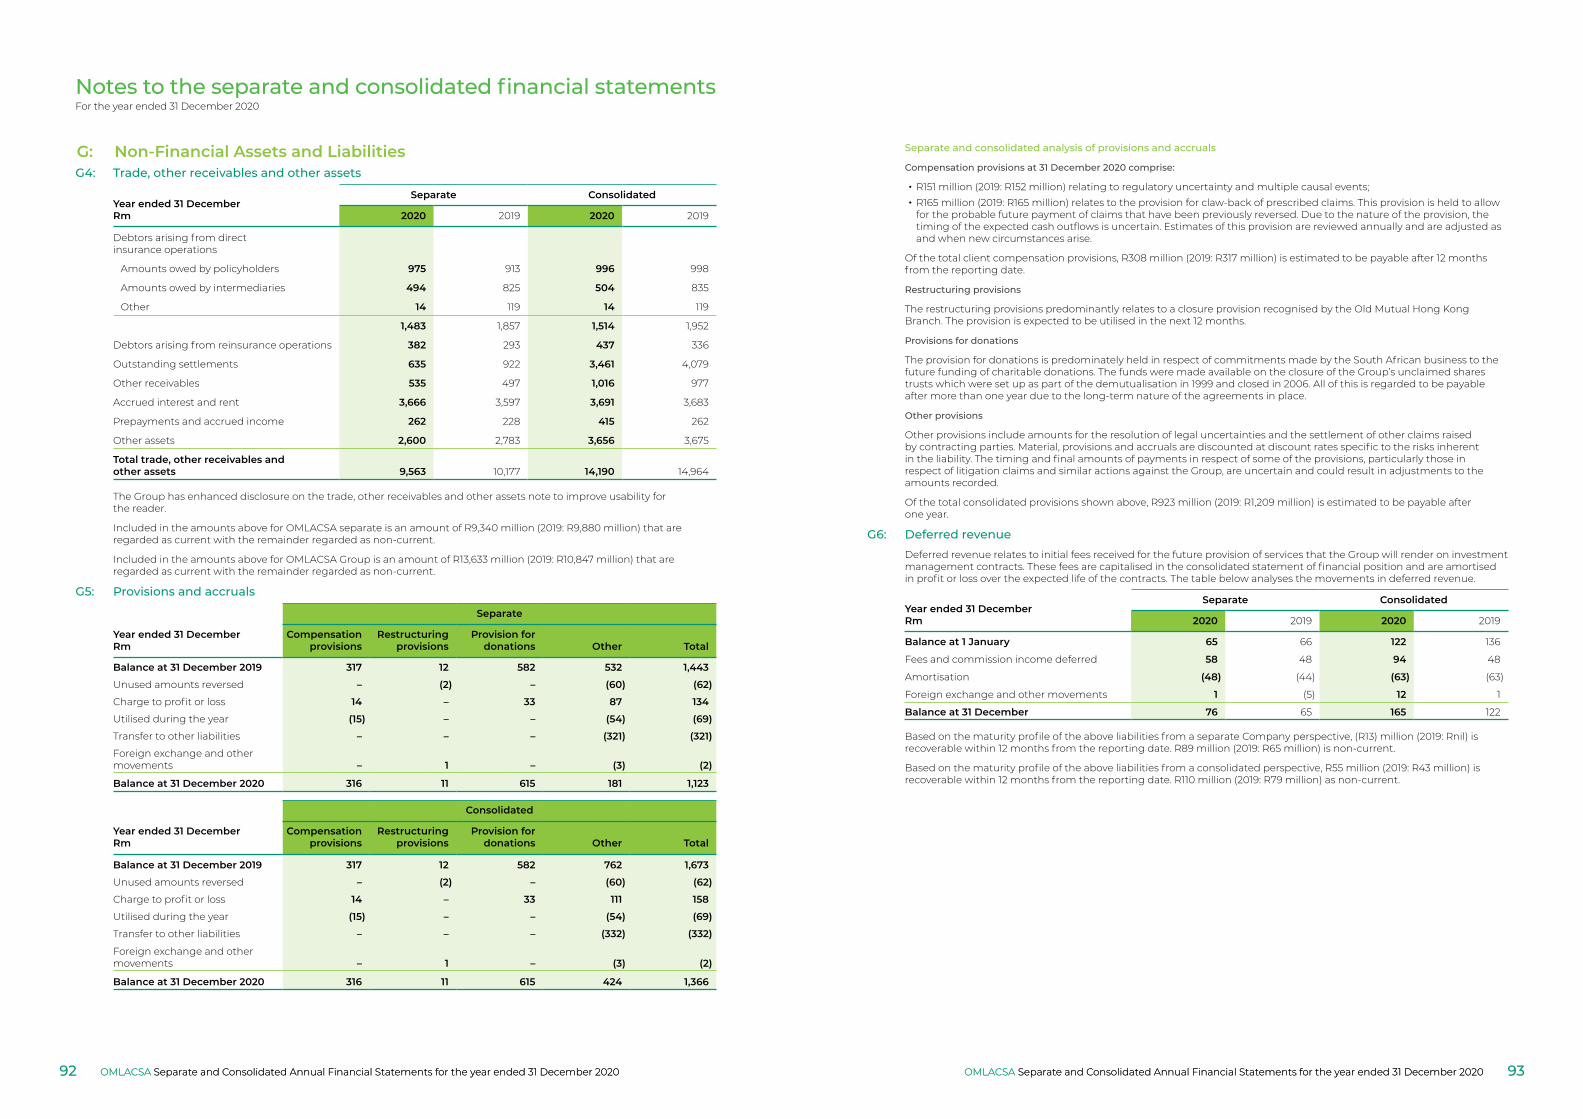
Notes to the separate and consolidated financial statementsFor the year ended 31 December 2020
G: Non‑Financial Assets and LiabilitiesG4: Trade, other receivables and other assets
Year ended 31 DecemberRm
Separate Consolidated
2020 2019 2020 2019
Debtors arising from direct insurance operations
Amounts owed by policyholders 975 913 996 998
Amounts owed by intermediaries 494 825 504 835
Other 14 119 14 119
1,483 1,857 1,514 1,952
Debtors arising from reinsurance operations 382 293 437 336
Outstanding settlements 635 922 3,461 4,079
Other receivables 535 497 1,016 977
Accrued interest and rent 3,666 3,597 3,691 3,683
Prepayments and accrued income 262 228 415 262
Other assets 2,600 2,783 3,656 3,675
Total trade, other receivables and other assets 9,563 10,177 14,190 14,964
The Group has enhanced disclosure on the trade, other receivables and other assets note to improve usability for the reader.
Included in the amounts above for OMLACSA separate is an amount of R9,340 million (2019: R9,880 million) that are regarded as current with the remainder regarded as non-current.
Included in the amounts above for OMLACSA Group is an amount of R13,633 million (2019: R10,847 million) that are regarded as current with the remainder regarded as non-current.
G5: Provisions and accruals
Year ended 31 DecemberRm
Separate
Compensationprovisions
Restructuringprovisions
Provision for donations Other Total
Balance at 31 December 2019 317 12 582 532 1,443
Unused amounts reversed – (2) – (60) (62)
Charge to profit or loss 14 – 33 87 134
Utilised during the year (15) – – (54) (69)
Transfer to other liabilities – – – (321) (321)
Foreign exchange and other movements – 1 – (3) (2)
Balance at 31 December 2020 316 11 615 181 1,123
Year ended 31 December Rm
Consolidated
Compensation provisions
Restructuring provisions
Provision fordonations Other Total
Balance at 31 December 2019 317 12 582 762 1,673
Unused amounts reversed – (2) – (60) (62)
Charge to profit or loss 14 – 33 111 158
Utilised during the year (15) – – (54) (69)
Transfer to other liabilities – – – (332) (332)
Foreign exchange and other movements – 1 – (3) (2)
Balance at 31 December 2020 316 11 615 424 1,366
Separate and consolidated analysis of provisions and accruals
Compensation provisions at 31 December 2020 comprise:
• R151 million (2019: R152 million) relating to regulatory uncertainty and multiple causal events;• R165 million (2019: R165 million) relates to the provision for claw-back of prescribed claims. This provision is held to allow
for the probable future payment of claims that have been previously reversed. Due to the nature of the provision, the timing of the expected cash outflows is uncertain. Estimates of this provision are reviewed annually and are adjusted as and when new circumstances arise.
Of the total client compensation provisions, R308 million (2019: R317 million) is estimated to be payable after 12 months from the reporting date.
Restructuring provisions
The restructuring provisions predominantly relates to a closure provision recognised by the Old Mutual Hong Kong Branch. The provision is expected to be utilised in the next 12 months.
Provisions for donations
The provision for donations is predominately held in respect of commitments made by the South African business to the future funding of charitable donations. The funds were made available on the closure of the Group’s unclaimed shares trusts which were set up as part of the demutualisation in 1999 and closed in 2006. All of this is regarded to be payable after more than one year due to the long-term nature of the agreements in place.
Other provisions
Other provisions include amounts for the resolution of legal uncertainties and the settlement of other claims raised by contracting parties. Material, provisions and accruals are discounted at discount rates specific to the risks inherent in the liability. The timing and final amounts of payments in respect of some of the provisions, particularly those in respect of litigation claims and similar actions against the Group, are uncertain and could result in adjustments to the amounts recorded.
Of the total consolidated provisions shown above, R923 million (2019: R1,209 million) is estimated to be payable after one year.
G6: Deferred revenueDeferred revenue relates to initial fees received for the future provision of services that the Group will render on investment management contracts. These fees are capitalised in the consolidated statement of financial position and are amortised in profit or loss over the expected life of the contracts. The table below analyses the movements in deferred revenue.
Year ended 31 DecemberRm
Separate Consolidated
2020 2019 2020 2019
Balance at 1 January 65 66 122 136
Fees and commission income deferred 58 48 94 48
Amortisation (48) (44) (63) (63)
Foreign exchange and other movements 1 (5) 12 1
Balance at 31 December 76 65 165 122
Based on the maturity profile of the above liabilities from a separate Company perspective, (R13) million (2019: Rnil) is recoverable within 12 months from the reporting date. R89 million (2019: R65 million) is non-current.
Based on the maturity profile of the above liabilities from a consolidated perspective, R55 million (2019: R43 million) is recoverable within 12 months from the reporting date. R110 million (2019: R79 million) as non-current.
OMLACSA Separate and Consolidated Annual Financial Statements for the year ended 31 December 2020 OMLACSA Separate and Consolidated Annual Financial Statements for the year ended 31 December 202092 93OMLACSA Separate and Consolidated Annual Financial Statements for the year ended 31 December 2020OMLACSA Separate and Consolidated Annual Financial Statements for the year ended 31 December 2020
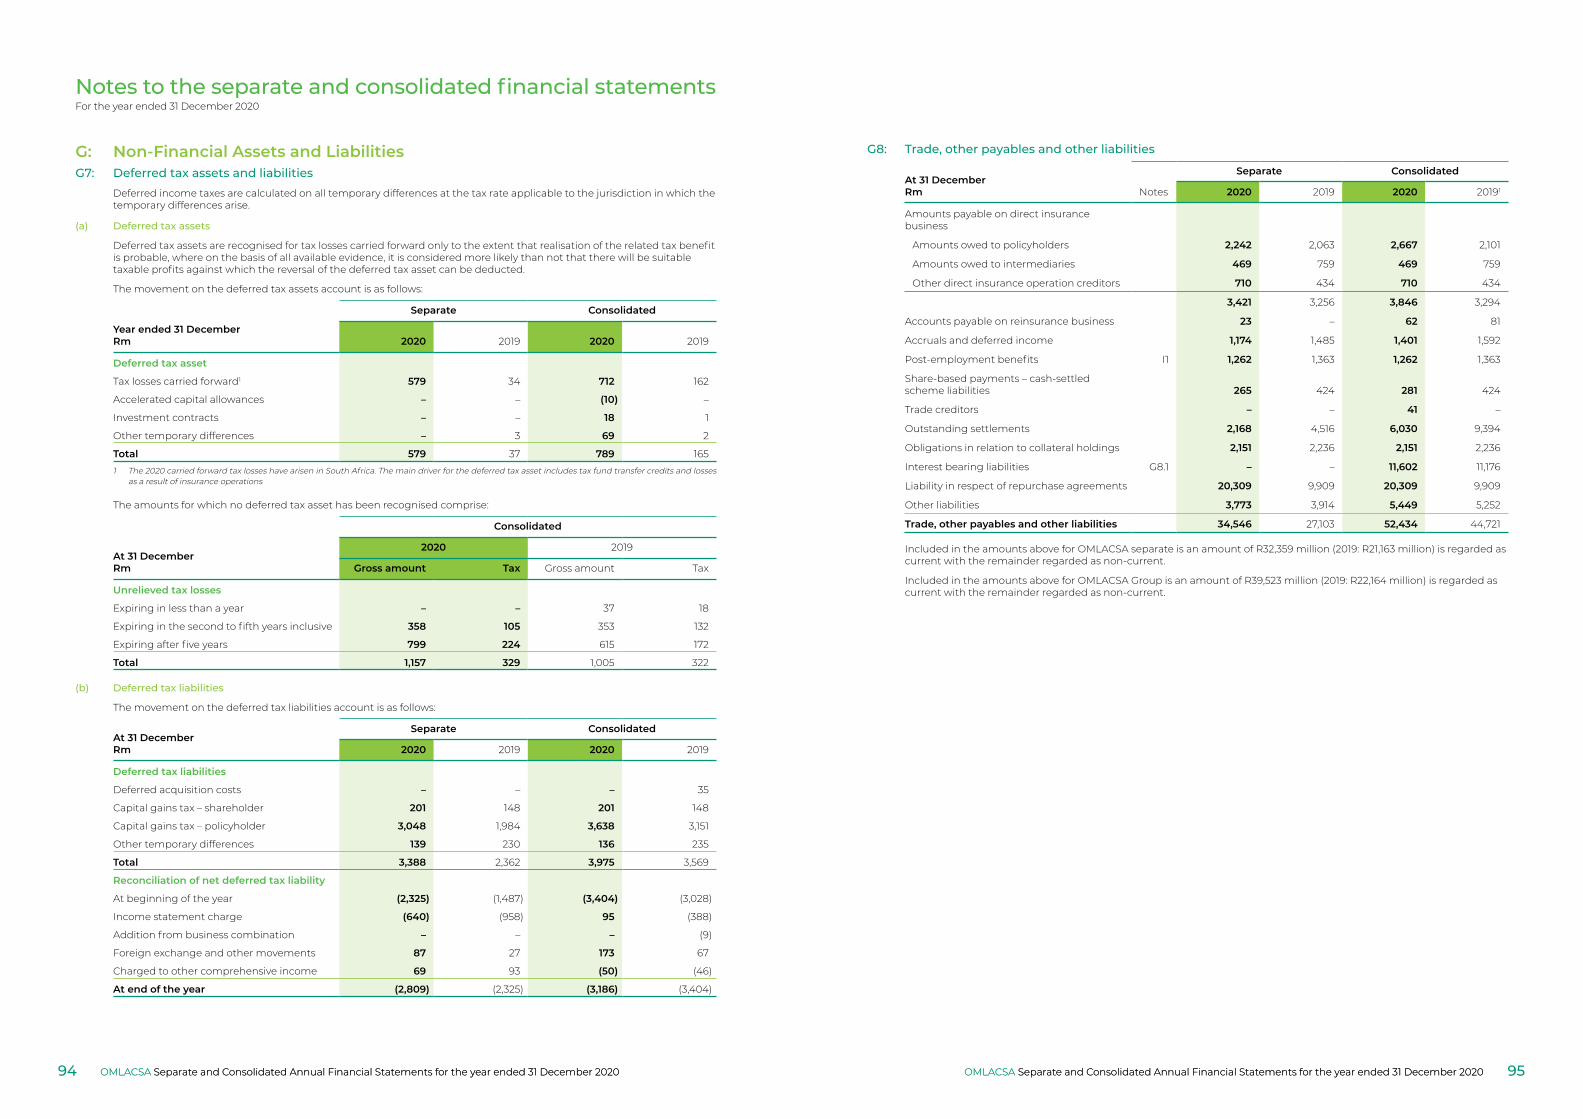
Notes to the separate and consolidated financial statementsFor the year ended 31 December 2020
G7: Deferred tax assets and liabilitiesDeferred income taxes are calculated on all temporary differences at the tax rate applicable to the jurisdiction in which the temporary differences arise.
(a) Deferred tax assets
Deferred tax assets are recognised for tax losses carried forward only to the extent that realisation of the related tax benefit is probable, where on the basis of all available evidence, it is considered more likely than not that there will be suitable taxable profits against which the reversal of the deferred tax asset can be deducted.
The movement on the deferred tax assets account is as follows:
Year ended 31 DecemberRm
Separate Consolidated
2020 2019 2020 2019
Deferred tax asset
Tax losses carried forward1 579 34 712 162
Accelerated capital allowances – – (10) –
Investment contracts – – 18 1
Other temporary differences – 3 69 2
Total 579 37 789 165
1 The 2020 carried forward tax losses have arisen in South Africa. The main driver for the deferred tax asset includes tax fund transfer credits and losses as a result of insurance operations
The amounts for which no deferred tax asset has been recognised comprise:
Consolidated
At 31 DecemberRm
2020 2019
Gross amount Tax Gross amount Tax
Unrelieved tax losses
Expiring in less than a year – – 37 18
Expiring in the second to fifth years inclusive 358 105 353 132
Expiring after five years 799 224 615 172
Total 1,157 329 1,005 322
(b) Deferred tax liabilities
The movement on the deferred tax liabilities account is as follows:
At 31 DecemberRm
Separate Consolidated
2020 2019 2020 2019
Deferred tax liabilities
Deferred acquisition costs – – – 35
Capital gains tax – shareholder 201 148 201 148
Capital gains tax – policyholder 3,048 1,984 3,638 3,151
Other temporary differences 139 230 136 235
Total 3,388 2,362 3,975 3,569
Reconciliation of net deferred tax liability
At beginning of the year (2,325) (1,487) (3,404) (3,028)
Income statement charge (640) (958) 95 (388)
Addition from business combination – – – (9)
Foreign exchange and other movements 87 27 173 67
Charged to other comprehensive income 69 93 (50) (46)
At end of the year (2,809) (2,325) (3,186) (3,404)
G: Non‑Financial Assets and Liabilities G8: Trade, other payables and other liabilities
At 31 DecemberRm Notes
Separate Consolidated
2020 2019 2020 20191
Amounts payable on direct insurance business
Amounts owed to policyholders 2,242 2,063 2,667 2,101
Amounts owed to intermediaries 469 759 469 759
Other direct insurance operation creditors 710 434 710 434
3,421 3,256 3,846 3,294
Accounts payable on reinsurance business 23 – 62 81
Accruals and deferred income 1,174 1,485 1,401 1,592
Post-employment benefits I1 1,262 1,363 1,262 1,363
Share-based payments – cash-settled scheme liabilities 265 424 281 424
Trade creditors – – 41 –
Outstanding settlements 2,168 4,516 6,030 9,394
Obligations in relation to collateral holdings 2,151 2,236 2,151 2,236
Interest bearing liabilities G8.1 – – 11,602 11,176
Liability in respect of repurchase agreements 20,309 9,909 20,309 9,909
Other liabilities 3,773 3,914 5,449 5,252
Trade, other payables and other liabilities 34,546 27,103 52,434 44,721
Included in the amounts above for OMLACSA separate is an amount of R32,359 million (2019: R21,163 million) is regarded as current with the remainder regarded as non-current.
Included in the amounts above for OMLACSA Group is an amount of R39,523 million (2019: R22,164 million) is regarded as current with the remainder regarded as non-current.
OMLACSA Separate and Consolidated Annual Financial Statements for the year ended 31 December 2020 OMLACSA Separate and Consolidated Annual Financial Statements for the year ended 31 December 202094 95OMLACSA Separate and Consolidated Annual Financial Statements for the year ended 31 December 2020OMLACSA Separate and Consolidated Annual Financial Statements for the year ended 31 December 2020
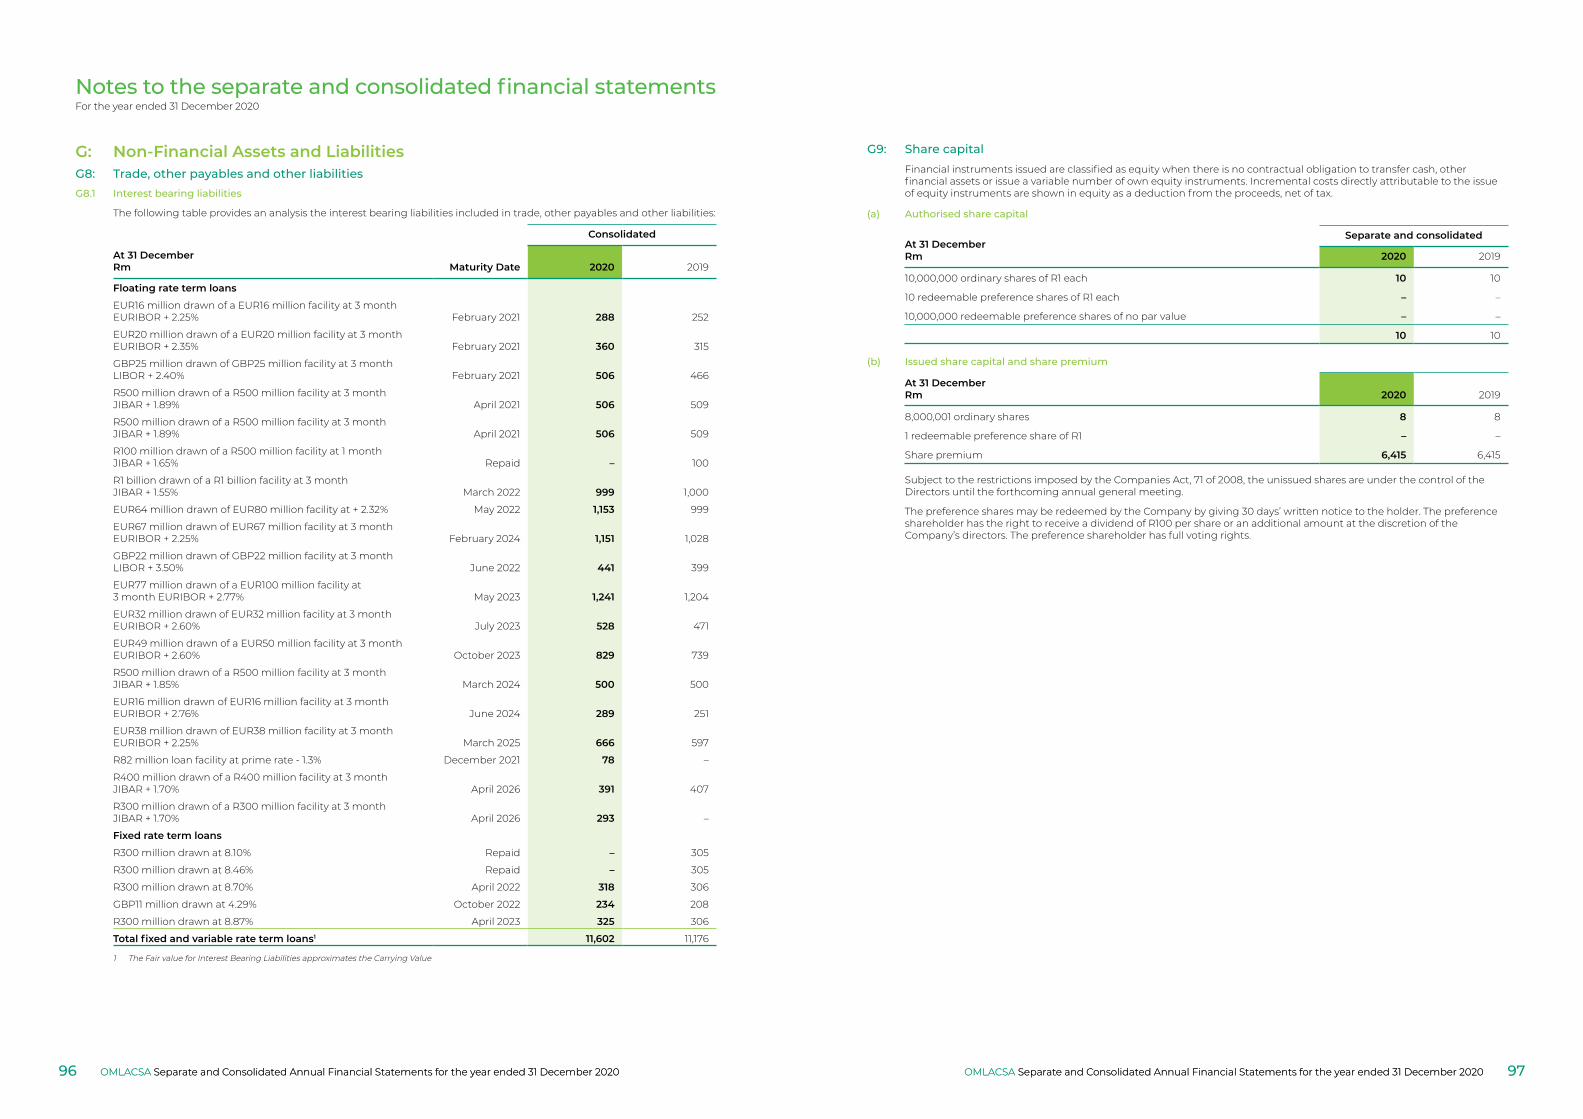
Notes to the separate and consolidated financial statementsFor the year ended 31 December 2020
G8.1 Interest bearing liabilities
The following table provides an analysis the interest bearing liabilities included in trade, other payables and other liabilities:
Consolidated
At 31 DecemberRm Maturity Date 2020 2019
Floating rate term loans
EUR16 million drawn of a EUR16 million facility at 3 month EURIBOR + 2.25% February 2021 288 252
EUR20 million drawn of a EUR20 million facility at 3 month EURIBOR + 2.35% February 2021 360 315
GBP25 million drawn of GBP25 million facility at 3 month LIBOR + 2.40% February 2021 506 466
R500 million drawn of a R500 million facility at 3 month JIBAR + 1.89% April 2021 506 509
R500 million drawn of a R500 million facility at 3 month JIBAR + 1.89% April 2021 506 509
R100 million drawn of a R500 million facility at 1 month JIBAR + 1.65% Repaid – 100
R1 billion drawn of a R1 billion facility at 3 month JIBAR + 1.55% March 2022 999 1,000
EUR64 million drawn of EUR80 million facility at + 2.32% May 2022 1,153 999
EUR67 million drawn of EUR67 million facility at 3 month EURIBOR + 2.25% February 2024 1,151 1,028
GBP22 million drawn of GBP22 million facility at 3 month LIBOR + 3.50% June 2022 441 399
EUR77 million drawn of a EUR100 million facility at 3 month EURIBOR + 2.77% May 2023 1,241 1,204
EUR32 million drawn of EUR32 million facility at 3 month EURIBOR + 2.60% July 2023 528 471
EUR49 million drawn of a EUR50 million facility at 3 month EURIBOR + 2.60% October 2023 829 739
R500 million drawn of a R500 million facility at 3 month JIBAR + 1.85% March 2024 500 500
EUR16 million drawn of EUR16 million facility at 3 month EURIBOR + 2.76% June 2024 289 251
EUR38 million drawn of EUR38 million facility at 3 month EURIBOR + 2.25% March 2025 666 597
R82 million loan facility at prime rate - 1.3% December 2021 78 –
R400 million drawn of a R400 million facility at 3 month JIBAR + 1.70% April 2026 391 407
R300 million drawn of a R300 million facility at 3 month JIBAR + 1.70% April 2026 293 –
Fixed rate term loans
R300 million drawn at 8.10% Repaid – 305
R300 million drawn at 8.46% Repaid – 305
R300 million drawn at 8.70% April 2022 318 306
GBP11 million drawn at 4.29% October 2022 234 208
R300 million drawn at 8.87% April 2023 325 306
Total fixed and variable rate term loans1 11,602 11,176
1 The Fair value for Interest Bearing Liabilities approximates the Carrying Value
G: Non‑Financial Assets and LiabilitiesG8: Trade, other payables and other liabilities
G9: Share capitalFinancial instruments issued are classified as equity when there is no contractual obligation to transfer cash, other financial assets or issue a variable number of own equity instruments. Incremental costs directly attributable to the issue of equity instruments are shown in equity as a deduction from the proceeds, net of tax.
(a) Authorised share capital
At 31 DecemberRm
Separate and consolidated
2020 2019
10,000,000 ordinary shares of R1 each 10 10
10 redeemable preference shares of R1 each – –
10,000,000 redeemable preference shares of no par value – –
10 10
(b) Issued share capital and share premium
At 31 DecemberRm 2020 2019
8,000,001 ordinary shares 8 8
1 redeemable preference share of R1 – –
Share premium 6,415 6,415
Subject to the restrictions imposed by the Companies Act, 71 of 2008, the unissued shares are under the control of the Directors until the forthcoming annual general meeting.
The preference shares may be redeemed by the Company by giving 30 days’ written notice to the holder. The preference shareholder has the right to receive a dividend of R100 per share or an additional amount at the discretion of the Company’s directors. The preference shareholder has full voting rights.
OMLACSA Separate and Consolidated Annual Financial Statements for the year ended 31 December 2020 OMLACSA Separate and Consolidated Annual Financial Statements for the year ended 31 December 202096 97OMLACSA Separate and Consolidated Annual Financial Statements for the year ended 31 December 2020OMLACSA Separate and Consolidated Annual Financial Statements for the year ended 31 December 2020
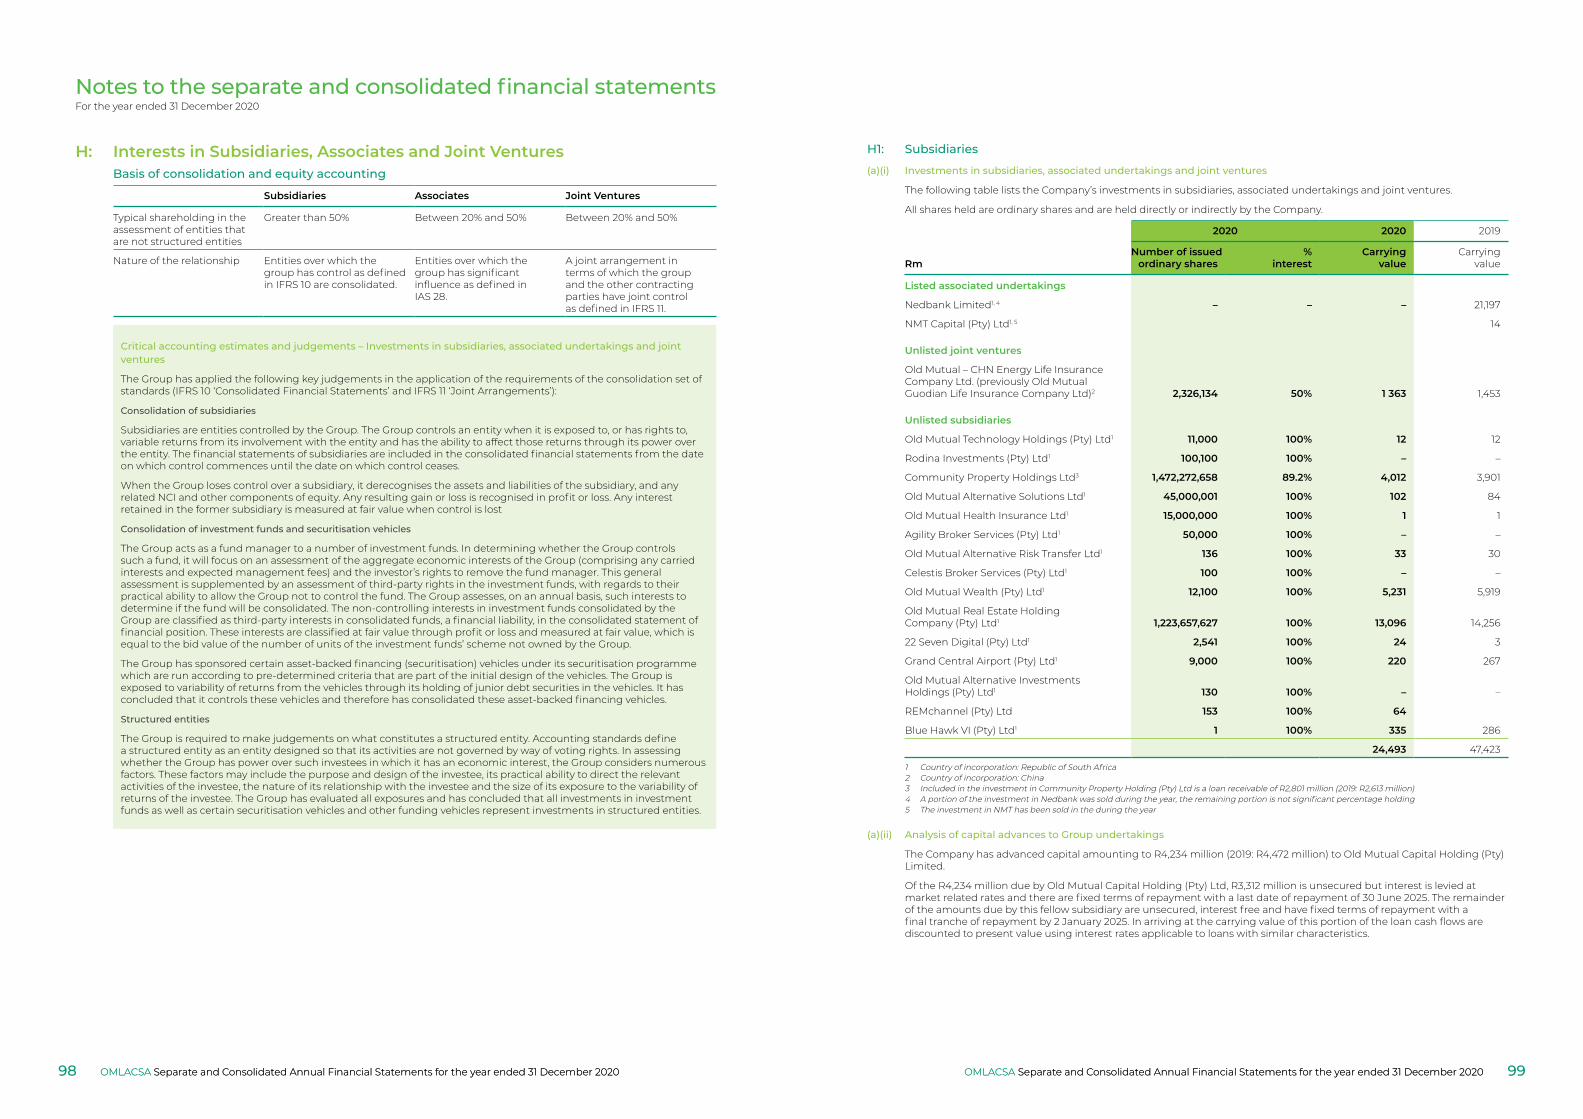
Notes to the separate and consolidated financial statementsFor the year ended 31 December 2020
H: Interests in Subsidiaries, Associates and Joint Ventures Basis of consolidation and equity accounting
Subsidiaries Associates Joint Ventures
Typical shareholding in the assessment of entities that are not structured entities
Greater than 50% Between 20% and 50% Between 20% and 50%
Nature of the relationship Entities over which the group has control as defined in IFRS 10 are consolidated.
Entities over which the group has significant influence as defined in IAS 28.
A joint arrangement in terms of which the group and the other contracting parties have joint control as defined in IFRS 11.
Critical accounting estimates and judgements – Investments in subsidiaries, associated undertakings and joint ventures
The Group has applied the following key judgements in the application of the requirements of the consolidation set of standards (IFRS 10 ‘Consolidated Financial Statements’ and IFRS 11 ‘Joint Arrangements’):
Consolidation of subsidiaries
Subsidiaries are entities controlled by the Group. The Group controls an entity when it is exposed to, or has rights to, variable returns from its involvement with the entity and has the ability to affect those returns through its power over the entity. The financial statements of subsidiaries are included in the consolidated financial statements from the date on which control commences until the date on which control ceases.
When the Group loses control over a subsidiary, it derecognises the assets and liabilities of the subsidiary, and any related NCI and other components of equity. Any resulting gain or loss is recognised in profit or loss. Any interest retained in the former subsidiary is measured at fair value when control is lost
Consolidation of investment funds and securitisation vehicles
The Group acts as a fund manager to a number of investment funds. In determining whether the Group controls such a fund, it will focus on an assessment of the aggregate economic interests of the Group (comprising any carried interests and expected management fees) and the investor’s rights to remove the fund manager. This general assessment is supplemented by an assessment of third-party rights in the investment funds, with regards to their practical ability to allow the Group not to control the fund. The Group assesses, on an annual basis, such interests to determine if the fund will be consolidated. The non-controlling interests in investment funds consolidated by the Group are classified as third-party interests in consolidated funds, a financial liability, in the consolidated statement of financial position. These interests are classified at fair value through profit or loss and measured at fair value, which is equal to the bid value of the number of units of the investment funds’ scheme not owned by the Group.
The Group has sponsored certain asset-backed financing (securitisation) vehicles under its securitisation programme which are run according to pre-determined criteria that are part of the initial design of the vehicles. The Group is exposed to variability of returns from the vehicles through its holding of junior debt securities in the vehicles. It has concluded that it controls these vehicles and therefore has consolidated these asset-backed financing vehicles.
Structured entities
The Group is required to make judgements on what constitutes a structured entity. Accounting standards define a structured entity as an entity designed so that its activities are not governed by way of voting rights. In assessing whether the Group has power over such investees in which it has an economic interest, the Group considers numerous factors. These factors may include the purpose and design of the investee, its practical ability to direct the relevant activities of the investee, the nature of its relationship with the investee and the size of its exposure to the variability of returns of the investee. The Group has evaluated all exposures and has concluded that all investments in investment funds as well as certain securitisation vehicles and other funding vehicles represent investments in structured entities.
H1: Subsidiaries
(a)(i) Investments in subsidiaries, associated undertakings and joint ventures
The following table lists the Company’s investments in subsidiaries, associated undertakings and joint ventures.
All shares held are ordinary shares and are held directly or indirectly by the Company.
2020 2020 2019
RmNumber of issued ordinary shares
%interest
Carryingvalue
Carryingvalue
Listed associated undertakings
Nedbank Limited1, 4 – – – 21,197
NMT Capital (Pty) Ltd1, 5 14
Unlisted joint ventures
Old Mutual – CHN Energy Life Insurance Company Ltd. (previously Old Mutual Guodian Life Insurance Company Ltd)2 2,326,134 50% 1 363 1,453
Unlisted subsidiaries
Old Mutual Technology Holdings (Pty) Ltd1 11,000 100% 12 12
Rodina Investments (Pty) Ltd1 100,100 100% – –
Community Property Holdings Ltd3 1,472,272,658 89.2% 4,012 3,901
Old Mutual Alternative Solutions Ltd1 45,000,001 100% 102 84
Old Mutual Health Insurance Ltd1 15,000,000 100% 1 1
Agility Broker Services (Pty) Ltd1 50,000 100% – –
Old Mutual Alternative Risk Transfer Ltd1 136 100% 33 30
Celestis Broker Services (Pty) Ltd1 100 100% – –
Old Mutual Wealth (Pty) Ltd1 12,100 100% 5,231 5,919
Old Mutual Real Estate Holding Company (Pty) Ltd1 1,223,657,627 100% 13,096 14,256
22 Seven Digital (Pty) Ltd1 2,541 100% 24 3
Grand Central Airport (Pty) Ltd1 9,000 100% 220 267
Old Mutual Alternative Investments Holdings (Pty) Ltd1 130 100% – –
REMchannel (Pty) Ltd 153 100% 64
Blue Hawk VI (Pty) Ltd1 1 100% 335 286
24,493 47,423
1 Country of incorporation: Republic of South Africa2 Country of incorporation: China3 Included in the investment in Community Property Holding (Pty) Ltd is a loan receivable of R2,801 million (2019: R2,613 million)4 A portion of the investment in Nedbank was sold during the year, the remaining portion is not significant percentage holding5 The investment in NMT has been sold in the during the year
(a)(ii) Analysis of capital advances to Group undertakings
The Company has advanced capital amounting to R4,234 million (2019: R4,472 million) to Old Mutual Capital Holding (Pty)Limited.
Of the R4,234 million due by Old Mutual Capital Holding (Pty) Ltd, R3,312 million is unsecured but interest is levied at market related rates and there are fixed terms of repayment with a last date of repayment of 30 June 2025. The remainder of the amounts due by this fellow subsidiary are unsecured, interest free and have fixed terms of repayment with a final tranche of repayment by 2 January 2025. In arriving at the carrying value of this portion of the loan cash flows are discounted to present value using interest rates applicable to loans with similar characteristics.
OMLACSA Separate and Consolidated Annual Financial Statements for the year ended 31 December 2020 OMLACSA Separate and Consolidated Annual Financial Statements for the year ended 31 December 202098 99OMLACSA Separate and Consolidated Annual Financial Statements for the year ended 31 December 2020OMLACSA Separate and Consolidated Annual Financial Statements for the year ended 31 December 2020
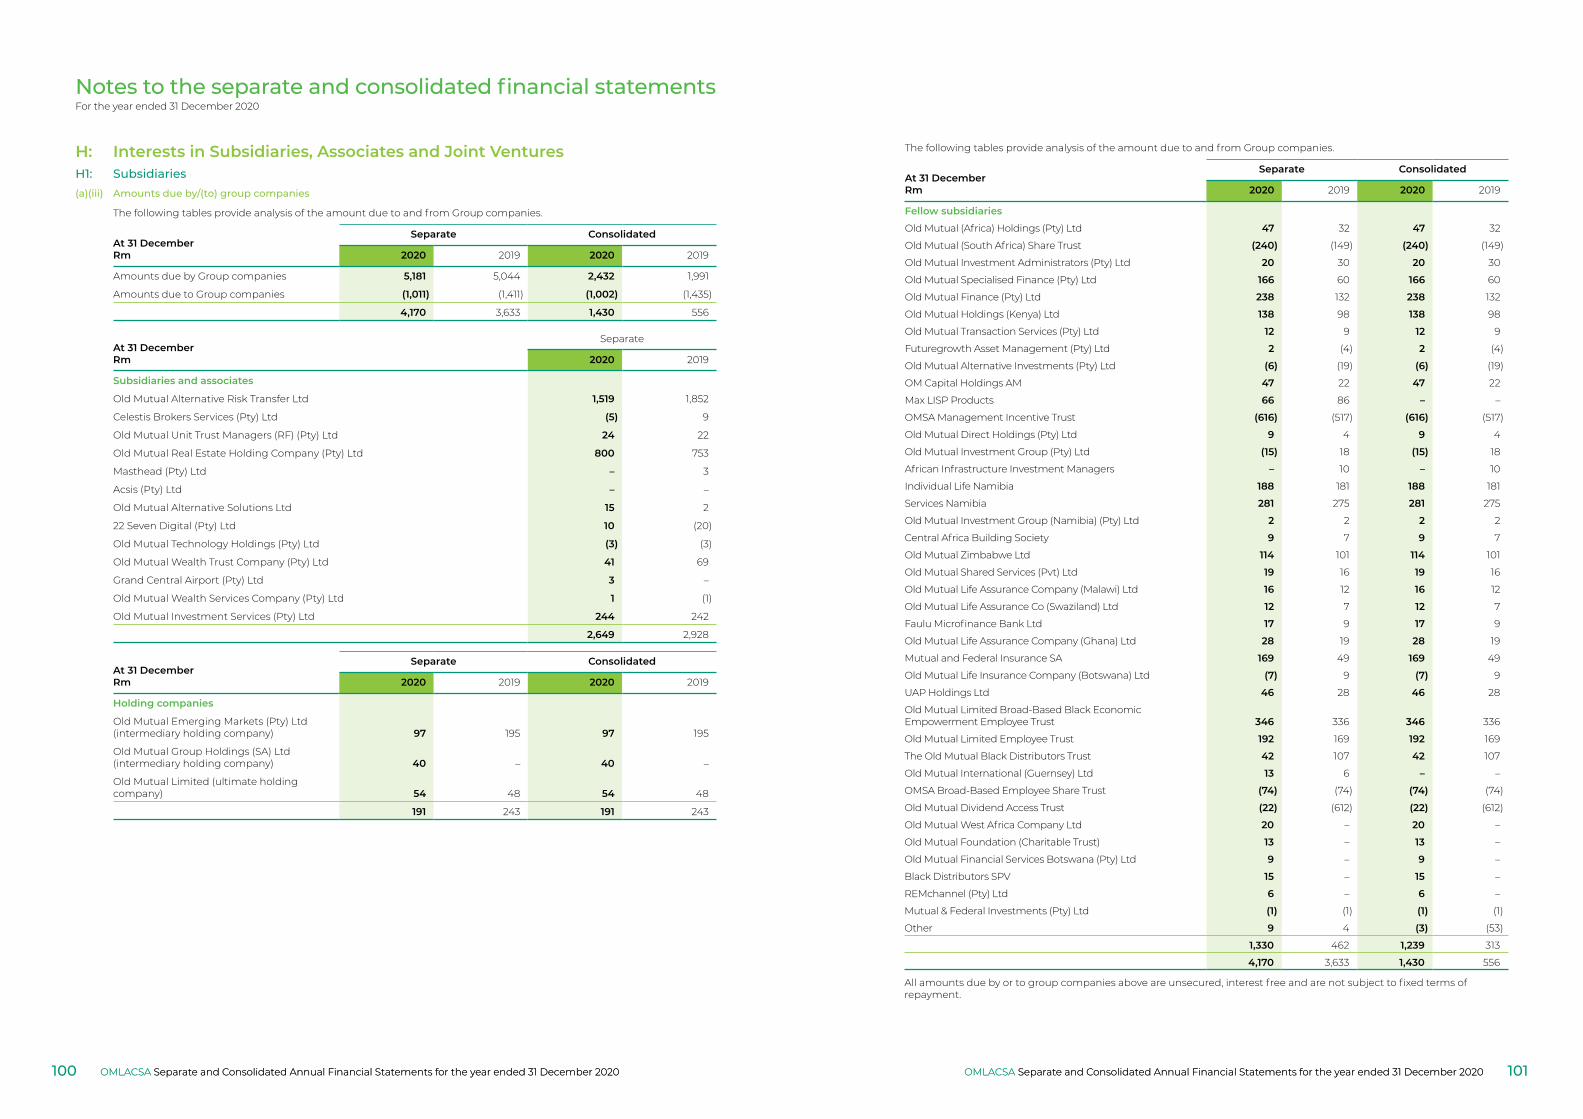
Notes to the separate and consolidated financial statementsFor the year ended 31 December 2020
(a)(iii) Amounts due by/(to) group companies
The following tables provide analysis of the amount due to and from Group companies.
At 31 DecemberRm
Separate Consolidated
2020 2019 2020 2019
Amounts due by Group companies 5,181 5,044 2,432 1,991
Amounts due to Group companies (1,011) (1,411) (1,002) (1,435)
4,170 3,633 1,430 556
At 31 DecemberRm
Separate
2020 2019
Subsidiaries and associates
Old Mutual Alternative Risk Transfer Ltd 1,519 1,852
Celestis Brokers Services (Pty) Ltd (5) 9
Old Mutual Unit Trust Managers (RF) (Pty) Ltd 24 22
Old Mutual Real Estate Holding Company (Pty) Ltd 800 753
Masthead (Pty) Ltd – 3
Acsis (Pty) Ltd – –
Old Mutual Alternative Solutions Ltd 15 2
22 Seven Digital (Pty) Ltd 10 (20)
Old Mutual Technology Holdings (Pty) Ltd (3) (3)
Old Mutual Wealth Trust Company (Pty) Ltd 41 69
Grand Central Airport (Pty) Ltd 3 –
Old Mutual Wealth Services Company (Pty) Ltd 1 (1)
Old Mutual Investment Services (Pty) Ltd 244 242
2,649 2,928
At 31 DecemberRm
Separate Consolidated
2020 2019 2020 2019
Holding companies
Old Mutual Emerging Markets (Pty) Ltd (intermediary holding company) 97 195 97 195
Old Mutual Group Holdings (SA) Ltd (intermediary holding company) 40 – 40 –
Old Mutual Limited (ultimate holding company) 54 48 54 48
191 243 191 243
H: Interests in Subsidiaries, Associates and Joint VenturesH1: Subsidiaries
The following tables provide analysis of the amount due to and from Group companies.
At 31 DecemberRm
Separate Consolidated
2020 2019 2020 2019
Fellow subsidiaries
Old Mutual (Africa) Holdings (Pty) Ltd 47 32 47 32
Old Mutual (South Africa) Share Trust (240) (149) (240) (149)
Old Mutual Investment Administrators (Pty) Ltd 20 30 20 30
Old Mutual Specialised Finance (Pty) Ltd 166 60 166 60
Old Mutual Finance (Pty) Ltd 238 132 238 132
Old Mutual Holdings (Kenya) Ltd 138 98 138 98
Old Mutual Transaction Services (Pty) Ltd 12 9 12 9
Futuregrowth Asset Management (Pty) Ltd 2 (4) 2 (4)
Old Mutual Alternative Investments (Pty) Ltd (6) (19) (6) (19)
OM Capital Holdings AM 47 22 47 22
Max LISP Products 66 86 – –
OMSA Management Incentive Trust (616) (517) (616) (517)
Old Mutual Direct Holdings (Pty) Ltd 9 4 9 4
Old Mutual Investment Group (Pty) Ltd (15) 18 (15) 18
African Infrastructure Investment Managers – 10 – 10
Individual Life Namibia 188 181 188 181
Services Namibia 281 275 281 275
Old Mutual Investment Group (Namibia) (Pty) Ltd 2 2 2 2
Central Africa Building Society 9 7 9 7
Old Mutual Zimbabwe Ltd 114 101 114 101
Old Mutual Shared Services (Pvt) Ltd 19 16 19 16
Old Mutual Life Assurance Company (Malawi) Ltd 16 12 16 12
Old Mutual Life Assurance Co (Swaziland) Ltd 12 7 12 7
Faulu Microfinance Bank Ltd 17 9 17 9
Old Mutual Life Assurance Company (Ghana) Ltd 28 19 28 19
Mutual and Federal Insurance SA 169 49 169 49
Old Mutual Life Insurance Company (Botswana) Ltd (7) 9 (7) 9
UAP Holdings Ltd 46 28 46 28
Old Mutual Limited Broad-Based Black Economic Empowerment Employee Trust 346 336 346 336
Old Mutual Limited Employee Trust 192 169 192 169
The Old Mutual Black Distributors Trust 42 107 42 107
Old Mutual International (Guernsey) Ltd 13 6 – –
OMSA Broad-Based Employee Share Trust (74) (74) (74) (74)
Old Mutual Dividend Access Trust (22) (612) (22) (612)
Old Mutual West Africa Company Ltd 20 – 20 –
Old Mutual Foundation (Charitable Trust) 13 – 13 –
Old Mutual Financial Services Botswana (Pty) Ltd 9 – 9 –
Black Distributors SPV 15 – 15 –
REMchannel (Pty) Ltd 6 – 6 –
Mutual & Federal Investments (Pty) Ltd (1) (1) (1) (1)
Other 9 4 (3) (53)
1,330 462 1,239 313
4,170 3,633 1,430 556
All amounts due by or to group companies above are unsecured, interest free and are not subject to fixed terms of repayment.
OMLACSA Separate and Consolidated Annual Financial Statements for the year ended 31 December 2020 OMLACSA Separate and Consolidated Annual Financial Statements for the year ended 31 December 2020100 101OMLACSA Separate and Consolidated Annual Financial Statements for the year ended 31 December 2020OMLACSA Separate and Consolidated Annual Financial Statements for the year ended 31 December 2020
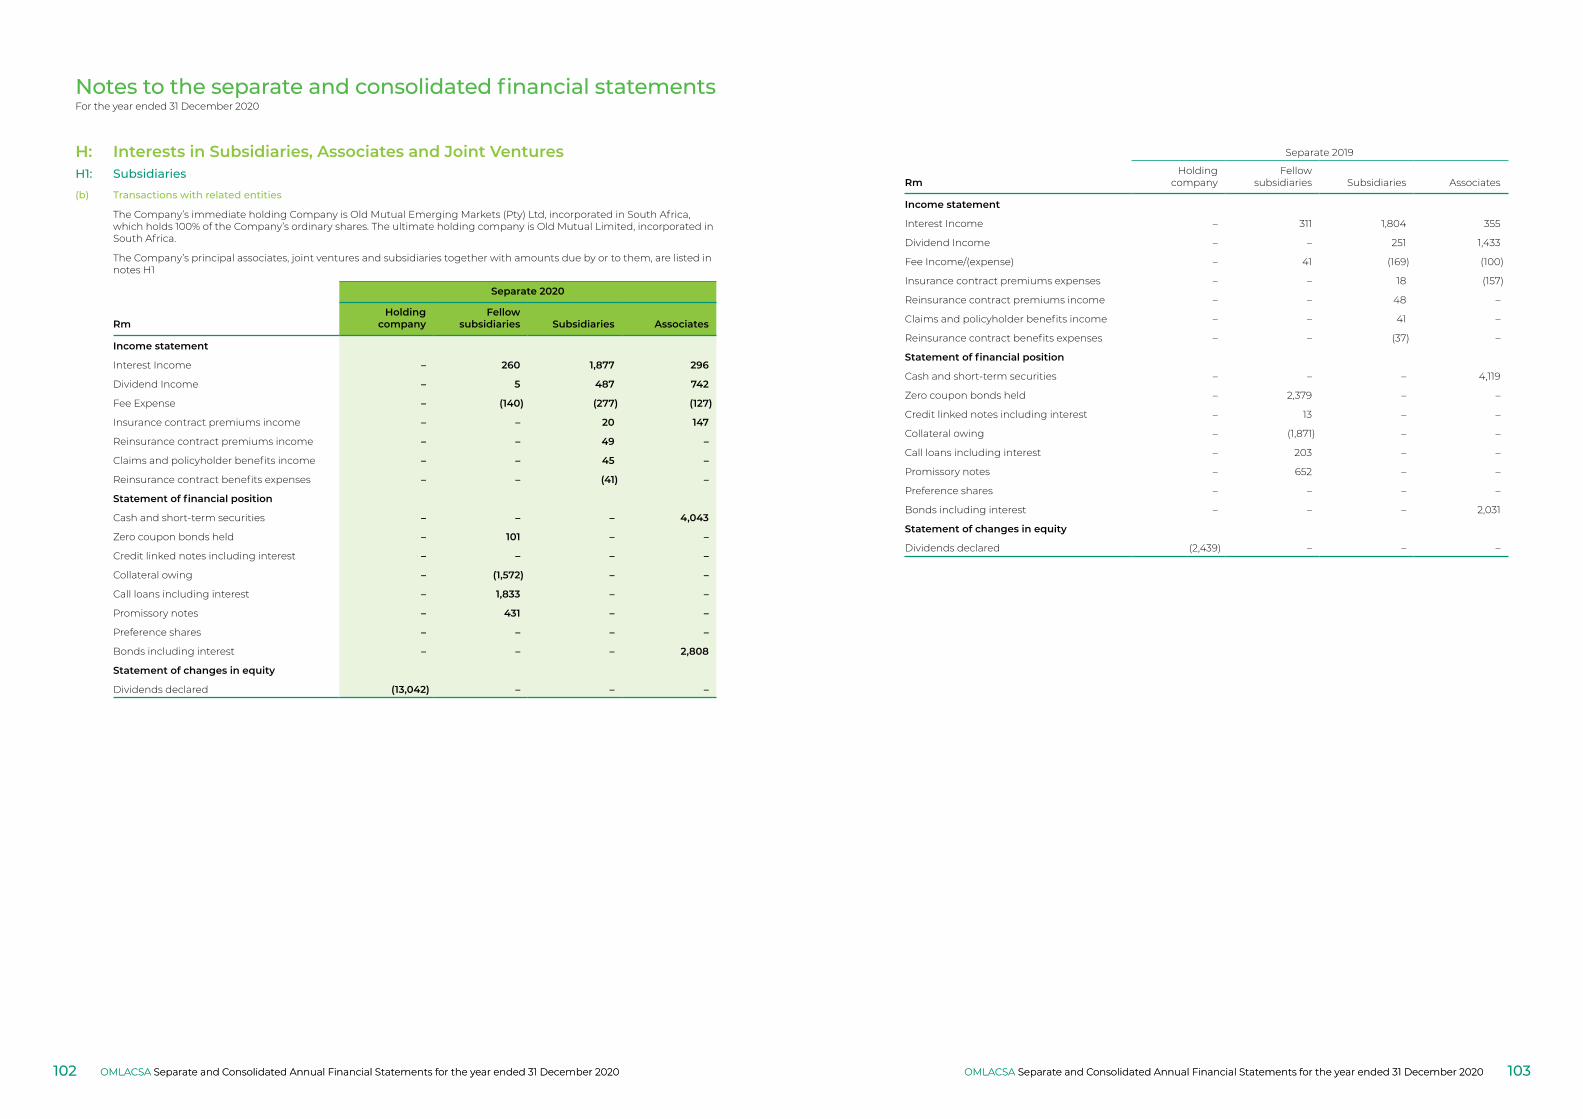
Notes to the separate and consolidated financial statementsFor the year ended 31 December 2020
(b) Transactions with related entities
The Company’s immediate holding Company is Old Mutual Emerging Markets (Pty) Ltd, incorporated in South Africa, which holds 100% of the Company’s ordinary shares. The ultimate holding company is Old Mutual Limited, incorporated in South Africa.
The Company’s principal associates, joint ventures and subsidiaries together with amounts due by or to them, are listed in notes H1
Separate 2020
RmHolding
company Fellow
subsidiaries Subsidiaries Associates
Income statement
Interest Income – 260 1,877 296
Dividend Income – 5 487 742
Fee Expense – (140) (277) (127)
Insurance contract premiums income – – 20 147
Reinsurance contract premiums income – – 49 –
Claims and policyholder benefits income – – 45 –
Reinsurance contract benefits expenses – – (41) –
Statement of financial position
Cash and short-term securities – – – 4,043
Zero coupon bonds held – 101 – –
Credit linked notes including interest – – – –
Collateral owing – (1,572) – –
Call loans including interest – 1,833 – –
Promissory notes – 431 – –
Preference shares – – – –
Bonds including interest – – – 2,808
Statement of changes in equity
Dividends declared (13,042) – – –
H: Interests in Subsidiaries, Associates and Joint VenturesH1: Subsidiaries
Separate 2019
RmHolding
company Fellow
subsidiaries Subsidiaries Associates
Income statement
Interest Income – 311 1,804 355
Dividend Income – – 251 1,433
Fee Income/(expense) – 41 (169) (100)
Insurance contract premiums expenses – – 18 (157)
Reinsurance contract premiums income – – 48 –
Claims and policyholder benefits income – – 41 –
Reinsurance contract benefits expenses – – (37) –
Statement of financial position
Cash and short-term securities – – – 4,119
Zero coupon bonds held – 2,379 – –
Credit linked notes including interest – 13 – –
Collateral owing – (1,871) – –
Call loans including interest – 203 – –
Promissory notes – 652 – –
Preference shares – – – –
Bonds including interest – – – 2,031
Statement of changes in equity
Dividends declared (2,439) – – –
OMLACSA Separate and Consolidated Annual Financial Statements for the year ended 31 December 2020 OMLACSA Separate and Consolidated Annual Financial Statements for the year ended 31 December 2020102 103OMLACSA Separate and Consolidated Annual Financial Statements for the year ended 31 December 2020OMLACSA Separate and Consolidated Annual Financial Statements for the year ended 31 December 2020
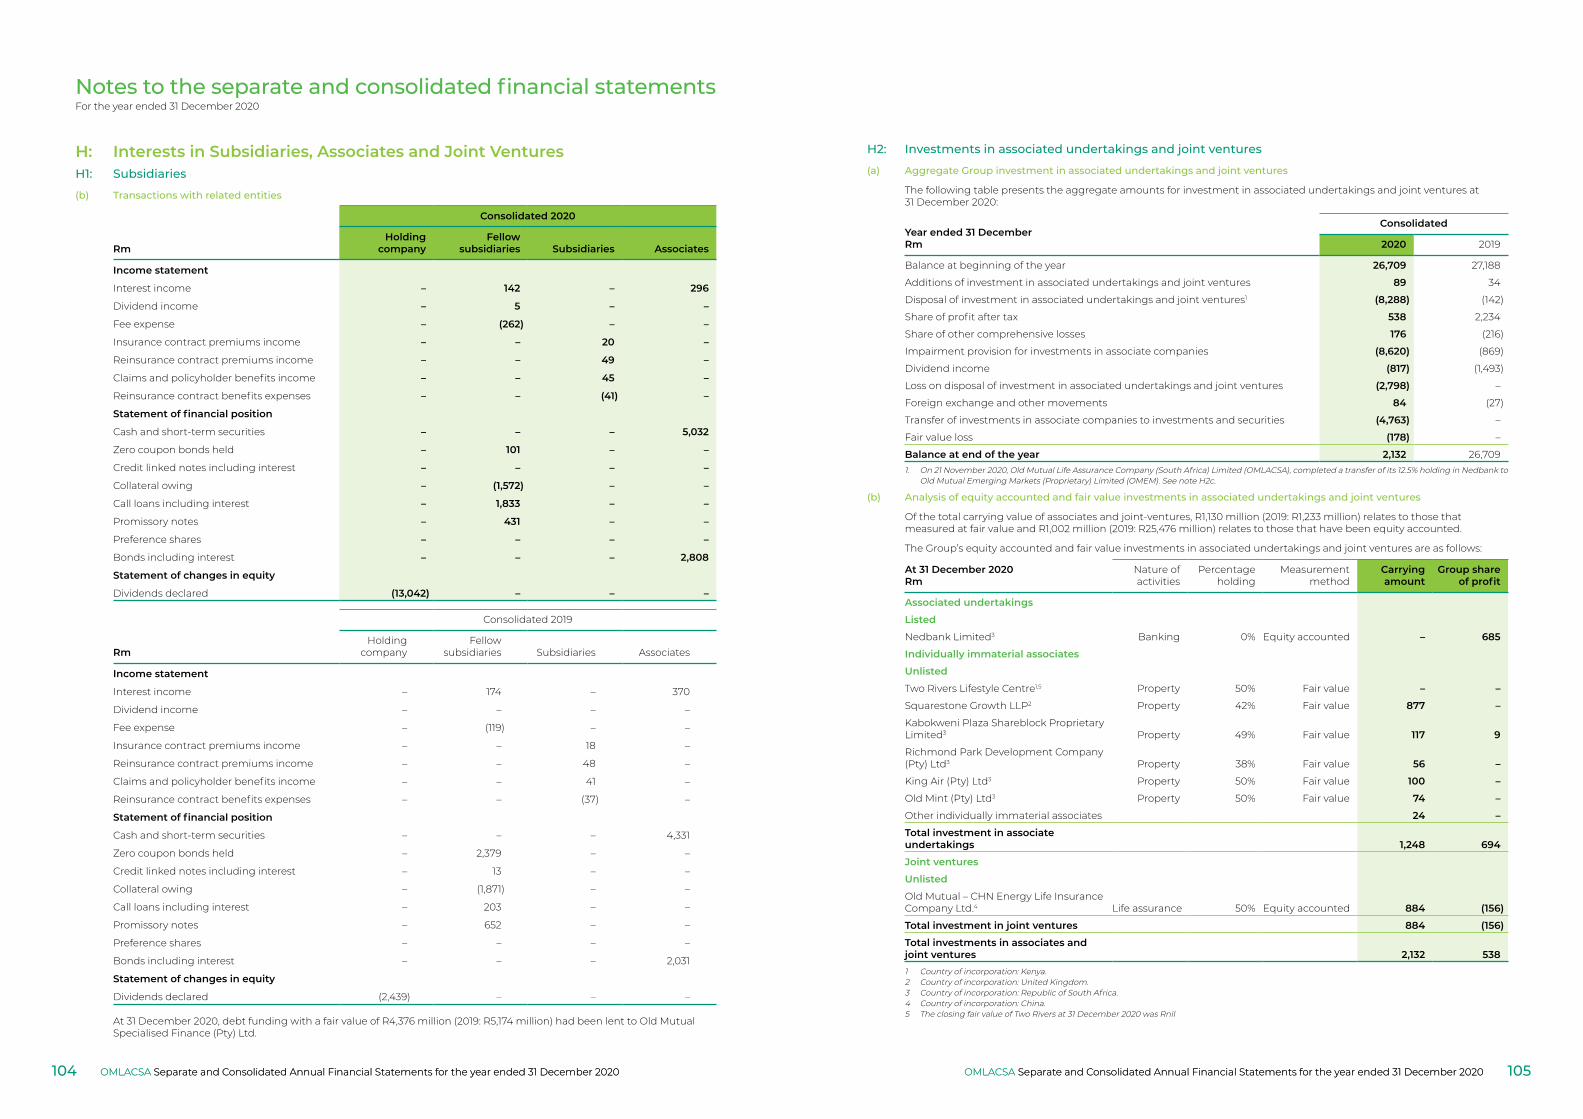
Notes to the separate and consolidated financial statementsFor the year ended 31 December 2020
Consolidated 2020
RmHolding
company Fellow
subsidiaries Subsidiaries Associates
Income statement
Interest income – 142 – 296
Dividend income – 5 – –
Fee expense – (262) – –
Insurance contract premiums income – – 20 –
Reinsurance contract premiums income – – 49 –
Claims and policyholder benefits income – – 45 –
Reinsurance contract benefits expenses – – (41) –
Statement of financial position
Cash and short-term securities – – – 5,032
Zero coupon bonds held – 101 – –
Credit linked notes including interest – – – –
Collateral owing – (1,572) – –
Call loans including interest – 1,833 – –
Promissory notes – 431 – –
Preference shares – – – –
Bonds including interest – – – 2,808
Statement of changes in equity
Dividends declared (13,042) – – –
Consolidated 2019
RmHolding
company Fellow
subsidiaries Subsidiaries Associates
Income statement
Interest income – 174 – 370
Dividend income – – – –
Fee expense – (119) – –
Insurance contract premiums income – – 18 –
Reinsurance contract premiums income – – 48 –
Claims and policyholder benefits income – – 41 –
Reinsurance contract benefits expenses – – (37) –
Statement of financial position
Cash and short-term securities – – – 4,331
Zero coupon bonds held – 2,379 – –
Credit linked notes including interest – 13 – –
Collateral owing – (1,871) – –
Call loans including interest – 203 – –
Promissory notes – 652 – –
Preference shares – – – –
Bonds including interest – – – 2,031
Statement of changes in equity
Dividends declared (2,439) – – –
At 31 December 2020, debt funding with a fair value of R4,376 million (2019: R5,174 million) had been lent to Old Mutual Specialised Finance (Pty) Ltd.
H: Interests in Subsidiaries, Associates and Joint VenturesH1: Subsidiaries
(b) Transactions with related entities
H2: Investments in associated undertakings and joint ventures
(a) Aggregate Group investment in associated undertakings and joint ventures
The following table presents the aggregate amounts for investment in associated undertakings and joint ventures at 31 December 2020:
Year ended 31 DecemberRm
Consolidated
2020 2019
Balance at beginning of the year 26,709 27,188
Additions of investment in associated undertakings and joint ventures 89 34
Disposal of investment in associated undertakings and joint ventures1 (8,288) (142)
Share of profit after tax 538 2,234
Share of other comprehensive losses 176 (216)
Impairment provision for investments in associate companies (8,620) (869)
Dividend income (817) (1,493)
Loss on disposal of investment in associated undertakings and joint ventures (2,798) –
Foreign exchange and other movements 84 (27)
Transfer of investments in associate companies to investments and securities (4,763) –
Fair value loss (178) –
Balance at end of the year 2,132 26,7091. On 21 November 2020, Old Mutual Life Assurance Company (South Africa) Limited (OMLACSA), completed a transfer of its 12.5% holding in Nedbank to
Old Mutual Emerging Markets (Proprietary) Limited (OMEM). See note H2c.
(b) Analysis of equity accounted and fair value investments in associated undertakings and joint ventures
Of the total carrying value of associates and joint-ventures, R1,130 million (2019: R1,233 million) relates to those that measured at fair value and R1,002 million (2019: R25,476 million) relates to those that have been equity accounted.
The Group’s equity accounted and fair value investments in associated undertakings and joint ventures are as follows:
At 31 December 2020Rm
Nature ofactivities
Percentage holding
Measurement method
Carryingamount
Group share of profit
Associated undertakings
Listed
Nedbank Limited3 Banking 0% Equity accounted – 685
Individually immaterial associates
Unlisted
Two Rivers Lifestyle Centre1,5 Property 50% Fair value – –
Squarestone Growth LLP2 Property 42% Fair value 877 –
Kabokweni Plaza Shareblock Proprietary Limited3 Property 49% Fair value 117 9
Richmond Park Development Company (Pty) Ltd3 Property 38% Fair value 56 –
King Air (Pty) Ltd3 Property 50% Fair value 100 –
Old Mint (Pty) Ltd3 Property 50% Fair value 74 –
Other individually immaterial associates 24 –
Total investment in associate undertakings 1,248 694
Joint ventures
Unlisted
Old Mutual – CHN Energy Life Insurance Company Ltd.4 Life assurance 50% Equity accounted 884 (156)
Total investment in joint ventures 884 (156)
Total investments in associates and joint ventures 2,132 5381 Country of incorporation: Kenya.2 Country of incorporation: United Kingdom.3 Country of incorporation: Republic of South Africa.4 Country of incorporation: China.5 The closing fair value of Two Rivers at 31 December 2020 was Rnil
OMLACSA Separate and Consolidated Annual Financial Statements for the year ended 31 December 2020 OMLACSA Separate and Consolidated Annual Financial Statements for the year ended 31 December 2020104 105OMLACSA Separate and Consolidated Annual Financial Statements for the year ended 31 December 2020OMLACSA Separate and Consolidated Annual Financial Statements for the year ended 31 December 2020
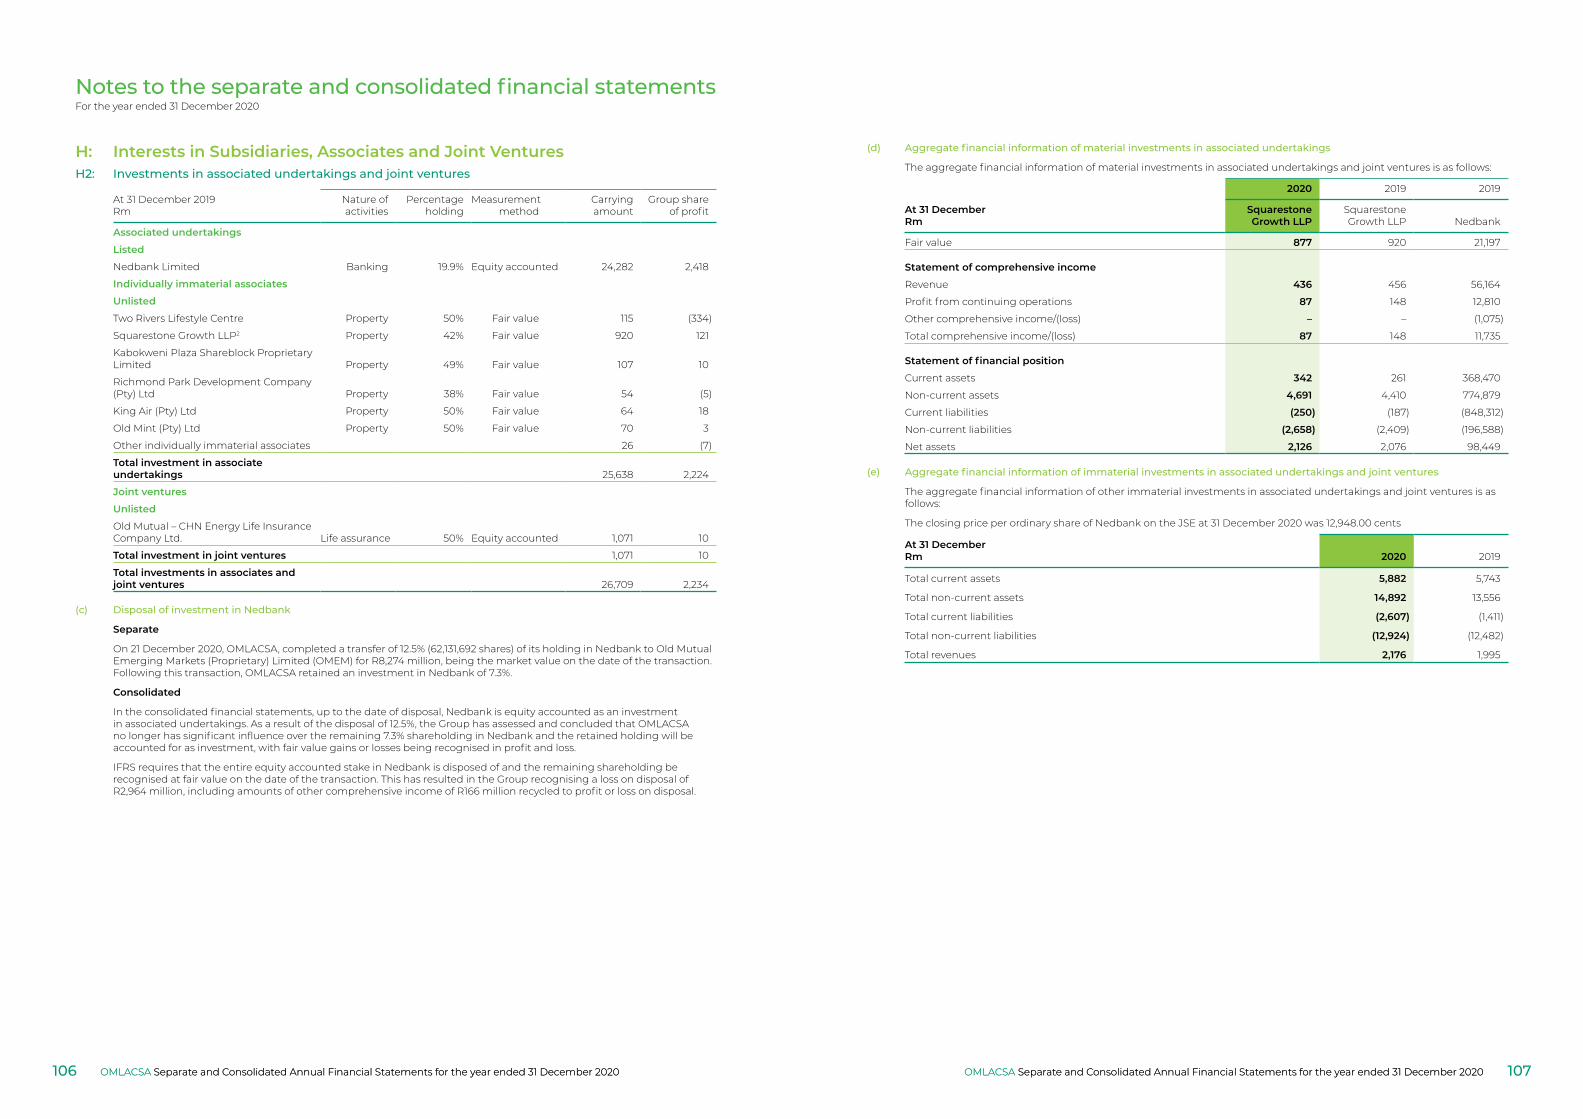
Notes to the separate and consolidated financial statementsFor the year ended 31 December 2020
At 31 December 2019Rm
Nature ofactivities
Percentage holding
Measurement method
Carryingamount
Group share of profit
Associated undertakings
Listed
Nedbank Limited Banking 19.9% Equity accounted 24,282 2,418
Individually immaterial associates
Unlisted
Two Rivers Lifestyle Centre Property 50% Fair value 115 (334)
Squarestone Growth LLP2 Property 42% Fair value 920 121
Kabokweni Plaza Shareblock Proprietary Limited Property 49% Fair value 107 10
Richmond Park Development Company (Pty) Ltd Property 38% Fair value 54 (5)
King Air (Pty) Ltd Property 50% Fair value 64 18
Old Mint (Pty) Ltd Property 50% Fair value 70 3
Other individually immaterial associates 26 (7)
Total investment in associate undertakings 25,638 2,224
Joint ventures
Unlisted
Old Mutual – CHN Energy Life Insurance Company Ltd. Life assurance 50% Equity accounted 1,071 10
Total investment in joint ventures 1,071 10
Total investments in associates and joint ventures 26,709 2,234
(c) Disposal of investment in Nedbank
Separate
On 21 December 2020, OMLACSA, completed a transfer of 12.5% (62,131,692 shares) of its holding in Nedbank to Old Mutual Emerging Markets (Proprietary) Limited (OMEM) for R8,274 million, being the market value on the date of the transaction. Following this transaction, OMLACSA retained an investment in Nedbank of 7.3%.
Consolidated
In the consolidated financial statements, up to the date of disposal, Nedbank is equity accounted as an investment in associated undertakings. As a result of the disposal of 12.5%, the Group has assessed and concluded that OMLACSA no longer has significant influence over the remaining 7.3% shareholding in Nedbank and the retained holding will be accounted for as investment, with fair value gains or losses being recognised in profit and loss.
IFRS requires that the entire equity accounted stake in Nedbank is disposed of and the remaining shareholding be recognised at fair value on the date of the transaction. This has resulted in the Group recognising a loss on disposal of R2,964 million, including amounts of other comprehensive income of R166 million recycled to profit or loss on disposal.
(d) Aggregate financial information of material investments in associated undertakings
The aggregate financial information of material investments in associated undertakings and joint ventures is as follows:
2020 2019 2019
At 31 DecemberRm
SquarestoneGrowth LLP
SquarestoneGrowth LLP Nedbank
Fair value 877 920 21,197
Statement of comprehensive income
Revenue 436 456 56,164
Profit from continuing operations 87 148 12,810
Other comprehensive income/(loss) – – (1,075)
Total comprehensive income/(loss) 87 148 11,735
Statement of financial position
Current assets 342 261 368,470
Non-current assets 4,691 4,410 774,879
Current liabilities (250) (187) (848,312)
Non-current liabilities (2,658) (2,409) (196,588)
Net assets 2,126 2,076 98,449
(e) Aggregate financial information of immaterial investments in associated undertakings and joint ventures
The aggregate financial information of other immaterial investments in associated undertakings and joint ventures is as follows:
The closing price per ordinary share of Nedbank on the JSE at 31 December 2020 was 12,948.00 cents
At 31 DecemberRm 2020 2019
Total current assets 5,882 5,743
Total non-current assets 14,892 13,556
Total current liabilities (2,607) (1,411)
Total non-current liabilities (12,924) (12,482)
Total revenues 2,176 1,995
H: Interests in Subsidiaries, Associates and Joint VenturesH2: Investments in associated undertakings and joint ventures
OMLACSA Separate and Consolidated Annual Financial Statements for the year ended 31 December 2020 OMLACSA Separate and Consolidated Annual Financial Statements for the year ended 31 December 2020106 107OMLACSA Separate and Consolidated Annual Financial Statements for the year ended 31 December 2020OMLACSA Separate and Consolidated Annual Financial Statements for the year ended 31 December 2020
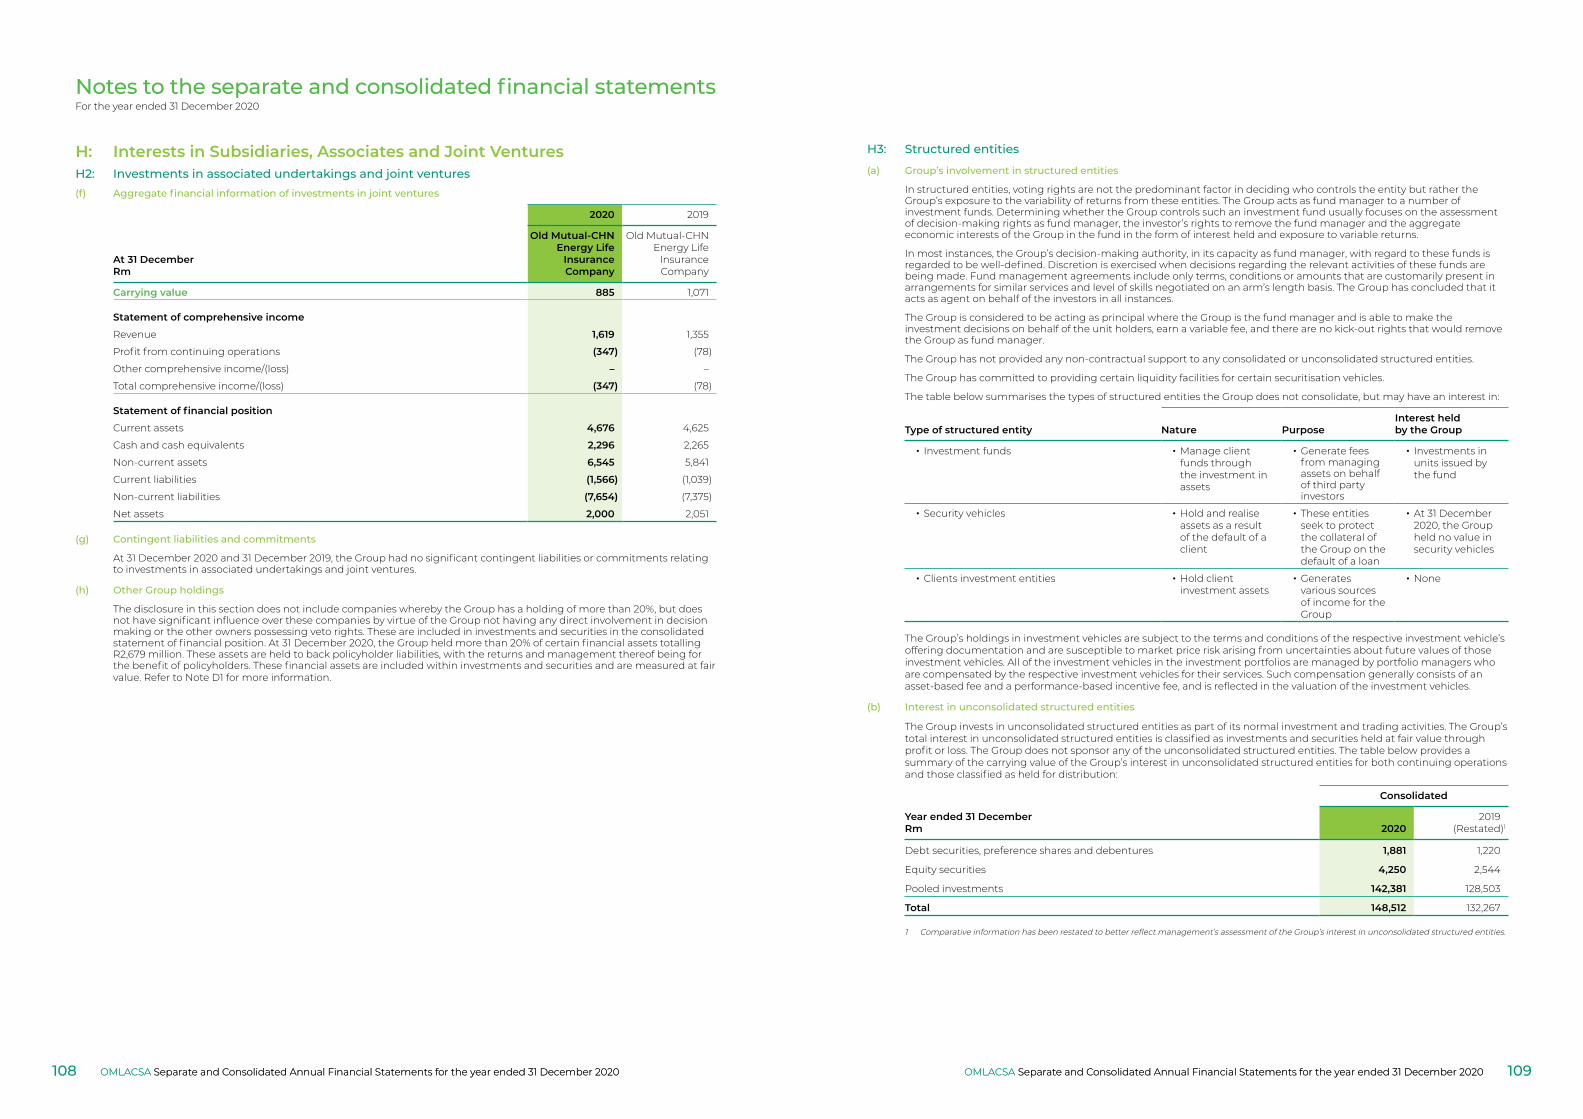
Notes to the separate and consolidated financial statementsFor the year ended 31 December 2020
(f) Aggregate financial information of investments in joint ventures
2020 2019
At 31 DecemberRm
Old Mutual‑CHNEnergy Life
InsuranceCompany
Old Mutual-CHNEnergy Life
InsuranceCompany
Carrying value 885 1,071
Statement of comprehensive income
Revenue 1,619 1,355
Profit from continuing operations (347) (78)
Other comprehensive income/(loss) – –
Total comprehensive income/(loss) (347) (78)
Statement of financial position
Current assets 4,676 4,625
Cash and cash equivalents 2,296 2,265
Non-current assets 6,545 5,841
Current liabilities (1,566) (1,039)
Non-current liabilities (7,654) (7,375)
Net assets 2,000 2,051
(g) Contingent liabilities and commitments
At 31 December 2020 and 31 December 2019, the Group had no significant contingent liabilities or commitments relating to investments in associated undertakings and joint ventures.
(h) Other Group holdings
The disclosure in this section does not include companies whereby the Group has a holding of more than 20%, but does not have significant influence over these companies by virtue of the Group not having any direct involvement in decision making or the other owners possessing veto rights. These are included in investments and securities in the consolidated statement of financial position. At 31 December 2020, the Group held more than 20% of certain financial assets totalling R2,679 million. These assets are held to back policyholder liabilities, with the returns and management thereof being for the benefit of policyholders. These financial assets are included within investments and securities and are measured at fair value. Refer to Note D1 for more information.
H: Interests in Subsidiaries, Associates and Joint VenturesH2: Investments in associated undertakings and joint ventures
H3: Structured entities
(a) Group’s involvement in structured entities
In structured entities, voting rights are not the predominant factor in deciding who controls the entity but rather the Group’s exposure to the variability of returns from these entities. The Group acts as fund manager to a number of investment funds. Determining whether the Group controls such an investment fund usually focuses on the assessment of decision-making rights as fund manager, the investor’s rights to remove the fund manager and the aggregate economic interests of the Group in the fund in the form of interest held and exposure to variable returns.
In most instances, the Group’s decision-making authority, in its capacity as fund manager, with regard to these funds is regarded to be well-defined. Discretion is exercised when decisions regarding the relevant activities of these funds are being made. Fund management agreements include only terms, conditions or amounts that are customarily present in arrangements for similar services and level of skills negotiated on an arm’s length basis. The Group has concluded that it acts as agent on behalf of the investors in all instances.
The Group is considered to be acting as principal where the Group is the fund manager and is able to make the investment decisions on behalf of the unit holders, earn a variable fee, and there are no kick-out rights that would remove the Group as fund manager.
The Group has not provided any non-contractual support to any consolidated or unconsolidated structured entities.
The Group has committed to providing certain liquidity facilities for certain securitisation vehicles.
The table below summarises the types of structured entities the Group does not consolidate, but may have an interest in:
Type of structured entity Nature PurposeInterest held by the Group
• Investment funds • Manage client funds through the investment in assets
• Generate fees from managing assets on behalf of third party investors
• Investments in units issued by the fund
• Security vehicles • Hold and realise assets as a result of the default of a client
• These entities seek to protect the collateral of the Group on the default of a loan
• At 31 December 2020, the Group held no value in security vehicles
• Clients investment entities • Hold client investment assets
• Generates various sources of income for the Group
• None
The Group’s holdings in investment vehicles are subject to the terms and conditions of the respective investment vehicle’s offering documentation and are susceptible to market price risk arising from uncertainties about future values of those investment vehicles. All of the investment vehicles in the investment portfolios are managed by portfolio managers who are compensated by the respective investment vehicles for their services. Such compensation generally consists of an asset-based fee and a performance-based incentive fee, and is reflected in the valuation of the investment vehicles.
(b) Interest in unconsolidated structured entities
The Group invests in unconsolidated structured entities as part of its normal investment and trading activities. The Group’s total interest in unconsolidated structured entities is classified as investments and securities held at fair value through profit or loss. The Group does not sponsor any of the unconsolidated structured entities. The table below provides a summary of the carrying value of the Group’s interest in unconsolidated structured entities for both continuing operations and those classified as held for distribution:
Year ended 31 DecemberRm
Consolidated
20202019
(Restated)1
Debt securities, preference shares and debentures 1,881 1,220
Equity securities 4,250 2,544
Pooled investments 142,381 128,503
Total 148,512 132,267
1 Comparative information has been restated to better reflect management’s assessment of the Group’s interest in unconsolidated structured entities.
OMLACSA Separate and Consolidated Annual Financial Statements for the year ended 31 December 2020 OMLACSA Separate and Consolidated Annual Financial Statements for the year ended 31 December 2020108 109OMLACSA Separate and Consolidated Annual Financial Statements for the year ended 31 December 2020OMLACSA Separate and Consolidated Annual Financial Statements for the year ended 31 December 2020
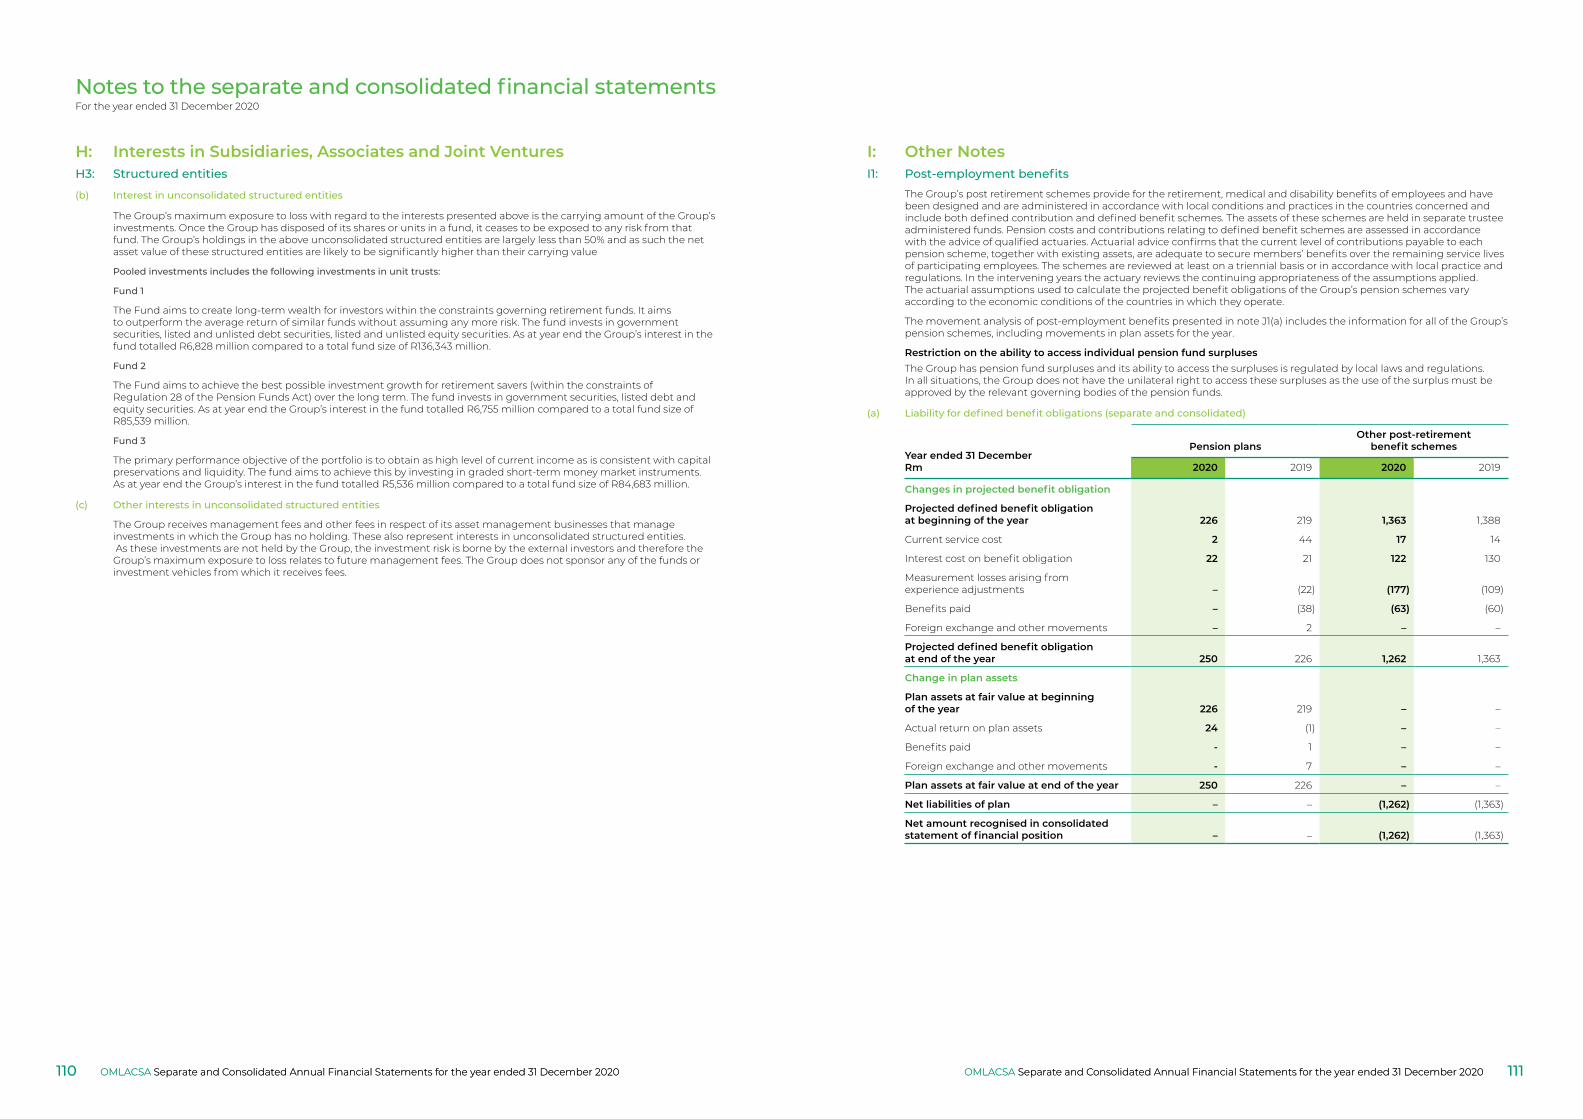
Notes to the separate and consolidated financial statementsFor the year ended 31 December 2020
H: Interests in Subsidiaries, Associates and Joint VenturesH3: Structured entities
(b) Interest in unconsolidated structured entities
The Group’s maximum exposure to loss with regard to the interests presented above is the carrying amount of the Group’s investments. Once the Group has disposed of its shares or units in a fund, it ceases to be exposed to any risk from that fund. The Group’s holdings in the above unconsolidated structured entities are largely less than 50% and as such the net asset value of these structured entities are likely to be significantly higher than their carrying value
Pooled investments includes the following investments in unit trusts:
Fund 1
The Fund aims to create long-term wealth for investors within the constraints governing retirement funds. It aims to outperform the average return of similar funds without assuming any more risk. The fund invests in government securities, listed and unlisted debt securities, listed and unlisted equity securities. As at year end the Group’s interest in the fund totalled R6,828 million compared to a total fund size of R136,343 million.
Fund 2
The Fund aims to achieve the best possible investment growth for retirement savers (within the constraints of Regulation 28 of the Pension Funds Act) over the long term. The fund invests in government securities, listed debt and equity securities. As at year end the Group’s interest in the fund totalled R6,755 million compared to a total fund size of R85,539 million.
Fund 3
The primary performance objective of the portfolio is to obtain as high level of current income as is consistent with capital preservations and liquidity. The fund aims to achieve this by investing in graded short-term money market instruments. As at year end the Group’s interest in the fund totalled R5,536 million compared to a total fund size of R84,683 million.
(c) Other interests in unconsolidated structured entities
The Group receives management fees and other fees in respect of its asset management businesses that manage investments in which the Group has no holding. These also represent interests in unconsolidated structured entities. As these investments are not held by the Group, the investment risk is borne by the external investors and therefore the Group’s maximum exposure to loss relates to future management fees. The Group does not sponsor any of the funds or investment vehicles from which it receives fees.
I: Other NotesI1: Post-employment benefits
The Group’s post retirement schemes provide for the retirement, medical and disability benefits of employees and have been designed and are administered in accordance with local conditions and practices in the countries concerned and include both defined contribution and defined benefit schemes. The assets of these schemes are held in separate trustee administered funds. Pension costs and contributions relating to defined benefit schemes are assessed in accordance with the advice of qualified actuaries. Actuarial advice confirms that the current level of contributions payable to each pension scheme, together with existing assets, are adequate to secure members’ benefits over the remaining service lives of participating employees. The schemes are reviewed at least on a triennial basis or in accordance with local practice and regulations. In the intervening years the actuary reviews the continuing appropriateness of the assumptions applied. The actuarial assumptions used to calculate the projected benefit obligations of the Group’s pension schemes vary according to the economic conditions of the countries in which they operate.
The movement analysis of post-employment benefits presented in note J1(a) includes the information for all of the Group’s pension schemes, including movements in plan assets for the year.
Restriction on the ability to access individual pension fund surplusesThe Group has pension fund surpluses and its ability to access the surpluses is regulated by local laws and regulations. In all situations, the Group does not have the unilateral right to access these surpluses as the use of the surplus must be approved by the relevant governing bodies of the pension funds.
(a) Liability for defined benefit obligations (separate and consolidated)
Year ended 31 DecemberRm
Pension plansOther post‑retirement
benefit schemes
2020 2019 2020 2019
Changes in projected benefit obligation
Projected defined benefit obligation at beginning of the year 226 219 1,363 1,388
Current service cost 2 44 17 14
Interest cost on benefit obligation 22 21 122 130
Measurement losses arising from experience adjustments – (22) (177) (109)
Benefits paid – (38) (63) (60)
Foreign exchange and other movements – 2 – –
Projected defined benefit obligation at end of the year 250 226 1,262 1,363
Change in plan assets
Plan assets at fair value at beginning of the year 226 219 – –
Actual return on plan assets 24 (1) – –
Benefits paid ‑ 1 – –
Foreign exchange and other movements ‑ 7 – –
Plan assets at fair value at end of the year 250 226 – –
Net liabilities of plan – – (1,262) (1,363)
Net amount recognised in consolidated statement of financial position – – (1,262) (1,363)
OMLACSA Separate and Consolidated Annual Financial Statements for the year ended 31 December 2020 OMLACSA Separate and Consolidated Annual Financial Statements for the year ended 31 December 2020110 111OMLACSA Separate and Consolidated Annual Financial Statements for the year ended 31 December 2020OMLACSA Separate and Consolidated Annual Financial Statements for the year ended 31 December 2020
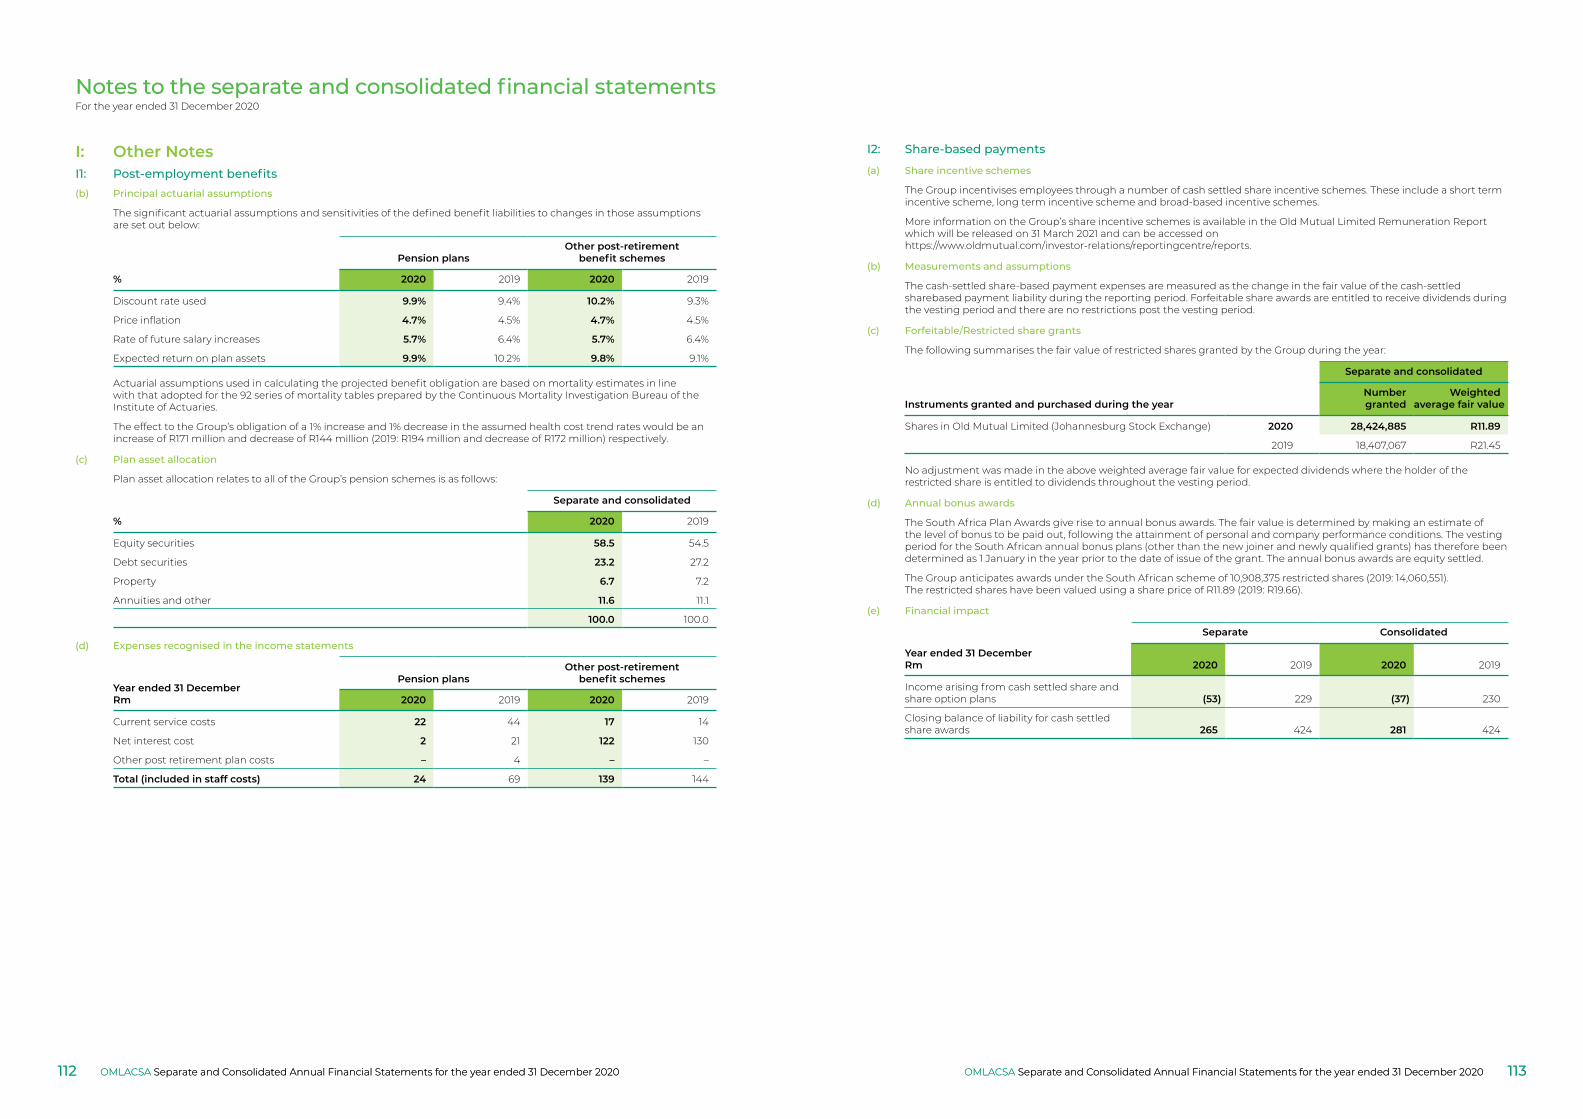
Notes to the separate and consolidated financial statementsFor the year ended 31 December 2020
(b) Principal actuarial assumptions
The significant actuarial assumptions and sensitivities of the defined benefit liabilities to changes in those assumptions are set out below:
Pension plansOther post‑retirement
benefit schemes
% 2020 2019 2020 2019
Discount rate used 9.9% 9.4% 10.2% 9.3%
Price inflation 4.7% 4.5% 4.7% 4.5%
Rate of future salary increases 5.7% 6.4% 5.7% 6.4%
Expected return on plan assets 9.9% 10.2% 9.8% 9.1%
Actuarial assumptions used in calculating the projected benefit obligation are based on mortality estimates in line with that adopted for the 92 series of mortality tables prepared by the Continuous Mortality Investigation Bureau of the Institute of Actuaries.
The effect to the Group’s obligation of a 1% increase and 1% decrease in the assumed health cost trend rates would be an increase of R171 million and decrease of R144 million (2019: R194 million and decrease of R172 million) respectively.
(c) Plan asset allocation
Plan asset allocation relates to all of the Group’s pension schemes is as follows:
Separate and consolidated
% 2020 2019
Equity securities 58.5 54.5
Debt securities 23.2 27.2
Property 6.7 7.2
Annuities and other 11.6 11.1
100.0 100.0
(d) Expenses recognised in the income statements
Year ended 31 DecemberRm
Pension plansOther post‑retirement
benefit schemes
2020 2019 2020 2019
Current service costs 22 44 17 14
Net interest cost 2 21 122 130
Other post retirement plan costs – 4 – –
Total (included in staff costs) 24 69 139 144
I: Other NotesI1: Post-employment benefits
I2: Share-based payments
(a) Share incentive schemes
The Group incentivises employees through a number of cash settled share incentive schemes. These include a short term incentive scheme, long term incentive scheme and broad-based incentive schemes.
More information on the Group’s share incentive schemes is available in the Old Mutual Limited Remuneration Report which will be released on 31 March 2021 and can be accessed on https://www.oldmutual.com/investor-relations/reportingcentre/reports.
(b) Measurements and assumptions
The cash-settled share-based payment expenses are measured as the change in the fair value of the cash-settled sharebased payment liability during the reporting period. Forfeitable share awards are entitled to receive dividends during the vesting period and there are no restrictions post the vesting period.
(c) Forfeitable/Restricted share grants
The following summarises the fair value of restricted shares granted by the Group during the year:
Separate and consolidated
Instruments granted and purchased during the yearNumbergranted
Weightedaverage fair value
Shares in Old Mutual Limited (Johannesburg Stock Exchange) 2020 28,424,885 R11.89
2019 18,407,067 R21.45
No adjustment was made in the above weighted average fair value for expected dividends where the holder of the restricted share is entitled to dividends throughout the vesting period.
(d) Annual bonus awards
The South Africa Plan Awards give rise to annual bonus awards. The fair value is determined by making an estimate of the level of bonus to be paid out, following the attainment of personal and company performance conditions. The vesting period for the South African annual bonus plans (other than the new joiner and newly qualified grants) has therefore been determined as 1 January in the year prior to the date of issue of the grant. The annual bonus awards are equity settled.
The Group anticipates awards under the South African scheme of 10,908,375 restricted shares (2019: 14,060,551). The restricted shares have been valued using a share price of R11.89 (2019: R19.66).
(e) Financial impact
Separate Consolidated
Year ended 31 DecemberRm 2020 2019 2020 2019
Income arising from cash settled share and share option plans (53) 229 (37) 230
Closing balance of liability for cash settled share awards 265 424 281 424
OMLACSA Separate and Consolidated Annual Financial Statements for the year ended 31 December 2020 OMLACSA Separate and Consolidated Annual Financial Statements for the year ended 31 December 2020112 113OMLACSA Separate and Consolidated Annual Financial Statements for the year ended 31 December 2020OMLACSA Separate and Consolidated Annual Financial Statements for the year ended 31 December 2020
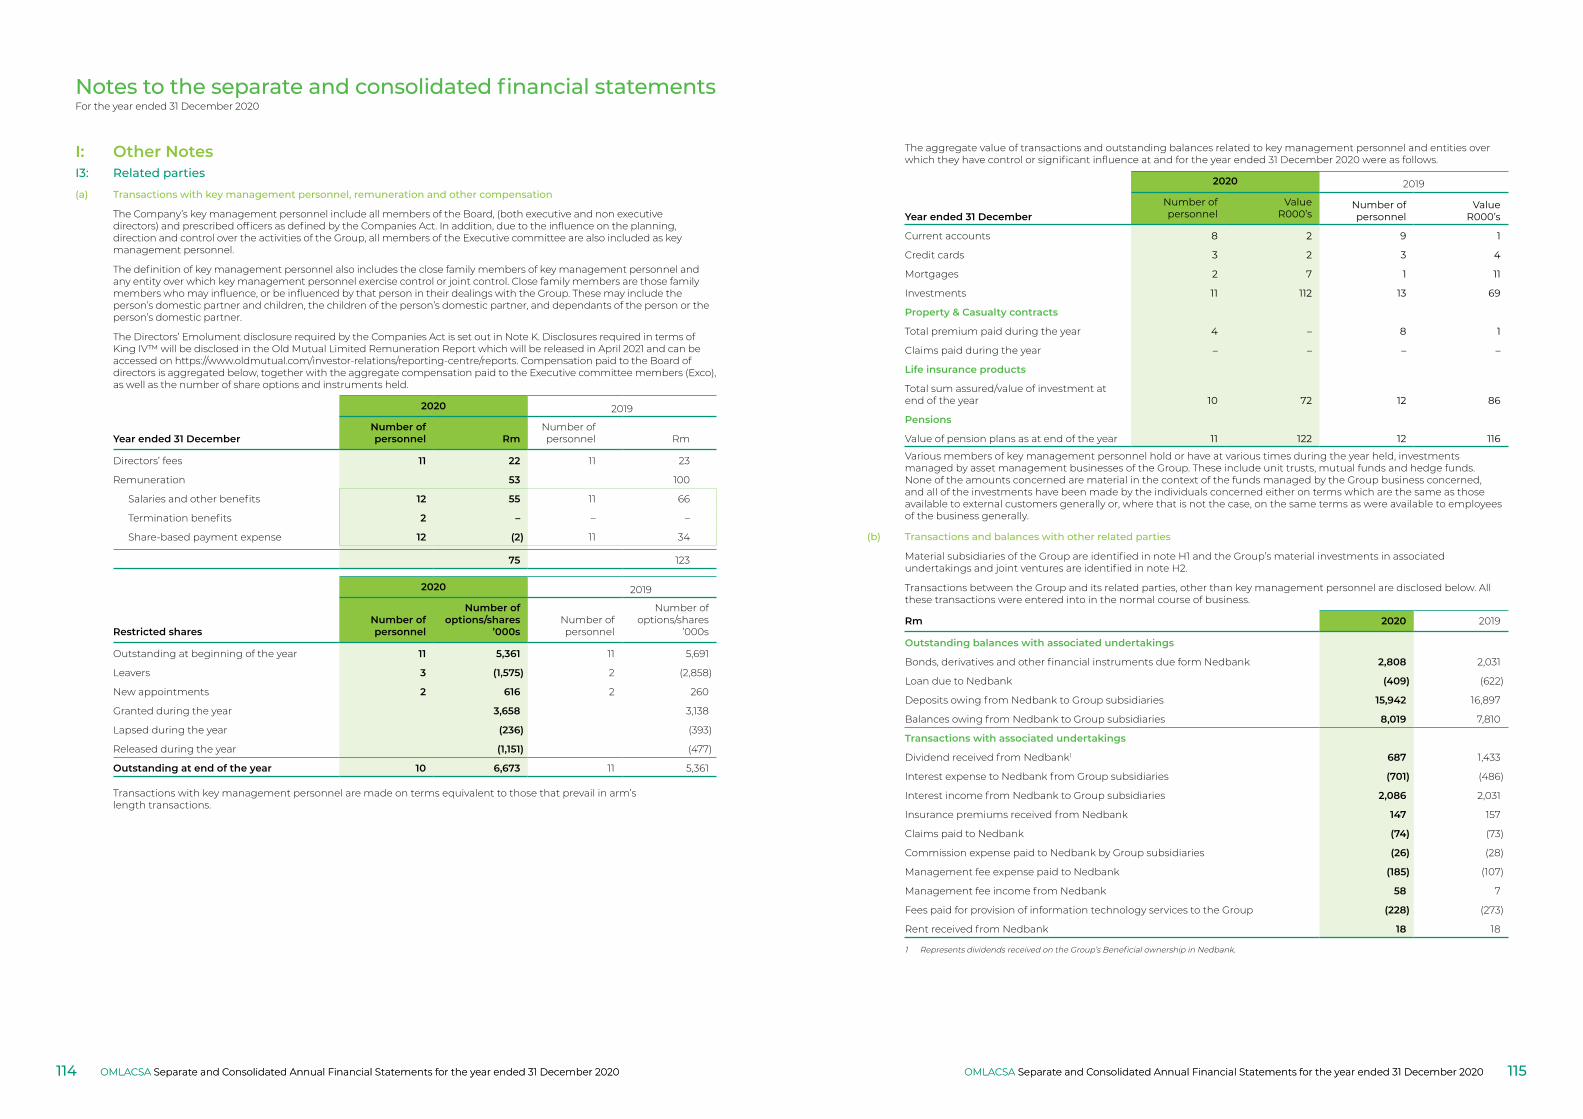
Notes to the separate and consolidated financial statementsFor the year ended 31 December 2020
I3: Related parties
(a) Transactions with key management personnel, remuneration and other compensation
The Company’s key management personnel include all members of the Board, (both executive and non executive directors) and prescribed officers as defined by the Companies Act. In addition, due to the influence on the planning, direction and control over the activities of the Group, all members of the Executive committee are also included as key management personnel.
The definition of key management personnel also includes the close family members of key management personnel and any entity over which key management personnel exercise control or joint control. Close family members are those family members who may influence, or be influenced by that person in their dealings with the Group. These may include the person’s domestic partner and children, the children of the person’s domestic partner, and dependants of the person or the person’s domestic partner.
The Directors’ Emolument disclosure required by the Companies Act is set out in Note K. Disclosures required in terms of King IV™ will be disclosed in the Old Mutual Limited Remuneration Report which will be released in April 2021 and can be accessed on https://www.oldmutual.com/investor-relations/reporting-centre/reports. Compensation paid to the Board of directors is aggregated below, together with the aggregate compensation paid to the Executive committee members (Exco), as well as the number of share options and instruments held.
Year ended 31 December
2020 2019
Number of personnel Rm
Number of personnel Rm
Directors’ fees 11 22 11 23
Remuneration 53 100
Salaries and other benefits 12 55 11 66
Termination benefits 2 – – –
Share-based payment expense 12 (2) 11 34
75 123
2020 2019
Restricted sharesNumber of personnel
Number of options/shares
’000sNumber of personnel
Number of options/shares
’000s
Outstanding at beginning of the year 11 5,361 11 5,691
Leavers 3 (1,575) 2 (2,858)
New appointments 2 616 2 260
Granted during the year 3,658 3,138
Lapsed during the year (236) (393)
Released during the year (1,151) (477)
Outstanding at end of the year 10 6,673 11 5,361
Transactions with key management personnel are made on terms equivalent to those that prevail in arm’s length transactions.
I: Other Notes The aggregate value of transactions and outstanding balances related to key management personnel and entities over which they have control or significant influence at and for the year ended 31 December 2020 were as follows.
2020 2019
Year ended 31 DecemberNumber of personnel
ValueR000’s
Number of personnel
ValueR000’s
Current accounts 8 2 9 1
Credit cards 3 2 3 4
Mortgages 2 7 1 11
Investments 11 112 13 69
Property & Casualty contracts
Total premium paid during the year 4 – 8 1
Claims paid during the year – – – –
Life insurance products
Total sum assured/value of investment at end of the year 10 72 12 86
Pensions
Value of pension plans as at end of the year 11 122 12 116
Various members of key management personnel hold or have at various times during the year held, investments managed by asset management businesses of the Group. These include unit trusts, mutual funds and hedge funds. None of the amounts concerned are material in the context of the funds managed by the Group business concerned, and all of the investments have been made by the individuals concerned either on terms which are the same as those available to external customers generally or, where that is not the case, on the same terms as were available to employees of the business generally.
(b) Transactions and balances with other related parties
Material subsidiaries of the Group are identified in note H1 and the Group’s material investments in associated undertakings and joint ventures are identified in note H2.
Transactions between the Group and its related parties, other than key management personnel are disclosed below. All these transactions were entered into in the normal course of business.
Rm 2020 2019
Outstanding balances with associated undertakings
Bonds, derivatives and other financial instruments due form Nedbank 2,808 2,031
Loan due to Nedbank (409) (622)
Deposits owing from Nedbank to Group subsidiaries 15,942 16,897
Balances owing from Nedbank to Group subsidiaries 8,019 7,810
Transactions with associated undertakings
Dividend received from Nedbank1 687 1,433
Interest expense to Nedbank from Group subsidiaries (701) (486)
Interest income from Nedbank to Group subsidiaries 2,086 2,031
Insurance premiums received from Nedbank 147 157
Claims paid to Nedbank (74) (73)
Commission expense paid to Nedbank by Group subsidiaries (26) (28)
Management fee expense paid to Nedbank (185) (107)
Management fee income from Nedbank 58 7
Fees paid for provision of information technology services to the Group (228) (273)
Rent received from Nedbank 18 18
1 Represents dividends received on the Group’s Beneficial ownership in Nedbank.
OMLACSA Separate and Consolidated Annual Financial Statements for the year ended 31 December 2020 OMLACSA Separate and Consolidated Annual Financial Statements for the year ended 31 December 2020114 115OMLACSA Separate and Consolidated Annual Financial Statements for the year ended 31 December 2020OMLACSA Separate and Consolidated Annual Financial Statements for the year ended 31 December 2020
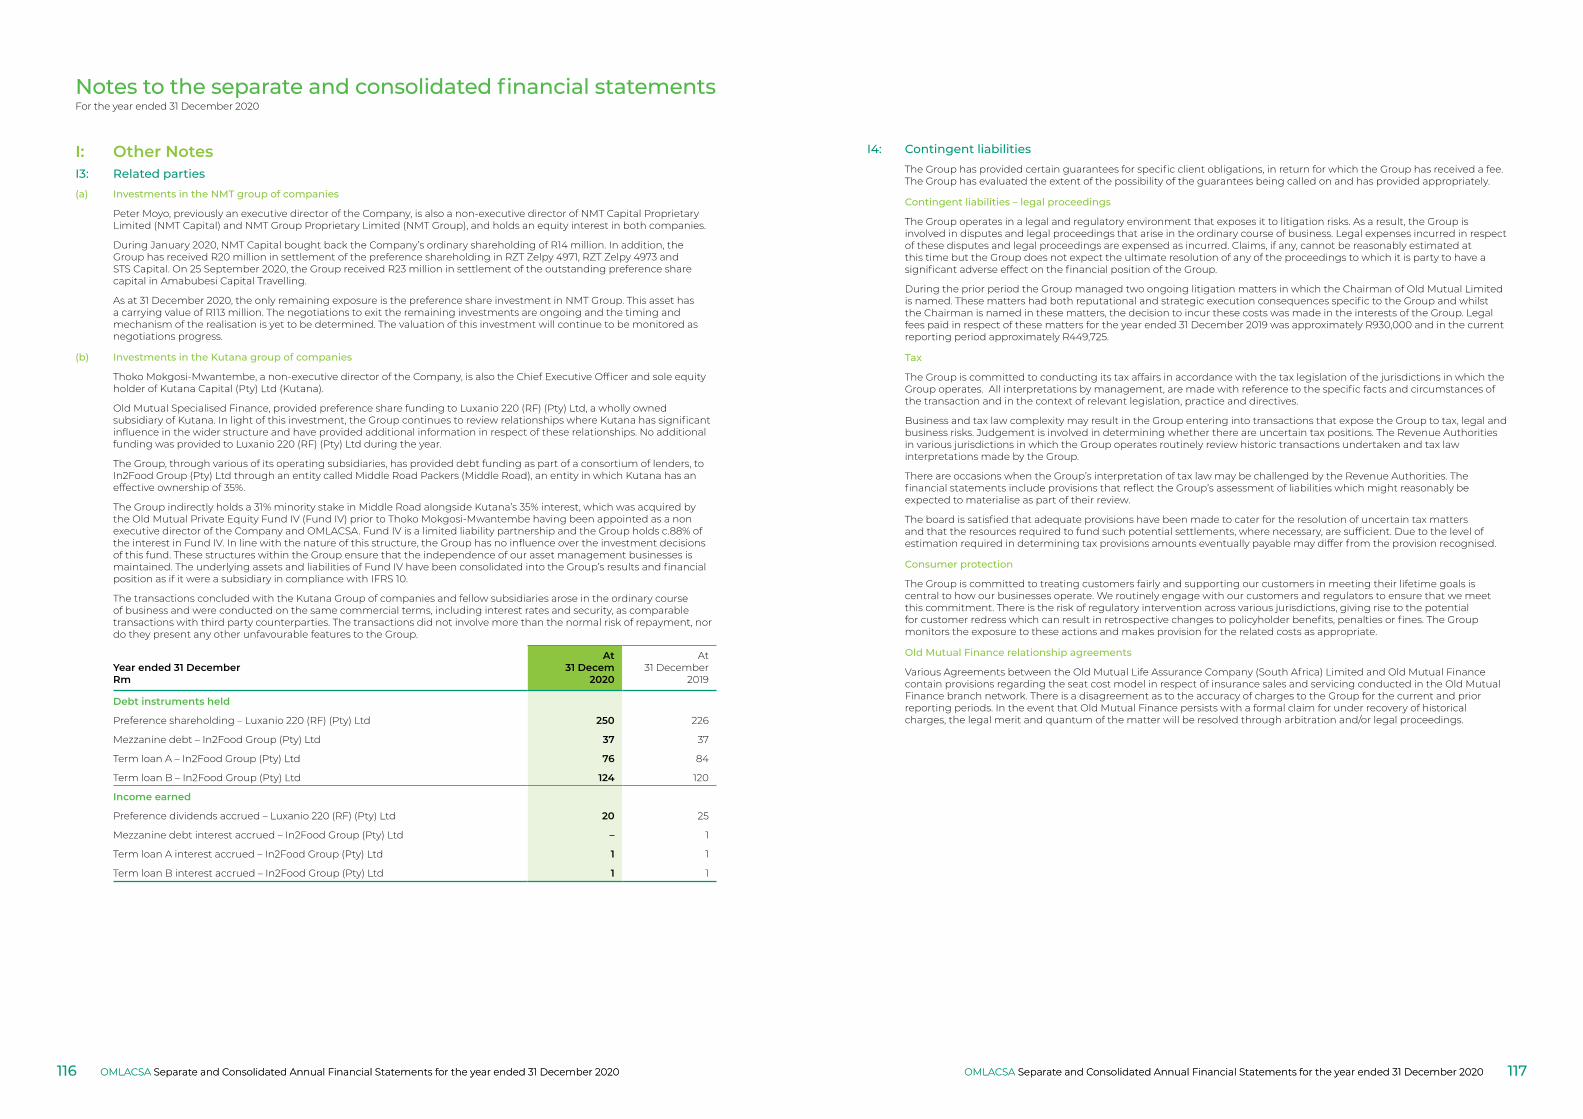
Notes to the separate and consolidated financial statementsFor the year ended 31 December 2020
(a) Investments in the NMT group of companies
Peter Moyo, previously an executive director of the Company, is also a non-executive director of NMT Capital Proprietary Limited (NMT Capital) and NMT Group Proprietary Limited (NMT Group), and holds an equity interest in both companies.
During January 2020, NMT Capital bought back the Company’s ordinary shareholding of R14 million. In addition, the Group has received R20 million in settlement of the preference shareholding in RZT Zelpy 4971, RZT Zelpy 4973 and STS Capital. On 25 September 2020, the Group received R23 million in settlement of the outstanding preference share capital in Amabubesi Capital Travelling.
As at 31 December 2020, the only remaining exposure is the preference share investment in NMT Group. This asset has a carrying value of R113 million. The negotiations to exit the remaining investments are ongoing and the timing and mechanism of the realisation is yet to be determined. The valuation of this investment will continue to be monitored as negotiations progress.
(b) Investments in the Kutana group of companies
Thoko Mokgosi-Mwantembe, a non-executive director of the Company, is also the Chief Executive Officer and sole equity holder of Kutana Capital (Pty) Ltd (Kutana).
Old Mutual Specialised Finance, provided preference share funding to Luxanio 220 (RF) (Pty) Ltd, a wholly owned subsidiary of Kutana. In light of this investment, the Group continues to review relationships where Kutana has significant influence in the wider structure and have provided additional information in respect of these relationships. No additional funding was provided to Luxanio 220 (RF) (Pty) Ltd during the year.
The Group, through various of its operating subsidiaries, has provided debt funding as part of a consortium of lenders, to In2Food Group (Pty) Ltd through an entity called Middle Road Packers (Middle Road), an entity in which Kutana has an effective ownership of 35%.
The Group indirectly holds a 31% minority stake in Middle Road alongside Kutana’s 35% interest, which was acquired by the Old Mutual Private Equity Fund IV (Fund IV) prior to Thoko Mokgosi-Mwantembe having been appointed as a non executive director of the Company and OMLACSA. Fund IV is a limited liability partnership and the Group holds c.88% of the interest in Fund IV. In line with the nature of this structure, the Group has no influence over the investment decisions of this fund. These structures within the Group ensure that the independence of our asset management businesses is maintained. The underlying assets and liabilities of Fund IV have been consolidated into the Group’s results and financial position as if it were a subsidiary in compliance with IFRS 10.
The transactions concluded with the Kutana Group of companies and fellow subsidiaries arose in the ordinary course of business and were conducted on the same commercial terms, including interest rates and security, as comparable transactions with third party counterparties. The transactions did not involve more than the normal risk of repayment, nor do they present any other unfavourable features to the Group.
Year ended 31 DecemberRm
At 31 Decem
2020
At 31 December
2019
Debt instruments held
Preference shareholding – Luxanio 220 (RF) (Pty) Ltd 250 226
Mezzanine debt – In2Food Group (Pty) Ltd 37 37
Term loan A – In2Food Group (Pty) Ltd 76 84
Term loan B – In2Food Group (Pty) Ltd 124 120
Income earned
Preference dividends accrued – Luxanio 220 (RF) (Pty) Ltd 20 25
Mezzanine debt interest accrued – In2Food Group (Pty) Ltd – 1
Term loan A interest accrued – In2Food Group (Pty) Ltd 1 1
Term loan B interest accrued – In2Food Group (Pty) Ltd 1 1
I: Other NotesI3: Related parties
I4: Contingent liabilitiesThe Group has provided certain guarantees for specific client obligations, in return for which the Group has received a fee. The Group has evaluated the extent of the possibility of the guarantees being called on and has provided appropriately.
Contingent liabilities – legal proceedings
The Group operates in a legal and regulatory environment that exposes it to litigation risks. As a result, the Group is involved in disputes and legal proceedings that arise in the ordinary course of business. Legal expenses incurred in respect of these disputes and legal proceedings are expensed as incurred. Claims, if any, cannot be reasonably estimated at this time but the Group does not expect the ultimate resolution of any of the proceedings to which it is party to have a significant adverse effect on the financial position of the Group.
During the prior period the Group managed two ongoing litigation matters in which the Chairman of Old Mutual Limited is named. These matters had both reputational and strategic execution consequences specific to the Group and whilst the Chairman is named in these matters, the decision to incur these costs was made in the interests of the Group. Legal fees paid in respect of these matters for the year ended 31 December 2019 was approximately R930,000 and in the current reporting period approximately R449,725.
Tax
The Group is committed to conducting its tax affairs in accordance with the tax legislation of the jurisdictions in which the Group operates. All interpretations by management, are made with reference to the specific facts and circumstances of the transaction and in the context of relevant legislation, practice and directives.
Business and tax law complexity may result in the Group entering into transactions that expose the Group to tax, legal and business risks. Judgement is involved in determining whether there are uncertain tax positions. The Revenue Authorities in various jurisdictions in which the Group operates routinely review historic transactions undertaken and tax law interpretations made by the Group.
There are occasions when the Group’s interpretation of tax law may be challenged by the Revenue Authorities. The financial statements include provisions that reflect the Group’s assessment of liabilities which might reasonably be expected to materialise as part of their review.
The board is satisfied that adequate provisions have been made to cater for the resolution of uncertain tax matters and that the resources required to fund such potential settlements, where necessary, are sufficient. Due to the level of estimation required in determining tax provisions amounts eventually payable may differ from the provision recognised.
Consumer protection
The Group is committed to treating customers fairly and supporting our customers in meeting their lifetime goals is central to how our businesses operate. We routinely engage with our customers and regulators to ensure that we meet this commitment. There is the risk of regulatory intervention across various jurisdictions, giving rise to the potential for customer redress which can result in retrospective changes to policyholder benefits, penalties or fines. The Group monitors the exposure to these actions and makes provision for the related costs as appropriate.
Old Mutual Finance relationship agreements
Various Agreements between the Old Mutual Life Assurance Company (South Africa) Limited and Old Mutual Finance contain provisions regarding the seat cost model in respect of insurance sales and servicing conducted in the Old Mutual Finance branch network. There is a disagreement as to the accuracy of charges to the Group for the current and prior reporting periods. In the event that Old Mutual Finance persists with a formal claim for under recovery of historical charges, the legal merit and quantum of the matter will be resolved through arbitration and/or legal proceedings.
OMLACSA Separate and Consolidated Annual Financial Statements for the year ended 31 December 2020 OMLACSA Separate and Consolidated Annual Financial Statements for the year ended 31 December 2020116 117OMLACSA Separate and Consolidated Annual Financial Statements for the year ended 31 December 2020OMLACSA Separate and Consolidated Annual Financial Statements for the year ended 31 December 2020
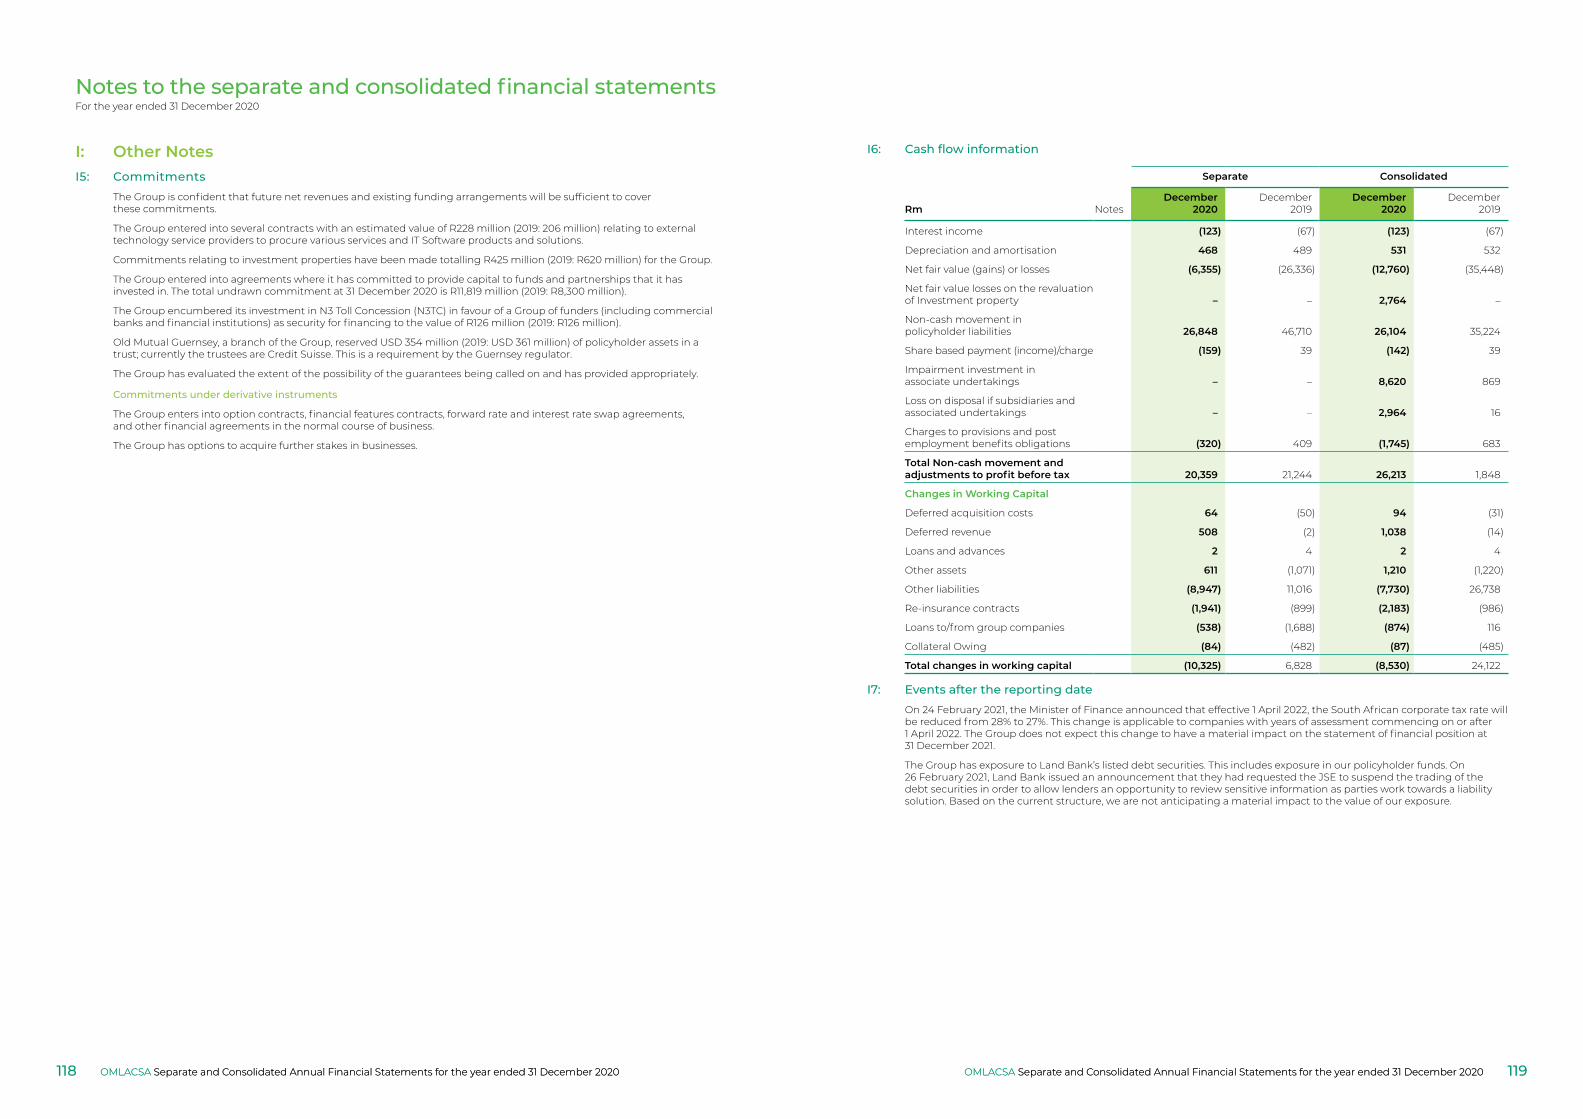
Notes to the separate and consolidated financial statementsFor the year ended 31 December 2020
I5: CommitmentsThe Group is confident that future net revenues and existing funding arrangements will be sufficient to cover these commitments.
The Group entered into several contracts with an estimated value of R228 million (2019: 206 million) relating to external technology service providers to procure various services and IT Software products and solutions.
Commitments relating to investment properties have been made totalling R425 million (2019: R620 million) for the Group.
The Group entered into agreements where it has committed to provide capital to funds and partnerships that it has invested in. The total undrawn commitment at 31 December 2020 is R11,819 million (2019: R8,300 million).
The Group encumbered its investment in N3 Toll Concession (N3TC) in favour of a Group of funders (including commercial banks and financial institutions) as security for financing to the value of R126 million (2019: R126 million).
Old Mutual Guernsey, a branch of the Group, reserved USD 354 million (2019: USD 361 million) of policyholder assets in a trust; currently the trustees are Credit Suisse. This is a requirement by the Guernsey regulator.
The Group has evaluated the extent of the possibility of the guarantees being called on and has provided appropriately.
Commitments under derivative instruments
The Group enters into option contracts, financial features contracts, forward rate and interest rate swap agreements, and other financial agreements in the normal course of business.
The Group has options to acquire further stakes in businesses.
I: Other Notes I6: Cash flow information
Rm Notes
Separate Consolidated
December2020
December2019
December2020
December2019
Interest income (123) (67) (123) (67)
Depreciation and amortisation 468 489 531 532
Net fair value (gains) or losses (6,355) (26,336) (12,760) (35,448)
Net fair value losses on the revaluation of Investment property – – 2,764 –
Non-cash movement in policyholder liabilities 26,848 46,710 26,104 35,224
Share based payment (income)/charge (159) 39 (142) 39
Impairment investment in associate undertakings – – 8,620 869
Loss on disposal if subsidiaries and associated undertakings – – 2,964 16
Charges to provisions and post employment benefits obligations (320) 409 (1,745) 683
Total Non‑cash movement and adjustments to profit before tax 20,359 21,244 26,213 1,848
Changes in Working Capital
Deferred acquisition costs 64 (50) 94 (31)
Deferred revenue 508 (2) 1,038 (14)
Loans and advances 2 4 2 4
Other assets 611 (1,071) 1,210 (1,220)
Other liabilities (8,947) 11,016 (7,730) 26,738
Re-insurance contracts (1,941) (899) (2,183) (986)
Loans to/from group companies (538) (1,688) (874) 116
Collateral Owing (84) (482) (87) (485)
Total changes in working capital (10,325) 6,828 (8,530) 24,122
I7: Events after the reporting dateOn 24 February 2021, the Minister of Finance announced that effective 1 April 2022, the South African corporate tax rate will be reduced from 28% to 27%. This change is applicable to companies with years of assessment commencing on or after 1 April 2022. The Group does not expect this change to have a material impact on the statement of financial position at 31 December 2021.
The Group has exposure to Land Bank’s listed debt securities. This includes exposure in our policyholder funds. On 26 February 2021, Land Bank issued an announcement that they had requested the JSE to suspend the trading of the debt securities in order to allow lenders an opportunity to review sensitive information as parties work towards a liability solution. Based on the current structure, we are not anticipating a material impact to the value of our exposure.
OMLACSA Separate and Consolidated Annual Financial Statements for the year ended 31 December 2020 OMLACSA Separate and Consolidated Annual Financial Statements for the year ended 31 December 2020118 119OMLACSA Separate and Consolidated Annual Financial Statements for the year ended 31 December 2020OMLACSA Separate and Consolidated Annual Financial Statements for the year ended 31 December 2020
Notes to the separate and consolidated financial statementsFor the year ended 31 December 2020
J: Future standards, amendments to standards and interpretations not early‑adopted in the 2020 financial statementsA number of new standards and amendments to standards are effective for annual periods beginning after 1 January 2021 and earlier application is permitted; however, the Group has not early adopted any of the forthcoming new or amended standards in preparing these consolidated financial statements.
IFRS 9, Financial Instruments, IAS 39, Financial Instruments: Recognition and Measurement, IFRS 7, Financial Instruments: Disclosures, IFRS 4, Insurance Contracts and IFRS 16, Leases.A fundamental reform of major interest rate benchmarks has been undertaken globally, including the replacement of some interbank offered rates (IBORs) with alternative nearly risk-free rates (referred to as ‘IBOR reform’). The Group had significant exposure to IBORs on its financial instruments that were replaced or reformed as part of these market-wide initiatives.
In August 2020, the IASB issued Interest Rate Benchmark Reform - Phase 2 (Phase 2 amendments), which amends IFRS 9, Financial Instruments, IAS 39, Financial Instruments: Recognition and Measurement, IFRS 7, Financial Instruments: Disclosures, IFRS 4, Insurance Contracts and IFRS 16, Leases. The Phase 2 amendments address issues that might affect financial reporting during the reform of an interest rate benchmark, including the effects of changes to contractual cash flows or hedging relationships arising from the replacement of an interest rate benchmark with an alternative benchmark rate.
The Interest Rate Benchmark Reform Phase 2 resulted in amendments to IFRS 7, IFRS 9, IAS 39 and IFRS 16 relating to changes in the basis for determining contractual cash flows of financial assets, financial liabilities and lease liabilities, hedge accounting and disclosures.
The Group does not have any significant impact from these amendments as the majority of the Group’s financial assets and financial liabilities are measured at fair value through profit or loss. The Group is also mostly exposed to JIBAR (Johannesburg) and to a lesser extent LIBOR (London) and EURIBOR (Euro) rates through its borrowed funds. There are currently no material leases that are linked to IBOR rates. The LIBOR reform is expected to be completed by June 2023 and there is currently no set date for the JIBAR reform. The Group will only transition to alternative benchmarks as each interest rate benchmark is replaced. The Group is in the process of determining the estimated impact as none of the interest rate benchmarks it is exposed to has been replaced yet. The Group does not expect that there will be a material impact as a result of these amendments.
IFRS 17 Insurance ContractsIFRS 17 is effective for reporting periods beginning on or after 1 January 2023, a two year deferral from the original effective date of 1 January 2021:
The new standard will affect the financial statements and key performance indicators of all entities in the Group that issue insurance contracts (such as term and life insurance, life annuities, disability insurance, and property & casualty insurance) or investment contracts with discretionary participation features (such as with-profit annuities and smooth bonus investments). The most significant impacted subsidiary will be the Old Mutual Life Assurance Company (South Africa) Limited (OMLACSA). However, all other Group entities with life and short-term insurance licences will also be impacted.
In 2017 the Group instituted an implementation programme under the sponsorship of the Chief Financial Officer, who chairs a steering committee consisting of senior finance, actuarial and information technology executives from impacted business areas. Each major IFRS 17 focus area is also governed by a delivery committee, which consists of senior finance and actuarial managers who make decisions on scope, design and enablement for their relevant focus areas. IFRS 17 Projects were also mobilised in segments and countries during 2019, each with their own governance and decision-making forums. All decisions relating to the interpretation of the standard (i.e. policies and methodologies) are made by a Technical Review Committee, which consists of actuarial and finance subject matter experts across the Group. Ratification of major decisions is done by the steering committee. Programme resources include a mix of dedicated and shared internal technical experts, as well as external consultants where appropriate.
IFRS 17 Insurance ContractsThe main focus of the programme during 2020 was the finalisation of key policy and methodology decisions, the assessment and analysis of the financial impact of transition to IFRS 17, as well as progressing process design, actuarial enablement, finance and data enablement activities. Assurance reviews were also initiated on policy and methodology papers and have progressed in line with plans.
The transition approach and process was finalised in 2018 and indicative transition calculations have been performed since then on 2018 and 2019 financial results. This process will continue through 2022, with a significant focus in 2021 on finalising the transition methodology and transition approaches for the Group. Actuarial modelling development, which is the most significant enablement requirement on the programme in addition to transition and data sourcing and system changes, commenced in 2018 and is progressing in line with planned milestones for 2021. The build of a robust financial data model, CSM calculation engine and results repository progressed according to plans during 2020 and the key focus in 2021 is to conclude the solution build and ensure successful user adoption across the Group. The new capability leverages the existing financial reporting landscape and provides a sustainable, long term IFRS 17 solution. The re-design of the draft annual financial statements, notes and disclosures was completed in 2020. Further refinement and testing will continue into 2021, as well as related build and enhancements to reporting and disclosure tools.
The further one year delay in the effective date has given us the opportunity to perform additional analysis on the financial impact of the transition to IFRS 17, as well as to extend the scope of parallel testing of data and reporting processes.
J: Future standards, amendments to standards and interpretations not early‑adopted in the 2020 financial statements
OMLACSA Separate and Consolidated Annual Financial Statements for the year ended 31 December 2020 OMLACSA Separate and Consolidated Annual Financial Statements for the year ended 31 December 2020120 121OMLACSA Separate and Consolidated Annual Financial Statements for the year ended 31 December 2020OMLACSA Separate and Consolidated Annual Financial Statements for the year ended 31 December 2020
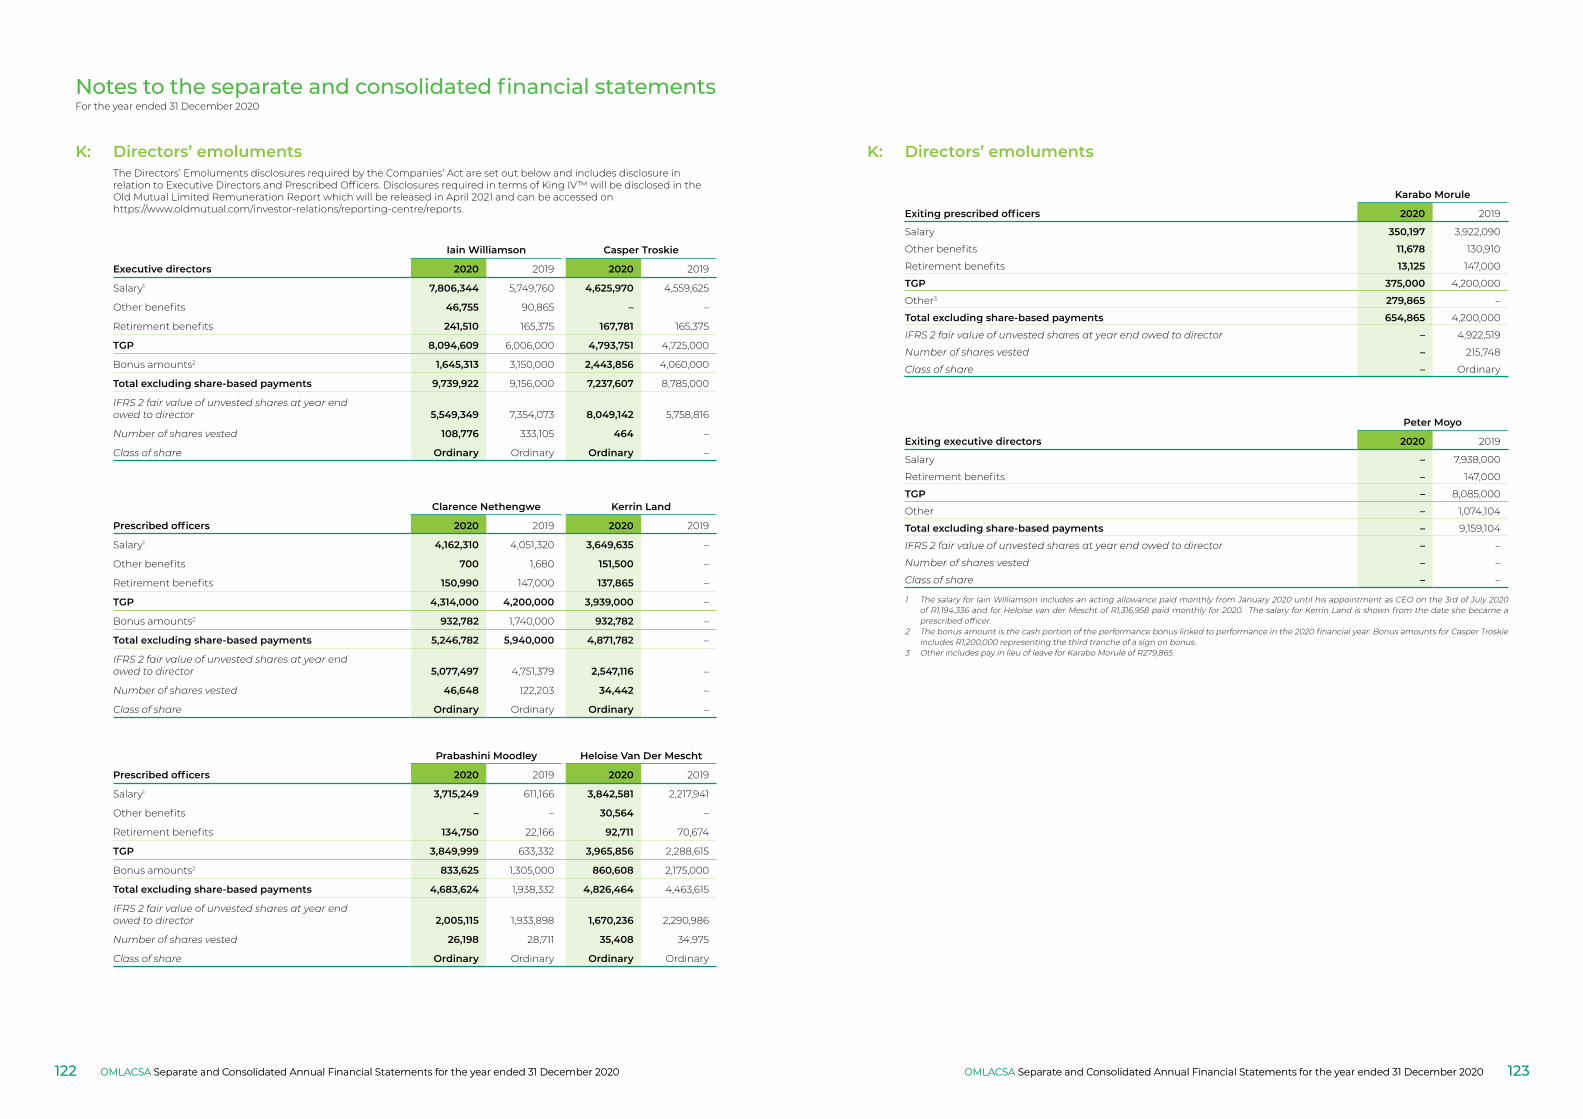
Notes to the separate and consolidated financial statementsFor the year ended 31 December 2020
K: Directors’ emolumentsThe Directors’ Emoluments disclosures required by the Companies’ Act are set out below and includes disclosure in relation to Executive Directors and Prescribed Officers. Disclosures required in terms of King IV™ will be disclosed in the Old Mutual Limited Remuneration Report which will be released in April 2021 and can be accessed on https://www.oldmutual.com/investor-relations/reporting-centre/reports.
Iain Williamson Casper Troskie
Executive directors 2020 2019 2020 2019
Salary1 7,806,344 5,749,760 4,625,970 4,559,625
Other benefits 46,755 90,865 – –
Retirement benefits 241,510 165,375 167,781 165,375
TGP 8,094,609 6,006,000 4,793,751 4,725,000
Bonus amounts2 1,645,313 3,150,000 2,443,856 4,060,000
Total excluding share‑based payments 9,739,922 9,156,000 7,237,607 8,785,000
IFRS 2 fair value of unvested shares at year end owed to director 5,549,349 7,354,073 8,049,142 5,758,816
Number of shares vested 108,776 333,105 464 –
Class of share Ordinary Ordinary Ordinary –
Clarence Nethengwe Kerrin Land
Prescribed officers 2020 2019 2020 2019
Salary1 4,162,310 4,051,320 3,649,635 –
Other benefits 700 1,680 151,500 –
Retirement benefits 150,990 147,000 137,865 –
TGP 4,314,000 4,200,000 3,939,000 –
Bonus amounts2 932,782 1,740,000 932,782 –
Total excluding share‑based payments 5,246,782 5,940,000 4,871,782 –
IFRS 2 fair value of unvested shares at year end owed to director 5,077,497 4,751,379 2,547,116 –
Number of shares vested 46,648 122,203 34,442 –
Class of share Ordinary Ordinary Ordinary –
Prabashini Moodley Heloise Van Der Mescht
Prescribed officers 2020 2019 2020 2019
Salary1 3,715,249 611,166 3,842,581 2,217,941
Other benefits – – 30,564 –
Retirement benefits 134,750 22,166 92,711 70,674
TGP 3,849,999 633,332 3,965,856 2,288,615
Bonus amounts2 833,625 1,305,000 860,608 2,175,000
Total excluding share‑based payments 4,683,624 1,938,332 4,826,464 4,463,615
IFRS 2 fair value of unvested shares at year end owed to director 2,005,115 1,933,898 1,670,236 2,290,986
Number of shares vested 26,198 28,711 35,408 34,975
Class of share Ordinary Ordinary Ordinary Ordinary
K: Directors’ emoluments
Karabo Morule
Exiting prescribed officers 2020 2019
Salary 350,197 3,922,090
Other benefits 11,678 130,910
Retirement benefits 13,125 147,000
TGP 375,000 4,200,000
Other3 279,865 –
Total excluding share‑based payments 654,865 4,200,000
IFRS 2 fair value of unvested shares at year end owed to director – 4,922,519
Number of shares vested – 215,748
Class of share – Ordinary
Peter Moyo
Exiting executive directors 2020 2019
Salary – 7,938,000
Retirement benefits – 147,000
TGP – 8,085,000
Other – 1,074,104
Total excluding share‑based payments – 9,159,104
IFRS 2 fair value of unvested shares at year end owed to director – –
Number of shares vested – –
Class of share – –
1 The salary for Iain Williamson includes an acting allowance paid monthly from January 2020 until his appointment as CEO on the 3rd of July 2020 of R1,194,336 and for Heloise van der Mescht of R1,316,958 paid monthly for 2020. The salary for Kerrin Land is shown from the date she became a prescribed officer.
2 The bonus amount is the cash portion of the performance bonus linked to performance in the 2020 financial year. Bonus amounts for Casper Troskie includes R1,200,000 representing the third tranche of a sign on bonus.
3 Other includes pay in lieu of leave for Karabo Morule of R279,865.
OMLACSA Separate and Consolidated Annual Financial Statements for the year ended 31 December 2020 OMLACSA Separate and Consolidated Annual Financial Statements for the year ended 31 December 2020122 123OMLACSA Separate and Consolidated Annual Financial Statements for the year ended 31 December 2020OMLACSA Separate and Consolidated Annual Financial Statements for the year ended 31 December 2020

Notes to the separate and consolidated financial statementsFor the year ended 31 December 2020
K: Directors’ emoluments Bonus share awards1
Share Units Value (Before Tax)
Award Date Vesting Date
IssuePrice(ZAR)
201920 Day
Year EndVWAP
(ZAR)
202020 Day
Year EndVWAP
(ZAR)
OpeningBalance
on1 Jan 2020
(Number)
Grantedduring
2020(Number)
Lapsedduring
2020(Number)
Settledduring
2020(Number)
ClosingBalance
on31 Dec 2020
(Number)
Value ofLapsedAwards
during 2020(ZAR)
Value ofSettledAwards
during 2020(ZAR)
Estimatedclosing fair
value on31 Dec 2020
(ZAR)
Iain Williamson
Long‑Term Incentive Plan2017 29 Mar 17 29 Mar 20 35,00 19,29 11,94 142,858 – 88,430 54,428 – 970,077 597,075 – 2018 19 Apr 18 19 Apr 21 41,34 19,29 11,94 108,854 – – – 108,854 – – 422,500 2019 Tranche 1 20 Mar 19 20 Mar 22 21,75 19,29 11,94 72,414 – – – 72,414 – – – 2019 Tranche 2 20 Mar 19 20 Mar 23 21,75 19,29 11,94 72,414 – – – 72,414 – – – 2019 Tranche 3 20 Mar 19 20 Mar 24 21,75 19,29 11,94 72,414 – – – 72,414 – – – 2020 Tranche 1 26 Mar 20 26 Mar 23 11,95 19,29 11,94 – 254,882 – – 254,882 – – – 2020 Tranche 2 26 Mar 20 26 Mar 24 11,95 19,29 11,94 – 254,882 – – 254,882 – – – 2020 Tranche 3 26 Mar 20 26 Mar 25 11,95 19,29 11,94 – 254,881 – – 254,881 – – – Deferred Short‑Term Incentive2017 29 Mar 17 29 Mar 20 35,00 19,29 11,94 53,884 – – 53,884 – – 591,107 – 2018 19 Apr 18 19 Apr 21 41,34 19,29 11,94 46,558 – – – 46,558 – – 556,024
2019 20 Mar 19 20 Mar 22 21,75 19,29 11,94 62,667 – – – 62,667 – – 748,407 2020 26 Mar 20 26 Mar 23 11,95 19,29 11,94 – 175 ,733 – – 175,733 – – 2 098,710 Broad‑Based Employee Share Plan
2018 18 Sep 18 18 Sep 20 29,80 19,29 11,94 336 – – 336 – – 3,384 – 2018 Special Award 14 Dec 18 18 Sep 20 22,00 19,29 11,94 128 – – 128 – – 1,289 – Total 632,527 940,378 88,430 108,776 1,375,699 970,077 1,192,855 3,825,641
Casper TroskieLong‑Term Incentive Plan2018 Tranche 1 18 Sep 18 18 Sep 21 29,80 19,29 11,94 100,671 – – – 100,671 – – 390,739 2018 Tranche 2 18 Sep 18 18 Sep 22 29,80 19,29 11,94 100,671 – – – 100,671 – – 390,739 2018 Tranche 3 18 Sep 18 18 Sep 23 29,80 19,29 11,94 100,672 – – – 100,672 – – 390,743 2018 Special Grant Tranche 1 14 Dec 18 18 Sep 21 22,00 19,29 11,94 38,196 – – – 38,196 – – 148,252 2018 Special Grant Tranche 2 14 Dec 18 18 Sep 22 22,00 19,29 11,94 38,196 – – – 38,196 – – 148,252 2018 Special Grant Tranche 3 14 Dec 18 18 Sep 23 22,00 19,29 11,94 38,197 – – – 38,197 – – 148,256 2019 Tranche 1 20 Mar 19 20 Mar 22 21,75 19,29 11,94 79,655 – – – 79,655 – – – 2019 Tranche 2 20 Mar 19 20 Mar 23 21,75 19,29 11,94 79,655 – – – 79,655 – – – 2019 Tranche 3 20 Mar 19 20 Mar 24 21,75 19,29 11,94 79,656 – – – 79,656 – – – 2020 Tranche 1 26 Mar 20 26 Mar 23 11,95 19,29 11,94 – 104,603 – – 104,603 – – – 2020 Tranche 2 26 Mar 20 26 Mar 24 11,95 19,29 11,94 – 104,603 – – 104,603 – – – 2020 Tranche 3 26 Mar 20 26 Mar 25 11,95 19,29 11,94 – 104,602 – – 104,602 – – – Deferred Short‑Term Incentive2019 20 Mar 19 20 Mar 22 21,75 19,29 11,94 80,247 – – – 80,247 – – 958,358 2020 26 Mar 20 26 Mar 23 11,95 19,29 11,94 – 137,239 – – 137,239 – – 1,638,992 Broad‑Based Employee Share Plan2018 18 Sep 18 18 Sep 20 29,80 19,29 11,94 336 – – 336 – – 3,384 – 2018 Special Award 14 Dec 18 18 Sep 20 22,00 19,29 11,94 128 – – 128 – – 1,289 – Buy out Award2018 18 Sep 18 18 Sep 21 29,80 19,29 11,94 83,893 – – – 83,893 – – 1,001,901 2018 Special Grant 14 Dec 18 18 Sep 21 22,00 19,29 11,94 31,831 – – – 31,831 – – 380,145 Total 852,004 451,047 – 464 1,302,587 – 4,673 5,596,377
1 Long term incentive plan estimated closing fair values on 30 December 2020 are shown based on estimated vesting values.
OMLACSA Separate and Consolidated Annual Financial Statements for the year ended 31 December 2020 OMLACSA Separate and Consolidated Annual Financial Statements for the year ended 31 December 2020124 125OMLACSA Separate and Consolidated Annual Financial Statements for the year ended 31 December 2020OMLACSA Separate and Consolidated Annual Financial Statements for the year ended 31 December 2020
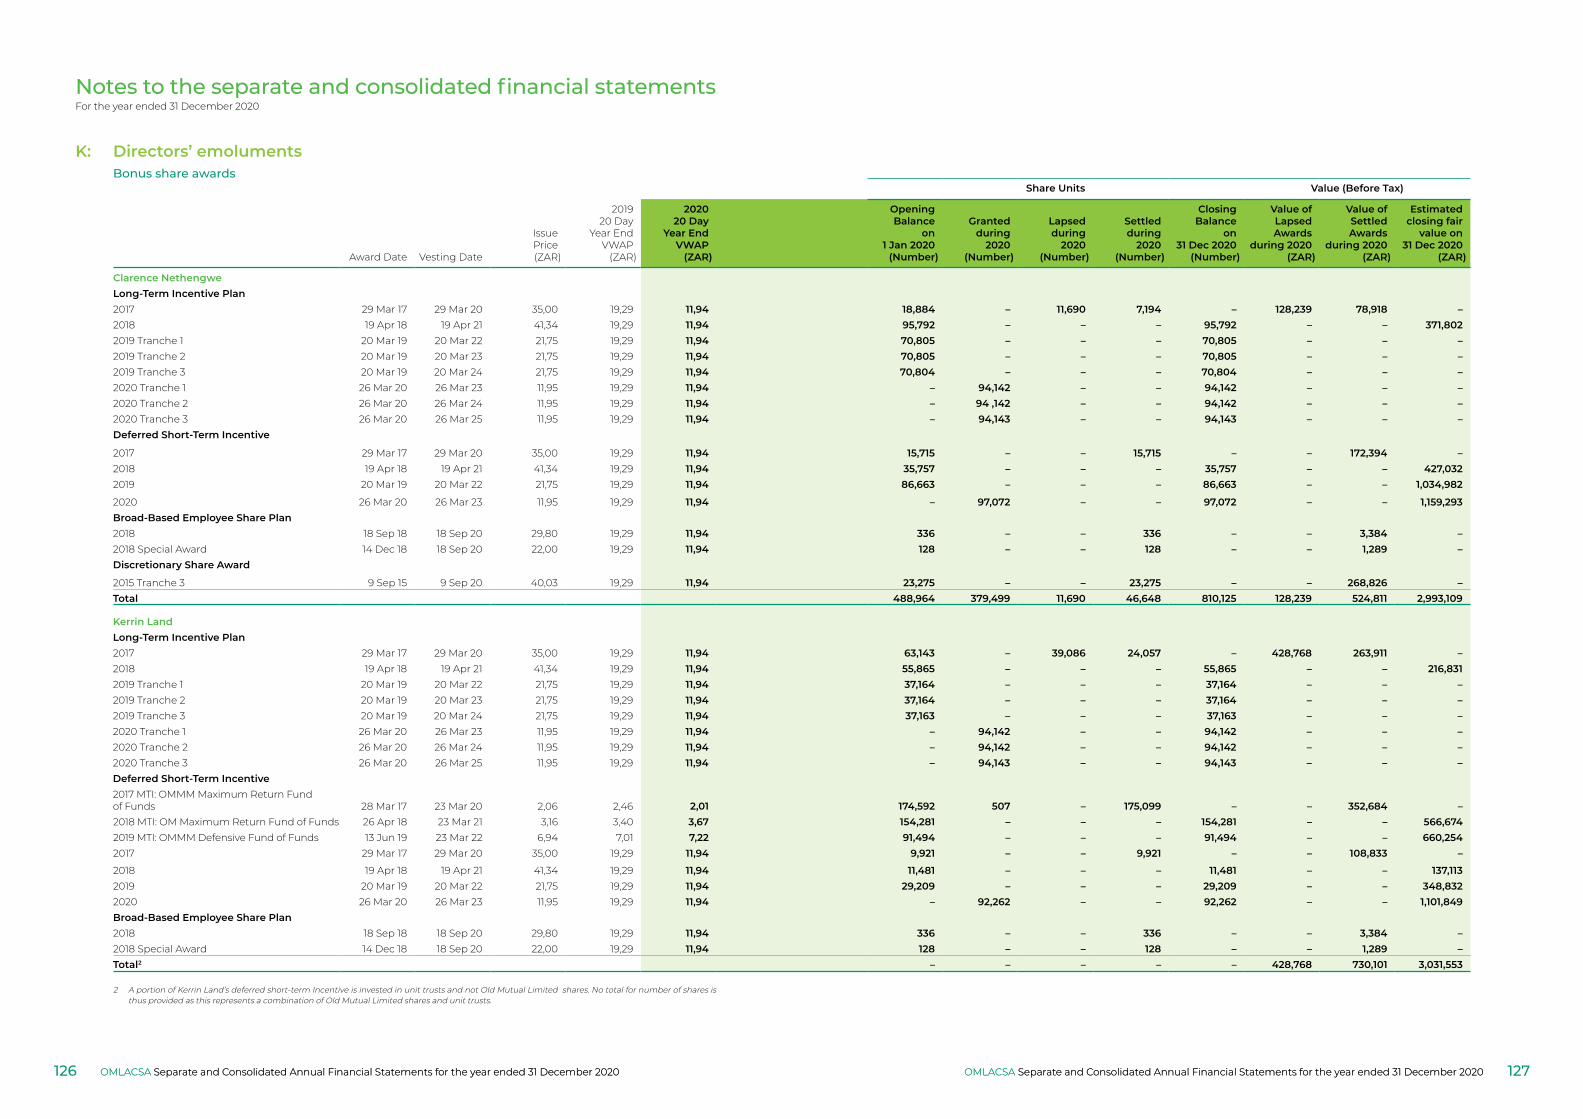
Notes to the separate and consolidated financial statementsFor the year ended 31 December 2020
K: Directors’ emoluments Bonus share awards
Share Units Value (Before Tax)
Award Date Vesting Date
IssuePrice(ZAR)
201920 Day
Year EndVWAP
(ZAR)
202020 Day
Year EndVWAP
(ZAR)
OpeningBalance
on1 Jan 2020
(Number)
Grantedduring
2020(Number)
Lapsedduring
2020(Number)
Settledduring
2020(Number)
ClosingBalance
on31 Dec 2020
(Number)
Value ofLapsedAwards
during 2020(ZAR)
Value ofSettledAwards
during 2020(ZAR)
Estimatedclosing fair
value on31 Dec 2020
(ZAR)
Clarence NethengweLong‑Term Incentive Plan2017 29 Mar 17 29 Mar 20 35,00 19,29 11,94 18,884 – 11,690 7,194 – 128,239 78,918 –2018 19 Apr 18 19 Apr 21 41,34 19,29 11,94 95,792 – – – 95,792 – – 371,802 2019 Tranche 1 20 Mar 19 20 Mar 22 21,75 19,29 11,94 70,805 – – – 70,805 – – –2019 Tranche 2 20 Mar 19 20 Mar 23 21,75 19,29 11,94 70,805 – – – 70,805 – – –2019 Tranche 3 20 Mar 19 20 Mar 24 21,75 19,29 11,94 70,804 – – – 70,804 – – –2020 Tranche 1 26 Mar 20 26 Mar 23 11,95 19,29 11,94 – 94,142 – – 94,142 – – –2020 Tranche 2 26 Mar 20 26 Mar 24 11,95 19,29 11,94 – 94 ,142 – – 94,142 – – –2020 Tranche 3 26 Mar 20 26 Mar 25 11,95 19,29 11,94 – 94,143 – – 94,143 – – –Deferred Short‑Term Incentive
2017 29 Mar 17 29 Mar 20 35,00 19,29 11,94 15,715 – – 15,715 – – 172,394 –2018 19 Apr 18 19 Apr 21 41,34 19,29 11,94 35,757 – – – 35,757 – – 427,032 2019 20 Mar 19 20 Mar 22 21,75 19,29 11,94 86,663 – – – 86,663 – – 1,034,982
2020 26 Mar 20 26 Mar 23 11,95 19,29 11,94 – 97,072 – – 97,072 – – 1,159,293 Broad‑Based Employee Share Plan2018 18 Sep 18 18 Sep 20 29,80 19,29 11,94 336 – – 336 – – 3,384 –2018 Special Award 14 Dec 18 18 Sep 20 22,00 19,29 11,94 128 – – 128 – – 1,289 –Discretionary Share Award
2015 Tranche 3 9 Sep 15 9 Sep 20 40,03 19,29 11,94 23,275 – – 23,275 – – 268,826 –Total 488,964 379,499 11,690 46,648 810,125 128,239 524,811 2,993,109
Kerrin LandLong‑Term Incentive Plan2017 29 Mar 17 29 Mar 20 35,00 19,29 11,94 63,143 – 39,086 24,057 – 428,768 263,911 –2018 19 Apr 18 19 Apr 21 41,34 19,29 11,94 55,865 – – – 55,865 – – 216,831 2019 Tranche 1 20 Mar 19 20 Mar 22 21,75 19,29 11,94 37,164 – – – 37,164 – – –2019 Tranche 2 20 Mar 19 20 Mar 23 21,75 19,29 11,94 37,164 – – – 37,164 – – –2019 Tranche 3 20 Mar 19 20 Mar 24 21,75 19,29 11,94 37,163 – – – 37,163 – – –2020 Tranche 1 26 Mar 20 26 Mar 23 11,95 19,29 11,94 – 94,142 – – 94,142 – – –2020 Tranche 2 26 Mar 20 26 Mar 24 11,95 19,29 11,94 – 94,142 – – 94,142 – – –2020 Tranche 3 26 Mar 20 26 Mar 25 11,95 19,29 11,94 – 94,143 – – 94,143 – – –Deferred Short‑Term Incentive2017 MTI: OMMM Maximum Return Fund of Funds 28 Mar 17 23 Mar 20 2,06 2,46 2,01 174,592 507 – 175,099 – – 352,684 –2018 MTI: OM Maximum Return Fund of Funds 26 Apr 18 23 Mar 21 3,16 3,40 3,67 154,281 – – – 154,281 – – 566,674 2019 MTI: OMMM Defensive Fund of Funds 13 Jun 19 23 Mar 22 6,94 7,01 7,22 91,494 – – – 91,494 – – 660,254 2017 29 Mar 17 29 Mar 20 35,00 19,29 11,94 9,921 – – 9,921 – – 108,833 –
2018 19 Apr 18 19 Apr 21 41,34 19,29 11,94 11,481 – – – 11,481 – – 137,113 2019 20 Mar 19 20 Mar 22 21,75 19,29 11,94 29,209 – – – 29,209 – – 348,832 2020 26 Mar 20 26 Mar 23 11,95 19,29 11,94 – 92,262 – – 92,262 – – 1,101,849 Broad‑Based Employee Share Plan2018 18 Sep 18 18 Sep 20 29,80 19,29 11,94 336 – – 336 – – 3,384 –2018 Special Award 14 Dec 18 18 Sep 20 22,00 19,29 11,94 128 – – 128 – – 1,289 –Total2 – – – – – 428,768 730,101 3,031,553
2 A portion of Kerrin Land’s deferred short-term Incentive is invested in unit trusts and not Old Mutual Limited shares. No total for number of shares is thus provided as this represents a combination of Old Mutual Limited shares and unit trusts.
OMLACSA Separate and Consolidated Annual Financial Statements for the year ended 31 December 2020 OMLACSA Separate and Consolidated Annual Financial Statements for the year ended 31 December 2020126 127OMLACSA Separate and Consolidated Annual Financial Statements for the year ended 31 December 2020OMLACSA Separate and Consolidated Annual Financial Statements for the year ended 31 December 2020
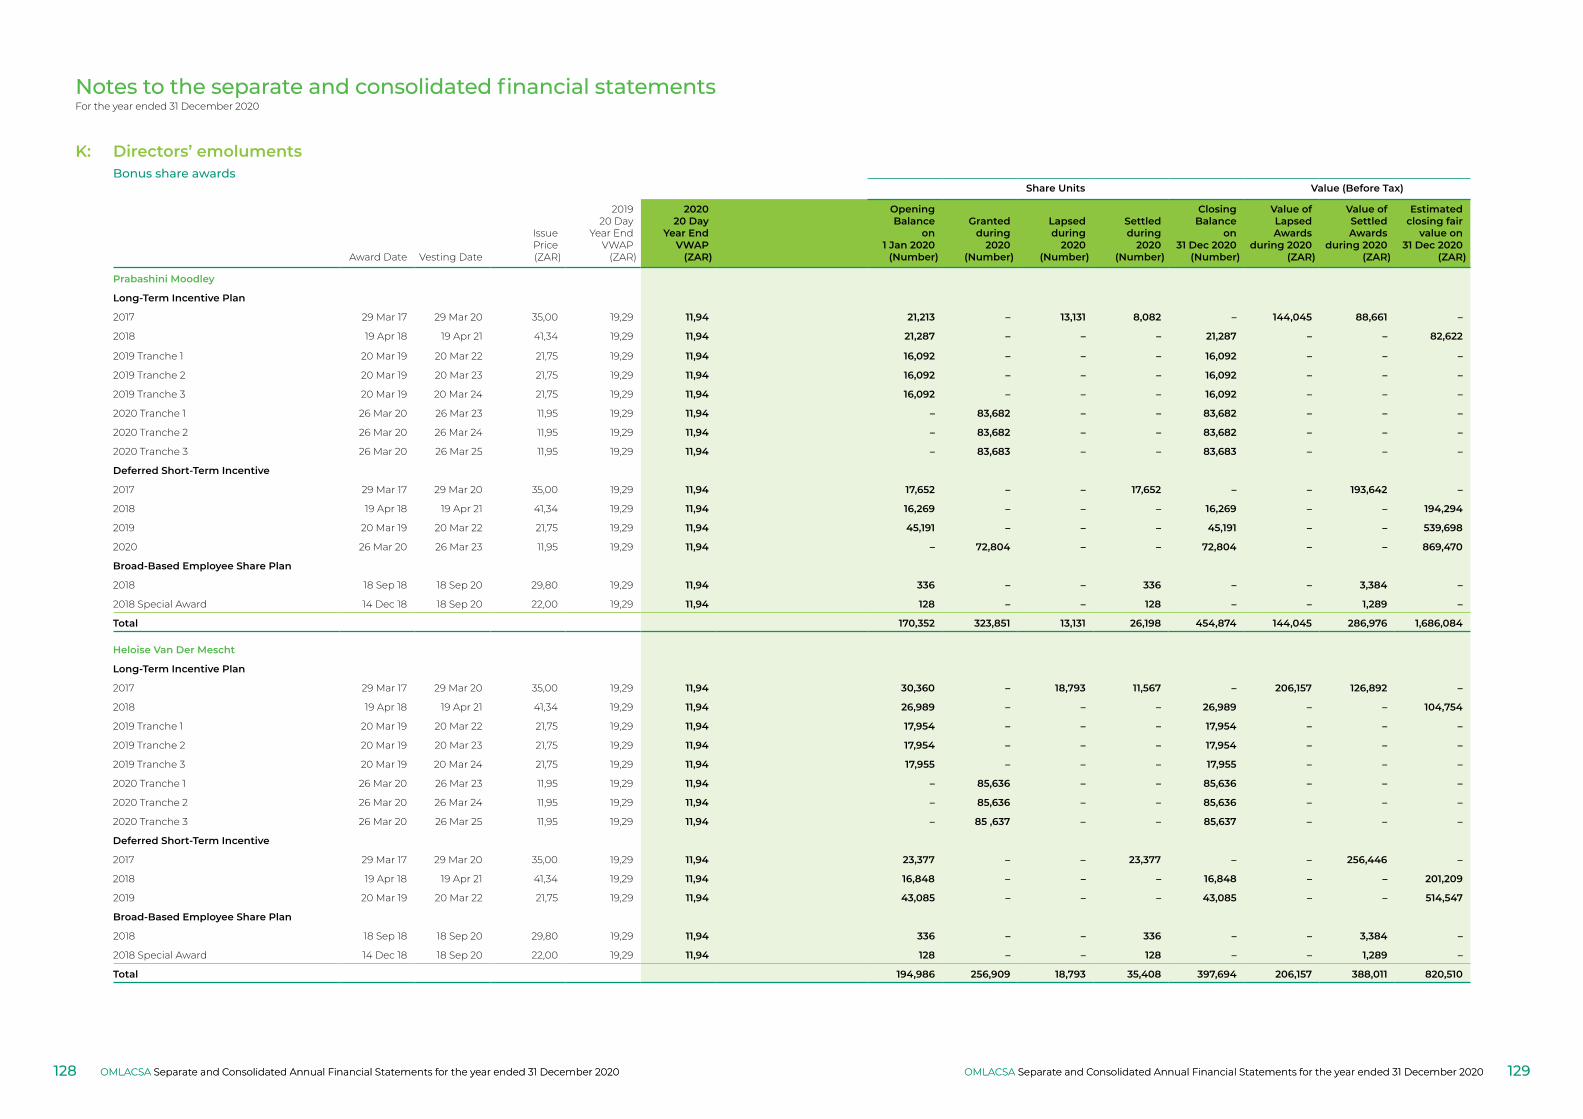
Notes to the separate and consolidated financial statementsFor the year ended 31 December 2020
Share Units Value (Before Tax)
Award Date Vesting Date
IssuePrice(ZAR)
201920 Day
Year EndVWAP
(ZAR)
202020 Day
Year EndVWAP
(ZAR)
OpeningBalance
on1 Jan 2020
(Number)
Grantedduring
2020(Number)
Lapsedduring
2020(Number)
Settledduring
2020(Number)
ClosingBalance
on31 Dec 2020
(Number)
Value ofLapsedAwards
during 2020(ZAR)
Value ofSettledAwards
during 2020(ZAR)
Estimatedclosing fair
value on31 Dec 2020
(ZAR)
Prabashini Moodley
Long‑Term Incentive Plan
2017 29 Mar 17 29 Mar 20 35,00 19,29 11,94 21,213 – 13,131 8,082 – 144,045 88,661 –
2018 19 Apr 18 19 Apr 21 41,34 19,29 11,94 21,287 – – – 21,287 – – 82,622
2019 Tranche 1 20 Mar 19 20 Mar 22 21,75 19,29 11,94 16,092 – – – 16,092 – – –
2019 Tranche 2 20 Mar 19 20 Mar 23 21,75 19,29 11,94 16,092 – – – 16,092 – – –
2019 Tranche 3 20 Mar 19 20 Mar 24 21,75 19,29 11,94 16,092 – – – 16,092 – – –
2020 Tranche 1 26 Mar 20 26 Mar 23 11,95 19,29 11,94 – 83,682 – – 83,682 – – –
2020 Tranche 2 26 Mar 20 26 Mar 24 11,95 19,29 11,94 – 83,682 – – 83,682 – – –
2020 Tranche 3 26 Mar 20 26 Mar 25 11,95 19,29 11,94 – 83,683 – – 83,683 – – –
Deferred Short‑Term Incentive
2017 29 Mar 17 29 Mar 20 35,00 19,29 11,94 17,652 – – 17,652 – – 193,642 –
2018 19 Apr 18 19 Apr 21 41,34 19,29 11,94 16,269 – – – 16,269 – – 194,294
2019 20 Mar 19 20 Mar 22 21,75 19,29 11,94 45,191 – – – 45,191 – – 539,698
2020 26 Mar 20 26 Mar 23 11,95 19,29 11,94 – 72,804 – – 72,804 – – 869,470
Broad‑Based Employee Share Plan
2018 18 Sep 18 18 Sep 20 29,80 19,29 11,94 336 – – 336 – – 3,384 –
2018 Special Award 14 Dec 18 18 Sep 20 22,00 19,29 11,94 128 – – 128 – – 1,289 –
Total 170,352 323,851 13,131 26,198 454,874 144,045 286,976 1,686,084
Heloise Van Der Mescht
Long‑Term Incentive Plan
2017 29 Mar 17 29 Mar 20 35,00 19,29 11,94 30,360 – 18,793 11,567 – 206,157 126,892 –
2018 19 Apr 18 19 Apr 21 41,34 19,29 11,94 26,989 – – – 26,989 – – 104,754
2019 Tranche 1 20 Mar 19 20 Mar 22 21,75 19,29 11,94 17,954 – – – 17,954 – – –
2019 Tranche 2 20 Mar 19 20 Mar 23 21,75 19,29 11,94 17,954 – – – 17,954 – – –
2019 Tranche 3 20 Mar 19 20 Mar 24 21,75 19,29 11,94 17,955 – – – 17,955 – – –
2020 Tranche 1 26 Mar 20 26 Mar 23 11,95 19,29 11,94 – 85,636 – – 85,636 – – –
2020 Tranche 2 26 Mar 20 26 Mar 24 11,95 19,29 11,94 – 85,636 – – 85,636 – – –
2020 Tranche 3 26 Mar 20 26 Mar 25 11,95 19,29 11,94 – 85 ,637 – – 85,637 – – –
Deferred Short‑Term Incentive
2017 29 Mar 17 29 Mar 20 35,00 19,29 11,94 23,377 – – 23,377 – – 256,446 –
2018 19 Apr 18 19 Apr 21 41,34 19,29 11,94 16,848 – – – 16,848 – – 201,209
2019 20 Mar 19 20 Mar 22 21,75 19,29 11,94 43,085 – – – 43,085 – – 514,547
Broad‑Based Employee Share Plan
2018 18 Sep 18 18 Sep 20 29,80 19,29 11,94 336 – – 336 – – 3,384 –
2018 Special Award 14 Dec 18 18 Sep 20 22,00 19,29 11,94 128 – – 128 – – 1,289 –
Total 194,986 256,909 18,793 35,408 397,694 206,157 388,011 820,510
K: Directors’ emoluments Bonus share awards
OMLACSA Separate and Consolidated Annual Financial Statements for the year ended 31 December 2020 OMLACSA Separate and Consolidated Annual Financial Statements for the year ended 31 December 2020128 129OMLACSA Separate and Consolidated Annual Financial Statements for the year ended 31 December 2020OMLACSA Separate and Consolidated Annual Financial Statements for the year ended 31 December 2020
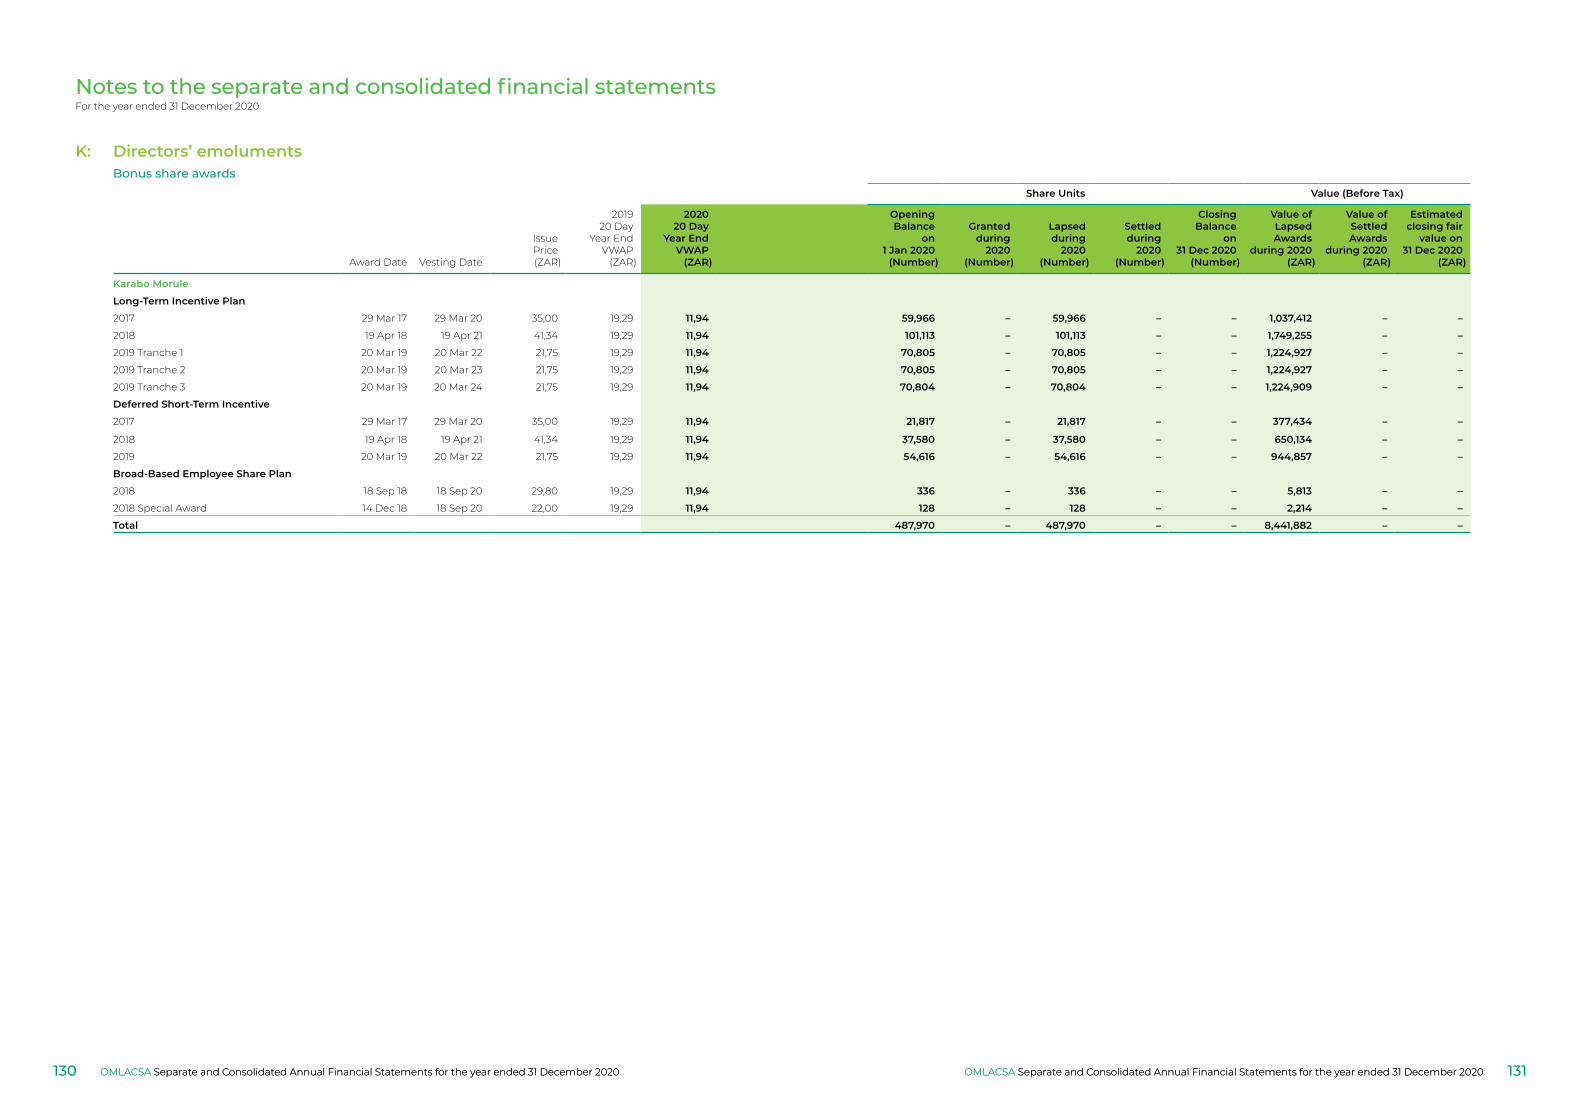
Notes to the separate and consolidated financial statementsFor the year ended 31 December 2020
K: Directors’ emoluments Bonus share awards
Share Units Value (Before Tax)
Award Date Vesting Date
IssuePrice(ZAR)
201920 Day
Year EndVWAP
(ZAR)
202020 Day
Year EndVWAP
(ZAR)
OpeningBalance
on1 Jan 2020
(Number)
Grantedduring
2020(Number)
Lapsedduring
2020(Number)
Settledduring
2020(Number)
ClosingBalance
on31 Dec 2020
(Number)
Value ofLapsedAwards
during 2020(ZAR)
Value ofSettledAwards
during 2020(ZAR)
Estimatedclosing fair
value on31 Dec 2020
(ZAR)
Karabo Morule
Long‑Term Incentive Plan
2017 29 Mar 17 29 Mar 20 35,00 19,29 11,94 59,966 – 59,966 – – 1,037,412 – –
2018 19 Apr 18 19 Apr 21 41,34 19,29 11,94 101,113 – 101,113 – – 1,749,255 – –
2019 Tranche 1 20 Mar 19 20 Mar 22 21,75 19,29 11,94 70,805 – 70,805 – – 1,224,927 – –
2019 Tranche 2 20 Mar 19 20 Mar 23 21,75 19,29 11,94 70,805 – 70,805 – – 1,224,927 – –
2019 Tranche 3 20 Mar 19 20 Mar 24 21,75 19,29 11,94 70,804 – 70,804 – – 1,224,909 – –
Deferred Short‑Term Incentive
2017 29 Mar 17 29 Mar 20 35,00 19,29 11,94 21,817 – 21,817 – – 377,434 – –
2018 19 Apr 18 19 Apr 21 41,34 19,29 11,94 37,580 – 37,580 – – 650,134 – –
2019 20 Mar 19 20 Mar 22 21,75 19,29 11,94 54,616 – 54,616 – – 944,857 – –
Broad‑Based Employee Share Plan
2018 18 Sep 18 18 Sep 20 29,80 19,29 11,94 336 – 336 – – 5,813 – –
2018 Special Award 14 Dec 18 18 Sep 20 22,00 19,29 11,94 128 – 128 – – 2,214 – –
Total 487,970 – 487,970 – – 8,441,882 – –
OMLACSA Separate and Consolidated Annual Financial Statements for the year ended 31 December 2020 OMLACSA Separate and Consolidated Annual Financial Statements for the year ended 31 December 2020130 131OMLACSA Separate and Consolidated Annual Financial Statements for the year ended 31 December 2020OMLACSA Separate and Consolidated Annual Financial Statements for the year ended 31 December 2020
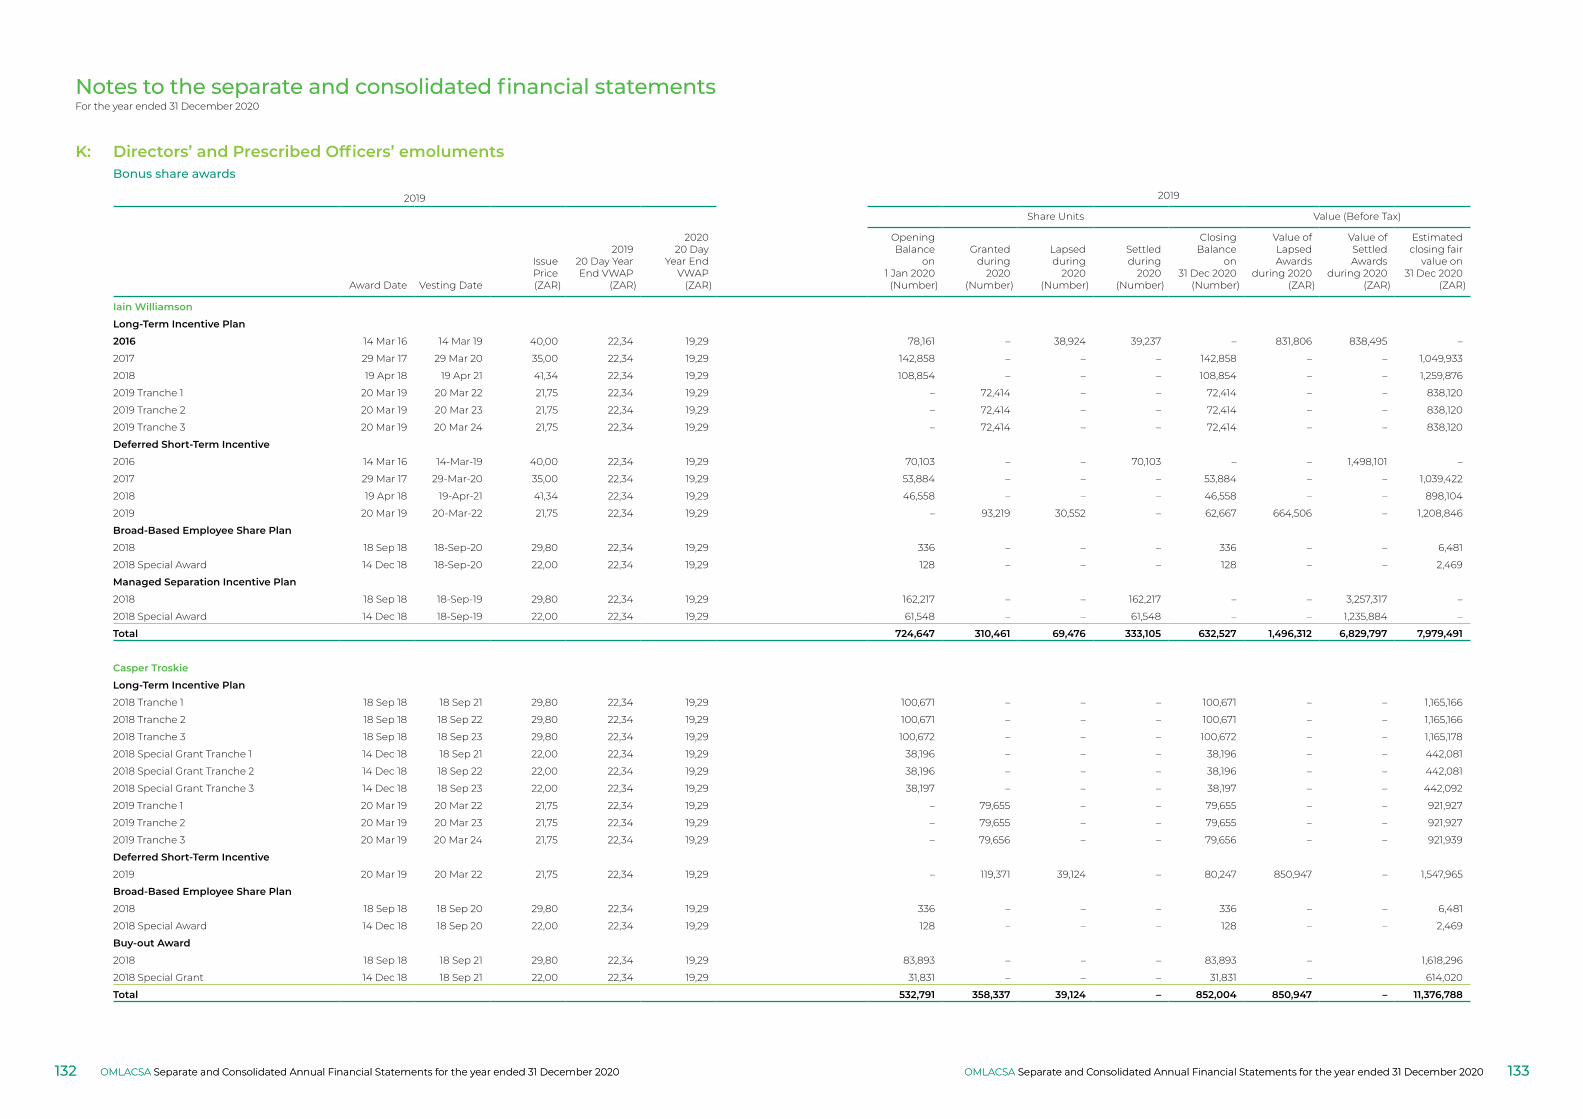
Notes to the separate and consolidated financial statementsFor the year ended 31 December 2020
K: Directors’ and Prescribed Officers’ emoluments Bonus share awards
2019 2019
Share Units Value (Before Tax)
Award Date Vesting Date
IssuePrice(ZAR)
201920 Day YearEnd VWAP
(ZAR)
202020 Day
Year EndVWAP
(ZAR)
OpeningBalance
on1 Jan 2020
(Number)
Grantedduring
2020(Number)
Lapsedduring
2020(Number)
Settledduring
2020(Number)
ClosingBalance
on31 Dec 2020
(Number)
Value ofLapsedAwards
during 2020(ZAR)
Value ofSettledAwards
during 2020(ZAR)
Estimatedclosing fair
value on31 Dec 2020
(ZAR)
Iain Williamson
Long‑Term Incentive Plan
2016 14 Mar 16 14 Mar 19 40,00 22,34 19,29 78,161 – 38,924 39,237 – 831,806 838,495 –
2017 29 Mar 17 29 Mar 20 35,00 22,34 19,29 142,858 – – – 142,858 – – 1,049,933
2018 19 Apr 18 19 Apr 21 41,34 22,34 19,29 108,854 – – – 108,854 – – 1,259,876
2019 Tranche 1 20 Mar 19 20 Mar 22 21,75 22,34 19,29 – 72,414 – – 72,414 – – 838,120
2019 Tranche 2 20 Mar 19 20 Mar 23 21,75 22,34 19,29 – 72,414 – – 72,414 – – 838,120
2019 Tranche 3 20 Mar 19 20 Mar 24 21,75 22,34 19,29 – 72,414 – – 72,414 – – 838,120
Deferred Short‑Term Incentive
2016 14 Mar 16 14-Mar-19 40,00 22,34 19,29 70,103 – – 70,103 – – 1,498,101 –
2017 29 Mar 17 29-Mar-20 35,00 22,34 19,29 53,884 – – – 53,884 – – 1,039,422
2018 19 Apr 18 19-Apr-21 41,34 22,34 19,29 46,558 – – – 46,558 – – 898,104
2019 20 Mar 19 20-Mar-22 21,75 22,34 19,29 – 93,219 30,552 – 62,667 664,506 – 1,208,846
Broad‑Based Employee Share Plan
2018 18 Sep 18 18-Sep-20 29,80 22,34 19,29 336 – – – 336 – – 6,481
2018 Special Award 14 Dec 18 18-Sep-20 22,00 22,34 19,29 128 – – – 128 – – 2,469
Managed Separation Incentive Plan
2018 18 Sep 18 18-Sep-19 29,80 22,34 19,29 162,217 – – 162,217 – – 3,257,317 –
2018 Special Award 14 Dec 18 18-Sep-19 22,00 22,34 19,29 61,548 – – 61,548 – – 1,235,884 –
Total 724,647 310,461 69,476 333,105 632,527 1,496,312 6,829,797 7,979,491
Casper Troskie
Long‑Term Incentive Plan
2018 Tranche 1 18 Sep 18 18 Sep 21 29,80 22,34 19,29 100,671 – – – 100,671 – – 1,165,166
2018 Tranche 2 18 Sep 18 18 Sep 22 29,80 22,34 19,29 100,671 – – – 100,671 – – 1,165,166
2018 Tranche 3 18 Sep 18 18 Sep 23 29,80 22,34 19,29 100,672 – – – 100,672 – – 1,165,178
2018 Special Grant Tranche 1 14 Dec 18 18 Sep 21 22,00 22,34 19,29 38,196 – – – 38,196 – – 442,081
2018 Special Grant Tranche 2 14 Dec 18 18 Sep 22 22,00 22,34 19,29 38,196 – – – 38,196 – – 442,081
2018 Special Grant Tranche 3 14 Dec 18 18 Sep 23 22,00 22,34 19,29 38,197 – – – 38,197 – – 442,092
2019 Tranche 1 20 Mar 19 20 Mar 22 21,75 22,34 19,29 – 79,655 – – 79,655 – – 921,927
2019 Tranche 2 20 Mar 19 20 Mar 23 21,75 22,34 19,29 – 79,655 – – 79,655 – – 921,927
2019 Tranche 3 20 Mar 19 20 Mar 24 21,75 22,34 19,29 – 79,656 – – 79,656 – – 921,939
Deferred Short‑Term Incentive
2019 20 Mar 19 20 Mar 22 21,75 22,34 19,29 – 119,371 39,124 – 80,247 850,947 – 1,547,965
Broad‑Based Employee Share Plan
2018 18 Sep 18 18 Sep 20 29,80 22,34 19,29 336 – – – 336 – – 6,481
2018 Special Award 14 Dec 18 18 Sep 20 22,00 22,34 19,29 128 – – – 128 – – 2,469
Buy‑out Award
2018 18 Sep 18 18 Sep 21 29,80 22,34 19,29 83,893 – – – 83,893 – 1,618,296
2018 Special Grant 14 Dec 18 18 Sep 21 22,00 22,34 19,29 31,831 – – – 31,831 – 614,020
Total 532,791 358,337 39,124 – 852,004 850,947 – 11,376,788
OMLACSA Separate and Consolidated Annual Financial Statements for the year ended 31 December 2020 OMLACSA Separate and Consolidated Annual Financial Statements for the year ended 31 December 2020132 133OMLACSA Separate and Consolidated Annual Financial Statements for the year ended 31 December 2020OMLACSA Separate and Consolidated Annual Financial Statements for the year ended 31 December 2020
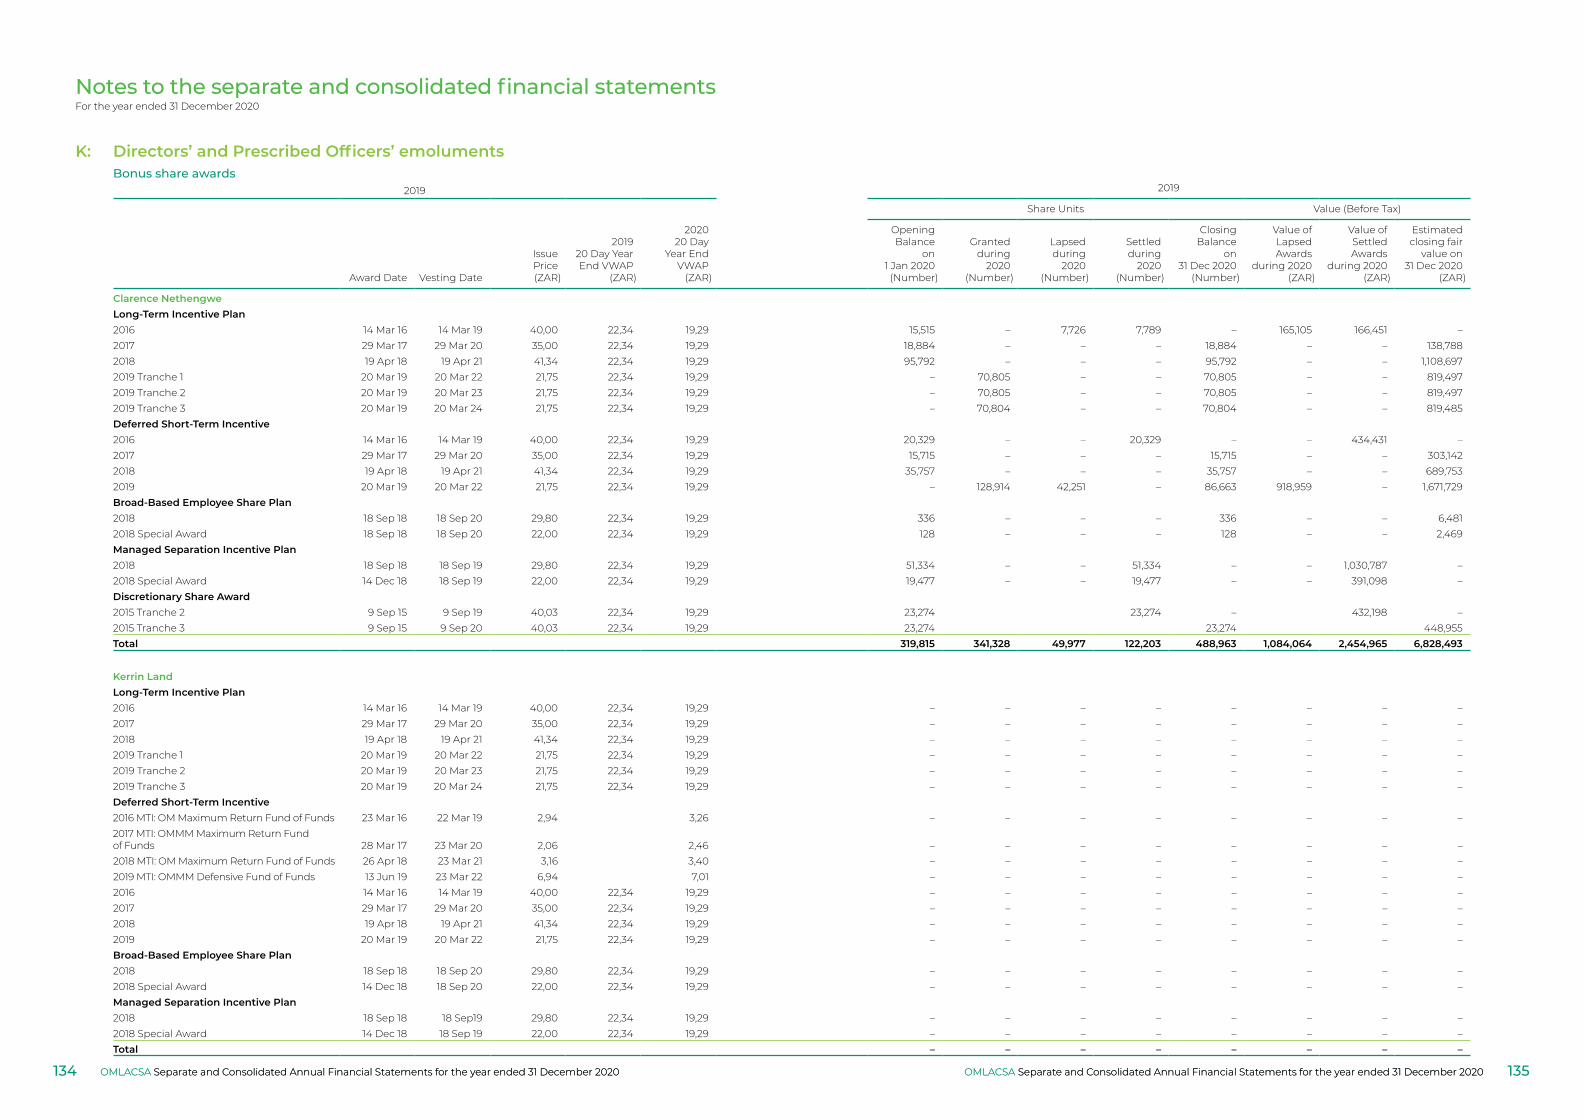
Notes to the separate and consolidated financial statementsFor the year ended 31 December 2020
2019 2019
Share Units Value (Before Tax)
Award Date Vesting Date
IssuePrice(ZAR)
201920 Day YearEnd VWAP
(ZAR)
202020 Day
Year EndVWAP
(ZAR)
OpeningBalance
on1 Jan 2020
(Number)
Grantedduring
2020(Number)
Lapsedduring
2020(Number)
Settledduring
2020(Number)
ClosingBalance
on31 Dec 2020
(Number)
Value ofLapsedAwards
during 2020(ZAR)
Value ofSettledAwards
during 2020(ZAR)
Estimatedclosing fair
value on31 Dec 2020
(ZAR)
Clarence NethengweLong‑Term Incentive Plan2016 14 Mar 16 14 Mar 19 40,00 22,34 19,29 15,515 – 7,726 7,789 – 165,105 166,451 –2017 29 Mar 17 29 Mar 20 35,00 22,34 19,29 18,884 – – – 18,884 – – 138,7882018 19 Apr 18 19 Apr 21 41,34 22,34 19,29 95,792 – – – 95,792 – – 1,108,6972019 Tranche 1 20 Mar 19 20 Mar 22 21,75 22,34 19,29 – 70,805 – – 70,805 – – 819,4972019 Tranche 2 20 Mar 19 20 Mar 23 21,75 22,34 19,29 – 70,805 – – 70,805 – – 819,4972019 Tranche 3 20 Mar 19 20 Mar 24 21,75 22,34 19,29 – 70,804 – – 70,804 – – 819,485Deferred Short‑Term Incentive2016 14 Mar 16 14 Mar 19 40,00 22,34 19,29 20,329 – – 20,329 – – 434,431 –2017 29 Mar 17 29 Mar 20 35,00 22,34 19,29 15,715 – – – 15,715 – – 303,1422018 19 Apr 18 19 Apr 21 41,34 22,34 19,29 35,757 – – – 35,757 – – 689,7532019 20 Mar 19 20 Mar 22 21,75 22,34 19,29 – 128,914 42,251 – 86,663 918,959 – 1,671,729Broad‑Based Employee Share Plan2018 18 Sep 18 18 Sep 20 29,80 22,34 19,29 336 – – – 336 – – 6,4812018 Special Award 18 Sep 18 18 Sep 20 22,00 22,34 19,29 128 – – – 128 – – 2,469Managed Separation Incentive Plan2018 18 Sep 18 18 Sep 19 29,80 22,34 19,29 51,334 – – 51,334 – – 1,030,787 –2018 Special Award 14 Dec 18 18 Sep 19 22,00 22,34 19,29 19,477 – – 19,477 – – 391,098 –Discretionary Share Award2015 Tranche 2 9 Sep 15 9 Sep 19 40,03 22,34 19,29 23,274 23,274 – 432,198 –2015 Tranche 3 9 Sep 15 9 Sep 20 40,03 22,34 19,29 23,274 23,274 448,955Total 319,815 341,328 49,977 122,203 488,963 1,084,064 2,454,965 6,828,493
Kerrin LandLong‑Term Incentive Plan2016 14 Mar 16 14 Mar 19 40,00 22,34 19,29 – – – – – – – –2017 29 Mar 17 29 Mar 20 35,00 22,34 19,29 – – – – – – – –2018 19 Apr 18 19 Apr 21 41,34 22,34 19,29 – – – – – – – –2019 Tranche 1 20 Mar 19 20 Mar 22 21,75 22,34 19,29 – – – – – – – –2019 Tranche 2 20 Mar 19 20 Mar 23 21,75 22,34 19,29 – – – – – – – –2019 Tranche 3 20 Mar 19 20 Mar 24 21,75 22,34 19,29 – – – – – – – –Deferred Short‑Term Incentive2016 MTI: OM Maximum Return Fund of Funds 23 Mar 16 22 Mar 19 2,94 3,26 – – – – – – – –2017 MTI: OMMM Maximum Return Fund of Funds 28 Mar 17 23 Mar 20 2,06 2,46 – – – – – – – –2018 MTI: OM Maximum Return Fund of Funds 26 Apr 18 23 Mar 21 3,16 3,40 – – – – – – – –2019 MTI: OMMM Defensive Fund of Funds 13 Jun 19 23 Mar 22 6,94 7,01 – – – – – – – –2016 14 Mar 16 14 Mar 19 40,00 22,34 19,29 – – – – – – – –2017 29 Mar 17 29 Mar 20 35,00 22,34 19,29 – – – – – – – –2018 19 Apr 18 19 Apr 21 41,34 22,34 19,29 – – – – – – – –2019 20 Mar 19 20 Mar 22 21,75 22,34 19,29 – – – – – – – –Broad‑Based Employee Share Plan2018 18 Sep 18 18 Sep 20 29,80 22,34 19,29 – – – – – – – –2018 Special Award 14 Dec 18 18 Sep 20 22,00 22,34 19,29 – – – – – – – –Managed Separation Incentive Plan2018 18 Sep 18 18 Sep19 29,80 22,34 19,29 – – – – – – – –2018 Special Award 14 Dec 18 18 Sep 19 22,00 22,34 19,29 – – – – – – – –Total – – – – – – – –
K: Directors’ and Prescribed Officers’ emoluments Bonus share awards
OMLACSA Separate and Consolidated Annual Financial Statements for the year ended 31 December 2020 OMLACSA Separate and Consolidated Annual Financial Statements for the year ended 31 December 2020134 135OMLACSA Separate and Consolidated Annual Financial Statements for the year ended 31 December 2020OMLACSA Separate and Consolidated Annual Financial Statements for the year ended 31 December 2020
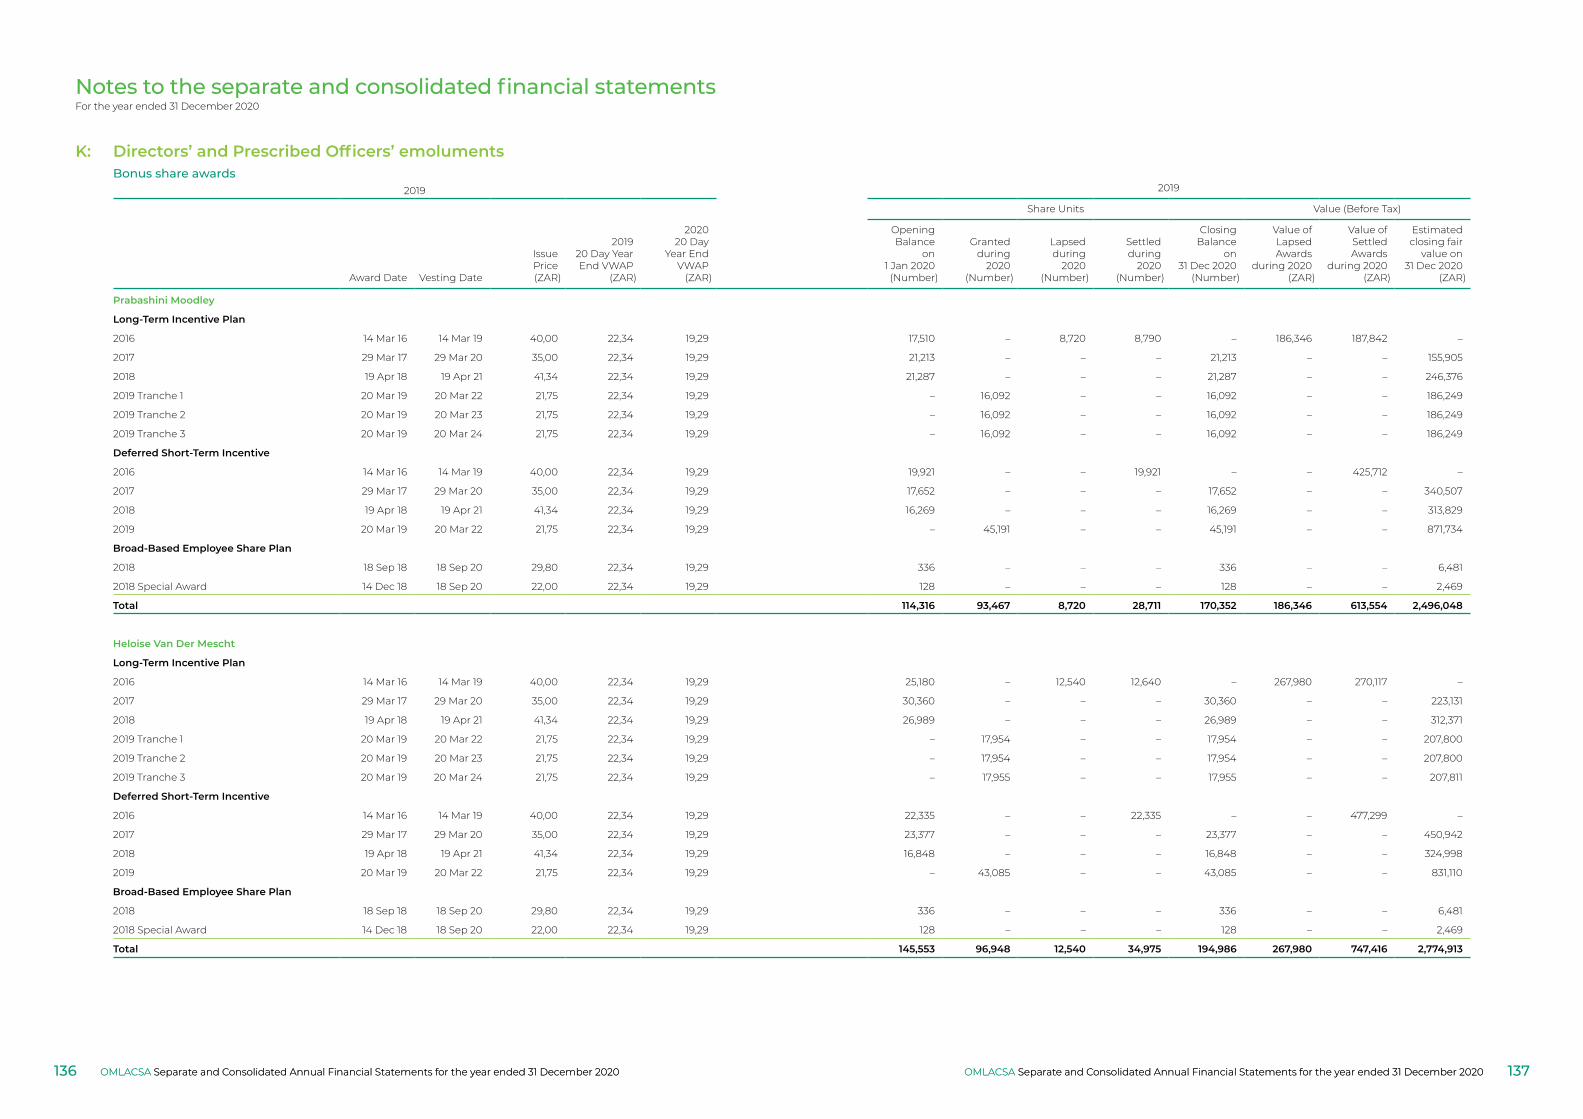
Notes to the separate and consolidated financial statementsFor the year ended 31 December 2020
2019 2019
Share Units Value (Before Tax)
Award Date Vesting Date
IssuePrice(ZAR)
201920 Day YearEnd VWAP
(ZAR)
202020 Day
Year EndVWAP
(ZAR)
OpeningBalance
on1 Jan 2020
(Number)
Grantedduring
2020(Number)
Lapsedduring
2020(Number)
Settledduring
2020(Number)
ClosingBalance
on31 Dec 2020
(Number)
Value ofLapsedAwards
during 2020(ZAR)
Value ofSettledAwards
during 2020(ZAR)
Estimatedclosing fair
value on31 Dec 2020
(ZAR)
Prabashini Moodley
Long‑Term Incentive Plan
2016 14 Mar 16 14 Mar 19 40,00 22,34 19,29 17,510 – 8,720 8,790 – 186,346 187,842 –
2017 29 Mar 17 29 Mar 20 35,00 22,34 19,29 21,213 – – – 21,213 – – 155,905
2018 19 Apr 18 19 Apr 21 41,34 22,34 19,29 21,287 – – – 21,287 – – 246,376
2019 Tranche 1 20 Mar 19 20 Mar 22 21,75 22,34 19,29 – 16,092 – – 16,092 – – 186,249
2019 Tranche 2 20 Mar 19 20 Mar 23 21,75 22,34 19,29 – 16,092 – – 16,092 – – 186,249
2019 Tranche 3 20 Mar 19 20 Mar 24 21,75 22,34 19,29 – 16,092 – – 16,092 – – 186,249
Deferred Short‑Term Incentive
2016 14 Mar 16 14 Mar 19 40,00 22,34 19,29 19,921 – – 19,921 – – 425,712 –
2017 29 Mar 17 29 Mar 20 35,00 22,34 19,29 17,652 – – – 17,652 – – 340,507
2018 19 Apr 18 19 Apr 21 41,34 22,34 19,29 16,269 – – – 16,269 – – 313,829
2019 20 Mar 19 20 Mar 22 21,75 22,34 19,29 – 45,191 – – 45,191 – – 871,734
Broad‑Based Employee Share Plan
2018 18 Sep 18 18 Sep 20 29,80 22,34 19,29 336 – – – 336 – – 6,481
2018 Special Award 14 Dec 18 18 Sep 20 22,00 22,34 19,29 128 – – – 128 – – 2,469
Total 114,316 93,467 8,720 28,711 170,352 186,346 613,554 2,496,048
Heloise Van Der Mescht
Long‑Term Incentive Plan
2016 14 Mar 16 14 Mar 19 40,00 22,34 19,29 25,180 – 12,540 12,640 – 267,980 270,117 –
2017 29 Mar 17 29 Mar 20 35,00 22,34 19,29 30,360 – – – 30,360 – – 223,131
2018 19 Apr 18 19 Apr 21 41,34 22,34 19,29 26,989 – – – 26,989 – – 312,371
2019 Tranche 1 20 Mar 19 20 Mar 22 21,75 22,34 19,29 – 17,954 – – 17,954 – – 207,800
2019 Tranche 2 20 Mar 19 20 Mar 23 21,75 22,34 19,29 – 17,954 – – 17,954 – – 207,800
2019 Tranche 3 20 Mar 19 20 Mar 24 21,75 22,34 19,29 – 17,955 – – 17,955 – – 207,811
Deferred Short‑Term Incentive
2016 14 Mar 16 14 Mar 19 40,00 22,34 19,29 22,335 – – 22,335 – – 477,299 –
2017 29 Mar 17 29 Mar 20 35,00 22,34 19,29 23,377 – – – 23,377 – – 450,942
2018 19 Apr 18 19 Apr 21 41,34 22,34 19,29 16,848 – – – 16,848 – – 324,998
2019 20 Mar 19 20 Mar 22 21,75 22,34 19,29 – 43,085 – – 43,085 – – 831,110
Broad‑Based Employee Share Plan
2018 18 Sep 18 18 Sep 20 29,80 22,34 19,29 336 – – – 336 – – 6,481
2018 Special Award 14 Dec 18 18 Sep 20 22,00 22,34 19,29 128 – – – 128 – – 2,469
Total 145,553 96,948 12,540 34,975 194,986 267,980 747,416 2,774,913
K: Directors’ and Prescribed Officers’ emoluments Bonus share awards
OMLACSA Separate and Consolidated Annual Financial Statements for the year ended 31 December 2020 OMLACSA Separate and Consolidated Annual Financial Statements for the year ended 31 December 2020136 137OMLACSA Separate and Consolidated Annual Financial Statements for the year ended 31 December 2020OMLACSA Separate and Consolidated Annual Financial Statements for the year ended 31 December 2020
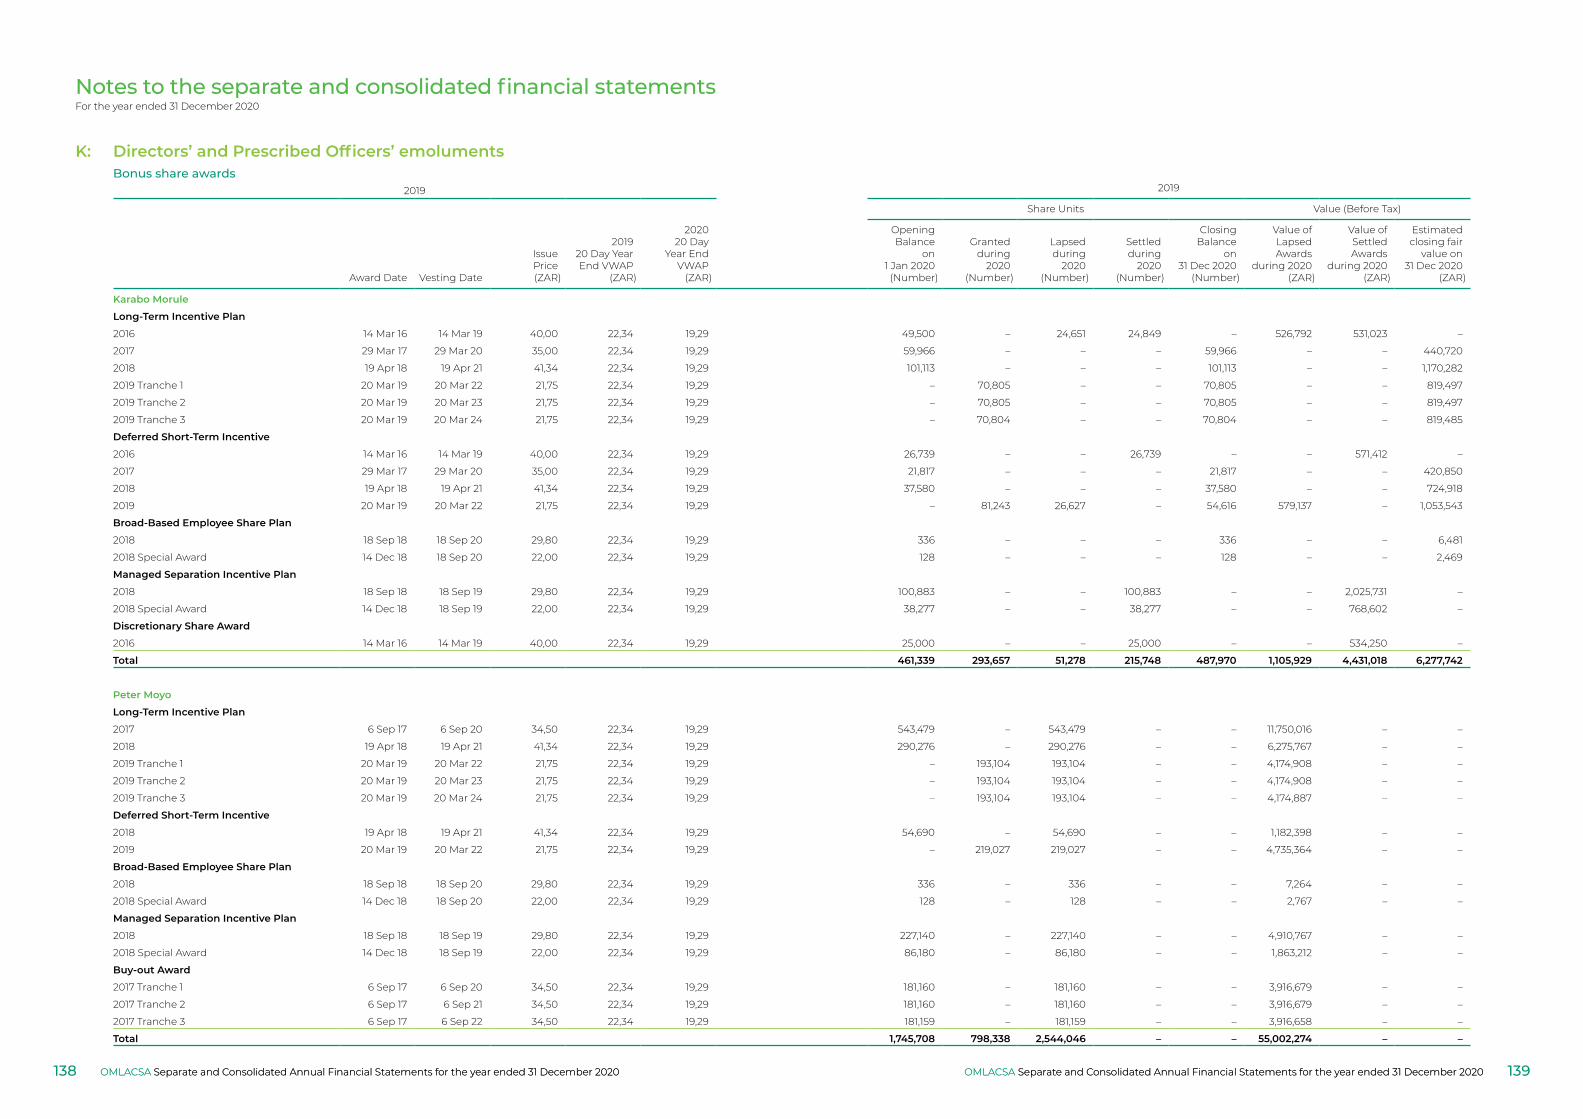
Notes to the separate and consolidated financial statementsFor the year ended 31 December 2020
2019 2019
Share Units Value (Before Tax)
Award Date Vesting Date
IssuePrice(ZAR)
201920 Day YearEnd VWAP
(ZAR)
202020 Day
Year EndVWAP
(ZAR)
OpeningBalance
on1 Jan 2020
(Number)
Grantedduring
2020(Number)
Lapsedduring
2020(Number)
Settledduring
2020(Number)
ClosingBalance
on31 Dec 2020
(Number)
Value ofLapsedAwards
during 2020(ZAR)
Value ofSettledAwards
during 2020(ZAR)
Estimatedclosing fair
value on31 Dec 2020
(ZAR)
Karabo Morule
Long‑Term Incentive Plan
2016 14 Mar 16 14 Mar 19 40,00 22,34 19,29 49,500 – 24,651 24,849 – 526,792 531,023 –
2017 29 Mar 17 29 Mar 20 35,00 22,34 19,29 59,966 – – – 59,966 – – 440,720
2018 19 Apr 18 19 Apr 21 41,34 22,34 19,29 101,113 – – – 101,113 – – 1,170,282
2019 Tranche 1 20 Mar 19 20 Mar 22 21,75 22,34 19,29 – 70,805 – – 70,805 – – 819,497
2019 Tranche 2 20 Mar 19 20 Mar 23 21,75 22,34 19,29 – 70,805 – – 70,805 – – 819,497
2019 Tranche 3 20 Mar 19 20 Mar 24 21,75 22,34 19,29 – 70,804 – – 70,804 – – 819,485
Deferred Short‑Term Incentive
2016 14 Mar 16 14 Mar 19 40,00 22,34 19,29 26,739 – – 26,739 – – 571,412 –
2017 29 Mar 17 29 Mar 20 35,00 22,34 19,29 21,817 – – – 21,817 – – 420,850
2018 19 Apr 18 19 Apr 21 41,34 22,34 19,29 37,580 – – – 37,580 – – 724,918
2019 20 Mar 19 20 Mar 22 21,75 22,34 19,29 – 81,243 26,627 – 54,616 579,137 – 1,053,543
Broad‑Based Employee Share Plan
2018 18 Sep 18 18 Sep 20 29,80 22,34 19,29 336 – – – 336 – – 6,481
2018 Special Award 14 Dec 18 18 Sep 20 22,00 22,34 19,29 128 – – – 128 – – 2,469
Managed Separation Incentive Plan
2018 18 Sep 18 18 Sep 19 29,80 22,34 19,29 100,883 – – 100,883 – – 2,025,731 –
2018 Special Award 14 Dec 18 18 Sep 19 22,00 22,34 19,29 38,277 – – 38,277 – – 768,602 –
Discretionary Share Award
2016 14 Mar 16 14 Mar 19 40,00 22,34 19,29 25,000 – – 25,000 – – 534,250 –
Total 461,339 293,657 51,278 215,748 487,970 1,105,929 4,431,018 6,277,742
Peter Moyo
Long‑Term Incentive Plan
2017 6 Sep 17 6 Sep 20 34,50 22,34 19,29 543,479 – 543,479 – – 11,750,016 – –
2018 19 Apr 18 19 Apr 21 41,34 22,34 19,29 290,276 – 290,276 – – 6,275,767 – –
2019 Tranche 1 20 Mar 19 20 Mar 22 21,75 22,34 19,29 – 193,104 193,104 – – 4,174,908 – –
2019 Tranche 2 20 Mar 19 20 Mar 23 21,75 22,34 19,29 – 193,104 193,104 – – 4,174,908 – –
2019 Tranche 3 20 Mar 19 20 Mar 24 21,75 22,34 19,29 – 193,104 193,104 – – 4,174,887 – –
Deferred Short‑Term Incentive
2018 19 Apr 18 19 Apr 21 41,34 22,34 19,29 54,690 – 54,690 – – 1,182,398 – –
2019 20 Mar 19 20 Mar 22 21,75 22,34 19,29 – 219,027 219,027 – – 4,735,364 – –
Broad‑Based Employee Share Plan
2018 18 Sep 18 18 Sep 20 29,80 22,34 19,29 336 – 336 – – 7,264 – –
2018 Special Award 14 Dec 18 18 Sep 20 22,00 22,34 19,29 128 – 128 – – 2,767 – –
Managed Separation Incentive Plan
2018 18 Sep 18 18 Sep 19 29,80 22,34 19,29 227,140 – 227,140 – – 4,910,767 – –
2018 Special Award 14 Dec 18 18 Sep 19 22,00 22,34 19,29 86,180 – 86,180 – – 1,863,212 – –
Buy‑out Award
2017 Tranche 1 6 Sep 17 6 Sep 20 34,50 22,34 19,29 181,160 – 181,160 – – 3,916,679 – –
2017 Tranche 2 6 Sep 17 6 Sep 21 34,50 22,34 19,29 181,160 – 181,160 – – 3,916,679 – –
2017 Tranche 3 6 Sep 17 6 Sep 22 34,50 22,34 19,29 181,159 – 181,159 – – 3,916,658 – –
Total 1,745,708 798,338 2,544,046 – – 55,002,274 – –
K: Directors’ and Prescribed Officers’ emoluments Bonus share awards
OMLACSA Separate and Consolidated Annual Financial Statements for the year ended 31 December 2020 OMLACSA Separate and Consolidated Annual Financial Statements for the year ended 31 December 2020138 139OMLACSA Separate and Consolidated Annual Financial Statements for the year ended 31 December 2020OMLACSA Separate and Consolidated Annual Financial Statements for the year ended 31 December 2020
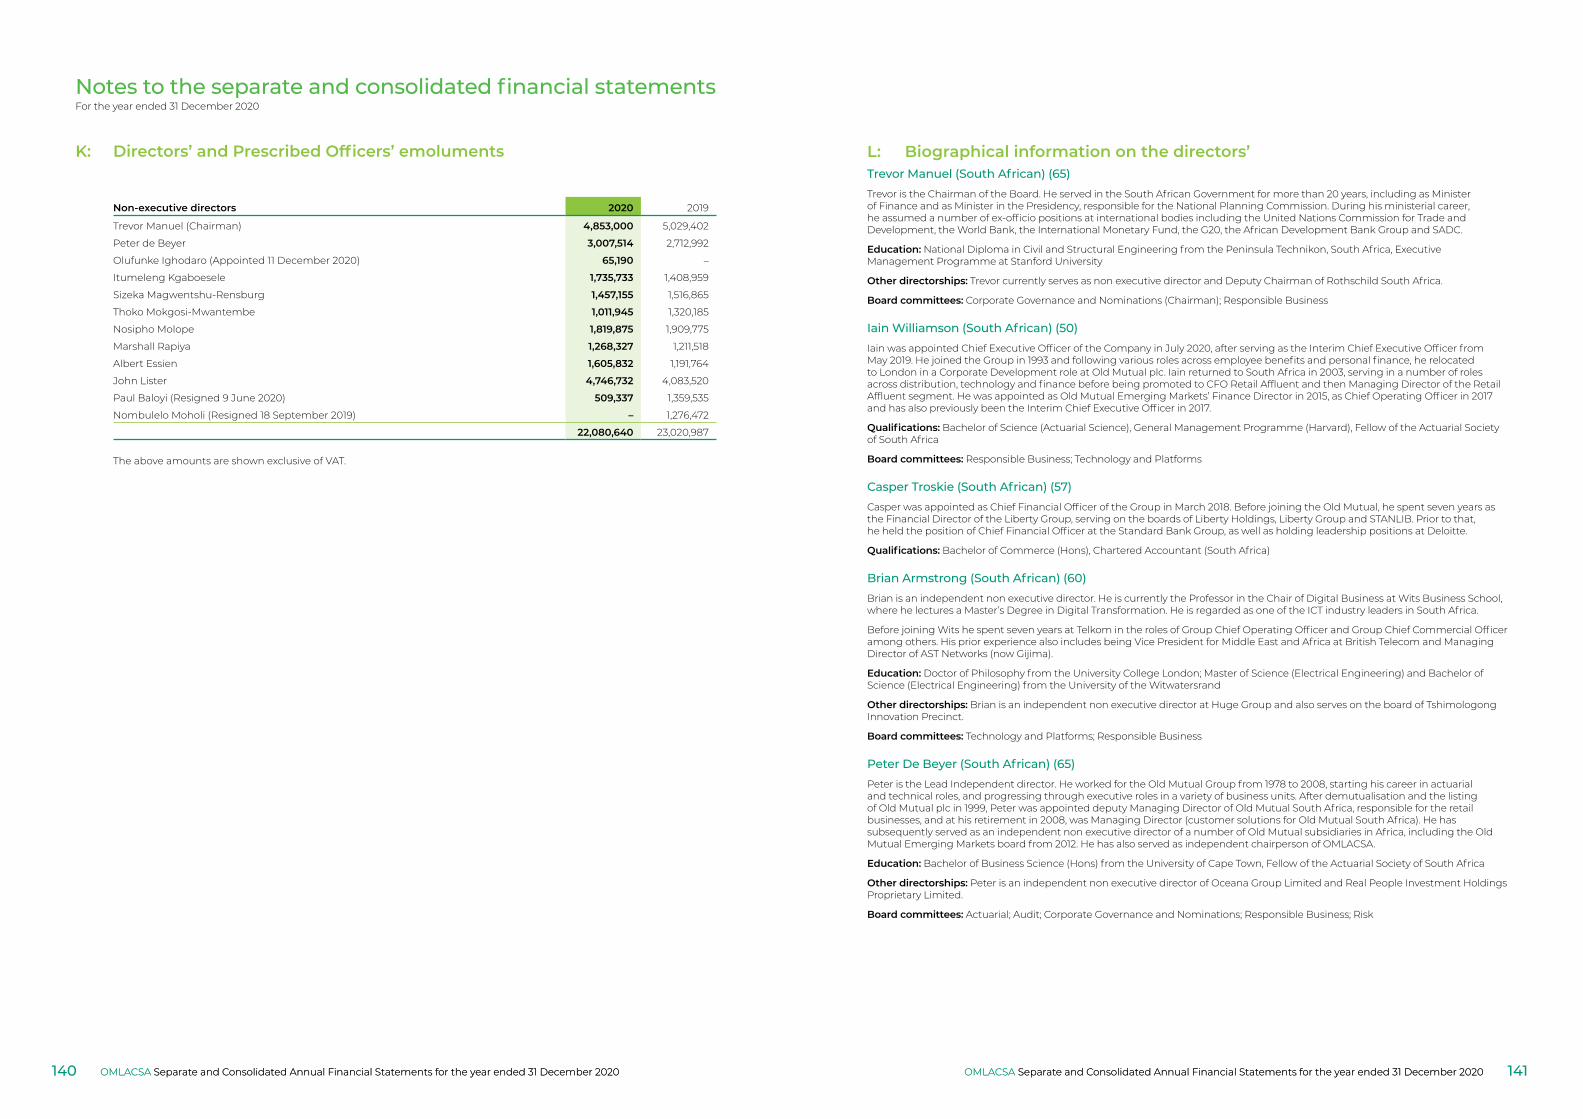
Notes to the separate and consolidated financial statementsFor the year ended 31 December 2020
Non‑executive directors 2020 2019
Trevor Manuel (Chairman) 4,853,000 5,029,402
Peter de Beyer 3,007,514 2,712,992
Olufunke Ighodaro (Appointed 11 December 2020) 65,190 –
Itumeleng Kgaboesele 1,735,733 1,408,959
Sizeka Magwentshu-Rensburg 1,457,155 1,516,865
Thoko Mokgosi-Mwantembe 1,011,945 1,320,185
Nosipho Molope 1,819,875 1,909,775
Marshall Rapiya 1,268,327 1,211,518
Albert Essien 1,605,832 1,191,764
John Lister 4,746,732 4,083,520
Paul Baloyi (Resigned 9 June 2020) 509,337 1,359,535
Nombulelo Moholi (Resigned 18 September 2019) – 1,276,472
22,080,640 23,020,987
The above amounts are shown exclusive of VAT.
K: Directors’ and Prescribed Officers’ emoluments
L: Biographical information on the directors’Trevor Manuel (South African) (65)Trevor is the Chairman of the Board. He served in the South African Government for more than 20 years, including as Minister of Finance and as Minister in the Presidency, responsible for the National Planning Commission. During his ministerial career, he assumed a number of ex-officio positions at international bodies including the United Nations Commission for Trade and Development, the World Bank, the International Monetary Fund, the G20, the African Development Bank Group and SADC.
Education: National Diploma in Civil and Structural Engineering from the Peninsula Technikon, South Africa, Executive Management Programme at Stanford University
Other directorships: Trevor currently serves as non executive director and Deputy Chairman of Rothschild South Africa.
Board committees: Corporate Governance and Nominations (Chairman); Responsible Business
Iain Williamson (South African) (50)Iain was appointed Chief Executive Officer of the Company in July 2020, after serving as the Interim Chief Executive Officer from May 2019. He joined the Group in 1993 and following various roles across employee benefits and personal finance, he relocated to London in a Corporate Development role at Old Mutual plc. Iain returned to South Africa in 2003, serving in a number of roles across distribution, technology and finance before being promoted to CFO Retail Affluent and then Managing Director of the Retail Affluent segment. He was appointed as Old Mutual Emerging Markets’ Finance Director in 2015, as Chief Operating Officer in 2017 and has also previously been the Interim Chief Executive Officer in 2017.
Qualifications: Bachelor of Science (Actuarial Science), General Management Programme (Harvard), Fellow of the Actuarial Society of South Africa
Board committees: Responsible Business; Technology and Platforms
Casper Troskie (South African) (57)Casper was appointed as Chief Financial Officer of the Group in March 2018. Before joining the Old Mutual, he spent seven years as the Financial Director of the Liberty Group, serving on the boards of Liberty Holdings, Liberty Group and STANLIB. Prior to that, he held the position of Chief Financial Officer at the Standard Bank Group, as well as holding leadership positions at Deloitte.
Qualifications: Bachelor of Commerce (Hons), Chartered Accountant (South Africa)
Brian Armstrong (South African) (60)Brian is an independent non executive director. He is currently the Professor in the Chair of Digital Business at Wits Business School, where he lectures a Master’s Degree in Digital Transformation. He is regarded as one of the ICT industry leaders in South Africa.
Before joining Wits he spent seven years at Telkom in the roles of Group Chief Operating Officer and Group Chief Commercial Officer among others. His prior experience also includes being Vice President for Middle East and Africa at British Telecom and Managing Director of AST Networks (now Gijima).
Education: Doctor of Philosophy from the University College London; Master of Science (Electrical Engineering) and Bachelor of Science (Electrical Engineering) from the University of the Witwatersrand
Other directorships: Brian is an independent non executive director at Huge Group and also serves on the board of Tshimologong Innovation Precinct.
Board committees: Technology and Platforms; Responsible Business
Peter De Beyer (South African) (65)Peter is the Lead Independent director. He worked for the Old Mutual Group from 1978 to 2008, starting his career in actuarial and technical roles, and progressing through executive roles in a variety of business units. After demutualisation and the listing of Old Mutual plc in 1999, Peter was appointed deputy Managing Director of Old Mutual South Africa, responsible for the retail businesses, and at his retirement in 2008, was Managing Director (customer solutions for Old Mutual South Africa). He has subsequently served as an independent non executive director of a number of Old Mutual subsidiaries in Africa, including the Old Mutual Emerging Markets board from 2012. He has also served as independent chairperson of OMLACSA.
Education: Bachelor of Business Science (Hons) from the University of Cape Town, Fellow of the Actuarial Society of South Africa
Other directorships: Peter is an independent non executive director of Oceana Group Limited and Real People Investment Holdings Proprietary Limited.
Board committees: Actuarial; Audit; Corporate Governance and Nominations; Responsible Business; Risk
OMLACSA Separate and Consolidated Annual Financial Statements for the year ended 31 December 2020 OMLACSA Separate and Consolidated Annual Financial Statements for the year ended 31 December 2020140 141OMLACSA Separate and Consolidated Annual Financial Statements for the year ended 31 December 2020OMLACSA Separate and Consolidated Annual Financial Statements for the year ended 31 December 2020
Notes to the separate and consolidated financial statementsFor the year ended 31 December 2020
Matthys Du Toit (South African) (62)Matthys (Thys), is an independent non executive director. Thys, with 4 colleagues, co-founded Coronation Asset Management Limited (Coronation) and was subsequently appointed as Managing Director in 1996. In 2003, he led the listing of Coronation on the JSE. Thys has also been instrumental in the establishment of the empowerment asset management businesses Kagiso Asset Management, Namibia Asset Management, Coronation Fund Managers (Botswana) and African Harvest Asset Management. He was the chairperson of KWV Holdings Limited and served as a non-executive director of PSG Group Limited, Pioneer Food Group Limited, Attacq Limited and ZCI Limited.
Education: Bachelor of Science with majors in Viticulture, Biochemistry and Chemistry, Master of Business Administration (Cum Laude) from the University of Stellenbosch
Other directorships: Thys is the executive chairman of Rootstock Investment Management Proprietary Limited.
Board committees: Corporate Governance and Nominations; Remuneration; Related Party Transaction (Chairperson)
Albert Essien (Ghanaian) (65)Albert is an independent non executive director. He started his banking career with the National Investment Bank Limited in Accra, and subsequently joined the corporate banking department of Ecobank Ghana. He previously served as the Group Chief Executive Officer of Ecobank and led Ecobank’s expansion into Burundi, Kenya, Malawi, Rwanda, South Africa, Tanzania, Uganda and Zambia. Albert also led Ecobank’s negotiations in the formation of the Ecobank-Nedbank alliance.
Education: EDP (INSEAD), Bachelor of Arts in Economics from the University of Ghana, Honorary fellow of the Ghana Chartered Institute of Bankers
Other directorships: Albert is the chairman of Oasis Africa Capital Fund Limited, Ghana Amalgamated Trust and Jumo Ghana Limited. He is also an independent non executive director of the Development Finance Institute (FinDev) Canada and Jumo World Limited.
Board committees: Responsible Business; Risk
Olufunke Ighodaro (Nigerian) (58)Olufunke is an independent non-executive director. She is currently the audit and risk committee chair of Massmart Holdings Limited (a Walmart subsidiary company, housing its African retailing interests). She is also a Member of the Investment Committee of Cell C Limited and a Independent Non-Executive Director of Sabvest Limited. Previously Funke served as audit and risk committee chair of Transaction Capital Limited and has also served as independent non-executive director and audit and risk committee member of Datatec Limited (a global IT services business operating across Africa, Europe, North America and Asia).
Olufunke has over 22 years’ experience operating at executive board level, having previously served as chief financial officer of JSE listed companies namely Tiger Brands Limited, Primedia Limited and as executive director and chief financial officer designate of Barloworld Limited. She was an executive director of EMTS Limited (trading as 9mobile), Nigeria’s fourth largest telco as well as acting in an interim capacity as chief financial officer. She also founded and led the private equity business of the Kagiso Trust Investment Group.
Education: Bachelor of Business Science (Hons)(Operational Research) from the university of Salford. Fellow of the Institute of Chartered Accountants in England and Wales (ICAEW); Chartered Accountant with the South Africa Institute of Chartered Accountants (SAICA)
Board Committees: Actuarial; Audit; Risk
Itumleng Kgabosele (South African) (49)Itumeleng is an independent non executive director. He has over 20 years of financial services experience, having held positions with Hambros Bank Limited, Deutsche Bank AG London and Merrill Lynch.
Education: Bachelor of Commerce and Postgraduate Diploma in Accounting from the University of Cape Town, Diploma in Financial Markets and Instruments from the University of Johannesburg, Chartered Accountant (South Africa)
Other directorships: Itumeleng is a director of Consol Holdings Proprietary Limited and BBD Holdings Proprietary Limited. He is also co-founder and Chief Executive Officer of Sphere Holdings Proprietary Limited, an investment company that invests primarily in the industrial services sectors.
Board committees: Actuarial; Audit; Corporate Governance and Nominations; Remuneration (Chairperson)
John Lister (British) (62)John is an independent non executive director. He has over 3 decades of experience in the insurance sector and is a finance and risk specialist. He is the former Chief Risk Officer of AVIVA plc and Chief Financial Officer and Chief Actuary of its UK life and savings business. He was the former chairman of the Risk committee of Delta Lloyd Limited, Netherlands, prior to its sale to the NN Group. He has significant experience and knowledge across a number of areas including capital management, risk management and regulatory engagement.
Education: Bachelor of Science in Statistics from the University of Wales, Cardiff and Fellow of the Institute of Actuaries
Other directorships: John is chairman of the Risk committee at Phoenix Life and Pacific Life Re in the UK.
Board committees: Actuarial (Chairperson); Audit; Corporate Governance and Nominations; Risk (Chairperson)
L: Biographical information on the directors’ Sizeka Magwntshu Rensburg (South African) (61)Sizeka is an independent non executive director. She has extensive experience spanning over 25 years in the Small, Medium and Micro Enterprise (“SMME”) development space in South Africa and Southern Africa. She served on various boards of state-owned enterprises and was a member of the South African Ministerial Advisory committee on SMME Development (Ministry of Economic Development).
Education: Bachelor of Arts in Accounting and Business Administration from Webster University, Master of Business Administration from Webster University and DPhil in Business Management from the University of Johannesburg
Other directorships: Sizeka is a non executive director of the Industrial Development Corporation of South Africa SOC Limited and chairperson of the investments committee. She is also a director of Rensiza Investments Proprietary Limited.
Board committees: Corporate Governance and Nominations; Remuneration; Responsible Business (Chairperson)
Thoko Mokgosi Mwantembe (South African) (59)Thoko is a non executive director. Her career spans numerous sectors, including pharmaceuticals companies such as Logos Pharmaceutical and Glaxo Wellcome. She is the former Chief Executive Officer of Alcatel South Africa Proprietary Limited, Hewlett Packard South Africa Proprietary Limited and Vodacom Group Limited.
Education: Bachelor of Science and Diploma in Teaching from the University of Swaziland, Master of Science in Medical Chemistry from the University of Loughborough, Senior Executive Programme at Harvard University, Managing Corporate Resources Programme from the Institute of Management Development of Switzerland
Other directorships: Thoko is the Chief Executive Officer of Kutana Investments Group Limited, a black women-owned economic empowerment investment group. She is also a director at Royal Bafokeng Platinum Limited.
Board committees: Remuneration; Technology and Platforms
Nosipho Molope (South African) (56)Nosipho is an independent non executive director. She previously worked at WipCapital Proprietary Limited as part of the Specialised Funds Management team, after which she joined Viamax Proprietary Limited, a subsidiary of Transnet, as a Group Finance Executive. She was also the former Finance Director at ZICO Proprietary Limited and Chief Financial Officer at the Financial Services Board. She has served on the Boards of Nampak Limited, Illovo Sugar Limited, Toyota Financial Services South Africa Proprietary Limited and various subsidiaries of MTN Group Limited in the rest of Africa, including MTN Cameroon, MTN Ivory Coast, MTN Liberia, MTN Benin and MTN South Sudan.
Education: Bachelor of Science (Medical Science) from the University of the Witwatersrand, Bachelor of Accounting Science (Hons) with a Certificate of Theory in Accountancy from the University of South Africa, Chartered Accountant (South Africa)
Other directorships: Nosipho serves as director on various company boards including Engen Limited, South32 Coal Holdings Proprietary Limited, Mobile Telephone Networks Proprietary Limited (MTN SA), MTN Eswatini, MTN Rwandacell, MTN Uganda and MTN Zambia.
Board committees: Actuarial; Audit (Chairperson); Corporate Governance and Nominations; Risk
James Mwangi (Kenyan) (43)James is an independent non executive director. He helped found the Dalberg Group in New York in 2002 and set up its African operations in Johannesburg in 2007, before taking on the role of Global Managing Partner and Chief Executive of Dalberg’s consulting business from 2010 to 2014. Prior to Dalberg, he worked at McKinsey & Company in New York.
He is a 2009 Archbishop Tutu Leadership Fellow of the African Leadership Institute and a 2013 Young Global Leader of the World Economic Forum.
Education: Bachelor of Arts in Economics from Harvard University
Other directorships: James is the executive director of the Dalberg Group, overseeing the global operations of its 6 businesses operating in over 30 countries worldwide. He also serves on the boards of One Acre Fund, The Skoll Foundation, Koko Networks and various Dalberg businesses and entities.
Board committees: Related Party Transaction; Responsible Business; Technology and Platforms
OMLACSA Separate and Consolidated Annual Financial Statements for the year ended 31 December 2020 OMLACSA Separate and Consolidated Annual Financial Statements for the year ended 31 December 2020142 143OMLACSA Separate and Consolidated Annual Financial Statements for the year ended 31 December 2020OMLACSA Separate and Consolidated Annual Financial Statements for the year ended 31 December 2020
Notes to the separate and consolidated financial statementsFor the year ended 31 December 2020
Marshall Rapiya (South African) (68)Marshall is a non executive director. He has served as Managing Director for Old Mutual South Africa’s retail mass market and prior to that managed a number of Old Mutual South Africa’s businesses. He also served as Chief Executive Officer of Old Mutual South Africa and was on the Board of Directors of Old Mutual Insure.
Education: Bachelor of Administration from the University of South Africa, Global Leadership Programme at the London Business School, Channel Leadership from INSEAD France, Leading Organisational Change and Renewal programme from Harvard University
Other directorships: Marshall is a board member of the Masisizane non-profit company and is the lead independent director at Sea Harvest.
Board committees: Responsible Business; Risk
Stewart Van Graan (South African) (65)Stewart is an independent non executive director. He has extensive experience in information technology and was the former Managing Director of Dell Computer Proprietary Limited (“Dell”) in South Africa as well as the former the vice president for Dell’s Enterprise Solutions business in the EMEA Emerging Markets. Stewart also served as the chairperson of Dell in South Africa and the Dell Khulisa Academy. Prior to joining Dell, he spent 23 years at IBM in various positions, both locally and internationally. He also served on the advisory board of the University of Stellenbosch Business School.
Education: Bachelor of Commerce (Hons) in Systems and Technology from the University of Cape Town, Programme for Management Development at the Graduate School of Business in Cape Town
Other directorships: Stewart is a non executive director of the Allied Electronics Corporation Limited and BankservAfrica.
Board committees: Corporate Governance and Nominations; Risk; Related Party Transaction; Technology & Platforms (Chairperson)
Note: Age as at 23 March 2021, being the publication date.
L: Biographical information on the directors’ Registered name: Old Mutual Life Assurance Company (South Africa) LimitedCountry of incorporation: South AfricaRegistration number: 1999/004643/06
Registered Office Postal Address:Mutualpark PO Box 66Jan Smuts Drive Cape TownPinelands 8000Cape Town South Africa7405South AfricaTelephone: +27 (0)21 509-9111
Company Secretary:Elsabé Kirsten
DirectorsIndependent non‑executive Non‑executiveTrevor Manuel (Chairman) Thoko Mokgosi-Mwantembe1
Peter de Beyer (Lead Independent Director) Marshall RapiyaPaul Baloyi (Resigned 9 June 2020)Brian Armstrong (Appointed 29 June 2020)Matthys du ToitAlbert Essien ExecutiveItumeleng Kgaboesele Iain Williamson (Chief Executive Officer – Appointed 3 July 2020)John Lister Casper Troskie (Chief Financial Officer) Sizeka Magwentshu-RensburgNosipho MolopeJames MwangiStewart van Graan Public OfficerFunke Ighodaro (Appointed 22 September 2020) Nazrien Kader
1 Refer to note I3(c) in the annual financial statements for more information on changes in the status of directors.
AdministrationFor the year ended 31 December 2020
OMLACSA Separate and Consolidated Annual Financial Statements for the year ended 31 December 2020144 OMLACSA Separate and Consolidated Annual Financial Statements for the year ended 31 December 2020

www.oldmutual.com