Embed Size (px)
Citation preview
Joyce Dubow, PPI Project Manager
The Public Policy Institute, formed in 1985, is part of the Research Group of AARP. One of the missions of the Institute is to foster research and analysis on public policy issues of importance to older Americans. This paper represents part of that effort.
The views expressed herein are for information, debate, and discussion and do not necessarily represent formal policies of the Association.
2000, AARP. Reprinting with permission only. AARP, 601 E Street, NW, Washington, DC 20049
#2000-14
September 2000
Older Consumers’ Skill in Using Comparative Data to Inform Health Plan Choice:
A Preliminary Assessment
by Judith H. Hibbard, Dr. P.H.
Paul Slovic, Ph.D. Ellen Peters, Ph.D.
Melissa Finucane, Ph.D.
Executive Summary
Background
Recent changes in the Medicare program increase the potential health plan options available to Medicare beneficiaries. Along with the expanded choices, there is also an unprecedented effort by federal agencies, health providers, advocates, and others to inform older Americans about their health options. Most of Medicare’s 39 million beneficiaries receive a detailed booklet annually describing the choices. Beneficiaries can also call a toll-free number for information, or go to a counseling center or the Internet for additional help.
Purpose
How well do older Americans handle these new demands for using information and
making choices? Little is known about older adults’ ability to use information in decision making and the degree to which they possess the skills needed to make sound decisions. The goals of this study are to begin to assess decision skill among Medicare beneficiaries and to assess the relationship between decision making skill level and how much assistance in decision making is desired. The study explores whether those who are most likely to seek help are the ones most in need of assistance. Specific research questions are: • Can we measure decision skill among Medicare beneficiaries? • Do Medicare beneficiaries who have poor decision skills have a greater desire to delegate
decisions and/or to have help in making decisions than beneficiaries with better decision making skills do?
• Are beneficiaries who have less decision skill more likely to view having and making choices as burdensome?
Method
This study employs a cross-sectional analysis to address the research questions. A convenience sample of 253 Medicare beneficiaries was recruited and paid for participation in the study. Beneficiaries were recruited at Eugene/Springfield, Oregon senior centers. Study participants are an average age of 75 years, with ages ranging from 65-94 years. Sixty-one percent of our study population is female. Twenty-four percent have a college degree or higher, while only 9 percent have less than a high school education. Only 17 percent of the study population rate their health as fair or poor, while 25 percent of the total Medicare population rate their health as poor or fair. The study sample has higher educational levels, has better self-reported health, and is younger than the Medicare population as a whole.
A preliminary index of skill was constructed that appears to be both valid and reliable.
The index assesses an individual's ability to interpret comparative information accurately for use in making health plan choices.
ii
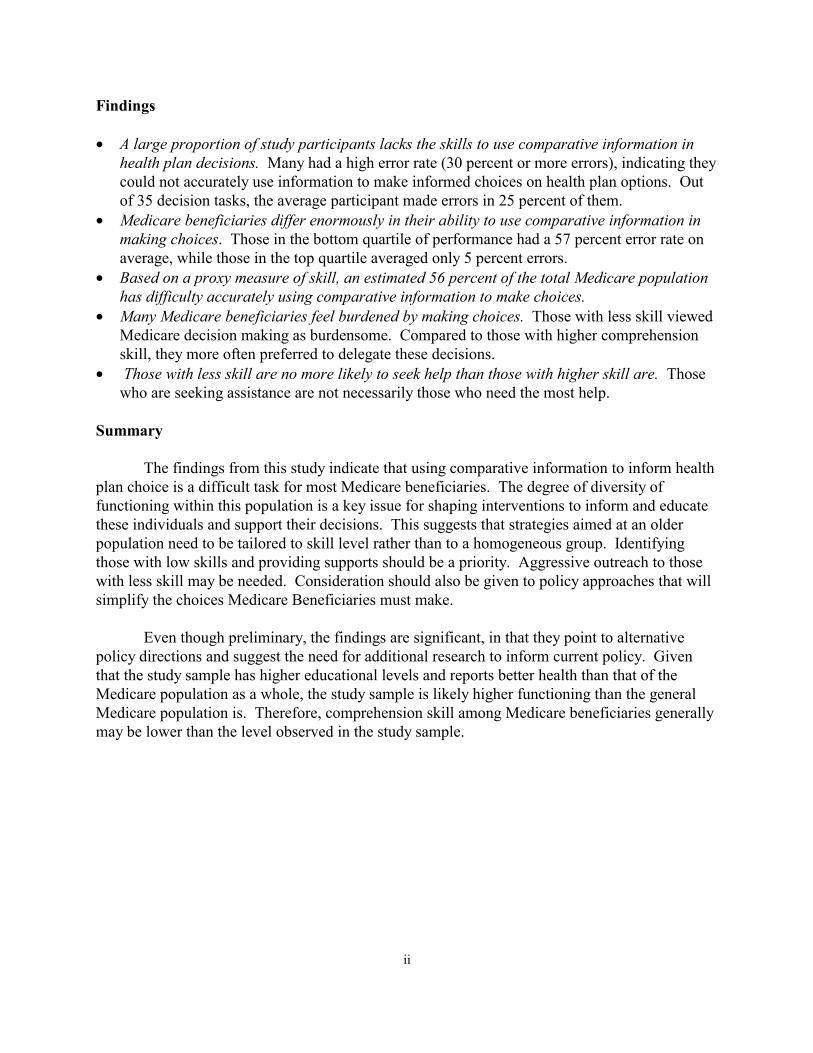
Findings • A large proportion of study participants lacks the skills to use comparative information in
health plan decisions. Many had a high error rate (30 percent or more errors), indicating they could not accurately use information to make informed choices on health plan options. Out of 35 decision tasks, the average participant made errors in 25 percent of them.
• Medicare beneficiaries differ enormously in their ability to use comparative information in making choices. Those in the bottom quartile of performance had a 57 percent error rate on average, while those in the top quartile averaged only 5 percent errors.
• Based on a proxy measure of skill, an estimated 56 percent of the total Medicare population has difficulty accurately using comparative information to make choices.
• Many Medicare beneficiaries feel burdened by making choices. Those with less skill viewed Medicare decision making as burdensome. Compared to those with higher comprehension skill, they more often preferred to delegate these decisions.
• Those with less skill are no more likely to seek help than those with higher skill are. Those who are seeking assistance are not necessarily those who need the most help.
Summary
The findings from this study indicate that using comparative information to inform health
plan choice is a difficult task for most Medicare beneficiaries. The degree of diversity of functioning within this population is a key issue for shaping interventions to inform and educate these individuals and support their decisions. This suggests that strategies aimed at an older population need to be tailored to skill level rather than to a homogeneous group. Identifying those with low skills and providing supports should be a priority. Aggressive outreach to those with less skill may be needed. Consideration should also be given to policy approaches that will simplify the choices Medicare Beneficiaries must make.
Even though preliminary, the findings are significant, in that they point to alternative policy directions and suggest the need for additional research to inform current policy. Given that the study sample has higher educational levels and reports better health than that of the Medicare population as a whole, the study sample is likely higher functioning than the general Medicare population is. Therefore, comprehension skill among Medicare beneficiaries generally may be lower than the level observed in the study sample.
iii
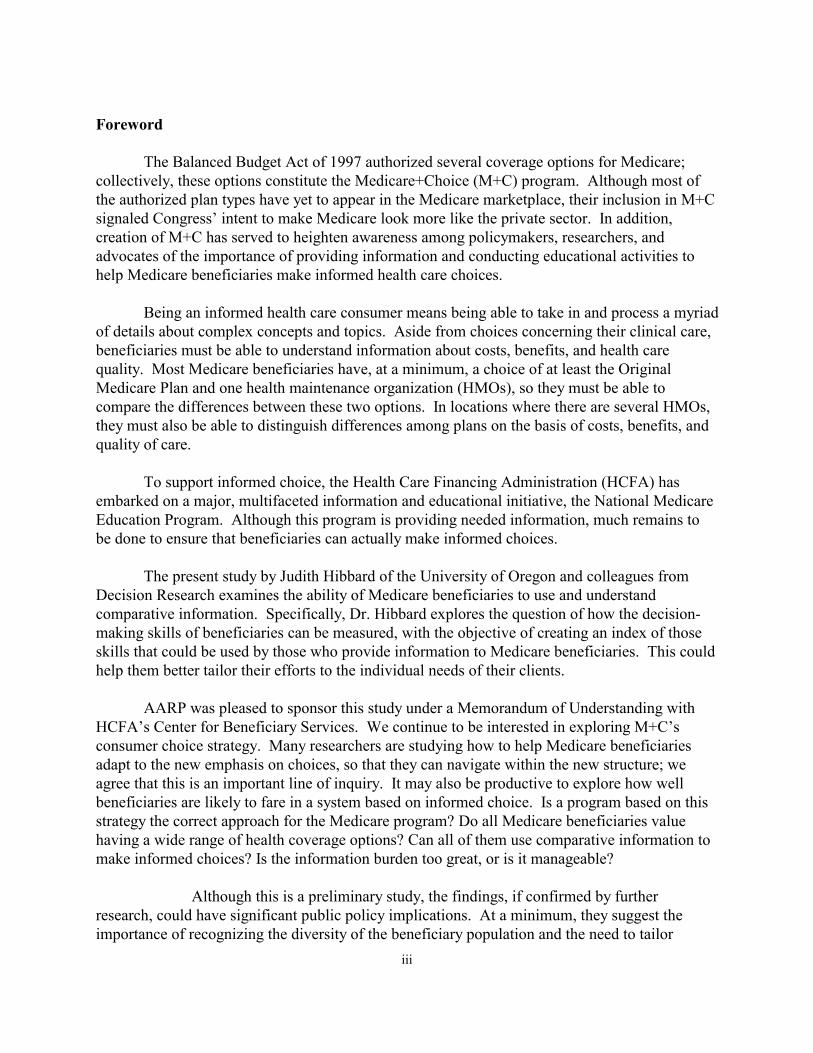
Foreword
The Balanced Budget Act of 1997 authorized several coverage options for Medicare; collectively, these options constitute the Medicare+Choice (M+C) program. Although most of the authorized plan types have yet to appear in the Medicare marketplace, their inclusion in M+C signaled Congress’ intent to make Medicare look more like the private sector. In addition, creation of M+C has served to heighten awareness among policymakers, researchers, and advocates of the importance of providing information and conducting educational activities to help Medicare beneficiaries make informed health care choices.
Being an informed health care consumer means being able to take in and process a myriad of details about complex concepts and topics. Aside from choices concerning their clinical care, beneficiaries must be able to understand information about costs, benefits, and health care quality. Most Medicare beneficiaries have, at a minimum, a choice of at least the Original Medicare Plan and one health maintenance organization (HMOs), so they must be able to compare the differences between these two options. In locations where there are several HMOs, they must also be able to distinguish differences among plans on the basis of costs, benefits, and quality of care.
To support informed choice, the Health Care Financing Administration (HCFA) has embarked on a major, multifaceted information and educational initiative, the National Medicare Education Program. Although this program is providing needed information, much remains to be done to ensure that beneficiaries can actually make informed choices.
The present study by Judith Hibbard of the University of Oregon and colleagues from Decision Research examines the ability of Medicare beneficiaries to use and understand comparative information. Specifically, Dr. Hibbard explores the question of how the decision-making skills of beneficiaries can be measured, with the objective of creating an index of those skills that could be used by those who provide information to Medicare beneficiaries. This could help them better tailor their efforts to the individual needs of their clients.
AARP was pleased to sponsor this study under a Memorandum of Understanding with HCFA’s Center for Beneficiary Services. We continue to be interested in exploring M+C’s consumer choice strategy. Many researchers are studying how to help Medicare beneficiaries adapt to the new emphasis on choices, so that they can navigate within the new structure; we agree that this is an important line of inquiry. It may also be productive to explore how well beneficiaries are likely to fare in a system based on informed choice. Is a program based on this strategy the correct approach for the Medicare program? Do all Medicare beneficiaries value having a wide range of health coverage options? Can all of them use comparative information to make informed choices? Is the information burden too great, or is it manageable?
Although this is a preliminary study, the findings, if confirmed by further research, could have significant public policy implications. At a minimum, they suggest the importance of recognizing the diversity of the beneficiary population and the need to tailor
iv
materials and strategies to support their different capacities and needs. The findings also call into question whether some of the current features of M+C are appropriate for certain segments of the older Medicare population. For example, given the finding that many who are over 80 years old cannot adequately understand comparative information, is a program based on the need to select from among multiple plan options a workable program design? Is the “lock-in” provision that will keep M+C enrollees in the same risk-based plan (initially for six months in 2002, then nine months in 2003 and subsequent years) suitable for beneficiaries who may not be able to understand the implications of their choices? Clearly, more research must be conducted to confirm the findings of this study. AARP is committed to ensuring that the Medicare program remains responsive to the needs of the entire beneficiary population. We encourage HCFA and others to continue learning how best to accomplish this objective. Joyce Dubow Senior Policy Advisor Public Policy Institute, AARP
Contents
Introduction ..................................................................................................................................... 1
Background ..................................................................................................................................... 1
Methods ...................................................................................................................................... 3
Study sample, design and data collection .............................................................................. 3
Variables ...................................................................................................................... 3
Dependent variables ..................................................................................................... 3
Predictor variables........................................................................................................ 4
Findings ...................................................................................................................................... 5
How can we measure decision skill among Medicare beneficiaries?.................................... 5
Reliability and validity of comprehension index .................................................................. 6
Are there differences among Medicare beneficiaries in terms of their comprehension skills? ........................................................................................................................... 6
What beneficiary characteristics predict skill? ...................................................................... 6
Do Medicare beneficiaries who have poor comprehension skills have a greater desire for assistance in making choices than beneficiaries with better comprehension skills do? Do they view having and making choices as being more burdensome than those with more skills do?.................................................................................... 6
Can we estimate what portion of the Medicare population would have difficulty using comparative information in choices? ................................................................. 7
Discussion ...................................................................................................................................... 8
Policy Implications........................................................................................................................ 10
Bibliography.................................................................................................................................. 12
Table 1: Characteristics of the Study Population .......................................................................... 14
Figure 1: Comprehension Score by Self-Assessed Skill in Using Tables and Graphs.................. 15
Figure 2: Comprehension Score by Self-Reported Understanding of the Difference Between Medicare HMOs and Original Medicare .............................................................. 15
Figure 3: How Participants are Distributed on Comprehension Score ......................................... 16
Figure 4: What Factors Are Related to Comprehension Score? Education .................................. 16
Figure 5: What Factors Are Related to Comprehension Score? Health Status ............................. 17
Figure 6: What Factors Are Related to Comprehension Score? Age............................................ 17
Figure 7: Effect of Education on Comprehension Score Decreases with Age.............................. 18
vi
Figure 8: Those Who Want to Delegate Decision Have Lower Comprehension Score................ 18
Figure 9: Those Who View Medicare Decisions as Burdensome Have Lower Comprehension Scores ........................................................................................................ 19
Figure 10: Those Who Want Help from Family or Friends in Making the Decision Have Lower Comprehension Scores ........................................................................................................ 19
Figure 11: Seeking Assistance Is Unrelated to Comprehension Scores........................................ 20
Figure 12: Assistance Sought Is Unrelated to Comprehension Scores ......................................... 20
Figure 13: Those Who Want More Choices Have Higher Comprehension Scores ...................... 21
Figure 14: Those Who Desire More Information Have Higher Comprehension Scores: ............. 21
Figures 15: Scatter Plot of Screening Tool: Sample Distribution on Index and Comprehension Score .................................................................................................................................. 22
Figure 16: Calculations for Estimating Comprehension Score in the Larger Beneficiary Population ............................................................................................................................ 23
Appendices ......................................................................................................................24-40
Appendix A: Attitudes about managed care and choice...................................................... 24
Appendix B: Health and Demographics .............................................................................. 26
Appendix C: Summary of comprehension measures........................................................... 28
Introduction
Recent changes in Medicare broaden the possible array of enrollment options available to the program’s beneficiaries. These new choices reflect a growing complexity of insurance mechanisms and delivery system options. While most of these new options have not yet materialized, HCFA has begun to provide more information about the characteristics and performance of HMOs, the predominant plan type that is available. The assumption is that, provided with information to explain the available options, beneficiaries will be able to make choices that fit their individual needs and preferences. There is also the hope that with comparative performance information, beneficiaries will choose higher-performing plans and that this, in turn, will increase incentives for health plans to improve care and patient satisfaction.
Little is known about how well older adults can process and use comparative information
in making choices, or how much information they can effectively use. Whether Medicare beneficiaries view having more health plan options as an advantage or as a burden is also not known. Understanding these questions is particularly important as we evaluate different possible directions for the future of the Medicare program. For example, several of the options under consideration take Medicare in the direction of a premium support program. This approach would rely on the market to provide a wide array of options and would place a greater burden on Medicare beneficiaries to be able to understand those options and their potential personal, financial, and health care consequences.
The research questions addressed in this study are:
• Can we measure decision skill among Medicare beneficiaries? • Do Medicare beneficiaries who have poor decision skills have a greater desire to delegate
decisions and/or seek assistance in making decisions than beneficiaries with better decision making skills do?
• Are beneficiaries who have less decision skill more likely to view having and making choices as burdensome? The current study is done through a memorandum of understanding between AARP’s
Public Policy Institute and the Health Care Financing Administration (HCFA). The data were collected under a HCFA contract.
Background
To use comparative information in making health care choices, consumers need several skills. At the basic level is the ability to understand comparative information, then apply it to one's own situation, interests, and needs. Being able to differentially weight the various factors under consideration (e.g., costs, benefits, different performance dimensions) according to one's needs and preferences is a complex cognitive task. Similarly, making trade-offs among the factors under consideration and bringing all the factors together into a choice are cognitively difficult. While little is known about the ability of older adults to carry out these steps in the decision process, there is evidence that aging-related changes in cognitive functioning could
2
influence these abilities (Hershey et al., 1990; Light, 1994; Meyer et al, 1993; Salthouse, 1986; Zacks & Hasher, 1997).
Older consumers face a number of barriers to being able to use comparative information
effectively to make plan choices. These multi-layered barriers range from age-related declines in cognitive and physical functioning to literacy and knowledge deficits.
Studies of cognitive aging reveal that there are age-related declines in information processing with respect to speed, memory capacity, reasoning, problem solving, and text processing (Hershey et al., 1990; Light, 1994; Meyer et al., 1993; Salthouse, 1986; Zacks & Hasher, 1997). Older adults may also have a decreased ability to ignore extraneous information (Salthouse, 1991; Salthouse 1996; Hasher & Zacks, 1988). As a result, it may be difficult for them to find the relevant information when reviewing multiple pages of text or tables. In addition, because of these cognitive changes, older adults often have difficulty in switching tasks, for example, switching from reading about differences in premiums to comparing quality measures. Poorer performance on these different cognitive tasks likely translates to poorer performance on decision making tasks (Schwarz, Park, Knauper, & Sudman, 1998). At the same time, older adults may actually perform better than younger persons on decision tasks in other ways. For example, because older adults have more life experience, they may have better everyday problem-solving skills (Cornelius & Caspi, 1987).
Almost all of the research on decision making has excluded older adults. As a result,
very little is known about how older adults integrate information into decisions and how the presentation of information affects their interpretation and use of that information (Peters, Finucane, MacGregor, & Slovic,(2000); Schwarz, Park, Knauper, & Sudman, 1998). There is general evidence that older adults seek less information about medical decisions, make important treatment decisions more quickly, and exhibit less sophisticated reasoning about decisions (Meyer, Russo, & Talbot, 1995; Park et al., 1999). There also appears to be a high degree of diversity of functioning in this population (Park, Morrell, & Shifren, 1999). One source of this diversity may be variation in the rate of decline in cognitive function. There are a variety of reasons for this heterogeneity, including variation in physiological functioning, the presence of multiple comorbidities, differences in life experience, and differences in social history and ethnic background. This diversity suggests that some older adults will be competent at using comparative information to inform their choices, while others will need substantial help.
In addition to age-related cognitive changes, knowledge deficits about the health care
delivery system are barriers to older adults making informed health plan choices. Most Medicare beneficiaries have low levels of knowledge about Medicare and the different options they have within the program (McGee, Sofaer, & Kreling 1996). To be able to decide between the original Medicare program and a Medicare managed care plan, beneficiaries need to understand what the differences are. Hibbard et al. (1998) found that knowledge levels about these differences were very low in high penetration Medicare managed care markets. Those enrolled in managed care plans had significantly lower knowledge levels than did beneficiaries in the original Medicare program.
Educational and literacy levels are other factors that affect the ability to use comparative

3
information in making choices. The National Adult Literacy Survey (National Center for Education Statistics, 1999) estimates that 39 percent of those age 60 and older function at the lowest literacy level (level 1), compared to 16 percent of the total population who function at this level. Those at literacy level 1 cannot read at all or can locate only one piece of specific information in short, uncomplicated text, such as a short newspaper article. The literacy study also indicates that a high percentage of those age 65 and older have difficulty reading tables, charts, and graphs.
Methods
Study Design, Sample, and Data Collection. This study employs a cross-sectional analysis to address the research questions. The study uses a convenience sample of 253 Medicare beneficiaries. Participants were recruited and paid for their participation. Recruitment and data collection took place primarily at Eugene/Springfield, Oregon senior centers. Participants were asked to review information and complete several decision tasks related to using comparative information in making health plan selections.
Only aged Medicare beneficiaries were included, and there was no upper age limit on
participation. Because recruitment took place at community centers, homebound and institutionalized beneficiaries were de facto excluded.
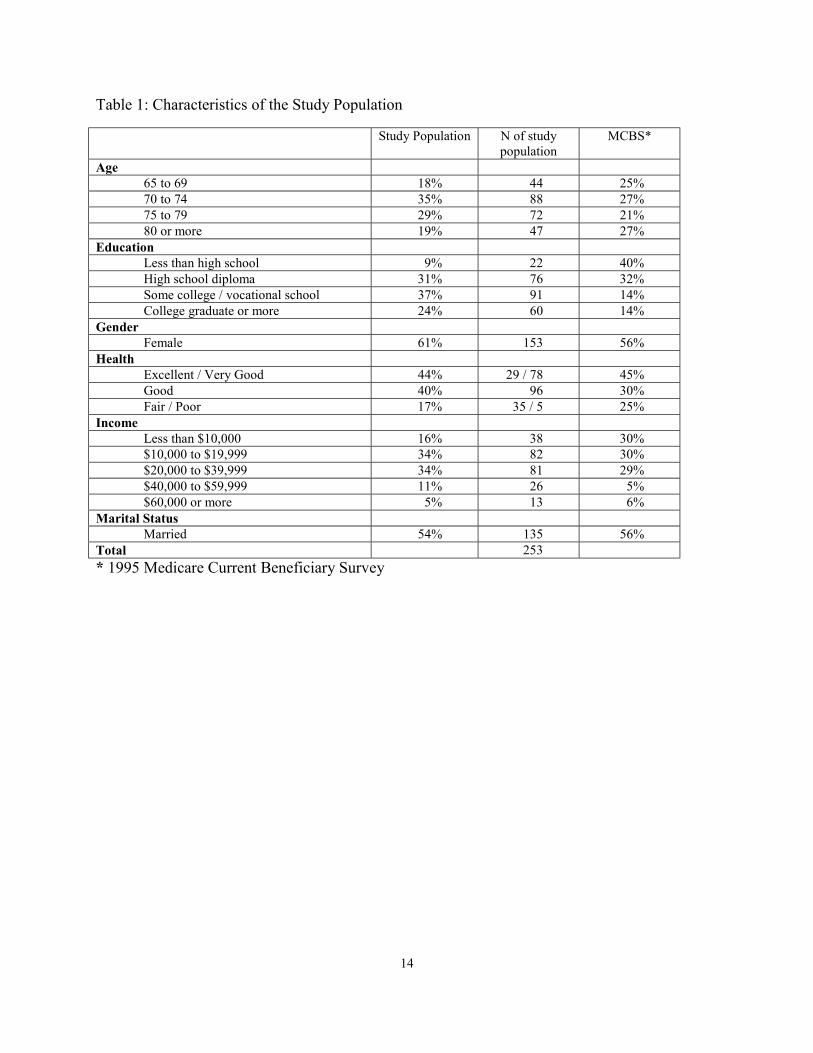
Table 1 shows the characteristics of the study sample and how it compares to a nationally
representative sample of Medicare beneficiaries (Medicare Current Beneficiary Survey [MCBS], 1995). Study participants are on average 75 years old. Ages range from 65-94 years (Table 1). Sixty-one percent of the study population are female. Twenty-four percent have a college degree or higher, while only 9 percent have less than a high school education. A similar pattern is found with regard to household income. Only 17 percent of the study population rate their health as fair or poor. The study sample is younger, has higher educational levels, and reports better health than that of the Medicare population as a whole. Thus, the sample is likely higher functioning than is the Medicare population as a whole.
Variables. The main dependent variable is the comprehension index that assesses the ability to
accurately interpret and use comparative information. This index examines whether participants can correctly understand the information presented in tables, charts, and text form. It also assesses ability to make optimal choices when viewing unambiguous data.
The comprehension index summarizes performance on 35 decision tasks (see Appendix C). These decisions involved interpretation of data presented in different ways, including interpreting text, bar graphs, tables with numbers, and data displays that use symbols instead of numbers. The score on the comprehension index represents the number of errors made in interpreting unambiguous data and/or making suboptimal choices, such as choosing lower-performing plans within given cost strata. The score on the comprehension index measures the respondent’s ability to accurately use comparative
4
information. Variables used as validity checks to the comprehension skill index. Two variables that, on their face, would seem to be related to the comprehension skill index are used to assess construct validity.
• Self-rated skill in using comparative information in choices is a single item with these response categories: excellent, good, fair, and poor.
• Self-rated ability to understand the differences between Medicare HMOs and original Medicare is a single item with these response categories: excellent, good, fair, and poor.
Predictor variables include social, demographic, and health status measures. In addition, we developed several indices to assess experiences with decision making, and an index for possible use as a screening tool. The indices are listed below.
The decision burden index is a simple summated index based on a factor analysis. The seven items in the index focus on the degree to which choices and decisions are viewed as burdensome by study participants. Index scores range from 7-28, with a mean of 17. A higher index score indicates a greater perceived burden associated with making Medicare choices. The index is reliable with a Cronbach's alpha of .8. The seven items are: • I prefer not to have the responsibility for choosing. • I am more likely to make a wrong choice if I have lots of different options
to choose from. • Choosing a Medicare health plan is a task I would rather avoid. • I often feel overwhelmed because there is too much information about
each health plan to take in. • I have difficulty understanding all the information about each Medicare
health plan. • Whenever I make a choice, I worry it will be the wrong one. • Instead of choosing myself, I'd rather have a family member or close friend
help me decide which Medicare plan to choose.
Desire for choice/information are two separate items that ask about wanting choice and information to support Medicare choices: • I am more likely to make a good choice if I have lots of different options to
choose from. (Strongly Agree, Agree, Disagree, Strongly Disagree) • I prefer to have lots of information about each Medicare health plan choice.
(Strongly Agree, Agree, Disagree, Strongly Disagree) Seeking decision assistance is measured using two separate items. One asks about the likelihood of seeking help in the coming year. The other item asks the respondents whether they have ever sought assistance. Both items have four response categories; however, because of low responses to some categories, only dichotomized versions of the
5
items are shown in the analysis: • If you had to make a choice of a Medicare health plan in the coming year, how
much assistance would you seek in making that choice? • Have you ever sought assistance when you needed to choose a health plan?
The screening index is a three-item index made up of education, age, and self-rated health. It is highly related to the comprehension skill index, and is used in the analysis as a proxy measure for comprehension skill. It is also used to estimate the prevalence of comprehension skill deficits in the Medicare population. The index is constructed using an additive non-linear approach with the weighting derived from regression analysis. The index ranges from 3-17. Scoring is: age: (65-69=1), (70-75=2), (75-79=3), (80+=7); education: (post college=1), (college=2), (some college=3), (high school=3), (less than high school=5); Self-rated health: (excellent=1), (very good=2), (good=3), (fair=4), (poor=5).
Findings • How can we measure decision skill among Medicare beneficiaries?
Making decisions requires skills in several areas: Being able to interpret unambiguous data correctly is the lowest level skill involved in using information for decision making. Most comparative information includes multiple factors and often has no obvious dominant choice. Decision making requires accurate interpretation, as well as much higher-level skills. These include being able to identify the important factors to integrate into a decision; making trade-offs; and bringing all the factors together and weighting them in ways that match one's individual needs and values. The comprehension index was originally conceptualized as a way of capturing a range of these skills. However, it became clear that the lowest-level skill, just being able to interpret unambiguous data comparing options on one dimension, was a serious barrier for a significant portion of the study population. Thus, we have focused our measurement and assessment of comprehension on this most basic level of performance.
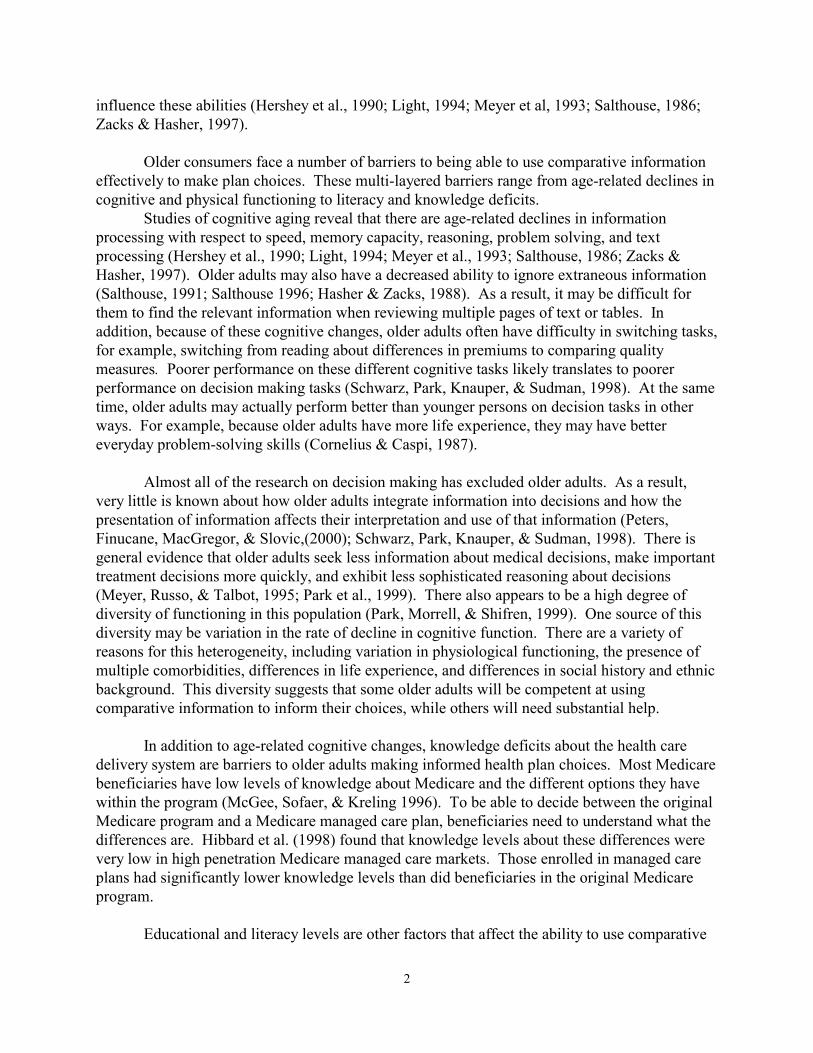
Reliability and validity of comprehension index. A preliminary index to assess
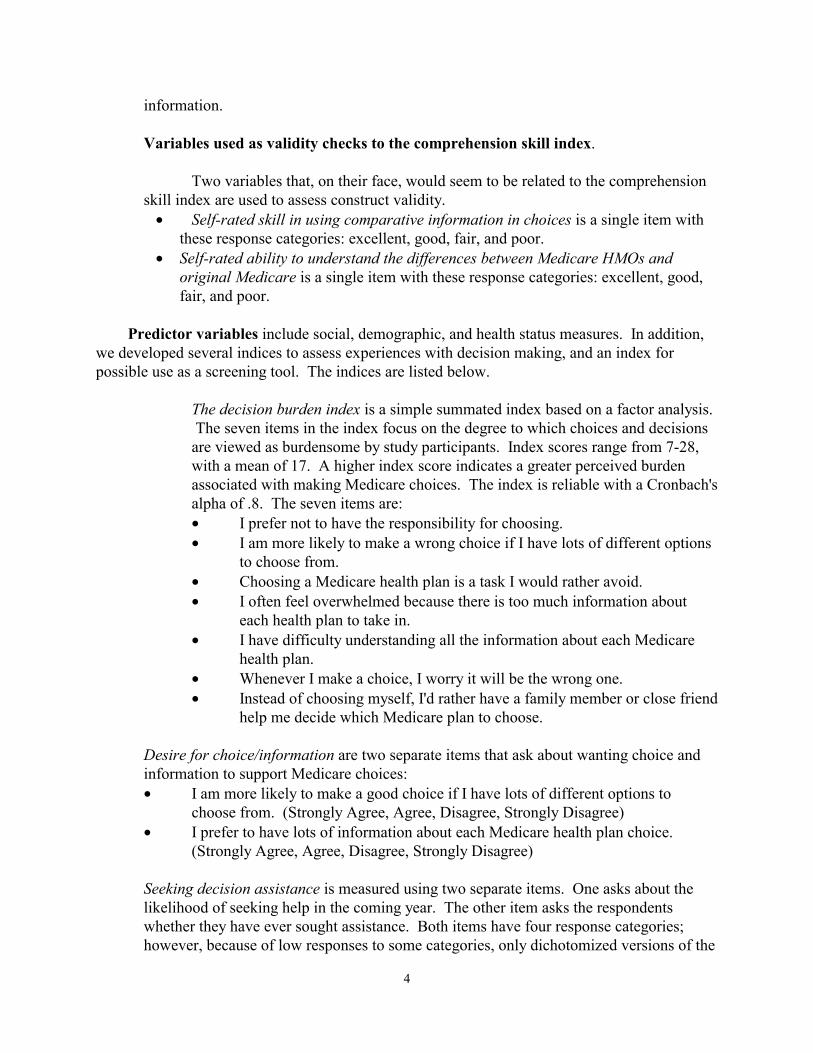
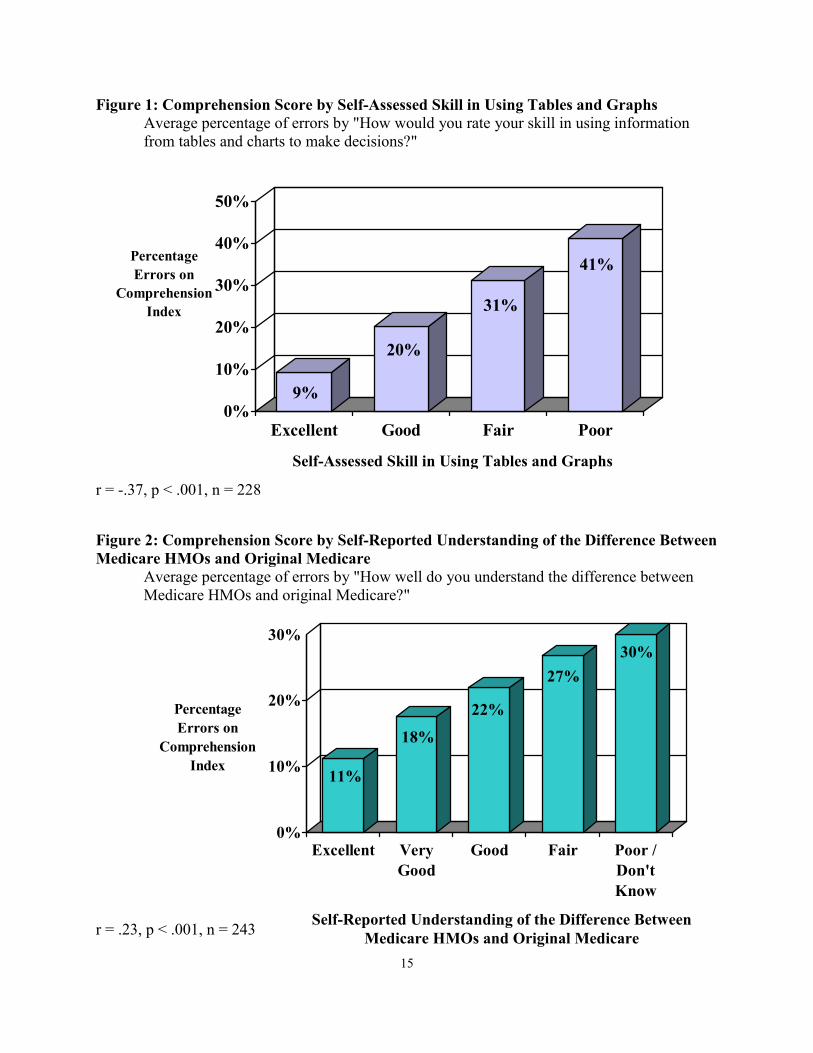
comprehension was created. The 35-item index is highly reliable with a Cronbach's alpha of .9. One indication of the validity of the comprehension index is whether it correlates with other measures that also measure ability to understand and use information. Two factors were chosen for this validity check: (1) self-rated skill in using comparative information; and (2) self-assessed understanding of the differences between original and Medicare managed care. In fact, both factors are highly correlated with the comprehension index score. Those who have poorer skills seem to recognize their lesser skill and rate themselves lower (Figure 1).1 At the same time, those who say that they have a poor understanding of the differences between original and Medicare managed care also tend to score poorly on the comprehension index (Figure 2). That is, those who are more confused about Medicare also have more difficulty 1. The item asking respondents to rate their own skill came after they had been asked to complete several decision tasks using comparative information. It is possible that their rating might have been different if they had been asked to rate their decision skill prior to the decision tasks.
6
understanding comparative information about the health plan options. • Are there differences among Medicare beneficiaries in terms of their comprehension
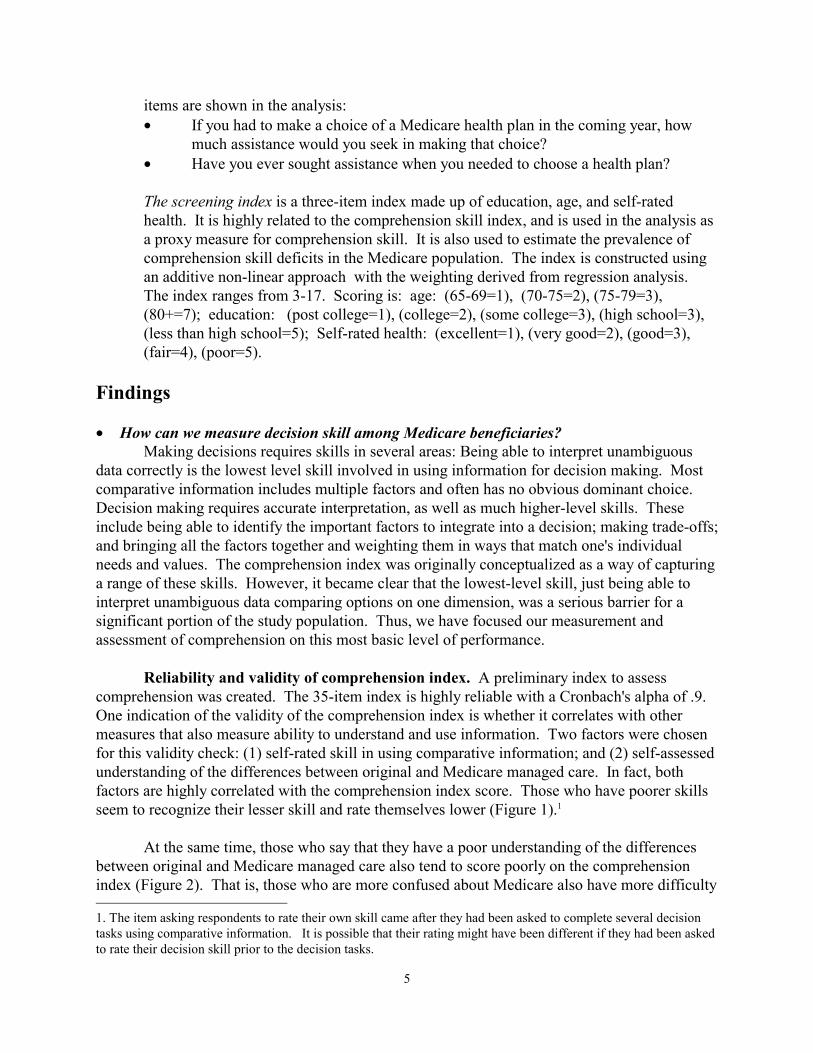
skills? An initial examination of the comprehension index indicates that there is a high degree of
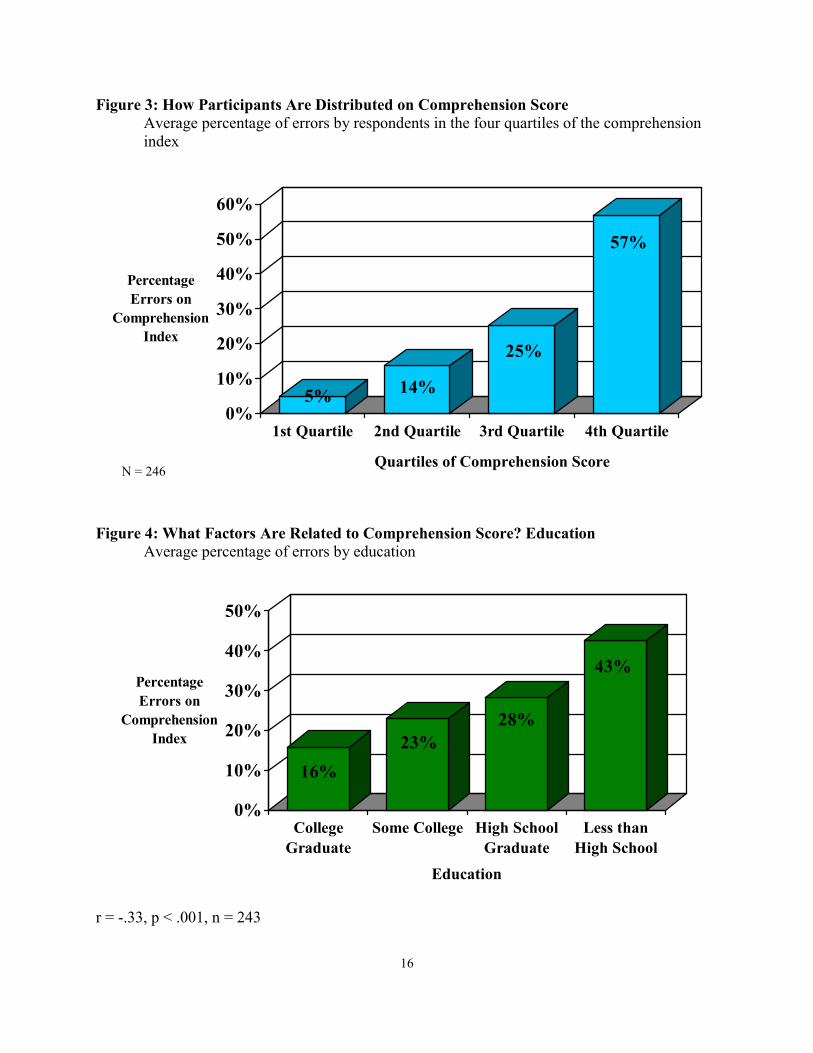
variability within the older population concerning their ability to interpret information accurately (Figure 3). Out of 35 decision tasks, the average number of errors was 8.7, or a 25 percent error rate. The range of performance on these tasks was 0 errors to 28 errors. Those in the bottom quartile of performance had an average of a 57 percent error rate, while those in the top quartile averaged only 5 percent errors.
Because the study population was recruited from local senior centers, the participants are
socially active and engaged. They are overall in better health, have higher educational levels, and are younger than the general Medicare population is (Table 1). Thus, participants are likely better functioning than the larger beneficiary population is. This is important to keep in mind in reviewing the level of skill observed within the study population. • What beneficiary characteristics predict skill?
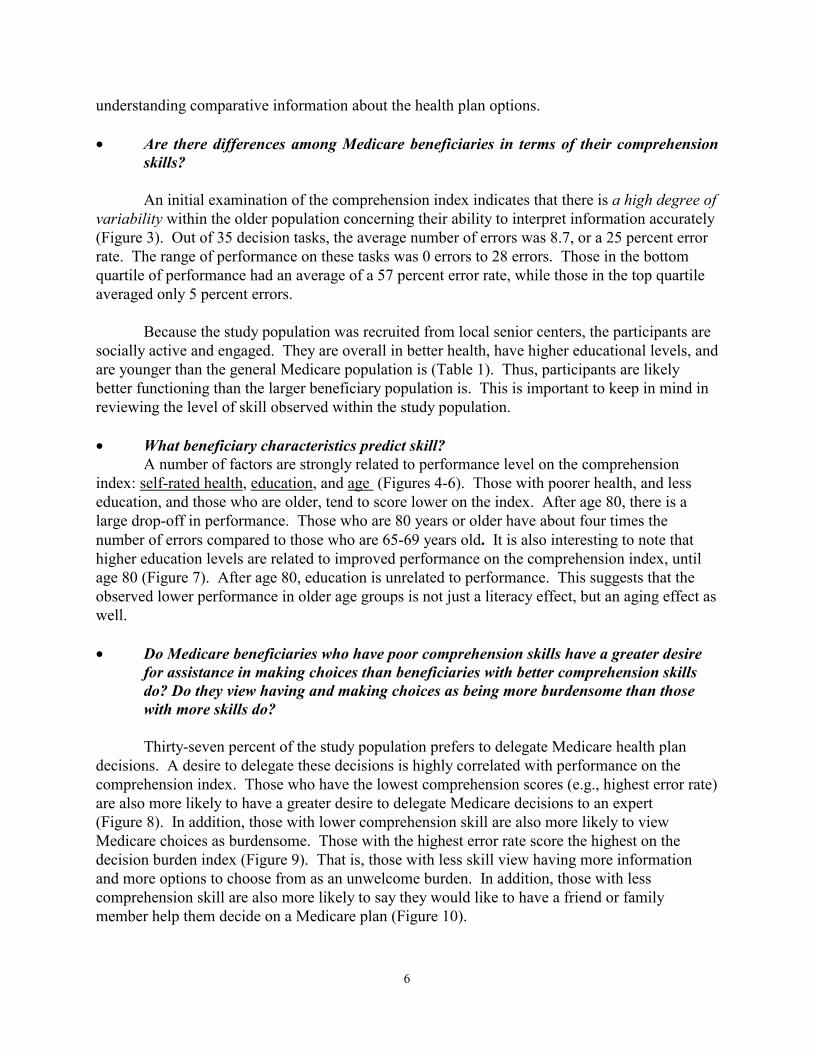
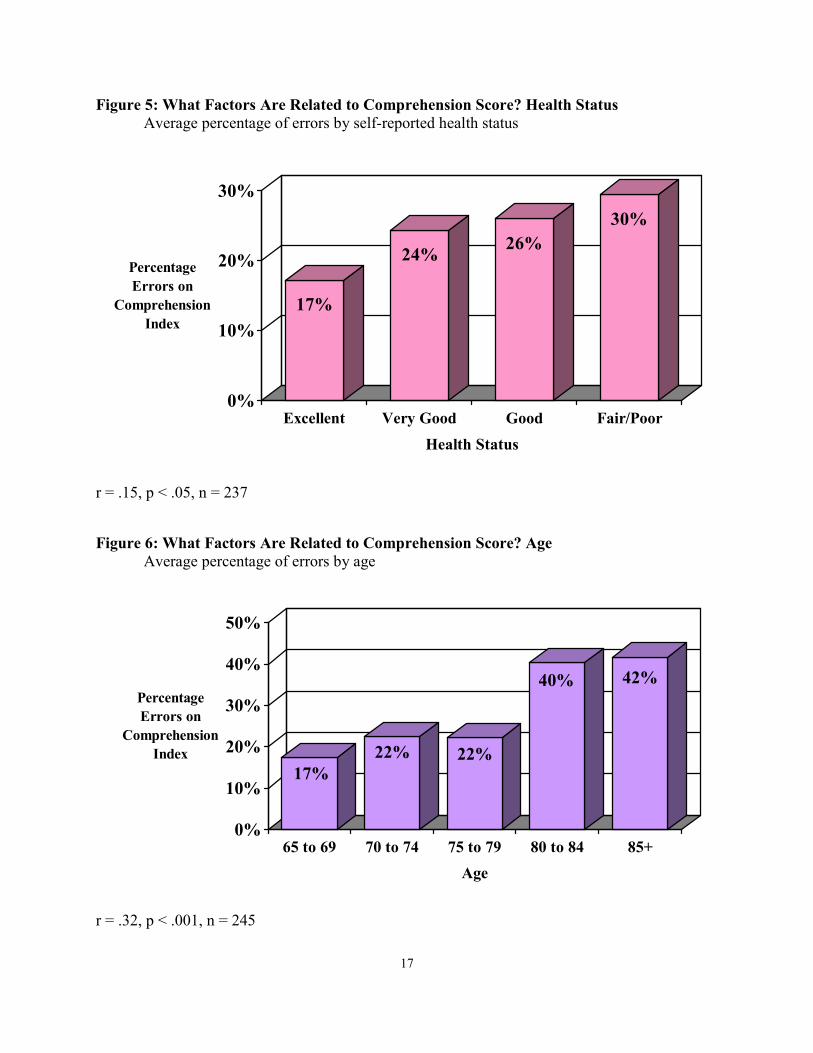
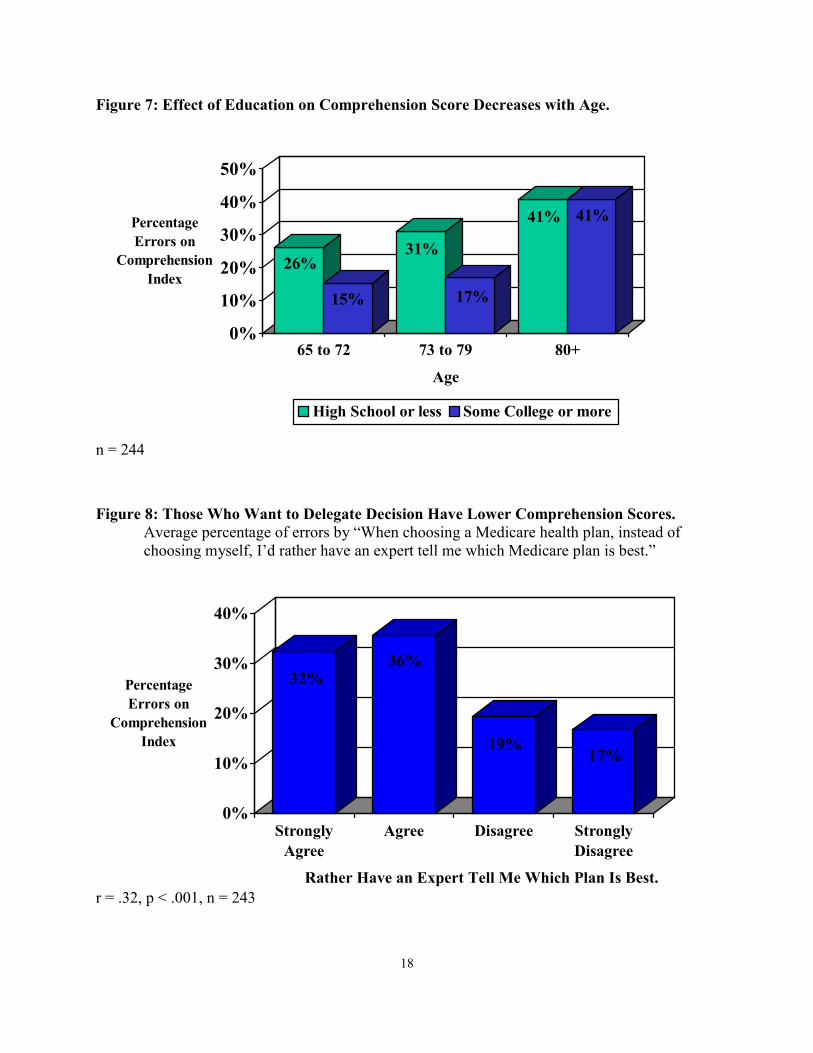
A number of factors are strongly related to performance level on the comprehension index: self-rated health, education, and age (Figures 4-6). Those with poorer health, and less education, and those who are older, tend to score lower on the index. After age 80, there is a large drop-off in performance. Those who are 80 years or older have about four times the number of errors compared to those who are 65-69 years old. It is also interesting to note that higher education levels are related to improved performance on the comprehension index, until age 80 (Figure 7). After age 80, education is unrelated to performance. This suggests that the observed lower performance in older age groups is not just a literacy effect, but an aging effect as well.
• Do Medicare beneficiaries who have poor comprehension skills have a greater desire
for assistance in making choices than beneficiaries with better comprehension skills do? Do they view having and making choices as being more burdensome than those with more skills do?
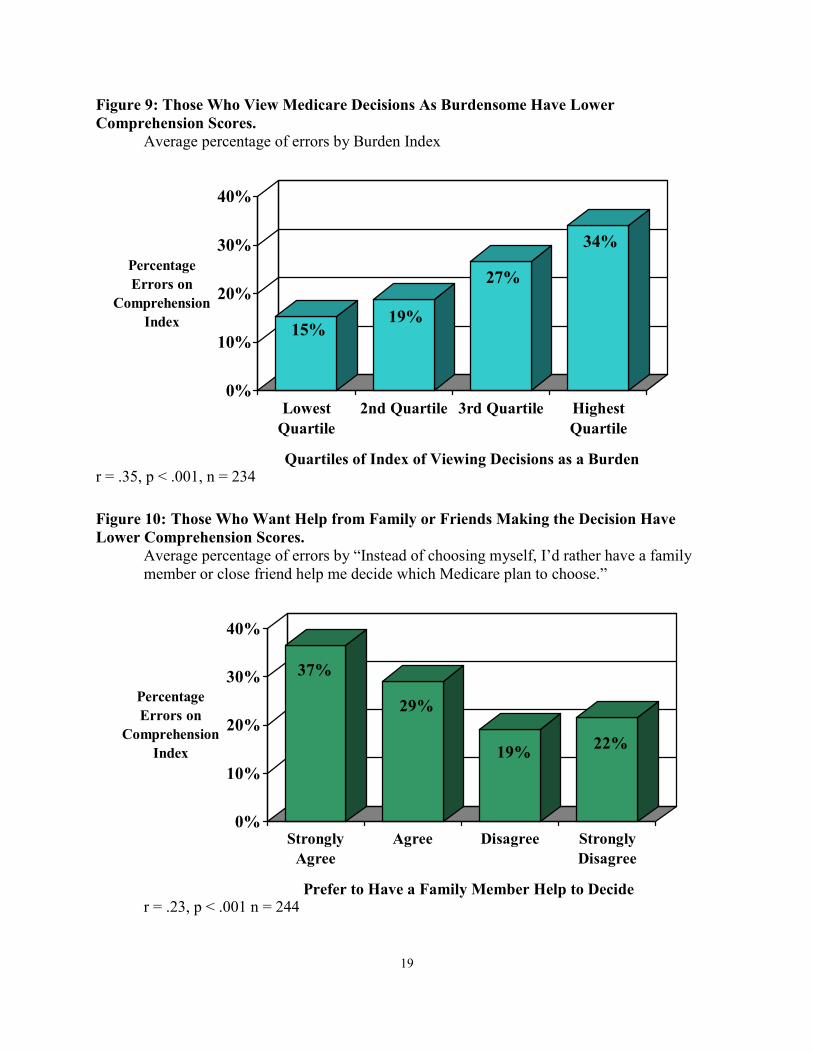
Thirty-seven percent of the study population prefers to delegate Medicare health plan decisions. A desire to delegate these decisions is highly correlated with performance on the comprehension index. Those who have the lowest comprehension scores (e.g., highest error rate) are also more likely to have a greater desire to delegate Medicare decisions to an expert (Figure 8). In addition, those with lower comprehension skill are also more likely to view Medicare choices as burdensome. Those with the highest error rate score the highest on the decision burden index (Figure 9). That is, those with less skill view having more information and more options to choose from as an unwelcome burden. In addition, those with less comprehension skill are also more likely to say they would like to have a friend or family member help them decide on a Medicare plan (Figure 10).
7
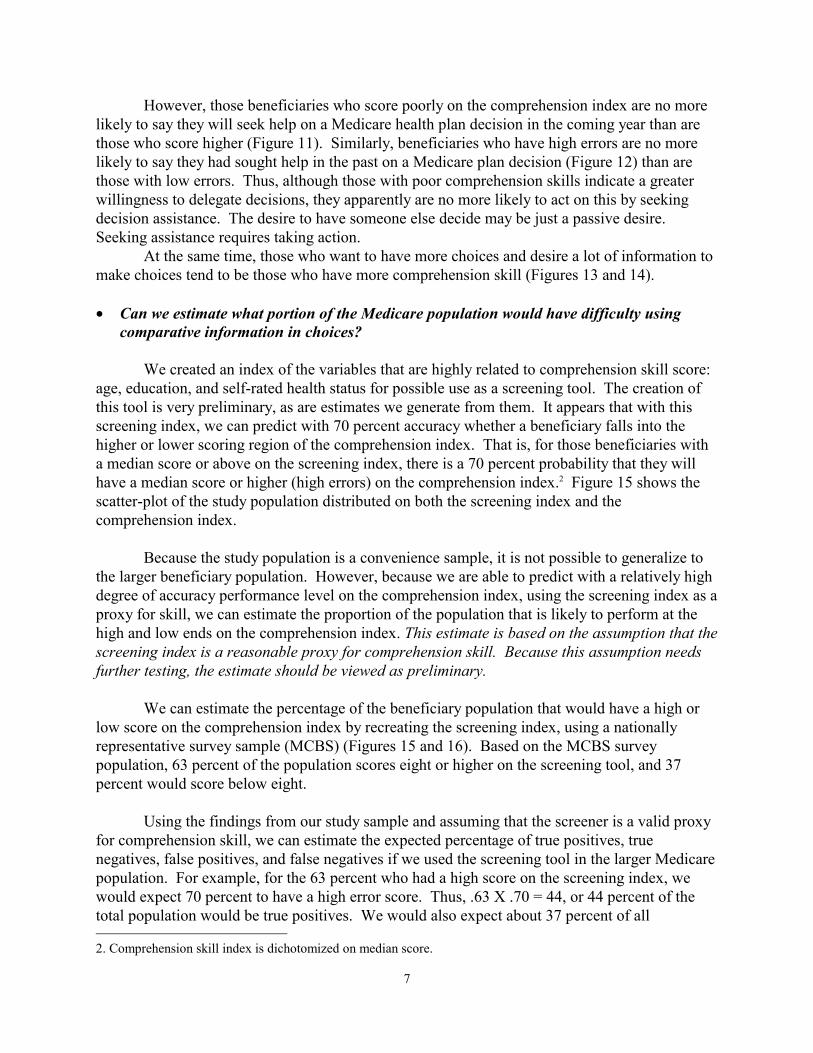
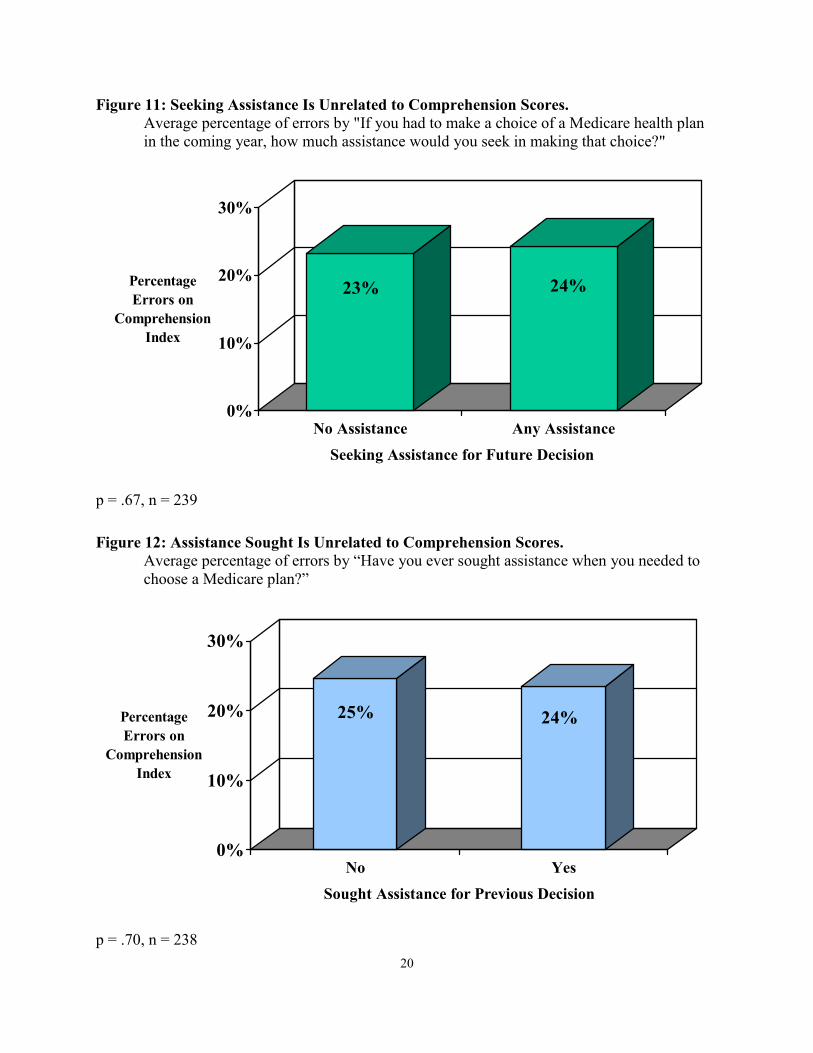
However, those beneficiaries who score poorly on the comprehension index are no more likely to say they will seek help on a Medicare health plan decision in the coming year than are those who score higher (Figure 11). Similarly, beneficiaries who have high errors are no more likely to say they had sought help in the past on a Medicare plan decision (Figure 12) than are those with low errors. Thus, although those with poor comprehension skills indicate a greater willingness to delegate decisions, they apparently are no more likely to act on this by seeking decision assistance. The desire to have someone else decide may be just a passive desire. Seeking assistance requires taking action.
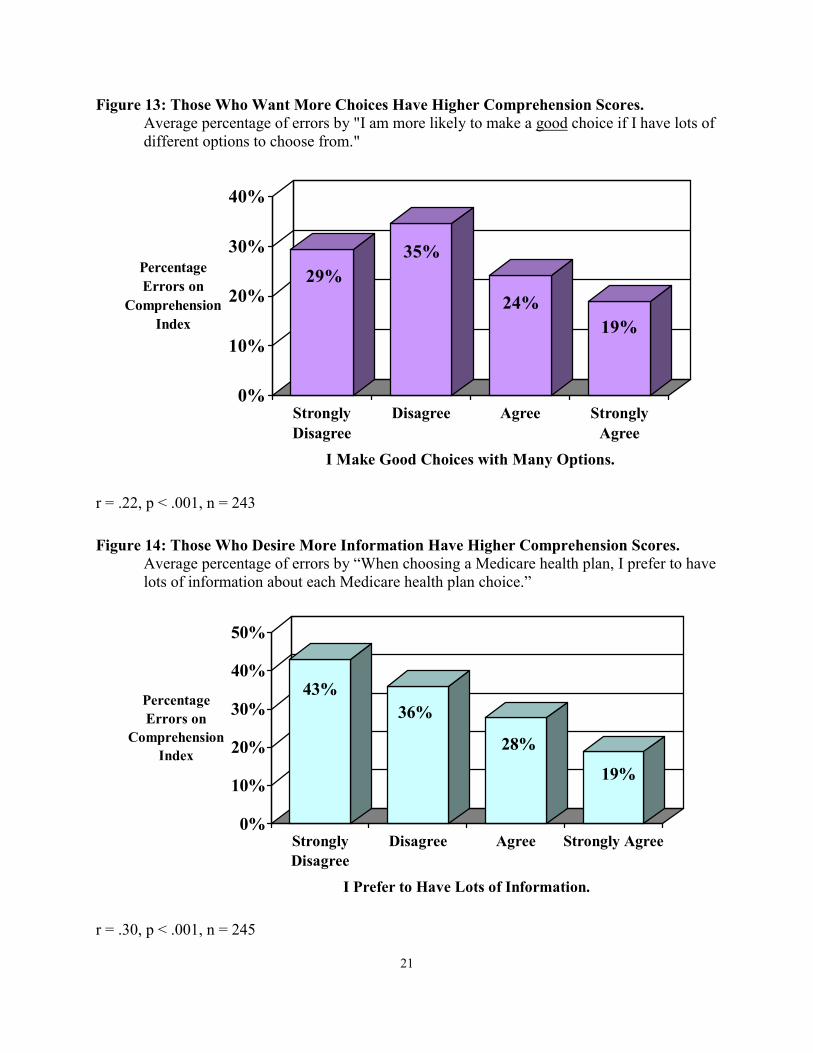
At the same time, those who want to have more choices and desire a lot of information to make choices tend to be those who have more comprehension skill (Figures 13 and 14).
• Can we estimate what portion of the Medicare population would have difficulty using
comparative information in choices? We created an index of the variables that are highly related to comprehension skill score:
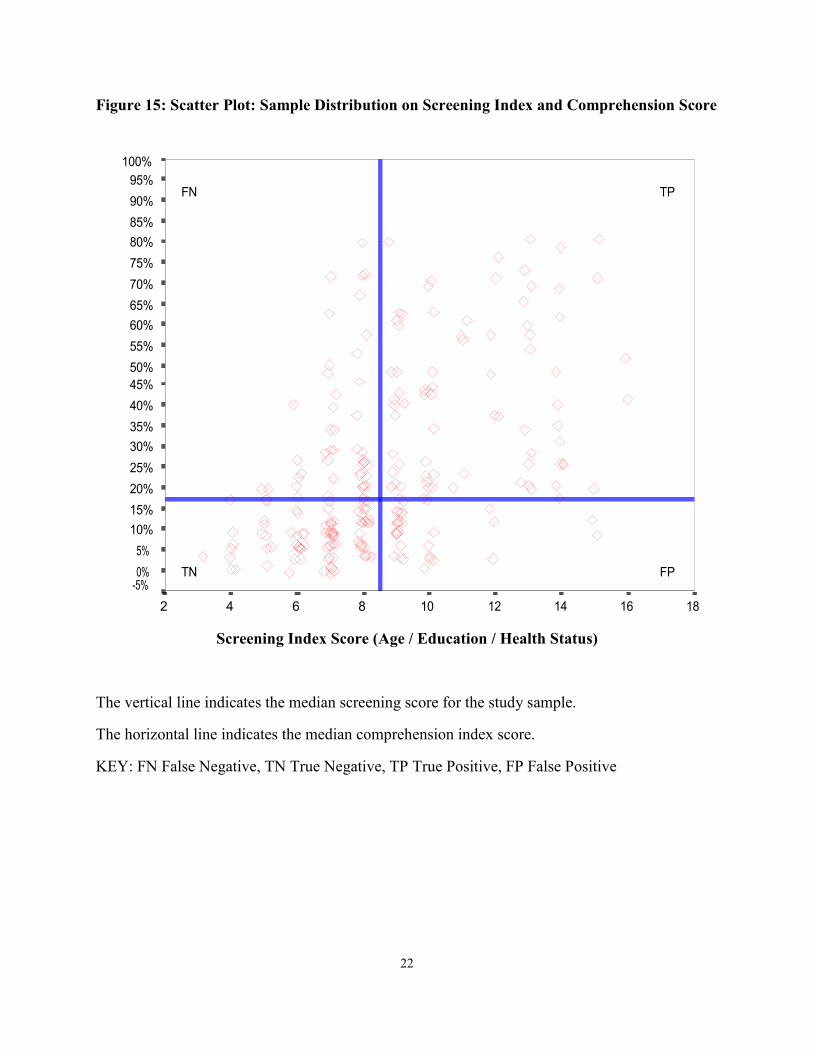
age, education, and self-rated health status for possible use as a screening tool. The creation of this tool is very preliminary, as are estimates we generate from them. It appears that with this screening index, we can predict with 70 percent accuracy whether a beneficiary falls into the higher or lower scoring region of the comprehension index. That is, for those beneficiaries with a median score or above on the screening index, there is a 70 percent probability that they will have a median score or higher (high errors) on the comprehension index.2 Figure 15 shows the scatter-plot of the study population distributed on both the screening index and the comprehension index.
Because the study population is a convenience sample, it is not possible to generalize to
the larger beneficiary population. However, because we are able to predict with a relatively high degree of accuracy performance level on the comprehension index, using the screening index as a proxy for skill, we can estimate the proportion of the population that is likely to perform at the high and low ends on the comprehension index. This estimate is based on the assumption that the screening index is a reasonable proxy for comprehension skill. Because this assumption needs further testing, the estimate should be viewed as preliminary.
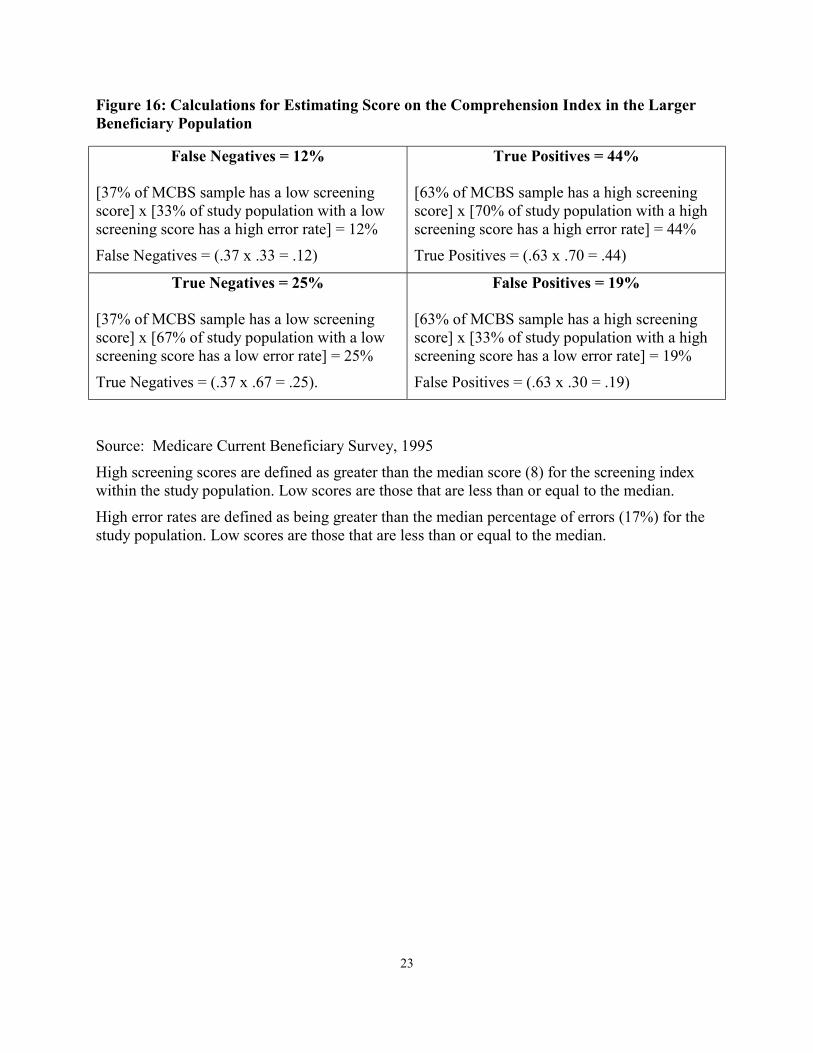
We can estimate the percentage of the beneficiary population that would have a high or
low score on the comprehension index by recreating the screening index, using a nationally representative survey sample (MCBS) (Figures 15 and 16). Based on the MCBS survey population, 63 percent of the population scores eight or higher on the screening tool, and 37 percent would score below eight.
Using the findings from our study sample and assuming that the screener is a valid proxy
for comprehension skill, we can estimate the expected percentage of true positives, true negatives, false positives, and false negatives if we used the screening tool in the larger Medicare population. For example, for the 63 percent who had a high score on the screening index, we would expect 70 percent to have a high error score. Thus, .63 X .70 = 44, or 44 percent of the total population would be true positives. We would also expect about 37 percent of all 2. Comprehension skill index is dichotomized on median score.
8
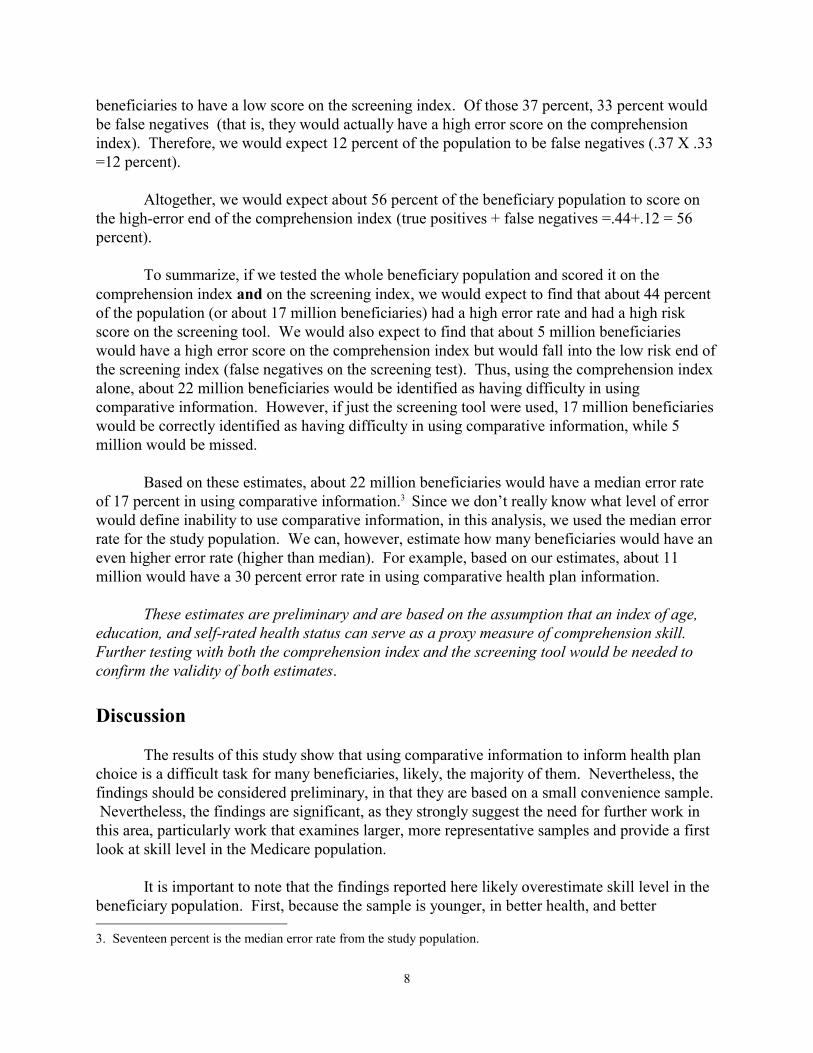
beneficiaries to have a low score on the screening index. Of those 37 percent, 33 percent would be false negatives (that is, they would actually have a high error score on the comprehension index). Therefore, we would expect 12 percent of the population to be false negatives (.37 X .33 =12 percent).
Altogether, we would expect about 56 percent of the beneficiary population to score on
the high-error end of the comprehension index (true positives + false negatives =.44+.12 = 56 percent).
To summarize, if we tested the whole beneficiary population and scored it on the
comprehension index and on the screening index, we would expect to find that about 44 percent of the population (or about 17 million beneficiaries) had a high error rate and had a high risk score on the screening tool. We would also expect to find that about 5 million beneficiaries would have a high error score on the comprehension index but would fall into the low risk end of the screening index (false negatives on the screening test). Thus, using the comprehension index alone, about 22 million beneficiaries would be identified as having difficulty in using comparative information. However, if just the screening tool were used, 17 million beneficiaries would be correctly identified as having difficulty in using comparative information, while 5 million would be missed.
Based on these estimates, about 22 million beneficiaries would have a median error rate
of 17 percent in using comparative information.3 Since we don’t really know what level of error would define inability to use comparative information, in this analysis, we used the median error rate for the study population. We can, however, estimate how many beneficiaries would have an even higher error rate (higher than median). For example, based on our estimates, about 11 million would have a 30 percent error rate in using comparative health plan information.
These estimates are preliminary and are based on the assumption that an index of age,
education, and self-rated health status can serve as a proxy measure of comprehension skill. Further testing with both the comprehension index and the screening tool would be needed to confirm the validity of both estimates. Discussion
The results of this study show that using comparative information to inform health plan
choice is a difficult task for many beneficiaries, likely, the majority of them. Nevertheless, the findings should be considered preliminary, in that they are based on a small convenience sample. Nevertheless, the findings are significant, as they strongly suggest the need for further work in this area, particularly work that examines larger, more representative samples and provide a first look at skill level in the Medicare population.
It is important to note that the findings reported here likely overestimate skill level in the
beneficiary population. First, because the sample is younger, in better health, and better 3. Seventeen percent is the median error rate from the study population.
9
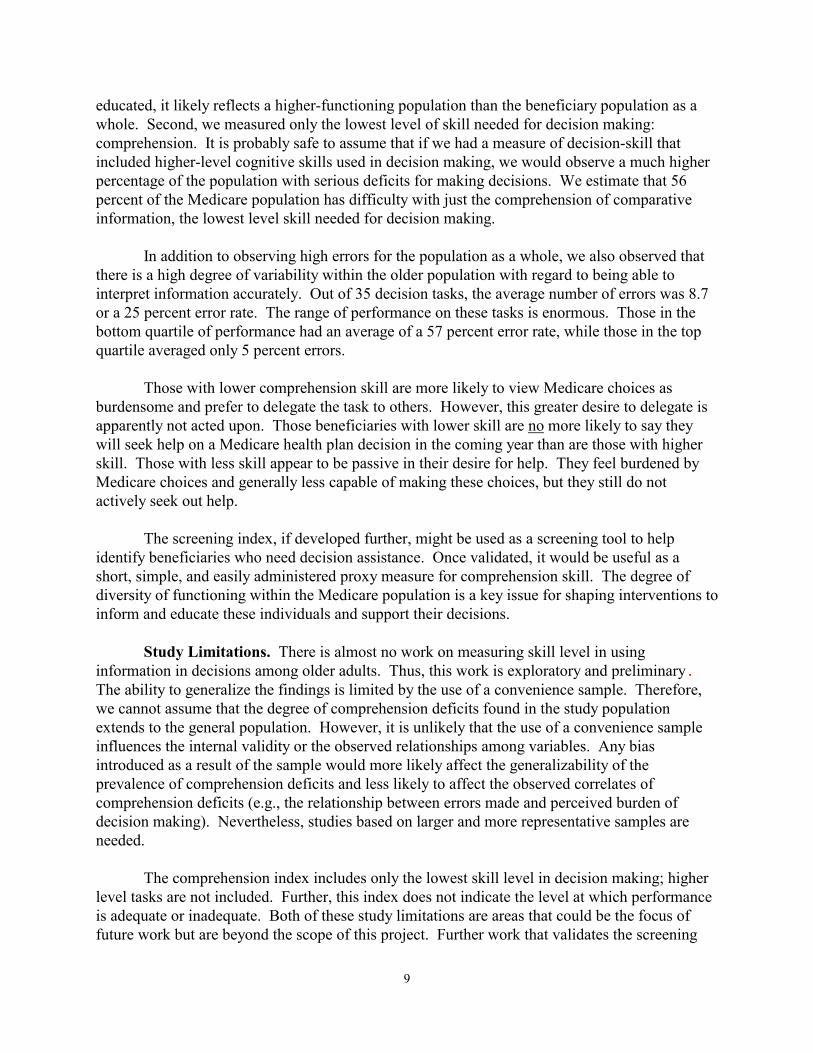
educated, it likely reflects a higher-functioning population than the beneficiary population as a whole. Second, we measured only the lowest level of skill needed for decision making: comprehension. It is probably safe to assume that if we had a measure of decision-skill that included higher-level cognitive skills used in decision making, we would observe a much higher percentage of the population with serious deficits for making decisions. We estimate that 56 percent of the Medicare population has difficulty with just the comprehension of comparative information, the lowest level skill needed for decision making.
In addition to observing high errors for the population as a whole, we also observed that
there is a high degree of variability within the older population with regard to being able to interpret information accurately. Out of 35 decision tasks, the average number of errors was 8.7 or a 25 percent error rate. The range of performance on these tasks is enormous. Those in the bottom quartile of performance had an average of a 57 percent error rate, while those in the top quartile averaged only 5 percent errors.
Those with lower comprehension skill are more likely to view Medicare choices as
burdensome and prefer to delegate the task to others. However, this greater desire to delegate is apparently not acted upon. Those beneficiaries with lower skill are no more likely to say they will seek help on a Medicare health plan decision in the coming year than are those with higher skill. Those with less skill appear to be passive in their desire for help. They feel burdened by Medicare choices and generally less capable of making these choices, but they still do not actively seek out help.
The screening index, if developed further, might be used as a screening tool to help
identify beneficiaries who need decision assistance. Once validated, it would be useful as a short, simple, and easily administered proxy measure for comprehension skill. The degree of diversity of functioning within the Medicare population is a key issue for shaping interventions to inform and educate these individuals and support their decisions.
Study Limitations. There is almost no work on measuring skill level in using
information in decisions among older adults. Thus, this work is exploratory and preliminary. The ability to generalize the findings is limited by the use of a convenience sample. Therefore, we cannot assume that the degree of comprehension deficits found in the study population extends to the general population. However, it is unlikely that the use of a convenience sample influences the internal validity or the observed relationships among variables. Any bias introduced as a result of the sample would more likely affect the generalizability of the prevalence of comprehension deficits and less likely to affect the observed correlates of comprehension deficits (e.g., the relationship between errors made and perceived burden of decision making). Nevertheless, studies based on larger and more representative samples are needed.
The comprehension index includes only the lowest skill level in decision making; higher
level tasks are not included. Further, this index does not indicate the level at which performance is adequate or inadequate. Both of these study limitations are areas that could be the focus of future work but are beyond the scope of this project. Further work that validates the screening
10
index and comprehension index is also needed. Implications for Future Research. In the present study, we constructed a preliminary
index of comprehension skill that appears to be both valid and reliable. The index assesses an individual's ability to interpret and understand comparative information for use in choices. Those who perform at the high error end of the comprehension index, making 30 percent or more errors, are clearly not capable of using comparative information in decision making on their own. However, where the cut-off should be (i.e., percentage of errors) is not clear. What is clear is that it is possible to measure at least this basic element of decision skill, and that the beneficiary population varies substantially at this most elemental level of decision skill.
The diversity in functioning strongly suggests a segmentation approach to educating,
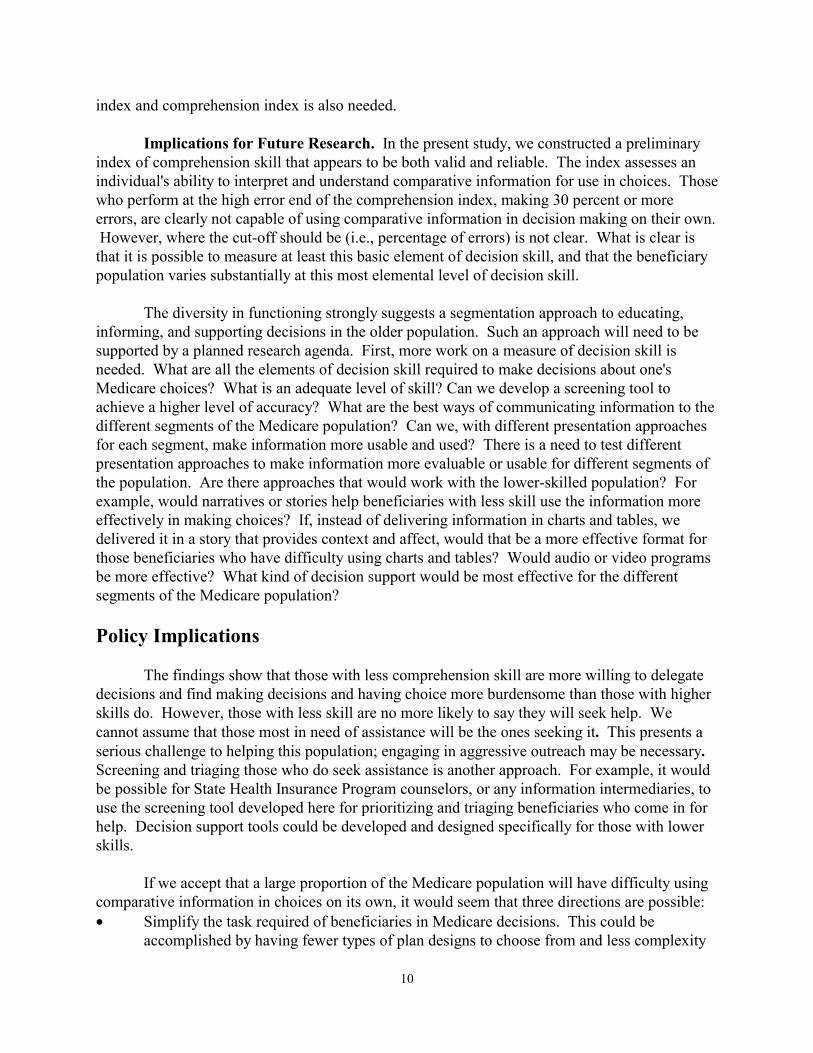
informing, and supporting decisions in the older population. Such an approach will need to be supported by a planned research agenda. First, more work on a measure of decision skill is needed. What are all the elements of decision skill required to make decisions about one's Medicare choices? What is an adequate level of skill? Can we develop a screening tool to achieve a higher level of accuracy? What are the best ways of communicating information to the different segments of the Medicare population? Can we, with different presentation approaches for each segment, make information more usable and used? There is a need to test different presentation approaches to make information more evaluable or usable for different segments of the population. Are there approaches that would work with the lower-skilled population? For example, would narratives or stories help beneficiaries with less skill use the information more effectively in making choices? If, instead of delivering information in charts and tables, we delivered it in a story that provides context and affect, would that be a more effective format for those beneficiaries who have difficulty using charts and tables? Would audio or video programs be more effective? What kind of decision support would be most effective for the different segments of the Medicare population? Policy Implications
The findings show that those with less comprehension skill are more willing to delegate
decisions and find making decisions and having choice more burdensome than those with higher skills do. However, those with less skill are no more likely to say they will seek help. We cannot assume that those most in need of assistance will be the ones seeking it. This presents a serious challenge to helping this population; engaging in aggressive outreach may be necessary. Screening and triaging those who do seek assistance is another approach. For example, it would be possible for State Health Insurance Program counselors, or any information intermediaries, to use the screening tool developed here for prioritizing and triaging beneficiaries who come in for help. Decision support tools could be developed and designed specifically for those with lower skills.
If we accept that a large proportion of the Medicare population will have difficulty using
comparative information in choices on its own, it would seem that three directions are possible: • Simplify the task required of beneficiaries in Medicare decisions. This could be
accomplished by having fewer types of plan designs to choose from and less complexity
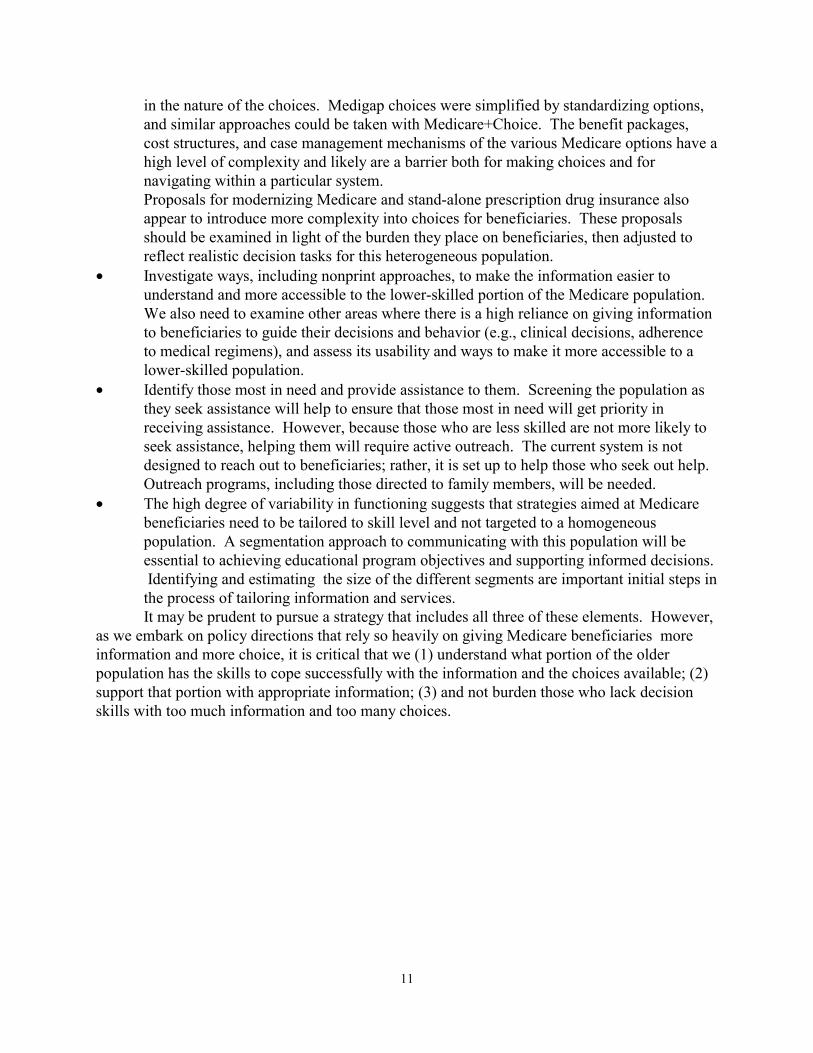
11
in the nature of the choices. Medigap choices were simplified by standardizing options, and similar approaches could be taken with Medicare+Choice. The benefit packages, cost structures, and case management mechanisms of the various Medicare options have a high level of complexity and likely are a barrier both for making choices and for navigating within a particular system.
Proposals for modernizing Medicare and stand-alone prescription drug insurance also appear to introduce more complexity into choices for beneficiaries. These proposals should be examined in light of the burden they place on beneficiaries, then adjusted to reflect realistic decision tasks for this heterogeneous population.
• Investigate ways, including nonprint approaches, to make the information easier to understand and more accessible to the lower-skilled portion of the Medicare population. We also need to examine other areas where there is a high reliance on giving information to beneficiaries to guide their decisions and behavior (e.g., clinical decisions, adherence to medical regimens), and assess its usability and ways to make it more accessible to a lower-skilled population.
• Identify those most in need and provide assistance to them. Screening the population as they seek assistance will help to ensure that those most in need will get priority in receiving assistance. However, because those who are less skilled are not more likely to seek assistance, helping them will require active outreach. The current system is not designed to reach out to beneficiaries; rather, it is set up to help those who seek out help. Outreach programs, including those directed to family members, will be needed.
• The high degree of variability in functioning suggests that strategies aimed at Medicare beneficiaries need to be tailored to skill level and not targeted to a homogeneous population. A segmentation approach to communicating with this population will be essential to achieving educational program objectives and supporting informed decisions. Identifying and estimating the size of the different segments are important initial steps in the process of tailoring information and services. It may be prudent to pursue a strategy that includes all three of these elements. However,
as we embark on policy directions that rely so heavily on giving Medicare beneficiaries more information and more choice, it is critical that we (1) understand what portion of the older population has the skills to cope successfully with the information and the choices available; (2) support that portion with appropriate information; (3) and not burden those who lack decision skills with too much information and too many choices.
12
Bibliography
Cornelius, S.W., & Caspi, A.(1987). “Everyday Problem Solving in Adulthood and Old Age”. Psychology & Aging, 2 (2), 144-153.
Hasher, L., & Zacks, R. T (1988). “Working Memory, Comprehension, and Aging: A Review and a New View. ” In G.H. Bower (Ed.), The Psychology of Learning and Motivation (p.p. 193-225). New York: Academic Press.
Hershey, D. A., Walsh, D. A., Read, S. J., & Chulef, A. A. (1990). “The Effects of Expertise on Financial Problem Solving: Evidence for Goal-Directed, Problem Solving Scripts.” Organizational Behavior and Human Decision Processes, 46, 77-101.
Hibbard, J., H., & Jewett, J. J (1997). “Will Quality Report Cards Help Consumers?” Health Affairs, 16, 218-228.
Hibbard, J. H., Jewett, J. J., Engelmann, S., & Tusler, M (1998). “Can Medicare Beneficiaries Make Informed Choices.” Health Affairs, 17, 181-193.
Hibbard, J. H., Sofaer, S., & Jewett, J. J (1996). “Condition-Specific Performance Information: Assessing Salience, Comprehension, and Approaches for Communicating Quality.” Health care Financing Review, 18, 95-109.
Kleimann, S., Bernstein, J., & Gluck, M. (1998). Medicare Choices in California. Washington, DC: National Academy of Social Insurance.
Light, L.L (1996). “Memory and Aging.” in E. L. Bjork & R. A. Bjork (Eds.), Handbook of Perception and Cognition, vol. 10, Memory. (pp.443-490). San Diego, California: Academic Press.
McGee, J., Sofaer, S., & Kreling, B. (1996) Findings from Focus Groups Conducted for The National Committee for Quality Assurance (NCQA). Medicare and Medicaid Consumer Information Projects. Washington, DC: The National Committee for Quality Assurance.
Meyer, B. J. F., Marsiske, M., & Willis, S. L. (1993). “Text Processing Variables Predict the Readability of Everyday Documents Read by Older Adults.” Reading Research Quarterly, 28, 234-249.
Meyer, B., J. F., Russo, C., & Talbot, A. (1995). “Discourse Comprehension and Problem Solving: Decisions About the Treatment of Breast Cancer by Women Across the Life Span. Psychology and Aging, 10, 84-103.
National Center for Education Statistics. (1999) 1992 National Adult Literacy Survey: Interpreting the Adult Literacy Scales and Literacy Levels. Washington, DC.
13
Park, D. C. (1999). “Aging and the Controlled and Automatic Processing of Medical Information and Medical Intentions.” In D. C. Park, R. W. Morrell, & K.Shifren (Eds.), Processing of Medical Information in Aging Patients: Cognitive and Human Factors Perspectives. Mahwah, NJ: Erlbaum.
Park, D. C., Morrell, R. W., & Shifren, K. (Eds.), (1999). Processing of Medical Information in Aging Patients: Cognitive and Human Factors Perspectives. Mahwah, NJ: Erlbaum.
Peters, E., Finucane, M.L. , MacGregor, D. M. & Slovic, P. (2000). “The bearable lightness of aging: Judgment and decision processes in older adults.” In National Research Council (Ed.), The aging mind: Opportunities in cognitive research (Appendix C). Washington, DC: National Academy Press.
Salthouse, T. A. (1991). Theoretical Perspectives on Cognitive Aging. Hillsdale, NJ: Erlbaum.
Salthouse, T. A. (1996). “The Processing Speed Theory of Adult Age Differences in Cognition.” Psychological Review, 103, 403-428.
Schwarz, N., Park, D. C., Knauper, B., & Sudman, S. (1998). Cognition, Aging, and Self-Reports. Philadelphia. Psychology Press.
Zacks, R. T., & Hasher, L. (1997). “Cognitive Gerontology and Attentional Inhibition: A Reply to Burke and McDowd” Journal of Gerontology: Psychological Sciences, 52B, 274-283.
14
Table 1: Characteristics of the Study Population
Study Population N of study population
MCBS*
Age 65 to 69 18% 44 25% 70 to 74 35% 88 27% 75 to 79 29% 72 21% 80 or more 19% 47 27% Education Less than high school 9% 22 40% High school diploma 31% 76 32% Some college / vocational school 37% 91 14% College graduate or more 24% 60 14% Gender Female 61% 153 56% Health Excellent / Very Good 44% 29 / 78 45% Good 40% 96 30% Fair / Poor 17% 35 / 5 25% Income Less than $10,000 16% 38 30% $10,000 to $19,999 34% 82 30% $20,000 to $39,999 34% 81 29% $40,000 to $59,999 11% 26 5% $60,000 or more 5% 13 6% Marital Status Married 54% 135 56% Total 253 * 1995 Medicare Current Beneficiary Survey
15
Figure 1: Comprehension Score by Self-Assessed Skill in Using Tables and Graphs Average percentage of errors by "How would you rate your skill in using information from tables and charts to make decisions?"
r = -.37, p < .001, n = 228
Figure 2: Comprehension Score by Self-Reported Understanding of the Difference Between Medicare HMOs and Original Medicare
Average percentage of errors by "How well do you understand the difference between Medicare HMOs and original Medicare?"
r = .23, p < .001, n = 243
9%
20%
31%
41%
0%
10%
20%
30%
40%
50%
PercentageErrors on
Comprehension Index
PoorFairGoodExcellent
11%
18%
22%
27%30%
0%
10%
20%
30%
PercentageErrors on
Comprehension Index
Excellent VeryGood
Good Fair Poor /Don'tKnow
Self-Assessed Skill in Using Tables and Graphs
Self-Reported Understanding of the Difference Between Medicare HMOs and Original Medicare
16
Figure 3: How Participants Are Distributed on Comprehension Score Average percentage of errors by respondents in the four quartiles of the comprehension index
Figure 4: What Factors Are Related to Comprehension Score? Education Average percentage of errors by education
r = -.33, p < .001, n = 243
5% 14%
25%
57%
0%
10%
20%
30%
40%
50%
60%
PercentageErrors on
Comprehension Index
1st Quartile 2nd Quartile 3rd Quartile 4th Quartile
16%23%
28%
43%
0%
10%
20%
30%
40%
50%
PercentageErrors on
Comprehension Index
Less thanHigh School
High SchoolGraduate
Some College CollegeGraduate
Education
N = 246 Quartiles of Comprehension Score
17
Figure 5: What Factors Are Related to Comprehension Score? Health Status Average percentage of errors by self-reported health status
r = .15, p < .05, n = 237
Figure 6: What Factors Are Related to Comprehension Score? Age
Average percentage of errors by age
r = .32, p < .001, n = 245
17%
24% 26%30%
0%
10%
20%
30%
PercentageErrors on
Comprehension Index
Excellent Very Good Good Fair/PoorHealth Status
17%22% 22%
40% 42%
0%
10%
20%
30%
40%
50%
PercentageErrors on
Comprehension Index
65 to 69 70 to 74 75 to 79 80 to 84 85+Age
18
Figure 7: Effect of Education on Comprehension Score Decreases with Age.
n = 244
Figure 8: Those Who Want to Delegate Decision Have Lower Comprehension Scores. Average percentage of errors by “When choosing a Medicare health plan, instead of choosing myself, I’d rather have an expert tell me which Medicare plan is best.”
r = .32, p < .001, n = 243
26%
15%
31%
17%
41% 41%
0%
10%
20%
30%
40%
50%
Percentage Errors on
Comprehension Index
65 to 72 73 to 79 80+
Age
High School or less Some College or more
32%36%
19%17%
0%
10%
20%
30%
40%
PercentageErrors on
Comprehension Index
StronglyAgree
Agree Disagree StronglyDisagree
Rather Have an Expert Tell Me Which Plan Is Best.
19
Figure 9: Those Who View Medicare Decisions As Burdensome Have Lower Comprehension Scores.
Average percentage of errors by Burden Index
r = .35, p < .001, n = 234
Figure 10: Those Who Want Help from Family or Friends Making the Decision Have Lower Comprehension Scores.
Average percentage of errors by “Instead of choosing myself, I’d rather have a family member or close friend help me decide which Medicare plan to choose.”
r = .23, p < .001 n = 244
37%
29%
19% 22%
0%
10%
20%
30%
40%
PercentageErrors on
Comprehension Index
StronglyAgree
Agree Disagree StronglyDisagree
15%19%
27%
34%
0%
10%
20%
30%
40%
PercentageErrors on
Comprehension Index
LowestQuartile
2nd Quartile 3rd Quartile HighestQuartile
Prefer to Have a Family Member Help to Decide
Quartiles of Index of Viewing Decisions as a Burden
20
Figure 11: Seeking Assistance Is Unrelated to Comprehension Scores. Average percentage of errors by "If you had to make a choice of a Medicare health plan in the coming year, how much assistance would you seek in making that choice?"
p = .67, n = 239
Figure 12: Assistance Sought Is Unrelated to Comprehension Scores. Average percentage of errors by “Have you ever sought assistance when you needed to choose a Medicare plan?”
p = .70, n = 238
23% 24%
0%
10%
20%
30%
PercentageErrors on
Comprehension Index
No Assistance Any AssistanceSeeking Assistance for Future Decision
25% 24%
0%
10%
20%
30%
PercentageErrors on
Comprehension Index
No YesSought Assistance for Previous Decision
21
Figure 13: Those Who Want More Choices Have Higher Comprehension Scores. Average percentage of errors by "I am more likely to make a good choice if I have lots of different options to choose from."
r = .22, p < .001, n = 243
Figure 14: Those Who Desire More Information Have Higher Comprehension Scores. Average percentage of errors by “When choosing a Medicare health plan, I prefer to have lots of information about each Medicare health plan choice.”
r = .30, p < .001, n = 245
43%36%
28%
19%
0%
10%
20%
30%
40%
50%
PercentageErrors on
Comprehension Index
StronglyDisagree
Disagree Agree Strongly Agree
I Prefer to Have Lots of Information.
29%35%
24%19%
0%
10%
20%
30%
40%
PercentageErrors on
Comprehension Index
StronglyDisagree
Disagree Agree StronglyAgree
I Make Good Choices with Many Options.
22
Figure 15: Scatter Plot: Sample Distribution on Screening Index and Comprehension Score
Screening Index Score (Age / Education / Health Status)
The vertical line indicates the median screening score for the study sample.
The horizontal line indicates the median comprehension index score.
KEY: FN False Negative, TN True Negative, TP True Positive, FP False Positive
Perc
ent E
rror
s on
Com
preh
ensi
on In
dex
18161412108642
100%95%90%85%80%75%70%65%60%55%50%45%40%35%30%25%20%15%10%5%0%-5%
FP
FN TP
TN
23
Figure 16: Calculations for Estimating Score on the Comprehension Index in the Larger Beneficiary Population
False Negatives = 12%
[37% of MCBS sample has a low screening score] x [33% of study population with a low screening score has a high error rate] = 12%
False Negatives = (.37 x .33 = .12)
True Positives = 44%
[63% of MCBS sample has a high screening score] x [70% of study population with a high screening score has a high error rate] = 44%
True Positives = (.63 x .70 = .44)
True Negatives = 25%
[37% of MCBS sample has a low screening score] x [67% of study population with a low screening score has a low error rate] = 25%
True Negatives = (.37 x .67 = .25).
False Positives = 19%
[63% of MCBS sample has a high screening score] x [33% of study population with a high screening score has a low error rate] = 19%
False Positives = (.63 x .30 = .19)
Source: Medicare Current Beneficiary Survey, 1995
High screening scores are defined as greater than the median score (8) for the screening index within the study population. Low scores are those that are less than or equal to the median.
High error rates are defined as being greater than the median percentage of errors (17%) for the study population. Low scores are those that are less than or equal to the median.
24
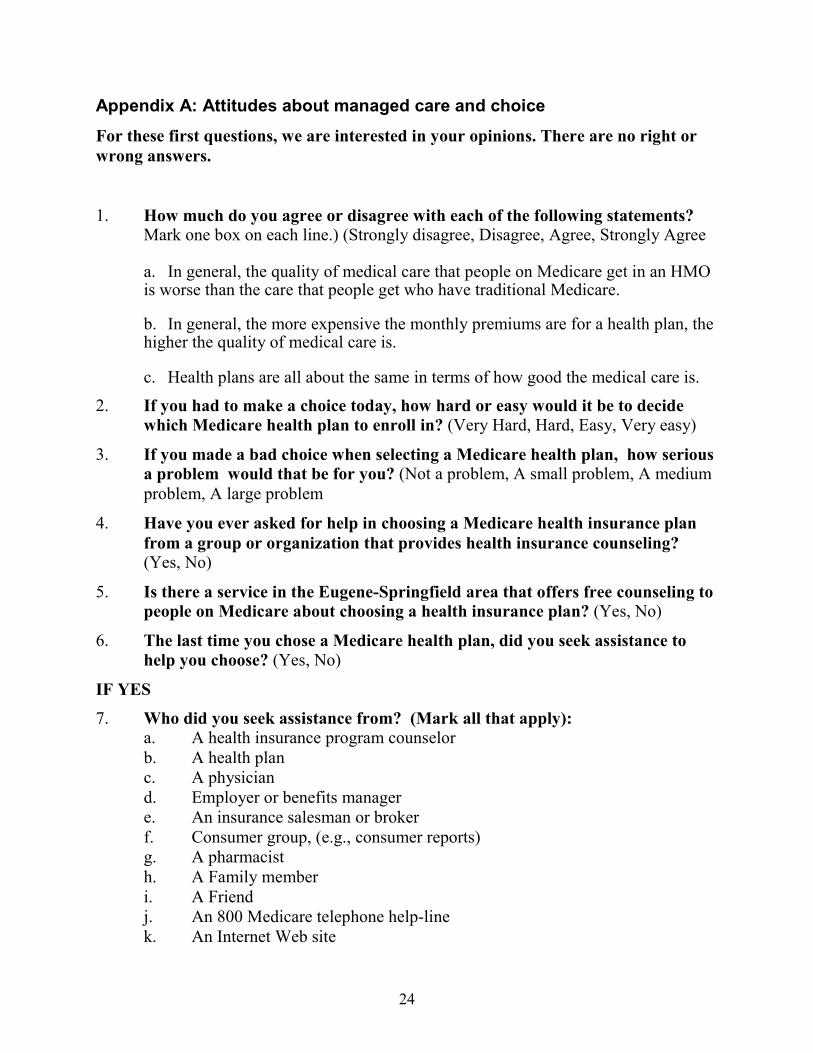
Appendix A: Attitudes about managed care and choice
For these first questions, we are interested in your opinions. There are no right or wrong answers.
1. How much do you agree or disagree with each of the following statements? Mark one box on each line.) (Strongly disagree, Disagree, Agree, Strongly Agree
a. In general, the quality of medical care that people on Medicare get in an HMO is worse than the care that people get who have traditional Medicare.
b. In general, the more expensive the monthly premiums are for a health plan, the higher the quality of medical care is.
c. Health plans are all about the same in terms of how good the medical care is.
2. If you had to make a choice today, how hard or easy would it be to decide which Medicare health plan to enroll in? (Very Hard, Hard, Easy, Very easy)
3. If you made a bad choice when selecting a Medicare health plan, how serious a problem would that be for you? (Not a problem, A small problem, A medium problem, A large problem
4. Have you ever asked for help in choosing a Medicare health insurance plan from a group or organization that provides health insurance counseling? (Yes, No)
5. Is there a service in the Eugene-Springfield area that offers free counseling to people on Medicare about choosing a health insurance plan? (Yes, No)
6. The last time you chose a Medicare health plan, did you seek assistance to help you choose? (Yes, No)
IF YES
7. Who did you seek assistance from? (Mark all that apply): a. A health insurance program counselor b. A health plan c. A physician d. Employer or benefits manager e. An insurance salesman or broker f. Consumer group, (e.g., consumer reports) g. A pharmacist h. A Family member i. A Friend j. An 800 Medicare telephone help-line k. An Internet Web site
25
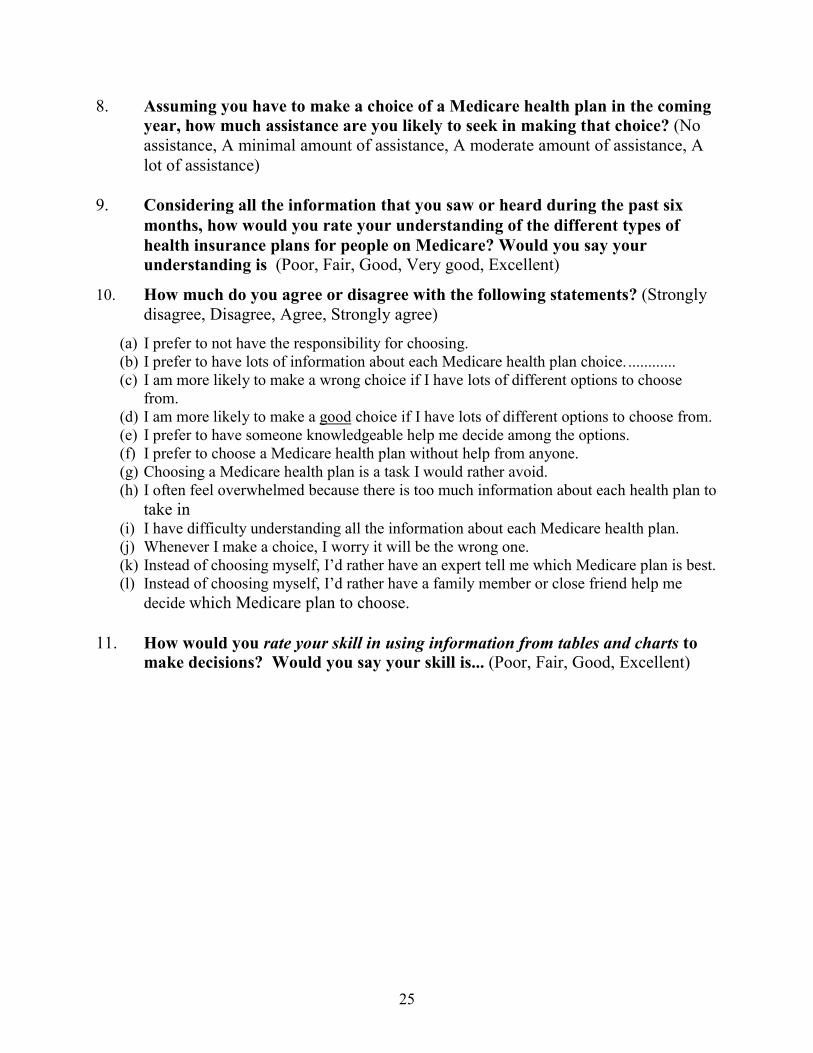
8. Assuming you have to make a choice of a Medicare health plan in the coming year, how much assistance are you likely to seek in making that choice? (No assistance, A minimal amount of assistance, A moderate amount of assistance, A lot of assistance)
9. Considering all the information that you saw or heard during the past six
months, how would you rate your understanding of the different types of health insurance plans for people on Medicare? Would you say your understanding is (Poor, Fair, Good, Very good, Excellent)
10. How much do you agree or disagree with the following statements? (Strongly disagree, Disagree, Agree, Strongly agree)
(a) I prefer to not have the responsibility for choosing. (b) I prefer to have lots of information about each Medicare health plan choice. ............ (c) I am more likely to make a wrong choice if I have lots of different options to choose
from. (d) I am more likely to make a good choice if I have lots of different options to choose from. (e) I prefer to have someone knowledgeable help me decide among the options. (f) I prefer to choose a Medicare health plan without help from anyone. (g) Choosing a Medicare health plan is a task I would rather avoid. (h) I often feel overwhelmed because there is too much information about each health plan to
take in (i) I have difficulty understanding all the information about each Medicare health plan. (j) Whenever I make a choice, I worry it will be the wrong one. (k) Instead of choosing myself, I’d rather have an expert tell me which Medicare plan is best. (l) Instead of choosing myself, I’d rather have a family member or close friend help me
decide which Medicare plan to choose.
11. How would you rate your skill in using information from tables and charts to make decisions? Would you say your skill is... (Poor, Fair, Good, Excellent)
26
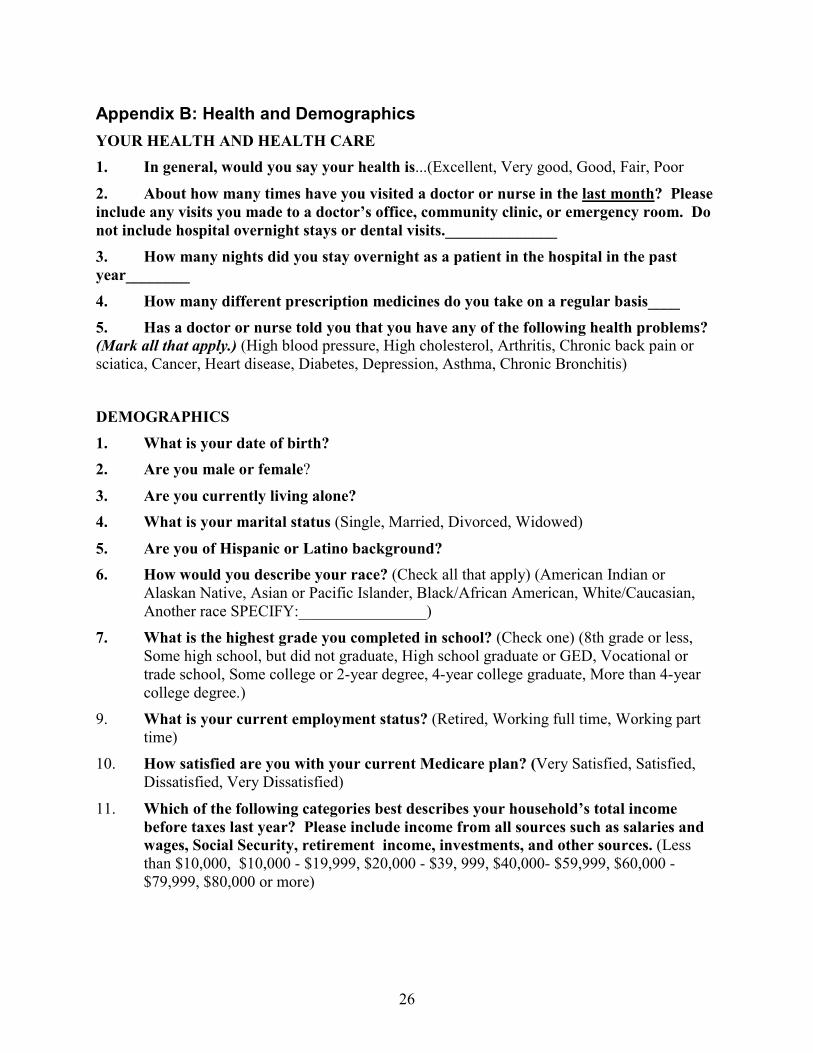
Appendix B: Health and Demographics YOUR HEALTH AND HEALTH CARE 1. In general, would you say your health is...(Excellent, Very good, Good, Fair, Poor
2. About how many times have you visited a doctor or nurse in the last month? Please include any visits you made to a doctor’s office, community clinic, or emergency room. Do not include hospital overnight stays or dental visits.______________ 3. How many nights did you stay overnight as a patient in the hospital in the past year________ 4. How many different prescription medicines do you take on a regular basis____ 5. Has a doctor or nurse told you that you have any of the following health problems? (Mark all that apply.) (High blood pressure, High cholesterol, Arthritis, Chronic back pain or sciatica, Cancer, Heart disease, Diabetes, Depression, Asthma, Chronic Bronchitis)
DEMOGRAPHICS 1. What is your date of birth? 2. Are you male or female?
3. Are you currently living alone? 4. What is your marital status (Single, Married, Divorced, Widowed)
5. Are you of Hispanic or Latino background? 6. How would you describe your race? (Check all that apply) (American Indian or
Alaskan Native, Asian or Pacific Islander, Black/African American, White/Caucasian, Another race SPECIFY:________________)
7. What is the highest grade you completed in school? (Check one) (8th grade or less, Some high school, but did not graduate, High school graduate or GED, Vocational or trade school, Some college or 2-year degree, 4-year college graduate, More than 4-year college degree.)
9. What is your current employment status? (Retired, Working full time, Working part time)
10. How satisfied are you with your current Medicare plan? (Very Satisfied, Satisfied, Dissatisfied, Very Dissatisfied)
11. Which of the following categories best describes your household’s total income before taxes last year? Please include income from all sources such as salaries and wages, Social Security, retirement income, investments, and other sources. (Less than $10,000, $10,000 - $19,999, $20,000 - $39, 999, $40,000- $59,999, $60,000 - $79,999, $80,000 or more)
27
HEALTH PLAN TYPE
“Medicare is a program that provides health insurance for citizens 65 years or older. The traditional Medicare plan covers things like doctors visits, lab tests, x-rays and hospital stays. It works pretty much like any health insurance policy. Some people choose to enroll in an HMO instead of the traditional Medicare plan. Then they get all their medical care from that Medicare HMO. Medicare helps pay for their HMO enrollment.”
1. Do you have traditional Medicare or do you have a Medicare HMO plan? (Traditional
Medicare, Medicare HMO, Both, Don’t know)
1a. If you decided on your own to go to a doctor who was not part of your Medicare HMO, would the HMO still pay part of the bill?
2.. Do you have a supplement or Medigap policy? (Yes, No)
2a. For that supplement or Medigap policy, do you have to choose doctors from an approved list, or can you see any doctor you want?
28
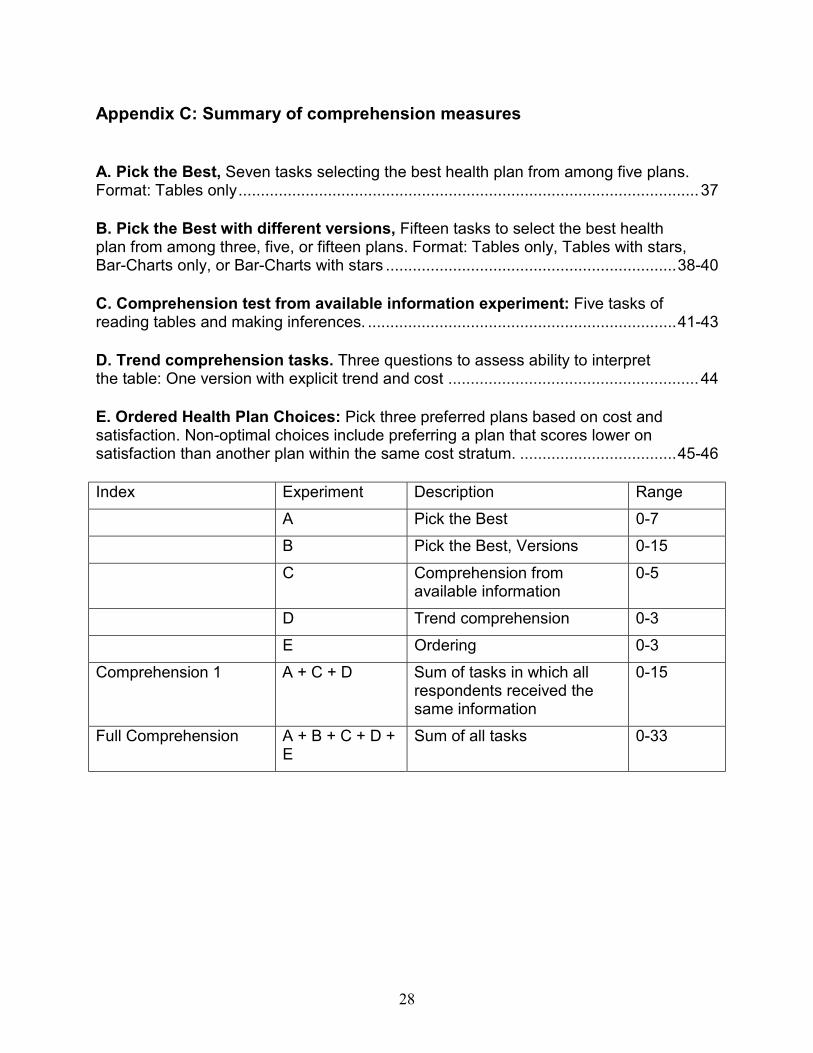
Appendix C: Summary of comprehension measures
A. Pick the Best, Seven tasks selecting the best health plan from among five plans. Format: Tables only.......................................................................................................37
B. Pick the Best with different versions, Fifteen tasks to select the best health plan from among three, five, or fifteen plans. Format: Tables only, Tables with stars, Bar-Charts only, or Bar-Charts with stars .................................................................38-40
C. Comprehension test from available information experiment: Five tasks of reading tables and making inferences. .....................................................................41-43
D. Trend comprehension tasks. Three questions to assess ability to interpret the table: One version with explicit trend and cost ........................................................44
E. Ordered Health Plan Choices: Pick three preferred plans based on cost and satisfaction. Non-optimal choices include preferring a plan that scores lower on satisfaction than another plan within the same cost stratum. ...................................45-46 Index Experiment Description Range A Pick the Best 0-7 B Pick the Best, Versions 0-15 C Comprehension from
available information 0-5
D Trend comprehension 0-3 E Ordering 0-3 Comprehension 1 A + C + D Sum of tasks in which all
respondents received the same information
0-15
Full Comprehension A + B + C + D + E
Sum of all tasks 0-33
29
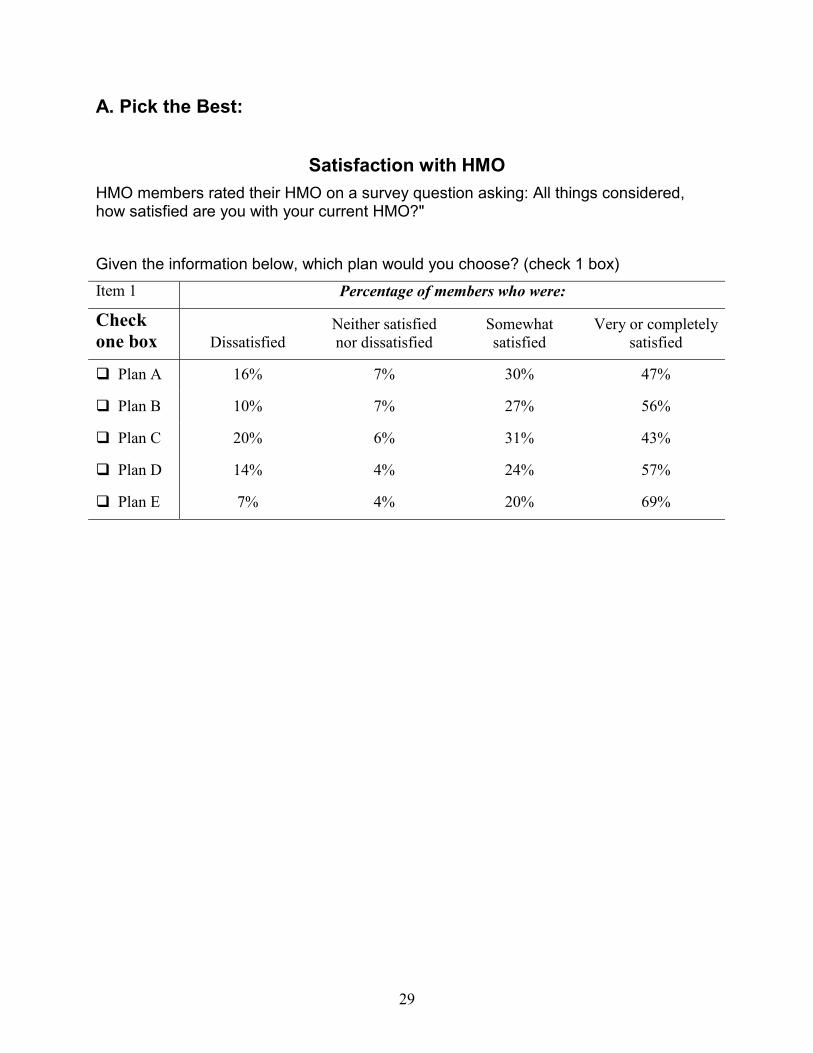
A. Pick the Best:
Satisfaction with HMO HMO members rated their HMO on a survey question asking: All things considered, how satisfied are you with your current HMO?" Given the information below, which plan would you choose? (check 1 box) Item 1 Percentage of members who were:
Check one box Dissatisfied
Neither satisfied nor dissatisfied
Somewhat satisfied
Very or completely satisfied
! Plan A 16% 7% 30% 47%
! Plan B 10% 7% 27% 56%
! Plan C 20% 6% 31% 43%
! Plan D 14% 4% 24% 57%
! Plan E 7% 4% 20% 69%
30
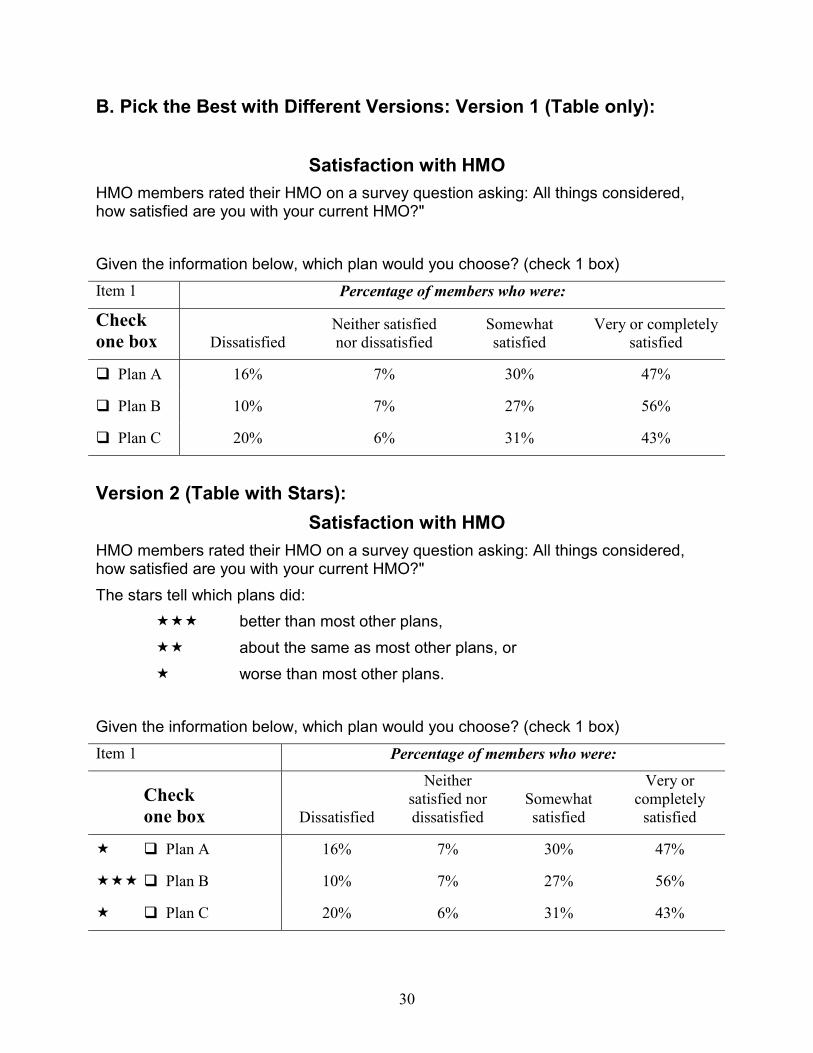
B. Pick the Best with Different Versions: Version 1 (Table only):
Satisfaction with HMO HMO members rated their HMO on a survey question asking: All things considered, how satisfied are you with your current HMO?" Given the information below, which plan would you choose? (check 1 box) Item 1 Percentage of members who were:
Check one box Dissatisfied
Neither satisfied nor dissatisfied
Somewhat satisfied
Very or completely satisfied
! Plan A 16% 7% 30% 47%
! Plan B 10% 7% 27% 56%
! Plan C 20% 6% 31% 43%
Version 2 (Table with Stars): Satisfaction with HMO
HMO members rated their HMO on a survey question asking: All things considered, how satisfied are you with your current HMO?" The stars tell which plans did: """ better than most other plans, "" about the same as most other plans, or " worse than most other plans. Given the information below, which plan would you choose? (check 1 box) Item 1 Percentage of members who were:
Check one box Dissatisfied
Neither satisfied nor dissatisfied
Somewhat satisfied
Very or completely
satisfied
" ! Plan A 16% 7% 30% 47%
""" ! Plan B 10% 7% 27% 56%
" ! Plan C 20% 6% 31% 43%
31
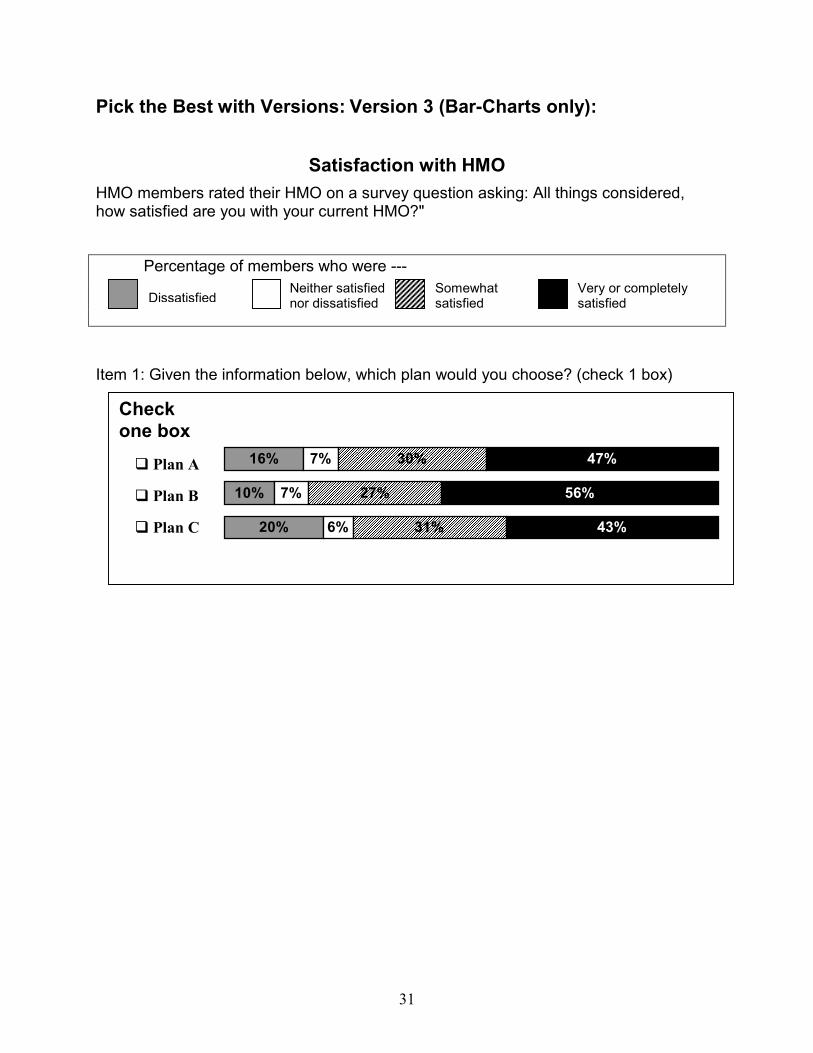
Pick the Best with Versions: Version 3 (Bar-Charts only):
Satisfaction with HMO HMO members rated their HMO on a survey question asking: All things considered, how satisfied are you with your current HMO?"
Percentage of members who were ---
Item 1: Given the information below, which plan would you choose? (check 1 box)
Check one box �����������������������������������������������������������
��������������������������������������������������������������������������������������������������������������������������������������������������������������������������������������������������������������������������������������������������������������������������������������������
������������������������������������������������������������������������������������������������������������������������������
16%
10%
20%
7%
7%
6%
30%
27%
31%
47%
56%
43%
! Plan A
! Plan B
! Plan C
DissatisfiedNeither satisfied nor dissatisfied
Somewhat satisfied
Very or completely satisfied
32
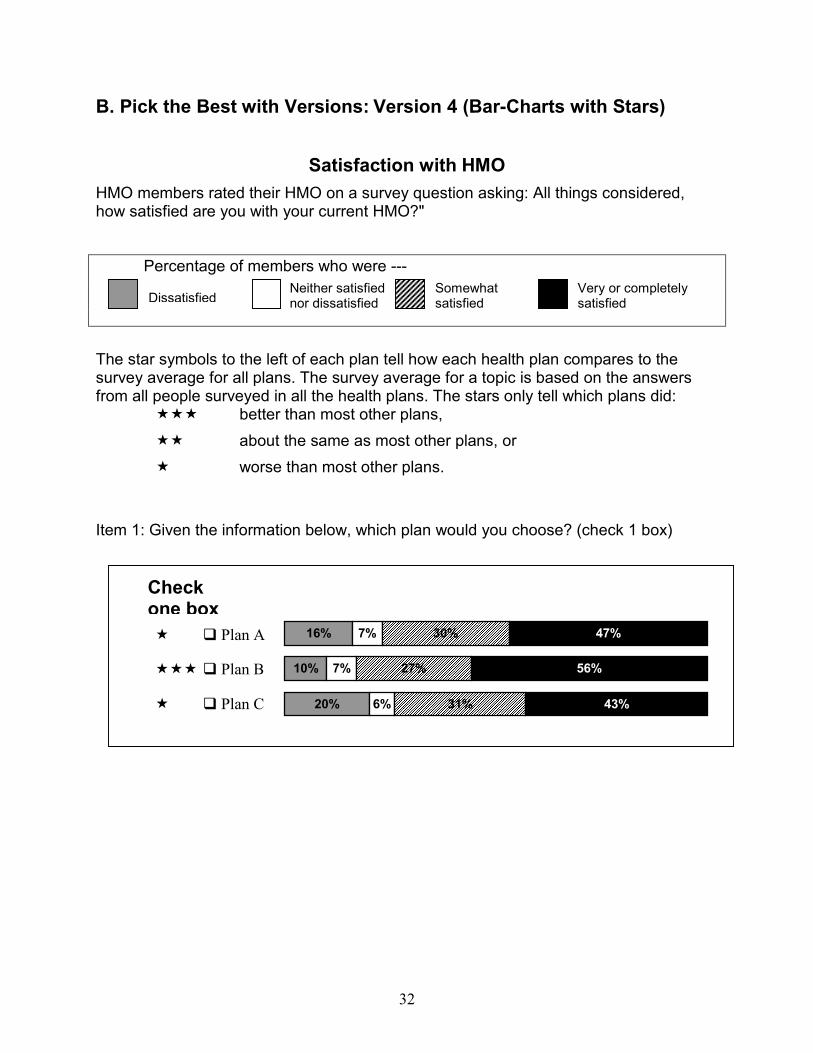
B. Pick the Best with Versions: Version 4 (Bar-Charts with Stars)
Satisfaction with HMO HMO members rated their HMO on a survey question asking: All things considered, how satisfied are you with your current HMO?"
Percentage of members who were ---
The star symbols to the left of each plan tell how each health plan compares to the survey average for all plans. The survey average for a topic is based on the answers from all people surveyed in all the health plans. The stars only tell which plans did: """ better than most other plans, "" about the same as most other plans, or " worse than most other plans. Item 1: Given the information below, which plan would you choose? (check 1 box)
" ! Plan A
""" ! Plan B
" ! Plan C
Check one box ����������������������������������������������������
��������������������������������������������������������������������������������������������������������
��������������������������������������������������������������������������������������������������
������������������������������������������������������������������������������������������������������������
16%
10%
20%
7%
7%
6%
30%
27%
31%
47%
56%
43%
DissatisfiedNeither satisfied nor dissatisfied
Somewhat satisfied
Very or completely satisfied
33
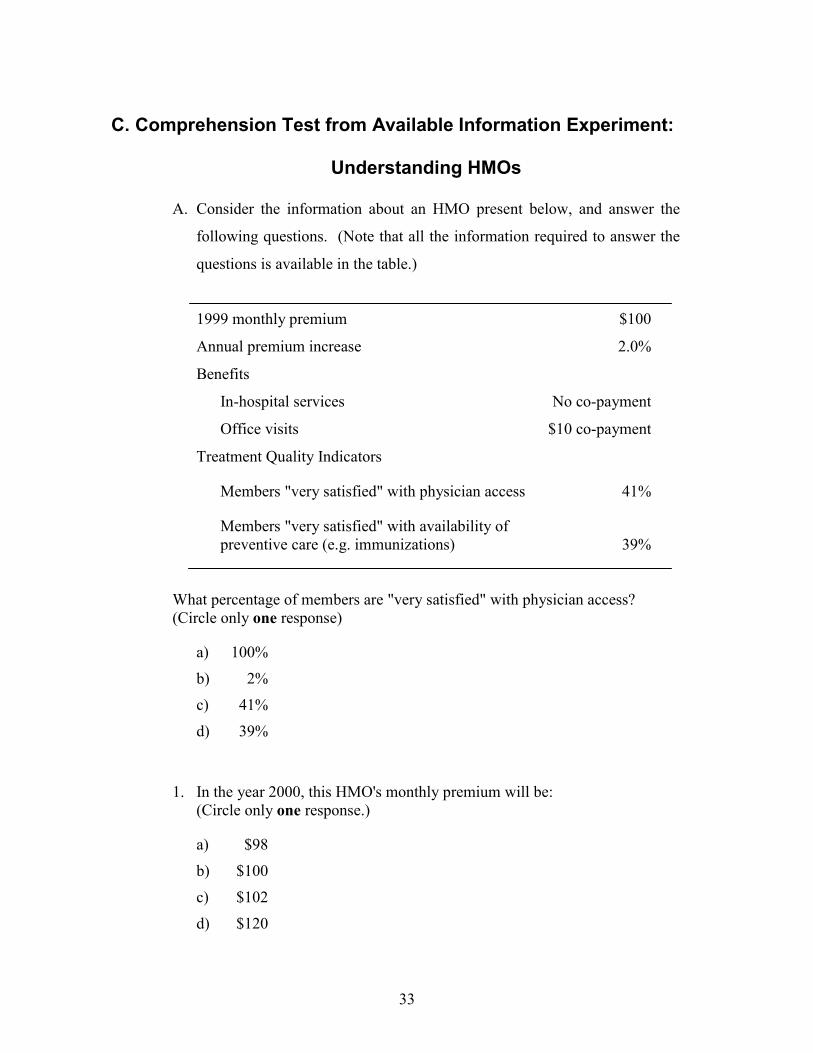
C. Comprehension Test from Available Information Experiment:
Understanding HMOs
A. Consider the information about an HMO present below, and answer the
following questions. (Note that all the information required to answer the
questions is available in the table.)
1999 monthly premium $100
Annual premium increase 2.0%
Benefits
In-hospital services No co-payment
Office visits $10 co-payment
Treatment Quality Indicators
Members "very satisfied" with physician access 41%
Members "very satisfied" with availability of preventive care (e.g. immunizations) 39%
What percentage of members are "very satisfied" with physician access? (Circle only one response)
a) 100%
b) 2%
c) 41%
d) 39%
1. In the year 2000, this HMO's monthly premium will be: (Circle only one response.)
a) $98
b) $100
c) $102
d) $120
34
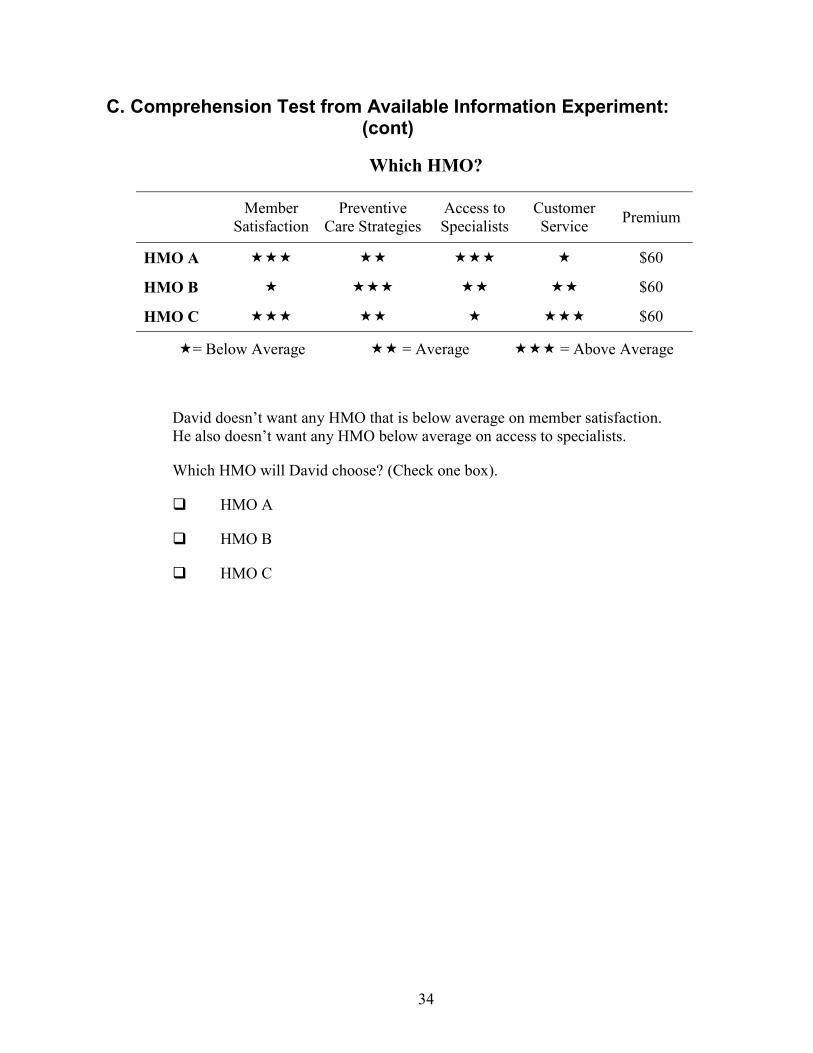
C. Comprehension Test from Available Information Experiment: (cont)
Which HMO?
Member Satisfaction
Preventive Care Strategies
Access to Specialists
Customer Service Premium
HMO A """ "" """ " $60
HMO B " """ "" "" $60
HMO C """ "" " """ $60
"= Below Average "" = Average """ = Above Average
David doesn’t want any HMO that is below average on member satisfaction. He also doesn’t want any HMO below average on access to specialists.
Which HMO will David choose? (Check one box).
! HMO A
! HMO B
! HMO C
35
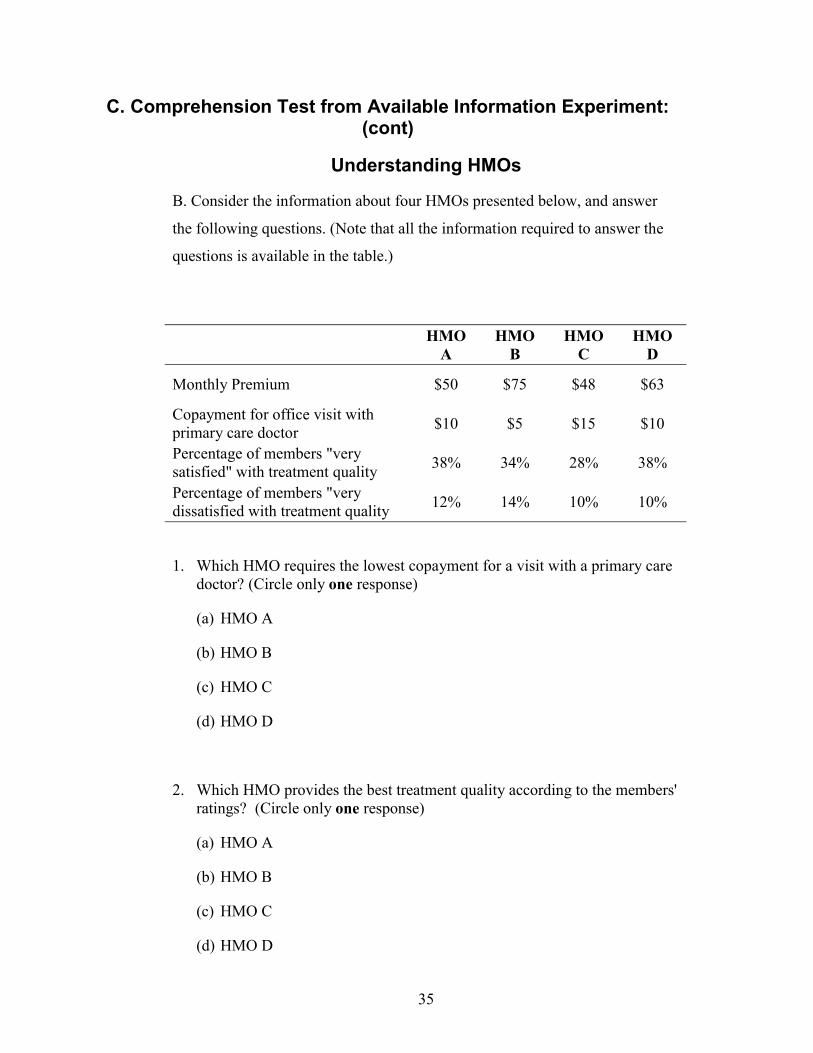
C. Comprehension Test from Available Information Experiment: (cont)
Understanding HMOs
B. Consider the information about four HMOs presented below, and answer
the following questions. (Note that all the information required to answer the
questions is available in the table.)
HMO A
HMO B
HMO C
HMO D
Monthly Premium $50 $75 $48 $63
Copayment for office visit with primary care doctor $10 $5 $15 $10
Percentage of members "very satisfied" with treatment quality 38% 34% 28% 38%
Percentage of members "very dissatisfied with treatment quality 12% 14% 10% 10%
1. Which HMO requires the lowest copayment for a visit with a primary care doctor? (Circle only one response)
(a) HMO A
(b) HMO B
(c) HMO C
(d) HMO D
2. Which HMO provides the best treatment quality according to the members' ratings? (Circle only one response)
(a) HMO A
(b) HMO B
(c) HMO C
(d) HMO D
36
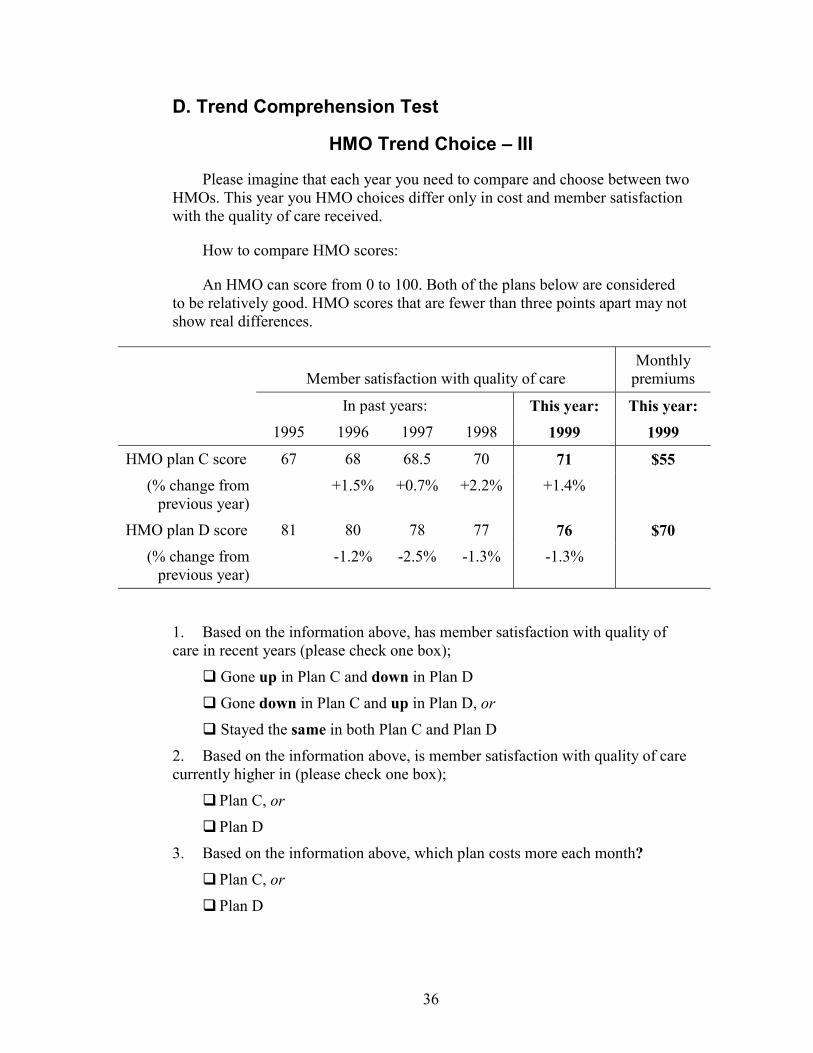
D. Trend Comprehension Test
HMO Trend Choice – III
Please imagine that each year you need to compare and choose between two HMOs. This year you HMO choices differ only in cost and member satisfaction with the quality of care received.
How to compare HMO scores:
An HMO can score from 0 to 100. Both of the plans below are considered to be relatively good. HMO scores that are fewer than three points apart may not show real differences.
Member satisfaction with quality of care
Monthly premiums
In past years: This year: This year: 1995 1996 1997 1998 1999 1999 HMO plan C score 67 68 68.5 70 71 $55
(% change from previous year)
+1.5% +0.7% +2.2% +1.4%
HMO plan D score 81 80 78 77 76 $70 (% change from
previous year) -1.2% -2.5% -1.3% -1.3%
1. Based on the information above, has member satisfaction with quality of care in recent years (please check one box);
! Gone up in Plan C and down in Plan D
! Gone down in Plan C and up in Plan D, or
! Stayed the same in both Plan C and Plan D
2. Based on the information above, is member satisfaction with quality of care currently higher in (please check one box);
! Plan C, or ! Plan D
3. Based on the information above, which plan costs more each month?
! Plan C, or ! Plan D
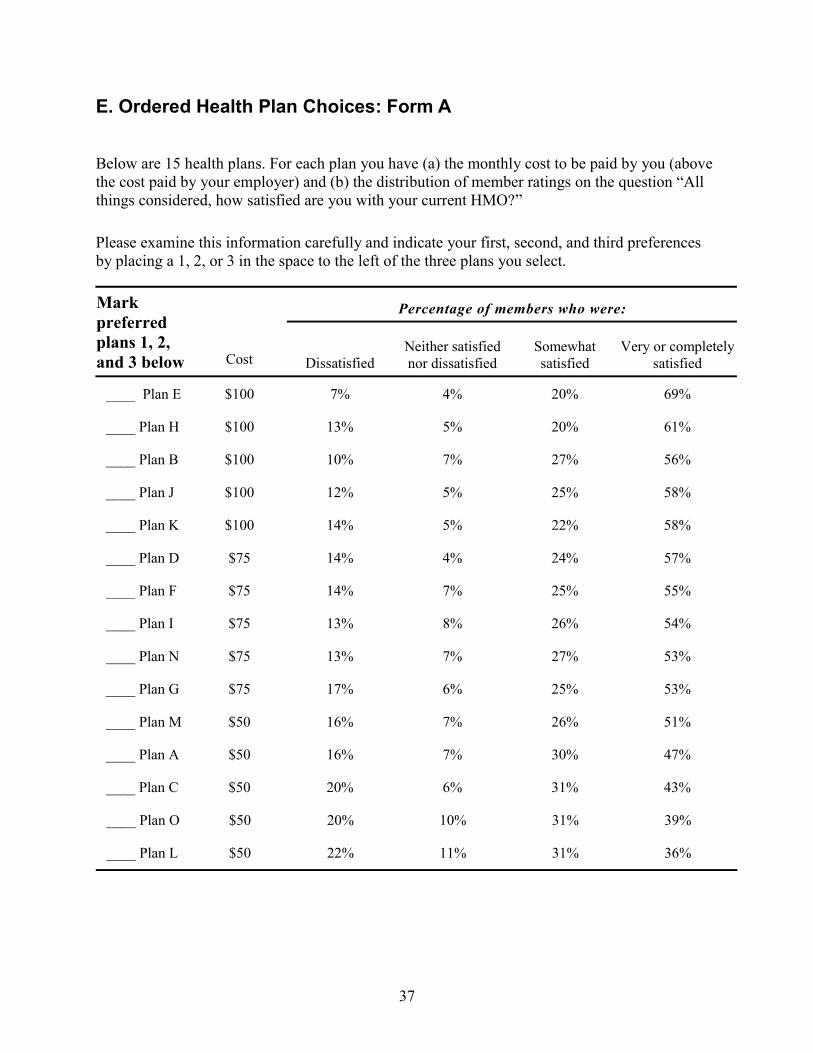
37
E. Ordered Health Plan Choices: Form A
Below are 15 health plans. For each plan you have (a) the monthly cost to be paid by you (above the cost paid by your employer) and (b) the distribution of member ratings on the question “All things considered, how satisfied are you with your current HMO?”
Please examine this information carefully and indicate your first, second, and third preferences by placing a 1, 2, or 3 in the space to the left of the three plans you select.
Percentage of members who were: Mark preferred plans 1, 2, and 3 below Cost Dissatisfied
Neither satisfied nor dissatisfied
Somewhat satisfied
Very or completely satisfied
____ Plan E $100 7% 4% 20% 69%
____ Plan H $100 13% 5% 20% 61%
____ Plan B $100 10% 7% 27% 56%
____ Plan J $100 12% 5% 25% 58%
____ Plan K $100 14% 5% 22% 58%
____ Plan D $75 14% 4% 24% 57%
____ Plan F $75 14% 7% 25% 55%
____ Plan I $75 13% 8% 26% 54%
____ Plan N $75 13% 7% 27% 53%
____ Plan G $75 17% 6% 25% 53%
____ Plan M $50 16% 7% 26% 51%
____ Plan A $50 16% 7% 30% 47%
____ Plan C $50 20% 6% 31% 43%
____ Plan O $50 20% 10% 31% 39%
____ Plan L $50 22% 11% 31% 36%
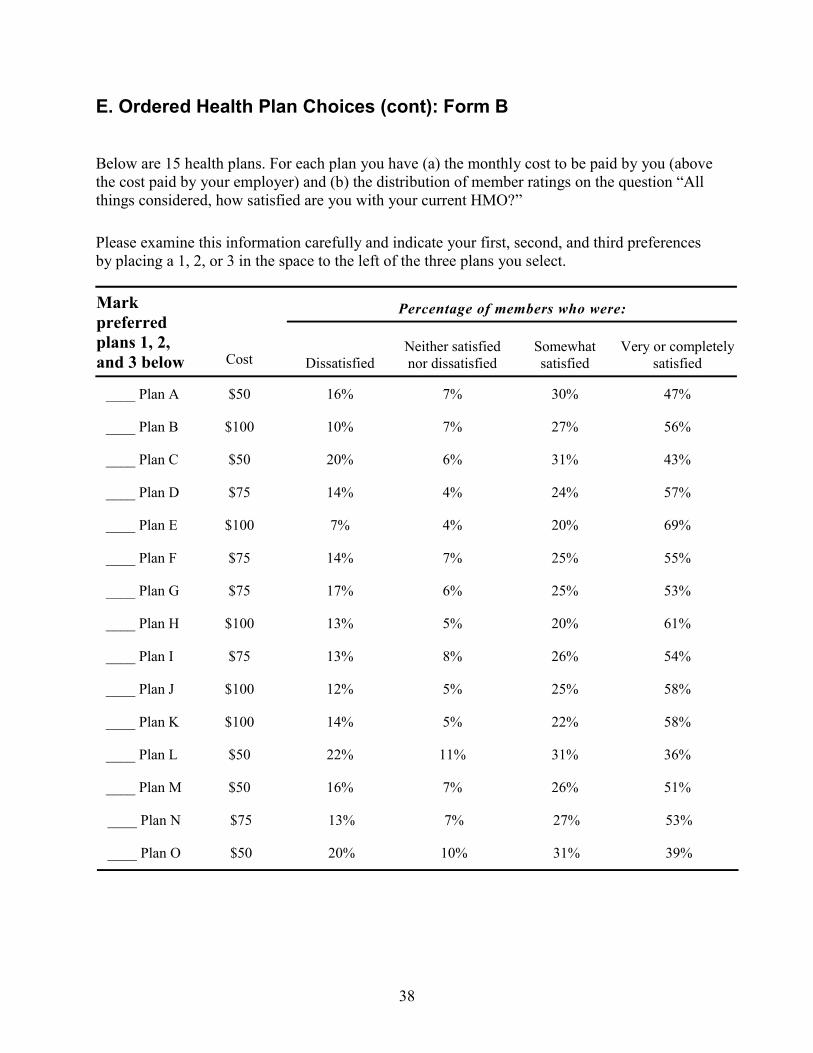
38
E. Ordered Health Plan Choices (cont): Form B
Below are 15 health plans. For each plan you have (a) the monthly cost to be paid by you (above the cost paid by your employer) and (b) the distribution of member ratings on the question “All things considered, how satisfied are you with your current HMO?”
Please examine this information carefully and indicate your first, second, and third preferences by placing a 1, 2, or 3 in the space to the left of the three plans you select.
Percentage of members who were: Mark preferred plans 1, 2, and 3 below Cost Dissatisfied
Neither satisfied nor dissatisfied
Somewhat satisfied
Very or completely satisfied
____ Plan A $50 16% 7% 30% 47%
____ Plan B $100 10% 7% 27% 56%
____ Plan C $50 20% 6% 31% 43%
____ Plan D $75 14% 4% 24% 57%
____ Plan E $100 7% 4% 20% 69%
____ Plan F $75 14% 7% 25% 55%
____ Plan G $75 17% 6% 25% 53%
____ Plan H $100 13% 5% 20% 61%
____ Plan I $75 13% 8% 26% 54%
____ Plan J $100 12% 5% 25% 58%
____ Plan K $100 14% 5% 22% 58%
____ Plan L $50 22% 11% 31% 36%
____ Plan M $50 16% 7% 26% 51%
____ Plan N $75 13% 7% 27% 53%
____ Plan O $50 20% 10% 31% 39%