Embed Size (px)
Citation preview

OligopolyMr Traynor©
EconomicsNote 11 • Leaving Cert • 5th Year
St. Michaels College, Ailesbury Rd
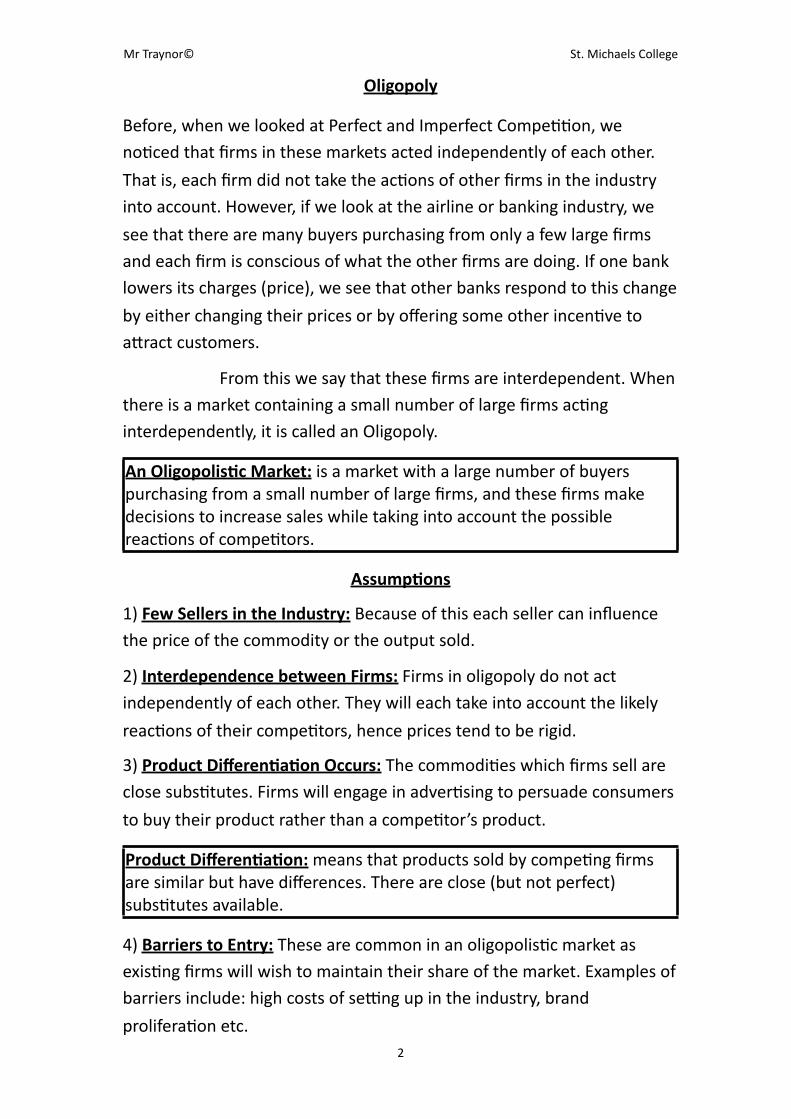
Oligopoly
Before, when we looked at Perfect and Imperfect CompeLLon, we noLced that firms in these markets acted independently of each other.
That is, each firm did not take the acLons of other firms in the industry into account. However, if we look at the airline or banking industry, we
see that there are many buyers purchasing from only a few large firms and each firm is conscious of what the other firms are doing. If one bank lowers its charges (price), we see that other banks respond to this change
by either changing their prices or by offering some other incenLve to aRract customers.
From this we say that these firms are interdependent. When there is a market containing a small number of large firms acLng interdependently, it is called an Oligopoly.
An Oligopolis,c Market: is a market with a large number of buyers purchasing from a small number of large firms, and these firms make decisions to increase sales while taking into account the possible reacLons of compeLtors.
Assump,ons
1) Few Sellers in the Industry: Because of this each seller can influence the price of the commodity or the output sold.
2) Interdependence between Firms: Firms in oligopoly do not act independently of each other. They will each take into account the likely
reacLons of their compeLtors, hence prices tend to be rigid.
3) Product Differen,a,on Occurs: The commodiLes which firms sell are close subsLtutes. Firms will engage in adverLsing to persuade consumers
to buy their product rather than a compeLtor’s product.
Product Differen,a,on: means that products sold by compeLng firms are similar but have differences. There are close (but not perfect) subsLtutes available.
4) Barriers to Entry: These are common in an oligopolisLc market as exisLng firms will wish to maintain their share of the market. Examples of barriers include: high costs of se\ng up in the industry, brand
proliferaLon etc.
Mr Traynor© St. Michaels College
2
Barriers to Entry: Are the forces at work which prevent or deter other firms from entering into the industry
5) Collusion may Occur: Firms within the industry may meet to control the output in the industry or control prices e.g. OPEC.
Collusion: is any acLon taken by separate and rival companies to restrict compeLLon between them with a view to increasing their total profits
Limit Pricing: occurs when exisLng firms in an OligopolisLc market charge a price lower than the price they could charge in order to discourage the entry of new firms into the market or to force unwanted entrants out of the market.
6) Non-‐Price Compe,,on is More Common than Price Compe,,on: Due to the fear of how compeLtors will react, firms tend not to engage in price compeLLon but rather they engage in non-‐price compeLLon to
gain consumers.
Non-‐Price Compe,,on: occurs when firms try to increase their market share without changing their price.
Price Compe,,on: is when firms compete with other firms on the basis of price
Examples of Non-‐Price Compe,,on
a) Sponsoring Community Events
b) Free Gias
c) Special introductory price for new customers
d) Increasing the quality of the service
Mr Traynor© St. Michaels College
3
Barriers to Entry
In the assumpLons we said that barriers to entry exist in an OligopolisLc market. These are the things that stop other firms entering the industry. We will now look at what barriers to entry exist in Oligopoly.
1) High Start Up Costs: Some OligopolisLc firms operate on such a large scale that the costs of starLng up in the industry faced by potenLal entrants is so high that it would be unprofitable to set up a new firm in opposiLon to the exisLng ones.
2) Limit Pricing: When new firms enter the industry, exisLng OligopolisLc firms may all agree to each lower their price, in the hope that the new entrant is unable to match this price and as such is forced out of the industry.
3) Economies of Scale: ExisLng firms may enjoy huge economies of scale in adverLsing which induces brand loyalty and reduces customer’s willingness to try new brands.
4) Channels of Distribu,on: ExisLng firms may control the supply of goods to retailers and refuse to supply retailers that carry the products of new firms.
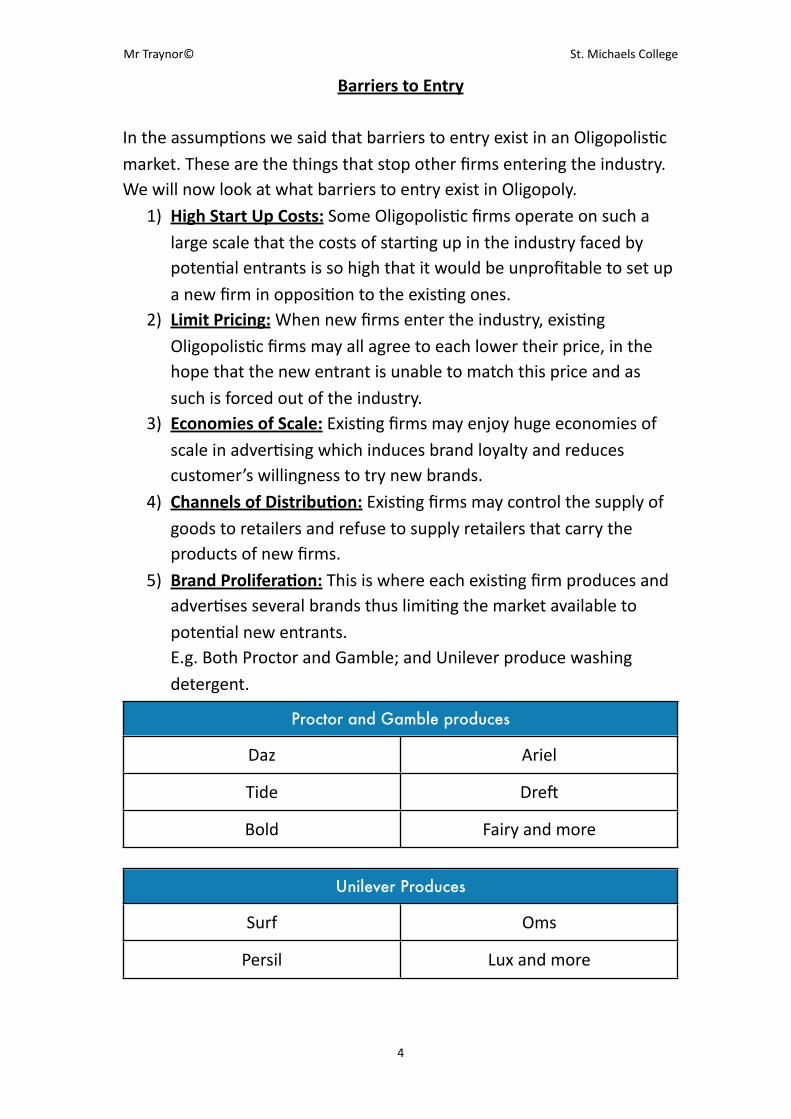
5) Brand Prolifera,on: This is where each exisLng firm produces and adverLses several brands thus limiLng the market available to potenLal new entrants.E.g. Both Proctor and Gamble; and Unilever produce washing detergent.
Proctor and Gamble producesProctor and Gamble produces
Daz Ariel
Tide Drea
Bold Fairy and more
Unilever Produces Unilever Produces
Surf Oms
Persil Lux and more
Mr Traynor© St. Michaels College
4
NOTE: Proctor and Gamble and Unilever operate in what is called a duopololy. It is an oligopoly with only two firms.
Brand Prolifera,on: is where each exisLng firm produces and adverLses several brands thus limiLng the market available to a new entrant.
It is important to note that there is no one theory of Oligopoly that accurately describes the equilibrium of an OligopolisLc firm in all cases. This is unlike the other market structures that we have studied (Perfect CompeLLon, Imperfect CompeLLon and Monopoly) where we can accurately predict their acLons and equilibrium in both the Short Run and the Long Run.
The behaviour of any OligopolisLc firm depends on the industry it is in (banking, petroleum, insurance, food chains) and how it reacts to its compeLtors decisions and how it believes its compeLtors will react to its decisions.
We will now look at a number of ideas that have been put forward to try to explain the different aspects of OligopolisLc markets.
Mr Traynor© St. Michaels College
5
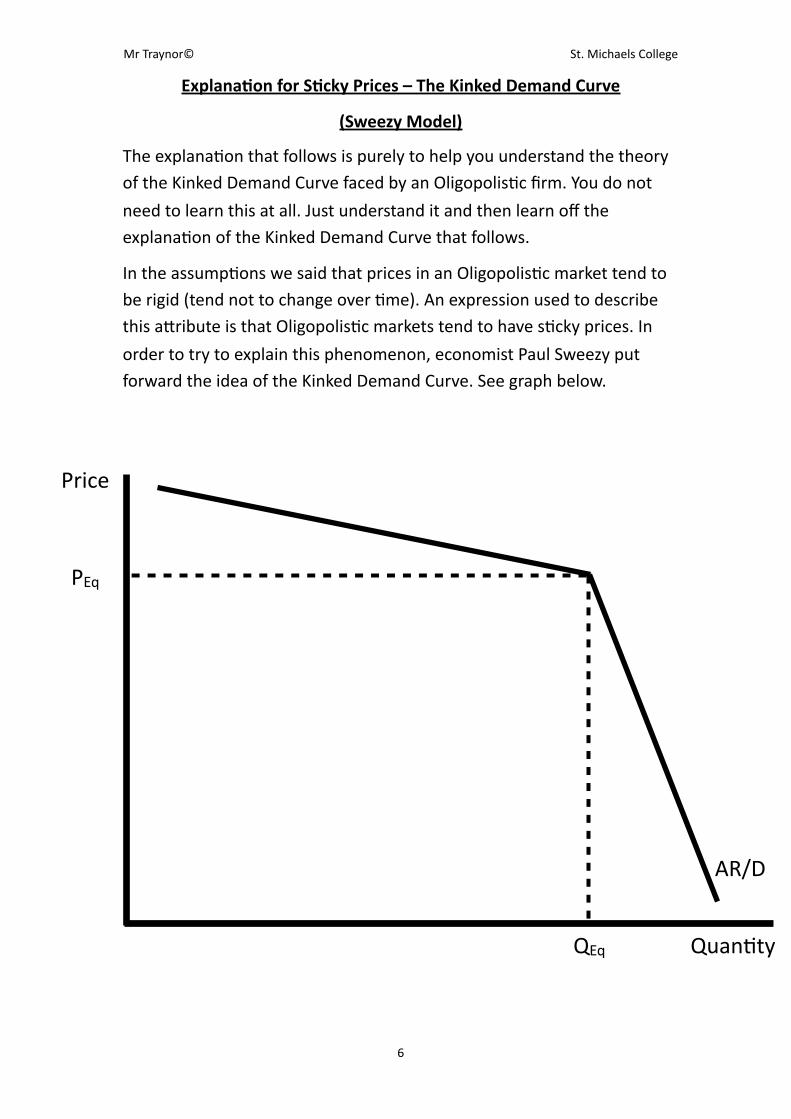
Explana,on for S,cky Prices – The Kinked Demand Curve
(Sweezy Model)
The explanaLon that follows is purely to help you understand the theory of the Kinked Demand Curve faced by an OligopolisLc firm. You do not
need to learn this at all. Just understand it and then learn off the explanaLon of the Kinked Demand Curve that follows.
In the assumpLons we said that prices in an OligopolisLc market tend to be rigid (tend not to change over Lme). An expression used to describe this aRribute is that OligopolisLc markets tend to have sLcky prices. In
order to try to explain this phenomenon, economist Paul Sweezy put forward the idea of the Kinked Demand Curve. See graph below.
Mr Traynor© St. Michaels College
6
Price
QuanLty
AR/D
PEq
QEq
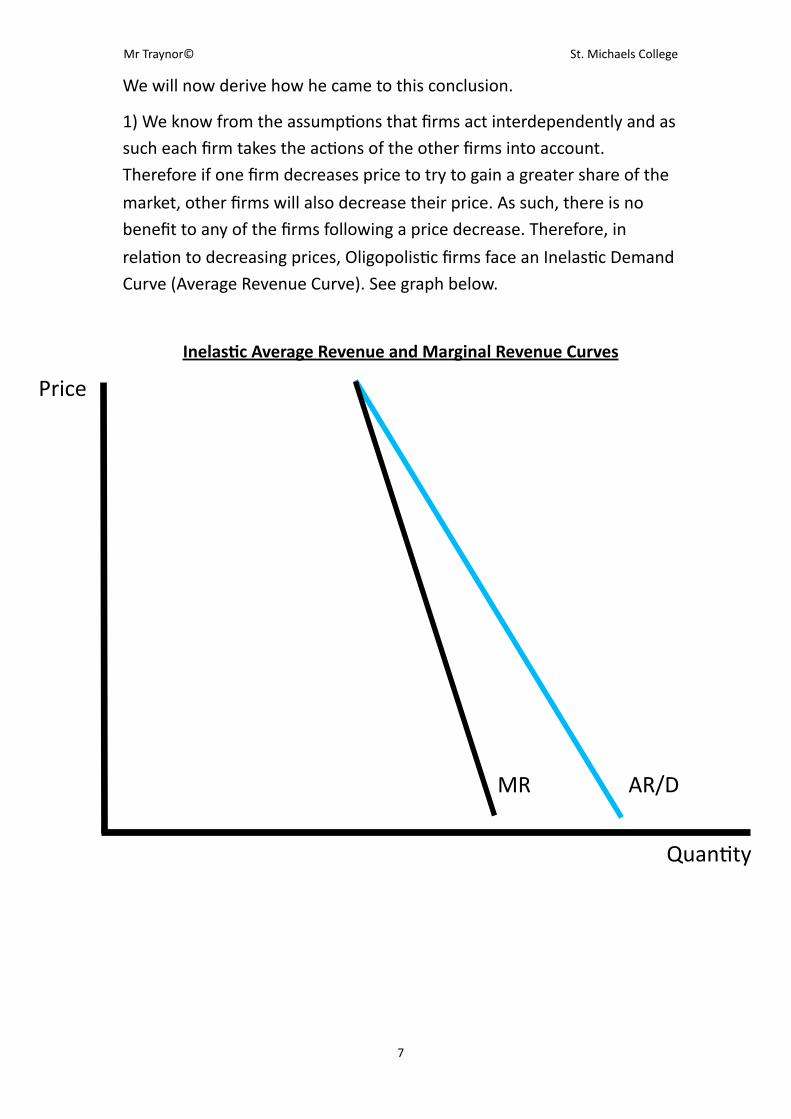
We will now derive how he came to this conclusion.
1) We know from the assumpLons that firms act interdependently and as such each firm takes the acLons of the other firms into account. Therefore if one firm decreases price to try to gain a greater share of the
market, other firms will also decrease their price. As such, there is no benefit to any of the firms following a price decrease. Therefore, in
relaLon to decreasing prices, OligopolisLc firms face an InelasLc Demand Curve (Average Revenue Curve). See graph below.
Inelas,c Average Revenue and Marginal Revenue Curves
Mr Traynor© St. Michaels College
7
Price
QuanLty
AR/DMR
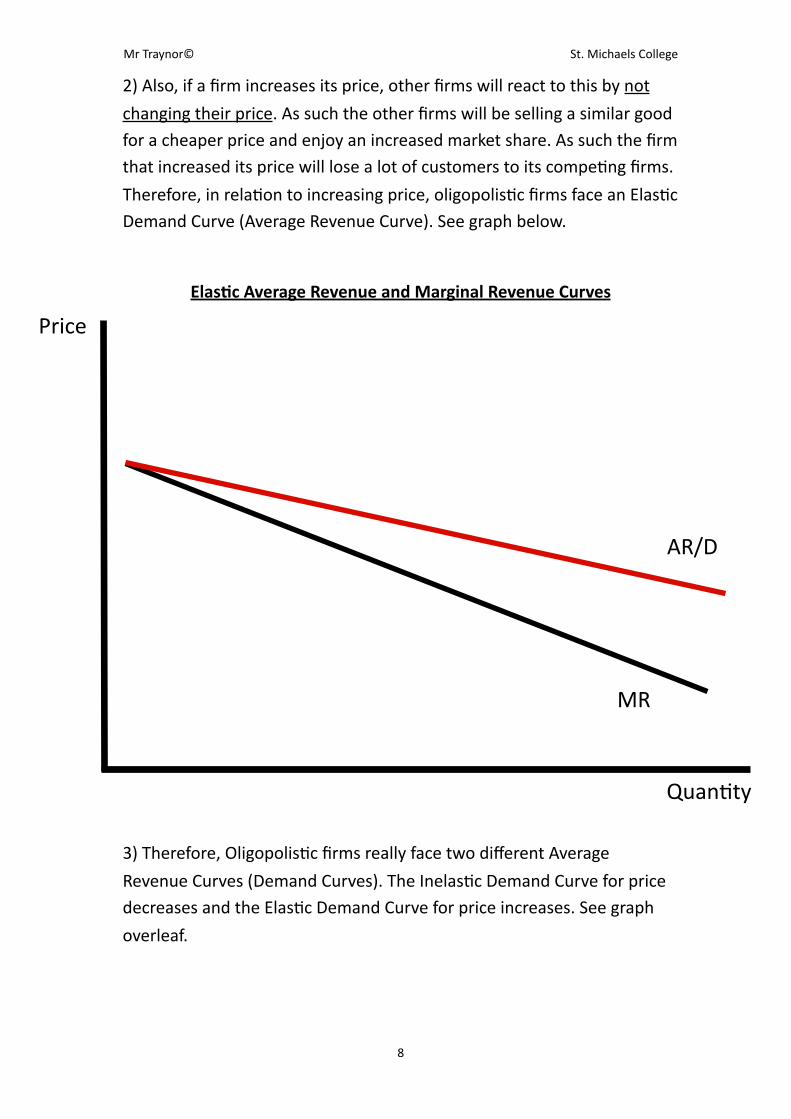
2) Also, if a firm increases its price, other firms will react to this by not
changing their price. As such the other firms will be selling a similar good for a cheaper price and enjoy an increased market share. As such the firm that increased its price will lose a lot of customers to its compeLng firms.
Therefore, in relaLon to increasing price, oligopolisLc firms face an ElasLc Demand Curve (Average Revenue Curve). See graph below.
Elas,c Average Revenue and Marginal Revenue Curves
3) Therefore, OligopolisLc firms really face two different Average
Revenue Curves (Demand Curves). The InelasLc Demand Curve for price decreases and the ElasLc Demand Curve for price increases. See graph
overleaf.
Mr Traynor© St. Michaels College
8
Price
QuanLty
AR/D
MR
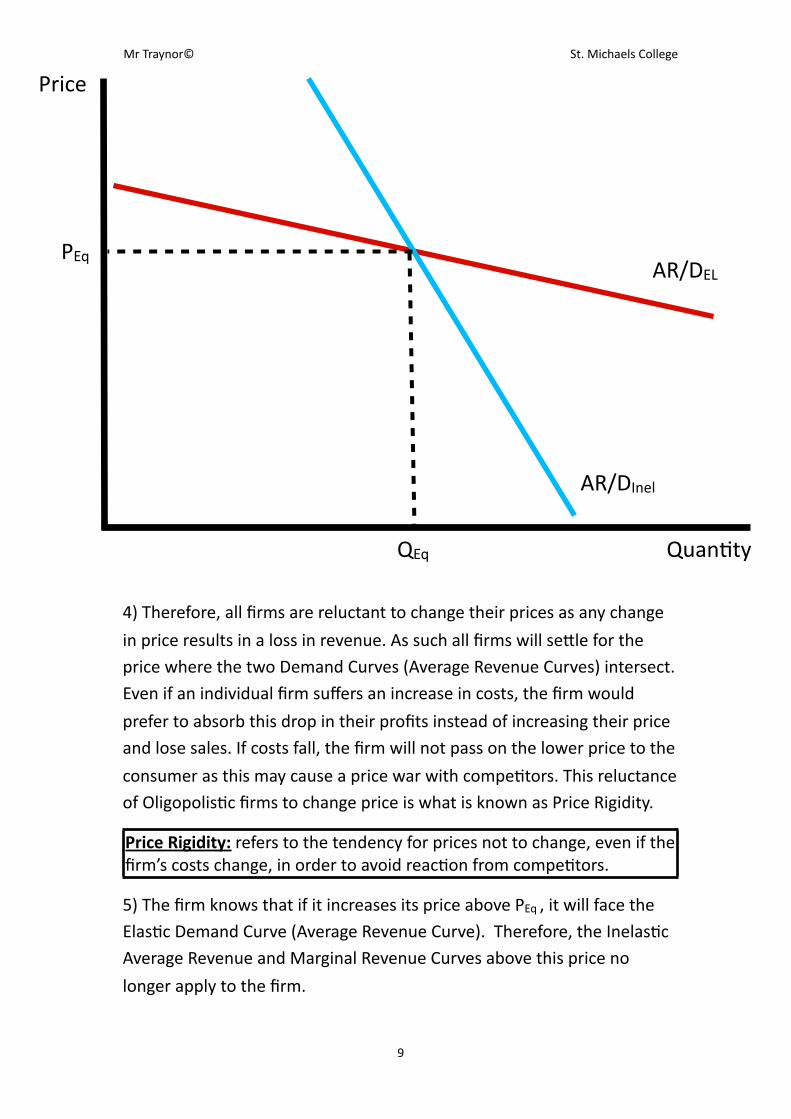
4) Therefore, all firms are reluctant to change their prices as any change
in price results in a loss in revenue. As such all firms will seRle for the price where the two Demand Curves (Average Revenue Curves) intersect. Even if an individual firm suffers an increase in costs, the firm would
prefer to absorb this drop in their profits instead of increasing their price and lose sales. If costs fall, the firm will not pass on the lower price to the
consumer as this may cause a price war with compeLtors. This reluctance of OligopolisLc firms to change price is what is known as Price Rigidity.
Price Rigidity: refers to the tendency for prices not to change, even if the firm’s costs change, in order to avoid reacLon from compeLtors.
5) The firm knows that if it increases its price above PEq , it will face the ElasLc Demand Curve (Average Revenue Curve). Therefore, the InelasLc Average Revenue and Marginal Revenue Curves above this price no
longer apply to the firm.
Mr Traynor© St. Michaels College
9
Price
QuanLty
AR/DEL
AR/DInel
PEq
QEq
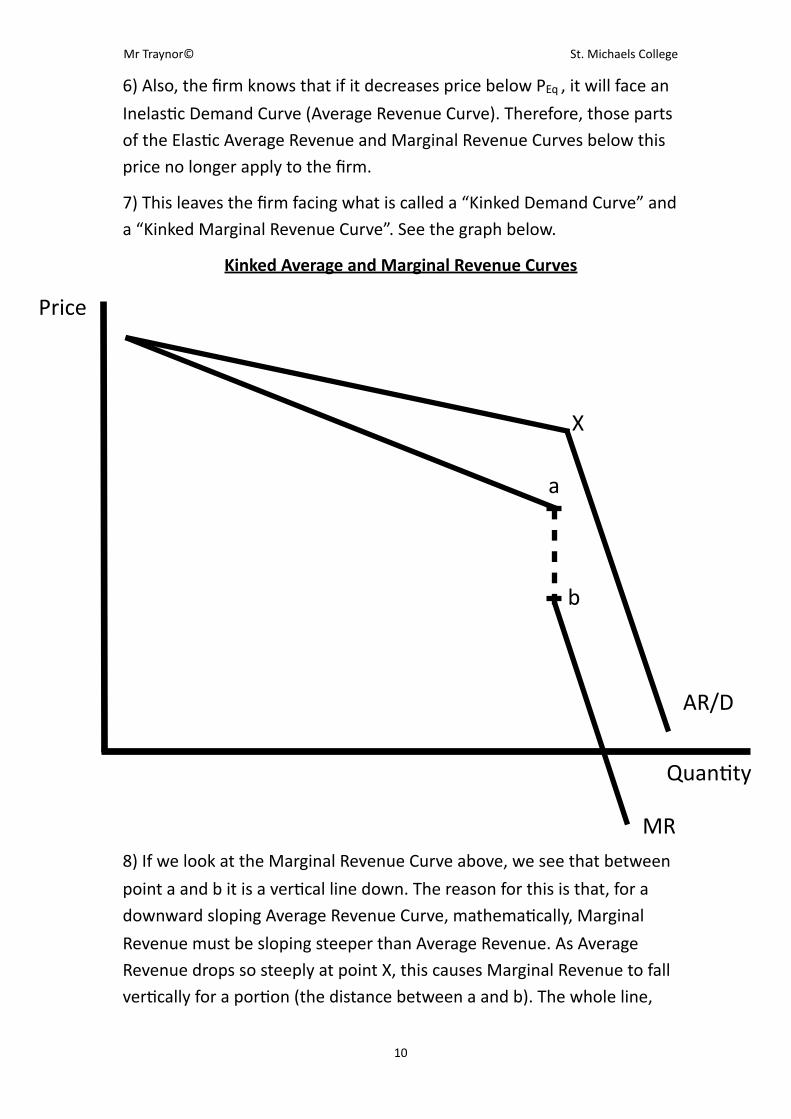
6) Also, the firm knows that if it decreases price below PEq , it will face an
InelasLc Demand Curve (Average Revenue Curve). Therefore, those parts of the ElasLc Average Revenue and Marginal Revenue Curves below this price no longer apply to the firm.
7) This leaves the firm facing what is called a “Kinked Demand Curve” and a “Kinked Marginal Revenue Curve”. See the graph below.
Kinked Average and Marginal Revenue Curves
8) If we look at the Marginal Revenue Curve above, we see that between
point a and b it is a verLcal line down. The reason for this is that, for a downward sloping Average Revenue Curve, mathemaLcally, Marginal
Revenue must be sloping steeper than Average Revenue. As Average Revenue drops so steeply at point X, this causes Marginal Revenue to fall verLcally for a porLon (the distance between a and b). The whole line,
Mr Traynor© St. Michaels College
10
Price
QuanLty
AR/D
MR
X
a
b
including the verLcal drop, is the Marginal Revenue Curve faced by an
OligopolisLc firm; it’s just an unusual shape.
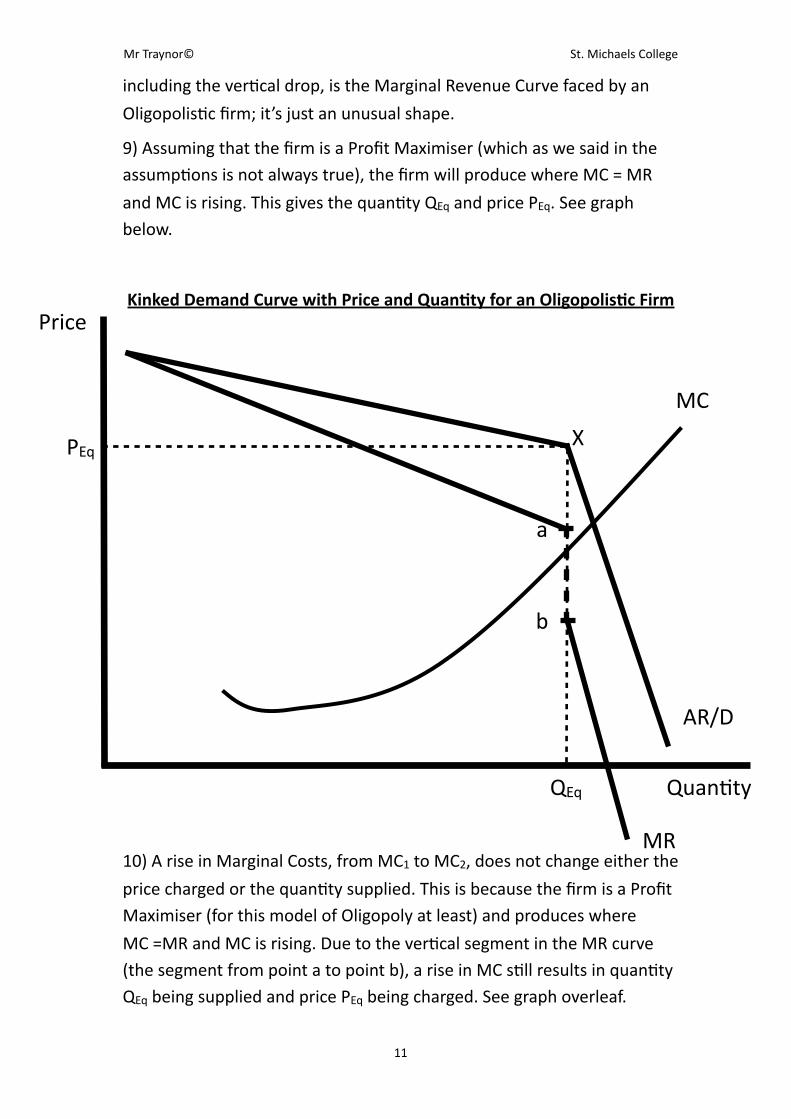
9) Assuming that the firm is a Profit Maximiser (which as we said in the assumpLons is not always true), the firm will produce where MC = MR
and MC is rising. This gives the quanLty QEq and price PEq. See graph below.
Kinked Demand Curve with Price and Quan,ty for an Oligopolis,c Firm
10) A rise in Marginal Costs, from MC1 to MC2, does not change either the
price charged or the quanLty supplied. This is because the firm is a Profit Maximiser (for this model of Oligopoly at least) and produces where
MC =MR and MC is rising. Due to the verLcal segment in the MR curve (the segment from point a to point b), a rise in MC sLll results in quanLty QEq being supplied and price PEq being charged. See graph overleaf.
Mr Traynor© St. Michaels College
11
Price
QuanLty
AR/D
MR
X
a
b
!
MC
QEq
PEq
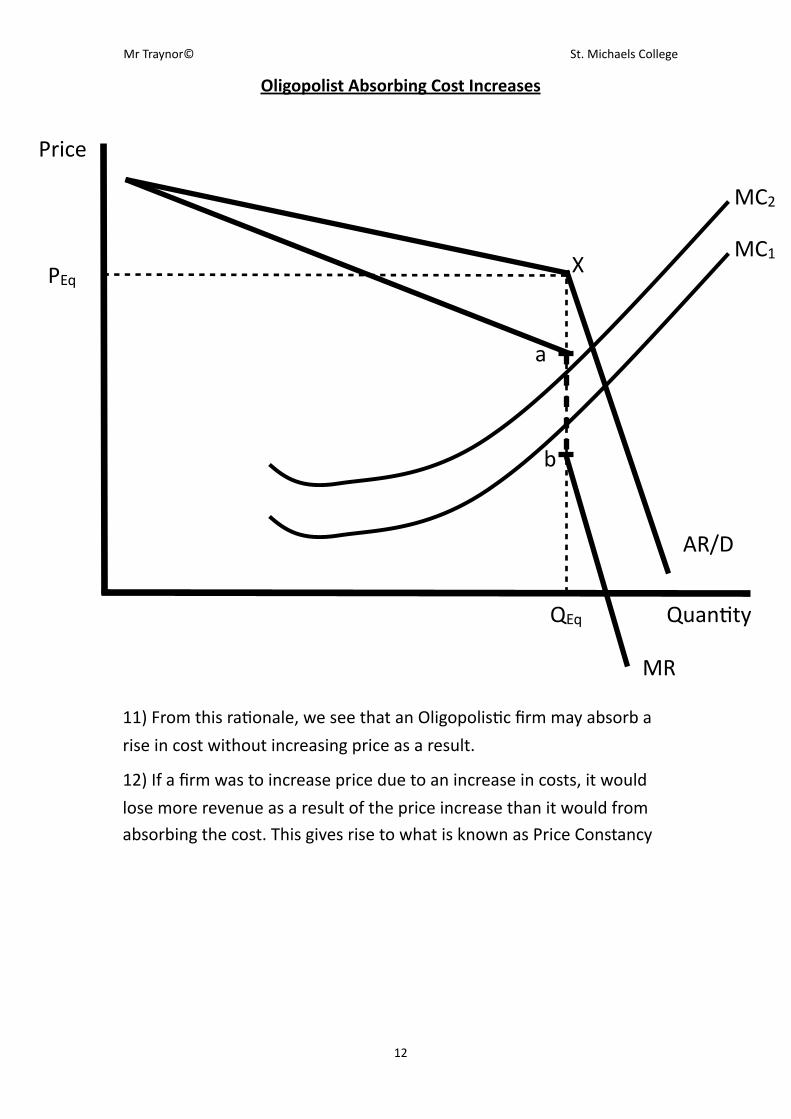
Oligopolist Absorbing Cost Increases
11) From this raLonale, we see that an OligopolisLc firm may absorb a
rise in cost without increasing price as a result.
12) If a firm was to increase price due to an increase in costs, it would
lose more revenue as a result of the price increase than it would from absorbing the cost. This gives rise to what is known as Price Constancy
Mr Traynor© St. Michaels College
12
Price
QuanLty
AR/D
MR
X
a
b
!MC1
!MC2
PEq
QEq
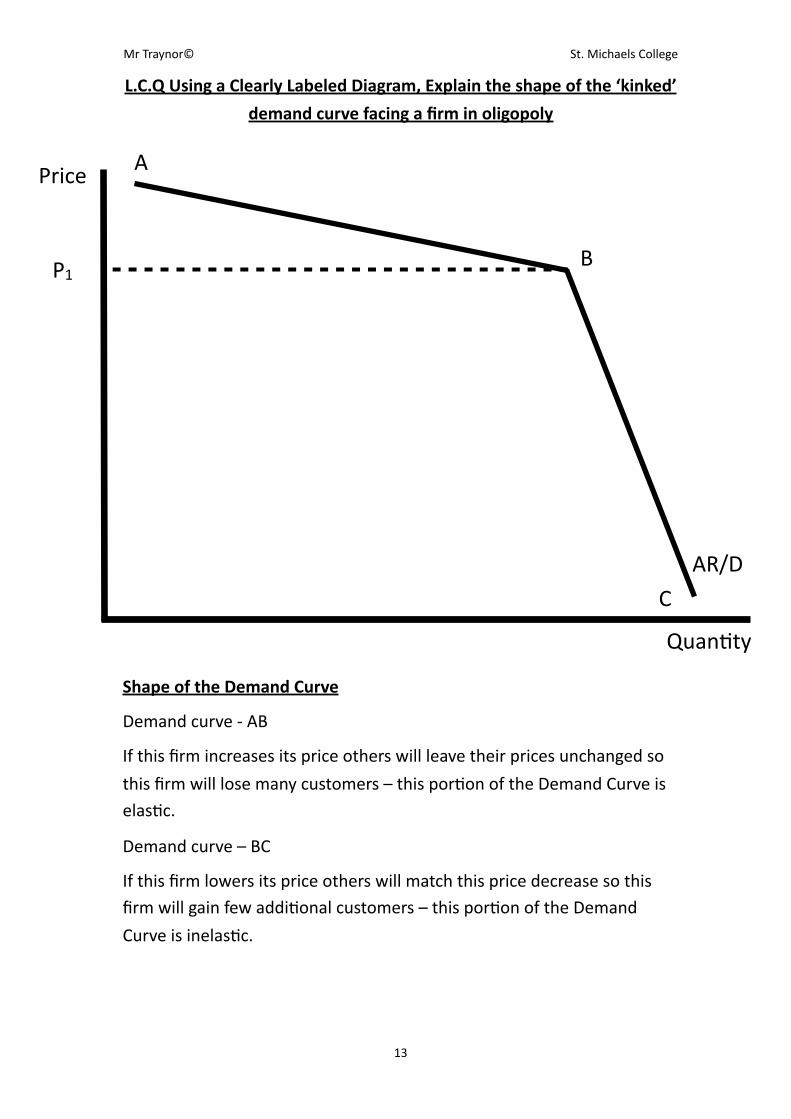
L.C.Q Using a Clearly Labeled Diagram, Explain the shape of the ‘kinked’
demand curve facing a firm in oligopoly
Shape of the Demand Curve
Demand curve -‐ AB
If this firm increases its price others will leave their prices unchanged so
this firm will lose many customers – this porLon of the Demand Curve is elasLc.
Demand curve – BC
If this firm lowers its price others will match this price decrease so this firm will gain few addiLonal customers – this porLon of the Demand
Curve is inelasLc.
Mr Traynor© St. Michaels College
13
Price
QuanLty
AR/D
P1
A
B
C
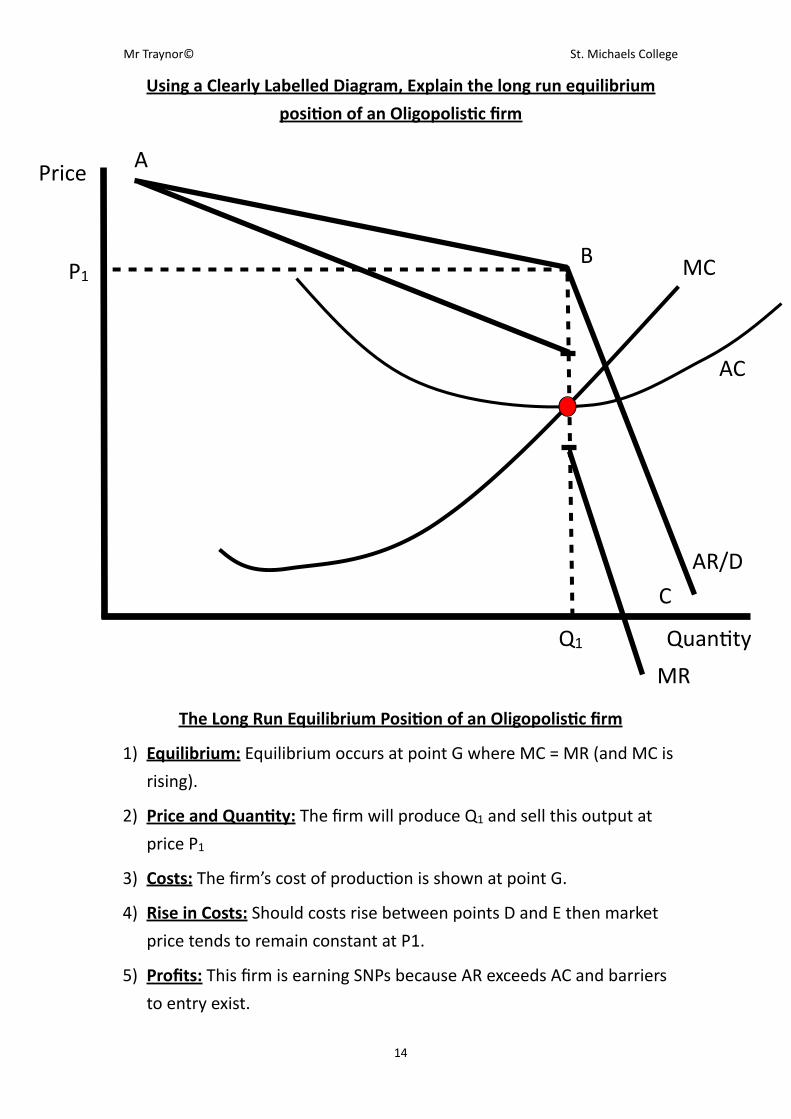
Using a Clearly Labelled Diagram, Explain the long run equilibrium
posi,on of an Oligopolis,c firm
The Long Run Equilibrium Posi,on of an Oligopolis,c firm
1) Equilibrium: Equilibrium occurs at point G where MC = MR (and MC is
rising).
2) Price and Quan,ty: The firm will produce Q1 and sell this output at
price P1
3) Costs: The firm’s cost of producLon is shown at point G.
4) Rise in Costs: Should costs rise between points D and E then market
price tends to remain constant at P1.
5) Profits: This firm is earning SNPs because AR exceeds AC and barriers
to entry exist.
Mr Traynor© St. Michaels College
14
Price
QuanLty
AR/D
P1
A
B
C
Q1
!MC
!
AC
MR
Price Constancy
Like Price Rigidity, Price Constancy involves leaving the price of the good unchanged. It differs from Price Rigidity in that the reason for not changing the price is that it may actually cost more to change the price
rather than take a small dent in profits.
E.g. If the owner of a restaurant finds that his costs are rising, but only
slightly, he may not increase the prices charged as this would involve reprinLng all the menus and changing adverLsed prices. This could prove to be more expensive than his slight increase in costs and as such the
owner leaves the prices unchanged.
Evalua,on of the Sweezy Model
1) The Sweezy model accurately described OligopolisLc markets in the 1930’s (there was a great depression and firms had excess capacity).
2) However, due to the oil shocks in the 1970’s and 80’s, high inflaLon and increase in wages, OligopolisLc firms raised prices without suffering a
great loss in demand.
3)Another problem with this model is that it does not explain how the iniLal equilibrium price, PEq , was set.
In industries where it is difficult for firms to raise prices without suffering
a serious decline in revenue, there is an incenLve to engage in collusion to which we now turn our aRenLon.
Mr Traynor© St. Michaels College
15
Forms of Collusion
Collusion: is any acLon taken by separate and rival companies to restrict compeLLon between them with a view to increasing their total profits
In the assumpLons we said that collusion may exist in an Oligopoly. We will now look at the different forms of collusion that can take place.
1) Pricing Policy / Limit Pricing: One firm, with the tacit agreement of
others, could reduce prices forcing unwanted entrants out of the industry.
2) Produc,on/Output Policy: Firms could join together to limit output to certain agreed amounts.
3) Sales Territories: Firms could divide up the markets between them and
agree not to compete in each other’s market segments.
4) Refusal to supply firms: Firms may not supply those firms who buy
from firms not in the cartel.
5) Implicit Collusion: Each firm recognises that behaving as if they were branches of a single firm, their joint profits would be higher. So firms do
not provoke their rivals by cu\ng prices. Instead they try to increase market share by engaging in non-‐price compeLLve measures.
Most of the forms of collusion above are known as Explicit Collusion
Explicit Collusion: occurs when separate companies jointly decide on a specific course of acLon. I.e. there is an agreed arrangement.
However, in many Oligopolies around the world, firms may not have an explicit arrangement, but by following each other’s acLons, may come to an implied agreement which reduces compeLLon and raises each of their
profits. This type of collusion is known as Implicit Collusion.
Implicit Collusion (Tacit Collusion): occurs when there is no formal
agreement between firms, but each firm acts in a non-‐compeLLve way in order to increase profits.
Mr Traynor© St. Michaels College
16
Price Leadership
Price Leadership: occurs when the largest supplier sets its price and the smaller rivals follow its lead.
This means that the most dominant firm in the industry sets its price and, in order not to engage in Price CompeLLon, the smaller firms in the industry set the same price for their goods without any explicit
agreement.
Price Compe,,on: is when firms compete with other firms on the basis of price
The idea of Price Leadership has been used in conjuncLon with or as an alternaLve to the Kinked Demand Curve. When it is used with the Kinked Demand Curve Model, it is given as the method by which the market
reaches the equilibrium price. When it is used as an alternaLve to the Kinked Demand Curve, it is said that it is Price Leadership alone that
causes Price Rigidity and not the Kinked Demand Curve.
As we said in the assumpLons, firms tend not to engage in Price CompeLLon. This is due to the fact that if one firm lowers their price, all
other firms adopt the same tacLc resulLng in no increase in market share to any firm. Therefore, each firm is sLll selling the same amount of goods
as they were before the price decrease, but now they are selling these goods at a lower price and as such each firm is worse off as a result. This gives rise to the fact that OligopolisLc firms engage in Non-‐Price
CompeLLon. We will now discuss the Pros and Cons to the consumer of Non-‐Price CompeLLon.
Mr Traynor© St. Michaels College
17
Benefits to the Consumer of Non -‐ Price Compe,,on
Non-‐Price Compe,,on: occurs when firms try to increase their market share without changing their price.
1) Price Stability: Non-‐Price CompeLLon results in constant prices thus making it easier for the consumer to budget for these goods.
2) Be[er Quality Products: As firms do not wish to compete on [rice, the
only way they can compete is by the quality of their product and their aaer sales service. This results in a higher standard of product
delivered to the consumer.
3) Benefits of Adver,sing: As a form of adverLsing, different firms sponsor sporLng clubs, chariLes etc. When a consumer avails of these
ameniLes, they are incurring a benefit from Non-‐Price CompeLLon.
4) Consumers are more Informed: As a result of the adverLsing
employed by each oligopolisLc firm, consumers become more informed about each potenLal product and as such are beRer able to buy the good that best suits their needs.
5) Consumer Loyalty is Rewarded: A certain type of credit can accrue to the customer from constantly shopping in one business or constantly
buying the same good. E.g. Club card points in Dunnes
The list above is the benefits to consumers of Non-‐Price CompeLLon.
However in every case, Price CompeLLon is beRer for the consumer. We will now look at why consumers prefer Price CompeLLon.
Reasons why Consumers Prefer Price Compe,,on
1) Cheaper Prices: The first and most important aspect of why consumers prefer Price CompeLLon is that it ensures cheaper prices,
resulLng in an increase in consumer’s real income.
2) Greater Choice: Under Price CompeLLon, non efficient firms are
forced out of the industry. As such, these people who find themselves unemployed search for a niche in the market to gain employment. When they find this niche they either set up their own firm or work in
Mr Traynor© St. Michaels College
18
a business that provides the consumer with different goods giving
them a greater choice.
3) Higher Costs in Non-‐Price Compe,,on: The “extras” that are offered to the consumer under Non-‐Price CompeLLon cause a rise in the
price of the good which results in a reducLon in consumer’s real income.
4) Unwanted Extras: Many of the extra offers that are included with the good in Non-‐Price CompeLLon are not desired by the consumer and as such are of no benefit them.
5) Extras not Used: Consumers frequently do not use the vouchers or gia tokens that they receive in Non-‐Price CompeLLon and as such
these “extras” are something that the consumer never receives.
Types of Non-Price CompetitionTypes of Non-Price Competition
Special Offers “X% Extra Free”
CompeLLons Local and NaLonal Sponserships
Free Gias Free Samples
Coupons Loyalty Points
Objec,ves of the Firm other than Profit Maximisa,on
Up to this point in our course we have assumed that the main objecLve
of every firm is to maximise profits. In reality this is a good assumpLon as it accurately represents the main objecLve of the vast majority of firms operaLng in the Irish economy. However, there are reasons why firms
might not wish to maximise profits and we shall now look at these reasons.
Mr Traynor© St. Michaels College
19
Reasons why firms may not pursue Profit Maximisa,on
or
Objec,ves that Oligopolis,c firms may have other than Profit Maximisa,on
1) Fear of Government Interven,on: Firms may fear that very large Super Normal Profits (SNP) might aRract government aRenLon in the form of further regulaLons or increased taxes. In order to avoid this, the firms may decide to produce a certain level of output other than that level of output which maximises profits. (Where MC = MR and MC is rising).
2) Fear Compe,,on: A firm may fear that very large Super Normal Profits (SNP) might aRract new firms into the industry. To prevent this, the firm might engage in Limit Pricing, se\ng prices so low in order to discourage new firms from entering the industry. The firm suffers lower profits in the short run in order to gain sustained profits in the long run.
3) Less Work: The owners of the business may prefer to earn stable/moderate levels of profits rather than constantly striving for large supernormal profits as this is what they are saLsfied with.
4) Lack of Incen,ve: Where the managers are not owners they may tend towards a more conservaLve approach rather than a dynamic drive to profit maximisaLon.
5) Sales Maximisa,on: Once a minimum level of profit is earned to reward shareholders, provide funds for reinvestment etc. the firm may concentrate on maximising sales; increasing its share of the market. It may wish to achieve economies of scale; decrease the level of sales of rival firms; become the most dominant firm in the market.
Mr Traynor© St. Michaels College
20
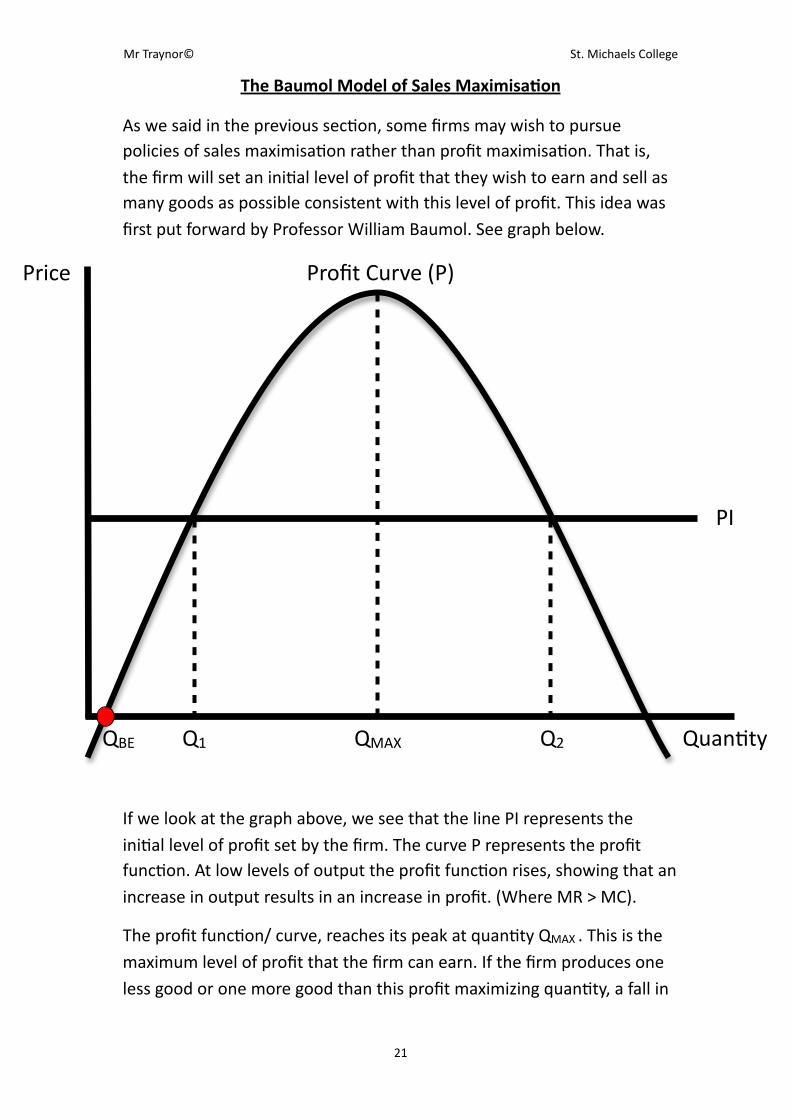
The Baumol Model of Sales Maximisa,on
As we said in the previous secLon, some firms may wish to pursue policies of sales maximisaLon rather than profit maximisaLon. That is, the firm will set an iniLal level of profit that they wish to earn and sell as many goods as possible consistent with this level of profit. This idea was first put forward by Professor William Baumol. See graph below.
If we look at the graph above, we see that the line PI represents the iniLal level of profit set by the firm. The curve P represents the profit funcLon. At low levels of output the profit funcLon rises, showing that an increase in output results in an increase in profit. (Where MR > MC).
The profit funcLon/ curve, reaches its peak at quanLty QMAX . This is the maximum level of profit that the firm can earn. If the firm produces one less good or one more good than this profit maximizing quanLty, a fall in
Mr Traynor© St. Michaels College
21
Price
QuanLty
!Profit Curve (P)
QMAX
PI
Q1 Q2QBE
profits would result. Maximum Profit occurs at the level of output where MC = MR and MC is rising.
Beyond quanLty QMAX , we see that the profit funcLon starts to fall again. Showing that an increase in output results in a decrease in profits.(Where MC > MR).
NOTE: At very low levels of output the firm is suffering a loss. This is due to the fact that Fixed Costs are incurred even if the firm produces nothing. The firm does not break even unLl the quanLty QBE . Aaer quanLty QBE the firm begins to earn a profit.
If we drop a perpendicular line form where the iniLal profit line (PI) cuts the profit curve (P); we find the two quanLLes that the firm could produce in order to earn the required level of profit. These two quanLLes occur at Q1 and Q2 respecLvely. If the firm is trying to maximise sales, they will produce the quanLty Q2, this is the level of output that earns the firm the greatest market share consistent with the iniLal level of profit.
If the firm is a profit maximiser, they will produce quanLty QMAX .
If the firm wishes to just reach the iniLal profit level and is not concerned with profit maximisaLon or market share, then they will produce the quanLty Q1 .
Mr Traynor© St. Michaels College
22