Embed Size (px)
Citation preview
-
omwTM-13530
IN SITU TREATMENT OF MIXEDCONTAMINANTS IN GROUNDWATER:
Application of Zero-Valence Iron andPalladized Iron for Treatment ofGroundwater Contaminated with
Trichloroethene and Technetium-99
N. E. KORTEL. LIANG
B. GUM. T. MUCK
J. L. ZUTMANR M. SCHLOSSER
R L. SIEGRISTT. C. HOUK
Q. FERNANDO
This report has been reproduced directly from the best available copy.
Available to DOE and DOE contractors from the Office of Scientific and Techni-cal Information, P.O. Box 62, Oak Ridge, TN 37631; prices available from (615)5766401, FTS 6266401.
Available to the public from the National Technical Information Service, U.S.Department of Commerce, 5266 Port Royal Rd., Springfield. VA 22161.
This report was prepared as an account of work sponsored by an agency ofthe United States Government. Neither the United States Government nor anyagency thereof, nor any of their empioyees. makes any warranty, express orimplied, or assumes any legal liability or responsibilii for the accuracy, conkpleteness. or usefulness of any information, apparatus, product, or process dis-closed, or represents that its use would not infringe privately owned rights.Reference herein to any specific commercial product, process, or service bytrade name, trademark, manufacturer, or otherwise, does not necessarily consti-tute or imply its endorsement, recommendation, or favoring by the United StatesGovernment or any agency thereof. The views and opinions of authorsexpressed herein do not necessarily state or reflect those of the United StatesGovernment or any agency thereof.
ORNL/TM-13530
9 IN SITU TREATMENT OF MIXED CONTAMINANTSIN GROUNDWATER:
‘f Application of Zero-Valence Iron and Palladized Ironfor Treatment of Groundwater Contaminated
with Trichloroethene and Technetium-99
N. E. KORTE’L. LIANG’
B. GuM. T. MUCK3
J. L. ZUTMAN3R M. SCHLOSSER3
R L. SIEGRIST2*4T. C. HOUK5
Q. FERNANDO6
.Prepared: April 1997
Environmental Sciences Division Publication No. 4721
Prepared by theOak Ridge National Laboratory
Grand Junction, CO 81503
Managed byLOCKHEED MARTIN ENERGY RESEARCH CORPORATION
for theU.S. DEPARTMENT OF ENERGY
under contract DE-AC05-960R22464
’ Oak Ridge National Laboratory, Environmental Sciences Division, Grand Junction, Cola. 81503’ Oak Ridge National Laboratory, Environmental Sciences Division, Oak Ridge, Tenn. 378313 Oak Ridge National Laboratory, Liie Sciences Division, Grand Junction, Colo. 815034 Colorado School of Mines, Golden, Colo. 804015 Portsmouth Gaseous Diffusion Plant, Piketon, Ohio 456616 University of Arizona, Tucson, Ariz. 85721

Y
A
c
c
ii
Contents
t
.
I
L
?
Figures . . . . . . . . . . . . . . . . . . . . . . . . . . . . . . . . . . . . . . . . . . . . . . . . . . . . . . . . vTables . . . . . . . . . . . . . . . . . . . . . . . . . . . . . . . . . . . . . . . . . . . . . . . . . . . . . . . viiAbbreviations, Acronyms, and Initialisms . . . . . . . . . . . . . . . . . . . . . . . . . . . . . . ixAcknowledgment . . . . . . . . . . . . . . . . . . . . . . . . . . . . . . . . . . . . . . . . . . . . . . ..xiExecutiveSummary.. . . . . . . . . . . . . . . . . . . . . . . . . . . . . . . . . . . . . . . . . . . . xiii
1. Introduction . . . . . . . . . . . . . . . . . . . . . . . . . . . . . . . . . . . . . . . . . . . . . . l-l1.1 Technology Screening . . . . . . . . . . . . . . . . . . . . . . . . . . . . . . . . . . . l-2
1.1.1 VOC Treatment Process Screening . . . . . . . . . . . . . . . . . . . . . l-41.1.2 Radionuclide Treatment Process Screening . . . . . . . . . . . . . . . l-5
2. Treatment Process Selection . . . . . . . . . . . . . . . . . . . . . . . . . . . . . . . . . . 2-l2.1 Special Concerns of Recirculation and Coupled Treatment . . . . . . . 2-l2.2 Backup Treatment Approaches . . . . . . . . . . . . . . . . . . . . . . . . . . . . 2-22.3 PORTS Support . . . . . . . . . . . . . . . . . . . . . . . . . . . . . . . . . . . . . . . 2-32.4 Commercial Partner Support . . . . . . . . . . . . . . . . . . . . . . . . . . . . . . 2-3
3. Laboratory Pilot Treatment Testing . . . . . . . . . . . . . . . . . . . . . . . . . . . . 3-l3.1 Dechlorination of Chlorinated Solvents by Zero-Valence Iron
andPd/Fe . . . . . . . . . . . . . . . . . . . . . . . . . . . . . . . . . . . . . . . . . . . . 3-l3.1.1 Batch Studies . . . . . . . . . . . . . . . . . . . . . . . . . . . . . . . . . . . . . 3-2
3.2 Radionuclide/Trace Metal Removal with Fe Filings . . . . . . . . . . . . . 3-l 53.2.1 Batch Testing . . . . . . . . . . . . . . . . . . . . . . . . . . . . . . . . . . . . 3-173.2.2 Column Studies with Fe and Resin . . . . . . . . . . . . . . . . . . . . 3-17
4. Investigation of Pd/Fe Surface . . . . . . . . . . . . . . . . . . . . . . . . . . . . . . . . 4-l
5. Pd/Fe Mechanistic Studies . . . . . . . . . . . . . . . . . . . . . . . . . . . . . . . . . . . 5-l5.1 Experimental . . . . . . . . . . . . . . . . . . . . . . . . . . . . . . . . . . . . . . . . . . . 5-25.2 Carbon Cloth Cathodes . . . . . . . . . . . . . . . . . . . . . . . . . . . . . . . . . . 5-55.3 Graphite Rod Electrodes . . . . . . . . . . . . . . . . . . . . . . . . . . . . . . . . . 5-75.4 Iron Wire Electrodes . . . . . . . . . . . . . . . . . . . . . . . . . . . . . . . . . . . . 5-75.5 Palladium Gauze Electrodes . . . . . . . . . . . . . . . . . . . . . . . . . . . . . . . 5-75.6 Implications for the Reaction Mechanisms . . . . . . . . . . . . . . . . . . . . 5-8
6. Longevity and Regeneration of Pd/Fe . . . .6.1 Poisoning . . . . . . . . . . . . . . . . . . . . . .6.2 Loss of Palladium . . . . . . . . . . . . . . . .6.3 Regeneration . . . . . . . . . . . . . . . . . . .6.4 Discussion . . . . . . . . . . . . . . . . . . . . .
7. Field Experiments . . . . . . . . . . . . . . . . . . .
. . ................... 6-l
. . . . . . . . . . . . . . . . . . . . . 6-l
. . . . . . . . . . . . . . . . . . . . . 6-2
. . . . . . . . . . . . . . . . . . . . . 6-3
. . . . . . . . . . . . . . . . . . . . . 6-6
. . . . . . . . . . . . . . . . . . . . . 7-l
. . .111
7.1 Treatment Trailer . . . . . . . . . . . . . . . . . . . . . . . . . . . . . . . . . . . . . . . 7-l7.2 Treatment of Tcgg with Zero-Valence Iron . . . . . . . . . . . . . . . . . . . . 7-57.3 Phase 1 - Full-Scale with J&K-Prepared Pd/Fe . . . . . . . . . . . . . . . . . 7-5
7.3.1 Pd/Fe Design Parameters . . . . . . . . . . . . . . . . . . . . . . . . . . . . . 7-77.3.2 Field Test. . . . . . . . . . . . . . . . . . . . . . . . . . . . . . . . . . . . . . . . . 7-87.3.3 Effects on Other Chemical Constituents . . . . . . . . . . . . . . . . . 7-10
7.4 Phase 2 - Small-Scale Experiment with JMC-Prepared Pd/Fe . . . . . 7-l 17.5 Phase 3 - Small-Scale Field Test with Pd/Fe Prepared On-Site . . . . 7- 167.6Summary . . . . . . . . . . . . . . . . . . . . . . . . . . . . . . . . . . . . . . . . . . . . 7-20
References . . . . . . . . . . . . . . . . . . . . . . . . . . . . . . . . . . . . . . . . . . . . . . . S- 1
iv
c 3.1.3.2.
. 3.3.3.4
3.5.3.6.
3.7.
3.8.
@ 3.9.3.10.
” 3.11.3.12.3.13.
3.14.3.15.4.1.4.2.4.3.4.4.
4.5.
Figures
Peak area of TCE in solution . . . . . . . . . . . . . . . . . . . . . . . . . . . . . . . . 3-4Comparative TCE reduction rates , . . . . . . . . . . . . . . . . . . . . , . . . . . . 3-6Peak area of dichloromethane . . . . . . . . . . . . . . . . . . . . . . . . . . . . . . . 3-7Mass of VOCs escaping from a 40-mL VOA vial with an adaptor capand 10 mL of a high-level aqueous solution of VOCs . . . . . . . . . . . . . 3-8Schematic diagram of zero-headspace extractor . . . . . . . . . . . . . . , . . 3-10Kinetics and byproduct distribution from TCE degradation by zero-valence iron. Initial pH was 6.5. Initial TCE concentration was17.4 urn (2.3 ppm). The solution was buffered with 1 mM NaHCO,;25 g of iron filings (Fisher, 40-mesh) was added to 125-r& solution.C2 includes ethene and ethane . . . . . . . . . . . . . . . . . . . . . . . . . . . . . . 3-12Kinetics and byproduct distribution from TCE reduction by palla-dized iron. Reduction of TCE with iron alone is shown as n . The con-ditions were TCE = 15.3 urn (2 ppm), NaHCO, = 1 mM, Ph = 6.5 25 gpalladized (0.05%) iron (iron is from Fisher, 40 mesh) in 125 mL ofsolution. C2 is a combination of ethene and ethane . . . . . . . . . . . . . . 3-13TCE analysis with 14C tracer with scintillation counting. Experimentwas conducted with 10 g iron filings (Fisher, 40 mesh) in 50-rnL TCEsolution. The solution contained 1 mM NaHCO,, 71.6 urn(9.4 ppm) TCE. 14C tracer was added to the TCE solution. The initialpHwas6.5 . . . . . . . . . . . . . . . . . . . . . . . . . . . . . . . . . . . . . . . . . . . . 3-14Tc sorption by Master Builder iron filings . . . . . . . . . . . . . . . . . . . . . 3-l 8Tc sorption by Fisher iron filings . . . . . . . . . . . . . . . , . . . . . . . . . . . . 3-19Batch test removal of Tcgg using iron filings, PGDP well No. 66 . . . . 3-21Batch test removal of Tcgg using iron filings, PGDP well No. 186 . . . 3-22Tc removal from Fisher iron filings column. Note: C/Co = measuredactivity divided by the initial activity : . . . . . . . . . . . . . . . . . . . , . . . . 3-24Tc removal from resin column . . . . . . . . . . . . . . . . . . . . . . . . . . . . . . 3-26Removal of Tc? in a column experiment at PGDP . . . . . . _ . . . . . . . . 3-27Micro-PIXE surface analysis of Pd/Fe filings . . . . . . . . . . . . . . . . . . . . 4-2XPS results for a clean, unreacted palladized iron film . . . . . . . , _ . . . . 4-4XPS results for a Pd/Fe film following reaction with TCE . , _ . . . . . . . 4-5XPS results for a Pd/Fe film after reaction with PCB and an aqueousrinse . . . . . . . . . . . . . . . . . . . . . . . . . . . . . . . .._....._.......... 4-7(a) Binding energies of the Pd 3d,,, and the Pd3d, peaks in the x-rayphotoelectron spectrum of elemental Pd deposited on the iron surface,(b) Pd 3d peaks of elemental Pd and Pd 2+ species after deposition of avery low surface of palladium. The presence of Pd-O-Fe bonds is evi-dent from the binding energies of the Pd2+ species. (c) Pd 3d peaksafter the iron surface with the Pd-O-Fe bonds was allowed to standovernight in an ultra high vacuum . . . . . . . . . . . . . . . . . . . . . . . . . . . . 4-8
V
4.6.
4.7.
4.8.
4.9.
5.1.
5.2.
5.3.
6.1,6.2.
7.1.7.27.37.47.5
7.67.7
Fe 2p photoelectron spectrum of an iron surface covered with a thinhydroxylated iron oxide film. The presence of elemental iron is con-firmed by the presence of Fe 2p peaks at 707.1 and 720.3 eV . . . . . _ 4-10Pd 3d photoelectron spectrum of a heavy deposit of elemental pal-ladium on a hydroxylated iron oxide surface. The peak shapes andpeak widths show that only elemental palladium is present . . . . . . . . . 4-12(a) Fe 2p photoelectron spectrum of the hydroxylated iron oxide film.The presence of a shoulder at 707.1 eV indicates that presence of ele-mental iron in addition to the multiple oxidation states of iron, (b) TheFe 2p photoelectron spectrum of the hydroxylated iron oxide film afterits thickness was allowed to increase in moist air for 3 weeks. The Fe3p peaks of elemental iron are obscured by the thick hydroxylated ironoxidefilm . . . . . . . . . . . . . . . . . . . . . . . . . . . . . . . . . . . . . . . . . . . . . 4-13(a) Full-scan photoelectron spectrum of the Pd/Fe surface. (b) Fullscan photoelectron spectrum of the Pd/Fe surface after exposure toan aqueous solution of saturated TCE. (c) Full-scan photoelectronspectrum of the Pd/Fe surface in panel b washed twice with 3 M HCl 4-14Reaction vessel for electrochemical experiments used to evaluatemechanism of reduction by Pd/Fe. . . . . . . . . . . . . . _ . . . . . . . . . . . . . . 5-3Production of phenol at palladized carbon cloth electrodes underconditions of controlled potential of -0.700 volts vs SCE (-X), con-trolled current of 5.6 mA (-A-), and at a constant current of 5.6 mAat a palladized graphite cathode (-+-). Degradation of 4-CP at palla-dized carbon cloth electrodes under conditions of controlled potentialof -.0700 volts vs SCE (J-), controlled current of 5.6 rnA (-v-), andat a constant current of 5.6 mA at a palladized graphite cathode (-•-). . 5-6Proposed mechanisms for the hydrodehalogenation of 4-CP to phenol.a) Direct reduction at electrode surface. b) Hydrogenation at pallad-ium catalyst surface. c) Adsorption of 4-CP at electrode substrate fol-lowed by hydrogenation at palladium island/electrode surface. . . . . . . 5-9Study of the lifetime of Pd/Fe (time vs volume). . . . . . . . . . . . . . . . . . . 6-4Complexing acids are proposed for surface regeneration and metal/radionuclide removal . . . . . . . . . . . . . . . . . . . . . . . . . . . . . . . . . . . . . . . 6-5Schematic of treatment trailer used for field tests. . . . . . . . . . . . . . . . . 7-2Detailed view of columns used for field tests . . . . , . . . . . . . . . . . . . . . 7-3Plan view of treatment trailer layout . . , . . . . . , . . . . . . . . . . . . . . . . . 7-4Tc (pCi/g) distribution in Fe columns 580,000 gal of water treated . . . 7-6Number of times influent TCE concentration was reduced by % as itpassed through the Pd/Fe treatment columns. . . . . _ . . _ . . . . . . . . . . 7-l 5Pd/Fe production chamber used for field bulk preparation of PdIFe. . . 7- 17Comparison of field and laboratory prepared Pd/Fe in laboratory batchtests ..I..................._........................... 7-19
v i
Tables
1.1 Desired features of an in situ treatment module train . . . . . . . . . . . . . . l-31.2 Candidate processes for VOC and radionuclide removal or destruction l-43.1 Observed rate constants for chlorinated ethenes in the presence of iron
filings . . . . . . . . . . . . . . . . . . . . . . . . . . . . . . . . . . . . . . . . . . . . . . . . 3-163.2 Laboratory analysis of Tc and iron filings batch samples, pCi/L . . . . . 3-207.1 Phase 2 results, ppb - low concentration influent, 0.5 galknin . . . . . . . 7-14
.
.
0
vii

a
. . .vlll
‘p cmCMSs4-CPl,l-DCE1,2-DCEDODOEESCAeVFeFIDggalGchHPLCISTRJ-MCK@Cl,KCPkeV
.mCi
,mgminmL
molnmORNLPCBspCiPdPdiFePETCPGDPPIXEPORTSPPb
Abbreviations, Acronyms, and Initialisms
centimetercorrective measure studies4-chlorophenol1,l -dichloroethene1,2-dichloroethenedissolved oxygenU. S . Department of EnergyElectron Spectroscopy for Chemical Analysiselectron voltironflame ionization detectort3-an-lgallongas chromatographyhourhigh-pressure liquid chromatographyIn Situ Treatment/RecirculationJohnson-Matthey Corporationpotassium hexachloropalladateKansas City Plantkiloelectron voltkilogramlitermilliamperemillicuriemilligramminutemillilitermillimolemolenanometerOak Ridge National Laboratorypolychlorinated biphenylspicocuriepalladiumpalladized ironPittsburgh Energy Technology CenterPaducah Gaseous Diffusion PlantProton Induced X-Ray EmissionPortsmouth Gaseous Diffusion Plantparts per billion
ix
PPm *PTPEPt/PeRBSRCTS
SCESERSSRBSTcTCEPA
::fA
parts per millionpolytetrafluoroethyleneplatinized ironRutherford Backscattering SpectrometryResearch Corporation Technologiessecondsaturated calomel electrodeRaman Spectroscopy, Surface Enhanced Raman SpectroscopysulfLr-reducing bacteriatechnetiumtrichloroethener&-amperemicrometerUniversity of Arizonaultravioletvolatile organic compoundsversusX-Ray Photoelectron Spectroscopyzero-headspace extractors
X
Acknowledgment
Identifying, testing, and implementing innovative technologies will be required inorder to meet the expectations identified in the Ten Year Plan. The PortsmouthGaseous Diffusion Plant (PORTS) has hosted and funded many technology dem-onstrations. The cooperative working relationship with the regulator community,a history of successfully moving from the demonstration stage to remediation of anexisting unit, and the available technical support have combined to make PORTSan ideal site for field demonstrating new ideas.
Many individuals and organizations have contributed to the successful completionof this project. Without the financial support and management assistance of theU. S. Department of Energy (DOE) Office of Environmental Restoration andLockheed Martin Energy Systems (LMES) at PORTS, this project could not havebeen accomplished. The project team is grateful to the following PORTSindividuals for their support to the project:
E. GillespieJ. SheppardL. KanterD. TaylorR. BarnettD. IgouT. HoukJ. ErvinG. BudzinB. AbkeH. SydnorP. BurlesonM. Pelfiey
DOEDOEDOELMESLMES (In Memorium)LMESLMESLMESLMESLMBSLMESLMESLockheed Martin Utility Services
3
‘\x i

xii
Executive Summary
This report describes the innovative treatment aspects of the project, In SituTreatment of Mixed Contaminants in Groundwater. This project was a three andone-half year effort comprised of laboratory work performed at Oak RidgeNational Laboratory (ORNL) and the University of Arizona (UofA) and fieldworkperformed at the Department of Energy’s (DOE) Portsmouth Gaseous DiffusionPlant (PORTS). Core funding for the overall project, which emphasized deploy-ment of horizontal recirculation wells and simultaneous treatment of radioactiveand hazardous organic wastes, was provided by DOE-EM-50, Office of Scienceand Technology, Subsurface Contaminants Focus Area. The plan in the originalEM-50 project was to utilize conventional treatment approaches. However,ancillary funding from PORTS, several other DOE facilities, and private compa-nies enabled innovative technologies using zero-valence iron and palladized iron@l/Fe) to be tested as part of this project.
Laboratory research conducted at ORNL and the UofA led to the discovery thatzero-valence iron treated with a trace of palladium (Pd) (nominally 0.05%) rapidlydechlorinated a wide range of hydrocarbons. Other research at ORNL and else-where has shown that many metals and radionuclides either precipitate or areadsorbed by zero-valence iron. Technetium (Tc) is particularly amenable to treat-ment of this type. Consequently, a combined approach using zero-valence iron forTc and palladized iron &l/Fe) for trichloroethene (TCE) was applied to a ground-water waste stream at the PORTS facility.
Laboratory research preparatory to the field tests demonstrated that Pd/Fe de-chlorinated TCE one to two orders of magnitude faster than untreated iron.Further studies examined the nature of the Pd/Fe surface and evaluated the reac-tion mechanism. Work with x-ray photoelectron spectroscopy demonstrated thatPd attaches to the iron surface in a two-step process whereby a Pd-oxygen bondforms first with Pd in the +2 oxidation state. The Pd is then rapidly fiu-ther reducedto the elemental state as it plates on the Fe surface.
Mechanistic studies have demonstrated that Pd./Fe reduces chlorinated hydro-carbons by hydrogenation. Hydrogen gas, formed because of the corrosion of Fe,is absorbed by the Pd. The chlorinated hydrocarbon adsorbs to the iron and is thenreduced by hydrogen at the Pd/Fe interface.
Laboratory studies with zero-valence iron revealed a very high capacity for immo-bilization of Tc. In a column study, approximately an order of magnitude more Tc-contaminated water could be treated by the iron as compared to a conventional ion
. . .xl11
exchange resin. The primary removal mechanism is believed to be reductivep r e c i p i t a t i o n .
In the field test, approximately 600,000 gal of water were treated. Treatment wasstraightforward and completely effective for Tc. The influent concentration of Tcwas lower than anticipated (<20 pCi/L). Nevertheless, all of the Tc contained inthe treated water was adsorbed by approximately 12 in. of a coarse zero-valenceiron.
Initial full-scale tests with Pd/Fe were unsuccessful because of problems in themanufacture. The Pd/Fe was prepared at a commercial facility and a subsequentinspection revealed that several important aspects of the manufacture were per-formed incorrectly. In particular, exposure to oxygen both in the air and in waterwas prolonged leading to oxidation and eventual failure of the material. Thus, thebackup treatment approach, granular activated carbon, was implemented for theremainder of the field test. However, two smaller tests were performed withPd/Fe. A smaller amount of commercially-prepared Pd/Fe was used to treat watercontaining 1 ppm of TCE. Although this material was only half as reactive astypical laboratory preparations, treatment results matched the laboratory kineticsfor approximately 100 hours, at which time an equipment malfunction terminatedthe test and ruined the Pd/.Pe.
Next, 30 kg of Pd/Fe was prepared at the field site by ORNL personnel. ThisPd/Fe had the expected kinetic reactivity, being approximately twice as reactive asthe second batch of commercially-prepared material. This was an importantfinding because it demonstrated that bulk preparations were possible. Previously,the largest batch of Pd/Fe that had been prepared with this level of reactivity wasapproximately 50 g. Unfortunately, the overall project had to be terminatedbecause of cost and schedule considerations before an adequate field test could beperformed on this new Pd/Fe.
In summary, the innovative treatment approaches showed that zero-valence iron isa very effective media for removing Tc from groundwater. Laboratory work withPd/Fe demonstrated the material’s significant potential for treatment of chlori-nated hydrocarbons. Unfortunately, the field studies did not provide an adequatetest. The fieldwork did, however, yield the following important findings: labor-atory kinetic data from batch tests could be used to predict field reactivity ofcommercially-prepared Pd/Fe and a field-prepared bulk preparation matched thereactivity of Pd/Pe prepared at the laboratory scale. These important findings willbe used as the point of departure for additional research and testing.
1. Introduction
P This report constitutes the second of three final reports for the project entitled “InSitu Treatment of Mixed Contaminants in Groundwater.” This report is limited tothe innovative treatment aspects of the program. A report on pilot testing of thehorizontal recirculation system was the first report of the series (Muck et al.1996). A comprehensive report that focuses on the engineering, cost andhydrodynamic aspects of the project has also been prepared (Korte et al. 1997a).
The overall goal of this portion of the project was to package one or more unitprocesses, as modular components in vertical and/or horizontal recirculationwells, for treatment of volatile organic compounds (VOCs) [e.g., trichloroethene(TCE)] and radionuclides [e.g., technetium (Tc)~] in groundwater. The projectwas conceived, in part, because the coexistence of chlorinated hydrocarbons andradionuclides had been identified as the predominant combination of groundwatercontamination in the U.S. Department of Energy (DOE) complex (E2iley et al.1992). Thus, a major component of the project was the development of modulesthat provide simultaneous treatment of hydrocarbons and radionuclides. Theproject was a 3 %-year effort that included screening, modeling, laboratory experi-mentation, and field demonstration. The project objectives included: (1) eval-uation of horizontal wells for inducing groundwater recirculation, (2) develop-ment of below-ground treatment modules for simultaneous removal of VOCs andradionuclides, and (3) demonstration of a coupled system (treatment module withrecirculation well) at a DOE field site where both VOCs and radionuclides arepresent in the groundwater.
The project was a direct extension of prior work with the DOE International Tech-nology Exchange Program. Several countries, notably the former West Germany,have significant environmental restoration and waste management research anddevelopment programs. Confronted with contaminated land from the world warsand the postwar industrialization period, researchers have been actively develop-ing and implementing technologies for effective environmental restoration. Aninvestigation of German developments by Oak Ridge National Laboratory(ORNL) staff (Siegrist et al. 1993) determined that recirculation technologies hadnear-term potential for application at DOE sites. In addition, the investigation ofGerman technologies also identified needs that would increase the applicabilityand utility of recirculation systems: (1) testing and demonstration of horizontalrecirculation wells and (2) modular packaging of unit processes for downholetreatment of multiple contaminant classes. Accordingly, this project was initiatedwith funding from DOE’s Office of Science and Technology, subsurface contami-nation focus area (EM-50).
l-l
l-2
The initial project plan focused on coupling conventional treatment processes.However, the project team’s simultaneous involvement with treatment mediaresearch enabled inchtsion of innovative processes employing zero-valence ironand palladized iron (Pd/Fe). The evaluation of innovative treatment in this projectcould not have been accomplished without the project infrastructure provided byDOE-EM-50. However, specific funding for the zero-valence iron and Pd/Fework was provided by DOE-EM-40 from the Portsmouth Gaseous Diffusion Plant(PORTS) and Paducah Gaseous Diffusion Plant (PGDP), the Kansas City Plant(KCP) and by a private partner, Research Corporation Technologies (RCT). Fieldtesting was performed at DOE’s PORTS site near Piketon, Ohio.
1.1 Technology Screening
The initial project activity was the screening and preliminary evaluation ofcandidate treatment processes for use in treating mixed contaminants (VOCs andradionuclides). Treating mixed contaminants presents unusual difficulties.Typically, VOCs are the most abundant contaminants, but the presence ofradionuclides results in additional health concerns that must be addressed by atreatment approach vastly different from that used for VOCs. Furthermore, thepresence of radionuclides may yield mixed-solid wastes if the VOCs are treatedby conventional means (e.g., pump-and-treat with aboveground carbon adsorp-tion). These issues were specifically addressed in the evaluation of candidatetreatment processes for testing in this program. Because no research or develop-ment of a particular process was to be performed, the technology review focusedon technologies that could be readily adapted and integrated for use with mixedcontaminants. The objective was to couple emerging or available processes intotreatment modules for use in situ. To guide the evaluation and screening effort,major groundwater plumes at DOE’s PORTS and PGDP sites were chosen asprimary candidates for an eventual field demonstration.
This evaluation and screening effort led to selection of a set of promising treat-ment processes for initial study. These processes were selected from those thatwere commercially available or emerging, because they appeared compatible withan in situ treatment module system and offered a high probability of successfulperformance in that application. Table 1.1 summarizes the features desired in thetreatment module. A safe, effective, and efficient process was the overall goal.Efficient removal and destruction processes are desirable in order to limit thetreatment time (objectives 1 and 2). Successful completion of the project includedgeneral-public and site-worker protection (objective 3). Objective 4 reflectedproject cost and resource effectiveness. Processes that destroy and/or concentratecontaminants may achieve desired minimization of secondary waste streams(objectives 5 through 7). Most processes targeted single contaminants or classes
1-3
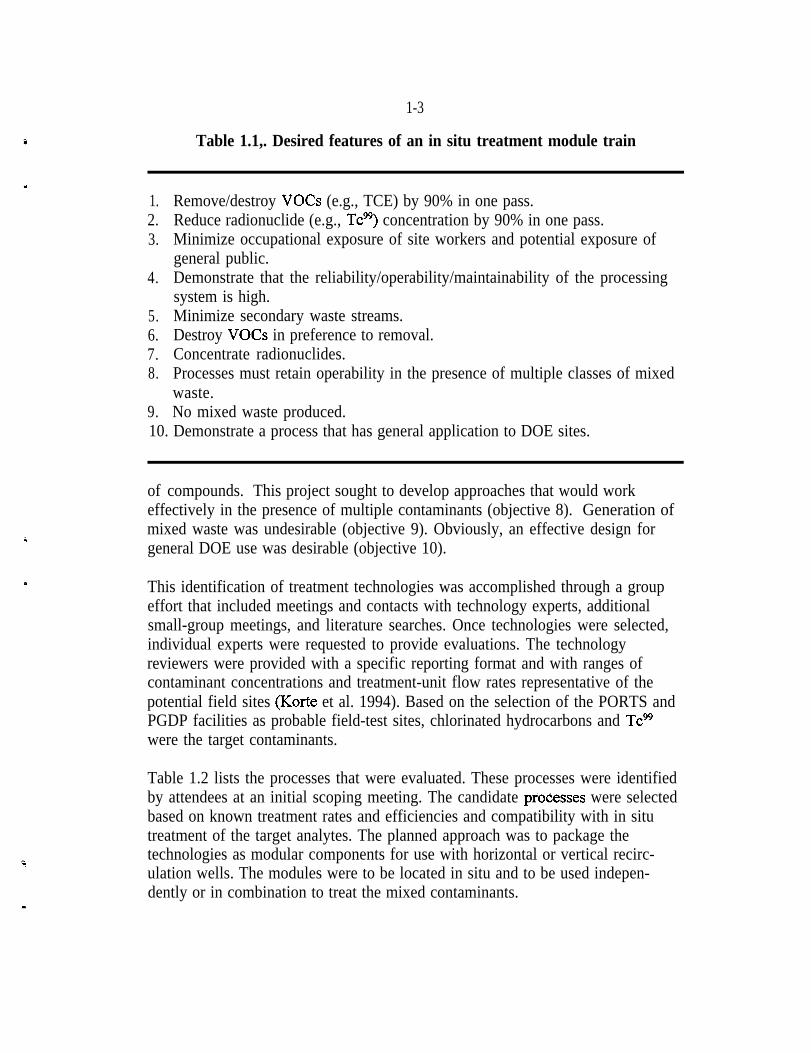
3 Table 1.1,. Desired features of an in situ treatment module train
e1.2.3.
4.
5. Minimize secondary waste streams.6. Destroy VOCs in preference to removal.7. Concentrate radionuclides.
Remove/destroy VOCs (e.g., TCE) by 90% in one pass.Reduce radionuclide (e.g., Tcgg) concentration by 90% in one pass.Minimize occupational exposure of site workers and potential exposure ofgeneral public.Demonstrate that the reliability/operability/maintainability of the processingsystem is high.
8. Processes must retain operability in the presence of multiple classes of mixedwaste.
9. No mixed waste produced.10. Demonstrate a process that has general application to DOE sites.
i
P
of compounds. This project sought to develop approaches that would workeffectively in the presence of multiple contaminants (objective 8). Generation ofmixed waste was undesirable (objective 9). Obviously, an effective design forgeneral DOE use was desirable (objective 10).
This identification of treatment technologies was accomplished through a groupeffort that included meetings and contacts with technology experts, additionalsmall-group meetings, and literature searches. Once technologies were selected,individual experts were requested to provide evaluations. The technologyreviewers were provided with a specific reporting format and with ranges ofcontaminant concentrations and treatment-unit flow rates representative of thepotential field sites (Korte et al. 1994). Based on the selection of the PORTS andPGDP facilities as probable field-test sites, chlorinated hydrocarbons and Tcggwere the target contaminants.
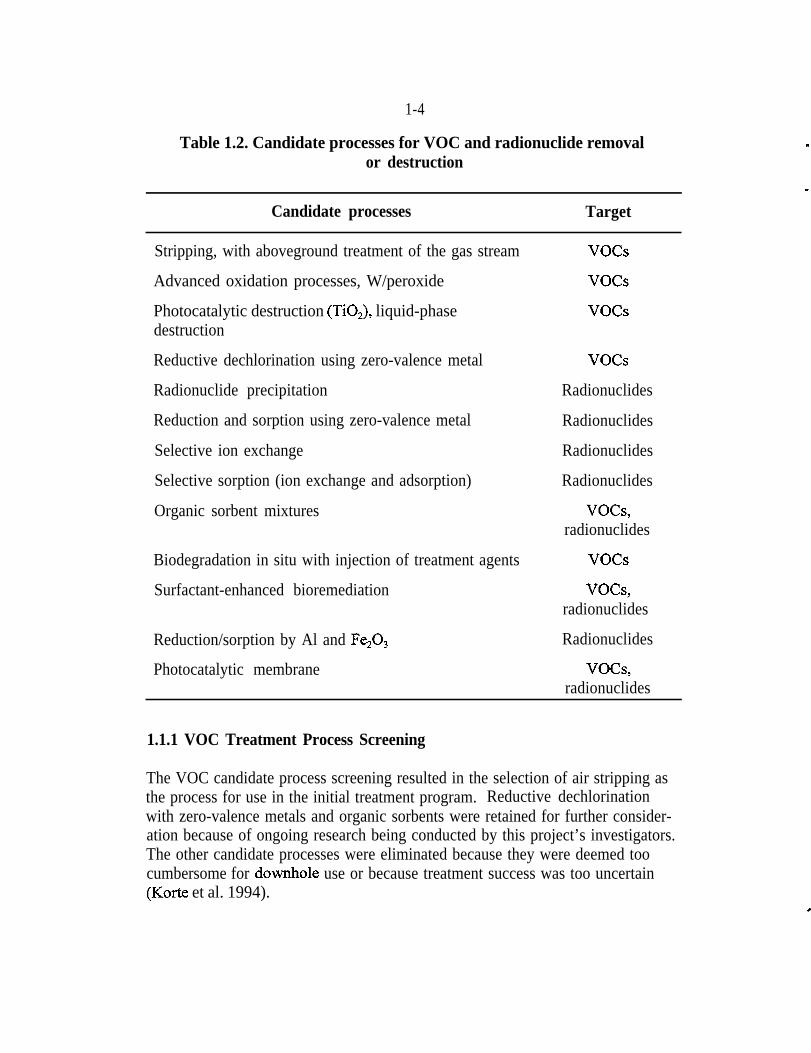
Table 1.2 lists the processes that were evaluated. These processes were identifiedby attendees at an initial scoping meeting. The candidate prodesses were selectedbased on known treatment rates and efficiencies and compatibility with in situtreatment of the target analytes. The planned approach was to package thetechnologies as modular components for use with horizontal or vertical recirc-ulation wells. The modules were to be located in situ and to be used indepen-dently or in combination to treat the mixed contaminants.
1-4
Table 1.2. Candidate processes for VOC and radionuclide removalor destruction
Candidate processes Target
Stripping, with aboveground treatment of the gas stream
Advanced oxidation processes, W/peroxide
Photocatalytic destruction (TiO,), liquid-phasedestruction
Reductive dechlorination using zero-valence metal
Radionuclide precipitation
Reduction and sorption using zero-valence metal
Selective ion exchange
vocs
Radionuclides
Radionuclides
Radionuclides
Selective sorption (ion exchange and adsorption) Radionuclides
Organic sorbent mixtures
Biodegradation in situ with injection of treatment agents
Surfactant-enhanced bioremediation
Reduction/sorption by Al and Fe,O,
Photocatalytic membrane
vocs
vocs
vocs
vocs,radionuclides
vocs
vocs,
radionuclides
Radionuclides
vocs,radionuclides
1.1.1 VOC Treatment Process Screening
The VOC candidate process screening resulted in the selection of air stripping asthe process for use in the initial treatment program. Reductive dechlorinationwith zero-valence metals and organic sorbents were retained for further consider-ation because of ongoing research being conducted by this project’s investigators.The other candidate processes were eliminated because they were deemed toocumbersome for downhole use or because treatment success was too uncertain(Korte et al. 1994).
E
l-5
5 1.1.2 Radionuclide Treatment Process Screening
4 The radionuclide candidate process screening resulted in the selection of selectiveion exchange as the appropriate process for the initial treatment program. Sorptionwith zero-valence metals and sorption with organic sorbents were retained forfurther consideration as above. The other processes were eliminated againbecause they were too cumbersome or because success was too uncertain.

,

2-l
3 2. Treatment Process Selection
.
E
It was recognized at the outset of the project, that research into new treatmentmethods was very active. Indeed, other research being conducted by the principalinvestigators for this project resulted in the application of zero-valence metals inthe treatment scheme rather than air stripping/ion exchange as initially selectedwith the screening process. The other research being conducted included a seriesof DOE-EM-40 funded literature, laboratory, and field studies funded by thePittsburgh Energy Technology Center (PETC), PGDP, PORTS, and the KCP.Each of these entities was interested in the potential application of zero-valenceiron to chlorinated solvent degradation and/or metal or radionuclide removal. Thework that was conducted was used to support corrective measures studies (CMSs)for hazardous waste sites under the purview of the particular facility. Theperformance of this work led to the discovery that Pd/Fe degraded chlorinatedhydrocarbons an order of magnitude or more faster than untreated zero-valenceiron (Muftikian et al. 1995; Korte et al. 1997b). Moreover, PcVFe degradedpolychlorinated biphenyls (PCBs) and dichloromethane which are not degradedby zero-valence iron. This discovery was performed in conjunction with research-ers at the University of Arizona (UofA). RCT, a venture capital/technologytransfer company filed a patent on the process, which was issued in March of1997 (No. 5,611,936), on behalf of the UofA and began a program to license thepatent to the private sector.
In the meantime, studies supporting CMS activities at PORTS and PGDP demon-strated that zero-valence iron was effective at removing TcW (Clausen et al. 1995;Gu et al. 1996; Muck et al. 1995). Consequently, the decision was made to testzero-valence iron for Tcgg removal and Pd/Fe for the destruction of chlorinatedhydrocarbons (see Sect. 2.3 and 2.4).
2.1 Special Concerns of Recirculation and Coupled Treatment
Treating groundwater in a recirculation mode with coupled processes involvesdifficulties not encountered for conventional ex-situ treatment. The selection oftreatment methods must address the effects the processes have on each other andon the aquifer. For example, air stripping does not couple very well with the useof Fe to remove Tcgg. The primary mechanism for Tc removal by Fe is believed tobe reductive precipitation (Gu et al. 1996). Thus, oxygen removal is necessarybefore Tc can be reduced, but oxygen is also the principal clogging agent for Fecolumns or barriers (Mackenzie et al. 1997). Thus, to use air stripping with Fewithout risk of clogging the well or aquifer would require the use of nitrogen as
2-2
the stripping fluid. Using nitrogen would have added significantly to the cost andcomplication of treatment.
.Treated, recirculated, groundwater might also change the subsurface environment.For example, the Gallia aquifer at PORTS, which was being treated in this project,is relatively low in oxygen and contains dissolved Fe in some locations. With airstripping, there was concern that oxygen injected during reinjection would bothprecipitate Fe and stimulate growth of Fe-oxidizing bacteria-a widely-recog-nized problem in southern Ohio. Such problems could lead to clogging of thewell and the aquifer. In addition, with ion exchange there is the problem that theresin would absorb a certain amount of VOC-containing water and, hence, wouldalways have to be tested to determine if it were a mixed waste. Likewise, strip-ping is always accompanied by scaling from metal precipitation, sedimentation,and microbial growth. These solid phases would surely contain Tc~~ and requireadditional testing.
After reviewing these considerations, it was concluded that Fe, Pd/Fe, ionexchange resin, and granular activated carbon would provide combinationscompatible with each other and with the Gallia aquifer. For example, in the Fe-Pd/Fe system, any oxygen in the groundwater would initially be removed by theFe, which would simultaneously remove the Tc~~ (see Sect. 3.2). Water enteringthe Pd/Fe, therefore, would be free of both oxygen and Tc~~. Thus, the Pd/Fewould be protected from clogging and would not become a mixed waste. The Fealso had the facility of slowly reducing chlorinated VOCs such that, after a fewhours or days of storage following removal from t&e system, it would contain onlyTc~~ and would not be a mixed waste. The only effect on the aquifer would be theinjection of soluble Fe which was already present.
2.2 Backup Treatment Approaches
The laboratory and field tests had provided a high degree of certainty thatelemental Fe would be effective for removing Tc~~. Nevertheless, there was .concern regarding clogging because of the formation of iron oxides, sulfates, andcarbonates. Thus, a commercial ion exchange resin was considered the back-upfor the treatment of Tc99.
Field use of Pd/Fe for VOC destruction was considered much more uncertain thanthe use of Fe to remove Tc. The material had never been prepared in bulk andJohnson-Matthey Corporation (JMC), the supplier hired by RCT, used proprietarypreparation methods. Although the laboratory tests were promising, there wereindications that the JMC-prepared material might not be sufficiently rugged.Thus, granular activated carbon was considered the backup.
2-3
Some discussion is appropriate for the selection of carbon. Carbon is oftenconsidered an inferior approach for VOC cleanup because the contaminants aretransferred from one media to another. However, carbon is particularly useful forusing in situ in a horizontal well as this project was attempting to demonstrate.For example, carbon is light in weight and available in bulk. Thus, it could beeasily deployed in canisters of various sizes including those which would fit in thearm of a horizontal well. In addition, carbon was also deemed the most usefulsurrogate for Pd/Fe in an operational sense. The Fe would still remove theoxygen and Tc~~ and would dechlorinate residual VOCs when taken off line. Thedifference in the Fe-C system as compared to the Fe-Pd/Fe system, therefore, isthat the VOC portion of the treatment relied on sorption and removal rather thanon destruction. In other words, the carbon would have to be treated for removal ofthe sorbed VOCs. It should be noted that any of these configurations satisfied theinitial intent of the project which was aimed at coupled, conventional treatment.Innovative treatment only became possible because of the additional work per-formed with funding from the additional sources mentioned in the Introduction.
2.3 PORTS Support
The project could not have been conducted without the strong and resolute sup-port of the PORTS facility. PORTS funded much of the site preparation and wellconstruction and provided direct funding to OWL. Overall support from PORTSamounted to more than one million dollars. Most of that support was for infia-structure and construction of the horizontal wells. Support for treatment researchwas limited to approximately $30K for the In Situ Treatment/Recirculation(ISTR) project. Those funds were used for laboratory work at ORNL and theUofA. PORTS, however, also funded treatability studies needed for a CMS thatincluded laboratory treatment of Tc~~ with iron and dechlorination of TCE withPd/Fe (Muck et al. 1995; Korte et al. 1995a). That work had considerable synergywith the ISTR project requirements and, indeed, was necessary for the field test ofFe and Pd/Fe. Funding for these efforts was approximately $150K.
2.4 Commercial Partner Support
As noted in the Introduction, a patent has been issued for the Pd/Fe technology onbehalf of the UofA by RCT. RCT, therefore, had an interest in seeing that thematerial was used and provided a trailer for the field test. This trailer, described inSect. 5.1, was provided as a gift to ORNL and the DOE and is now available foruse at other sites. RCT’s direct investment, specific to the project at PORTS, wasapproximately $55K.
2-4
Similarly, JMC, as one of the few suppliers of precious metal materials, has aninterest in the development of a commercial market for Pd/Fe. Consequently,JMC tested several preparation processes at no cost to the project. Small
1 quantities were prepared and submitted to ORNL for testing. Ultimately, JMCprepared two bulk shipments at their factory in New Jersey. The initial bulkshipment was purchased by RCT at an estimated cost of $12K. However, JMCexpended considerable internal time at no cost to the project. Subsequently, JMCand RCT shared the cost of a second smaller bulk shipment. Finally, JMCprovided ORNL, free of charge, the Fe and Pd salt used in the third and finalPd/Fe preparation used in this project. That final preparation was performed on-site at PORTS by ORNL personnel. JMC’s direct support to the project exceeded$1 OK but internal activities accounted for considerably more.
3-1
3. Laboratory Pilot Treatment Testing
The DOE-EM-50 portion of this project did not include laboratory researchbecause the stated objective was to couple conventional treatment processes.However, synergism with related projects enabled laboratory research to affect thechoice of treatment method. The laboratory work was, funded by various DOE-EM-40 entities as noted in the Introduction.
3.1 Dechlorination of Chlorinated Solvents by Zero-Valence Iron and Pd/Fe
The dehalogenation of chlorinated solvents by zero-valence iron has become thesubject of intensive research and development as a potentially cost-effective,passive treatment for contaminated groundwater (Gillham and O’Hannesin 1992,Gillham and O’Hannesin 1994; O’Hannesin and Gillharn 1992; O’Hannesin et al.1995; Vogan et al. 1994; Korte et al. 1995b; Liang et al. 1995; 1997). Thistreatment process is based on the fact that zero-valence iron is an effectivereducing agent for many redox-reactive species. Thermodynamically, dehalo-genation occurs through a dual-electron transfer from Fe0 to the halogenatedhydrocarbons, resulting in an oxidized Fe ion, a dehalogenated hydrocarbon, and ahalogen ion, X- :
Fe’+R-X+H’=>Fe2’+R-H+X- (1)
Although detailed reaction pathways and mechanisms are still being investigated,the reaction is believed to be a heterogeneous surface reaction. As such, degra-dation rates vary among Fe filings obtained from different sources as a result ofdifferences in surface characteristics such as specific surface area; surface chem-ical composition, and extent of surface oxidation (Gillham and O’Hannesin 1994;Homey et al. 1995; Liang et al. 1997). Laboratory studies have suggested thatcomplete dechlorination (for example: from TCE to ethylene or ethane) in asingle step is unlikely and that stepwise dechlorination must take place on themetal surface (O’Hannesin 1993; Gillham and O’Hannesin 1994; Matheson andTratnyek 1994; Sivavec and Homey 1995; Liang et al. 1995; Puls et al. 1995).More recently, a p-elimination process with formation of the intermediatechloroacetylene has been suggested as the dominant reaction pathway for TCE(Sivavec et al. 1997). These laboratory studies also show that compoundscontaining fewer chlorines such as chloroethene (vinyl chloride) are more difficultto dechlorinate than the more highly chlorinated compounds such as TCE.
In collaboration with the UofA, researchers in the Environmental SciencesDivision at ORNL found that a bimetallic preparation of Fe with a small amount
3-2
of palladium (Pd) (nominally 0.05% by weight) was a superior reductant for TCE(Korte et al. 1995b, 1997b; Muftikian et al. 1995; Liang et al. 1997; Grittini et al.1996). The bimetallic system yielded dechlorination kinetics that were one to twoorders of magnitude faster than those for zero-valence iron alone. Althoughpalladization increases the cost of the reactive Fe, the amount of filings requiredto achieve the same level of dechlorination is significantly reduced due to morerapid degradation rates. Furthermore, more complete dechlorination has beenobserved with the bimetallic substrate than with Fe alone (Liang et al. 1997).
3.1.1 Batch Studies
For preliminary experiments with Pd/Fe, the one-carbon chlorinated compoundsand the unsaturated two-carbon chlorinated compounds were obtained as follows:TCE and CC& from Fisher Scientific Co., Fair Lawn, New Jersey; l,l-dichloro-ethene (1,l -DCE), cis-1,2-dichloroethene (1,2-DCE) and h-an+1,2-DCE fromChem Service Inc., West Chester, Pennsylvania; perchloroethene from SigmaChemical Co., St. Louis, Missouri; and CHCl, and CH,Cl, from MallinckrodtSpecialty Chemicals Co., Paris, Kentucky. The purity of these compounds waschecked by gas chromatography (GC). Besides the peak that originated from theorganic compound of interest, no other peaks that could be attributed to organicimpurities were detected [limit of detection 1 parts per million (ppm)].
Elemental Fe of varying degrees of purity and with varying amounts of surfaceoxides and elemental impurities was used in this work. The Fe was obtained fromthree different commercial sources: Fe filings were obtained from Baker andAdamson, New York, New York, Fe particles (10 ,um in diameter and 99.9%pure) from Aldrich Chemical Co., Milwaukee, Wisconsin; and Fe filings(40 mesh), from Fisher Scientific Co. After the Fe was acid washed with HCl andpalladized with potassium hexachloropalladate (K,PdCL,), no significant differ-ences were found in preliminary batch experiments. K,PdCL, was obtained fromAldrich Chemical Co.
To prepare Pd/Fe for laboratory use, a 10 g sample of Fe was washed initiallywith five to six 25 mL portions of 6M HCl solution followed by five to six 25 mLportions of distilled water. Subsequently, it has been determined that a single acidwash is sufficient. Fifteen to 20 mg of K,PdCL, were dissolved in 30 to 40 mL ofdistilled water. This red-orange solution of K2PdCL6, when added with stirring tothe acid-washed Fe, turned pale yellow after the redox reaction (2) had occurred.
2Fe0 + PdClbm2 - 2Fe+2 + Pd” + 6Cl- (2)
The Pd/Fe was washed 3 to 4 times with distilled water and used, without drying,in the dechlorination experiments.
3-3
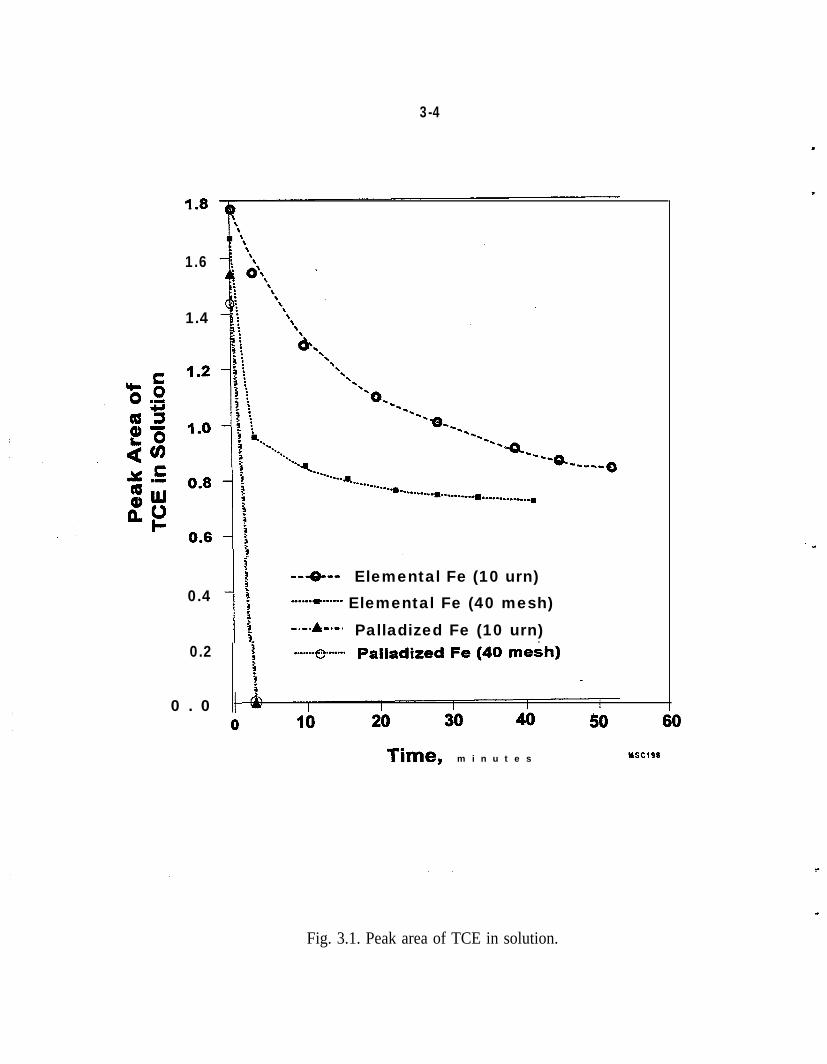
A 12 mL glass vial equipped with a Teflon septum fitted into a cap was used forthe preliminary batch dechlorination reactions. The Pd/Fe, 3.6 g of the 10 pmparticles from Aldrich Chemical Co., or 3.6 g of Fe filings from Baker andAdamson, or 10 g of 40-mesh Fe particles from Fisher Scientific Co., was placedin contact with 10 mL of a solution of the halogenated organic compound,(20 ppm in water), in the glass vial. After the vial was shaken vigorously,samples were withdrawn with a syringe for GC analysis; It is recognized thatcollecting repetitive samples from a glass vial capped with a Teflon septumresults in some loss of sample. However, as shown in Fig. 3.1 the experimentswere sufficiently reproducible and the difference in reaction rates of palladizedand unpalladized Fe was sufficiently large that effects due to leakage could bediscounted for the purposes of this comparison.
I
e
The results of the batch experiments shown in Fig. 3.1 indicate that 10 g of Pd/Fe(5 mg Pd on 10 g Fe, 40 mesh from Fisher Scientific Co.) can dechlorinate 10 mLof a 20 ppm solution of TCE in approximately 3 min, whereas 10 g of the sameFe, but unpalladized, (40 mesh Fisher Scientific Co.) reacts much more slowly.Similar results were obtained with the 10 pm particles of palladized and unpal-ladized Fe (Fig. 3.1). In these batch experiments, the concentration of TCE in thesolution was followed as a function of time. The initial rapid and subsequentgradual decrease of the TCE in the solution, (Fig. 3.1) in the presence of unpal-ladized Fe, is caused in part by the equilibration of the TCE between the head-space and the solution and not by the reaction of the TCE with unpalladized Fe.This was confiied by the absence of any detectable reaction products in the first30 min. When the reaction was followed for much longer periods of time with10 hum particles of unpalladized Fe, intermediate reaction products, 1,l -DCE and1,2-DCE (cis and i-runs) were identified in addition to ethene. With palladized10 pm particles of Fe, however, the only reaction product that was identified wasethane. Any reaction products that were present at concentrations less than 1 ppmcould not be detected in these preliminary experiments.
The pH of an aqueous solution in contact with Pd@e was monitored for 14 minand was observed to increase,from 6.68 to 8.51. In addition, hydrogen gas(confirmed by GC) was evolved when the Pd/Fe was contacted with water. Theextent to which reactions 3)-(6) occur accounts for the changes in pH that occurduring the time in which Pd/Fe is in contact with the aqueous solution.
Fe0 - Fed2 + 2e- (3)
2e- + l/20, + H,O - 2OH- (4)
Fee2 + H,O - Fe(OH)’ + H’ (5)
Fe0 + 2H’ - Fei2 + H, (6)
3-4
1.6
1.4
0.4
0.2
0 . 0
5j -+--I Elemental Fe (10 urn)5i ---*---- Elemental Fe (40 mesh)$;r m,w. B.-e&0 Palladized Fe (10 urn)
Time, m i n u t e s
50 60
YSClS8
Fig. 3.1. Peak area of TCE in solution.
3-5
The rate of the hydrodechlorination of TCE may be governed by a number of fac-tors: the surface area of the Pd, the Pd:Fe ratio on the Fe surface, the extent ofsurface oxidation, the extent of mixing, the concentration of the TCE, the pH ofthe solution and the dissolved oxygen (DO) in the solution. In these preliminaryexperiments, no attempts were made to quantify the effect of each of these factorson the reaction rate. However, it is significant to note that data obtained subse-quently show little or no effect of surface area (West et al. 1997) when the Fe ispalladized.
As noted previously, the reductive dechlorination of TCE occurs on the metalsurface. The electrons released as a result of the oxidation of the elemental Fe(equation 3), and the hydrogen gas produced (equations 3,5, and 6) may partici-pate in the rapid reductive hydrodechlorination of TCE. Hydrogen probably playsa lesser role when Fe is the reductant (Matheson and Tratnyek 1994) but is vital tothe reaction with Pd/Fe (Chapter 5, Cheng et al. in press). It is obvious that acomplex sequence of reactions governs the reaction rate and that the followingequation merely represents the stoichiometry of the overall hydrodechlorination ofTCE.
2Cl++C(H)Cl+ 3Fe0 + 5H2 -, 2&H, + 6Cl- + 3Fe’2 (7)
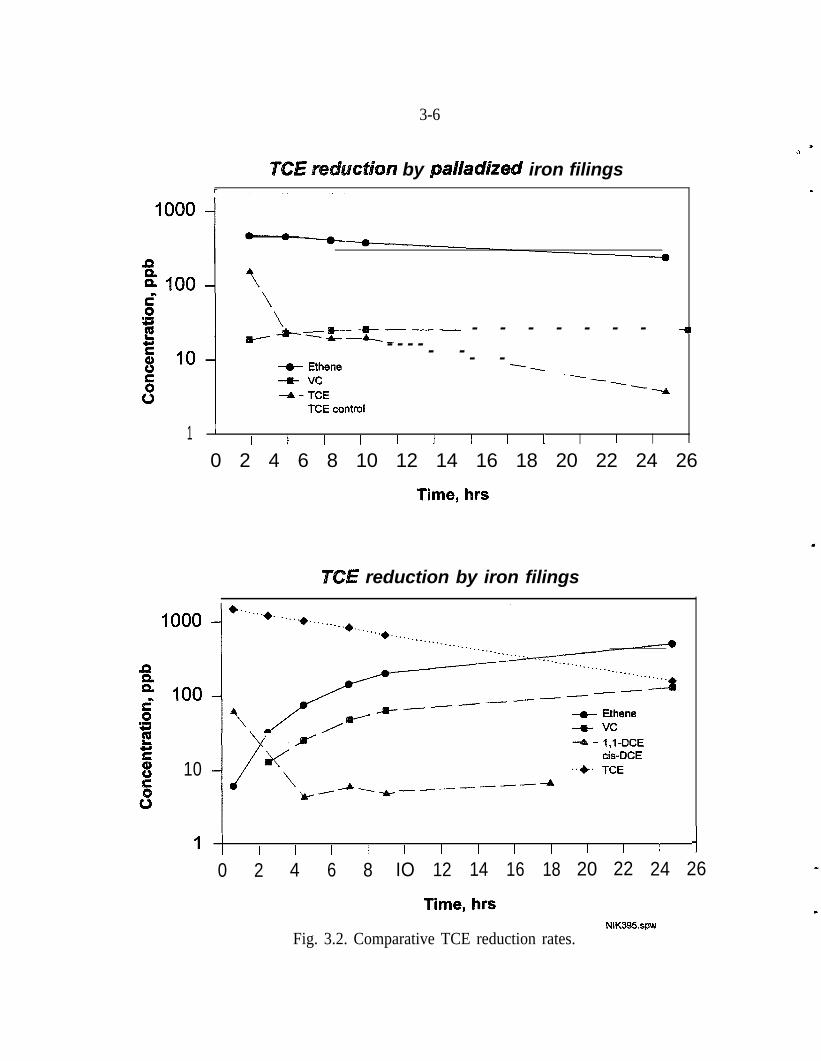
The hydrodechlorination of perchloroethene, 1,l -DCE, and cis and trans 1,2-DCEalso occur rapidly with Pd/Fe. These reductions also yield the reaction products,C,H,, Fe+2 and Cl- as shown in equation 7. Moreover, as shown on Fig. 3.2,subsequent experiments with improved analytical capability demonstrated thatwhen Pd/Fe is compared to untreated Fe, under identical conditions, the DCE iso-mers are not detected and chloroethene persists at a concentration one order ofmagnitude less.
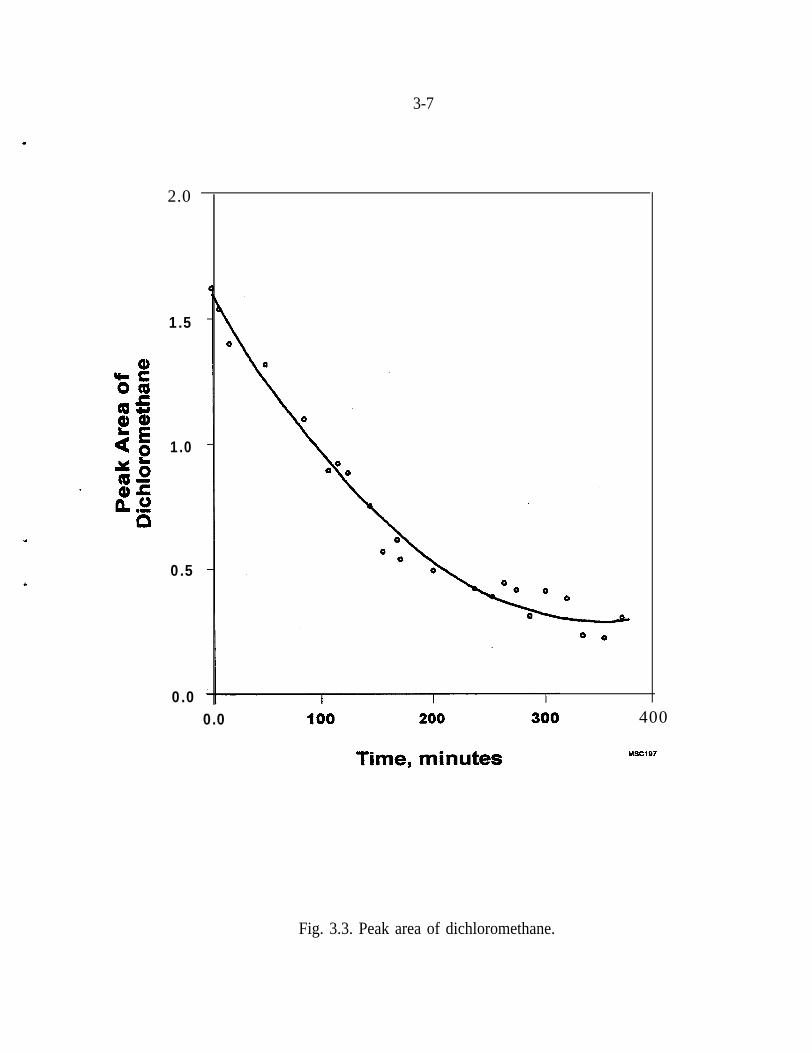
The dechlorination of the one-carbon compounds, (Ccl,, CHCl,, and CH,Cl,),was also studied with Pd/Fe. The rate of the dechlorination of Ccl, is much fasterthan that of the two-carbon unsaturated compounds (e.g., TCE). As the number ofchlorine atoms decreases, from carbon tetrachloride to chloroform and finally todichloromethane, (Fig. 3.3) the rate of the dechlorination reaction decreases. Itshould be noted, however, that dichloromethane is not dechlorinated with Fealone (Gillham and O’Hannesin 1994).
In order to perform more detailed studies, additional care was taken because of thevolatility of the compounds under study. Recent research at ORNL has focusedon the handling of water and soil samples contaminated with VOCs such as TCEand chloroethene (Gu et al. 1995; West et al. 1995; Siegrist et al. 1997). Thesestudies have shown that the leakage of VOCs from containers, though generallyrecognized, can be quite severe, and that rigorous precautions are required toensure there are no losses of volatile contaminants. An example of leakage from40-mL vial is shown in Fig. 3.4. Considering that chloroethene’s vapor pressure
3-6
n by paNadized iron filings
,~~*a------- - - - - - - - -a- - - - - - - -
+ Ethene -----s- vc --
-A - TCE -Yi
1TCE control
II I I I I I I I I I
L
0 2 4 6 8 10 12 14 16 18 20 22 24 26
Time, hrs
c
BCE reduction by iron filings
-)-m-c- --..-----
Ap’--a- Ethene+ vc
/
* - l,l-DCEcis-DCE
10 ,,+. TCE
_-_-------a
1 1 I I I I I I I I I I I I -I0 2 4 6 8 IO 12 14 16 18 20 22 24 26
Time, hrsNIK395spw
Fig. 3.2. Comparative TCE reduction rates.
3-7
2.0
1.5
1.0
0.5
0.00.0
Time, minutes
400
MSC107
Fig. 3.3. Peak area of dichloromethane.

3-9
J (2600 mm Hg) is more than 40 times that of TCE (60 mm Hg) (Barbee 1994), lossof chloroethene when conducting batch experiments is a potential problem.
The concern regarding loss of byproducts is also based on the fact that researchersin the field have not always reported a high mass balance for carbon as indicatedby reported values of 73% (Orth and Gillham 1995) and approximately 90%(Sivavec and Homey 1995). Chloride mass balances near 100% have beenreported (Haitko and Baghel 1995), but an excellent mass balance for Cl does notnecessarily mean that chloroethene is not above acceptable levels.
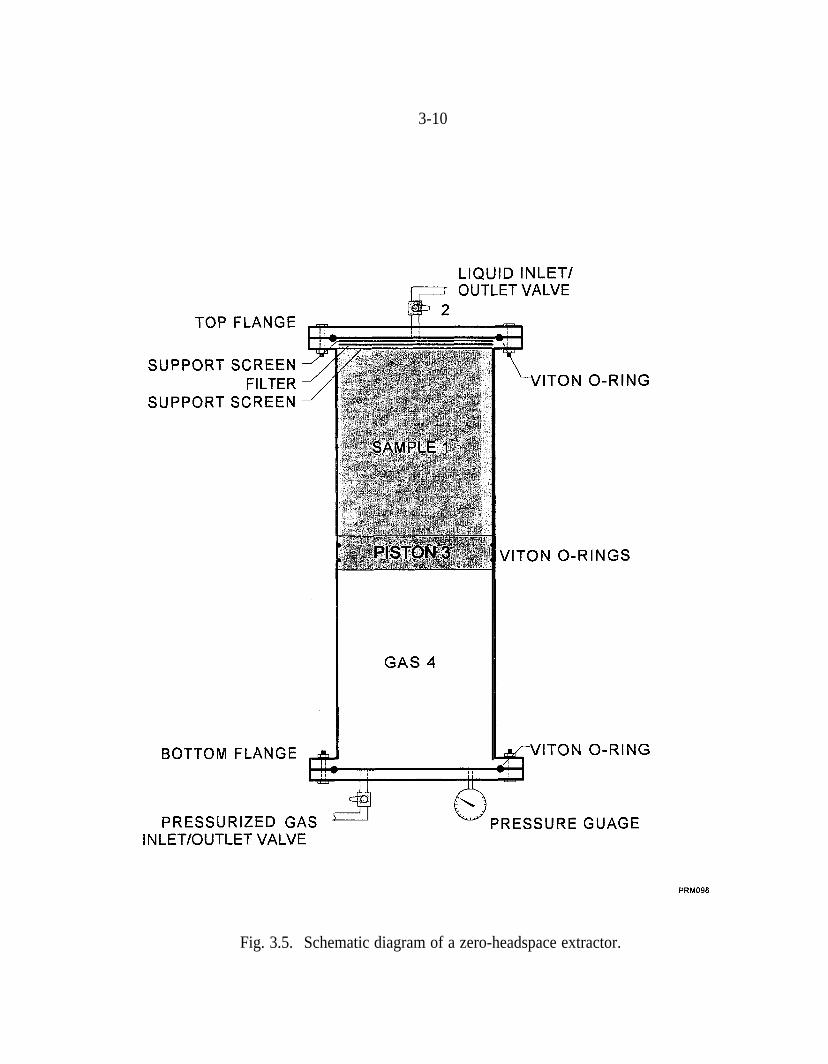
Thus, more detailed batch studies were performed with zero-headspace extractors[(ZHEs), Associated Design and Manufacturing Co., Alexandria, Virginia]. TheZHEs prevent losses due to leakage (Siegrist et al. 1997). Figure 3.5 is aschematic diagram of a ZHE. The reagents are contained in Sect. 1, andheadspace is excluded by forcing the piston up with pressurized gas.
In these batch experiments, 25 g of 40-mesh Fe filings (Fisher Scientific,Pittsburgh, Pennsylvania) were added to the ZHEs, which contained 125 mL of anaqueous solution (nominally 2 mg/L of TCE). A solution without the addition ofthe Fe filings was prepared in a ZHE as a control. The ZHEs were mounted on arack and rotated at 30 revolutionslmin. Samples were collected at variousintervals without exposing the fluid to the atmosphere. The Pd/Fe was preparedas described previously.
Sampling and analysis of TCE and its products were performed as follows. Atselected time intervals, 5-mL aqueous samples were collected from the ZHEs andimmediately injected into a purge-and-trap concentrator (Tekmar 3000, Tekmar,Cincinnati, Ohio). Samples from the concentrator were analyzed for reactionbyproducts by GC (HP-5890 Series II, Hewlett-Packard, Wilmington, Delaware)with a flame ionization detector @ID). The initial oven temperature was 30°Cand ramped to 150°C. The detector temperature was 300°C and the carrier gaswas helium with a flow rate of 7 mL/min. The GC was equipped with a 0.53~mmcapillary column (DB-624, J&W Scientific, Folsom, California).
Experiments were also performed with 14C-labeled TCE. The labeled sampleswere analyzed with a scintillation counter (Packard 2000 CA, Packard InstrumentCo., Downers Grove, Illinois). These experiments were designed to evaluate thephysical loss of TCE in the experimental apparatus (ZHEs). The same experi-mental conditions were maintained as for the unlabeled samples, except that a
3-10
LIQUID INLET/
TOP FLANGE
SUPPORT SCREENFILTER
SUPPORT SCREEN
GAS 4
BOTTOM FLANGE
PRESSURIZED
VITON O-RING
PRESSURE GUAGE
VITON O-RING
VITON O-RINGS
INLET/OUTLET VALVE
PRM098
Fig. 3.5. Schematic diagram of a zero-headspace extractor.
3-11
small fraction of 14C-labeled TCE was introduced into the TCE solution. Sampleswere collected for simultaneous GC analysis and scintillation counting. For thelatter, 9 mL of the scintillation cocktail Ecolume (ICN Biomedicals Inc., Irvine,California) were added to the 1 mL of sample:
Results
Persistence of Byproducts
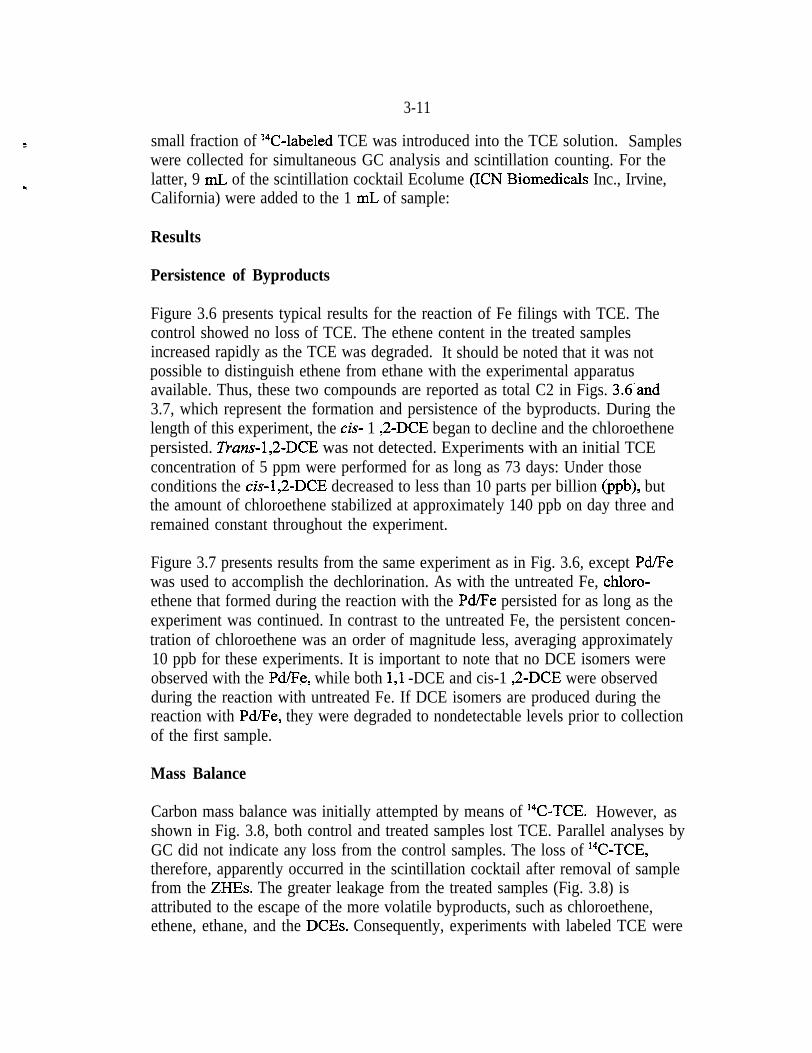
Figure 3.6 presents typical results for the reaction of Fe filings with TCE. Thecontrol showed no loss of TCE. The ethene content in the treated samplesincreased rapidly as the TCE was degraded. It should be noted that it was notpossible to distinguish ethene from ethane with the experimental apparatusavailable. Thus, these two compounds are reported as total C2 in Figs. 3.6~and3.7, which represent the formation and persistence of the byproducts. During thelength of this experiment, the cis- 1 ,ZDCE began to decline and the chloroethenepersisted. Trans-1,2-DCE was not detected. Experiments with an initial TCEconcentration of 5 ppm were performed for as long as 73 days: Under thoseconditions the cis-1,2-DCE decreased to less than 10 parts per billion (ppb), butthe amount of chloroethene stabilized at approximately 140 ppb on day three andremained constant throughout the experiment.
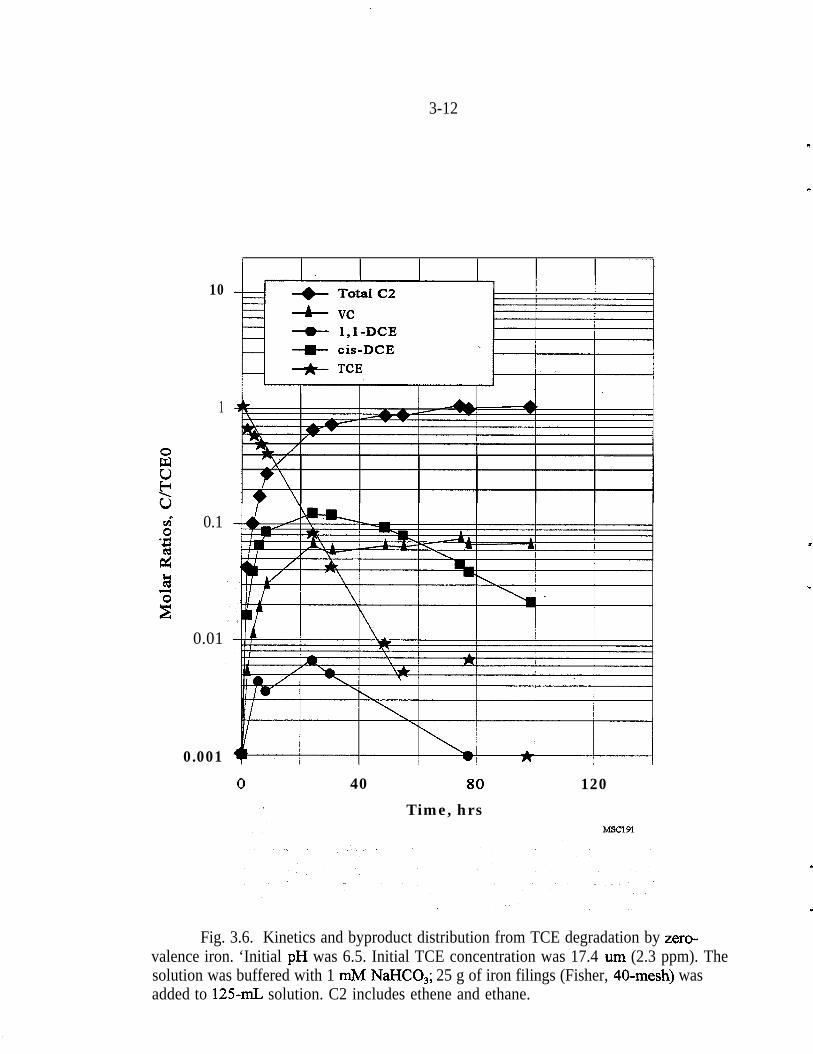
Figure 3.7 presents results from the same experiment as in Fig. 3.6, except Pd/Fewas used to accomplish the dechlorination. As with the untreated Fe, chloro-ethene that formed during the reaction with the PdiFe persisted for as long as theexperiment was continued. In contrast to the untreated Fe, the persistent concen-tration of chloroethene was an order of magnitude less, averaging approximately10 ppb for these experiments. It is important to note that no DCE isomers wereobserved with the Pd/Fe, while both 1,l -DCE and cis-1 ,ZDCE were observedduring the reaction with untreated Fe. If DCE isomers are produced during thereaction with Pd/Fe, they were degraded to nondetectable levels prior to collectionof the first sample.
Mass Balance
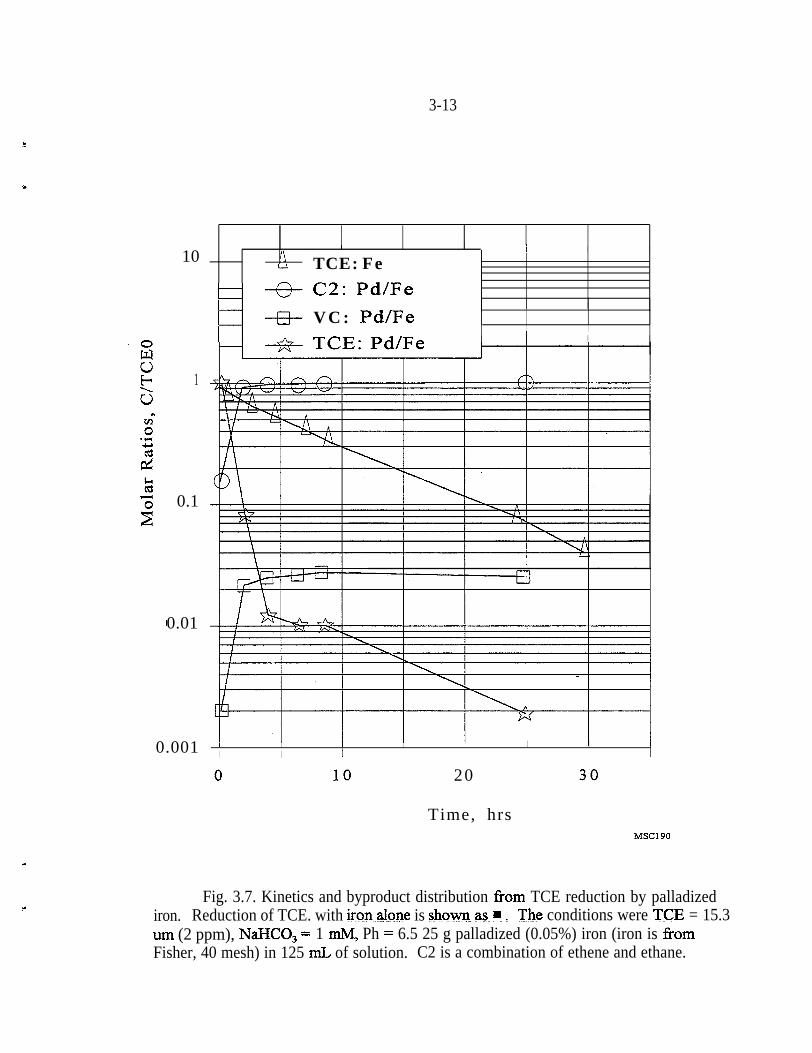
Carbon mass balance was initially attempted by means of r4C-TCE. However, asshown in Fig. 3.8, both control and treated samples lost TCE. Parallel analyses byGC did not indicate any loss from the control samples. The loss of 14C-TCE,therefore, apparently occurred in the scintillation cocktail after removal of samplefrom the ZHEs. The greater leakage from the treated samples (Fig. 3.8) isattributed to the escape of the more volatile byproducts, such as chloroethene,ethene, ethane, and the DCEs. Consequently, experiments with labeled TCE were
3-12
10
1
0.1
0.01
0.001
+ l,l-DCE-4- cis-DCE
40 80
Time, hrs
120
Msc191
Fig. 3.6. Kinetics and byproduct distribution from TCE degradation by zero-valence iron. ‘Initial pH was 6.5. Initial TCE concentration was 17.4 urn (2.3 ppm). Thesolution was buffered with 1 mM NaHCO,; 25 g of iron filings (Fisher, 40-mesh) wasadded to 125-n& solution. C2 includes ethene and ethane.
3-13
10
1
0.1
0.01I
0.001
I I I I I II\LA TCE: Fe-
H /\C3.H -
X: Pd/Fe
# h
I I
---f+ VC: Pd/FeI
II
IT-T?. n-l/r?- I I
I I I II I I
20
Time, hrsMSCl90
Fig. 3.7. Kinetics and byproduct distribution from TCE reduction by palladizediron. Reduction of TCE. with iron,,alpne is &oyq as ? :. The conditions were TCJZ = 15.3urn (2 ppm), NaJXO, = 1 n&f, Ph = 6.5 25 g palladized (0.05%) iron (iron is fromFisher, 40 mesh) in 125 mL of solution. C2 is a combination of ethene and ethane.
3-14
500
0
0 20 40 60 80 100 120 140 160
Time, hrsMSClS9
Fig. 3.8. TCE analysis with 14C tracer with scintillation counting. Experiment wasconducted with 10 g iron filings (Fisher, 40 mesh) in 50-r& TCE solution. The solutioncontained 1 m&I NaHCO,, 71.6 urn (9.4 ppm) TCE. 14C tracer was added to the TCEsolution. The initial pH was 6.5.
3-15
discontinued. Problems with labeled TCE have been reported previously (Gu etal. 1995).
As shown in Fig. 3.8, the concentration of TCE without addition of Fe remainedconstant in the ZHEs for the duration of the experiments. Unfortunately, thecarbon balance for the reaction in the ZHEs was hampered by the inability toseparate ethene and ethane. Ethane has a higher response factor with the FIDdetector, although it is believed to be present in lower concentrations than ethene.In addition, separate GC analyses indicated that the ratio of ethane to etheneincreased with time. With calibration performed with ethene, the carbon massbalance was greater than 100%. The overestimation of total carbon increases withtime because the ethane-to-ethene ratio increases. Keeping in mind that thecarbon mass balance is slightly greater than 1 00%, after 24 hrs the byproductmixture from the reaction of Fe with TCE contained approximately 12% c&l ,2-DCE, 8% chloroethene, and ~1% of 1 ,l-DCE.
Half-lives
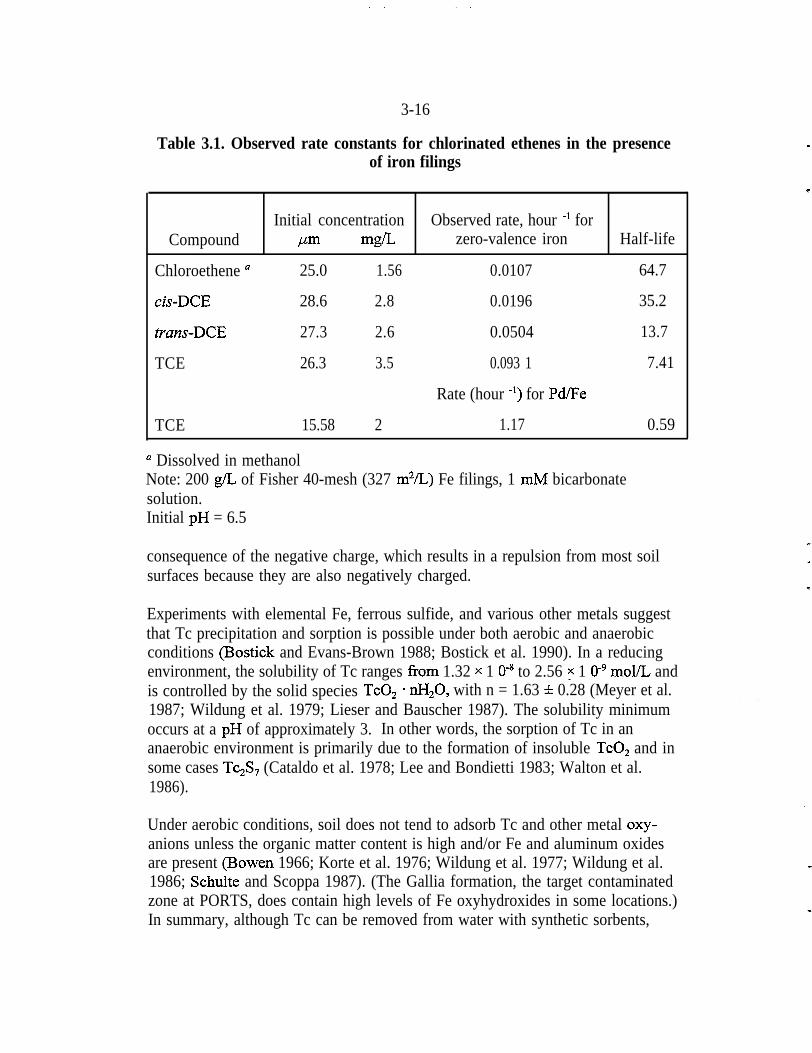
The data in Figs. 3.6 and 3.7, which compare results from experiments that usedsimilar amounts of chloroethene, cis-DCE, and z?an.r-DCE as starting materials,were used to calculate half-lives for the reductive dechlorination of TCE (Table3.1). The TCE half-life with untreated Fe was 7.4 hrs, which compares reason-ably well with other reported values from batch reactions (Gillham andO’Hannesin 1994; Sivavec and Horney 1995) conducted under somewhatdifferent conditions. For P,d/Fe, the TCE half-life under the same experimentalconditions was 35 min. The more rapid reaction is consistent with the observationthat chlorinated intermediates were less persistent with time.
In summary, these experiments established that the bimetallic system, Pd/Fe waspreferable to elemental Fe for the rapid and complete hydrodechlorination of onecarbon and two carbon chlorinated compounds. The combination of Pd, the“promoter” metal, and Fe, the “base” metal, appears to be a useful bimetallicsystem for the rapid hydrodechlorination of one-carbon and two-carbon chlori-nated compounds.
3.2 Radionuclide/T,race IQetal Removal wit.. Fe Filings
Laboratory studies focused on the treatment of Tcgg because it is the principal in-organic contaminant at the PORTS and PGDP sites. The most commonly foundoxidation states of Tc are zero-valence Tc, Tc+~, and Tc’~. The most stablechemical species of Tc in aqueous solution is pertechnetate (TcO,-), which can bequite mobile in the environment under oxidizing conditions. The mobility is a
3-16
Table 3.1. Observed rate constants for chlorinated ethenes in the presenceof iron filings
Initial concentration Observed rate, hour -I forCompound pm mg/L zero-valence iron Half-life
Chloroethene a 25.0 1.56 0.0107 64.7
c&DCE 28.6 2.8 0.0196 35.2
trans-DCE 27.3 2.6 0.0504 13.7
TCE 26.3 3.5 0.093 1 7.41
Rate (hour -‘) for Pd/Fe
TCE 15.58 2 1.17 0.59
n Dissolved in methanolNote: 200 g/L of Fisher 40-mesh (327 m2/L) Fe filings, 1 mM bicarbonatesolution.Initial pH = 6.5
consequence of the negative charge, which results in a repulsion from most soilsurfaces because they are also negatively charged.
Experiments with elemental Fe, ferrous sulfide, and various other metals suggestthat Tc precipitation and sorption is possible under both aerobic and anaerobicconditions (Bostick and Evans-Brown 1988; Bostick et al. 1990). In a reducingenvironment, the solubility of Tc ranges from 1.32 x 1 Om8 to 2.56 3 1 Omg mol/L andis controlled by the solid species TcO, - nH20, with n = 1.63 f 0.28 (Meyer et al.1987; Wildung et al. 1979; Lieser and Bauscher 1987). The solubility minimumoccurs at a pH of approximately 3. In other words, the sorption of Tc in ananaerobic environment is primarily due to the formation of insoluble TcO, and insome cases Tc2S7 (Cataldo et al. 1978; Lee and Bondietti 1983; Walton et al.1986).
Under aerobic conditions, soil does not tend to adsorb Tc and other metal oxy-anions unless the organic matter content is high and/or Fe and aluminum oxidesare present (Bowen 1966; Korte et al. 1976; Wildung et al. 1977; Wildung et al.1986; Schulte and Scoppa 1987). (The Gallia formation, the target contaminatedzone at PORTS, does contain high levels of Fe oxyhydroxides in some locations.)In summary, although Tc can be removed from water with synthetic sorbents,
3-17
B research has shown that materials that reduce Tc show the greatest removalefficiencies (Bostick and Evans-Brown 1988; Del Cul et al. 1992; Cantrell 1995).
5Work reported in the literature has focused on wastes with high concentrations ofTc (e.g., raffinate with Tc concentration of 13 mg/L or 228 mCi/L). There are noliterature data on the treatment of groundwater that contains the relatively lowconcentrations of Tc (on the order of hundreds or thousands of PC&) that areobserved at PORTS.
3.2.1 Batch Testing
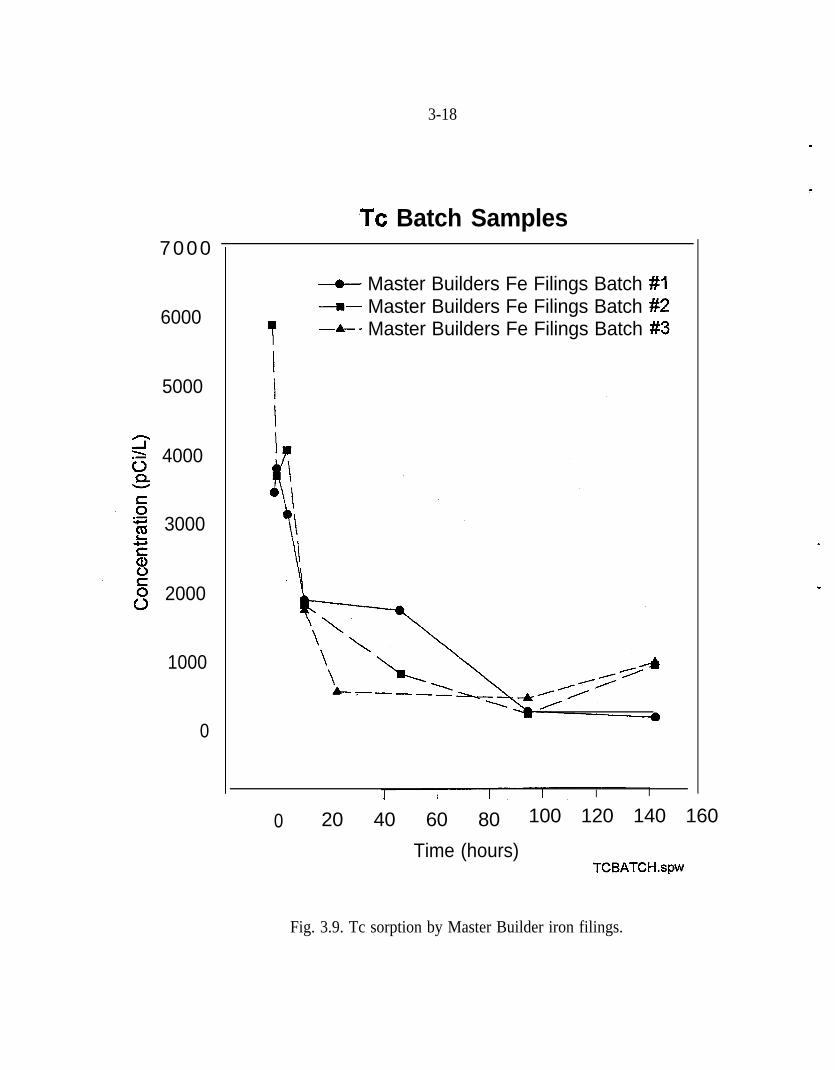
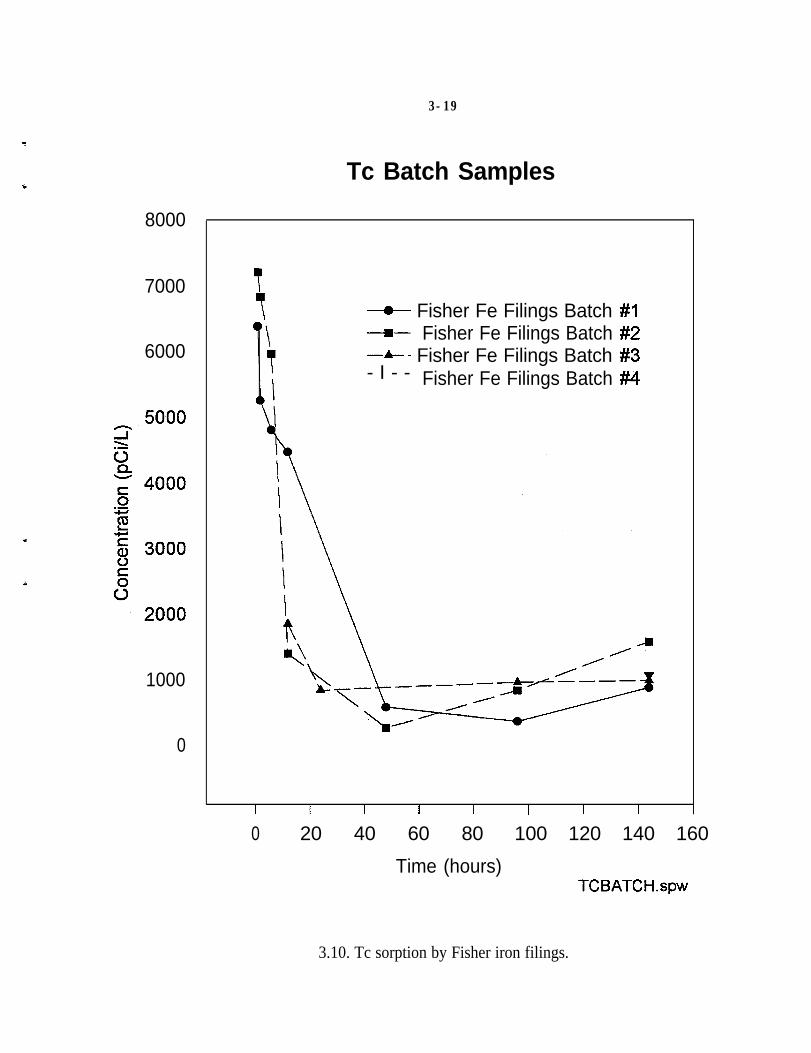
A series of batch studies were performed with water from a contaminated well atPORTS (Muck et al. 1995). Figures 3.9,3.10, and Table 3.2 present the resultsfrom laboratory analyses of these batch studies. The first set of samples whichwas collected over a five-day period consisted of the following: equipmentrinsate samples; samples of untreated groundwater (I); control samples (C);Master Builder Fe filing samples (FeM); and Fisher Fe filing samples (FeF). Thefield blank sample for all four equipment rinsate samples showed no detectableconcentrations of Tc. All of the batch tests using Fe filings show a markeddecrease in Tc concentrations (Figs. 3.9 and 3.10). The Tc removal at the end ofthe tests was approximately 80%.
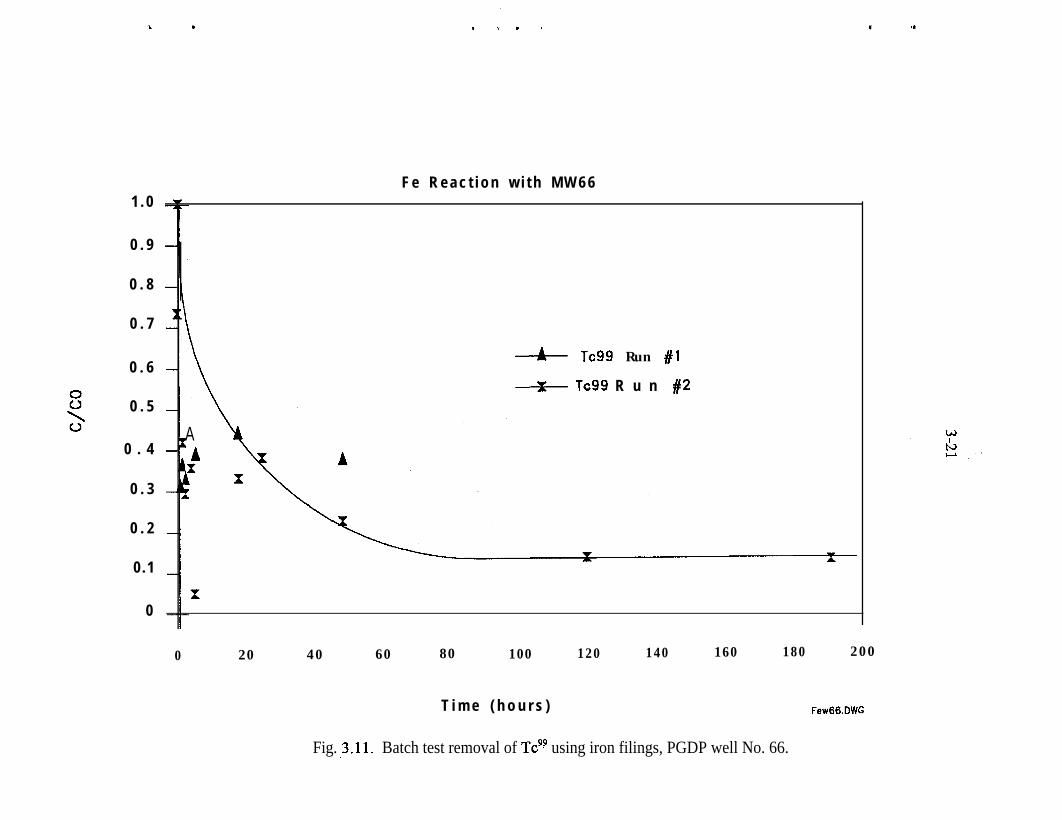
Batch experiments conducted with contaminated groundwater at the PGDP alsoindicated that removal of Tc with Fe filings was feasible. Forty-mesh Fe filingsprovided by Master Builder were used in the experiments (Clausen and Richards1994). The half-life of soluble Tc in contact with Fe ranged from less than ‘/ h to8 h. The data also indicated that approximately 40% removal of Tc occurs essen-tially instantaneously (Figs. 3.11 and 3.12). This suggests that Tc is precipitating.The tailing effect of activity levels with time could be due to a slower secondaryprecipitation mechanism or sorption of Tc to the Fe surface.
3.2.2 Column Studies with Fe and Resin
Column experiments were conducted to evaluate the capacity of zero-valence ironin comparison to Bio-Rad MSZ-1 resin-a resin, similar to those used withinDOE for Tc removal. Fe filings (Fisher Scientific) with a mesh size of 40(average diameter of 420 urn) were used for the experiments. The resin wasanalytical grade, monodispersed (average diameter of 550 urn), and chemicallysimilar to the technical grade Dowex hydroxide-form resin that is used at thePORTS facility.
Glass columns of l-cm diameter were used in the experiments, with the lengthsadjusted from 4 cm to 12 cm. Solution was introduced at the bottom inlet and
3-18
4000
3000
2000
1000
0
7000
6000
5000
.Tc Batch Samples
---a-- Master Builders Fe Filings Batch #I-+- Master Builders Fe Filings Batch #2
I -A--- Master Builders Fe Filings Batch #3
0 20 40 60 80 100 120 140 160
Time (hours)TCBATCH.spw
Fig. 3.9. Tc sorption by Master Builder iron filings.
3-19
8000
7000
6000
1000
0
Tc Batch Samples
---o- Fisher Fe Filings Batch #Ia- Fisher Fe Filings Batch #2--A---- Fisher Fe Filings Batch #3- I - - Fisher Fe Filings Batch #I4
I I I I I I I I
0 20 40 60 80 100 120 140 160
Time (hours)TCBATCH.spw
3.10. Tc sorption by Fisher iron filings.
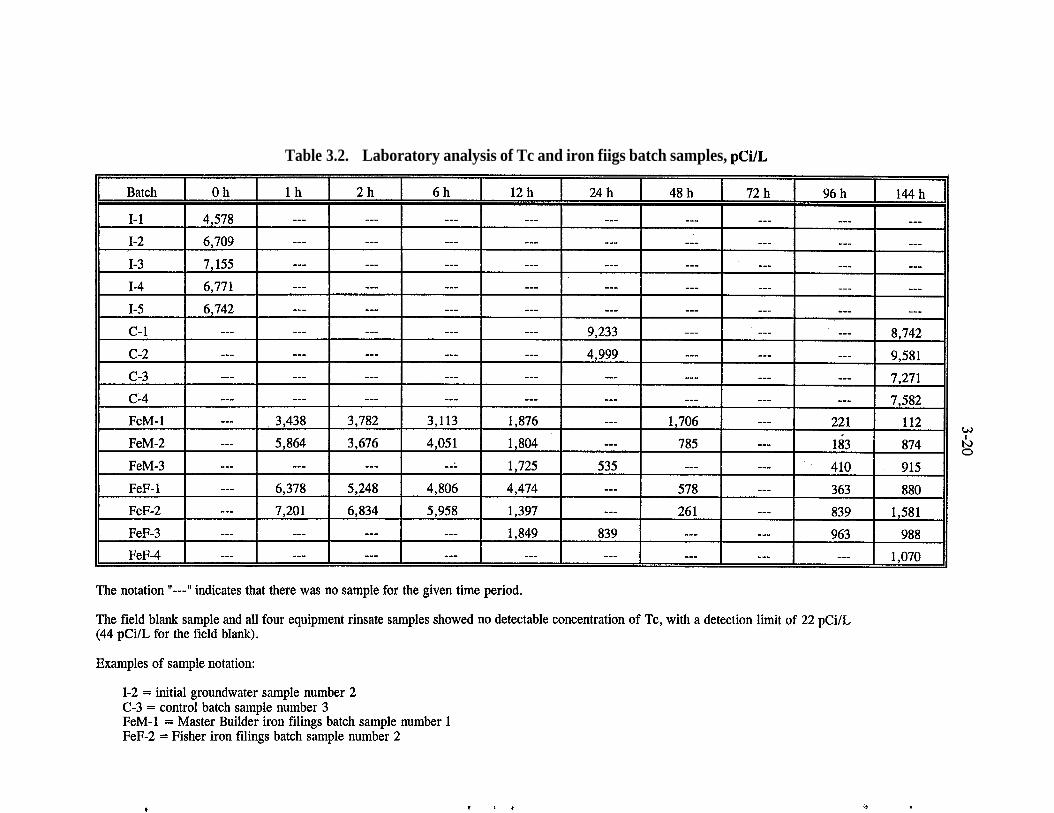
Table 3.2. Laboratory analysis of Tc and iron fiigs batch samples, pCi/L
The notation “---‘I indicates that there was no sample for the given time period.
The field blank sample and all four equipment rinsate samples showed no detectable concentration of Tc, with a detection limit of 22 pCi/L(44 pCi/L for the field blank).
Examples of sample notation:
I-2 = initial groundwater sample number 2C-3 = control batch sample number 3FeM-1 = Master Builder iron filings batch sample number 1FeF-2 = Fisher iron filings batch sample number 2
1 . 0
0 . 9
0 . 8
0 . 7
0 . 6
0 . 5
0 . 4
0 . 3
0 . 2
0.1
0
0 20 40 60 80 100 120 140 160 180 200
F e R e a c t i o n w i t h M W 6 6
\
* Tc99 Run #l
e Tc99 R u n #2
A‘Afc
‘I
T i m e ( h o u r s ) FewCXLDWG
Fig. ,3.11. Batch test removal of Tc9? using iron filings, PGDP well No. 66.

3-22
r
03/3
3-23
pumped upward with a high-pressure liquid chromatography pump. The flow ratewas varied from 1 mL/min to approximately 10 mL/min. Tracer tests with Cl-showed that there was little longitudinal dispersion indicating that the columnswere uniformly packed.
Simulated PORTS groundwater spiked with Tc95m was used. Preliminary testing(292 pCi/mL of Tc9’“) showed that Fe was able to remove Tc at very lowconcentrations (equivalent to 0.23 pCi/L of Tc~~).
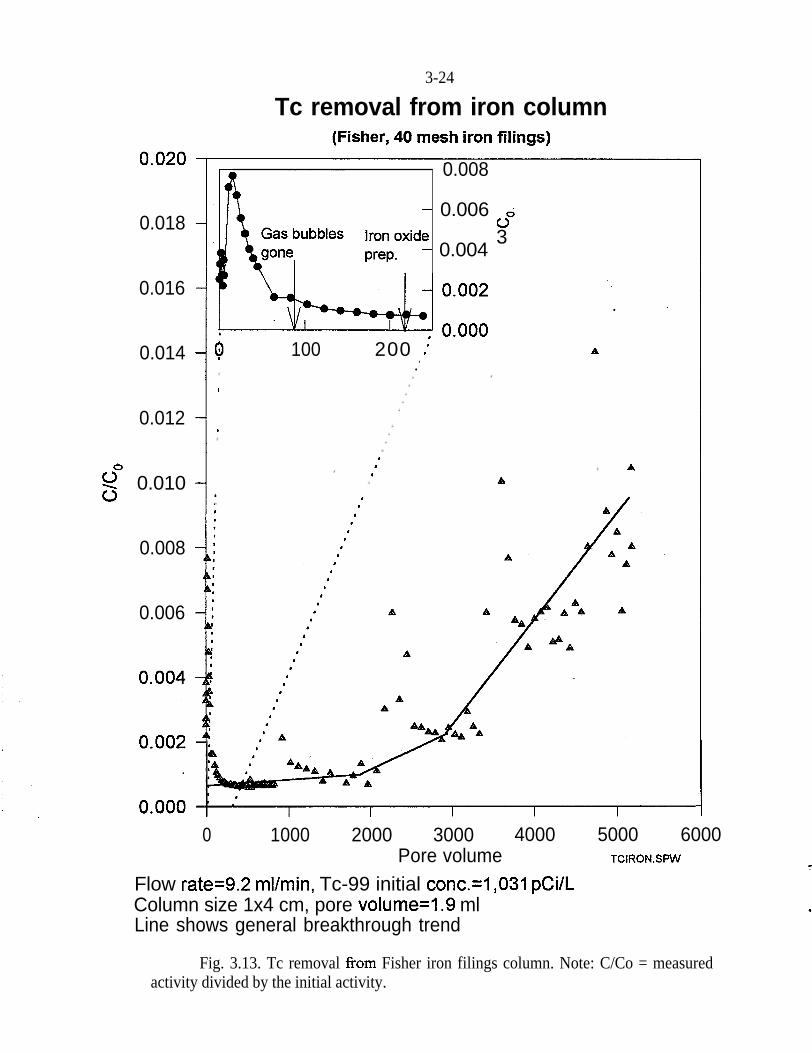
Figure 3.13 shows the breakthrough curve of Tc~~ and Tc~‘~ from a column l-cmin diameter and 4-cm long packed with 10 g of Fe. The flow rate was 9.2 mL/minwhich corresponds to a pore velocity of 19.5 crn/min and a residence time of0.21 min. The initial concentration of Tc9’ was 1,03 1 pCi/L and the initialconcentration of Tc95m was 469.7 pCi/mL.
At the beginning of the experiment, gas bubbles (presumably hydrogen) wereobserved due to electrolysis of water by Fe. The rising of gas bubbles from thecolumn disturbed the plug flow characteristics of the column, and preferentialflow paths for the water were created. This explains the relatively high concentra-tions of Tc9’ and Tcgsm at the beginning of the experiment (before 150 pore vol-umes). After the gas bubbles disappeared from the column, a baseline was estab-lished. This baseline was maintained for approximately 2,000 pore volumes, withonly occasional minor deflections. The initial pH was 6.2. The effluent pHincreased immediately to 9.5, then decreased to approximately 6.5. At the begin-ning of the experiment, the electrolysis of water controlled the water chemistryand .produced the high pH that was observed.
During the course of the experiment, precipitation of ferric oxides and hydroxideswas observed on the surface of the Fe in the column. This reaction was accomp-anied by a drop in pH and an increase in pressure. Any physical disturbance ofthe column released this back-pressure and altered transport of the radionuclides.It was this mechanical disturbance that was responsible for the fluctuations on thebreakthrough curve.
Although an initial deviation from the baseline was observed at approximately2,000 pore volumes, it was not until 5,000 pore volumes, that approximately 1%of the Tc~~ and Tc~‘~ came through the column. This quantity of Tc~~ is approxi-mately 10 pCi/L, which is very near the background concentration. Based on thisbreakthrough curve, Tc9’ loading on the column at 5,000 pore volumes was calcu-lated to be 900 pCi/g.
Subsequently, a column test was performed with a coarse Fe (Peerless, Inc.,Detroit, Michigan) which was ultimately used in the field test. With simulated
3-24
0.018
0.016
0.014
0.012
$7 0.010
0.008
0.006
-I0 1000 2000 3000 4000 5000 6000
Pore volume TCIRON.SPW
Flow rate=9.2 ml/min, Tc-99 initial conc.=l,O31 pCi/LColumn size 1x4 cm, pore volume=1.9 mlLine shows general breakthrough trend
0.008
- 0.006 c~Iron oxide
- 0.0043
prep.
100 200 0’ A.l
., A
,I
,
,
,
,8
,.
,
,
A ,�A A
, Aa
,0
t
Tc removal from iron column(Fisher, 40 mesh iron filings)
Fig. 3.13. Tc removal from Fisher iron filings column. Note: C/Co = measuredactivity divided by the initial activity.
3-25
PORTS groundwater spiked at 1754 pCi/L, a 1 cm x 4 cm column was run at2 mL/min and no Tc was detected in the effluent after two weeks. This water wasaerobic, in contrast to the water that would be treated onsite. Thus, some cloggingdid occur (back pressure of approximately 350 pounds per square in.).
Nevertheless, the high removal efficiency for Tc supported the decision to usePeerless Fe in the field test.
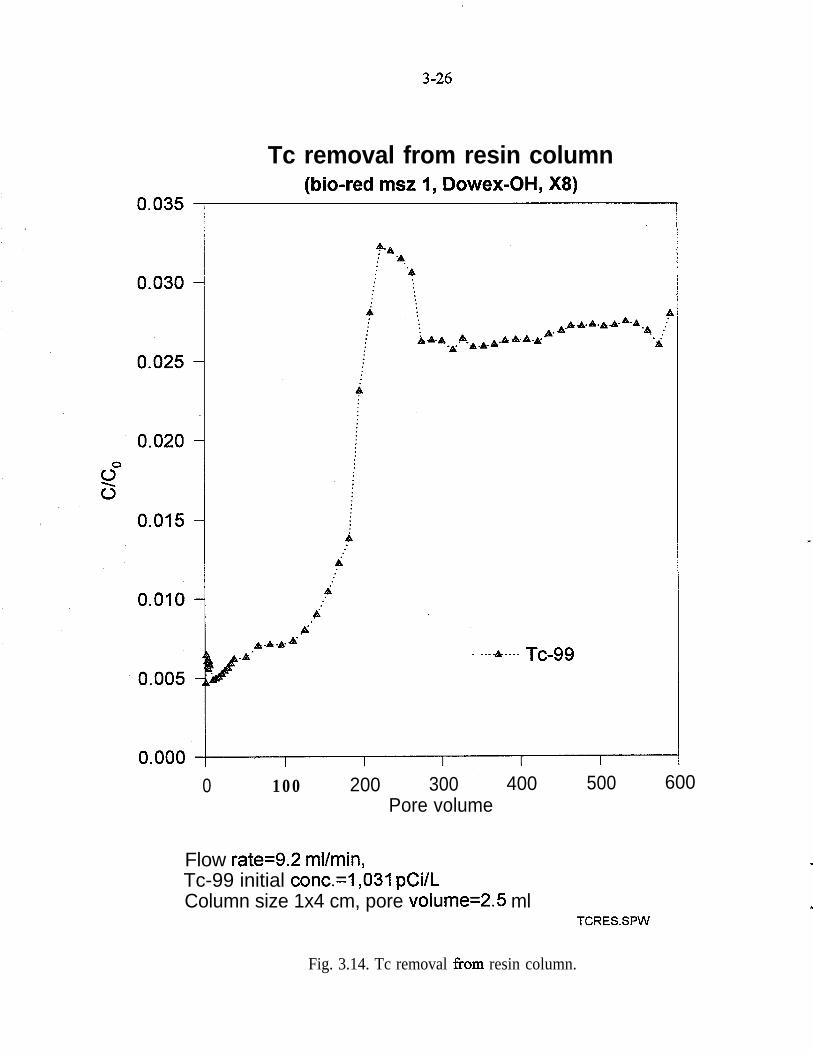
Experiments similar to those with zero-valence iron were conducted using Bio-Rad MSZ-1 resin (equivalent to Dowex OH-type resin). The simulated PORTSgroundwater was pumped upward through a l-cm x 4-cm column at a flow rate of9.2 mL/min. Because of the difference in porosity. as compared to the Fe column,the pore velocity in the resin column was 14.65 cm/mm, and the residence timewas 0.27 min. Because the resin is an ion exchange media, a high pH (11.5) wasobserved in the effluent throughout the experiment. A whitish precipitate andincreased back-pressure of the medium were also observed.
Figure 3.14 shows the breakthrough of TcQQ from the resin column. An above-background reading for TcQQ was registered at the beginning of the experiment,and a substantial increase in the effluent concentration, approximately 3% of bothTcQQ and Tc’~~ occurred at 200 pore volumes. The resin loading at 200 porevolumes was &lculated as 500 pCi/g.
An experiment with a slower flow rate and a longer resin column was alsoconducted. The flow rate was set at 2 mL/min, which corresponds to a porevelocity of 3.18 cm/min. The residence time for the 12-cm-long column was3.77 min-more than an order of magnitude higher than the previous experiment(Fig. 3.14). For 600 pore volwnes, both TcQQ and TcQsm were removed to back-ground levels. The loading of TcQQ and TcQsm based on this experiment, wasapproximately 1,550 pCi/g.
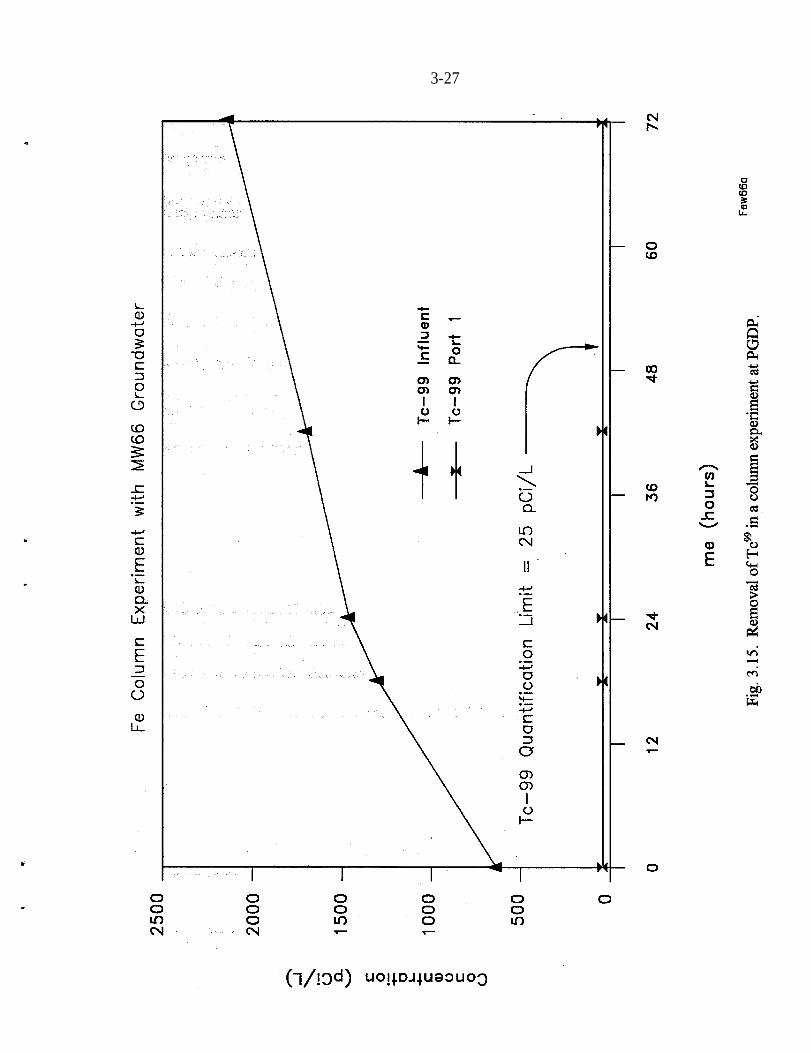
A column experiment was also conducted at PGDP using groundwater contami-nated with Tc (Clausen and Richards 1994). The column was filled with 40-meshMaster Builder Fe filings. The experiment was conducted at a flow rate of appro-ximately 40 mL/min, which resulted in a residence time of 1 h. The averageinfiuent Tc activity was 1,448 pCi/L. No breakthrough of Tc had occurred after72 pore volumes had passed through the column (Fig. 3.15). Equipment malftmc-tion resulted in termination of the test before kinetic information could beobtained.
To summarize, the results fi-om column experiments with Fe and resin suggestedthat:
Tc removal from resin column(bio-red msz 1, Dowex-OH, X8)
0
. ..-.A.-.. Tc-99
100 200 300 400Pore volume
500 600
Flow rate=9.2 ml/min,Tc-99 initial conc.=1,031 pCi/LColumn size 1x4 cm, pore volume=2.5 ml
TCRESSPW
t
Fig. 3.14. Tc removal from resin column.
3-27
.
3-28
l At high flow rates (15 to 20 cm/min), and residence times of less than aminute, the Fe was much more efficient than the resin.
l Sorption of Tc99 and Tc95m on the resin is slow. These experiments indicatedthat a residence time of at least 3.8 min is required.
l Zero-valence iron rapidly removes Tc. Fe can treat thousands of bed volumesof contaminated groundwater before 1% of the influent contaminant leaves thereactor.
4-l
4. Investigation of Pd/Fe Surface
The dechlorination of hydrocarbons with Pd/Fe is believed to be a heterogeneousreaction that initially requires adsorption on the metallic surface. Consequently, astudy of the metallic surface is essential to fully understand and optimize thereaction. This section summarizes the surface analytical measurements that havebeen performed. The purpose of the measurements was to examine the longevityof the Pd/Fe surface and to obtain additional information regarding the reactionmechanism.
The Pd/Fe surface has been investigated with the following techniques: RamanSpectroscopy, Surface Enhanced Raman Spectroscopy (SERS), Rutherford Back-scattering Spectrometry (RBS), Proton Induced X-Ray Emission (PIXE), PIXEwith a highly focused ion beam (Micro-PIXE), and X-ray Photoelectron Spectro-scopy (XPS). Raman and SERS were found to be of limited use because thesetechniques lacked sufficient sensitivity. The other techniques have all provideduseful data.
RBS - Limited use of RBS demonstrated that the Pd does not penetrate into the Febut is resident on the surface. Moreover, even under conditions of excess Pd,RBS has demonstrated that the Fe surface is never completely covered. The Pdalways congregates in distinct “islands”. Under highly-controlled conditions, itshould be possible to determine the thickness of the Pd layer using RBS.
PXE - PIXE was used to confirm the RBS results regarding the location of the Pdon the Fe surface. No unique information was obtained. PIXE is also used tocalculate the concentration of Pd on the Fe surface.
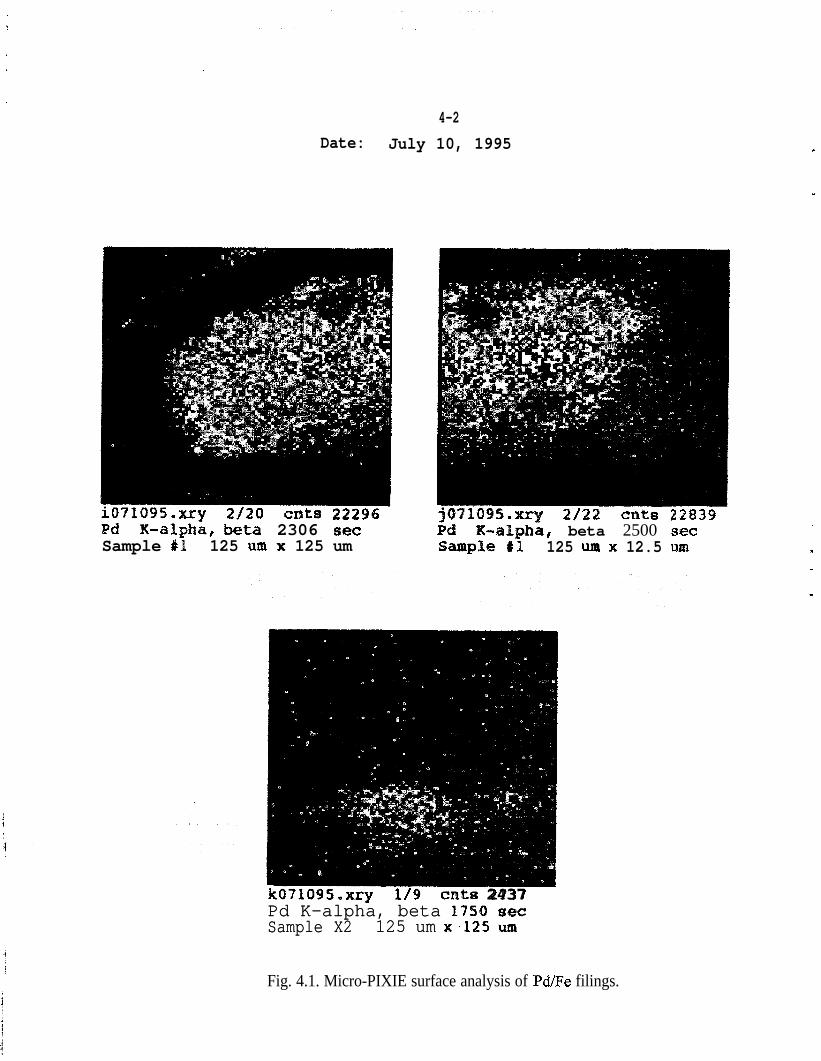
Micro-PIXE - The use of a highly focused proton beam permits much greaterresolution regarding the characteristics of the metallic surface. Micro-PIXEresults also proved that the Pd was not uniformly distributed but formed “islands”on the Fe surface (Fig. 4.1). Additional studies, to determine the features of theFe surface that cause the Pd clusters, can be performed in the future.
XPS - The majority of the surface analyses performed to date have utilized XPS orElectron Spectroscopy for Chemical Analysis or ESCA. Most of this work hasbeen reported previously by Muftikian et al. (1996). XPS is commonly used toexamine the chemical state of elements on a surface. In this technique, the surfaceof the sample is sputtered with an argon ion beam and a characteristicphotoelectron is ejected. The energy of the photoelectron is related to the bindingenergy of the electrons in the substance under study.
4-2
Date: July 10, 1995
LtSBd X-alpha, beta 2306 sexSample #I 125 IUB x 125 um
K-alphii, beta 2500 setSample #.I 125 cam x 12.5 um
kO71095.xrykO71095.xry l/9l/9 cnts 2?37cnts 2437Pd K-alpha, beta 1750 setPd K-alpha, beta 1750 setSample X2Sample X2 125 um x.125 urn125 um x.125 urn
Fig. 4.1. Micro-PIXIE surface analysis of Pd/Fe filings.
4-3
.
The XPS measurements for this project were performed with a VacuumGenerators ESCALAB MKII photoelectron spectrometer (East Grinstred, U.K.)with an Alma,,, (1486.6 eV) X-ray ~source and a hemispherical 150~mni meanradius electron analyzer with a take-off angle of 90”. The energy resolution E,(full width at half maximum) of the XPS peaks was less than 1.0 eV for the Ag3d, peak with the AIKQ source that was operated with a power of 300 W. Thebinding energies of the photoelectrons were determined by assuming that thecarbon 1 s electrons had a binding energy of 284.6 eV. The data were recordeddigitally, and all peak scans were signal averaged until an acceptable signal-to-noise ratio was obtained. During the data acquisition, the pressure in the samplechamber did not exceed 5 x lo-*’ Torr.
The relative atomic ratios of Pd, oxygen, and carbon on the Pd/Fe surface werecalculated from the Pd 3d, 0 2s, and C 1s peak areas after a standard backgroundsubtraction procedure was applied, and integration of the baseline-corrected peakarea was performed. The peak areas were corrected for cross section, excitation,and inelastic mean free path by employing well-established algorithms (Briggsand Seah 1983). All reported ratios are relative to the 0 2s peak area because thispeak was free of any overlap with other XPS peaks. The more commonly usedand more intense reference peak is the 0 Is, but it overlaps with Pd 3p,, peakand, therefore, cannot be used to calculate elemental ratios. The calculated atomicratios are only useful in identifying trends in the experimental results. Forexample, the Pd:Fe ratio increased as expected, from 0.07 to 0.4, when the Fesurface was exposed to K,PdCL6 solution from 1 to 30 s, whereas the 0:Fe ratioremained approximately constant.
Sample preparation. A 1 cm x 1 cm pure Fe foil, 0.254 mm thick, obtainedfrom Aesar (Ward Hill, Massachusetts) was spot-welded to a stainless steel stub,and the surface of the foil was etched with 8 keV argon ions from an argon iongun. The argon ion beam was incident on the Fe surface at an angle of -15 O tothe surface normal.
The Fe foil was exposed to a solution of K2PdCL6 in water and to the washsolutions by moving the sample into the load lock chamber. The chamber wasbrought up to a pressure of 1 atm with ultra-high-purity argon. The K,PdCL6solution was added to the sample surface with the aid of a micropipet. The Fesurface was then rinsed with ultrapure water that was added from a secondmicropipet. The sample was pumped down in the load-lock chamber and thenrepositioned in the sample chamber, and the surface analysis was performed asdescribed above.
Figure 4.2 presents results obtained from a thin film of Pd/Fe prior to exposure toorganic compounds. When the Pd/Fe surface is exposed to TCE (Fig. 4.3, com-
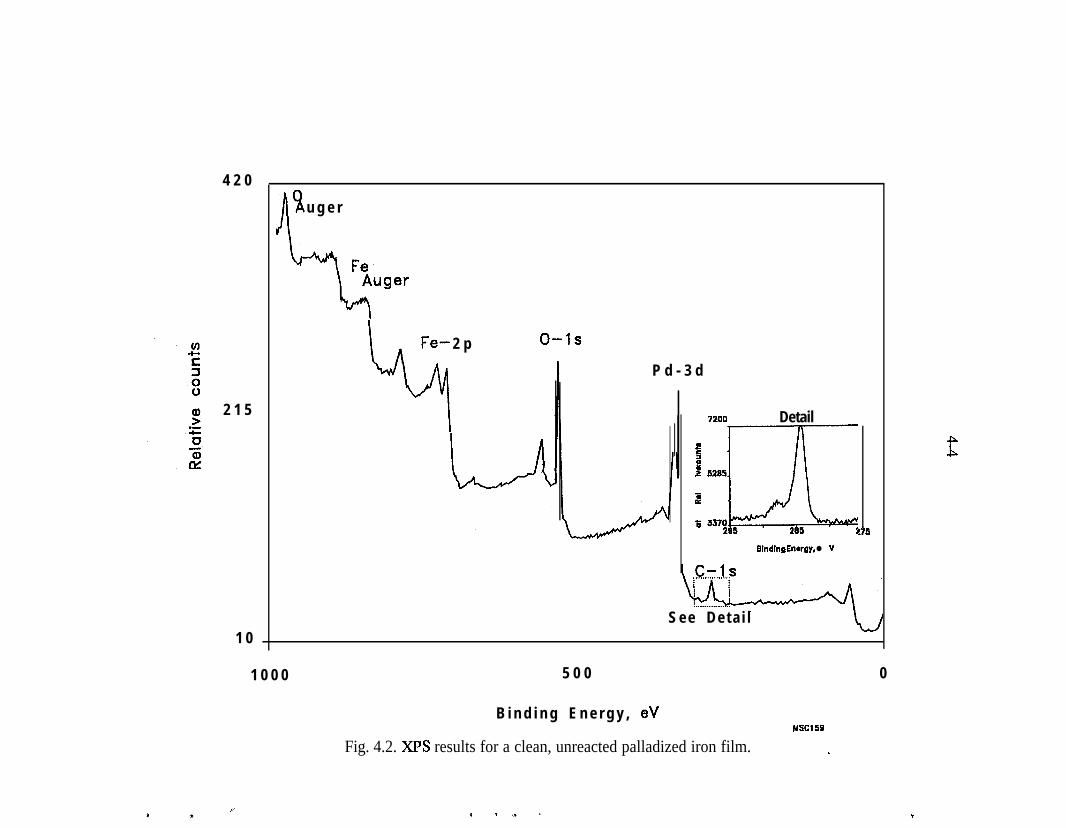
4 2 0
2 1 5
1 0
J\su g e r
F e - 2 p
%
P d - 3 d
7200 Detail
I-t 5295
0
H
3370B285 295 :
Blndln9 Energy, l V
S e e D e t a i l
1 0 0 0 5 0 0
B i n d i n g E n e r g y , eV
Fig. 4.2. Xl% results for a clean, unreacted palladized iron film.
0
MC159
f
fP
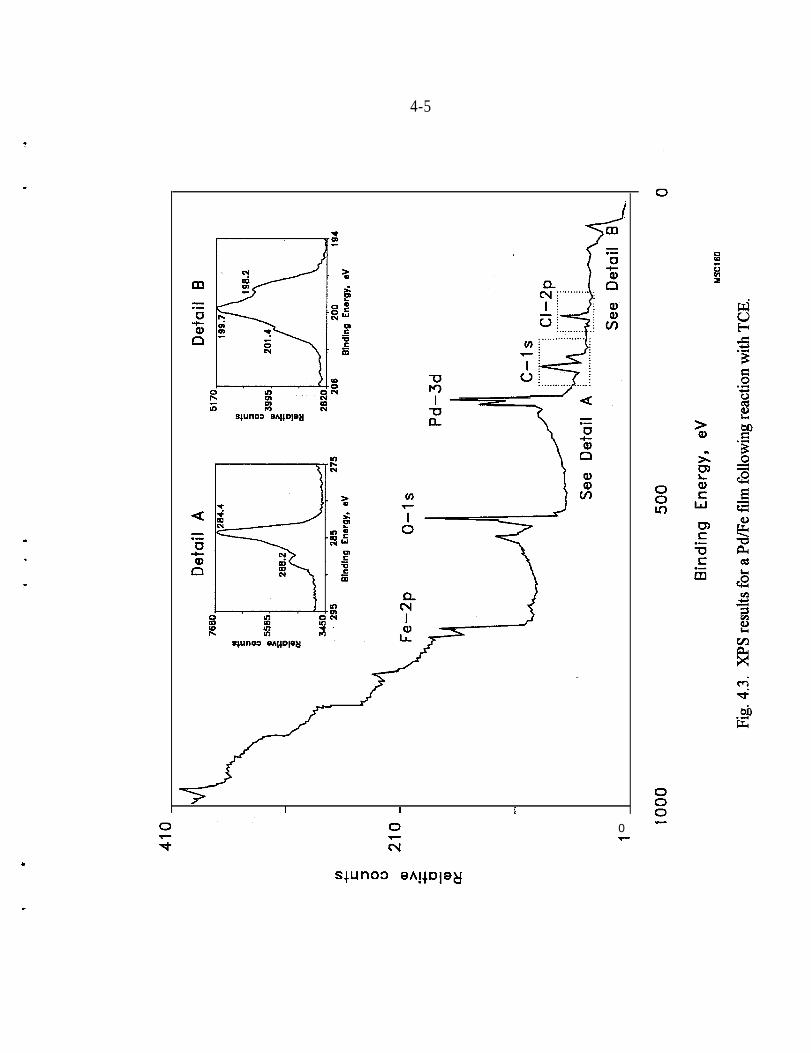
4-5
.-
I I I
0
zi-
s+uno:, Wt!+Dla~
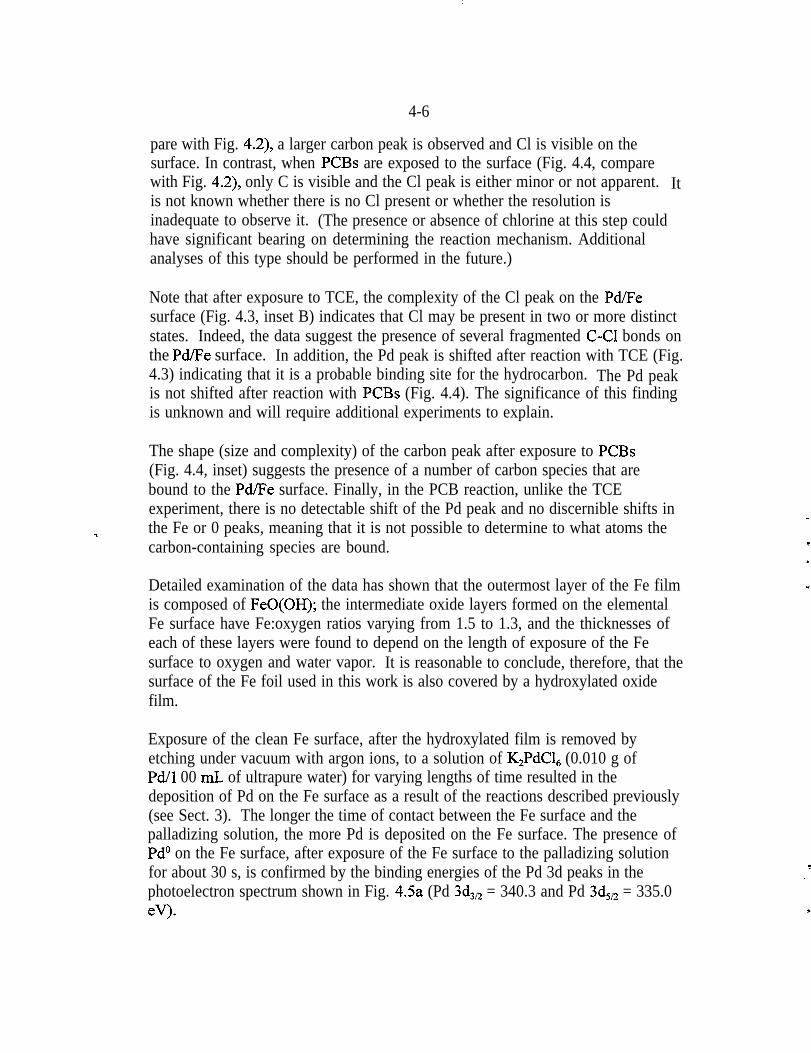
:I I
4-6
pare with Fig. 4.2), a larger carbon peak is observed and Cl is visible on thesurface. In contrast, when PCBs are exposed to the surface (Fig. 4.4, comparewith Fig. 4.2), only C is visible and the Cl peak is either minor or not apparent. Itis not known whether there is no Cl present or whether the resolution isinadequate to observe it. (The presence or absence of chlorine at this step couldhave significant bearing on determining the reaction mechanism. Additionalanalyses of this type should be performed in the future.)
Note that after exposure to TCE, the complexity of the Cl peak on the Pd/Fesurface (Fig. 4.3, inset B) indicates that Cl may be present in two or more distinctstates. Indeed, the data suggest the presence of several fragmented C-Cl bonds onthe Pd/Fe surface. In addition, the Pd peak is shifted after reaction with TCE (Fig.4.3) indicating that it is a probable binding site for the hydrocarbon. The Pd peakis not shifted after reaction with PCBs (Fig. 4.4). The significance of this findingis unknown and will require additional experiments to explain.
The shape (size and complexity) of the carbon peak after exposure to PCBs(Fig. 4.4, inset) suggests the presence of a number of carbon species that arebound to the Pd/Fe surface. Finally, in the PCB reaction, unlike the TCEexperiment, there is no detectable shift of the Pd peak and no discernible shifts in
-e the Fe or 0 peaks, meaning that it is not possible to determine to what atoms thecarbon-containing species are bound.
Detailed examination of the data has shown that the outermost layer of the Fe filmis composed of FeO(OH); the intermediate oxide layers formed on the elementalFe surface have Fe:oxygen ratios varying from 1.5 to 1.3, and the thicknesses ofeach of these layers were found to depend on the length of exposure of the Fesurface to oxygen and water vapor. It is reasonable to conclude, therefore, that thesurface of the Fe foil used in this work is also covered by a hydroxylated oxidefilm.
Exposure of the clean Fe surface, after the hydroxylated film is removed byetching under vacuum with argon ions, to a solution of K,PdCI, (0.010 g ofPd/l 00 mL of ultrapure water) for varying lengths of time resulted in thedeposition of Pd on the Fe surface as a result of the reactions described previously(see Sect. 3). The longer the time of contact between the Fe surface and thepalladizing solution, the more Pd is deposited on the Fe surface. The presence ofPd” on the Fe surface, after exposure of the Fe surface to the palladizing solutionfor about 30 s, is confirmed by the binding energies of the Pd 3d peaks in thephotoelectron spectrum shown in Fig. 4.5a (Pd 3d,, = 340.3 and Pd 3djn = 335.0eV).
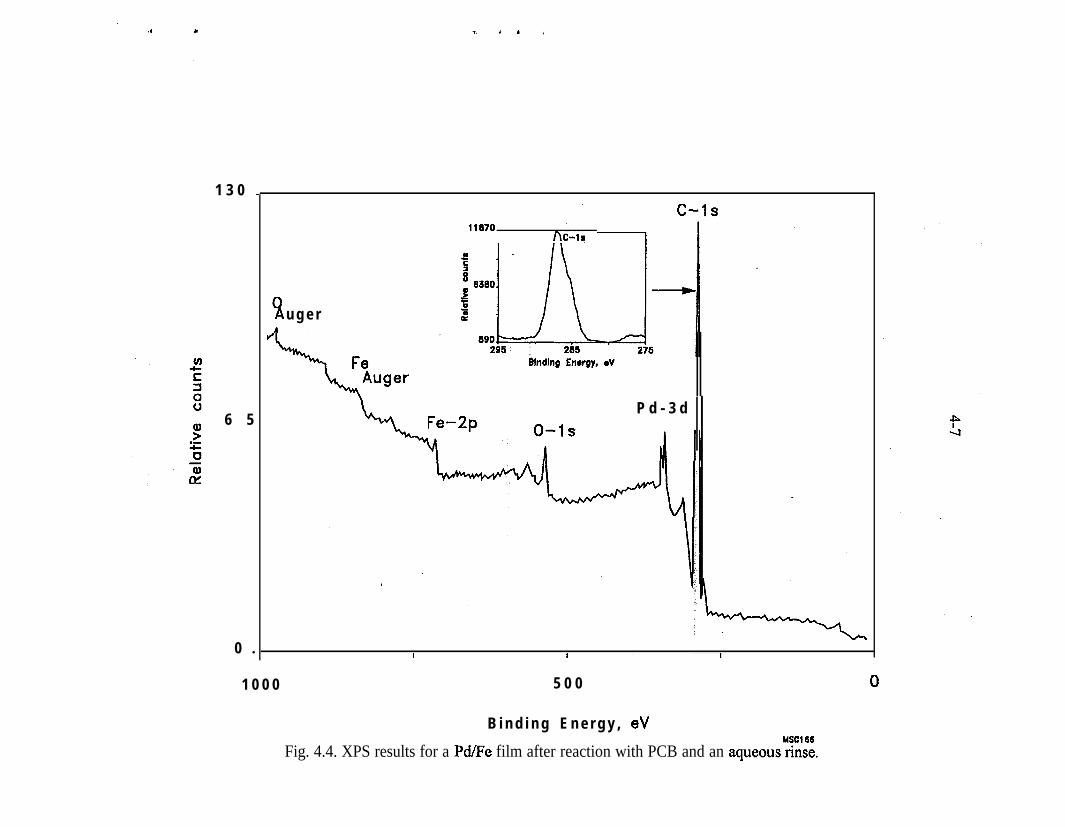
1 3 0 _
6 5
0 .
11870 nc-h
1u g e rA
P d - 3 d
1 0 0 0 5 0 0
B i n d i n g E n e r g y , eV
Fig. 4.4. XPS results for a Pd/Fe film after reaction with PCB and an aqueous;::.
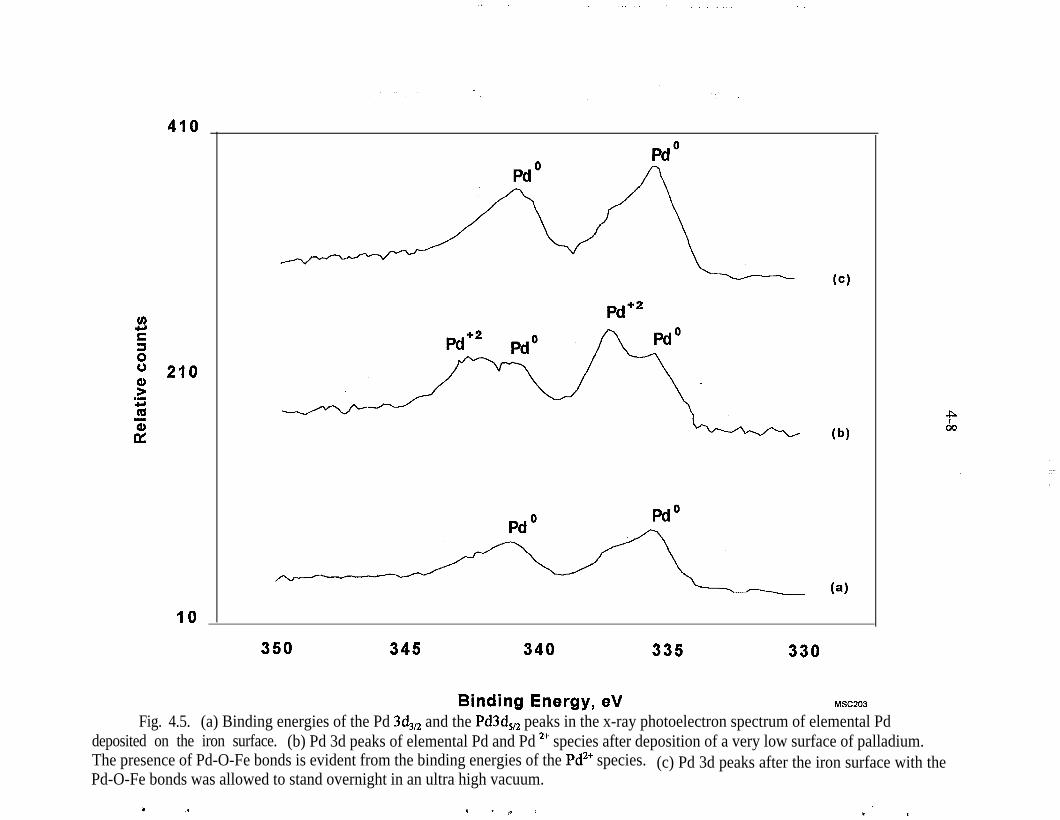
410
1?s00 270
Pd”
Pd+2
(b)
IO
350 345 340 335 330
Binding Energy, eV MSC203
Fig. 4.5. (a) Binding energies of the Pd 3d,, and the Pd3d, peaks in the x-ray photoelectron spectrum of elemental Pddeposited on the iron surface. (b) Pd 3d peaks of elemental Pd and Pd 2+ species after deposition of a very low surface of palladium.The presence of Pd-O-Fe bonds is evident from the binding energies of the Pd2+ species. (c) Pd 3d peaks after the iron surface with thePd-O-Fe bonds was allowed to stand overnight in an ultra high vacuum.
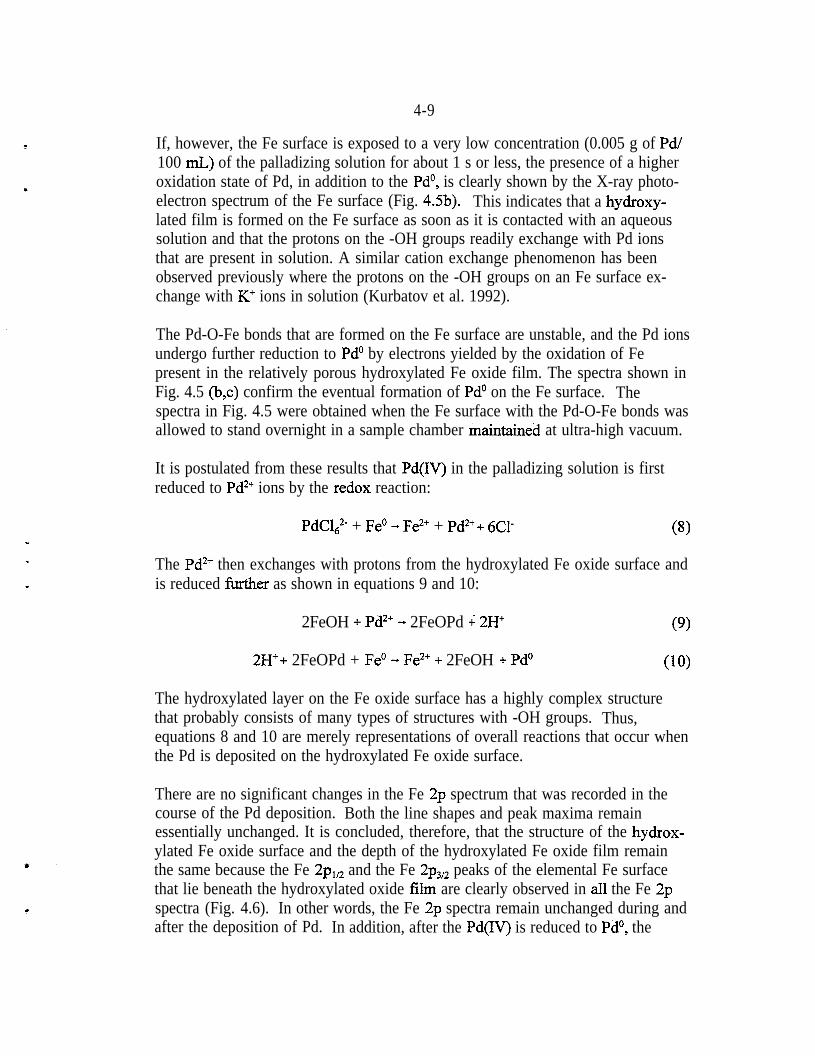
4-9
If, however, the Fe surface is exposed to a very low concentration (0.005 g of Pd/100 nL) of the palladizing solution for about 1 s or less, the presence of a higheroxidation state of Pd, in addition to the Pd’, is clearly shown by the X-ray photo-electron spectrum of the Fe surface (Fig. 4Sb). This indicates that a hydroxy-lated film is formed on the Fe surface as soon as it is contacted with an aqueoussolution and that the protons on the -OH groups readily exchange with Pd ionsthat are present in solution. A similar cation exchange phenomenon has beenobserved previously where the protons on the -OH groups on an Fe surface ex-change with K’ ions in solution (Kurbatov et al. 1992).
The Pd-O-Fe bonds that are formed on the Fe surface are unstable, and the Pd ionsundergo further reduction to Pd” by electrons yielded by the oxidation of Fepresent in the relatively porous hydroxylated Fe oxide film. The spectra shown inFig. 4.5 (b,c) confirm the eventual formation of Pd” on the Fe surface. Thespectra in Fig. 4.5 were obtained when the Fe surface with the Pd-O-Fe bonds wasallowed to stand overnight in a sample chamber maintaine.d at ultra-high vacuum.
It is postulated from these results that Pd(IV) in the palladizing solution is firstreduced to Pd2+ ions by the redox reaction:
PdClh2- + Fe0 + Fe*’ + Pd2++ 6Cl- (8)
The Pd2+ then exchanges with protons from the hydroxylated Fe oxide surface andis reduced further as shown in equations 9 and 10:
2FeOH + Pd*+ - 2FeOPd +’ 2H’ (9)
2H++ 2FeOPd + Fe0 -, Fe2’ + 2FeOH + Pd” (10)
The hydroxylated layer on the Fe oxide surface has a highly complex structurethat probably consists of many types of structures with -OH groups. Thus,equations 8 and 10 are merely representations of overall reactions that occur whenthe Pd is deposited on the hydroxylated Fe oxide surface.
There are no significant changes in the Fe 2p spectrum that was recorded in thecourse of the Pd deposition. Both the line shapes and peak maxima remainessentially unchanged. It is concluded, therefore, that the structure of the hydrox-ylated Fe oxide surface and the depth of the hydroxylated Fe oxide film remainthe same because the Fe 2~,,~ and the Fe 2p,,, peaks of the elemental Fe surfacethat lie beneath the hydroxylated oxide film are clearly observed in aI1 the Fe 2pspectra (Fig. 4.6). In other words, the Fe 2p spectra remain unchanged during andafter the deposition of Pd. In addition, after the Pd(IV) is reduced to PdO, the
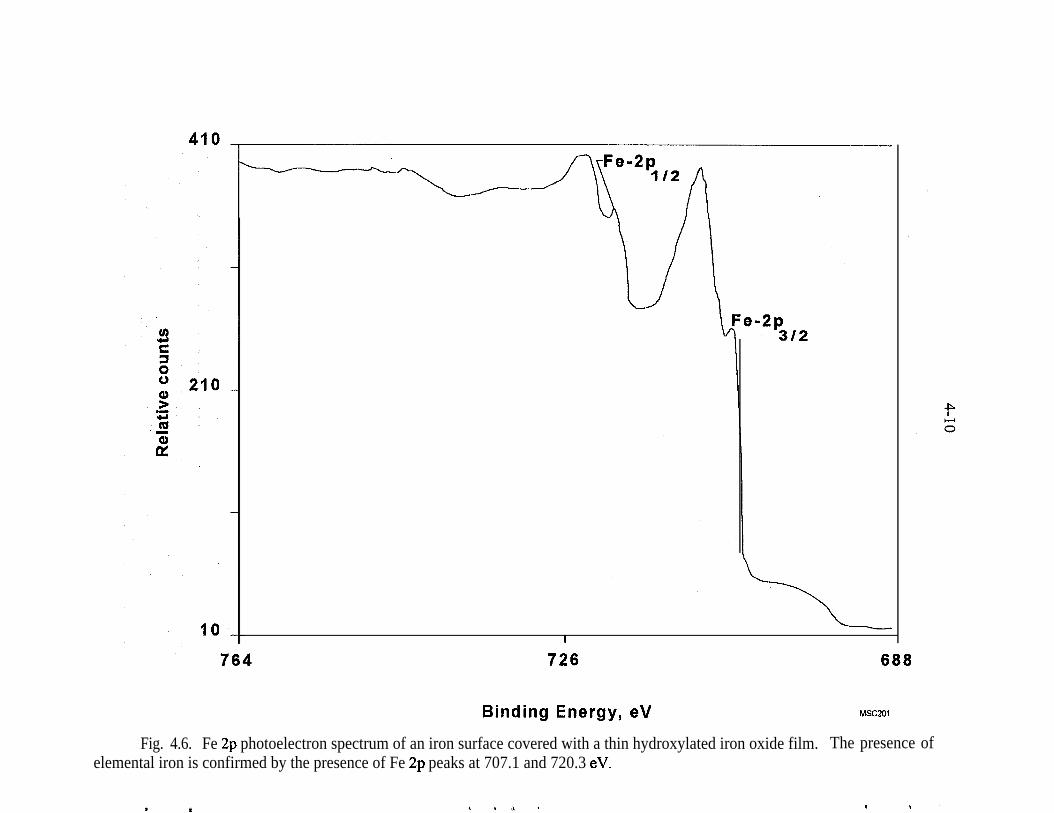
I
726
Binding Energy, eV
688
Fig. 4.6. Fe 2p photoelectron spectrum of an iron surface covered with a thin hydroxylated iron oxide film. The presence ofelemental iron is confirmed by the presence of Fe 2p peaks at 707.1 and 720.3 eV.
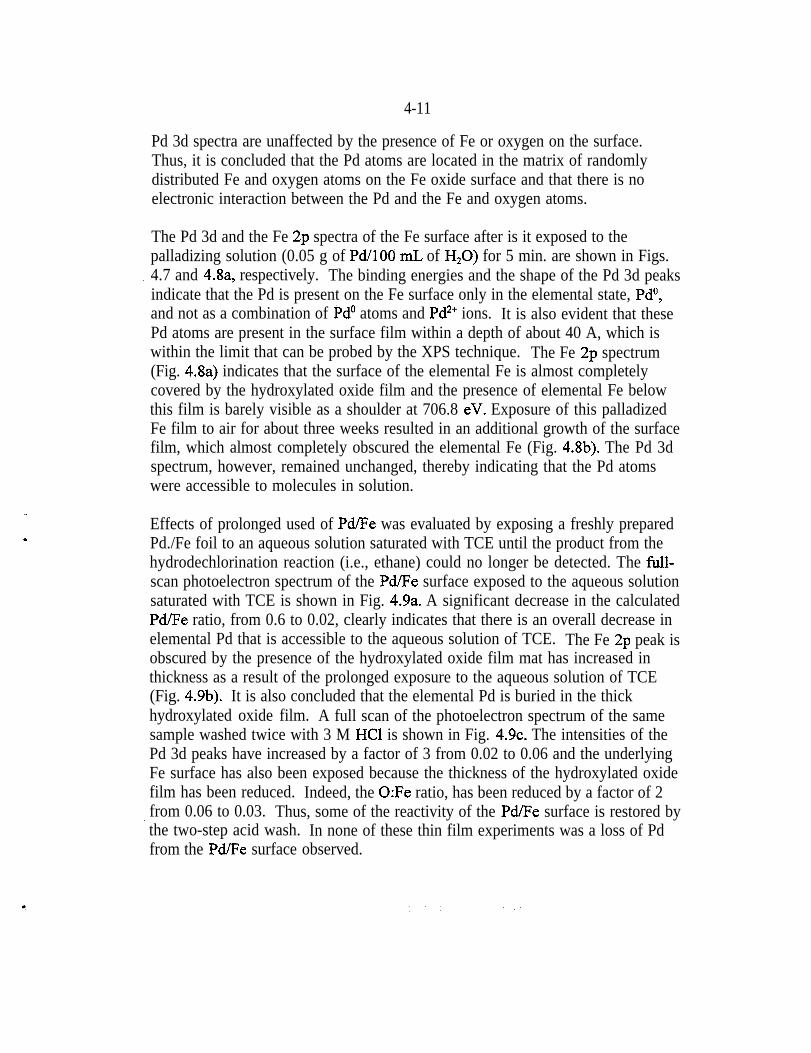
4-11
Pd 3d spectra are unaffected by the presence of Fe or oxygen on the surface.Thus, it is concluded that the Pd atoms are located in the matrix of randomlydistributed Fe and oxygen atoms on the Fe oxide surface and that there is noelectronic interaction between the Pd and the Fe and oxygen atoms.
The Pd 3d and the Fe 2p spectra of the Fe surface after is it exposed to thepalladizing solution (0.05 g of Pd/lOO n.L of H,O) for 5 min. are shown in Figs.4.7 and 4.8a, respectively. The binding energies and the shape of the Pd 3d peaksindicate that the Pd is present on the Fe surface only in the elemental state, PdO,and not as a combination of Pd” atoms and Pd*+ ions. It is also evident that thesePd atoms are present in the surface film within a depth of about 40 A, which iswithin the limit that can be probed by the XPS technique. The Fe 2p spectrum(Fig. 4.8a) indicates that the surface of the elemental Fe is almost completelycovered by the hydroxylated oxide film and the presence of elemental Fe belowthis film is barely visible as a shoulder at 706.8 eV. Exposure of this palladizedFe film to air for about three weeks resulted in an additional growth of the surfacefilm, which almost completely obscured the elemental Fe (Fig. 4.8b). The Pd 3dspectrum, however, remained unchanged, thereby indicating that the Pd atomswere accessible to molecules in solution.
Effects of prolonged used of Pd/Fe was evaluated by exposing a freshly preparedPd./Fe foil to an aqueous solution saturated with TCE until the product from thehydrodechlorination reaction (i.e., ethane) could no longer be detected. The full-scan photoelectron spectrum of the Pd/Fe surface exposed to the aqueous solutionsaturated with TCE is shown in Fig. 4.9a. A significant decrease in the calculatedPd/Fe ratio, from 0.6 to 0.02, clearly indicates that there is an overall decrease inelemental Pd that is accessible to the aqueous solution of TCE. The Fe 2p peak isobscured by the presence of the hydroxylated oxide film mat has increased inthickness as a result of the prolonged exposure to the aqueous solution of TCE(Fig. 4.9b). It is also concluded that the elemental Pd is buried in the thickhydroxylated oxide film. A full scan of the photoelectron spectrum of the samesample washed twice with 3 M HCl is shown in Fig. 4.9~. The intensities of thePd 3d peaks have increased by a factor of 3 from 0.02 to 0.06 and the underlyingFe surface has also been exposed because the thickness of the hydroxylated oxidefilm has been reduced. Indeed, the 0:Fe ratio, has been reduced by a factor of 2from 0.06 to 0.03. Thus, some of the reactivity of the Pd/Fe surface is restored bythe two-step acid wash. In none of these thin film experiments was a loss of Pdfrom the Pd/Fe surface observed.
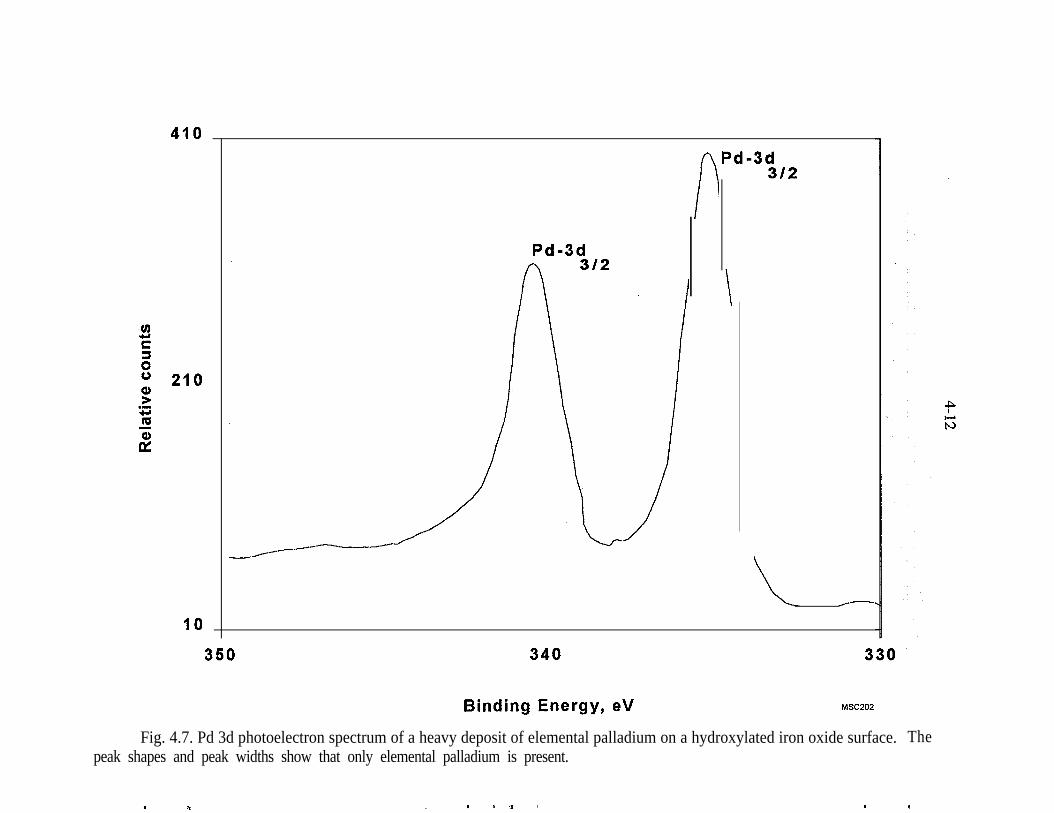
410
312
10
Pd-3d
-
350 340
Binding Energy, eV MSC202
Fig. 4.7. Pd 3d photoelectron spectrum of a heavy deposit of elemental palladium on a hydroxylated iron oxide surface. Thepeak shapes and peak widths show that only elemental palladium is present.
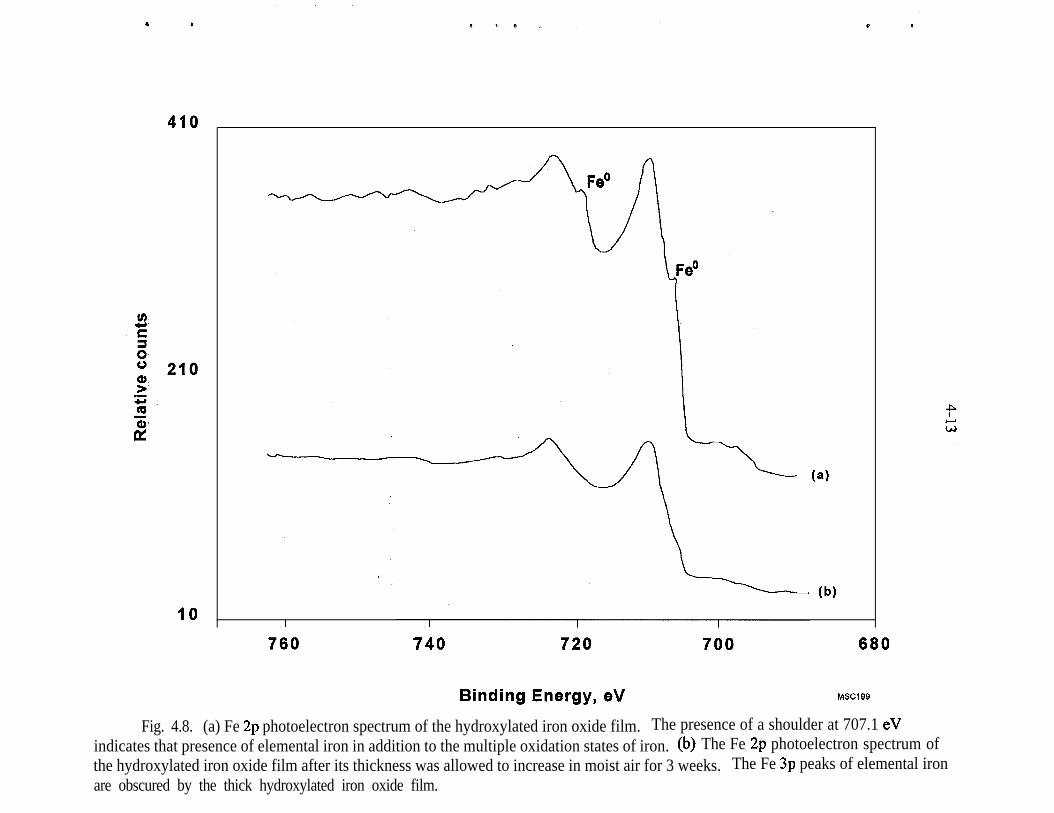
410
IO I
760 740 720
(b)
680
Binding Energy, eV MS’S199
Fig. 4.8. (a) Fe 2p photoelectron spectrum of the hydroxylated iron oxide film. The presence of a shoulder at 707.1 eVindicates that presence of elemental iron in addition to the multiple oxidation states of iron. (b) The Fe 2p photoelectron spectrum ofthe hydroxylated iron oxide film after its thickness was allowed to increase in moist air for 3 weeks. The Fe 3p peaks of elemental ironare obscured by the thick hydroxylated iron oxide film.
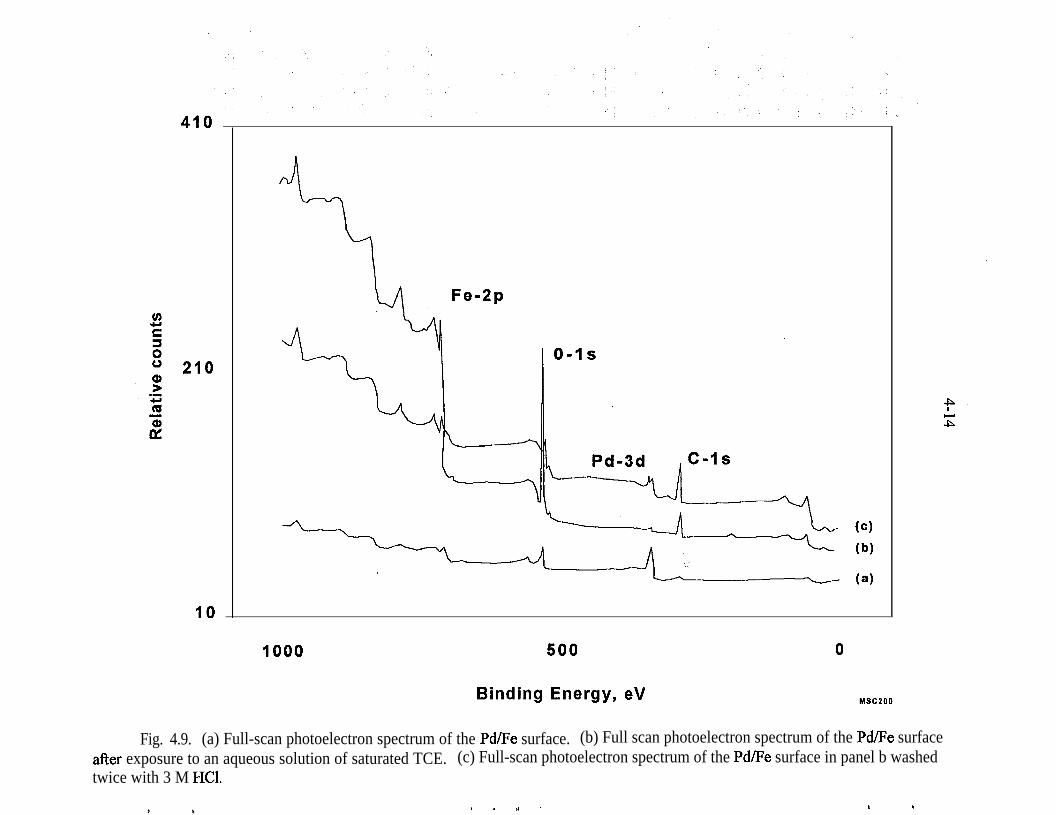
410
210
IO
Fe-2p
(cllb)
(4
1000
Binding Energy, eV
Fig. 4.9. (a) Full-scan photoelectron spectrum of the Pd/Fe surface. (b) Full scan photoelectron spectrum of the Pd/Fe surfaceafter exposure to an aqueous solution of saturated TCE. (c) Full-scan photoelectron spectrum of the Pd/Fe surface in panel b washedtwice with 3 M HCl.
I . l, ’ * ,
5-l
5. Pd/Fe Mechanistic Studies
P
The high reactivity of the Pd/Fe bimetallic system can be attributed to thefollowing sequence of reactions: (a) evolution of hydrogen gas by the reduction ofwater molecules by elemental Fe, (i.e., the “corrosion” of Fe in water) (b) theadsorption of the evolved hydrogen gas by Pd’, and the formation of the powerfulreducing species “PdI+“, (i.e., hydrogen gas intercalated into the elemental Pdlattice), and (c) the reduction of the chlorinated organic compound that isadsorbed on the bimetallic Pd/Fe surface.
c
Electrochemical experiments were devised to confirm that the PdH, species playsa significant role in the reductive dechlorination reactions at the Pd/Fe surface onwhich the chlorinated species are adsorbed (Cheng et al. 1997). The principalvariables that govern these dechlorination reactions are the surface area of thebimetallic Pd/Fe system and the amount of PdH, that is available. Thus, thecathodic reductions of a chlorinated organic compound at electrodes of knownsurface area in the presence and the absence of evolved hydrogen gas were exam-ined. These experiments have helped in the evaluation of the role of surfacebound Pd not only in its role as a hydrogen evolution catalyst but also a facilitatorof the reductive dechlorination of organics.
.
IThe hydrogen evolution characteristics of platinized iron (Pee) and Pd/Fe shouldbe similar, but the rate of hydrodechlorination by Pt/Fe was found to be muchslower than that observed with Pd/Fe. This finding is apparently due to the abilityof Pd to absorb hydrogen. Indeed, Pd metal in conjunction with high-pressurehydrogen have been used over the years in many organic hydrogenation schemes(Marques et al. 1994; Johnston and Wilby 1985; Coq et al. 1993; Bodnariuk et al.1989). For these experiments, the organic compound used to examine the role ofPd in reductive dechlorination was 4-chlorophenol(4-CP). This compound wasselected for its relative non-volatility and the aqueous solubility of both thereactant and product (phenol). Moreover, 4-CP and phenol can be convenientlydetermined at ppm levels in aqueous solutions by high-pressure liquid chroma-tography (HPLC).
Y
Several types of cathodic materials have been evaluated for the catalytic decomp-osition of halogenated organics (Criddle and McCarty 199 1; Zhang 1995; Kulikovet al. 1996). Zhang and Rusling utilized either carbon cloth or Pb cathodes for thedechlorination of PCBs (Zhang and Rusling 1993). These authors found that Pbcathodes were superior to carbon and suggested that this was due to the higherhydrogen over-potential of Pb. Matheson and Tratnyek proposed that’it should bepossible to rapidly dehalogenate chloroorganics by hydrogen gas if a suitable
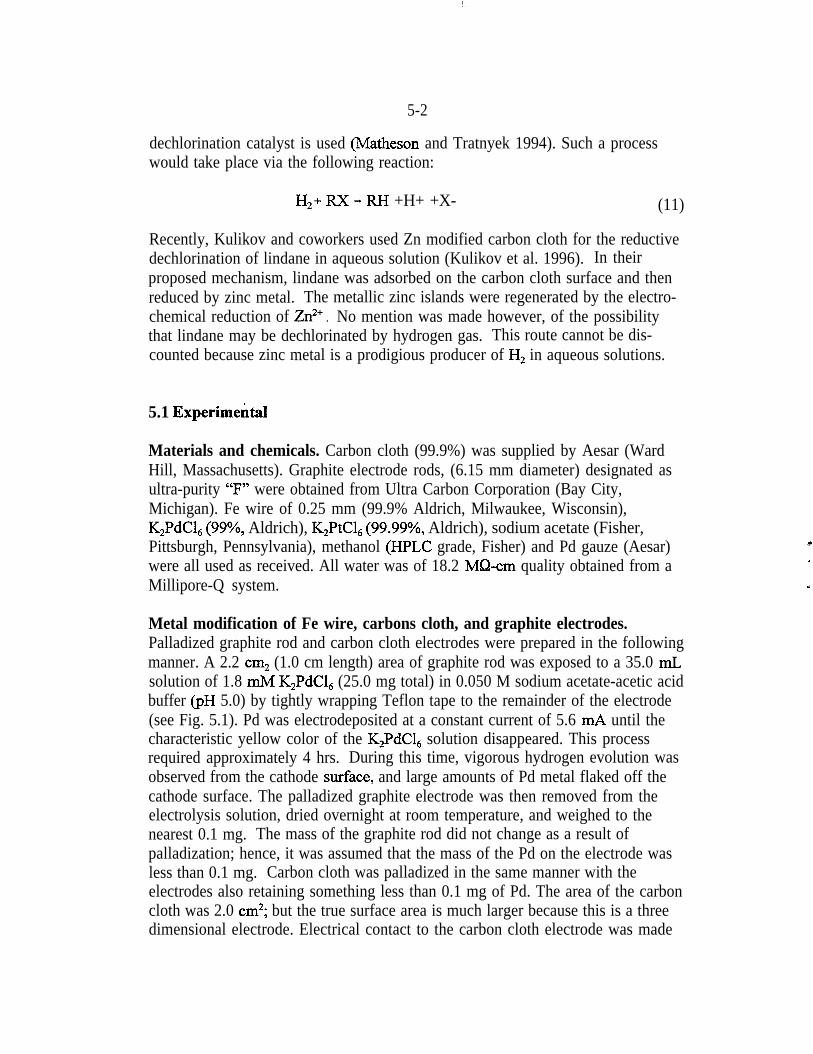
5-2
dechlorination catalyst is used (Matheson and Tratnyek 1994). Such a processwould take place via the following reaction:
Hz+RX-RH +H+ +X- (11)
Recently, Kulikov and coworkers used Zn modified carbon cloth for the reductivedechlorination of lindane in aqueous solution (Kulikov et al. 1996). In theirproposed mechanism, lindane was adsorbed on the carbon cloth surface and thenreduced by zinc metal. The metallic zinc islands were regenerated by the electro-chemical reduction of Zn2’ . No mention was made however, of the possibilitythat lindane may be dechlorinated by hydrogen gas. This route cannot be dis-counted because zinc metal is a prodigious producer of H, in aqueous solutions.
5.1 Experimelhtal
Materials and chemicals. Carbon cloth (99.9%) was supplied by Aesar (WardHill, Massachusetts). Graphite electrode rods, (6.15 mm diameter) designated asultra-purity “F” were obtained from Ultra Carbon Corporation (Bay City,Michigan). Fe wire of 0.25 mm (99.9% Aldrich, Milwaukee, Wisconsin),K,PdCl, (99%, Aldrich), K,PtCl, (99.99%, Aldrich), sodium acetate (Fisher,Pittsburgh, Pennsylvania), methanol (HPLC grade, Fisher) and Pd gauze (Aesar)were all used as received. All water was of 18.2 MGcm quality obtained from aMillipore-Q system.
Metal modification of Fe wire, carbons cloth, and graphite electrodes.Palladized graphite rod and carbon cloth electrodes were prepared in the followingmanner. A 2.2 cm2 (1.0 cm length) area of graphite rod was exposed to a 35.0 mLsolution of 1.8 mM K*PdC& (25.0 mg total) in 0.050 M sodium acetate-acetic acidbuffer (pH 5.0) by tightly wrapping Teflon tape to the remainder of the electrode(see Fig. 5.1). Pd was electrodeposited at a constant current of 5.6 mA until thecharacteristic yellow color of the K,PdCI, solution disappeared. This processrequired approximately 4 hrs. During this time, vigorous hydrogen evolution wasobserved from the cathode stiace, and large amounts of Pd metal flaked off thecathode surface. The palladized graphite electrode was then removed from theelectrolysis solution, dried overnight at room temperature, and weighed to thenearest 0.1 mg. The mass of the graphite rod did not change as a result ofpalladization; hence, it was assumed that the mass of the Pd on the electrode wasless than 0.1 mg. Carbon cloth was palladized in the same manner with theelectrodes also retaining something less than 0.1 mg of Pd. The area of the carboncloth was 2.0 cm2; but the true surface area is much larger because this is a threedimensional electrode. Electrical contact to the carbon cloth electrode was made
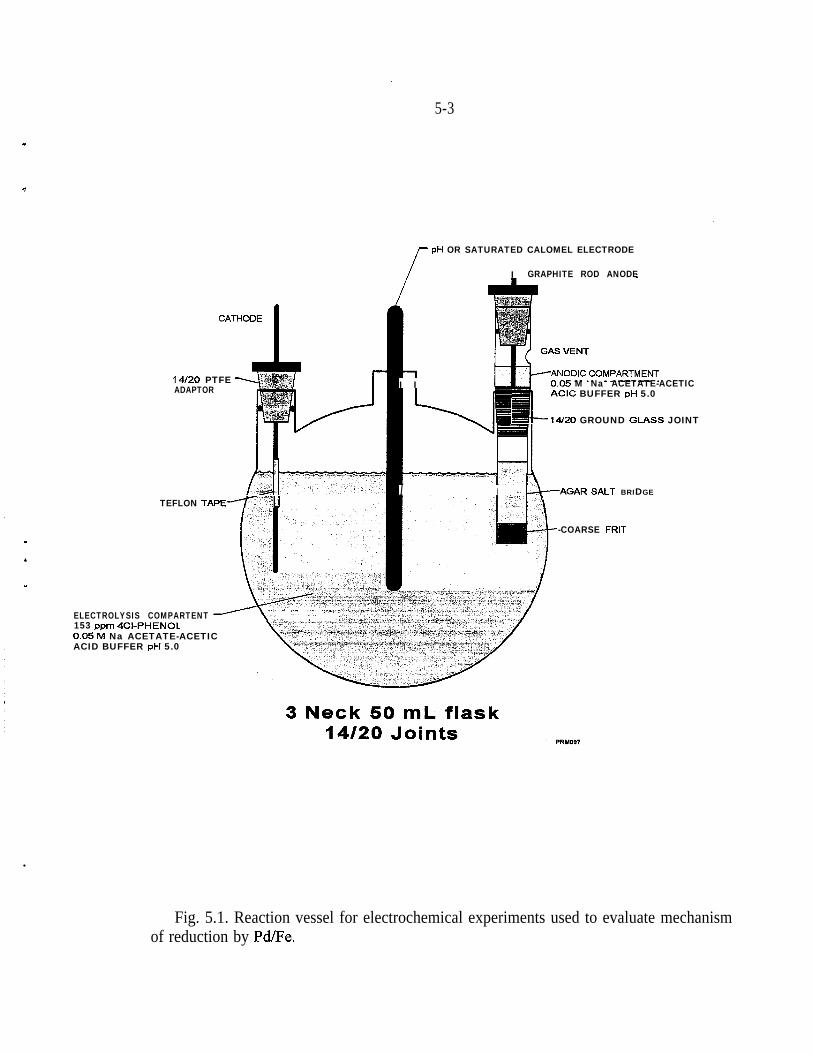
5-3
pH OR SATURATED CALOMEL ELECTRODE
I GRAPHITE ROD ANODE
14120 PTFEADAPTOR
TEFLON TAPE-71
ELECTROLYSIS COMPARTENT-\; i :.‘” (.,. *l.rrw
.~., I j153 mxn 4CI-PHENOL
I I M Na ACETATE-ACETIC
ml- ACIC BUFFER pH 5.0
I#20 GROUND GLASS JOINT
0.05’hl Na ACETATE-ACETICACID BUFFER pH 5.0
I I .’ GAGAR SALT BRIDGE
-COARSE FRIT
3 Neck 50 mL flask14/20 Jnin+-
l
Fig. 5.1. Reaction vessel for electrochemical experiments used to evaluate mechanismof reduction by Pd/Fe.
5-4
with a copper plated alligator clip with its surface isolated from the electrolysissolutions by wrapping with Teflon tape. Platinization of carbon cloth followedthe same procedure and conditions used for palladization. The amount of platinumadhering to the surface of carbon cloth after this procedure was also found to beless than 0.1 mg.
As shown previously, deposition of Pd onto Fe from K,PdCl, is a spontaneousprocess via the reaction:
2Fe0 + PdClbe2 + 2Fe’2 + Pd” + 6Cl- (2)
Palladization of Fe wire was accomplished by exposure to 20.0 mL of a solutionof 0.072 mM solution of K,PdCl, for 30 min. The amount of Pd deposited on theFe surface (1 mg) was assumed to be that resulting from 100% completion ofreaction 2.
Bulk electrolysis of 4-CP solution. The electrode systems described above wereused for the constant current electrolysis of 4-CP at ambient temperature (25 “C f3). The cell was a three neck (14120) round bottom flask (50 mL). Cathodes wereheld securely in place with a 14/20 polytetrafluoroethylene (PTFE) o-ring adapter.Electrical contact with the carbon cloth and Fe wire electrodes was maintained bymeans of the Cu-plated alligator clip wrapped with Teflon tape. The alligator clipwas contacted with a copper wire threaded through 5 mm glass tubing and held inplace with a PTFE o-ring adapter. The central 14/20 portal was used for pHmeasurements or for the measurement of the cathode potential. vs saturatedcalomel electrode (SCE) (Fisher, Pittsburgh, Pennsylvania). The anode wasisolated from the electrolysis solutions by means of a 4% agar salt bridge (0.25 Msodium acetate). The anodic compartment was also vented so that oxygen gaswas able to escape. Control experiments indicated that no 4-CP migrated acrossthe agar salt bridge over the time scale of the experiments. The solutions wereunstirred. Constant current and constant potential experiments were conducted ona Princeton Applied Research Corporation model 173 potentiostat/galvanostat(Princeton, New Jersey). The pH measurements were made with an Orion model9 l-05 combination electrode and a Perkin-Elmer Metrion III pH meter.
HPLC analysis. Samples of the 4-CP solution were analyzed by HPLC duringthe course of the constant current electrolysis. The HPLC apparatus consisted of aRheodyne model 720 injection valve, Milton-Roy Constametric 300 isocraticpump, a 5.0 cm Cl8 Zorbex column, Waters Associates model 440 absorbancedetector set at 254 nm, and a Hewlett-Packard model 3392A integrator. Themobile phase composition was 50/50/2 water, methanol, glacial acetic acidmixture by volume. Phenol (t = 2.54 min) and 4-CP (t = 4.37 min) peaks were
c
5-5
. identified by using standard solutions. Quantification of phenol production and4-CP dechlorination was accomplished by the use of calibration curves.
5.2 Carbon Cloth Cathodes
A 25.0 mL solution of 153 ppm 4-CP in a 0.05 M sodium acetate-acetic acidbuffer was electrolyzed at a constant current of 5.6 mA at a bare carbon clothcathode. The potential vs saturated calomel electrode was measured throughoutthe electrolysis and did not vary more than f 10 mV of -1.10 volts. The pH of thesolution increased slowly from 5.0 to 5.6 during the course of the electrolysis(16 hrs) which was performed under aerobic conditions. During this time period,samples of the electrolysis solution were analyzed for phenol and 4-CP content byHPLC. The 4-CP content was found to remain nearly constant throughout theexperiment with minimal amounts of phenol produced (~5 ppm) at the end of theelectrolysis. A vigorous evolution of hydrogen gas was observed at the carbonelectrode throughout the experiment. The results of this experiment indicate thatthe bare carbon cloth surface is not an efficient substrate for the dechlorination of4-CP.
The identical carbon cloth electrode was then subjected to palladization byelectrodeposition as described in Sect. 5.1. Constant current electrolysis of the4-CP solution as outlined above with a bare carbon cloth electrode required aninitial applied potential of -0.69 volts (vs SCE) which increased gradually to -0.85volts at the completion of the electrolysis (15 hrs). The solution pH increasedfrom 5.0 to 5.6 during the 15 hr period. The dechlorination of 4-CP to phenol wasfound to occur much more rapidly at the palladized carbon cloth electrode. Theresults of the HPLC analyses of the electrolysis solution are shown in Fig. 5.2.Complete dechlorination of the compound occurred.
Elimination of DO by purging with helium gas yielded identical results for thebare and palladized carbon cloth electrode systems. Thus, DQ was not removedin subsequent electrochemical experiments.
Platinized carbon cloth electrodes failed to reduce 4-CP to phenol. No loss of4-CP and no production of phenol were observed over a 15.7 hr period underconditions of constant current electrolysis (5.6 mA) of the ‘153 ppm solution of
. 4-CP (pH 5.0).
Constant potential electrolysis (-0.700 volts vs SCE) of 4-CP at the three electrodesystems described above gave results that were similar to those obtained with theconstant current study. In other words, the rate of electrochemically induceddechlorination at 2.0 cm2 carbon cloth electrodes followed the sequence,palladized>>platinized = unmodified electrode. Figure 5.2 illustrates the resultsof the constant potential study.
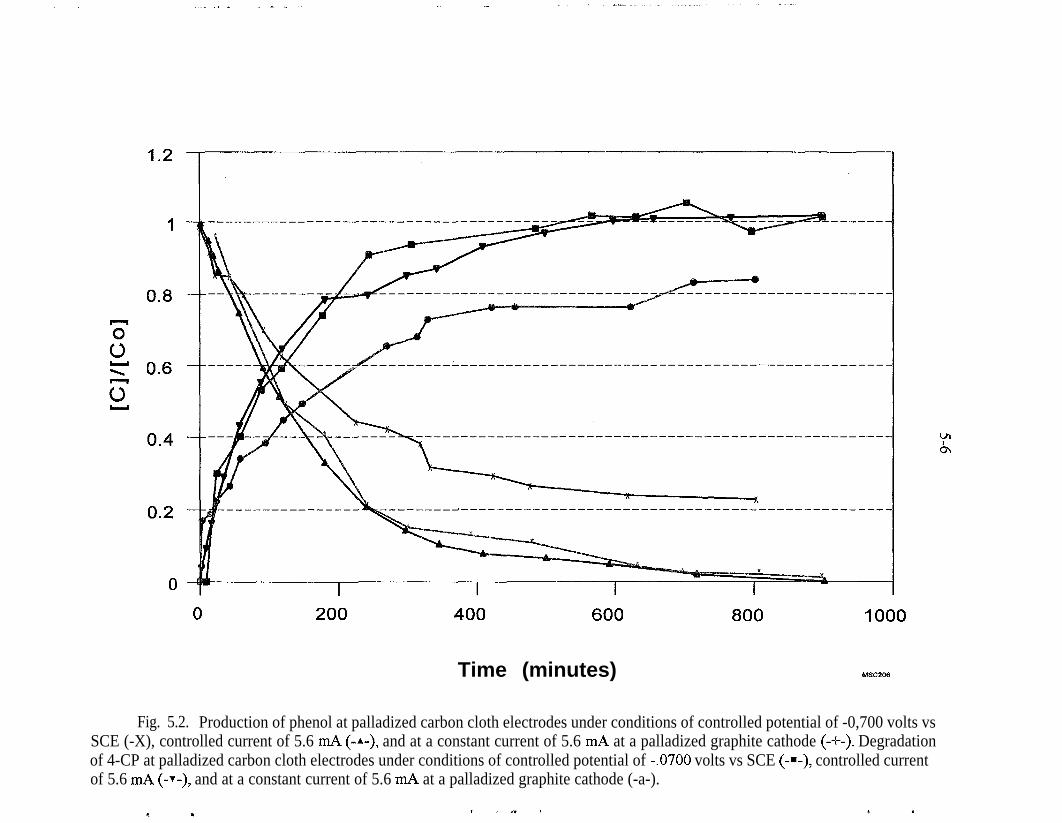
. . ._” .I _ . - ._ i.__ ._
0.8
0.6
0 200 400 600 800 1000
Time (minutes) MSC206
Fig. 5.2. Production of phenol at palladized carbon cloth electrodes under conditions of controlled potential of -0,700 volts vsSCE (-X), controlled current of 5.6 mA (-A-), and at a constant current of 5.6 mA at a palladized graphite cathode (-+-). Degradationof 4-CP at palladized carbon cloth electrodes under conditions of controlled potential of -.0700 volts vs SCE (-=-), controlled currentof 5.6 mA (-‘I-), and at a constant current of 5.6 mA at a palladized graphite cathode (-a-).
5-7
The complete dechlorination of 4-CP at the palladized carbon cloth electroderequired 15 hrs, during which time the current decreased from 2.2 to 0.8 mA.Neither the platinized nor the bare carbon cloth electrodes were able to effectdechlorination of 4-CP at a constant potential of -0.700 volts vs SCE during 15 hrtime periods.
5.3 Graphite Rod Electrodes
A similar constant current (5.6 mA) ,electrolysis of 25.0 mL of the 153 ppmsolution of 4-CP was conducted on both bare and palladized graphite rodelectrodes. The geometrical surface area of the electrodes exposed to solutionwas 2.2 cm*. As with bare carbon cloth the unpalladized graphite electrode failedto effect the hydrodechlorination of 4-CP during a period of 13.5 hrs.’ Theconstant current electrolysis of 5.6 mA required a potential of -1.5 volts vs SCEfor the bare graphite electrode.
Dechlorination of 4-CP at the palladized graphite electrode (x0.1 mg Pd) wasfaster than at the bare graphite surface albeit slower than with the palladizedcarbon cloth cathode. The results of the dechlorination of 4-CP are presented inFig. 5.2. Approximately 70% of the 4-CP was found to dechlorinate to phenolduring an electrolysis period of 15 hrs.
5.4 Iron Wire Electrodes
A 0.270 g sample of 0.25 mm Fe wire (68 cm, 17 cm2) was tightly coiled and usedfor the electrolysis of 153 ppm 4-CP at 5.6 mA for 16 hrs. The potential requiredfor this constant current was -0.95 volts vs SCE. No phenol was detected at theend of this time period. The 4-CP concentration remained constant throughout theelectrolysis. Palladization of this electrode resulted in only slight increases ofphenol production (~10 ppm) with identical electrolysis conditions. The potentialrequired to maintain a constant 5.6 mA current for the Pd/Fe wire electrode was-0.95 volts vs SCE.
5.5 Palladium Gauze Electrodes
A 0.0350 g sample of Pd (area -0.5 cm*) gauze cathode was used to electrolyzethe 153 ppm solution of 4-CP for 16 hrs at both constant current 5.6 mA (Ecathode =
5-8
-2.1 volts vs SCE) and a constant potential of -0.700 volts vs SCE (220 PA). ThePd gauze electrode was saturated with hydrogen prior to exposure to the 4-CPsolution by applying a constant current of 5 mA overnight in a 0.05 M sodiumacetate acetic acid btier solution (pH 5.0) (Lawson et al. 1991). Neither phenolproduction nor dechlorination of the 4-CP was observed during this period oftime.
5.6 Implications for the Reaction Mechanisms
Direct Electroreduction at the Electrode Surfaces. There are three plausiblemechanisms by which electrochemically driven reductive dechlorination mayproceed. These routes are shown in Fig. 5.3. The homogeneous reduction of4CP in solution was ruled out because of the failure of the control experiments onbare metal surfaces. This conclusion is consistent with recent findings regardingthe mechanisms of reduction of surface bound 4-aminoazobenzene by zero-valence iron (Weber 1996).
In the first mechanism (Fig. 5.3a), the reductive dechlorination is a two electron,one proton process which takes place at the electrode surface (equation 12).
RX +H+ +2e--RH+X- (12)
Such processes have been mentioned as a possible reaction route for dissolvingmetal reactions (Matheson and Tratnyek 1994). Indeed, corrosion of Fe to Fe*+occurs at a potential of -0.66 volts vs SCE and for this reason metallic Fe has beenfrequently claimed to be a facilitator for the reductive dehalogenation of chloro-organics. In this study, the electrode serves as the reducing agent, either in thepotentiostatic (-0.700 volts vs SCE) or galvanostatic (5.6 mA) mode. If equation12 were the reaction route then palladization of electrode surfaces should be oflittle relevance because the electrode acts as the thermodynamic equivalent of thecorroding Fe system. In this role all the unmodified electrodes, including Fe,failed to electrolyze 4-CP to phenol during the time scale of the experiment(15 hrs). This indicates that the route presented by equation 12 is not importantfor reductive dehalogenation of 4-CP.
Dechlorination at Pd Surfaces. In Fig. 5.3b Pd islands formed by the electro- *deposition of Pd act as catalytic surfaces for the mechanisms shown by equation11. This implies that 4-CP is adsorbed on the Pd surface. This scheme can beeliminated as a significant route for dechlorination of 4-CP because the resultsobtained at the Pd gauze electrode do not support this conclusion.

.
A
ELECTRODE SURFACE+ 2e-
/I’/‘/‘/ ‘/e- ELECTRODE SURFACE_ _ . I, _
C
/I’/‘/‘/ ‘/e-ELECTRODE SURFACE
PRMDS
Fig. 5.3. Proposed mechanisms for the hydrodehalogenation of 4-CP to phenol.-- -. . Ia) Direct reduction at electrode surface. b) Hydrogenation at palladium catalyst surtace.c) Adsorption of 4-CP at electrode substrate followed by hydrogenation at palladiumisland/electrode surface.
5-10
Despite the pretreatment which ensured that the Pd lattice was saturated with.hydrogen, this electrode system failed to effect the dechlorination of 4-CP at aconstant current of 5.6 mA The blockage of 4-CP adsorption by hydrogen gasevolution cannot be discounted, but it should also be noted that at the appliedpotential of -0.700 volts vs SCE (which resulted in a current of 200 PA), hydrogenevolution was modest as compared to the galvanostatic experiment (5.6 mA). Yet,there was no evidence of dechlorination at the Pd gauze electrode.
Dechlorination at the Pd-Substrate Interface. Figure 5.3~ illustrates a thirdreaction route for the dehalogenation reaction. In this scheme, 4-CP is adsorbedto the substrate surface and undergoes dechlorination at the Pd island/substrateinterface.
The results obtained with the Pd/Fe, graphite, and carbon cloth electrodes supportthis scheme. In the latter two cases dechlorination to phenol was relatively suc-cessful. Again, as in the Pd gauze system the interior of the Pd islands (CO. 1 mg)is saturated with hydrogen gas during the time scale of our experiments. Theamount of charge and the dif%ion coefficient of hydrogen in the Pd latticeindicates that less than 20 min is needed for fi.tll saturation (Lawson et al. 1991);the hydrodehalogenation products were detected before this time period wascompleted.
The palladized graphite and carbon cloth electrodes were both able to dechlorinate4-CP (Fig . 5.2). The scheme outlined in Fig. 5.3~ is therefore a plausible reactionroute. The ability of carbon surfaces to adsorb organic compounds probably facili-tates the dechlorination reaction because it places the compound in the vicinity ofhydrogen-saturated Pd islands. It is apparent that Pd by itself cannot effect thedechlorination probably because of its inability to adsorb 4-CP. Negative resultsfor Pd/Fe wire may also be due to the low concentration of adsorbed 4-CP in
-.comparison with concentrations adsorbed on carbon surfaces.
Hydrogen Generation and Pd vs Platinum in Dechlorination Reactions.These results demonstrate that hydrogen plays a key role in the dechlorination of4-CP to phenol. Therefore, the electrochemical evolution of hydrogen gas by thereduction of water aids dechlorination. Both platinum and Pd are excellent sur-faces for the electrochemical evolution of hydrogen gas (Sawyer and Roberts1974). Indeed, constant current studies generate the same flux of hydrogen at bareelectrodes as well as metal-modified electrodes. However, in these experiments,in which platinum was substituted for Pd, the dechlorination reactions ceasedunder constant potential as well as constant current conditions. Galvanostaticstudies on bare and palladized electrode surfaces indicate that only the latter havethe ability to reductively dechiorinate 4-CP. In other words, although the flux ofhydrogen gas generated at Pd and Pt surfaces is approximately equal, Pd has the
5-11
unique property of promoting dechlorination of organic compounds. Apparently,the ability of Pd to absorb hydrogen into its lattice and to maintain a high surfaceconcentration of hydrogen (Lawson et al. 1991) explains this phenomenon.Neither carbon nor platinum can absorb significant amounts of hydrogen. Carbonand platinum surfaces at which the same flux of hydrogen gas is generated, cannotpromote dechlorination reactions because hydrogen gas escapes relatively easilyfrom both surfaces.
In summary, these electrochemical experiments have shown that palladization ofcathodic surfaces promotes the dechlorination of 4-CP not by an increased rate ofhydrogen evolution but by the Pd islands acting as “pools” of hydrogen thatpromote dechlorination. The substrate s&ace on which Pd is deposited alsoplays a key role relative to its propensity to adsorb the compound to bedechlorinated.
.
e
c

!I
.
.
.
P
6-1
6. Longevity and Regeneration of Pd/F’e
The value of Pd/Fe as a treatment agent is directly related to the length of time thematerial remains active and the ease with which it can be regenerated. Accord-ingly, preliminary experiments and observations throughout this project haveconsidered longevity and regeneration. It should be noted, however, that theproject funding and timing did not permit the systematic experiments required tofully understand these two issues.
6.1 Poisoning
It is well-known that sulfide poisons hydrogenation catalysts (Freifelder 1971).Fortunately, sulfide occurs naturally only in very anaerobic groundwaters thattypically do not have a beneficial use. For that reason, sulfide as a poisoningagent for PdiFe was not expected to be a problem. Sulfate, however, would beprominent in many waste streams where Pd/Fe could be applied. As a simplecheck, preliminary laboratory batch studies were performed to determine whetherPd/Fe reduced sulfate. These studies did not detect any sulfate reduction.
Subsequently, a simulated, reactive-barrier, field experiment (Liang et al. 1996)conducted at PORTS did indicate some formation of sulfide from sulfate.Groundwater at PORTS can contain several hundred ppm of sulfate and was inthe range of 350 - 450 ppm in the simulated reactive-barrier experiment. Pd/Fedechlorinated TCE as designed but the column clogged after approximately 3600pore volumes had been treated. It should be noted that columns of two-types ofzero-valence iron also clogged but at a much lower (approximately 350) numberof pore volumes. In addition, there was initially a significant problem withtrapped air during start-up and air or oxygen is known to be the primary agent forcausing clogging (Mackenzie et al. 1997). However, when the Pd@e column wasopened, there was a distinct odor of sulfide. Water samples from the column didnot contain soluble sulfide, but reduced sulfur species (sulfide and sulfite), asidentified by XPS, were present on the used PdiFe.
The apparent contrary results between the lab and field experiments concerningsulfide formation can be reconciled by considering the possibility that sulfur-reducing bacteria (SRBs), using hydrogen as a primary food source, were reduc-ing the sulfate. Subsequent analysis of the water from the column did reveal thatSRBs were present. These data, of themselves, are not sufficient to prove thatsulfate reduction is a significant process. Experiments under controlled condi-tions are needed for conclusive evidence.
6-2
6.2 Loss of Palladium
Another problem that was evaluated was loss of Pd from the Fe surface. This wasnot considered to be a problem based on the difference in reduction potentials ofPd and Fe.
Pd*+ + 2e- - Pd” + 0.92 (13)
(PdC1,)4- + 2e- - Pd” + Cl + 0.62 (14)
Fe+* + 2e- - Fe0 - 0.44 (15)
Potential loss of the second metal had been addressed by others (Mallat et al.1991). These authors suggested that the Pd was cemented rather than bound tothe Pd. Mallat et al. (1991) stated that “Dissolution of the second metal isnegligible. . . . When all of the base metal in a single particle is completelyconsumed, the second metal of the more positive Nemst potential is also dissolvedand can be deposited again on another base metal particle.” However, as variouspreparations of Pd/Fe were used in this project, loss of Pd from the surface wasevident. The Pd was found in a black precipitate that “flaked off’ the Fe surface.Thus, the contention by Mallat et al. (1991) that the Pd would be re-dissolved maynot be correct as Pd metal is difficult to dissolve (Cotton and Wilkinson 1966).
To date, the potential problem of Pd loss from the surface has not been fullyexplained. In particular, this difficulty results from the fact that data fromdifferent experiments are contradictory. For example, thin film work suggestedthat there was not a Pd adherence problem (see Sect. 4) (Muftikian et al. 1996).In contrast, Pd/Fe prepared in the field under relatively controlled conditions (seeSect. 7) showed that some amount of Pd is precipitated as Pd metal and is notcemented to the Fe surface. It is suspected, therefore, that Pd cementation andadherence improves under more controlled conditions. In other words, if platingoccurs under conditions where the Fe surface is less-clean, that is, in the presenceof Fe oxides/hydroxides and other impurities, then palladization is less successful.Similarly, the condition of the surface with respect to size and variation of poresmay also be a factor. Recall that in Sect. 4, data were presented that show that thePd is always found on “islands” and does not completely cover the Fe surface.The reason that Pd plates in certain locations only is not known and is the subjectof current studies.
6-3
. 6.3 Regeneration
+
‘
The reactivity of the Pd/Fe was expected to decrease with time. Reasons for anexpected deterioration with increased contact with site water include: increasedcoverage of the Fe surface with hydroxylate ions (see Sect. 4), precipitation ofsulfates, carbonates and oxides on the Pd/l?e surface, and accumulation ofcolloidal matter that occurs naturally in the aquifer.
The only regeneration experiments that were conducted were brief tests at alaboratory scale. Promising results were initially obtained with hydrochloric acid(HCl). Figure 6.1 shows results from repetitive experiments performed withFisher Fe palladized to 0.05%. In reviewing the figure, it should be noted that thesolution:mass ratio was approximately 3: 1. Such a ratio is unfavorable relative tothe manner in which Pd@e would be used in a practical system. For example, thesolution:mass ratio on a column is approximately 1:4. The data in Fig. 6.1 showdeterioration with time. However, a single rinse with lm HCl restored thereactivity.
HCl was chosen for the initial experiments because it was readily available, inex-pensive and believed not to. dissolve Pd. Unfortunately, subsequent experimentsindicated ,that some Pd was dissolved by HCl. Indeed, the problem appearedparticularly severe with Pd/Fe prepared in bulk by JMC. Further experiments,therefore, have focused on the use of mild complexing acids such as citric andoxalic (Fig. 6.2). The expected advantage of mild, complexing acids is that theywill dissolve Fe+2 and Fe+3 salts but will not have much effect on Fe metal. Thedata obtained to date are preliminary but suggest that less Pd is lost from thesurface when it is rinsed with oxalic acid. Nevertheless, some Pd was lost fromthe surface in every case in which Pd/Fe was vigorously rinsed. Such losses werelow enough that they may be tolerable. In fact, rinsing a column tith a regener-ation solution is much less abrasive than the method used in these experimentswhich was to vigorously shake the flask. Thus, it is hoped that dissolution ofoxides/ hydroxides etc., will occur with a simple rinse and that rinsing withoutabrasion will result in better adherence of the Pd.
Y
It should be noted that regeneration on a column will introduce other consider-ations. For example, the addition of a solution with a low pH will accelerate thecorrosion of the Fe and production of hydrogen. Thus, it will be necessary torelieve pressure build-up in a safe manner.
Preliminary data included attempting to regenerate a sample of PdiFe from theaforementioned simulated barrier project (Sect. 6.1) (Liang et al. 1996) with citricacid. The reactivity of the used Pd/Fe had decreased by a factor of 10 and a single
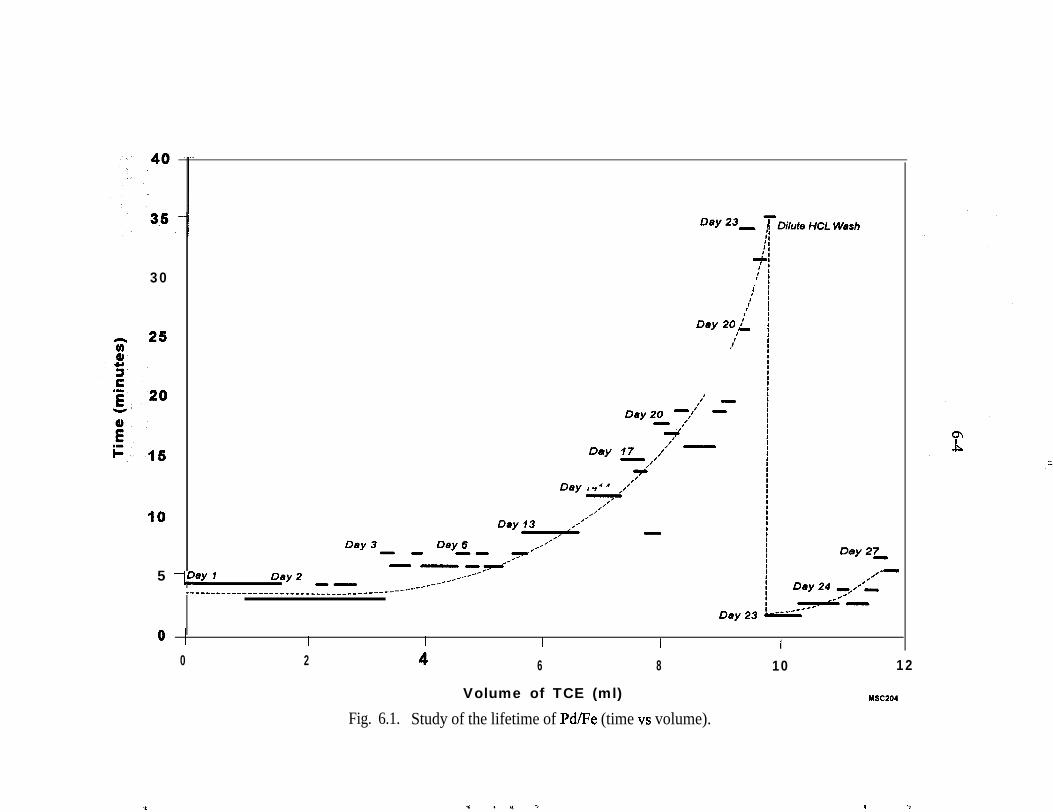
30
IO
I’ -
Day 20 -,I’ -- ,’
--r’
Day 17 / -
+’
Day 14 I’-+
, ’<g
Day 13 ,’
Day 3-a
Day 6__fLI
.’C’--
s mm---/7
.5 -,D~Y 1 Day 2 <-*-- _<--- */--
------____^_________------------------------
Day 23
Day 23-
7:
:::
Day 20 :,-
‘Dilute HCL Wash
0 / I I I I I0 2 4 6 8 10 12
Volume of TCE (ml) MC204
Fig. 6.1. Study of the lifetime of Pd/Fe (time vs volume).
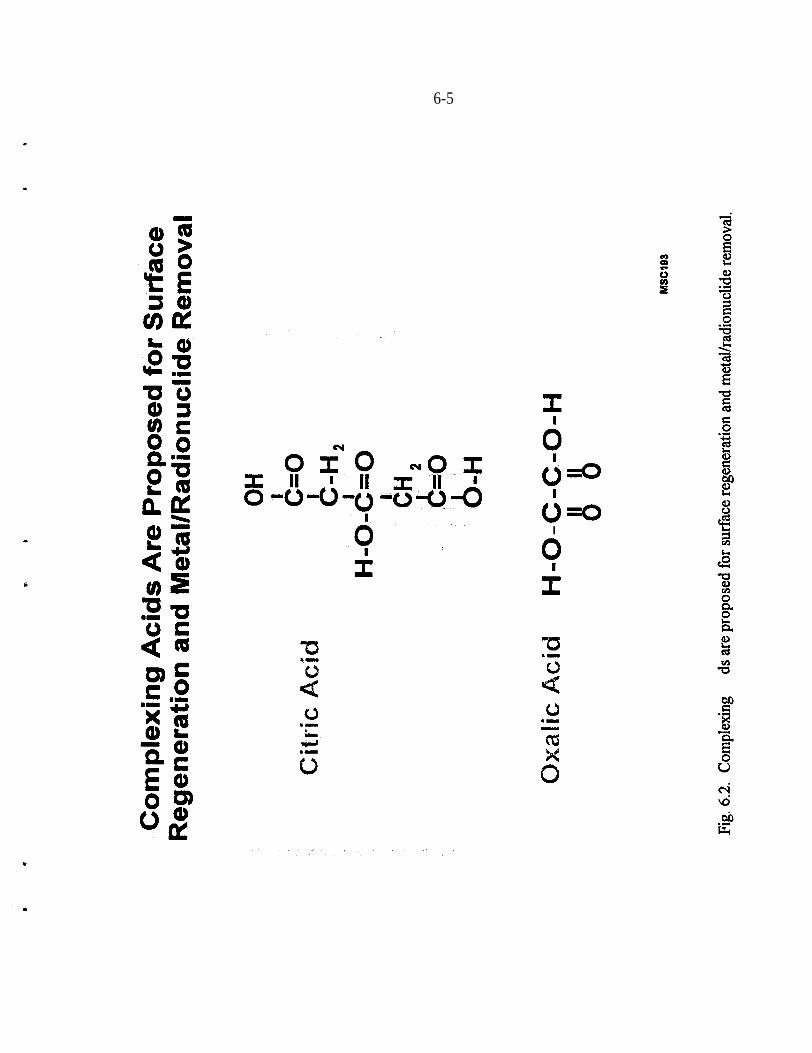
6-5
.
I
0
o-I
0I
I
6-6
citric acid (1M) rinse improved reactivity by a factor of 4. Another brief exper-iment at ORNL compared a 1M rinse of the used Pd/Fe with HCl, oxalic, andcitric acids. Only the oxalic acid extract did not contain any Pd. Funding did notpermit a comparison of the restoration of the reactivity.
6.4 Discussion
The data obtained to date yield a point of departure for additional research. Forexample, the thin-film work suggests that a cleaner Fe surface results in better Pdadherence. Although XPS shows that a hydroxylate layer forms instantly duringpalladization, there may be a significant difference in the amount and quality ofthe layer formed when the Fe is clean and under vacuum and argon previous tothe initial contact with Pd. Perhaps, Pd added in these circumstances adheresbetter than the bulk preparations tested to date.
The thin-film work (Sect. 4) (Muftikian et al. 1996) showed that Pd-O-Fe bondsformed prior to complete reduction to Pd metal. However, the data showed thatboth Pd and Pd’2 were present. It can be speculated that some of the Pd plateddirectly on the Fe without the intervening step of combining with oxygen.Perhaps, Pd that does not participate in bonding with oxygen is more tightlybound. It also seems, from steric considerations, that the oxygen may affect thequality of the pi-bonding that is presumed to hold the Pd on the Fe surface.Unfortunately, the reaction is too rapid to determine whether or not all of the Pdinitially bonds with oxygen or not.
Another issue is with respect to the time required for mixing the Fe and thepalladization solution. It was observed that there was considerable standing waterduring palladization at JMC. Likewise, there was several min of contact timewith interstitial water during the bulk palladization conducted in the field atPORTS (Sect. 7). Perhaps, some of the Pd is reduced in solution by ferrous Febefore it can plate on the, Fe metal. This would account for Pd metal that is foundwithin the Fe matrix but not cemented to the Fe.
The information presented in this section, in conjunction with the results of thefield tests (Sect. 7), clearly show that adherence of Pd to the Fe is a critical issuein the further development of this technology. It is emphasized, however, thatrelatively little testing has been performed. Additional planned research, fundedby other programs, will evaluate other base materials (e.g., Fe foams) and platingtechnologies (e.g., electroless, sputtering) as well as include a comprehensiveevaluation of regeneration possibilities.
7-l
. 7. Field Experiments
Pd/Fe was tested in three separate phases during the field program at PORTS.Initially, the test was to be full-scale with JMC-prepared Pd/Fe. As will bediscussed, this experiment failed because of manufacturing problems at JMC’sNew Jersey facility. Thus, a smaller scale experiment, also using JMC-preparedPd/Fe was attempted. This experiment met with some success but was premature-ly terminated because of an operator error. Finally, a third phase, relying on fieldpreparation of Pd/Fe was attempted. This third phase would have provided themost useful results but equipment malfunction and overall cessation of fieldactivities prevented a complete test. Nevertheless, there were important lessonslearned in each phase of activity as described below.
7.1 Treatment Trailer
I
.
A mobile trailer (Fig. 7.1) was designed for the field tests. All parts for the trailerwere provided by RCT (Sect. 2.4) at no cost to DOE and ORNL. Labor for thedesign and construction were funded by DOE-EM-50.
The trailer is 16 ft in length and 8 ft wide. Four large side doors and a double reardoor provide convenient access to the treatment system inside the trailer. Thesystem itself consists of six stainless steel columns supported on steel cradles andenclosed behind removable plexiglass windows. The column enclosures aremounted inside spill containment liners equipped with leak detectors and anautomatic pump shut-off. As secondary containment, the entire trailer floor islined and equipped with leak detectors and automatic shut-off.
Two of the columns, used as pre-filters for removing particulates and DO, are12 in. long and 12 in. in diameter. The remaining four columns are 30 in. longand 12 in. in diameter. The column design is shown in Fig. 7.2. The lids oneither end were packed with fine and coarse sands as a means of providing bothadditional filtration and to prevent loss of the reactive media, in this case Fe orPd/Fe.
z
/l
The columns are connected by stainless steel tubing and valves and can beoperated individually, in-series, or in-parallel (Fig. 7.3). Flexible metal tubingand quick disconnects enable rapid changes to be made without shutting off flowto the entire system. The columns are also easily rotated by means of the supportcradles. Even with media as heavy as Fe (approximately 500 lbs in thisapplication), the columns could be rotated by a single person. Each column is
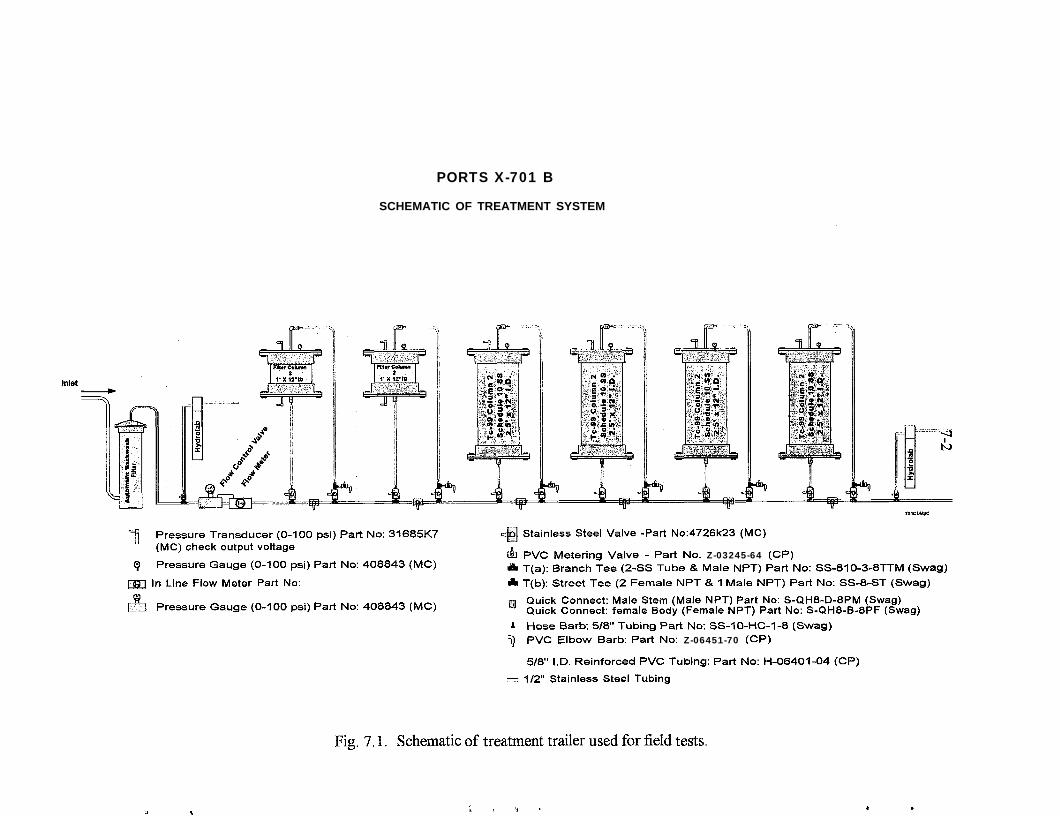
PORTS X-701 B
SCHEMATIC OF TREATMENT SYSTEM
41 Pressure Transducer (O-100 psi) Part No: 31685K7(MC) check output voltage
Q Pressure Gauge (O-100 psi) Part No: 408843 (MC)
m In Line Flow Meter Part No:
l&l Pressure Gauge (O-100 psi) Part No: 408843 (MC)
C@ Stainless Steel Valve -Part No:4726k23 (MC)
& PVC Metering Valve - Part No. Z-03245-64 (CP)&la T(a): Branch Tee (2-SS Tube & Male NPT) Part No: SS-810-3-8TTM (Swag)* T(b): Street Tee (2 Female NPT 8 1 Male NPT) Part No: SS-8-ST (Swag)
a Quick Connect: Male Stem (Male NPT) Part No: S-QH8-D-8PM (Swag)Quick Connect: female Body (Female NPT) Part No: S-QH8-B-8PF (Swag)
1 Hose Barb: S/8” Tubing Part No: SS-IO-HC-l-8 (Swag)ij PVC Elbow Barb: Part No: Z-06451-70 (CP)
- 5/8” I.D. Reinforced PVC Tubing: Part No: H-06401-04 (CP)
= l/2” Stainless Steel Tubing
Fig. 7.1. Schematic of treatment trailer used for field tests.
J z I ‘4 *
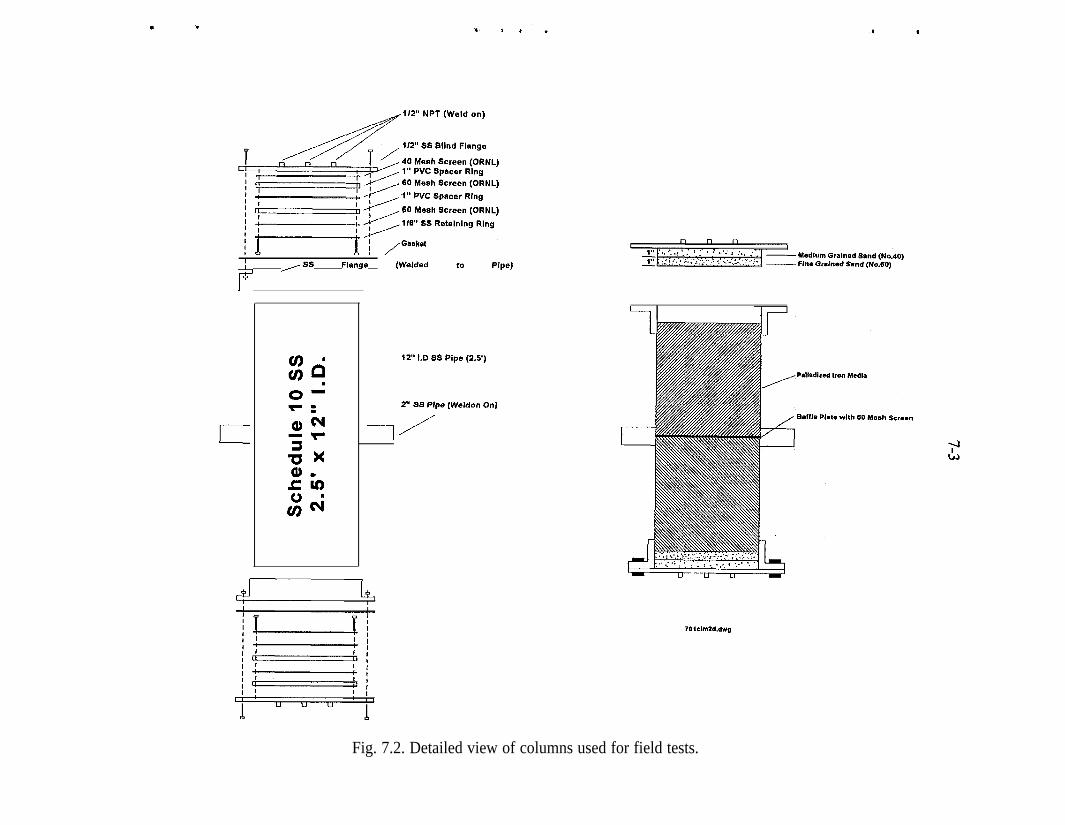
112” NPT (Weld on)
SO Mesh Screen (ORNL)
I
4$ ,SS Flange (Welded to Pipe)
12” I.D ss Pipe (2.5’)
2” SS Pipe (Weldon On)
---I/ c
Fig. 7.2. Detailed view of columns used for field tests.
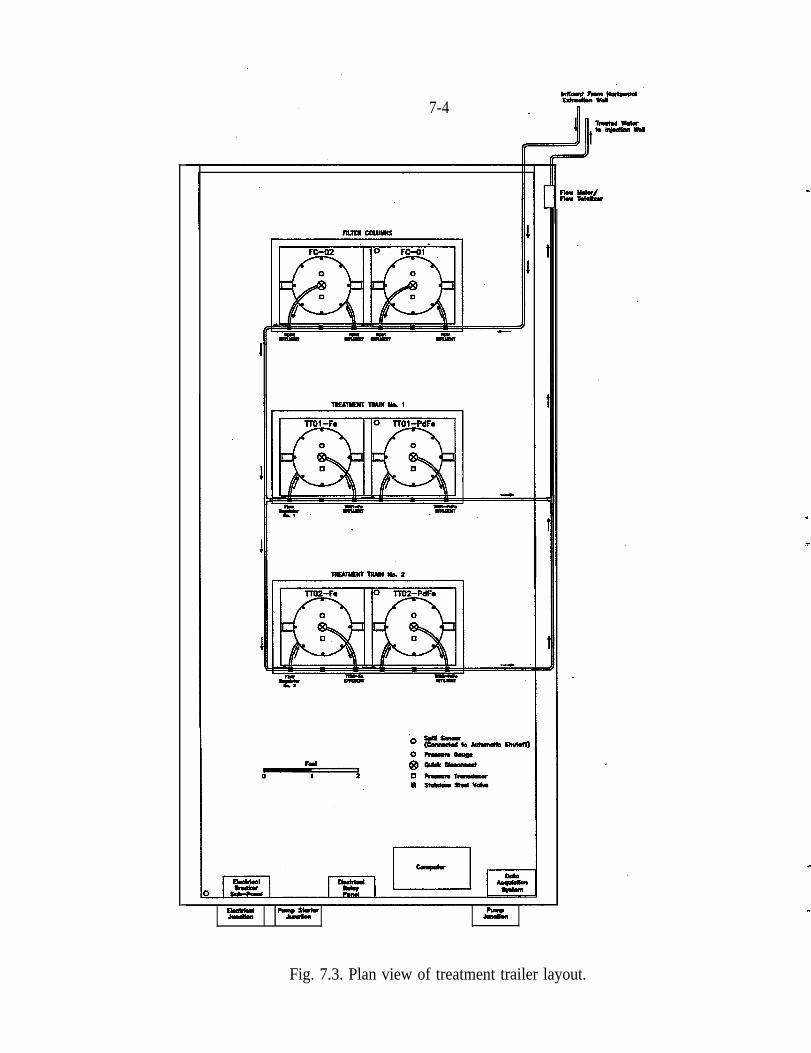
7-4
1
1
1
Ez --- J%&
Fig. 7.3. Plan view of treatment trailer layout.
7-5
c.
I
0
also equipped with pressure transducers and analog pressure gauges. Flow metersare used to monitor total flow and flow through individual columns.
A data acquisition system was also designed and built to closely monitor treat-ment system parameters. Flow rates, pressures, treatment time, treated volume,and trailer alarm conditions can be logged at specified intervals. Thus, all of theaforementioned parameters can be compiled and evaluated in real-time. Analy-tical data derived from samples collected during operation can also be conven-iently merged with the operational parameters such that treatment effkiency as afunction of time, flow rate, and pressure can be easily viewed.
7.2 Treatment of Tcgg with Zero-Valence Iron
As described in Sect. 2, a primary goal of this project was to treat a radioactive(Tcgg) and a hazardous (TCE) contaminant simultaneously. Certain wells withinthe flow field contained more than 100 pCik of Tc~ while no Tc~ was detectedin others. As soon as the horizontal recirculation system was started, samples
”were collected for analysis of Tc . Unfortunately, no Tcgg was detected with adetection limit of 20 pCi/L. However, because Tcgg was within the flow field, itwas certain that low concentrations of Tcgg were flowing through the treatmentsystem. The original plan had been to analyze frequently the effluent from the Fecolumn to determine when Tcgg breakthrough occurred. Those analyses were notperformed because of the low concentrations. However, the columns were dis-mantled, segmented, and the segments analyzed for their Tcgg content, followingthe cessation of the pumping and treatment.
Figure 7.4 shows the results of the Tcgg analyses of the Fe segments. Approxi-mately 600,000 gal of water had been pumped through the columns but all of theTcgg was confined to only 12 in. of Fe. These data show that the simultaneoustreatment of mixed contaminants was successfully demonstrated. With higherconcentrations of Tcgg, the Fe columns would have been periodically changed.These data, in conjunction with the laboratory data (Sect. 3), show that it ispossible to select Fe of varying capacity for Tcgg Thus, the activity of the spent Fe.could be tailored to the particular treatment/storage option that is available.Additional description of the Tc contamination and treatment costs is presented inthe horizontal recirculation system report (Korte et al. 1997a).
7.3 Phase 1 - Full-Scale with JMC-Prepared Pd/Fe
When the potential benefits of using Pd/Fe were identified, RCT contacted JMCwho is one of the world’s largest sources for precious metal preparations. JMC
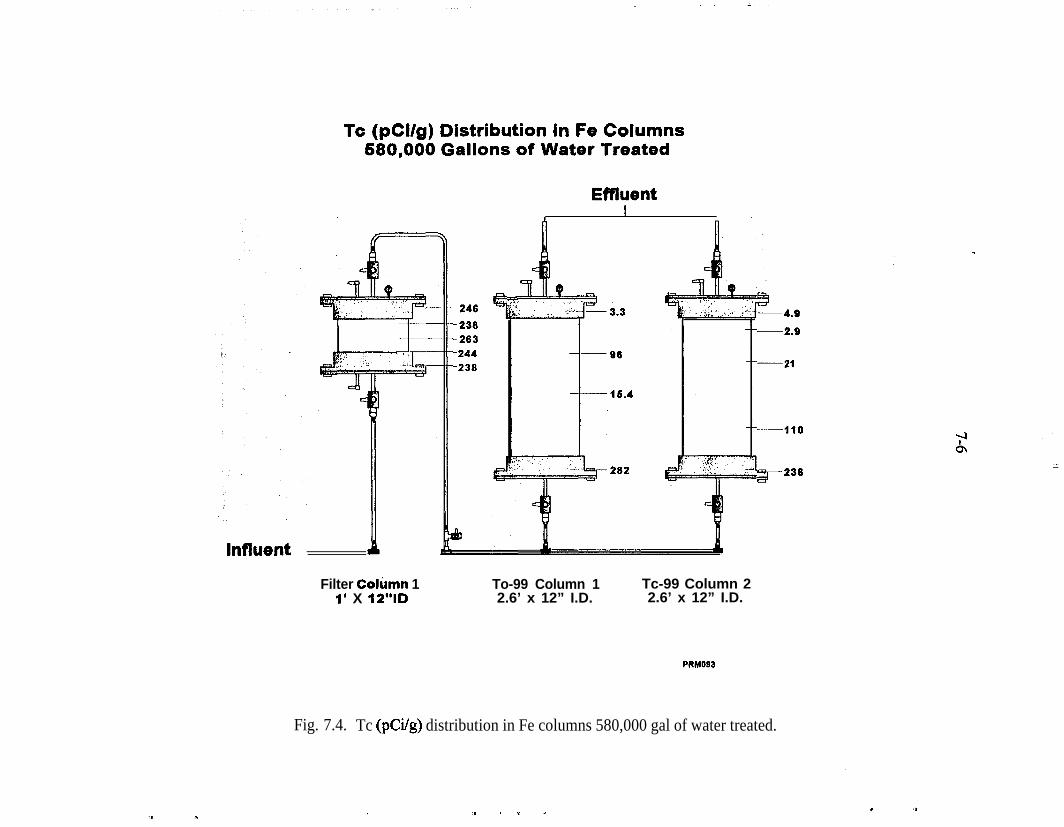
Tc (pCi/g) Distribution in Fe Columns680,000 Gallons of Water Treated
EffluentI
lnfluent
Filter Colirmn 1 To-99 Column 1 Tc-99 Column 21’ X 12”ID 2.6’ x 12” I.D. 2.6’ x 12” I.D.
=:.!9.
-236-263-244-230
-4.9
-2.9
-21
-110
g-236
PRMOBB
Fig. 7.4. Tc (pCi/g) distribution in Fe columns 580,000 gal of water treated.
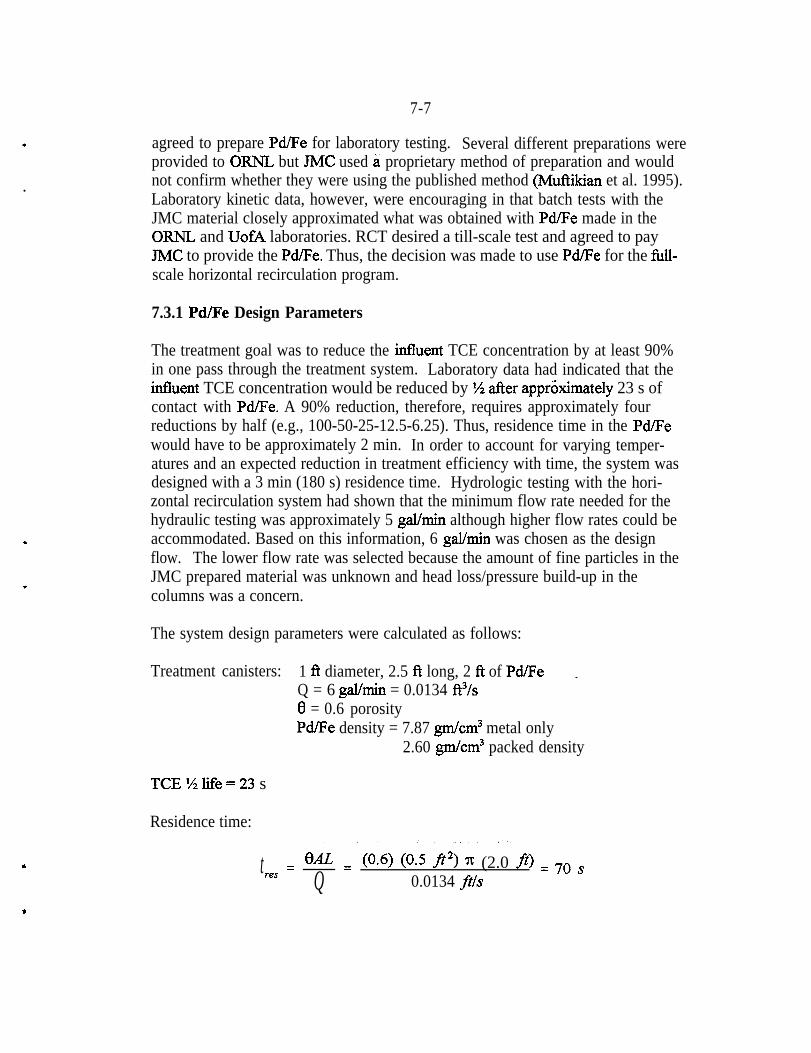
7-7
.
.
agreed to prepare Pd/Fe for laboratory testing. Several different preparations wereprovided to ORNL but JMC used g proprietary method of preparation and wouldnot confirm whether they were using the published method (Muftikian et al. 1995).Laboratory kinetic data, however, were encouraging in that batch tests with theJMC material closely approximated what was obtained with Pd/Fe made in theORNL and UofA laboratories. RCT desired a till-scale test and agreed to payJMC to provide the Pd/Fe. Thus, the decision was made to use Pd/Fe for the full-scale horizontal recirculation program.
7.3.1 Pd/Fe Design Parameters
The treatment goal was to reduce the influent TCE concentration by at least 90%in one pass through the treatment system. Laboratory data had indicated that theinfluent TCE concentration would be reduced by ‘/ tier appr&imately 23 s ofcontact with PdFe. A 90% reduction, therefore, requires approximately fourreductions by half (e.g., 100-50-25-12.5-6.25). Thus, residence time in the Pd/Fewould have to be approximately 2 min. In order to account for varying temper-atures and an expected reduction in treatment efficiency with time, the system wasdesigned with a 3 min (180 s) residence time. Hydrologic testing with the hori-zontal recirculation system had shown that the minimum flow rate needed for thehydraulic testing was approximately 5 gal/min although higher flow rates could beaccommodated. Based on this information, 6 ga.l/min was chosen as the designflow. The lower flow rate was selected because the amount of fine particles in theJMC prepared material was unknown and head loss/pressure build-up in thecolumns was a concern.
The system design parameters were calculated as follows:
Treatment canisters: 1 fi diameter, 2.5 fi long, 2 R of Pd/Fe _Q = 6 gal/min = 0.0134 R3/s0 = 0.6 porosityPd/Fe density = 7.87 gm/cm3 metal only
2.60 g&cm3 packed density
TCEXlife=23 s
Residence time:
. t = fL&L =res (0.6) (O-5 ft2) n (2.0 ft> = 70 sQ 0.0134 ftls
.
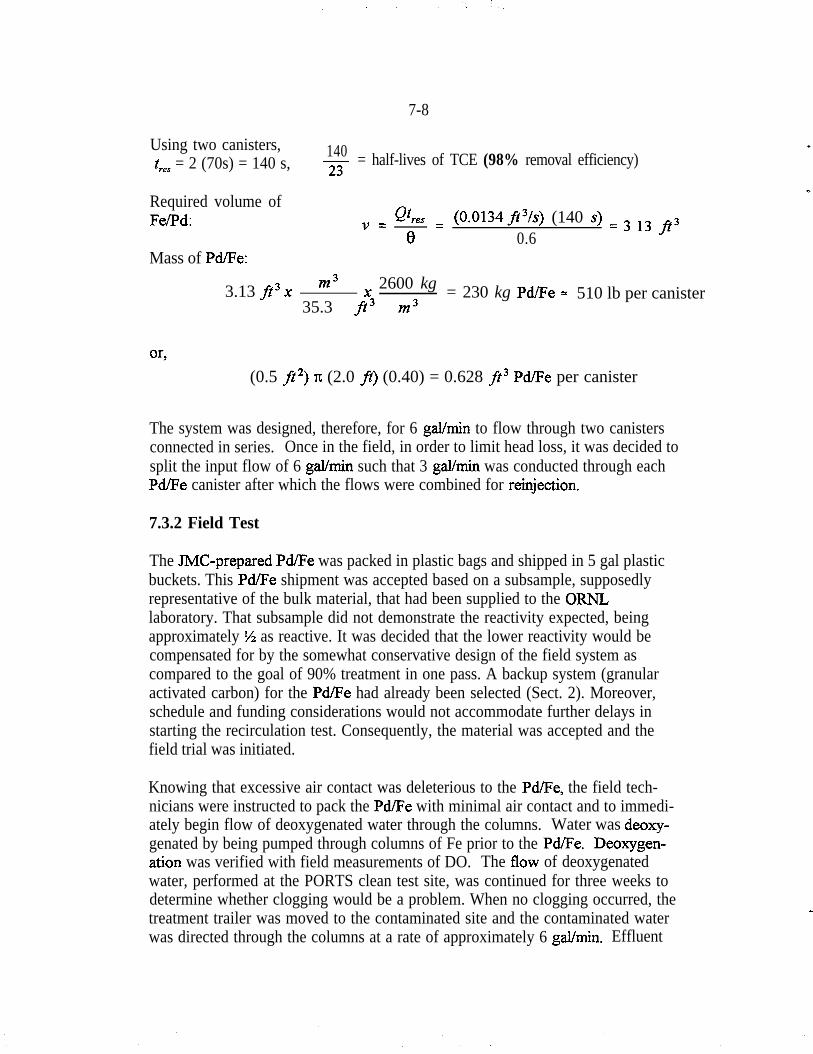
7-8
Using two canisters,tres = 2 (70s) = 140 s,
140Tjj- = half-lives of TCE (98% removal efficiency)
Required volume ofFe/Pd: v = Qtres =
0(0.0134P3/s) (140 s) = 3 I3 ft3
0.6Mass of Pd/Fe:
3.13 ft3 X m3 x 2600 kg
35.3 ft3 m3 = 230 kg Pd/Fe = 510 lb per canister
05(0.5 ft2) IT (2.0 ft) (0.40) = 0.628 ft3 Pd/Fe per canister
The system was designed, therefore, for 6 gal/mm to flow through two canistersconnected in series. Once in the field, in order to limit head loss, it was decided tosplit the input flow of 6 gal/mm such that 3 gal/min was conducted through eachPd/Pe canister after which the flows were combined for reinjection.
7.3.2 Field Test
The JMC-prepared Pd./Fe was packed in plastic bags and shipped in 5 gal plasticbuckets. This Pd/Fe shipment was accepted based on a subsample, supposedlyrepresentative of the bulk material, that had been supplied to the ORNLlaboratory. That subsample did not demonstrate the reactivity expected, beingapproximately ‘/ as reactive. It was decided that the lower reactivity would becompensated for by the somewhat conservative design of the field system ascompared to the goal of 90% treatment in one pass. A backup system (granularactivated carbon) for the Pd/Fe had already been selected (Sect. 2). Moreover,schedule and funding considerations would not accommodate further delays instarting the recirculation test. Consequently, the material was accepted and thefield trial was initiated.
Knowing that excessive air contact was deleterious to the PdRe, the field tech-nicians were instructed to pack the Pd/Pe with minimal air contact and to immedi-ately begin flow of deoxygenated water through the columns. Water was deoxy-genated by being pumped through columns of Fe prior to the PdEe. Deoxygen-ation was verified with field measurements of DO. The flow of deoxygenatedwater, performed at the PORTS clean test site, was continued for three weeks todetermine whether clogging would be a problem. When no clogging occurred, thetreatment trailer was moved to the contaminated site and the contaminated waterwas directed through the columns at a rate of approximately 6 gal/mm. Effluent
7-9
samples collected tier 1% hrs and again at 8 hrs showed essentially no treatmentof VOCs. At this point, the flow rate was decreased by a factor of 10 such thatcolumn residence time was approximately 30 min.
Once the poor treatment results were observed, the drums of unused Pd/Feobtained from JMC were inspected and the personnel who had packed the Pd/Fecolumns were questioned. It was noted that from drum-to-drum the PdJFe washighly variable in appearance and moisture content. Some of the Pd/Fe wasorange in color. All of it was distinctly brown as opposed to appearing black andmetallic as expected. The moisture content was also highly variable. Some of thedrums were wet, with water droplets visible within the material. Other drums werequite dry. It was also observed that hardened clumps were interspersed with thefiner material. The Pd/Fe was supposed to be 40 mesh or smaller and JMC hadbeen requested to remove as many of the fine particles as possible.
To test the material’s reactivity, a series of batch experiments were quickly per-formed in the field. Ten grams of the unused Pd./Fe were added to vials that werethen filled with 40 mL of water from the groundwater extraction system. The vialswere gently shaken for 5, 10, 15,20, and 30 min at which point aliquots weretaken for analysis. The results showed neither the reactivity nor the internalconsistency expected. In other words, the 10 min sample did not dechlorinatetwice as much TCE as the 5 min sample and so on. Indeed, there was little patternto the data. Subsamples were then collected and shipped to ORNL for additionaltesting. Testing at ORNL showed similar results.
Unused Pd/Fe prepared by JMC and left over from the previously mentionedsimulated barrier experiment (Liang et al. 1996) was also obtained from storage atPORTS. Batch tests showed that it was at least twice as reactive as the newmaterial. A sieve analysis was then performed on the two preparations. The newmaterial was 5-10% > than 40 mesh as compared to previously received Pd/Fewhich was 22% > 40 mesh. Moreover, the new material had more than twice asmuch mass in the ~60 mesh fraction even though JMC had been requested toremove a greater percentage of fine particles.
In the meantime, additional data from the treatment system became available.With a flow of 0.6 gal/m& a 67 ppm TCE influent was reduced to 17 ppm.While such data demonstrated that some treatment was occurring, the horizontalrecirculation test could not be conducted at such a low flow rate. Consequently,the decision was made to switch to carbon for VOC removal. The Fe columnswere retained for removal of Tc.
Additional measurements were made on the various JMC-prepared materials. Forexample, a total analysis for Pd was performed. The previously-used sample
7-10
(Liang et al. 1996) reportedly contained 0.36-0.52% Pd. Two separate drums ofthe new material showed 0.0325-0.047% Pd and 0.0098-0.012% Pd respectively.These data indicate that the desired coverage (0.05%) was obtained for thepreviously-received preparation but that the Pd content was both low and highlyvariable in the new material. JMC personnel stated that the only real difference inthe two preparations was that the batch size was quite a bit larger for the secondone.
7.3.3 Effects on Other Chemical Constituents
The purpose of this section is to convey the data related to the use of the Pd/Fe.Only a minor amount of data were collected regarding the Fe - Pd!Fe treatmentsystem’s effect on other groundwater contaminants. The following results,however, may be useful for predicting long-term effects. Samples were alsocollected from 12 monitoring wells that were located in and near the flow-fieldand from the influent and effluent of each treatment column. The data from thesewells are discussed in detail in the final report for this project (Korte et al. 1997a).
The data discussed in this section are all from field measurements performedwithin a few minutes to a few hours of sample collection. The analyses were allperformed with kits available from Hach Inc. (Loveland, Colorado).
Chloride - Chloride in the monitoring wells ranged from approximately 20 -60 mg/L. The influent to the treatment system was approximately 35 mg/L.Effluent from the Fe columns showed a slight increase (to 40-50 mg/L). Effluentfrom one of the Pd/Fe columns ranged to 82 mg/L suggesting that the rinse of theHCl wash performed by JMC was inadequate. If the Pd/Fe had been stored at lowpH, significant corrosion might have occurred during storage. There was noincrease in chloride through the other Pd/Fe column but this may-be explained bythe varying conditions of the Pd/Fe as described previously.
Sulfate - Sulfate in the monitoring wells ranged from approximately 130 -300 mg/L. Influent to the treatment system was approximately 215 mg/L. Therewas no evidence of sulfate removal in the Fe columns but concentrations de-creased to approximately 165 mg/L after passage through the Pd@e. Precipitationof ferrous sulfate in the Fe columns was expected but obviously had not occurredto ‘any significant extent over the length of this experiment. Time and funding didnot permit an evaluation of the removal mechanism in the Pd/Fe.
Others (Mackenzie et al. 1997) have reported a grey-to-white precipitate attributedto ferrous‘sulfates and carbonates. It is noted that neither the Fe nor the Pd@eshowed any evidence of this grey color, even after three months of field use in ahigh sulfate environment.
7-11
Alkalinity - Alkalinity in mg/L as CaCO, in the monitoring wells ranged from 71(well-80G) to 665 (well-75-G). The influent to the treatment system was approx-imately 100-l 50 mg/L which increased to approximately 250 mg/L through the Fecolumns but did not change as it passed through the Pd/Fe. This increase in alka-linity may be an indication of microbial activity. More study, however, is neededto evaluate this speculation.
Ferrous Fe - The detection limit for the ferrous Fe analysis was approximately0.1 mgiL. Ferrous Fe in the monitoring wells was either not detected or found intrace concentrations with the exception of well 77-G which contained approx-imately 8 mg/L. The ferrous Fe influent concentration to the treatment systemwas unexpectedly high, 15-20 mg/L. As expected, ferrous Fe increased through-out the treatment system, increasing to 1 lo-125 mg/L as it passed through the Fecolumns and to 200-210 mg/L after passage through the Pd/Fe.
7.4 Phase 2 - Small-Scale Experiment with JMC-Prepared Pd/Fe
*
.u
Once the data obtained in Sect. 7.3.2 were provided to JMC, they agreed to permitproject personnel to witness the preparation of the Pd/Fe. JMC and RCT agreed
i
to provide the funding and a smaller-scale field test was designed. The goal of thesmaller scale test was to obtain some long-term field data with Pd/Fe withoutjeopardizing the data collection or operation of the full-scale horizontal recircu-lation test which was successfully operating with Fe and carbon treatment of themixed waste effluent.
Accordingly, a dilution system was built in a trailer adjacent to the treatmentsystem. Treated water was taken from the carbon system and used to diluteincoming untreated water. This was done so that lower concentrations and lowervolumes of TCE would be treated. The horizontal recirculation system wasyielding water with 200 ppm TCE which was somewhat higher than expected.None of the laboratory work associated with Pd/Fe had been performed at suchhigh concentrations. Hence, a lower concentration was desired so that a directcomparison could be made to the laboratory. The dilution system was designedsuch that its effluent went back through the carbon in order to eliminate anyconcerns about reinjecting untreated water.
The preparation of the Pd/Fe at JMC’s facility was witnessed by Nit Korte of,ORNL, M.T. Koerner of RCT, and Frank Cheng of the UofA. Instead of using40-mesh Fe, as used previously, 40-60 mesh, spherical, electrolytic Fe (AlfaiAesar, Ward Hill, MA) was used. Alfa-Aesar Fe was selected because of excellentbatch study results obtained at the UofA. Discussions revealed that JMC had
7-12
departed from the published procedure in several ways. They were using a sodiumsalt rather than a potassium salt and were not thoroughly washing the Fe with acidprior to palladization (personal communication Kevin Donnegan and BobMcNair, JMC, to Nit Korte, ORNL, October 22,1996). Use of the Na salt wasnot likely to pose a problem but an inadequate acid rinse probably was. At thistime, JMC agreed to use a 1N HCl rinse as opposed to the 6N HCl that had beenpublished (Muftikian et al. 1995). This acid rinse was to be followed by athorough water rinse.
The on-site observations revealed that there were a number of shortcomings withrespect to the preparation method at JMC. The following is an unprioritized list ofthe potential problems that were observed:
l The stirrer blade in the reactor did not agitate the bottom. Thus, only the toplayer of Fe was well-mixed.
l Deionized water was not readily available and there were several long periodsof waiting while it was obtained. In the meantime, the Fe corroded with air,water or acid.
I:l The reactor was not bottom-draining, meaning that a pipe had to be inserted to
remove the excess water. The pipe could not remove the bottom l-3 in. ofj solution. Thus, the acid rinse was very inefficient and the quality of the
preparation of the Fe surface was questionable. Moreover, the water rinse to ”remove the acid had to be conducted several times to raise the pH above thatof the palladizing solution (2.54). Thus, instead of a simple acid rinse anddrain, acid was added and then drained as much as possible followed byseveral more rinses with water. Two hours passed from the time the Fe wasadded to the acid until the palladizing step could be performed. In addition,the rinse water was not deoxygenated so the Fe would have been subject tomuch more corrosion than at the laboratory.
An obvious result of this preparation process was that a clear solution was not ob-tained following the palladization step. Instead, the solution was yellow-greenwhich was indicative of a high concentration of dissolved ferrous Fe. Chiefamong the concerns regarding the high concentration of ferrous Fe is that it couldreduce the Pd+4 to Pd metal without the metal plating on the Fe surface.
The packaging of the Pd/Fe was not observed but discussions with plant personnelindicated that previous batches had been subjected to significant air contact. Itwas requested, therefore, that this material be packaged wet and immediatelyshipped to PORTS. Samples were taken to ORNL and to the UofA for batch
7-13
testing. The batch testing again showed approximately half of the reactivity as thelaboratory-prepared Pd/Fe.
The Pd./Fe preparation that was observed accounted for half of what was to beused in this test. A second batch was prepared the next day in which JMCpersonnel stated that air contact and time delays were much shorter. Because thebatches were to be used in different columns, one item of interest was todetermine if there was a performance difference.
The columns, as shown in Fig. 7.2, were cleaned and prepared for the Pd.&e.Sand in the lids and all screens, etc. were removed and replaced with freshmaterials. Less than half of each column was to be used. The procedure forpacking the columns was to connect them to the treatment system and begin theflow of water until it just began to appear in the half of the column to which thePd!Fe was to be added. At that point, the containers (sealed, plastic jars) sent byJMC were opened and the Pd/Fe added to the column. Once the Pd/Fe was added,the lid was put on the column, the column was rotated so that the Pd/Fe was nowat the bottom and immersed in the deoxygenated water. Water flow through thesystem was started immediately. The entire packing process required less than 10min. Visual inspection of the Pd/Fe indicated no obvious deterioration from thesamples that were collected during manufacture. There was also no obviousdifference in the batches from the two preparation periods. There was approxi-mately 10% less material in batch 2. Thus, column TTOl-Pd contained‘approxi-mately 12 in. of PdJFe and column TT02-Pd contained approximately lb in.
Data from this test are presented in Table 7.1. The system flow rate was approxi-mately 0.5 gal/mm and the influent concentration was nominally 1 ppm(1000 ppb). Based on the reactivity measured in the laboratory, the expectationwas that the concentration reduction would be approximately 5 half-times. Inother words, a concentration of 1000 ppb would be reduced to approximately30 ppb (e.g., 1000-500-250-125-62.5-3 1.75). It is evident from the table that theamount of reduction approximated that expected from the laboratory measure-ments. The other primary feature of interest was that column TT02-Pd generallyoutperformed TTO 1 -Pd. In 17 of the 20 measurement periods, there was greaterreduction with TT02-Pd. The last nine measurements, constituting almost 46 hrsof operation all showed TT02-Pd with a lower effluent concentration. It is notedthat the infhtent to TTOl-Pd was slightly higher than for TT02-Pd, but thedifferences were 5-l 0% not factors of 5 to 10 as observed in the effluent. Also,recall that there was approximately 10% less Pd/Fe in TT02-Pd. The number ofhalf-time reductions is plotted in Fig. 7.5. The differences seem especiallystriking in the last nine measurements where the data suggest successively poorertreatment with TTOl-Pd. It should be noted that in the final 24 hr period, therewas a significant drop in air temperature (from 55 O to 20 “) and the dechlorination
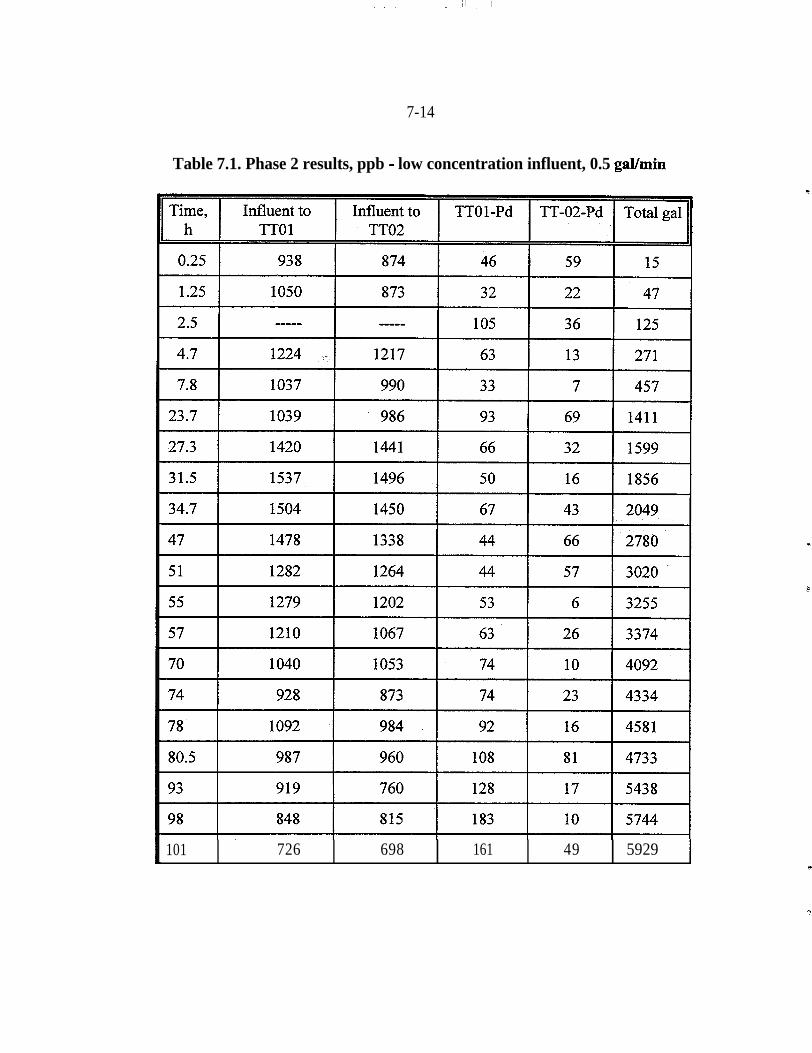
7-14
Table 7.1. Phase 2 results, ppb - low concentration influent, 0.5 gal/min
101 726 698 161 49 5929I
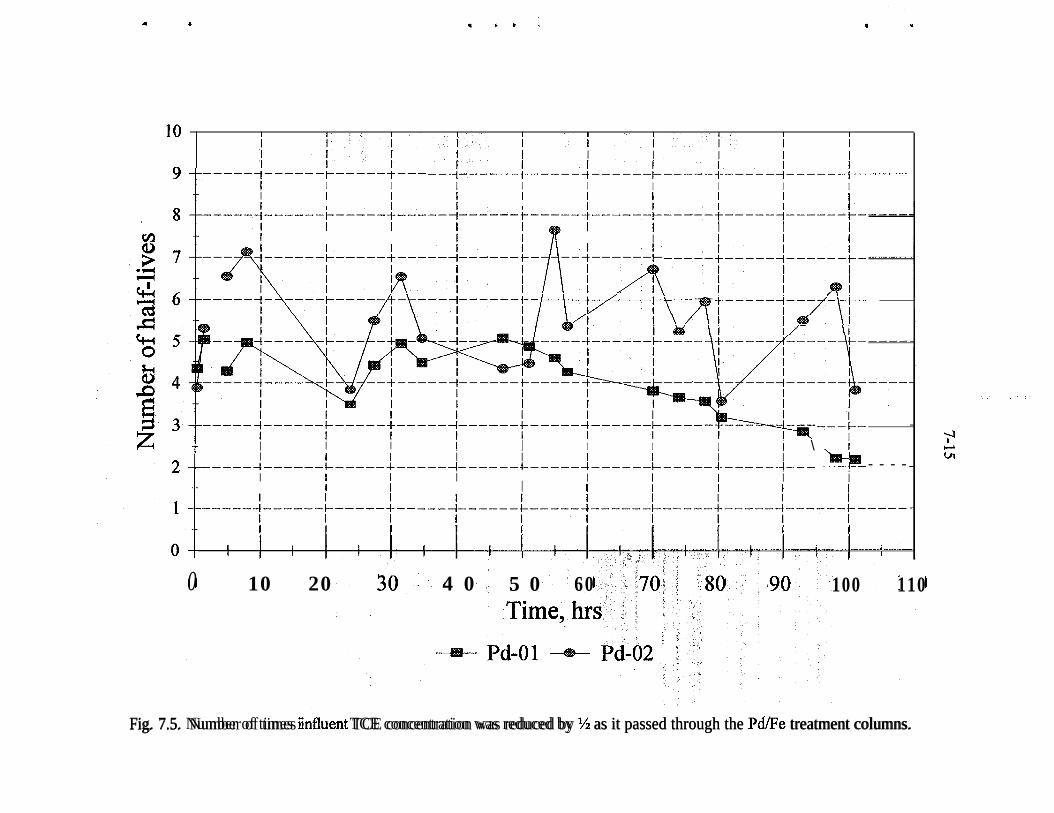
. c
10
9
OiI I I I I
0 I I I I I I I I I ,I I ?; I I I I
0 10 20 30 .’ 4 0 5 0 60 +o;; :so .90 100 110Time&;,: I..
--es-- p&t)2 ' [--ES-- pd-01 /
Fig. 7.5.Fig. 7.5. Number of times influent TCE concentration was reduced by % as it passed through the PdiFe treatment columns.Number of times influent TCE concentration was reduced by % as it passed through the PdiFe treatment columns.
I I I I I I I
t-----f------f-----+--- --A------+-----+-----+-----$.-----A------L-----
l I I I I I I I I I
ti I I
tI I I I I I
I I I I I I I
I I I I I I i i I
I II I
------;-----;-----A------+- I I
I I-----T-----+-----k-
I II I I I
t
-----I-
\
----r-----,- ---l------t-
i+t tt
- --pL--r --
t
t ----- l--7+t-
i Y \i i/- \i
t-----J------~-----i-----~------C-----J------~---- ---;-I.I- i i i i I I I I i \ i
1 i I I i i I I i i-----~------C-----~-----~------~-----~------~-----~-----~--- - - - -
i
I I I iI
I I I i iI
I-----“------~-----~--
II I
I IJ~-----l_---+-----~-----~-----+-----+~~~! I I I I I
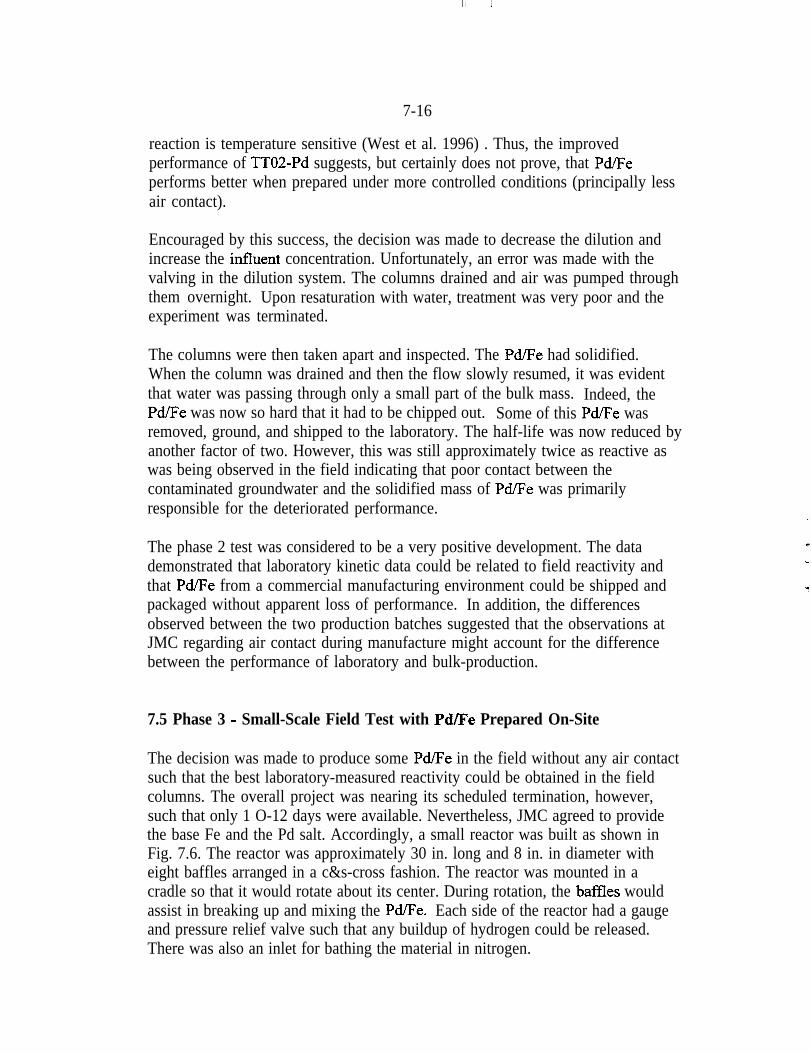
7-16
reaction is temperature sensitive (West et al. 1996) . Thus, the improvedperformance of TT02-Pd suggests, but certainly does not prove, that Pd/Feperforms better when prepared under more controlled conditions (principally lessair contact).
Encouraged by this success, the decision was made to decrease the dilution andincrease the influent concentration. Unfortunately, an error was made with thevalving in the dilution system. The columns drained and air was pumped throughthem overnight. Upon resaturation with water, treatment was very poor and theexperiment was terminated.
The columns were then taken apart and inspected. The Pd./Fe had solidified.When the column was drained and then the flow slowly resumed, it was evidentthat water was passing through only a small part of the bulk mass. Indeed, thePd/Fe was now so hard that it had to be chipped out. Some of this Pd/Fe wasremoved, ground, and shipped to the laboratory. The half-life was now reduced byanother factor of two. However, this was still approximately twice as reactive aswas being observed in the field indicating that poor contact between thecontaminated groundwater and the solidified mass of Pd/Fe was primarilyresponsible for the deteriorated performance.
The phase 2 test was considered to be a very positive development. The datademonstrated that laboratory kinetic data could be related to field reactivity andthat Pd/Fe from a commercial manufacturing environment could be shipped andpackaged without apparent loss of performance. In addition, the differencesobserved between the two production batches suggested that the observations atJMC regarding air contact during manufacture might account for the differencebetween the performance of laboratory and bulk-production.
7.5 Phase 3 - Small-Scale Field Test with Pd/Fe Prepared On-Site
The decision was made to produce some Pd/Fe in the field without any air contactsuch that the best laboratory-measured reactivity could be obtained in the fieldcolumns. The overall project was nearing its scheduled termination, however,such that only 1 O-12 days were available. Nevertheless, JMC agreed to providethe base Fe and the Pd salt. Accordingly, a small reactor was built as shown inFig. 7.6. The reactor was approximately 30 in. long and 8 in. in diameter witheight baffles arranged in a c&s-cross fashion. The reactor was mounted in acradle so that it would rotate about its center. During rotation, the baffIes wouldassist in breaking up and mixing the Pd/Fe. Each side of the reactor had a gaugeand pressure relief valve such that any buildup of hydrogen could be released.There was also an inlet for bathing the material in nitrogen.
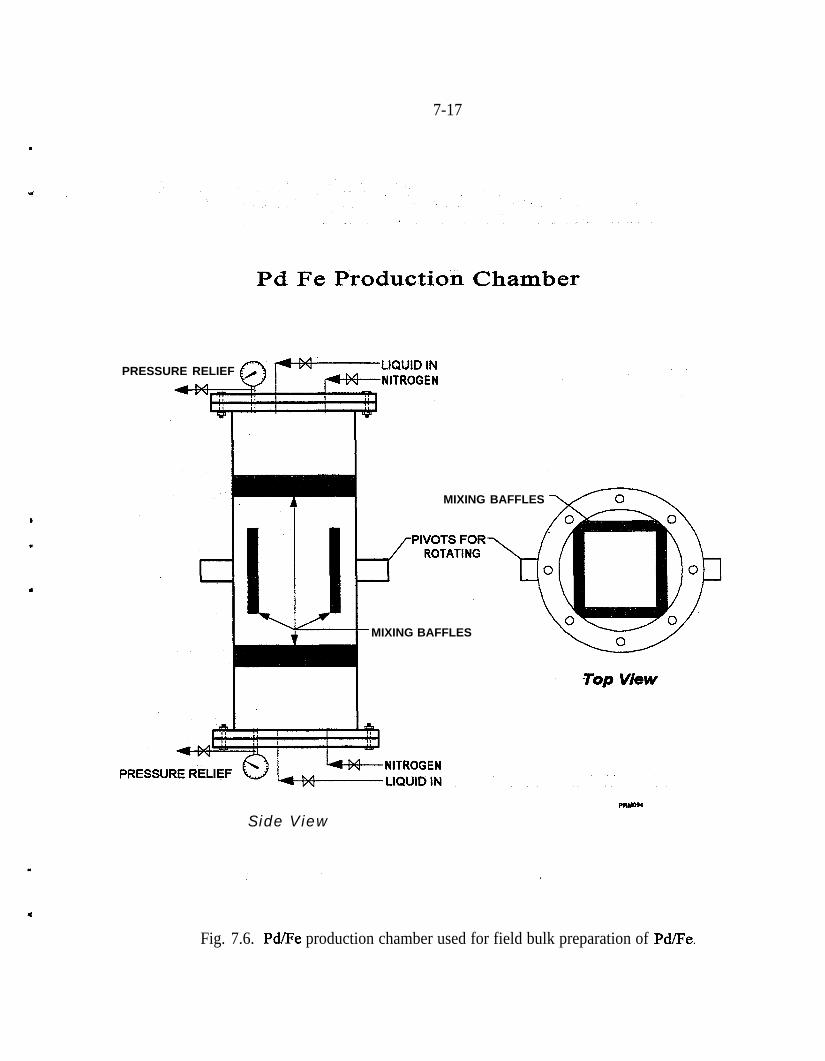
7-17
.
Pd Fe Production Chamber
PRESSURE RELIEF
MIXING BAFFLES
MIXING BAFFLES
Side View
Fig. 7.6. Pd/Fe production chamber used for field bulk preparation of PdLFe.
7-18
The process used was as follows: .
.
.
.
.
.
.
The reaction vessel was purged with nitrogen and 30 kg of Alfa-Aesar Fe wasadded. A positive nitrogen pressure was then maintained throughout theremainder of the procedure.
Deionized water was deoxygenated by vigorous bubbling with nitrogen. A ’nitrogen pressure was maintained over three vessels of water. One of thesewas used for the acid rinse solution, another for the water rinse, and the thirdfor the palladization solution.
Three gal of deoxygenated 10% HCl were added. The cylinder was thenrotated repeatedly for 20 min to perform the acid wash.
The acid was drained from the bottom with a positive pressure of nitrogenmaintained at all times. Draining required approximately 5 min.
A single water rinse, with two gal of deionized, deoxygenated water wasperformed. The column was rotated for approximately 5 min and drained aswith the acid rinse.
163 g of 18.44% Pd (sodium chloropalladate, a hydrated salt, assay providedby JMC), was added to three gal of deionized, deoxygenated water. Thisvessel was stirred with a magnetic stirrer for approximately 5 min and theentire contents were added to the Fe in the reactor vessel.
The reactor vessel was then rotated repeatedly. After approximately 5 min, thesupernatant appeared clear and was drained off under nitrogen pressure.
The Pd/Fe was immediately transferred to a nitrogen-purged treatmentcanister. After several minutes a small amount of black precipitate formed inthe supernatant. (Subsequent analyses by JMC showed that the precipitatewas pure Pd. Nevertheless, bulk analysis of the Pd/Fe indicated that coveragewas the expected 0.05%. Because Pd was added in slight excess, it appearedthat approximately 90% plated on the Fe). The lid to the canister was screwedon and the contaminated water flow was initiated.
The entire production process required approximately 30 min and the only aircontact that could have occurred was when the Pd/Fe was carried to the treatmentcanister. That activity required less than 1 min.
During this experiment, only 4 - 6 in. of Pd/Fe were to be used. Some baffles andscreens were added to the field canisters to hold the material in place. A sub-sample of the material was also collected and shipped to the ORAL laboratory.Laboratory kinetic data (Fig. 7.7) indicated that this material was similar in
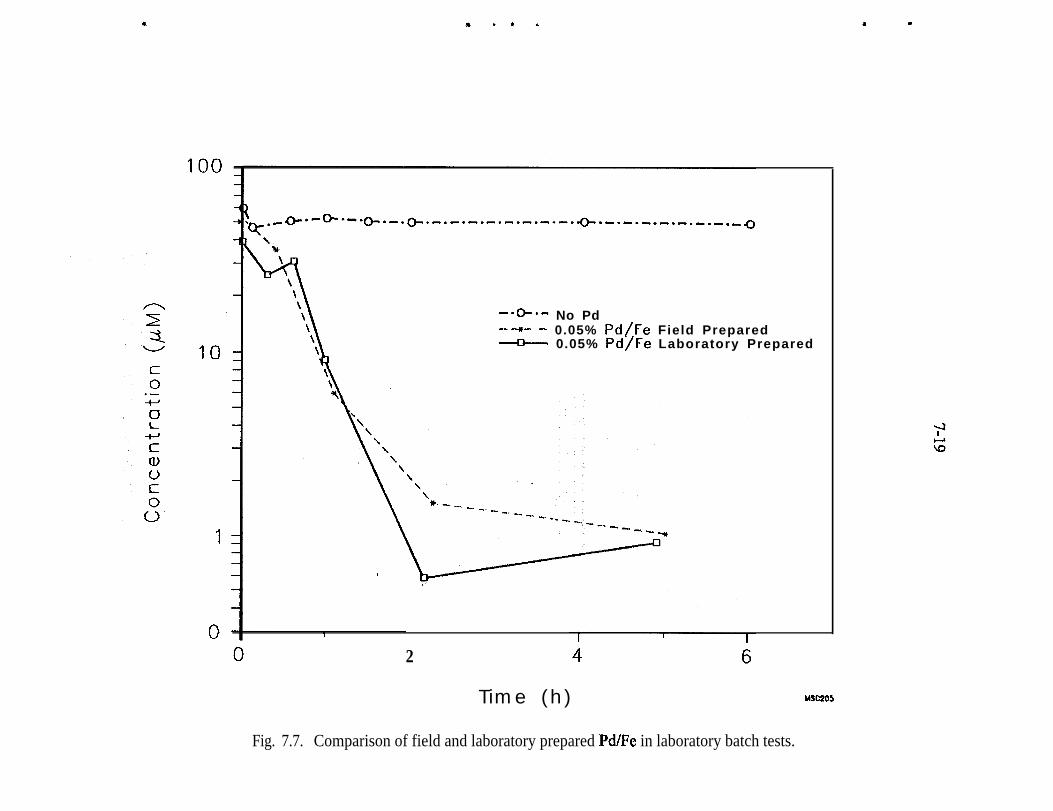
a .
1
-. O-O- No Pd---+- - 0.05% Pd/Fe Field Prepared---I)- 0.05% Pd/Fe Laboratory Prepared
2
Time (h) USC205
Fig. 7.7. Comparison of field and laboratory prepared Pd/Fe in laboratory batch tests.
7-20
reactivity to laboratory-prepared Pd/Fe, that is, twice as reactive as that providedby JMC and used in phase 2. In other words, the careful exclusion of oxygen didimprove the reactivity of the catalyst.
Treatment using the packed canister was then initiated. The preliminary results,those from the first l-3 hrs of operation, indicated that treatment wasapproximately at the level expected. At that point, however, the treatmentdeteriorated significantly and remained at less than 50% removal for the nextweek. (Flow through the column was continued in order to observe whether thePd/Fe solidified in the absence of the air contact that occurred in phase 2.) Whenthe column was opened, there was no apparent solidification or oxidation of thePd/Fe and no apparent reason why treatment was so much less than expected. Tocheck for preferential pathways, a slow stream of nitrogen was injected into thebottom of the column. It was observed that all of the gas escaped around the sideof the baffles instead of passing through the Pd./Fe. As noted above, these bafflesand screens were inserted to hold the Pd/Fe in place because the columns weredesigned to hold quite a bit more material. Unfortunately, these did not seal astightly as was necessary and permitted the contaminated water to flow around thecatalyst. At this point, funds for the overall field experiment had been expendedand the project was terminated.
Although the field-prepared material was not tested under field conditions duringphase 3, several important lessons were learned. First, although the supernatantwas clear, some Pd (10%) did not plate on the Fe. Whether or not Pdprecipitation is occurring in the laboratory is unknown. Perhaps the more rapidlaboratory plating step results in more efficient plating or precipitation may beoccurring but the amounts are too small to be noticed. Second, no solidificationoccurred, although the Pd/Fe was in contact with water for more than a week.Third, even with the improvements in the production procedure, it was notpossible to perform the plating and rinsing steps nearly as quickly as in thelaboratory.
7.6 Summary
The PORTS experiments yielded considerable useful information and results con-cerning Pd/Fe. The ability to take commercially-prepared material and measurethe kinetics in the laboratory and then obtain the same performance in the field isan important step. The fact that the material did not solidify during exposure todeoxygenated water is important. The reactor design used in the field providedgood mixing and a convenient means of preventing air contact. Finally, provingthat some of the Pd is being reduced but not plating on the Fe was an importantdiscovery.
7-21
Unfortunately, the PORTS experiments did not provide a thorough field test of thePd/Fe. The initial test was marred because of poorly prepared and packagedPd/Fe. The second test provided the best data but an equipment malfunction cutthe test short. The third test was inconclusive because of equipment ma&mction.
On the other hand, zero-valence iron, used throughout the more than four monthfield period effectively removed Tc and there was no evidence of clogging. Theconcept of simultaneous treatment of mixed contaminants with Fe-Pd/Fe has beenproven but the full-scale test of the Pd/Fe was not accomplished.
Plans
New funding has recently become available from EM-SO’s Efficient SeparationsProgram. This funding will permit approximately one-year’s laboratory effortregarding material development. The focus of that effort is to determine thenature of the Pd adherence to Fe and to determine the optimum methods forplating, use, and regeneration. Experiments are being conducted with differentmaterials (particle size, purity) and with different plating approaches (e.g., electro-less plating). Kinetic studies and measurements of surface areas and surfacecomposition will be investigated during this project.
.

I !
:
8-l
8. References
Bar-bee, G. C. 1994. Fate of chlorinated aliphatic hydrocarbons in the vadosezone and ground water. Ground Wuter Monitoring and Remediation,14(l): 129-140.
Bodnariuk, P., B. Coq, G. Ferrat, and F. F&eras. 1989. Carbon chlorine hydro-genolysis over Pdrh and Pdsn bimetallic catalysts. Journal of Catalysis,116(2):459-466.
Bostick, W. D., J. L. Shoemaker, P. E. Osborne, and B. Evans-Brown. 1990.“Treatment and Disposal Options for Heavy Metals Waste Containing SolubleTechnetium-99.” In Emerging Technologiesfor Hazardous Waste Treatment,ACS Symposium Series No. 422. D. W. Tedder and F. F. Pohland, eds., 345-367.
Bostick, W. D., and B. S. Evans-Brown. 1988. Sorptive Removal of TechnetiumJ’rom Heavy A4etals Sludge Filtrate Containing Nitrate Ion. WQT-160. OakRidge National Laboratory, Oak Ridge, Tennessee.
3 Bowen, H. J. N. 1966. Trace Elements in Biochemistry. Academic Press,. London.
Briggs, D., and M. Seah. 1983. Practical Surface Analysis, John Wiley andSons, New York, New York.
Cantrell, K. J. 1995.Zero-valent iron for the in situ remediation of selectedmetals in groundwater. Journal of Hazardous Materials, 42(2):0201-0212.
Cataldo, D. A., R. E. Wildung, and T. R. Garland. 1978. Technetium Accumu-lation, Fate, and Behavior in Plants. In Environmental Cycling Processes,eds., D. C. Adrian0 and I. L. B&bin, 207-220.
Cheng, F., Q. F. Fernando, and N. Korte. 1997. Electrochemical Dechlorinationof 4-Chlorophenol to Phenol. Etivironmental Science and Technology,31(4):1074-1078.
Clausen, J. L., W. L. Richards, N. E. Korte, and L. Liang. 1995. ORNLA4MESResearch into remedial applications of zero-valence metals: 3) Removal ofTCE, cis-l,ZDCE, vinyl chloride, and technetium. In American ChemicalSociety Division of Environmental Chemistry, presented at the 209th ACSNational Meeting, April 2-7, 1995, Anaheim, California, 35( 1):755.
8-2
Clausen, J. L., and W. L. Richards. 1994. Work Plan for Batch and ColumnStudies Using Iron Filings to Treat Trichloroethylene and Technetium.KYIER-5 1. Paducah Gaseous Diffusion Plant, Paducah, Kentucky.
Coq, B., S. Hub, F. Figueras, and D. Tournigant. 1993. Conversion under hydro-gen of dichlorodifluoromethane over bimetallic palladium catalysts. AppliedCatalysis A: General, 101(1):41 - 50.
Cotton, F. A., and G. Wilkinson. 1966. Advanced Inorganic Chemistry. Inter-science Publishers, New York, NY.
Criddle, C. S., and P. L. McCarty. 1991. Electrolytic model system for reductivedehalogenation in aqueous environments. Environ. Sci. TechnoZ., 25(5):973 -978.
Del Cul, G. D., W. D. Bostick, D. R. Trotter, and P. E. Osborne. 1992.Technetium-99 removal from process solutions and contaminatedgroundwater. In Separation Science and Technology, 7th Symposium onSeparation Science and Technology for Energy Applications, October 20-25,Knoxville, Tennessee.
Freifelder, M. 1971. Practical Catalytic Hydrogenation. Wiley, New York, NY.
Gillham, R. W. and S. F. O’Hannesin. 1994. Enhanced degradation of halo-genated aliphatics by zero-valent iron. Ground Water, 32:958-967.
Gillham, R. W. and S. F. 0’Hannesi.n. 1992. Metal-catalyzed abiotic degradationof halogenated organic compounds. IAH conference, Modem Trends inHydrogeology, Hamilton Ontario, Canada.
Grittini, C., G. A. Romeo, Jr., Q. Fernando, and N. E. Korte. 1996. Rapiddechlorination of pentachlorophenol. American Chemical Society, 2 12thNational Meeting, Orlando, Florida. Environmental Chemistry Preprints of
Extended ;4 bstrLcts, 36(2): 19-20. August.
Grittini, C., M. Malcomson, Q. Fernando, and N. Korte. 1995. Rapid dechlor-ination of polychlorinated biphenyls on the surface of a Pd/Fe bimetallicsystem. Environmental Science & Technology, 29(11):2898-2900.
Gu, B.;‘K. E.‘Dowlen, L’Liang, and J: L. Clausen: i996. Efficient separation andrecovery of technetium-99 from contaminated groundwater. Sep. Technol.,6:123-132.
8-3
Gu, B., 0. R. West, and R. L. Siegrist. 1995. Using 14C-labeled radiochemicalscan cause experimental error in studies of the behavior of volatile organiccompounds. Environmental Science and Technology, 29(5): 1210.
.
Haitko, D. A., and S. S. Baghel. 1995. Enhanced trichloroethylenedechlorination by Fe(O). Presented before the Division of EnvironmentalChemistry, American Chemical Society, April 2-7, Anaheim, California.
Homey, D. P., P. D. McKenzie, J. J. Salvo, and T. M. Sivavec. 1995. Zero-valent iron treatability study for groundwater contaminated with chlorinatedorganic solvents at the Paducah, Kentucky GDP Site. Report submitted toLockheed Martin Energy Systems. GE Corporate Research and Development,Schenectady, New York.
Johnston, R. A., and A. H. Wilby. 1985. Chem. Rev., 85: 129.
Korte, N., M. T. Muck, P. M. Kearl, R. L. Siegrist, R. M. Schlosser, M. E.Mumby, D.T. Davenport, D. W. Greene, D. A. Pickering, C. A. Muhr, and J.Strong-Gunderson. 1997a. In Situ Treatment of Mixed Contaminants inGroundwater, Final Report on Engineering, Cost, and Hydrodynamic Aspectof the Project. Oak Ridge National Laboratory, Grand Junction, Colorado, inpreparation.
.Korte, N. E., L. Liang, R. Muftikian, C. Grittini, and Q. Fernando. 1997b. The
Dechlorination of Hydrocarbons: Palladized iron utilised for ground waterpurification. Platinum Metals Review, 41(1):2-7.
Korte, N. E., M. T. Muck, J. L. Zutman, L. Liang, J. D. Goodlaxson, and J.Clausen. 1995a. Zero-Valence Metal Reduction of ChlorinatedHydrocarbons Technology Screening Report Portsmouth uranium EnrichmentPlant Piketon, Ohio. Oak Ridge National Laboratory, Grand Junction,Colorado.
Korte, N. E., R. Muftikian, C. Grittini, Q. Fernando, J. L. Clausen, and L. Liang.1995b. ORNLMMES Research into Remedial Applications of Zero-ValenceMetals. 2: Bimetallic Enhancements. In American ChemicaE Society Divisionof Environmental Chemistry, presented at the 209th ACS National Meeting,April 2-7, 1995, Anaheim, California, 35(1):752.
a-4,
Korte, N. E., R. L. Siegrist, M. Ally, B. Bischoff, W. Bostick, J. M. Strong-Gunderson, P. Kearl, L. Liang, D. Marsh, A. Mattus, A. Pahunbo, J.Stockdale, P. Taylor, and 0. F. Webb. 1994. In Situ Treatment of MixedContaminants in Groundwater: Review of Candidate Processes, ORNLITM-12772, Oak Ridge National Laboratory, Oak Ridge, Tennessee.
Korte, N., J. Skopp, W. H. Fuller, E. E. Niebla, and B. A. Alesii. 1976. Traceelement movement in soils: influence of soil physical and chemicalproperties. SoiE Science, 122:350.
Kulikov, S. M., V. P. Plekhanov, A. J. Tsyganok, C. Schlimm, and E. Heitz.1996. Electrochemical reductive dechlorination of chlororganic compoundson carbon cloth and metal modified carbon cloth cathodes. ElectrochimicaActu, 411527.
Kurbatov, Cr., E. Darque-Cerett, and M. Acouturier. 1992. Surf Interface Anal.,l&811.
Lawson, D. R., M. J. Tiemey, I. F. Cheng, L. S. Van Dyke, M. W. Espenscheid,and C. R. Martin. 1991. Use of a coulormetric assay technique to study thevariables affecting deuterium loading levels with palladium electrodes.Electrochimica Acta, 36(9): 15 15 - 1522.
Lee, S. Y., and E. A. Bondietti. 1983. Technetium behavior in sulfide andferrous iron solutions. Material Research Society Symposium Proceedings,15:315-321.
Liang, L., N. E. Korte, J. D. Goodlaxson, J. Clausen, Q. Fernando, R. Muftikian.1997. Byproduct formation during the reduction of TCE by zero-valence ironand palladized iron. Ground Water Monitoring and Remediation, Winter:122-127.
Liang, L., 0. R. West, N. E. Korte, J. D. Goodlaxson, D. A. Pickering, J. L.Zutman, F. J. Anderson, C. A. Welch, and M. J. Pelfrey. 1996. The X-625Groundwater Treatment Facility. A Field-Scale Test of TrichloroethyleneDechlorination Using Iron Filings for the X-l 20/x- 749 Groundwater Plume.Oak Ridge National Laboratory, Oak Ridge, Term.
Liang, L., J. D. Goodlaxson, N. E. Korte, J. L. Clausen, and D. T. Davenport.1995. ORNLMMES Research into Remedial applications of Zero-ValenceMetals. 1: Laboratory Analysis of Reductive Dechlorination ofTrichloroethene. 209th National Meeting, Anaheim, Calif. AmericanChemical Society, 35( 1):728-73 1.

8-5
Lieser, K. H., and C. H. Bauscher. 1987. Technetium in the hydrosphere and inthe geosphere: 1. Chemistry of technetium and iron in natural waters andinfluence of the redox potential on the sorption of technetium. RadiochimicaActa, 42:205-2 13.
Mackenzie, P. D., T. M. Sivavec, and D. P. Homey. 1997. Extending HydraulicLifetime of Iron Walls. Presented at International Containment TechnologyConference and Exhibition, St. Petersburg, Florida, February 9 - 12.
Mallat, T., Z. Bodnar, and J. Petro. 1991. Reduction by dissolving bimetals.Tetrahedron, 47~441-446.
Marques, C. A., M. Selva, and P. Tundo. 1994. Facile hydrodehalogenation withH-2 and Pd/C catalyst under multiphase conditions. 2. Selectivity andkinetics. J. Org. Chem., 59(14):3830 - 3837.
Matheson, L. J. and P. G. Tratnyek. 1994. Reductive dehalogenation of chlori-nated methanes by iron metal. Environmental Science and Technology,28:2045-2053.
D
*Meyer, R. E., W. D. Arnold, and F. I. Case. 1987. The Solubility of Electra-
deposited Tc(’ Oxides. ORNL-6374. Oak Ridge National Laboratory, OakRidge, Tennessee.
Muck, M. T., P. M. Kearl, R. L. Siegrist, N. E. Korte, R. M. Schlosser, M. E.Mumby, D.T. Davenport, D. W. Greene, D. A. Pickering, C. A. Muhr, and J.Strong-Gunderson. 1996. Pilot Test of a Horizontal Well RecirculationSystem at the Clean Test Site, Portsmouth Gaseous D@usion Plant. OakRidge National Laboratory, Grand Junction, Colorado.
Muck, M. T., N. E. Korte, L. Liang, D. Marsh, J. L. Zutman, and J. Clausen.1995. Technology Screening Report for Tc Removalfiom GroundwaterPortsmouth Uranium Enrichment Plant, Piketon, Ohio. Oak Ridge NationalLaboratory, Grand Junction, Colorado.
Mufiikian, R., K. Nebesny, Q. Fernando, and N. Korte. 1996. X-ray photo-electron spectra of the palladium-iron bimetallic surface used for the rapiddechlorination of chlorinated organic environmental contaminants.Environmental Science & Technology, 30(12)3593-3596.
Muftikian, R., Q. Fernando; and N. E. Korte. 1995. A method for the rapiddechlorination of low molecular weight chlorinated hydrocarbons in water.Water Research 24( 10):2434-2439.
8-6
O’Hannesin et al. 1995. TCE degradation in groundwater using zero-valent iron.Presented Before the Division of Environmental Chemistry, AmericanChemical Society, September 17 - 20, Atlanta, Georgia.
O’Hannesin, S. F. 1993. A Field Demonstration of a Permeable Reaction Wallfor the In Situ Abiotic Degradation of Halogenated Aiiphatic OrganicCompounds. MS. Thesis, University of Waterloo, Ontario, Canada.
O’Hannesin, S. F. And R. W. Gillham. 1992. A permeable reaction wall for insitu degradation of halogenated organic compounds. 45th CanadianGeotechnical Society Conference. Toronto, Ontario, Canada.
Orth, W. S., and R. W. Gillham. 1995. Chloride and carbon mass balances foriron-enhanced degradation of trichloroethene. Presented before the Divisionof Environmental Chemistry, American Chemical Society, April 2-7,Anaheim, California.
Puls, R. W., R. M. Powell, and C. J. Paul. 1995. In Situ Remediation of GroundWater Contaminated with Chromate and Chlorinated Solvents Using Zero-valent Iron: A Field Study. 209th National Meeting, Anaheim, Calif.American Chemical Society. 35(1):788.
a
x
Riley, R. G., J. M. Zachara, and F. J. Wobber. 1992. Chemical Contaminants onDOE Lands and Selection of Contaminant Mixtures for Subsurface ScienceResearch. DOE/ER-0547T.
.
R
Sawyer, D. T., and J. L. Roberts. 1974. Experimental Electrochemistry forChemists, John Wiley and Sons, New York, New York, p. 61.
Schulte, E. H., and P. Scoppa. 1987. Sources and behavior of technetium in theenvironment. Science of the Total Environment, 64: 163-l 79.
Siegrist, R. L., 0. R. West, C. K. Bayne, R. A. Jenkins, and C. A. Muhr. 1997.Anintegrated study of sampling and measurement error for soil VOCs.Manuscript in preparation.
Siegrist, R. L., M. I. Morris, 0. R. West, D. D. Gates, D. A. Pickering, R. A.Jenkins, T. J. Mitchell, D. W. Greene, C. A. Muhr, S. Herbes, T. M. Gilliam,H. L. Jennings, A. J. Lucero, J. L. Zutman, and others. 1993. Full-Scale FieldDemonstration and Testing of Physicochemical Processes for In SituTreatment of Soil Contaminated by Volatile Organic Compounds in thePresence of Radio-active Substances. Presented at Waste Management ‘93,Tucson, Arizona, February 28 - March 4,1993.
Y
8-7
Sivavec, T. M., P. D. Mackenzie, D. P. Homey and S. S. Baghel. 1997. Redox-Active Media for Permeable Reactive Barriers. Presented at InternationalContainment Technology Conference and Exhibition, St. Petersburg, Florida,February 9 - 12.
Sivavec, T. M. and D. P. Homey. 1995. Reductive Dechlorination of ChlorinatedEthenes by Iron Metal. Presented before the Division of EnvironmentalChemistry, American Chemical Society. Anaheim, California, April 2-7,1995.
Vogan, J. L., J. K. Seaberg, B. Gnabasik, and S. F. O’Hannesin. 1994.Evaluation of in Situ Groundwater Remediation by Metal EnhancedReductive Dehalogenation-laboratory Column Studies and Groundwater FlowModeling. 87th annual meeting, Air & Waste Management, Cincinnati, Ohio.
Walton, F. B., J. Paquette, J. P. M. Ross, and W. E. Lawrence. 1986. Tc(IV) andTc(VII) interactions with iron oxyhydroxides. N&ear and ChemicaE WasteManagement, 6:121-126.
West, 0. R., L. Liang, W. L. Holden, N. E. Korte, Q. Fernando, and J. L. Clausen.1997. Degradation of Polychlorinated Biphenyls (PCBs) Using PalladizedIron. ORNL/TM-132 17. Oak Ridge National Laboratory, Oak Ridge,Tennessee.
West, 0. R., R. L. Siegrist, T. J. Mitchell, and R. A. Jenkins. 1995. Measurementerror and spatial variability effects on characterization of volatile organics inthe subsurface. Environmental Science and Technology, 29(3):647.
Wildung R. E., T. R. Garland, K. M. McFadden, and C. E. Cowan. 1986.Technetium Sorption in Surface Soils. In Technetium in the Environment, G.Desmet and C. Myttenaere, eds., 115-129, Elsevier Applied SciencePublishers.
Wildung, R. E., K. M. McFadden, and T. R. Garland. 1979. Technetium sourcesand behavior in the environment. Journal of Environmental Quality, 8: 156-161.
YWildung, R. E., T. R. Garland, and D. A. Cataldo. 1977. Accumulation of
technetium by plants. Health Physics, 323 14-3 17.
Zhang, S. P. 1995. Dechlorination of polychlorinated biphenyls on soils and clayby electrolysis in a biocontinuous microemulsion. Environ. Sci. Technol.,29:1195.
8-8
Zhang, S. P.and J. F. Rusling. 1993. Dechlorination of polychlorinatedbiphenyls by electrochemical catalysis in a biocontinuous microemulsion.Environ. Sci. Technol., 27(7): 1375 - 1380.
b, 50.
P
z51.
I
52.
53.
54.
55.
56.3
il
INTERNAL DISTRIBUTION
1. B. Berven 22. R. Mann2. J. H. Cushman 23-27. M. Muck3. T. Early 28. T. E. Myrick4. D. E. Fowler 29. D. E. Reichle5-9. B. Gu 30. C. Rightmire10. S. G. Hildebrand 3 l-33. R. Schlosser11. G. K. Jacobs 34. D. S. Shriner12. P. Kanciruk 35-39. R. Siegrist13. P. Kearl 40-42. J. Zutman14. C. Kendrick 43. Central Research Library15-19. N. Korte 44-46. ESD Library20. C. A. Little 47-48. Laboratory Records Dept.21. J. M. Loar 49. Laboratory Records, ORNL-RC
EXTERNAL DISTRIBUTION
F. Anderson, Lockheed Martin Energy Systems, Portsmouth Gaseous Diffusion Plant,3930 ‘US Route 23 S, Piketon, OH 45661
J. Baker, Environmental Protection Specialist, AlliedSignal, Inc., 2000 E. 95th Street,Kansas City, MO 6413 1
M. Broido, Director, Environmental Sciences Division, ER-74, U.S. Department ofEnergy, 19901 Germantown Road, Germantown, MD 20874
G. Budzin, Lockheed Martin Energy Systems, Portsmouth Gaseous Diffusion Plant, 3930US Route 23 S, Piketon, OH 45661
F. Bullock, Lockheed Martin Energy Systems, Portsmouth Gaseous Diffusion Plant, 3930US Route 23 S, Piketon, OH 45661
S. Chamberlain, U.S. Department of Energy, 19901 Germantown Rd.-CLOV,Germantown, MD 20874-1290
J. Clausen, Ogden Environmental & Energy Services, 239 Littleton Road, Suite lB,Westford, MA 01886
,, . ..,
ZVPDFETIKDIS
57. P. Cross, Lockheed Martin Energy Systems, Portsmouth Gaseous Diffusion Plant,3930 US Route 23 S, Piketon, OH 45661
58. E. G. Cumesty, ORNL Site Manager, U.S. Department of Energy, Oak Ridge NationalLaboratory, P.O. Box 2008, Oak Ridge, TN 3783 l-6269 s
59.
60.
K. Donnegan, Johnson-Matthey, 2001 Nolte Drive, West Deptford, NJ 08066
J. Douthitt, Lockheed Martin Energy Systems, Environmental Restoration and WasteManagement, 761 Veterans Ave., Kevil, KY 42053
61-65. Q. Fernando, Department of Chemistry, University of Arizona, Tucson, AZ 85710
66.
67.
D. G. Hager, Heritage Partners, 6030 N. Camino Esplendora, Tucson, AZ 85718
J. Harness, Program Manager, Environmental Technology Group, U.S. Department ofEnergy, Oak Ridge Operations, 55 Jefferson Street, Oak Ridge, TN 3783 1
68. R. Helferich, Cercona of America, Inc., 5911 Wolf Creek Pike, Dayton, OH 45428-2439
69-73. T. Houk, Technology Applications Program Manager, Lockheed Martin Energy Systems,
74.
75.
76.
77.
78.
79.
\
80.
Portsmouth Gaseous Diffusion Plant, 3930 US Route 23 S, Piketon, OH 45661
D. Kaback, Colorado Center for Environmental Management, 19th Street, Suite 2750,Denver, CO 80202
4
L. Kantner, U.S. Department of Energy, Portsmouth Gaseous Diffusion Plant, 3930 USRoute 23 S, Piketon, OH. 45661
M. Koemer, Research Corporation Technologies, 101 N. Wilmar Road, Suite 600,Tucson, AZ 85711
L. Liang, Department of Earth Sciences, University of Wales, Cardiff, P.O. Box 914,Cardiff, U.K.
M. C. MacCracken, Director, Office of the U.S. Global Change Research Program, CodeYS-1,300 E Street, SW, Washington, D.C. 20546
R. Miller, Lockheed Martin Energy Systems, Environmental Restoration and WasteManagement, 761 Veterans Ave., Kevil, KY 42053
Office of Assistant Manager for Energy Research and Development, U.S. Department ofEnergy Oak Ridge Operations, P. 0. Box 2001, Oak Ridge, TN 3783 l-8600
8 l-82. Office of Scientific and Technical Information, P. 0. Box 62, Oak Ridge, TN 3783 1
ZVPDFETM.DIS
83. A. Patrinos, Associate Director, Office of Health and Environmental Research, ER-70,U.S. Department of Energy, 19901 Germantown Road, Germantown, MD 20874
d84. E. Phillips, U.S. Department of Energy , Oak Ridge Operations, 55 Jefferson Street, Oak
Ridge, TN 3783 1.
P 85. J. Powers, U.S. Department of Energy, Portsmouth Gaseous Diffusion Plant, 3930 USRoute 23 S, Piketon, OH 45661
86. J. Sheppard, Deputy Site Manager, U.S. Department of Energy, Portsmouth GaseousDifIixsion Plant, 3930 US Route 23. S, Piketon, OH 45661
ZVPDFETM.DIS

4