Embed Size (px)
Citation preview

Archives of Hydro-Engineering and Environmental MechanicsVol. 59 (2012), No. 3–4, pp. 137–153DOI: 10.2478/heem-2013-0008-y© IBW PAN, ISSN 1231–3726
On Flow-Altering Countermeasures for Scour at Vertical-WallAbutment
Alessio Radice∗, Oskars Lauva∗∗
∗ Assistant Professor, Dept. I.I.A.R., Politecnico di Milano, Piazza Leonardo da Vinci, 32, 20133 Milano,Italy, Corresponding author, E-mail: [email protected]
∗∗ M.Sc. student in Heat, Gas and Water Technology, Faculty of Civil Engineering, Riga TechnicalUniversity, Azenes street 16/20, Riga, LV-1048, Latvia
(Received April 03, 2012; revised October 10, 2012)
AbstractResults are presented for clear-water scour experiments at a vertical-wall abutment where theobstacle was modified with slots or roughening elements as flow-altering countermeasuresagainst the erosion process. The laboratory campaign comprehended an initial experiment withan unprotected obstacle, two experiments with slots above and beneath the non-scoured bedlevel, respectively, and one experiment with a roughened abutment. The repeatability of theexperiments was checked and found satisfactory. The measured data set consisted of (i) scourdepth with time; (ii) geometry of the erosion hole; and (iii) sediment motion pattern at severalevolution stages of the process. A novel feature of the work was the attempt to combine evi-dence on the scour depth and that on sediment motion so as to shed light on the mechanismof scour reduction by the countermeasures tested. It is argued that this strategy might furnishguidelines for future extensive investigations of scour countermeasures, aimed at finding opti-mal design solutions.
Key words: local scour, abutment, process dynamics, flow-altering countermeasures, sedi-ment transport
Notation
b – abutment length,B – duct width,C – areal concentration of sediments in motion,d – sediment size,ds – maximum scour depth,g – acceleration due to gravity,h – flow height,Q – water discharge,Qc – threshold value of water discharge,
138 A. Radice, O. Lauva
qs – sediment transport rate per unit width (component along theflow direction),
qs – sediment transport rate per unit width (vector),T – time of experiment,us – sediment velocity (vector),Wdownstream – volume of the scour hole downstream of the abutment,Wtotal = Wupstream + Wdownstream,Wupstream – volume of the scour hole upstream of the abutment,x – longitudinal coordinate,y – transverse coordinate,z – elevation above non-scoured bed level,∆ = (ρg − ρ)/ρ,φ – Shields number,φc – threshold value of the Shields number,Φ – dimensionless sediment transport rate per unit width,ρ – water density,ρg – sediment density.
1. Introduction
One of the major causes of bridge failure or collapse is local scour, which is dueto a three-dimensional, vortical flow system induced by the structures’ interceptionof the river flow. In recent years, extensive research (see, for reviews, Melville andColeman 2000, Lagasse et al 2001) has been aimed at finding methods to efficientlyreduce the expected scour levels at both piers and abutments, the latter being withinthe scope of this work.
Scour countermeasures are typically divided into (i) bed-armoring devices and (ii)flow-altering devices. The former increase the resistance of the river bed and includeriprap blocks or similar tools (recent examples for abutments include Melville et al2006a and 2006b, Korkut et al 2007, Cardoso and Fael 2009, Sui et al 2010). The latter(examples for pier protection are given when they are not available for abutments) re-duce the strength of the turbulent flow field and include collars and/or slots (e.g., Dar-gahi 1990, Chiew 1992, Kumar et al 1999, Zarrati et al 2004, Heidarpour et al 2010),vanes (e.g., Johnson et al 2001, Li et al 2006), sacrificial piles (Melville and Hadfield1999, Haque et al 2007), structure threading (Dey et al 2006), and sills (e.g., Chiewand Lim 2003, Grimaldi et al 2009). In some cases, combinations of bed-armoringand flow-altering devices have been proposed (e.g., Mashahir et al 2010, Zarrati et al2010). In general, studies on scour countermeasures have involved extensive labora-tory campaigns aimed at finding configurations for which sufficient reductions in thescour depth could be obtained.
The experiments documented in this manuscript dealt with flow-altering coun-termeasures for bridge abutments, a field scarcely covered in the previous literature.

On Flow-Altering Countermeasures for Scour at Vertical-Wall Abutment 139
A distinctive feature of this study was the attention paid to the mechanisms of the scourprocess at protected obstacles. The purpose was not to propose optimal engineeringsolutions, which would have required much more extensive experimental campaigns.The experiments presented here were rather meant to clarify the functioning of se-lected devices and thus to provide guidance for further experimental campaigns.
2. Experiments
A 5.8 m long, pressurized, transparent duct with a rectangular cross section (widthB = 40 cm and height h = 16 cm) was used for the experimental tests. The lastpart of the duct was a 2 m long recess section filled with loose sediments. Thesewere simulated with uniform circular PVC cylinders, which were used instead ofspheres because this is the shape in which PVC particles are typically produced assemi-manufactured materials for several industrial applications. The particle shapeshould have only a marginal influence on the results documented in the following.The characteristic size of the grains, however, was determined as the diameter ofa sphere having the same volume as the PVC cylinder. This size was 3.6 mm, andin the following will be referred to as d. The specific gravity of the sediment parti-cles was ∆ = (ρg − ρ)/ρ = 0.43, with ρg and ρ being the densities of PVC and water,respectively. The same sediments were glued onto the bottom of the remaining partof the duct to ensure homogeneity of the bed roughness.
The vertical-wall abutment model used here was a plate of length b = 100 mm.Given the width of the experimental channel, the contraction ratio resulted as b/B =
0.25. The experiments documented in the following might thus be affected by flowconstriction, but at least two considerations could be made in this respect: (i) the effectof the contraction ratio for vertical-wall abutments was specifically addressed by Bal-lio et al (2009), who found that the scour expectable for b/B = 0.25 was less than 1.10times that for b/B ≤ 0.10 (condition considered unaffected by contraction), except forthe very beginning of the experiments (corresponding to ds/bh0.5 ≤ 1, with ds as themaximum scour depth); (ii) however, the study presented here involved the compar-ison of scour depths obtained for abutments of the same length, so the contractionratio was always kept the same.
The reference system used throughout the analysis involved the x axis aligned withthe main flow, the y axis from the left to the right wall of the duct, and the z axis aselevation above the non-scoured bed level. The plan coordinates of the abutment nosewere set at x = 1, 000 mm, y = 100 mm.
As mentioned, only flow-altering countermeasures are within the scope of thisstudy (a very preliminary documentation for a bed-armoring device applied to thepresent abutment can be found in Radice 2010). Therefore, the experimental campaigncomprehended the following four configurations: (U) unprotected abutment (that wasactually a repetition of an experiment performed by Radice et al 2009b and furtheranalyzed by Radice et al 2010); (SA) abutment with a slot above the non-scoured bed

140 A. Radice, O. Lauva
level; (SB) abutment with a slot beneath the non-scoured bed level; (R) roughenedabutment. Fig. 1 shows a sketch of the four abutments. In both SA and SB tests, thedimension of the slot was 30 × 80 mm. The position of the slot was such that thedistance between the non-scoured bed level and the edge of the slot was 40 mm inboth cases (i.e. the bottom edge for SA and the top edge for SB). In the R test, thesize of the roughening elements and the spacing between them were 10 and 30 mm,respectively.
Fig. 1. The abutments used in the four experiments: unprotected (U), with slot above bed level(SA), with slot beneath bed level (SB), roughened (R). All abutments were placed at the leftside of the duct. The dashed line represents the trace of the non-scoured sediment level. Theflow direction, coordinate system and measuring points for the scour depth indicated in the
sketch for the U abutment are valid also for the others
The threshold water discharge for incipient particle motion was experimentallydetermined by Radice and Ballio (2008). It is well known that the definition of the crit-ical condition is not straightforward (see, for example, Buffington and Montgomery1997). Radice and Ballio (2008) identified the condition of incipient particle motionwith Φ = qs/
(g × ∆ × d3
)0.5= 6 × 10⁻⁵, where Φ and qs are dimensionless and di-
mensional sediment transport rates per unit width, respectively, and g is the accelera-tion due to gravity. The chosen sediment transport rate corresponds to φ/φc = 1.01(φ is the Shields (1936) number and φc is its threshold value) if the equation ofMeyer-Peter and Muller (1948) and φc = 0.04 are used. The water discharge corre-sponding to the critical conditions was Qc = 19.0 l/s.
The scour experiments documented in the following were carried out with a dis-charge Q = 18.5 l/s and were thus clear-water, near-critical scour experiments. Beforethe start of a test, the duct was slowly filled with water, and a discharge lower than 7.0l/s was established to prevent anticipated scour. The discharge was then progressivelyincreased up to the desired value (the transient was monitored through a magneticflowmeter and typically lasted less than 1 minute).

On Flow-Altering Countermeasures for Scour at Vertical-Wall Abutment 141
Each test was performed twice, with the first and second runs being devoted tothe measurement of scour and sediment motion, respectively. During the first runs, thescour depth was frequently measured upstream of the abutment nose (nose measuringpoint at x = 990 mm, y = 100 mm) and near the duct wall (wall measuring pointat x = 990 mm, y = 0). For the former measurement, a laser sensor positioned ona support above the duct lid and capable of measuring through the lid was used. Themeasurement at the wall point was instead made with a ruler attached to the lateralwall of the duct. At some evolution stages, the discharge was decreased to stop theprocess temporarily, and surveys were made of several transverse and longitudinalsections of the scour hole. A temporary stop and restart of the experiment did notcause significant distortions to the measured temporal trend of the scour depth eventhough the ‘freezed’ geometry of the scour hole may have been slightly different fromthat for the phenomenon in progress.
During the second runs, the motion of the sediments on the bottom of the holewas filmed at several evolution stages, using a motion camera with a resolution of1, 024 × 800 pixel and the frame rate set to 50 Hz. In addition, scour depth values weretaken to check test repeatability in comparison with the other runs. The experimentswere filmed from above, and the planar focus area was approximately 250 × 200 mm2.Sediment motion was measured by the method of Radice et al (2006). The sedimentkinematics was quantified through the areal concentration of moving sediments Cand the vector particle velocity us, the two quantities being related to the vector soliddischarge per unit width (qs) as qs = C × us × d. The concentration of moving parti-cles was measured through image subtraction and following proper image filter. Thesediment velocity was measured by Particle Image Velocimetry, using interrogationareas with a side of 2 cm and a maximum measurable velocity of 20 cm/s. Sincethe experiments were filmed from above and no projection of velocity was made, themeasurement did not include the vertical motion of the particles.
The experimental configuration used here was different from those typically ap-plied for scour analyses for two reasons, namely (i) the use of lightweight materialand (ii) the covered flow condition. Radice et al (2009a and 2009b) addressed theseissues in detail. The key points of the referenced discussions are sketched here. Thelow density of the sediments is accounted for in the estimation of the threshold con-ditions for incipient particle motion; thus, the experiments documented here were runat nearly threshold conditions like most of the literature ones with natural sand. Thepressure flow changes the features of the near-obstacle flow field because a secondprincipal vortex is created by the separation of the boundary layer at the duct lid, butinterference between the two principal vortices progressively decreases because thebottom one sinks into the scour hole. Another difference is that the rise of the watersurface upstream of the pier is prevented, but such rise may be expected to be modestfor the low Froude number used here. Finally, Radice et al (2009b) presented a com-parison between two abutment scour experiments, in which the runs were for naturalsediments with a free surface and lightweight sediments with covered flow, respec-

142 A. Radice, O. Lauva
tively. Once a proper dimensionless comparison was made, the difference between thetwo experiments turned out to be a decreasing function of the run time and was lowerthan 15% for the advanced stages of the process, corresponding to a range typicallyconsidered more than acceptable for scour predictions. It is therefore proposed herethat the results shown, though strictly representative of scour in covered flow, mayhave equal applicability for scour with a free surface. The reader is redirected to thereferenced works for further support to the last statement.
3. Results
3.1. Scour Depth
The temporal evolution of the scour depth at the two measuring points upstream of theabutment is depicted in Fig. 2 for all the experiments performed. For the unprotectedabutment (U) the scour depth was initially larger at the nose, but it prevailed at thewall for T > 4 × 10³ s. The experiment, when compared with the one performed byRadice et al (2009b) (not shown here), proved a good repeatability of the process. Forthe evaluation of the performance of the tested countermeasures, the scour trends atthe abutment nose and at the duct wall were considered separately. In general, noneof the countermeasures caused an evident variation of the scour trend at the abutmentnose. However, the devices changed the time evolution of the scour depth at the lateralwall. This location deserves attention because it was the position of the maximumscour depth in the U test and, moreover, the scour at the junction between the walland the abutment would, in a real situation, affect the stability of the bank. Duringthe SA experiment (Fig. 2a) the slot reduced the scour depth throughout the entireduration of the run, with greater (and significant) effect obtained for time T > 103
s. It was hypothesized that the beneficial effect of the slot in the advanced stages ofthe process was mainly related to the interception of the downflow in front of theabutment. The SB test presented (Fig. 2b) a different behavior, with the scour depthat the wall growing very rapidly as soon as the slot had been exposed ds > 40 mm).After a hole of around 120 mm had been scoured (that is, when the bottom of the scourhole had approached the bottom of the slot), the trends for U and SB tests tended toconverge, and in the final part of the experiment (T > 4 × 10³ s) the slot appeared tohave negligible effect. This finding supported the interpretation that at the beginningof the process the slot acted as a preferential way for the sediments to be conveyedaway, whereas in the final stages this could not happen because the size of the slotwas small in comparison with that of the scour hole and the bottom of the slot wasmuch above the bottom of the hole. Finally, during the R test (Fig. 2c) the scour trendat the wall was initially close to that for the U test, but a reduction of scour could beobtained for T > 800 s. Thus, the roughening elements could not alter the flow fieldin the beginning of the scour process, but an effective change of the flow pattern wasinduced in the subsequent stages.

On Flow-Altering Countermeasures for Scour at Vertical-Wall Abutment 143
Fig. 2. Time evolution of the scour depth at the nose and wall measuring points: trend for theunprotected abutment compared with those for the protected ones: (a) SA, (b) SB, (c) R

144 A. Radice, O. Lauva
Fig. 3 depicts the transverse section of the scour hole 10 mm upstream of the abut-ment face and the longitudinal section 10 mm distant from the wall, as surveyed atdifferent times during all the experiments. The plots obviously confirm what is men-tioned above with reference to the scour trends at the nose and wall points. In addition,it is worth noting that the SB test presented largest scour depths in the downstreamportion of the scour hole, presumably due to a jet-like flow passing through the slotand impinging on the sediment bed.
The surveys of the transverse sections of the scour hole were used to compute itsvolume. The total volume of the hole (Wtotal henceforth) was split into the portionsupstream of the abutment (for x = 700 − 1, 000 mm, Wupstream) and downstream ofthe abutment (for x = 1, 000 − 1, 500 mm, Wdownstream). The temporal evolution ofthe scoured volumes is depicted in Fig. 4, from which it can be seen that the coun-termeasures, though reducing the scour depth in the proximity of the obstacle, didnot always reduce the volume of the scour depth. This result suggests that the flowfield was distorted and deviated away from the abutment, but kept a scouring potentialthat developed elsewhere. Such a conclusion is in qualitative agreement with previousliterature findings (e.g., Johnson et al 2001, Li et al 2006).
Some characteristic values of the scour depth and relative percentage reductionare reported in Tab. 1 for a general evaluation of countermeasure performance. A rel-atively small effect of the scour countermeasures on scour at the nose is representedby percentages, which are usually lower than 5% in absolute value. The poor perfor-mance of the SB configuration is also shown. Among the SA and the R configuration,the latter performed better, with scour reductions at the duct wall of around 15% inthe advanced stages of the process. A similar analysis for the scoured volumes (seeTab. 2) showed that in most cases the reduction was negative, that is, the hole volumewas larger in a protected test than in the unprotected one. For example, the R config-uration induced the previously documented reduction for the wall point but involvedan increase in the scour volume of around 5% in the final stage of the experiment. Inother words, it seemed that an increase in the hole volume would be the price to payfor a reduction in the scour depth at the wall point. In this respect, it may be arguedthat focusing attention on the region closest to the abutment or on the global scourvolume implies different perspectives, that is, the local stability of the obstacle or theamount of sediment leaving the river reach may be considered more or less importantdepending on various circumstances.
The obtained reductions in the scour depth were compared with values docu-mented in the literature. For example, Chiew (1992) used slots as protections forcircular piers and obtained scour reductions of up to 30%, but only using slots witha height equal to the water depth. Actually, it may be argued that piers with long slotstend to become similar to separate piles (which have also been proposed as scourcountermeasures, e.g., Vittal el al 1994). However, for ratios of the slot height to thepier width similar to those used in the present study, Chiew (1992) obtained scourreductions similar to those found here. Furthermore, the roughened abutment con-

On Flow-Altering Countermeasures for Scour at Vertical-Wall Abutment 145
Fig. 3. Geometry of the scour hole represented through the transverse section 10 mm upstreamof the abutment (left) and the longitudinal section 10 mm away from the lateral wall of theduct (right). Experimental times of survey: (a) 3,600 s; (b) 10,800 s; (c) 25,200 s; (d) 57,600
s. Dashed lines identify the vertical-wall abutment

146 A. Radice, O. Lauva
Fig. 4. Temporal evolution of the scoured volume for the experimental tests. Wupstream andWdownstream represent the volumes of the portions of the hole upstream and downstream of the
abutment, respectively. Wtotal is the sum of the previous two contributions
Table 1. Scour depths (mm) and scour reduction (%) obtained in the tests with the protectedabutment in comparison with the unprotected one
Time 180 s 3,600 s 10,800 s 25,200 s 57,600 sTest U Scour nose 115 193 209 219 245
Scour wall 74 195 223 246 269Test SA Scour nose 115 188 209 230 261
Scour wall 58 168 198 235 258% reduction nose 0.0 2.6 0.0 −5.0 −6.5% reduction wall 21.6 13.8 11.2 4.5 4.1
Test SB Scour nose 108 183 204 225 251Scour wall 104 200 223 246 261% reduction nose 6.1 5.2 2.4 −2.7 −2.4% reduction wall −40.5 −2.6 0.0 0.0 3.0
Test R Scour nose 118 188 199 217 232Scour wall 66 165 180 211 231% reduction nose −2.6 2.6 4.8 0.9 5.3% reduction wall 10.8 15.4 19.3 14.2 14.1
sidered here was similar to the threaded pier proposed by Dey et al (2006). Theyobtained scour reductions of up to 40%, but the ratio of the thread size to the obstaclesize was much larger than the analogous one for the roughening elements used here(0.33 instead of 0.10), and indeed the authors acknowledged that it was quite largecompared with technical possibilities.

On Flow-Altering Countermeasures for Scour at Vertical-Wall Abutment 147
Table 2. Scour volumes (106 mm3) and relative reduction (%) obtained in the tests with pro-tected abutment in comparison with the unprotected one
Time 3,600 s 10,800 s 25,200 s 57,600 sTest U Wupstream 6.3 8.8 10.5 12.5
Wdownstream 11.7 16.1 19.2 23.8Wtotal 18.1 24.9 29.7 36.3
Test SA Wupstream 6.2 8.2 10.2 13.0Wdownstream 10.5 14.5 19.4 25.1Wtotal 16.7 22.7 29.6 38.1% reduction upstream 2.1 7.2 2.9 −4.3% reduction downstream 10.6 9.8 −0.8 −5.5% reduction total 7.6 8.9 0.5 −5.1
Test SB Wupstream 6.6 8.4 10.4 12.4Wdownstream 12.9 16.5 21.5 26.0Wtotal 19.6 24.9 31.9 38.4% reduction upstream −4.4 4.6 0.8 0.4% reduction downstream −10.2 −2.6 −11.8 −9.4% reduction total −8.1 −0.1 −7.4 −6.0
Test R Wupstream 6.8 8.7 10.1 12.5Wdownstream 13.8 17.2 20.6 25.1Wtotal 20.6 25.9 30.8 37.5% reduction upstream −7.2 1.5 3.6 −0.1% reduction downstream −17.6 −7.1 −7.3 −5.4% reduction total −14.0 −4.1 −3.5 −3.6
3.2. Sediment Motion
Flow-altering countermeasures are designed and built to change the structure of thehydrodynamic pattern, which, in turn, triggers and controls the kinematics of the sedi-ments on the bottom of the scour hole. As a result, the sediment motion pattern is alsoexpected to undergo some modifications if a flow-altering countermeasure is installed.Here, a phenomenological analysis of the mechanisms induced by flow-altering coun-termeasures was made taking advantage of the measurement of sediment motiondescribed above. Motion patterns were represented by means of the contour linesof time-averaged sediment concentration (as an indicator of sediment activity) andmotion lines obtained from the time-averaged sediment velocity (as an indicator ofsediment direction). Arguments related to the possibility of time averaging withinan evolving process have been provided by Radice et al (2009b) on the basis of theconcept of scale separation between the characteristic times used for averaging andthose needed for a significant morphologic evolution of the scour hole to occur.
Fig. 5 shows the results obtained for the four experiments and the experimentaltime T = 180 s. The patterns for the upstream region of the hole (x < 1, 000 mm)were similar for the U and SA cases. For the SB case the motion of sediments pre-sented a significant component along the positive x direction, due to the slot beinga way for the sediments to pass through the obstacle. Also in the R case the backward

148 A. Radice, O. Lauva
sediment motion in the region upstream of the abutment nose (x = 950–1, 000 mm;y = 40–100 mm) was almost absent. In this case, since the backward motion of sed-iments is probably a footprint of the action of the principal vortex, it was concludedthat the roughening elements weakened the action of the vortex. The downstreampart of the hole presented some differences between various tests, mostly related tothe deformation of the recirculation region for the protected tests in comparison withthe U test.
Fig. 5. Spatial distribution of time-averaged sediment concentration (contour lines) and sedi-ment motion lines for experimental time T = 180 s. (a) case U, (b) SA, (c) SB, (d) R
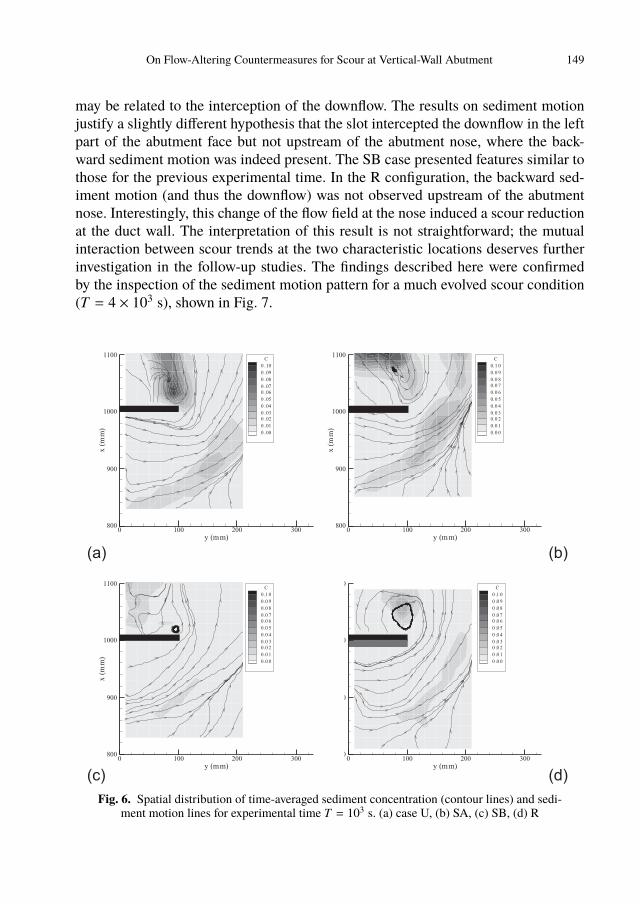
The sediment motion pattern for an intermediate scour stage (T = 103 s) is de-picted in Fig. 6. The U test presented two evident regions of reverse sediment mo-tion: upstream of the abutment nose (x = 950–1, 000 mm, y = 60–100 mm) and forx = 850–900 mm, y = 0–30 mm. These regions were in good agreement with thosedescribed by Radice et al (2009b), as a further proof of experiment repeatability. TheSA configuration did not present the backward sediment motion in the second region.It was hypothesized above that the scour mitigation induced by the SA configuration
On Flow-Altering Countermeasures for Scour at Vertical-Wall Abutment 149
may be related to the interception of the downflow. The results on sediment motionjustify a slightly different hypothesis that the slot intercepted the downflow in the leftpart of the abutment face but not upstream of the abutment nose, where the back-ward sediment motion was indeed present. The SB case presented features similar tothose for the previous experimental time. In the R configuration, the backward sed-iment motion (and thus the downflow) was not observed upstream of the abutmentnose. Interestingly, this change of the flow field at the nose induced a scour reductionat the duct wall. The interpretation of this result is not straightforward; the mutualinteraction between scour trends at the two characteristic locations deserves furtherinvestigation in the follow-up studies. The findings described here were confirmedby the inspection of the sediment motion pattern for a much evolved scour condition(T = 4 × 10³ s), shown in Fig. 7.
Fig. 6. Spatial distribution of time-averaged sediment concentration (contour lines) and sedi-ment motion lines for experimental time T = 103 s. (a) case U, (b) SA, (c) SB, (d) R

150 A. Radice, O. Lauva
Fig. 7. Spatial distribution of time-averaged sediment concentration (contour lines) and sedi-ment motion lines for experimental time T = 4 × 10³ s. (a) case U, (b) SA, (c) SB, (d) R
A summary of the above evidence was given as follows. Local scour results fromthe action of the three-dimensional flow field. Kwan and Melville (1994) reporteda general understanding of the process as initiated by the accelerating flow aroundthe structure and developed by the vortex structure. Slots attempt to act on both flowcontraction and the downflow. However, it was shown that the downflow was only par-tially intercepted in the experiments documented here. Roughening elements, thoughobviously not reducing the contraction ratio, acted as inhibitors of the downflow andalso reduced it upstream of the entire abutment face, thus mitigating the scour depthat the wall. The SB configuration was the least effective, since the presence of the slotreduced the distance that the sediments entrained close to the wall had to travel topass downstream of the abutment. None of the countermeasures managed to inhibitthe flow components responsible for scour at the nose.
It is acknowledged that the results proposed in the present study are obviouslyinsufficient for optimal countermeasure design, which should be guided by more ex-

On Flow-Altering Countermeasures for Scour at Vertical-Wall Abutment 151
tensive laboratory and field experimentation that was beyond the scope of this work.On the other hand, the analysis presented above shows that it is possible to interpretthe performance of scour countermeasures by observing their effect on the sedimentmotion. This finding might be helpful in devising more extensive experimental cam-paigns.
4. Conclusions
In this manuscript the use of flow-altering scour countermeasures at vertical-wallabutments was explored. A distinctive feature of the approach was the observationof the phenomenological aspects of the scour process at protected abutments throughthe analysis of the motion of sediment particles within the scour hole.
A preliminary experimental campaign was run, analyzing the scour process at anunprotected abutment and at abutments protected with slots or roughening elements.The scour reductions obtained were consistent with those documented in the literaturefor similar conditions. However, the aim of the experiments was not to devise optimalengineering criteria to be used for countermeasure designing, but rather to interpretthe working principles of such devices.
The analysis of the sediment motion pattern and of the temporal trend of the scourdepth at the abutment nose and in the corner region made it possible to suggest aninterpretation of the process. In particular, it was explained how countermeasuressuch as those tested here may act on flow components. Hypotheses on the workingprinciples based on the measurement of the scour depth could be corroborated or up-dated by results from the measurement of the sediment motion. The phenomenologi-cal indications obtained in this study may be used for guidance in devising extensiveexperimental campaigns aimed at finding specific technical solutions.
Acknowledgments
The experimental campaign documented here was performed during an internship ofthe second author at the Politecnico di Milano. Financial support from the Erasmusscholarship fund at Riga Technical University is gratefully acknowledged. This re-search was also partially supported by the Italian Ministry of University and Researchunder the PRIN Research Program.
ReferencesBallio F., Teruzzi A., Radice A. (2009) Constriction effects in clear-water scour at abutments, Journal
of Hydraulic Engineering, 135 (2), 140–145.Buffington J. M., Montgomery D. R. (1997) A systematic analysis of eight decades of incipient motion
studies, with special reference to gravel-bedded rivers, Water Resources Research, 33, 1993–2029.Cardoso A. H., Fael C. M. S. (2009) Protecting vertical-wall abutments with riprap mattresses, Journal
of Hydraulic Engineering, 135 (6), 457–465.

152 A. Radice, O. Lauva
Chiew Y. M. (1992) Scour protection at bridge piers, Journal of Hydraulic Engineering, 118 (9),1260–1269.
Chiew Y. M., Lim S. Y. (2003) Protection of bridge piers using a sacrificial sill, Proc. Institution of CivilEngineers, Water Maritime and Energy, 156 (1), 53–62.
Dargahi B. (1990) Controlling mechanism of local scouring, Journal of Hydraulic Engineering, 116(10), 1197–1214.
Dey S., Sumer B. M., Fredsøe J. (2006) Control of scour at vertical circular piles under waves andcurrent, Journal of Hydraulic Engineering, 132 (3), 270–279.
Grimaldi C., Gaudio R., Calomino F., Cardoso A. H. (2009) Control of scour at bridge piers by a down-stream bed sill, Journal of Hydraulic Engineering, 135 (1), 13–21.
Haque M. A., Rahman M., Islam G. M. T., Hussain M. A. (2007) Scour mitigation at bridge piers usingsacrificial piles, International Journal of Sediment Research, 22 (1), 49–59.
Heidarpour M., Afzalimehr H., Izanidia E. (2010) Reduction of local scour around bridge pier groupsusing collars, International Journal of Sediment Research, 25 (4), 411–422.
Johnson P. A., Hey R. D., Tessier M., Rosgen D. L. (2001) Use of vanes for control of scour at verticalwall abutments, Journal of Hydraulic Engineering, 127 (9), 772–778.
Korkut R., Martinez E. J., Morales R., Ettema R., Barkdoll B. (2007) Geobag performance as scourcountermeasure for bridge abutments, Journal of Hydraulic Engineering, 133 (4), 431–439.
Kumar V., Ranga Raju K. G., Vittal N. (1999) Reduction of local scour around bridge piers using slotsand collars, Journal of Hydraulic Engineering, 125 (12), 1302–1305.
Kwan R. T. F., Melville B. W. (1994) Local scour and flow measurements at bridge abutments, Journalof Hydraulic Research, 32 (5), 661–673.
Lagasse P. F., Zevenbergen L. W., Schall J. D., Clopper P. E. (2001) Bridge scour and stream instabilitycountermeasures, Federal Highway Administration, FHWA NHI 01-003, HEC-23.
Li H., Barkdoll B. D., Kuhnle R., Alonso C. (2006) Parallel walls as an abutment scour countermeasure,Journal of Hydraulic Engineering, 132 (5), 510–520.
Mashahir M. B., Zarrati A. R., Mokallaf E. (2010) Application of riprap and collar to prevent scouringaround rectangular bridge piers, Journal of Hydraulic Engineering, 136 (3), 183–187.
Melville B. W., Coleman S. E. (2000) Bridge scour, Water Resources Publications: Highlands Ranch,Colorado, USA.
Melville B. W., Hadfield A. C. (1999) Use of sacrificial piles as pier scour countermeasures, Journal ofHydraulic Engineering, 125 (11), 1221–1224.
Melville B. W., van Ballegooy S., Coleman S., Barkdoll B. (2006a) Countermeasure toe protection atspill-through abutments, Journal of Hydraulic Engineering, 132 (3), 235–245.
Melville B. W., van Ballegooy S., Coleman S., Barkdoll B. (2006b) Scour countermeasures forwing-wall abutments, Journal of Hydraulic Engineering, 132 (6), 563–574.
Meyer-Peter E., Muller R. (1948) Formulas for bed-load transport, Proc. of the II Meeting of IAHR,Stockholm, Sweden.
Radice A. (2010) Discussion of “Protecting vertical-wall abutments with riprap mattresses” by A.H.Cardoso and C.M.S. Fael, Journal of Hydraulic Engineering, 136 (10), 848–849.
Radice A., Ballio F. (2008) Double-average characteristics of sediment motion in one-dimensional bedload, Acta Geophysica, 56 (3), 654–668.
Radice A., Ballio F., Porta G. (2009a) Local scour at a trapezoidal abutment: Sediment motion pattern,Journal of Hydraulic Research, 47 (2), 250-262.
Radice A., Ballio F., Tran C. K. (2010) Gravity- and turbulence-dominated sediment motion inthe clear-water scour process at a vertical-wall abutment in pressurized flow, Archives ofHydro-Engineering and Environmental Mechanics, 57 (1–2), 3–19.

On Flow-Altering Countermeasures for Scour at Vertical-Wall Abutment 153
Radice A., Malavasi S., Ballio F. (2006) Solid transport measurements through image processing, Ex-periments in Fluids, 41, 721–734.
Radice A., Porta G., Franzetti S. (2009b) Analysis of the time-averaged properties of sediment motionin a local scour process, Water Resources Research, 45, W03401.
Shields A. (1936) Anwendung der Aehnlichkeitsmechanik und der Turbulenz Forschung auf dieGeschiebebewegung, Mitt. der Preussische Versuchanstalt fur Wasserbau und Schiffbau, Tech.Hochsch., Berlin, Germany, 26.
Sui J., Afzalimehr H., Samani A. K., Maherani M. (2010) Clear-water scour around semi-ellipticalabutments with armored beds, International Journal of Sediment Research, 25 (3), 233–245.
Vittal N., Kothyari U. C., Haghighat M. (1994) Clear-water scour around bridge pier group, Journal ofHydraulic Engineering, 120 (11), 1309–1318.
Zarrati A. R., Chamani M. R., Shafaie A., Latifi M. (2010) Scour countermeasures for cylindrical pierusing riprap and combination of collar and riprap, International Journal of Sediment Research, 25(3), 313–321.
Zarrati A. R., Gholami H., Mashahir M. B. (2004) Application of collar to control scouring aroundrectangular bridge piers, Journal of Hydraulic Research, 42 (1), 97–103.