Embed Size (px)
Citation preview

On the accuracy of van der Waals inclusive density-functional theory exchange-correlation functionals for ice at ambient and high pressuresBiswajit Santra, Jií Klimeš, Alexandre Tkatchenko, Dario Alfè, Ben Slater, Angelos Michaelides, Roberto Car,
and Matthias Scheffler Citation: The Journal of Chemical Physics 139, 154702 (2013); doi: 10.1063/1.4824481 View online: http://dx.doi.org/10.1063/1.4824481 View Table of Contents: http://scitation.aip.org/content/aip/journal/jcp/139/15?ver=pdfcov Published by the AIP Publishing Advertisement:
This article is copyrighted as indicated in the abstract. Reuse of AIP content is subject to the terms at: http://scitation.aip.org/termsconditions. Downloaded to IP:
128.112.123.238 On: Tue, 15 Oct 2013 21:24:11
THE JOURNAL OF CHEMICAL PHYSICS 139, 154702 (2013)
On the accuracy of van der Waals inclusive density-functional theoryexchange-correlation functionals for ice at ambient and high pressures
Biswajit Santra,1,2 Jirí Klimeš,3 Alexandre Tkatchenko,1 Dario Alfè,4,5 Ben Slater,6
Angelos Michaelides,4,6,a) Roberto Car,2 and Matthias Scheffler1
1Fritz-Haber-Institut der Max-Planck-Gesellschaft, Faradayweg 4-6, 14195 Berlin, Germany2Department of Chemistry, Princeton University, Princeton, New Jersey 08544, USA3Faculty of Physics and Center for Computational Materials Science, University of Vienna, Sensengasse 8/12,A-1090 Wien, Austria4London Centre for Nanotechnology, University College London, London WC1E6BT, United Kingdom5Department of Physics and Astronomy, University College London, London WC1E6BT, United Kingdom andDepartment of Earth Sciences, University College London, London WC1E6BT, United Kingdom6Department of Chemistry, University College London, London WC1E6BT, United Kingdom
(Received 11 July 2013; accepted 25 September 2013; published online 15 October 2013)
Density-functional theory (DFT) has been widely used to study water and ice for at least 20 years.However, the reliability of different DFT exchange-correlation (xc) functionals for water remains amatter of considerable debate. This is particularly true in light of the recent development of DFTbased methods that account for van der Waals (vdW) dispersion forces. Here, we report a detailedstudy with several xc functionals (semi-local, hybrid, and vdW inclusive approaches) on ice Ih andsix proton ordered phases of ice. Consistent with our previous study [B. Santra, J. Klimeš, D. Alfè,A. Tkatchenko, B. Slater, A. Michaelides, R. Car, and M. Scheffler, Phys. Rev. Lett. 107, 185701(2011)] which showed that vdW forces become increasingly important at high pressures, we findhere that all vdW inclusive methods considered improve the relative energies and transition pressuresof the high-pressure ice phases compared to those obtained with semi-local or hybrid xc functionals.However, we also find that significant discrepancies between experiment and the vdW inclusive ap-proaches remain in the cohesive properties of the various phases, causing certain phases to be absentfrom the phase diagram. Therefore, room for improvement in the description of water at ambientand high pressures remains and we suggest that because of the stern test the high pressure ice phasespose they should be used in future benchmark studies of simulation methods for water. © 2013 AIPPublishing LLC. [http://dx.doi.org/10.1063/1.4824481]
I. INTRODUCTION
Density-functional theory (DFT) is now widely used tostudy water and ice in a range of different environments,including, for example, bulk water, water at interfaces, andwater under confinement. Most DFT studies of water have in-volved the application of semi-local generalized gradient ap-proximations (GGA) for the exchange and correlation (xc) en-ergy. Whilst these studies have proved to be very useful inproviding insights into the structure and properties of water,there are persistent question marks over the quantitative ac-curacy of such xc functionals, in particular for the treatmentof condensed phase water which is held together by hydrogen(H) bonding and van der Waals (vdW) interactions. Over theyears this has prompted a number of benchmark studies fo-cused on gas phase water clusters,1–18 liquid water,19–44 andcrystalline phases of ice.45–64 While we currently have a rel-atively clear understanding about the performance of variousxc functionals for gas phase clusters, this is far from beingestablished for ice and liquid water. This is particularly truein light of recent work which has shown that vdW dispersionforces are important for the accurate description of differentproperties of water.45–51, 65–73
a)Electronic mail: [email protected]
Understanding the role of vdW forces in water has beengreatly helped by the emergence of various approaches whichaccount for vdW forces within the framework of DFT.74–83
In the last few years, many of the vdW inclusive DFT xcfunctionals have been used to investigate the effects of vdWon the structural, energetic, and vibrational properties of liq-uid water.65–73 Overall, with vdW inclusive xc functionalsthere are indeed improvements in certain calculated proper-ties of liquid water. For example, the first peak in the oxygen-oxygen radial distribution function is generally reduced andbrought into closer agreement with experiment. However, theaccuracy of the computed properties strongly depends on themethods chosen to incorporate vdW as well as the techni-cal details of the molecular dynamics simulations. There is,of course, also the challenge of accounting for quantum nu-clear effects, which is rarely done in ab initio studies of liquidwater.40, 41 However, in contrast to liquid water, the variouscrystalline phases of ice represent a relatively straightforwardset of structures against which DFT methods can be tested.Indeed there are at present 15 experimentally characterizedice phases with water molecules in a number of distinct ar-rangements, H bond networks, and densities.84–87 Many ofthe ice phases are complicated with disordered water arrange-ments (so-called “proton disordered”). However, some phases
0021-9606/2013/139(15)/154702/11/$30.00 © 2013 AIP Publishing LLC139, 154702-1
This article is copyrighted as indicated in the abstract. Reuse of AIP content is subject to the terms at: http://scitation.aip.org/termsconditions. Downloaded to IP:
128.112.123.238 On: Tue, 15 Oct 2013 21:24:11

154702-2 Santra et al. J. Chem. Phys. 139, 154702 (2013)
have relatively simple proton ordered arrangements of watermolecules, and it is these phases that are particularly suit-able as benchmarks. Furthermore, thanks to Whalley’s ex-trapolations of the experimental finite temperature and pres-sure phase coexistence lines to zero temperature, for some ofthese phases there are even estimates of the internal energydifferences,88 which makes theoretical benchmarks particu-larly straightforward and mitigates the need for expensive freeenergy calculations.
In an earlier study on ice we found that the effects ofvdW become increasingly important upon going from thelow- to the high-density phases and capturing this variationin the vdW energy is essential to get the transition pres-sures between the ice phases within an order of magnitudeof experiment.45 Here, we extend on the previous study sig-nificantly by reporting results on the accuracy of the co-hesive properties of individual phases of ice obtained froma wide range of vdW inclusive functionals. Also by look-ing at the enthalpies of ice as a function of pressure wehave obtained a more detailed picture of the stability rangeof each ice phase predicted from the different functionals.The approaches used here include: (i) vdWTS, which involvesan explicit summation of pairwise (two-body) vdW disper-sion interactions among all atom pairs using their respec-tive vdW C6 coefficients which are functionals of the elec-tron density;75 (ii) vdWMB, an extension of vdWTS that ac-counts for electrodynamic screening and many-body vdW in-teractions within the dipole approximation;89 and (iii) vari-ous functionals from the “vdW-DF” family.74, 76, 90 All vdW-DFs are calculated via a model dynamic response functionand long range pairwise approximations.74, 130 These variousvdW inclusive approaches have been reasonably successfulin modeling a wide variety of materials91–96 including differ-ent phases of water starting from clusters2, 76, 97 to condensedphases.45, 46, 67–69, 73 In this study, we find that all vdW inclu-sive functionals considered predict phase transition pressuresin much better agreement with experiment than the function-als which do not include vdW. However, the precise values
of the lattice constants and lattice energies are highly sensi-tive to the choice of vdW inclusive method. Moreover, noneof the functionals can simultaneously produce energetics andvolumes of the ice phases with high enough precision to yielda phase diagram that correctly captures all the phases foundin experiments.
In Sec. II details of the simulation methods are provided.This is followed by discussions of our results for the equi-librium lattice energies (Sec. III A), the equilibrium volumes(Sec. III B), enthalpies (Sec. III C), and a decomposition oftotal energies focusing on exchange and correlation energies(Sec. III D). Conclusions and a short perspective on futurework are given in Sec. IV.
II. SIMULATION DETAILS
We have computed and analyzed the equilibrium latticeenergies, volumes, and enthalpies of several ice phases. Thisincludes the ambient pressure phase of ice, ice Ih, and all theproton ordered high-pressure phases, namely, in order of in-creasing pressure, ice IX, II, XIII, XIV, XV, and VIII. Wehave focused on proton ordered phases because they are morestraightforward to model than the proton disordered phases.The initial structures used for the proton ordered phases havebeen obtained from experiment85, 98–102 and the unit cells usedare shown in Fig. 1. Proton disordered ice Ih is modeled withthe 12 water unit cell proposed by Hamann.54 The results ob-tained from the 12 molecule cell have also been compared toresults from a unit cell of 96 water molecules (Refs. 60 and103). These results reveal that the lattice energies obtainedfrom the 12 and 96 water molecule unit cells are within1 meV/H2O and the equilibrium volumes differ only by<0.01 Å3/H2O with PBE.104
The lattice energy per H2O (�E) of ice is obtained bysubtracting the total energy of N isolated H2O molecules(EH2O) from the total energy of the ice unit cell (EIce)
FIG. 1. Unit cells of the ice phases (Ih, IX, II, XIII, XIV, XV, and VIII) studied here. The ice Ih structure (96 water molecule) is obtained from Ref. 60 andall the proton ordered phases of ice are obtained from various scattering experiments.85, 98–102 The optimized coordinates of the ice structures are given in thesupplementary material.131
This article is copyrighted as indicated in the abstract. Reuse of AIP content is subject to the terms at: http://scitation.aip.org/termsconditions. Downloaded to IP:
128.112.123.238 On: Tue, 15 Oct 2013 21:24:11

154702-3 Santra et al. J. Chem. Phys. 139, 154702 (2013)
containing N molecules of H2O, i.e.,
�E = (EIce − N × EH2O)/N. (1)
At zero pressure the theoretical equilibrium lattice energiesand volumes are obtained by varying the lattice parametersisotropically within ±20% of the experimental values andfitting the resultant energy-volume curves to the Murnaghanequation of state.105 By isotropic variation we mean that theratios of the lattice parameters are kept fixed at the experi-mental value, which is a reasonable approximation that hasan insignificant influence on the computed properties. For ex-ample, performing a rigorous test on ice VIII by varying thec/a ratio of the lattice parameters provides changes of<0.5 meV/H2O and <0.02 Å3/H2O, respectively, in the equi-librium lattice energy and volume when compared to theresults obtained by fixing the c/a ratio at the experimentalvalue.106 Also previously it was shown that for ice Ih the equi-librium c/a ratio is very similar (within ∼0.4%) to the exper-imental value when calculated with various xc functionals.58
The properties of the various ice phases have been in-vestigated with seven functionals, representing a numberof different classes of functional. These include, PBE, awidely used GGA functional, and PBE0,107 a hybrid ex-change variant of PBE. Neither of these functionals accountfor vdW forces. We have also considered PBE+vdWTS andPBE0+vdWTS, vdW inclusive versions of PBE and PBE0,where the vdW interaction is calculated with the Tkatchenkoand Scheffler (TS) scheme.75 The xc energy (Exc) in thisscheme takes the form
Exc = EGGA/hybridx + (ELDA
c + EGGAc ) + ETS
vdW, (2)
where EGGA/hybridx is the PBE or PBE0 exchange, ELDA
c isthe local-density approximation (LDA) correlation, EGGA
c isthe PBE semi-local correlation correction, and ETS
vdW is thevdW energy in the TS scheme. In addition, we have em-ployed an extension of the vdWTS approach which takes intoaccount many-body (MB) dispersion and long-range electro-static screening.89 In this case ETS
vdW in Eq. (1) is replaced withMB dispersion energy terms and the xc functional is referredto as PBE0+vdWMB. Another approach to incorporate vdWwithin DFT is employed here, specifically the approach gen-erally referred to as “vdW-DF.”74 In this case the total xc en-ergy takes the form
Exc = EGGAx + ELDA
c + ENLc , (3)
where EGGAx is GGA exchange and ENL
c is the nonlocal cor-relation energy through which the vdW interactions are cap-tured. We have used three functionals from this categorywhich we refer to as revPBE-vdW,74 optPBE-vdW,76 andrPW86-vdW2.90 The difference between revPBE-vdW (orig-inally proposed in Ref. 74) and optPBE-vdW is in the ex-change functional only. The former employs revPBE108 ex-change, whereas the latter uses optPBE exchange76 which wasdeveloped by fitting interaction energies of the S22 data set.109
Typically optPBE exchange is less repulsive than revPBEat intermediate and short inter-atomic distances.76, 93 Com-pared to the above two functionals rPW86-vdW2 has a differ-ent exchange rPW86110 and a modified nonlocal correlation
functional.90 We should note that all three vdW-DF function-als utilize GGA exchange.
The calculations with PBE and PBE+vdWTS were per-formed with the all electron numeric atom-centered orbital(NAO) basis set code FHI-aims.111 Sufficiently large basissets (“tier2” for H and “tier3” for O) were employed to calcu-late total energies and to optimize structures. PBE0, revPBE-vdW, optPBE-vdW, and rPW86-vdW2 calculations weredone with the VASP code112, 113 with the hardest projector-augmented wave (PAW) pseudopotentials and a 1000 eVplane-wave basis set cut off. The ENL
c is calculated self-consistently with the efficient algorithm of Román-Pérez andSoler114 employing 30 interpolation points for the q0 func-tion with a saturation value qcut
0 = 10 a.u., as implementedby Klimeš et al. in VASP.93 These settings are found to bevery accurate and details of the implementation and tests per-formed for a variety of solids can be found in Ref. 93. For allthe ice structures the atoms are fully relaxed with all of the xcfunctionals (except with PBE0+vdWTS and PBE0+vdWMB)without any symmetry constraints until all forces are less than0.01 eV/Å. The energy-volume curves of each ice phase withPBE0+vdWTS and PBE0+vdWMB were produced by per-forming single point energy calculations on the PBE0 opti-mized geometries at different volumes. For the calculations ofany GGA exchange based functional the number of k pointsare chosen so that the spacing in the k point grid in each di-rection of reciprocal space is within 0.02 Å−1 to 0.04 Å−1 forall of the ice phases. For the hybrid functional (PBE0) calcu-lations the number of k points are doubled in each directioncompared to the GGA calculations, which provides total ener-gies converged to within 1 meV/H2O. With VASP the energyof the water monomer was calculated within a cubic cell oflength 20 Å.
III. RESULTS
In this section, we report how the above mentioned DFTxc functionals describe the different phases of ice by exam-ining equilibrium lattice energies, volumes at zero pressure,and the relative enthalpies of the various phases. Subsequentlywe report an analysis of the individual contributions from ex-change and correlation to the lattice energies.
A. Lattice energies at zero pressure
The lattice energy is one of the key characteristic quanti-ties of a solid and we use it here to evaluate the performanceand deficiencies of different xc functionals in describing ice.Previously most analysis of lattice energies concentrated onice Ih,47, 54, 58 however, recently we showed that studying iceIh alone is not enough to establish the general behavior of anxc functional over the entire phase diagram of water.45 Herewe have calculated the lattice energies of different ice phasesusing a wide variety of xc functionals and made comparisonswith experiments85, 88, 99, 101, 115 and diffusion quantum MonteCarlo (DMC)45 whenever possible (Table I). We note that theDFT and DMC lattice energies reported in Table I do notinclude nuclear zero-point energies (ZPEs) and are directlycomparable with the experimental lattice energies provided
This article is copyrighted as indicated in the abstract. Reuse of AIP content is subject to the terms at: http://scitation.aip.org/termsconditions. Downloaded to IP:
128.112.123.238 On: Tue, 15 Oct 2013 21:24:11

154702-4 Santra et al. J. Chem. Phys. 139, 154702 (2013)
TABLE I. Equilibrium lattice energies (cf. Eq. (1)) of different ice phases with various methods. The relative lattice energies of the high-pressure ice phaseswith respect to ice Ih are given in parenthesis. All energies are in meV/H2O.
Ih IX II XIII XIV XV VIII
Expt.a −610 (0) −606 (5) −609 (1) . . . . . . . . . −577 (33)DMCb −605 (0) . . . −609 (−4) . . . . . . . . . −575 (30)
PBE −636 (0) −587 (49) −567 (69) −556 (80) −543 (93) −526 (110) −459 (177)PBE0 −598 (0) −557 (41) −543 (55) −530 (67) −518 (80) −504 (94) −450 (148)
PBE+vdWTS −714 (0) −705 (9) −698 (16) −695 (19) −690 (24) −678 (36) −619 (95)PBE0+vdWTS −672 (0) −670 (2) −666 (6) −661 (11) −656 (16) −646 (26) −596 (76)PBE0+vdWMB −672 (0) −663 (9) −656 (16) −648 (22) −642 (30) −629 (43) −589 (83)
revPBE-vdW −559 (0) −563 (−4) −556 (3) −555 (4) −552 (7) −545 (14) −517 (42)optPBE-vdW −668 (0) −673 (−5) −667 (1) −666 (2) −664 (4) −656 (12) −630 (38)rPW86-vdW2 −619 (0) −621 (−2) −618 (1) −615 (4) −605 (14) −605 (14) −586 (33)
aReference 88.bThe DMC statistical error bar is ±5 meV/H2O (Ref. 45).
by Whalley,88 in which ZPE contributions were removed andthe energies were extrapolated to 0 K. In Fig. 2 the differencesin the calculated and experimental lattice energies are shownfor ice Ih, IX, II, and VIII for all the functionals considered.It can be seen that for the phases for which DMC data areavailable the agreement between DMC and experiment is ex-cellent, differing only by 5 meV/H2O at most, which is alsothe size of the DMC statistical errors.
We begin with the performance of functionals which donot account for vdW (PBE and PBE0) on the absolute valuesof the lattice energies. The behavior of PBE for ice Ih is wellknown, it overestimates the lattice energy: overestimations ofbetween 30 and 100 meV/H2O have been reported depend-ing on the computational set-up used (mainly the quality ofthe basis sets and pseudopotentials).46, 47, 60, 116 Here, using afull potential all-electron approach and very tightly convergedNAO basis sets, we find that PBE overestimates the lattice en-ergy of ice Ih by ∼26 meV/H2O (Fig. 2). This is in closeagreement with the results from highly converged PAW cal-culations reported in Ref. 58. Interestingly the established no-tion that PBE overestimates the lattice energies of ice does nothold for the high-density phases. For example, PBE exhibitsa ∼125 meV/H2O underestimation for the lattice energy ofice VIII. The story is somewhat similar for PBE0, the hybridvariant of PBE. PBE0 predicts a very good lattice energy forice Ih (only 15 meV/H2O less than experiment) but simulta-neously underestimates the lattice energy of the high-density
-80
-40
0
40
80
120
ΔEC
alc.
− Δ
EE
xpt. [
meV
/H2O
]
PBEPBE0
PBE+vdWTS
PBE0+vdWTS
PBE0+vdWMB
revPBE-vdWoptPBE-vdW
rPW86-vdW2DMC
Ih IX II VIII
Ove
r-bi
ndin
gU
nder
-bin
ding
FIG. 2. Differences in the lattice energies of ice calculated (�ECalc.) withvarious DFT functionals and DMC45 compared to experiment (�EExpt.). Zeroon the Y axis indicates perfect agreement with experiment.
ice phases. We believe that the behavior seen here for PBEand PBE0 is likely to apply to many other GGA and hybridxc functionals. For example, our calculations show that BLYPand revPBE GGA functionals underestimate the lattice energyof ice VIII by 246 meV/H2O and 316 meV/H2O, respectively.Similar findings have also been reported for B3LYP.49
In general we find that when vdW is accounted for thedifferences between the calculated and experimental latticeenergies are much less sensitive to the particular phases beingexamined (Fig. 2). Considering first the vdWTS scheme, withthe PBE+vdWTS and PBE0+vdWTS functionals the latticeenergies are on average ∼100 meV/H2O and ∼60 meV/H2O,respectively, too large compared to experiment. The smallererrors obtained from PBE0+vdWTS largely arise from thedifference between PBE and PBE0 since the vdW contribu-tions from these functionals obtained with the TS schemeare similar (to within 15 meV/H2O). The contributions fromvdW interactions beyond two-body vdWTS to lattice ener-gies are found to be small for the phases considered. Specif-ically, the PBE0+vdWMB approach reduces the error by7–17 meV/H2O for the high-density phases compared to thestandard PBE0+vdWTS. A noticeable exception to the con-sistent performance of vdWTS found for ice Ih, IX, and IIis the highest density ice VIII phase (by 40–50 meV/H2O[Fig. 2]). This inconsistency is largely due to the shortcom-ings of the damping function used in the vdWTS approach indescribing the interpenetrating H bond network in ice VIIIwhich has water molecules that do not form H bonds witheach other as close as 2.9 Å apart.
When the vdW-DF functionals are utilized the errorsare more consistent for the phases (Fig. 2). However, themagnitude and sign of the error varies considerably fromone functional to another, e.g., on average optPBE-vdW pro-duces too large (∼60 meV/H2O) and revPBE-vdW producestoo small (∼50 meV/H2O) lattice energies compared to ex-periment. The fact that revPBE-vdW underestimates the lat-tice energy is not a surprise and consistent with results ob-tained with this functional for small molecules and waterclusters.76, 90, 95, 97, 117 Previously reported lattice energies ofice Ih with revPBE-vdW are 30–35 meV/H2O larger thanwhat we obtain here. This is not a very substantial dif-ference and we suspect it is mostly down to differences
This article is copyrighted as indicated in the abstract. Reuse of AIP content is subject to the terms at: http://scitation.aip.org/termsconditions. Downloaded to IP:
128.112.123.238 On: Tue, 15 Oct 2013 21:24:11

154702-5 Santra et al. J. Chem. Phys. 139, 154702 (2013)
TABLE II. Comparisons of the calculated and experimental equilibrium volumes (Å3/H2O) of the various ice phases. MAE is the mean absolute error (%)and ME is the mean error (%) (averaged over all the ice phases) with respect to the experimental volumes. Errors with and without zero point vibration (ZPE)are shown. For the MAEs the positive sign indicates larger volumes and the negative sign indicates smaller volumes compared to experiment.
Without ZPE With ZPE
Ih IX II XIII XIV XV VIII MAE ME MAE ME
Expt. 32.05a 25.63b 24.97c 23.91d 23.12d 22.53e 20.09c . . . . . . . . . . . .DMCf 31.69 24.70 19.46 . . . . . . . . . . . .PBE 30.79 26.11 25.01 24.08 23.27 22.82 20.74 1.69 0.57 4.00 2.99PBE0 30.98 26.06 24.84 23.94 23.07 22.62 20.27 1.03 − 0.14 3.14g 2.32g
PBE+vdWTS 29.67 23.86 23.62 22.44 21.71 21.47 20.13 5.52 − 5.47 4.51 − 3.49PBE0+vdWTS 29.88 23.85 23.63 22.47 21.74 21.45 19.70 5.39 − 5.39 4.05g − 3.05g
PBE0+vdWMB 29.42 23.87 23.26 22.26 21.45 21.10 18.90 6.88 − 6.88 5.08g − 5.08g
revPBE-vdW 34.38 27.94 27.62 26.38 25.54 25.10 22.96 10.27 10.27 15.09 15.09optPBE-vdW 31.63 25.50 25.15 23.99 23.20 22.75 20.55 0.92 0.42 3.21 3.09rPW86-vdW2 33.69 26.65 26.35 25.07 24.24 23.74 21.27 5.09 5.09 8.22 8.22
a10 K, Ref. 115.b30 K, Ref. 99.c0 K, Ref. 88.d80 K, Ref. 101.e80 K, Ref. 85.fThe DMC statistical errors are ±0.01, ±0.20, and ±0.02 Å3/H2O, respectively, for ice Ih, II, and VIII (Ref. 45).gSee Ref. 118.
in pseudopotentials.46, 47 Here, rPW86-vdW2 provides thebest agreement with experimental lattice energies being con-sistently within ∼15 meV/H2O of experiment for all icephases.
The role played by vdW interactions in the phase dia-gram of ice is most evident when relative energies betweenthe ice phases are considered. Both the vdWTS and vdW-DFapproaches provide results which are in much closer agree-ment with experiment and DMC than the standard GGA andhybrid functionals in this regard. Table I shows that experi-mentally the energy difference between ice Ih and the high-est density ice VIII phase is 33 meV/H2O. Although the rel-ative stabilities of ice XIII, XIV, and XV are not known(either from experiment or DMC) they should also fall withinthe 33 meV/H2O window since ice VIII is the least stablephase at zero pressure and 0 K (of all the phases studiedhere). However, when calculated with PBE and PBE0 the en-ergy difference between ice Ih and ice VIII is far too large(>140 meV/H2O). Likewise, when comparison with exper-iment is possible the phases between ice Ih and ice VIIIare also destabilized too much. All vdW inclusive function-als reduce the energy differences between the phases, bring-ing them into much closer agreement with experiment. Forexample, the energy difference between ice Ih and ice VIIIcomes down to only 76 meV/H2O and 33 meV/H2O withPBE0+vdWTS and rPW86-vdW2, respectively.
As noted earlier, ZPE contributions were not consideredin the above discussions as ZPE effects do not play a sig-nificant role in determining the relative energies of the var-ious ice phases. The main effect from ZPE contributions isto reduce the lattice energies by about 120–110 meV/H2O.This applies across the board for all phases and function-als considered, although a small monotonic decrease on thelevel of 6–10 meV/H2O is seen upon going from the low-to the high-density phases. However, as we will see in Sec.III B ZPE effects do influence the equilibrium volumessignificantly.
B. Equilibrium volumes
The equilibrium volume, which is a measure of the den-sity of the phases, is another important quantity used to as-sess the performance of different theoretical methods. Previ-ous efforts focused mostly on calculating the density of ice Ih,whereas here we seek to understand how functionals performfor a range of phases. Table II and Fig. 3 show comparisonsof the calculated and experimental volumes. The equilibriumvolumes of ice Ih obtained using both PBE and PBE0 are∼4% smaller than experiment, which is consistent with pre-vious calculations.46, 58 Upon going to higher densities, how-ever, contrasting behavior is observed and as one moves tohigher densities there is an increasing tendency to overesti-mate the volume. Indeed for ice VIII the volume is overesti-mated by 4% with both PBE and PBE0. Clearly, the greaterunderestimation of vdW interactions at higher densities leadsto a progressive overestimation of the equilibrium volumes.Overall though, and in contrast to the lattice energies, the per-formance of PBE and PBE0 for the equilibrium volumes is
-5
0
5
10
15
20
(VC
alc. −
VE
xpt.)
/ VE
xpt. [
%]
PBEPBE0
-5
0
5
10
15
20
(VC
alc. −
VE
xpt.)
/ VE
xpt. [
%]
PBE0+vdWMB
revPBE-vdW
-5
0
5
10
15
20
(VC
alc. −
VE
xpt.)
/ VE
xpt. [
%]
PBE+vdWTS
PBE0+vdWTS
-5
0
5
10
15
20
(VC
alc. −
VE
xpt.)
/ VE
xpt. [
%]
optPBE-vdWrPW86-vdW2
Ih IX II XIV
XV
VII
I
VII
I
XV
XIV
XII
I
IIIX
(a) (b)
XII
I
Ih
Without ZPE With ZPE
FIG. 3. Percentage differences in the calculated equilibrium volumes (VCalc.)compared to experiment (VExpt.) (a) without and (b) with zero point energies(ZPE) in VCalc.. The zero value on the Y axis designates the experimentalreference values. Here positive errors indicate larger computed volumes andnegative errors indicate smaller computed volumes compared to experiment.
This article is copyrighted as indicated in the abstract. Reuse of AIP content is subject to the terms at: http://scitation.aip.org/termsconditions. Downloaded to IP:
128.112.123.238 On: Tue, 15 Oct 2013 21:24:11

154702-6 Santra et al. J. Chem. Phys. 139, 154702 (2013)
reasonable, differing by <2% from experiment when aver-aged over all ice phases.
With vdWTS the volumes are decreased by 3%–9% fromtheir parent functionals (PBE and PBE0) and in compari-son to experiment the volumes actually become worse. Theunderestimated volumes obviously correlate with the un-derestimated lattice energies predicted by these approaches(Fig. 2). Going beyond two-body vdWTS the equilibrium vol-umes are reduced further and compared to experiment the av-erage difference becomes ∼7%. It is noteworthy that vdWMB
reduces the volume of ice VIII more than vdWTS, and as a re-sult it improves the relative change in the volume with respectto ice XV, which in turn substantially affects the phase transi-tion pressures (Sec. III C). Contrary to the performance of thevdWTS approaches, the equilibrium volumes obtained fromrevPBE-vdW are on average ∼10% too large (Fig. 3). Suchbehavior of revPBE-vdW has been attributed to the overlyrepulsive revPBE exchange functional and is analogous towhat has been found previously with this functional for manyother solids.93, 95 The rPW86-vdW2 functional incorporatesimprovements in both the exchange and correlation compo-nents of the functional compared to revPBE-vdW and we findthat this is reflected in improved volumes, being on average∼5% larger than experiment. However, this performance isstill inferior to PBE and PBE0. Of the vdW inclusive func-tionals optPBE-vdW provides the smallest average error be-ing within 2% of experiment for all the ice phases.
Unlike the lattice energies, the effects of ZPE on the equi-librium volumes cannot be ignored, especially in the higherdensity phases. The effect of ZPE on the equilibrium volumesis estimated by computing free energy as a function of volumeas F (V ) = E(V ) + 1
2
∑ν ¯ων(V ), where ων(V ) is the fre-
quency of phonon mode ν at a given volume. In line with therecent study of Murray and Galli,46 we find that with PBE thevolumes of ice Ih and VIII increase by ∼0.5% and ∼5.5%, re-spectively, when ZPE effects are accounted for (Fig. 3(b) andTable II). Indeed overall we find that the ZPE effects graduallyincrease from the low- to high-density phases and dependingon the functional the increase in the equilibrium volume forthe highest density ice VIII phase is somewhere between 3%and 6%.118 Thus, compared to experiments the mean abso-lute error in predicting volumes of phases increases by ∼2%for vdW-DF and decreases by ∼1.5% for vdWTS when ZPEeffects are accounted for. Overall for all the vdW inclusivefunctionals, when ZPE effects are taken into account optPBE-vdW and PBE0+vdWTS are the two best functionals in termsof predicting volumes (Table II).
C. Enthalpy
Apart from absolute lattice energies and densities, accu-rate predictions of phase transitions are important if a func-tional is to be of real value in exploring the phase diagram ofwater. In Ref. 45 we showed that vdW interactions had a hugeimpact on the predicted phase transition pressures betweenthe various phases of ice considered. Here we extend thisstudy by calculating the enthalpies of different phases to es-tablish the most stable phases at different pressures predictedby the various xc functionals. Pressures, P(V), at different vol-
TABLE III. Comparisons of the calculated and experimental transitionpressures. Only positive transition pressures are reported. All pressures arein GPa.
IX II XIII XIV/XV VIII
Expt. 0.1–0.2a . . . 0.2–0.8b 1.2–1.4b 1.50b
PBE 1.66 . . . . . . 3.45 6.08PBE0 1.32 . . . . . . 2.83 4.50PBE+vdWTS 0.26 . . . . . . 1.25 6.37PBE0+vdWTS 0.10 . . . 0.89 1.04 4.62PBE0+vdWMB 0.26 . . . . . . 1.65 3.50revPBE-vdW . . . . . . . . . 0.78 2.36optPBE-vdW . . . . . . . . . 0.68 2.22rPW86-vdW2 . . . . . . 0.63 1.25 1.34
aReference 119.bReference 87.
umes have been calculated from the Murnaghan equation ofstate,105
P (V ) = B0/B′0((V0/V )B
′0 − 1), (4)
where B0, B ′0, and V0 are the equilibrium bulk modulus, the
derivative of the bulk modulus with respect to pressure, andthe equilibrium volume at zero pressure, respectively. Fig. 4shows the enthalpies of the various phases as a function ofpressure relative to the enthalpy of ice Ih (at 0 K and zeropressure). The most stable phase at each pressure is the onewith the lowest enthalpy and the crossovers between differ-ent phases indicate the pressures at which the phase tran-sitions are predicted to occur. The phase transition pres-sures predicted from all functionals are also summarized inTable III.
According to the most recent experimental phase diagramof water, upon pressurizing the ambient pressure ice Ih phasethe high-pressure proton ordered phases are expected to oc-cur in the following sequence: ice IX, II, XIII, XIV, XV, andVIII.87 However, the exact phase boundaries between thesephases have not been determined directly from experiment,especially when considering the low temperature regime.84–87
Specifically, between ice Ih and IX there is no measured phaseboundary available and a reasonable choice is to consider theknown phase coexistence line between ice Ih and III, the pro-ton disordered counterpart of ice IX, which appears at ∼0.1–0.2 GPa.87, 119 The experimental phase boundaries betweenice IX, II, and XIII are also unknown, however, they certainlyshould appear in the pressure window of 0.2–0.8 GPa since athigher pressures (∼1.2–1.4 GPa) ice XIV and XV are foundto be stabilized.85, 87, 101 The highest density phase, ice VIII,can be found at 1.5 GPa.87 Now we will discuss how our cal-culated phase transition pressures compare with the experi-mental data.
Table III shows that the phase transition pressures ob-tained from PBE are much too high compared to experiment;about an order of magnitude too high for ice IX and 3–4 timestoo high for ice XIV and VIII. Small improvements arise us-ing PBE0 with 20%–30% reductions in the transition pres-sures. The predicted order in which the ice phases appear (Ih,IX, XIV, and VIII) with increasing pressure agrees with ex-periment. However, ice II, XIII, and XV are missing from the
This article is copyrighted as indicated in the abstract. Reuse of AIP content is subject to the terms at: http://scitation.aip.org/termsconditions. Downloaded to IP:
128.112.123.238 On: Tue, 15 Oct 2013 21:24:11

154702-7 Santra et al. J. Chem. Phys. 139, 154702 (2013)
0 1 2 3 4 50
200
400
600
800
ΔH [
meV
/H2O
]
Ih
0 1 2 3 4 50
200
400
600
ΔH [
meV
/H2O
]
IX
0 1 2 3 4 5Pressure (GPa)
0
200
400
600
ΔH [
meV
/H2O
]
II
0 0.50
100
XIII
0 0.50
100
0 0.5 1 1.5 2 2.50
100
200
300
400
ΔH [
meV
/H2O
]
XIV
0 0.5 1 1.5Pressure (GPa)
0
50
100
150
200
250
ΔH [
meV
/H2O
]
XV
0 0.5 1 1.5 2 2.50
100
200
300
400
ΔH [
meV
/H2O
]
VIII
VIII
IX XIV
VIIIXIVIX
(a)
(b)
Ih
XIVIX
(c)
VIII
Ih
IhIX
XVVIII
VIIIXIVIX
VIIIXIVIX
PBE0
PBE0+vdWTS
PBE0+vdWMB
revPBE-vdW
optPBE-vdW
rPW86-vdW2
(d)
(e)
(f)
XIII
XIII
FIG. 4. Change in the enthalpies (�H) of the ice phases relative to the enthalpy of ice Ih at T = 0 and P = 0 calculated with (a) PBE0, (b) PBE0+vdWTS,(c) PBE0+vdWMB, (d) revPBE-vdW, (e) optPBE-vdW, and (f) rPW86-vdW2. The vertical dotted lines indicate the transition pressures. The most stable icephases along the pressure axis are indicated at the bottom of each panel. The insets show elaborations of the PBE0+vdWTS and optPBE-vdW plots within the0.0–0.5 GPA pressure range.
PBE (and PBE0) phase diagram, i.e., at no positive externalpressure do these phases have the lowest enthalpy (Fig. 4).
With the vdW inclusive functionals the transition pres-sures are lowered substantially and are in reasonableagreement with experiment (Table III). For ice IX, XIII, andXIV the transition pressures obtained from PBE0+vdWTS
are within the range of experimental values. However,PBE0+vdWTS fails to reduce the transition pressure of iceVIII mainly because the relative lattice energy of ice VIIIwith respect to ice XV (∼50 meV/H2O) does not improvewith vdWTS (Table I). Inclusion of many-body vdW de-creases the energy difference between ice VIII and ice XV by10 meV/H2O and brings the relative change in the equilibriumvolume (2.2 Å3/H2O) into better agreement with experiment(2.4 Å3/H2O). Both improvements help in reducing the calcu-lated transition pressure of ice VIII to 3.5 GPa which is closerto the experimental pressure of 1.5 GPa. Despite the improve-ments in the transition pressures both vdWTS and vdWMB failto predict the presence of all of the experimentally character-ized ice phases on the phase diagram (Fig. 4).
The phase diagrams obtained with the three vdW-DFs arenot particularly impressive either. None of the functionals findthe ice Ih to IX transition at a positive pressure, because theypredict ice IX is to be energetically more stable than ice Ih atzero pressure. However, the predicted transition pressures forthe higher density phases (ice XIII and beyond) are in goodagreement with experiment, differing by no more than a fac-tor of 2. Interestingly, since ice XIV and XV are isoenergeticwith rPW86-vdW2 (Table I) this functional predicts ice XV
to be more stable than ice XIV at all pressures (Fig. 4(f)). Forice VIII all three vdW-DFs reproduce the experimental tran-sition pressure (1.5 GPa) with reasonable accuracy, rPW86-vdW2 being the closest (1.34 GPa) followed by optPBE-vdW(2.22 GPa) and then revPBE-vdW (2.36 GPa).
D. Decomposition of the exchange and correlationcontributions to the lattice energy
GGA, hybrid-GGA, and vdW inclusive functionals leadto varied results for the ice phases considered. In order to shedmore light on why this is we have decomposed the contri-butions from exchange and correlation energies to the latticeenergies for all the xc functionals studied. The contributionfrom the exchange energy (�Ex) to the lattice energy is ob-tained by subtracting the exchange energy of N isolated H2Omolecules (EH2O
x ) from the exchange energy of the ice unitcells (EIce
x ) containing N molecules of H2O and can be definedas
�Ex = (EIcex − N × EH2O
x )/N. (5)
An equivalent definition is used to extract the contributionform the correlation energy (�Ec) to the lattice energy.
Figs. 5(a) and 5(b) show the variations in �Ex and�Ec for all ice phases at the equilibrium densities obtainedfrom each xc functional. In general we find that upon go-ing from the low to the high density phases the energeti-cally favorable exchange contribution to the lattice energy de-creases, just as the lattice energies do. We also find that the
This article is copyrighted as indicated in the abstract. Reuse of AIP content is subject to the terms at: http://scitation.aip.org/termsconditions. Downloaded to IP:
128.112.123.238 On: Tue, 15 Oct 2013 21:24:11
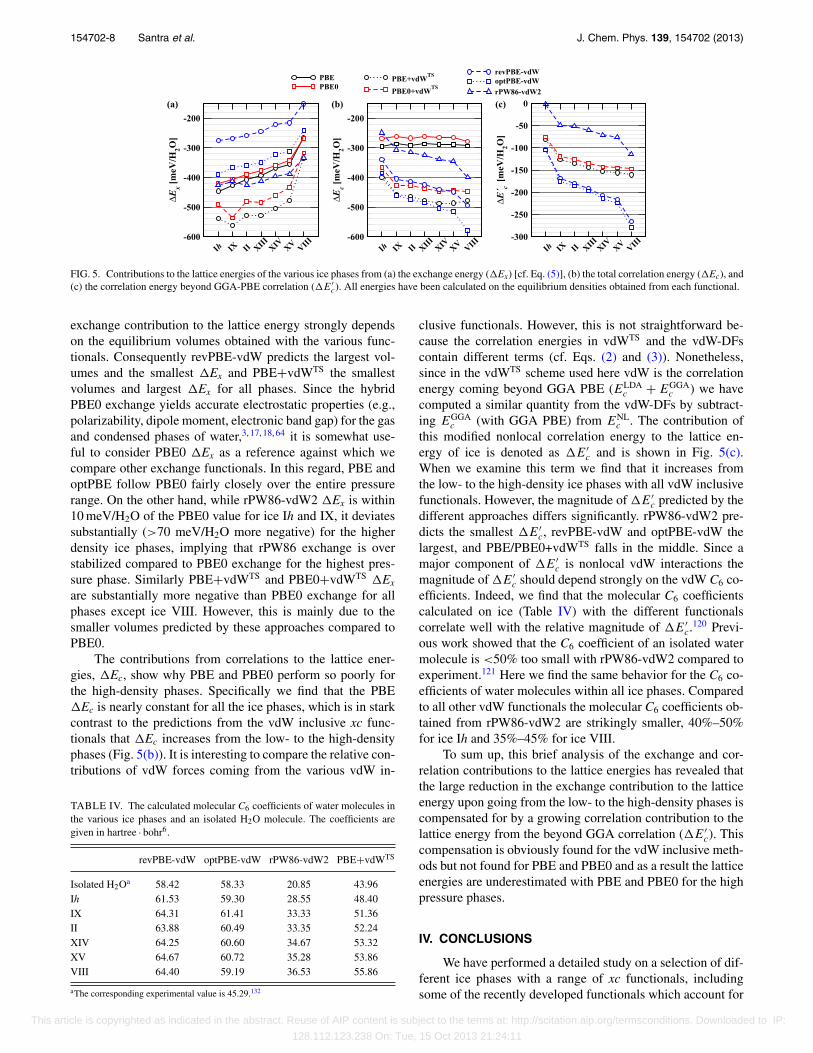
154702-8 Santra et al. J. Chem. Phys. 139, 154702 (2013)
-600
-500
-400
-300
-200
ΔEx
[meV
/H2O
]
PBEPBE0
-600
-500
-400
-300
-200
ΔEc
[meV
/H2O
]
PBE+vdWTS
PBE0+vdWTS
-300
-250
-200
-150
-100
-50
0
ΔE´ c
[meV
/H2O
]
revPBE-vdWoptPBE-vdW
rPW86-vdW2
Ih IXII XIV XV VIIIXIII IhIX II XIII XIV XV VIII Ih IX XIIIII XIV XV VIII
(a) (b) (c)
FIG. 5. Contributions to the lattice energies of the various ice phases from (a) the exchange energy (�Ex) [cf. Eq. (5)], (b) the total correlation energy (�Ec), and(c) the correlation energy beyond GGA-PBE correlation (�E′
c). All energies have been calculated on the equilibrium densities obtained from each functional.
exchange contribution to the lattice energy strongly dependson the equilibrium volumes obtained with the various func-tionals. Consequently revPBE-vdW predicts the largest vol-umes and the smallest �Ex and PBE+vdWTS the smallestvolumes and largest �Ex for all phases. Since the hybridPBE0 exchange yields accurate electrostatic properties (e.g.,polarizability, dipole moment, electronic band gap) for the gasand condensed phases of water,3, 17, 18, 64 it is somewhat use-ful to consider PBE0 �Ex as a reference against which wecompare other exchange functionals. In this regard, PBE andoptPBE follow PBE0 fairly closely over the entire pressurerange. On the other hand, while rPW86-vdW2 �Ex is within10 meV/H2O of the PBE0 value for ice Ih and IX, it deviatessubstantially (>70 meV/H2O more negative) for the higherdensity ice phases, implying that rPW86 exchange is overstabilized compared to PBE0 exchange for the highest pres-sure phase. Similarly PBE+vdWTS and PBE0+vdWTS �Ex
are substantially more negative than PBE0 exchange for allphases except ice VIII. However, this is mainly due to thesmaller volumes predicted by these approaches compared toPBE0.
The contributions from correlations to the lattice ener-gies, �Ec, show why PBE and PBE0 perform so poorly forthe high-density phases. Specifically we find that the PBE�Ec is nearly constant for all the ice phases, which is in starkcontrast to the predictions from the vdW inclusive xc func-tionals that �Ec increases from the low- to the high-densityphases (Fig. 5(b)). It is interesting to compare the relative con-tributions of vdW forces coming from the various vdW in-
TABLE IV. The calculated molecular C6 coefficients of water molecules inthe various ice phases and an isolated H2O molecule. The coefficients aregiven in hartree · bohr6.
revPBE-vdW optPBE-vdW rPW86-vdW2 PBE+vdWTS
Isolated H2Oa 58.42 58.33 20.85 43.96Ih 61.53 59.30 28.55 48.40IX 64.31 61.41 33.33 51.36II 63.88 60.49 33.35 52.24XIV 64.25 60.60 34.67 53.32XV 64.67 60.72 35.28 53.86VIII 64.40 59.19 36.53 55.86
aThe corresponding experimental value is 45.29.132
clusive functionals. However, this is not straightforward be-cause the correlation energies in vdWTS and the vdW-DFscontain different terms (cf. Eqs. (2) and (3)). Nonetheless,since in the vdWTS scheme used here vdW is the correlationenergy coming beyond GGA PBE (ELDA
c + EGGAc ) we have
computed a similar quantity from the vdW-DFs by subtract-ing EGGA
c (with GGA PBE) from ENLc . The contribution of
this modified nonlocal correlation energy to the lattice en-ergy of ice is denoted as �E′
c and is shown in Fig. 5(c).When we examine this term we find that it increases fromthe low- to the high-density ice phases with all vdW inclusivefunctionals. However, the magnitude of �E′
c predicted by thedifferent approaches differs significantly. rPW86-vdW2 pre-dicts the smallest �E′
c, revPBE-vdW and optPBE-vdW thelargest, and PBE/PBE0+vdWTS falls in the middle. Since amajor component of �E′
c is nonlocal vdW interactions themagnitude of �E′
c should depend strongly on the vdW C6 co-efficients. Indeed, we find that the molecular C6 coefficientscalculated on ice (Table IV) with the different functionalscorrelate well with the relative magnitude of �E′
c.120 Previ-ous work showed that the C6 coefficient of an isolated watermolecule is <50% too small with rPW86-vdW2 compared toexperiment.121 Here we find the same behavior for the C6 co-efficients of water molecules within all ice phases. Comparedto all other vdW functionals the molecular C6 coefficients ob-tained from rPW86-vdW2 are strikingly smaller, 40%–50%for ice Ih and 35%–45% for ice VIII.
To sum up, this brief analysis of the exchange and cor-relation contributions to the lattice energies has revealed thatthe large reduction in the exchange contribution to the latticeenergy upon going from the low- to the high-density phases iscompensated for by a growing correlation contribution to thelattice energy from the beyond GGA correlation (�E′
c). Thiscompensation is obviously found for the vdW inclusive meth-ods but not found for PBE and PBE0 and as a result the latticeenergies are underestimated with PBE and PBE0 for the highpressure phases.
IV. CONCLUSIONS
We have performed a detailed study on a selection of dif-ferent ice phases with a range of xc functionals, includingsome of the recently developed functionals which account for
This article is copyrighted as indicated in the abstract. Reuse of AIP content is subject to the terms at: http://scitation.aip.org/termsconditions. Downloaded to IP:
128.112.123.238 On: Tue, 15 Oct 2013 21:24:11

154702-9 Santra et al. J. Chem. Phys. 139, 154702 (2013)
vdW dispersion forces. Whilst we know a lot about the per-formance of these functionals in the gas phase (in particularon gas phase data sets such as the S22109, 122) much less isknown about how these functionals perform in the condensedphases, which was one of the key motivations for this study.As seen before in the gas phase the vdW inclusive function-als do offer some improvement in performance. This is par-ticularly true for the relative energies of the different phasesand as a result the phase transition pressures. However, thefunctionals tested are far from perfect and none simultane-ously yields excellent lattice energies and lattice constants forall phases. Of the schemes considered PBE0+vdWTS consis-tently overestimates lattice energies by ∼50 meV/H2O andequilibrium densities by ∼5%. optPBE-vdW produces densi-ties of ice that are in best agreement (∼3%) with experimentbut the lattice energies are ∼50 meV/H2O too large. revPBE-vdW underestimates densities by >10% and lattice energiesby ∼50 meV/H2O. rPW86-vdW2 gives very accurate latticeenergies but the densities are underestimated by >8%.
The improved agreement between the experimental andcalculated phase transition pressures when using the vdWfunctionals clearly highlights the importance of accountingfor vdW in ice. However, even with vdW inclusive func-tionals, capturing all of the experimentally characterized icephases on the water phase diagram is clearly still a major chal-lenge and beyond the capabilities of the methods consideredhere. Water is well known to provide a stern challenge forDFT, be it water clusters, liquid water, and now ice. The factthat several phases of ice are missing from the phase diagramof water is somewhat of a blow to the true predictive abilityof the methods considered here, but also a challenge and op-portunity for developing and testing new methods.
From this study it is evident that the ice phases con-sidered here are extremely useful in providing a challeng-ing “data set” against which new methods can be testedand proved. It would of course be interesting to see howsome of the other vdW inclusive DFT methods developedrecently perform on the ice phases. In this respect the al-ready available experimental lattice energies and the match-ing DMC numbers are valuable references. However, addi-tional DMC data on other phases of ice would certainly be ofvalue as would other vdW inclusive methods, e.g., random-phase approximation123, 124 and second order Møller-Plessetperturbation theory.59, 125 Finally, we note that the difficulty inpredicting ice phases up to only the pressure range 1–2 GPausing GGA, hybrid, and vdW inclusive DFT approaches sug-gests that caution must be exercised when searching for andpredicting new phases of water at yet higher pressures usingsuch functionals.63, 126–129
ACKNOWLEDGMENTS
B. Santra and R.C. are supported by the Scientific Dis-covery through Advanced Computing (SciDAC) programfunded by Department of Energy Grant No. DE-SC0008626.A.M. was supported by the European Research Council(Quantum-CRASS project) and the Royal Society through aRoyal Society Wolfson Research Merit Award. Also partlyvia our membership of the UK’s HPC Materials Chemistry
Consortium, which is funded by EPSRC (EP/F067496), thiswork made use of the computational facilities of HECToR.J.K. is grateful to UCL and the EPSRC for support throughthe Ph.D.+ scheme.
1B. Santra, A. Michaelides, and M. Scheffler, J. Chem. Phys. 127, 184104(2007).
2B. Santra, A. Michaelides, M. Fuchs, A. Tkatchenko, C. Filippi, and M.Scheffler, J. Chem. Phys. 129, 194111 (2008).
3B. Santra, A. Michaelides, and M. Scheffler, J. Chem. Phys. 131, 124509(2009).
4E. E. Dahlke, R. M. Olson, H. R. Leverentz, and D. G. Truhlar, J. Phys.Chem. A 112, 3976 (2008).
5X. Xu and W. A. Goddard III, J. Phys. Chem. A 108, 2305 (2004).6J. T. Su, X. Xu, and W. A. Goddard III, J. Phys. Chem. A 108, 10518(2004).
7S. S. Xantheas, J. Chem. Phys. 102, 4505 (1995).8K. Kim and K. D. Jordan, J. Phys. Chem. 98, 10089 (1994).9J. A. Anderson and G. S. Tschumper, J. Phys. Chem. A 110, 7268 (2006).
10G. C. Shields and K. N. Kirschner, Synth. React. Inorg., Met.-Org.,Nano-Met. Chem. 38, 32 (2008).
11G. I. Csonka, A. Ruzsinszky, and J. P. Perdew, J. Phys. Chem. B 109,21471 (2005).
12E. E. Dahlke and D. G. Truhlar, J. Phys. Chem. B 109, 15677 (2005).13M. J. Gillan, F. R. Manby, M. D. Towler, and D. Alfè, J. Chem. Phys. 136,
244105 (2012).14J. Ireta, J. Neugebauer, and M. Scheffler, J. Phys. Chem. A 108, 5692
(2004).15S. Tsuzuki and H. P. Lüthi, J. Chem. Phys. 114, 3949 (2001).16J. J. Novoa and C. Sosa, J. Phys. Chem. 99, 15837 (1995).17J. R. Hammond, N. Govind, K. Kowalski, J. Autschbach, and S. S. Xanth-
eas, J. Chem. Phys. 131, 214103 (2009).18F.-F. Wang, G. Jenness, W. A. Al-Saidi, and K. D. Jordan, J. Chem. Phys.
132, 134303 (2010).19J. C. Grossman, E. Schwegler, E. W. Draeger, F. Gygi, and G. Galli, J.
Chem. Phys. 120, 300 (2004).20E. Schwegler, J. C. Grossman, F. Gygi, and G. Galli, J. Chem. Phys. 121,
5400 (2004).21M. V. Fernández-Serra and E. Artacho, J. Chem. Phys. 121, 11136 (2004).22M. J. McGrath, J. I. Siepmann, I.-F. W. Kuo, C. J. Mundy, J. Vande-
Vondele, J. Hutter, F. Mohamed, and M. Krack, ChemPhysChem 6, 1894(2005).
23M. J. McGrath, J. I. Siepmann, I.-F. W. Kuo, and C. Mundy, Mol. Phys.104, 3619 (2006).
24M. J. McGrath, J. I. Siepmann, I.-F. W. Kuo, C. J. Mundy, J. VandeVon-dele, J. Hutter, F. Mohamed, and M. Krack, J. Phys. Chem. A 110, 640(2006).
25H.-S. Lee and M. E. Tuckerman, J. Chem. Phys. 125, 154507 (2006).26H.-S. Lee and M. E. Tuckerman, J. Chem. Phys. 126, 164501 (2007).27T. Todorova, A. P. Seitsonen, J. Hutter, I.-F. W. Kuo, and C. J. Mundy, J.
Phys. Chem. B 110, 3685 (2006).28J. VandeVondele, F. Mohamed, M. Krack, J. Hutter, M. Sprik, and M.
Parrinello, J. Chem. Phys. 122, 014515 (2005).29M. Guidon, F. Schiffmann, J. Hutter, and J. VandeVondele, J. Chem. Phys.
128, 214104 (2008).30T. D. Kühne, M. Krack, and M. Parrinello, J. Chem. Theory Comput. 5,
235 (2009).31P. H.-L. Sit and N. Marzari, J. Chem. Phys. 122, 204510 (2005).32M. V. Fernández-Serra, G. Ferlat, and E. Artacho, Mol. Simul. 31, 361
(2005).33D. Asthagiri, L. R. Pratt, and J. D. Kress, Phys. Rev. E 68, 041505
(2003).34A. E. Mattsson and T. R. Mattsson, J. Chem. Theory Comput. 5, 887
(2009).35I.-F. W. Kuo, C. J. Mundy, M. J. McGrath, J. I. Siepmann, J. VandeVon-
dele, M. Sprik, J. Hutter, B. Chen, M. L. Klein, F. Mohamed et al., J. Phys.Chem. B 108, 12990 (2004).
36M. Sprik, J. Hutter, and M. Parrinello, J. Chem. Phys. 105, 1142 (1996).37P. L. Silvestrelli and M. Parrinello, J. Chem. Phys. 111, 3572 (1999).38S. Yoo, X. C. Zeng, and S. S. Xantheas, J. Chem. Phys. 130, 221102
(2009).39C. Zhang, D. Donadio, F. Gygi, and G. Galli, J. Chem. Theory Comput. 7,
1443 (2011).
This article is copyrighted as indicated in the abstract. Reuse of AIP content is subject to the terms at: http://scitation.aip.org/termsconditions. Downloaded to IP:
128.112.123.238 On: Tue, 15 Oct 2013 21:24:11

154702-10 Santra et al. J. Chem. Phys. 139, 154702 (2013)
40B. Chen, I. Ivanov, M. L. Klein, and M. Parrinello, Phys. Rev. Lett. 91,215503 (2003).
41J. A. Morrone and R. Car, Phys. Rev. Lett. 101, 017801 (2008).42K. Laasonen, M. Sprik, M. Parrinello, and R. Car, J. Chem. Phys. 99, 9080
(1993).43O. Akin-Ojo and F. Wang, Chem. Phys. Lett. 513, 59 (2011).44D. Alfè, A. P. Bartók, G. Csányi, and M. J. Gillan, J. Chem. Phys. 138,
221102 (2013).45B. Santra, J. Klimeš, D. Alfè, A. Tkatchenko, B. Slater, A. Michaelides,
R. Car, and M. Scheffler, Phys. Rev. Lett. 107, 185701 (2011).46E. D. Murray and G. Galli, Phys. Rev. Lett. 108, 105502 (2012).47I. Hamada, J. Chem. Phys. 133, 214503 (2010).48B. Kolb and T. Thonhauser, Phys. Rev. B 84, 045116 (2011).49O. Kambara, K. Takahashi, M. Hayashi, and J.-L. Kuo, Phys. Chem.
Chem. Phys. 14, 11484 (2012).50Y. Fang, B. Xiao, J. Tao, J. Sun, and J. P. Perdew, Phys. Rev. B 87, 214101
(2013).51M. J. Gillan, D. Alfè, A. P. Bartók, and G. Csányi, “First-principles ener-
getics of water clusters and ice: A many-body analysis,” J. Chem. Phys.(submitted); preprint arXiv:1303.0751.
52B. Pamuk, J. M. Soler, R. Ramírez, C. P. Herrero, P. Stephens, P. B. Allen,and M.-V. Fernández-Serra, Phys. Rev. Lett. 108, 193003 (2012).
53C. Lee, D. Vanderbilt, K. Laasonen, R. Car, and M. Parrinello, Phys. Rev.Lett. 69, 462 (1992).
54D. R. Hamann, Phys. Rev. B 55, R10157 (1997).55S. J. Singer, J.-L. Kuo, T. K. Hirsch, C. Knight, L. Ojamäe, and M. L.
Klein, Phys. Rev. Lett. 94, 135701 (2005).56G. A. Tribello, B. Slater, and C. G. Salzmann, J. Am. Chem. Soc. 128,
12594 (2006).57M. de Koning, A. Antonelli, A. J. R. da Silva, and A. Fazzio, Phys. Rev.
Lett. 96, 075501 (2006).58P. J. Feibelman, Phys. Chem. Chem. Phys. 10, 4688 (2008).59A. Hermann and P. Schwerdtfeger, Phys. Rev. Lett. 101, 183005 (2008).60D. Pan, L.-M. Liu, G. A. Tribello, B. Slater, A. Michaelides, and E. Wang,
Phys. Rev. Lett. 101, 155703 (2008).61A. Erba, S. Casassa, L. Maschio, and C. Pisani, J. Phys. Chem. B 113,
2347 (2009).62J. A. Morrone, L. Lin, and R. Car, J. Chem. Phys. 130, 204511 (2009).63B. Militzer and H. F. Wilson, Phys. Rev. Lett. 105, 195701 (2010).64F. Labat, C. Pouchan, C. Adamo, and G. E. Scuseria, J. Comput. Chem.
32, 2177 (2011).65I.-C. Lin, A. P. Seitsonen, M. D. Coutinho-Neto, I. Tavernelli, and U.
Rothlisberger, J. Phys. Chem. B 113, 1127 (2009).66J. Schmidt, J. VandeVondele, I.-F. W. Kuo, D. Sebastiani, J. I. Siepmann,
J. Hutter, and C. J. Mundy, J. Phys. Chem. B 113, 11959 (2009).67J. Wang, G. Román-Pérez, J. M. Soler, E. Artacho, and M.-V. Fernández-
Serra, J. Chem. Phys. 134, 024516 (2011).68A. Møgelhøj, A. K. Kelkkanen, K. T. Wikfeldt, J. Schiøtz, J. J. Mortensen,
L. G. M. Pettersson, B. I. Lundqvist, K. W. Jacobsen, A. Nilsson, and J.K. Nørskov, J. Phys. Chem. B 115, 14149 (2011).
69C. Zhang, J. Wu, G. Galli, and F. Gygi, J. Chem. Theory Comput. 7, 3054(2011).
70R. Jonchiere, A. P. Seitsonen, G. Ferlat, A. M. Saitta, and R. Vuilleumier,J. Chem. Phys. 135, 154503 (2011).
71S. Yoo and S. S. Xantheas, J. Chem. Phys. 134, 121105 (2011).72Z. Ma, Y. Zhang, and M. E. Tuckerman, J. Chem. Phys. 137, 044506
(2012).73Z. Li, “Improving ab initio molecular dynamics of liquid water,” Ph.D.
thesis (Princeton University, 2012).74M. Dion, H. Rydberg, E. Schröder, D. C. Langreth, and B. I. Lundqvist,
Phys. Rev. Lett. 92, 246401 (2004).75A. Tkatchenko and M. Scheffler, Phys. Rev. Lett. 102, 073005 (2009).76J. Klimeš, D. R. Bowler, and A. Michaelides, J. Phys.: Condens. Matter
22, 022201 (2010).77O. A. von Lilienfeld, I. Tavernelli, U. Rothlisberger, and D. Sebastiani,
Phys. Rev. Lett. 93, 153004 (2004).78P. L. Silvestrelli, Phys. Rev. Lett. 100, 053002 (2008).79T. Sato and H. Nakai, J. Chem. Phys. 131, 224104 (2009).80S. Grimme, J. Antony, S. Ehrlich, and H. Krieg, J. Chem. Phys. 132,
154104 (2010).81O. A. Vydrov and T. V. Voorhis, Phys. Rev. Lett. 103, 063004 (2009).82A. D. Becke and E. R. Johnson, J. Chem. Phys. 123, 154101 (2005).83J. Tao, J. P. Perdew, and A. Ruzsinszky, Proc. Natl. Acad. Sci. U.S.A. 109,
18 (2012).
84V. Petrenko and R. W. Whitworth, Physics of Ice (Oxford University Press,New York, 2003).
85C. G. Salzmann, P. G. Radaelli, E. Mayer, and J. L. Finney, Phys. Rev.Lett. 103, 105701 (2009).
86C. G. Salzmann, P. G. Radaelli, A. Hallbrucker, E. Mayer, and J. L. Finney,in Physics and Chemistry of Ice, edited by W. F. Kuhs (The Royal Societyof Chemistry, Cambridge, 2007), pp. 521–528.
87C. G. Salzmann, P. G. Radaelli, B. Slater, and J. L. Finney, Phys. Chem.Chem. Phys. 13, 18468 (2011).
88E. Whalley, J. Chem. Phys. 81, 4087 (1984).89A. Tkatchenko, R. A. DiStasio, Jr., R. Car, and M. Scheffler, Phys. Rev.
Lett. 108, 236402 (2012).90K. Lee, E. D. Murray, L. Kong, B. I. Lundqvist, and D. C. Langreth, Phys.
Rev. B 82, 081101(R) (2010).91D. C. Langreth et al., J. Phys.: Condens. Matter 21, 084203 (2009).92A. Tkatchenko, L. Romaner, O. T. Hofmann, E. Zojer, and C. Ambrosch-
Draxl, MRS Bull. 35, 435 (2010).93J. Klimeš, D. R. Bowler, and A. Michaelides, Phys. Rev. B 83, 195131
(2011).94R. A. DiStasio, Jr., O. A. von Lilienfeld, and A. Tkatchenko, Proc. Natl.
Acad. Sci. U.S.A. 109, 14791 (2012).95J. Klimeš and A. Michaelides, J. Chem. Phys. 137, 120901 (2012).96A. M. Reilly and A. Tkatchenko, J. Phys. Chem. Lett. 4, 1028 (2013).97A. K. Kelkkanen, B. I. Lundqvist, and J. K. Nørskov, J. Chem. Phys. 131,
046102 (2009).98C. M. B. Line and R. W. Whitworth, J. Chem. Phys. 104, 10008
(1996).99J. D. Londono, W. F. Kuhs, and J. L. Finney, J. Chem. Phys. 98, 4878
(1993).100C. Lobban, J. L. Finney, and W. F. Kuhs, J. Chem. Phys. 117, 3928 (2002).101C. G. Salzmann, P. G. Radaelli, A. Hallbrucker, E. Mayer, and J. L. Finney,
Science 311, 1758 (2006).102W. F. Kuhs, J. L. Finney, C. Vettier, and D. V. Bliss, J. Chem. Phys. 81,
3612 (1984).103D. Pan, L.-M. Liu, G. A. Tribello, B. Slater, A. Michaelides, and E. Wang,
J. Phys.: Condens. Matter 22, 074209 (2010).104J. P. Perdew, K. Burke, and M. Ernzerhof, Phys. Rev. Lett. 77, 3865
(1996).105F. D. Murnaghan, Proc. Natl. Acad. Sci. U.S.A. 30, 244 (1944).106B. Santra, “Density-functional theory exchange-correlation functionals for
hydrogen bonds in water,” Ph.D. thesis (Fritz-Haber-Institut der Max-Planck Gesellschaft, TU-Berlin, 2010).
107C. Adamo and V. Barone, J. Chem. Phys. 110, 6158 (1999).108Y. Zhang and W. Yang, Phys. Rev. Lett. 80, 890 (1998).109P. Jurecka, J. Šponer, J. Cerný, and P. Hobza, Phys. Chem. Chem. Phys. 8,
1985 (2006).110E. D. Murray, K. Lee, and D. C. Langreth, J. Chem. Theory Comput. 5,
2754 (2009).111V. Blum et al., Comput. Phys. Commun. 180, 2175 (2009).112G. Kresse and J. Hafner, Phys. Rev. B 47, 558 (1993).113G. Kresse and J. Furthmüller, Phys. Rev. B 54, 11169 (1996).114G. Román-Pérez and J. M. Soler, Phys. Rev. Lett. 103, 096102 (2009).115K. Röttger, A. Endriss, J. Ihringer, S. Doyle, and W. F. Kuhs, Acta Cryst.
B50, 644 (1994).116J. Carrasco, B. Santra, J. Klimeš, and A. Michaelides, Phys. Rev. Lett.
106, 026101 (2011).117A. Gulans, M. J. Puska, and R. M. Nieminen, Phys. Rev. B 79, 201105(R)
(2009).118Frequency calculations have not been performed for any of the PBE0
based functionals. For PBE0 we have estimated the ZPE correctedvolumes by considering the volume changes found with PBE. ForPBE0+vdWTS and PBE0+vdWMB ZPE corrected volumes are estimatedwith the volume changes obtained with PBE+vdWTS.
119G. S. Kell and E. Whalley, J. Chem. Phys. 48, 2359 (1968).120In case of vdWTS molecular C6 coefficients are calculated by using Eq.
(10) in Ref. 75 and for the vdW-DFs we have used the long distance be-havior of the kernel as given by Eq. (17) in Ref. 74 and in Eq. (23.5) in Ref.130. The vdW-DF C6 coefficients vary only within 1% when using differ-ent PAW potentials or norm-conserving pseudopotentials, however, theydepend significantly on the functional employed to calculate the electrondensity. For example, the C6 coefficient of an isolated water molecule isreduced to 45.5 a.u. when Hartree-Fock electron density is used. Likewise,the vdW-DF C6 coefficients of an isolated water molecule obtained hereare 20%–24% larger than the values reported in Ref. 121 where electron
This article is copyrighted as indicated in the abstract. Reuse of AIP content is subject to the terms at: http://scitation.aip.org/termsconditions. Downloaded to IP:
128.112.123.238 On: Tue, 15 Oct 2013 21:24:11

154702-11 Santra et al. J. Chem. Phys. 139, 154702 (2013)
densities were calculated using a so-called long-range corrected hybridfunctional which is expected to give densities similar to those given byHartree-Fock.
121O. A. Vydrov and T. V. Voorhis, Phys. Rev. A 81, 062708 (2010).122L. A. Burns, Álvaro Vázquez-Mayagoitia, B. G. Sumpter, and C. D. Sher-
rill, J. Chem. Phys. 134, 084107 (2011).123D. Lu, Y. Li, D. Rocca, and G. Galli, Phys. Rev. Lett. 102, 206411 (2009).124L. Schimka, J. Harl, A. Stroppa, A. Grüneis, M. Marsman, F. Mittendorfer,
and G. Kresse, Nature Mater. 9, 741 (2010).125A. Grüneis, M. Marsman, and G. Kresse, J. Chem. Phys. 133, 074107
(2010).126C. J. Pickard and R. J. Needs, J. Chem. Phys. 127, 244503 (2007).
127J. M. McMahon, Phys. Rev. B 84, 220104(R) (2011).128A. Hermanna, N. W. Ashcroft, and R. Hoffmann, Proc. Natl. Acad. Sci.
U.S.A. 109, 745 (2012).129C. J. Pickard, M. Martinez-Canales, and R. J. Needs, Phys. Rev. Lett. 110,
245701 (2013).130O. A. Vydrov, and T. Van Voorhis, in Fundamentals of Time-Dependent
Density Functional Theory, edited by M. A. L. Marques, N. Maitra, F.Nogueira, E. K. U. Gross, and A. Rubio (Springer, Berlin, 2012).
131See supplementary material at http://dx.doi.org/10.1063/1.4824481 forcoordinates of all ice phases optimized with all xc functionals consideredhere.
132D. J. Margoliash and W. J. Meath, J. Chem. Phys. 68, 1426 (1978).
This article is copyrighted as indicated in the abstract. Reuse of AIP content is subject to the terms at: http://scitation.aip.org/termsconditions. Downloaded to IP:
128.112.123.238 On: Tue, 15 Oct 2013 21:24:11