Embed Size (px)
Citation preview
ORIGINAL PAPER
On the Fractal Dimension of Rough Surfaces
B. N. J. Persson
Received: 2 December 2013 / Accepted: 25 February 2014 / Published online: 7 March 2014
� Springer Science+Business Media New York 2014
Abstract Most natural surfaces and surfaces of engi-
neering interest, e.g., polished or sandblasted surfaces, are
self-affine fractal over a wide range of length scales, with
the fractal dimension Df ¼ 2:15� 0:15. We give several
examples illustrating this and a simple argument, based on
surface fragility, for why the fractal dimension usually is
\2.3. A kinetic model of sandblasting is presented, which
gives surface topographies and surface roughness power
spectra in good agreement with experiments.
Keyword Self-affine fractal � Surface fragility � Fractal
dimension � Power spectra
1 Introduction
All natural surfaces and surfaces of engineering interest have
surface roughness on many different length scales, sometimes
extending from atomic dimensions to the linear size of the
object under study. Surface roughness is of crucial importance
in many engineering applications, e.g., in tribology [1–4]. For
example, the surface roughness on a road surface influences the
tire–road friction or grip [1]. It is therefore of great interest to
understand the nature of surface roughness in engineering
applications. Several studies of the fractal properties of surface
roughness have been presented, but mainly for surfaces pro-
duced by growth (atomic deposition) processes [5]. Many
studies of surfaces produced by atomistic erosion processes,
e.g., sputtering, have also been presented, see, e.g., [6–8]. In this
article, I will present several examples of power spectra of
different surfaces with self-affine fractal-like surface
roughness. All surfaces have fractal dimensions Df ¼ 2:15�0:15 and I will give a simple argument, based on surface fra-
gility, for why the fractal dimension usually is \2.3. I also
present a kinetic model of sandblasting, which gives surface
topographies and surface roughness power spectra in good
agreement with experiments.
2 Power Spectrum: Definition
We consider randomly rough surfaces where the statistical
properties are transitionally invariant and isotropic. In this
case, the 2D power spectrum [3, 9]
CðqÞ ¼ 1
ð2pÞ2Z
d2xhhðxÞhð0Þie�iq�x
will only depend on the magnitude q of the wavevector q.
Here, hðxÞ is the height coordinate at the point x ¼ ðx; yÞand h::i stands for ensemble averaging. From CðqÞ; many
quantities of interest can be directly calculated. For
example, the root-mean-square (rms) roughness amplitude
hrms can be written as
h2rms ¼ 2p
Zq1
q0
dq qCðqÞ ð1Þ
where q0 and q1 are the small and large wavevector cut-off.
The rms slope j is determined by
j2 ¼ 2pZq1
q0
dq q3CðqÞ: ð2Þ
For a self-affine fractal surface,
B. N. J. Persson (&)
PGI-1, FZ-Julich, 52425 Julich, Germany
e-mail: [email protected]
123
Tribol Lett (2014) 54:99–106
DOI 10.1007/s11249-014-0313-4
CðqÞ ¼ C0
q
q0
� ��2ð1þHÞ: ð3Þ
Substituting this in (1) gives
h2rms ¼
pC0
Hq2
0 1� q1
q0
� ��2H" #
ð4Þ
and from (2) we get
j2 ¼ pC0
1� Hq4
0
q1
q0
� �2ð1�HÞ�1
" #: ð5Þ
Usually, q0/q1 � 1 and since 0\H\1, unless H is very
close to 0 or 1, we get
j ¼ q0hrms
H
1� H
� �1=2q1
q0
� �1�H
: ð6Þ
Many surfaces of engineering interest, e.g., a polished steel
surface, have rms roughness of order � 1 lm when probed
over a surface region of linear size L ¼ p=q0� 100 lm.
This gives q0hrms � 0:1; and if the surface is self-affine
fractal, the whole way down to the nanometer region
(length scale a) then q1 ¼ p=a � 1010 m�1 and (6) gives
j � 0:1� 105ð1�HÞ. I use this equation to argue that most
surfaces of interest, if self-affine fractal from the macro-
scopic length scale (say L� 100 lm) to the nanometer
region, cannot have a fractal dimension larger than Df �2:3 or so, as otherwise the average surface slope becomes
huge which is unlikely to be the case as the surface would
be very ‘‘fragile’’ and easily damaged (smoothened) by the
mechanical interactions with external objects. That is, if we
assume that the rms slope has to be below, say 3, we get
that H [ 0:7 or Df ¼ 3� H\2:3. As we now show, this
inequality is nearly always satisfied for real surfaces.
3 Power Spectra: Some Examples
I have calculated the 2D surface roughness power spectra of
several hundred surfaces of engineering interest. Here, I give
just a few examples to illustrate the general picture which has
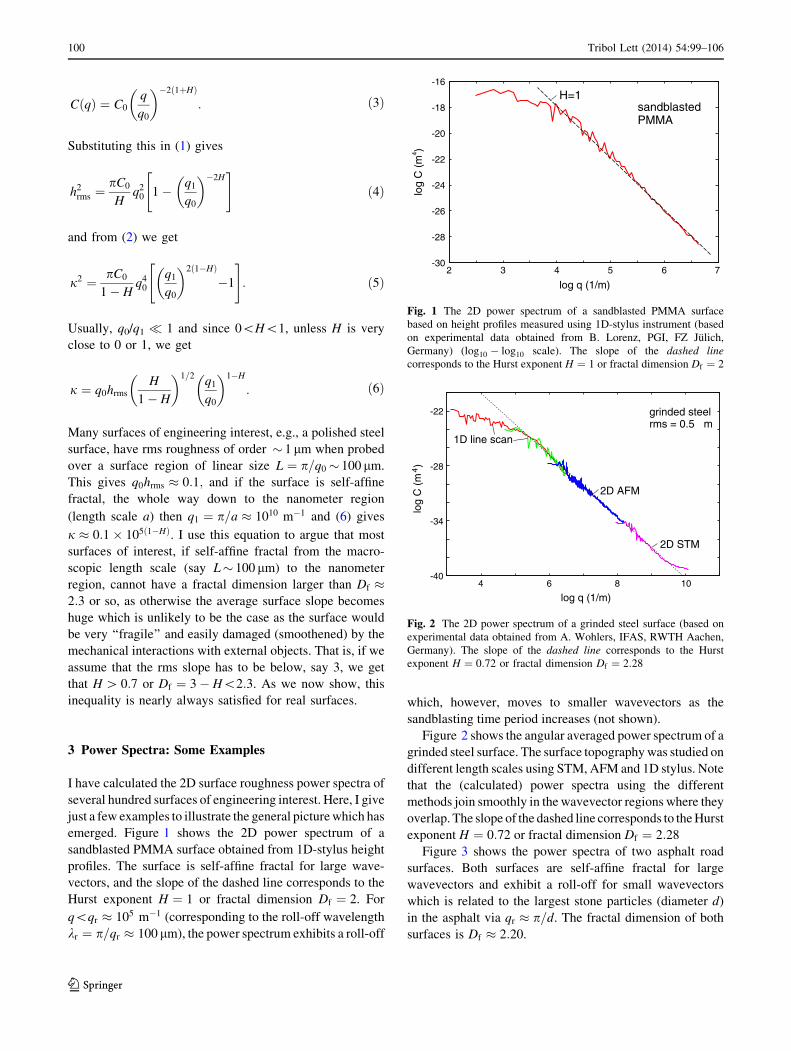
emerged. Figure 1 shows the 2D power spectrum of a
sandblasted PMMA surface obtained from 1D-stylus height
profiles. The surface is self-affine fractal for large wave-
vectors, and the slope of the dashed line corresponds to the
Hurst exponent H ¼ 1 or fractal dimension Df ¼ 2. For
q\qr � 105 m�1 (corresponding to the roll-off wavelength
kr ¼ p=qr � 100 lm), the power spectrum exhibits a roll-off
which, however, moves to smaller wavevectors as the
sandblasting time period increases (not shown).
Figure 2 shows the angular averaged power spectrum of a
grinded steel surface. The surface topography was studied on
different length scales using STM, AFM and 1D stylus. Note
that the (calculated) power spectra using the different
methods join smoothly in the wavevector regions where they
overlap. The slope of the dashed line corresponds to the Hurst
exponent H ¼ 0:72 or fractal dimension Df ¼ 2:28
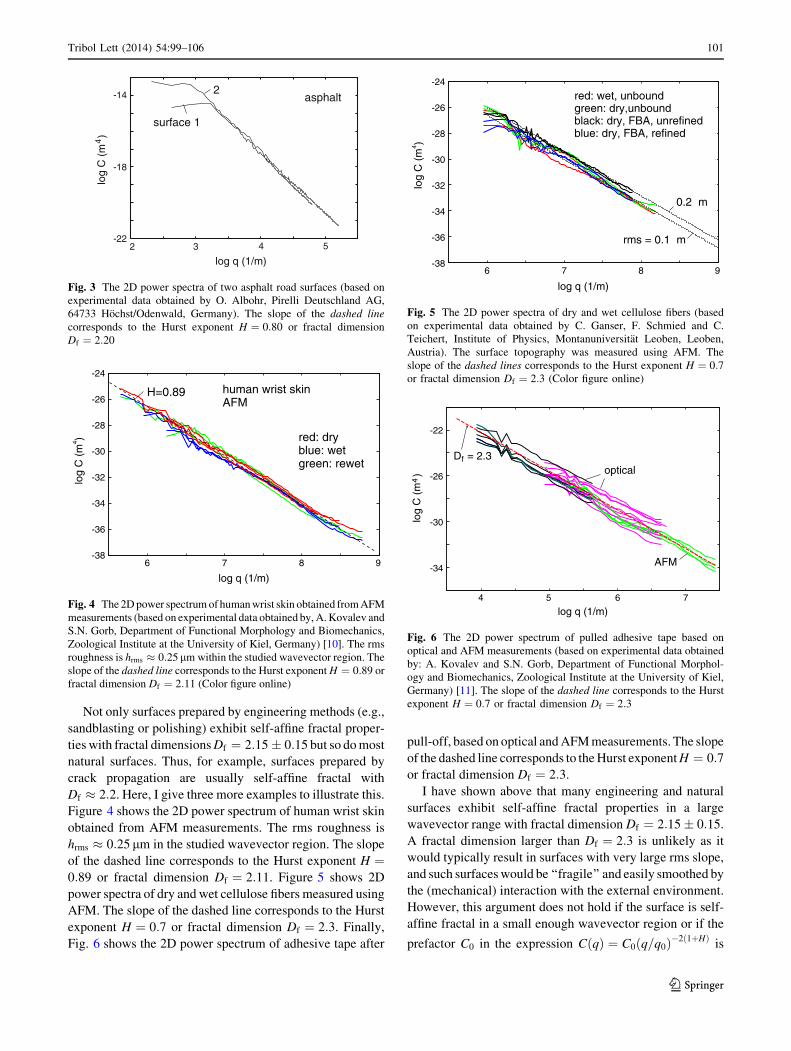
Figure 3 shows the power spectra of two asphalt road
surfaces. Both surfaces are self-affine fractal for large
wavevectors and exhibit a roll-off for small wavevectors
which is related to the largest stone particles (diameter d)
in the asphalt via qr � p=d. The fractal dimension of both
surfaces is Df � 2:20.
2 3 4 5 6 7-30
-28
-26
-24
-22
-20
-18
-16
sandblastedPMMA
H=1
log q (1/m)
log
C (
m4 )
Fig. 1 The 2D power spectrum of a sandblasted PMMA surface
based on height profiles measured using 1D-stylus instrument (based
on experimental data obtained from B. Lorenz, PGI, FZ Julich,
Germany) (log10 � log10 scale). The slope of the dashed line
corresponds to the Hurst exponent H ¼ 1 or fractal dimension Df ¼ 2
-404 6 8 10
-34
-28
-22
log q (1/m)
grinded steelrms = 0.5 µm
2D AFM
2D STM
1D line scan
log
C (
m )4
Fig. 2 The 2D power spectrum of a grinded steel surface (based on
experimental data obtained from A. Wohlers, IFAS, RWTH Aachen,
Germany). The slope of the dashed line corresponds to the Hurst
exponent H ¼ 0:72 or fractal dimension Df ¼ 2:28
100 Tribol Lett (2014) 54:99–106
123
Not only surfaces prepared by engineering methods (e.g.,
sandblasting or polishing) exhibit self-affine fractal proper-
ties with fractal dimensions Df ¼ 2:15� 0:15 but so do most
natural surfaces. Thus, for example, surfaces prepared by
crack propagation are usually self-affine fractal with
Df � 2:2. Here, I give three more examples to illustrate this.
Figure 4 shows the 2D power spectrum of human wrist skin
obtained from AFM measurements. The rms roughness is
hrms � 0:25 lm in the studied wavevector region. The slope
of the dashed line corresponds to the Hurst exponent H ¼0:89 or fractal dimension Df ¼ 2:11. Figure 5 shows 2D
power spectra of dry and wet cellulose fibers measured using
AFM. The slope of the dashed line corresponds to the Hurst
exponent H ¼ 0:7 or fractal dimension Df ¼ 2:3. Finally,
Fig. 6 shows the 2D power spectrum of adhesive tape after
pull-off, based on optical and AFM measurements. The slope
of the dashed line corresponds to the Hurst exponent H ¼ 0:7
or fractal dimension Df ¼ 2:3.
I have shown above that many engineering and natural
surfaces exhibit self-affine fractal properties in a large
wavevector range with fractal dimension Df ¼ 2:15� 0:15.
A fractal dimension larger than Df ¼ 2:3 is unlikely as it
would typically result in surfaces with very large rms slope,
and such surfaces would be ‘‘fragile’’ and easily smoothed by
the (mechanical) interaction with the external environment.
However, this argument does not hold if the surface is self-
affine fractal in a small enough wavevector region or if the
prefactor C0 in the expression CðqÞ ¼ C0ðq=q0Þ�2ð1þHÞis
-14
-18
-222 3 4 5
log q (1/m)
log
C (
m )4
asphalt
surface 1
2
Fig. 3 The 2D power spectra of two asphalt road surfaces (based on
experimental data obtained by O. Albohr, Pirelli Deutschland AG,
64733 Hochst/Odenwald, Germany). The slope of the dashed line
corresponds to the Hurst exponent H ¼ 0:80 or fractal dimension
Df ¼ 2:20
6 7 8 9-38
-36
-34
-32
-30
-28
-26
-24
log q (1/m)
log
C (
m4 ) red: dry
blue: wetgreen: rewet
H=0.89 human wrist skinAFM
Fig. 4 The 2D power spectrum of human wrist skin obtained from AFM
measurements (based on experimental data obtained by, A. Kovalev and
S.N. Gorb, Department of Functional Morphology and Biomechanics,
Zoological Institute at the University of Kiel, Germany) [10]. The rms
roughness is hrms � 0:25 lm within the studied wavevector region. The
slope of the dashed line corresponds to the Hurst exponent H ¼ 0:89 or
fractal dimension Df ¼ 2:11 (Color figure online)
6 7 8 9-38
-36
-34
-32
-30
-28
-26
-24
log q (1/m)
log
C (
m4 )
rms = 0.1µm
0.2µm
red: wet, unboundgreen: dry,unboundblack: dry, FBA, unrefinedblue: dry, FBA, refined
Fig. 5 The 2D power spectra of dry and wet cellulose fibers (based
on experimental data obtained by C. Ganser, F. Schmied and C.
Teichert, Institute of Physics, Montanuniversitat Leoben, Leoben,
Austria). The surface topography was measured using AFM. The
slope of the dashed lines corresponds to the Hurst exponent H ¼ 0:7or fractal dimension Df ¼ 2:3 (Color figure online)
log q (1/m)
optical
AFM
4 5 6 7
-34
-30
-26
-22
log
C (
m )4
D = 2.3f
Fig. 6 The 2D power spectrum of pulled adhesive tape based on
optical and AFM measurements (based on experimental data obtained
by: A. Kovalev and S.N. Gorb, Department of Functional Morphol-
ogy and Biomechanics, Zoological Institute at the University of Kiel,
Germany) [11]. The slope of the dashed line corresponds to the Hurst
exponent H ¼ 0:7 or fractal dimension Df ¼ 2:3
Tribol Lett (2014) 54:99–106 101
123
very small. In fact, self-affine fractal surfaces with the fractal
dimension Df ¼ 3 result when a liquid is cooled below its
glass transition temperature where the capillary waves on the
liquid surface get frozen-in. For capillary waves (see, e.g.,
Ref. [2]),
CðqÞ ¼ 1
ð2pÞ2kBT
qgþ cq2 ð7Þ
where q is the mass density, g the gravitation constant, and c
the liquid surface tension. For q q0 ¼ ðqg=cÞ1=2;we have
CðqÞ� q�2 and comparing this with the expression for a self-
affine fractal surface CðqÞ� q�2ð1þHÞ gives H ¼ 0 and
Df ¼ 3. In a typical case, the cut-off q0 � 103 m�1 so the
surface is self-affine fractal over a wide wavevector range,
but the rms roughness and the rms slope are still rather small
due to the small magnitude of C0 ¼ kBT=qg, which results
from the small magnitude of thermal energy kBT . Using
AFM, frozen capillary waves have recently been observed on
polymer surfaces (polyaryletherketone, with the glass tran-
sition temperature T g � 423 K and c � 0:03 J=m) [12]. The
measured power spectrum was found to be in beautiful
agreement with the theory prediction of (7). For this case,
including all the roughness with q [ q0, one can calculate the
rms roughness to be hrms � ðkBT=2pcÞ1=2½lnðq1=q0Þ1=2 �1 nm and the rms slope j � ðkBT=4pcÞ1=2
q1 � 1.
4 Simulation of Rough Surfaces: A Simple Erosion
Process
I have argued above that if a surface is self-affine fractal
over a large wavevector region (as it is often the case), it
usually has a fractal dimension \2.3, since otherwise the
rms slope would be so large (1) as to make the surface
fragile, and very sensitive to the impact of external objects
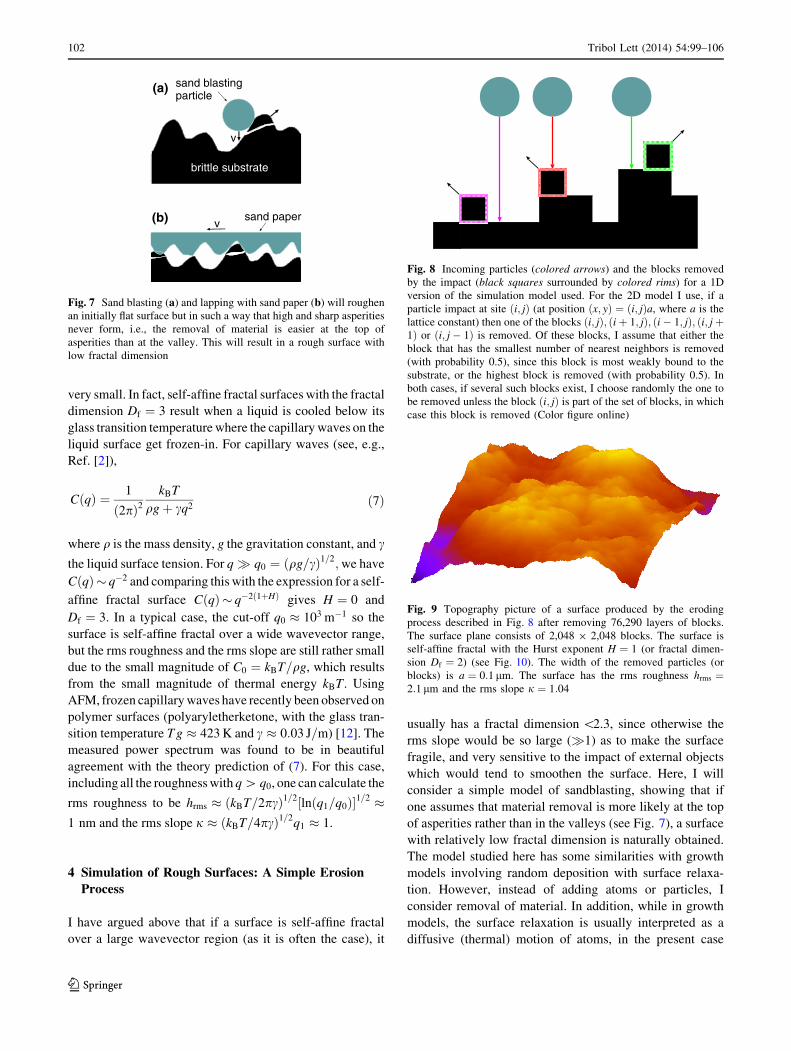
which would tend to smoothen the surface. Here, I will
consider a simple model of sandblasting, showing that if
one assumes that material removal is more likely at the top
of asperities rather than in the valleys (see Fig. 7), a surface
with relatively low fractal dimension is naturally obtained.
The model studied here has some similarities with growth
models involving random deposition with surface relaxa-
tion. However, instead of adding atoms or particles, I
consider removal of material. In addition, while in growth
models, the surface relaxation is usually interpreted as a
diffusive (thermal) motion of atoms, in the present case
v
sand blastingparticle
sand paperv
(a)
(b)
brittle substrate
Fig. 7 Sand blasting (a) and lapping with sand paper (b) will roughen
an initially flat surface but in such a way that high and sharp asperities
never form, i.e., the removal of material is easier at the top of
asperities than at the valley. This will result in a rough surface with
low fractal dimension
Fig. 8 Incoming particles (colored arrows) and the blocks removed
by the impact (black squares surrounded by colored rims) for a 1D
version of the simulation model used. For the 2D model I use, if a
particle impact at site ði; jÞ (at position ðx; yÞ ¼ ði; jÞa, where a is the
lattice constant) then one of the blocks ði; jÞ; ðiþ 1; jÞ; ði� 1; jÞ; ði; jþ1Þ or ði; j� 1Þ is removed. Of these blocks, I assume that either the
block that has the smallest number of nearest neighbors is removed
(with probability 0.5), since this block is most weakly bound to the
substrate, or the highest block is removed (with probability 0.5). In
both cases, if several such blocks exist, I choose randomly the one to
be removed unless the block ði; jÞ is part of the set of blocks, in which
case this block is removed (Color figure online)
Fig. 9 Topography picture of a surface produced by the eroding
process described in Fig. 8 after removing 76,290 layers of blocks.
The surface plane consists of 2,048 9 2,048 blocks. The surface is
self-affine fractal with the Hurst exponent H ¼ 1 (or fractal dimen-
sion Df ¼ 2) (see Fig. 10). The width of the removed particles (or
blocks) is a ¼ 0:1 lm. The surface has the rms roughness hrms ¼2:1 lm and the rms slope j ¼ 1:04
102 Tribol Lett (2014) 54:99–106
123
thermal effects are not directly involved (but may be
indirectly involved in determining whether the material
removal involves plastic flow or brittle fracture).
We now present a model for sandblasting, where a beam
of hard particles is sent on the surface orthogonal to the
originally flat substrate surface, and with a laterally uni-
form probability distribution. The substrate is considered as
a cubic lattice of blocks (or particles) and every particle
from the incoming beam removes a randomly chosen sur-
face block on the solid substrate. As shown in Fig. 8, if an
incoming particle impacts at site ði; jÞ (at position
ðx; yÞ ¼ ði; jÞa, where a is the lattice constant) then one of
the blocks ði; jÞ; ðiþ 1; jÞ; ði� 1; jÞ; ði; jþ 1Þ or ði; j� 1Þ is
removed. Of these blocks I assume that either (a) the block
that has the smallest number of nearest neighbors is
removed (with probability 0.5), since this block is most
weakly bound to the substrate, or (b) the block at the
highest position is removed (with probability 0.5). In both
cases, if several such blocks exist, I choose randomly the
one to remove unless the block ði; jÞ is part of the set of
blocks, in which case this block is removed. The substrate
surface consists of 2,048 9 2,048 blocks, and I assume
periodic boundary conditions. I note that the processes
(a) and (b) above are similar to the Wolf and Villain [13]
and Family [14] grows models, respectively.
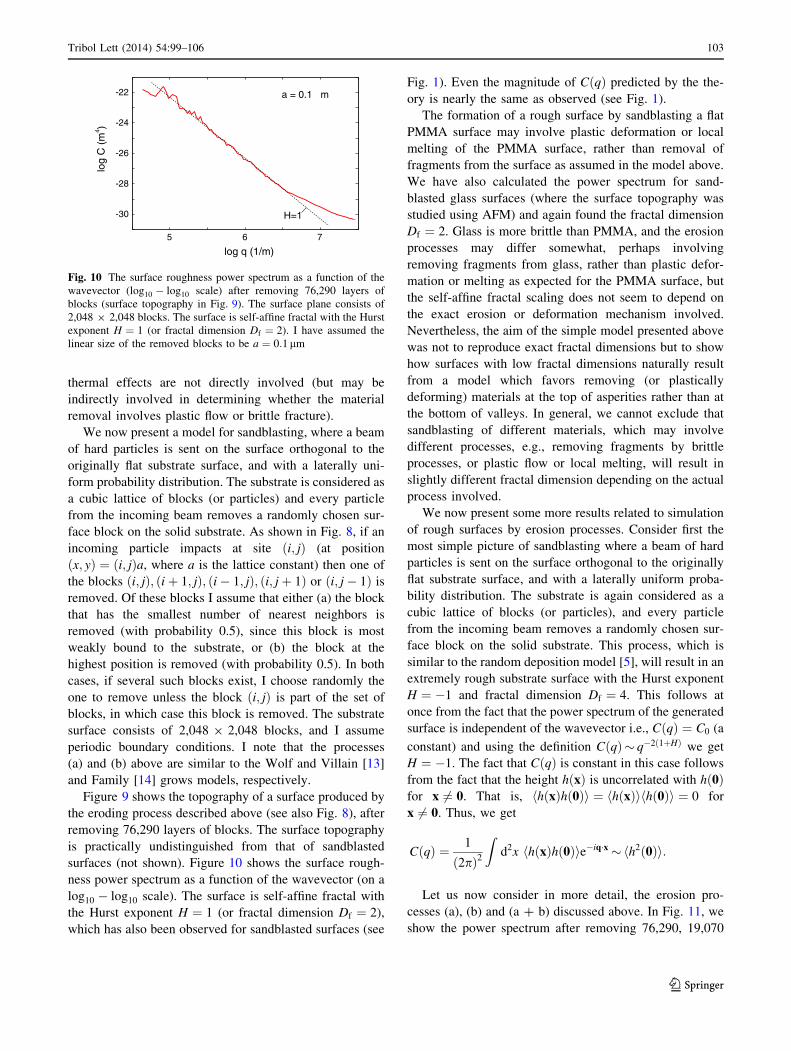
Figure 9 shows the topography of a surface produced by
the eroding process described above (see also Fig. 8), after
removing 76,290 layers of blocks. The surface topography
is practically undistinguished from that of sandblasted
surfaces (not shown). Figure 10 shows the surface rough-
ness power spectrum as a function of the wavevector (on a
log10 � log10 scale). The surface is self-affine fractal with
the Hurst exponent H ¼ 1 (or fractal dimension Df ¼ 2),
which has also been observed for sandblasted surfaces (see
Fig. 1). Even the magnitude of CðqÞ predicted by the the-
ory is nearly the same as observed (see Fig. 1).
The formation of a rough surface by sandblasting a flat
PMMA surface may involve plastic deformation or local
melting of the PMMA surface, rather than removal of
fragments from the surface as assumed in the model above.
We have also calculated the power spectrum for sand-
blasted glass surfaces (where the surface topography was
studied using AFM) and again found the fractal dimension
Df ¼ 2. Glass is more brittle than PMMA, and the erosion
processes may differ somewhat, perhaps involving
removing fragments from glass, rather than plastic defor-
mation or melting as expected for the PMMA surface, but
the self-affine fractal scaling does not seem to depend on
the exact erosion or deformation mechanism involved.
Nevertheless, the aim of the simple model presented above
was not to reproduce exact fractal dimensions but to show
how surfaces with low fractal dimensions naturally result
from a model which favors removing (or plastically
deforming) materials at the top of asperities rather than at
the bottom of valleys. In general, we cannot exclude that
sandblasting of different materials, which may involve
different processes, e.g., removing fragments by brittle
processes, or plastic flow or local melting, will result in
slightly different fractal dimension depending on the actual
process involved.
We now present some more results related to simulation
of rough surfaces by erosion processes. Consider first the
most simple picture of sandblasting where a beam of hard
particles is sent on the surface orthogonal to the originally
flat substrate surface, and with a laterally uniform proba-
bility distribution. The substrate is again considered as a
cubic lattice of blocks (or particles), and every particle
from the incoming beam removes a randomly chosen sur-
face block on the solid substrate. This process, which is
similar to the random deposition model [5], will result in an
extremely rough substrate surface with the Hurst exponent
H ¼ �1 and fractal dimension Df ¼ 4. This follows at
once from the fact that the power spectrum of the generated
surface is independent of the wavevector i.e., CðqÞ ¼ C0 (a
constant) and using the definition CðqÞ� q�2ð1þHÞ we get
H ¼ �1. The fact that CðqÞ is constant in this case follows
from the fact that the height hðxÞ is uncorrelated with hð0Þfor x 6¼ 0. That is, hhðxÞhð0Þi ¼ hhðxÞihhð0Þi ¼ 0 for
x 6¼ 0. Thus, we get
CðqÞ ¼ 1
ð2pÞ2Z
d2x hhðxÞhð0Þie�iq�x�hh2ð0Þi:
Let us now consider in more detail, the erosion pro-
cesses (a), (b) and (a ? b) discussed above. In Fig. 11, we
show the power spectrum after removing 76,290, 19,070
a = 0.1 µm
H=1
5 6 7
log q (1/m)
-30
-28
-26
-24
-22lo
g C
(m
4 )
Fig. 10 The surface roughness power spectrum as a function of the
wavevector (log10 � log10 scale) after removing 76,290 layers of
blocks (surface topography in Fig. 9). The surface plane consists of
2,048 9 2,048 blocks. The surface is self-affine fractal with the Hurst
exponent H ¼ 1 (or fractal dimension Df ¼ 2). I have assumed the
linear size of the removed blocks to be a ¼ 0:1 lm
Tribol Lett (2014) 54:99–106 103
123
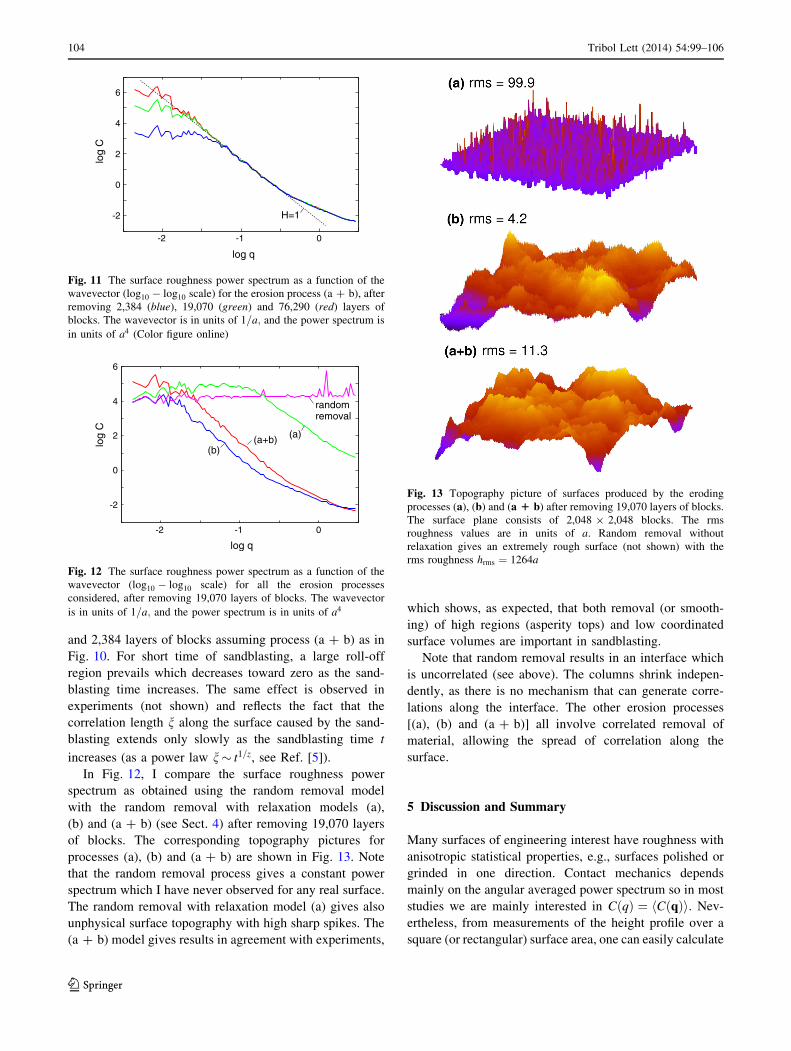
and 2,384 layers of blocks assuming process (a ? b) as in
Fig. 10. For short time of sandblasting, a large roll-off
region prevails which decreases toward zero as the sand-
blasting time increases. The same effect is observed in
experiments (not shown) and reflects the fact that the
correlation length n along the surface caused by the sand-
blasting extends only slowly as the sandblasting time t
increases (as a power law n� t1=z, see Ref. [5]).
In Fig. 12, I compare the surface roughness power
spectrum as obtained using the random removal model
with the random removal with relaxation models (a),
(b) and (a ? b) (see Sect. 4) after removing 19,070 layers
of blocks. The corresponding topography pictures for
processes (a), (b) and (a ? b) are shown in Fig. 13. Note
that the random removal process gives a constant power
spectrum which I have never observed for any real surface.
The random removal with relaxation model (a) gives also
unphysical surface topography with high sharp spikes. The
(a ? b) model gives results in agreement with experiments,
which shows, as expected, that both removal (or smooth-
ing) of high regions (asperity tops) and low coordinated
surface volumes are important in sandblasting.
Note that random removal results in an interface which
is uncorrelated (see above). The columns shrink indepen-
dently, as there is no mechanism that can generate corre-
lations along the interface. The other erosion processes
[(a), (b) and (a ? b)] all involve correlated removal of
material, allowing the spread of correlation along the
surface.
5 Discussion and Summary
Many surfaces of engineering interest have roughness with
anisotropic statistical properties, e.g., surfaces polished or
grinded in one direction. Contact mechanics depends
mainly on the angular averaged power spectrum so in most
studies we are mainly interested in CðqÞ ¼ hCðqÞi. Nev-
ertheless, from measurements of the height profile over a
square (or rectangular) surface area, one can easily calculate
-2 -1 0
log q
-2
0
2
4
6lo
g C
H=1
Fig. 11 The surface roughness power spectrum as a function of the
wavevector (log10 � log10 scale) for the erosion process (a ? b), after
removing 2,384 (blue), 19,070 (green) and 76,290 (red) layers of
blocks. The wavevector is in units of 1=a; and the power spectrum is
in units of a4 (Color figure online)
(a+b) (a)
(b)
randomremoval
-2 -1 0
-2
0
2
4
6
log q
log
C
Fig. 12 The surface roughness power spectrum as a function of the
wavevector (log10 � log10 scale) for all the erosion processes
considered, after removing 19,070 layers of blocks. The wavevector
is in units of 1=a; and the power spectrum is in units of a4
Fig. 13 Topography picture of surfaces produced by the eroding
processes (a), (b) and (a 1 b) after removing 19,070 layers of blocks.
The surface plane consists of 2,048 9 2,048 blocks. The rms
roughness values are in units of a. Random removal without
relaxation gives an extremely rough surface (not shown) with the
rms roughness hrms ¼ 1264a
104 Tribol Lett (2014) 54:99–106
123
the power spectrum as a function of q ¼ ðqx; qyÞ, and study
how it depends on the direction in the q-plane (e.g., along
the qx or qy-axis). This information can be used to obtain the
fractal properties of the surface in different directions. We
note that there are many different ways to determine the
fractal dimension of a self-affine fractal surface, but if the
surface really is self-affine fractal, then all the different
methods should give the same Hurst exponent.
We have studied the surface topography on asphalt road
surfaces, concrete road surfaces, sandblasted PMMA and
glass surfaces, polished and grinded PMMA, steel and
glass surfaces, rubber stoppers and glass and polymer
barrels for syringes and many more surfaces. We have used
AFM, engineering stylus and optical methods, and have
very good experience using AFM and stylus measure-
ments, but sometimes experienced problems using optical
methods to determine the power spectrum. Using the dif-
ferent experimental techniques described above, one can
study the surface roughness on all relevant length scales,
starting at, say, cm down to nm if necessary.
Surface roughness on engineering surfaces is important
for many different properties such as the heat and electric
contact resistance [15, 16], mixed lubrication [17], wear
and adhesion [18]. Thus, for example, one standard way to
reduce adhesion is to roughen surfaces. In wafer bonding,
one instead wants the surfaces to be as smooth as possible
and already surface roughness of order a few nanometer
(when measured over a length scale of � 100 lm) may
eliminate adhesion.
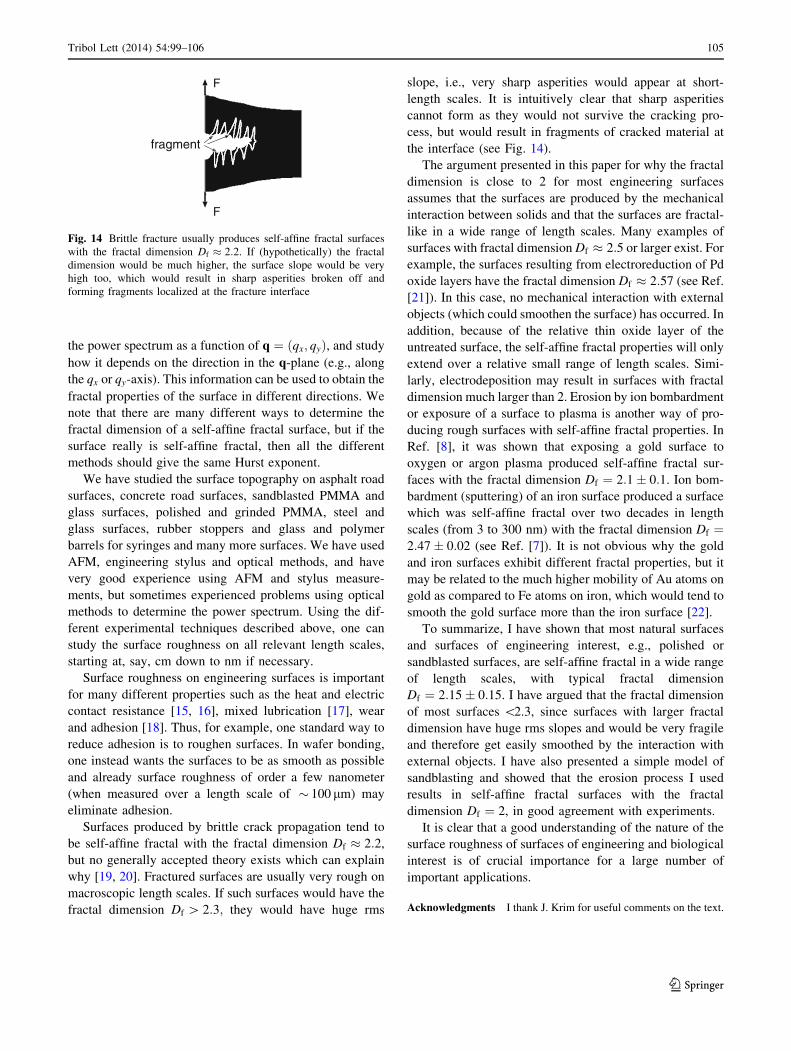
Surfaces produced by brittle crack propagation tend to
be self-affine fractal with the fractal dimension Df � 2:2,
but no generally accepted theory exists which can explain
why [19, 20]. Fractured surfaces are usually very rough on
macroscopic length scales. If such surfaces would have the
fractal dimension Df [ 2:3; they would have huge rms
slope, i.e., very sharp asperities would appear at short-
length scales. It is intuitively clear that sharp asperities
cannot form as they would not survive the cracking pro-
cess, but would result in fragments of cracked material at
the interface (see Fig. 14).
The argument presented in this paper for why the fractal
dimension is close to 2 for most engineering surfaces
assumes that the surfaces are produced by the mechanical
interaction between solids and that the surfaces are fractal-
like in a wide range of length scales. Many examples of
surfaces with fractal dimension Df � 2:5 or larger exist. For
example, the surfaces resulting from electroreduction of Pd
oxide layers have the fractal dimension Df � 2:57 (see Ref.
[21]). In this case, no mechanical interaction with external
objects (which could smoothen the surface) has occurred. In
addition, because of the relative thin oxide layer of the
untreated surface, the self-affine fractal properties will only
extend over a relative small range of length scales. Simi-
larly, electrodeposition may result in surfaces with fractal
dimension much larger than 2. Erosion by ion bombardment
or exposure of a surface to plasma is another way of pro-
ducing rough surfaces with self-affine fractal properties. In
Ref. [8], it was shown that exposing a gold surface to
oxygen or argon plasma produced self-affine fractal sur-
faces with the fractal dimension Df ¼ 2:1� 0:1. Ion bom-
bardment (sputtering) of an iron surface produced a surface
which was self-affine fractal over two decades in length
scales (from 3 to 300 nm) with the fractal dimension Df ¼2:47� 0:02 (see Ref. [7]). It is not obvious why the gold
and iron surfaces exhibit different fractal properties, but it
may be related to the much higher mobility of Au atoms on
gold as compared to Fe atoms on iron, which would tend to
smooth the gold surface more than the iron surface [22].
To summarize, I have shown that most natural surfaces
and surfaces of engineering interest, e.g., polished or
sandblasted surfaces, are self-affine fractal in a wide range
of length scales, with typical fractal dimension
Df ¼ 2:15� 0:15. I have argued that the fractal dimension
of most surfaces \2.3, since surfaces with larger fractal
dimension have huge rms slopes and would be very fragile
and therefore get easily smoothed by the interaction with
external objects. I have also presented a simple model of
sandblasting and showed that the erosion process I used
results in self-affine fractal surfaces with the fractal
dimension Df ¼ 2, in good agreement with experiments.
It is clear that a good understanding of the nature of the
surface roughness of surfaces of engineering and biological
interest is of crucial importance for a large number of
important applications.
Acknowledgments I thank J. Krim for useful comments on the text.
F
F
fragment
Fig. 14 Brittle fracture usually produces self-affine fractal surfaces
with the fractal dimension Df � 2:2. If (hypothetically) the fractal
dimension would be much higher, the surface slope would be very
high too, which would result in sharp asperities broken off and
forming fragments localized at the fracture interface
Tribol Lett (2014) 54:99–106 105
123
References
1. Persson, B.N.J.: Theory of rubber friction and contact mechanics.
J. Chem. Phys. 115, 3840 (2001)
2. Persson, B.N.J.: Contact mechanics for randomly rough surfaces.
Surf. Sci. Rep. 61, 201 (2006)
3. Persson, B.N.J., Albohr, O., Tartaglino, U., Volokitin, A.I.,
Tosatti, E.: On the nature of surface roughness with application to
contact mechanics, sealing, rubber friction and adhesion. J. Phys.
Condens. Matter 17, R1 (2005)
4. Krim, J.: Friction and energy dissipation mechanisms in adsorbed
molecules and molecularly thin films. Adv. Phys. 61, 155 (2012)
5. Barabasi, A.L., Stanley, H.E.: Fractal Concept in Surface Growth.
Cambridge University Press, Cambridge (1995)
6. Krim, J., Palasantzas, G.: Experimental-observations of self-
affine scaling and kinetic roughening at submicron length scales.
Int. J. Mod. Phys. B 9, 599–632 (1995)
7. Krim, J., Heyvaert, I., Van Haesendonck, C., Bruynseraede, Y.:
Scanning tunneling microscopy observation of self-affine fractal
roughness in ion-bombarded film surfaces. Phys. Rev. Lett. 70,
57–61 (1993)
8. Berman, D., Krim, J.: Impact of oxygen and argon plasma
exposure on the roughness of gold film surfaces. Thin Solid Films
520, 6201 (2012)
9. Carbone, G., Lorenz, B., Persson, B.N.J., Wohlers, A.: Contact
mechanics and rubber friction for randomly rough surfaces with
anisotropic statistical properties. Eur. Phys. J. 29, 275 (2009)
10. Persson, B.N.J., Kovalev, A., Gorb, S.N.: Tribol. Lett. doi:10.
1007/s11249-012-0053-2
11. Persson, B.N.J., Kovalev, A., Wasem, M., Gnecco, E., Gorb,
S.N.: Surface roughness of peeled adhesive tape: a mystery? EPL
92, 46001 (2010)
12. Pires, D., Gotsmann, B., Porro, F., Wiesmann, D., Duerig, U.,
Knoll, A.: Ultraflat templated polymer surfaces. Langmuir 25,
5141 (2009)
13. Wolf, D.E., Villain, J.: Growth with surface diffusion. Europhys.
Lett. 13, 389 (1990)
14. Family, F.: Scaling of rough surfaces: effects of surface diffusion.
J. Phys. A 19, L441 (1986)
15. Campana, C., Persson, B.N.J., Muser, M.H.: Transverse and
normal interfacial stiffness of solids with randomly rough sur-
faces. J. Phys. Condens. Matter 23, 085001 (2011)
16. Akarapu, S., Sharp, T., Robbins, M.O.: Stiffness of contacts
between rough surfaces. Phys. Rev. Lett. 106, 204301 (2011)
17. Persson, B.N.J., Scaraggi, M.: Lubricated sliding dynamics: flow
factors and Stribeck curve. Eur. J. Phys. E 34, 113 (2011)
18. Mulakaluri, N., Persson, B.N.J.: Adhesion between elastic solids
with randomly rough surfaces: comparison of analytical theory
with molecular-dynamics simulations. EPL 96, 66003 (2011)
19. Bouchaud, E.: Scaling properties of cracks. J. Phys. Condens.
Matter 9, 4319 (1997)
20. Bouchaud, E., Lapasset, G., Planes, J.: Fractal dimension of
fractured surfaces: a universal value? Europhys. Lett. 13, 73
(1990)
21. Kessler, T., Visintin, A., Bolzan, A.E., Andreasen, G., Salva-
rezza, R.C., Triaca, W.E., Arivia, A.J.: Electrochemical and
scanning force microscopy characterization of fractal palladium
surfaces resulting from the electroreduction of palladium oxide
layers. Langmuir 12, 6587 (1996)
22. Krim, J.: Private communication, North Carolina State Univer-
sity, Raleigh, NC (2013)
106 Tribol Lett (2014) 54:99–106
123