Embed Size (px)
Citation preview
GLOBAL INVESTMENT COMMITTEE / COMMENTARY APRIL 2018
On the Markets
MICHAEL WILSON
Chief Investment Officer Morgan Stanley Wealth Management Morgan Stanley & Co. Chief US Equity Strategist Morgan Stanley & Co.
TABLE OF CONTENTS
2 Inflation Fixation How much will inflation rise and how much of a problem will it be?
3 The Unpriced Inflation Agenda Government policies could make inflation worse than the market anticipates.
4 Banking on Dividend Growth Financials, growth utilities and global oil are some stock sectors to consider.
5 Is Credit at an Inflection Point? Low interest rates bolstered credit, but now quality is down and leverage is up.
6 Core Principles for Muni Investors Investors could benefit by relying on some basic principles.
7
Short Takes We look at real fed funds, how interest rates affect housing and credit downgrades in retail and apparel.
8 The Fourth Industrial Revolution Investing in the companies working on automation and AI may be key.
9 Taking the Markets’ Vital Signs Monitoring changes in financial conditions is critical. Here’s how it’s done.
12 Q&A: Upgrade Bond Portfolios Capital Group’s Mike Gitlin warns that now is not the time to stretch for yield.
Price Matters Success or failure is usually determined by a few key decisions or plays at critical moments. Most of our days consist of mundane tasks that everyone must do as part of their job and life. However, winning requires an ability to step up at those rare pivotal moments and take a risk—to stand away from the crowd.
Entering 2018, we were not nearly as bullish as we were last year on global equity markets, particularly the US and the Asian emerging markets. Part of this contrast was due to our very bullish outlook in 2017 rather than a fear of a dramatic change in our fundamental outlook. Instead, our key thesis was that asset prices at the end of 2017 were fuller than at any time since the onset of the financial crisis. In short, our call for an upward revaluation in 2017 had played out and in our view, price matters more than any other variable in the long run.
Fast forward three months and global equity valuations have adjusted significantly, particularly when taking into account the recent 0.2 percentage-point decline in long-term interest rates. Specifically, global equity valuations have fallen by 20% on our favored metric, the equity risk premium—the forward 12-month earnings yield minus the 10-year US Treasury yield. This is much more than the 10% correction in prices and more than accounts for the heightened risk around trade tensions, tighter financial conditions and a likely deceleration in economic growth and leading indicators.
As a result, we remain disciplined buyers of global equities as we believe the price you pay matters more today that it has in the past several years. Price is the margin of safety we have as investors. Pay a good price and you can ignore what happens tomorrow or the next day because a good entry point will almost always ensure a good return over the longer run. Pay too high a price and your odds of success go down dramatically. Pricing today, in our view, is an opportunity.
The other thing to remember is that markets are going to remain more volatile than in the past few years. While it may feel a little crazy with the stock market bouncing around so much, the past several months’ behavior is more normal than the past few years when market volatility was subdued. Our advice: Don’t chase high prices as many did in January. Instead, be disciplined and patient, and take advantage of the volatility when it gives you lower prices, like today.
ON THE MARKETS / ECONOMICS
Please refer to important information, disclosures and qualifications at the end of this material. April 2018 2
ANDREW SHEETS Chief Cross-Asset Strategist Morgan Stanley & Co.
he question of inflation—how much it will rise and how much of a problem
that will be—is likely to dominate markets for the next few months. Sure, something else could come along but, based on our economists’ forecasts, we’re set to have higher core prices in the US, Europe and Japan. This comes at a time when the unemployment rate in the OECD has never been lower and fiscal policy is unusually expansionary. Rarely, we’d argue, does a narrative present itself so clearly.
That prices are rising is not necessarily a bad thing. Rising inflation is a pretty normal development when solid growth is using up spare capacity. It can be a good thing for equity holders receiving nominal cash flows, or creditors who find the real value of their obligations declining—and it’s certainly preferable for most risky assets than a backdrop in which prices fall.
IMPORTANCE OF GROWTH. These are all good arguments, backed by data. What I think they understate, however, is the
importance of growth in allowing markets to weather higher inflation. That’s a relatively constant feature in the historical data, and it was certainly a feature of year-to-date resilience; higher inflation, real rates and volatility unfolded against good global data and the strongest quarter for S&P 500 earnings revisions breadth since 1998.
That is why I, and a number of my colleagues, expect the market environment to get trickier. After 12 months of falling core inflation and rising global purchasing managers indexes (PMIs), we are set to enter a period of rising core inflation and likely declining PMIs. That’s a major change, and prior “inflation up, PMIs down” periods—in 2000, late 2007 and 2011—caused higher volatility.
THE RISK OF EXTRAPOLATION. Our concern isn’t about the level of inflation. Core inflation remains below 2.0% annualized across the G3 this year, according to Morgan Stanley & Co.’s estimates. PMIs will likely remain above 50, signaling economic expansion. For us,
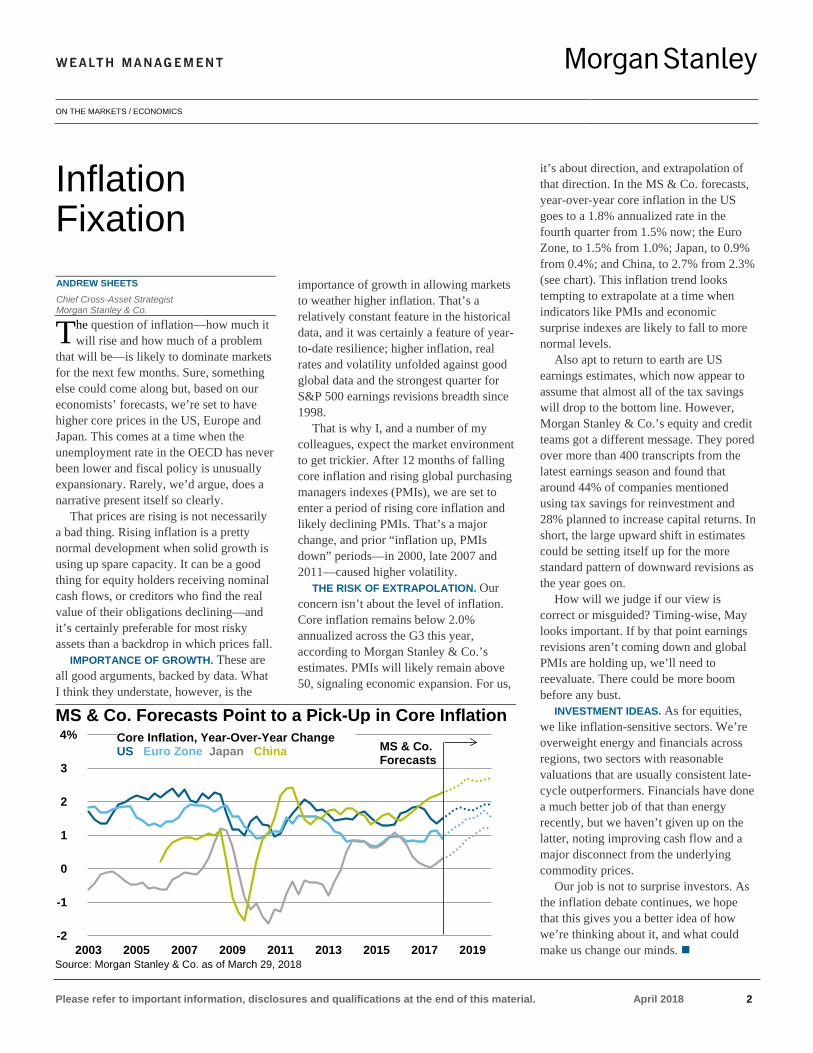
it’s about direction, and extrapolation of that direction. In the MS & Co. forecasts, year-over-year core inflation in the US goes to a 1.8% annualized rate in the fourth quarter from 1.5% now; the Euro Zone, to 1.5% from 1.0%; Japan, to 0.9% from 0.4%; and China, to 2.7% from 2.3% (see chart). This inflation trend looks tempting to extrapolate at a time when indicators like PMIs and economic surprise indexes are likely to fall to more normal levels.
Also apt to return to earth are US earnings estimates, which now appear to assume that almost all of the tax savings will drop to the bottom line. However, Morgan Stanley & Co.’s equity and credit teams got a different message. They pored over more than 400 transcripts from the latest earnings season and found that around 44% of companies mentioned using tax savings for reinvestment and 28% planned to increase capital returns. In short, the large upward shift in estimates could be setting itself up for the more standard pattern of downward revisions as the year goes on.
How will we judge if our view is correct or misguided? Timing-wise, May looks important. If by that point earnings revisions aren’t coming down and global PMIs are holding up, we’ll need to reevaluate. There could be more boom before any bust.
INVESTMENT IDEAS. As for equities, we like inflation-sensitive sectors. We’re overweight energy and financials across regions, two sectors with reasonable valuations that are usually consistent late-cycle outperformers. Financials have done a much better job of that than energy recently, but we haven’t given up on the latter, noting improving cash flow and a major disconnect from the underlying commodity prices.
Our job is not to surprise investors. As the inflation debate continues, we hope that this gives you a better idea of how we’re thinking about it, and what could make us change our minds.
Inflation Fixation
T
MS & Co. Forecasts Point to a Pick-Up in Core Inflation
Source: Morgan Stanley & Co. as of March 29, 2018
-2
-1
0
1
2
3
4%
2003 2005 2007 2009 2011 2013 2015 2017 2019
MS & Co.Forecasts
Core Inflation, Year-Over-Year Change US Euro Zone Japan China
ON THE MARKETS / POLICY
Please refer to important information, disclosures and qualifications at the end of this material. April 2018 3
LISA SHALETT Head of Wealth Management Investment Resources Head of Investment & Portfolio Strategies Morgan Stanley Wealth Management
o far this year, the stock market has struggled with a stimulative US fiscal
policy that translates into stronger economic growth, albeit with slightly higher long-term interest rates. Reasons for higher rates include a 30% year-over-year jump in Treasury issuance, a budget deficit growing to nearly 6% of GDP and inflation expectations that vacillate between 2.0% and 2.1%. While February’s average hourly earnings and consumer prices were okay, they are trailing indicators. All told, we are concerned about bond market complacency.
INFLATIONARY PRESSURE. In our view, policies coming out of Washington are aggressively proinflation. Although tariffs already announced may be too small to impact prices, we worry that supply-chain pressures, an overtly weak dollar policy, protectionist actions against China, failure to reach a new NAFTA deal,
blocked cross-border mergers and new State Department leadership could drive inflation higher than expected.
Inflationary pressures abound. The US Producer Price Index (PPI) indicates inflation in the manufacturing supply chain. In February, the headline PPI rose 2.8% year over year, with the core up 2.7%. Survey data from the National Federation of Independent Business and the Business Roundtable show businesses large and small plan to expand, hire workers—and raise wages.
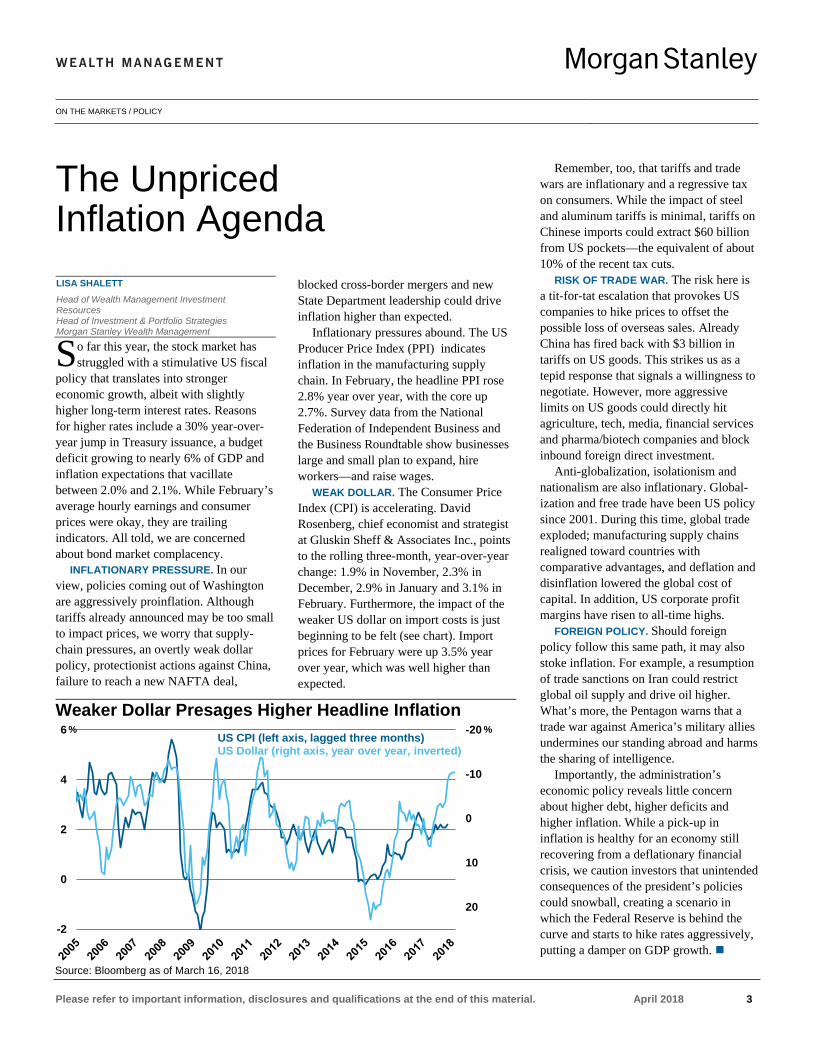
WEAK DOLLAR. The Consumer Price Index (CPI) is accelerating. David Rosenberg, chief economist and strategist at Gluskin Sheff & Associates Inc., points to the rolling three-month, year-over-year change: 1.9% in November, 2.3% in December, 2.9% in January and 3.1% in February. Furthermore, the impact of the weaker US dollar on import costs is just beginning to be felt (see chart). Import prices for February were up 3.5% year over year, which was well higher than expected.
Remember, too, that tariffs and trade wars are inflationary and a regressive tax on consumers. While the impact of steel and aluminum tariffs is minimal, tariffs on Chinese imports could extract $60 billion from US pockets—the equivalent of about 10% of the recent tax cuts.
RISK OF TRADE WAR. The risk here is a tit-for-tat escalation that provokes US companies to hike prices to offset the possible loss of overseas sales. Already China has fired back with $3 billion in tariffs on US goods. This strikes us as a tepid response that signals a willingness to negotiate. However, more aggressive limits on US goods could directly hit agriculture, tech, media, financial services and pharma/biotech companies and block inbound foreign direct investment.
Anti-globalization, isolationism and nationalism are also inflationary. Global-ization and free trade have been US policy since 2001. During this time, global trade exploded; manufacturing supply chains realigned toward countries with comparative advantages, and deflation and disinflation lowered the global cost of capital. In addition, US corporate profit margins have risen to all-time highs.
FOREIGN POLICY. Should foreign policy follow this same path, it may also stoke inflation. For example, a resumption of trade sanctions on Iran could restrict global oil supply and drive oil higher. What’s more, the Pentagon warns that a trade war against America’s military allies undermines our standing abroad and harms the sharing of intelligence.
Importantly, the administration’s economic policy reveals little concern about higher debt, higher deficits and higher inflation. While a pick-up in inflation is healthy for an economy still recovering from a deflationary financial crisis, we caution investors that unintended consequences of the president’s policies could snowball, creating a scenario in which the Federal Reserve is behind the curve and starts to hike rates aggressively, putting a damper on GDP growth.
The Unpriced Inflation Agenda
S
Weaker Dollar Presages Higher Headline Inflation
Source: Bloomberg as of March 16, 2018
-20
-10
0
10
20
-2
0
2
4
6US CPI (left axis, lagged three months)US Dollar (right axis, year over year, inverted)
% %
ON THE MARKETS / EQUITIES
Please refer to important information, disclosures and qualifications at the end of this material. April 2018 4
DAN SKELLY Senior Equity Analyst Morgan Stanley Wealth Management KEVIN DEMERS, CFA Equity Analyst Morgan Stanley Wealth Management
ising interest rates have led to a broad sell-off in many dividend-paying
stocks and sectors. Now, we are starting to see opportunities, particularly in sectors that exhibit high dividend growth, which we believe should be better insulated from rising inflation and interest rates.
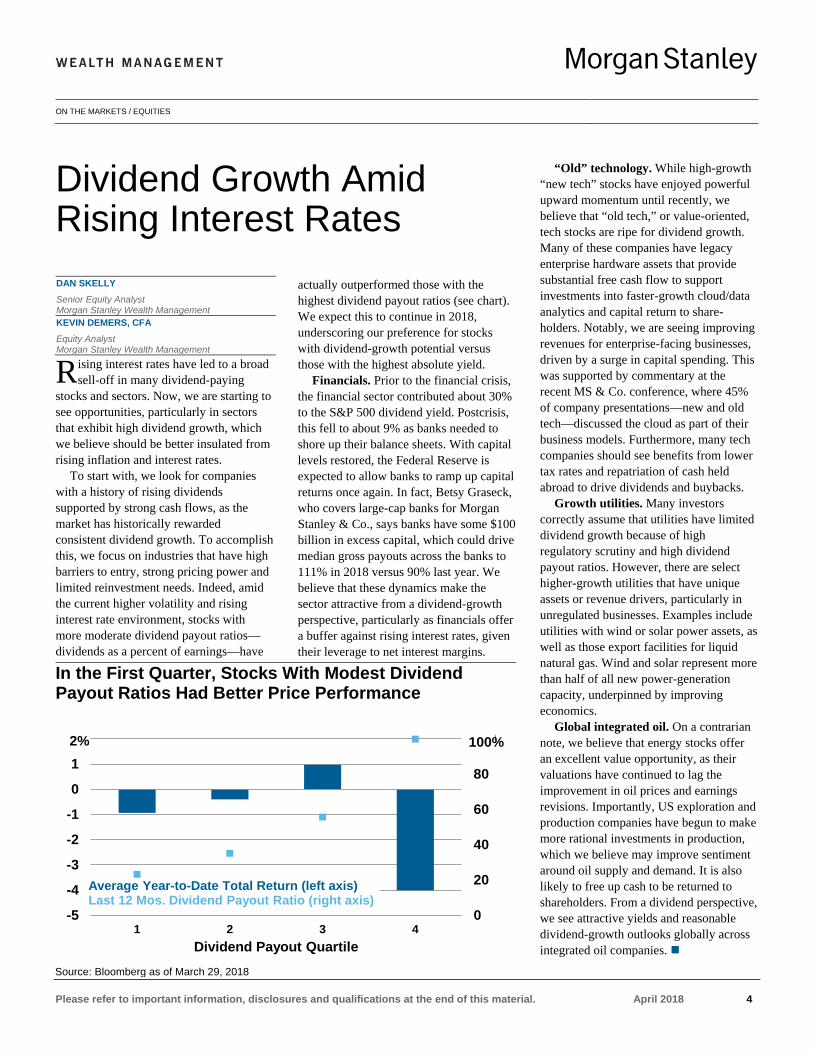
To start with, we look for companies with a history of rising dividends supported by strong cash flows, as the market has historically rewarded consistent dividend growth. To accomplish this, we focus on industries that have high barriers to entry, strong pricing power and limited reinvestment needs. Indeed, amid the current higher volatility and rising interest rate environment, stocks with more moderate dividend payout ratios—dividends as a percent of earnings—have
actually outperformed those with the highest dividend payout ratios (see chart). We expect this to continue in 2018, underscoring our preference for stocks with dividend-growth potential versus those with the highest absolute yield.
Financials. Prior to the financial crisis, the financial sector contributed about 30% to the S&P 500 dividend yield. Postcrisis, this fell to about 9% as banks needed to shore up their balance sheets. With capital levels restored, the Federal Reserve is expected to allow banks to ramp up capital returns once again. In fact, Betsy Graseck, who covers large-cap banks for Morgan Stanley & Co., says banks have some $100 billion in excess capital, which could drive median gross payouts across the banks to 111% in 2018 versus 90% last year. We believe that these dynamics make the sector attractive from a dividend-growth perspective, particularly as financials offer a buffer against rising interest rates, given their leverage to net interest margins.
“Old” technology. While high-growth “new tech” stocks have enjoyed powerful upward momentum until recently, we believe that “old tech,” or value-oriented, tech stocks are ripe for dividend growth. Many of these companies have legacy enterprise hardware assets that provide substantial free cash flow to support investments into faster-growth cloud/data analytics and capital return to share-holders. Notably, we are seeing improving revenues for enterprise-facing businesses, driven by a surge in capital spending. This was supported by commentary at the recent MS & Co. conference, where 45% of company presentations—new and old tech—discussed the cloud as part of their business models. Furthermore, many tech companies should see benefits from lower tax rates and repatriation of cash held abroad to drive dividends and buybacks.
Growth utilities. Many investors correctly assume that utilities have limited dividend growth because of high regulatory scrutiny and high dividend payout ratios. However, there are select higher-growth utilities that have unique assets or revenue drivers, particularly in unregulated businesses. Examples include utilities with wind or solar power assets, as well as those export facilities for liquid natural gas. Wind and solar represent more than half of all new power-generation capacity, underpinned by improving economics.
Global integrated oil. On a contrarian note, we believe that energy stocks offer an excellent value opportunity, as their valuations have continued to lag the improvement in oil prices and earnings revisions. Importantly, US exploration and production companies have begun to make more rational investments in production, which we believe may improve sentiment around oil supply and demand. It is also likely to free up cash to be returned to shareholders. From a dividend perspective, we see attractive yields and reasonable dividend-growth outlooks globally across integrated oil companies.
Dividend Growth Amid Rising Interest Rates
R
In the First Quarter, Stocks With Modest Dividend Payout Ratios Had Better Price Performance
Source: Bloomberg as of March 29, 2018
0
20
40
60
80
100
-5
-4
-3
-2
-1
0
1
2
1 2 3 4Dividend Payout Quartile
2% 100%
Average Year-to-Date Total Return (left axis)Last 12 Mos. Dividend Payout Ratio (right axis)
ON THE MARKETS / FIXED INCOME
Please refer to important information, disclosures and qualifications at the end of this material. April 2018 5
LUCY YAN Cross-Asset Strategist Morgan Stanley Wealth Management
uring this economic cycle, US corporations have been major
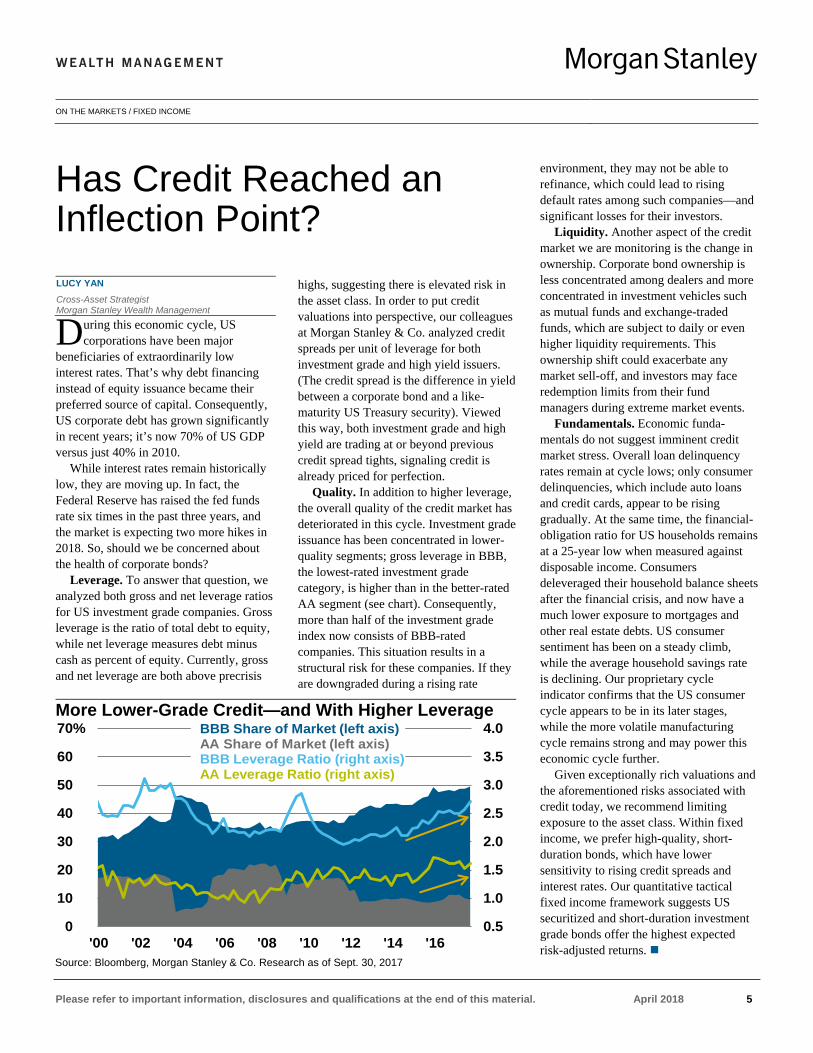
beneficiaries of extraordinarily low interest rates. That’s why debt financing instead of equity issuance became their preferred source of capital. Consequently, US corporate debt has grown significantly in recent years; it’s now 70% of US GDP versus just 40% in 2010.
While interest rates remain historically low, they are moving up. In fact, the Federal Reserve has raised the fed funds rate six times in the past three years, and the market is expecting two more hikes in 2018. So, should we be concerned about the health of corporate bonds?
Leverage. To answer that question, we analyzed both gross and net leverage ratios for US investment grade companies. Gross leverage is the ratio of total debt to equity, while net leverage measures debt minus cash as percent of equity. Currently, gross and net leverage are both above precrisis
highs, suggesting there is elevated risk in the asset class. In order to put credit valuations into perspective, our colleagues at Morgan Stanley & Co. analyzed credit spreads per unit of leverage for both investment grade and high yield issuers. (The credit spread is the difference in yield between a corporate bond and a like-maturity US Treasury security). Viewed this way, both investment grade and high yield are trading at or beyond previous credit spread tights, signaling credit is already priced for perfection.
Quality. In addition to higher leverage, the overall quality of the credit market has deteriorated in this cycle. Investment grade issuance has been concentrated in lower-quality segments; gross leverage in BBB, the lowest-rated investment grade category, is higher than in the better-rated AA segment (see chart). Consequently, more than half of the investment grade index now consists of BBB-rated companies. This situation results in a structural risk for these companies. If they are downgraded during a rising rate
environment, they may not be able to refinance, which could lead to rising default rates among such companies—and significant losses for their investors.
Liquidity. Another aspect of the credit market we are monitoring is the change in ownership. Corporate bond ownership is less concentrated among dealers and more concentrated in investment vehicles such as mutual funds and exchange-traded funds, which are subject to daily or even higher liquidity requirements. This ownership shift could exacerbate any market sell-off, and investors may face redemption limits from their fund managers during extreme market events.
Fundamentals. Economic funda-mentals do not suggest imminent credit market stress. Overall loan delinquency rates remain at cycle lows; only consumer delinquencies, which include auto loans and credit cards, appear to be rising gradually. At the same time, the financial-obligation ratio for US households remains at a 25-year low when measured against disposable income. Consumers deleveraged their household balance sheets after the financial crisis, and now have a much lower exposure to mortgages and other real estate debts. US consumer sentiment has been on a steady climb, while the average household savings rate is declining. Our proprietary cycle indicator confirms that the US consumer cycle appears to be in its later stages, while the more volatile manufacturing cycle remains strong and may power this economic cycle further.
Given exceptionally rich valuations and the aforementioned risks associated with credit today, we recommend limiting exposure to the asset class. Within fixed income, we prefer high-quality, short-duration bonds, which have lower sensitivity to rising credit spreads and interest rates. Our quantitative tactical fixed income framework suggests US securitized and short-duration investment grade bonds offer the highest expected risk-adjusted returns.
Has Credit Reached an Inflection Point?
D
More Lower-Grade Credit—and With Higher Leverage
Source: Bloomberg, Morgan Stanley & Co. Research as of Sept. 30, 2017
0.5
1.0
1.5
2.0
2.5
3.0
3.5
4.0
0%
10%
20%
30%
40%
50%
60%
70%
'00 '02 '04 '06 '08 '10 '12 '14 '16
BBB Share of Market (left axis) AA Share of Market (left axis) BBB Leverage Ratio (right axis)AA Leverage Ratio (right axis)
ON THE MARKETS / MUNICIPAL BONDS
Please refer to important information, disclosures and qualifications at the end of this material. April 2018 6
MICHAEL ZEZAS Strategist Morgan Stanley & Co.
olatility is back, and investors seem confused. It’s times like these that
increase the value of secular principles and a longer-term fundamental outlook in navigating markets. Our clients seem to want to invest in municipal bonds by timing turning points in interest rates, but precisely timing rate moves can be difficult. What's more, staying in short-duration securities while waiting for those points means sacrificing munis’ tax-exempt income. We think investors benefit more by relying on some basic principles.
You’re more macro investor than you think. Credit risk only matters when it’s systemic. Better growth and lower recession odds in 2018 mean that we do not expect systemic credit risks to impact munis in the near term, despite secular risks to state and local credit. Therefore, these key drivers for returns will likely remain macro cues: the level of interest rates and the shape of the yield curve.
If one has a conviction that the curve will “bear steepen”— both long- and short-term rates go up, but the long go up more than short—bonds will be less desirable. But bear steepening is uncommon. Since 1981, bear steepeners between two-year and 10-year bonds over a three-month period occurred only 10% of the time; between 10-year and 30-year bonds, just 5% of the time.
If one has a conviction that rates will remain stable to lower and/or that the yield curve will flatten from here, then munis’ longer-maturity profile becomes more asset than liability. Given our macro outlook, we think munis will continue to be a fixed income outperformer this year.
Supply still doesn’t matter. We see scant evidence that supply technicals meaningfully impact total or excess returns over investable time periods. Hence, barring an extreme supply swing (not our expectation), we think supply will remain a neutral factor this year.
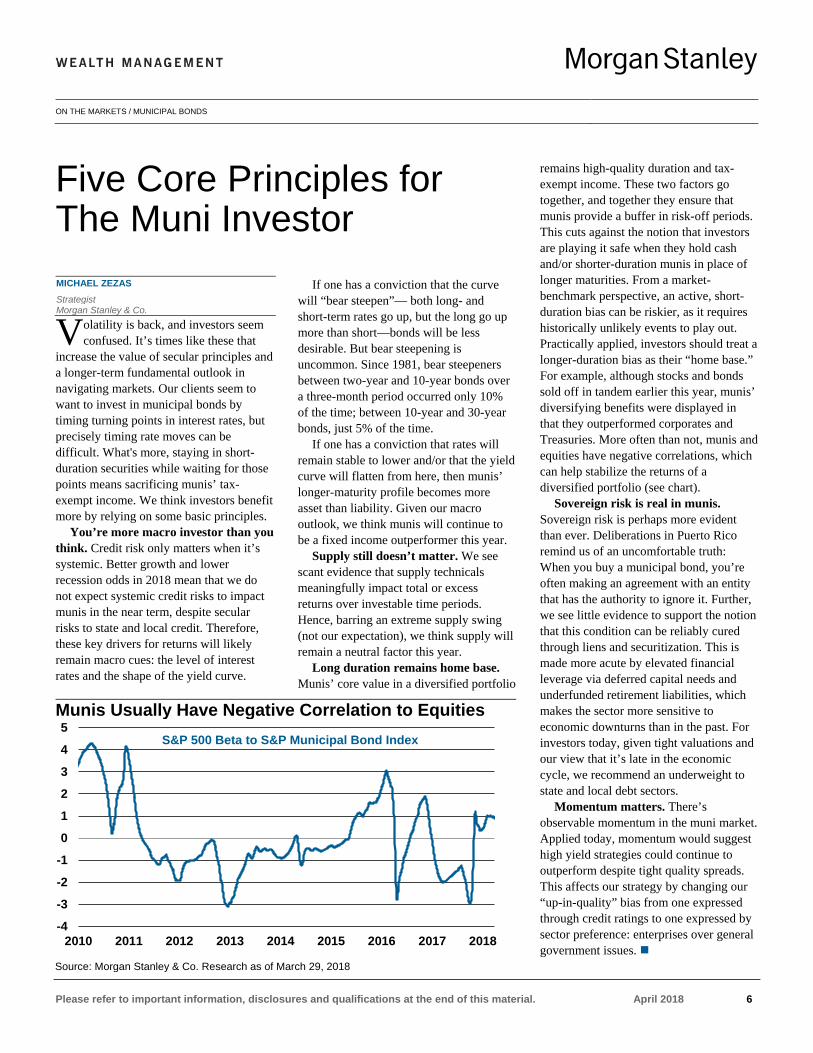
Long duration remains home base. Munis’ core value in a diversified portfolio
remains high-quality duration and tax-exempt income. These two factors go together, and together they ensure that munis provide a buffer in risk-off periods. This cuts against the notion that investors are playing it safe when they hold cash and/or shorter-duration munis in place of longer maturities. From a market-benchmark perspective, an active, short-duration bias can be riskier, as it requires historically unlikely events to play out. Practically applied, investors should treat a longer-duration bias as their “home base.” For example, although stocks and bonds sold off in tandem earlier this year, munis’ diversifying benefits were displayed in that they outperformed corporates and Treasuries. More often than not, munis and equities have negative correlations, which can help stabilize the returns of a diversified portfolio (see chart).
Sovereign risk is real in munis. Sovereign risk is perhaps more evident than ever. Deliberations in Puerto Rico remind us of an uncomfortable truth: When you buy a municipal bond, you’re often making an agreement with an entity that has the authority to ignore it. Further, we see little evidence to support the notion that this condition can be reliably cured through liens and securitization. This is made more acute by elevated financial leverage via deferred capital needs and underfunded retirement liabilities, which makes the sector more sensitive to economic downturns than in the past. For investors today, given tight valuations and our view that it’s late in the economic cycle, we recommend an underweight to state and local debt sectors.
Momentum matters. There’s observable momentum in the muni market. Applied today, momentum would suggest high yield strategies could continue to outperform despite tight quality spreads. This affects our strategy by changing our “up-in-quality” bias from one expressed through credit ratings to one expressed by sector preference: enterprises over general government issues.
Five Core Principles for The Muni Investor
V
Munis Usually Have Negative Correlation to Equities
Source: Morgan Stanley & Co. Research as of March 29, 2018
-4
-3
-2
-1
0
1
2
3
4
5
2010 2011 2012 2013 2014 2015 2016 2017 2018
S&P 500 Beta to S&P Municipal Bond Index
ON THE MARKETS / SHORT TAKES
Please refer to important information, disclosures and qualifications at the end of this material. April 2018 7
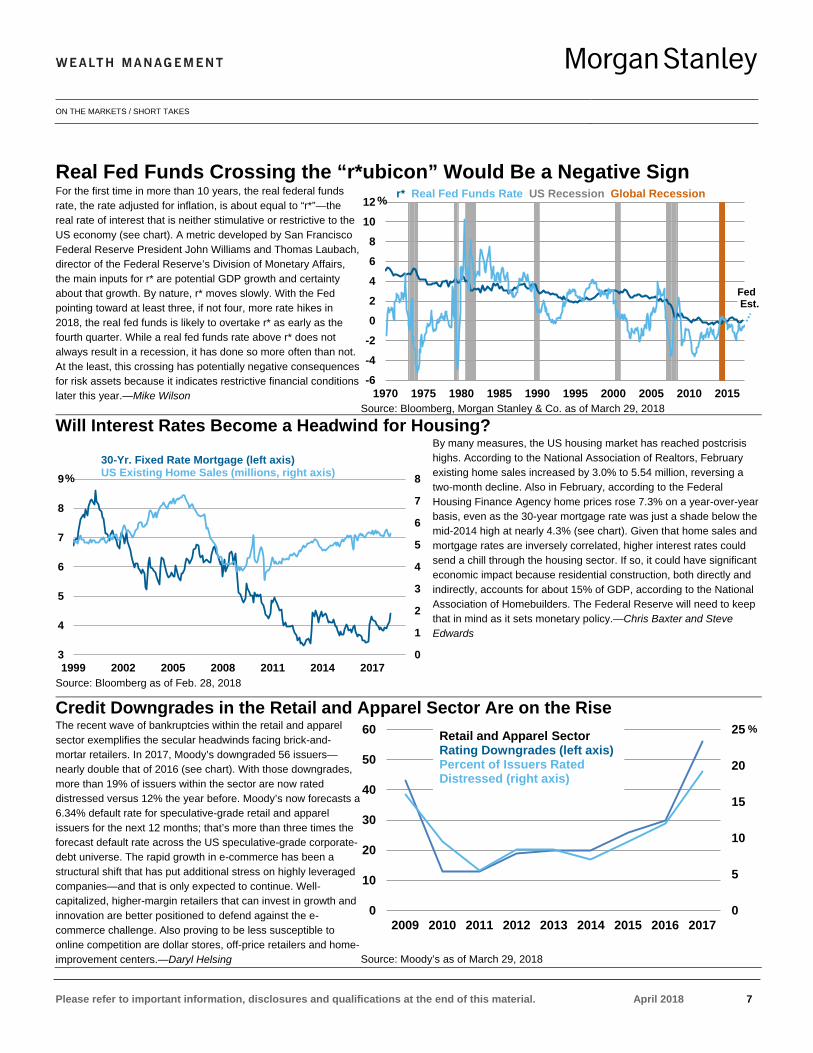
Real Fed Funds Crossing the “r*ubicon” Would Be a Negative Sign For the first time in more than 10 years, the real federal funds rate, the rate adjusted for inflation, is about equal to “r*”—the real rate of interest that is neither stimulative or restrictive to the US economy (see chart). A metric developed by San Francisco Federal Reserve President John Williams and Thomas Laubach, director of the Federal Reserve’s Division of Monetary Affairs, the main inputs for r* are potential GDP growth and certainty about that growth. By nature, r* moves slowly. With the Fed pointing toward at least three, if not four, more rate hikes in 2018, the real fed funds is likely to overtake r* as early as the fourth quarter. While a real fed funds rate above r* does not always result in a recession, it has done so more often than not. At the least, this crossing has potentially negative consequences for risk assets because it indicates restrictive financial conditions later this year.—Mike Wilson
Source: Bloomberg, Morgan Stanley & Co. as of March 29, 2018 Will Interest Rates Become a Headwind for Housing?
Source: Bloomberg as of Feb. 28, 2018
By many measures, the US housing market has reached postcrisis highs. According to the National Association of Realtors, February existing home sales increased by 3.0% to 5.54 million, reversing a two-month decline. Also in February, according to the Federal Housing Finance Agency home prices rose 7.3% on a year-over-year basis, even as the 30-year mortgage rate was just a shade below the mid-2014 high at nearly 4.3% (see chart). Given that home sales and mortgage rates are inversely correlated, higher interest rates could send a chill through the housing sector. If so, it could have significant economic impact because residential construction, both directly and indirectly, accounts for about 15% of GDP, according to the National Association of Homebuilders. The Federal Reserve will need to keep that in mind as it sets monetary policy.—Chris Baxter and Steve Edwards
Credit Downgrades in the Retail and Apparel Sector Are on the Rise The recent wave of bankruptcies within the retail and apparel sector exemplifies the secular headwinds facing brick-and-mortar retailers. In 2017, Moody’s downgraded 56 issuers—nearly double that of 2016 (see chart). With those downgrades, more than 19% of issuers within the sector are now rated distressed versus 12% the year before. Moody’s now forecasts a 6.34% default rate for speculative-grade retail and apparel issuers for the next 12 months; that’s more than three times the forecast default rate across the US speculative-grade corporate-debt universe. The rapid growth in e-commerce has been a structural shift that has put additional stress on highly leveraged companies—and that is only expected to continue. Well-capitalized, higher-margin retailers that can invest in growth and innovation are better positioned to defend against the e-commerce challenge. Also proving to be less susceptible to online competition are dollar stores, off-price retailers and home-improvement centers.—Daryl Helsing Source: Moody’s as of March 29, 2018
-6
-4
-2
0
2
4
6
8
10
12
1970 1975 1980 1985 1990 1995 2000 2005 2010 2015
r* Real Fed Funds Rate US Recession Global Recession
FedEst.
%
0
1
2
3
4
5
6
7
8
3
4
5
6
7
8
9
1999 2002 2005 2008 2011 2014 2017
30-Yr. Fixed Rate Mortgage (left axis)US Existing Home Sales (millions, right axis)%
0
5
10
15
20
25
0
10
20
30
40
50
60
2009 2010 2011 2012 2013 2014 2015 2016 2017
%555555
Retail and Apparel Sector Rating Downgrades (left axis)Percent of Issuers RatedDistressed (right axis)
%
ON THE MARKETS / THEMATIC INVESTING
Please refer to important information, disclosures and qualifications at the end of this material. April 2018 8
SCOTT HELFSTEIN, PhD Market Strategist Morgan Stanley Wealth Management
ince the 1950s, scientists have forecasted the coming of intelligent
machines. The popularity of films like 2001: A Space Odyssey, The Terminator and The Matrix show that machines with advanced reasoning power evoke curiosity, wonder and concern.
A machine that replicates human reasoning and abstraction likely remains some distance off. Still, advances in computational capabilities and sensing technology make automation attractive for many companies. The latest innovations in artificial intelligence and robotics could generate a meaningful economic impact.
NO DOMINANT APPROACH. Original concepts like neural networks have progressed to new technologies like “deep reinforcement learning,” “generative adversarial networks” and “computational revealed algorithms.” No single
technology seems to dominate. Rather, there is a range of methods that are best when paired with appropriate tasks.
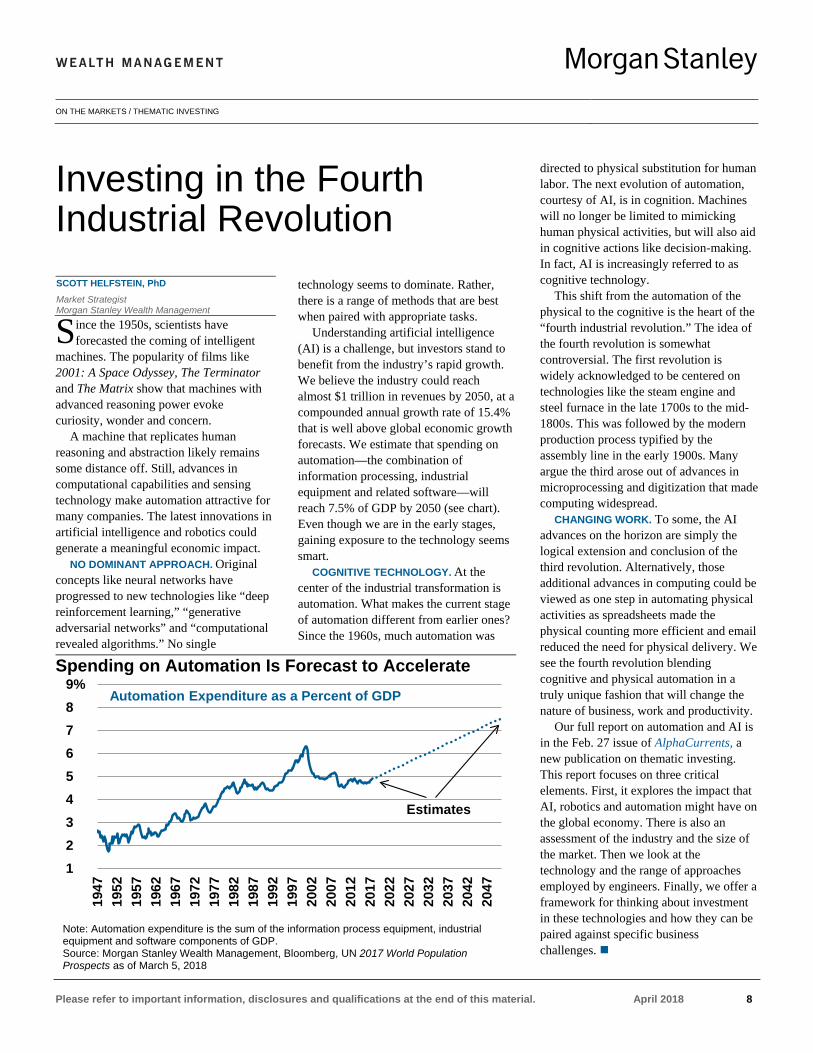
Understanding artificial intelligence (AI) is a challenge, but investors stand to benefit from the industry’s rapid growth. We believe the industry could reach almost $1 trillion in revenues by 2050, at a compounded annual growth rate of 15.4% that is well above global economic growth forecasts. We estimate that spending on automation—the combination of information processing, industrial equipment and related software—will reach 7.5% of GDP by 2050 (see chart). Even though we are in the early stages, gaining exposure to the technology seems smart.
COGNITIVE TECHNOLOGY. At the center of the industrial transformation is automation. What makes the current stage of automation different from earlier ones? Since the 1960s, much automation was
directed to physical substitution for human labor. The next evolution of automation, courtesy of AI, is in cognition. Machines will no longer be limited to mimicking human physical activities, but will also aid in cognitive actions like decision-making. In fact, AI is increasingly referred to as cognitive technology.
This shift from the automation of the physical to the cognitive is the heart of the “fourth industrial revolution.” The idea of the fourth revolution is somewhat controversial. The first revolution is widely acknowledged to be centered on technologies like the steam engine and steel furnace in the late 1700s to the mid-1800s. This was followed by the modern production process typified by the assembly line in the early 1900s. Many argue the third arose out of advances in microprocessing and digitization that made computing widespread.
CHANGING WORK. To some, the AI advances on the horizon are simply the logical extension and conclusion of the third revolution. Alternatively, those additional advances in computing could be viewed as one step in automating physical activities as spreadsheets made the physical counting more efficient and email reduced the need for physical delivery. We see the fourth revolution blending cognitive and physical automation in a truly unique fashion that will change the nature of business, work and productivity.
Our full report on automation and AI is in the Feb. 27 issue of AlphaCurrents, a new publication on thematic investing. This report focuses on three critical elements. First, it explores the impact that AI, robotics and automation might have on the global economy. There is also an assessment of the industry and the size of the market. Then we look at the technology and the range of approaches employed by engineers. Finally, we offer a framework for thinking about investment in these technologies and how they can be paired against specific business challenges.
Investing in the Fourth Industrial Revolution
S
Spending on Automation Is Forecast to Accelerate
Note: Automation expenditure is the sum of the information process equipment, industrial equipment and software components of GDP. Source: Morgan Stanley Wealth Management, Bloomberg, UN 2017 World Population Prospects as of March 5, 2018
1%2%3%4%5%6%7%8%9%
1947
1952
1957
1962
1967
1972
1977
1982
1987
1992
1997
2002
2007
2012
2017
2022
2027
2032
2037
2042
2047
Estimates
Automation Expenditure as a Percent of GDP
ON THE MARKETS / INDICATORS
Please refer to important information, disclosures and qualifications at the end of this material. April 2018 9
LISA SHALETT Head of Wealth Management Investment Resources Head of Investment & Portfolio Strategies Morgan Stanley Wealth Management STEVE EDWARDS, CFA Senior Investment Strategist Morgan Stanley Wealth Management CHRIS BAXTER Investment Strategist Morgan Stanley Wealth Management
n past market cycles, the Federal Reserve’s monetary policy and the
resulting movement in interest rates dominated the investment backdrop and largely determined the availability of credit and financial market liquidity. Given the severity of the global financial crisis, the Fed and other central banks departed from the historical playbook. Quantitative Easing (QE) became the effective anchor for interest rates, while a new raft of regulation raised banks’ capital requirements, constraining credit growth and monetary velocity.
These developments ushered in major changes for this postcrisis period. Given
banks’ diminished role in extending credit to the real economy, the public credit markets exploded in size, scope and relevance. The currency markets assumed an even greater role in balancing global capital flows than in past cycles. As a result, credit spreads and the US dollar—the world’s reserve currency and a key vehicle for determining global trade flows—emerged as critical data that demanded close monitoring. Helpfully, financial conditions indexes (FCIs) combine these crucial variables and others into a single measure of financial market health. Their relevance has grown markedly in this postcrisis environment.
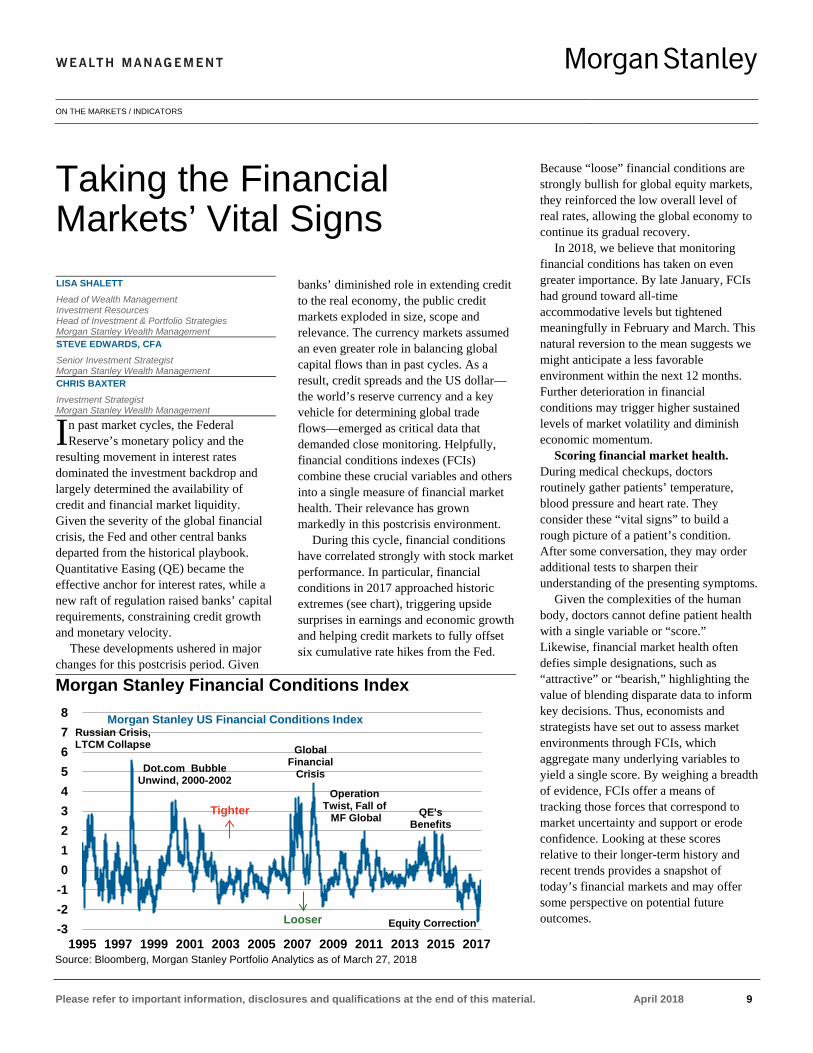
During this cycle, financial conditions have correlated strongly with stock market performance. In particular, financial conditions in 2017 approached historic extremes (see chart), triggering upside surprises in earnings and economic growth and helping credit markets to fully offset six cumulative rate hikes from the Fed.
Because “loose” financial conditions are strongly bullish for global equity markets, they reinforced the low overall level of real rates, allowing the global economy to continue its gradual recovery.
In 2018, we believe that monitoring financial conditions has taken on even greater importance. By late January, FCIs had ground toward all-time accommodative levels but tightened meaningfully in February and March. This natural reversion to the mean suggests we might anticipate a less favorable environment within the next 12 months. Further deterioration in financial conditions may trigger higher sustained levels of market volatility and diminish economic momentum.
Scoring financial market health. During medical checkups, doctors routinely gather patients’ temperature, blood pressure and heart rate. They consider these “vital signs” to build a rough picture of a patient’s condition. After some conversation, they may order additional tests to sharpen their understanding of the presenting symptoms.
Given the complexities of the human body, doctors cannot define patient health with a single variable or “score.” Likewise, financial market health often defies simple designations, such as “attractive” or “bearish,” highlighting the value of blending disparate data to inform key decisions. Thus, economists and strategists have set out to assess market environments through FCIs, which aggregate many underlying variables to yield a single score. By weighing a breadth of evidence, FCIs offer a means of tracking those forces that correspond to market uncertainty and support or erode confidence. Looking at these scores relative to their longer-term history and recent trends provides a snapshot of today’s financial markets and may offer some perspective on potential future outcomes.
Taking the Financial Markets’ Vital Signs
I
Morgan Stanley Financial Conditions Index
Source: Bloomberg, Morgan Stanley Portfolio Analytics as of March 27, 2018
-3-2-1012345678
1995 1997 1999 2001 2003 2005 2007 2009 2011 2013 2015 2017
Tighter
Morgan Stanley US Financial Conditions IndexRussian Crisis, LTCM Collapse
Dot.com BubbleUnwind, 2000-2002
Global Financial
Crisis
Operation Twist, Fall of
MF Global QE'sBenefits
Looser Equity Correction
Please refer to important information, disclosures and qualifications at the end of this material. April 2018 10
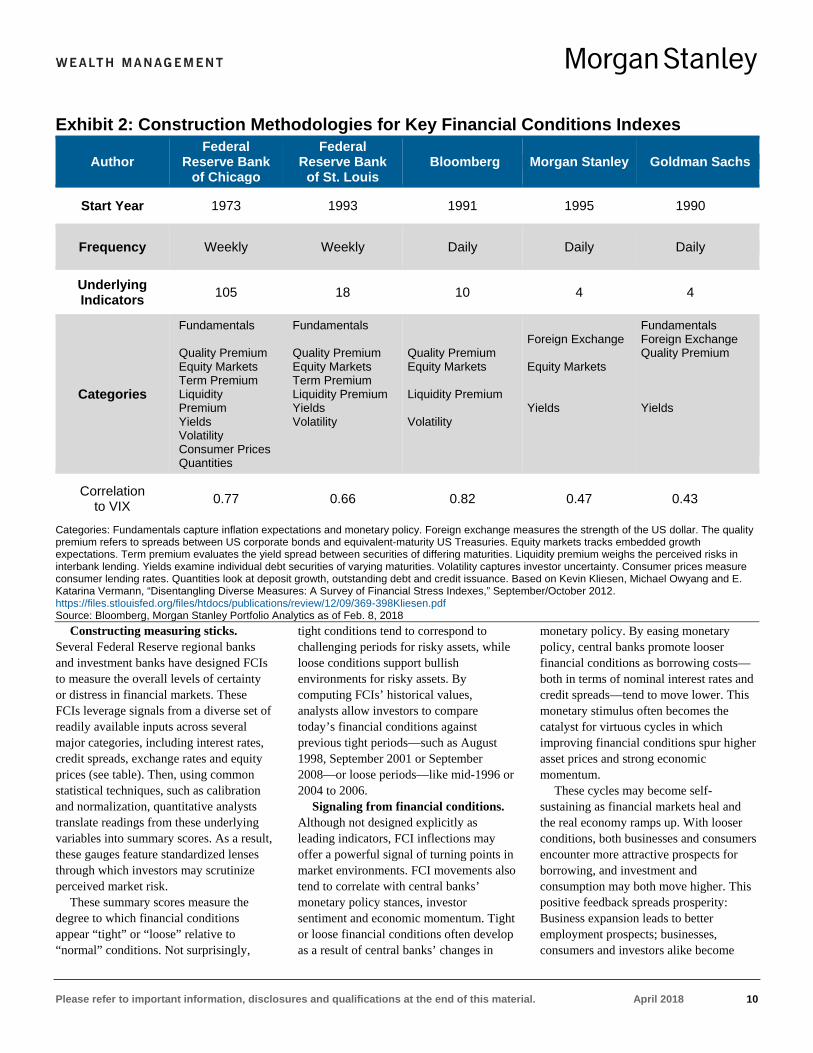
Constructing measuring sticks. Several Federal Reserve regional banks and investment banks have designed FCIs to measure the overall levels of certainty or distress in financial markets. These FCIs leverage signals from a diverse set of readily available inputs across several major categories, including interest rates, credit spreads, exchange rates and equity prices (see table). Then, using common statistical techniques, such as calibration and normalization, quantitative analysts translate readings from these underlying variables into summary scores. As a result, these gauges feature standardized lenses through which investors may scrutinize perceived market risk.
These summary scores measure the degree to which financial conditions appear “tight” or “loose” relative to “normal” conditions. Not surprisingly,
tight conditions tend to correspond to challenging periods for risky assets, while loose conditions support bullish environments for risky assets. By computing FCIs’ historical values, analysts allow investors to compare today’s financial conditions against previous tight periods—such as August 1998, September 2001 or September 2008—or loose periods—like mid-1996 or 2004 to 2006.
Signaling from financial conditions. Although not designed explicitly as leading indicators, FCI inflections may offer a powerful signal of turning points in market environments. FCI movements also tend to correlate with central banks’ monetary policy stances, investor sentiment and economic momentum. Tight or loose financial conditions often develop as a result of central banks’ changes in
monetary policy. By easing monetary policy, central banks promote looser financial conditions as borrowing costs—both in terms of nominal interest rates and credit spreads—tend to move lower. This monetary stimulus often becomes the catalyst for virtuous cycles in which improving financial conditions spur higher asset prices and strong economic momentum.
These cycles may become self-sustaining as financial markets heal and the real economy ramps up. With looser conditions, both businesses and consumers encounter more attractive prospects for borrowing, and investment and consumption may both move higher. This positive feedback spreads prosperity: Business expansion leads to better employment prospects; businesses, consumers and investors alike become
Exhibit 2: Construction Methodologies for Key Financial Conditions Indexes
Author Federal
Reserve Bank of Chicago
Federal Reserve Bank
of St. Louis Bloomberg Morgan Stanley Goldman Sachs
Start Year 1973 1993 1991 1995 1990
Frequency Weekly Weekly Daily Daily Daily
Underlying Indicators 105 18 10 4 4
Categories
Fundamentals Quality Premium Equity Markets Term Premium Liquidity Premium Yields Volatility Consumer Prices Quantities
Fundamentals Quality Premium Equity Markets Term Premium Liquidity Premium Yields Volatility
Quality Premium Equity Markets Liquidity Premium Volatility
Foreign Exchange Equity Markets Yields
Fundamentals Foreign Exchange Quality Premium Yields
Correlation to VIX
0.77 0.66 0.82 0.47 0.43
Categories: Fundamentals capture inflation expectations and monetary policy. Foreign exchange measures the strength of the US dollar. The quality premium refers to spreads between US corporate bonds and equivalent-maturity US Treasuries. Equity markets tracks embedded growth expectations. Term premium evaluates the yield spread between securities of differing maturities. Liquidity premium weighs the perceived risks in interbank lending. Yields examine individual debt securities of varying maturities. Volatility captures investor uncertainty. Consumer prices measure consumer lending rates. Quantities look at deposit growth, outstanding debt and credit issuance. Based on Kevin Kliesen, Michael Owyang and E. Katarina Vermann, “Disentangling Diverse Measures: A Survey of Financial Stress Indexes,” September/October 2012. https://files.stlouisfed.org/files/htdocs/publications/review/12/09/369-398Kliesen.pdf Source: Bloomberg, Morgan Stanley Portfolio Analytics as of Feb. 8, 2018
Please refer to important information, disclosures and qualifications at the end of this material. April 2018 11
more confident; financial assets gain; and market volatility drops.
At times, financial conditions may even become more accommodative than policy rates would suggest. In the wake of the financial crisis, central banks embarked on historically unprecedented QE policies, in part to bolster financial conditions. As intended, QE effectively lubricated the global economy. In light of its success, central bankers have noted that QE has consequently broadened their toolkits and intermediate-term objectives and expanded their mandates to consider, at least indirectly, how their actions will affect financial conditions and financial stability.
Today’s outlook. For the two years ending in January 2018, FCIs reflected the supportive environment for stronger economic momentum and rising prices for risky assets. Given the stability in monetary policy, macroeconomic data and earnings expectations, investors gradually assumed greater risk. The strong fundamental growth picture, both for the economy and earnings, boosted asset prices and valuations.
While financial conditions may remain accommodative for some time, history indicates they cannot continue to improve indefinitely. Since late January, investors have confronted several confluences that have prompted tighter financial conditions, and we believe that investors must consider the possibility of further tightening ahead and the subsequent implications.
Though economic momentum remains broadly firm, the pace of improvement has moderated. Just as gravity weighs on a ball tossed into the air, economic surprises cannot, by definition, remain positive forever. After a multiyear recovery, the global economy has reached its long-term potential, according to the World Bank’s January 2018 Global Economic Prospects. For this reason, further growth may stoke nascent inflationary pressures and hasten the removal of extraordinary monetary accommodation.
Nonetheless, today’s central bank policy does remain stimulative for growth, given the wide spread between nominal GDP growth and policy rates. In order to
protect the recovery, as part of their macroprudential policy, central bankers will likely remain vigilant in avoiding tight financial conditions and maintain their close coordination. Still, central banks face the challenge of balancing growth-stimulative policies with the probability of higher inflation.
In short, even as growth may accelerate again, perhaps above trend, tighter financial conditions may presage a more pronounced downward inflection for fundamental momentum later this year. The potential drivers of this change include higher bond yields, a stronger trade-weighted dollar, wider credit spreads, diminished certainty and higher volatility. Watch their movements, as these interrelated pieces will likely dictate the tenor of 2018’s unfolding market narrative. This article was excerpted and adapted from the Feb. 13, 2018 Special Report, “Financial Conditions Indexes: Barometers for Market and Macro Environments.”
ON THE MARKETS / Q&A
Please refer to important information, disclosures and qualifications at the end of this material. April 2018 12
quities have posted eight straight years of annual gains, leading many
to wonder if stocks will soon stumble. On the other hand, the bull market in bonds goes back to the 1980s. Mike Gitlin, head of fixed income at Capital Group, is urging investors to be cautious. “We're preaching, ‘upgrade your bond portfolio.’ This is the time in the cycle to not stretch for yield.” He recently shared his outlook with Morgan Stanley Wealth Management Market Strategist Joe Laetsch. The following is an edited version of their conversation.
JOE LAETSCH (JL): What is your take
on the current environment? MIKE GITLIN (MG): Our general
perspective is that there is synchronized global growth right now and a rebound in growth around the world, but a lot of that growth is priced into asset markets.
With central bank policy beginning to change, we’re going to have much greater volatility in the market, and people should be more modest in terms of their return expectations. We think this period of volatility creates a five-year, forward-looking return outlook that’s not as strong as the past five years.
From a US interest rate perspective, we agree with the market in terms of there being three hikes this year. Next year becomes more questionable, as we get closer toward a recession—not that we’re predicting a recession for X or Y period of time. However, we think some of the positive impacts of stimulus are beginning to wane, so we have less confidence in the hikes in 2019 than we do in 2018. We think the fed funds rate could top out around 2.5% in this cycle before we hit the
next recession, and not 3.0% or 3.25% as the Federal Reserve would like to think.
JL: Does that impact your market view? MG: In our core portfolios, we’re
overweight inflation and underweight corporate credit. We like Treasury Inflation Protected Securities (TIPS). Investment grade corporate credit spreads are relatively tight, so valuations aren’t compelling, and fundamentals are okay—but not great—with leverage at or near historical highs. We have zero weighting in high yield in our core portfolios. This late in the cycle, high yield doesn’t provide great risk/reward benefits.
We think you’re going to see core CPI head closer to 2.4% to 2.5% based on a lot of factors: wage growth, tax cuts, the possibility of infrastructure spending, tariffs—which obviously are inflationary—and a weak dollar, which is putting pressure on import prices. There are a lot of reasons why we could have higher inflation.
JL: The March jobs report showed higher wage growth, which contributed to higher inflation expectations and higher bond yields. What is your take on that?
MG: People are sensitive to the change in direction in monetary policy. The old adage is, “Don’t bet against the Fed,” and you had accommodative monetary policy for nearly a decade. That’s beginning to change, and that’s why you’re seeing greater volatility. The Fed reversed course a few years ago, but other central banks are just catching up. The Bank of Canada and the Bank of England have hiked. The European Central Bank is cutting bond purchases. Even the Bank of Japan’s monetary policy is in play. It’s not necessarily the magnitude of tighter
policy, it’s the change in direction that has increased volatility—and I think that’s only going to continue. As policy changes after being accommodative for so long, the risks of policy missteps increase, and I think that’s what people are focused on.
We also see clients focused on interest rate risk and much less concerned with credit risk. We think they should be as focused on credit risk as they are on interest rate risk.
JL: Why would credit spreads widen? MG: We’re watching the fundamentals
of the companies themselves, and the leverage. We’re also watching greater volatility, both in bonds and stocks. We’ve gone up in spread in the investment grade market just on the back of the equity market hiccups we’ve had. If we have a sustained equity market downturn, you would expect high-grade spreads to widen. So we’re watching the fundamentals, but also the technicals, and we’re watching the equity market correlation quite closely.
JL: What are your expectations given the new Fed chair?
MG: We don’t see a dramatic change in policy. What’s going to be more interesting to watch is how this Fed reacts as the global synchronized economic recovery becomes more mixed, and you get some data points that suggest we’re heading toward the end of the cycle.
The previous Fed was very, very dovish; this Fed may be more neutral. I don’t think anyone knows how that is going to impact policy when we get some of those economic hiccups, but if you look at both the Treasury forward market and implied fed funds pricing, I would say this is not a normal cycle. This is not a cycle where you get the fed funds rate to 4% before you have your next recession. We think there’s a very strong probability that fed funds don’t even reach 3% before we have our next recession.
JL: Do you see the Fed’s balance sheet wind-down as a material risk?
MG: In the supply/demand of the Treasury market, there are a lot of things
Late in the Cycle, Upgrade Bond Portfolios
E
Please refer to important information, disclosures and qualifications at the end of this material. April 2018 13
at play. There’s the wind-down of the balance sheet, and also highly publicized selling of Treasuries by foreign countries. There’s also going to be increased supply to fund the budget deficit.
On the other side, higher yields raise demand from lots of different cohorts—insurance companies, sovereign wealth funds and defined-benefit plans that have programs to matching assets to their liabilities. While you have to deal with the supply that’s coming from unwinding the balance sheet and from foreign selling and from funding deficits, for every 25 basis points that the 10-year Treasury yield moves higher, there are buyers happy to own the risk-free rate—at 2.75%, 3.00% and 3.25%—if it were to get that high. There’s a balance in the supply/demand equation that we think is underestimated.
JL: Are you positioned mainly in the US, or do you look internationally? The Global Investment Committee has written about emerging market (EM) debt as potentially presenting value.
MG: For us, there are real benefits to owning EM debt. At this stage, you get slightly higher yield than in high yield corporates, and you get a lower correlation to the equity market. The only thing on the downside in terms of those metrics is duration. You do have greater interest rate risk, because EM debt strategies are usually about a year and a half or two years longer duration than high-yield corporate strategies, but we’re not too concerned about having that duration.
JL: Where do you think we are in the current economic cycle?
MG: Developed markets outside of the US, particularly Europe, are about a year and a half to two years behind the US in emerging from the financial crisis. In the US, I wouldn’t want to put an end date on it, but we’re certainly late in the cycle. Our economic recovery will end up being the longest expansion since World War II. The typical expansion is about five years, and
this expansion is nine years long. We’re trying to convince investors that
when you’re late in the cycle—and we’re not preaching a doomsday scenario, but simply suggesting we’ll have a more normal recession at some point probably in the next 18 to 24 months—you want to be balanced in equity and fixed income. We see a lot of folks with way too much risk.
JL: Where in fixed income are they taking on too much risk?
MG: On the fixed income side of the portfolio, too many people have been reaching for yield, so in terms of risk, their fixed income portfolio looks a lot like their equity portfolio.
As an example, we looked at the positioning of top-quartile funds in the short-term bond category for the three years ending in 2017. Ninety percent of those funds didn’t look like traditional short-term bond funds. On average, using the Morningstar Best Fit categorization, 31% of the best-performing funds appeared to look more like high yield and 26% investment grade. Nine percent looked like they were multiasset, which includes up to 30% equity; 9% looked like bank-loans funds, characteristically; and 7% looked like emerging market debt funds. So to do well in the short-term bond category in the past three years, you had to look nothing like short-term bonds.
You have to be thoughtful about your fixed income portfolio. You have to upgrade it when you’re this late in the cycle. With a zero-interest-rate policy for so long, in the US and around the world, everyone reached for yield, and many folks haven’t come back toward being more conservative. At this stage in the cycle, we’d argue that you don’t want to be highly correlated with the equity market in your bond portfolio.
JL: What do you think about the flows into bond funds versus equity funds since 2008, and how does that play out?
MG: We’re not as concerned about flows in the bond markets as a lot of the press would have you to believe. We’ve heard concern for years that all of the money that flowed into bonds after the financial crisis would flow out at some point during the cycle. I think the demographic shift is one thing to point to on why we don’t think that will be the case.
Another reason we think there is a greater secular demand for fixed income is that a whole generation of investors saw two massive bear markets in equities within a decade. In the early 2000s and then in 2008, people saw the equity market decline by 50% twice. Psychologically, I think that contributes to a secular shift toward more balanced portfolios.
Finally, from defined-benefit plans, there is a secular need for high-quality, long-duration paper, as they match assets and liabilities. That creates real demand for investment grade (Treasury and corporate) bonds longer term. Also, as you get toward the end of the cycle, the risk-free rate has become much more attractive. The two-year US Treasury yields 2.28%. Three years ago, the yield was 0.50%, so the yield is 175 basis points higher and is now higher than the S&P dividend yield for the first time in a decade. The short end of the yield curve has become relatively attractive again.
JL: How do you satisfy investors’ need for income in this environment?
MG: The best thing we can do for investors is to earn a reasonable yield without taking a tremendous amount of either interest rate risk or credit risk.
Mike Gitlin is not an employee of
Morgan Stanley Wealth Management. Opinions expressed by him are solely his own and may not necessarily reflect those of Morgan Stanley Wealth Management or its affiliates.

Please refer to important information, disclosures and qualifications at the end of this material. April 2018 14
Global Investment Committee Tactical Asset Allocation
The Global Investment Committee provides guidance on asset allocation decisions through its various models. The five models below are recommended for investors with up to $25 million in investable assets. They are based on an increasing scale of risk (expected volatility) and expected return.
Wealth Conservation Income
Balanced Growth Market Growth
Opportunistic Growth Key
Source: Morgan Stanley Wealth Management GIC as of March 29, 2018
Ultrashort Fixed Income
Fixed Income & Preferreds
Equities
Alternatives
Please refer to important information, disclosures and qualifications at the end of this material. April 2018 15
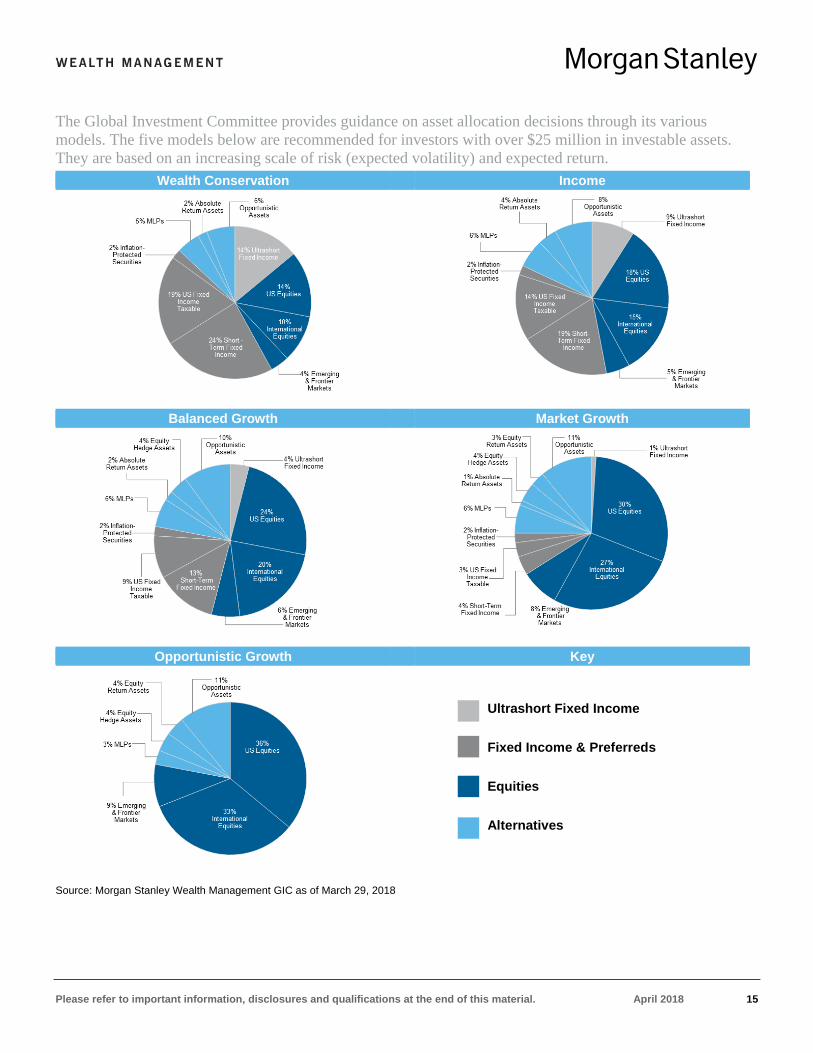
The Global Investment Committee provides guidance on asset allocation decisions through its various models. The five models below are recommended for investors with over $25 million in investable assets. They are based on an increasing scale of risk (expected volatility) and expected return.
Wealth Conservation Income
Balanced Growth Market Growth
Opportunistic Growth Key
Source: Morgan Stanley Wealth Management GIC as of March 29, 2018
Ultrashort Fixed Income
Fixed Income & Preferreds
Equities
Alternatives
Please refer to important information, disclosures and qualifications at the end of this material. April 2018 16
Source: Morgan Stanley Wealth Management GIC as of March 29, 2018 *For more about the risks to Master Limited Partnerships (MLPs) and Duration, please see the Risk Considerations section beginning on page 17 of this report.
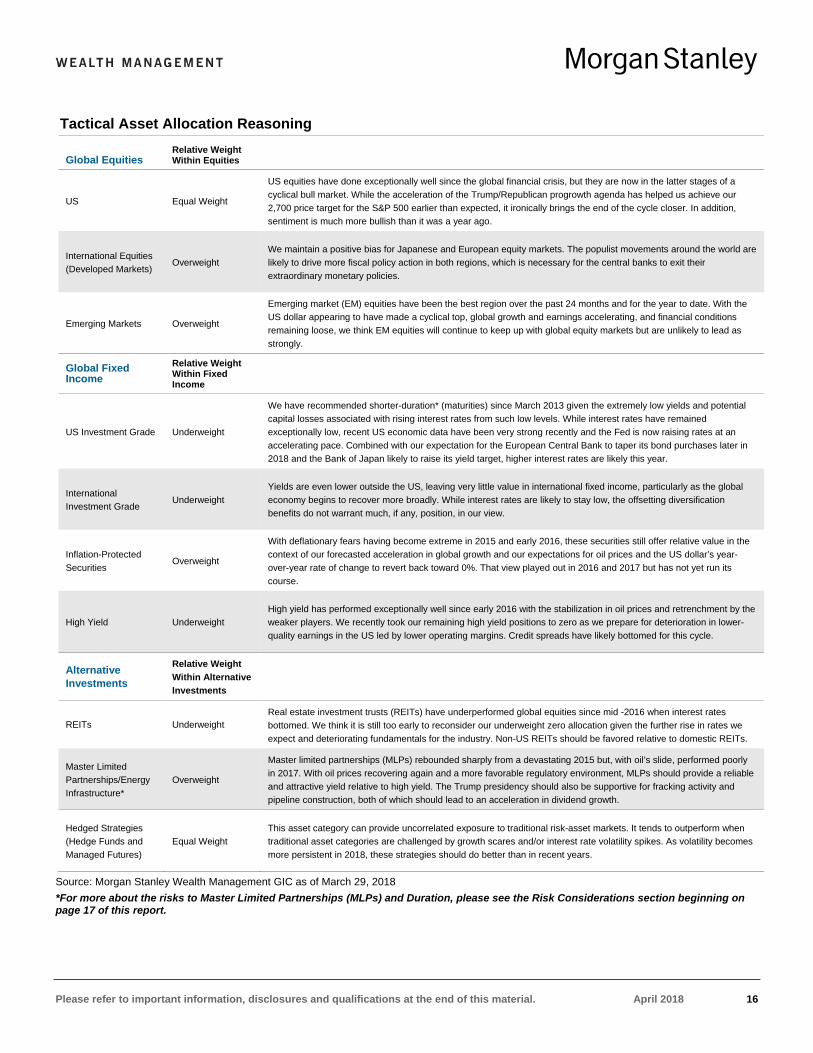
Tactical Asset Allocation Reasoning
Global Equities Relative Weight Within Equities
US Equal Weight
US equities have done exceptionally well since the global financial crisis, but they are now in the latter stages of a cyclical bull market. While the acceleration of the Trump/Republican progrowth agenda has helped us achieve our 2,700 price target for the S&P 500 earlier than expected, it ironically brings the end of the cycle closer. In addition, sentiment is much more bullish than it was a year ago.
International Equities (Developed Markets)
Overweight We maintain a positive bias for Japanese and European equity markets. The populist movements around the world are likely to drive more fiscal policy action in both regions, which is necessary for the central banks to exit their extraordinary monetary policies.
Emerging Markets Overweight
Emerging market (EM) equities have been the best region over the past 24 months and for the year to date. With the US dollar appearing to have made a cyclical top, global growth and earnings accelerating, and financial conditions remaining loose, we think EM equities will continue to keep up with global equity markets but are unlikely to lead as strongly.
Global Fixed Income
Relative Weight Within Fixed Income
US Investment Grade Underweight
We have recommended shorter-duration* (maturities) since March 2013 given the extremely low yields and potential capital losses associated with rising interest rates from such low levels. While interest rates have remained exceptionally low, recent US economic data have been very strong recently and the Fed is now raising rates at an accelerating pace. Combined with our expectation for the European Central Bank to taper its bond purchases later in 2018 and the Bank of Japan likely to raise its yield target, higher interest rates are likely this year.
International Investment Grade
Underweight Yields are even lower outside the US, leaving very little value in international fixed income, particularly as the global economy begins to recover more broadly. While interest rates are likely to stay low, the offsetting diversification benefits do not warrant much, if any, position, in our view.
Inflation-Protected Securities
Overweight
With deflationary fears having become extreme in 2015 and early 2016, these securities still offer relative value in the context of our forecasted acceleration in global growth and our expectations for oil prices and the US dollar’s year-over-year rate of change to revert back toward 0%. That view played out in 2016 and 2017 but has not yet run its course.
High Yield Underweight High yield has performed exceptionally well since early 2016 with the stabilization in oil prices and retrenchment by the weaker players. We recently took our remaining high yield positions to zero as we prepare for deterioration in lower-quality earnings in the US led by lower operating margins. Credit spreads have likely bottomed for this cycle.
Alternative Investments
Relative Weight Within Alternative Investments
REITs Underweight Real estate investment trusts (REITs) have underperformed global equities since mid -2016 when interest rates bottomed. We think it is still too early to reconsider our underweight zero allocation given the further rise in rates we expect and deteriorating fundamentals for the industry. Non-US REITs should be favored relative to domestic REITs.
Master Limited Partnerships/Energy Infrastructure*
Overweight
Master limited partnerships (MLPs) rebounded sharply from a devastating 2015 but, with oil’s slide, performed poorly in 2017. With oil prices recovering again and a more favorable regulatory environment, MLPs should provide a reliable and attractive yield relative to high yield. The Trump presidency should also be supportive for fracking activity and pipeline construction, both of which should lead to an acceleration in dividend growth.
Hedged Strategies (Hedge Funds and Managed Futures)
Equal Weight This asset category can provide uncorrelated exposure to traditional risk-asset markets. It tends to outperform when traditional asset categories are challenged by growth scares and/or interest rate volatility spikes. As volatility becomes more persistent in 2018, these strategies should do better than in recent years.
ON THE MARKETS
Please refer to important information, disclosures and qualifications at the end of this material. April 2018 17
Index Definitions
For index, indicator and survey definitions referenced in this report please visit the following: http://www.morganstanleyfa.com/public/projectfiles/id.pdf
Risk Considerations Alternative Investments The sole purpose of this material is to inform, and it in no way is intended to be an offer or solicitation to purchase or sell any security, other investment or service, or to attract any funds or deposits. Investments mentioned may not be suitable for all clients. Any product discussed herein may be purchased only after a client has carefully reviewed the offering memorandum and executed the subscription documents. Morgan Stanley Wealth Management has not considered the actual or desired investment objectives, goals, strategies, guidelines, or factual circumstances of any investor in any fund(s). Before making any investment, each investor should carefully consider the risks associated with the investment, as discussed in the applicable offering memorandum, and make a determination based upon their own particular circumstances, that the investment is consistent with their investment objectives and risk tolerance. Alternative investments often are speculative and include a high degree of risk. Investors could lose all or a substantial amount of their investment. Alternative investments are suitable only for eligible, long-term investors who are willing to forgo liquidity and put capital at risk for an indefinite period of time. They may be highly illiquid and can engage in leverage and other speculative practices that may increase the volatility and risk of loss. Alternative Investments typically have higher fees than traditional investments. Investors should carefully review and consider potential risks before investing. Certain information contained herein may constitute forward-looking statements. Due to various risks and uncertainties, actual events, results or the performance of a fund may differ materially from those reflected or contemplated in such forward-looking statements. Clients should carefully consider the investment objectives, risks, charges, and expenses of a fund before investing. Alternative investments involve complex tax structures, tax inefficient investing, and delays in distributing important tax information. Individual funds have specific risks related to their investment programs that will vary from fund to fund. Clients should consult their own tax and legal advisors as Morgan Stanley Wealth Management does not provide tax or legal advice. Interests in alternative investment products are offered pursuant to the terms of the applicable offering memorandum, are distributed by Morgan Stanley Smith Barney LLC and certain of its affiliates, and (1) are not FDIC-insured, (2) are not deposits or other obligations of Morgan Stanley or any of its affiliates, (3) are not guaranteed by Morgan Stanley and its affiliates, and (4) involve investment risks, including possible loss of principal. Morgan Stanley Smith Barney LLC is a registered broker-dealer, not a bank. Hypothetical Performance General: Hypothetical performance should not be considered a guarantee of future performance or a guarantee of achieving overall financial objectives. Asset allocation and diversification do not assure a profit or protect against loss in declining financial markets. Hypothetical performance results have inherent limitations. The performance shown here is simulated performance based on benchmark indices, not investment results from an actual portfolio or actual trading. There can be large differences between hypothetical and actual performance results achieved by a particular asset allocation. Despite the limitations of hypothetical performance, these hypothetical performance results may allow clients and Financial Advisors to obtain a sense of the risk / return trade-off of different asset allocation constructs. Investing in the market entails the risk of market volatility. The value of all types of securities may increase or decrease over varying time periods. This analysis does not purport to recommend or implement an investment strategy. Financial forecasts, rates of return, risk, inflation, and other assumptions may be used as the basis for illustrations in this analysis. They should not be considered a guarantee of future performance or a guarantee of achieving overall financial objectives. No analysis has the ability to accurately predict the future, eliminate risk or guarantee investment results. As investment returns, inflation, taxes, and other economic conditions vary from the assumptions used in this analysis, your actual results will vary (perhaps significantly) from those presented in this analysis. The assumed return rates in this analysis are not reflective of any specific investment and do not include any fees or expenses that may be incurred by investing in specific products. The actual returns of a specific investment may be more or less than the returns used in this analysis. The return assumptions are based on hypothetical rates of return of securities indices, which serve as proxies for the asset classes. Moreover, different forecasts may choose different indices as a proxy for the same asset class, thus influencing the return of the asset class. MLPs Master Limited Partnerships (MLPs) are limited partnerships or limited liability companies that are taxed as partnerships and whose interests (limited partnership units or limited liability company units) are traded on securities exchanges like shares of common stock. Currently, most MLPs operate in
ON THE MARKETS
Please refer to important information, disclosures and qualifications at the end of this material. April 2018 18
the energy, natural resources or real estate sectors. Investments in MLP interests are subject to the risks generally applicable to companies in the energy and natural resources sectors, including commodity pricing risk, supply and demand risk, depletion risk and exploration risk. Individual MLPs are publicly traded partnerships that have unique risks related to their structure. These include, but are not limited to, their reliance on the capital markets to fund growth, adverse ruling on the current tax treatment of distributions (typically mostly tax deferred), and commodity volume risk. The potential tax benefits from investing in MLPs depend on their being treated as partnerships for federal income tax purposes and, if the MLP is deemed to be a corporation, then its income would be subject to federal taxation at the entity level, reducing the amount of cash available for distribution to the fund which could result in a reduction of the fund’s value. MLPs carry interest rate risk and may underperform in a rising interest rate environment. MLP funds accrue deferred income taxes for future tax liabilities associated with the portion of MLP distributions considered to be a tax-deferred return of capital and for any net operating gains as well as capital appreciation of its investments; this deferred tax liability is reflected in the daily NAV; and, as a result, the MLP fund’s after-tax performance could differ significantly from the underlying assets even if the pre-tax performance is closely tracked. Duration Duration, the most commonly used measure of bond risk, quantifies the effect of changes in interest rates on the price of a bond or bond portfolio. The longer the duration, the more sensitive the bond or portfolio would be to changes in interest rates. Generally, if interest rates rise, bond prices fall and vice versa. Longer-term bonds carry a longer or higher duration than shorter-term bonds; as such, they would be affected by changing interest rates for a greater period of time if interest rates were to increase. Consequently, the price of a long-term bond would drop significantly as compared to the price of a short-term bond.
International investing entails greater risk, as well as greater potential rewards compared to U.S. investing. These risks include political and economic uncertainties of foreign countries as well as the risk of currency fluctuations. These risks are magnified in countries with emerging markets, since these countries may have relatively unstable governments and less established markets and economies.
Managed futures investments are speculative, involve a high degree of risk, use significant leverage, have limited liquidity and/or may be generally illiquid, may incur substantial charges, may subject investors to conflicts of interest, and are usually suitable only for the risk capital portion of an investor’s portfolio. Before investing in any partnership and in order to make an informed decision, investors should read the applicable prospectus and/or offering documents carefully for additional information, including charges, expenses, and risks. Managed futures investments are not intended to replace equities or fixed income securities but rather may act as a complement to these asset categories in a diversified portfolio. Investing in commodities entails significant risks. Commodity prices may be affected by a variety of factors at any time, including but not limited to, (i) changes in supply and demand relationships, (ii) governmental programs and policies, (iii) national and international political and economic events, war and terrorist events, (iv) changes in interest and exchange rates, (v) trading activities in commodities and related contracts, (vi) pestilence, technological change and weather, and (vii) the price volatility of a commodity. In addition, the commodities markets are subject to temporary distortions or other disruptions due to various factors, including lack of liquidity, participation of speculators and government intervention. Physical precious metals are non-regulated products. Precious metals are speculative investments, which may experience short-term and long term price volatility. The value of precious metals investments may fluctuate and may appreciate or decline, depending on market conditions. If sold in a declining market, the price you receive may be less than your original investment. Unlike bonds and stocks, precious metals do not make interest or dividend payments. Therefore, precious metals may not be suitable for investors who require current income. Precious metals are commodities that should be safely stored, which may impose additional costs on the investor. The Securities Investor Protection Corporation (“SIPC”) provides certain protection for customers’ cash and securities in the event of a brokerage firm’s bankruptcy, other financial difficulties, or if customers’ assets are missing. SIPC insurance does not apply to precious metals or other commodities. Bonds are subject to interest rate risk. When interest rates rise, bond prices fall; generally the longer a bond's maturity, the more sensitive it is to this risk. Bonds may also be subject to call risk, which is the risk that the issuer will redeem the debt at its option, fully or partially, before the scheduled maturity date. The market value of debt instruments may fluctuate, and proceeds from sales prior to maturity may be more or less than the amount originally invested or the maturity value due to changes in market conditions or changes in the credit quality of the issuer. Bonds are subject to the credit risk of the issuer. This is the risk that the issuer might be unable to make interest and/or principal payments on a timely basis. Bonds are also subject to reinvestment risk, which is the risk that principal and/or interest payments from a given investment may be reinvested at a lower interest rate. Bonds rated below investment grade may have speculative characteristics and present significant risks beyond those of other securities, including greater credit risk and price volatility in the secondary market. Investors should be careful to consider these risks alongside their individual circumstances, objectives and risk tolerance before investing in high-yield bonds. High yield bonds should comprise only a limited portion of a balanced portfolio. Interest on municipal bonds is generally exempt from federal income tax; however, some bonds may be subject to the alternative minimum tax (AMT). Typically, state tax-exemption applies if securities are issued within one's state of residence and, if applicable, local tax-exemption applies if securities are issued within one's city of residence. Treasury Inflation Protection Securities’ (TIPS) coupon payments and underlying principal are automatically increased to compensate for inflation by tracking the consumer price index (CPI). While the real rate of return is guaranteed, TIPS tend to offer a low return. Because the return of TIPS is linked to inflation, TIPS may significantly underperform versus conventional U.S. Treasuries in times of low inflation. Ultrashort-term fixed income asset class is comprised of fixed income securities with high quality, very short maturities. They are therefore subject to the risks associated with debt securities such as credit and interest rate risk.
ON THE MARKETS
Please refer to important information, disclosures and qualifications at the end of this material. April 2018 19
The majority of $25 and $1000 par preferred securities are “callable” meaning that the issuer may retire the securities at specific prices and dates prior to maturity. Interest/dividend payments on certain preferred issues may be deferred by the issuer for periods of up to 5 to 10 years, depending on the particular issue. The investor would still have income tax liability even though payments would not have been received. Price quoted is per $25 or $1,000 share, unless otherwise specified. Current yield is calculated by multiplying the coupon by par value divided by the market price. The initial interest rate on a floating-rate security may be lower than that of a fixed-rate security of the same maturity because investors expect to receive additional income due to future increases in the floating security’s underlying reference rate. The reference rate could be an index or an interest rate. However, there can be no assurance that the reference rate will increase. Some floating-rate securities may be subject to call risk. The market value of convertible bonds and the underlying common stock(s) will fluctuate and after purchase may be worth more or less than original cost. If sold prior to maturity, investors may receive more or less than their original purchase price or maturity value, depending on market conditions. Callable bonds may be redeemed by the issuer prior to maturity. Additional call features may exist that could affect yield.
Some $25 or $1000 par preferred securities are QDI (Qualified Dividend Income) eligible. Information on QDI eligibility is obtained from third party sources. The dividend income on QDI eligible preferreds qualifies for a reduced tax rate. Many traditional ‘dividend paying’ perpetual preferred securities (traditional preferreds with no maturity date) are QDI eligible. In order to qualify for the preferential tax treatment all qualifying preferred securities must be held by investors for a minimum period – 91 days during a 180 day window period, beginning 90 days before the ex-dividend date. Principal is returned on a monthly basis over the life of a mortgage-backed security. Principal prepayment can significantly affect the monthly income stream and the maturity of any type of MBS, including standard MBS, CMOs and Lottery Bonds. Yields and average lives are estimated based on prepayment assumptions and are subject to change based on actual prepayment of the mortgages in the underlying pools. The level of predictability of an MBS/CMO’s average life, and its market price, depends on the type of MBS/CMO class purchased and interest rate movements. In general, as interest rates fall, prepayment speeds are likely to increase, thus shortening the MBS/CMO’s average life and likely causing its market price to rise. Conversely, as interest rates rise, prepayment speeds are likely to decrease, thus lengthening average life and likely causing the MBS/CMO’s market price to fall. Some MBS/CMOs may have “original issue discount” (OID). OID occurs if the MBS/CMO’s original issue price is below its stated redemption price at maturity, and results in “imputed interest” that must be reported annually for tax purposes, resulting in a tax liability even though interest was not received. Investors are urged to consult their tax advisors for more information. CEFs Credit quality is a measure of a bond issuer's creditworthiness, or ability to repay interest and principal to bondholders in a timely manner. The credit ratings shown are based on each fund’s security rating as provided by Standard & Poor's, Moody's and/or Fitch, as applicable. Credit ratings are issued by the rating agencies for the underlying securities in the fund and not the fund itself, and the credit quality of the securities in the fund does not represent the stability or safety of the fund. Credit ratings shown range from AAA, being the highest, to D, being the lowest based on S&P and Fitch’s classification (the equivalent of Aaa and C, respectively, by Moody’s). Ratings of BBB or higher by S&P and Fitch (Baa or higher by Moody’s) are considered to be investment grade-quality securities. If two or more of the agencies have assigned different ratings to a security, the highest rating is applied. Securities that are not rated by all three agencies are listed as “NR.” Investing in currency involves additional special risks such as credit, interest rate fluctuations, derivative investment risk, and domestic and foreign inflation rates, which can be volatile and may be less liquid than other securities and more sensitive to the effect of varied economic conditions. In addition, international investing entails greater risk, as well as greater potential rewards compared to U.S. investing. These risks include political and economic uncertainties of foreign countries as well as the risk of currency fluctuations. These risks are magnified in countries with emerging markets, since these countries may have relatively unstable governments and less established markets and economies. Investing in foreign and emerging markets entails greater risks than those normally associated with domestic markets, such as political, currency, economic and market risks. These risks are magnified in frontier markets. Rebalancing does not protect against a loss in declining financial markets. There may be a potential tax implication with a rebalancing strategy. Investors should consult with their tax advisor before implementing such a strategy. Equity securities may fluctuate in response to news on companies, industries, market conditions and general economic environment. Besides the general risk of holding securities that may decline in value, closed-end funds may have additional risks related to declining market prices relative to net asset values (NAVs), active manager underperformance, and potential leverage. Some funds also invest in foreign securities, which may involve currency risk. Companies paying dividends can reduce or cut payouts at any time. Value investing does not guarantee a profit or eliminate risk. Not all companies whose stocks are considered to be value stocks are able to turn their business around or successfully employ corrective strategies which would result in stock prices that do not rise as initially expected.
Growth investing does not guarantee a profit or eliminate risk. The stocks of these companies can have relatively high valuations. Because of these high valuations, an investment in a growth stock can be more risky than an investment in a company with more modest growth expectations. Asset allocation and diversification do not assure a profit or protect against loss in declining financial markets.
ON THE MARKETS
Please refer to important information, disclosures and qualifications at the end of this material. April 2018 20
The indices are unmanaged. An investor cannot invest directly in an index. They are shown for illustrative purposes only and do not represent the performance of any specific investment. The indices selected by Morgan Stanley Wealth Management to measure performance are representative of broad asset classes. Morgan Stanley Smith Barney LLC retains the right to change representative indices at any time. REITs investing risks are similar to those associated with direct investments in real estate: property value fluctuations, lack of liquidity, limited diversification and sensitivity to economic factors such as interest rate changes and market recessions. Because of their narrow focus, sector investments tend to be more volatile than investments that diversify across many sectors and companies. Technology stocks may be especially volatile. Risks applicable to companies in the energy and natural resources sectors include commodity pricing risk, supply and demand risk, depletion risk and exploration risk. Yields are subject to change with economic conditions. Yield is only one factor that should be considered when making an investment decision. Credit ratings are subject to change. Certain securities referred to in this material may not have been registered under the U.S. Securities Act of 1933, as amended, and, if not, may not be offered or sold absent an exemption therefrom. Recipients are required to comply with any legal or contractual restrictions on their purchase, holding, sale, exercise of rights or performance of obligations under any securities/instruments transaction.
Disclosures
Morgan Stanley Wealth Management is the trade name of Morgan Stanley Smith Barney LLC, a registered broker-dealer in the United States. This material has been prepared for informational purposes only and is not an offer to buy or sell or a solicitation of any offer to buy or sell any security or other financial instrument or to participate in any trading strategy. Past performance is not necessarily a guide to future performance. The author(s) (if any authors are noted) principally responsible for the preparation of this material receive compensation based upon various factors, including quality and accuracy of their work, firm revenues (including trading and capital markets revenues), client feedback and competitive factors. Morgan Stanley Wealth Management is involved in many businesses that may relate to companies, securities or instruments mentioned in this material. This material has been prepared for informational purposes only and is not an offer to buy or sell or a solicitation of any offer to buy or sell any security/instrument, or to participate in any trading strategy. Any such offer would be made only after a prospective investor had completed its own independent investigation of the securities, instruments or transactions, and received all information it required to make its own investment decision, including, where applicable, a review of any offering circular or memorandum describing such security or instrument. That information would contain material information not contained herein and to which prospective participants are referred. This material is based on public information as of the specified date, and may be stale thereafter. We have no obligation to tell you when information herein may change. We make no representation or warranty with respect to the accuracy or completeness of this material. Morgan Stanley Wealth Management has no obligation to provide updated information on the securities/instruments mentioned herein. The securities/instruments discussed in this material may not be suitable for all investors. The appropriateness of a particular investment or strategy will depend on an investor’s individual circumstances and objectives. Morgan Stanley Wealth Management recommends that investors independently evaluate specific investments and strategies, and encourages investors to seek the advice of a financial advisor. The value of and income from investments may vary because of changes in interest rates, foreign exchange rates, default rates, prepayment rates, securities/instruments prices, market indexes, operational or financial conditions of companies and other issuers or other factors. Estimates of future performance are based on assumptions that may not be realized. Actual events may differ from those assumed and changes to any assumptions may have a material impact on any projections or estimates. Other events not taken into account may occur and may significantly affect the projections or estimates. Certain assumptions may have been made for modeling purposes only to simplify the presentation and/or calculation of any projections or estimates, and Morgan Stanley Wealth Management does not represent that any such assumptions will reflect actual future events. Accordingly, there can be no assurance that estimated returns or projections will be realized or that actual returns or performance results will not materially differ from those estimated herein.
This material should not be viewed as advice or recommendations with respect to asset allocation or any particular investment. This information is not intended to, and should not, form a primary basis for any investment decisions that you may make. Morgan Stanley Wealth Management is not acting as a fiduciary under either the Employee Retirement Income Security Act of 1974, as amended or under section 4975 of the Internal Revenue Code of 1986 as amended in providing this material except as otherwise provided in writing by Morgan Stanley and/or as described at www.morganstanley.com/disclosures/dol.
Morgan Stanley Smith Barney LLC, its affiliates and Morgan Stanley Financial Advisors do not provide legal or tax advice. Each client should always consult his/her personal tax and/or legal advisor for information concerning his/her individual situation and to learn about any potential tax or other implications that may result from acting on a particular recommendation.
ON THE MARKETS
Please refer to important information, disclosures and qualifications at the end of this material. April 2018 21
This material is primarily authored by, and reflects the opinions of, Morgan Stanley Smith Barney LLC (Member SIPC), as well as identified guest authors. Articles contributed by employees of Morgan Stanley & Co. LLC (Member SIPC) or one of its affiliates are used under license from Morgan Stanley.
This material is disseminated in Australia to “retail clients” within the meaning of the Australian Corporations Act by Morgan Stanley Wealth Management Australia Pty Ltd (A.B.N. 19 009 145 555, holder of Australian financial services license No. 240813).
Morgan Stanley Wealth Management is not incorporated under the People's Republic of China ("PRC") law and the material in relation to this report is conducted outside the PRC. This report will be distributed only upon request of a specific recipient. This report does not constitute an offer to sell or the solicitation of an offer to buy any securities in the PRC. PRC investors must have the relevant qualifications to invest in such securities and must be responsible for obtaining all relevant approvals, licenses, verifications and or registrations from PRC's relevant governmental authorities.
If your financial adviser is based in Australia, Switzerland or the United Kingdom, then please be aware that this report is being distributed by the Morgan Stanley entity where your financial adviser is located, as follows: Australia: Morgan Stanley Wealth Management Australia Pty Ltd (ABN 19 009 145 555, AFSL No. 240813); Switzerland: Morgan Stanley (Switzerland) AG regulated by the Swiss Financial Market Supervisory Authority; or United Kingdom: Morgan Stanley Private Wealth Management Ltd, authorized and regulated by the Financial Conduct Authority, approves for the purposes of section 21 of the Financial Services and Markets Act 2000 this material for distribution in the United Kingdom.
Morgan Stanley Wealth Management is not acting as a municipal advisor to any municipal entity or obligated person within the meaning of Section 15B of the Securities Exchange Act (the “Municipal Advisor Rule”) and the opinions or views contained herein are not intended to be, and do not constitute, advice within the meaning of the Municipal Advisor Rule.
This material is disseminated in the United States of America by Morgan Stanley Wealth Management. Third-party data providers make no warranties or representations of any kind relating to the accuracy, completeness, or timeliness of the data they provide and shall not have liability for any damages of any kind relating to such data. This material, or any portion thereof, may not be reprinted, sold or redistributed without the written consent of Morgan Stanley Smith Barney LLC.
© 2018 Morgan Stanley Smith Barney LLC. Member SIPC.