Embed Size (px)
Citation preview

Chapter-IV: Ondansetron HCl Introduction
245
ONDANSETRON HYDROCHLORIDE-ANTIEMITIC DRUG
4.01 Drug Profile
Ondansetron (OND) chemically known as 4H-Carbazol-4-one,1,2,3,9-
tetrahydro-9-methyl-3-(2-methyl-1H-imidazol-1-yl) methyl-,monohydrochloride,(±)-
,dehydrate. It is used as a selective blocking agent of the serotonin 5-HT3 receptor
type and also used for prevention of nausea and vomiting associated with highly
emetogenic cancer chemotherapy, radiotherapy or anesthesia and surgery. It is
officially reported in the United States of Pharmacopoeia [271] and British
Pharmacopoeia [272].
Physical Properties:
Molecular formula : C18H19N3O·HCl·2H2O
Molecular weight : 365.86 grams
Appearance : White to off-white powder
Solubility : Water and normal saline.
Structure:
O
N
NH3C
N
H3C

Chapter-IV: Ondansetron HCl Introduction
246
Pharmaceutical Formulations:
Ondem (Alkem) : 4mg.8mg Tablets
2mg/ml -2ml, 4ml Injections
Zofer Sun (Solares) : 4mg, 8mg Tablets
2mg/ml -2ml, 4ml Injections
Zofran (Glaxo Smith Kline) : 4-mg 8-mg Tablets
Osetron (Dr.Reddy’s) : 4mg.8mg Tablets
4mg/ml, 8mg/ml Injections
Inactive Ingredients:
Each tablet also contains the inactive ingredients aspartame, gelatin, mannitol,
methylparaben sodium, propylparaben sodium, strawberry flavor, lactose,
microcrystalline cellulose, pregelatinized starch, hypromellose, magnesium stearate,
titanium dioxide, triacetin, and iron oxide yellow (8mg tablet only)
Literature Survey:
An extensive literature survey is carried out, and it is evident that some
analytical methods such as reverse phase HPLC, spectrophotometric and derivative
spectrophotometric methods are reported for the determination of ondansetron in pure
and formulations and mostly in biological fluids. Reverse phase HPLC [273-293] are
reported in the literature for the determination of ondansetron mostly in biological
fluids [284-293] and in the study of impurities [294].The reported methods are costly
and not applicable at higher concentrations. A few spectrophotometric [295-296] and
derivative spectrophotometric [297] methods are also found in the literature for the
determination of ondansetron HCl in pure and combination with paracetamol.

Chapter-IV Ondansetron HCl Part-A: HPLC Method
247
QUANTIFICATION OF ONDANSETRON HYDROCHLORIDE
BY REVERSE PHASE HPLC METHOD
4.02 Introduction
High-performance liquid chromatography (HPLC) is a chromatographic
technique that can separate a mixture of compounds and is used in biochemistry and
analytical chemistry to identify, quantify and purify the individual components of the
mixture. HPLC typically utilizes different types of stationary phases, a pump that moves
the mobile phase(s) and analyte through the column, and a detector that provides a
characteristic retention time for the analyte. A few HPLC methods [273-293] are reported
in the literature for the determination of ondansetron in different biological fluids and in
combination with other drugs but there is a little HPLC work is done on pure and
formulations. The reported methods are costly and not applicable at higher
concentrations. Hence the author is interested in developing a reverse phase HPLC
method to estimate the amount of ondansetron pure drug and is successfully applied for
pharmaceutical formulations. The experimental details, materials, development of
method, chromatographic conditions and validated parameters are given below.
4.03 Experimental
Instrumentation: Shimadzu LC- 20AT Prominance liquid chromatographic system
equipped with binary gradient pump, UV-VIS SPD 20A detector, Column Oven and
controlled by spinchrom software is used for the analysis.
Chromatographic conditions
Column : Intertisil ODS 3V (150mm, 4.6mm- ID;
5µm particle size)

Chapter-IV Ondansetron HCl Part-A: HPLC Method
248
Detector : UV-VIS SPD 20A Prominance
Wavelength (nm) :305nm
Flow Rate : 0.5ml/minute
Injection Volume : 10 μl
Temperature : 25oC
Run Time : 25 minutes
Retention Time : 9.029 min.
4.04 Method Development
(i ) Materials and Reagents
Gift samples of Ondansetron hydrochloride and working reference standard
are obtained from Aurobindo Pharma Ltd. The formulations are purchased locally.
All the reagents and chemicals used are of HPLC grade. Acetonitrile, methanol,
sodium acetate and acetic acid are purchased from Merck, India and HPLC grade
water is used to prepare the mobile phase. Stock solutions of ondansetron
hydrochloride and sample solutions are prepared in the mobile phase. Fresh working
solutions are prepared daily. All solutions are filtered through 0.45 µm membrane
filter and degassed using a sonicator.
(ii) Preparation of Solutions:
Preparation of buffer solution of pH=4.5 (0.02M, Merck; v/w): About 0.820 grams
of sodium acetate is accurately weighed, transferred into 500ml volumetric flask and

Chapter-IV Ondansetron HCl Part-A: HPLC Method
249
dissolved in HPLC grade water and made up to the mark by adjusting the pH = 4.5 by
adding a few drops of acetic acid, sonicated and filtered
Preparation of mobile phase(Buffer: Acetonitril ; 65:35 v/v): Mobile phase is
prepared by mixing accurately measured volumes of 195ml of buffer and 105 ml of
acetonitrile in a 500ml beaker, stirred well, sonicated and used for the analysis.
Preparation of Standard (1mg/ml;w/v): About 50mg of ondansetron hydrochloride
is accurately weighed , transferred into a well cleaned 50ml volumetric flask,
dissolved in mobile phase and made up to the mark. The solution is degassed by
sonication, filtered through 0.45μ filter and used as a standard solution. Working
standard solutions of different concentrations (20%, 40%, 60% 80%, 100% and 120%
are prepared by measuring and diluting required volumes of standard.
Preparation of test solution: Twenty tablets (4.0mg/Tablet and 8.0mg/Tablet) of
Osetron/Ondem are powdered and mixed thoroughly, an amount of the powder
equivalent to 50mg of the drug is accurately weighed and dissolved in methanol,
shaken well and filtered. The filtrate is evaporated to dryness carefully and the
residue is dissolved in mobile phase and made up to 50ml. The resulting solution is
degassed by sonication and filtered through 0.45μ filter and 5.0ml of this test solution
is further diluted to 50ml and used for the analysis.
(iii) Procedure:
The chromatographic conditions are fixed for the Shimatzu HPLC system .The
mobile phase is allowed to pump from the mobile phase reservoir into the column
Intertisil ODS 3V (150mm, 4.6mm-ID; 5µm particle size) at a flow rate of 0.5
ml/min., keeping the column in thermostat at a temperature of 25oC. The response of
Chapter-IV Ondansetron HCl Part-A: HPLC Method
250
the instrument is recorded at maximum wavelength 305nm. After complete elution of
the mobile phase through the column, it is found that the base line is almost parallel to
x-axis in the chromatogram. Now 10μl of the standard / test solution of ondansetron
hydrochloride is injected into the system, and the chromatogram is recorded (Fig.4.01,
Fig.4.02 P: 255).
(iv) Optimization of the proposed method:
The developed method is optimized and optimum conditions are established
by varying the parameters such as concentration of the standard, type of column,
temperature of the column, flow rate, injection volume, composition of the mobile
phase (polarity), pH of the buffer ect one at a time, keeping the others fixed and
observing the effect on the retention time, tailing factor and other system suitability
parameters. It is found that the best suitable conditions to obtain the chromatogram in
reasonable retention time, tailing factor less than 2.0, and number of theoretical plates
more than 2000 are given above and maintained throughout the analysis.
4.05 Method Validation
Proper validation of analytical methods is important for pharmaceutical
analysis when ensurance of the continuing efficacy and safety of each batch
manufactured relies solely on the determination of quality. The ability to control this
quality is dependent upon the ability of the analytical methods, as applied under well-
defined conditions and at an established level of sensitivity, to give a reliable
demonstration of all deviation from target criteria. The most widely applied validation
characteristics are given below

Chapter-IV Ondansetron HCl Part-A: HPLC Method
251
(i) System Suitability and System Precision: The system suitability parameters and
system precision are evaluated from the area of the chromatograms of six replicate
injections and found to be within the limits. The system suitability parameters are
presented in Table-4.01(a) and Table-4.01(b), P: 257.
(ii) Linearity of detector response: Linearity of detector response to the concentration
of the standard drug is established by plotting a graph between the concentrations
versus average area of two peaks. A series of six solutions of the drug are prepared in
the concentration range of about 20μg/ml to 120μg/ml corresponding to 20% to 120%
of target concentration. Each solution is injected into the system and recorded the
chromatogram under the test conditions. A graph is plotted to concentration in µg/ml
on X-axis versus response on Y-axis (Fig.4.03 (a), P: 256). The detector response is
found to be linear with a correlation coefficient of 0.9999. The results are summarized
in Table-4.02, P: 257.
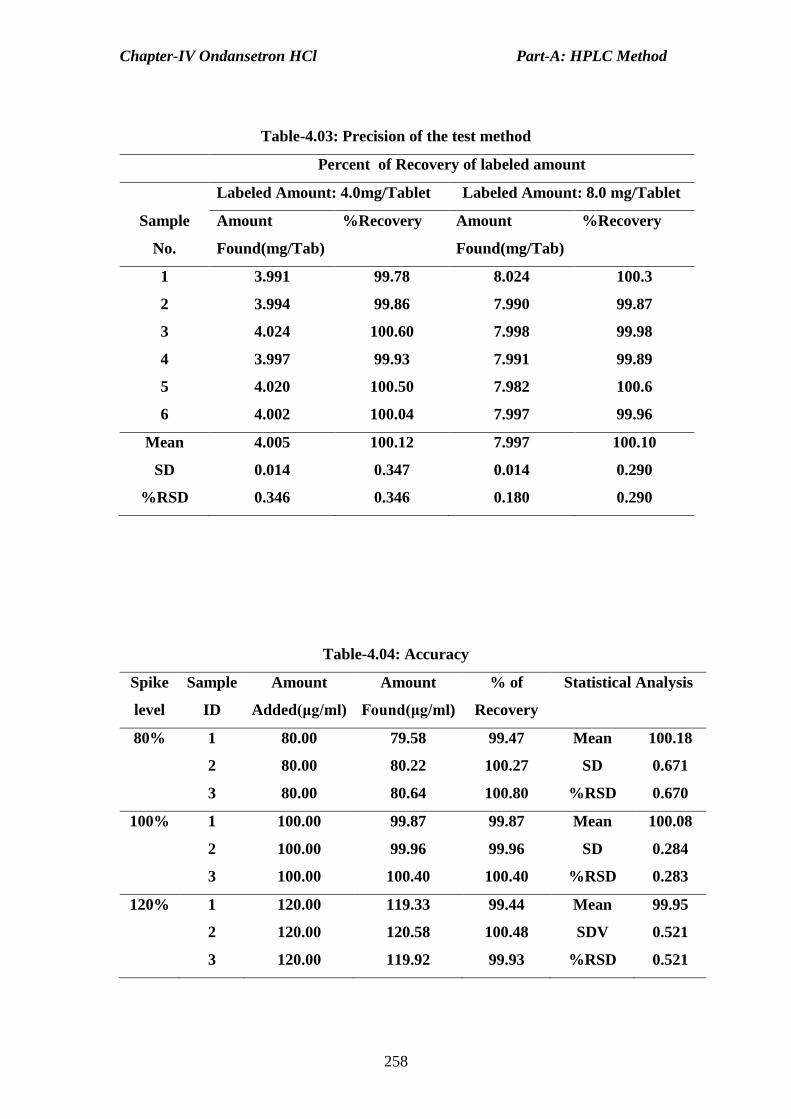
(iii) Precision of test method: Commercial formulations of ondansetron hydrochloride of
4.0mg and 8.0mg are successfully analyzed by the developed method. The precision of
the test method is evaluated by assaying six samples of tablets of 4.0mg and 8.0mg. The
average percent of assay of formulations in tablets is found to be 100.12 (±0.347) and
100.10 (±0.290). The results are summarized in Table-4.03, P: 258.
(iv) Accuracy of the method: To determine the accuracy of the method, solutions of
different concentrations (75%, 100%, and 125% of the target concentration) of
ondansetron hydrochloride sample are prepared in triplicate for each spike level and
assayed as per standard method. The % recovery is found to be100.18 (±0.671),
100.08 (±0.284) and 99.95 (±0.521) at 75%, 100% and 125% spike levels
respectively. The results are summarized in Table-4.04, P: 258.
Chapter-IV Ondansetron HCl Part-A: HPLC Method
252
(v) Limit of Detection and Limit of Quantitation: LOD and LOQ are calculated
based on the standard deviation of the response and the slope of the calibration curve
The results of LOD and LOQ are summarized in Table-4.02, P: 257.
(vi)Linearity of test method: The percent of recovery of the drug is determined by
adding different known amounts of the standard drug to equal amount of test sample.
A linear plot is drawn to amount of ondansetron added to average amount of the drug
recovered. The results of the recovery experiments by the developed method are
summarized in Table-4.05, P: 259.
(vii) Ruggedness
(d) Intra Day & Inter Day variability: This study is conducted on day-1 and day-2
using same columns on the same HPLC system by assaying six separately prepared
ondansetron sample solutions under similar conditions. The system suitability
parameters are evaluated as per the standard method on both the days and found to be
within limits. The average % assay for the two systems is found to be 100.00 (±0.256)
and 100.08 (±0.219). The results are summarized in Table-4.06(a), P: 259.
Comparison of the results obtained on two days shows that the assay method is
rugged for day to day variability.
(b) System to System variability: System to system variability study is conducted on
two HPLC systems by using the same column by assaying six separately prepared
ondansetron sample solutions under similar conditions. The system suitability
parameters are evaluated as per the standard method on both the systems and found to
be within limits. The average % assay for the two systems is found to be 100.05
(±0.287) and 100.25 (±0.348). The results are summarized in Table-4.06(b), P: 260.

Chapter-IV Ondansetron HCl Part-A: HPLC Method
253
Comparison of the results obtained on two systems shows that the assay method is
rugged for system to system variability.
(c)Column to Column variability: This study is conducted using two columns on the
same HPLC system by assaying six separately prepared ondansetron sample solutions
under similar conditions. The system suitability parameters are evaluated as per the
standard method on both the systems and found to be within limits. The average %
assay for the two columns is found to be 100.10 (±0.446) and 100.23(±0.363). The
results are summarized in Table-4.06(c), P: 260. Comparison of the results obtained
on two columns shows that the assay method is rugged for column to column
variability.
(viii) Robustness
A study is conducted to determine the effect of variation in chromatographic
conditions such as flow rate, detection wavelength, temperature of the column,
composition of the mobile phase and pH of the buffer solution. Sample solution
prepared in triplicate as per test method is injected into the HPLC system and the
system suitability parameters are evaluated as per the test method and found to be
within limits. The variation in parameters and the results obtained are incorporated in
Table-4.07, P: 261.
4.06 Results and Discussion:
To estimate the amount of ondansetron hydrochloride in pure and
pharmaceutical formulations by reverse high performance liquid chromatography
under optimized chromatographic conditions, chromatograms are recorded for
standard and test solutions. The system suitability parameters and system precision

Chapter-IV Ondansetron HCl Part-A: HPLC Method
254
are evaluated and found within the limits. The results are given in Table-4.01(a),
P: 257. A plot is drawn between concentration and the instrument response, it is linear
with good correlation coefficient(r=0.9999) (Table-4.02, P: 257; Fig.4.03 (a), P:
256). Precision and accuracy of the developed method are determined and are
expressed in %RSD and % of recovery of the active pharmaceutical ingredient. Low
%RSD value 0.347 and 0.290 and high percent of recovery 100.18(±0.671),
100.08(±0.284), 99.95(±0.521), at 80%, 100% and 120% concentration of the
standard indicate that the method is highly precise and accurate (Table-4.03 and
Table-4.04, P: 258).
A study is conducted between two different days, two different systems, and
two columns to compare the results. The system suitability parameters evaluated as
per the test method on both the systems, columns and between two days are found to
be within limits. The average % assay and relative standard deviation are within the
limits (Table-4.06(a) - Table-4.06(c), P: 259-260). The change in system suitability
parameters are evaluated by studying the effect of change in composition of the
mobile phase, flow rate, pH
of the buffer solution, wavelength and column
temperature and found to be acceptable (Table-4.07, P: 261).
Pharmaceutical formulations are analyzed by the developed method by
estimating the amount of drug recovered by standard addition method. A graph is
drawn between the amount of drug added and the amount of drug recovered, the plot
is linear and regression equation is given by y=1.0173x+0.5907with r2 =
0.9999
(Table-4.05, P: 259; Fig.4.03 (b), P: 256). Precision and Accuracy of the test sample
is determined by assaying formulations of 4.0mg, 8.0mg per tablet and 2.0mg/ml.
High percent of mean recovery and low %RSD values (Table-4.07, P: 261)

Chapter-IV Ondansetron HCl Part-A: HPLC Method
255
indicate that the method should be successfully applied for the analysis of
formulations.
Fig 4.01 Chromatogram of Ondansetron hydrochloride (Standard)
Fig4.02 Chromatogram of Onansetron hydrochloride (Formulation)

Chapter-IV Ondansetron HCl Part-A: HPLC Method
256
Linearity of detector responce to the concentration of the Ondansetron HCl
y = 28007x - 8898.8
R2 = 0.9998
0.0E+00
8.0E+05
1.6E+06
2.4E+06
3.2E+06
4.0E+06
0 30 60 90 120
Concentration of Ondansetron HCl µg/ml
Det
ecto
r R
esp
on
se
Fig 4.03(a) Linearity of the detector response
Linearity of the test Method
y = 1.0173x - 0.5907
R2 = 0.9999
0.0
25.0
50.0
75.0
100.0
125.0
0.0 20.0 40.0 60.0 80.0 100.0 120.0 140.0
Weight of Drug added in µg/ml
Weig
ht
of
dru
g r
eco
vered
in
µg
/ml
Fig.4.03 (b) Linearity of the Test Method

Chapter-IV Ondansetron HCl Part-A: HPLC Method
257
Table-4.01(a): System Suitability
System suitability parameters Observed value Acceptance criteria
USP tailing factor 1.524 NMT2.0
Number of theoretical plates 2746 NLT2000
RSD(six replicate measurements) 0.483 NMT 2.0%
Table-4.01(b): System Precision
S.No.
Concentration
(μg/ml)
Average Area
Statistical
Parameters
Value of the
parameters
1 100 2771955 Mean 2776428
2 100 2769832
3 100 2799604 SD 13420
4 100 2760823
5 100 2783188 %RSD 0.483
6 100 2773168
Table-4.02: Linearity of detector response
S.No.
Concentration
μg/ml
Average
Area
Regression Parameter
1 20 557656 Slope 27661
2 40 1129312 Intercept 7282
3 60 1668967 Correlation Coefficient 0.9999
4 80 2215323 LOD µg/ml 1.558
5 100 2772179 LOQ µg/ml 5.194
6 120 3324935
Chapter-IV Ondansetron HCl Part-A: HPLC Method
258
Table-4.03: Precision of the test method
Percent of Recovery of labeled amount
Sample
No.
Labeled Amount: 4.0mg/Tablet Labeled Amount: 8.0 mg/Tablet
Amount
Found(mg/Tab)
%Recovery
Amount
Found(mg/Tab)
%Recovery
1 3.991 99.78 8.024 100.3
2 3.994 99.86 7.990 99.87
3 4.024 100.60 7.998 99.98
4 3.997 99.93 7.991 99.89
5 4.020 100.50 7.982 100.6
6 4.002 100.04 7.997 99.96
Mean 4.005 100.12 7.997 100.10
SD 0.014 0.347 0.014 0.290
%RSD 0.346 0.346 0.180 0.290
Table-4.04: Accuracy
Spike
level
Sample
ID
Amount
Added(μg/ml)
Amount
Found(μg/ml)
% of
Recovery
Statistical Analysis
80% 1 80.00 79.58 99.47 Mean 100.18
2 80.00 80.22 100.27 SD 0.671
3 80.00 80.64 100.80 %RSD 0.670
100% 1 100.00 99.87 99.87 Mean 100.08
2 100.00 99.96 99.96 SD 0.284
3 100.00 100.40 100.40 %RSD 0.283
120% 1 120.00 119.33 99.44 Mean 99.95
2 120.00 120.58 100.48 SDV 0.521
3 120.00 119.92 99.93 %RSD 0.521

Chapter-IV Ondansetron HCl Part-A: HPLC Method
259
Table-4.05: Linearity of test method
Spike
level (%)
Drug
added(μg/ml)
Drug
Recovered(μg/ml )
Regression parameters
20 20.00 19.68 Slope 1.0173
40 40.00 40.72
60 60.00 59.79 Intercept 0.5007
80 80.00 80.63
100 100.00 101.32 Correlation Coefficient 0.9999
120 120.00 121.57
Table -4.06(a) Intra Day and Inter Day Variation
Percent of assay of the sample mg
Sample No. Day-1 Day-2
1 99.69 100.31
2 100.14 99.93
3 99.80 99.94
4 100.31 99.95
5 99.85 100.4
6 100.23 99.92
Mean 100.00 100.08
SD 0.256 0.219
%RSD 0.256 0.219
Comparison of the precision with method precision
F=1.840,t=1.117 F=2.511,t=0.503
Comparison of precisions between two analysts
F=1.366 t=0.540

Chapter-IV Ondansetron HCl Part-A: HPLC Method
260
Table -4.06(b) System to System Variation
Percent of assay of the sample mg
Sample No. Systemt-1 System-2
1 99.97 100.50
2 99.93 99.97
3 100.3 99.93
4 99.82 100.60
5 100.5 99.91
6 99.78 100.60
Mean 100.05 100.25
SD 0.287 0.348
%RSD 0.287 0.347
Comparison of the precision with method precision
F=1.463,t=0.598 F=1.003,t=0.928
Comparison of precisions between two analysts
F=1.476 t=1.205
Table -4.06(c) Column to Column Variation
Percent of assay of the sample mg
Sample No. Column-1 Column-2
1 100.40 99.87
2 99.50 99.93
3 99.80 100.60
4 100.30 99.95
5 100.70 100.70
6 99.87 100.30
Mean 100.10 100.23
SD 0.446 0.363
%RSD 0.445 0.363
Comparison of the precision with method precision
F=1.649,t=0.137 F=1.097,t=0.708
Comparison of precisions between two analysts
F=1.510 t=0.504

Chapter-IV Ondansetron HCl Part-A: HPLC Method
261
Table 4.07: Study of Robustness
Variable Variation USP Plate Count USP Tailing %RSD
Standard -------- 2259 1.537 0.000
Flow Rate 0.4 ml/min. 2284 1.653 0.316
0.6 ml/min. 2316 1.496 0.464
Wavelength 300 nm 2146 1.427 0.581
310 nm 2431 1.126 0.735
Column
Temperature
23oC
2197 1.254 0.673
28oC
2634 1.257 0.331
%Mobile
Phase
70%+30% 2422 1.197 0.215
60%+40% 2397 1.261 0.316
Buffer pH 4.8 2317 1.319 0.554
4.2 2521 1.652 0.523
Acceptance Criteria USP Tailing Factor not more than 2.0, Theoretical Plates
not less than 2000
4.07 Conclusion: The developed method is simple, rapid, precise, accurate, linear,
and robust and rugged. The developed method can be applied to determine
ondansetron in pharmaceutical formulations with good percent of recoveries and
hence it provides an alternative method to use in any analytical testing laboratories to
determine the amount of ondansetron in pure and formulations.

Chapter - IV Ondansetron HCl Part-B: Visible Spectrophotometry
262
VISIBLE SPECTROPHOTOMETRIC DETERMINATION OF
ONDANSETRON
4.08 Introduction
Analytically useful functional groups present in ondansetron hydrochloride
have not been fully exploited for designing suitable visible spectrophotometric
methods and therefore still offer a scope to develop more number of new visible
spectrophotometric methods. The author has made some attempts in this direction and
succeeded in developing visible spectrophotometric methods.
4.09 Experimental
4.09(i) Instrumentation
UV-Visible Spectrophotometer: Double beam Elico SL159 model UV-Visible
spectrophotometer with 2nm resolution, 1cm length quartz coated optics; Wavelength
range190-1100nm is used for all the spectral measurements.
Digital pH Meter: Digital pH Meter with combined electrode, Temperature probe ±0.01
accuracy is used for adjusting pH of the buffer solution.
4.09(ii) Preparation of solutions
(a) Standard Solution of Ondansetron HCl
Stock solution of Ondansetron HCl (0.1%) is freshly prepared by transferring
accurately weighed 100mg of Ondansetron HCl into 100mL volumetric flask,
dissolved in triple distilled water, and made up to the mark. Then working standard
solutions 250μg/ml, 200μg/ml and 100μg/ml are prepared by transferring 25.0ml,

Chapter - IV Ondansetron HCl Part-B: Visible Spectrophotometry
263
20.0ml and 10.0ml of the stock solution into three 100ml standard flasks and made up
to the mark respectively. 100μg/ml working standard solution is used in M1(a), M18,
M19; 200μg/ml working standard solution is used for the following methods M5(c),
M7. M16, M17; 250μg/ml working standard solution is used for the following
methods M1(b), M5(a), M15.
(b) Preparation of reagents
Analytical grade chemicals, reagents and double distilled water are used in the
preparation of solutions.
Method M1(a), M1(b): ARS solution (Fluka) 0.2%, 5.49 x 10⁻³
M, BTB solution (0.1%,
1.60 x 10⁻³
M); Method M5(a), M5(c): MBTH Solution (Fluka): 0.2%, 8.56 x 10⁻³
M), Ce
(IV) solution (Merck):1%, 9.35 x 10⁻³
M), NaIO4 solution (BDH): 0.2%, 9.35 x 10⁻³
M),
AcOH solution (Qualigens): 2.3 M) ; Method – M15 : p-CA solution (Sd-fine; 0.1%,
4.785x10⁻³
M); Method M16 :MO solution ( 0.2%, 6.11 x 10⁻³
M);Method M17 :PA
solution ( 0.1%, 4.36 x 10⁻³
M), Buffer pH – 9.8. Preparations of reagents for the above
methods are as same as described in Chapter-II
Method – M7
NBS solution (Loba; 0.01%, 5.618x10⁻⁴
M): Prepared by dissolving accurately
weighed 50mg of N-Bromo succinimide (NBS) in 500mL of distilled water and
standardized iodometrically.
CB solution (Chroma; 0.005%, 5.497x10⁻⁴
M): Prepared by dissolving 50mg of
Celestine blue in 1000mL of distilled water.

Chapter - IV Ondansetron HCl Part-B: Visible Spectrophotometry
264
Hydrochloric acid (E.Merck; 5M): Prepared by diluting 217.5mL of concentrated
HCI to 500mL with distilled water and standardized
Method M18
4-AP Solution(BDH; 0.5%, 2.45 x 10⁻²
M): 500mg of 4-AP is accurately weighed and
dissolved in 100ml of MeOH containing ml of Con. HCl.
Method M19
INH Solution (Sd.Fine; 0.8%,5.83 x 10-3
M) : 800mg of INH is accurately weighed
and dissolved in 100ml of MeOH containing ml of conc. HCl.
4.09(iii) Procedures for new methods
The procedures for the developed methods and optimum conditions are
described as given below.
Method – M1(a) and M1(b)
Into a series of 125ml separating funnels containing aliquots of standard OND
solution (3.3-20.0μg/ml, 8.3-50.0μg/ml for methods M1(a) and M1(b) respectively),
6.0ml of 0.1M HCI solution and 1.0ml of 0.2% ARS dye solution M1(a), 2.0ml BTB
dye solution M1(b) are added successively. The total volume of aqueous phase in
each separating funnel is adjusted to 15ml with distilled water. To each separating
funnel 10ml of chloroform is added and the contents are shaken for 2min. The two
phases are allowed to separate and the absorbance of the separated chloroform layer
is measured at max (415nm for ARS; 420nm for BTB) against a similar reagent

Chapter - IV Ondansetron HCl Part-B: Visible Spectrophotometry
265
blank. The amount of OND is deduced from the calibration curve (Fig.4.14 - 4.15, P:
280).
Method – M5(a) and M5(c)
Aliquots of standard OND solution 10.0 - 60.0g/ml (3.2 – 19.2g/ml for
method M5(c)) are transferred into a series of 25ml calibrated tubes. Then 0.5ml of
MBTH (1.0ml in case of method M5(c)) solution is added and kept aside for 5min.
After that 2.0ml (1.58 x 10⁻²
M) of ceric ammonium sulphate (1.0ml (9.35 x 10⁻³
M) of
NaIO4 solution, 1.0ml of acetic acid solution for method M5(c)) is added and kept
aside for 10min. The volume is made up to the mark with distilled water. The
absorbance is measured at 630nm for both the methods against a similar reagent
blank. The amount of OND is computed from its calibration graph. (Fig.4.16 and Fig
4.17, P: 281).
Method – M7
Different aliquots of standard OND solution (8.0-48.0g/ml) are transferred
into a series of 25ml calibrated tubes. Then 1.25ml (1M) of HCl and 4.0ml (2.81 x
10-3
M) of NBS solutions are added and the total volume is brought to 15ml with
distilled water. After 10minutes 4.0ml of CB solution is added, after 5minutes
absorbance is measured at 460nm against reagent blank. The decrease in absorbance
corresponding to consumed NBS and in turn the dye concentration is obtained by
subtracting the decrease in absorbance of the solution that of blank solution. The
amount of drug is computed from calibration curve (Fig.4.18, P: 281).

Chapter - IV Ondansetron HCl Part-B: Visible Spectrophotometry
266
Method – M15
Into a series of 10ml calibrated tubes containing aliquots of standard OND
solution (12.5 – 75.0 g/ml), 2.0ml of chloranilic acid (4.785 x 10⁻³
M) is added and
kept aside for 30 min at lab temperature. The volume in each tube is made up to the
mark with chloroform. The absorbance of the colored species is measured at 540nm
against a reagent blank. The amount of the drug is calculated from Beer’s law plot
(Fig.4.19, P: 281).
Method M16
To each of 10ml calibrated tubes different aliquots (10.0-60.0 g/ml) of
standard OND solution, 2.0ml of water and 8 Volumes H2O2 are added successively
and then kept aside for 10min. After that 1.0ml of MO solution is added and the total
volume in each flask is brought to 10ml by the addition of distilled water. The
absorbance is measured at 530nm against a reagent blank prepared in a similar way.
The concentration of drug in a sample is computed from Beer-Lambert plot (Fig.4.20,
P: 282).
Method M17
Into a series of 50 ml separating funnels containing aliquots of drug (6.7 –
40.0 g/ml) solutions, 2 ml of pH 9.8 buffer and 2.0 ml of 0.1% picric acid solutions
are added successively. Total volume of aqueous phase in each separating funnel is
adjusted to 15 ml with distilled water. To each separating funnel 10 ml of chloroform
is added and the contents are shaken for 2 min. The two phases are allowed to
separate and the absorbance of the separated chloroform layer is measured at 415 nm

Chapter - IV Ondansetron HCl Part-B: Visible Spectrophotometry
267
against a reagent blank prepared under similar conditions. The amount of drug is
deduced from the calibration graph (Figs.4.21, P: 282).
Method: M18
Delivered aliquots of standard OND solution (5.0 – 30.0g/ml) into a series of
10ml calibrated tubes, then 3.0ml (5.83 x 10⁻³
M) of 4-AP is added to each tube and
kept aside for 15min. Later the solution in each tube is made up to 10ml with
methanol. The absorbance is measured at 440nm against the reagent blank. The
amount of OND is computed from its calibration graph. (Fig.4.22, P: 282)
Method: M19
Into a series of 10ml calibrated tubes delivered aliquots of standard OND
solution (5.0 – 30.0g/ml), then 2.0ml (2.45 x 10⁻³
M) of INH solution is added to
each tube and heated for 10min at 60oC. Later the solution in each tube is made up to
10ml with methanol. The absorbance is measured at 470 nm against the reagent
blank. The amount of OND is computed from its calibration graph (Fig.4.23, P: 282).
4.09(ii) Optimization of methods
Optimum conditions for the maximum color development of the proposed
methods (M1(a), M1(b), M5(a), M5(c), M7, M15, M16, M17, M18 and M19) are
established by varying the parameters one at a time, keeping the others fixed and
observing the effect produced on the absorbance of the colored species. The optimum
conditions necessary for rapid and quantitative formation of the colored product with
maximum stability and sensitivity for the methods Method - M1(a), M1(b); Method

Chapter - IV Ondansetron HCl Part-B: Visible Spectrophotometry
268
– M5(a), Method – M5(c) and Method – M15 are as same as described in Chapter-
II, P: 97-109.
Method – M7
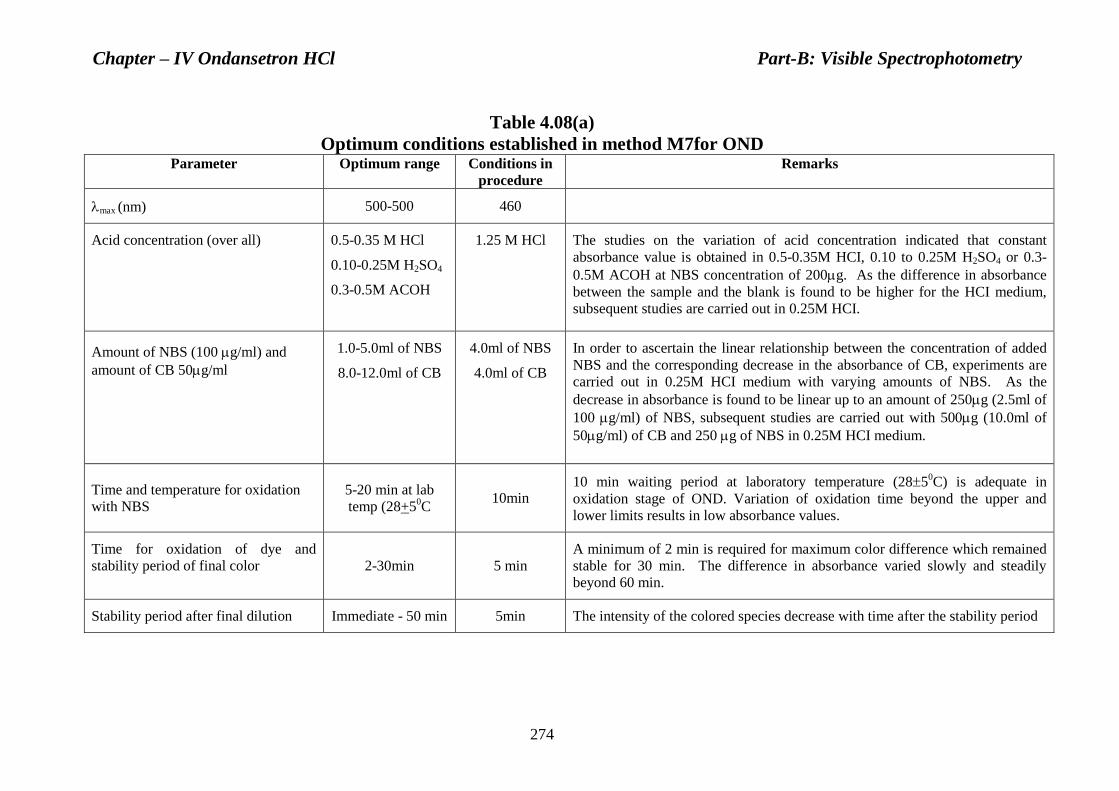
The effect of reagent concentration (acidity, NBS and CB), waiting period in
each step with respect to maximum sensitivity, minimum blank, adherence to Beer’s
law, reproducibility and stability of final color are studied by means of control
experiments varying one parameter at a time (Table: 4.08(a), P: 274)
Method M16
In developing this method, the effect of various parameters likes strength and
volume of H2O2 time required for oxidation, volume and strength of reagents MO,
strength of the acid, solvent for final dilution in developing color of maximum
stability and intensity are studied (Table: 4.08(b), P: 275).
Method – M17
The optimum conditions in this method are fixed based on the study of the
effects of various parameters such as type of buffer, concentration of picric acid,
choice of organic solvent, ratio of organic phase to aqueous phase, shaking time,
temperature, intensity and stability of the colored species in organic phase. The author
performed controlled in pediments by measuring absorbance at max 415nm of a
series of solutions varying one and fixing the other parameter (Table: 4.08(c), P:
276).

Chapter - IV Ondansetron HCl Part-B: Visible Spectrophotometry
269
Method: M18
Optimum conditions are established based on the study of the effects of various
parameters such as volume of (2.54 x 10⁻²
M) 4-AP solution, volume of solvents
solution used initially and subsequently for final dilution and the stability of colored
species after final dilution, measuring absorbance at 440nm. The optimum conditions
developed and actual conditions chosen for the procedure (Table: 4.08(d), P: 277).
Method: M19
The optimum conditions in this method are found based on the study of the
effects of various parameters such as volume of (5.83 x 10⁻³
M) INH solution, volume
of solvents solution used initially and subsequently for final dilution and the stability of
colored species after final dilution is established by measuring absorbance at 450nm.
The optimum conditions developed and actual conditions chosen for the procedure
(Table: 4.08(e), P: 277).
4.10 Validation of the proposed methods
The proposed methods are validated based on sensitivity, linearity precision,
accuracy, specificity. Sensitivity of all the methods is evaluated by determining the
limit of detection (LOD) and limit of quantitation (LOQ). The average percent of
recovery obtained which indicates good accuracy of the developed methods.
4.10(i) Linearity
Calibration graphs are plotted by taking concentration on x-axis and
absorbance on y- axis for the proposed methods and found to be passing linearly
through the origin. Linear least square regression analysis is carried out for getting the

Chapter - IV Ondansetron HCl Part-B: Visible Spectrophotometry
270
slope, intercept and correlation coefficient, standard deviation on slope, standard
deviation on intercept, limit of detection and limit of quantification are evaluated
Table 4.10(a)-Table 4.10(c) , P: 287
4.10(ii) Precision
Repeatability of proposed methods is determined from the absorbance values
for six replicates of constant amount of ondansetron hydrochloride within the Beer’s
law limits. The percent of relative standard deviation and percent range of error
(0.05confidence limit) are calculated for the proposed methods and represented in
(Table4.11 (a)-Table 4.11(c), P: 288)
4.10(iii) Accuracy
In order to determine the accuracy of the proposed methods, three different
levels of drug concentrations are prepared from the stock solution and analyzed by
taking three replicate measurements. Accuracy is expressed as mean percentage
recovery and percentage relative standard deviation. (Table4.12 (a)-Table4.12 (j), P:
289-293).
4.10(iv) Limit of Detection and Limit of Quantitation
The limit of detection and quantitation are calculated based on the standard
deviation of the intercept (Sa), and slope of calibration curve, b, and presented in
Table 4.10(a)-Table4.10(c), P: 287.
Chapter - IV Ondansetron HCl Part-B: Visible Spectrophotometry
271
4.11(i) Assay of pharmaceutical formulations
Thirty tablets of 4.0mg/tablet or 8.0mg /tablet) are powdered and mixed
thoroughly. The amount of the powder equivalent to 100mg is dissolved in methanol,
shaken well and filtered .The filtrate is made up to 100ml with triple distilled water.
Working sample solutions of 250μg/ml, 200μg/ml are prepared by diluting 25.0ml
and 20.0ml of this solution to 100ml. The present of recoveries are determined by
adding different known amounts of the standard drug to equal amount of test sample;
reagents are added and diluted to the same volume. The absorption values are
measured for every solution and the results are plotted on a graph with the dependent
variable (absorbance) on y-axis and the amount of the drug added on x-axis.
Extrapolation of the straight line thus obtained to the point where the x-axis is cut
provides a measure of drug in the test solution. The results of the recovery
experiments by the proposed methods are listed in Table 4.13(a)-Table4.13 (e), P:
294-298.
4.11 (ii) Analysis of formulations
Commercial formulations containing Ondansetron HCl are successfully
analyzed by the proposed methods. The values obtained by the proposed and
reference methods for the formulations were compared statistically with F-test and t-
test and found to be not different significantly. The results are summarized in Table
4.13(a)-Table4.13 (e), P: 294-298. Percent recoveries are determined by adding
standard drug to preanalysed formulations. The results of the recovery experiments by
the proposed methods are also listed in Table 4.13(a)-Table4.13 (e), P: 294-298.

Chapter - IV Ondansetron HCl Part-B: Visible Spectrophotometry
272
4.12 Results and Discussions
4.12(i) Spectral Characteristics
In order to ascertain the optimum wavelength of maximum absorption (max) of
the colored species formed in the each of nine spectrophotometric methods, certain
amount of the drug is taken and developed color by following the prescribed
procedure for each method. The absorption spectrum is scanned on a
spectrophotometer in the region of wavelength 370 to 900nm against similar reagent
blank. The reagent blank absorption spectrum of each method is also recorded against
the solvent. The results are graphically represented in Fig. 4.04 – Fig.4.13, P: 278-
280. The absorption curves of the colored species in each method show
characteristics absorption maxima where as the blank in each method has low or no
absorption in this region.
4.12(ii) Optical Characteristics
In order to know whether the colored species formed in the above methods, adhere
to Beer’s law, the absorbances at maximum wavelength of a series of solutions containing
different amounts of the drug and specified amounts of reagents (as given in the
recommended procedures for each method) are recorded against the corresponding reagent
blanks. The Beer’s law plots of these systems are recorded against the corresponding
reagent blanks (Fig. 4.14 – Fig. 4.23, P: 280-282). Beer’s law limits, molar absorptivity,
Sandell’s sensitivity and optimum photometric range for each method are calculated and
are represented in Table 4.09 (a)-Table4.09(c), P: 286).

Chapter - IV Ondansetron HCl Part-B: Visible Spectrophotometry
273
4.12(iii) Validation Parameters
Least square regression analysis is carried out for getting the slope, intercept and
correlation coefficient and presented in (Table4.10 (a)-Table4.10(c), P:287). Precision
of each method is determined by measuring the absorbance of six replicate concentrations
of ondansetron hydrochloride and expressed as %RSD. The low percent of relative
standard deviation values (Tables4.11 (a)-Table 4.11(c), P: 288) show that these
methods are precise. Accuracy of these methods is expressed in terms of percent of
recovery of the drug added. High percent of recovery of the drug at different
concentration levels indicates that the developed methods are accurate. The results are
given in the Table4.12 (a)-Table4.12 (j), P: 289-293. Commercial formulations of the
drug are successfully analyzed by these methods. The %RSD and %Recovery values
obtained by the proposed are compared with reference method by applying statistical
tests such as F-test and t-test. These methods are found to be not significantly different
Table4.13 (a) - Table4.13 (e), P: 294-298.
Chapter – IV Ondansetron HCl Part-B: Visible Spectrophotometry
274
Table 4.08(a)
Optimum conditions established in method M7for OND Parameter Optimum range Conditions in
procedure
Remarks
max (nm) 500-500 460
Acid concentration (over all)
0.5-0.35 M HCl
0.10-0.25M H2SO4
0.3-0.5M ACOH
1.25 M HCl
The studies on the variation of acid concentration indicated that constant
absorbance value is obtained in 0.5-0.35M HCI, 0.10 to 0.25M H2SO4 or 0.3-
0.5M ACOH at NBS concentration of 200g. As the difference in absorbance
between the sample and the blank is found to be higher for the HCI medium,
subsequent studies are carried out in 0.25M HCI.
Amount of NBS (100 g/ml) and
amount of CB 50g/ml
1.0-5.0ml of NBS
8.0-12.0ml of CB
4.0ml of NBS
4.0ml of CB
In order to ascertain the linear relationship between the concentration of added
NBS and the corresponding decrease in the absorbance of CB, experiments are
carried out in 0.25M HCI medium with varying amounts of NBS. As the
decrease in absorbance is found to be linear up to an amount of 250g (2.5ml of
100 g/ml) of NBS, subsequent studies are carried out with 500g (10.0ml of
50g/ml) of CB and 250 g of NBS in 0.25M HCI medium.
Time and temperature for oxidation
with NBS
5-20 min at lab
temp (28+50C
10min 10 min waiting period at laboratory temperature (285
0C) is adequate in
oxidation stage of OND. Variation of oxidation time beyond the upper and
lower limits results in low absorbance values.
Time for oxidation of dye and
stability period of final color 2-30min 5 min
A minimum of 2 min is required for maximum color difference which remained
stable for 30 min. The difference in absorbance varied slowly and steadily
beyond 60 min.
Stability period after final dilution Immediate - 50 min 5min The intensity of the colored species decrease with time after the stability period

Chapter – IV Ondansetron HCl Part-B: Visible Spectrophotometry
275
Table 4.08(b)
Optimum conditions established in method M16 for OND Parameter Optimum range Conditions in
procedure
Remarks
max (nm) 500-570 530
Effect of volume of (6.11x10⁻³
M) MO
on color development
0.5-2.0ml
1.0ml Addition of MO at lower limits resulted low absorbance values. Increasing the
volume beyond upper limits had no effect.
Nature of oxidant on color
development
H2O2 H2O2 Of the various oxidants such as Cr(VI), Mn(VII), Fe(III) ,Ce(IV and H2O2 are
tried in combination with MO for oxidation reaction, the combination MO-
H2O2 for the method is found to be best suited with respect to sensitivity and
stability of colored species formed .
Effect of volume of H2O2 for
maximum color development
0.5-2.5ml
2.0ml
Less than 1.0Ml of H2O2 is found to decrease the absorbance of the test solution
Time required for color development
after the addition of oxidant
1-10 min
10min
1 min of time is necessary to attain maximum color development.
Solvent for final dilution Water
Water
Other solvents like methanol, ethanol and propan-2-ol are found not to enhance
the intensity or stability of the final colored product.
Stability period after final dilution 1-45min
30 min
After the stability period, the intensity of the colored product is found to
decrease with time.

Chapter – IV Ondansetron HCl Part-B: Visible Spectrophotometry
276
Table 4.08(c)
Optimum conditions established in method M17 for OND Parameter
Optimum range
Conditions in
procedure
Remarks
max (nm) PA
400-490
415
Effect of buffer on color development 9.0 - 10.0 pH-9.8
Variations of the pH less than 6.0 and greater than11.0 resulted in low
absorbance values
Effect volume of (4.36x10⁻³
M) PA for
M17 (6.11x10⁻³
M)
1.0-3.0ml (M17)
2.0ml (M17)
2.0ml dye solution of is necessary for covering broad range of Beer’s law limits
Choice of organic solvent for
extraction of the colored complex. Chloroform Chloroform
The water immiscible solvents tested for the extraction of the colored complex
into organic phase which include (chlorobenzene, carbon tetrachloride, benzene,
n-butanol and chloroform). Chloroform is preferred for its selective extraction
of the colored drug-dye complex from the aqueous phase.
Effect of ratio of organic to aqueous
phase on extraction
1:1.5
1:1.5
The extraction of the colored species into organic layer is incomplete when the
ratio of organic to aqueous phase is more than the specified ratio in each case
Effect of shaking time on extraction
1-5 min
2 min
Constant absorbance values are obtained for shaking periods between 1-5 min.
Effect of temperature on the colored
species
Laboratory
temperature
(28+30C)
Laboratory
temperature
At low temperature (less than200C) the extraction of colored species is found to
be improper. At high temperature (greater than350C) the stability of the colored
species is found to be less.
Stability of the colored species in
organic solvent.
1-60 min
5 min

Chapter – IV Ondansetron HCl Part-B: Visible Spectrophotometry
277
Table 4.08(d)
Optimum conditions established in method M18 for OND
Parameter
Optimum range
Conditions in
procedure
Remarks
max (nm)
400 - 470
440
Effect of volume (2.45 x 10⁻²
M) of
4-AP in MeOH and waiting time.
2 - 4ml, 15min 3.0ml ,15min
3ml of 4-AP and 15min waiting time are preferred for covering broad
range in Beer’s law limits.
Solvent for final dilution. Methanol Methanol
MeOH has been found to be suitable for final dilution to give better
absorbance values.
Stability period after final dilution.
Immediate -
40min
10min
After 40min the absorbance of colored species diminish slowly with time.
Table 4.08(e)
Optimum conditions established in method M19 for OND
Parameter Optimum range Conditions in
procedure
Remarks
max (nm) 400 - 500 470
Effect of volume (5.83 x 10⁻³
M) of
INH in MeOH and heating (time
and temp).
1 - 3 ml, 600C,
5 - 15 min.
2.0 ml, 600C,
10 min.
Addition of INH (2ml) and heating (600C, 10min) have been found to be
necessary to cover broad range in Beer’s law limits.
Solvent for final dilution. Methanol Methanol
MeOH has been found to be suitable for final dilution to give better
absorbance values.
Stability period after final dilution.
Immediate - 50
min
Immediate
After the stability period, the absorbance of colored species decreased
slowly.

Chapter – IV Ondansetron HCl Part-B: Visible Spectrophotometry
278
Method M1(a):ARS+CHCl3
[OND]=3.64x10⁻⁵
M
[ARS]=3.66x10⁻⁴
M, [HCl]=4.0x10⁻²
M
0.000
0.200
0.400
0.600
375 400 425 450 475 500
Wavelength nm
Ab
so
rba
nc
e
Blank
Test
Fig. 4.04 Absorption Spectrum of OND
with ARS M1(a)
Method M1(b):BTB+CHCl3
[OND]=9.11x10⁻⁵
M
[BTB]=2.14x10⁻⁴
M, Buffer PH=3.5
0.000
0.200
0.400
0.600
0.800
350 400 450 500 550
Wavelength nm
Ab
so
rba
nc
e
Blank
Test
Aq.
Dye
Fig. 4.05 Absorption Spectrum of OND
with BTB M1(b)
Method M5(a):MBTH+Ce(IV)
[OND]=5.47x10⁻⁵
M
[MBTH]=1.71x10⁻⁴
M,
[Ce(IV)]=1.27x10⁻³
M
0.000
0.050
0.100
0.150
0.200
500 550 600 650 700 750
Wavelength nm
Ab
so
rba
nc
e
Blank
Test
Fig. 4.06 Absorption Spectrum of OND
with MBTH+Ce(IV) M5(a)
Method M5(c):MBTH+NaIO4+AcOH
[OND]=4.37x10⁻⁵
M,
[MBTH]=3.42x10⁻⁴
M
[NaIO4]=3.47x10⁻⁴
M
[AcOH]=1.28x10⁻¹
M
0.100
0.200
0.300
0.400
0.500
500 550 600 650 700 750
Wavelength nm
Ab
so
rba
nc
e
Blank
Test
Fig. 4.07 Absorption Spectrum of OND
with MBTH+NaIO4+AcOH M5(c)

Chapter – IV Ondansetron HCl Part-B: Visible Spectrophotometry
279
Method M7:NBS+CB+HCl
[OND]=4.37x10⁻⁵
M,
[NBS]=8.99x10⁻⁵
M
[CB]=8.80x10⁻⁴
M, [HCl]=5.0x10⁻²
M
0.000
0.050
0.100
0.150
0.200
375 425 475 525 575
Wavelength nm
Ab
so
rba
nc
e
BlankTestAq.Dye
Fig. 4.08 Absorption Spectrum of OND
with NBC+CB M7
Method M15:p-CA+CHCl3
[OND]=1.37x10⁻⁴
M
[p-CA]=9.57x10⁻⁴
M
0.000
0.250
0.500
0.750
450 500 550 600 650
Wavelenght nmA
bs
orb
an
ce
BlankTest
Fig. 4.09 Absorption Spectrum of OND
with p-CA M15
Method M16:H2O2+MO
[OND]=5.47x10⁻⁵
M,
[MO]=3.06x10⁻⁴
M,
0.000
0.100
0.200
0.300
450 500 550 600 650Wavelength nm
Ab
so
rba
nc
e
Blank
Test
Fig. 4.10 Absorption Spectrum of OND
with H2O2+MO M16
Method M17:PA+CHCl3
[OND]=7.29x10⁻⁵
M
[PA]=5.82x10⁻⁴
M, [HCl]=4.0x10⁻²
M
0.000
0.200
0.400
0.600
350 400 450 500
Wavelength nm
Ab
so
rba
nc
e
Blank
Test
Fig. 4.11 Absorption Spectrum of OND
with PA+CHCl3 M17
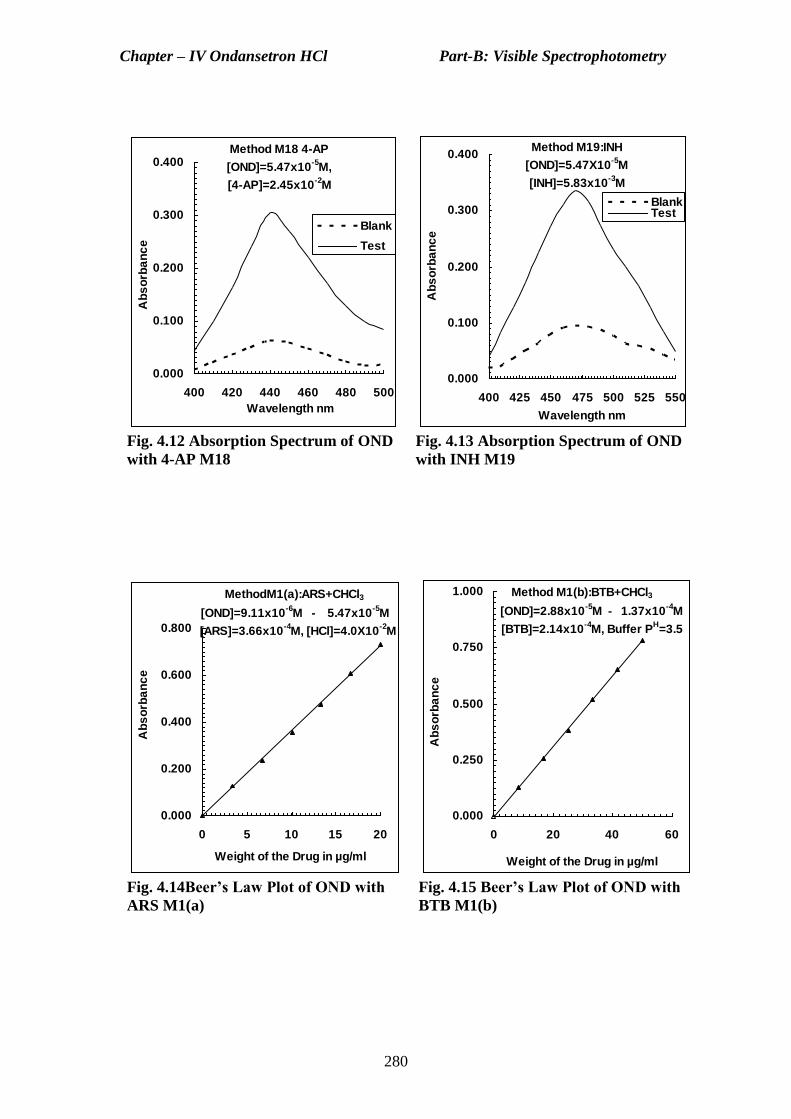
Chapter – IV Ondansetron HCl Part-B: Visible Spectrophotometry
280
Method M18 4-AP
[OND]=5.47x10⁻⁵
M,
[4-AP]=2.45x10⁻²
M
0.000
0.100
0.200
0.300
0.400
400 420 440 460 480 500
Wavelength nm
Ab
so
rba
nc
e
Blank
Test
Fig. 4.12 Absorption Spectrum of OND
with 4-AP M18
Method M19:INH
[OND]=5.47X10⁻⁵
M
[INH]=5.83x10⁻³
M
0.000
0.100
0.200
0.300
0.400
400 425 450 475 500 525 550
Wavelength nm
Ab
so
rba
nc
e
BlankTest
Fig. 4.13 Absorption Spectrum of OND
with INH M19
MethodM1(a):ARS+CHCl3
[OND]=9.11x10⁻⁶
M - 5.47x10⁻⁵
M
[ARS]=3.66x10⁻⁴
M, [HCl]=4.0X10⁻²
M
0.000
0.200
0.400
0.600
0.800
0 5 10 15 20
Weight of the Drug in µg/ml
Ab
so
rba
nc
e
Fig. 4.14Beer’s Law Plot of OND with
ARS M1(a)
Method M1(b):BTB+CHCl3
[OND]=2.88x10⁻⁵
M - 1.37x10⁻⁴
M
[BTB]=2.14x10⁻⁴
M, Buffer PH=3.5
0.000
0.250
0.500
0.750
1.000
0 20 40 60
Weight of the Drug in µg/ml
Ab
so
rba
nc
e
Fig. 4.15 Beer’s Law Plot of OND with
BTB M1(b)

Chapter – IV Ondansetron HCl Part-B: Visible Spectrophotometry
281
Method M5(a):MBTH+Ce(IV)
[OND]=2.73x10⁻⁵
M - 1.64x10⁻⁴
M
[MBTH]=1.71x10⁻⁴
M,
[Ce(IV)]=1.27x10⁻³
M
0.000
0.250
0.500
0.750
0 20 40 60 80
Weight of the Drug in µg/ml
Ab
so
rba
nc
e
Fig. 4.16 Beer’s Law Plot of OND with
MBTH+Ce(IV) M5(a)
Method M5(c):MBTH+NaIO4+AcOH
OND]=8.75x10⁻⁶
M -5.25x10⁻⁵
M
[MBTH]=3.42x10⁻³
M,
[NaIO4]=3.74x10⁻⁴
M
[AcOH]=1.4x10⁻¹
M
0.000
0.200
0.400
0.600
0 10 20 30Weight of the Drug in µg/ml
Ab
so
rba
nc
e
Fig. 4.17 Beer’s Law Plot of OND with
MBTH+NaIO4+AcOH M5(c)
Method M7:NBS+CB+HCl
[OND]=2.19x10⁻⁵
M -1.31x10⁻⁴
M
[NBS]=1.35x10⁻⁴
M,[CB]=1.32x10⁻⁴
M
[HCl]=5.0x10⁻²
M
0.000
0.100
0.200
0.300
0.400
0 20 40 60 80Weght of the Drug in µg/ml
Ab
so
rba
nc
e
Fig. 4.18 Beer’s Law Plot of OND with
NBS+CB M7
Method M15:p-CA+CHCl3
[OND]=3.42x10⁻⁵
M - 2.05x10⁻⁴
M
[p-CA]=9.57x10⁻⁴
M
0.000
0.300
0.600
0.900
0 20 40 60 80Weight of the Drug in µg/ml
Ab
so
rba
nc
e
Fig. 4.19 Beer’s Law Plot of OND with
p-CA+CHCl3 M15
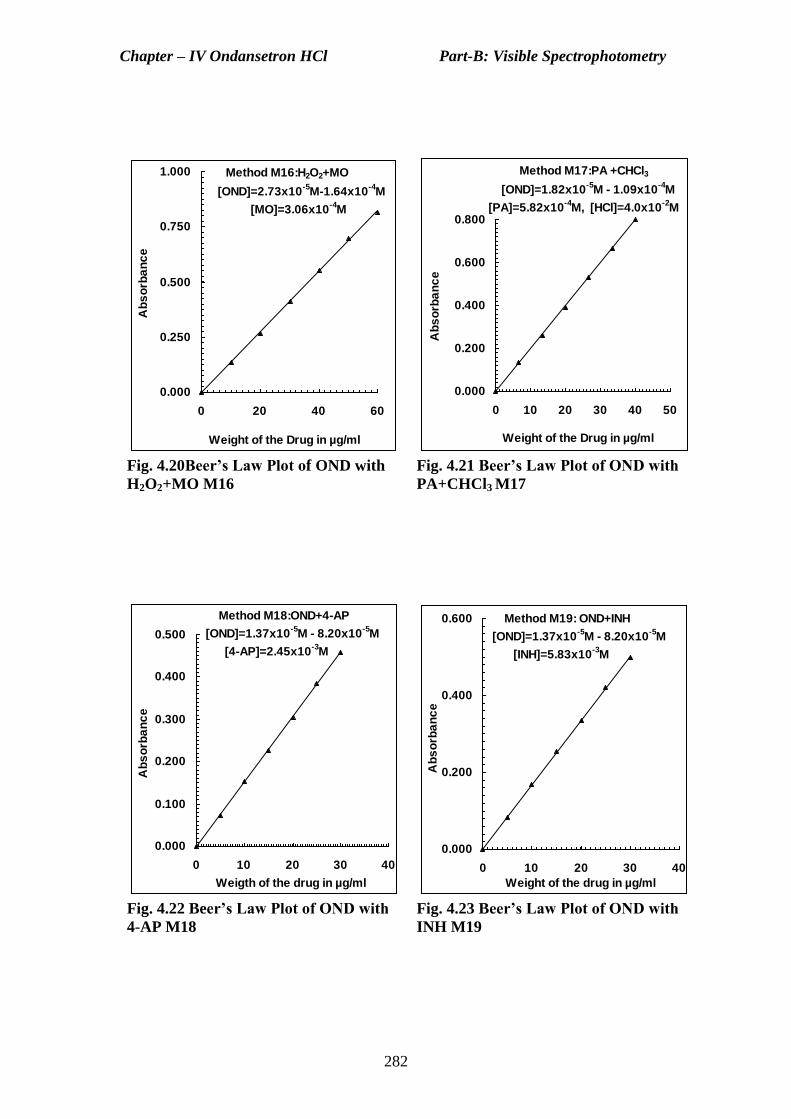
Chapter – IV Ondansetron HCl Part-B: Visible Spectrophotometry
282
Method M16:H2O2+MO
[OND]=2.73x10⁻⁵
M-1.64x10⁻⁴
M
[MO]=3.06x10⁻⁴
M
0.000
0.250
0.500
0.750
1.000
0 20 40 60
Weight of the Drug in µg/ml
Ab
so
rba
nc
e
Fig. 4.20Beer’s Law Plot of OND with
H2O2+MO M16
Method M17:PA +CHCl3
[OND]=1.82x10⁻⁵
M - 1.09x10⁻⁴
M
[PA]=5.82x10⁻⁴
M, [HCl]=4.0x10⁻²
M
0.000
0.200
0.400
0.600
0.800
0 10 20 30 40 50
Weight of the Drug in µg/mlA
bs
orb
an
ce
Fig. 4.21 Beer’s Law Plot of OND with
PA+CHCl3 M17
Method M18:OND+4-AP
[OND]=1.37x10⁻⁵
M - 8.20x10⁻⁵
M
[4-AP]=2.45x10⁻³
M
0.000
0.100
0.200
0.300
0.400
0.500
0 10 20 30 40
Weigth of the drug in µg/ml
Ab
so
rba
nc
e
Fig. 4.22 Beer’s Law Plot of OND with
4-AP M18
Method M19: OND+INH
[OND]=1.37x10⁻⁵
M - 8.20x10⁻⁵
M
[INH]=5.83x10⁻³
M
0.000
0.200
0.400
0.600
0 10 20 30 40
Weight of the drug in µg/ml
Ab
so
rba
nc
e
Fig. 4.23 Beer’s Law Plot of OND with
INH M19
Chapter – IV Ondansetron HCl Part-B: Visible Spectrophotometry
283
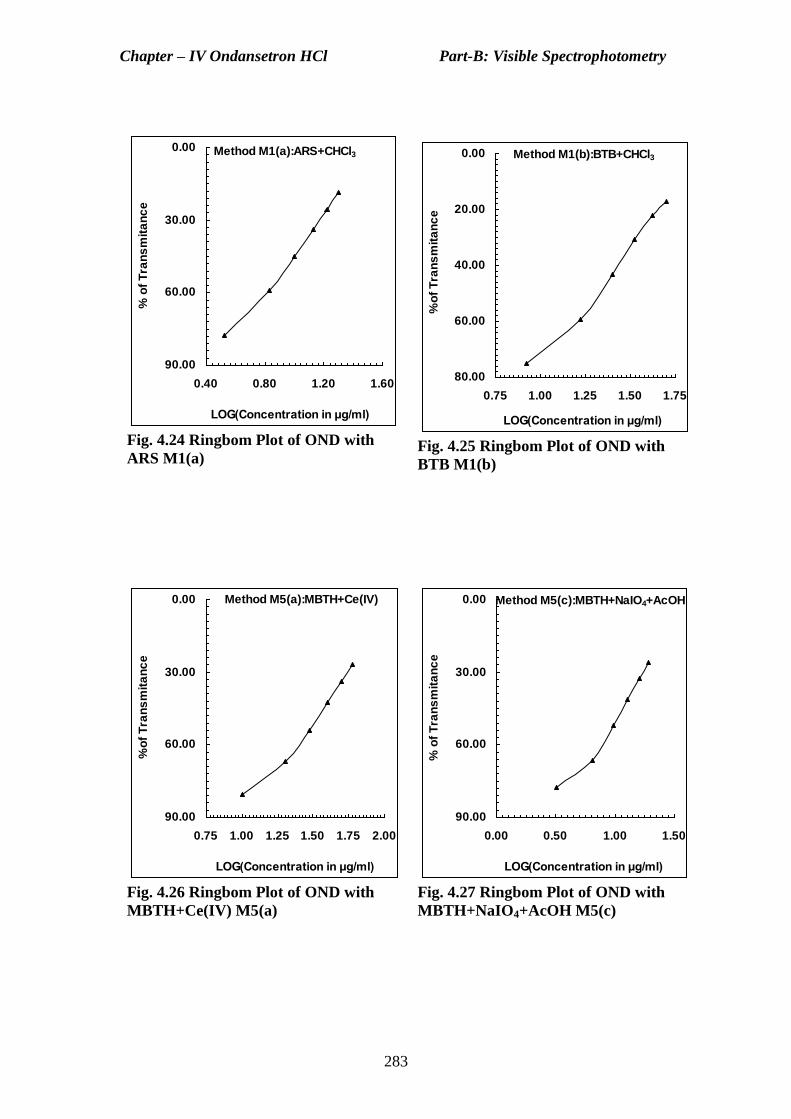
Method M1(a):ARS+CHCl30.00
30.00
60.00
90.00
0.40 0.80 1.20 1.60
LOG(Concentration in μg/ml)
% o
f T
ran
sm
ita
nc
e
Fig. 4.24 Ringbom Plot of OND with
ARS M1(a)
Method M1(b):BTB+CHCl30.00
20.00
40.00
60.00
80.00
0.75 1.00 1.25 1.50 1.75
LOG(Concentration in μg/ml)%
of
Tra
ns
mit
an
ce
Fig. 4.25 Ringbom Plot of OND with
BTB M1(b)
Method M5(a):MBTH+Ce(IV)0.00
30.00
60.00
90.00
0.75 1.00 1.25 1.50 1.75 2.00
LOG(Concentration in μg/ml)
%o
f T
ran
sm
ita
nc
e
Fig. 4.26 Ringbom Plot of OND with
MBTH+Ce(IV) M5(a)
Method M5(c):MBTH+NaIO4+AcOH0.00
30.00
60.00
90.00
0.00 0.50 1.00 1.50
LOG(Concentration in μg/ml)
% o
f T
ran
sm
ita
nc
e
Fig. 4.27 Ringbom Plot of OND with
MBTH+NaIO4+AcOH M5(c)

Chapter – IV Ondansetron HCl Part-B: Visible Spectrophotometry
284
Method M7:NBS+CB+HCl25.00
50.00
75.00
100.00
0.75 1.00 1.25 1.50 1.75 2.00
LOG (Concentration in μg/ml)
%o
f T
ran
sm
ita
nc
e
Fig. 4.28 Ringbom Plot of OND with
NBS M7
Method M15:p-CA+CHCl30.00
20.00
40.00
60.00
80.00
1.00 1.25 1.50 1.75 2.00
LOG(Concentration in μg/ml)
%o
f T
ran
sm
ita
nc
e
Fig. 4.29 Ringbom Plot of OND with p-
CA M15
Method M16:H2O2+MO0.00
20.00
40.00
60.00
80.00
0.75 1.00 1.25 1.50 1.75 2.00
LOG(Concentration in μg/ml)
%o
f T
ran
sm
ita
nc
e
Fig. 4.30 Ringbom Plot of OND with
H2O2+MO M16
Method M17: PA+CHCl30.00
20.00
40.00
60.00
80.00
0.75 1.00 1.25 1.50 1.75
LOG(Concentration in μg/ml)
%o
f T
ran
sm
ita
nc
e
Fig. 4.31 Ringbom Plot of OND with PA
M17

Chapter – IV Ondansetron HCl Part-B: Visible Spectrophotometry
285
Method M18: OND+4-AP30.00
45.00
60.00
75.00
90.00
0.50 1.00 1.50 2.00
LOG (Concentration in μg/ml)
% T
ran
sm
ita
nc
e
Fig. 4.32Ringbom Plot of OND with 4-AP M18
Method M19:OND+INH0.00
30.00
60.00
90.00
0.50 1.00 1.50 2.00
LOG(Concentration in μg/ml)
% T
ran
sm
ita
nc
e
Fig. 4.33 Ringbom Plot of OND with INH M19

Chapter – IV Ondansetron HCl Part-B: Visible Spectrophotometry
286
Table-4.09(a): Optical Characteristics of the proposed methods for OND
Name of the Parameter M1(a) M1(b) M5(a) M5(c)
Maximum Wavelength λmax 415 nm 420 nm 630 nm 630 nm
Beer's Law Limits µg/ml 3.3-20.0 8.3-50 10.0-60.0 3.2-19.2
Optimum Photometric Range µg/ml 6.7-20.0 25.0-41.67 30.0-60.0 9.6-16.0
Sandell's Sensitivity µg/cm2 / 0.001 Abs 2.62E-02 6.46E-02 1.00E-01 3.48E-02
Molar Absorptivity lt/mole/cm 1.33E+04 5.76E+03 3.47E+03 1.10E+04
Table-4.09(b): Optical Characteristics of the proposed methods for OND
Name of the Parameter M7 M15 M16 M17
Maximum Wavelength λmax 460 nm 540 nm 530 nm 415 nm
Beer's Law Limits µg/ml 8.0-48.0 12.5-75.0 10.0-60.0 6.7-40.0
Optimum Photometric Range µg/ml 16.0-40.0 25.0-75.0 20.0-50.0 20.0-33.3
Sandell's Sensitivity µg/cm2 / 0.001 Abs 1.27E-01 8.17E-02 7.35E-02 4.94E-02
Molar Absorptivity lt/mole/cm 2.93E+03 4.30E+03 5.04E+03 7.34E+03
Table-4.09(c): Optical Characteristics of the proposed methods for OND
Name of the Parameter M18 M19
Maximum Wavelength λmax 440 470
Beer's Law Limits µg/ml 5.0-30.0 5.0-30.0
Optimum Photometric Range µg/ml 10.0-30.0 10.0-30.0
Sandell's Sensitivity µg/cm2 / 0.001 Abs 6.85E-02 6.02E-02
Molar Absorptivity lt/mole/cm 5.62E+03 6.09E+03

Chapter – IV Ondansetron HCl Part-B: Visible Spectrophotometry
287
Table-4.10(a): Linear least square regression analysis
Name of the Parameter M1(a) M1(b) M5(a) M5(c)
Slope (b) 3.64E-02 1.57E-02 9.47E-03 3.01E-02
Intercept(a) -1.53E-03 -4.73E-03 1.07E-03 3.53E-03
Standard Deviation on Slope(Sb) 3.67E-04 8.77E-05 7.93E-05 3.85E-04
Standard Deviation on Intercept(Sa) 4.76E-03 2.85E-03 3.09E-03 4.80E-03
Correlation coefficient (r ) 0.9997 0.9999 0.9998 0.9995
Limit of Detection (LOD) µg/ml 0.392 0.542 0.977 0.479
Limit of Quantification (LOQ) µg/ml 1.307 1.808 3.259 1.597
Table-4.10(b): Linear least square regression analysis
Name of the Parameter M7 M15 M16 M17
Slope (b) 8.01E-03 1.17E-02 1.38E-02 2.01E-02
Intercept(a) -1.33E-04 7.67E-03 -2.20E-03 -3.87E-03
Standard Deviation on Slope(Sb) 5.46E-05 1.13E-04 1.17E-04 1.41E-04
Standard Deviation on Intercept(Sa) 1.70E-03 5.52E-03 4.57E-03 3.66E-03
Correlation coefficient (r ) 0.9998 0.9998 0.9998 0.9999
Limit of Detection (LOD) µg/ml 0.637 1.410 0.996 0.548
Limit of Quantification (LOQ) µg/ml 2.124 4.700 3.321 1.826
Table-4.10(c): Linear least square regression analysis
Name of the Parameter M18 M19
Slope (b) 1.54E-02 1.67E-02
Intercept(a) -2.13E-03 2.33E-03
Standard Deviation on Slope(Sb) 8.73E-05 1.26E-04
Standard Deviation on Intercept(Sa) 1.70E-03 2.46E-03
Correlation coefficient (r ) 0.9999 0.9998
Limit of Detection (LOD) µg/ml 0.332 0.442
Limit of Quantification (LOQ) µg/ml 1.107 1.475

Chapter – IV Ondansetron HCl Part-B: Visible Spectrophotometry
288
Table 4.11(a) Precision of the test method
S.No Statistical Parameter Value M1(a) M1(b) M5(a) M5(c)
1 Concentration (μg/ml) 13.33 33.33 40.00 12.80
2 Mean( of six replicates) (μg/ml) 13.34 33.31 39.96 12.82
3 Standard Deviation (s) 0.131 0.165 0.224 0.132
4 %Relative Standard Deviation(%RSD) 0.978 0.496 0.559 1.031
5 0.05 level confidence limit µg/ml 0.215 0.272 0.368 0.217
Table 4.11(b) Precision of the test method
S.No Statistical Parameter Value M7 M15 M16 M17
1 Concentration (μg/ml) 32.00 50.00 40.00 26.67
2 Mean( of six replicates) (μg/ml) 31.96 50.05 39.97 26.69
3 Standard Deviation (s) 0.256 0.271 0.228 0.176
4 %Relative Standard Deviation(%RSD) 0.802 0.542 0.570 0.659
5 0.05 level confidence limit µg/ml 0.422 0.446 0.375 0.289
Table 4.11(c) Precision of the test method
S.No Statistical Parameter Value M18 M19
1 Concentration (μg/ml) 20.00 20.00
2 Mean( of six replicates) (μg/ml) 19.98 20.04
3 Standard Deviation (s) 0.107 0.109
4 %Relative Standard Deviation(%RSD) 0.536 0.544
5 0.05 level confidence limit µg/ml 0.176 0.180

Chapter – IV Ondansetron HCl Part-B: Visible Spectrophotometry
289
Table-4.12(a): Accuracy of the proposed Method M1(a)
Sample
ID
Amount
Taken µg/ml
Amount
Found µg/ml
Percent of
Recovery
Statistical analysis
1 10.00 9.98 99.82 Mean 100.36
2 10.00 10.13 101.33 SD 0.839
3 10.00 9.99 99.92 %RSD 0.836
1 13.33 13.32 99.92 Mean 100.15
2 13.33 13.35 100.15 SD 0.225
3 13.33 13.38 100.38 %RSD 0.225
1 16.66 16.76 100.59 Mean 100.01
2 16.66 16.54 99.26 SD 0.675
3 16.66 16.69 100.17 %RSD 0.675
Table-4.12(b): Accuracy of the proposed methodM1(b)
Sample
ID
Amount taken
µg/ml
Amount found
µg/ml
Percent of
Recovery
Statistical analysis
1 25.00 25.42 101.69 Mean 100.757
2 25.00 24.93 99.73 SD 0.983
3 25.00 25.21 100.85 %RSD 0.976
1 33.33 33.29 99.88 Mean 100.450
2 33.33 33.54 100.63 SD 0.505
3 33.33 33.61 100.84 %RSD 0.502
1 41.66 41.79 100.31 Mean 100.066
2 41.66 41.82 100.38 SD 0.479
3 41.66 41.46 99.51 %RSD 0.479

Chapter – IV Ondansetron HCl Part-B: Visible Spectrophotometry
290
Table-4.12(c): Accuracy of the proposed methodM5(a)
Sample
ID
Amount taken
µg/ml
Amount found
µg/ml
Percent of
Recovery
Statistical analysis
1 30.00 30.12 100.40 Mean 99.489
2 30.00 29.78 99.27 SD 0.823
3 30.00 29.64 98.80 %RSD 0.827
1 40.00 40.41 101.03 Mean 99.917
2 40.00 39.78 99.45 SD 0.964
3 40.00 39.71 99.28 %RSD 0.965
1 50.00 49.72 99.44 Mean 99.900
2 50.00 49.81 99.62 SD 0.647
3 50.00 50.32 100.64 %RSD 0.648
Table-4.12(d): Accuracy of the proposed methodM5(c)
Sample
ID
Amount taken
µg/ml
Amount found
µg/ml
Percent of
Recovery
Statistical analysis
1 9.60 9.64 100.42 Mean 100.000
2 9.60 9.57 99.69 SD 0.376
3 9.60 9.59 99.90 %RSD 0.376
1 12.80 12.71 99.30 Mean 100.156
2 12.80 12.86 100.47 SD 0.753
3 12.80 12.89 100.70 %RSD 0.752
1 16.00 16.22 101.38 Mean 100.250
2 16.00 15.93 99.56 SD 0.982
3 16.00 15.97 99.81 %RSD 0.980

Chapter – IV Ondansetron HCl Part-B: Visible Spectrophotometry
291
Table-4.12(e): Accuracy of the proposed Method M7
Sample
ID
Amount taken
µg/ml
Amount found
µg/ml
Percent of
Recovery
Statistical analysis
1 24.00 24.34 101.42 Mean 100.583
2 24.00 23.96 99.83 SD 0.795
3 24.00 24.12 100.50 %RSD 0.790
1 32.00 32.46 101.44 Mean 100.542
2 32.00 32.27 100.84 SD 1.079
3 32.00 31.79 99.34 %RSD 1.073
1 40.00 40.18 100.45 Mean 99.683
2 40.00 39.79 99.48 SD 0.687
3 40.00 39.65 99.13 %RSD 0.689
Table-4.12(f): Accuracy of the proposed Method M15
Sample
ID
Amount taken
µg/ml
Amount found
µg/ml
Percent of
Recovery
Statistical analysis
1 37.50 37.97 101.25 Mean 100.444
2 37.50 37.38 99.68 SD 0.788
3 37.50 37.65 100.40 %RSD 0.784
1 50.00 50.32 100.64 Mean 100.087
2 50.00 49.85 99.70 SD 0.492
3 50.00 49.96 99.92 %RSD 0.491
1 62.50 62.98 100.77 Mean 99.653
2 62.50 61.94 99.10 SD 0.965
3 62.50 61.93 99.09 %RSD 0.969

Chapter – IV Ondansetron HCl Part-B: Visible Spectrophotometry
292
Table-4.12(g): Accuracy of the proposed methodM16
Sample
ID
Amount taken
µg/ml
Amount found
µg/ml
Percent of
Recovery
Statistical analysis
1 30.00 30.38 101.27 Mean 100.400
2 30.00 29.87 99.57 SD 0.850
3 30.00 30.11 100.37 %RSD 0.847
1 40.00 40.32 100.80 Mean 99.808
2 40.00 39.63 99.08 SD 0.891
3 40.00 39.82 99.55 %RSD 0.893
1 50.00 50.33 100.66 Mean 99.933
2 50.00 49.71 99.42 SD 0.647
3 50.00 49.86 99.72 %RSD 0.647
Table-4.12(h): Accuracy of the proposed methodM17
Sample
ID
Amount taken
µg/ml
Amount found
µg/ml
Percent of
Recovery
Statistical analysis
1 20.00 20.11 100.54 Mean 99.838
2 20.00 20.08 100.39 SD 1.085
3 20.00 19.72 98.59 %RSD 1.087
1 26.67 26.84 100.64 Mean 99.704
2 26.67 26.52 99.44 SD 0.833
3 26.67 26.41 99.04 %RSD 0.836
1 33.34 33.58 100.73 Mean 100.217
2 33.34 33.24 99.71 SD 0.510
3 33.34 33.41 100.22 %RSD 0.509
Chapter – IV Ondansetron HCl Part-B: Visible Spectrophotometry
293
Table-4.12(i): Accuracy of the proposed methodM18
Sample
ID
Amount taken
µg/ml
Amount found
µg/ml
Percent of
Recovery
Statistical analysis
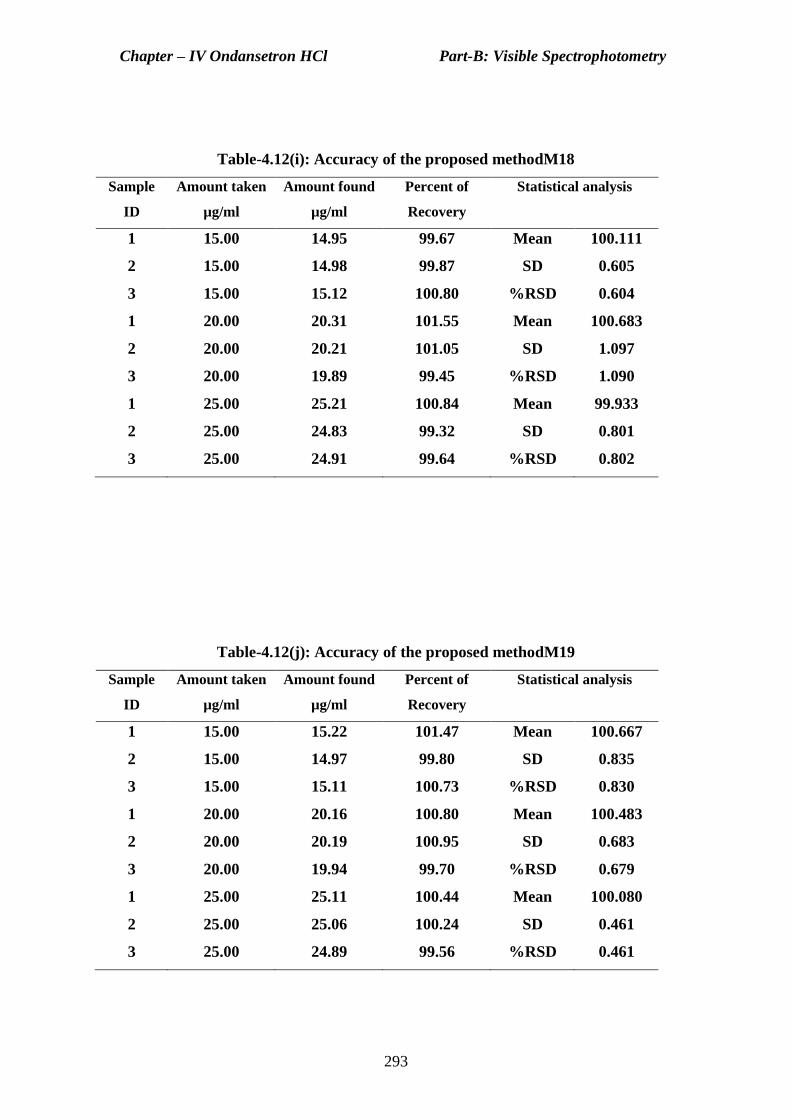
1 15.00 14.95 99.67 Mean 100.111
2 15.00 14.98 99.87 SD 0.605
3 15.00 15.12 100.80 %RSD 0.604
1 20.00 20.31 101.55 Mean 100.683
2 20.00 20.21 101.05 SD 1.097
3 20.00 19.89 99.45 %RSD 1.090
1 25.00 25.21 100.84 Mean 99.933
2 25.00 24.83 99.32 SD 0.801
3 25.00 24.91 99.64 %RSD 0.802
Table-4.12(j): Accuracy of the proposed methodM19
Sample
ID
Amount taken
µg/ml
Amount found
µg/ml
Percent of
Recovery
Statistical analysis
1 15.00 15.22 101.47 Mean 100.667
2 15.00 14.97 99.80 SD 0.835
3 15.00 15.11 100.73 %RSD 0.830
1 20.00 20.16 100.80 Mean 100.483
2 20.00 20.19 100.95 SD 0.683
3 20.00 19.94 99.70 %RSD 0.679
1 25.00 25.11 100.44 Mean 100.080
2 25.00 25.06 100.24 SD 0.461
3 25.00 24.89 99.56 %RSD 0.461

Chapter – IV Ondansetron HCl Part-B: Visible Spectrophotometry
294
Table4.13 (a): Assay of Formulations of Ondansetron Hydrochloride
Reference Method [296]
Sample
Amount
Taken
(mg/tablet)
Amount found in
proposed methods*
Percent of Recovery
Ref.Method Proposed methods**
M1a M1b M1a M1b
Osetron 4 Mean 3.988 3.985 %REC 99.42 99.704 99.633
SD ±0.015 ±0.022 %RSD ±0.61 ±0.379 ±0.549
F-test 1.389 2.815
t-test 0.974 0.640
Ondem 4 Mean 4.008 3.995 %REC 99.91 100.204 99.872
SD ±0.036 ±0.031 %RSD ±0.71 ±0.905 ±0.788
F-test 1.636 1.231
t-test 0.624 0.088
Osetron 8 Mean 7.982 7.975 %REC 100.05 99.773 99.690
SD ±0.101 ±0.090 %RSD ±0.66 ±1.263 ±1.129
F-test 3.642 2.904
t-test 0.391 0.583
Ondem 8 Mean 8.054 8.027 %REC 99.86 100.671 100.338
SD ±0.084 ±0.054 %RSD ±0.68 ±1.038 ±0.670
F-test 2.368 1.980
t-test 1.614 1.250
*Average of six determinations are considered, AVG=Average, SD=Standard deviation,
F=F-test value, t=t-test value; Theoretical values at 0.05 level of confidence limit F=5.19,
t=1.833.
**%REC=% of Recovery, %RSD=%of Relative standard deviation; Recovery studies,
4.0 and 8.0mg added to the preanalyzed formulations (Average of six determinations)

Chapter – IV Ondansetron HCl Part-B: Visible Spectrophotometry
295
Table4.13 (b): Assay of Formulations of Ondansetron Hydrochloride
Reference Method [296]
Sample
Amount
Taken
(mg/tablet)
Amount found in
proposed methods*
Percent of Recovery
Ref.Method Proposed methods**
M5a M5c M5a M5c
Osetron 4 Mean 3.978 3.991 %REC 99.42 99.454 99.775
SD ±0.023 ±0.009 %RSD ±0.61 ±0.580 ±0.222
F-test 2.906 3.133
t-test 0.100 1.347
Ondem 4 Mean 3.999 4.002 %REC 99.91 99.970 100.050
SD ±0.020 ±0.023 %RSD ±0.71 ±0.508 ±0.574
F-test 2.513 1.655
t-test 0.169 0.376
Osetron 8 Mean 7.974 7.967 %REC 100.05 99.669 99.585
SD ±0.091 ±0.110 %RSD ±0.66 ±1.136 ±1.383
F-test 2.937 4.351
t-test 0.619 0.665
Ondem 8 Mean 8.027 8.033 %REC 99.86 100.331 100.415
SD ±0.046 ±0.107 %RSD ±0.68 ±0.576 ±1.328
F-test 1.726 3.860
t-test 1.322 0.924
*Average of six determinations are considered, AVG=Average, SD=Standard deviation,
F=F-test value, t=t-test value; Theoretical values at 0.05 level of confidence limit F=5.19,
t=1.833.
**%REC=% of Recovery, %RSD=%of Relative standard deviation; Recovery studies,
4.0 and 8.0mg added to the preanalyzed formulations (Average of six determinations)

Chapter – IV Ondansetron HCl Part-B: Visible Spectrophotometry
296
Table4.13(c): Assay of Formulations of Ondansetron Hydrochloride
Reference Method [296]
Sample
Amount
Taken
(mg/tablet)
Amount found in
proposed methods*
Percent of Recovery
Ref.Method Proposed methods**
M7 M15 M7 M15
Osetron 4 Mean 3.957 3.992 %REC 99.42 98.917 99.792
SD ±0.032 ±0.011 %RSD ±0.61 ±0.810 ±0.263
F-test 1.746 2.188
t-test 1.227 1.378
Ondem 4 Mean 4.000 4.009 %REC 99.91 100.000 100.229
SD ±0.020 ±0.033 %RSD ±0.71 ±0.504 ±0.836
F-test 2.506 1.394
t-test 0.253 0.712
Osetron 8 Mean 7.977 7.978 %REC 100.05 99.713 99.725
SD ±0.104 ±0.090 %RSD ±0.66 ±1.301 ±1.131
F-test 3.861 2.918
t-test 0.484 0.515
Ondem 8 Mean 8.042 8.050 %REC 99.86 100.519 100.629
SD ±0.082 ±0.101 %RSD ±0.68 ±1.022 ±1.255
F-test 2.290 3.459
t-test 1.331 1.332
*Average of six determinations are considered, AVG=Average, SD=Standard deviation,
F=F-test value, t=t-test value; Theoretical values at 0.05 level of confidence limit F=5.19,
t=1.833.
**%REC=% of Recovery, %RSD=%of Relative standard deviation; Recovery studies,
4.0 and 8.0mg added to the preanalyzed formulations (Average of six determinations)

Chapter – IV Ondansetron HCl Part-B: Visible Spectrophotometry
297
Table4.13 (d): Assay of Formulations of Ondansetron Hydrochloride
Reference Method [296]
Sample
Amount
Taken
(mg/tablet)
Amount found in
proposed methods*
Percent of Recovery
Ref.Method Proposed methods**
M16 M17 M16 M17
Osetron 4 Mean 3.989 3.988 %REC 99.42 99.725 99.704
SD ±0.008 ±0.011 %RSD ±0.61 ±0.212 ±0.280
F-test 1.122 2.212
t-test 1.164 1.043
Ondem 4 Mean 4.009 4.010 %REC 99.91 100.221 100.238
SD ±0.034 ±0.033 %RSD ±0.71 ±0.842 ±0.827
F-test 1.414 1.366
t-test 0.691 0.735
Osetron 8 Mean 7.982 7.978 %REC 100.05 99.771 99.729
SD ±0.078 ±0.098 %RSD ±0.66 ±0.983 ±1.231
F-test 2.204 3.456
t-test 0.475 0.476
Ondem 8 Mean 8.033 8.054 %REC 99.86 100.417 100.673
SD ±0.075 ±0.085 %RSD ±0.68 ±0.932 ±1.057
F-test 1.900 2.458
t-test 1.201 1.597
*Average of six determinations are considered, AVG=Average, SD=Standard deviation,
F=F-test value, t=t-test value; Theoretical values at 0.05 level of confidence limit F=5.19,
t=1.833.
**%REC=% of Recovery, %RSD=%of Relative standard deviation; Recovery studies,
4.0 and 8.0mg added to the preanalyzed formulations (Average of six determi

Chapter – IV Ondansetron HCl Part-B: Visible Spectrophotometry
298
Table4.13 (e): Assay of Formulations of Ondansetron Hydrochloride
Reference Method [296]
Sample
Amount
Taken
(mg/tablet)
Amount found in
proposed methods*
Percent of Recovery
Ref.Method Proposed methods**
M18 M19 M18 M19
Osetron 4 Mean 3.990 3.981 %REC 99.42 99.758 99.533
SD ±0.014 ±0.028 %RSD ±0.61 ±0.363 ±0.703
F-test 2.356 1.333
t-test 1.174 0.300
Ondem 4 Mean 4.007 4.007 %REC 99.91 100.172 100.175
SD ±0.037 ±0.035 %RSD ±0.71 ±0.912 ±0.879
F-test 1.661 1.542
t-test 0.554 0.574
Osetron 8 Mean 7.984 7.986 %REC 100.05 99.794 99.823
SD ±0.100 ±0.079 %RSD ±0.66 ±1.248 ±0.993
F-test 3.558 2.251
t-test 0.358 0.364
Ondem 8 Mean 8.050 8.051 %REC 99.86 100.621 100.631
SD ±0.084 ±0.092 %RSD ±0.68 ±1.039 ±1.138
F-test 2.373 2.845
t-test 1.515 1.438
*Average of six determinations are considered, AVG=Average, SD=Standard deviation,
F=F-test value, t=t-test value; Theoretical values at 0.05 level of confidence limit F=5.19,
t=1.833.
**%REC=% of Recovery, %RSD=%of Relative standard deviation; Recovery studies,
4.0 and 8.0mg added to the preanalyzed formulations (Average of six determinations)
Chapter – IV Ondansetron HCl Part-B: Visible Spectrophotometry
299
4.13 Nature of the colored species
Ondansetron HCl possesses tertiary nitrogen atom and keto functional group
in substituted Carbazol ring and tertiary nitrogen atom substituted imidazol. These
groups are responsible for color development in the analysis. Tertiary nitrogen atom
of imidazol in OND is responsible for the development of ion-ion association
complex formation with acid dyes such as Alizarin Red-S (ARS), Bromothymol
blue(BTB) [M1(a) &M1(b),]; α-position of substituted imidazol is favorable for
electrophlic substitution reactions in oxidative coupling reactions [M5(a) and M5(c)].
The tertiary nitrogen in imidazol is also responsible for ion-ion association complex
with PA in basic buffer medium [M17]. Keto functional group is responsible for the
color development with 4-AP and INH reagents due to condensation reaction with the
elimination of water molecule [M18 and M19]
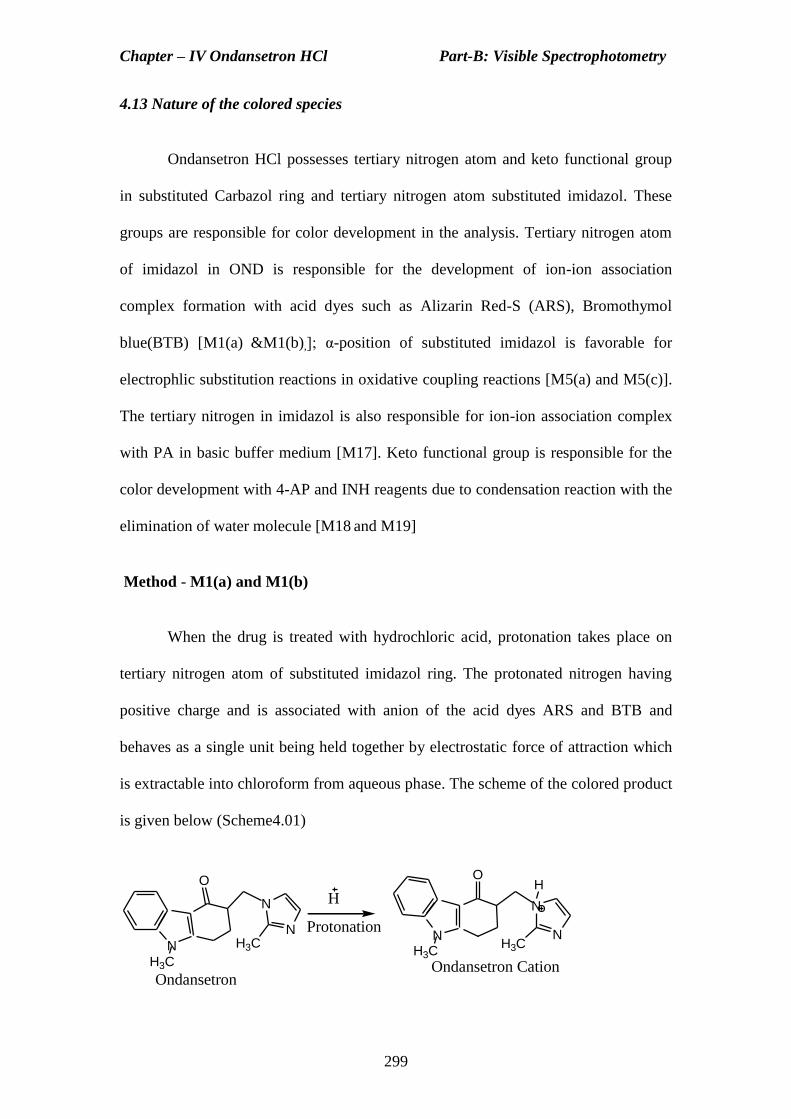
Method - M1(a) and M1(b)
When the drug is treated with hydrochloric acid, protonation takes place on
tertiary nitrogen atom of substituted imidazol ring. The protonated nitrogen having
positive charge and is associated with anion of the acid dyes ARS and BTB and
behaves as a single unit being held together by electrostatic force of attraction which
is extractable into chloroform from aqueous phase. The scheme of the colored product
is given below (Scheme4.01)
O
N
NH3CN
H3C
H
O
N
NH3C
NH3C
H
OndansetronOndansetron Cation
Protonation

Chapter – IV Ondansetron HCl Part-B: Visible Spectrophotometry
300
O
N
N
H3C
NH3C
H
O O
-O3S OH
O
O
SO3-
OH
Anion of ARSColored Product
O
N
N
CH3
N CH3
H
Cation of the Drug
O
N
N
CH3
N CH3
H
C
BrMe2HC
CHMe2
O
SO3H3C
Br
Me2HC
HO
C
BrMe2HC
CHMe2
O
SO3H3C
Br
Me2HC
HO
O
N
N
H3C
NH3C
H
Anion of BTBColored ProductCation of the Drug
Scheme 4.01
Method – M5(a) and M5(c)
Under the reaction conditions, MBTH on oxidation in the presence of oxidants
such as Ce (IV), NaIO4 in acetic acid medium, loses two electrons and one proton
forming and electrophilic intermediate, which is the active coupling species that reacts
with the coupler (OND) by electrophillic attack on ortho position of the most
nucleophilic site on cyclic ring (substituted imidazol ring).
N
S
CH3
N-NH2
MBTH
N
S
CH3
N NH
Electrophilic intermediate
-2e , H
Ce(IV) / NaIO4+AcOH

Chapter – IV Ondansetron HCl Part-B: Visible Spectrophotometry
301
N
S
CH3
N
Electrophilic intermediate
NHN
S
CH3
N NH
Electrophilic intermediate
O
N
N
H3CN
H3C
O
N
N
H3C
NH3C
+N
S
H3C
N
NH
Electrophilic intermediate
N
S
CH3
NNH
Ondansetron
Colored Product
Scheme 4.02
Method – M7
The first step is the oxidation of drug in the presence of NBS. The unreacted
NBS is reacted with excess CB. The decrease in the intensity of color is
corresponding to unreacted CB. The scheme of reactions are presented in scheme 4.03
+ CB Oxidation products of dye + Unreacted CB (Coloured)
(Colourless through disruption of chromophores and auxochromes)
NBS
Step - I
OND + NBS Oxidation product (s) of OND + Unreacted NBS
Step - II
(Unreacted)
O
N
N
H3C
NH3C
N
O
O
Br+ O
N
N
H3C
NH3C
HN
O
O
+ HBrOxidation
Oxidised Product of the DrugNBS (excess)Ondansetron
NBS (unreacted)+
Succinamide
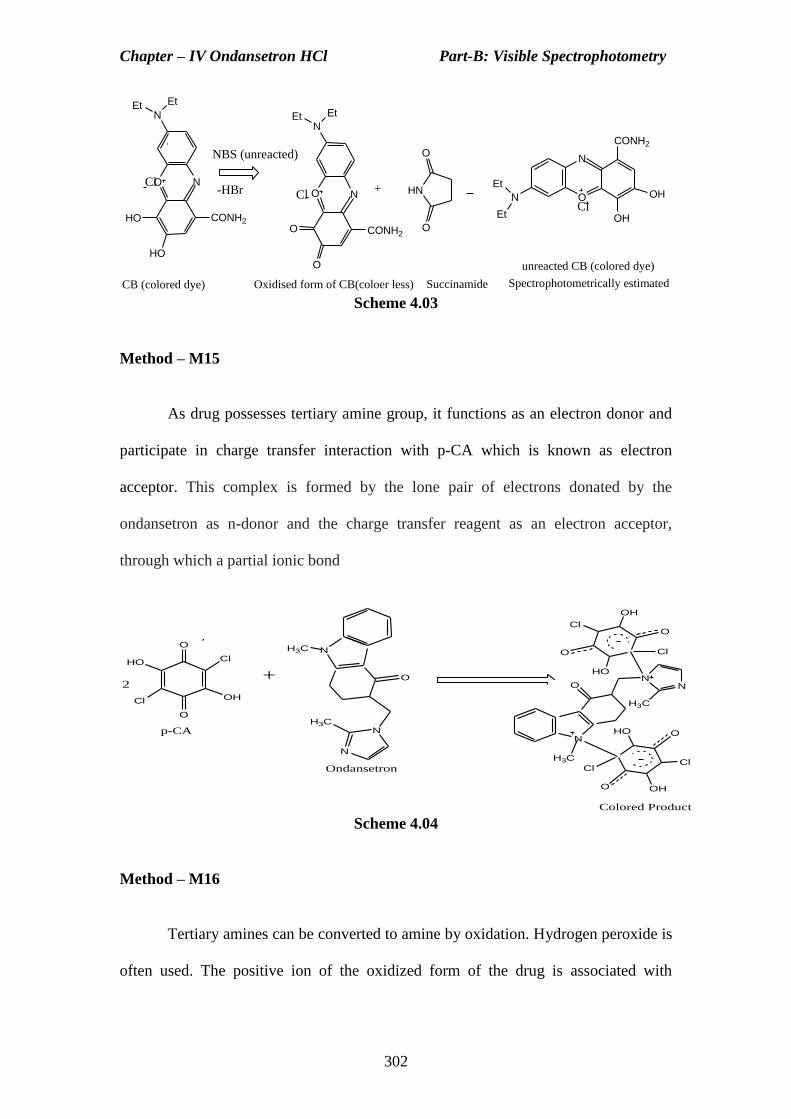
Chapter – IV Ondansetron HCl Part-B: Visible Spectrophotometry
302
HO
HO
CONH2
N
EtEt
NOClHN
O
OO
O
CONH2
N
EtEt
NOCl-HBr +
NBS (unreacted)
OH
OH
CONH2
N
Et
Et
N
OCl
unreacted CB (colored dye)
Spectrophotometrically estimatedOxidised form of CB(coloer less) SuccinamideCB (colored dye)
Scheme 4.03
Method – M15
As drug possesses tertiary amine group, it functions as an electron donor and
participate in charge transfer interaction with p-CA which is known as electron
acceptor. This complex is formed by the lone pair of electrons donated by the
ondansetron as n-donor and the charge transfer reagent as an electron acceptor,
through which a partial ionic bond
O
O
OH
ClHO
Cl
O
N
N
H3C
NH3C
2+
p-CA
OH
Cl
HO
Cl
ON
N
H3C
N
H3C
HO
Cl
OH
Cl
O
O
O
O
Ondansetron
Colored Product
Scheme 4.04
Method – M16
Tertiary amines can be converted to amine by oxidation. Hydrogen peroxide is
often used. The positive ion of the oxidized form of the drug is associated with

Chapter – IV Ondansetron HCl Part-B: Visible Spectrophotometry
303
negative ion of the methyl orange molecule to form ion-ion associated complex which
is extracted in to chloroform solvent.
O
N
NH3C
N
H3C
O
N
NH3C
N
H3C
OH
Ondansetron Oxidised form of the Drug
H2O2
O
N
N
H3C
NH3C
OH
N
N
SO3
N(CH3)2
+O
N
N
H3C
NH3C
OH
N
N
SO3
N(CH3)2Cation of the Drug Anion of the Methyl Orange Colored Product
Scheme 4.05
Method M17
The phenolic group in picric acid is more acidic, so in basic medium it
immediately loses the acidic proton, to produce a stable anionic species. The drug
OND possesses a tertiary nitrogen atom; it immediately accepts the proton. The
positive ion thus formed and negative ion of the dye forms a stable ion-ion associated
complex which is extractable into chloroform solvent. The scheme of the colored
product is represented in scheme 4.06
OH
NO2
NO2
O2N
O
NO2
NO2
O2N+ H
Basic Buffer
Stable Anion of Picric Acid

Chapter – IV Ondansetron HCl Part-B: Visible Spectrophotometry
304
O
N
NH3CN
H3C
H
O
N
NH3C
NH3C
H
Ondansetron Protonated Ondansetron
Protonation
O
NO2
O2N
NO2
O
N
NCH3 N
CH3
H
O
NO2
O2N
NO2
O
N
NCH3 N
CH3
H
+
Colored Product
Scheme 4.06
Method: M18 and M19
It is well known that 4 – amino phenazone (4- AP) and isonicotinic hydrazide
(INH) give a colored hydrazone and Schiff’s base respectively with keto groups of the
drug (OND).The colored species formation may be represented as under scheme 4.07
and scheme 4.08.
CH3
CH3H2N
O
C6H5
O
N
N
H3C
NH3C
CH3H3C
C6H5
N
N
H3C
NH3C
N
+
-H2O
Condensation
Ondansetron 4-AP Colored Product
O
Scheme 4.07

Chapter – IV Ondansetron HCl Part-B: Visible Spectrophotometry
305
C
HN
O
N
O
N
NH3C
N
H3C
H H
C
HN
O
N
NH3C
N
H3C
N-H2O
CondensationINH
Ondansetron Colored Product
Scheme 4.08
4.14 Conclusions: The proposed methods are simple, sensitive and reliable and can
be used for routine determination of OND in bulk and formulations. Statistical
analysis of the results shows that the proposed methods have good precision and
accuracy. Results of the analysis of formulations reveal that the proposed methods are
suitable for their analysis with virtually no interference of the usual additives present
in pharmaceutical formulations. The descending order of sensitivity (εmax) and
maximum wavelength (λmax) among the proposed methods are shown below.
The decreasing order of sensitivity (εmax) among the proposed methods is shown
below.
M17›M19›M1(b)›M18 ›M16 ›M15 ›M5(a) ›M7 ›M1(a) ›M5(c)
The descending order maximum wavelength (λmax) among the proposed methods is
shown below.
M5(a)›M5(c)› M15 ›M16 ›M19›M7›M18›M15›M1(a)›M17.

Chapter – IV Ondansetron HCl Part-C: Derivative Spectrophotometry
306
DERIVATIVE SPECTROPHOTOMETRIC DETERMINATION OF
ONDANSETRON HYDROCHLORIDE
4.15 Introduction
The influence of an impurity on the absorption spectrum of a substance can be
eliminated by considering derivative curves. For quantitative purpose, peak heights
are usually measured for the long-wave peak satellite of either the second or fourth
derivative curves. Single or multi-components can be analyzed in the presence of
broad, interfering background matrix absorption. Author developed four derivative
spectrophotometric methods based on the reactions such as ion-ion association
reaction with acidic dye ARS chloroform as extracting solvent (M1a),oxidative
coupling reactions with MBTH as oxidative coupler in the presence of an oxidizing
agent Ce(IV) (M5a), substitution reaction with NBS(M7) and n-electron transfer
reaction with p-CA (M15).
4.16(i) Experimental
UV-Visible Spectrophotometer: Elico SL159 model, 2nm high resolution, double
beam, 1cm length quartz coated optics; Wavelength range 390-900nm; High stability,
linearity, and precision instrument is used for all the spectral measurements.
4.16(ii) Preparation of solutions
Standard Solution of Ondansetron HCl: The stock solution of ondansetron HCl is
freshly prepared by transferring accurately weighed 100mg of ondansetron HCl into
100ml volumetric flask and dissolved in double distilled water, and then made up to
the mark. Then working standard solutions 250μg/ml( for methods M5(a), M7,M15),

Chapter – IV Ondansetron HCl Part-C: Derivative Spectrophotometry
307
and 100μg/ml ( for method M1(a)), are prepared by transferring 25.0ml and 10.0ml
of the stock solution into two 100ml standard flask and made up to the mark
respectively.
Preparation of reagents: The following reagents are prepared for the estimation of
the drug by second order derivative spectra. The procedure for the preparation is same
as described in Chapter-IV Part-B: Visible spectrophotometry.
ARS solution : Fluka, 0.2%, 5.49 x 10⁻³
M
HCl solution : Qualigens, 0.1M
MBTH Solution : Fluka, 0.2%, 8.56 x 10⁻³
M
Ce (IV) solution : MERCK, 1%, 9.35 x 10⁻³
M
NBS solution : Loba, 0.01%, 5.618x10⁻⁴
M
CB solution : Chroma, 0.005%, 5.497x10⁻⁴
M
Hydrochloric acid : E.Merck, 5M
p-CA solution : Sd-fine, 0.1%, 4.785x10⁻³
M
4.16(iii) Proposed Procedures
The following procedures are used to determine the amount of the
Ondansetron HCl by the second order spectrophotometry
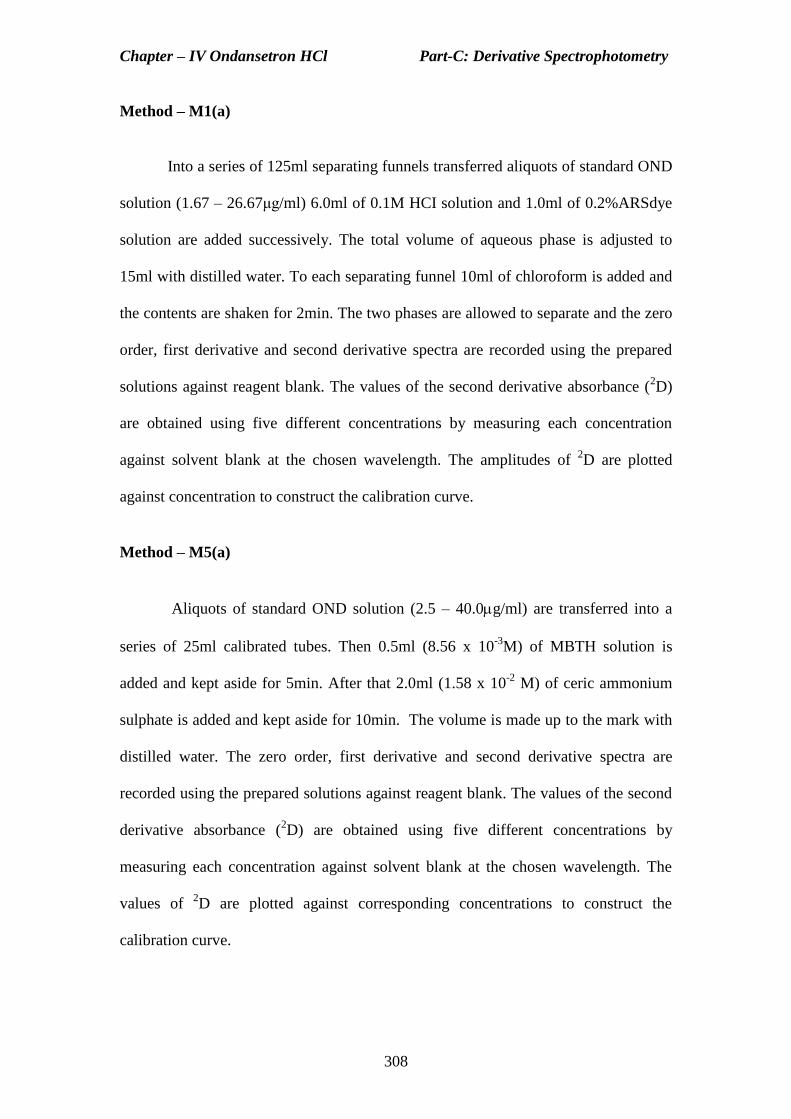
Chapter – IV Ondansetron HCl Part-C: Derivative Spectrophotometry
308
Method – M1(a)
Into a series of 125ml separating funnels transferred aliquots of standard OND
solution (1.67 – 26.67μg/ml) 6.0ml of 0.1M HCI solution and 1.0ml of 0.2%ARSdye
solution are added successively. The total volume of aqueous phase is adjusted to
15ml with distilled water. To each separating funnel 10ml of chloroform is added and
the contents are shaken for 2min. The two phases are allowed to separate and the zero
order, first derivative and second derivative spectra are recorded using the prepared
solutions against reagent blank. The values of the second derivative absorbance (2D)
are obtained using five different concentrations by measuring each concentration
against solvent blank at the chosen wavelength. The amplitudes of 2D are plotted
against concentration to construct the calibration curve.
Method – M5(a)
Aliquots of standard OND solution (2.5 – 40.0g/ml) are transferred into a
series of 25ml calibrated tubes. Then 0.5ml (8.56 x 10⁻³
M) of MBTH solution is
added and kept aside for 5min. After that 2.0ml (1.58 x 10⁻²
M) of ceric ammonium
sulphate is added and kept aside for 10min. The volume is made up to the mark with
distilled water. The zero order, first derivative and second derivative spectra are
recorded using the prepared solutions against reagent blank. The values of the second
derivative absorbance (2D) are obtained using five different concentrations by
measuring each concentration against solvent blank at the chosen wavelength. The
values of 2D are plotted against corresponding concentrations to construct the
calibration curve.

Chapter – IV Ondansetron HCl Part-C: Derivative Spectrophotometry
309
Method – M7
Aliquots of standard OND solution (20.0 - -100g/ml) are transferred into a
series of 25ml calibrated tubes. Then 1.25ml (1M) of HCl and 4.0ml (2.81 x 10⁻³
M)
of NBS solutions are added and the total volume is brought to 15ml with distilled
water. After 10minutes4.0ml of CB solution is added, after 5minutes absorbance is
measured at 540nm against reagent blank. The blank (omitting drug) and dye
(omitting drug and oxidant) solutions are prepared in similar manner and their
absorbances are measured against distilled water. The decrease in absorbance
corresponding to consumed NBS and in turn the dye concentration is obtained by
subtracting the decrease in absorbance of the solution that of blank solution. The zero
order, first derivative and second derivative spectra are recorded using the prepared
solutions against reagent blank. The values of the second derivative absorbance (2D)
are obtained using five different concentrations by measuring each concentration
against solvent blank at the chosen wavelength. The values of 2D are plotted against
corresponding concentrations to construct the calibration curve.
Method – M15
Into a series of 10ml calibrated tubes containing aliquots of standard OND
solution (6.25-100g/ml), 2.0ml of chloranilic acid (4.785 x 10⁻³
M) is added and kept
aside for 30 min at lab temperature. The volume in each tube is made up to the mark
with chloroform. The zero order, first derivative and second derivative spectra are
recorded using the prepared solutions against reagent blank. The values of the second
derivative absorbance (2D) are obtained using five different concentrations by
measuring each concentration against solvent blank at the chosen wavelength. The

Chapter – IV Ondansetron HCl Part-C: Derivative Spectrophotometry
310
values of 2D are plotted against corresponding concentrations to construct the
calibration curve.
4.17 Method Development
The zero-order (0D) spectra of OND are showed in Fig.4.34 –Fig. 4.37, P:
312, the zero-crossing points are assigned from the 1D and
2D spectra of the proposed
methods are shown Fig.4.38- Fig.4.45, P: 313-314. The 1D zero-crossing point of
OND for the proposed methods are found at 425nm method M1(a), 640nm method
M5(a) , 455nm method M7 and 540 nm method M15 respectively (Fig.4.38- Fig.4.41,
P: 313); and 2D zero-crossing point of OND for the proposed methods are found 412
and 440nm method M1(a), 595nm, 695nm method M5(a); 425nm and 500 nm
method M7 and 485nm and 580 nm method M15 (Fig4.42-Fig4.45, P: 314)
respectively. The selection of wavelength is based on the fact that the absolute value
of the total derivative spectrum at the selected wavelength has the best linear response
to the analyte concentration. The 2D spectra showed better resolution and linearity of
the calibration curve of OND. Therefore second derivative amplitudes are chosen for
the determination of OND.
4.18 Method Validation
Linearity and Range
The calibration plots are linear in the range of 1.7 – 26.7μg/ml method M1(a);
2.5-40.0 μg/ml for method M5(a), 20.0-100.0 μg/ml method M7 and 6.25 – 50.0
μg/ml method M15 (Fig.4.46 – Fig 4.49, P: 315). Correlation coefficient for all the
methods is greater than 0.999. The mean values of correlation coefficient, slope and
intercept are shown in Table 4.14, P: 316.

Chapter – IV Ondansetron HCl Part-C: Derivative Spectrophotometry
311
Precision
The precision of each proposed methods is ascertained from the absorbance
values obtained by actual determination of five replicates of ondansetron sample
solution. The percent relative standard deviation and percent range of error (0.05
confidence limit) are calculated for the proposed methods (Table 4.15, P: 316).
Accuracy
To determine the accuracy of each proposed method, different amounts of
samples of ondansetron HCl within the Beer’s law limits are taken and analyzed by
the proposed method. The results (percent error) are recorded in Table 4.16(a)-
Table4.16 (d) P: 316-318.
Limit of detection (LOD) and limit of quantitation (LOQ)
The LOD and LOQ of OND are calculated based on the standard deviation of
the intercept and s is the slope of the calibration curves (n=5).The data are presented
in Table 4.14, P: 316.

Chapter – IV Ondansetron HCl Part-C: Derivative Spectrophotometry
312
Zero Order Spectra of OND
with ARS,CHCl3
0.000
0.200
0.400
0.600
0.800
1.000
375 400 425 450 475 500
Wavelength (λ)nm
Ab
so
rpti
on
(A)
1.67 μg/ml3.33 μg/ml6.67μg/ml13.3 μg/ml26.6 μg/ml
Fig. 4.34 Absorption Spectrum of OND
with ARS methodM1(a)
Zero Order Spectra of OND with
MBTH,Ce(IV)
0.000
0.050
0.100
0.150
0.200
0.250
0.300
0.350
0.400
500 550 600 650 700 750
Wavelength (λ)nmA
bs
orb
an
ce
(A)
2.50 μg/ml5.00 μg/ml10.0 μg/ml20.0 μg/ml40.0 μg/ml
Fig. 4.35 Absorption Spectrum of OND
with MBTH method M5(a)
Zero Order Spectra of OND with
NBS,CB,HCl
0.000
0.200
0.400
0.600
0.800
375 425 475 525 575
Wavelength (λ) nm
Ab
so
rba
nc
e(A
)
20 μg/ml40 μg/ml60 μg/ml80 μg/ml100μg/ml
Fig. 4.36 Absorption Spectrum of OND
with NBS+CB method M7
Zero Order Spectra of OND with
p-CA,CHCl3
0.000
0.250
0.500
0.750
450 500 550 600 650
Wavelength(λ) nm
Ab
so
rba
nc
e(A
)
6.25 μg/ml12.5 μg/ml25.0 μg/ml50.0 μg/ml
Fig. 4.37 Absorption Spectrum of OND
with p-CA method M15
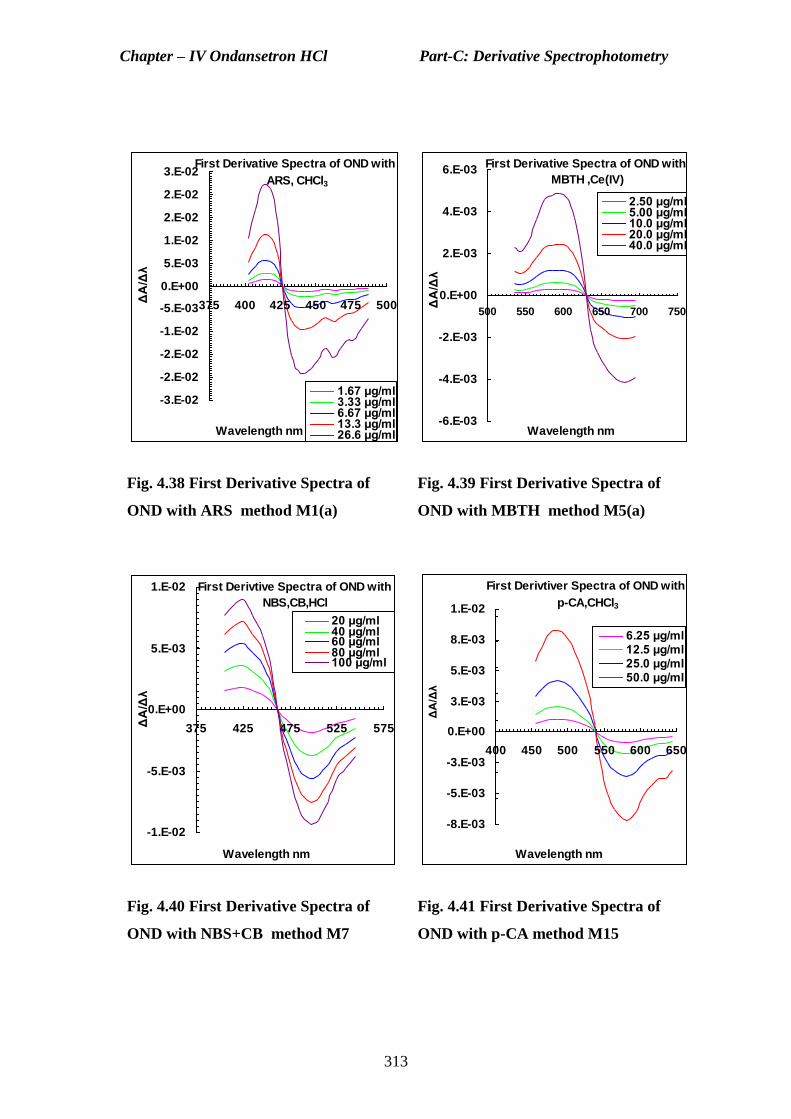
Chapter – IV Ondansetron HCl Part-C: Derivative Spectrophotometry
313
First Derivative Spectra of OND with
ARS, CHCl3
-3.E-02
-2.E-02
-2.E-02
-1.E-02
-5.E-03
0.E+00
5.E-03
1.E-02
2.E-02
2.E-02
3.E-02
375 400 425 450 475 500
Wavelength nm
ΔA
/Δλ
1.67 μg/ml3.33 μg/ml6.67 μg/ml13.3 μg/ml26.6 μg/ml
Fig. 4.38 First Derivative Spectra of
OND with ARS method M1(a)
First Derivative Spectra of OND with
MBTH ,Ce(IV)
-6.E-03
-4.E-03
-2.E-03
0.E+00
2.E-03
4.E-03
6.E-03
500 550 600 650 700 750
Wavelength nmΔ
A/Δ
λ
2.50 μg/ml5.00 μg/ml10.0 μg/ml20.0 μg/ml40.0 μg/ml
Fig. 4.39 First Derivative Spectra of
OND with MBTH method M5(a)
First Derivtive Spectra of OND with
NBS,CB,HCl
-1.E-02
-5.E-03
0.E+00
5.E-03
1.E-02
375 425 475 525 575
Wavelength nm
ΔA
/Δλ
20 μg/ml40 μg/ml60 μg/ml80 μg/ml100 μg/ml
Fig. 4.40 First Derivative Spectra of
OND with NBS+CB method M7
First Derivtiver Spectra of OND with
p-CA,CHCl3
-8.E-03
-5.E-03
-3.E-03
0.E+00
3.E-03
5.E-03
8.E-03
1.E-02
400 450 500 550 600 650
Wavelength nm
ΔA
/Δλ
6.25 μg/ml12.5 μg/ml25.0 μg/ml50.0 μg/ml
Fig. 4.41 First Derivative Spectra of
OND with p-CA method M15

Chapter – IV Ondansetron HCl Part-C: Derivative Spectrophotometry
314
Second Derivative Spectra of OND
with ARS,CHCl3
-4.E-03
-3.E-03
-2.E-03
-1.E-03
0.E+00
1.E-03
2.E-03
400 425 450 475 500
Wavelength nm
Δ2A
/Δ2λ
1.67 μg/ml3.33 μg/ml6.67 μg/ml13.3 μg/ml26.6 μg/ml
Fig. 4.42Second Derivative Spectra of
OND with ARS method M1(a)
Second Derivative Spectra of OND
with MBTH,Ce(IV)
-5.E-04
-3.E-04
-2.E-04
0.E+00
2.E-04
500 550 600 650 700 750
Wavelength nmΔ
2A
/Δ2λ
2.5μg/ml5.0μg/ml10.0μg/ml20.0μg/ml40.0μg/mlSeries6
Fig. 4.43 Second Derivative Spectra of
OND with MBTH method M5(a)
Second Derivative Spectra of OND
with NBS,CB,HCl
-8.E-04
-5.E-04
-3.E-04
0.E+00
3.E-04
400 450 500 550
Wavelength nm
Δ2A
/Δ2λ
20 μg/ml40 μg/ml60 μg/ml80 μg/ml100 μg/ml
Fig. 4.44 Second Derivative Spectra of
OND with NBS+CB method M7
Second Derivative Spectra of OND
with p-CA,CHCl3
-4.E-04
-3.E-04
-2.E-04
-1.E-04
0.E+00
1.E-04
2.E-04
450 500 550 600 650
Wavelength nm
Δ2A
/Δ2λ
6.25 μg/ml12.5 μg/ml25.0 μg/ml50.0 μg/ml
Fig. 4.45 Second Derivative Spectra of
OND with p-CA method M15
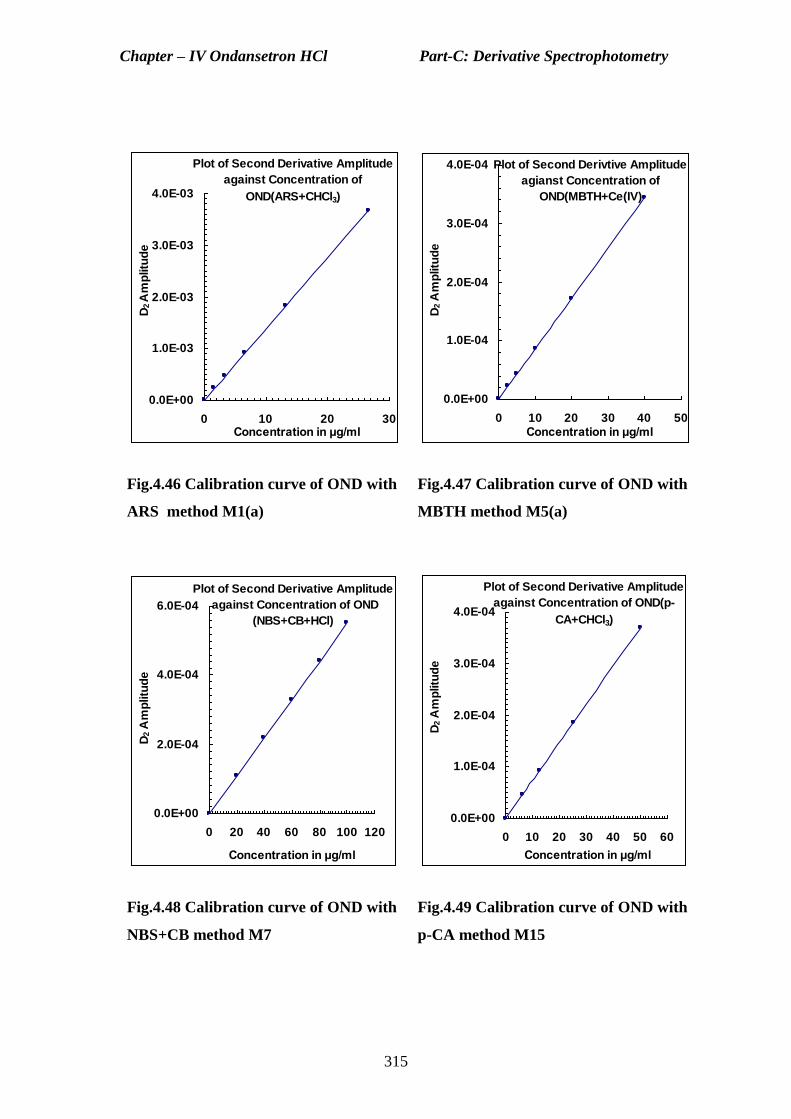
Chapter – IV Ondansetron HCl Part-C: Derivative Spectrophotometry
315
Plot of Second Derivative Amplitude
against Concentration of
OND(ARS+CHCl3)
0.0E+00
1.0E-03
2.0E-03
3.0E-03
4.0E-03
0 10 20 30Concentration in μg/ml
D2 A
mp
litu
de
Fig.4.46 Calibration curve of OND with
ARS method M1(a)
Plot of Second Derivtive Amplitude
agianst Concentration of
OND(MBTH+Ce(IV)
0.0E+00
1.0E-04
2.0E-04
3.0E-04
4.0E-04
0 10 20 30 40 50Concentration in μg/ml
D2 A
mp
litu
de
Fig.4.47 Calibration curve of OND with
MBTH method M5(a)
Plot of Second Derivative Amplitude
against Concentration of OND
(NBS+CB+HCl)
0.0E+00
2.0E-04
4.0E-04
6.0E-04
0 20 40 60 80 100 120
Concentration in μg/ml
D2 A
mp
litu
de
Fig.4.48 Calibration curve of OND with
NBS+CB method M7
Plot of Second Derivative Amplitude
against Concentration of OND(p-
CA+CHCl3)
0.0E+00
1.0E-04
2.0E-04
3.0E-04
4.0E-04
0 10 20 30 40 50 60
Concentration in μg/ml
D2 A
mp
litu
de
Fig.4.49 Calibration curve of OND with
p-CA method M15

Chapter – IV Ondansetron HCl Part-C: Derivative Spectrophotometry
316
Table: 4.14: Linearity studies and regression parameters
S.No Name of the Parameter M1(a) M5(a) M7 M15
1 Linearity Limits µg/ml 1.7-26.7 2.5-40.0 20.0-100.0 6.25-50.0
2 Slope (b) 1.38E-04 8.46E-06 5.54E-06 7.50E-06
3 Intercept(a) -3.75E-06 1.46E-06 -1.20E-06 -1.58E-06
4 Correlation Coefficient ( r ) 1.0000 0.9999 0.9999 0.9999
5 Limit of Detection (LOD) µg/ml 0.069 0.244 0.323 0.598
6 Limit of Quantification (LOQ) µg/ml 0.229 0.813 1.076 1.993
Table 3.15 Precision of the proposed methods
S.No Name of the Parameter M1(a) M5(a) M7 M15
1 Amount Taken (µg/ml) 13.33 20.00 60.00 25.00
2 Mean (n=5)( µg/ml) 13.328 19.97 60.43 24.64
3 Standard Deviation (S) 0.026 0..53 0.633 0.173
4 %Relative Standard Deviation 0.194 0.260 1.048 0.695
5 0.05 Confidence level 0.314 0.142 0.215 0.352
5 %Recovery 99.62 99.85 100.72 99.76
Table-4.16(a): Accuracy of the method M1(a)
Concentration-1 Concentration-2 Concentration-3
Taken Found %Recovery Taken Found %Recovery Taken Found %Recovery
10.00 10.06 100.63 13.33 13.35 100.15 16.66 16.68 100.11
10.00 9.97 99.72 13.33 13.32 99.92 16.66 16.14 96.86
10.00 9.98 99.82 13.33 13.36 100.23 16.66 16.63 99.80
10.00 10.07 100.73 13.33 13.31 99.85 16.66 16.69 100.17
10.00 9.98 99.82 13.33 13.30 99.77 16.66 16.67 100.05
Mean 10.012 100.145 13.328 99.985 16.562 99.397
SD 0.049 0.026 0.237
%RSD 0.486 0.194 1.431

Chapter – IV Ondansetron HCl Part-C: Derivative Spectrophotometry
317
Table-4.16(b): Accuracy of the method M5(a)
Concentration-1 Concentration-2 Concentration-3
Taken Found %Recovery Taken Found %Recovery Taken Found %Recovery
15.00 15.09 100.60 20.00 19.94 99.70 25.00 24.96 99.84
15.00 15.06 100.40 20.00 20.05 100.25 25.00 24.92 99.68
15.00 14.97 99.80 20.00 20.01 100.05 25.00 25.21 100.84
15.00 14.92 99.47 20.00 19.94 99.70 25.00 25.60 102.40
15.00 15.06 100.40 20.00 19.93 99.65 25.00 25.08 100.32
Mean 15.020 100.133 19.974 99.870 25.154 100.616
SD 0.072 0.053 0.274
%RSD 0.478 0.266 1.089
Table-4.16(c): Accuracy of the method M7
Concentration-1 Concentration-2 Concentration-3
Taken Found %Recovery Taken Found %Recovery Taken Found %Recovery
45.00 44.67 99.27 60.00 59.70 99.50 75.00 75.72 100.96
45.00 44.83 99.62 60.00 59.87 99.78 75.00 74.72 99.63
45.00 45.21 100.47 60.00 60.98 101.63 75.00 74.31 99.08
45.00 45.61 101.36 60.00 61.10 101.83 75.00 75.84 101.12
45.00 44.87 99.71 60.00 60.50 100.83 75.00 75.73 100.97
Mean 45.038 100.084 60.430 100.717 75.264 100.352
SD 0.375 0.633 0.701
%RSD 0.834 1.048 0.931
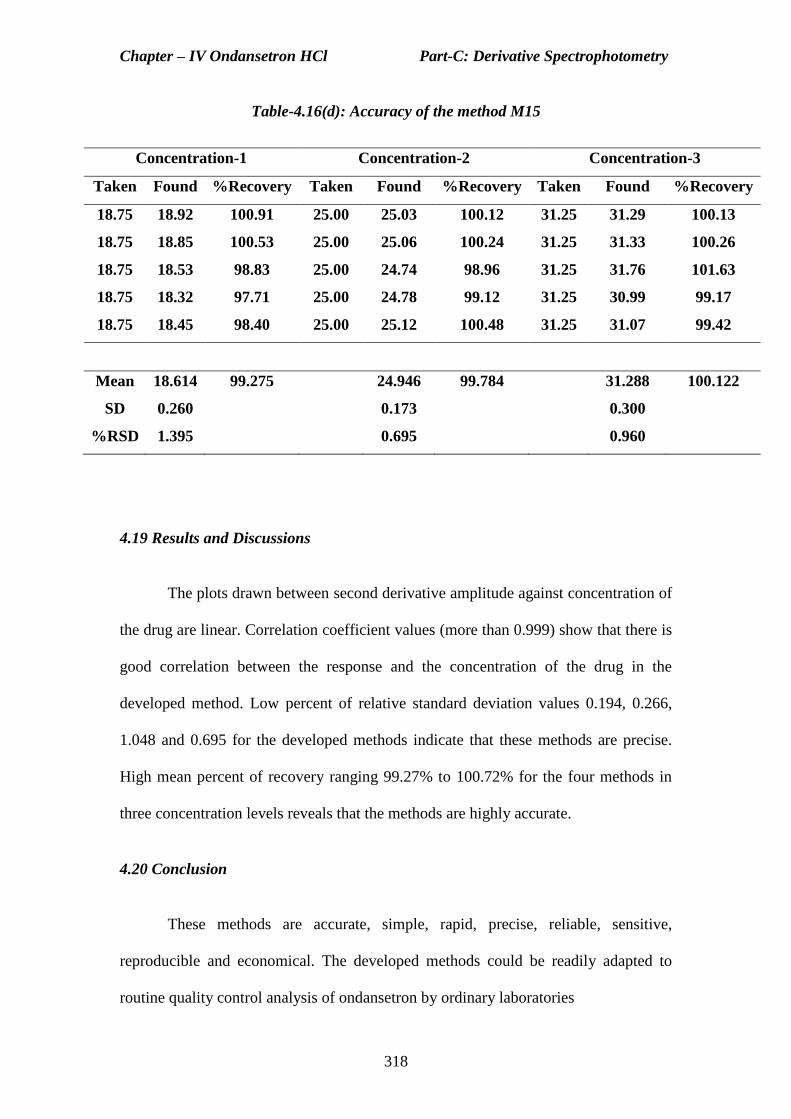
Chapter – IV Ondansetron HCl Part-C: Derivative Spectrophotometry
318
Table-4.16(d): Accuracy of the method M15
Concentration-1 Concentration-2 Concentration-3
Taken Found %Recovery Taken Found %Recovery Taken Found %Recovery
18.75 18.92 100.91 25.00 25.03 100.12 31.25 31.29 100.13
18.75 18.85 100.53 25.00 25.06 100.24 31.25 31.33 100.26
18.75 18.53 98.83 25.00 24.74 98.96 31.25 31.76 101.63
18.75 18.32 97.71 25.00 24.78 99.12 31.25 30.99 99.17
18.75 18.45 98.40 25.00 25.12 100.48 31.25 31.07 99.42
Mean 18.614 99.275 24.946 99.784 31.288 100.122
SD 0.260 0.173 0.300
%RSD 1.395 0.695 0.960
4.19 Results and Discussions
The plots drawn between second derivative amplitude against concentration of
the drug are linear. Correlation coefficient values (more than 0.999) show that there is
good correlation between the response and the concentration of the drug in the
developed method. Low percent of relative standard deviation values 0.194, 0.266,
1.048 and 0.695 for the developed methods indicate that these methods are precise.
High mean percent of recovery ranging 99.27% to 100.72% for the four methods in
three concentration levels reveals that the methods are highly accurate.
4.20 Conclusion
These methods are accurate, simple, rapid, precise, reliable, sensitive,
reproducible and economical. The developed methods could be readily adapted to
routine quality control analysis of ondansetron by ordinary laboratories