Embed Size (px)
Citation preview

One in 100:Behind Bars in America 2008

The Pew Charitable Trusts is driven by the power of knowledge to solve today’s most
challenging problems. Pew applies a rigorous, analytical approach to improve public policy,
inform the public and stimulate civic life. We partner with a diverse range of donors,
public and private organizations and concerned citizens who share our commitment to
fact-based solutions and goal-driven investments to improve society.
Public Safety Performance Project 1
Table of ContentsAbout this Report ....................................................................................................................................................2Executive Summary.................................................................................................................................................3
A Snapshot of Prison Growth .....................................................................................................................51 in 100 Adults Behind Bars ......................................................................................................................5State Trends Vary Widely ..........................................................................................................................7Florida: A Case Study in Growth ..............................................................................................................9
The Costs – High and Climbing Fast .....................................................................................................11California: $8.8 Billion and Growing ......................................................................................................11Health Care, Geriatrics Drive Costs ........................................................................................................12Staff Vacancies, Overtime Spike...............................................................................................................13Restitution, Child Support, Tax Payments Lag .......................................................................................13Crowding Out Other Priorities ................................................................................................................14Pre-K, Higher Ed Funding Lags...............................................................................................................15
Controlling Crime and Costs .....................................................................................................................17A New Path in Texas ................................................................................................................................17Managing Prison Admissions...................................................................................................................18Adjusting Length of Stay ..........................................................................................................................19
A Final Word ....................................................................................................................................................21
Figures Prison Count Pushes Up ................................................................................................................5Doing the Math................................................................................................................................6Who’s Behind Bars ..........................................................................................................................7Wide Variation in Prison Growth....................................................................................................8High Growth Rates Spread Across Nation......................................................................................9Twenty Years of Rising Costs ........................................................................................................12Taking a Bigger Cut.......................................................................................................................14Of Books and Bars ........................................................................................................................15Making Decisions Where to Spend ...............................................................................................16Controlling Crime and Prison Populations: Two Levers..............................................................20
Endnotes ..........................................................................................................................................................23Methodology Notes.........................................................................................................................................24Jurisdictional Notes .........................................................................................................................................28
Appendix Table A-1: State, Regional and National Prison Counts...............................................................29Table A-2: State Corrections Spending, FY 2007 .........................................................................30Table A-3: State Spending on Corrections and Higher Education, FY 1987-2007.......................31Table A-4: National Corrections and Higher Education Spending Trends, FY 1987-2007 .........32Table A-5: State Employees in Corrections Workforce, 2006 .....................................................33Table A-6: 1 in X: Incarceration Rates by Sex, Race/Ethnicity, Age and State ...........................34Table A-7: International Comparisons ..........................................................................................35
One in 100: Behind Bars in America 20082
About this Report
The Pew Charitable Trusts applies the power of knowledge to solve today’s most challenging problems.Pew’s Center on the States identifies and advances effective policy approaches to critical issues facing states.
Launched in 2006 as an initiative of the Center, the Public Safety Performance Project seeks to help statesadvance fiscally sound, data-driven policies and practices in sentencing and corrections that protect publicsafety, hold offenders accountable, and control corrections costs.
Pew Center on the States Susan Urahn, managing directorLori Grange, senior officerTim Lynch, officer
Project TeamJenifer Warren, principal authorAdam Gelb, project director, Public Safety Performance ProjectJake Horowitz, senior associate, Public Safety Performance ProjectJessica Riordan, senior associate, Communications
Data ConsultantsAssociation of State Correctional Administrators The JFA Institute• George Camp, co-executive director • James F. Austin, president• Jennifer Raley, project manager • Wendy Naro, vice president
• Gillian Thomson, consultantReport Design202design• Mike Heffner, partner• Lucy Pope, partner• Denise Kooper
We also would like to thank the 50 state correctional agencies, the Federal Bureau of Prisons, the Bureauof Justice Statistics, and the National Association of State Budget Officers, which provided much of thedata for this report.
For additional information on the Pew Center on the States and the Public Safety Performance Project,please visit www.pewcenteronthestates.org.
February 2008
Three decades of growth in America’s prisonpopulation has quietly nudged the nation across asobering threshold: for the first time, more than onein every 100 adults is now confined in an Americanjail or prison. According to figures gathered andanalyzed by the Pew Public Safety PerformanceProject, the number of people behind bars in theUnited States continued to climb in 2007, saddlingcash-strapped states with soaring costs they can illafford and failing to have a clear impact either onrecidivism or overall crime.
For some groups, the incarceration numbers areespecially startling. While one in 30 men betweenthe ages of 20 and 34 is behind bars, for blackmales in that age group the figure is one in nine.Gender adds another dimension to the picture. Menstill are roughly 10 times more likely to be in jail orprison, but the female population is burgeoning at afar brisker pace. For black women in their mid- tolate-30s, the incarceration rate also has hit the 1-in-100 mark. Growing older, meanwhile, continues tohave a dramatic chilling effect on criminal behavior.While one in every 53 people in their 20s is behindbars, the rate for those over 55 falls to one in 837.
While the national incarceration trend remains onthe rise, some states report a flattening of growth,or even a decline, figures from January 1 of thisyear show. Texas’ count dropped slightly over theprevious year, but with California’s massive systemdipping by 4,068 inmates, Texas has become thenation’s imprisonment leader. New York andMichigan, also among the country’s biggestsystems, reported declines as well.
There is reason to suspectthose states may soonhave lots of company.Prison costs are blowingholes in state budgets butbarely making a dent inrecidivism rates. At thesame time, policy makersare becoming increasinglyaware of research-backedstrategies for communitycorrections—better ways to identify which offendersneed a prison cell and which can be safely handledin the community, new technologies to monitor theirwhereabouts and behavior, and more effectivesupervision and treatment programs to help themstay on the straight and narrow. Taken together,these trends are encouraging policy makers todiversify their states’ array of criminal sanctions withoptions for low-risk offenders that save tax dollarsbut still hold offenders accountable for their actions.
Policy Choices Drive Growth
In exploring such alternatives, lawmakers arelearning that current prison growth is not drivenprimarily by a parallel increase in crime, or acorresponding surge in the population at large.Rather, it flows principally from a wave of policychoices that are sending more lawbreakers to prisonand, through popular “three-strikes” measures andother sentencing enhancements, keeping them therelonger. Overlaying that picture in some states hasbeen the habitual use of prison stays to punish
Public Safety Performance Project 3
Executive Summary
“There isn’t a person inpublic office that’s not
sensitive to the accusationof being soft on crime. But
you don’t have to be softon crime to be smart in
dealing with criminals.”
OH Gov. Ted Strickland (D)The Columbus Dispatch
January 26, 2008
those who break rulesgoverning their probationor parole. In California,for example, suchviolators make up a largeproportion of prisonadmissions, churning inand out of badlyoverloaded facilities.Nationally, more thanhalf of released offenders
are back in prison within three years, either for anew crime or for violating the terms of theirrelease.1
Few doubt the necessity of locking up violentcriminals and those who repeatedly threatencommunity safety. And policy makersunderstandably are moved to act by especiallyheinous crimes or victims seeking justice in thename of a loved one.
Increasingly, however, states are discovering thatcasting such a wide net for prisoners creates avexing fiscal burden—especially in lean times.Finding enough dollars to house, feed and providea doctor’s care to a low-risk inmate is a strugglebesetting states from Arizona to Vermont. In theabsence of tax hikes, lawmakers may findthemselves forced to cut or limit other vitalprograms—from transportation to education andhealthcare—to foot the incarceration tab.
That tab, meanwhile, is exploding, fueled in partby staff overtime expenses and a steep rise ininmate healthcare costs. In 1987, the statescollectively spent $10.6 billion of their generalfunds—their primary pool of discretionary taxdollars—on corrections. Last year, they spent morethan $44 billion, a 315 percent jump, data from the
National Association of State Budget Officersshow. Adjusted to 2007 dollars, the increase was127 percent. Over the same period, adjustedspending on higher education rose just 21 percent.
Taking a Different Tack
Faced with the mushrooming bills, many states areconfronting agonizing choices and weatheringbitter divisions in their legislatures. But lawmakersare by no means powerless before the budgetonslaught. Indeed, a rising number of statesalready are diversifying their menu of sanctionswith new approaches that save money but stillensure that the public is protected and thatoffenders are held accountable. And some alreadyare reaping encouraging results.
Kansas and Texas are well on their way. Facingdaunting projections of prison population growth,they have embraced a strategy that blendsincentives for reduced recidivism with greater useof community supervision for lower-risk offenders.In addition, the two states increasingly areimposing sanctions other than prison for paroleand probation violators whose infractions areconsidered “technical,” such as missing acounseling session. The new approach, born ofbipartisan leadership, is allowing the two states toensure they have enough prison beds for violentoffenders while helping less dangerous lawbreakersbecome productive, taxpaying citizens.
No policy maker would choose this path if itmeant sacrificing public safety. But gradually, somestates are proving that deploying a broad range ofsanctions can protect communities, punishlawbreakers and conserve tax dollars for otherpressing public needs.
One in 100: Behind Bars in America 20084
“There’s a shift away from the mindset of lockthem up and throw awaythe key. That cannotsustain itself.”
OH State Rep. John J. White (R-Kettering)Dayton Daily NewsFebruary 11, 2007
The United States incarcerates
more people than any country in theworld, including the far more populous
nation of China. At the start of the new year, theAmerican penal system held more than 2.3 millionadults. China was second, with 1.5 million peoplebehind bars, and Russia was a distant third with890,000 inmates, according to the latest availablefigures. Beyond the sheer number of inmates,America also is the global leader in the rate atwhich it incarcerates its citizenry, outpacing nationslike South Africa and Iran. In Germany, 93 peopleare in prison for every 100,000 adults andchildren. In the U.S, the rate is roughly eight timesthat, or 750 per 100,000.2 (See Appendix A-7 foradditional international analysis.)
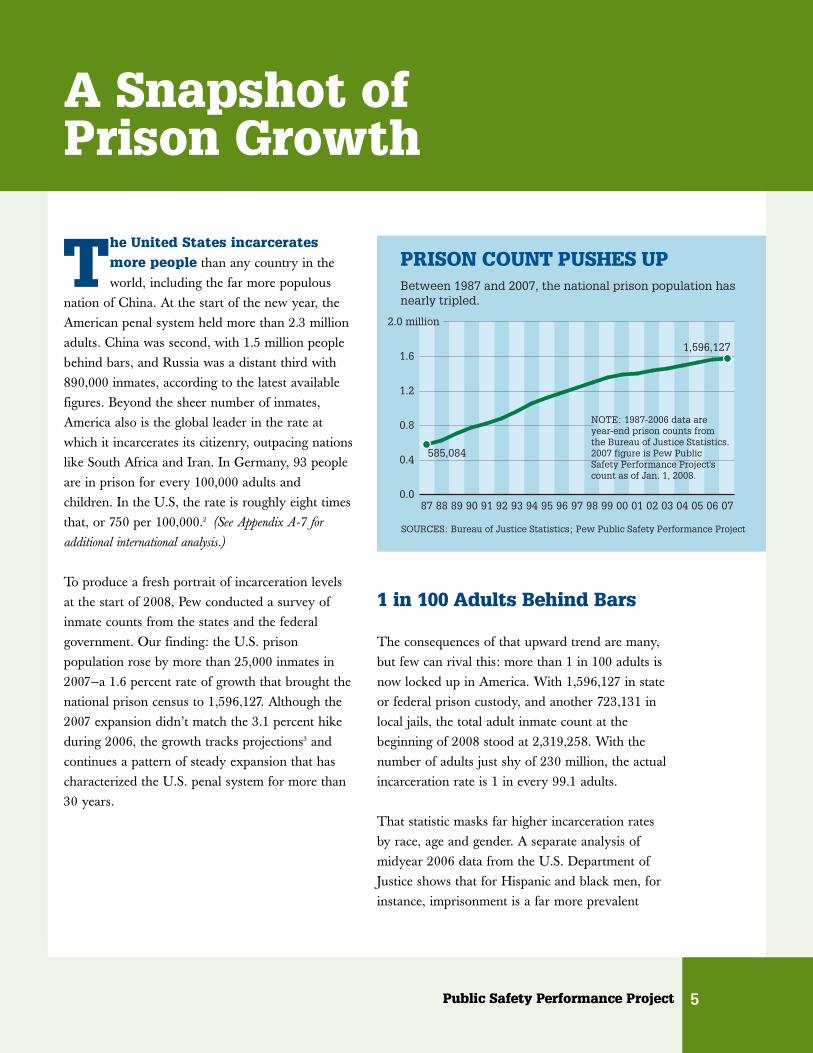
To produce a fresh portrait of incarceration levelsat the start of 2008, Pew conducted a survey ofinmate counts from the states and the federalgovernment. Our finding: the U.S. prisonpopulation rose by more than 25,000 inmates in2007—a 1.6 percent rate of growth that brought thenational prison census to 1,596,127. Although the2007 expansion didn’t match the 3.1 percent hikeduring 2006, the growth tracks projections3 andcontinues a pattern of steady expansion that hascharacterized the U.S. penal system for more than30 years.
1 in 100 Adults Behind Bars
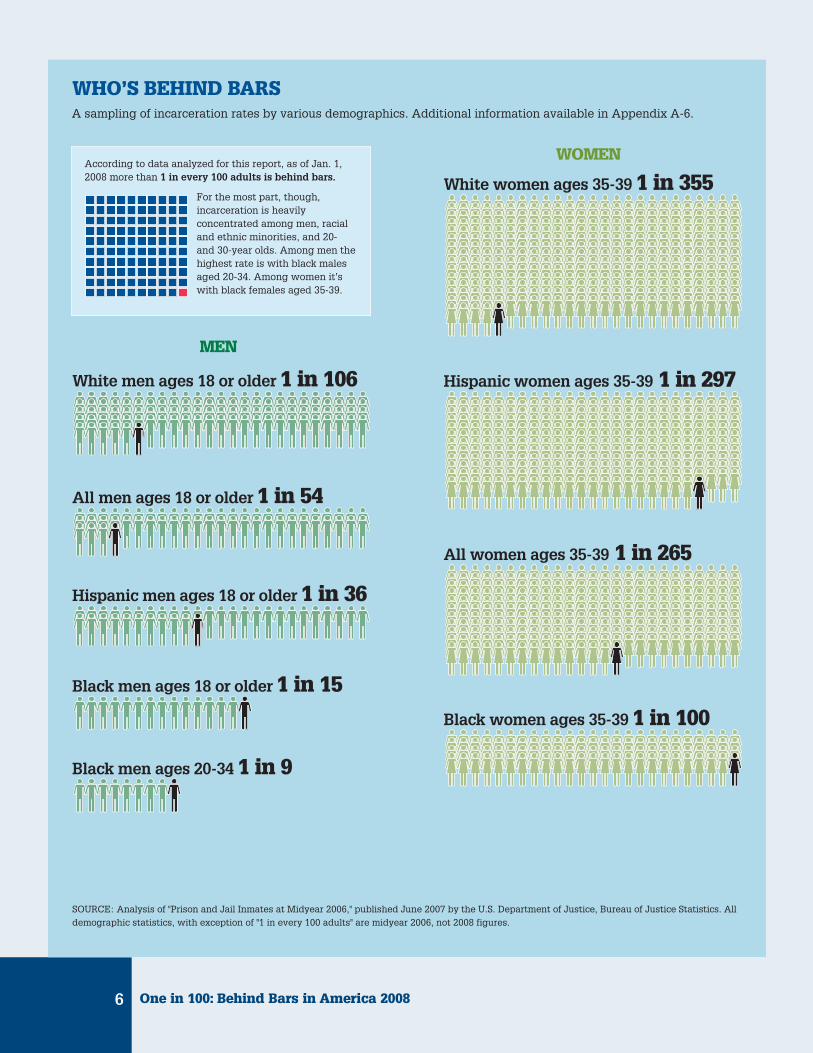
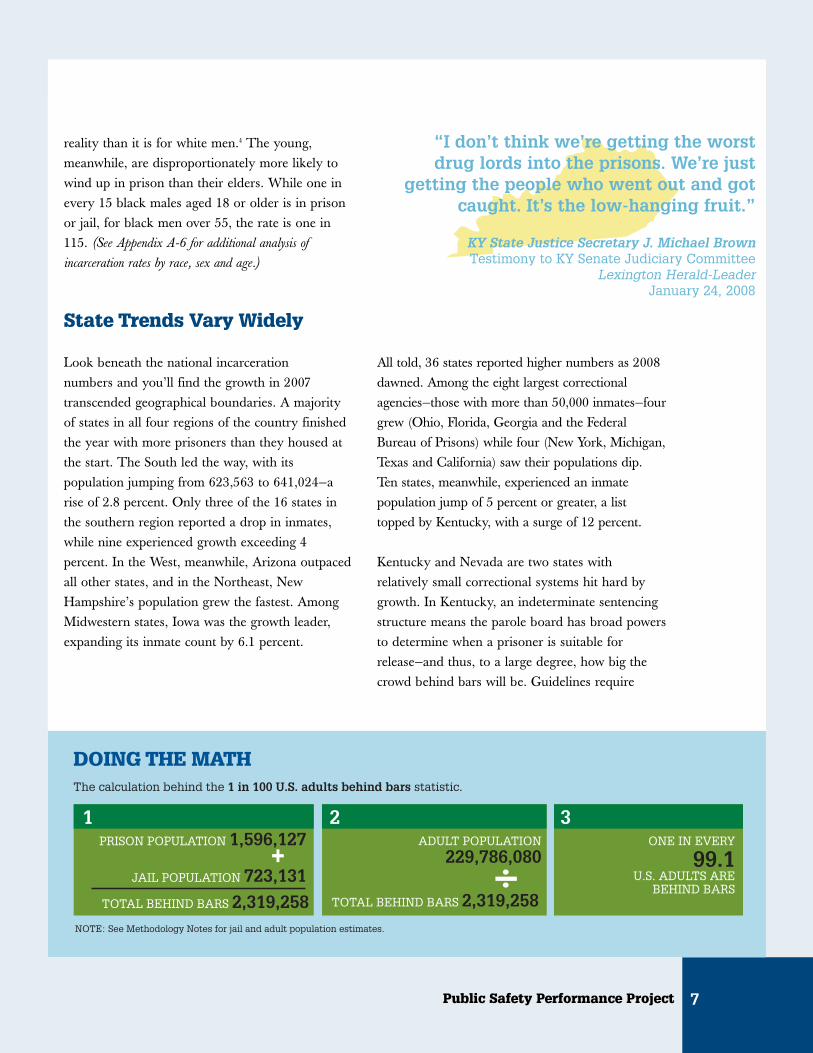
The consequences of that upward trend are many,but few can rival this: more than 1 in 100 adults isnow locked up in America. With 1,596,127 in stateor federal prison custody, and another 723,131 inlocal jails, the total adult inmate count at thebeginning of 2008 stood at 2,319,258. With thenumber of adults just shy of 230 million, the actualincarceration rate is 1 in every 99.1 adults.
That statistic masks far higher incarceration ratesby race, age and gender. A separate analysis ofmidyear 2006 data from the U.S. Department ofJustice shows that for Hispanic and black men, forinstance, imprisonment is a far more prevalent
Public Safety Performance Project 5
A Snapshot of Prison Growth
PRISON COUNT PUSHES UP
SOURCES: Bureau of Justice Statistics; Pew Public Safety Performance Project
NOTE: 1987-2006 data are year-end prison counts from the Bureau of Justice Statistics. 2007 figure is Pew PublicSafety Performance Project'scount as of Jan. 1, 2008.
585,084
1,596,127
0.0
0.4
0.8
1.2
1.6
2.0 million
070605040302010099989796959493929190898887
Between 1987 and 2007, the national prison population has nearly tripled.
One in 100: Behind Bars in America 20086
WHO’S BEHIND BARS
SOURCE: Analysis of "Prison and Jail Inmates at Midyear 2006," published June 2007 by the U.S. Department of Justice, Bureau of Justice Statistics. All demographic statistics, with exception of "1 in every 100 adults" are midyear 2006, not 2008 figures.
White women ages 35-39 1 in 355
All women ages 35-39 1 in 265
Hispanic women ages 35-39 1 in 297
Black women ages 35-39 1 in 100
White men ages 18 or older 1 in 106
All men ages 18 or older 1 in 54
Hispanic men ages 18 or older 1 in 36
Black men ages 18 or older 1 in 15
Black men ages 20-34 1 in 9
WOMEN
MEN
According to data analyzed for this report, as of Jan. 1, 2008 more than 1 in every 100 adults is behind bars.
For the most part, though, incarceration is heavily concentrated among men, racial and ethnic minorities, and 20- and 30-year olds. Among men the highest rate is with black males aged 20-34. Among women it’s with black females aged 35-39.
A sampling of incarceration rates by various demographics. Additional information available in Appendix A-6.
reality than it is for white men.4 The young,meanwhile, are disproportionately more likely towind up in prison than their elders. While one inevery 15 black males aged 18 or older is in prisonor jail, for black men over 55, the rate is one in115. (See Appendix A-6 for additional analysis ofincarceration rates by race, sex and age.)
State Trends Vary Widely
Look beneath the national incarceration numbers and you’ll find the growth in 2007transcended geographical boundaries. A majorityof states in all four regions of the country finishedthe year with more prisoners than they housed atthe start. The South led the way, with itspopulation jumping from 623,563 to 641,024—arise of 2.8 percent. Only three of the 16 states inthe southern region reported a drop in inmates,while nine experienced growth exceeding 4percent. In the West, meanwhile, Arizona outpacedall other states, and in the Northeast, NewHampshire’s population grew the fastest. AmongMidwestern states, Iowa was the growth leader,expanding its inmate count by 6.1 percent.
All told, 36 states reported higher numbers as 2008dawned. Among the eight largest correctionalagencies—those with more than 50,000 inmates—fourgrew (Ohio, Florida, Georgia and the FederalBureau of Prisons) while four (New York, Michigan,Texas and California) saw their populations dip.Ten states, meanwhile, experienced an inmatepopulation jump of 5 percent or greater, a listtopped by Kentucky, with a surge of 12 percent.
Kentucky and Nevada are two states withrelatively small correctional systems hit hard bygrowth. In Kentucky, an indeterminate sentencingstructure means the parole board has broad powersto determine when a prisoner is suitable forrelease—and thus, to a large degree, how big thecrowd behind bars will be. Guidelines require
7Public Safety Performance Project
TOTAL BEHIND BARS 2,319,258 TOTAL BEHIND BARS 2,319,258
ADULT POPULATION
229,786,080ONE IN EVERY
99.1U.S. ADULTS ARE
BEHIND BARS
PRISON POPULATION 1,596,127
JAIL POPULATION 723,131
1 2 3
NOTE: See Methodology Notes for jail and adult population estimates.
DOING THE MATH The calculation behind the 1 in 100 U.S. adults behind bars statistic.
“I don’t think we’re getting the worst drug lords into the prisons. We’re just
getting the people who went out and gotcaught. It’s the low-hanging fruit.”
KY State Justice Secretary J. Michael BrownTestimony to KY Senate Judiciary Committee
Lexington Herald-LeaderJanuary 24, 2008
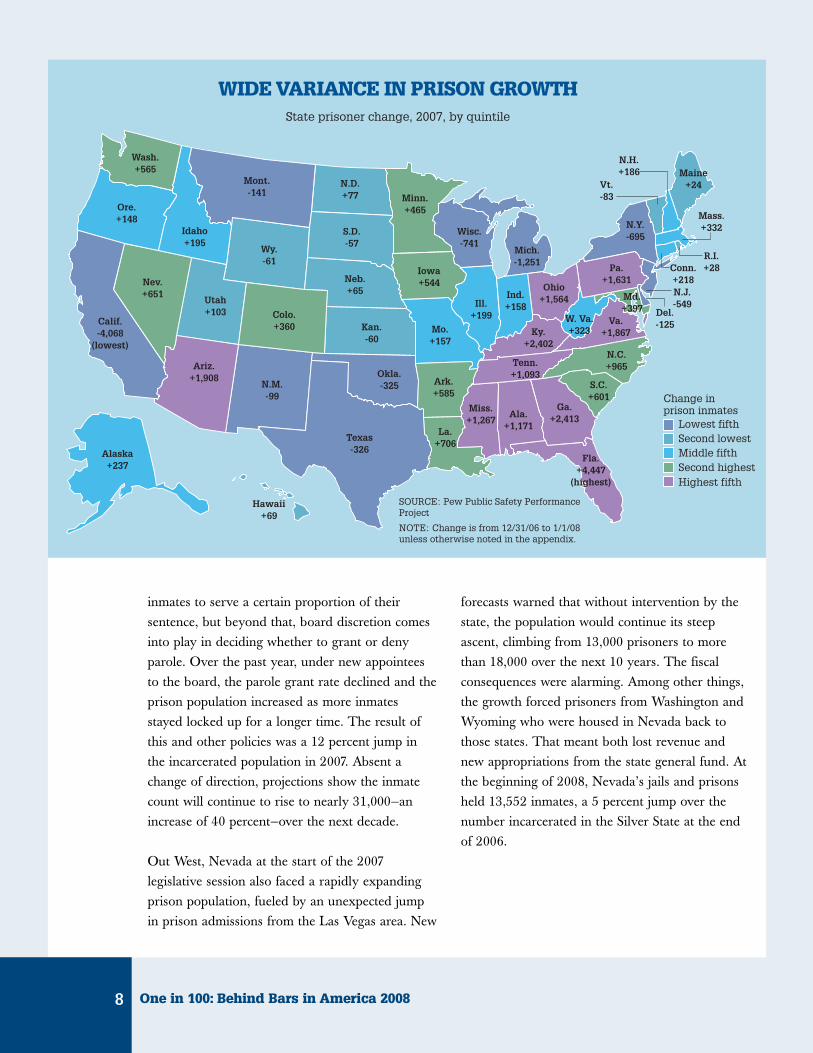
inmates to serve a certain proportion of theirsentence, but beyond that, board discretion comesinto play in deciding whether to grant or denyparole. Over the past year, under new appointeesto the board, the parole grant rate declined and theprison population increased as more inmatesstayed locked up for a longer time. The result ofthis and other policies was a 12 percent jump inthe incarcerated population in 2007. Absent achange of direction, projections show the inmatecount will continue to rise to nearly 31,000—anincrease of 40 percent—over the next decade.
Out West, Nevada at the start of the 2007legislative session also faced a rapidly expandingprison population, fueled by an unexpected jumpin prison admissions from the Las Vegas area. New
forecasts warned that without intervention by thestate, the population would continue its steepascent, climbing from 13,000 prisoners to morethan 18,000 over the next 10 years. The fiscalconsequences were alarming. Among other things,the growth forced prisoners from Washington andWyoming who were housed in Nevada back tothose states. That meant both lost revenue andnew appropriations from the state general fund. Atthe beginning of 2008, Nevada’s jails and prisonsheld 13,552 inmates, a 5 percent jump over thenumber incarcerated in the Silver State at the endof 2006.
One in 100: Behind Bars in America 20088
WIDE VARIANCE IN PRISON GROWTHState prisoner change, 2007, by quintile
Change in prison inmates
Lowest fifthSecond lowestMiddle fifthSecond highestHighest fifth
Ind.+158
N.Y.-695Wisc.
-741S.D.-57
Utah+103
Ore.+148
N.C.+965
Ga.+2,413
Fla.+4,447
(highest)
Tenn.+1,093
W. Va.+323
N.H.+186
R.I.+28
Mass.+332
Conn.+218N.J.-549
Del.-125
Pa.+1,631
Texas-326
Iowa+544Neb.
+65
Wy.-61
Idaho+195
Calif.-4,068
(lowest)
Ariz.+1,908
Minn.+465
Maine+24
Md.+397
Va.+1,867
Ohio+1,564
Mich.-1,251
N.D.+77
Mont.-141
S.C.+601
Ky.+2,402
Miss.+1,267
Colo.+360
Alaska+237
Hawaii+69
Nev.+651
Wash.+565
Ala.+1,171
Ark.+585
N.M.-99
Mo.+157
Ill.+199
La.+706
Okla.-325
Kan.-60
Vt.-83
SOURCE: Pew Public Safety Performance Project
NOTE: Change is from 12/31/06 to 1/1/08 unless otherwise noted in the appendix.
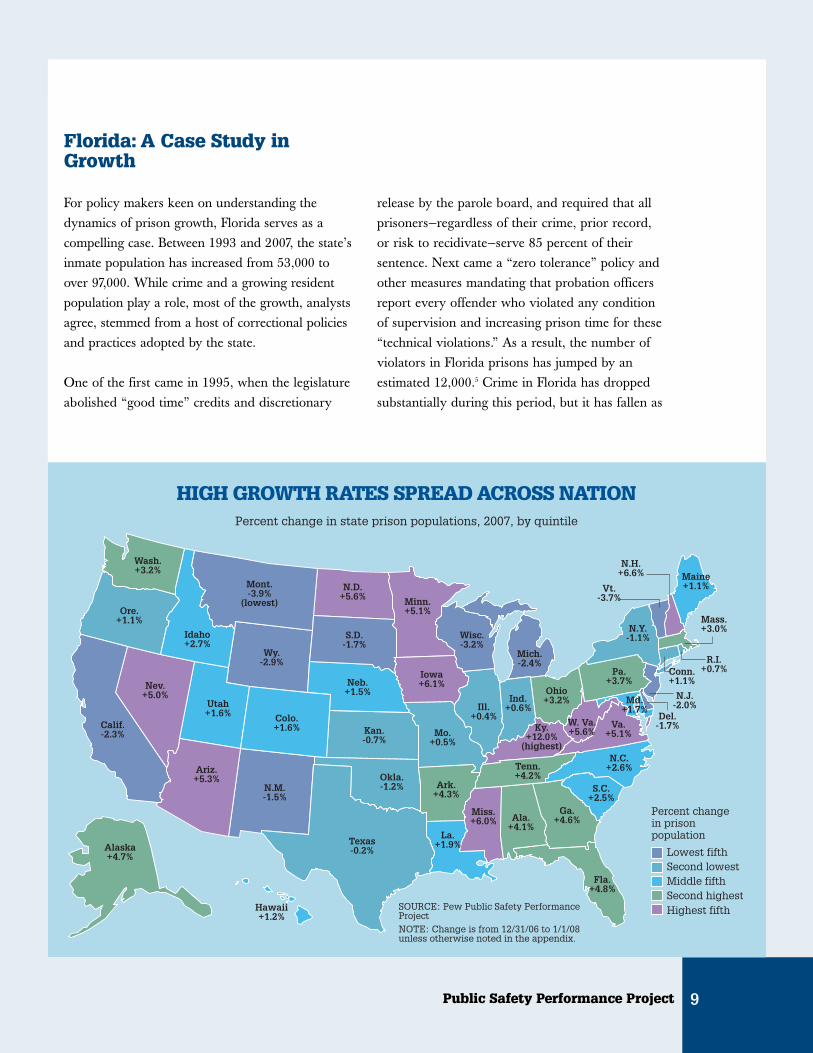
Florida: A Case Study inGrowth
For policy makers keen on understanding thedynamics of prison growth, Florida serves as acompelling case. Between 1993 and 2007, the state’sinmate population has increased from 53,000 toover 97,000. While crime and a growing residentpopulation play a role, most of the growth, analystsagree, stemmed from a host of correctional policiesand practices adopted by the state.
One of the first came in 1995, when the legislatureabolished “good time” credits and discretionary
release by the parole board, and required that allprisoners—regardless of their crime, prior record,or risk to recidivate—serve 85 percent of theirsentence. Next came a “zero tolerance” policy andother measures mandating that probation officersreport every offender who violated any conditionof supervision and increasing prison time for these“technical violations.” As a result, the number ofviolators in Florida prisons has jumped by anestimated 12,000.5 Crime in Florida has droppedsubstantially during this period, but it has fallen as
Public Safety Performance Project 9
HIGH GROWTH RATES SPREAD ACROSS NATIONPercent change in state prison populations, 2007, by quintile
SOURCE: Pew Public Safety Performance ProjectNOTE: Change is from 12/31/06 to 1/1/08 unless otherwise noted in the appendix.
Ind.+0.6%
N.Y.-1.1%Wisc.
-3.2%S.D.
-1.7%
Utah+1.6%
Ore.+1.1%
N.C.+2.6%
Ga.+4.6%
Fla.+4.8%
Tenn.+4.2%
W. Va.+5.6%
N.H.+6.6%
R.I.+0.7%
Mass.+3.0%
Conn.+1.1%
N.J.-2.0%
Del.-1.7%
Pa.+3.7%
Texas-0.2%
Iowa+6.1%Neb.
+1.5%
Wy.-2.9%
Idaho+2.7%
Calif.-2.3%
Ariz.+5.3%
Minn.+5.1%
Maine+1.1%
Md.+1.7%
Va.+5.1%
Ohio+3.2%
Mich.-2.4%
N.D.+5.6%
Mont.-3.9%
(lowest)
S.C.+2.5%
Ky.+12.0%
(highest)
Miss.+6.0%
Colo.+1.6%
Alaska+4.7%
Hawaii+1.2%
Nev.+5.0%
Wash.+3.2%
Ala.+4.1%
Ark.+4.3%
N.M.-1.5%
Mo.+0.5%
Ill.+0.4%
La.+1.9%
Okla.-1.2%
Kan.-0.7%
Vt.-3.7%
Percent change in prison population
Lowest fifthSecond lowestMiddle fifthSecond highestHighest fifth

much or more in some states that have not growntheir prison systems, or even have shrunk them,such as New York.
Without a change of direction, Florida is expectedto reach a peak of nearly 125,000 inmates by 2013.Based on that projection, the state will run out ofprison capacity by early 2009 and will need to addanother 16,500 beds to keep pace.6
One in 100: Behind Bars in America 200810
Prisons and jails are “24-7”
operations. They require large, highlytrained staffs. Their inhabitants are troubled,
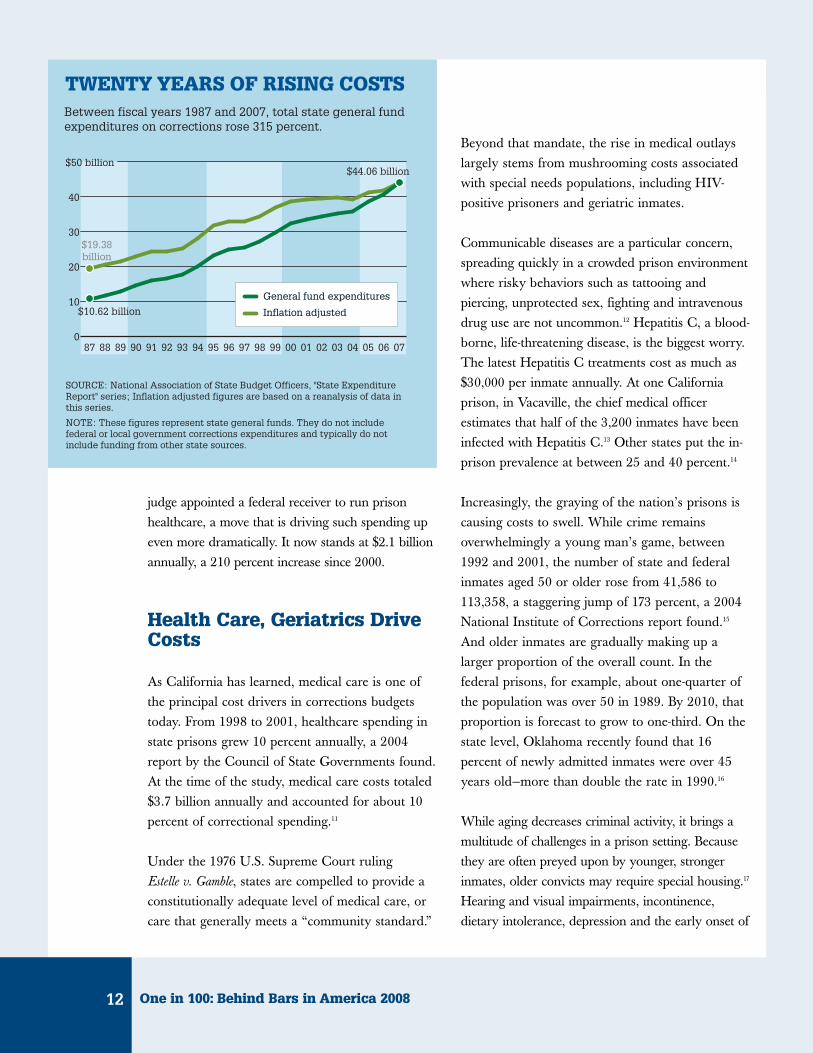
aging and generally sicker than people outsideprison walls. Even absent continued growth, the costof keeping the nation’s lock-ups running safely isstaggering. Total state spending on corrections—including bonds and federal contributions—topped$49 billion last year, up from $12 billion in 1987. By2011, continued prison growth is expected to coststates an additional $25 billion.7
The primary catalyst behind the increase is obvious:prison growth means more bodies to feed, clothe,house and supervise. While figures vary widely bystate, the average per prisoner operating cost was$23,876 in 2005, the most recent year for whichdata were available. Rhode Island spent the mostper inmate ($44,860) while Louisiana had the lowestper inmate cost, $13,009.8 While employee wagesand benefits account for much of the varianceamong states, other factors—such as the inmate-to-staff ratio—play a role as well. Capital expenses,meanwhile, are difficult to estimate, but researcherscite $65,000 per bed as the best approximation for atypical medium security facility.9
California: $8.8 Billion and Growing
Remarkably, 13 states now devote more than $1billion a year in general funds to their correctionssystems. The undisputed leader is California,where spending totaled $8.8 billion last year. Even
when adjusted for inflation, thatrepresents a 216 percent increaseover the amount California spenton corrections 20 years earlier.And last year, the governorsigned a bill authorizinganother $7.9 billion inspending, through leaserevenue bonds, for 53,000more prison and jail beds.Texas, with a slightly largernumber of inmates, ranks adistant second in spending, investingroughly $3.3 billion last year.
California vividly symbolizes the financial perils ofthe state prison business. On top of the perennialpolitical tug-of-war, the state’s whoppingcorrections budget is shaped by a bevy of courtsettlements that make predicting and controllingspending tricky. Following successful lawsuits byprisoner plaintiffs, California now is subject tocourt oversight of inmate medical and dental care,mental health services, its juvenile offenders, andthe treatment of disabled inmates. Even its parolerevocation system is controlled by a legalsettlement, and thereby subject to judicial ordersthat influence spending.
Healthcare costs have been affected more than anyother category. In FY 2000-01, California spent $676million on such costs. By FY 2004-05, after the statesettled a lawsuit alleging negligent and insufficientmedical care, spending had soared to $1.05 billion,an increase of 55 percent.10 And that was before a
Public Safety Performance Project 11
The Costs – High and Climbing Fast
“We are jammed up with this situation right now because
we have fallen in love with one of
the most undocumentedbeliefs: That somehow you get safer if you put
more people in jail.”
CA Senate President Pro Tem Don Perata (D-East Bay)
Associated PressDecember 8, 2007
judge appointed a federal receiver to run prisonhealthcare, a move that is driving such spending upeven more dramatically. It now stands at $2.1 billionannually, a 210 percent increase since 2000.
Health Care, Geriatrics DriveCosts
As California has learned, medical care is one ofthe principal cost drivers in corrections budgetstoday. From 1998 to 2001, healthcare spending instate prisons grew 10 percent annually, a 2004report by the Council of State Governments found.At the time of the study, medical care costs totaled$3.7 billion annually and accounted for about 10percent of correctional spending.11
Under the 1976 U.S. Supreme Court ruling Estelle v. Gamble, states are compelled to provide aconstitutionally adequate level of medical care, orcare that generally meets a “community standard.”
Beyond that mandate, the rise in medical outlayslargely stems from mushrooming costs associatedwith special needs populations, including HIV-positive prisoners and geriatric inmates.
Communicable diseases are a particular concern,spreading quickly in a crowded prison environmentwhere risky behaviors such as tattooing andpiercing, unprotected sex, fighting and intravenousdrug use are not uncommon.12 Hepatitis C, a blood-borne, life-threatening disease, is the biggest worry.The latest Hepatitis C treatments cost as much as$30,000 per inmate annually. At one Californiaprison, in Vacaville, the chief medical officerestimates that half of the 3,200 inmates have beeninfected with Hepatitis C.13 Other states put the in-prison prevalence at between 25 and 40 percent.14
Increasingly, the graying of the nation’s prisons iscausing costs to swell. While crime remainsoverwhelmingly a young man’s game, between1992 and 2001, the number of state and federalinmates aged 50 or older rose from 41,586 to113,358, a staggering jump of 173 percent, a 2004National Institute of Corrections report found.15
And older inmates are gradually making up alarger proportion of the overall count. In thefederal prisons, for example, about one-quarter ofthe population was over 50 in 1989. By 2010, thatproportion is forecast to grow to one-third. On thestate level, Oklahoma recently found that 16percent of newly admitted inmates were over 45years old—more than double the rate in 1990.16
While aging decreases criminal activity, it brings amultitude of challenges in a prison setting. Becausethey are often preyed upon by younger, strongerinmates, older convicts may require special housing.17
Hearing and visual impairments, incontinence,dietary intolerance, depression and the early onset of
One in 100: Behind Bars in America 200812
SOURCE: National Association of State Budget Officers, "State Expenditure Report" series; Inflation adjusted figures are based on a reanalysis of data in this series.
NOTE: These figures represent state general funds. They do not include federal or local government corrections expenditures and typically do not include funding from other state sources.
$44.06 billion
$10.62 billion
$19.38billion
TWENTY YEARS OF RISING COSTSBetween fiscal years 1987 and 2007, total state general fund expenditures on corrections rose 315 percent.
0
10
20
30
40
$50 billion
070605040302010099989796959493929190898887
General fund expendituresGeneral fund expenditures
Inflation adjustedInflation adjusted
chronic diseases are other complicating managementfactors. As a result, the average cost associated withan older prisoner is $70,000—two to three times thatof a younger prisoner.18
The bottom line: Some crimes are so heinous theywarrant a lifetime behind bars. But states arespending more and more on inmates who are lessand less of a threat to public safety.
Staff Vacancies, OvertimeSpike
Another key cost driver is compensation for theofficers who patrol cellblocks.
In 2006, the most recent year for which data wereavailable, there were approximately 4.25 millionstate government employees. About 11 percent ofthem—or one in nine—worked in corrections,19 butprisons are struggling mightily to keep a fullcomplement of officers on staff. The result—theextensive use of overtime—is one of the biggestbudget busters confronting states.
In Wisconsin, for instance, overtime rose 27 percentbetween 2005 and 2006, largely due to anunanticipated 1,200-inmate jump in the prisonpopulation.20 California’s overtime costs, meanwhile,exploded by 35 percent between 2005 and 2006, asthe state struggled to keep its 33 prisons staffeddespite nearly 4,000 vacancies. Overtime costs inCalifornia topped half a billion dollars in 2006, with15 percent of the corrections workforce earning atleast $25,000 in overtime that year. Six employeeseven earned more than the $212,179 annual salaryset aside for Gov. Arnold Schwarzenegger.21
The economic picture is sodire in California, where abudget deficit of $14.5billion is predicted for thecoming fiscal year, that theRepublican governor hasproposed releasing more than22,100 inmates before theirterms are up. Eligibility wouldbe limited to nonviolent, non-serious offenders, and theplan excludes sex offendersand those convicted of 25other specific crimes.Governor Schwarzeneggersays the state would save $1.1 billion throughhis proposal, but so far it has received a coolreception from both parties in the legislature.
Restitution, Child Support,Tax Payments Lag
While overtime and healthcare costs show upvividly in budget documents, the nation’s relianceon incarceration for many low-risk offendersinflicts economic hardship in many other, lessobvious ways. If they have a job at all, prisonersare typically unable to earn more than a very lowwage, making it unlikely they will pay much, ifanything, in child support, victim restitution ortaxes. National statistics on such impacts arescarce. But a few state-level reports document thedifference incarceration can make.
In a 2001 study, Massachusetts found that morethan three-quarters of the state’s prison populationhad paid none of its mandated child support in theprevious 12 months. During the same timeframe,more than two-thirds of parolees with child
Public Safety Performance Project 13
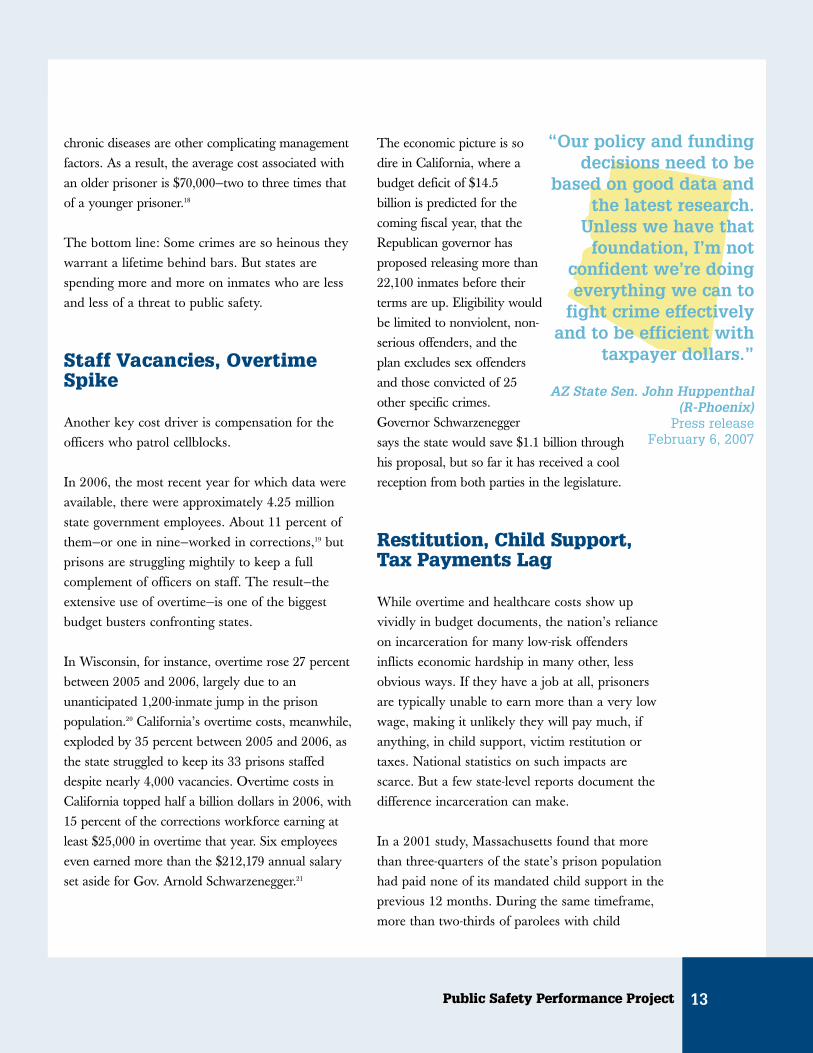
“Our policy and fundingdecisions need to be
based on good data andthe latest research.
Unless we have thatfoundation, I’m not
confident we’re doingeverything we can to
fight crime effectivelyand to be efficient with
taxpayer dollars.”
AZ State Sen. John Huppenthal(R-Phoenix)
Press releaseFebruary 6, 2007
support obligations managed to make at leastpartial payments. Overall, the average prisonerpaid only $206 over the previous year forchild support obligations, while the averageamount paid by parolees was $1,538—morethan seven times as much.22
In Florida, meanwhile, statistics show thatoffenders under supervision in the communitymake substantial restitution payments tovictims. In FY 2004-2005, one study showed,Florida probationers paid more than $37.3million in restitution under mandatoryfinancial obligation agreements established atthe onset of their supervision.23
Crowding Out OtherPriorities
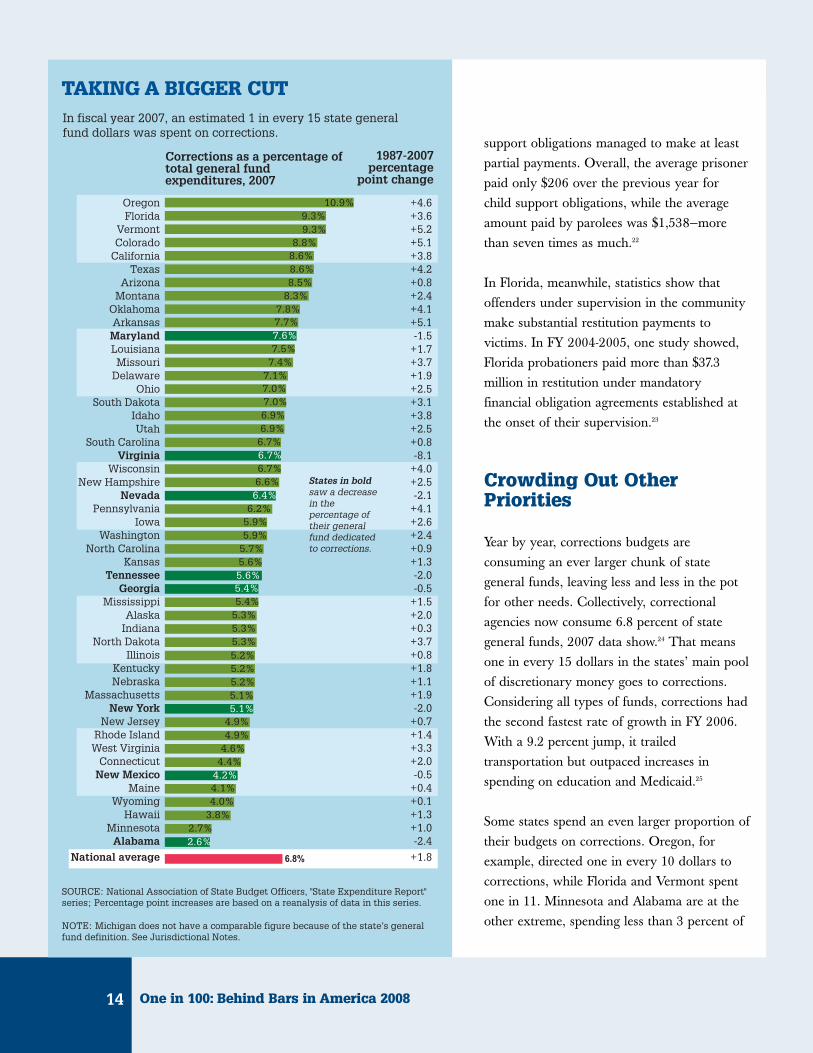
Year by year, corrections budgets areconsuming an ever larger chunk of stategeneral funds, leaving less and less in the potfor other needs. Collectively, correctionalagencies now consume 6.8 percent of stategeneral funds, 2007 data show.24 That meansone in every 15 dollars in the states’ main poolof discretionary money goes to corrections.Considering all types of funds, corrections hadthe second fastest rate of growth in FY 2006.With a 9.2 percent jump, it trailedtransportation but outpaced increases inspending on education and Medicaid.25
Some states spend an even larger proportion oftheir budgets on corrections. Oregon, forexample, directed one in every 10 dollars tocorrections, while Florida and Vermont spentone in 11. Minnesota and Alabama are at theother extreme, spending less than 3 percent of
One in 100: Behind Bars in America 200814
SOURCE: National Association of State Budget Officers, "State Expenditure Report" series; Percentage point increases are based on a reanalysis of data in this series.
NOTE: Michigan does not have a comparable figure because of the state’s general fund definition. See Jurisdictional Notes.
Corrections as a percentage of total general fund expenditures, 2007
1987-2007percentage
point change
OregonFlorida
VermontColorado
CaliforniaTexas
ArizonaMontana
OklahomaArkansasMarylandLouisianaMissouri
DelawareOhio
South DakotaIdahoUtah
South CarolinaVirginia
WisconsinNew Hampshire
NevadaPennsylvania
IowaWashington
North CarolinaKansas
TennesseeGeorgia
MississippiAlaska
IndianaNorth Dakota
IllinoisKentuckyNebraska
MassachusettsNew York
New JerseyRhode IslandWest Virginia
ConnecticutNew Mexico
MaineWyoming
HawaiiMinnesota
Alabama
National average
+4.6+3.6+5.2+5.1+3.8+4.2+0.8+2.4+4.1+5.1-1.5
+1.7+3.7+1.9+2.5+3.1+3.8+2.5+0.8-8.1
+4.0+2.5-2.1
+4.1+2.6+2.4+0.9+1.3-2.0-0.5
+1.5+2.0+0.3+3.7+0.8+1.8+1.1+1.9-2.0
+0.7+1.4+3.3+2.0-0.5
+0.4+0.1+1.3+1.0-2.4
+1.8
TAKING A BIGGER CUTIn fiscal year 2007, an estimated 1 in every 15 state general fund dollars was spent on corrections.
States in bold saw a decrease in the percentage of their general fund dedicated to corrections.
10.9%9.3%9.3%
8.8%8.6%8.6%8.5%
8.3%7.8%7.7%7.6%7.5%
7.4%7.1%7.0%7.0%6.9%6.9%
6.7%6.7%6.7%6.6%6.4%
6.2%5.9%5.9%
5.7%5.6%5.6%5.4%5.4%
5.3%5.3%5.3%5.2%5.2%5.2%5.1%5.1%
4.9%4.9%
4.6%4.4%
4.2%4.1%4.0%
3.8%2.7%2.6%
6.8%
their general fund dollars on corrections. Overthe past 20 years, corrections spending took up alarger share of overall general fund expendituresin 42 states.
Some policy makers are questioning the wisdom ofdevoting an increasingly large slice of the budgetpie to incarceration, especially when recidivismrates have remained discouragingly high. Are wegetting our money’s worth? Is our investment inthis system returning sufficient dividends forvictims, taxpayers and society at large?
On average, corrections is the fifth-largest statebudget category, behind health, elementary andsecondary education, higher education andtransportation. But nearly all corrections dollarscome from the states’ own coffers; healthcare, bycontrast, draws a majority of funding from thefederal government, primarily through Medicaid.For some public officials, that distinction highlightsthe effect of corrections spending on other priorities.
Pre-K, Higher Ed Funding Lags
Higher education is of particular concern. Highereducation spending accounts for a roughlycomparable portion of state expenditures ascorrections, and other than tuition is paid foralmost entirely out of state rather than federalfunds. States don’t necessarily make explicitchoices between higher education and correctionsfunding, but they do have to balance their budgets.So, unlike the federal government, a dollar spent inone area is unavailable for another.
In 1987, states collectively spent $33 billion of theirgeneral funds on higher education. By 2007, theywere spending $72.88 billion, an increase of 121
percent. Adjustedto 2007 dollars, theincrease was 21percent. Over thesame timeframe,inflation-adjustedcorrectionsspending rose 127percent, from $10.6billion ($19.4billion in 2007dollars) to more than $44 billion.
Some regional differences were more dramatic.While inflation-adjusted prison spending rose 61percent in the Northeast in the last 20 years, highereducation spending went the other way, droppingby 5.5 percent. In the West, meanwhile, the numberof dollars allocated to prisons skyrocketed by 205percent. At the same time, higher educationspending rose just 28 percent.
Public Safety Performance Project 15
SOURCE: National Association of State Budget Officers, "State Expenditure Report" series; Inflation adjusted general fund figures are based on a reanalysis of data in this series.
OF BOOKS AND BARSBetween 1987 and 2007, the amount states spent on corrections more than doubled while the increase in higher education spending has been moderate.
+21%
Higher education
Corrections
+127%
“If we don’t change the coursenow,we will be building
prisons forever and ever—prisons we can’t afford.”
TX State Senator John Whitmire(D-Houston)
Chair, Senate Criminal Justice CommitteeAustin-American Statesman
January 31, 2007
Corrections spending also competes with thefunding many states want to devote to earlychildhood education, one of the most provencrime prevention strategies. Research shows thatattending a high-quality pre-kindergarteninfluences a child’s success both in school and inlife. One rigorous study that followed severelydisadvantaged children into adulthood showedthat participation in pre-kindergartendramatically reduced participation in juvenileand adult crime, and increased high schoolgraduation, employment and earnings, with atotal benefit-cost ratio of 16 to 1.26
Backed with such evidence of success, states havesubstantially increased support for high-quality,voluntary pre-kindergarten. New state pre-kfunding exceeded $525 million in FY 2008, anincrease of more than 12 percent over FY07expenditures, bringing total state investments inearly education across the country to $4.8 billion.27
Increasingly, state policy makers are finding thata dollar spent for pre-k classes now can forestallmany more dollars for prison beds down theroad.
One in 100: Behind Bars in America 200816
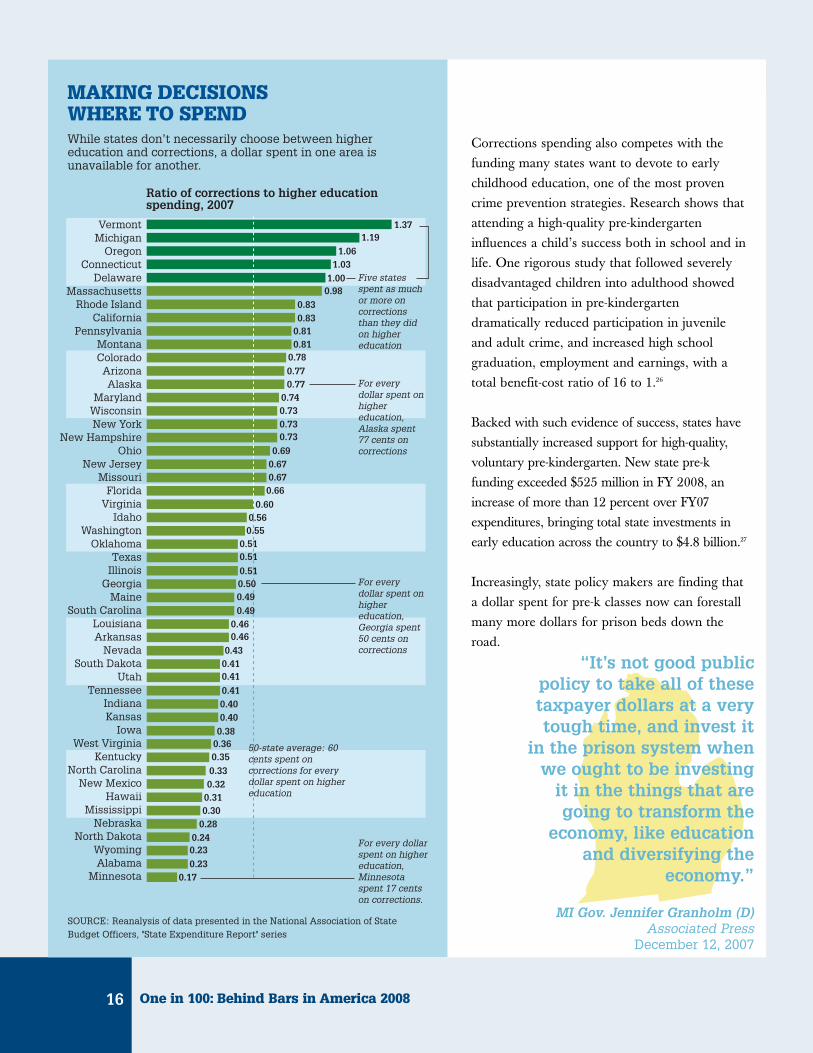
MAKING DECISIONS WHERE TO SPENDWhile states don’t necessarily choose between higher education and corrections, a dollar spent in one area is unavailable for another.
SOURCE: Reanalysis of data presented in the National Association of State Budget Officers, "State Expenditure Report" series
Ratio of corrections to higher education spending, 2007
VermontMichigan
OregonConnecticut
DelawareMassachusetts
Rhode IslandCalifornia
PennsylvaniaMontanaColoradoArizonaAlaska
MarylandWisconsinNew York
New HampshireOhio
New JerseyMissouri
FloridaVirginia
IdahoWashington
OklahomaTexas
IllinoisGeorgia
MaineSouth Carolina
LouisianaArkansas
NevadaSouth Dakota
UtahTennessee
IndianaKansas
IowaWest Virginia
KentuckyNorth Carolina
New MexicoHawaii
MississippiNebraska
North DakotaWyomingAlabama
Minnesota
Five states spent as much or more on corrections than they did on higher education
For every dollar spent on higher education, Minnesota spent 17 cents on corrections.
For every dollar spent on higher education, Georgia spent 50 cents on corrections
For every dollar spent on higher education, Alaska spent 77 cents on corrections
0.17
0.23
0.23
0.240.280.300.310.320.33
0.350.360.38
0.400.40
0.410.41
0.41
0.43
0.460.46
0.490.49
0.500.51
0.510.51
0.550.56
0.60
0.66
0.670.67
0.69
0.730.730.73
0.74
0.770.77
0.78
0.810.81
0.830.83
0.981.00
1.031.06
1.191.37
50-state average: 60 cents spent on corrections for every dollar spent on higher education
“It’s not good publicpolicy to take all of thesetaxpayer dollars at a verytough time, and invest it
in the prison system whenwe ought to be investing
it in the things that aregoing to transform the
economy, like educationand diversifying the
economy.”
MI Gov. Jennifer Granholm (D)Associated Press
December 12, 2007
The politics of crime fighting havemade most lawmakers understandablywary of advocating a diverse punishment
strategy. There are politicians who have seen theircareers torpedoed by opponents who used a lonevote, or even a comment, to create a dreaded “soft-on-crime” image at election time.
Still, in some states, policy makers on both sides ofthe aisle are finding a safe path through thisminefield. In some cases, the soaring costs ofimprisonment have hindered spending on othervital programs to a degree that many findunacceptible. At the same time, polls show a shift inpublic attitudes toward crime, which has droppeddown the list of issues of most concern to voters.28
Taken together, these factors—coupled with newstrategies that can cut recidivism rates—are fuelinga bipartisan appetite for new approaches.
Fortunately, public officials today enjoy a panoplyof options as they consider how to rein inexpansion of their prison population whilemaintaining public safety. Indeed, policy choices—more than crime rates, general population growthor other factors—are what determine the number ofpeople behind bars. Policy makers largely controlthe levers that govern who goes in and when theyget out. In short, they control their own fiscaldestiny.
Some states already have broken away from old,prison-fits-all patterns to create more diversecorrectional systems that are proving more cost-effective and at least as effective at preventing
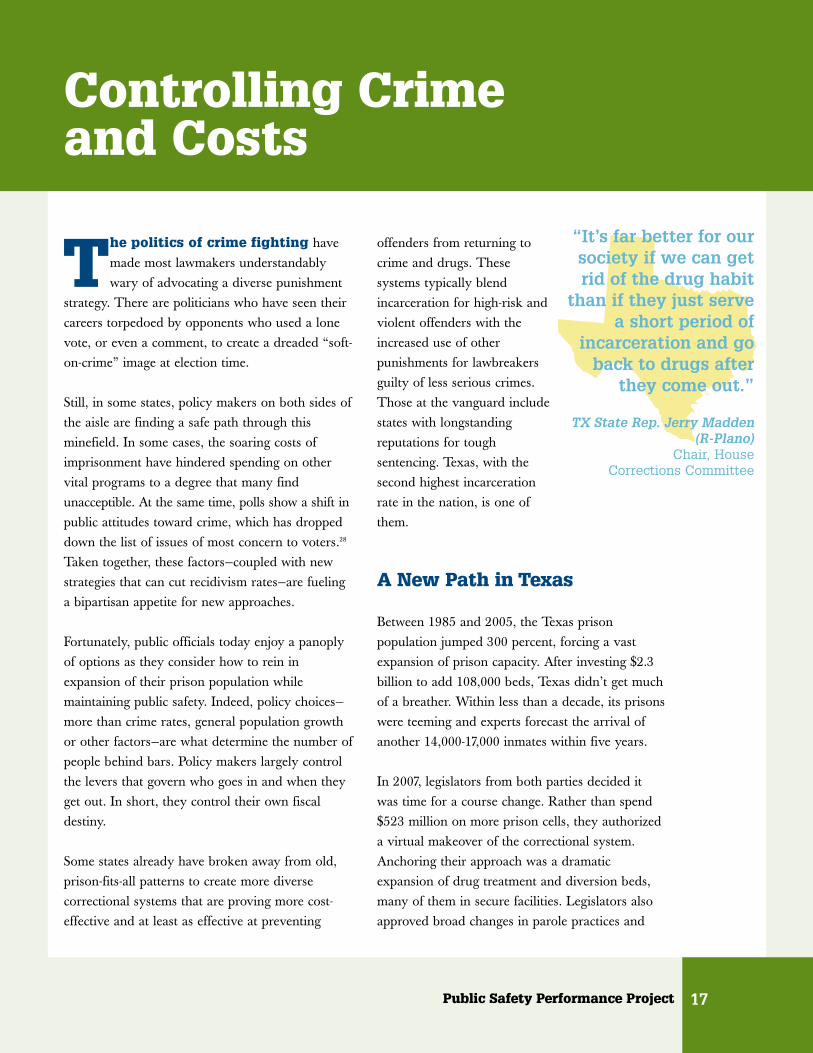
offenders from returning tocrime and drugs. Thesesystems typically blendincarceration for high-risk andviolent offenders with theincreased use of otherpunishments for lawbreakersguilty of less serious crimes.Those at the vanguard includestates with longstandingreputations for toughsentencing. Texas, with thesecond highest incarcerationrate in the nation, is one ofthem.
A New Path in Texas
Between 1985 and 2005, the Texas prisonpopulation jumped 300 percent, forcing a vastexpansion of prison capacity. After investing $2.3billion to add 108,000 beds, Texas didn’t get muchof a breather. Within less than a decade, its prisonswere teeming and experts forecast the arrival ofanother 14,000-17,000 inmates within five years.
In 2007, legislators from both parties decided itwas time for a course change. Rather than spend$523 million on more prison cells, they authorizeda virtual makeover of the correctional system.Anchoring their approach was a dramaticexpansion of drug treatment and diversion beds,many of them in secure facilities. Legislators alsoapproved broad changes in parole practices and
Public Safety Performance Project 17
Controlling Crime and Costs
“It’s far better for oursociety if we can getrid of the drug habit
than if they just servea short period of
incarceration and goback to drugs after
they come out.”
TX State Rep. Jerry Madden(R-Plano)
Chair, House Corrections Committee
expanded drug courts. In all, the reforms areexpected to save Texas $210 million over the nexttwo years—plus an additional $233 million if therecidivism rate drops and the state can avoidcontingency plans to build three new prisons.29
“It’s always been safer politically to build the nextprison, rather than stop and see whether that’sreally the smartest thing to do,” said state Sen.
John Whitmire ofHouston, chairman of thesenate’s criminal justicecommittee. “But we’re at apoint where I don’t thinkwe can afford to do thatanymore.”
At the start of 2008, thefuture looked promising inthe Lone Star state. For thenext five years, newprojections by theLegislative Budget Boardshow, the prison trend is aflat line.
Managing Prison Admissions
As Texas has found, two principal variables governthe size of the crowd on a state’s prison yards—thenumber of admissions and the length of time aninmate remains behind bars. Even the smallestmodifications can yield a marked slowdown—oracceleration—in population growth.
At the front end of the pipeline, states are reapingsavings primarily through two maneuvers—thediversion of lower-risk offenders away from prisoninto less-costly settings and the use of a variety of
“intermediate” sanctions for parolees andprobationers who violate conditions of theirrelease.
One common target for diversion is nonviolentoffenders with drug addictions or mental illnesses.Since 2004, at least 13 states have adoptedlegislation creating or expanding communitycorrections options for nonviolent offenders,including drug courts that combine the “carrot” ofsubstance abuse treatment with the “stick” ofpenalties for missing treatment or failing a drugtest.30
Another focus of diversion programs is those whohave broken the rules of their release on probationor parole. In 2005, parole violators accounted formore than one-third of all prison admissions, thefederal Bureau of Justice Statistics reports.31
Similarly, half the people in U.S. jails are therebecause they failed on probation in thecommunity.
While some violators are reincarcerated for newcrimes, a significant number wind up back inprison for so-called “technical” violations—transgressions such as a failed drug test or missedappointment with a supervisory agent. Californialocks up massive numbers of violators, scramblingto accommodate them in a sprawling, 171,444-inmate system so crowded that a three-judge panelmay order a population reduction. A 2005 studyshowed that more than two-thirds of parolees inthe Golden State were returned to prison withinthree years of release; of those, 39 percent weredue to technical violations.32
Viewing technical violators as a lesser threat tosociety than other offenders, states are increasinglyopting to punish them with community-based
One in 100: Behind Bars in America 200818
“For continuedfunding, we have toachieve that goalstatewide. The DOChas announced to usour funding will nolonger be based solelyon how many clientswe have, but on ourperformance.”
Ken Moore, Director, Reno County (KS) Community CorrectionsThe Hutchinson NewsJanuary 19, 2008
sanctions. These include a mix of day reportingcenters, electronic monitoring systems, andcommunity service. This strategy makes offenderspay for their missteps but keeps prison beds freefor more violent and chronic lawbreakers. And, itmakes it more likely the violators will be able topay victim restitution, child support and taxes.
Kansas is among the states giving this approach anaggressive try. In 2006, Kansas faced bleak failurerates among offenders, with probation or parolerevocations accounting for two-thirds of prisonadmissions, and nine out of 10 of those revocationsresulting from technical violations. Meanwhile, thestate was bracing for a 22 percent increase in itsincarcerated population by 2016—and a bill ofnearly $500 million for new prison constructionand operations.
To gain a sense of public attitudes about suchsignificant new spending, legislators commissioneda survey, which revealed that most Kansansfavored combining some construction withprograms to help offenders on probation succeedand avoid reincarceration. At the recommendationof a bipartisan task force, the Kansas Legislatureoffered grants to community corrections agenciesto cut revocations for those on parole andprobation by 20 percent. Key elements of thestrategy include tracking and monitoringrevocations and creating guidelines to assist judgesand officers in revocation decisions.33
“By holding individuals who committed lessserious crimes accountable for completingtreatment and vocational programs, we will ensurewe have space in our prisons to keep violentoffenders behind bars,” said Gov. KathleenSebelius, a vocal supporter of her state’s direction.
AdjustingLength of Stay
The other key lever statescan pull to tame prisongrowth is adjusting thelength of time inmatesremain behind bars. In somestates with indeterminatesentencing, such as Texas,parole boards are takingpains to ensure their parolegrant rates are meeting theminimum level mandated bylaw. Even a small tweak—such as the 5 percentincrease in grants by theTexas Board of Pardons andParole between 2006 and 2007—can have anappreciable thinning effect on the prison population.
More commonly, states are opting to use “earnedtime,” or credits that shorten an inmate’s term, tocontrol the prison numbers. Typically, offendersare offered such credits if they completerehabilitation or education programs, demonstrategood behavior or meet some other benchmark. Inaddition to freeing up cell space, this strategy aidswardens and correctional officers by givinginmates an incentive to behave, and helps cutreoffense rates by increasing participation in risk-reducing programs.
Nevada is among the states enjoying benefits fromthis approach. With projections for dramatic prisongrowth over the coming decade, Nevada at thestart of 2007 faced a serious fiscal struggle thatthreatened spending on other key governmentservices. With public safety paramount, policymakers decided to get creative. First, the legislature
Public Safety Performance Project 19
“Community releaseprograms that are
conducted under strictguidelines and
conditions enhancepublic safety because
offenders who re-entersociety under parole
supervision are far lesslikely to re-offend thanthose who are released
without the benefit of asupervised release.”
CT Gov. Jodi Rell (R)Press release
January 27, 2008
One in 100: Behind Bars in America 200820
and executive branch agreed to expand earnedtime credits for prisoners, except sex offenders andthose convicted of violent crimes. In passing AB510, lawmakers increased the amount of good timean inmate could earn for good conduct andcompletion of education and treatment programs.To achieve an added population benefit, Nevadamade the law retroactive to prisoners sentenced aslong ago as 2000.
So far, the results in Nevada have fulfilledexpectations, and, after the bump upward in 2007,the prison population has begun a moderatedecline. A commission created to track impacts ofthe reforms has found no increases in keyindicators such as crime, arrests or court filings.
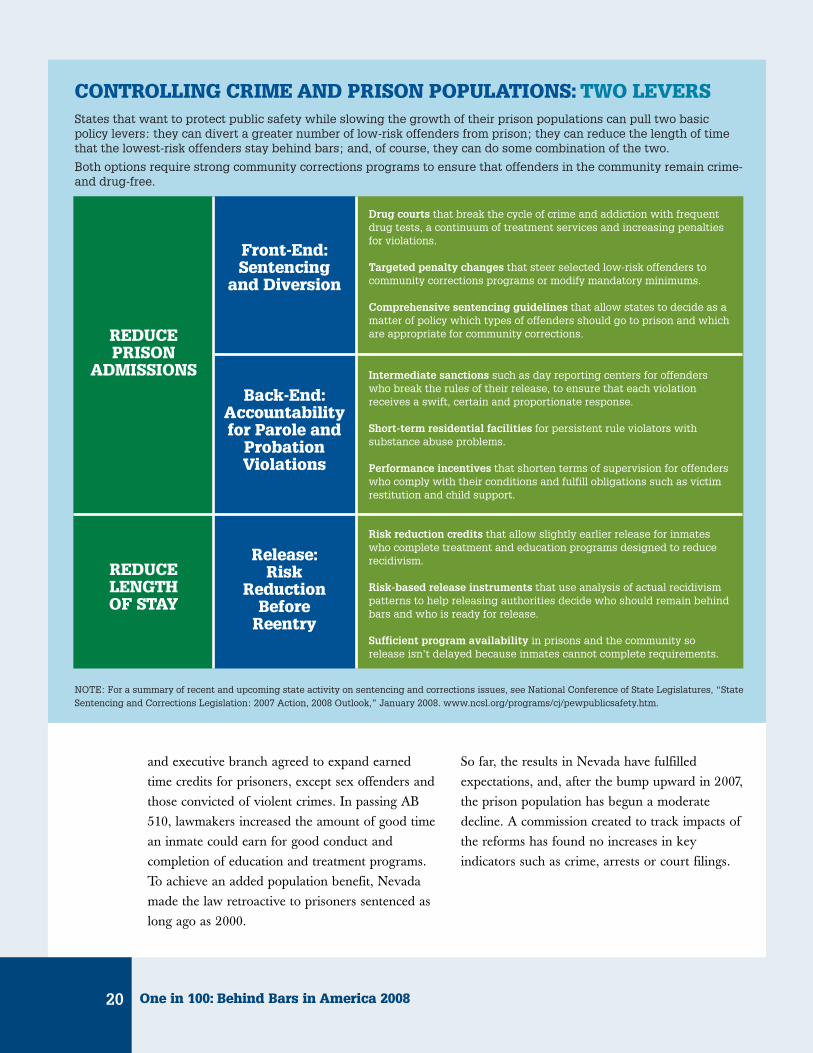
CONTROLLING CRIME AND PRISON POPULATIONS: TWO LEVERSStates that want to protect public safety while slowing the growth of their prison populations can pull two basic policy levers: they can divert a greater number of low-risk offenders from prison; they can reduce the length of time that the lowest-risk offenders stay behind bars; and, of course, they can do some combination of the two.
Both options require strong community corrections programs to ensure that offenders in the community remain crime- and drug-free.
NOTE: For a summary of recent and upcoming state activity on sentencing and corrections issues, see National Conference of State Legislatures, “State Sentencing and Corrections Legislation: 2007 Action, 2008 Outlook,” January 2008. www.ncsl.org/programs/cj/pewpublicsafety.htm.
REDUCEPRISON
ADMISSIONS
REDUCELENGTHOF STAY
Front-End:Sentencing
and Diversion
Back-End:Accountabilityfor Parole and
ProbationViolations
Release:Risk
ReductionBefore
Reentry
Drug courts that break the cycle of crime and addiction with frequent drug tests, a continuum of treatment services and increasing penalties for violations.
Targeted penalty changes that steer selected low-risk offenders to community corrections programs or modify mandatory minimums.
Comprehensive sentencing guidelines that allow states to decide as a matter of policy which types of offenders should go to prison and which are appropriate for community corrections.
Intermediate sanctions such as day reporting centers for offenders who break the rules of their release, to ensure that each violation receives a swift, certain and proportionate response.
Short-term residential facilities for persistent rule violators with substance abuse problems.
Performance incentives that shorten terms of supervision for offenders who comply with their conditions and fulfill obligations such as victim restitution and child support.
Risk reduction credits that allow slightly earlier release for inmates who complete treatment and education programs designed to reduce recidivism.
Risk-based release instruments that use analysis of actual recidivism patterns to help releasing authorities decide who should remain behind bars and who is ready for release.
Sufficient program availability in prisons and the community so release isn’t delayed because inmates cannot complete requirements.
A Final Word
As a nation, the United States has long anchored itspunishment policy in bricks and mortar. Thetangible feel of a jail or prison, with its surefireincapacitation of convicts, has been an unquestionedweapon of choice in our battle against crime. Recentstudies show, however, that a continual increase inour reliance on incarceration will pay decliningdividends in crime prevention. In short, experts say,expanding prisons will accomplish less and costmore than it has in the past.34
Meanwhile, the breathtaking rise in correctionalcosts is triggering alarm in statehouses around thenation. By inevitably reducing the amount of taxdollars that are available for other vital needs,relentless prison growth is drawing closer scrutinyfrom lawmakers and the public. In some states,that scrutiny has evolved into action, producingencouraging results both for public safety andpublic spending. These states are finding that bybroadening the mix of sanctions in theircorrectional tool box, they can save money andstill make lawbreakers pay.
The national inmate count marches onward andupward, almost exactly as it was projected to dolast year. And with one in 100 adults looking out atthis country from behind an expensive wall of bars,the potential of new approaches cannot be ignored.
Public Safety Performance Project 21
“Nebraska’s prison population isprojected to grow in the coming years,and the concept we’ve embraced throughcommunity corrections is that there arebetter solutions to this challenge than tosimply build another maximum-securityprison.”
NE Gov. Dave Heineman (R)Press releaseFebruary 12, 2007

1 Langan, Dr. Patrick A., and Dr. David J. Levin, Recidivism ofPrisoners Released in 1994, U.S. Department of Justice, Bureauof Justice Statistics (Washington, D.C.: June 2002)
2 International incarceration rates from International Centre forPrison Studies at King's College, London, “World PrisonBrief.” www.kcl.ac.uk/depsta/rel/icps/worldbrief/world_brief.html
3 State projections were reported in Public Safety, Public Spending:Forecasting America’s Prison Population, 2007-2011, Public SafetyPerformance Project, The Pew Charitable Trusts(Washington, D.C.: February 2007).
4 Sabol, Dr. William J., et al, Prison and Jail Inmates at Midyear2006. U.S. Department of Justice, Bureau of Justice Statistics(Washington, D.C.: June 2007) All incarceration rates forsubpopulations in this report are derived from this and otherBureau of Justice Statistics reports.
5 The number of offenders sentenced to prison for technicalviolations increased 7.1 percent in FY 2004-05, 4.3 percent inFY 2005-06, and 5.8 percent in FY 2006-07.
6 Workpapers of the Criminal Justice Estimating Conference,October 8, 2007. Tallahassee, FL: EDR.
7 Public Safety, Public Spending, p. ii. These cost estimates arecumulative, including operating and capital expendituresfrom 2007 to 2011.
8 Public Safety, Public Spending, p. 33.
9 Public Safety, Public Spending, p.22.
10 Office of California State Controller Steve Westly, CaliforniaDepartment of Corrections and Rehabilitation, Review Report:Healthcare Delivery System (Sacramento, CA: August, 2006).
11 Council of State Governments, Trends Alert, Information forState Decision-Makers, Corrections Health Care Costs, by ChadKinsella, January 2004.
12 Ibid.
13 Prison’s Deadliest Inmate, Hepatitis C, Escaping: Public-health Workers Warn of Looming Epidemic of ‘Silent Killer,’Associated Press (Vacaville, CA: March 14, 2007).
14 Fox, Rena K. et al, “Hepatitis C Virus Infection AmongPrisoners in the California State Correctional System,”Clinical Infectious Diseases (June 2005).
15 Anno, Jaye B., et al, Addressing the Needs of Elderly, ChronicallyIll, and Terminally Ill Inmates, U.S. Department of Justice,National Institute of Corrections, Criminal Justice Institute(Middleton, CT: February, 2004).
16 Turley, Jonathan, George Washington University LawSchool professor. Testimony before the House JudiciaryCommittee, Dec. 6, 2007.
17 Addressing the Needs of Elderly, Chronically Ill, and Terminally IllInmates
18 Ibid.
19 U.S. Census Bureau, State Government Employment andPayroll data: http://www.census.gov/govs/www/apesst.html.For more, see Appendix A-5.
20 Marley, Patrick, “Prison officers rack up overtime,”Milwaukee Journal Sentinel, December 12, 2007.
21 Chorneau, Tom, “$500 million in OT at state prisons,” SanFrancisco Chronicle, July 15, 2007
22 Thoennes, Dr. Nancy, Child Support Profile: MassachusettsIncarcerated and Paroled Parent, Center for Policy Research,(Denver, CO: May 2002).
23 Florida Department of Corrections, Restitution and OtherMonetary Obligations Collected from Offenders Under Supervision inFY 2004-05, available online athttp://www.dc.state.fl.us/oth/ccmyths.html.
24 National Association of State Budget Officers, "StateExpenditure Report FY 2006," December 2007.http://www.nasbo.org/Publications/PDFs/fy2006er.pdf
25 Ibid.
26 Schweinhart, L. J., Montie, J., Xiang, Z., Barnett, W. S.,Belfield, C. R., & Nores, M. (2005). Lifetime effects: TheHigh/Scope Perry Preschool study through age 40. (Monographs ofthe High/Scope Educational Research Foundation, 14).Ypsilanti, MI: High/Scope Press.
27 Prek Now, Votes Count, Legislative Action on Prek Fiscal Year 2008(Washington, D.C.: September 2007). www.preknow.org.
28 In the latest Gallup Poll, only 2 percent of Americans volun-teered “crime” as the most important problem facing thecountry. In March 1977, by contrast, 15 percent of Americanspolled by Gallup volunteered “crime” as the most importantproblem facing the country. Cited in Sam Roberts, “All CrimeIs Local In '08 Politics,” The New York Times, Sept. 16, 2007.
29 For more detail on Texas and the legislators who helpedadvance this legislation, see the following reports: Council ofState Governments Justice Center, Justice Reinvestment StateBrief: Texas, and Public Safety Performance Project, The PewCharitable Trusts, Changing Direction: A Bipartisan Team Paves aNew Path for Sentencing and Corrections in Texas.
30 Vera Institute of Justice, Managing State Prison Growth: KeyTrends in Sentencing Policy (New York, January 2008).
31 Prison and Jail Inmates at Midyear 2006
32 Ibid.
33 For more detail on Kansas and a national discussion of theissues surrounding parole violators, see the following reports:Council of State Governments Justice Center, JusticeReinvestment State Brief: Kansas, and Public Safety PerformanceProject, The Pew Charitable Trusts, When Offenders Break theRules: Smart Responses to Parole and Probation Violations.
34 Vera Institute of Justice, Reconsidering Incarceration: NewDirections for Reducing Crime, by Don Stemen (New York:January 2007).
Public Safety Performance Project 23
Endnotes
One in 100: Behind Bars in America 200824
This report estimates the number of prisonershoused in state and federal correctional facilities asof January 1, 2008. A separate estimate was madefor the number of persons in local jail facilities onthat date. In order to calculate the nationalincarceration rate, we also estimated the adultresident population.
The 2008 national incarceration rate in this report isnot comparable to the rates published for prior yearsby the U.S. Department of Justice, Bureau of JusticeStatistics (BJS), or to those issued last year by thePew Public Safety Performance Project. Thedifference occurs because this report uses the adultresident population to calculate the incarceration ratefor adults, while the BJS incarceration rates and theearlier Pew report are based on the total U.S.population, including those under age 18.
State and Federal PrisonPopulation Estimate
In making the state and federal prisonerpopulation estimate, we took a two-prongedapproach to obtain the count of inmates under thejurisdiction of each state’s Department ofCorrections (DOC) and the Federal Bureau ofPrisons (FBOP) on January 1, 2008.
The first phase was a two-page survey which theAssociation of State Correctional Administrators(ASCA) sent to each DOC and the FBOPrequesting its total jurisdictional count as well ascertain subpopulations (e.g., pretrial, sentenced,males and females, etc.) comprising the totaljurisdictional count. At the same time, the JFAInstitute sought to obtain each department’s totaljurisdictional count through a combination ofemails and phone calls to each DOC and searchesof the DOC websites for inmate populationstatistics. The objective was to ensure that throughtwo organizations and two methods we were ableto secure the most accurate count for each stateand the FBOP. We investigated and reconciled anydifferences in the total jurisdictional counts, oftenthrough follow-up emails or phone calls to the states.
For many DOCs, prisoners under their jurisdictionare housed not only in their own prison facilities,but also in facilities controlled by other agencies(i.e., local jails, other states’ prisons, federal prisons,and private prisons). To avoid double-counting, wespecified that the states’ responses should includethe inmates under a DOC’s jurisdiction regardlessof the inmates’ locations, and exclude any inmateshoused by a DOC who are not under that DOC’sjurisdiction. As a hypothetical example, Mississippiwould exclude inmates they are housing in theirprisons for Texas while Texas would include itsprisoners housed in Mississippi.
Unless otherwise noted, for the January 1, 2008inmate population count, we utilized the totaljurisdictional count that each state DOC provided
This Bureau of
Report Justice Statistics
Inmates/ Inmates/
Adult Population= Total Population=
Adult Incarceration Rate Incarceration Rate
Methodology Notes
on the ASCA survey. For the 2006 inmatepopulation count, we utilized the December 31,2006 jurisdictional prisoner count from Table 1 ofthe Bureau of Justice Statistics’ “Prisoners in 2006”report. Note that some states provided counts ondates other than January 1, 2008.
Many states provided their total jurisdictionalcounts before performing the data verificationprocess they would normally undertake beforepublishing their official counts. As a result, theinmate figures in this report may differ from totaljurisdictional counts subsequently published. Weexpect any such differences to be minor.
State-specific information about the source of thecounts and any additional explanations appear in“Jurisdictional Notes” following this section.
The inmate count does not include a significantnumber of inmates held in facilities other thanfederal and state prisons and local jails. It excludesthose in custody in territorial prisons, facilitiesadministered by U.S. Immigration and CustomsEnforcement, military facilities, jails in Indiancountry, and juvenile facilities. At yearend 2006,there were 126,230 inmates in custody in thesefacilities, three-quarters of them juveniles,according to the most recent count by the JusticeDepartment. However, the count does includeapproximately 8,500 juveniles in jails or prisons.
Local Jail PopulationEstimate
This estimate takes into account people who areincarcerated in local (county and city) jails.Typically these inmates are being held pendingtrial or have been sentenced to less than a year.
Since there are more than 3,000 local jails in theUnited States, it was not feasible to conduct acomplete national survey. Instead, we extrapolatedfrom the most recent national trends as reportedby BJS, which does conduct an annual surveyusing a sophisticated sampling methodology.
Table 1 shows the BJS jail population counts fromits recent surveys. There has been considerablefluctuation in the rate of growth over the past sixyears. The average rate of growth has been 3.56percent, but the growth rate slowed considerablyin 2006.
To help inform our estimate, we surveyed some ofthe nation’s largest jail systems during December2007. Together these jails represent 12 percent ofthe nation’s jail population. Here we see significantfluctuation, with an overall increase of only 1percent since midyear 2004.
Since the BJS surveys represent the populations asof June 30, and given that jail populations havesevere seasonal fluctuations, the December 2007jail counts are not directly comparable to the June30 BJS counts. Still, those counts offer someevidence that jail growth may indeed have slowed.So using the average rate of growth since 2000may well over-estimate the actual jail population.
For these reasons we decided to use the 2006growth rate of 2.47 percent. An estimate of theJanuary 1, 2008 population must cover the 18-month period beginning with the last BJS report,from mid-year 2006. So we multiplied the 2.47percent annual rate by a factor of 1.5 whichproduces an 18-month growth rate of 3.7 percent.This produced an estimated January 1, 2008 jailpopulation of 794,417.
Public Safety Performance Project 25
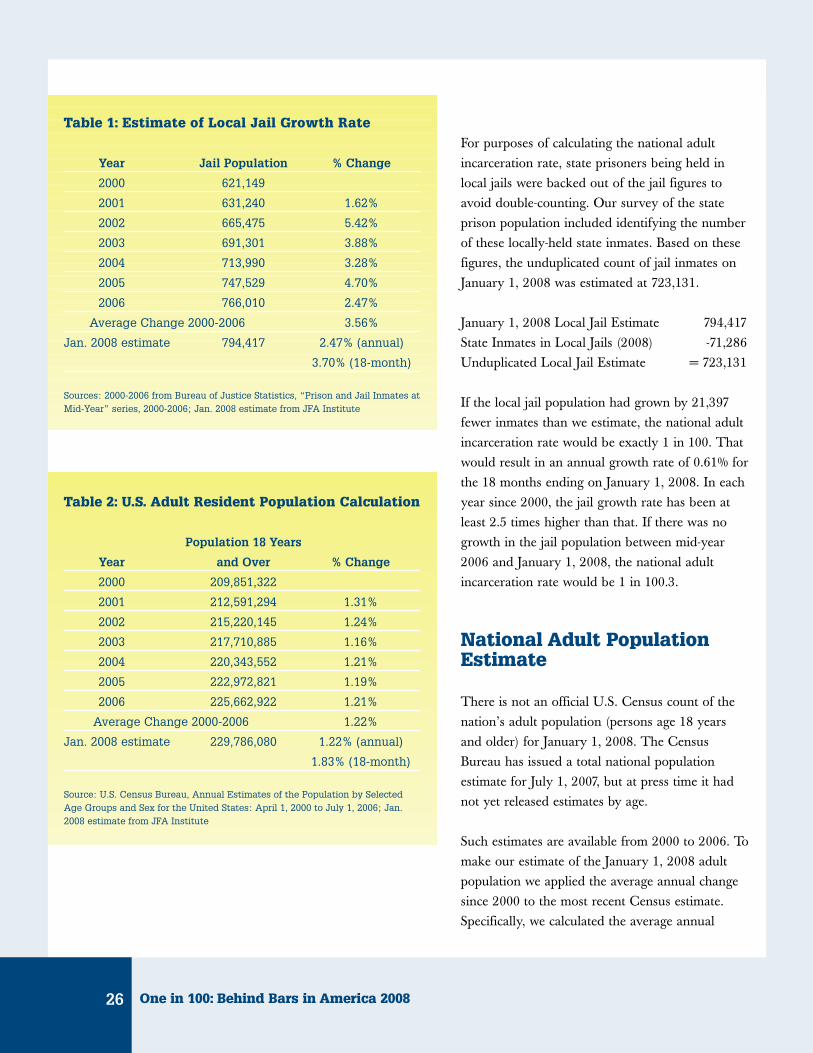
For purposes of calculating the national adultincarceration rate, state prisoners being held inlocal jails were backed out of the jail figures toavoid double-counting. Our survey of the stateprison population included identifying the numberof these locally-held state inmates. Based on thesefigures, the unduplicated count of jail inmates onJanuary 1, 2008 was estimated at 723,131.
January 1, 2008 Local Jail Estimate 794,417State Inmates in Local Jails (2008) -71,286Unduplicated Local Jail Estimate = 723,131
If the local jail population had grown by 21,397fewer inmates than we estimate, the national adultincarceration rate would be exactly 1 in 100. Thatwould result in an annual growth rate of 0.61% forthe 18 months ending on January 1, 2008. In eachyear since 2000, the jail growth rate has been atleast 2.5 times higher than that. If there was nogrowth in the jail population between mid-year2006 and January 1, 2008, the national adultincarceration rate would be 1 in 100.3.
National Adult PopulationEstimate
There is not an official U.S. Census count of thenation’s adult population (persons age 18 yearsand older) for January 1, 2008. The CensusBureau has issued a total national populationestimate for July 1, 2007, but at press time it hadnot yet released estimates by age.
Such estimates are available from 2000 to 2006. Tomake our estimate of the January 1, 2008 adultpopulation we applied the average annual changesince 2000 to the most recent Census estimate.Specifically, we calculated the average annual
One in 100: Behind Bars in America 200826
Table 1: Estimate of Local Jail Growth Rate
Year Jail Population % Change
2000 621,149
2001 631,240 1.62%
2002 665,475 5.42%
2003 691,301 3.88%
2004 713,990 3.28%
2005 747,529 4.70%
2006 766,010 2.47%
Average Change 2000-2006 3.56%
Jan. 2008 estimate 794,417 2.47% (annual)
3.70% (18-month)
Sources: 2000-2006 from Bureau of Justice Statistics, “Prison and Jail Inmates atMid-Year” series, 2000-2006; Jan. 2008 estimate from JFA Institute
Table 2: U.S. Adult Resident Population Calculation
Population 18 Years
Year and Over % Change
2000 209,851,322
2001 212,591,294 1.31%
2002 215,220,145 1.24%
2003 217,710,885 1.16%
2004 220,343,552 1.21%
2005 222,972,821 1.19%
2006 225,662,922 1.21%
Average Change 2000-2006 1.22%
Jan. 2008 estimate 229,786,080 1.22% (annual)
1.83% (18-month)
Source: U.S. Census Bureau, Annual Estimates of the Population by SelectedAge Groups and Sex for the United States: April 1, 2000 to July 1, 2006; Jan.2008 estimate from JFA Institute
Public Safety Performance Project 27
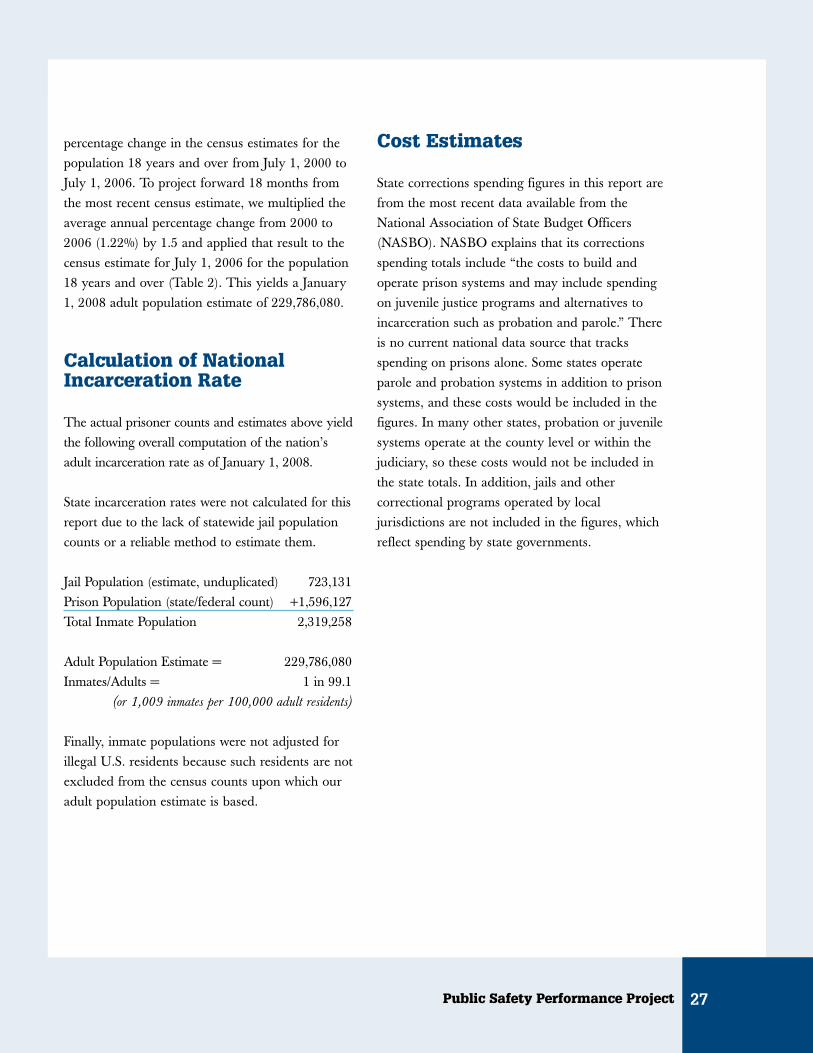
percentage change in the census estimates for thepopulation 18 years and over from July 1, 2000 toJuly 1, 2006. To project forward 18 months fromthe most recent census estimate, we multiplied theaverage annual percentage change from 2000 to2006 (1.22%) by 1.5 and applied that result to thecensus estimate for July 1, 2006 for the population18 years and over (Table 2). This yields a January1, 2008 adult population estimate of 229,786,080.
Calculation of NationalIncarceration Rate
The actual prisoner counts and estimates above yieldthe following overall computation of the nation’sadult incarceration rate as of January 1, 2008.
State incarceration rates were not calculated for thisreport due to the lack of statewide jail populationcounts or a reliable method to estimate them.
Jail Population (estimate, unduplicated) 723,131Prison Population (state/federal count) +1,596,127Total Inmate Population 2,319,258
Adult Population Estimate = 229,786,080Inmates/Adults = 1 in 99.1
(or 1,009 inmates per 100,000 adult residents)
Finally, inmate populations were not adjusted forillegal U.S. residents because such residents are notexcluded from the census counts upon which ouradult population estimate is based.
Cost Estimates
State corrections spending figures in this report arefrom the most recent data available from theNational Association of State Budget Officers(NASBO). NASBO explains that its correctionsspending totals include “the costs to build andoperate prison systems and may include spendingon juvenile justice programs and alternatives toincarceration such as probation and parole.” Thereis no current national data source that tracksspending on prisons alone. Some states operateparole and probation systems in addition to prisonsystems, and these costs would be included in thefigures. In many other states, probation or juvenilesystems operate at the county level or within thejudiciary, so these costs would not be included inthe state totals. In addition, jails and othercorrectional programs operated by localjurisdictions are not included in the figures, whichreflect spending by state governments.
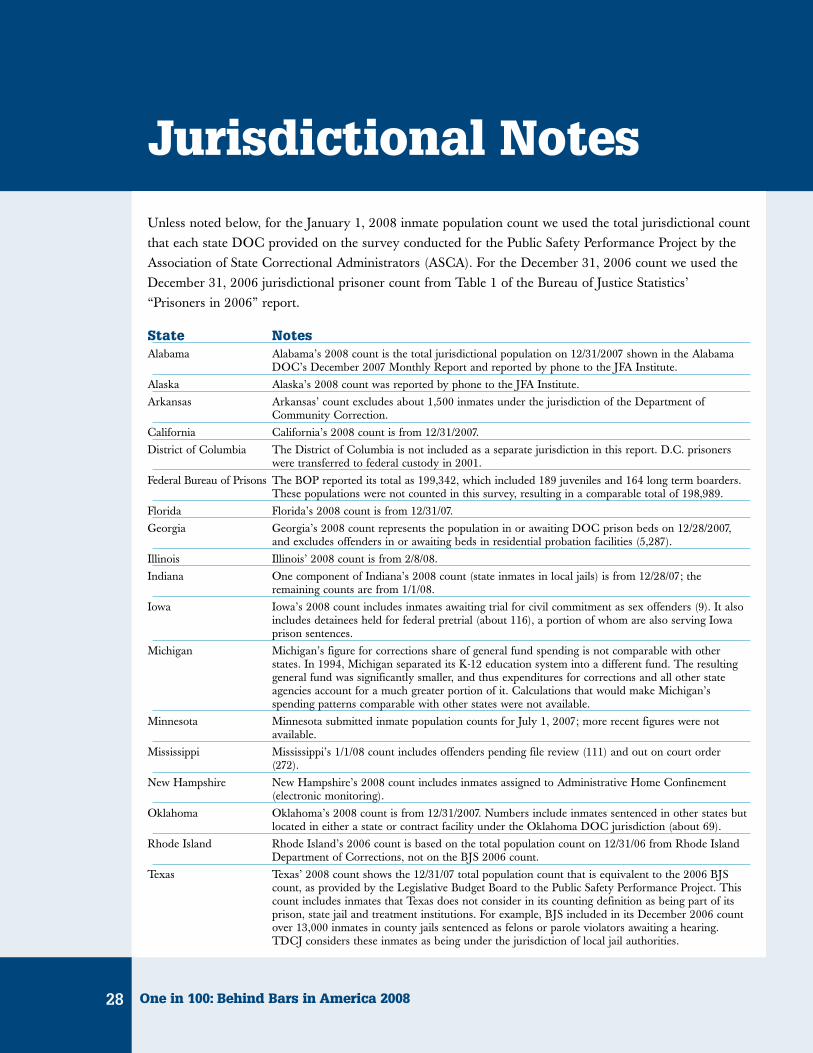
Jurisdictional Notes
Unless noted below, for the January 1, 2008 inmate population count we used the total jurisdictional countthat each state DOC provided on the survey conducted for the Public Safety Performance Project by theAssociation of State Correctional Administrators (ASCA). For the December 31, 2006 count we used theDecember 31, 2006 jurisdictional prisoner count from Table 1 of the Bureau of Justice Statistics’“Prisoners in 2006” report.
State NotesAlabama Alabama’s 2008 count is the total jurisdictional population on 12/31/2007 shown in the Alabama
DOC’s December 2007 Monthly Report and reported by phone to the JFA Institute.
Alaska Alaska’s 2008 count was reported by phone to the JFA Institute.
Arkansas Arkansas’ count excludes about 1,500 inmates under the jurisdiction of the Department ofCommunity Correction.
California California’s 2008 count is from 12/31/2007.
District of Columbia The District of Columbia is not included as a separate jurisdiction in this report. D.C. prisonerswere transferred to federal custody in 2001.
Federal Bureau of Prisons The BOP reported its total as 199,342, which included 189 juveniles and 164 long term boarders.These populations were not counted in this survey, resulting in a comparable total of 198,989.
Florida Florida’s 2008 count is from 12/31/07.
Georgia Georgia’s 2008 count represents the population in or awaiting DOC prison beds on 12/28/2007,and excludes offenders in or awaiting beds in residential probation facilities (5,287).
Illinois Illinois’ 2008 count is from 2/8/08.
Indiana One component of Indiana’s 2008 count (state inmates in local jails) is from 12/28/07; theremaining counts are from 1/1/08.
Iowa Iowa’s 2008 count includes inmates awaiting trial for civil commitment as sex offenders (9). It alsoincludes detainees held for federal pretrial (about 116), a portion of whom are also serving Iowaprison sentences.
Michigan Michigan’s figure for corrections share of general fund spending is not comparable with otherstates. In 1994, Michigan separated its K-12 education system into a different fund. The resultinggeneral fund was significantly smaller, and thus expenditures for corrections and all other stateagencies account for a much greater portion of it. Calculations that would make Michigan’sspending patterns comparable with other states were not available.
Minnesota Minnesota submitted inmate population counts for July 1, 2007; more recent figures were notavailable.
Mississippi Mississippi’s 1/1/08 count includes offenders pending file review (111) and out on court order(272).
New Hampshire New Hampshire’s 2008 count includes inmates assigned to Administrative Home Confinement(electronic monitoring).
Oklahoma Oklahoma’s 2008 count is from 12/31/2007. Numbers include inmates sentenced in other states butlocated in either a state or contract facility under the Oklahoma DOC jurisdiction (about 69).
Rhode Island Rhode Island’s 2006 count is based on the total population count on 12/31/06 from Rhode IslandDepartment of Corrections, not on the BJS 2006 count.
Texas Texas’ 2008 count shows the 12/31/07 total population count that is equivalent to the 2006 BJScount, as provided by the Legislative Budget Board to the Public Safety Performance Project. Thiscount includes inmates that Texas does not consider in its counting definition as being part of itsprison, state jail and treatment institutions. For example, BJS included in its December 2006 countover 13,000 inmates in county jails sentenced as felons or parole violators awaiting a hearing.TDCJ considers these inmates as being under the jurisdiction of local jail authorities.
One in 100: Behind Bars in America 200828
Public Safety Performance Project 29
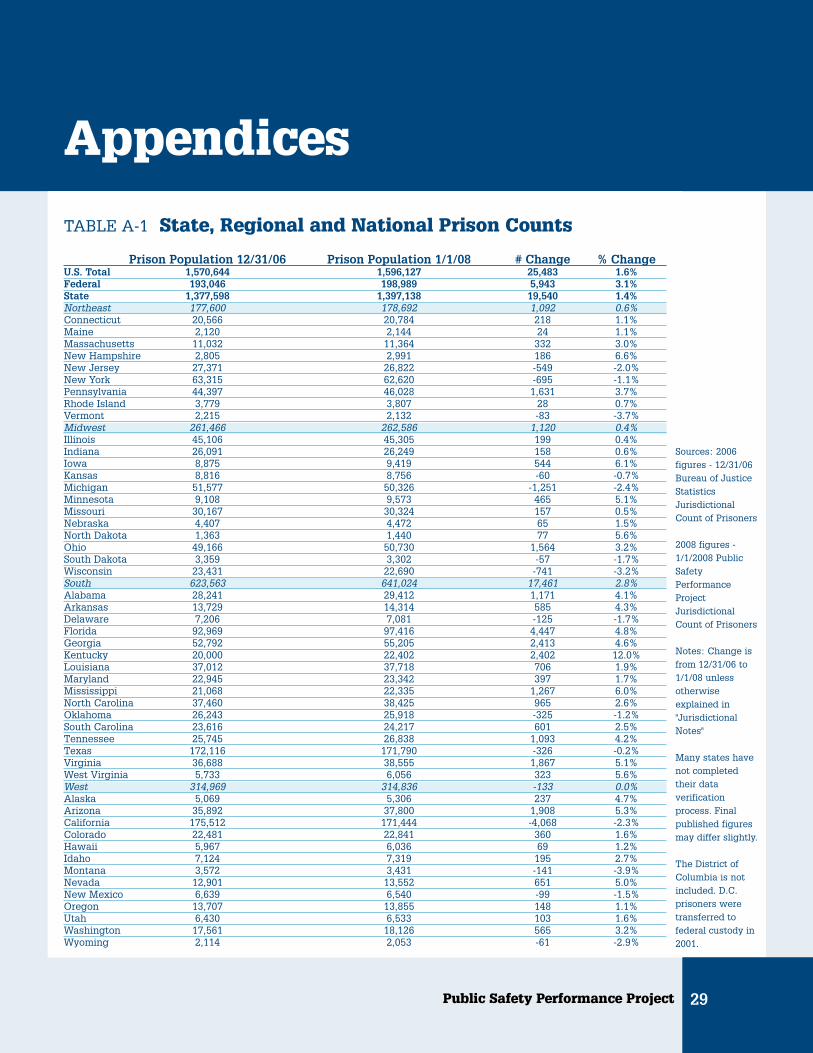
Appendices
TABLE A-1 State, Regional and National Prison Counts
Prison Population 12/31/06 Prison Population 1/1/08 # Change % ChangeU.S. Total 1,570,644 1,596,127 25,483 1.6%Federal 193,046 198,989 5,943 3.1%State 1,377,598 1,397,138 19,540 1.4%Northeast 177,600 178,692 1,092 0.6%Connecticut 20,566 20,784 218 1.1%Maine 2,120 2,144 24 1.1%Massachusetts 11,032 11,364 332 3.0%New Hampshire 2,805 2,991 186 6.6%New Jersey 27,371 26,822 -549 -2.0%New York 63,315 62,620 -695 -1.1%Pennsylvania 44,397 46,028 1,631 3.7%Rhode Island 3,779 3,807 28 0.7%Vermont 2,215 2,132 -83 -3.7%Midwest 261,466 262,586 1,120 0.4%Illinois 45,106 45,305 199 0.4%Indiana 26,091 26,249 158 0.6%Iowa 8,875 9,419 544 6.1%Kansas 8,816 8,756 -60 -0.7%Michigan 51,577 50,326 -1,251 -2.4%Minnesota 9,108 9,573 465 5.1%Missouri 30,167 30,324 157 0.5%Nebraska 4,407 4,472 65 1.5%North Dakota 1,363 1,440 77 5.6%Ohio 49,166 50,730 1,564 3.2%South Dakota 3,359 3,302 -57 -1.7%Wisconsin 23,431 22,690 -741 -3.2%South 623,563 641,024 17,461 2.8%Alabama 28,241 29,412 1,171 4.1%Arkansas 13,729 14,314 585 4.3%Delaware 7,206 7,081 -125 -1.7%Florida 92,969 97,416 4,447 4.8%Georgia 52,792 55,205 2,413 4.6%Kentucky 20,000 22,402 2,402 12.0%Louisiana 37,012 37,718 706 1.9%Maryland 22,945 23,342 397 1.7%Mississippi 21,068 22,335 1,267 6.0%North Carolina 37,460 38,425 965 2.6%Oklahoma 26,243 25,918 -325 -1.2%South Carolina 23,616 24,217 601 2.5%Tennessee 25,745 26,838 1,093 4.2%Texas 172,116 171,790 -326 -0.2%Virginia 36,688 38,555 1,867 5.1%West Virginia 5,733 6,056 323 5.6%West 314,969 314,836 -133 0.0%Alaska 5,069 5,306 237 4.7%Arizona 35,892 37,800 1,908 5.3%California 175,512 171,444 -4,068 -2.3%Colorado 22,481 22,841 360 1.6%Hawaii 5,967 6,036 69 1.2%Idaho 7,124 7,319 195 2.7%Montana 3,572 3,431 -141 -3.9%Nevada 12,901 13,552 651 5.0%New Mexico 6,639 6,540 -99 -1.5%Oregon 13,707 13,855 148 1.1%Utah 6,430 6,533 103 1.6%Washington 17,561 18,126 565 3.2%Wyoming 2,114 2,053 -61 -2.9%
Sources: 2006figures - 12/31/06Bureau of JusticeStatisticsJurisdictionalCount of Prisoners
2008 figures -1/1/2008 PublicSafetyPerformanceProjectJurisdictional Count of Prisoners
Notes: Change isfrom 12/31/06 to1/1/08 unlessotherwiseexplained in"JurisdictionalNotes"
Many states havenot completedtheir dataverificationprocess. Finalpublished figuresmay differ slightly.
The District ofColumbia is notincluded. D.C.prisoners weretransferred tofederal custody in2001.
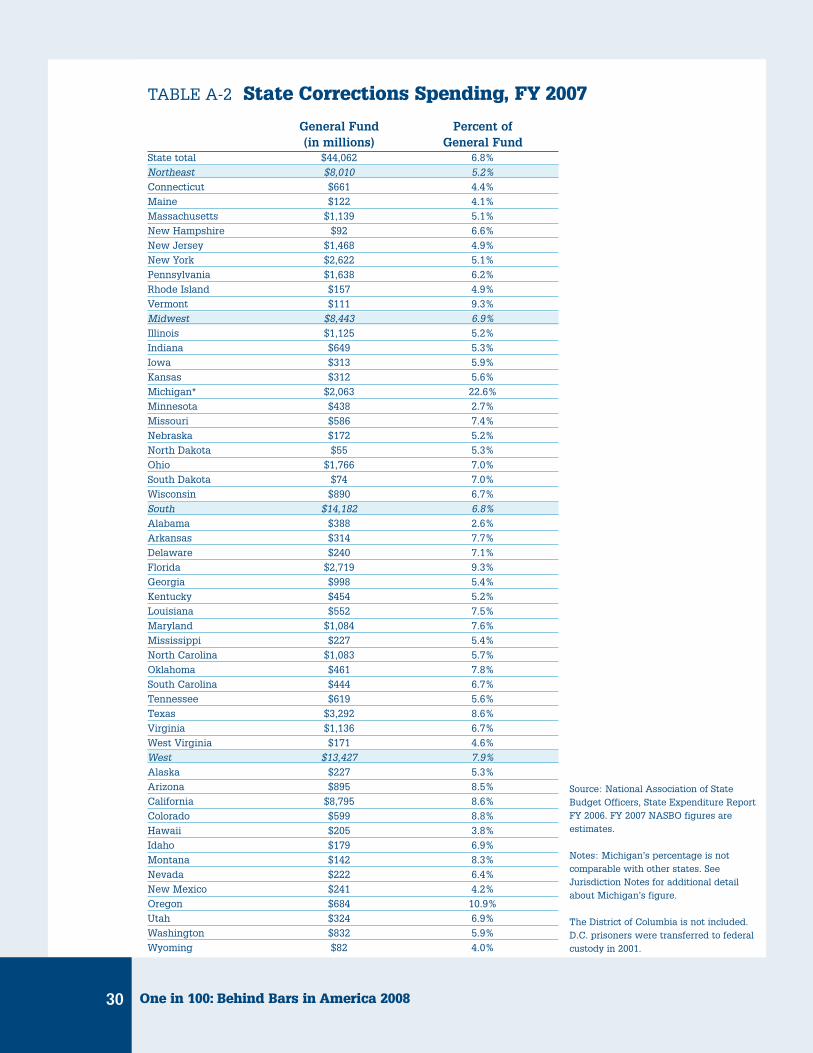
One in 100: Behind Bars in America 200830
TABLE A-2 State Corrections Spending, FY 2007
General Fund Percent of(in millions) General Fund
State total $44,062 6.8%
Northeast $8,010 5.2%
Connecticut $661 4.4%
Maine $122 4.1%
Massachusetts $1,139 5.1%
New Hampshire $92 6.6%
New Jersey $1,468 4.9%
New York $2,622 5.1%
Pennsylvania $1,638 6.2%
Rhode Island $157 4.9%
Vermont $111 9.3%
Midwest $8,443 6.9%
Illinois $1,125 5.2%
Indiana $649 5.3%
Iowa $313 5.9%
Kansas $312 5.6%
Michigan* $2,063 22.6%
Minnesota $438 2.7%
Missouri $586 7.4%
Nebraska $172 5.2%
North Dakota $55 5.3%
Ohio $1,766 7.0%
South Dakota $74 7.0%
Wisconsin $890 6.7%
South $14,182 6.8%
Alabama $388 2.6%
Arkansas $314 7.7%
Delaware $240 7.1%
Florida $2,719 9.3%
Georgia $998 5.4%
Kentucky $454 5.2%
Louisiana $552 7.5%
Maryland $1,084 7.6%
Mississippi $227 5.4%
North Carolina $1,083 5.7%
Oklahoma $461 7.8%
South Carolina $444 6.7%
Tennessee $619 5.6%
Texas $3,292 8.6%
Virginia $1,136 6.7%
West Virginia $171 4.6%
West $13,427 7.9%
Alaska $227 5.3%
Arizona $895 8.5%
California $8,795 8.6%
Colorado $599 8.8%
Hawaii $205 3.8%
Idaho $179 6.9%
Montana $142 8.3%
Nevada $222 6.4%
New Mexico $241 4.2%
Oregon $684 10.9%
Utah $324 6.9%
Washington $832 5.9%
Wyoming $82 4.0%
Source: National Association of StateBudget Officers, State Expenditure ReportFY 2006. FY 2007 NASBO figures areestimates.
Notes: Michigan’s percentage is notcomparable with other states. SeeJurisdiction Notes for additional detailabout Michigan’s figure.
The District of Columbia is not included.D.C. prisoners were transferred to federalcustody in 2001.
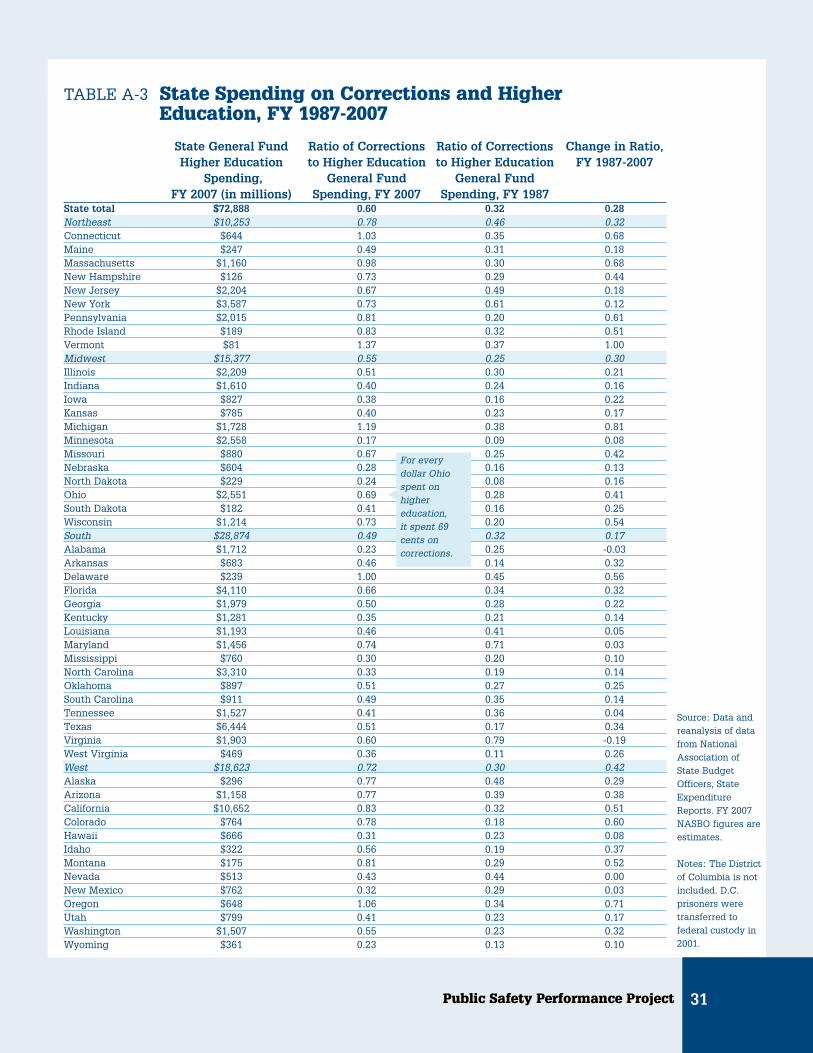
Public Safety Performance Project 31
TABLE A-3 State Spending on Corrections and HigherEducation, FY 1987-2007
State General Fund Ratio of Corrections Ratio of Corrections Change in Ratio,Higher Education to Higher Education to Higher Education FY 1987-2007
Spending, General Fund General FundFY 2007 (in millions) Spending, FY 2007 Spending, FY 1987
State total $72,888 0.60 0.32 0.28Northeast $10,253 0.78 0.46 0.32Connecticut $644 1.03 0.35 0.68Maine $247 0.49 0.31 0.18Massachusetts $1,160 0.98 0.30 0.68New Hampshire $126 0.73 0.29 0.44New Jersey $2,204 0.67 0.49 0.18New York $3,587 0.73 0.61 0.12Pennsylvania $2,015 0.81 0.20 0.61Rhode Island $189 0.83 0.32 0.51Vermont $81 1.37 0.37 1.00Midwest $15,377 0.55 0.25 0.30Illinois $2,209 0.51 0.30 0.21Indiana $1,610 0.40 0.24 0.16Iowa $827 0.38 0.16 0.22Kansas $785 0.40 0.23 0.17Michigan $1,728 1.19 0.38 0.81Minnesota $2,558 0.17 0.09 0.08Missouri $880 0.67 0.25 0.42Nebraska $604 0.28 0.16 0.13North Dakota $229 0.24 0.08 0.16Ohio $2,551 0.69 0.28 0.41South Dakota $182 0.41 0.16 0.25Wisconsin $1,214 0.73 0.20 0.54South $28,874 0.49 0.32 0.17Alabama $1,712 0.23 0.25 -0.03Arkansas $683 0.46 0.14 0.32Delaware $239 1.00 0.45 0.56Florida $4,110 0.66 0.34 0.32Georgia $1,979 0.50 0.28 0.22Kentucky $1,281 0.35 0.21 0.14Louisiana $1,193 0.46 0.41 0.05Maryland $1,456 0.74 0.71 0.03Mississippi $760 0.30 0.20 0.10North Carolina $3,310 0.33 0.19 0.14Oklahoma $897 0.51 0.27 0.25South Carolina $911 0.49 0.35 0.14Tennessee $1,527 0.41 0.36 0.04Texas $6,444 0.51 0.17 0.34Virginia $1,903 0.60 0.79 -0.19West Virginia $469 0.36 0.11 0.26West $18,623 0.72 0.30 0.42Alaska $296 0.77 0.48 0.29Arizona $1,158 0.77 0.39 0.38California $10,652 0.83 0.32 0.51Colorado $764 0.78 0.18 0.60Hawaii $666 0.31 0.23 0.08Idaho $322 0.56 0.19 0.37Montana $175 0.81 0.29 0.52Nevada $513 0.43 0.44 0.00New Mexico $762 0.32 0.29 0.03Oregon $648 1.06 0.34 0.71Utah $799 0.41 0.23 0.17Washington $1,507 0.55 0.23 0.32Wyoming $361 0.23 0.13 0.10
Source: Data andreanalysis of datafrom NationalAssociation ofState BudgetOfficers, StateExpenditureReports. FY 2007NASBO figures areestimates.
Notes: The Districtof Columbia is notincluded. D.C.prisoners weretransferred tofederal custody in2001.
For everydollar Ohiospent onhighereducation, it spent 69cents oncorrections.
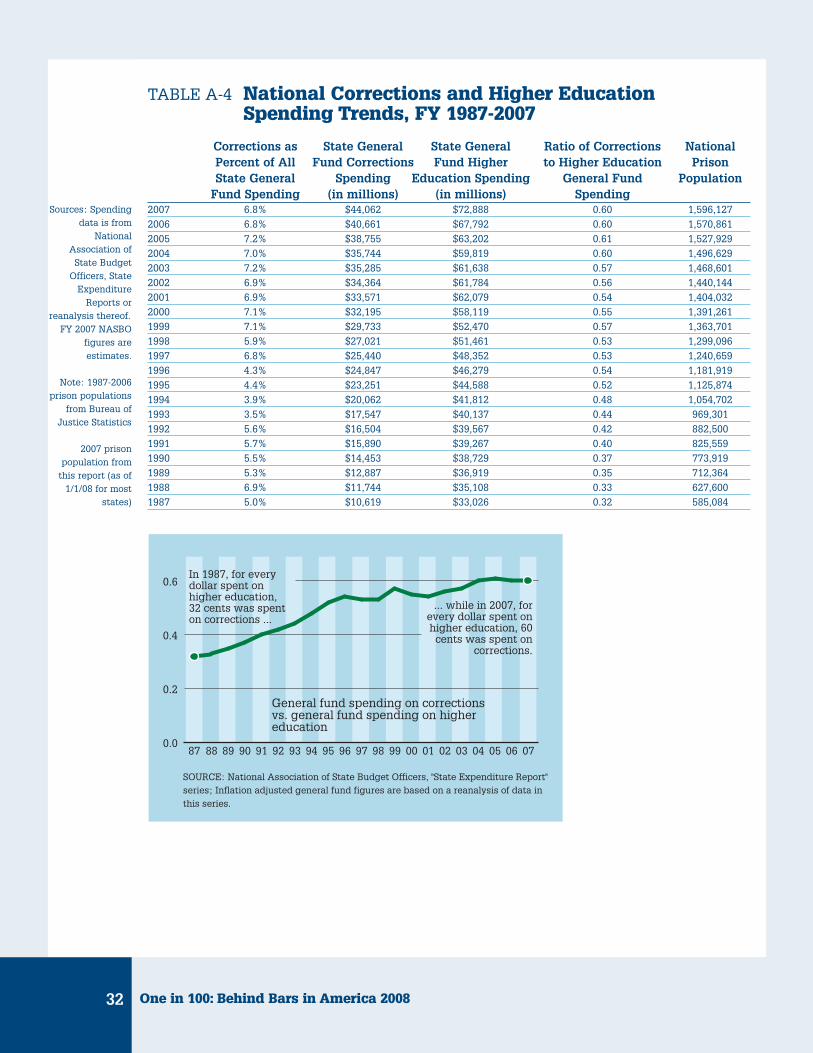
TABLE A-4 National Corrections and Higher EducationSpending Trends, FY 1987-2007
Corrections as State General State General Ratio of Corrections NationalPercent of All Fund Corrections Fund Higher to Higher Education PrisonState General Spending Education Spending General Fund Population
Fund Spending (in millions) (in millions) Spending2007 6.8% $44,062 $72,888 0.60 1,596,127
2006 6.8% $40,661 $67,792 0.60 1,570,861
2005 7.2% $38,755 $63,202 0.61 1,527,929
2004 7.0% $35,744 $59,819 0.60 1,496,629
2003 7.2% $35,285 $61,638 0.57 1,468,601
2002 6.9% $34,364 $61,784 0.56 1,440,144
2001 6.9% $33,571 $62,079 0.54 1,404,032
2000 7.1% $32,195 $58,119 0.55 1,391,261
1999 7.1% $29,733 $52,470 0.57 1,363,701
1998 5.9% $27,021 $51,461 0.53 1,299,096
1997 6.8% $25,440 $48,352 0.53 1,240,659
1996 4.3% $24,847 $46,279 0.54 1,181,919
1995 4.4% $23,251 $44,588 0.52 1,125,874
1994 3.9% $20,062 $41,812 0.48 1,054,702
1993 3.5% $17,547 $40,137 0.44 969,301
1992 5.6% $16,504 $39,567 0.42 882,500
1991 5.7% $15,890 $39,267 0.40 825,559
1990 5.5% $14,453 $38,729 0.37 773,919
1989 5.3% $12,887 $36,919 0.35 712,364
1988 6.9% $11,744 $35,108 0.33 627,600
1987 5.0% $10,619 $33,026 0.32 585,084
SOURCE: National Association of State Budget Officers, "State Expenditure Report" series; Inflation adjusted general fund figures are based on a reanalysis of data in this series.
0.0
0.2
0.4
0.6
070605040302010099989796959493929190898887
In 1987, for every dollar spent on higher education, 32 cents was spent on corrections ...
General fund spending on corrections vs. general fund spending on higher education
... while in 2007, for every dollar spent on higher education, 60 cents was spent on
corrections.
Sources: Spendingdata is from
NationalAssociation of
State BudgetOfficers, State
ExpenditureReports or
reanalysis thereof.FY 2007 NASBO
figures areestimates.
Note: 1987-2006prison populations
from Bureau ofJustice Statistics
2007 prisonpopulation from
this report (as of1/1/08 for most
states)
One in 100: Behind Bars in America 200832
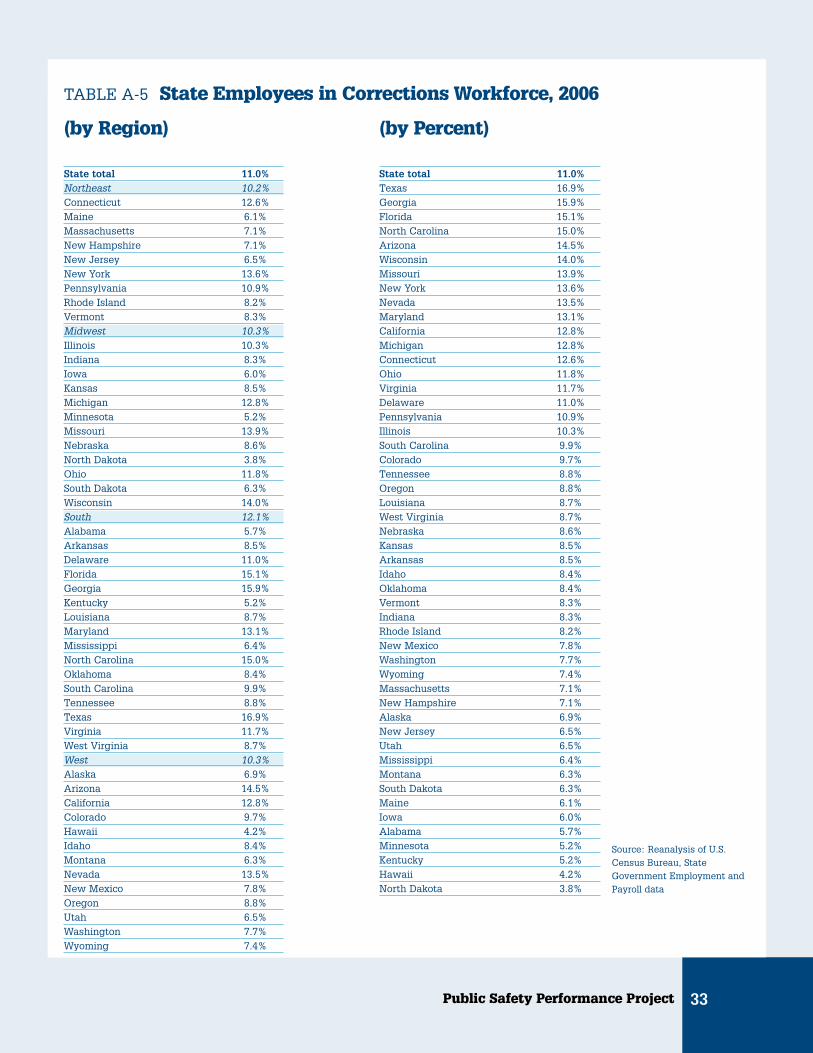
Public Safety Performance Project 33
TABLE A-5 State Employees in Corrections Workforce, 2006
(by Region)
State total 11.0%Northeast 10.2%Connecticut 12.6%Maine 6.1%Massachusetts 7.1%New Hampshire 7.1%New Jersey 6.5%New York 13.6%Pennsylvania 10.9%Rhode Island 8.2%Vermont 8.3%Midwest 10.3%Illinois 10.3%Indiana 8.3%Iowa 6.0%Kansas 8.5%Michigan 12.8%Minnesota 5.2%Missouri 13.9%Nebraska 8.6%North Dakota 3.8%Ohio 11.8%South Dakota 6.3%Wisconsin 14.0%South 12.1%Alabama 5.7%Arkansas 8.5%Delaware 11.0%Florida 15.1%Georgia 15.9%Kentucky 5.2%Louisiana 8.7%Maryland 13.1%Mississippi 6.4%North Carolina 15.0%Oklahoma 8.4%South Carolina 9.9%Tennessee 8.8%Texas 16.9%Virginia 11.7%West Virginia 8.7%West 10.3%Alaska 6.9%Arizona 14.5%California 12.8%Colorado 9.7%Hawaii 4.2%Idaho 8.4%Montana 6.3%Nevada 13.5%New Mexico 7.8%Oregon 8.8%Utah 6.5%Washington 7.7%Wyoming 7.4%
(by Percent)
State total 11.0%Texas 16.9%Georgia 15.9%Florida 15.1%North Carolina 15.0%Arizona 14.5%Wisconsin 14.0%Missouri 13.9%New York 13.6%Nevada 13.5%Maryland 13.1%California 12.8%Michigan 12.8%Connecticut 12.6%Ohio 11.8%Virginia 11.7%Delaware 11.0%Pennsylvania 10.9%Illinois 10.3%South Carolina 9.9%Colorado 9.7%Tennessee 8.8%Oregon 8.8%Louisiana 8.7%West Virginia 8.7%Nebraska 8.6%Kansas 8.5%Arkansas 8.5%Idaho 8.4%Oklahoma 8.4%Vermont 8.3%Indiana 8.3%Rhode Island 8.2%New Mexico 7.8%Washington 7.7%Wyoming 7.4%Massachusetts 7.1%New Hampshire 7.1%Alaska 6.9%New Jersey 6.5%Utah 6.5%Mississippi 6.4%Montana 6.3%South Dakota 6.3%Maine 6.1%Iowa 6.0%Alabama 5.7%Minnesota 5.2%Kentucky 5.2%Hawaii 4.2%North Dakota 3.8%
Source: Reanalysis of U.S.Census Bureau, StateGovernment Employment andPayroll data
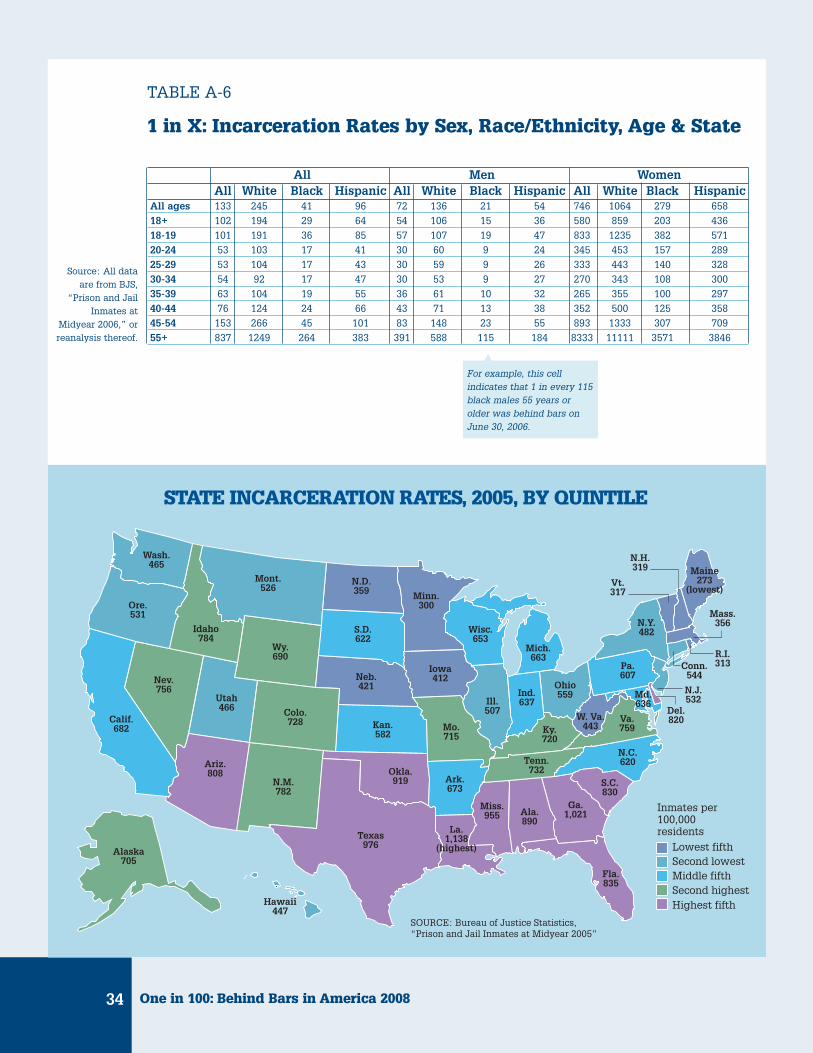
One in 100: Behind Bars in America 200834
TABLE A-6
1 in X: Incarceration Rates by Sex, Race/Ethnicity, Age & State
All Men WomenAll White Black Hispanic All White Black Hispanic All White Black Hispanic
All ages 133 245 41 96 72 136 21 54 746 1064 279 658
18+ 102 194 29 64 54 106 15 36 580 859 203 436
18-19 101 191 36 85 57 107 19 47 833 1235 382 571
20-24 53 103 17 41 30 60 9 24 345 453 157 289
25-29 53 104 17 43 30 59 9 26 333 443 140 328
30-34 54 92 17 47 30 53 9 27 270 343 108 300
35-39 63 104 19 55 36 61 10 32 265 355 100 297
40-44 76 124 24 66 43 71 13 38 352 500 125 358
45-54 153 266 45 101 83 148 23 55 893 1333 307 709
55+ 837 1249 264 383 391 588 115 184 8333 11111 3571 3846
Source: All dataare from BJS,
“Prison and JailInmates at
Midyear 2006,” orreanalysis thereof.
Inmates per 100,000 residents
Lowest fifthSecond lowestMiddle fifthSecond highestHighest fifth
Ind.637
N.Y.482Wisc.
653S.D.622
Utah466
Ore.531
N.C.620
Ga.1,021
Fla.835
Tenn.732
W. Va.443
N.H.319
R.I.313
Mass.356
Conn.544
N.J.532
Del.820
Pa.607
Texas976
Iowa412Neb.
421
Wy.690
Idaho784
Calif.682
Ariz.808
Minn.300
Maine273
(lowest)
Md.636
Va.759
Ohio559
Mich.663
N.D.359
Mont.526
S.C.830
Ky.720
Miss.955
Colo.728
Alaska705
Hawaii447
Nev.756
Wash.465
Ala.890
Ark.673
N.M.782
Mo.715
Ill.507
La.1,138
(highest)
Okla.919
Kan.582
Vt.317
SOURCE: Bureau of Justice Statistics,“Prison and Jail Inmates at Midyear 2005”
STATE INCARCERATION RATES, 2005, BY QUINTILE
For example, this cellindicates that 1 in every 115black males 55 years orolder was behind bars onJune 30, 2006.
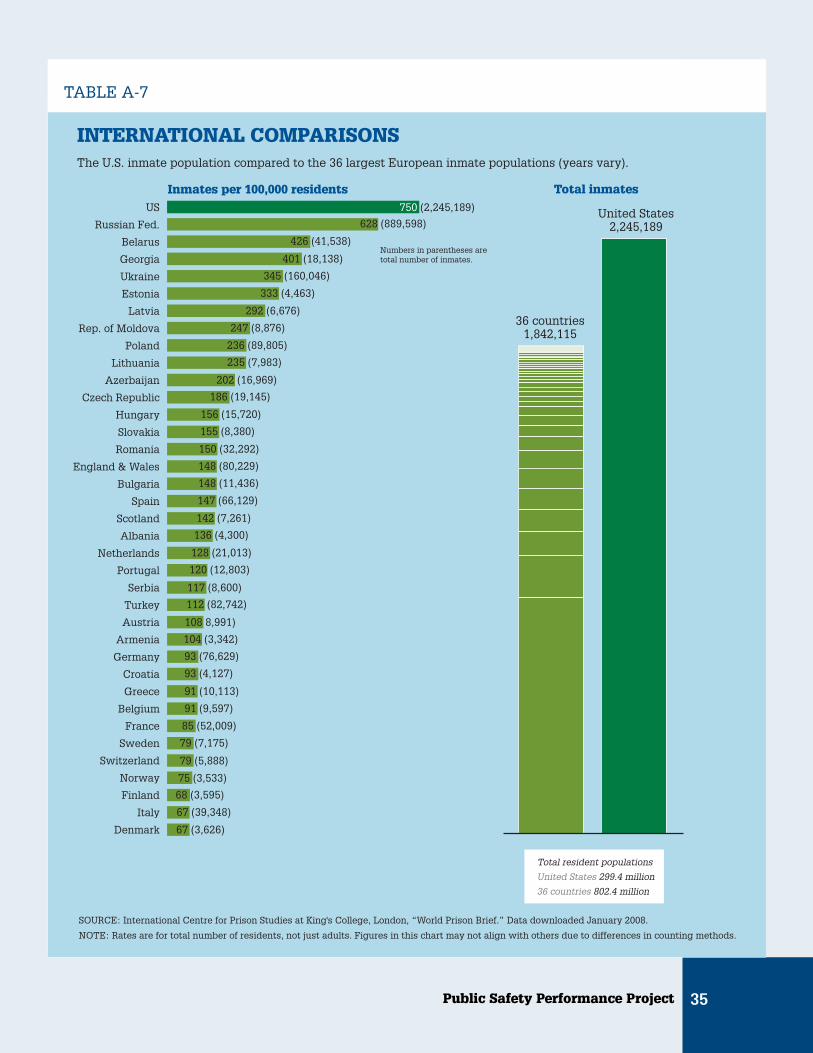
Public Safety Performance Project 35
TABLE A-7
SOURCE: International Centre for Prison Studies at King's College, London, “World Prison Brief.” Data downloaded January 2008.
NOTE: Rates are for total number of residents, not just adults. Figures in this chart may not align with others due to differences in counting methods.
Numbers in parentheses are total number of inmates.
INTERNATIONAL COMPARISONSThe U.S. inmate population compared to the 36 largest European inmate populations (years vary).
36 countries1,842,115
United States2,245,189
US
Russian Fed.
Belarus
Georgia
Ukraine
Estonia
Latvia
Rep. of Moldova
Poland
Lithuania
Azerbaijan
Czech Republic
Hungary
Slovakia
Romania
England & Wales
Bulgaria
Spain
Scotland
Albania
Netherlands
Portugal
Serbia
Turkey
Austria
Armenia
Germany
Croatia
Greece
Belgium
France
Sweden
Switzerland
Norway
Finland
Italy
Denmark
Inmates per 100,000 residents Total inmates
Total resident populations
United States 299.4 million
36 countries 802.4 million
750 (2,245,189)
628 (889,598)
426 (41,538)
401 (18,138)
345 (160,046)
333 (4,463)
292 (6,676)
247 (8,876)
236 (89,805)
235 (7,983)
202 (16,969)
186 (19,145)
156 (15,720)
155 (8,380)
150 (32,292)
148 (80,229)
148 (11,436)
147 (66,129)
142 (7,261)
136 (4,300)
128 (21,013)
120 (12,803)
117 (8,600)
112 (82,742)
108 8,991)
104 (3,342)
93 (76,629)
93 (4,127)
91 (10,113)
91 (9,597)
85 (52,009)
79 (7,175)
79 (5,888)
75 (3,533)
68 (3,595)
67 (39,348)
67 (3,626)


The Pew Charitable Trusts
1025 F Street, NW Suite 900
Washington, DC 20004-1409
www.pewtrusts.org