Embed Size (px)
Citation preview
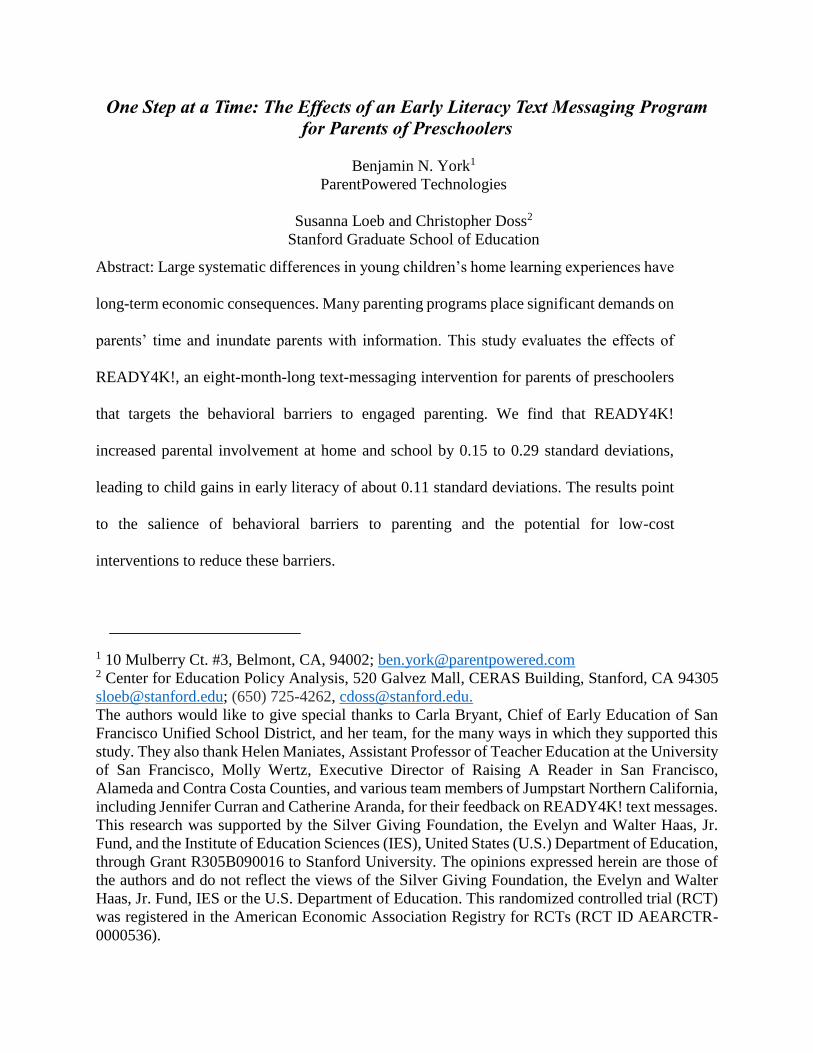
One Step at a Time: The Effects of an Early Literacy Text Messaging Program
for Parents of Preschoolers
Benjamin N. York1
ParentPowered Technologies
Susanna Loeb and Christopher Doss2
Stanford Graduate School of Education
Abstract: Large systematic differences in young children’s home learning experiences have
long-term economic consequences. Many parenting programs place significant demands on
parents’ time and inundate parents with information. This study evaluates the effects of
READY4K!, an eight-month-long text-messaging intervention for parents of preschoolers
that targets the behavioral barriers to engaged parenting. We find that READY4K!
increased parental involvement at home and school by 0.15 to 0.29 standard deviations,
leading to child gains in early literacy of about 0.11 standard deviations. The results point
to the salience of behavioral barriers to parenting and the potential for low-cost
interventions to reduce these barriers.
1 10 Mulberry Ct. #3, Belmont, CA, 94002; [email protected] 2 Center for Education Policy Analysis, 520 Galvez Mall, CERAS Building, Stanford, CA 94305
[email protected]; (650) 725-4262, [email protected].
The authors would like to give special thanks to Carla Bryant, Chief of Early Education of San
Francisco Unified School District, and her team, for the many ways in which they supported this
study. They also thank Helen Maniates, Assistant Professor of Teacher Education at the University
of San Francisco, Molly Wertz, Executive Director of Raising A Reader in San Francisco,
Alameda and Contra Costa Counties, and various team members of Jumpstart Northern California,
including Jennifer Curran and Catherine Aranda, for their feedback on READY4K! text messages.
This research was supported by the Silver Giving Foundation, the Evelyn and Walter Haas, Jr.
Fund, and the Institute of Education Sciences (IES), United States (U.S.) Department of Education,
through Grant R305B090016 to Stanford University. The opinions expressed herein are those of
the authors and do not reflect the views of the Silver Giving Foundation, the Evelyn and Walter
Haas, Jr. Fund, IES or the U.S. Department of Education. This randomized controlled trial (RCT)
was registered in the American Economic Association Registry for RCTs (RCT ID AEARCTR-
0000536).
Page 1 of 51
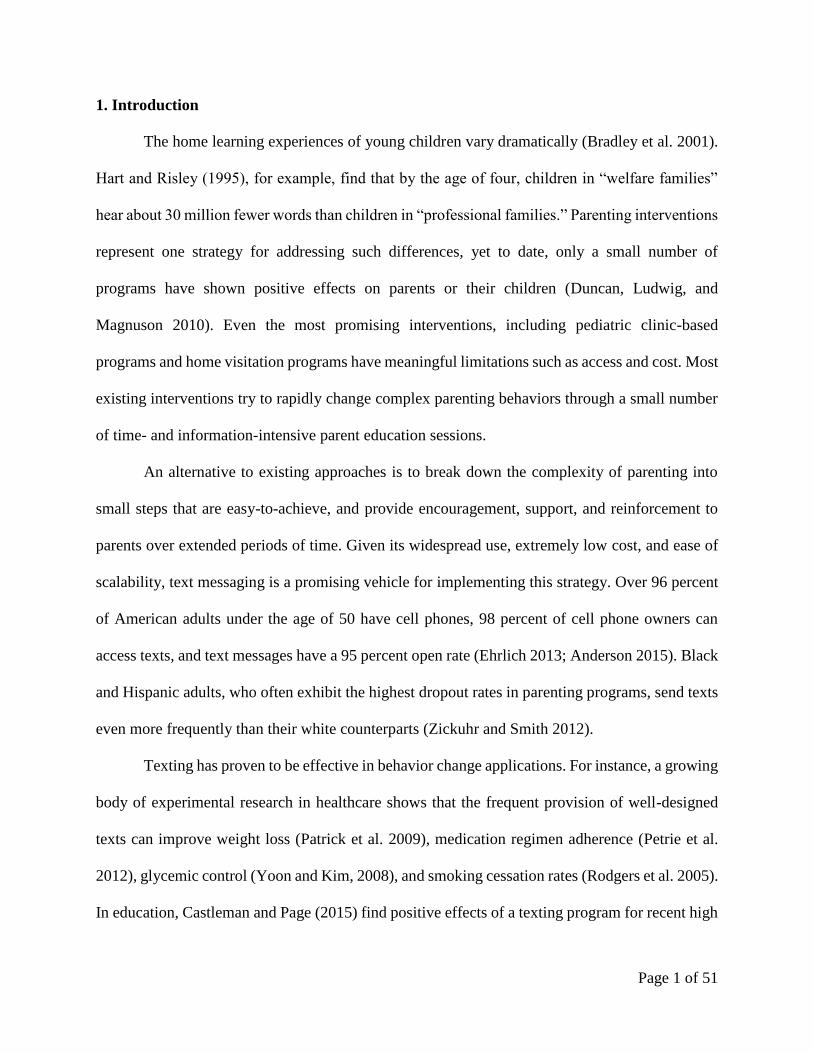
1. Introduction
The home learning experiences of young children vary dramatically (Bradley et al. 2001).
Hart and Risley (1995), for example, find that by the age of four, children in “welfare families”
hear about 30 million fewer words than children in “professional families.” Parenting interventions
represent one strategy for addressing such differences, yet to date, only a small number of
programs have shown positive effects on parents or their children (Duncan, Ludwig, and
Magnuson 2010). Even the most promising interventions, including pediatric clinic-based
programs and home visitation programs have meaningful limitations such as access and cost. Most
existing interventions try to rapidly change complex parenting behaviors through a small number
of time- and information-intensive parent education sessions.
An alternative to existing approaches is to break down the complexity of parenting into
small steps that are easy-to-achieve, and provide encouragement, support, and reinforcement to
parents over extended periods of time. Given its widespread use, extremely low cost, and ease of
scalability, text messaging is a promising vehicle for implementing this strategy. Over 96 percent
of American adults under the age of 50 have cell phones, 98 percent of cell phone owners can
access texts, and text messages have a 95 percent open rate (Ehrlich 2013; Anderson 2015). Black
and Hispanic adults, who often exhibit the highest dropout rates in parenting programs, send texts
even more frequently than their white counterparts (Zickuhr and Smith 2012).
Texting has proven to be effective in behavior change applications. For instance, a growing
body of experimental research in healthcare shows that the frequent provision of well-designed
texts can improve weight loss (Patrick et al. 2009), medication regimen adherence (Petrie et al.
2012), glycemic control (Yoon and Kim, 2008), and smoking cessation rates (Rodgers et al. 2005).
In education, Castleman and Page (2015) find positive effects of a texting program for recent high
Page 2 of 51
school graduates designed to curb summer “melt,” which occurs when college-intending graduates
fail to matriculate in college the year after high school. Similarly, Bergman (2016) finds that high
school students whose parents received messages about their missing work and grades had
improved by 0.19 standard deviations (SD).
This study adds to research on both parenting and behavioral interventions by evaluating
the effects of READY4K!, an eight-month-long text-messaging program for parents of
preschoolers designed to help them support their children’s development. During the 2013-14 and
2015-16 school years, we conducted randomized controlled trials (RCTs) of the program in San
Francisco Unified School District (SFUSD). Between the two years 1,031 parents and guardians
agreed to participate in the study, and we randomly selected half to receive READY4K!. Each
week, these parents received three texts about an academic skill or set of skills: a “FACT” text
designed to inform and motivate parents; a “TIP” text that aimed to minimize the cognitive,
emotional, and time burdens of engaged parenting by providing parents with highly-specific
activities that build on existing family routines; and a “GROWTH” text, which provided parents
with encouragement and reinforcement as well as a follow-up tip. About every two weeks, we sent
one “placebo” text to parents in the control group, often pertaining to the district’s kindergarten
enrollment process or required vaccinations.
We find strong evidence that parents in the treatment group used the tips and found
READY4K! to be helpful. For example, treatment group parents found READY4K! texts to be
0.41 SD more helpful than control group parents (p<0.01). In addition, READY4K! parents
reported engaging in more home literacy activities with their children, ranging from pointing out
rhyming words to concepts of print like showing their children the different parts of a book– an
average of 0.16 SD (p<0.10). According to teachers, parents in the treatment group more
Page 3 of 51
frequently asked questions about their children’s school experiences than the control group parents
– effects of up to 0.21 (0.14 average) SD (p<0.05). Increases in parental involvement at home and
school translated into learning gains for children, as students whose parents received READY4K!
texts scored an average of 0.11 SD (p<0.05) higher on a spring early literacy assessment. Children
who scored below the median of the baseline skills particularly benefited from the intervention
with an increase in literacy skills of 0.31SD (p<0.01).
The remainder of this paper proceeds as follows. In Section 2, we review research on the
behavioral barriers to engaged parenting as well as on parenting and text messaging interventions.
Section 3 describes study procedures. In Section 4, we present study results. We conclude this
paper in Section 5 with a discussion of the findings.
2. Literature Review
Virtually all parents want their children to succeed in school (Stevenson, Chen, and Uttal
1990), yet some parents provide their children with comparatively more support. For example,
economically disadvantaged and wealthy parents exhibit large and systematic differences in
parenting practices. From birth to age two, non-poor children are more likely than poor children
to be caressed, kissed, or hugged by their mother, and they are less likely to be spanked. Non-poor
birth-to-two-year-olds also have greater access to children’s books and are more likely to be read
to than their poor counterparts. These disparities have significant consequences, as children who
experience responsive and stimulating parental care tend to score higher on assessments of motor,
social, emotional, literacy, and numeracy skills than those who do not (Bradley et al. 2001; NICHD
Early Child Care Research Network 2006; Melhuish et al. 2008). Skill gaps that develop early in
life are difficult to overcome and have significant negative implications for later life economic
outcomes (Heckman 2006).
Page 4 of 51
Given that most parents want their children to succeed in school, why are some parents
more involved in their children’s learning? Unequal access to resources – such as toys, books, free
time, parks, and libraries – is clearly a part of the answer to this question (Costello et al. 2003;
Riccio et al. 2013). For example, recent research shows that a $1,000 increase in family income
raises children’s combined reading and math scores by 0.06 standard deviations (Dahl and Lochner
2012). This study, however, focuses on other parenting factors not included in most basic
economic models of utility maximization under a budget constraint. These factors may be easier
and more cost effective to address through policies or interventions.
One such factor is imperfect information. Some parents may not have good information
about the importance of parenting or productive parenting practices, and as a result, fail to provide
their children with an adequate level of support or the right types of support. Imperfect information
has been studied in other educational contexts with mixed results. Avery and Kane (2004) and
Grodsky and Jones (2007), for example, find little evidence that students or parents lacking
information about the costs and benefits of college explains the socioeconomic stratification of
college attendance. However, other studies find that the provision of information impacts school
choices and student outcomes (Hastings and Weinstein 2008; Valant and Loeb 2014).
Yet even when parents have preferences for child success and sufficient resources and
information to support their children, due to a number of behavioral barriers, they do not always
do so. One set of barriers stems from the limited information processing capabilities of the human
mind (Simon 1955). In the face of cognitively demanding tasks – such as tasks requiring a
substantial amount of choice, and continuous, on-going tasks – individuals tend to make choices
based on faulty heuristics or they avoid making decisions altogether (Mullainathan and Thaler
2000). The cognitive demands of parenting are clearly high, as each day parents must make
Page 5 of 51
decisions about what to say, do, and provide to their children in every situation. Making choices
about activities to support child development may be particularly daunting for parents, given that
many of the skills required to be successful in school are outside of parents’ area of expertise (e.g.,
literacy, numeracy, and socio-emotional skills).
Ample research provides evidence of suboptimal behavior (e.g., poor decision making) in
the face of high cognitive demand (bounded rationality). For example, one study underscoring the
difficulty of tasks that require substantial choice finds that reducing the selection of jams offered
to consumers from 24 to six varieties, all equally appealing, increases the likelihood of a jam
purchase by ten-fold (Iyengar and Lepper 2000). In education, a random assignment study of
simplifying the college enrollment process finds that students of low- to moderate-income families
who received assistance filling out the Free Application for Federal Student Aid (FAFSA), along
with information about their eligibility for aid and local post-secondary options, were substantially
more likely to submit the aid application and enroll in college the following fall than students in
families that only received information (Bettinger et al. 2012). Poverty may also exacerbate the
cognitive demand issue. As people living in poverty focus on meeting daily financial challenges
such as buying food and paying rent, less cognitive capacity remains for completing other complex
tasks such as parenting. Researchers have shown the existence of the scarcity phenomenon both in
the laboratory and in contexts such as farming (Shah, Mullainathan, and Shafir 2012; Mani et al.
2013).
In addition to limitations in human information-processing capabilities, there is increasing
evidence that limits to attention can also lead to suboptimal behavior (Karlan et al. 2010). Given
the significant demands on most parents’ time, parents likely have particularly limited attention.
A single mother, for instance, might have the goal of providing daily test preparation support to
Page 6 of 51
her child for an exam to be administered in a month, but may be preoccupied by the day-to-day
rigors of being a parent (e.g., working one or more jobs, shopping for groceries, paying the bills,
house chores, and bathing, dressing, feeding, transporting, and entertaining her child or children)
and forget to help her child until the final days leading up to the assessment, ultimately
underinvesting in the child’s preparation relative to her initial preference. A series of randomized
experiments finds that sending regular reminders to new savings account holders improves their
saving behavior, providing evidence for the importance of limited attention (Karlan et al. 2010).
Non-standard preferences can also present behavioral barriers to parental involvement.
Time-inconsistent preferences, or self-control problems (DellaVigna 2009), are likely most
germane to parents. In parenting, a potentially significant source of self-control problems is
delayed gratification. Although many parents derive pleasure from doing activities with their
children, the benefits of activities that will increase children’s school readiness skills are not
always evident and parents may prefer to do other activities with their children that are more
familiar or will be sure to make their children happy. Moreover, school readiness-building
activities generally do not lead to immediate gains in child development, meaning that parents
must wait for the satisfaction that they receive from engaging in these activities. Parental
involvement also requires parents to forego personal activities with immediate rewards, such as
talking to a friend on the phone or going for walk, and thus has potentially significant timing
hurdles. In general, most people tend to do too little when gratification is delayed (Thaler and
Sunstein 2008).
Emotions can also impact human behavior (DellaVigna 2009). In one study, subjects
exposed to violent video clips displayed more aggressive behavior after watching the clips than
those exposed to non-violent clips (Josephson 1987). The responsibility and importance of

Page 7 of 51
parenting can induce powerful emotions and inhibit some parents from fully engaging with their
children. The scope and long-term nature of the enterprise (e.g., providing care and support to
children into adulthood) can make parenting emotions especially intense, particularly when parents
are uncertain about what to do. Fortunately, there are strategies for dealing with such emotions.
For example, Bandura and Schunk (1981) showed that reframing a large distal goal into a series
of small proximal goals increased students’ confidence and improved test scores.
A substantial amount of effort has gone into developing interventions to improve parents’
practices. Many of these programs try to quickly change complex parenting behaviors through a
short series of time-intensive parenting information sessions. Unfortunately, this strategy has
proven to be largely ineffective, especially over the long run (Duncan, Ludwig, and Magnuson
2010). This lack of effectiveness is not surprising given that the behavioral hurdles to parenting
are generally not alleviated and, in fact, may be increased by common approaches that place
significant demands on parents’ time and inundate parents with information.
An alternative strategy that has shown more promise is to target parents’ home literacy
practices by leveraging children’s visits to the doctor’s office. Pediatric clinic-based programs
provide parents with information on the importance of literacy development as well as books and
other resources. These relatively inexpensive interventions have correlated with improvements in
literacy practices among low-income, black, and Hispanic parents (Golova et al. 1999; Needlman
et al. 2005; Blom-Hoffman et al. 2007; Zuckerman 2009). Program participation generally predicts
children’s language development (Sharif, Rieber, and Ozuah 2002). One such program, the Reach
out and Read (ROR) program, has received a particularly high level of attention in the literature
(Mendelsohn et al. 2001).

Page 8 of 51
Some childcare centers and elementary schools have carried out similar family-based home
literacy interventions (e.g., Whitehurst et al. 1994; Jordan, Snow, and Porche 2000). Recent meta-
analyses of these programs find that they are associated with small but significant short-term gains
for young children (Manz et al. 2010; Reese, Sparks, and Leyva 2010). For example, a random
assignment study of a reading program that teaches parents dialogic reading techniques such as
asking open-ended questions find positive treatment effects on children’s writing, language, and
print concepts skills (Whitehurst et al. 1994).
While clinic- and school-based programs show promise, they have a number of limitations.
Many of the benefits of clinic-based interventions occur during visits, which are often infrequent.
The shortcomings of school-based programs are even greater, largely driven by the time and effort
demands school-based programs place on parents. For instance, the overall participation rate in a
study of ParentCorps, which consists of 13 school-based, two hour-long parent and child sessions,
was 42 percent, and the average number of ParentCorps sessions attended by treatment group
parents was less than six (Brotman et al. 2011). Dropout rates in center-based programs are often
high, and it is often the parents who could benefit the most from support who drop out (Prinz and
Miller 1994).
Another alternative to parenting information sessions are home visitation programs, but a
growing body of research indicates mixed, and arguably underwhelming effects (Gomby 2005;
Astuto and Allen 2009; Azzi-Lessing 2011). Some home visitation programs result in meaningful
improvements in parenting practices such as the reduction of child abuse, yet they often yield few
measured effects on children’s development in less extreme situations. As Gomby, Culross, and
Behrman (1999) point out, it may be unrealistic to expect programs involving 20 to 40 hours of
Page 9 of 51
direct contact over several years to have such significant impacts on parental behaviors and in turn
children’s outcomes. In addition, home visitation programs are expensive and difficult to scale.
Despite the field’s limited success in changing parenting behaviors to date, recent
technology-driven behavioral interventions provide reason for optimism. In particular, sending
well-crafted and timed text messages to individuals has been shown to be an effective way to
change a range of complex behaviors and represents a potentially promising strategy for supporting
parents. For example behavioral text messaging interventions in healthcare have led to
improvements in weight loss (Patrick et al. 2009), medication regimen adherence (Petrie et al.
2012), and glycemic control (Yoon and Kim 2008). Further, an experimental study of a
personalized and interactive text messaging program designed to help individuals in New Zealand
quit smoking finds that 28 percent of the treatment group quit smoking, compared to 13 percent of
the control group (Rodgers et al. 2005).
Texting in education is relatively new but initial findings are encouraging. Castleman and
Page (2015) evaluate a texting program for recent high school graduates designed increase college
enrollment. The program, which was delivered between early June and mid-August, consists of a
series of 10 texts messages to students and their parents, sent roughly over five-day intervals. The
messages remind students and their parents about tasks required by the students’ intended college
such as completing important paperwork. They also prompt students and parents to ask for
additional assistance if needed. The study finds that students were roughly three percentage points
more likely to enroll at two-year institutions and that texting was particularly effective for students
with low access to college-planning supports. Another notable experimental texting study sent
parents or guardians of high school students messages for six months about students’ missing
assignments such as homework, classwork, exams and grades (Bergman 2016). This study finds
Page 10 of 51
positive treatment effects on attendance, assignment completion, behavior, and grade point
average, and some evidence of effects on math test scores.
While the above studies provide evidence that texting can nudge individuals toward
positive behaviors, prior texting interventions are quite limited in scope. Most programs have
focused primarily on sustaining participants’ attention on their goals while others alert individuals
to problems by sending basic information but do not provide the tools necessary to build
knowledge and lasting skills. Bergman (2016), for example, simply informed parents about their
children’s missing assignments. In contrast, a program to support parents more fully needs to
address the cognitive load of choice and ambiguity inherent in parenting and provide richer
information to parents, along with a structured routine. To the best of our knowledge, texting has
not been evaluated for this purpose. In this study, we evaluate the impact of READY4K!, an early
literacy-focused text messaging program for parents of preschoolers that breaks down parenting
activities into small steps that are relatively easy to achieve in a highly-structured fashion.
3. Procedures
3a. The Intervention
READY4K! is an eight-month-long text messaging program for parents of four year olds
designed to help them support their children’s academic development. This study reports on the
results of providing the program to two cohorts of prekindergarten families in the San Francisco
Unified School District (SFUSD). During the 2013-2014 school year we randomly selected
participants to receive a program dedicated solely to improving literacy skills. During the 2015-
2016 school year we randomly selected families to receive a program that supported the literacy,
math, and socio-emotional development of their children. Though the content of the program
differs between years, the structure of the program remains identical and we cull on the same
Page 11 of 51
behavioral economics and education theories to change parental habits. Both programs draw on
research in academic development (e.g., California Department of Education 2008; Lonigan and
Shanahan 2009), academic-related parenting practices (e.g., Reese, Sparks, and Leyva 2010), and
behavioral economics (e.g., Simon 1955). Both programs are linked to the California Preschool
Learning Foundations and are structured as a spiral curriculum. It starts with simple topics and
gets progressively more advanced over time, and topics are re-introduced throughout the year for
reinforcement. In describing the program we concentrate on the literacy texts because they are
common between years. Information on the math and socio-emotional texts are available on
request.
Parents were randomly assigned to receive three READY4K! texts messages per week
during the school year about a particular set of skills (starting in October and ending in May). On
Mondays, they received “FACT” texts, designed to inform and motivate parents by highlighting
the importance of a particular skill or set of skills. On Wednesdays, they received “TIP” texts,
designed to minimize the cognitive, emotional, and time burdens of engaged parenting. These texts
include short, simple, and highly specific activities for parents to do with their children that build
on existing family routines. To maximize the likelihood of uptake, we aimed to make the activities
fun for parents and their children. On Fridays, parents received “GROWTH” texts, which provide
encouragement, and extend the Wednesday tips. The following is an example week of texts:
FACT: Letters are the building blocks of written language. Children need to know the letters to
learn how to read & write.
TIP: Point out the first letter in your child’s name in magazines, at the store & on signs. Have your
child try. Make it a game. Who can find the most?

Page 12 of 51
GROWTH: Keep pointing out letters. You’re preparing your child 4K! Now when you point out
a letter, ask: What sound does it make?
Overall, literacy texts cover a wide range of skills and related parenting practices,
including: upper- and lower-case letter recognition, letter sound awareness, beginning sound
awareness, rhyme awareness, name writing, concepts of print, story comprehension, vocabulary
development, listening to and singing songs, self-narration, parent-child conversations, and
establishing high-quality parent-child book reading routines. Math texts cover topics such as:
counting, number recognition, shapes, sorting, patterns, addition, subtraction, and comparisons of
size. Finally, socio-emotional texts concentrate on identifying emotions, identifying their causes
and consequences, building emotion regulation, perseverance, sharing, and turn-taking. Parents
chose to receive texts in English, Spanish, or Chinese.
In the first year of the program, we integrated text messages that emphasized parental
involvement at school. The following text, which we sent during a week about concepts of print,
is one example:
TIP: Ask the teacher about your child’s knowledge of concepts of print. Concepts of print include
knowing how book are organized & that words have meaning.
In the first year we also included messages about SFUSD’s Raising A Reader (RAR)
program, which regularly sends books home to children. In particular, we coupled parent-child
reading activities with texts about RAR to alleviate concerns that families without books could not
engage in the suggested reading activities. For example:
Page 13 of 51
TIP: Use the RAR red book bag to build your routine. Let your child hold the book. Ask what it is
about. Follow the words with your finger as you read.
In the vast majority of cases, READY4K! texts build on activities that parents already do
with their children. By extending pre-existing family routines, the program’s messages minimize
the costs of adopting beneficial home literacy practices. Parents do not have to take up new
activities, which have time and emotional costs; they are simply asked to build on established
routines. For example, the following “spiral” week of texts focuses on leveraging bath time:
FACT: Bath time is great for teaching your child important skills 4K. Start by asking: What are
the things we need for bath time? Why?
TIP: When you’re bathing your child, point out the letters on shampoo bottles. Ask your child to
name them and tell you the sounds that they make.
GROWTH: Keep using bath time to prepare your child 4K! Ask: What rhymes with tub (cub, rub),
soap (rope, hope) and bubble (double, trouble)?
While parents in the treatment group received multiple READY4K! texts per week, parents
in the control group received one placebo text about every two weeks. These messages pertained
to the district’s kindergarten enrollment requirements or required vaccinations. For example:
READY4K: Immunization forms are available at any San Francisco Health Center & SFUSD’s
Educational Placement Center at 555 Franklin St., Room 100.
Page 14 of 51
3b. Study Participants
We conducted the experimental study of READY4K! with parents of four year old
preschoolers in SFUSD – administered by the Early Education Department (EED). EED serves
roughly one-third of San Francisco’s preschool market (the poorest third), operating 21 stand-
alone sites and 13 sites that are co-located at elementary schools. Stand-alone and co-located sites
function somewhat differently and have different sets of supports.
To recruit parents at stand-alone sites, we built on EED’s existing enrollment processes by
distributing READY4K! enrollment forms to the department’s enrollment clerks and offering them
10 dollars for each family that they enrolled. In SFUSD, parents of preschoolers must turn in a
completed enrollment form to an enrollment clerk prior to the start of the school year. In the first
year, to further encourage participation, we offered parents a ten-dollar Target gift card for
enrolling in the program. We discontinued this incentive in the second year due to cost
considerations, but this change did not pose a barrier to recruiting participants. In the first year, we
also provided ten dollars per month or a 12 dollar monthly Amazon.com gift card to all participants
because we did not want texting costs to represent a barrier to program participation. Surveys of
parents in the first year indicated that most families have an unlimited texting plan. We therefore
discontinued this incentive in the second year as well. This lack of incentive did not appreciably
change attrition rates.
Unlike stand-alone sites, early education sites that are co-located at elementary schools do
not have an EED enrollment clerk. In lieu of the above strategy we sent home information to
eligible parents about the program along with our enrollment form. We also called some families
and opted them into the study over the phone. The incentive structure in the first year was the same
for these families.

Page 15 of 51
We began program enrollment in early June and completed it in late September, about six
weeks after the start of the school year, so as to include late preschool enrollees. Between the two
years, 1,031 of 1,761 eligible families, representing all 34 sites enrolled in the study.3
Of the 1,031 families that enrolled in the study, 69 left SFUSD prior to the start of the
school year and 27 left the district during the year, leaving an analytic sample of 935 families.
Mobility is generally high in early education. Assuming that READY4K! did not affect initial
enrollment or mid-year exit decisions, only 17 out of 935 families intentionally left the study – an
opt-out rate of roughly two percent.
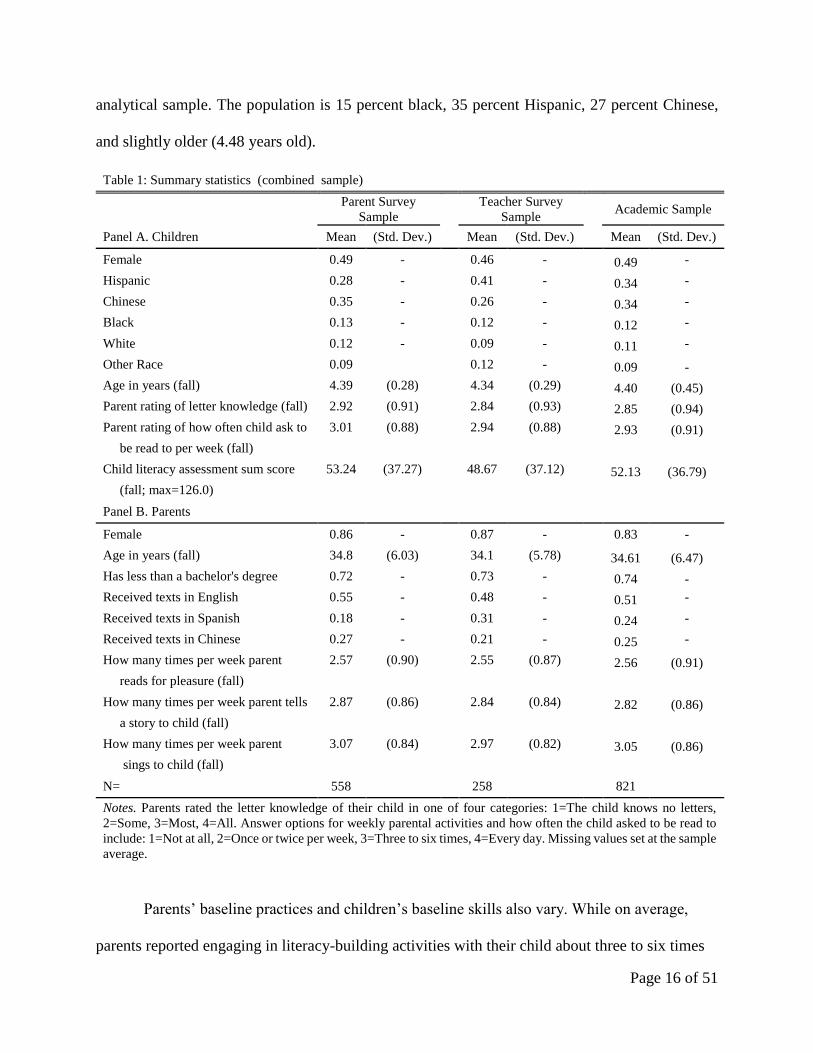
Table 1 presents descriptive statistics on the sample of families represented in the parent
surveys, teacher surveys, and academic assessment. Sample sizes are smaller than the 935 families
due to survey non-response and student absences during the assessment window. The teacher
survey sample size is smaller because we were unable to survey teachers in the second year. While
nearly all families in the district receive financial aid for preschool attendance costs (e.g., during
the 2012-13 school year, only 12 percent of families paid full tuition), the participants in this study
are diverse in other ways. As shown in Table 1, roughly 34 percent of children in the academic
sample are Hispanic, 34 percent are Chinese, and 12 percent are black. The average fall age of
children and parents in the sample is 4.40 and 34.61 years, respectively. About half of the parents,
51 percent, chose to receive texts in English, 24 percent chose Spanish, and 25 percent chose
Chinese. Most parents (80 percent) had an unlimited texting plan at the start of the study.
Demographically, the population of four year olds in SFUSD is similar in composition to the
3 In the first year, 519 of 874 families enrolled in the program and represented 31 of the 34 sites.
In the second year of the program, 512 of 887 families enrolled in the program and represented all
sites.
Page 16 of 51
analytical sample. The population is 15 percent black, 35 percent Hispanic, 27 percent Chinese,
and slightly older (4.48 years old).
Table 1: Summary statistics (combined sample)
Parent Survey
Sample
Teacher Survey
Sample Academic Sample
Panel A. Children Mean (Std. Dev.) Mean (Std. Dev.) Mean (Std. Dev.)
Female 0.49 - 0.46 - 0.49 -
Hispanic 0.28 - 0.41 - 0.34 -
Chinese 0.35 - 0.26 - 0.34 -
Black 0.13 - 0.12 - 0.12 -
White 0.12 - 0.09 - 0.11 -
Other Race 0.09 0.12 - 0.09 -
Age in years (fall) 4.39 (0.28) 4.34 (0.29) 4.40 (0.45)
Parent rating of letter knowledge (fall) 2.92 (0.91) 2.84 (0.93) 2.85 (0.94)
Parent rating of how often child ask to 3.01 (0.88) 2.94 (0.88) 2.93 (0.91)
be read to per week (fall)
Child literacy assessment sum score 53.24 (37.27) 48.67 (37.12) 52.13 (36.79)
(fall; max=126.0)
Panel B. Parents
Female 0.86 - 0.87 - 0.83 -
Age in years (fall) 34.8 (6.03) 34.1 (5.78) 34.61 (6.47)
Has less than a bachelor's degree 0.72 - 0.73 - 0.74 -
Received texts in English 0.55 - 0.48 - 0.51 -
Received texts in Spanish 0.18 - 0.31 - 0.24 -
Received texts in Chinese 0.27 - 0.21 - 0.25 -
How many times per week parent 2.57 (0.90) 2.55 (0.87) 2.56 (0.91)
reads for pleasure (fall)
How many times per week parent tells 2.87 (0.86) 2.84 (0.84) 2.82 (0.86)
a story to child (fall)
How many times per week parent 3.07 (0.84) 2.97 (0.82) 3.05 (0.86)
sings to child (fall)
N= 558 258 821
Notes. Parents rated the letter knowledge of their child in one of four categories: 1=The child knows no letters,
2=Some, 3=Most, 4=All. Answer options for weekly parental activities and how often the child asked to be read to
include: 1=Not at all, 2=Once or twice per week, 3=Three to six times, 4=Every day. Missing values set at the sample
average.
Parents’ baseline practices and children’s baseline skills also vary. While on average,
parents reported engaging in literacy-building activities with their child about three to six times

Page 17 of 51
per week (including story-telling, reading, and singing), many parents reported engaging in this
activities more or less often than three to six times. Similarly, parents reported a high degree of
variation in their children’s pre-treatment early literacy skills. While on average, parents
indicated that their children know most of the letters and can produce letter sounds and rhyme
somewhat well, the variation around these averages is quite large. Children’s direct assessment
scores support parents’ reports. For example, the average fall literacy assessment score of
children in the academic sample is approximately 52 out of 126, with a standard deviation of
about 37.
3c. Data
This study uses multiple sources of data describing four year olds in SFUSD and their
parents. Information on parents comes from three sources: the READY4K! enrollment form, an
end-of-year survey of parents, and an end-of-year survey of teachers (the teacher survey was only
fielded in the first year). In the enrollment form, we collected basic information from parents
including their home address, cell phone number, cell phone service provider, and if they have
unlimited texting. We also asked parents to rate their early literacy-related parenting practices and
their children’s early literacy skills (summary statistics are presented in Table 1). We collected
these data prior to the start of the intervention and all parents partially or fully completed the form.
At the end of each respective school year, we mailed surveys to families’ homes, in which
we asked parents about their experiences participating in the study (we also sent a text message to
parents with a link to an on-line version of the survey). We asked all parents about their experiences
receiving and using study texts messages, as well as the activities they engaged in to help develop
their children’s early literacy skills. We offered parents 50 dollars for completing the survey.
Ultimately 558 did so, resulting in a response rate of approximately 60 percent.
Page 18 of 51
In the first year of the experiment, we also surveyed teachers about parental involvement.
We asked them about the frequency with which parents asked questions about their child’s
interests, what their child is doing and learning in school, and things they can do to help their child
learn to read. Teachers did not know which parents were in the treatment group and which were
in the control group. As with parents, we offered teachers 50 dollars for completing the survey.
Overall, 63 teachers covering 258 of 449 families in the first year of the experiment completed and
returned them – a response rate of about 57 percent.
To describe students, we use two additional sources of information: SFUSD’s
administrative records and students’ spring scores on the district’s early literacy assessment. In the
spring of each school year, the district assesses the early literacy skills of four years olds using
Phonological Awareness Literacy Screening (PALS). PALS was developed and validated at the
University of Virginia (Invernizzi et al. 2004). PALS is a one-on-one assessment that takes about
20 to 30 minutes to complete. It includes tests of children’s name writing skills, alphabet
knowledge, beginning sound awareness, print and word awareness, rhyme awareness, and nursery
rhyme awareness. The assessment has a leveled component: in the alphabet knowledge subtest,
children who correctly identify 16 or more upper-case letters move on to be assessed in lower-case
letters; and, children who correctly identify nine or more lower-case letters move on to letter
sounds. SFUSD collects PALS data through a partnership with the University of San Francisco,
which uses education graduate students to administer the assessment. The PALS assessment
window was between March and April, well before the end of the READY4K! intervention, which
occurred in May. All of the students in this study were assessed with the English-language version
of PALS.
Page 19 of 51
3d. Randomization Checks
In expectation, the only difference between the treatment group and the control group in a
randomized experiment is treatment status. On average, all other characteristics of treatment and
control group members, such as race, should be balanced. If by chance, despite the randomization
process, there is imbalance across the groups, then treatment effect estimates could be biased.
We randomized READY4K! within sites and therefore estimate a set of site fixed effects
models to evaluate covariate balance. These models take the following form:
𝑋𝑖𝑠𝑡 = 𝛽1𝑇𝑖𝑠𝑡 + 𝛾𝑠𝑡 + 𝜀𝑖𝑠𝑡 (1)
where 𝑋𝑖𝑠𝑡 is a pre-treatment covariate of child i (or his or her parent) in site s in year t, 𝑇𝑖𝑠𝑡 is the
treatment status of the parent of child i in site s in year t, 𝛾𝑠𝑡 is a site-by-year fixed effect, and 𝜀𝑖𝑠𝑡
is a child-level (or parent-level) error term (standard errors are clustered at the site-by-year level).
We examine the balance of several pre-treatment covariates, including: child age, race, and gender;
parents’ ratings of children’s pre-treatment early literacy skills; children’s fall assessment scores;
parents’ age, texting language, and parents’ self-reports of their early literacy-related parenting
activities.
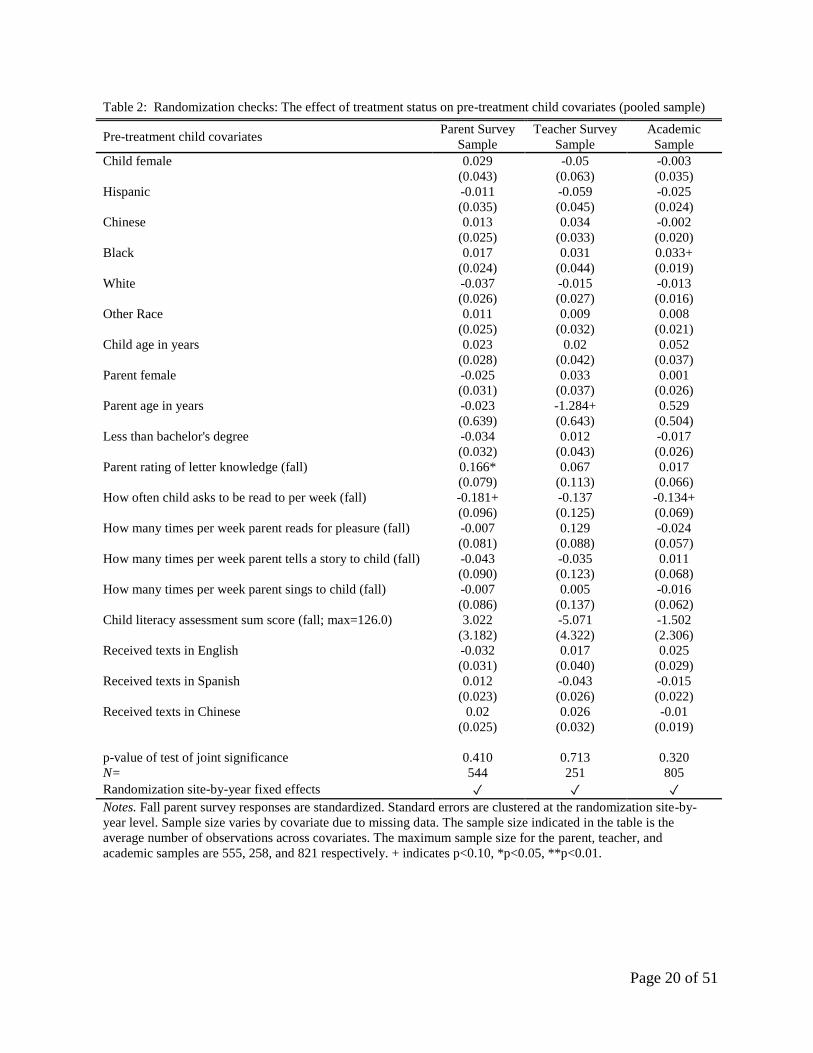
Table 2 illustrates that between the two years of the program there is little evidence of
covariate imbalance. Of the 57 estimates we generate to assess imbalance, only five are statistically
significant at the ten percent level or less (nine percent of the estimates). This could occur by
chance. Further, we cannot reject the null hypothesis that the covariates are jointly different from
zero in each of the three samples. Appendix Table A3 shows that the first year of the program has
more significant imbalance, while the second year of the program does not. In all cases we present
results separately for each year, and combined between years, in models that include and exclude
covariates.
Page 20 of 51
Table 2: Randomization checks: The effect of treatment status on pre-treatment child covariates (pooled sample)
Pre-treatment child covariates Parent Survey
Sample
Teacher Survey
Sample
Academic
Sample
Child female 0.029 -0.05 -0.003
(0.043) (0.063) (0.035)
Hispanic -0.011 -0.059 -0.025
(0.035) (0.045) (0.024)
Chinese 0.013 0.034 -0.002
(0.025) (0.033) (0.020)
Black 0.017 0.031 0.033+
(0.024) (0.044) (0.019)
White -0.037 -0.015 -0.013
(0.026) (0.027) (0.016)
Other Race 0.011 0.009 0.008
(0.025) (0.032) (0.021)
Child age in years 0.023 0.02 0.052
(0.028) (0.042) (0.037)
Parent female -0.025 0.033 0.001
(0.031) (0.037) (0.026)
Parent age in years -0.023 -1.284+ 0.529
(0.639) (0.643) (0.504)
Less than bachelor's degree -0.034 0.012 -0.017
(0.032) (0.043) (0.026)
Parent rating of letter knowledge (fall) 0.166* 0.067 0.017
(0.079) (0.113) (0.066)
How often child asks to be read to per week (fall) -0.181+ -0.137 -0.134+
(0.096) (0.125) (0.069)
How many times per week parent reads for pleasure (fall) -0.007 0.129 -0.024
(0.081) (0.088) (0.057)
How many times per week parent tells a story to child (fall) -0.043 -0.035 0.011
(0.090) (0.123) (0.068)
How many times per week parent sings to child (fall) -0.007 0.005 -0.016
(0.086) (0.137) (0.062)
Child literacy assessment sum score (fall; max=126.0) 3.022 -5.071 -1.502
(3.182) (4.322) (2.306)
Received texts in English -0.032 0.017 0.025
(0.031) (0.040) (0.029)
Received texts in Spanish 0.012 -0.043 -0.015
(0.023) (0.026) (0.022)
Received texts in Chinese 0.02 0.026 -0.01
(0.025) (0.032) (0.019)
p-value of test of joint significance 0.410 0.713 0.320
N= 544 251 805
Randomization site-by-year fixed effects ✓ ✓ ✓
Notes. Fall parent survey responses are standardized. Standard errors are clustered at the randomization site-by-
year level. Sample size varies by covariate due to missing data. The sample size indicated in the table is the
average number of observations across covariates. The maximum sample size for the parent, teacher, and
academic samples are 555, 258, and 821 respectively. + indicates p<0.10, *p<0.05, **p<0.01.
Page 21 of 51
3e. Estimating Treatment Effects
This study evaluates the impact of READY4K! on parents’ attitudes towards the program,
related texting behaviors, home literacy practices, and involvement at school, as well as children’s
early literacy skills. To assess the effect of the program on parents, we start by examining the end-
of-year parent survey data. In the survey, we asked parents about their attitudes toward
READY4K! and their program-related texting behaviors. In particular, we asked parents if they
read and used READY4K! text messages and if they found the texts to be helpful. We also asked
if they shared the texts and would recommend READY4K! to other parents.
To evaluate the effects of the program on parents’ attitudes toward READY4K! and texting
behaviors, we estimate two sets of models. In the first set of models we simply regress measures
of parents’ texting attitudes and behaviors on treatment status and site-by-year fixed effects to
account for our randomization strategy. The second set of models we add all pre-treatment
covariates to increase the precision of effect estimates and to account for any imbalance in the
covariates. The second set of models takes the following form:
𝑌𝑖𝑠𝑡 = 𝛽1𝑇𝑖𝑠𝑡 + 𝑋𝑖𝑠𝑡𝛽2 + 𝛾𝑠𝑡 + 𝜀𝑖𝑠𝑡 (2)
where 𝑌𝑖𝑠𝑡 is a measure of the attitude of parent i in site s in year t toward READY4K! or program-
related texting behavior, 𝑇𝑖𝑠𝑡 is the parent’s treatment status, 𝛾𝑠𝑡 is a site-by-year fixed effect, 𝑋𝑖𝑠𝑡
is a vector of pre-treatment covariates (child demographics and baseline skills and parent
demographics and baseline parenting activity), and 𝜀𝑖𝑠𝑡is a parent-level error term (standard errors
are clustered at the site-by-year level).

Page 22 of 51
In addition to texting behaviors and attitudes, we also asked parents about their home
literacy activities in the end-of-year survey. In particular, we asked them to indicate how many
times during the last week they engaged in various activities, such as helping their children write
their name, reciting nursery rhymes, and reading to their children. Our first step in analyzing this
data is to conduct a factor analysis to help assess the dimensionality of the data. Results of this
analysis indicate that one underlying early literacy parenting factor explains approximately 48
percent of the variance in the data in the first year and 58 percent in the second year. Based on this
result, we use principal components analysis to create a global home literacy composite variable
(see Appendix Table A6 for the elements of this composite and their weightings).
To evaluate the effects of READY4K! on parents’ home literacy practices, we use the same
two-model approach described above. We include as outcomes the global home literacy composite
variable and specific home literacy practices, including how often parents read to their children,
looked at pictures in a book, told stories, pointed out words that begin with the same sound and
words that rhyme, showed their children the different parts of a book (e.g., cover, author, title, and
pages), recited nursery rhymes, pointed out letters in the home environment, and said and
explained new words using household objects. In the second year of the experiment we were able
to ask only a subset of the questions we fielded in the first year. We therefore present results for
each question fielded in each year, the home literacy composite variable from each year, and a
pooled home literacy composite variable.
We also use the aforementioned two-model approach to evaluate the effects of the
treatment on parental involvement at school and children’s early literacy development. The
outcomes for our analysis of parental involvement at school are teachers’ end-of-year ratings of
how often parents ask questions about their children, including questions about: their child’s
Page 23 of 51
interests and friends; how their child gets along with others; what their child is doing and learning
in school; their child’s understanding of early literacy skills; things they can do at home to help
their child learn to read; and children’s book recommendations. As with the parental home literacy
activity data, we use principal components analysis to create a global composite variable for
parental involvement at school. We find that one factor explains about 81 percent of the variance
in the school involvement data (see Appendix Table A6 for elements and their weightings).
To evaluate the effects of READY4K! on children’s literacy development, we use
children’s spring PALS scores. We examine the impact of the program on both children’s
individual subtest scores and their average scores on PALS. To generate average scores, we
standardized children’s subtests scores, took an average of these standardized scores, and
standardized the average. We chose this approach because not all students took all subtests and
different subtests contain different numbers of items (our objective was to give equal weighting to
each subtest). For example, the upper-case letter knowledge subtest has 26 items, whereas the
maximum score on the name writing subtest is seven. Given that initial knowledge explains much
of the variation in spring test scores, we include controls for children’s baseline assessment scores
in the fully-specified model, as described above.
3f. Attrition Analysis
Like most preschool programs throughout the country, SFUSD’s program experiences
significant attrition. As noted above, 96 participating families left the district prior to or during the
school year. Not including these families, 17 families opted out of the study. The children of 114
families were not tested in spring, in large part due to absences on testing day. As a result, we only
have spring test score data on 821 children (89 percent of the 935 families who stayed in the district
for the entire year). In total, 558 parents filled out the parent survey and 63 teachers provided
Page 24 of 51
information on the parental involvement of 258 parents (60 and 57 percent of staying families,
respectively).
The biggest concern with study attrition pertains to bias. If the types of treatment group
families who attrited are systematically different than the type of control group families who
attrited in a way that is related to study outcomes, then results are likely biased. For example, if
extremely poor families leave the treatment group at a higher rate than they leave the control group,
and income is positively related to study outcomes, than results are likely biased upward.
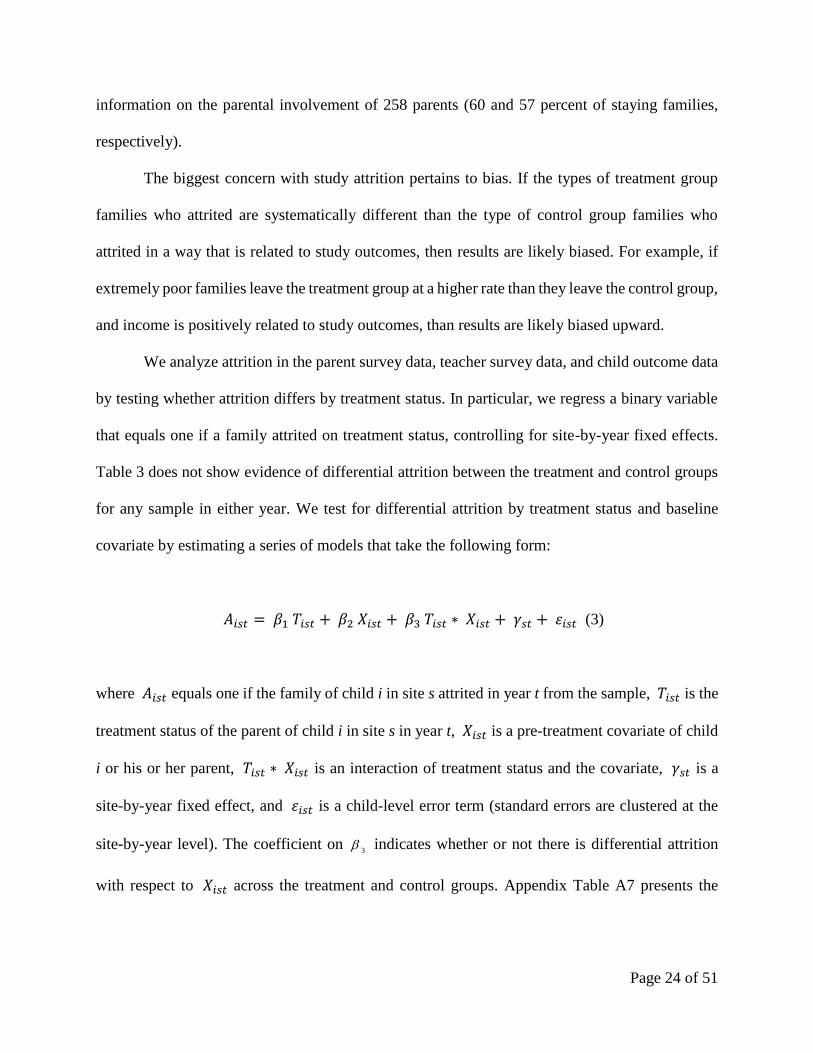
We analyze attrition in the parent survey data, teacher survey data, and child outcome data
by testing whether attrition differs by treatment status. In particular, we regress a binary variable
that equals one if a family attrited on treatment status, controlling for site-by-year fixed effects.
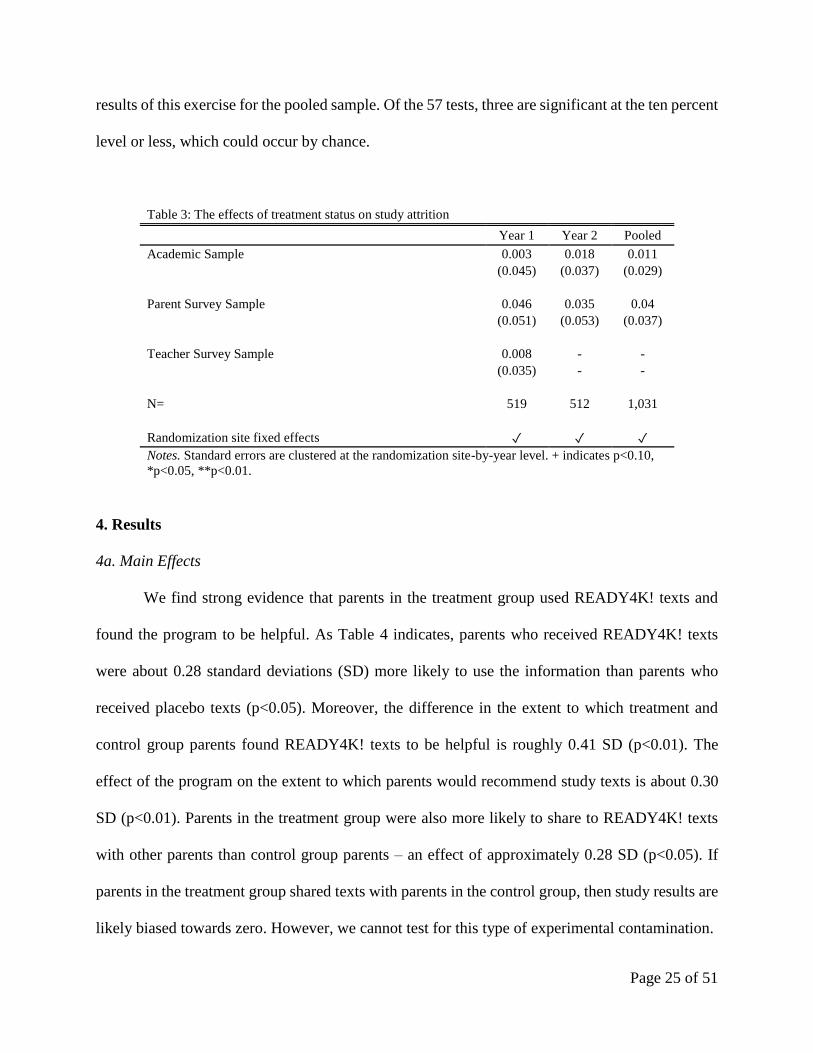
Table 3 does not show evidence of differential attrition between the treatment and control groups
for any sample in either year. We test for differential attrition by treatment status and baseline
covariate by estimating a series of models that take the following form:
𝐴𝑖𝑠𝑡 = 𝛽1 𝑇𝑖𝑠𝑡 + 𝛽2 𝑋𝑖𝑠𝑡 + 𝛽3 𝑇𝑖𝑠𝑡 ∗ 𝑋𝑖𝑠𝑡 + 𝛾𝑠𝑡 + 𝜀𝑖𝑠𝑡 (3)
where 𝐴𝑖𝑠𝑡 equals one if the family of child i in site s attrited in year t from the sample, 𝑇𝑖𝑠𝑡 is the
treatment status of the parent of child i in site s in year t, 𝑋𝑖𝑠𝑡 is a pre-treatment covariate of child
i or his or her parent, 𝑇𝑖𝑠𝑡 ∗ 𝑋𝑖𝑠𝑡 is an interaction of treatment status and the covariate, 𝛾𝑠𝑡 is a
site-by-year fixed effect, and 𝜀𝑖𝑠𝑡 is a child-level error term (standard errors are clustered at the
site-by-year level). The coefficient on indicates whether or not there is differential attrition
with respect to 𝑋𝑖𝑠𝑡 across the treatment and control groups. Appendix Table A7 presents the
3
Page 25 of 51
results of this exercise for the pooled sample. Of the 57 tests, three are significant at the ten percent
level or less, which could occur by chance.
Table 3: The effects of treatment status on study attrition
Year 1 Year 2 Pooled
Academic Sample 0.003 0.018 0.011
(0.045) (0.037) (0.029)
Parent Survey Sample 0.046 0.035 0.04
(0.051) (0.053) (0.037)
Teacher Survey Sample 0.008 - -
(0.035) - -
N= 519 512 1,031
Randomization site fixed effects ✓ ✓ ✓
Notes. Standard errors are clustered at the randomization site-by-year level. + indicates p<0.10,
*p<0.05, **p<0.01.
4. Results
4a. Main Effects
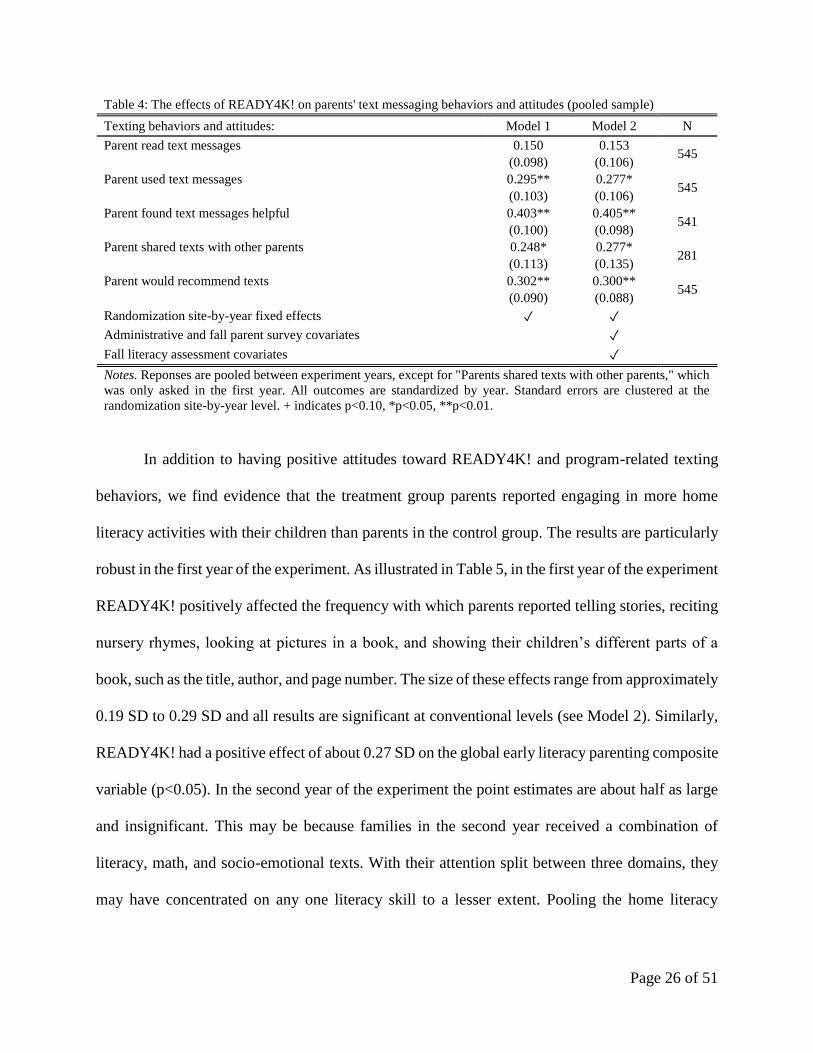
We find strong evidence that parents in the treatment group used READY4K! texts and
found the program to be helpful. As Table 4 indicates, parents who received READY4K! texts
were about 0.28 standard deviations (SD) more likely to use the information than parents who
received placebo texts (p<0.05). Moreover, the difference in the extent to which treatment and
control group parents found READY4K! texts to be helpful is roughly 0.41 SD (p<0.01). The
effect of the program on the extent to which parents would recommend study texts is about 0.30
SD (p<0.01). Parents in the treatment group were also more likely to share to READY4K! texts
with other parents than control group parents – an effect of approximately 0.28 SD (p<0.05). If
parents in the treatment group shared texts with parents in the control group, then study results are
likely biased towards zero. However, we cannot test for this type of experimental contamination.
Page 26 of 51
Table 4: The effects of READY4K! on parents' text messaging behaviors and attitudes (pooled sample)
Texting behaviors and attitudes: Model 1 Model 2 N
Parent read text messages 0.150 0.153 545
(0.098) (0.106)
Parent used text messages 0.295** 0.277* 545
(0.103) (0.106)
Parent found text messages helpful 0.403** 0.405** 541
(0.100) (0.098)
Parent shared texts with other parents 0.248* 0.277* 281
(0.113) (0.135)
Parent would recommend texts 0.302** 0.300** 545
(0.090) (0.088)
Randomization site-by-year fixed effects ✓ ✓
Administrative and fall parent survey covariates ✓
Fall literacy assessment covariates ✓
Notes. Reponses are pooled between experiment years, except for "Parents shared texts with other parents," which
was only asked in the first year. All outcomes are standardized by year. Standard errors are clustered at the
randomization site-by-year level. + indicates p<0.10, *p<0.05, **p<0.01.
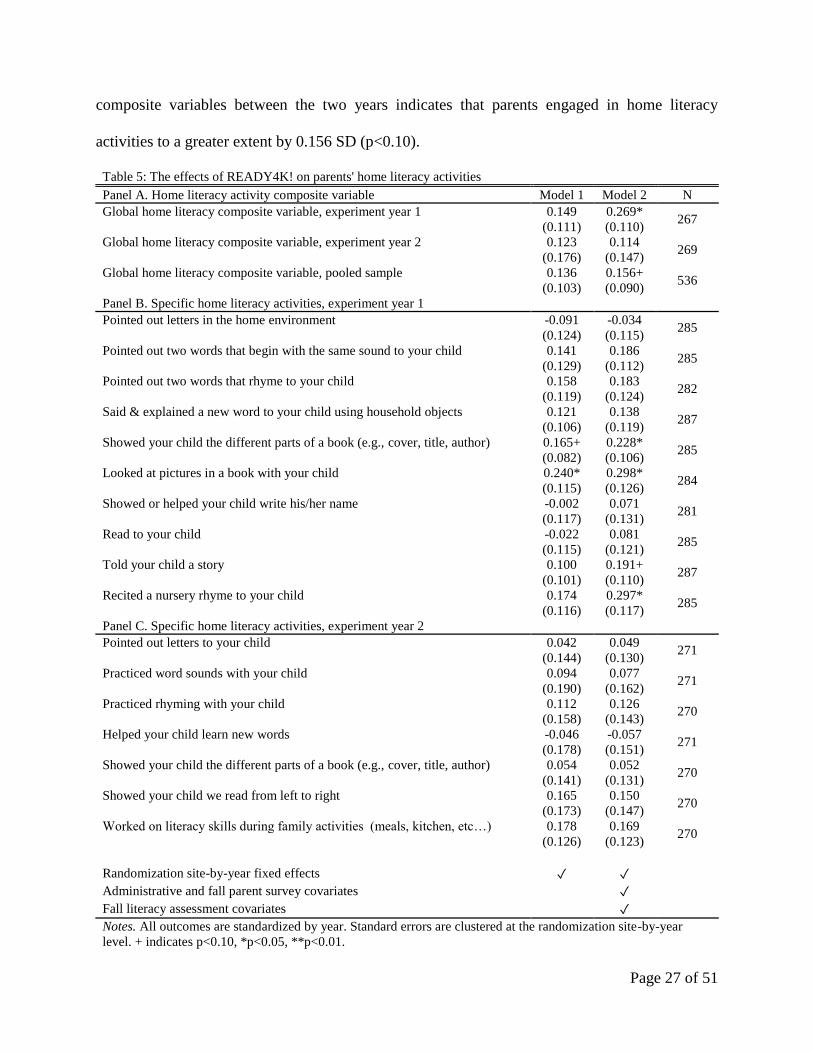
In addition to having positive attitudes toward READY4K! and program-related texting
behaviors, we find evidence that the treatment group parents reported engaging in more home
literacy activities with their children than parents in the control group. The results are particularly
robust in the first year of the experiment. As illustrated in Table 5, in the first year of the experiment
READY4K! positively affected the frequency with which parents reported telling stories, reciting
nursery rhymes, looking at pictures in a book, and showing their children’s different parts of a
book, such as the title, author, and page number. The size of these effects range from approximately
0.19 SD to 0.29 SD and all results are significant at conventional levels (see Model 2). Similarly,
READY4K! had a positive effect of about 0.27 SD on the global early literacy parenting composite
variable (p<0.05). In the second year of the experiment the point estimates are about half as large
and insignificant. This may be because families in the second year received a combination of
literacy, math, and socio-emotional texts. With their attention split between three domains, they
may have concentrated on any one literacy skill to a lesser extent. Pooling the home literacy
Page 27 of 51
composite variables between the two years indicates that parents engaged in home literacy
activities to a greater extent by 0.156 SD (p<0.10).
Table 5: The effects of READY4K! on parents' home literacy activities
Panel A. Home literacy activity composite variable Model 1 Model 2 N
Global home literacy composite variable, experiment year 1 0.149 0.269* 267
(0.111) (0.110)
Global home literacy composite variable, experiment year 2 0.123 0.114 269
(0.176) (0.147)
Global home literacy composite variable, pooled sample 0.136 0.156+ 536
(0.103) (0.090)
Panel B. Specific home literacy activities, experiment year 1
Pointed out letters in the home environment -0.091 -0.034 285
(0.124) (0.115)
Pointed out two words that begin with the same sound to your child 0.141 0.186 285
(0.129) (0.112)
Pointed out two words that rhyme to your child 0.158 0.183 282
(0.119) (0.124)
Said & explained a new word to your child using household objects 0.121 0.138 287
(0.106) (0.119)
Showed your child the different parts of a book (e.g., cover, title, author) 0.165+ 0.228* 285
(0.082) (0.106)
Looked at pictures in a book with your child 0.240* 0.298* 284
(0.115) (0.126)
Showed or helped your child write his/her name -0.002 0.071 281
(0.117) (0.131)
Read to your child -0.022 0.081 285
(0.115) (0.121)
Told your child a story 0.100 0.191+ 287
(0.101) (0.110)
Recited a nursery rhyme to your child 0.174 0.297* 285
(0.116) (0.117)
Panel C. Specific home literacy activities, experiment year 2
Pointed out letters to your child 0.042 0.049 271
(0.144) (0.130)
Practiced word sounds with your child 0.094 0.077 271
(0.190) (0.162)
Practiced rhyming with your child 0.112 0.126 270
(0.158) (0.143)
Helped your child learn new words -0.046 -0.057 271
(0.178) (0.151)
Showed your child the different parts of a book (e.g., cover, title, author) 0.054 0.052 270
(0.141) (0.131)
Showed your child we read from left to right 0.165 0.150 270
(0.173) (0.147)
Worked on literacy skills during family activities (meals, kitchen, etc…) 0.178 0.169 270
(0.126) (0.123)
Randomization site-by-year fixed effects ✓ ✓
Administrative and fall parent survey covariates ✓
Fall literacy assessment covariates ✓
Notes. All outcomes are standardized by year. Standard errors are clustered at the randomization site-by-year
level. + indicates p<0.10, *p<0.05, **p<0.01.
Page 28 of 51
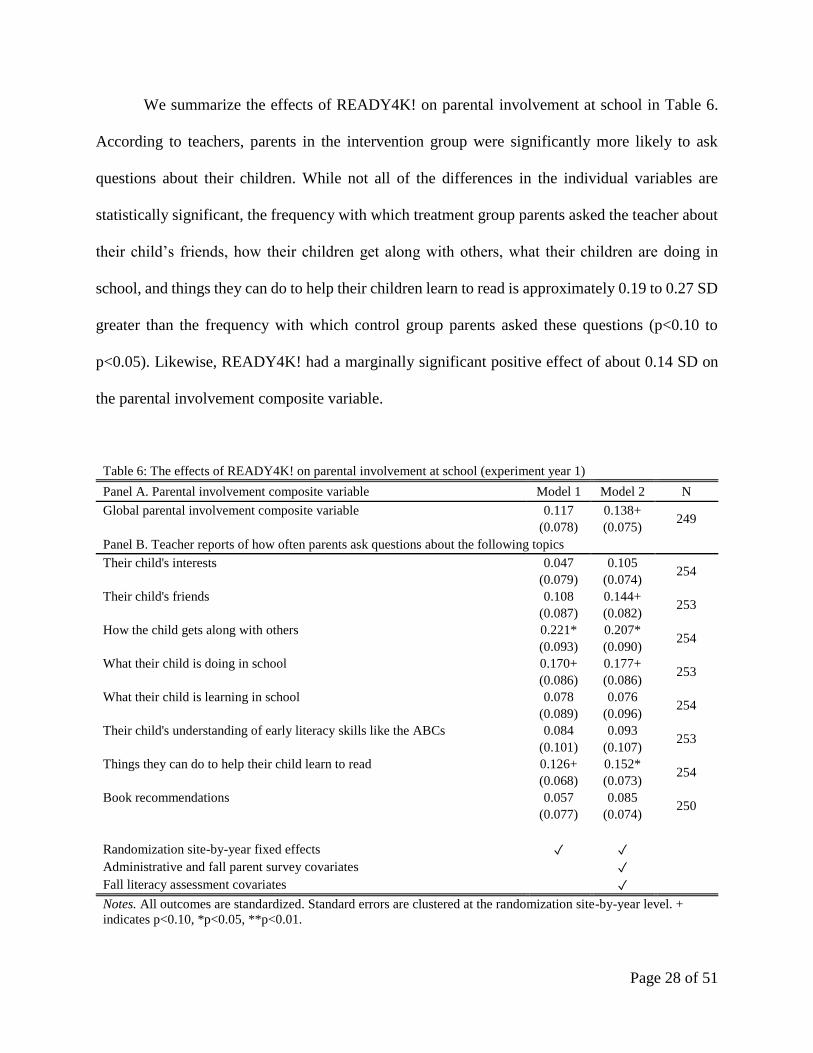
We summarize the effects of READY4K! on parental involvement at school in Table 6.
According to teachers, parents in the intervention group were significantly more likely to ask
questions about their children. While not all of the differences in the individual variables are
statistically significant, the frequency with which treatment group parents asked the teacher about
their child’s friends, how their children get along with others, what their children are doing in
school, and things they can do to help their children learn to read is approximately 0.19 to 0.27 SD
greater than the frequency with which control group parents asked these questions (p<0.10 to
p<0.05). Likewise, READY4K! had a marginally significant positive effect of about 0.14 SD on
the parental involvement composite variable.
Table 6: The effects of READY4K! on parental involvement at school (experiment year 1)
Panel A. Parental involvement composite variable Model 1 Model 2 N
Global parental involvement composite variable 0.117 0.138+ 249
(0.078) (0.075)
Panel B. Teacher reports of how often parents ask questions about the following topics
Their child's interests 0.047 0.105 254
(0.079) (0.074)
Their child's friends 0.108 0.144+ 253
(0.087) (0.082)
How the child gets along with others 0.221* 0.207* 254
(0.093) (0.090)
What their child is doing in school 0.170+ 0.177+ 253
(0.086) (0.086)
What their child is learning in school 0.078 0.076 254
(0.089) (0.096)
Their child's understanding of early literacy skills like the ABCs 0.084 0.093 253
(0.101) (0.107)
Things they can do to help their child learn to read 0.126+ 0.152* 254
(0.068) (0.073)
Book recommendations 0.057 0.085 250
(0.077) (0.074)
Randomization site-by-year fixed effects ✓ ✓
Administrative and fall parent survey covariates ✓
Fall literacy assessment covariates ✓
Notes. All outcomes are standardized. Standard errors are clustered at the randomization site-by-year level. +
indicates p<0.10, *p<0.05, **p<0.01.
Page 29 of 51
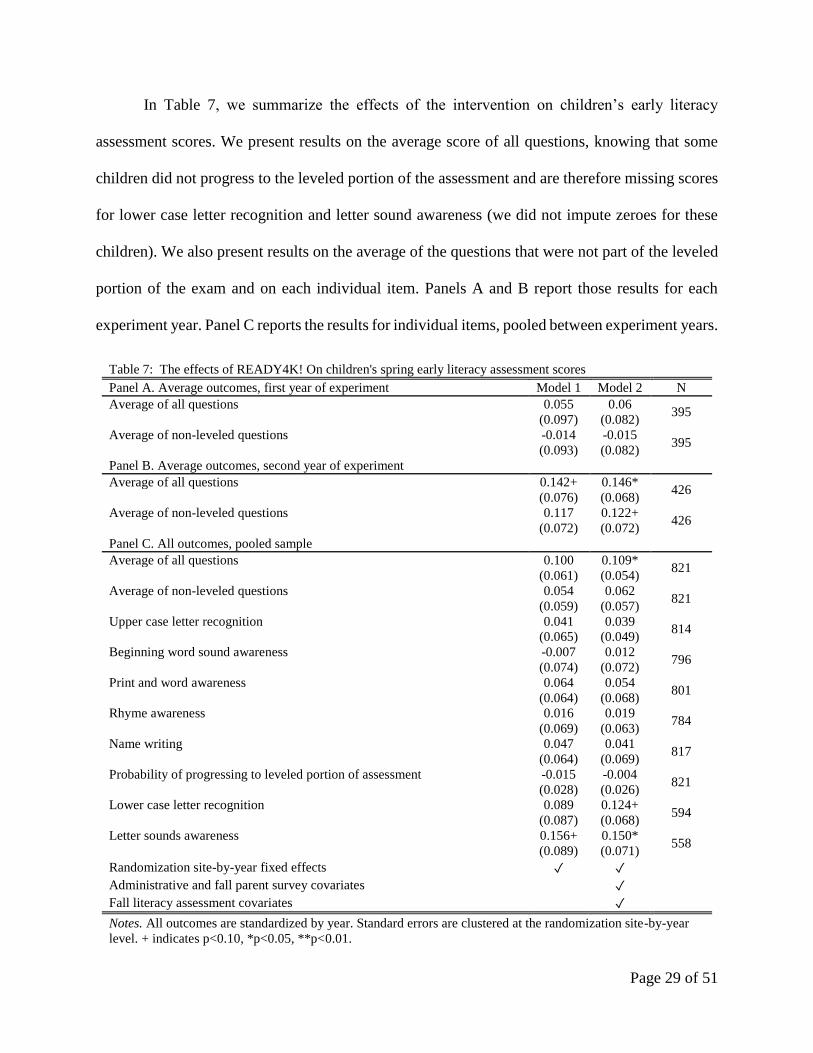
In Table 7, we summarize the effects of the intervention on children’s early literacy
assessment scores. We present results on the average score of all questions, knowing that some
children did not progress to the leveled portion of the assessment and are therefore missing scores
for lower case letter recognition and letter sound awareness (we did not impute zeroes for these
children). We also present results on the average of the questions that were not part of the leveled
portion of the exam and on each individual item. Panels A and B report those results for each
experiment year. Panel C reports the results for individual items, pooled between experiment years.
Table 7: The effects of READY4K! On children's spring early literacy assessment scores
Panel A. Average outcomes, first year of experiment Model 1 Model 2 N
Average of all questions 0.055 0.06 395
(0.097) (0.082)
Average of non-leveled questions -0.014 -0.015 395
(0.093) (0.082)
Panel B. Average outcomes, second year of experiment
Average of all questions 0.142+ 0.146* 426
(0.076) (0.068)
Average of non-leveled questions 0.117 0.122+ 426
(0.072) (0.072)
Panel C. All outcomes, pooled sample
Average of all questions 0.100 0.109* 821
(0.061) (0.054)
Average of non-leveled questions 0.054 0.062 821
(0.059) (0.057)
Upper case letter recognition 0.041 0.039 814
(0.065) (0.049)
Beginning word sound awareness -0.007 0.012 796
(0.074) (0.072)
Print and word awareness 0.064 0.054 801
(0.064) (0.068)
Rhyme awareness 0.016 0.019 784
(0.069) (0.063)
Name writing 0.047 0.041 817
(0.064) (0.069)
Probability of progressing to leveled portion of assessment -0.015 -0.004 821
(0.028) (0.026)
Lower case letter recognition 0.089 0.124+ 594
(0.087) (0.068)
Letter sounds awareness 0.156+ 0.150* 558
(0.089) (0.071)
Randomization site-by-year fixed effects ✓ ✓
Administrative and fall parent survey covariates ✓
Fall literacy assessment covariates ✓
Notes. All outcomes are standardized by year. Standard errors are clustered at the randomization site-by-year
level. + indicates p<0.10, *p<0.05, **p<0.01.
Page 30 of 51
Our findings indicate that the intervention had a number of positive effects on children’s
literacy development. Panel A illustrates that the first year of the experiment generated small, but
insignificant positive estimates on the average of all questions, and no effects on the average of
the non-leveled questions. In the second year, however, there is a robust 0.146SD (p<0.05) increase
in the average of all questions, and a marginally significant 0.122SD increase in the average of the
non-leveled questions. Panel C illustrates that pooling years results in a 0.109SD (p<0.05) increase
in the average of all questions. Looking at the individual questions, the results appear to be driven
by increases in lower case letter recognition and letter sounds awareness. The remainder of the
individual questions have positive, but small and insignificant point estimates. The intervention
also did not affect the propensity to move on to the leveled portion of the assessment. Given that
children were assessed seven to 11 weeks prior to the end of the intervention (22 to 34 percent of
the program remaining), it is possible to view this as a lower-bound estimate.
Ex post, it is unclear why the program was more effective in the second year. It is possible
that improvements to the program over time made the texts more effective. It is also possible that
practicing math and socio-emotional skills had spill over literacy benefits. Studies indicate that, at
this age, the barriers between domains may not be rigid and that increasing the effect of one domain
can improve performance on another (Butterworth 2005; Graziano et al. 2007; Sarama et al. 2012;
Morris et al. 2013). We are fielding more research to determine whether these “combination”
programs capture synergies between domains to amply results.
4b. Heterogeneity Analysis
The main results indicate that the program increased the literacy performance of children
in the treatment group by 0.11SD to 0.15 SD. An open question is which part of the skills
Page 31 of 51
distribution these types of interventions help the most. On one hand, families of children who
perform better
at baseline may be more likely to interact with the texts to produce even greater learning gains for
their children. If this were the case, the program may increase the inequality of outcomes in this
population. Alternatively, children who are weaker at baseline stand to benefit the most from
interacting with the activities because they have the most room to grow. In this scenario, the
intervention could plausibly decrease the achievement gap of children in this population.
We explore which of these scenarios are at play by dividing the sample in half based on
student performance at baseline. We identify the median student performance on the fall
administration of PALS and separate those children who scored above and below the median.
Table 8 presents the results for children scoring below the median of the baseline school
distributions and shows that the programmatic benefits are concentrated on this population of
students. Model 2 indicates that the treatment increased the average performance of children by
0.33SD and 0.35SD (p<0.05) in the first and second year of the program, respectively. In the
pooled sample, children benefited by 0.31 SD (p<0.01). Looking at the average of the non-leveled
questions, power is limited in any one year, though the point estimates are consistently around
0.25 SD. In the pooled sample the children benefited by a significant 0.26SD (p<0.05). The
analysis of individual questions indicate that these benefits are found on several individual skills.
Children benefited in identifying upper case letters, lower case letters, letter sounds, and in the
ability to write their name. Point estimates range from 0.18SD to 0.53SD (p<0.10 to p<0.05).
Appendix Table A5 reports these results for children who scored above the median of the baseline
skill distribution. Strikingly, all point estimates are insignificant and quantitatively small, with no
consistent direction in point estimates. Overall, children weaker at baseline experienced the

Page 32 of 51
benefits of the program, indicating that the program may have reduced some achievement gaps.4
Notably, these results are consistent between years of the experiment.
Table 8: Heterogeneity in READY4K! effects on children's spring early literacy assessment scores
Sample of children below median of baseline skills
Panel A. Average outcomes, first year of experiment Model 1 Model 2 N
Average of all questions 0.193 0.330* 198
(0.155) (0.137)
Average of non-leveled questions 0.128 0.253+ 198
(0.154) (0.145)
Panel B. Average outcomes, second year of experiment
Average of all questions 0.306* 0.348+ 207
(0.132) (0.180)
Average of non-leveled questions 0.250+ 0.286 207
(0.135) (0.183)
Panel C. All outcomes, pooled sample
Average of all questions 0.253* 0.313** 406
(0.101) (0.108)
Average of non-leveled questions 0.192+ 0.261* 405
(0.102) (0.112)
Upper case letter recognition 0.123 0.175+ 400
(0.101) (0.101)
Beginning word sound awareness -0.051 0.014 388
(0.137) (0.126)
Print and word awareness 0.179 0.179 391
(0.110) (0.118)
Rhyme awareness 0.11 0.118 378
(0.107) (0.117)
Name writing 0.218 0.287+ 402
(0.147) (0.156)
Probability of progressing to leveled portion of assessment -0.017 0.014 405
(0.046) (0.047)
Lower case letter recognition 0.336+ 0.529** 193
(0.186) (0.182)
Letter sounds awareness 0.366* 0.456* 171
(0.215) (0.233)
Randomization site-by-year fixed effects ✓ ✓
Administrative and fall parent survey covariates ✓
Fall literacy assessment covariates ✓
Notes. All outcomes are standardized by year. Standard errors are clustered at the randomization site-by-year
level. + indicates p<0.10, *p<0.05, **p<0.01.
4 Substantial heterogeneity can exist based on ethnicity of the participating families and by texting
language. Small sample sizes hinder such an analysis, though there is suggestive evidence that
results are larger for Hispanic families and for families that received texts in English or Spanish.
These effects are once again concentrated on those children who scored below the median of the
baseline PALS distribution.
Page 33 of 51
5. Discussion
Young children with few learning opportunities at home exhibit fewer skills across a broad
range of developmental domains – skills that are critical for economic success later in life
(Heckman 2006). Traditional parenting information sessions often do little to ameliorate
differences in children’s at-home experiences. Interventions that target parents’ literacy skills and
in-home visitations show more promise; however, access to these programs is an issue. Moreover,
some parents who acquire the skills necessary to support their child’s learning fail to stay involved
in the long term, in part due to behavioral barriers.
This study examines the effectiveness of an early literacy text messaging program that
targets the behavioral barriers to parental involvement by breaking down the complexity of
parenting into bite-sized pieces and proving continuous encouragement and support over long
periods of time. We find that the texting program approach positively affected parents and their
children. Receiving READY4K! texts increased the extent to which parents engaged in home
literacy activities with their children, with effect sizes ranging from about 0.16 SD to 0.29 SD. The
intervention also increased involvement at school, as reported by teachers, with effect sizes of 0.14
SD to 0.27 SD. Increases in parental activity and involvement led to learning gains among children,
as READY4K! had an overall, significant positive effect of roughly 0.11 standard deviations on
students’ average spring PALS scores. The results, however, are concentrated on children who
scored below the median of the baseline skills distribution. The 0.31 SD increase in scores among
this group suggests that the program helps decrease achievement gaps among students.
One compelling implication of the study’s findings is that text messaging and similar
technologies that can provide small bits of information to a broad population could be viable
strategies for promoting parental involvement and changing other complex adult behaviors. The
Page 34 of 51
vast majority of American adults have cell phones, nearly all cell phone owners already send and
receive texts, and texting rates are particularly high in black and Hispanic populations. Moreover,
virtually all text messages are opened (by comparison, the e-mail open rate in education is about
36 percent). We spent less than one dollar per family to send text messages per school year, and
fixed program expenses such as content development costs trend towards zero on a per-family
basis as the program scales. Scaling text messaging programs like READY4K! is easy, as adding
users to the program requires little administrative work. Based on its widespread use, low cost,
and scalability, text messaging is a potentially attractive alternative to other parenting
interventions, which generally place significant demands on parents’ time and effort and can be
costly for providers, as well.
Page 35 of 51
References
Abraham, C. and Michie, S. (2008). A taxonomy of behavior change techniques used in
interventions. Health Psychology, 27(3), pp. 379.
Anderson, M. (2015). Technology device ownership: 2015. Pew Research. Retrieved,
December 15, 2015 from http://www.pewinternet.org/2015/10/29/technology-device
ownership-2015
Astuto, J. and LaRue A. (2009). Home visitation and young children: An approach worth investing
in? Society for Research in Child Development. Retrieved, December 15, 2015 from
https://eric.ed.gov/?id=ED509749
Avery, C. and Kane, T.J. (2004). Student perceptions of college opportunities. The Boston COACH
Program. In Caroline Hoxby (ed.) College choices: The economics of where to go, when to
go, and how to pay for it, pp.355-394, Chicago: The University of Chicago Press.
Azzi-Lessing, L. (2011). Home visitation programs: Critical issues and future directions. Early
Childhood Research Quarterly, 26(4), pp. 387-398.
Bandura, A. and Dale, S. (1981). Cultivating competence, self-efficacy, and intrinsic interest
through proximal self-motivation. Journal of Personality and Social Psychology, 41(3),
pp. 586-598.
Bergman, P. (2016). Parent-Child information frictions and human capital investment:
Evidence from a field experiment. Working Paper. Retrieved April 8, 2016 from:
http://www.columbia.edu/~psb2101/BergmanSubmission.pdf
Bettinger, E. P., Long, B.T., Oreopoulos, P., and Sanbonmatsu, L. (2012). The role of application
assistance and information in college decisions: Results from the H&R Block FAFSA
experiment. The Quarterly Journal of Economics, 127(3), pp. 1205-1242.
Blom-Hoffman, J., O’Neil-Pirozzi, T., Volpe, R., Cutting, J., and Bissinger, E. (2007). Instructing
parents to use dialogic reading strategies with preschool children: Impact of a video-based
training program on caregiver reading behaviors and children’s related verbalizations.
Journal of Applied School Psychology, 23(1), pp. 117-131.
Bradley, R. H., Corwyn, R.F., Burchinal, M., McAdoo, H.P., and Coll, C.G. (2001). The home
environments of children in the United States part II: Relations with behavioral
development through age thirteen. Child Development, 72(6), pp. 1868-1886.
Bradley, R. H., Corwyn, R.F. McAdoo H.P., and Coll, C.G. (2001). The home environments of
children in the United States part I: Variations by age, ethnicity, and poverty status. Child
Development, 72(6), pp. 1844-1867.
Page 36 of 51
Brotman, L. M., Calzada, E., Huang, K.Y., Kingston, S., Dawson‐McClure, S., Kamboukos, D.,
Rosenfelt, A., Schwab, A., and Petkova, E. (2011). Promoting effective parenting practices
and preventing child behavior problems in school among ethnically diverse families from
underserved, urban communities. Child Development, 82(1), pp. 258-276.
Butterworth, B. (2005). The development of arithmetic abilities. Journal Child Psychology and
Psychiatry, 46(1), pp. 3-18.
California Department of Education. (2008). California preschool learning foundations, volume 1.
Sacramento, CA. Retrieved, December 15, 2015 from http://www.cde.ca.gov/sp/cd/re/
documents/preschoollf.pdf
Castleman, B. L. and Page L.C. (2015). Summer nudging: Can personalized text messages and
peer mentor outreach increase college going among low-income high school graduates?
Journal of Economic Behavior & Organization, 115, pp. 144-160.
Costello, J.E., Compton, S.N., Keeler G., and Angold, A. (2003). Relationships between poverty
and psychopathology: A natural experiment. Journal of the American Medical Association,
290(15), pp. 2023-2029.
Dahl, G. B. and Lochner, L. (2012). The impact of family income on child achievement: Evidence
from the earned income tax credit. The American Economic Review, 102(5), pp. 1927-
1956.
DellaVigna, S. (2009). Psychology and economics: Evidence from the field. Journal of Economic
Literature, 47(2), pp. 315-372.
Duncan, G. J., Ludwig, J., and Magnuson, K.A. (2010). Child development. In Phillip Levine and
David Zimmerman (eds.) Targeting investments in children: Fighting poverty when
resources are limited, pp. 27-58, Chicago: University of Chicago Press.
Ehrlich, S. (2013). Mogreet releases best practices guide for successfully navigating text marketing
rules and regulations. The Wall Street Journal, February 17, 2013.
Golova, N., Alario A.J., Vivier, P.M., Rodriguez, M., and High, P.C. (1999). Literacy promotion
for Hispanic families in a primary care setting: A randomized, controlled trial. Pediatrics,
103(5), pp. 993-997.
Gomby, D. S. (2005). Home visitation in 2005: Outcomes for children and parents. Committee on
Economic Development. Retrieved, December 15, 2015 from http://legis.wisconsin.gov/lc/
committees/study/2008/SFAM08/files/GombyHVoutcomes2005.pdf
Gomby, D.S., Culross, P.L., and Behrman, R.E.. (1999). Home visiting: Recent program
evaluations: Analysis and recommendations. The Future of Children, 9(1), pp. 4-26.
Page 37 of 51
Graziano, P. A., Reavis, R.D., Keane, S.P., and Calkins, S.D. (2007). The role of emotion regulation
in children’s early academic success. Journal of School Psychology, 45(1), pp. 3-19.
Grodsky, E. and Jones, MT. (2007). Real and imagined barriers to college entry: Perceptions of
cost. Social Science Research, 36(2), pp. 745-766.
Hart, B., and Risley, T.R. (1995). Meaningful differences in the everyday experience of young
American children, 1st ed. Baltimore, MD: Paul H. Brookes Publishing.
Hastings, J.S. and Weinstein, J.M. (2008). Information, school choice, and academic achievement:
Evidence from two experiments. Quarterly Journal of Economics, 123(4), pp. 1373-1414.
Heckman, J.J. (2006). Skill formation and the economics of investing in disadvantaged children.
Science, 312(5782), pp. 1900-1902.
Invernizzi, M., Sullivan A., Meier, J., and Swank, L. (2004). Phonological Awareness Literacy
Screening (PALS) prek teacher’s Manual. University of Virginia.
Iyengar, S., and Lepper, M. (2000). When choice is demotivating: Can one desire too much of a
good thing? Personality & Social Psychology, 79(6), pp. 995-1006.
Jordan, G.E., Snow C.E., and Porche, M.V. (2000). Project EASE: The effect of a family literacy
project on kindergarten students’ early literacy skills. Reading Research Quarterly, 35(4),
pp. 524-546.
Josephson, W.L. (1987). Television violence and children's aggression: Testing the priming, social
script, and disinhibition predictions. Journal of Personality and Social Psychology, 53(5),
pp. 882-890.
Karlan, D., McConnell, M., Mullainathan S., and Zinman J. (2016). Getting to the top of mind:
How reminders increase saving. Management Science, 62(12), pp. 3393-3411.
Lonigan, C. J., and Shanahan, T. (2009). Developing early literacy: Report of the National Early
Literacy Panel. National Institute for Literacy. Retrieved, December 15, 2005 from
https://eric.ed.gov/?id=ED508381
Mani, A., Mullainathan, S., Shafir, E., and Zhao, J. (2013). Poverty Impedes Cognitive Function.
Science, 341(6149), pp. 976-980.
Manz, P.H., Hughes C., Barnabas E., Bracaliello C., and Ginsburg-Block, M. (2010). A descriptive
review and meta-analysis of family-based emergent literacy interventions: To what extent
is the research applicable to low-income, ethnic-minority or linguistically-diverse young
children? Early Childhood Research Quarterly, 25(4), pp. 409-431.
Page 38 of 51
Melhuish, E. C., Phan, M.B., Sylva, K., Sammons, P., Siraj‐Blatchford, I., and Taggart, B. (2008).
Effects of the home learning environment and preschool center experience upon literacy
and numeracy development in early primary school. Journal of Social Issues, 64(1), pp.
95-114.
Mendelsohn, A.L., Mogilner L.N., Dreyer, B.P., Forman, J.A., Weinstein, S.C., Broderick, M.,
Cheng, K.J., Magloire T., Moore, T., and Napier, C. (2001). The impact of a clinic-based
literacy intervention on language development in inner-city preschool children. Pediatrics,
107(1), pp. 130-134.
Morris, P., Millenky, M., Raver, C.C., and Jones, S.M. (2013). Does a preschool social and
emotional learning intervention pay off for classroom instruction and children’s behavior
and academic skills? Evidence from the Foundations of Learning project. Early Education
and Development, 24(7), pp. 1,020-1,042.
Mullainathan, S., and Thaler, R.H. (2000). Behavioral Economics. NBER Working Paper No.
w7948. Retrieved December 15, 2015 from http://www.nber.org/papers/w7948
Needlman, R., Toker, K.H., Dreyer, B.P., Klass, P., and Mendelsohn, A.L. (2005). Effectiveness of
a primary care intervention to support reading aloud: A multicenter evaluation. Ambulatory
Pediatrics, 5(4), pp. 209-215.
NICHD Early Child Care Research Network. (2006). Child-care effect sizes for the NICHD study
of early child care and youth development. The American Psychologist, 61, pp. 99.
Patrick, K., Raab, F., Adams, M., Dillon, L., Zabinski, M., Rock, C., Griswold, W., and Norman,
G. (2009). A Text Message-Based Intervention for Weight Loss. Journal of Medical
Internet Research, 11(1), p. e1.
Petrie, K.J., Perry, K., Broadbent, E., and Weinman, J. (2012). A text message programme designed
to modify patients’ illness and treatment beliefs improves self‐reported adherence to
asthma preventer medication. British Journal of Health Psychology, 17(1), pp. 74-84.
Prinz, R.J., and Miller, G.E. (1994). Family-based treatment for childhood antisocial behavior:
Experimental influences on dropout and engagement. Journal of Consulting and Clinical
Psychology, 62(3), pp. 645-650.
Reese, E., Sparks, A., and Leyva, L. (2010). A review of parent interventions for preschool
children’s language and emergent literacy. Journal of Early Childhood Literacy, 10(1), pp.
97-117.
Riccio, J., Dechausay, N., Miller, C., Nuñez, S., Verma, N., and Yang, E. (2013). Conditional cash
transfers in New York City: The continuing story of the Opportunity NYC-Family Rewards
Demonstration. MDRC. Retrieved, December 15, 2015 from http://www.mdrc.org/
publication/conditional-cash-transfers-new-york-city
Page 39 of 51
Rodgers, A., Corbett, T., Bramley,D., Riddell, T., Wills, M., Lin, R.B., and Jones, M. (2005). Do
U Smoke After Txt? Results of a Randomised Trial of Smoking Cessation Using Text
Messaging. Tobacco Control, 14(4), pp. 255-261.
Sarama, J., Lange, A.A., Clements, D.H., and Wolfe, C.B. (2012). The impacts of an early
mathematics curriculum on oral language and literacy. Early Childhood Research
Quarterly, 27(3), pp. 489-502.
Sharif, I., Rieber, S., and Ozuah, P.O. (2002). Exposure to Reach Out and Read and vocabulary
outcomes in inner city preschoolers. Journal of the National Medical Association, 94(3),
pp. 171-177
.
Simon, H.A. (1955). A behavioral model of rational choice. The Quarterly Journal of Economics,
69(1), pp. 99-118.
Shah, A.K., Mullainathan S., and Shafir, E. (2012). The consequences of having too little. Science,
338(6107), pp. 682-685.
Stevenson, H. W., Chen, C., and Uttal, D.H. (1990). Beliefs and achievement: A study of black,
white, and Hispanic children. Child Development, 61(2), pp. 508-523.
Thaler, R.H., and Sunstein, C.R. (2009). Nudge: Improving decisions about health, wealth, and
happiness, 2nd ed. New Haven, CT: Yale Press.
United States Department of Health and Human Services. (1996). Physical activity and health: A
report of the surgeon general. Retrieved, December 15, 2015 from https://www.cdc.gov/
nccdphp/sgr/
Valant, J., and Loeb, S. (2014). Information, choice, and decision-making: Field experiments with
adult and student school choosers. Working Paper.
Whitehurst, G.J., Epstein, J.N., Angell, A.L., Payne, A.C., Crone, D.A., and Fischel, J.E. (1994).
Outcomes of an emergent literacy intervention in Head Start. Journal of Educational
Psychology, 86(4), pp. 542.
Yoon, K.H. and Kim, H.S. (2008). A SMS by cellular phone intervention in type 2 diabetic patients
for 12 months. Diabetes Research & Clinical Practice, 79(2), 256-261.
Zickuhr, K., and Smith, A. (2012). Digital differences. Pew Research Center. Retrieved, December
15, 2015 from http://www.english.illinois.edu/-people-/faculty/debaron/482/482readings/
PEW_Class.pdf
Zuckerman, B. (2009). Promoting early literacy in pediatric practice: Twenty years of Reach Out
and Read. Pediatrics, 124(6), pp. 1660-166.
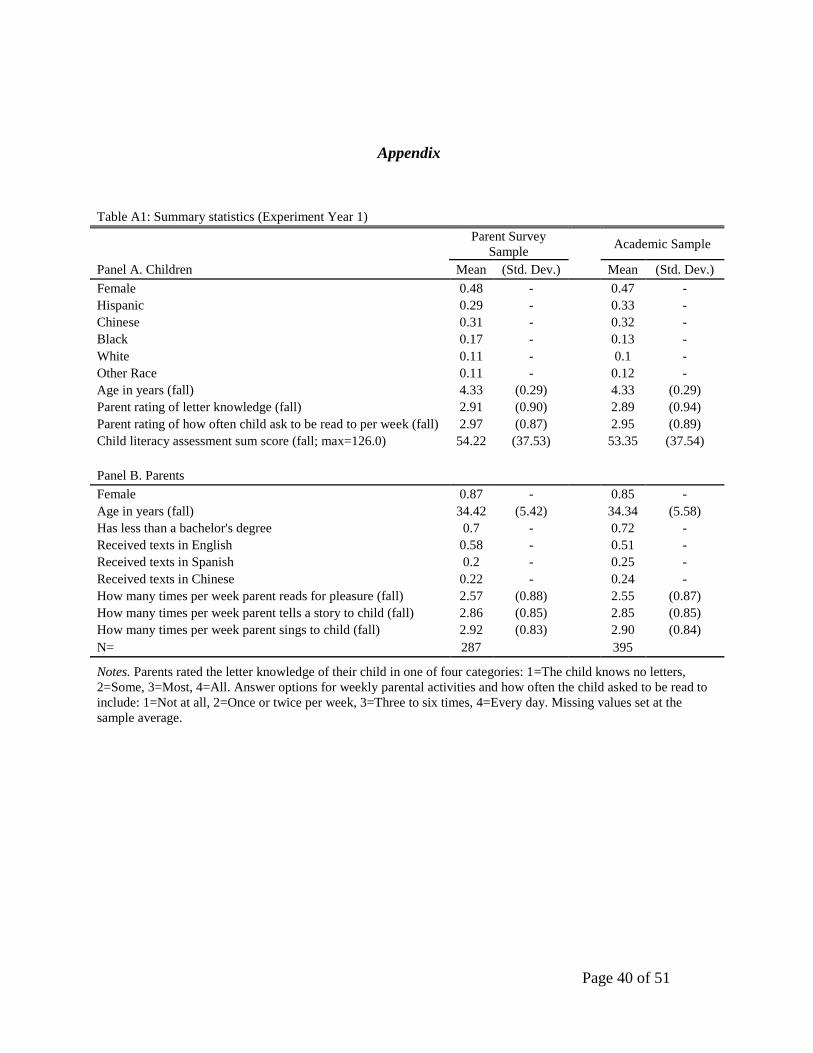
Page 40 of 51
Appendix
Table A1: Summary statistics (Experiment Year 1)
Parent Survey
Sample Academic Sample
Panel A. Children Mean (Std. Dev.) Mean (Std. Dev.)
Female 0.48 - 0.47 -
Hispanic 0.29 - 0.33 -
Chinese 0.31 - 0.32 -
Black 0.17 - 0.13 -
White 0.11 - 0.1 -
Other Race 0.11 - 0.12 -
Age in years (fall) 4.33 (0.29) 4.33 (0.29)
Parent rating of letter knowledge (fall) 2.91 (0.90) 2.89 (0.94)
Parent rating of how often child ask to be read to per week (fall) 2.97 (0.87) 2.95 (0.89)
Child literacy assessment sum score (fall; max=126.0) 54.22 (37.53) 53.35 (37.54)
Panel B. Parents
Female 0.87 - 0.85 -
Age in years (fall) 34.42 (5.42) 34.34 (5.58)
Has less than a bachelor's degree 0.7 - 0.72 -
Received texts in English 0.58 - 0.51 -
Received texts in Spanish 0.2 - 0.25 -
Received texts in Chinese 0.22 - 0.24 -
How many times per week parent reads for pleasure (fall) 2.57 (0.88) 2.55 (0.87)
How many times per week parent tells a story to child (fall) 2.86 (0.85) 2.85 (0.85)
How many times per week parent sings to child (fall) 2.92 (0.83) 2.90 (0.84)
N= 287 395
Notes. Parents rated the letter knowledge of their child in one of four categories: 1=The child knows no letters,
2=Some, 3=Most, 4=All. Answer options for weekly parental activities and how often the child asked to be read to
include: 1=Not at all, 2=Once or twice per week, 3=Three to six times, 4=Every day. Missing values set at the
sample average.
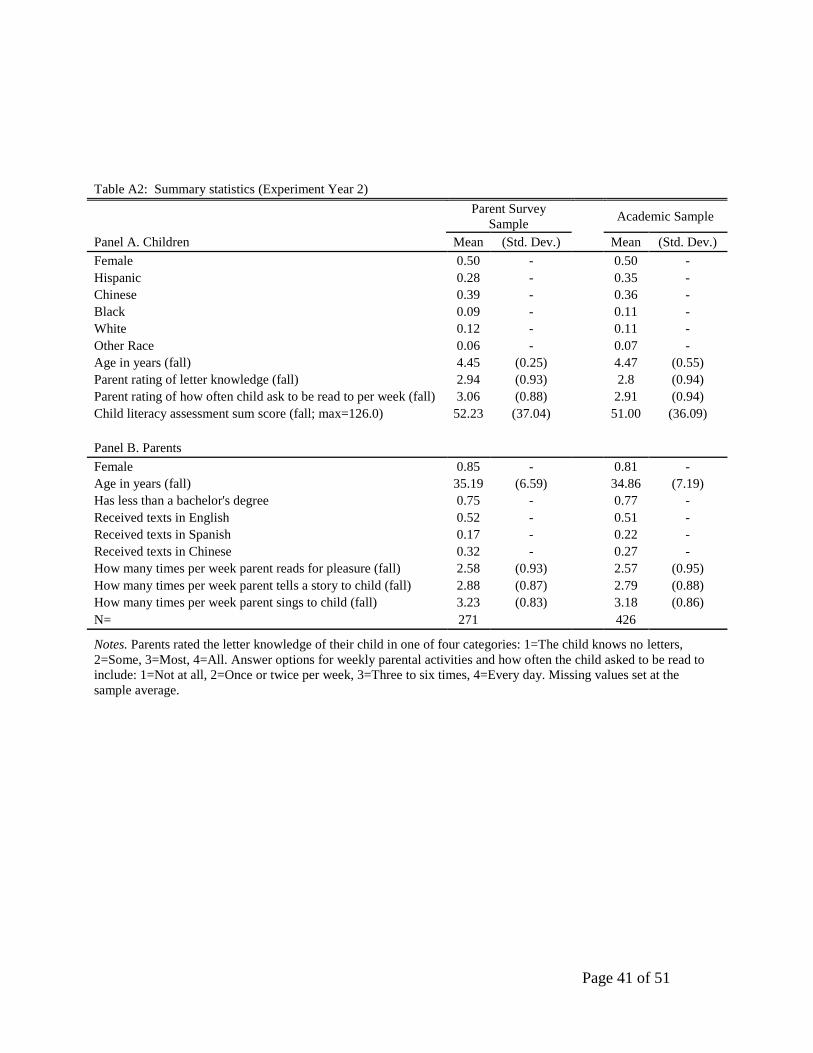
Page 41 of 51
Table A2: Summary statistics (Experiment Year 2)
Parent Survey
Sample Academic Sample
Panel A. Children Mean (Std. Dev.) Mean (Std. Dev.)
Female 0.50 - 0.50 -
Hispanic 0.28 - 0.35 -
Chinese 0.39 - 0.36 -
Black 0.09 - 0.11 -
White 0.12 - 0.11 -
Other Race 0.06 - 0.07 -
Age in years (fall) 4.45 (0.25) 4.47 (0.55)
Parent rating of letter knowledge (fall) 2.94 (0.93) 2.8 (0.94)
Parent rating of how often child ask to be read to per week (fall) 3.06 (0.88) 2.91 (0.94)
Child literacy assessment sum score (fall; max=126.0) 52.23 (37.04) 51.00 (36.09)
Panel B. Parents
Female 0.85 - 0.81 -
Age in years (fall) 35.19 (6.59) 34.86 (7.19)
Has less than a bachelor's degree 0.75 - 0.77 -
Received texts in English 0.52 - 0.51 -
Received texts in Spanish 0.17 - 0.22 -
Received texts in Chinese 0.32 - 0.27 -
How many times per week parent reads for pleasure (fall) 2.58 (0.93) 2.57 (0.95)
How many times per week parent tells a story to child (fall) 2.88 (0.87) 2.79 (0.88)
How many times per week parent sings to child (fall) 3.23 (0.83) 3.18 (0.86)
N= 271 426
Notes. Parents rated the letter knowledge of their child in one of four categories: 1=The child knows no letters,
2=Some, 3=Most, 4=All. Answer options for weekly parental activities and how often the child asked to be read to
include: 1=Not at all, 2=Once or twice per week, 3=Three to six times, 4=Every day. Missing values set at the
sample average.
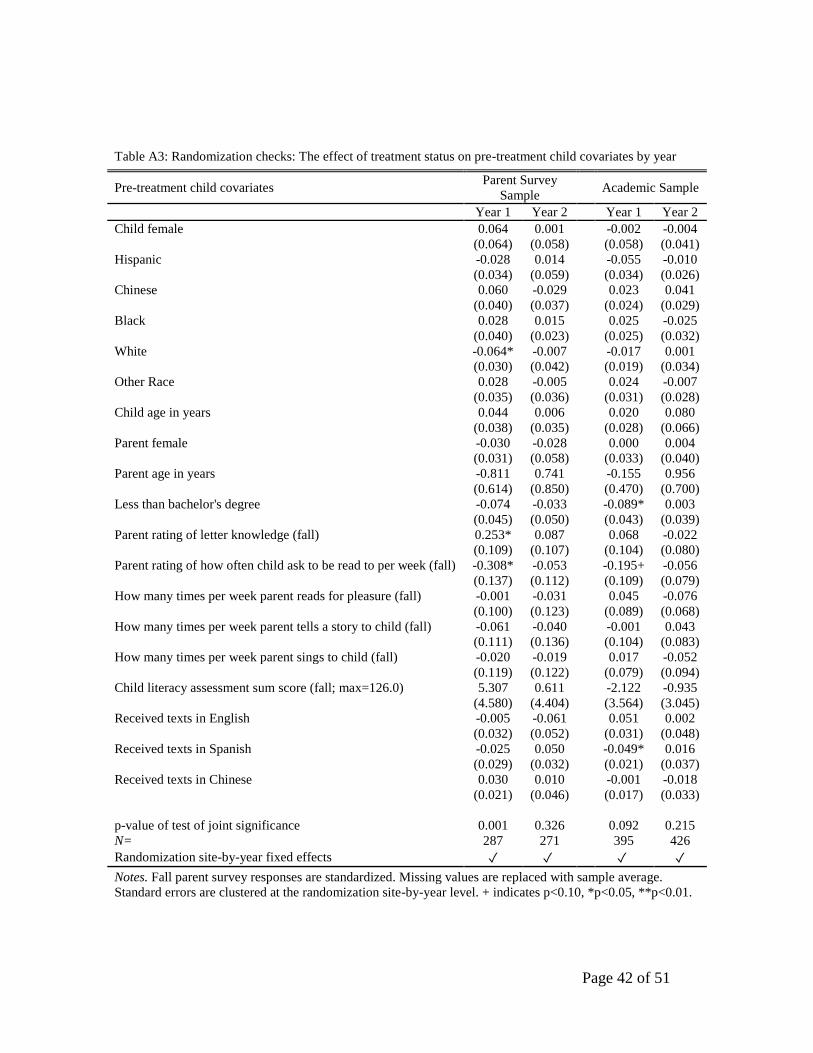
Page 42 of 51
Table A3: Randomization checks: The effect of treatment status on pre-treatment child covariates by year
Pre-treatment child covariates Parent Survey
Sample Academic Sample
Year 1 Year 2 Year 1 Year 2
Child female 0.064 0.001 -0.002 -0.004
(0.064) (0.058) (0.058) (0.041)
Hispanic -0.028 0.014 -0.055 -0.010
(0.034) (0.059) (0.034) (0.026)
Chinese 0.060 -0.029 0.023 0.041
(0.040) (0.037) (0.024) (0.029)
Black 0.028 0.015 0.025 -0.025
(0.040) (0.023) (0.025) (0.032)
White -0.064* -0.007 -0.017 0.001
(0.030) (0.042) (0.019) (0.034)
Other Race 0.028 -0.005 0.024 -0.007
(0.035) (0.036) (0.031) (0.028)
Child age in years 0.044 0.006 0.020 0.080
(0.038) (0.035) (0.028) (0.066)
Parent female -0.030 -0.028 0.000 0.004
(0.031) (0.058) (0.033) (0.040)
Parent age in years -0.811 0.741 -0.155 0.956
(0.614) (0.850) (0.470) (0.700)
Less than bachelor's degree -0.074 -0.033 -0.089* 0.003
(0.045) (0.050) (0.043) (0.039)
Parent rating of letter knowledge (fall) 0.253* 0.087 0.068 -0.022
(0.109) (0.107) (0.104) (0.080)
Parent rating of how often child ask to be read to per week (fall) -0.308* -0.053 -0.195+ -0.056
(0.137) (0.112) (0.109) (0.079)
How many times per week parent reads for pleasure (fall) -0.001 -0.031 0.045 -0.076
(0.100) (0.123) (0.089) (0.068)
How many times per week parent tells a story to child (fall) -0.061 -0.040 -0.001 0.043
(0.111) (0.136) (0.104) (0.083)
How many times per week parent sings to child (fall) -0.020 -0.019 0.017 -0.052
(0.119) (0.122) (0.079) (0.094)
Child literacy assessment sum score (fall; max=126.0) 5.307 0.611 -2.122 -0.935
(4.580) (4.404) (3.564) (3.045)
Received texts in English -0.005 -0.061 0.051 0.002
(0.032) (0.052) (0.031) (0.048)
Received texts in Spanish -0.025 0.050 -0.049* 0.016
(0.029) (0.032) (0.021) (0.037)
Received texts in Chinese 0.030 0.010 -0.001 -0.018
(0.021) (0.046) (0.017) (0.033)
p-value of test of joint significance 0.001 0.326 0.092 0.215
N= 287 271 395 426
Randomization site-by-year fixed effects ✓ ✓ ✓ ✓
Notes. Fall parent survey responses are standardized. Missing values are replaced with sample average.
Standard errors are clustered at the randomization site-by-year level. + indicates p<0.10, *p<0.05, **p<0.01.
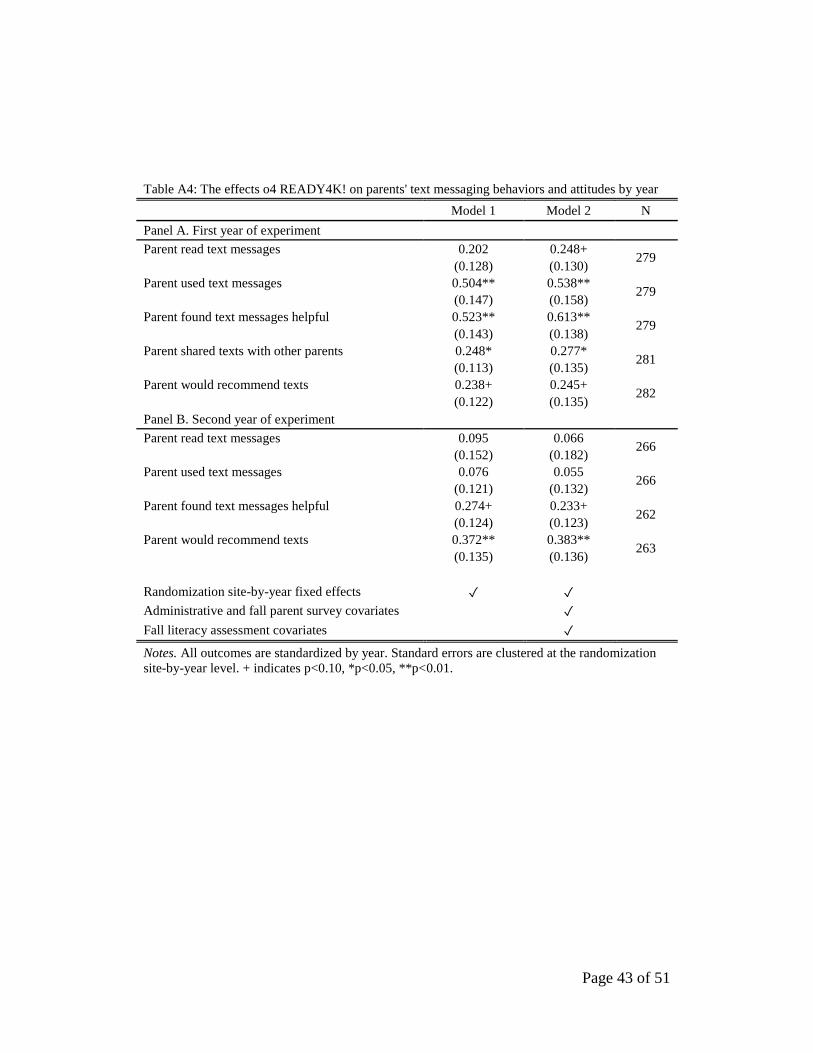
Page 43 of 51
Table A4: The effects o4 READY4K! on parents' text messaging behaviors and attitudes by year
Model 1 Model 2 N
Panel A. First year of experiment
Parent read text messages 0.202 0.248+ 279
(0.128) (0.130)
Parent used text messages 0.504** 0.538** 279
(0.147) (0.158)
Parent found text messages helpful 0.523** 0.613** 279
(0.143) (0.138)
Parent shared texts with other parents 0.248* 0.277* 281
(0.113) (0.135)
Parent would recommend texts 0.238+ 0.245+ 282
(0.122) (0.135)
Panel B. Second year of experiment
Parent read text messages 0.095 0.066 266
(0.152) (0.182)
Parent used text messages 0.076 0.055 266
(0.121) (0.132)
Parent found text messages helpful 0.274+ 0.233+ 262
(0.124) (0.123)
Parent would recommend texts 0.372** 0.383** 263
(0.135) (0.136)
Randomization site-by-year fixed effects ✓ ✓
Administrative and fall parent survey covariates ✓
Fall literacy assessment covariates ✓
Notes. All outcomes are standardized by year. Standard errors are clustered at the randomization
site-by-year level. + indicates p<0.10, *p<0.05, **p<0.01.

Page 44 of 51
Table A5: Heterogeneity in READY4K! effects on children's spring early literacy assessment scores
Sample of children above median of baseline skills
Panel A. Average outcomes, first year of experiment Model 1 Model 2 N
Average of all questions -0.014 0.000 197
(0.101) (0.087)
Average of non-leveled questions -0.056 -0.072 197
(0.098) (0.091)
Panel B. Average outcomes, second year of experiment
Average of all questions -0.045 -0.073 219
(0.084) (0.070)
Average of non-leveled questions -0.053 -0.078 291
(0.080) (0.073)
Panel C. All outcomes, pooled sample
Average of all questions -0.031 -0.028 416
(0.063) (0.049)
Average of non-leveled questions -0.054 -0.059 416
(0.062) (0.057)
Upper case letter recognition -0.009 0.000 414
(0.044) (0.044)
Beginning word sound awareness 0.033 0.032 408
(0.074) (0.077)
Print and word awareness -0.061 -0.083 410
(0.085) (0.087)
Rhyme awareness -0.069 -0.068 406
(0.088) (0.087)
Name writing -0.068 -0.071 415
(0.059) (0.059)
Probability of progressing to leveled portion of assessment -0.012 0.001 416
(0.029) (0.032)
Lower case letter recognition -0.004 0.028 401
(0.085) (0.093)
Letter sounds awareness 0.035 0.012 387
(0.092) (0.085)
Randomization site-by-year fixed effects ✓ ✓
Administrative and fall parent survey covariates ✓
Fall literacy assessment covariates ✓
Notes. All outcomes are standardized by year. Standard errors are clustered at the randomization site-by-year
level. + indicates p<0.10, *p<0.05, **p<0.01.

Page 45 of 51
Table A6: Composite Variable Components
Panel A. Global home literacy composite variable, first year of experiment
Components: Scoring
coefficient
Pointed out letters in the home environment 0.14504
Pointed out two words that begin with the same sound to your child 0.16495
Pointed out two words that rhyme to your child 0.16637
Said & explained a new word to your child using household objects 0.13605
Showed your child the different parts of a book (e.g., cover, title, author, and pages) 0.15588
Looked at pictures in a book with your child 0.14262
Showed or helped your child write his/her name 0.12261
Read to your child 0.13943
Told your child a story 0.13814
Recited a nursery rhyme to your child 0.13414
Eigenvalue: 4.74785 (47.48% of variance explained)
Panel B. Global home literacy composite variable, second year of experiment
Scoring
coefficient
Pointed out letters to your child 0.1846
Practiced word sounds with your child 0.2064
Practiced rhyming with your child 0.18928
Helped your child learn new words 0.19162
Showed your child the different parts of a book (e.g., cover, title, author, and pages) 0.17219
Showed your child we read from left to right 0.17254
Worked on literacy skills during family activities (meals, kitchen, etc…) 0.19908
Eigenvalue: 4.02786 (57.54% of variance explained)
Panel C. Global parental involvement composite variable
Components: Scoring
coefficient
Parent asked about their child's interests 0.14285
Parent asked about their child's friends 0.14226
Parent asked about how the child gets along with others 0.13665
Parent asked about what their child is doing in school 0.14187
Parent asked about what their child is learning in school 0.14577
Parent asked about their child's understanding of early literacy skills like the ABCs 0.14249
Parent asked about things they can do to help their child learn to read 0.14194
Parent asked for book recommendations 0.12035
Eigenvalue: 6.42564 (80.32% of variance explained)
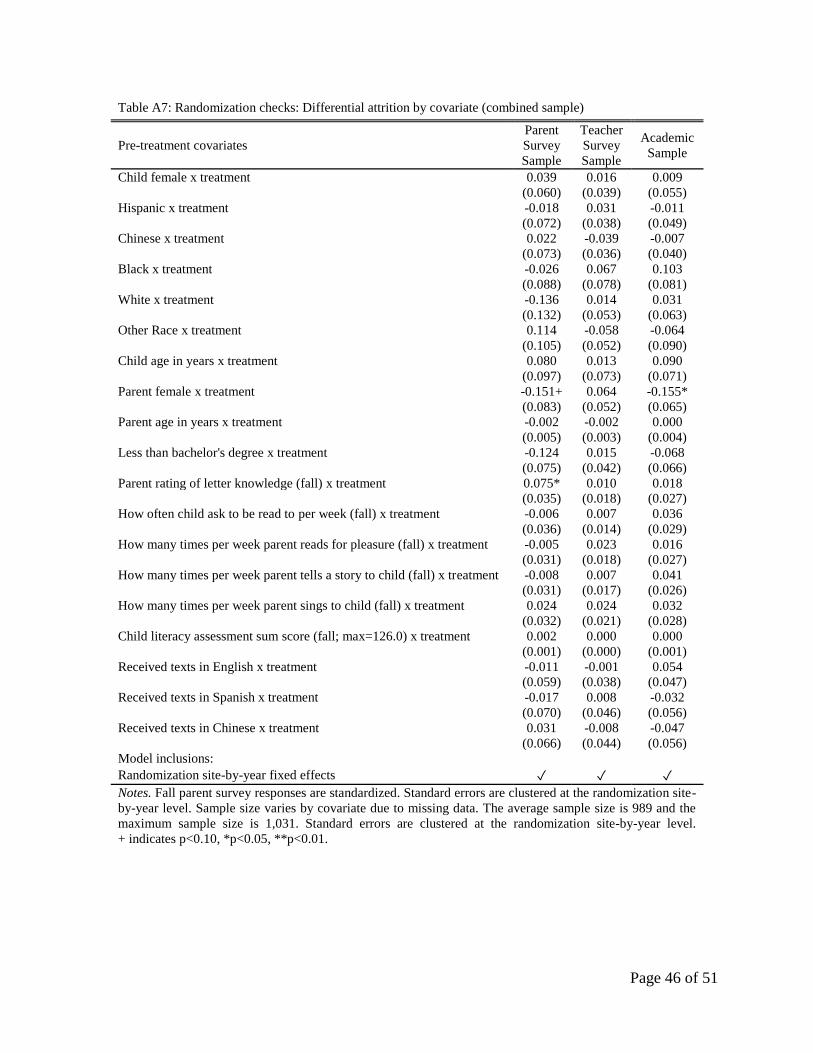
Page 46 of 51
Table A7: Randomization checks: Differential attrition by covariate (combined sample)
Pre-treatment covariates
Parent
Survey
Sample
Teacher
Survey
Sample
Academic
Sample
Child female x treatment 0.039 0.016 0.009
(0.060) (0.039) (0.055)
Hispanic x treatment -0.018 0.031 -0.011
(0.072) (0.038) (0.049)
Chinese x treatment 0.022 -0.039 -0.007
(0.073) (0.036) (0.040)
Black x treatment -0.026 0.067 0.103
(0.088) (0.078) (0.081)
White x treatment -0.136 0.014 0.031
(0.132) (0.053) (0.063)
Other Race x treatment 0.114 -0.058 -0.064
(0.105) (0.052) (0.090)
Child age in years x treatment 0.080 0.013 0.090
(0.097) (0.073) (0.071)
Parent female x treatment -0.151+ 0.064 -0.155*
(0.083) (0.052) (0.065)
Parent age in years x treatment -0.002 -0.002 0.000
(0.005) (0.003) (0.004)
Less than bachelor's degree x treatment -0.124 0.015 -0.068
(0.075) (0.042) (0.066)
Parent rating of letter knowledge (fall) x treatment 0.075* 0.010 0.018
(0.035) (0.018) (0.027)
How often child ask to be read to per week (fall) x treatment -0.006 0.007 0.036
(0.036) (0.014) (0.029)
How many times per week parent reads for pleasure (fall) x treatment -0.005 0.023 0.016
(0.031) (0.018) (0.027)
How many times per week parent tells a story to child (fall) x treatment -0.008 0.007 0.041
(0.031) (0.017) (0.026)
How many times per week parent sings to child (fall) x treatment 0.024 0.024 0.032
(0.032) (0.021) (0.028)
Child literacy assessment sum score (fall; max=126.0) x treatment 0.002 0.000 0.000
(0.001) (0.000) (0.001)
Received texts in English x treatment -0.011 -0.001 0.054
(0.059) (0.038) (0.047)
Received texts in Spanish x treatment -0.017 0.008 -0.032
(0.070) (0.046) (0.056)
Received texts in Chinese x treatment 0.031 -0.008 -0.047
(0.066) (0.044) (0.056)
Model inclusions:
Randomization site-by-year fixed effects ✓ ✓ ✓
Notes. Fall parent survey responses are standardized. Standard errors are clustered at the randomization site-
by-year level. Sample size varies by covariate due to missing data. The average sample size is 989 and the
maximum sample size is 1,031. Standard errors are clustered at the randomization site-by-year level.
+ indicates p<0.10, *p<0.05, **p<0.01.
Page 47 of 51
The Development of READY4K!
We began developing READY4K! in early 2013. Our first step in program development was to
generate a list of potential texting topics. To create this list, we consulted the California Preschool
Learning Foundations, The National Early Literacy Panel’s report on developing early literacy
skills (Lonigan and Shanahan 2009), experimental studies of interventions designed to help parents
support their preschooler’s literacy development (for a review, see Reese, Sparks, and Leyva
2010), and the websites of nationally-recognized literacy programs (such as Reach Out and Read,
Reading Rockets, and Reading Is Fundamental) and the U.S. and state departments of education.
The initial list of list of topics that we generated was far too long to cover in eight months
of weekly texts and it lacked a logical ordering. Therefore, our next step in developing READY4K!
was to establish a scope and sequence for the program. In determining which topics to include in
the program, we prioritized those with a strong research base as well as topics identified by
multiple organizations as important. Since we piloted READY4K! in SFUSD, we gave additional
weight to the early literacy skills in the California Preschool Learning Foundations as well as those
assessed by the district. To set the program’s sequence, we drew heavily on the behavior change
principle of shaping, or incrementally increasing the difficulty of tasks over time. We also re-
introduced or “spiraled” topics during the year to reinforce key concepts.
Our next step was to turn our scope and sequence into a text messaging program. As a
starting point, we reviewed research on behavior change theories in an attempt to identify the
characteristics of an effective message. While these theories have subtle differences, many of them
emphasize similar strategies such as highlighting the benefits or perceived outcomes of the target
behavior, identifying and minimizing barriers to the behavior, goal setting, and reinforcement,
which includes repetition and intrinsic rewards (for reviews, see U.S. Department of Health and
Page 48 of 51
Human Services, 1996; and, Abraham and Michie 2008). Using these techniques, we adopted the
three-texts-per-week model described above. “FACT” texts highlight perceived outcomes, “TIP”
texts are designed to build self-efficacy, and “GROWTH” texts provide reinforcement both
through repetition and the intrinsic reward of supporting the child’s learning. “GROWTH” texts
also serve a goal-setting function. All of them start by highlighting the program’s overarching goal
of preparing children for kindergarten: “GROWTH: By [taking up the activity of the week], you’re
preparing your child 4K!” Behavior change principles are also integrated in each individual text.
For example, READY4K! texts are as specific as possible and build on existing family routines so
as minimize the costs of uptake.
Throughout the development of READY4K!, Molly Wertz, Executive Director of Raising
A Reader in San Francisco, Alameda and Contra Costa Counties, Jennifer Curran and Catherine
Aranda of Jumpstart Northern California, and Helen Maniates, Assistant Professor of Teacher
Education at the University of San Francisco, provided us with valuable feedback on the program.
After we developed texts for an entire school year, we conducted a mini pilot study of
READY4K!. Over two days in the summer of 2013, we surveyed and conducted focus groups with
parents and caregivers of three to five year olds at Redwood City Public Library. In total, we got
feedback from 44 parents and caregivers, which we used to make final programmatic adjustments.
During the middle of the 2013-14 pilot of READY4K! (in January of 2014), we surveyed
parents in the program about their experiences receiving texts. Based on their feedback, we
augmented the program by including links to websites with additional resources for supporting
children’s development of early literacy skills. Throughout the year, we ran a READY4K! hotline
to provide parents in the intervention group with technical assistance (e.g., if they changed their
cell phone number).
Page 49 of 51
To send text messages, we used a commercially-available blast short message service
(SMS) provider as well as email. We sent English- and Spanish-language texts to the intervention
group via the SMS service provider. In particular, we provided the service provider with the cell
phone numbers of English- and Spanish-speaking parents in the treatment group, which it uploaded
into its system. Once cell phone numbers were in the system, we began texting parents using the
service provider’s web interface. We sent messages to all parents at the same time, but there was
the option to text parents individually.
To text Chinese-speaking treatment group parents and all control group parents, we used
an e-mail account. One can send text messages over e-mail if she has the cell phone number and
the name of the cell phone service provider (and the service provider’s “SMS gateway”) of the
intended recipient. For example, if the recipient’s service provider is Verizon Wireless, you can
send him a text message by typing in [email protected] in the “To:” field (@vtext.com is
Verizon’s SMS gateway). We sent messages in Chinese over e-mail because our blast SMS service
provider did not have the technology to send Chinese characters. We sent messages to the control
group over e-mail to save money.
In the 2015-2016 school year we expanded the program to include mathematics and socio-
emotional texts. The basic “FACT,” “TIP,” “GROWTH” model remained the same. We chose a
subset of literacy questions from the original year to include in the texting program. We made
adjustments to the wording and activities based on parental feedback.
To create the mathematics and socio-emotional texts we consulted the California Preschool
Frameworks, the Head Start Child Development and Early Learning Frameworks, and the
literature on mathematics and socio-emotional development. In a process that mirrored our
development of the literacy program, we listed topics to cover, charted a scope and sequence for
Page 50 of 51
the curriculum of texts, created the program, and iteratively refined the texts based on feedback.
We once again created a spiral curriculum that encourages growth in skills throughout the year by
asking parents to engage in progressively harder activities. We culled on the same behavioral
change principals in writing the texts.
Unlike the first year of the program, we did not text any links to additional resources,
though we did provide technical assistance if a family needed to change a number. Texts were
once again available in English, Spanish, and Chinese. We used a different SMS provider that
included the capability to directly text Chinese speaking families. We therefore did not text
Chinese speaking families via email in the second year. We also sent messages to the control group
directly through the SMS system.