Embed Size (px)
Citation preview
RSC Advances
PAPER
One-step solvoth
aCollaborative Innovation Center for Marine
Materials and Modern Textile, Growing Ba
Chemical Science and Engineering, Qingd
E-mail: [email protected]; [email protected] of Physics, Qingdao University, N
ChinacSchool of Chemical Engineering, The Univ
QLD 4072, Australia
Cite this: RSC Adv., 2014, 4, 59981
Received 22nd August 2014Accepted 31st October 2014
DOI: 10.1039/c4ra09079a
www.rsc.org/advances
This journal is © The Royal Society of C
ermal preparation of Fe3O4/graphene composites at elevated temperature andtheir application as anode materials for lithium-ionbatteries
Laiying Jing,a Aiping Fu,a Hongliang Li,*a Jingquan Liu,a Peizhi Guo,*a Yiqian Wangb
and Xiu Song Zhaoac
A one-step high-temperature solvothermal process (can be used up to 400 �C) has been explored for the
preparation of Fe3O4/graphene composites. The influence of high temperature (>230 �C) on the structure,
morphology and electrochemical properties of the resulting Fe3O4/graphene composites was investigated
by XRD, SEM, TEM and N2 adsorption–desorption measurements. Electrochemical performances of the as-
prepared Fe3O4/graphene composites at different temperatures were evaluated in coin-type cells as anode
materials for lithium-ion batteries. In comparison with the traditional solvothermal method (<240 �C), thehigh-temperature method does not require an additional calcination process yet it still could result in
Fe3O4/graphene composites with pure phase and excellent electrochemical properties. A preferred
solvothermal temperature of 280 �C has been deduced based on a series of control experiments. The
Fe3O4/graphene composite derived at 280 �C exhibited a high reversible capacity of 907 mA h g�1 at 0.1
C (92.6 mA g�1) even after 65 cycles, showing outstanding cycle stability. It also exhibited a high rate
capability of 410 mA h g�1 at 2 C (1852 mA g�1). The role of the graphene substrates in improving the
electrochemical properties of the composite is discussed based on the morphology, structure, phase
and electrochemical property studies.
1. Introduction
Recently, lithium-ion batteries (LIBs) have generated greatinterest because of the impact of portable electronic devices.Transition metal oxides have been considered as promisinghigh-performance anode materials for LIBs due to their highenergy density, safety for diverse applications, environmentalfriendliness and low cost.1–6 Among the transition metal oxides,magnetite (Fe3O4) is the most promising candidate anodematerial for LIBs because of its higher theoretical reversiblecapacity (926 mA h g�1) in comparison with carbonaceoussubstances.7–10 However, the low initial coulombic efficiencyand the severe volume changes during the Li ion insertion/extraction processes lead to a poor cycling performance,limiting the commercialization of this potential material.11–14
Hence, a exible strategy for improving the reversible capacity
Biomass Fibers, Laboratory of New Fiber
se for State Key Laboratory, College of
ao University, Qingdao 266071, China.
; Tel: +86-532-85950767
o. 308 Ningxia Road, Qingdao, 266071,
ersity of Queensland, St Lucia, Brisbane,
hemistry 2014
and long-cycle performance has been of signicant interest indeveloping high-performance LiB anode materials. Graphene isa one-atom thick planar sheet in a honeycomb crystal latticeand has been extensively explored as conductive materials forenergy storage.15,16 Graphene/Fe3O4 composites with excellentLIB performance have also been reported.17–19 Graphene showsthree main advantages as conductive substrates for the fabri-cation of composite electrode materials. Firstly, the sheets canprovide voids against the volume changes of the Fe3O4 particlesduring the Li ion insertion/extraction processes.20–22 Secondly,graphene sheets can prevent the aggregation of Fe3O4 particlesby the lamellar structure. Thirdly, it also can improve the rateperformance of the composites due to its intrinsic high elec-tronic conductivity. In the previous studies, most of the gra-phene/Fe3O4 composites were prepared by hydrothermal orsolvothermal methods at a temperature below 200 �C due to thelimitation of the Teon liner (the soening point of the poly-tetrauoroethylene autoclave liner is 240 �C). Usually, thenormal solvothermal process necessitates a long reaction time(more than 12 h and even several days) and requires a subse-quent calcination step at temperatures higher than 500 �C toobtain transition metal oxide based composite materials withpure phase and excellent electrochemical properties.23–25 Onequestion then arises: what will happen when the solvothermal
RSC Adv., 2014, 4, 59981–59989 | 59981
Scheme 1 Illustration of the formation process of the Fe3O4/graphenecomposites.
RSC Advances Paper
preparation of transition metal oxide is conducted at atemperature higher than 240 �C? However, it is difficult to ndan answer in the literature due to the temperature limitation ofnormal structured autoclaves.
Attempting to address the above question and to exploit newtechniques, a one-step high-temperature solvothermalapproach (up to 310 �C) for the preparation of Fe3O4/graphenecomposites has been explored herein based on a Swagelokstructured autoclave using an organic iron(II) compound asprecursor. Fe3O4/graphene composites with high reversiblecapacity and outstanding cycle stability have been preparedwithin 6 h via this high-temperature solvothermal process andno further calcinations were needed. The inuence of treatmenttemperature and reaction time on the composition, structure,morphology and electrochemical properties of the resultantFe3O4/graphene composites were investigated in detail.
2. Experimental section2.1. Materials
Ferrous oxalate dihydrate, ferric chloride hexahydrate, anhy-drous sodium acetate and ethylene glycol (Sinopharm ChemicalReagent Co., Ltd) were of AR grade and used without furtherpurication. Graphene, kindly provided by the sixth element(Changzhou) Ltd, was used as received without furthertreatment.
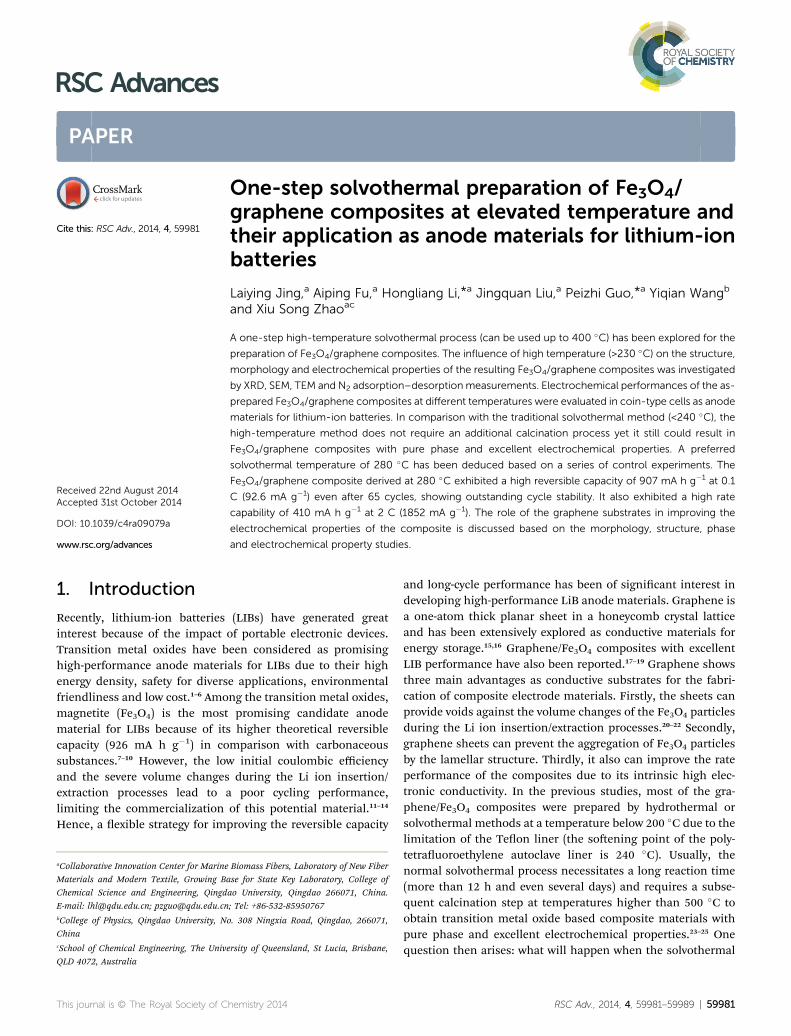
Fig. 1 XRD patterns of graphene (A), Fe3O4/graphene (210 �C) (12 h)(B), Fe3O4/graphene (230 �C) (12 h) (C), Fe3O4/graphene (250 �C) (12 h)(D), Fe3O4/graphene (280 �C) (6 h) (E), and Fe3O4 (280 �C) (12 h) (F).
2.2. Synthesis of Fe3O4/graphene composites
The Fe3O4/graphene composites were synthesized by a simpleone-step high-temperature solvothermal process. Typically, 0.32g of ferrous oxalate dihydrate, 0.2 g of anhydrous sodiumacetate and 0.011 g of graphene were added to 5 mL of ethyleneglycol under vigorous stirring. Aer stirring for 20 min, themixture was transferred into a Swagelok structured stainlessautoclave with a capacity of 8 mL (a homemade stainless steel(316) high-pressure cell with a Swagelok tting was used tomaintain the pressure at high temperatures up to 400 �C). Thenthe autoclave was put into a thermostatic oven for solvothermaltreatment for 6 or 12 h at different temperatures (210, 230, 250,280 or 310 �C). Aer the autoclave had cooled down to roomtemperature naturally, black precipitates were collected aercentrifugation. The solids were washed with distilled water andethanol twice, respectively, and then dried at 60 �C in a ther-mostatic oven, obtaining about 0.12 g Fe3O4/graphenecomposite with a reproducible yield of 85% calculated based onferrous oxalate dihydrate. The resultant composites preparedunder different temperatures were designated as Fe3O4/gra-phene (T �C) in the following discussion (where T ¼ 210, 230,250, 280 or 310 �C, respectively, corresponding to the appliedtreating temperatures). An illustration of the formation processof the Fe3O4/graphene composites is illustrated in Scheme 1.For comparison purposes, Fe3O4 nanoparticles were preparedin the same way as that of Fe3O4/graphene but in the absence ofgraphene. As a control experiment, the Fe3O4/graphenecomposite was also prepared using the traditional solvothermal
59982 | RSC Adv., 2014, 4, 59981–59989
method at 200 �C for 12 h using ferric chloride hexahydrate asprecursor.26
2.3. Characterization
The crystallographic information and composition of theproducts were investigated using a Bruker D8 advance X-raydiffractometer (XRD, Cu-Ka radiation l ¼ 0.15418). Fouriertransform infrared spectra were recorded from 400 to 4000cm�1 with a Nicolet 5700 spectrophotometer using pressed KBrpellets. Raman spectra were collected using a Horiba LabRAMHR Raman spectrometer (HORIBA Jobin Yvon Ltd.). The carboncontent in the composites was determined by thermogravi-metric analysis under an oxygen atmosphere with a heating rateof 10 �C min�1 (Mettler Toledo TGA/STDA851e). The morphol-ogies and the structures of the samples were examined by aJEOL JSM-6390LV scanning electron microscope (SEM) and aJEOL JEM-2010F transmission electron microscope (TEM). Thespecic surface areas were estimated with the Brunauer–Emmett–Teller (BET) method with N2 adsorption data in therelative pressure range of P/P0 ¼ 0.05–0.35. The pore sizedistributions were calculated using the Barrett–Joyner–Halenda(BJH) model applied to the desorption branch of the N2
isotherms obtained with a TriStar 3000 surface area and poreanalyzer (Micromeritics).
2.4. Electrochemical testing
The working electrodes were prepared by mixing the activematerial, acetylene black (super-P) and polyvinylidene uoride
This journal is © The Royal Society of Chemistry 2014
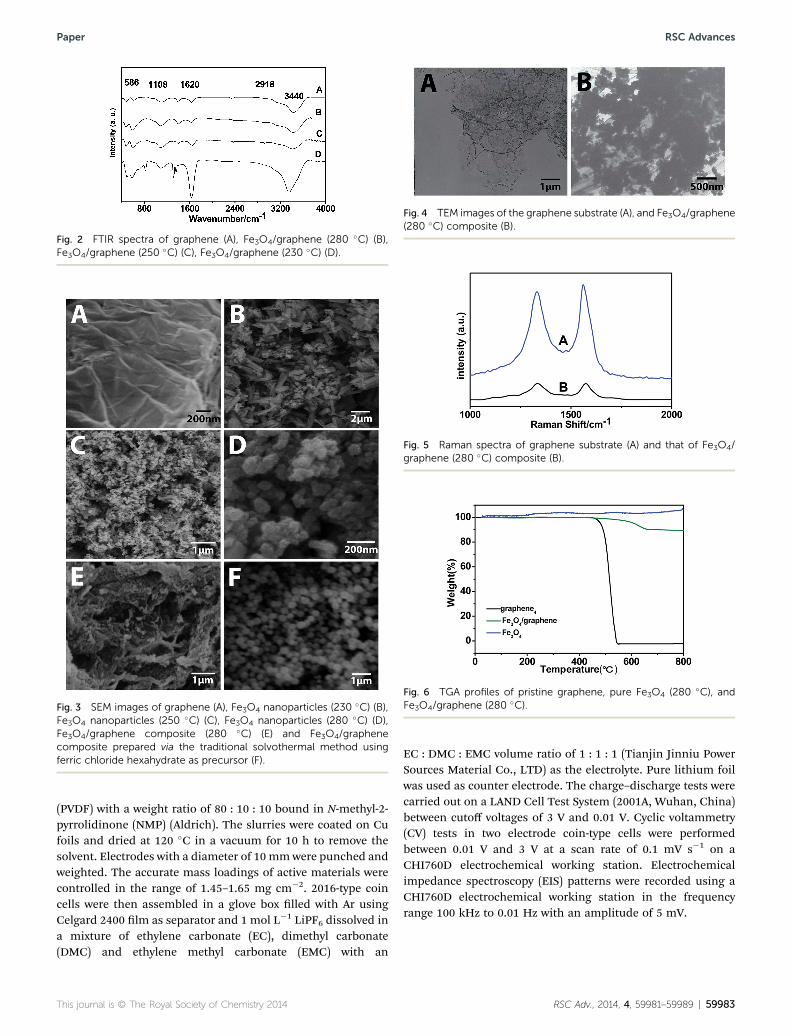
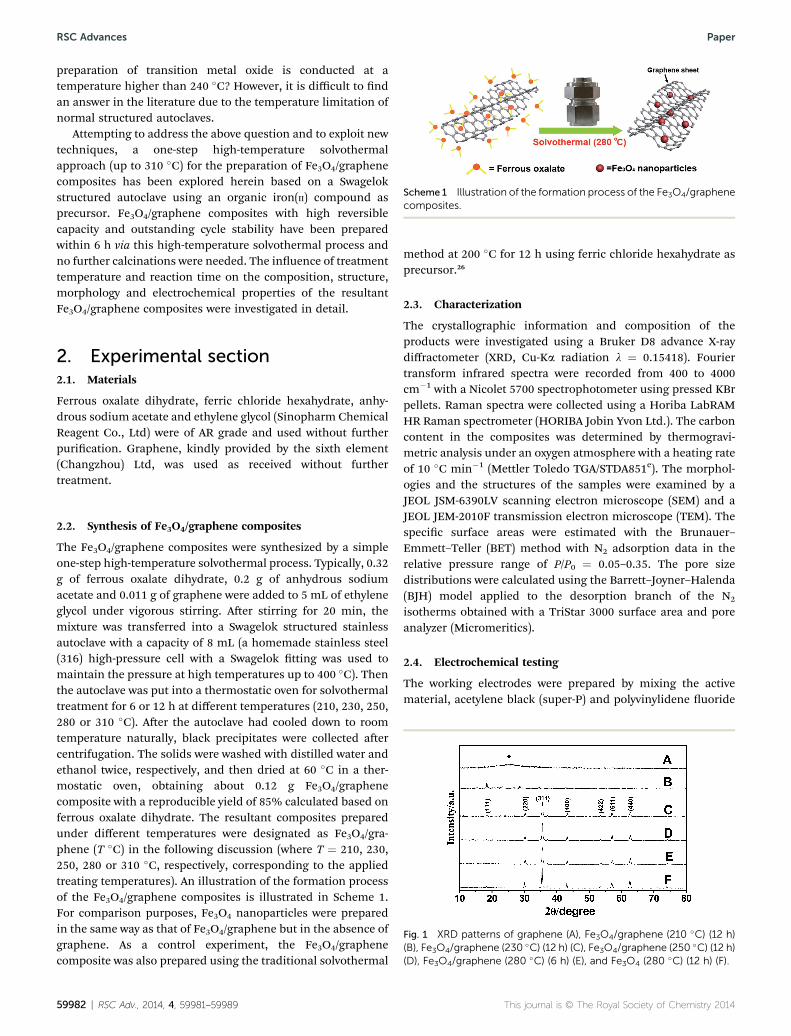
Fig. 2 FTIR spectra of graphene (A), Fe3O4/graphene (280 �C) (B),Fe3O4/graphene (250 �C) (C), Fe3O4/graphene (230 �C) (D).
Fig. 3 SEM images of graphene (A), Fe3O4 nanoparticles (230 �C) (B),Fe3O4 nanoparticles (250 �C) (C), Fe3O4 nanoparticles (280 �C) (D),Fe3O4/graphene composite (280 �C) (E) and Fe3O4/graphenecomposite prepared via the traditional solvothermal method usingferric chloride hexahydrate as precursor (F).
Fig. 4 TEM images of the graphene substrate (A), and Fe3O4/graphene(280 �C) composite (B).
Fig. 5 Raman spectra of graphene substrate (A) and that of Fe3O4/graphene (280 �C) composite (B).
Fig. 6 TGA profiles of pristine graphene, pure Fe3O4 (280 �C), andFe3O4/graphene (280 �C).
Paper RSC Advances
(PVDF) with a weight ratio of 80 : 10 : 10 bound in N-methyl-2-pyrrolidinone (NMP) (Aldrich). The slurries were coated on Cufoils and dried at 120 �C in a vacuum for 10 h to remove thesolvent. Electrodes with a diameter of 10 mmwere punched andweighted. The accurate mass loadings of active materials werecontrolled in the range of 1.45–1.65 mg cm�2. 2016-type coincells were then assembled in a glove box lled with Ar usingCelgard 2400 lm as separator and 1 mol L�1 LiPF6 dissolved ina mixture of ethylene carbonate (EC), dimethyl carbonate(DMC) and ethylene methyl carbonate (EMC) with an
This journal is © The Royal Society of Chemistry 2014
EC : DMC : EMC volume ratio of 1 : 1 : 1 (Tianjin Jinniu PowerSources Material Co., LTD) as the electrolyte. Pure lithium foilwas used as counter electrode. The charge–discharge tests werecarried out on a LAND Cell Test System (2001A, Wuhan, China)between cutoff voltages of 3 V and 0.01 V. Cyclic voltammetry(CV) tests in two electrode coin-type cells were performedbetween 0.01 V and 3 V at a scan rate of 0.1 mV s�1 on aCHI760D electrochemical working station. Electrochemicalimpedance spectroscopy (EIS) patterns were recorded using aCHI760D electrochemical working station in the frequencyrange 100 kHz to 0.01 Hz with an amplitude of 5 mV.
RSC Adv., 2014, 4, 59981–59989 | 59983
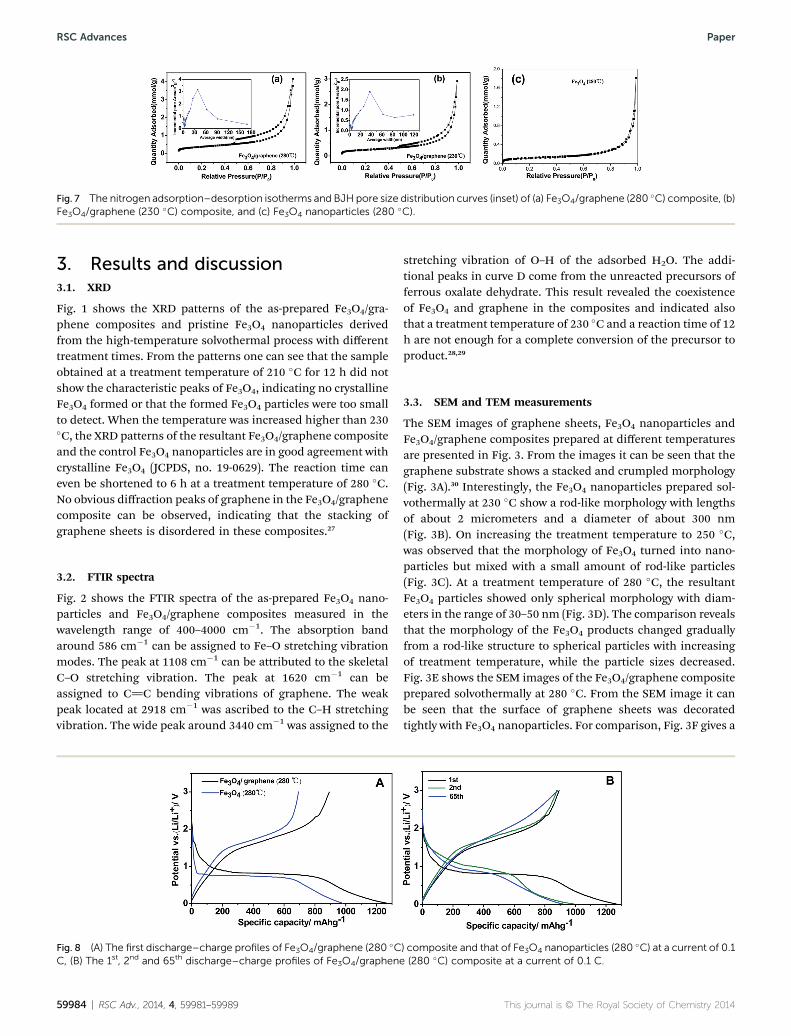
Fig. 7 The nitrogen adsorption–desorption isotherms and BJH pore size distribution curves (inset) of (a) Fe3O4/graphene (280 �C) composite, (b)Fe3O4/graphene (230 �C) composite, and (c) Fe3O4 nanoparticles (280 �C).
RSC Advances Paper
3. Results and discussion3.1. XRD
Fig. 1 shows the XRD patterns of the as-prepared Fe3O4/gra-phene composites and pristine Fe3O4 nanoparticles derivedfrom the high-temperature solvothermal process with differenttreatment times. From the patterns one can see that the sampleobtained at a treatment temperature of 210 �C for 12 h did notshow the characteristic peaks of Fe3O4, indicating no crystallineFe3O4 formed or that the formed Fe3O4 particles were too smallto detect. When the temperature was increased higher than 230�C, the XRD patterns of the resultant Fe3O4/graphene compositeand the control Fe3O4 nanoparticles are in good agreement withcrystalline Fe3O4 (JCPDS, no. 19-0629). The reaction time caneven be shortened to 6 h at a treatment temperature of 280 �C.No obvious diffraction peaks of graphene in the Fe3O4/graphenecomposite can be observed, indicating that the stacking ofgraphene sheets is disordered in these composites.27
3.2. FTIR spectra
Fig. 2 shows the FTIR spectra of the as-prepared Fe3O4 nano-particles and Fe3O4/graphene composites measured in thewavelength range of 400–4000 cm�1. The absorption bandaround 586 cm�1 can be assigned to Fe–O stretching vibrationmodes. The peak at 1108 cm�1 can be attributed to the skeletalC–O stretching vibration. The peak at 1620 cm�1 can beassigned to C]C bending vibrations of graphene. The weakpeak located at 2918 cm�1 was ascribed to the C–H stretchingvibration. The wide peak around 3440 cm�1 was assigned to the
Fig. 8 (A) The first discharge–charge profiles of Fe3O4/graphene (280 �CC, (B) The 1st, 2nd and 65th discharge–charge profiles of Fe3O4/graphen
59984 | RSC Adv., 2014, 4, 59981–59989
stretching vibration of O–H of the adsorbed H2O. The addi-tional peaks in curve D come from the unreacted precursors offerrous oxalate dehydrate. This result revealed the coexistenceof Fe3O4 and graphene in the composites and indicated alsothat a treatment temperature of 230 �C and a reaction time of 12h are not enough for a complete conversion of the precursor toproduct.28,29
3.3. SEM and TEM measurements
The SEM images of graphene sheets, Fe3O4 nanoparticles andFe3O4/graphene composites prepared at different temperaturesare presented in Fig. 3. From the images it can be seen that thegraphene substrate shows a stacked and crumpled morphology(Fig. 3A).30 Interestingly, the Fe3O4 nanoparticles prepared sol-vothermally at 230 �C show a rod-like morphology with lengthsof about 2 micrometers and a diameter of about 300 nm(Fig. 3B). On increasing the treatment temperature to 250 �C,was observed that the morphology of Fe3O4 turned into nano-particles but mixed with a small amount of rod-like particles(Fig. 3C). At a treatment temperature of 280 �C, the resultantFe3O4 particles showed only spherical morphology with diam-eters in the range of 30–50 nm (Fig. 3D). The comparison revealsthat the morphology of the Fe3O4 products changed graduallyfrom a rod-like structure to spherical particles with increasingof treatment temperature, while the particle sizes decreased.Fig. 3E shows the SEM images of the Fe3O4/graphene compositeprepared solvothermally at 280 �C. From the SEM image it canbe seen that the surface of graphene sheets was decoratedtightly with Fe3O4 nanoparticles. For comparison, Fig. 3F gives a
) composite and that of Fe3O4 nanoparticles (280 �C) at a current of 0.1e (280 �C) composite at a current of 0.1 C.
This journal is © The Royal Society of Chemistry 2014
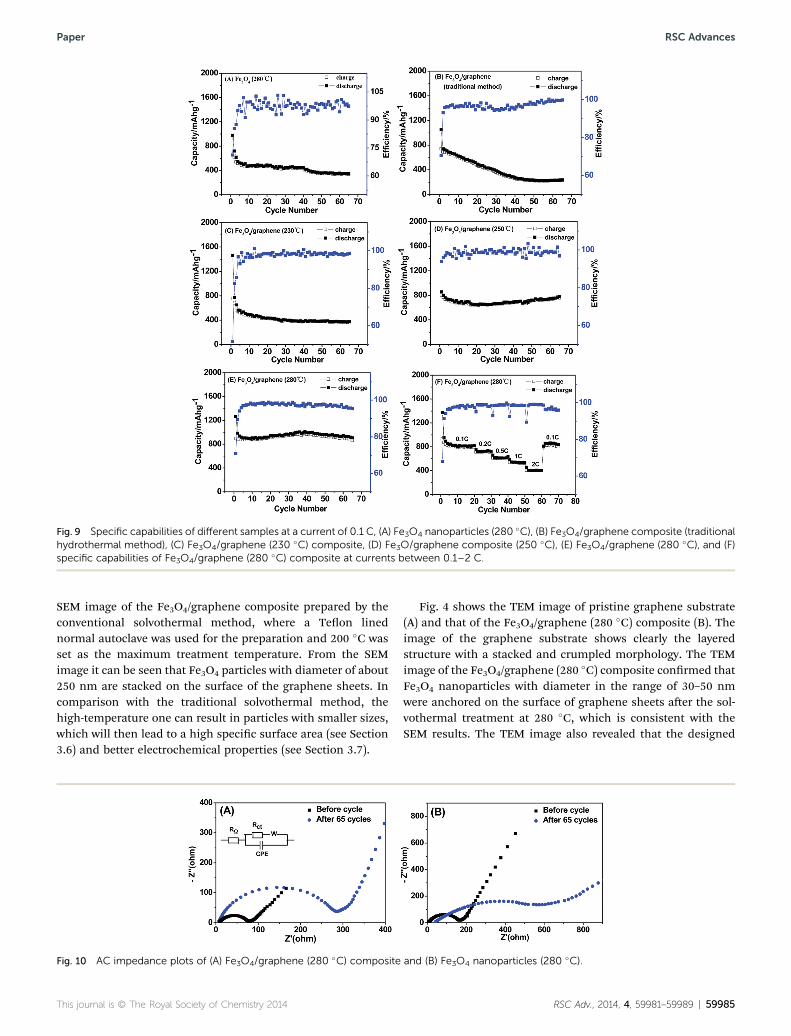
Fig. 9 Specific capabilities of different samples at a current of 0.1 C, (A) Fe3O4 nanoparticles (280 �C), (B) Fe3O4/graphene composite (traditionalhydrothermal method), (C) Fe3O4/graphene (230 �C) composite, (D) Fe3O/graphene composite (250 �C), (E) Fe3O4/graphene (280 �C), and (F)specific capabilities of Fe3O4/graphene (280 �C) composite at currents between 0.1–2 C.
Paper RSC Advances
SEM image of the Fe3O4/graphene composite prepared by theconventional solvothermal method, where a Teon linednormal autoclave was used for the preparation and 200 �C wasset as the maximum treatment temperature. From the SEMimage it can be seen that Fe3O4 particles with diameter of about250 nm are stacked on the surface of the graphene sheets. Incomparison with the traditional solvothermal method, thehigh-temperature one can result in particles with smaller sizes,which will then lead to a high specic surface area (see Section3.6) and better electrochemical properties (see Section 3.7).
Fig. 10 AC impedance plots of (A) Fe3O4/graphene (280 �C) composite
This journal is © The Royal Society of Chemistry 2014
Fig. 4 shows the TEM image of pristine graphene substrate(A) and that of the Fe3O4/graphene (280 �C) composite (B). Theimage of the graphene substrate shows clearly the layeredstructure with a stacked and crumpled morphology. The TEMimage of the Fe3O4/graphene (280 �C) composite conrmed thatFe3O4 nanoparticles with diameter in the range of 30–50 nmwere anchored on the surface of graphene sheets aer the sol-vothermal treatment at 280 �C, which is consistent with theSEM results. The TEM image also revealed that the designed
and (B) Fe3O4 nanoparticles (280 �C).
RSC Adv., 2014, 4, 59981–59989 | 59985
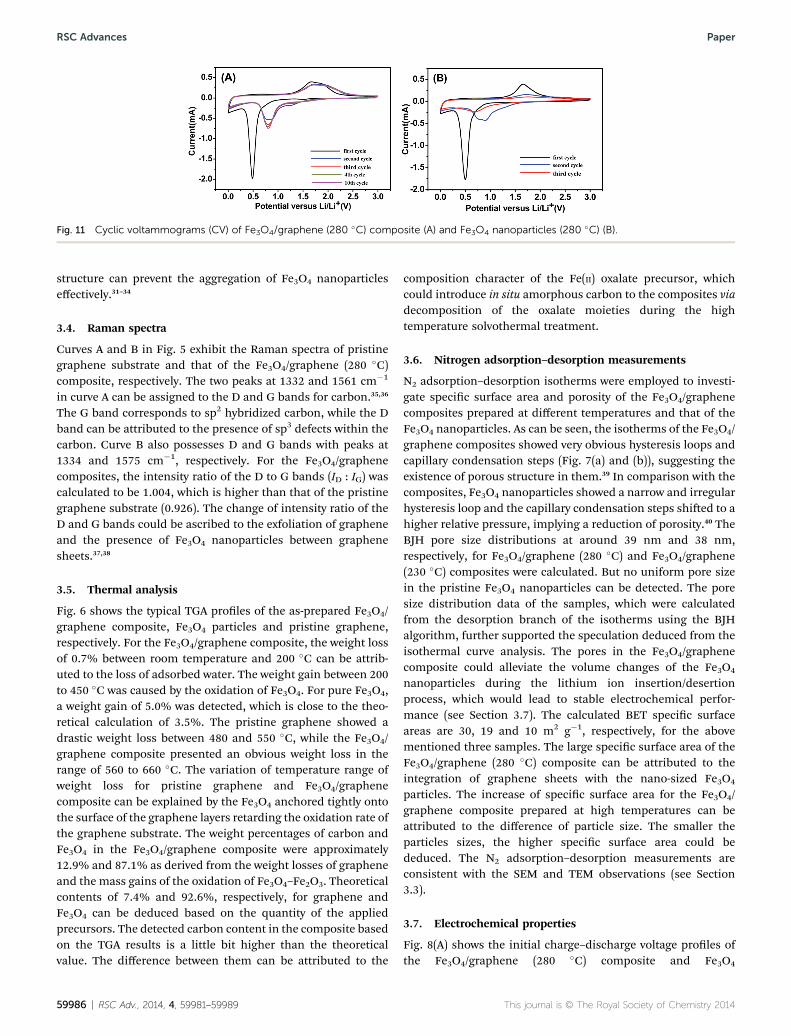
Fig. 11 Cyclic voltammograms (CV) of Fe3O4/graphene (280 �C) composite (A) and Fe3O4 nanoparticles (280 �C) (B).
RSC Advances Paper
structure can prevent the aggregation of Fe3O4 nanoparticleseffectively.31–34
3.4. Raman spectra
Curves A and B in Fig. 5 exhibit the Raman spectra of pristinegraphene substrate and that of the Fe3O4/graphene (280 �C)composite, respectively. The two peaks at 1332 and 1561 cm�1
in curve A can be assigned to the D and G bands for carbon.35,36
The G band corresponds to sp2 hybridized carbon, while the Dband can be attributed to the presence of sp3 defects within thecarbon. Curve B also possesses D and G bands with peaks at1334 and 1575 cm�1, respectively. For the Fe3O4/graphenecomposites, the intensity ratio of the D to G bands (ID : IG) wascalculated to be 1.004, which is higher than that of the pristinegraphene substrate (0.926). The change of intensity ratio of theD and G bands could be ascribed to the exfoliation of grapheneand the presence of Fe3O4 nanoparticles between graphenesheets.37,38
3.5. Thermal analysis
Fig. 6 shows the typical TGA proles of the as-prepared Fe3O4/graphene composite, Fe3O4 particles and pristine graphene,respectively. For the Fe3O4/graphene composite, the weight lossof 0.7% between room temperature and 200 �C can be attrib-uted to the loss of adsorbed water. The weight gain between 200to 450 �C was caused by the oxidation of Fe3O4. For pure Fe3O4,a weight gain of 5.0% was detected, which is close to the theo-retical calculation of 3.5%. The pristine graphene showed adrastic weight loss between 480 and 550 �C, while the Fe3O4/graphene composite presented an obvious weight loss in therange of 560 to 660 �C. The variation of temperature range ofweight loss for pristine graphene and Fe3O4/graphenecomposite can be explained by the Fe3O4 anchored tightly ontothe surface of the graphene layers retarding the oxidation rate ofthe graphene substrate. The weight percentages of carbon andFe3O4 in the Fe3O4/graphene composite were approximately12.9% and 87.1% as derived from the weight losses of grapheneand the mass gains of the oxidation of Fe3O4–Fe2O3. Theoreticalcontents of 7.4% and 92.6%, respectively, for graphene andFe3O4 can be deduced based on the quantity of the appliedprecursors. The detected carbon content in the composite basedon the TGA results is a little bit higher than the theoreticalvalue. The difference between them can be attributed to the
59986 | RSC Adv., 2014, 4, 59981–59989
composition character of the Fe(II) oxalate precursor, whichcould introduce in situ amorphous carbon to the composites viadecomposition of the oxalate moieties during the hightemperature solvothermal treatment.
3.6. Nitrogen adsorption–desorption measurements
N2 adsorption–desorption isotherms were employed to investi-gate specic surface area and porosity of the Fe3O4/graphenecomposites prepared at different temperatures and that of theFe3O4 nanoparticles. As can be seen, the isotherms of the Fe3O4/graphene composites showed very obvious hysteresis loops andcapillary condensation steps (Fig. 7(a) and (b)), suggesting theexistence of porous structure in them.39 In comparison with thecomposites, Fe3O4 nanoparticles showed a narrow and irregularhysteresis loop and the capillary condensation steps shied to ahigher relative pressure, implying a reduction of porosity.40 TheBJH pore size distributions at around 39 nm and 38 nm,respectively, for Fe3O4/graphene (280 �C) and Fe3O4/graphene(230 �C) composites were calculated. But no uniform pore sizein the pristine Fe3O4 nanoparticles can be detected. The poresize distribution data of the samples, which were calculatedfrom the desorption branch of the isotherms using the BJHalgorithm, further supported the speculation deduced from theisothermal curve analysis. The pores in the Fe3O4/graphenecomposite could alleviate the volume changes of the Fe3O4
nanoparticles during the lithium ion insertion/desertionprocess, which would lead to stable electrochemical perfor-mance (see Section 3.7). The calculated BET specic surfaceareas are 30, 19 and 10 m2 g�1, respectively, for the abovementioned three samples. The large specic surface area of theFe3O4/graphene (280 �C) composite can be attributed to theintegration of graphene sheets with the nano-sized Fe3O4
particles. The increase of specic surface area for the Fe3O4/graphene composite prepared at high temperatures can beattributed to the difference of particle size. The smaller theparticles sizes, the higher specic surface area could bededuced. The N2 adsorption–desorption measurements areconsistent with the SEM and TEM observations (see Section3.3).
3.7. Electrochemical properties
Fig. 8(A) shows the initial charge–discharge voltage proles ofthe Fe3O4/graphene (280 �C) composite and Fe3O4
This journal is © The Royal Society of Chemistry 2014
Paper RSC Advances
nanoparticles at 0.1 C (92.6 mA g�1). The rst discharge voltageprole of the Fe3O4/graphene composite is very similar to that ofFe3O4 nanoparticles. Both of them presented a steep voltagedrop from about 2.5 to 0.85 V, which can be attributed to thereaction of Fe3O4 + xLi+ + xe� 4 LixFe3O4.41 Then the Fe3O4/graphene composite electrode showed a long discharge plateaupotential around 0.85 V, which is due to the reduction of Fe ionsto form nano-sized metallic Fe and amorphous Li2O through aconversion reaction.42 The sloping curve of the Fe3O4/graphenecomposite from about 0.83 to 0.01 V could be attributed to theformation of a solid electrolyte interface (SEI) lm and thereversible reaction between lithium and graphene sheets 2C +Li+ + e� 4 LiC2.43–45 The initial discharge and charge capacitiesof the Fe3O4/graphene composites were estimated to be 1266and 897 mA h g�1, respectively, which are higher than those ofthe electrode made of pristine Fe3O4 nanoparticles (978.5 and697 mA h g�1). Fig. 8(B) shows the 1st, 2nd and 65th discharge–charge proles of an electrode made of Fe3O4/graphene (280 �C)composite at 0.1 C. A reversible capacity of 907 mA h g�1 wasretained at 0.1 C even aer 65 discharge–charge cycles. Thisconrms that graphene with outstanding intrinsic propertiescan effectively improve the electrochemical performance oftransition metal oxides.
Fig. 9 shows the reversible capacity versus cycle number forFe3O4 nanoparticles and Fe3O4/graphene composites preparedat different temperatures. The reversible capacity of pristineFe3O4 nanoparticles faded quickly and showed a low capacity ofonly 346 mA h g�1 aer 65 cycles (Fig. 9A). For the Fe3O4/gra-phene composites, it can be seen that with the increase oftreatment temperature, the reversible capacities had obviouslyincreased values. For the resultant composites at 230, 250 and280 �C, capacities of about 378, 781 and 907 mA h g�1,respectively, were retained aer 65 charge–discharge cycles.Their coulombic efficiencies remained more than 95%. Onincreasing the treatment temperature further to 310 �C, noobvious improvement to the electrochemical performance ofthe resultant composite was observed. Therefore, 280 �C hasbeen selected as the preferred treatment temperature based onenergy consumption considerations. The control Fe3O4/gra-phene composite prepared by the conventional solvothermalmethod, exhibited a low capacity of 230 mA h g�1 aer 65 cycles,which is much lower than that delivered by the Fe3O4/graphenecomposites prepared via the high-temperature solvothermalprocesses and is even lower than that of the pristine Fe3O4
nanoparticles (280 �C). The theoretical weight percentage of theintegrated graphene in our case is 7.4%, which is much lowerthan the reported data and will be of benet to the commer-cialization of the Fe3O4/graphene composite.17,19,27 There areseveral cycles showing capacity higher than the theoretical one,which may be due to the Li+ trapped both in the interlayer ofcarbons and cavities, as proposed by Tokumitsu et al.46 Theexcellent capacity retention can be ascribed to the existence ofgraphene in the composites that can improve the electricalconductivity of the composite and can also accommodate thevolume change of Fe3O4 nanoparticles during the repetitive Li+
insertion–extraction cycling.47,48 The capacity variation amongthe different composites can be contributed to by the
This journal is © The Royal Society of Chemistry 2014
differences of morphology, particle size and crystal perfection ofthe Fe3O4 particles in them derived at different temperature bythe solvothermal synthesis. The remarkable high-rate capabilityof Fe3O4/graphene (280 �C) is demonstrated in Fig. 9F. Andreversible capacities of about 830 mA h g�1 at 0.1 C, 720 mA hg�1 at 0.2 C, 615 mA h g�1 at 0.5 C, 540 mA h g�1 at 1 C and 410mA h g�1 at 2 C were delivered by this composite electrode. Thereversible capacity returned to its original value as the currentrate reduces back, revealing the superior reversibility of thiscomposite electrode and its suitability as a high rate anodematerial.
To illustrate further the differences between Fe3O4 nano-particles and Fe3O4/graphene (280 �C) composite, electro-chemical impedance spectroscopy (EIS) measurements werecarried out based on electrodes made of them in the frequencyrange from 105 to 0.01 Hz before or aer testing the galvano-static cycles, and typical Nyquist plots are given in Fig. 10. TheEIS was also simulated by Z-view soware using the equivalentcircuit as shown in Fig. 10. In the equivalent circuit (inset), RU
and Rct are the ohmic resistance (total resistance of the elec-trolyte, separator, and electrical contacts) and the chargetransfer resistance, respectively. CPE is the constant phaseelement and represents double layer capacitance, and Wrepresents the Warburg impedance, reecting the solid-statediffusion of Li ions into the bulk of the active materials. TheNyquist plots for the samples before and aer cycling aresimilar, displaying a depressed semicircle in the high-middlefrequency region, which could be assigned to the chargetransfer resistance (Rct), and an inclined line in the lowfrequency region, which represents theWarburg impedance.49,50
It can be seen from the image that the diameter of the semi-circle for Fe3O4/graphene (280 �C) before the cycle is muchsmaller than that of Fe3O4 nanoparticles, indicating a lowercharge transfer resistance of the material.51 It is believed thatthe graphene existing in the system was responsible for thelower charge transfer resistance of the composite material. Aer65 cycles, it is worth noting that the diameter of the semicircleswas enlarged for both the samples. However, the lowest charge-transfer resistance was obtained again on Fe3O4/grapheneelectrode. The results conrmed that the existence of graphenesignicantly enhanced the conductivity of the electrode made ofFe3O4/graphene composite.
The cyclic voltammogram (CV) of the as-synthesized Fe3O4/graphene (280 �C) composite was collected over the potentialrange from 0.01 to 3.0 V at a scan rate of 0.1 mV s�1. As shown inFig. 11(A) in the rst cycle two peaks at 0.01 and 0.49 V,respectively, were observed for the cathodic process, which areascribed to the lithiation reaction of Fe3O4 + 8Li
+ + 8e�4 3Fe0 +4Li2O and 2C + Li+ + e� 4 LiC2.52 While two peaks at about 1.68and 1.89 V were recorded in the anodic process, which corre-spond to the oxidation of Fe0 to Fe2+ and Fe3+ during the anodicprocess. During the subsequent cycles, both the cathodic andanodic peak potentials shi to high voltage ranges due to thepolarization of electrode materials in the rst cycle and theformation of the SEI lm. Thereaer, the peak intensity tendedto a constant and kept stable nally, implying good cyclingstability. On the contrary, as shown in Fig. 11(B), the peak
RSC Adv., 2014, 4, 59981–59989 | 59987
RSC Advances Paper
intensity and integral areas of the CV curves in the rst threecycles decreased obviously for Fe3O4 nanoparticles, implyingpoor capacity retention ability. The results are also agreed wellwith the constant current discharge and charge processestesting.
4. Conclusions
Fe3O4/graphene composite anode materials with excellentelectrochemical properties have been prepared by the one-stepsolvothermal method at elevated temperature (up to 310 �C)using an organic iron salt as precursor. On increasing thetreatment temperature from 230 to 280 �C, the morphologies ofthe resultant Fe3O4 particles turned from tubes with lengths ofabout 2 micrometers and diameters of about 300 nm to nano-particles with diameters in range of 30–50 nm. In comparisonwith the traditional solvothermal method (<240 �C), the high-temperature one can provide Fe3O4 nanocrystals in a shorttreatment time (only 6 h), meanwhile, the resultant Fe3O4/gra-phene composite could deliver higher capacity and bettercycling performance than that derived from the traditionalsolvothermal process. Control experiments revealed that theFe3O4/graphene composites prepared at 280 �C possessed thebest electrochemical performance, and a high capacity of 907mA h g�1 could be retained aer 65 cycles at a current density of0.1 C (92.6 mA g�1). This strategy which employs graphene(<10% weight percentages) as supporting sheets for loadedmetal oxide achieved by the one-step high-temperature sol-vothermal process was demonstrated to be an effective way toimprove the specic capacity and the cycling performance ofmetal oxide anode materials for lithium ion batteries. Theexcellent electrochemical performance of the Fe3O4/graphenecomposites resulting from the high-temperature solvothermalprocess can be related to the enhancement of conductivity bythe graphene sheets and the nano-scaled crystalline Fe3O4
particles. The high temperature could result in Fe3O4 nano-crystals with more perfect structure and enhance the importantinterfacial interaction between the graphene substrate and theFe3O4 nanocrystals (30–50 nm). Furthermore, the graphenesubstrates distributed among the Fe3O4 nanoparticles canprevent the aggregation of the Fe3O4 particles and can alsoprovide a void against the volume changes of Fe3O4 nano-particles during the charge–discharge process. This high-temperature solvothermal method does not need a long reac-tion time and separate calcinations as usually required in thetraditional method. This constitutes a facile approach to thesynthesis of transition metal oxide/graphene composites withgood cycling performance and high capacity retention as anodematerials for lithium-ion batteries. We expect that the meth-odology presented herein will be also useful for the preparationof other kinds of electrode materials for LIBs.
Acknowledgements
This work is supported by the National Key Project on BasicResearch (Grant no. 2012CB722705), the National High Tech-nology Research and Development Program of China (no.
59988 | RSC Adv., 2014, 4, 59981–59989
2012AA110407 and 2014AA052303) and the Natural ScienceFoundation of China (no. 21103096 and U1232104). Y. Q. Wangwould like to thank the nancial support from the Top-notchInnovative Talent Program of Qingdao City (Grant no. 13-CX-8) and the Taishan Scholar Program of Shandong Province.
References
1 M. R. Palacin, Chem. Soc. Rev., 2009, 38, 2565–2575.2 M. Armand and J. M. Tarascon, Nature, 2008, 451, 652–657.3 F. Cheng, Z. Tao, J. Liang and J. Chen, Chem. Mater., 2008,20, 667–681.
4 X. P. Gao and H. X. Yang, Energy Environ. Sci., 2010, 3, 174–189.
5 J. Qu, Y. X. Yin, Y. Q. Wang, Y. Yan, Y. G. Guo andW. G. Song,ACS Appl. Mater. Interfaces, 2013, 5, 3932–3936.
6 Y. Sun, X. Hu, W. Luo, F. Xia and Y. Huang, Adv. Funct.Mater., 2013, 23, 2436–2444.
7 S. K. Behera, J. Power Sources, 2011, 196, 8669–8674.8 J. Liu, Y. Zhou, F. Liu, C. Liu, J. Wang, Y. Pan and D. Xue, RSCAdv., 2012, 2, 2262–2265.
9 Q. Q. Xing, J. P. Tu, Y. Lu, J. Chen, Y. X. Yu, Y. Q. Qiao,X. L. Wang and C. D. Gu, J. Phys. Chem. C, 2012, 116, 6495–6502.
10 Y. Chen, H. Xia, L. Lu and J. Xue, J. Mater. Chem., 2012, 22,5006–5012.
11 W. M. Zhang, X. L. Wu, J. S. Hu, Y. G. Guo and L. J. Wan, Adv.Funct. Mater., 2008, 18, 3941–3946.
12 Y. He, L. Huang, J. S. Cai, X. M. Zheng and S. G. Sun,Electrochim. Acta, 2010, 55, 1140–1144.
13 T. Muraliganth, A. V. Murugan and A. Manthiram, Chem.Commun., 2009, 7360–7362.
14 G. H. Lee, J. G. Park, Y. M. Sung, K. Y. Chung, W. I. Cho andD. W. Kim, Nanotechnology, 2009, 20, 295205–295209.
15 A. K. Geim and K. S. Novoselov, Nat. Mater., 2007, 6, 183–191.16 A. K. Geim, Nature, 2009, 324, 1530–1534.17 X. Li, X. Huang, D. Liu, X. Wang, S. Song, L. Zhou and
J. Zhang, J. Phys. Chem. C, 2011, 115, 21567–21573.18 D. Chen, G. Ji, Y. Ma, J. Y. Lee and J. Lu, ACS Appl. Mater.
Interfaces, 2011, 3, 3078–3083.19 Y. Liu, K. Huang, H. Luo, H. Li, X. Qia and J. Zhong, RSC
Adv., 2014, 4, 17653–17659.20 P. Lian, X. Zhu, S. Liang, Z. Li, W. Yang and H. Wang,
Electrochim. Acta, 2010, 55, 3909–3914.21 S. M. Paek, E. J. Yoo and I. Honma,Nano Lett., 2009, 9, 72–75.22 S. L. Chou, J. Z. Wang, M. Choucair, H. K. Liu, J. A. Stride and
S. X. Dou, Electrochem. Commun., 2010, 12, 303–306.23 M. Zhang, M. Jia and Y. Jin, Appl. Surf. Sci., 2012, 261, 298–
305.24 T. Wang, X. Wang, Y. Lu, Q. Xiong, X. Zhao, J. Cai, S. Huang,
C. Gu and J. Tu, RSC Adv., 2014, 4, 322–330.25 G. Zhou, D. W. Wang, F. Li, L. Zhang, N. Li, Z. S. Wu, L. Wen,
G. Q. Liu and H. M. Cheng, Chem. Mater., 2010, 22, 5306–5313.
26 Q. Yu, A. Fu, H. Li, H. Liu, R. Lv, J. Liu, Z. Guo and X. S. Zhao,Colloids Surf., A, 2014, 457, 288–296.
This journal is © The Royal Society of Chemistry 2014
Paper RSC Advances
27 P. Lian, X. Zhu, H. Xiang, Z. Li, W. Yang and H. Wang,Electrochim. Acta, 2010, 56, 834–840.
28 C. Nethravathi and M. Rajamathi, Carbon, 2008, 46, 1994–1998.
29 Y. Liang, D. Wu, X. Feng and K.Mullen, Adv. Mater., 2009, 21,1679–1683.
30 J. C. Meyer, A. K. Geim, M. I. Katsnelson, K. S. Nosvoselov,T. J. Booth and S. Roth, Nature, 2007, 446, 60–63.
31 Z. S. Wu, W. Ren, L. Wen, L. Gao, J. Zhao, Z. Chen, G. Zhou,F. Li and H. M. Chen, ACS Nano, 2010, 6, 3187–3194.
32 P. Lian, X. Zhu, S. Liang, Z. Li, W. Yang and H. Wang,Electrochim. Acta, 2011, 56, 4532–4539.
33 X. Huang, X. Zhou, K. Qian, D. Zhao, Z. Liu and C. Yu, J.Alloys Compd., 2012, 514, 76–80.
34 Y. Dong, R. Ma, M. Hu, H. Cheng, Q. Yang, Y. Y. Li andJ. A. Zapien, Phys. Chem. Chem. Phys., 2013, 15, 7174–7181.
35 B. Zhao, G. Zhang, J. Song, Y. Jiang, H. Zhuang, P. Liu andT. Fang, Electrochim. Acta, 2011, 56, 7340–7346.
36 C. Zhang, X. Peng, Z. Guo, C. Cai, Z. Chen, D. Wexler, S. Liand H. Liu, Carbon, 2012, 50, 1897–1903.
37 J. Su, M. Cao, L. Ren and C. Hu, J. Phys. Chem. C, 2011, 115,14469–14477.
38 P. Poizot, S. Laruelle, S. Grugeon, L. Dupont andJ. M. Tarascon, Nature, 2000, 407, 496–499.
39 R. R. Xu, W. Q. Pang, J. H. Yu and J. S. Chen, Chemistry-Zeolites, and Porous Materials, Science Press, Beijing, 2004,pp. 146–147.
This journal is © The Royal Society of Chemistry 2014
40 H. Li, J. Sang, J. Zhao, A. Fu, H. Liu, M. Xu, G. Pang andX. S. Zhao, New J. Chem., 2012, 36, 2308–2315.
41 C. Ban, Z. Li, Z. Wu, M. J. Kirkham, L. Chen and Y. S. Jung,Adv. Energy Mater., 2011, 1, 58–62.
42 J. Z. Wang, C. Zhong, D. Wexler, N. H. Idris, Z. X. Wang,L. Q. Chen and H. K. Liu, Chem.–Eur. J., 2011, 17, 661–667.
43 S. Wang, J. Zhang and C. Chen, J. Power Sources, 2010, 195,5379–5381.
44 D. Pan, S. Wang, B. Zhao, M. Wu, H. Zhang, Y. Wang andZ. Jiao, Chem. Mater., 2009, 21, 3136–3142.
45 C. Lei, F. Han, Q. Sun, W. C. Li and A. H. Lu, Chem.–Eur. J.,2014, 20, 139–145.
46 K. Tokumitsu, H. Fujimoto, A. Mabuchi and T. Kasuh,Carbon, 1999, 37, 1599–1605.
47 C. Wu, Q. Zhuang, Y. Wu, L. Tian, Y. Cui and X. Zhang,Mater. Lett., 2013, 113, 1–4.
48 W. Wei, S. Yang, H. Zhou, I. Lieberwirth, X. Feng andK. Mullen, Adv. Mater., 2013, 25, 2909–2914.
49 D. Zhang, Y. J. Mai, J. Y. Xiang, X. H. Xia, Y. Q. Qiao andJ. P. Tu, J. Power Sources, 2012, 217, 229–235.
50 B. Wang, G. Wang, Z. Zheng, H. Wang, J. Bai and J. Bai,Electrochim. Acta, 2013, 106, 235–243.
51 C. Wang, H. Li, A. Fu, J. Liu, W. Ye, Z. Guo, S. Pang andX. S. Zhao, New J. Chem., 2014, 38, 616–623.
52 L. Wang, Y. Yu, P. C. Chen, D. W. Zhang and C. H. Chen, J.Power Sources, 2008, 183, 717–723.
RSC Adv., 2014, 4, 59981–59989 | 59989