Embed Size (px)
Citation preview

One to One Computing:A Summary of the
Quantitative Results from the Berkshire Wireless
Learning Initiative
Volume 9, Number 2 · January 2010
A publication of the Technology and Assessment Study CollaborativeCaroline A. & Peter S. Lynch School of Education, Boston College
www.jtla.org
Damian Bebell & Rachel Kay
SPECiAL EDiTioN: EDuCATioNAL ouTComES & RESEARCh fRom 1:1 ComPuTiNg SETTiNgS
The Journal of Technology, Learning, and Assessment
Special Edition: Educational Outcomes and Research from 1:1 Computing Settings
Special Edition Editors: Damian Bebell [email protected] Laura M. O’Dwyer [email protected] Lynch School of Education, Boston College Chestnut Hill, MA 02467
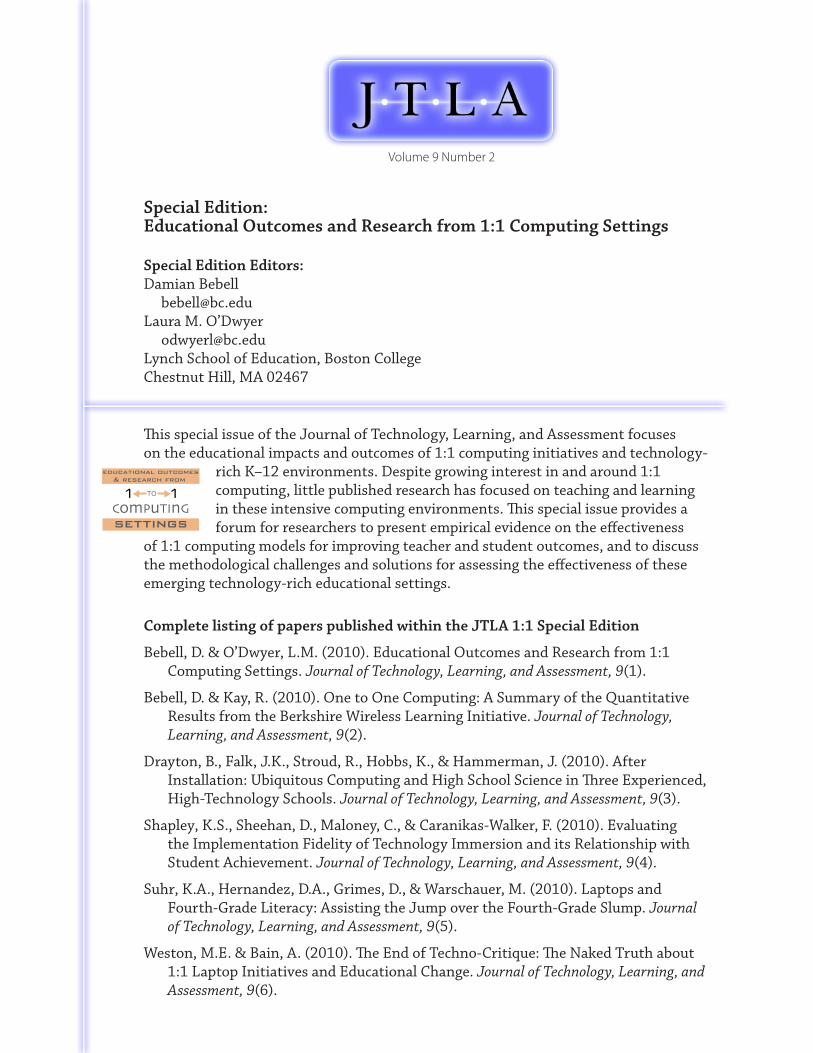
This special issue of the Journal of Technology, Learning, and Assessment focuses on the educational impacts and outcomes of 1:1 computing initiatives and technology-
rich K–12 environments. Despite growing interest in and around 1:1 computing, little published research has focused on teaching and learning in these intensive computing environments. This special issue provides a forum for researchers to present empirical evidence on the effectiveness
of 1:1 computing models for improving teacher and student outcomes, and to discuss the methodological challenges and solutions for assessing the effectiveness of these emerging technology-rich educational settings.
Complete listing of papers published within the JTLA 1:1 Special Edition
Bebell, D. & O’Dwyer, L.M. (2010). Educational Outcomes and Research from 1:1 Computing Settings. Journal of Technology, Learning, and Assessment, 9(1).
Bebell, D. & Kay, R. (2010). One to One Computing: A Summary of the Quantitative Results from the Berkshire Wireless Learning Initiative. Journal of Technology, Learning, and Assessment, 9(2).
Drayton, B., Falk, J.K., Stroud, R., Hobbs, K., & Hammerman, J. (2010). After Installation: Ubiquitous Computing and High School Science in Three Experienced, High-Technology Schools. Journal of Technology, Learning, and Assessment, 9(3).
Shapley, K.S., Sheehan, D., Maloney, C., & Caranikas-Walker, F. (2010). Evaluating the Implementation Fidelity of Technology Immersion and its Relationship with Student Achievement. Journal of Technology, Learning, and Assessment, 9(4).
Suhr, K.A., Hernandez, D.A., Grimes, D., & Warschauer, M. (2010). Laptops and Fourth-Grade Literacy: Assisting the Jump over the Fourth-Grade Slump. Journal of Technology, Learning, and Assessment, 9(5).
Weston, M.E. & Bain, A. (2010). The End of Techno-Critique: The Naked Truth about 1:1 Laptop Initiatives and Educational Change. Journal of Technology, Learning, and Assessment, 9(6).
TO
ComPuTInGsettings
educational outcomes& research from
Volume 9 Number 2

One to One Computing: A Summary of the Quantitative Results from the Berkshire Wireless Learning Initiative
Damian Bebell & Rachel Kay
Editor: Michael Russell [email protected] Technology and Assessment Study Collaborative Lynch School of Education, Boston College Chestnut Hill, MA 02467
Copy Editor: Jennifer Higgins Design: Thomas Hoffmann Layout: Aimee Levy
JTLA is a free on-line journal, published by the Technology and Assessment Study Collaborative, Caroline A. & Peter S. Lynch School of Education, Boston College.
Copyright ©2010 by the Journal of Technology, Learning, and Assessment (ISSN 1540-2525). Permission is hereby granted to copy any article provided that the Journal of Technology, Learning, and Assessment is credited and copies are not sold.
Preferred citation:
Bebell, D. & Kay, R. (2010). One to One Computing: A Summary of the Quantitative Results from the Berkshire Wireless Learning Initiative Journal of Technology, Learning, and Assessment, 9(2). Retrieved [date] from http://www.jtla.org.
Volume 9 Number 2

Abstract:
This paper examines the educational impacts of the Berkshire Wireless Learning Initiative (BWLI), a pilot program that provided 1:1 technology access to all students and teachers across five public and private middle schools in western Massachusetts. Using a pre/post comparative study design, the current study explores a wide range of program impacts over the three years of the project’s implementation. Specifically, the current document provides an overview of the project background, implementation, research design and methodology, and a summary of the quantitative results. The study details how teaching and learning practices changed when students and teachers were provided with laptops, wireless learning environments, and additional technology resources. The results found that both the implementation and outcomes of the program were varied across the five 1:1 settings and over the three years of the student laptop implementation. Despite these differences, there was evidence that the types of educational access and opportunities afforded by 1:1 computing through the pilot program led to measurable changes in teacher practices, student achievement, student engagement, and students’ research skills.

One to One Computing: A Summary of the Quantitative Results from the Berkshire Wireless Learning Initiative
Damian Bebell Rachel Kay Boston College
All of us, professionals as well as laymen, must consciously break the habits we bring to thinking about the computer. Computation is in its infancy. It is hard to think about computers of the future without projecting onto them the properties and the limitations of those we think we know today. And nowhere is this more true than in imagining how computers can enter the world of education.
—Seymour Papert, Mindstorms (2nd Ed.)
IntroductionFew modern educational initiatives have been as widespread, dramatic,
and costly as the integration of computer technologies into American class-rooms. Believing that increased use of computers will lead to improved teaching and learning, greater efficiency, and the development of impor-tant skills in students, educational leaders have made multi-billion dollar investments in educational technologies such that the national ratio of students to computers has dropped from 125:1 in 1983 to 4:1 in 2002 (where it has largely remained) (Russell, Bebell, & Higgins, 2004). While access to computers has increased, teachers and students in traditional school environments generally report using computers in schools for only a small amount of time each day (Bebell, Russell, & O’Dwyer, 2004; Russell, Bebell, O’Dwyer, & O’Connor, 2003; Ravitz, Wong, & Becker, 1999). Despite the many ways in which computers can be distributed within schools (e.g., in labs, libraries, or on shared carts), many observers theorize that the disjuncture between the dramatic increase in the presence of com-puters in schools and the relatively stagnant amount of use results in part because student-to-computer ratios have not yet reached a stage at which the technology is ubiquitous (Bull, Bull, Garofolo, & Harris, 2002; Papert, 1996; Rockman, 1998, Cuban, 2006).

One to One Computing: A Summary of the Quantitative Results from BWLI Bebell & Kay
6
J·T·L·A
Both proponents and opponents of educational technology agree that the full effects of computers in school cannot be fully realized until the technology is no longer a shared resource (Oppenheimer, 2003; Papert, 1992, 1996). In the past decade, a new educational reality has emerged where technology resources are no longer shared as thousands of teachers and students have been provided with their own laptop computers in school. In 2003–2004, it was estimated that 4% of the nation’s school dis-tricts were implementing some form of 1:1 computing. In 2006, it was estimated that close to 25% of school districts are implementing some form of a 1:1 laptop program (eSchool News, 2006). 1:1 programs cur-rently exist across the nation in a wide variety of settings including large-scale 1:1 initiatives in South Dakota, Pennsylvania, New Hampshire, Texas, Georgia, Louisiana, California, Virginia, Florida, Kansas, Maine, Massachusetts, and Michigan. In addition, increased international atten-tion has been focused on the adoption of 1:1 computing through programs such as the “One Laptop Per Child” Initiative and Intel’s “World Ahead Program”, which seek to provide bulk quantities of inexpensive laptop computers for educational purposes to children in third world countries (www.laptop.org).
Despite growing interest in and excitement about 1:1 computing, there has generally been a lack of large-scale research and evaluation studies focusing on teaching and learning in these intensive computing environments (Penuel, 2006). However, early studies suggest several posi-tive outcomes emerging from 1:1 laptop initiatives including: increased student engagement (Cromwell, 1999; Rockman, 1998; MEPRI, 2003; Bebell, 2005; Penuel, 2006), decreased disciplinary problems (Baldwin, 1999; MEPRI, 2003), increased use of computers for writing, analysis and research (Cromwell, 1999; Baldwin, 1999; Guignon, 1998; Russell, Bebell, & Higgins, 2004; Penuel, 2006), and a movement towards student-centered classrooms (Rockman, 1998). Baldwin (1999) also documented effects on student behaviors at home such that students reported spending less time watching television and more time on homework. Similarly, Russell, Bebell and Higgins (2004) reported that students’ academic use of computers at home occurred more frequently when students were provided with their own laptops.
In the past few years, a number of studies have begun to focus more specifically on the relationship between student achievement and partici-pation in 1:1 programs, but have not always included measures of specific technology uses. For example, Gulek and Demirtas (2005) examined test scores between students participating and not participating in a voluntary 1:1 laptop program at a middle school in Pleasanton, California. A signifi-cant difference in both math and ELA test scores was found for students participating in the program one year or more, even after statistically

One to One Computing: A Summary of the Quantitative Results from BWLI Bebell & Kay
7
J·T·L·A
controlling for prior achievement levels. An urban middle school study (Dunleavy & Heinecke, 2007) randomly selected students from a school population to participate in 1:1 laptop classrooms or non-1:1 laptop class-rooms. The researchers discovered a significant increase in overall science test scores as well as a significant gender interaction whereby boys had a much greater increase in scores in the 1:1 laptop program than girls. More recently, a 1:1 research symposium at the 2008 meeting of the American Educational Research Association included evidence from Maine’s state-wide 1:1 program (Silvernail, 2008) and Texas’ Technology Immersion Program (Shapley, 2008) that found students in 1:1 middle school class-rooms had statistically significant improvements in English Language Arts achievement, but not in Mathematics.
Given these measures of success, 1:1 computing has captured the imagination of many educational and political leaders looking to reform educational practices and improve underperforming schools. In addi-tion, a number of political leaders have suggested that providing students access to powerful computing technologies may significantly contribute to long-term economic prosperity. Within school settings, the promise of 1:1 computing has also taken root; nearly 50% of school district chief tech-nology officers reported in a recent national survey that they were likely to purchase a computing device for each student in their district by 2011 (Hayes, 2006).
The Berkshire Wireless Learning InitiativeThe Berkshire Wireless Learning Initiative (BWLI) was a three-year
pilot program across five western Massachusetts middle schools where every student and teacher was provided a laptop computer beginning in 2005. In addition, all classrooms were equipped with wireless Internet networks and selected classrooms with DLP/LCD projectors, as well as technical and curricular professional development and support to help teachers integrate the new technology into their curriculum. The $5.3 million dollar program1 was funded through a combination of district-level school funds, state funds, as well as local business contributions. Launched midway during the 2005–2006 school year, the initiative (as well as the accompanying research) continued through the 2007–2008 academic year.
The overall aim of the pilot program was to determine the efficacy of a one-to-one laptop initiative in transforming teaching and learning in a traditional middle school setting. Specifically, the targeted outcomes of the BWLI included: enhancing student achievement, improving student engagement, improving classroom management, enhancing students’ capabilities to conduct independent research and collaborate with their

One to One Computing: A Summary of the Quantitative Results from BWLI Bebell & Kay
8
J·T·L·A
peers, as well as creating fundamental changes in teaching strategies and curriculum delivery. The research efforts employed a pre/post with com-parison group design to examine the effects of 1:1 technology on students and teachers across the five participating schools. In addition to following the cohorts of students over three years of the 1:1 technology implementa-tion, the researchers also collected comparison data from two neighboring public middle schools with similar demographics. A summary of the par-ticipating schools in the BWLI research study are displayed in Table 1.
Table 1: Summary of Schools Participating in the BWLI Research
School Name District Classification Grades School Type
Conte North Adams Public BWLI 6, 7, 8 Public
Herberg Pittsfield Public BWLI 6, 7, 8 Public
Reid Pittsfield Public BWLI 6, 7, 8 Public
St. Mark Catholic Schools of Pittsfield BWLI Pre-K to 7 Parochial
St. Joseph Catholic Schools of Pittsfield BWLI 8, 9, 10, 11, 12 Parochial
North Westfield Public Comparison 6, 7, 8 Public
South Westfield Public Comparison 6, 7, 8 Public
In early January 2006, each of the seventh grade students across the five participating schools (n = 633) received Apple iBook G4 laptops for use during the remaining first year of the BWLI implementation. In the first months of the second and third year of the laptop implementation all sixth, seventh, and eighth grade students across each participating school were provided iBook G4 laptops for the majority of the 2006–2007 and 2007–2008 school year (n = 1700+/–).
Study Methodology and Data Sources
Program Objectives and Study Design OverviewTo directly meet the needs of the project stakeholders, the current
study aimed to document how successfully the BWLI program achieved the following targeted outcomes:
1. Enhanced student achievement;
2. Improved student engagement;
3. Fundamental changes in teaching strategies, curriculum delivery, and classroom management; and
One to One Computing: A Summary of the Quantitative Results from BWLI Bebell & Kay
9
J·T·L·A
4. Enhanced capabilities among students to conduct independent research, and collaborate with peers.
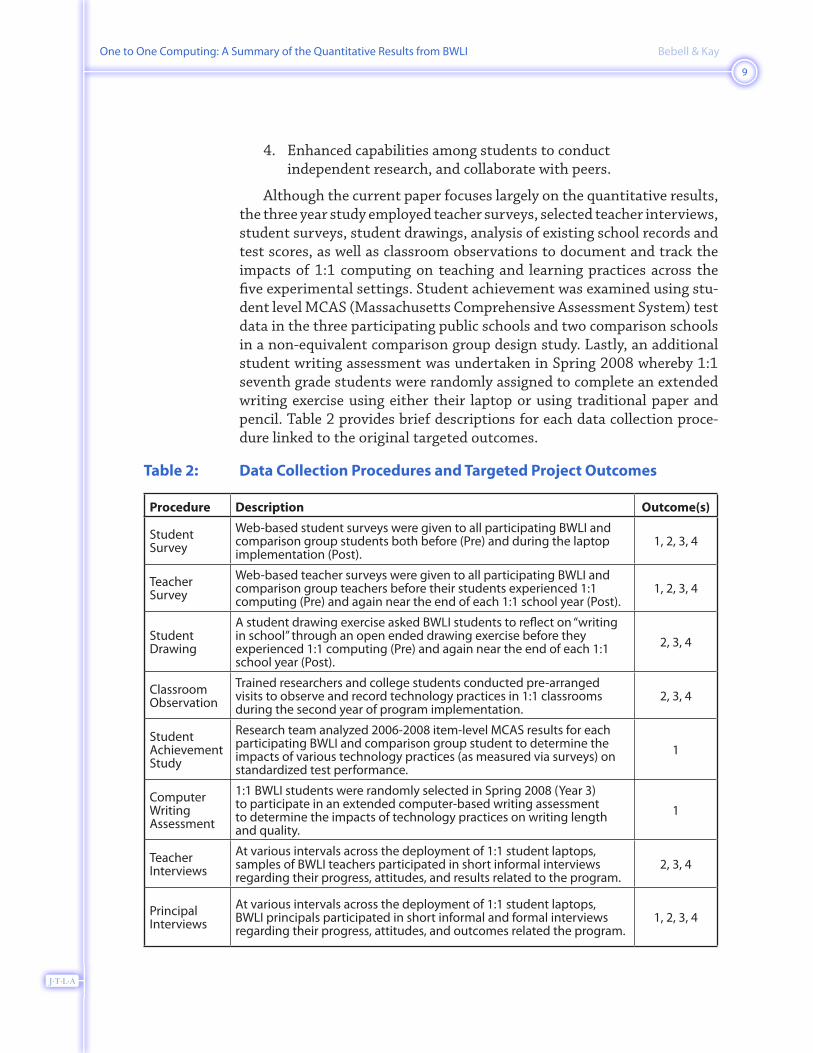
Although the current paper focuses largely on the quantitative results, the three year study employed teacher surveys, selected teacher interviews, student surveys, student drawings, analysis of existing school records and test scores, as well as classroom observations to document and track the impacts of 1:1 computing on teaching and learning practices across the five experimental settings. Student achievement was examined using stu-dent level MCAS (Massachusetts Comprehensive Assessment System) test data in the three participating public schools and two comparison schools in a non-equivalent comparison group design study. Lastly, an additional student writing assessment was undertaken in Spring 2008 whereby 1:1 seventh grade students were randomly assigned to complete an extended writing exercise using either their laptop or using traditional paper and pencil. Table 2 provides brief descriptions for each data collection proce-dure linked to the original targeted outcomes.
Table 2: Data Collection Procedures and Targeted Project Outcomes
Procedure Description Outcome(s)
Student Survey
Web-based student surveys were given to all participating BWLI and comparison group students both before (Pre) and during the laptop implementation (Post).
1, 2, 3, 4
Teacher Survey
Web-based teacher surveys were given to all participating BWLI and comparison group teachers before their students experienced 1:1 computing (Pre) and again near the end of each 1:1 school year (Post).
1, 2, 3, 4
Student Drawing
A student drawing exercise asked BWLI students to reflect on “writing in school” through an open ended drawing exercise before they experienced 1:1 computing (Pre) and again near the end of each 1:1 school year (Post).
2, 3, 4
Classroom Observation
Trained researchers and college students conducted pre-arranged visits to observe and record technology practices in 1:1 classrooms during the second year of program implementation.
2, 3, 4
Student Achievement Study
Research team analyzed 2006-2008 item-level MCAS results for each participating BWLI and comparison group student to determine the impacts of various technology practices (as measured via surveys) on standardized test performance.
1
Computer Writing Assessment
1:1 BWLI students were randomly selected in Spring 2008 (Year 3) to participate in an extended computer-based writing assessment to determine the impacts of technology practices on writing length and quality.
1
Teacher Interviews
At various intervals across the deployment of 1:1 student laptops, samples of BWLI teachers participated in short informal interviews regarding their progress, attitudes, and results related to the program.
2, 3, 4
Principal Interviews
At various intervals across the deployment of 1:1 student laptops, BWLI principals participated in short informal and formal interviews regarding their progress, attitudes, and outcomes related the program.
1, 2, 3, 4

One to One Computing: A Summary of the Quantitative Results from BWLI Bebell & Kay
10
J·T·L·A
It is important to note that each of the participating 1:1 schools varied the deployment and management of the laptop program to best suit the needs of their own distinct educational community. Each school subscribed to its own nuanced resource allocation, training and profes-sional development offerings, policies, and technical and curricular sup-port. Even though the pilot program raised the overall level of technology so that every student and teacher had a laptop computer in school, some differences remained in the deployment and management of the program across the five settings. These differences are further explored in the results and discussion sections of this paper.
Student and Teacher Survey Response Rates
Student Survey
As more fully described in the BWLI Evaluation Plan and the 2009 evaluation report (Bebell & Russell, 2006; Bebell & Kay, 2009), all par-ticipating pilot students were required to complete a web-based survey focused on the frequency of varied technology uses both in and out of the classroom and across the curriculum in addition to demographic items and a brief attitudes and beliefs inventory.
Given that the first year of the program focused only on the seventh grade, 574 grade seventh students across the BWLI schools completed pre-1:1 laptop surveys in December 2005/January 2006 (90.4% of the 635 seventh grade students). After approximately five months of 1:1 computing, 524 of these seventh grade students completed a post-laptop survey in early June 2006 (or 82.5%). Upon the completion of the second year of the program (June 2007) when students across all grade levels (6–8) had access to laptops, the Year 2 online survey was collected from 1,839 of the potential 1,898 students resulting in a 96.8% response rate. In addition, students across the two comparison schools were also solic-ited to participate in the student survey. The June 2008 student survey response rates are presented below for each of the pilot and comparison schools in Table 3 (next page).

One to One Computing: A Summary of the Quantitative Results from BWLI Bebell & Kay
11
J·T·L·A
Table 3: Year 3 (2007–2008) Student Survey Response Rate
School NameStudent
PopulationSurvey
ResponsesResponse
Rate
South Middle School 697 556 79.7%
North Middle School 790 553 70.0%
Total Comparison Schools 1487 1109 74.6%
Conte Middle School 318 318 100%
Herberg Middle School 699 691 98.9%
Reid Middle School 644 643 99.8%
St. Mark 84 84 100%
St. Joseph 41 26 63.4%
Total Pilot (1:1) Schools 1786 1762 98.7%
For the final student survey, a total of 1,109 students completed the Year 3 survey from the two comparison schools yielding a combined response rate of 74.6% while a response rate of 98.7% was achieved across the BWLI schools with 1762 out of 1786 eligible students completing the survey.
Teacher Survey
The online teacher survey focused on capturing the variety and extent of teachers’ technology use, teachers’ attitude toward technology, teaching, and learning, as well as teachers’ beliefs on the effects of the pilot program. The teacher survey is one of the main foci of the current report. As more fully documented in the full BWLI evaluation report (Bebell & Kay, 2009), every teacher participating in the 1:1 program was surveyed prior to and during the three years of the program. In the current report, results from the final June 2008 teacher survey are compared to past survey adminis-trations. Specifically, results from the first (January 2006) teacher survey again reflect a time when teachers had recently received their own laptops but students had not been issued computers. The May 2006 teacher survey administration asked teachers to focus on their first year experiences in the 1:1 program with seventh grade students having access to computers for the last five months of the year but still finding all the 6th and 8th grade students without computers. Teachers from comparison and pilot schools were surveyed again in June 2007, with 160 of the 168 total 1:1 teacher population responding (95% response rate). Given that the June 2008 data is detailed in the results section of this paper, a closer examination of the June 2008 final teacher survey response rates are presented below in Table 4 (next page).

One to One Computing: A Summary of the Quantitative Results from BWLI Bebell & Kay
12
J·T·L·A
Table 4: Year 3 (2007–2008) Teacher Survey Response Rate
School NameTeacher
PopulationSurvey
ResponsesResponse
Rate
South Middle School 80 49 61.3%
North Middle School 73 39 53.4%
Total Comparison Schools 153 88 57.6%
Conte Middle School 42 42 100%
Herberg Middle School 59 59 100%
Reid Middle School 58 58 100%
St. Mark 5 4 80%
St. Joseph 3 0 0%
Total BWLI Schools 167 163 97.6%
For the final teacher survey, a total of 88 teachers completed the survey across the two comparison schools yielding a combined response rate of 57.6% while the response rate was substantially higher across the pilot schools with 163 out of 167 teachers completing the survey (97.6% response rate). Of the 163 teachers across the four pilot schools who completed the BWLI teacher survey, 109 were classified as teaching one of the focused primary subject areas (English/Language Arts, Math, Science, Social Studies). In addition to the 109 primary subject classroom teachers the survey was also completed by an addition 54 teachers and educators who taught subjects including: physical education, special edu-cation, reading intervention, foreign languages, and health. To simplify the interpretation of the results, the current report only presents survey results from the 109 primary subject teachers. Interestingly, the differ-ences between the survey responses of the 109 primary subject classroom teachers and the other subject area specialists concerning the impacts of the BWLI program were largely negligible.
One to One Computing: A Summary of the Quantitative Results from BWLI Bebell & Kay
13
J·T·L·A
Exploring the Impact of 1:1 Computing on Student Achievement
School and Student Level MCAS Analyses
Given that the first targeted outcome of the state’s pilot 1:1 program was to “enhance student achievement” a central component of the cur-rent investigation was addressing how 1:1 participation and technology use impacted student test scores. Specifically, the current investigation addressed:
• trendsinschools’overallMCASperformanceovertimecompared to the comparison schools and state trends during this same period, and
• which,ifany,ofstudents’technologyusesinschoolorathomeare related to student-level performance on various MCAS measures (while statistically controlling for students’ pre-BWLI academic performance using prior MCAS performance)
School-level MCAS results and performance indicators from 1998 to 2008 were accessed from the Massachusetts Department of Education while student level data was provided to the research team directly from the participating schools for 2005-2008. To facilitate our analyses of how different types of student use impacted student test performance, grade 7 and 8 student survey results across all BWLI and comparison students were merged with the item-level MCAS data. Because only public school stu-dents participated in the mandatory MCAS state assessment, only results from the three BWLI public schools and the two comparison schools were available for use. Thus, for each grade level, a new data set was created that included student level MCAS and demographic information as well as the BWLI student survey data on technology use and practices. So, for each seventh and eighth grade student who completed the MCAS and the BWLI survey, the relationship between various technology uses and various out-come/student achievement measures could be examined. Since nearly all students in the pilot public schools completed both the MCAS and the BWLI student survey in Spring 2008, we are able to perform our investiga-tion with a highly representative sample of 1:1 student participants. Table 5, next page, summarizes the MCAS subject tests schedule used by the state across the years of the 1:1 pilot program.
One to One Computing: A Summary of the Quantitative Results from BWLI Bebell & Kay
14
J·T·L·A
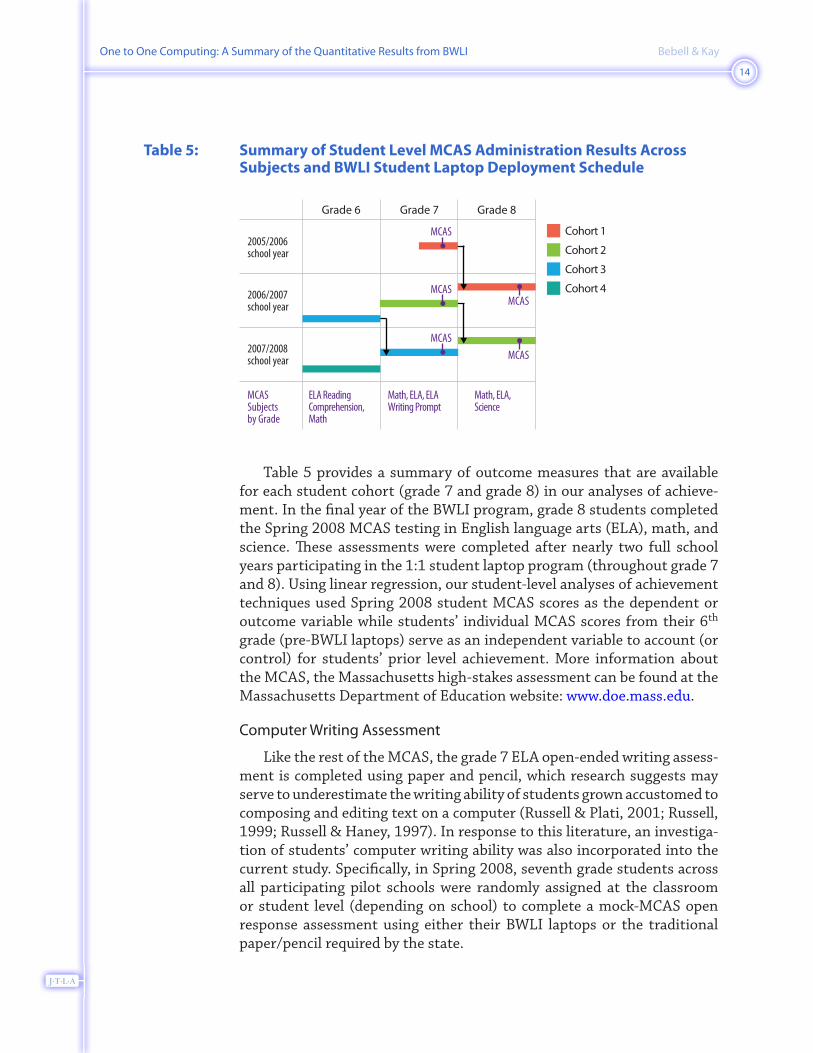
Table 5: Summary of Student Level MCAS Administration Results Across Subjects and BWLI Student Laptop Deployment Schedule
Table 5 provides a summary of outcome measures that are available for each student cohort (grade 7 and grade 8) in our analyses of achieve-ment. In the final year of the BWLI program, grade 8 students completed the Spring 2008 MCAS testing in English language arts (ELA), math, and science. These assessments were completed after nearly two full school years participating in the 1:1 student laptop program (throughout grade 7 and 8). Using linear regression, our student-level analyses of achievement techniques used Spring 2008 student MCAS scores as the dependent or outcome variable while students’ individual MCAS scores from their 6th grade (pre-BWLI laptops) serve as an independent variable to account (or control) for students’ prior level achievement. More information about the MCAS, the Massachusetts high-stakes assessment can be found at the Massachusetts Department of Education website: www.doe.mass.edu.
Computer Writing Assessment
Like the rest of the MCAS, the grade 7 ELA open-ended writing assess-ment is completed using paper and pencil, which research suggests may serve to underestimate the writing ability of students grown accustomed to composing and editing text on a computer (Russell & Plati, 2001; Russell, 1999; Russell & Haney, 1997). In response to this literature, an investiga-tion of students’ computer writing ability was also incorporated into the current study. Specifically, in Spring 2008, seventh grade students across all participating pilot schools were randomly assigned at the classroom or student level (depending on school) to complete a mock-MCAS open response assessment using either their BWLI laptops or the traditional paper/pencil required by the state.
Grade 6
Cohort 2
Cohort 3
Cohort 4
Cohort 1
Math, ELA, ELA Writing Prompt
ELA Reading Comprehension, Math
Math, ELA, Science
Grade 7 Grade 8
2005/2006school year
2006/2007school year
2007/2008school year
MCAS Subjects by Grade
MCAS
MCASMCAS
MCASMCAS

One to One Computing: A Summary of the Quantitative Results from BWLI Bebell & Kay
15
J·T·L·A
A publicly-released writing prompt from a prior (2006) MCAS ELA assessment was used for the BWLI computer writing study. The chief difference between the actual MCAS administration of the ELA writing assessment and the BWLI computer writing study was that in our study students were randomly assigned to complete their essay using either their BWLI laptop or using paper and pencil. Since nearly all participants in our computer writing study (n = 451) would be taking the actual paper-based 7th grade writing assessment later in the school year, a higher proportion of students (approximately two-thirds) were randomly assigned to the laptop setting.
Testing materials and directions were adapted for both the paper and computer testing classrooms, however the directions for the laptop stu-dents specified that all spell-checking, grammar-checking, and other auto-mated features of Microsoft Word (students’ most commonly used writing program) be turned off and/or removed to ensure that the only substan-tive difference between the computer and paper environments would be the mode of test administration. All other testing circumstances (time, resources, directions, scoring criteria, etc.) were held exactly the same to ensure a realistic and meaningful testing experience as well as to ensure valid results. Copies of all directions and materials used in the BWLI com-puter writing study are available at www.bc.edu/bwli.
To eliminate any scorer bias, a team of six trained education under-graduate students were recruited, trained, and employed to electronically input each of 141 paper essays (including all student mistakes, typos, etc.) into Microsoft Word. Once all the paper essays were successfully entered into an electronic format, a second team of eight undergraduate students completed formal training and reliability testing on the state’s coding rubric to score the seventh grade essays. After this training, each member of the scoring team was provided a random sample of student essays to score whereby each essay was scored by two raters on two dimensions: Topic Development and Standard English Conventions.
Qualitative Inquiries: Student Drawings, Classroom Observations, Teacher Interviews, and School Leadership/Principal Interviews
Throughout the three-year implementation of the 1:1 program, mem-bers of the research and evaluation team made regular visits to each par-ticipating school to conduct classroom observations, informally interview teachers, and both formally and informally interview school principals as well as other building level and district level leadership. In addition, stu-dents across the 1:1 settings participated in a student drawing exercise whereby they depicted themselves “writing in school” both before and

One to One Computing: A Summary of the Quantitative Results from BWLI Bebell & Kay
16
J·T·L·A
after implementation of the laptop program. In total, over 3500 student drawings were analyzed using an emergent analytic coding process estab-lished through prior student drawing and 1:1 research studies (Bebell, 2001; Bessette, 2008).
Although each of these qualitative inquires provided rich data sources and served multiple functions within the research study, the limited space herein does not allow a full discussion of these modes of inquiry and many of the specific findings they contributed. A larger discussion of these inqui-ries and specific study results can be found in the BWLI Final Report avail-able at www.bc.edu/bwli (Bebell & Kay, 2009).
ResultsThere are limitless ways to summarize the variety of results and out-
comes from such a complicated initiative. One of the most universal find-ings in the current investigation was that both the implementation and outcomes of the program were varied across the five 1:1 settings and over the three years of the student laptop implementation. The current results focus on those findings that were fairly universal across the five pilot set-tings while subsequent reports will focus on the more specific program differences between the schools.
Within months of the initial student implementation, teacher and student use of technology increased dramatically across the curriculum in nearly all of the participating classrooms. On average, teachers reported widespread adoption of new and novel approaches across their tradi-tional curriculum, which were then subsequently reported by teachers and administration to increase student motivation and engagement, and to a somewhat lesser extent, academic performance. The majority of teachers adopted a wide variety of professional uses for technology including elec-tronic record keeping, communication with other staff and parents via email, creation and management of web pages (often with posted home-work, lesson plans, educational resources, etc.) as well as access to a nearly infinite collection of curricular and pedagogical resources via the Internet. It was observed that teachers, by default, served as gatekeepers to stu-dents’ technology use throughout the school day while the three partici-pating public schools struggled with maintaining effective student laptop take-home policies and practices. Although there often remained substan-tial variation in the frequency and ways different teachers chose to use the technology with their students, the majority of students and teachers altered their approach and practices since the introduction of laptops to the classroom.

One to One Computing: A Summary of the Quantitative Results from BWLI Bebell & Kay
17
J·T·L·A
In this section of the paper, we explore common trends across the var-ious research results that directly address the original targeted project out-comes. Each of the four targeted outcomes (fundamental shifts in teaching practices, improved student engagement, enhanced student research and collaboration, and enhanced student achievement) are individually pre-sented below with examples from supporting data sources. Again, a more thorough examination of all study results, including variations across the five 1:1 settings, can be found in the BWLI Final Report available at www.bc.edu/bwli (Bebell & Kay, 2009).
Fundamental Changes in Teaching PracticesOne of the central project outcomes of the study was the documenta-
tion of fundamental changes in teaching, particularly teaching strategies, curriculum delivery, and classroom management. Without question, the 1:1 program had major impacts across many aspects of teaching for the majority of teacher participants. The chief results supporting this finding include the teacher survey, student survey, principal interviews, class-room observations, and teacher interviews. The first year of teacher and student survey results speak volumes about the speed at which teachers adopted and implemented technology across their professional lives. In short, teachers quickly adopted and incorporated technology into a wide variety of new practices beyond use with their students in the classroom (which had itself increased nearly four times within the first six months of the student deployment). By the third and final year of the 1:1 implemen-tation, student and teacher practices incorporated substantial technology resources and tools in four of the five 1:1 pilot settings. For example, Figure 1 (next page) displays the average number of school days students reported using technology by primary subject area (2007–2008 school year).

One to One Computing: A Summary of the Quantitative Results from BWLI Bebell & Kay
18
J·T·L·A
Figure 1: Average Number of School Days Students Reported Using Technology by Primary Subject Area (2007–2008 School Year)
Figure 1 displays the average number of days students reported using computers across four primary subject areas during the potential 180 school days of the 2007–2008 school year. In the above figure, students’ frequency of computer use is represented by four horizontal bars corre-sponding to the four surveyed subject areas. A number of interesting and noteworthy features are prominent in Figure 1. First, there is substan-tial variability in the frequency of use across subject areas within most of the pilot schools. For example, students across all grade levels at St. Mark reported using their computers over 80 times in ELA and nearly 70 times in Social Studies classes during the 2007–2008 school year while only 6 times in their Math classes. Looking across the schools for subject area trends, we find that in two of the five pilot schools, students used computers in Social Studies class more than other subjects, while students at Conte reported using computers the least in Social Studies. In other words, no single subject area received universally high use at more than two BWLI schools, suggesting that factors within each school play a large role in the adoption and student use of technology. Despite this within school variation, student use of technology in Math and Science classes were generally reported to be less frequent than in ELA and Social Studies classes when examined collectively across the pilot schools.
0 30 60 90 120 150 180
462726
50
42
826
15678
22119
8
6945
3350
57
49
00
3673
34
37Herberg
Reid
St. Joseph’s
South
North
St. Mark
Conte
1:1
Sch
ools
Cont
rol S
choo
ls
ELA/Reading
Math
Social Studies
Science

One to One Computing: A Summary of the Quantitative Results from BWLI Bebell & Kay
19
J·T·L·A
Looking cumulatively across the pilot school averages during the 2007–2008 school year we see that St. Joseph2 students reported the least frequent use (6 instances of computer use across these primary subject areas during the 2007–2008 school year). Students at St. Mark’s School reported the most frequent cumulative use with the average stu-dent reporting that they had used a computer across these four classes on 202 occasions during the school year. Close behind, the average Reid students reported 192 cumulative uses of a computer in these subjects across this same period while Herberg and Conte students reported 177 and 149 respective instances of computer use. What this means is that, on average, pilot students were typically using their laptop computers on a daily or slightly greater-than-daily basis in at least one of their primary subjects classes during the 2007–2008 school year, the second full year of the school wide 1:1 laptop implementation.
In the final teacher survey, nearly all of teachers (83%) reported that their own computer skills had improved since the beginning of the BWLI program. Teacher use of technology also increased dramatically as the pro-gram was implemented and for a wide variety of ways to support their work. For example, Table 6 (next page) illustrates pilot teachers’ use of technology over time from the original January 2006 survey administra-tion (pre-1:1 student access) to the final June 2008 survey.

One to One Computing: A Summary of the Quantitative Results from BWLI Bebell & Kay
20
J·T·L·A
Table 6: 1:1 Pilot Teachers’ Use of Technology Over Time (Average Number Of School Days Per Year)
Jan. 2006 May 2006 May 2007 June 2008
Use a computer to deliver instruction to your class 22.7 58.8 59.2 57.3
Prepare or maintain IEPs using a computer 17.0 9.0 18.4 15.8
Adapt an activity to students’ individual needs using computers 13.2 32.2 28.2 31.2
Make handouts for students using a computer 51.6 50.8 60.7 69.6
Create a test, quiz, or assignment using a computer 49.0 46.8 56.0 60.3
Perform research and lesson planning using the Internet 56.9 73.9 80.6 85.6
Create WebQuests or build the Internet into a lesson 8.8 20.3 21.9 19.9
Use a computer to present information to your class 23.9 56.7 47.4 47.4
Use a computer to help students better understand a concept 23.6 50.2 45.2 46.3
Use a computer to model relationships and/or functions 13.0 29.4 19.3 20.8
Create and/or maintain web pages 26.5 na 78.6 57.0
Assess students using a computer (including a test, quiz, or practice test) 24.1 na 43.6 40.5
Use a computer to communicate with teachers, parents, or administrators 89.6 105.4 111.2 120.9
In addition to showing how frequently teachers used technology at various times during the pilot implementation, Table 6 also illustrates the wide variety of technology adoption and use by teachers. Some of the most frequent “behind the scenes” uses of technology for teachers included such diverse professional tasks as researching and acquiring cur-ricular materials, using email as a school-wide communication system as well as with parents and students, scheduling, record keeping and grades, managing educational web sites for their students, and creating tests, quizzes or assignments. Clearly, teachers’ non-instructional professional practices were impacted by the 1:1 initiative—representing a marked shift in many aspects of teaching. The impact of the new 1:1 technology applied during actual instructional time was somewhat less universally across all pilot classrooms, however the impact was still quite notable considering the major investments required by teachers to “transform” and “funda-mentally change” their existing classroom practices.

One to One Computing: A Summary of the Quantitative Results from BWLI Bebell & Kay
21
J·T·L·A
The majority of teachers reported that they experienced marked shifts in their teaching. In the final survey administration, over 80% of pilot teachers reported that the delivery of curriculum within their classes had changed since their school began the 1:1 pilot program. In addition, slightly less than 60% of responding teachers believed that their school cli-mate had changed as a result of the program and over 50% of teachers fur-ther believed that their role as a teacher within their own classroom had changed. In assessing the impact of these changes in their own teaching, teachers were largely positive with 62% of pilot teachers reporting that their teaching had “improved as a result of the 1:1 program” while less than 10% disagreed. In addition to the teacher’s own reflection in the sur-veys, there were also numerous examples in the classroom observations, teacher interviews, and principal interviews of shifting teacher practices as a result of the 1:1 program.
Despite the majority of teachers reporting that 1:1 computing had led to changes in their teaching, almost everyone involved also expressed the sentiment that “even after a couple of years we still feel like were just get-ting accustomed to teaching in a 1:1 setting” echoing the sentiment that the impacts of the initiative could take many years to be fully realized. Finally, there remained a very small number of teachers who were only negligibly impacted by the pilot program and 1:1 computing. This small minority of staff generally felt satisfied with their pre-1:1 practices and teaching or were simply less confident experimenting with technology. However, the 1:1 pilot program substantially impacted many aspects of teachers’ professional lives in the vast majority of participating class-rooms, and often with positive results.
Improved Student EngagementThere is strong evidence that student engagement increased dramati-
cally in response to the enhanced educational access and opportunities afforded by 1:1 computing through the pilot program. The chief results supporting this finding include the teacher survey, student survey, prin-cipal interviews, classroom observations, and teacher interviews.
In their final survey (June 2008) teachers overwhelmingly reported improvements in student engagement and motivation (see Figure 3). Specifically, eighty-three percent of teachers felt that engagement had improved for their traditional students, compared to 84% for at-risk/low achieving students, and 71% for high achieving students. Similar to the results on student engagement, teachers overwhelmingly found that the 1:1 pilot program enhanced their students’ motivation. Seventy-six per-cent of 1:1 teachers reported that student motivation improved for their low achieving students compared to 73% for traditional students and 59%

One to One Computing: A Summary of the Quantitative Results from BWLI Bebell & Kay
22
J·T·L·A
for high achieving students. Conversely, a very small minority of teachers (less than 2%) believed that the 1:1 laptops had led to declined class par-ticipation and motivation for their students.
Similarly, the principals were as positive as the teachers in their belief that student participation in the program has led to dramatically improved student engagement in the classroom. Nearly all of the building leader-ship reported throughout the three-year implementation period that the majority of students responded very favorably to the laptop initiative and that students’ engagement, attentiveness, and motivation was improved when they were using laptops in class.
Across the classroom observations, student engagement and moti-vation was directly observed in each of the 1:1 pilot settings throughout the deployment period. These observations across the five participating schools, serve to triangulate the survey and interview results showing that the majority of students were more engaged and motivated when provided the opportunity to use technology in their classes. In classroom observa-tions, students would often walk into their class and greet the teacher by asking if they would be “using their laptops today.” When a teacher would respond positively, students would often cheer and visibly express their pleasure. Once class was underway, the majority of students did appear to be more on task and engaged in their schoolwork when they were using their laptops. In fact, students typically appeared to be so much more engaged and generally on task when using laptops in class, that it became a frequent practice to encourage policy makers and educational observers to actually visit and observe 1:1 classes as evidence of the programs suc-cess, such as when Senator John Kerry visited the Conte Middle School’s 1:1 classrooms in October 2007.
Both the classroom observations and teacher interviews also showed that student engagement could also be enhanced when the teacher used technology in class, such as a “cool” technology-enabled presentation to present curriculum.
Enhanced Student Research Skills and CollaborationThere is also evidence that student research skills and collaboration
were enhanced by the improved educational access and opportunities afforded by the 1:1 pilot program. The chief results supporting this finding include the teacher and student survey data, teacher interviews, principal interviews, and classroom observations. Overall, the vast majority (about 95%) of 1:1 pilot program students reported having at least one computer accessible at home which was most typically connected to a high-speed Internet connection and used for over 60 minutes per day, on average. Thus, we can conclude that the vast majority of students entered the 1:1 laptop initiative with considerable computing and Internet experience.

One to One Computing: A Summary of the Quantitative Results from BWLI Bebell & Kay
23
J·T·L·A
Based on the early survey results, pilot students and teachers very quickly adopted the Internet as a research tool and resource. One of the most consistent results across the study findings has been the great fre-quency with which students reported using the Internet to access infor-mation in school. Both the frequency and widespread nature of this use suggests that students had increased their research opportunities and capabilities through the 1:1 initiative.
Figure 2: Frequency of 1:1 and Comparison Students’ Various Computer Uses During The 2007–2008 School Year (Average Number of School Days per Year)
0 30 60 90 120 150 180
36
36
12
20
14
24
24
269
4
32
7
16
14
5
5
5
5
5
56
32
53
85
14
14
14
2
31
3
3
14
49
1011
BWLI
Comparison
Access a teacher’s website
Send and receive email
Take a test, quiz or practice test
Present information to the class
Take notes in class
Keep track of dates and schedule/calendar
Analyze data
Help a student �x a computer problem
Work with spreadsheets/databases
Help a teacher �x a computer problem
Write �rst drafts
Email a teacher
Solve problems
Play educational computer games
Create a PowerPoint presentation
Create graphs or tables
Find information on the Internet
Edit papers

One to One Computing: A Summary of the Quantitative Results from BWLI Bebell & Kay
24
J·T·L·A
Figure 2 shows specifically the number of days during the third year of the 1:1 pilot implementation (2007–2008 school year) that students reported a variety of specific technology uses. Summarizing across all schools and grade levels, this table provides an estimate of the frequency of these specific types of technology across the five pilot and two compar-ison schools. As Figure 2 shows, pilot students used technology across a wide variety of applications and with substantially greater frequency than students in the comparison schools. In fact all differences are statistically significant at p < .0005, except “Help a student fix a computer problem” (p = .546) and “Help a teacher fix a computer problem” (p = .648).
The figure also allows for the comparison of the most-frequently occur-ring technology uses (found at the top of the figure) to the least frequently occurring uses (found at the bottom of the figure). By far, the most fre-quently reported technology use at both pilot and comparison schools was using a computer “to find information on the Internet.” Other frequent uses of technology in the 1:1 settings included using a computer to: “access a teacher’s web site”, “play computer games”, “take notes in class” and “edit papers using a computer.” Some of the least frequent in-school technology uses during the 2007–2008 school year included using a computer to “ana-lyze data”, and “work with spreadsheets/databases.”
Certainly, in each pilot setting students’ access to digital resources and tools increased exponentially with 1:1 student computing. In both the classroom observations and teacher interviews, there were numerous accounts of how 1:1 computing and wireless Internet access had changed the way students’ would access information and conduct research. It was generally observed that students’ quick adoption and preference for the Internet (and more specifically Google) was emphatically reported to be the research tool of their choice. In the teacher survey, pilot teachers reported that once beginning the 1:1 environment they more frequently assigned their students to create products using a wider variety of tools and mediums than had been available prior to the 1:1 program. Specifically, teachers reported multifold increases in the frequency of their students creation of multimedia projects, pictures and art, stories and books, web pages or other web-based publications all using their new technology resources throughout the student laptop deployment. Teachers addition-ally observed that the increases in access to educational materials and tools for creating projects and products increased students’ collection of skills. After the third scheduled year of program implementation over 60% of teacher respondents still felt that their students have “greater freedom of choice with regard to their individual learning style” due to their partici-pation in the pilot program. Examining these results collectively, both the practices and sentiments of participating students and teachers suggest that students’ markedly increased their access and use of technology to conduct research through participation in the 1:1 program.

One to One Computing: A Summary of the Quantitative Results from BWLI Bebell & Kay
25
J·T·L·A
There is also mixed evidence that student collaboration and interac-tion with peers increased with the resources and opportunities afforded to students through the 1:1 pilot program. Although a challenging outcome to measure, teachers across the pilot setting generally observed increases in student collaboration for a sizable portion of their students, although not the majority. Specifically, in the final survey pilot teachers reported that their students’ interactions with other students had increased as a result of 1:1 computing. Across all 1:1 teacher respondents, 44% reported increased student interaction for their traditional students, 42% for their low-achieving students, and 39% for their high-achieving students. Across all types of students, fewer than 7% of teachers reported decreases in stu-dent peer interaction as a result of the 1:1 initiative. The post-BWLI prin-cipal/school leadership interview also saw school leaders divided in their assessment that “students interact with each other more while working with computers” where 3 of respondents agreed (40%) or strongly agreed (20%) and 2 disagreed (40%). However, teachers were stronger in their assessment that the BWLI program had positively impacted students’ ability to work independently. For example in the final year-end survey, BWLI teachers largely reported that their students’ ability to work inde-pendently had increased as a result of the program. Across all 1:1 teacher respondents, 69% reported increases in their traditional students ability to work independently, 65% for low-achieving students, and 52% for high-achieving students (less than 3% reported declines). Based on this evidence, we can conclude that both student collaboration and interaction increased for many 1:1 students and in many pilot classrooms, but the impact of the initiative on student collaboration was much less dramatic and universal than many of the other study findings.
Enhanced Student AchievementAfter three years of 1:1 implementation there was evidence that stu-
dent achievement had been positively enhanced through the types of edu-cational access and opportunities afforded by the 1:1 pilot program. In the following exploration of student achievement, we highlight results using a variety of approaches and perspectives including:
• teachersandschoolleadershipattitudesandbeliefsconcerningthe impact of 1:1 computing on their students’ academic achievement,
• achievementtrendsinschools’overallMCASperformanceovertime compared to the comparison schools and state trends,
• which,ifany,ofstudents’technologyusesinschoolorhomerelate to student-level performance on various MCAS outcomes (while statistically controlling for students’ pre-BWLI academic performance using prior MCAS performance), and

One to One Computing: A Summary of the Quantitative Results from BWLI Bebell & Kay
26
J·T·L·A
• theresultsofacomputer-writingstudywherebyBWLIseventhgrade students completed an extended writing exercise with and without technology.
Each of these approaches and perspectives for examining student achievement has their own focus as well as methodological limitations. So, we summarize each approach individually to provide readers a broad spec-trum of results from our achievement inquiry as well as to provide an indi-cation of the complexity and challenges associated with each approach.
Teacher Attitudes Towards 1:1 Computing and Its Impact on Students’ Academic Achievement
In a series of five-point Likert scaled survey questions (Strongly Agree, Agree, Neither Agree/Disagree, Disagree, and Strongly Disagree) teacher attitudes and beliefs towards the 1:1 pilot program were addressed after three years of participation in the June 2008 survey. Table 7 begins the summary of teacher attitudes towards 1:1 computing by addressing the degree to which teachers feel the laptop program has impacted their stu-dents.
Table 7: Summary of Pilot Teacher Sentiments Towards 1:1 Computing
Strongly agree Agree Neutral Disagree
Strongly disagree
My students have benefited greatly from participation in the 1:1 laptop program.
34% 37% 25% 3% 1%
I would encourage other Massachusetts middle schools to adopt 1:1 computing programs.
31% 37% 21% 8% 4%
The considerable costs and expenses associated with 1:1 laptop programs are not justified based on my experiences.
6% 17% 27% 25% 25%
The impacts of any 1:1 computing program may take many years to be fully understood.
16% 46% 25% 9% 4%
As Table 7 shows, after three years of program participation, teachers were largely positive in their sentiment and attitude towards 1:1 com-puting. Overall, 71% of BWLI teachers felt that their students had “ben-efited greatly” from their participation in the 1:1 program. In contrast, only a very small portion of teachers (4% total) disagreed with the state-ment that students had greatly benefited from their participation in the

One to One Computing: A Summary of the Quantitative Results from BWLI Bebell & Kay
27
J·T·L·A
1:1 laptop program. When teachers were asked more pointedly, about “encouraging other Massachusetts middle schools to adopt 1:1 computing” teachers were nearly as positive with 68% of participants in agreement. Half (50%) of all pilot teachers reported that they disagreed or strongly disagreed with the surveyed statement indicating that the considerable costs and expenses associated with a 1:1 laptop program is indeed justified based on their own experiences. Amongst the remaining half of teacher who did not expressly feel the expenses were justified, 23% agreed the costs and expenses were not justifiable while 27% reported that they could nei-ther agree nor disagree with the statement. It is also highly noteworthy to policy makers and educators alike that the majority of 1:1 teachers (60%) agreed with the survey item stating the “impacts of any 1:1 computing program may take many years to be fully understood.”
Teachers were also presented a list of fourteen types of student behav-iors, attitudes, and activities and were asked to rate how such actions have changed (Declined, No Effect, Improved) since the laptop program was first launched. Teachers were asked to focus the responses to these survey items based on specific groups of students. These groups included:
• highachievingstudents,
• at-riskorlow-achievingstudents,and
• traditionalstudents
The results reported below are averaged from all of the 108 BWLI pri-mary subject teachers who completed the final June 2008 survey. Figure 3, below presents 1:1 teachers’ beliefs on the impacts of 1:1 computing following three years of participation in the pilot program.

One to One Computing: A Summary of the Quantitative Results from BWLI Bebell & Kay
28
J·T·L·A
Figure 3: Teachers’ Beliefs on the Impact of 1:1 Computing Across Different Students (June 2008)
Figure 3 illustrates teachers’ beliefs on the impact of 1:1 computing across a wide variety of student behaviors, attitudes, and activities for their traditional, high-achieving, and low-achieving students. The four-teen student outcomes are sorted and organized by the degree of teacher sentiment, such that areas where teachers have observed the greatest improvements are located in the top of the figure, while areas with the
0 100 0 100 0 100
1
3
3
41
42
7
44
44
5831
5
21
66
24
49
69
2
2
73
2
2171
3
122
83
39
4050
467
28
45
6
3
44
2468
513
0
3760
0
43
47
8
42
50
5831
4
17
73
28
43
65
3
2
76
2469
121
84
37
3851
457
194
40
7
6
45
1873
543
1
3855
5
1
3
39
31
6
39
41
6030
5
31
51
38
47
52
2
2
59
2861
193
71
37
3452
437
402
54
6
3
45
1767
494
1
3954
0
Improved
TraditionalStudents
% % %
At Risk/Low AchievingStudents
High AchievingStudents
No E�ect
Declined
students’ motivation
students’ preparationfor class
students’ ability to retaincontent material
students’ interactionwith teachers
students’ quality of work
students’ attendance
students’ qualityof writing
students’ peer reviewin class
students’ interaction withother students
students’ ability to workindependently
students’ behavior
students’ ability to workin groups
engagement/interest level
students’ participationin class
Teachers’ beliefs on the impact of 1:1 computing on:

One to One Computing: A Summary of the Quantitative Results from BWLI Bebell & Kay
29
J·T·L·A
least improvements are located at the bottom. Although a great deal of information is contained within Figure 3, even a casual glance reveals that substantially more participating classroom teachers had a positive overall assessment of the 1:1 outcomes than negative or neutral. After two or more years’ experience in a 1:1 setting, teachers reported improvements were most concentrated in their students’ interest/engagement in class, motivation, and quality of work. In addition, the majority of teachers expressed that the program had also served to improve the quality of their students’ work. This observation was found across all three types of student groupings. However, the category with the highest percent of improvement was found for traditional students with 71% of 1:1 teachers reporting that students’ quality of work improved compared to 69% for at-risk/low achieving students and 61% for high achieving students. More specifically, the survey also addressed the impact on more specific stu-dent outcomes, such as the quality of student writing. High achieving stu-dents’ writing quality was seen to benefit most from the 1:1 laptops with nearly 60% of teachers responding that their high-achieving students’ writing quality had improved, although at-risk/low achieving students and traditional students were seen to improve by nearly as many teachers. Conversely, a small number of teachers (under 5% for each category) felt that their students’ writing had declined as a result of the 1:1 program.
Principal and School Leaders’ Attitudes Towards Students’ Academic Achievement
In their final research interview, after three years of 1:1 computing, each principal/school leader (n = 5) was presented with a number of state-ments addressing the potential impacts of the 1:1 pilot program. School leaders were asked to rate their degree of agreement with each statement using only the following scale: Strongly Agree, Agree, Disagree, Strongly Disagree. Responses were recorded during the interview and are repro-duced in Tables 8 (next page) and 9 (page 30).

One to One Computing: A Summary of the Quantitative Results from BWLI Bebell & Kay
30
J·T·L·A
Table 8: Summary of General Attitudes and Benefits of Computers in Education Across BWLI Principal/School Leaders (2008 Interview)
Strongly agree Agree Disagree
Strongly disagree
Students are more willing to write second drafts when using a computer. 100% 0% 0% 0%
Students would use technology more at my school if there was less pressure to perform on standardized tests.
67% 33% 0% 0%
Students create better-looking products with computers than with other traditional media.
60% 40% 0% 0%
Students work harder at their assignments when they use computers.
20% 60% 20% 0%
Students interact with each other more while working with computers. 20% 40% 40% 0%
Computers help students grasp difficult curricular concepts. 0% 100% 0% 0%
Students develop a deeper understanding of the subject material when using a computer.
0% 80% 20% 0%
Table 8 shows the BWLI schools’ leadership was overwhelmingly posi-tive in their views towards most of the commonly ascribed positive stu-dent outcomes from the 1:1 literature. For example, all of the interviewed school leadership reported unanimously that their students were “more willing to write second drafts when using a computer.” One hundred per-cent of all interviewed school leaders also believed that computers helped their students “grasp difficult curricular concepts” and allowed them to “create better looking products.” Moreover, of the school leaders who responded to this question, all were unanimous in their belief that “stu-dents would use technology more at my school if there was less pressure to perform on standardized tests.” There was only one school principal/leader who disagreed with the sentiments of the other four pilot school leaders who reported that their “students develop a deeper understanding of the subject material when using a computer” and that “students work harder when using a computer.” In addition to these general statements concerning the impact of computers on education, the interview also que-ried principals and school leaders to reflect on more specific items about the implementation and impacts of the pilot program specifically. These results are shared in Table 9 (next page).

One to One Computing: A Summary of the Quantitative Results from BWLI Bebell & Kay
31
J·T·L·A
Table 9: Summary of Specific Attitudes and Benefits of the 1:1 Pilot Program Across BWLI Principals/School Leaders (2008 Interview)
Strongly agree Agree Disagree
Strongly disagree
The BWLI program has positively impacted my students’ academic performance.
75% 25% 0% 0%
Increased technical support could have improved the effectiveness of the BWLI program.
60% 40% 0% 0%
The BWLI program has positively impacted my students in non-academic ways.
50% 25% 25% 0%
The impacts of any 1:1 computing program may take many years to be fully understood.
40% 60% 0% 0%
My students have benefited greatly from their participation in the 1:1 laptop program.
40% 40% 20% 0%
My teachers’ teaching has improved as a result of the 1:1 laptop program. 40% 40% 20% 0%
I would encourage other Massachusetts middle schools to adopt 1:1 computing programs.
40% 40% 20% 0%
Increased curriculum support could have improved the effectiveness of the BWLI program.
20% 60% 20% 0%
The considerable costs and expenses associated with 1:1 laptop programs are not justified based on my experiences.
0% 40% 40% 20%
Table 9 shows that the views of the 1:1 pilot school leadership were again overwhelmingly positive in their attitudes towards outcomes of 1:1 computing. For example, all (100%) of the interviewed school leadership reported that the “BWLI program has positively impacted my students’ academic achievement.” Again, there was only one school principal/leader who disagreed with the sentiments of other four pilot school leaders who reported that “The BWLI program had positively impacted my student’s in non-academic ways” and “my students have benefited greatly from their participation in the laptop program.” Similarly, in the interview questions weighing the costs and benefits of the pilot program, again the same school leader disagreed with the others who expressed universal agreement with the statement “I would encourage other Massachusetts middle schools to adopt 1:1 computing programs.” An additional school leader expressed some trepidation in a second (and more pointed) question concerning the costs and benefits associated with 1:1 computing. In total 60% of 1:1 pilot school leaders disagreed with the statement “considerable costs and

One to One Computing: A Summary of the Quantitative Results from BWLI Bebell & Kay
32
J·T·L·A
expenses associated with 1:1 laptop programs are not justified based on my experiences” while 40% expressed agreement.
School-Level Trend Analyses
In this series of analyses, student pass rates on the MCAS were weighted and averaged across the three public BWLI schools and compared to the combined student performance in the two comparison settings as well as to statewide student performance for both seventh grade and eighth grade achievement trends. For example, Figure 4 shows the percent of “passing” students on the 8th grade Math MCAS for BWLI schools, comparison schools, and the average state pass rates from 1998 to 2008.
Figure 4: Percent of Students “Passing” 8th Grade Math MCAS (1998–2008)
Figure 4 shows the percent of BWLI students, comparison students, and the state average of students who passed the 8th grade Math MCAS each year from 1998 to 2008. With the first MCAS assessment in 1998 both BWLI and comparison schools’ pass rates were 50% on average, 8% below the state average of 58%. Over the next seven years (the pre-BWLI
40%
45%
50%
55%
60%
65%
70%
75%
80%
1998 1999 2000 2003 2006 2007 2008
BWLI
Comaprison
State
Gap between BWLIand State
Gap between BWLIand Comaprison
BWLI 50%
50%
58%
50%
53%
60%
47%
58%
61%
58%
64%
67%
2002
54%
64%
67%
2001
57%
64%
69%
2004
60%
68%
71%
2005
55%
67%
70%
59%
74%
71%
65%
74%
75%
70%
76%
76%
-7.5%
0.5%
-10%
-3%
-13.5%
-10.5%
-9%
-5.7%
-12.8%
-9.5%
-11.8%
-6.9%
-11.3%
-8%
-15.3%
-12.1%
-12.2%
-15.1%
-9.8%
-8.9%
-6.3%
-6.7%
Comaprison
State
GAP: BWLI / StateGAP: BWLI / Comparison

One to One Computing: A Summary of the Quantitative Results from BWLI Bebell & Kay
33
J·T·L·A
period) scores in the comparison setting rose, steadily eliminating their performance gap with the state average. In this same time, BWLI scores also increased although less dramatically so that by the 2005 and 2006 assessments, BWLI pass rates were increasingly lagging behind both com-parison schools and state averages. In 2006, the overall pass rate for the 8th grade Math MCAS was 59% in the BWLI settings compared to 74% in the comparison schools and 71% statewide.
The Spring 2007 MCAS assessment represents the first time the 8th
grade student cohort had 1:1 laptop access including most of their 8th grade year as well as the last half of their 7th grade year across the BWLI schools. This cohort of BWLI students showed strong progress in improving pass rates 5% during each year of the 8th grade BWLI implementation, bringing the average pass rate up to 70% by 2008. In other words, this unprec-edented two-year improvement in eighth grade Math pass rates across BWLI settings corresponded with the years students’ participated in the 1:1 laptop program.
Similarly, additional examinations of 7th grade school performance on the ELA and Math MCAS found the highest student pass rates in 2007, the first full year of the BWLI implementation in grade 7 and the year when students and teachers reported the most widespread and frequent use of technology in the respective surveys. Specifically, grade 7 student performance in the BWLI settings reached its highest historical levels on record for both the ELA (since 2001) and Math (since 2006) MCAS during the year when BWLI implementation and use was at its peak. Similarly, our examination of test results for 8th grade performance on the ELA, Math, and Science MCAS also found the highest levels of student achievement were observed in 2007 and/or 2008, the two years that the BWLI imple-mentation provided 1:1 laptops to grade 8 students. Like the patterns observed for the 7th grade assessments, grade 8 student performance in the BWLI settings reached its highest historical levels in every tested sub-ject area (ELA, Math, and Science) when the BWLI implementation and use were at their peak.
Without a true experimental design, this trend analyses does little to prove that the 1:1 pilot program improved test scores. However one poten-tial explanation of the seventh and eighth grade MCAS pass rates over this time period could be that 1:1 participation was conducive or complemen-tary to practices that fostered improvements in test performance. Given that each year of our MCAS analyses represents different cohorts of stu-dents, there is a possibility that the improvements realized during the 1:1 implementation years may also be attributed (in full or part) to pre-existing characteristics of the student body that completed the exam in 2007 and 2008. Although it seems fairly unlikely that the years of the full 1:1 laptop

One to One Computing: A Summary of the Quantitative Results from BWLI Bebell & Kay
34
J·T·L·A
implementation also witnessed better performing students in each of the BWLI schools than had existed historically, without a randomized experi-mental study it is impossible to completely attribute these test score gains to the 1:1 pilot program. However, it is possible to examine the potential of any “cohort effect” within these results through further examination of how individual student performance on the MCAS has changed during the BWLI implementation period. In other words, how much improvement, if any, was observed for 8th grade students’ test performance after two years of 1:1 computing compared to the same students two years earlier in grade 6.
Student-level Relationship Between Achievement and Technology Use
As previously summarized in the methodology section, a student level data set was created that included MCAS results as well as the final administration of the student survey (June 2008). Thus, for each student who completed the MCAS and the BWLI survey, the relationship between student achievement and participation in 1:1 computing activities can be examined. Table 10 provides demographic information from the newly merged 2007–2008 MCAS/BWLI data set across the eighth grade BWLI and comparison school settings.
Table 10: Demographic and MCAS Information for Pilot and Comparison Students (Spring 2008)
Conte Herberg Reid North South
% of Students eligible for free/reduced lunch 44% 38% 57% 26% 45%
% of non-white (A, B, H, M, N) students 16% 18% 24% 10% 20%
Mean ELA raw score 34.6 35.6 34.8 36.7 34.5
Mean Math raw score 31.4 31.9 29.7 33.7 30.5
# of Students who completed 2008 MCAS 116 268 219 237 238
# of Students who completed 2008 BWLI survey 115 253 211 172 177
# of Special education students 21 43 34 42 43
Table 10 shows the mean MCAS scores across each school’s 2008 eighth grade class, the percent of students who were eligible to receive free or reduced lunch, the percent of non-white students, the number of special education students, as well as the number of students who completed the final Year 3 BWLI survey in June 2008.

One to One Computing: A Summary of the Quantitative Results from BWLI Bebell & Kay
35
J·T·L·A
Exploratory data analyses were performed using the student data to investigate if the frequency of teachers’ and students’ various technology uses (as measured by the student survey) exhibited any notable relation-ship with the 2008 student achievement results. More simply put, did any of students’ specific uses of technology during the third year of the 1:1 pilot program relate to their test performance? Given the fact that there was such wide variation across and between the 1:1 and comparison school students, the current data set provides a good opportunity for such explo-rations particularly considering the high participation rate.
Because there were such a wide ranging number of surveyed student technology uses, factor analysis was applied across the student survey items to create more reliable and stable measures of student practices within the 1:1 and comparison school settings. Specifically, principal com-ponent analysis was applied to create six scales representing different types of student technology use for writing and research, solving prob-lems, presenting information, class-related activities, communicating, and reported teachers’ use of technology. Four additional scales were created from the student survey results to represent students’ varied home use of computers including writing and research, multimedia, communication and social use, and recreational use. Lastly, student attitudes and beliefs were summarized across survey items to form two scales concerning stu-dents’ beliefs towards 1:1 computing and students’ self-perception of their technology abilities. Additional information on the factor analyses and student technology use scales is available in the Final BWLI Evaluation Report (Bebell & Kay, 2009) at: www.bc.edu/bwli.
Through an analysis of student test performance and various indicators of technology practices, it is possible to get some general understanding of the complex relationship between student and teacher practices and student achievement (as measured by the MCAS). In this type of design (including students from non-1:1 laptop settings in comparison groups) it is possible to examine if specific technology practices appear to be relating to test scores positively, negatively, or not at all. In the following analyses, the relationship between teachers’ and students’ use of technology and MCAS performance is demonstrated using Pearson’s correlation coeffi-cients (r). For the correlation tables of student results presented below, correlation values found to be statistically significant are depicted in bold (p < .05, 2-tailed test). Again, these correlation results are not intended to determine the effectiveness of the 1:1 pilot program or its various compo-nents, but rather to explore what student and teacher uses may be related to a common measure of student achievement. Table 11 (next page) shows the correlational relationship between 8th grade students’ 2008 perfor-mance on the ELA, Math, and Science sections of the MCAS with socio-economic status indicators and commonly reported technology uses.
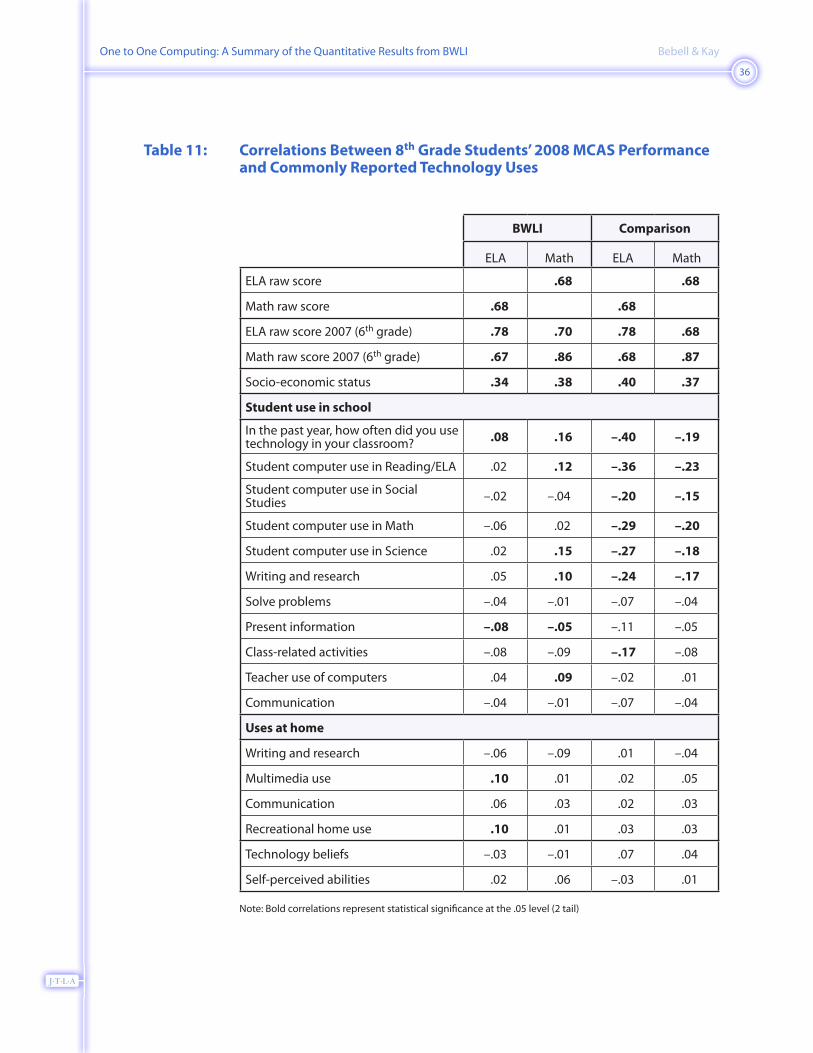
One to One Computing: A Summary of the Quantitative Results from BWLI Bebell & Kay
36
J·T·L·A
Table 11: Correlations Between 8th Grade Students’ 2008 MCAS Performance and Commonly Reported Technology Uses
BWLI Comparison
ELA Math ELA Math
ELA raw score .68 .68
Math raw score .68 .68
ELA raw score 2007 (6th grade) .78 .70 .78 .68
Math raw score 2007 (6th grade) .67 .86 .68 .87
Socio-economic status .34 .38 .40 .37
Student use in school
In the past year, how often did you use technology in your classroom? .08 .16 –.40 –.19
Student computer use in Reading/ELA .02 .12 –.36 –.23
Student computer use in Social Studies –.02 –.04 –.20 –.15
Student computer use in Math –.06 .02 –.29 –.20
Student computer use in Science .02 .15 –.27 –.18
Writing and research .05 .10 –.24 –.17
Solve problems –.04 –.01 –.07 –.04
Present information –.08 –.05 –.11 –.05
Class-related activities –.08 –.09 –.17 –.08
Teacher use of computers .04 .09 –.02 .01
Communication –.04 –.01 –.07 –.04
Uses at home
Writing and research –.06 –.09 .01 –.04
Multimedia use .10 .01 .02 .05
Communication .06 .03 .02 .03
Recreational home use .10 .01 .03 .03
Technology beliefs –.03 –.01 .07 .04
Self-perceived abilities .02 .06 –.03 .01
Note: Bold correlations represent statistical significance at the .05 level (2 tail)

One to One Computing: A Summary of the Quantitative Results from BWLI Bebell & Kay
37
J·T·L·A
Overall, it appears that there are a number of student level indicators (including students’ and teachers’ technology uses measured by the Spring 2008 survey) which were found to have a statistically significant relation-ship with student achievement as measured by the Spring 2008 MCAS. It is noteworthy that for both the comparison school sample and the BWLI sample, the relationship among the 2008 tested subjects (ELA, Math, and Science) exhibited strong positive correlations (between .69 and .80) indi-cating that students’ performance on one section of the MCAS was highly indicative of their performance in other tested subject areas. In addition, there was a very strong statistically significant relationship between stu-dents’ 2008 8th grade MCAS performance and their prior performance on MCAS, particularly in Math where correlations were observed as high as .87. Similarly, students’ socio-economic status (SES), as measured by a scale incorporating a student’s participation in free or reduced lunch programs and the number of books a student has at home as reported on the student survey, was positively correlated with MCAS performance indicating that low-SES students received lower test scores than students who were not eligible for assistance programs. In addition, the relationship between past achievement and student home variables on test performance has a long history in educational research and testing, and the results presented here echo much of this literature. Clearly, the very large positive correlations observed across students’ 2007 and 2008 test performance show that stu-dents prior test performance is the major predictor of future performance, independent of setting, educational reforms, or practices.
In terms of the relationship between students’ use of technology in the classroom and test performance, statistically significant (yet fairly weak) positive results were found for the BWLI eighth grade students (who had about two years of 1:1 laptop use in school) while statistically significant negative results were found for the comparison school 7th grade students (who never participated in a 1:1 laptop program). Specifically, 1:1 pilot students who reported using technology in their classroom during the 2007–2008 school year more frequently were found to score better on both the Math and Science 8th grade assessment than those 1:1 students who did not report as frequent use. In the comparison settings, the rela-tionship between technology use in the classroom and ELA and Math per-formance also exhibited a statistically significant correlation, however the relationship was negative.
Also presented in Table 11 is the relationship between the frequency of students’ reported use of technology across their four primary classes (ELA/Reading, Math, Social Studies, and Science) and 2008 MCAS per-formance. The relationship between BWLI test performance and students’ subject specific technology use varied by subject area, however statisti-cally significant relationships were observed for ELA, Math, and Science.

One to One Computing: A Summary of the Quantitative Results from BWLI Bebell & Kay
38
J·T·L·A
Student use of computers in Social Studies and Science classes was nega-tively correlated with MCAS ELA scores across BWLI students. Conversely, student use of computers in Reading/ELA and Math classes was positively correlated with Math and Science MCAS performance in the 1:1 pilot set-tings. For the comparison students, the relationship between student use of technology across the core curricular subjects and MCAS performance was again entirely negative. Statistically significant correlations were observed for students’ use of computers in Reading/ELA and student performance in ELA and Science, suggesting that the types of computer activities in non-1:1 settings were not necessarily conducive to increased student test performance.
Lastly, Table 11 includes a summary of correlations between scales of specific student uses of technology in school and ELA, Math, and Science MCAS scores. As shown above, nearly all of the specific technology uses exhibited weak, negative correlations with test results both for 1:1 pilot students and comparison school students. These results suggest that the specific skills gained by students who frequently use these technology applications in school may be unrelated or even negatively related with MCAS performance. Again, in this analysis we see BWLI students experi-encing somewhat more positive impacts from their use of technology than comparison students in the non-1:1 setting where nearly all specific school uses were negatively correlated with test performance. Specifically, for the BWLI eighth grade students, statistically significant positive correlations were observed for students’ in school use of technology for “communi-cation” with their 2008 Math and Science performance. Two statistically significant negative correlations were additionally observed; for BWLI stu-dents’ use of technology in school to “present information in class” with ELA and Math performance and “in class activities” with Science. In addi-tion, 1:1 pilot students’ frequency of home use of computers for “recre-ational use” was observed to be a positive statistically significant predictor for ELA and Math raw scores, whereas multimedia use was a negative statistically significant predictor in the non-1:1 settings. Lastly, students’ technology beliefs towards the 1:1 program were not found to be a statisti-cally significant predictor of MCAS performance in BWLI or comparison settings, however in the 1:1 setting students perceived abilities to use technology exhibited a statistically significant correlation with students MCAS performance across all tested subjects.
Determining the Relationship Between Student-level Technology Use and Student Achievement
In the preceding tables and figures, the relationship between students’ use of technology and measures of student achievement were explored for BWLI and comparison school students. Through these exploratory anal-

One to One Computing: A Summary of the Quantitative Results from BWLI Bebell & Kay
39
J·T·L·A
yses of potential variables that may impact students’ achievement, pre-vious achievement on prior MCAS exams was clearly the largest and most substantial predictor of students’ performance on the 2008 assessments. In addition, students’ socio-economic status was also a consistently strong predictor of all student achievement measures. Of more interest to the current inquiry, a number of student technology use indicators were also found to be statistically significant predictors of different student achieve-ment measures. However, given the overall weakness of these correlations and that prior MCAS performance is such a strong predictor of current and future achievement, does participation in the 1:1 pilot program still have an impact on student achievement after the large effects of prior achievement are statistically controlled? In other words, did being in the 1:1 pilot program and using technology in school results in student test performance beyond what we would expect for students given their past performance? The following analyses of 8th grade 2008 1:1 pilot and com-parison student participants seek to address this question.
Again, all eighth grade BWLI students completed the ELA and Math MCAS in Spring 2008 after nearly two full years of participation in 1:1 learning environments. The Spring 2006 MCAS assessment (completed by these same students when they were in grade 6) represents the last available state assessment results before students were exposed to the 1:1 setting, and given that both ELA and Math subject exams were offered, provides a good subject-specific measure of pre-laptop student achieve-ment. Figure 5 shows average 2006 and 2008 MCAS raw scores for BWLI and comparison students.
Figure 5: Mean 2008 ELA and Math Raw Scores for 8th Grade BWLI and Comparison Students Compared to Their 2006 MCAS Raw Scores
25
30
35
40
32.9
35.5
36.7
34.735.6
36.7
38.137.2
33.1
35.1
37.1
35.3
31.4
33.6
35.7
33.0
BWLI
Comparison
BWLI without Special Ed.
Comparison without Special Ed.
MathELA
2006 20062008 2008

One to One Computing: A Summary of the Quantitative Results from BWLI Bebell & Kay
40
J·T·L·A
Figure 5 illustrates the mean ELA and Math MCAS performance for 8th grade students in 2008, compared to the same students’ performance on the grade 6 ELA and Math MCAS in 2006. The figure shows the averages for BWLI students, who had approximately two years experience in a 1:1 environment, as well as for comparison students from two similar schools where no laptop program was present; although teacher use of technology was notably widespread in both comparison settings. Compared to their 6th grade test performance in 2006, 8th grade BWLI students averaged about 2.7 points better on the 8th grade assessment with a mean raw score of 35.6. Students in the comparison schools also improved in the 2008 assessment, although to a lesser extent than BWLI students with only a 1.3 point difference. However, comparison school students scored higher on average than BWLI students in both assessments. Although 11% more students “passed” the MCAS Math exam in BWLI schools in 2008 than had in 2006, the average of BWLI students’ raw scores decreased from 33.1 in 2006 to 31.4 in 2008, a mean drop of 1.7 points. During this same period in the comparison schools, the average 8th grade student also scored 1.4 points lower on the 2008 MCAS Math assessment than they had two years previously on the 2006 MCAS Math assessment. As also observed for ELA performance, school averages were higher for the comparison students on both the 2006 and 2008 tests than across the BWLI settings. Lastly, Figure 5 additionally shows the average performance for 1:1 and compar-ison school populations with the 143 Special Education students excluded from the analyses. The observed net gains in 2008 scores for BWLI stu-dents were diminished in both the ELA and Math subject tests when the special education students were excluded from the statistical analyses. In other words, the 1:1 population as a whole saw larger net gains in both ELA and Math when special education students were kept in the 2006 and 2008 test analyses.
To summarize, pilot students averaged a net gain in ELA scores during their two years of 1:1 laptop experience. However, so did the students in the comparison group who had only limited computer access and resources. In Math, BWLI students’ averaged lower scores on the 2008 assessment after two years of 1:1 computing (a net loss), but then again, so did the students in the comparison schools. So, to better determine if the impact on student achievement over the two years of 1:1 participation for the 8th grade pilot students was greater than the differences observed for com-parison school students during the same time period, we will statistically assess how much of the net change in student performance can be possibly attributed to 1:1 participation and experiences.
Student level regression models were created for ELA and Math 2008 scores using nearly all 8th grade 1:1 and comparison students. Models were developed and analyzed to determine the overall program effect (i.e.

One to One Computing: A Summary of the Quantitative Results from BWLI Bebell & Kay
41
J·T·L·A
1:1 status) of BWLI participation on students’ test scores. Thus, the ELA regression model included 2008 MCAS ELA raw scores as the dependent variable, BWLI status as an independent variable, and 2006 MCAS ELA raw scores as a controlling variable. BWLI status was a dichotomous vari-able with 1 representing a 1:1 pilot participant and 0 representing a com-parison school student. The resulting equation for the 2008 8th grade ELA model was:
Predicted 2008 ELA MCAS = 0.764(2006 ELA MCAS) + 1.04(BWLI Status) + 9.83
The analyses found that the coefficients for both prior achievement (i.e. 2006 ELA score) and participation in the pilot program were statisti-cally significant (p < .0005 for the ELA 2006 and p = .006 for BWLI). In other words, the increase in ELA scores for 1:1 pilot students was statis-tically significant compared to the increase in scores observed for com-parison students. Thus, after controlling for prior achievement we can conclude that the statistically significant difference observed in 1:1 pilot students’ 2008 ELA test performance was not present for the comparison students.
In addition, the current analyses also sought to look more specifically at the relationship, if any, between BWLI students’ use of computers during their 8th grade year and their 2008 ELA performance. To this end, any of the student technology use variables that had statistically significant cor-relations with the ELA MCAS scores (Table 11) were entered into the 2008 ELA achievement regression model. Specifically, the following technology use variables and scales were examined:
• StudentcomputeruseinSocialStudies
• StudentcomputeruseinScience
• Presentinformationusingcomputersscale(present)
• Recreationalhomeusescale(recreation)
• Studentperceivedabilitiesscale(ability)
The resulting regression equation was:
Predicted 2008 ELA MCAS = 0.76(2006 ELA MCAS) – 0.004(use in Social Studies) – 0.018(use in Science) + 0.238(present) + 0.62(recreation) + 0.23(ability) + 12.12
Overall, this model accounted for 61% of the variance in 2008 ELA scores across all 1:1 8th grade students, however a great deal of this vari-ance was explained solely by the 2006 scores. Specifically, after accounting for prior MCAS scores (p < .0005) two of the student technology-use pre-dictors: student computer use in science class (p = .003) and student recreation

One to One Computing: A Summary of the Quantitative Results from BWLI Bebell & Kay
42
J·T·L·A
home use of computers (p = .013) were observed to exhibit statistically sig-nificant coefficients.
First, a negative statistically significant relationship was found between students’ frequency of computer use in Science class and their ELA achievement, even after controlling for past achievement levels and all other variables within the model. In other words, students who reported more frequent use of computers in their Science classes were found to be actually less likely to perform better on the 2008 ELA MCAS then those students who used technology less frequently in Science during their 2007–2008 8th grade year.
In addition, a positive statistically significant relationship was also found between students’ recreational home use of computers and their ELA achievement, even after controlling for past achievement levels. In other words, students who reported more frequent use of computers for recreation at home were actually more likely to perform better on the 2008 ELA MCAS than those students who used technology less frequently for recreation at home. To provide a clearer idea of what types of student com-puter uses comprised the recreational home use scale, the original four survey items comprising the scale included students’ use of a computer to search the Internet for fun, create music or video projects, download music or videos, and shop online. Given that student home access and use appeared largely independent of students’ experience in 1:1 program, it was theorized that the relationship between recreational home use and ELA achievement may actually be an artifact of students’ socio-economic status (SES), which was previously observed to be a major correlate of student level 2008 ELA MCAS performance. In fact, the impact and sig-nificance of students’ recreation home use of computers was completely diminished when we statistically controlled students’ socio-economic status, as measured by the SES scale. Thus, the positive impact associated with home recreational use and variance accounted for in the 2008 ELA model was a by-product of students’ socio-economic status. This result suggests that when students’ SES is statistically controlled, as well as their 2006 scores, there was no difference in the impacts of recreational home computer use on 2008 ELA achievement.
None of the other individual or scaled student technology uses were found to be statistically significant in the ELA model, once prior achieve-ment scores were controlled.
Eighth grade student results were also examined for Math achieve-ment. The Math regression model included 2008 MCAS Math raw scores as the dependent variable, BWLI status as an independent variable and 2006 MCAS Math raw scores as the controlling variable. Again, BWLI status was a dichotomous variable with 1 representing a 1:1 pilot participant and 0

One to One Computing: A Summary of the Quantitative Results from BWLI Bebell & Kay
43
J·T·L·A
representing a comparison school student. The resulting equation for the 2008 8th grade Math model was:
Predicted 2008 Math MCAS = 0.77(2006 Math MCAS) + 0.75(BWLI Status) + 7.05
As expected, students’ prior MCAS scores continued to be a major sta-tistically significant predictor variable of 2008 MCAS scores (p < .0005). However, students’ participation in the pilot program was not a statisti-cally significant predictor of the 2008 MCAS scores (p = .086), when stu-dents’ prior (pre-1:1) scores were also taken into account, as had been observed for ELA performance. Thus, there was no statistically significant relationship found between students’ participation in two years of a 1:1 computer program and Math standardized test performance.
In addition, the current analyses also sought to look more specifically at the relationship, if any, between BWLI students’ use of computers and Math performance. To this end, any scales or variables that had significant correlations with the BWLI Math MCAS scores (Table 11) were entered into the Math regression model below. In addition, since the correlation between BWLI students’ 2008 MCAS Math performance and multimedia home use was very close to statistically significant, it was included in regression model as well. In total, the following technology use variables and scales were examined:
• StudentcomputeruseinReading/ELA
• StudentcomputeruseinMath
• Writingandresearchatschoolscale(writing)
• Presentinformationusingcomputersscale(present)
• Multimediauseathomescale(multimedia)
• Recreationalhomeusescale(recreation)
• Studentperceivedabilitiesscale(ability)
The resulting regression equation was:
Predicted 2008 Math MCAS = 0.85(2006 Math MCAS) + 0.016(use in Reading/ELA) + 0.028(use in Math) – 0.304(writing) – 0.289(present) + 0.528(multimedia) + 0.607(recreation) + 0.030(ability) + 2.79
Overall, this model accounted for 43% of the variance in 2008 Math scores across all BWLI 8th grade students, however the great majority of this variance was explained solely by the prior test scores. Specifically, across all of these predictor variables, only the 2006 Math raw scores (p < .0005) was found to be a statistically significant predictor. The variable student use of computers in Math class approximated a statistically signifi-

One to One Computing: A Summary of the Quantitative Results from BWLI Bebell & Kay
44
J·T·L·A
cant coefficient with 2008 Math performance outcomes (p =. 09), but fell just outside the established criteria for statistical significance.
In conclusion, the statistical analyses of student-level MCAS results revealed some positive, yet far from conclusive, results on the impacts of the 1:1 pilot program on student learning as measured by the state standard-ized assessment. In terms of overall program impacts, 1:1 student score increases across 1:1 settings were found to be statistically greater than increases in the non-1:1 settings for ELA achievement but not for Math during the final two years of the 1:1 implementation. When examining the specific relationships between the pilot students use of technology in school and at home, nearly all of the individual and scaled technology use measures failed to result in statistically significant relationship on the ELA or Math scores, once student prior achievement was accounted for.
In this analysis of school level and student achievement data, we have explored the impact of 1:1 participation on student achievement using the state standardized assessment as a common metric of student performance across 1:1 and comparison settings. However, the educational technology literature and the models themselves suggest that perhaps the MCAS may not be the most sensitive or appropriate measure of student achievement in the 1:1 settings. To more fully explore the limitations of the MCAS as an outcome measure, we conclude our analyses of student achievement with the results of a randomized computer writing study conducted across all seventh grade 1:1 pilot classrooms in Spring 2008.
Computer Writing Study Results
In an attempt to get a better understanding of the relationship of 1:1 computing and student technology uses on student achievement, the research team devised and carried out a study of students’ writing ability. As summarized in the Methodology section, the BWLI computer writing study randomly assigned all 7th grade 1:1 students to complete a realistic MCAS extended writing test over two 45-minute sessions in Spring 2008. A total of 388 essays were collected from students in the “computer” environment while 141 essays were collected on paper before being transcribed and scored by a team of trained readers. A summary of student performance across the computer and paper testing conditions is presented below in Table 13 (next page).

One to One Computing: A Summary of the Quantitative Results from BWLI Bebell & Kay
45
J·T·L·A
Table 13: Comparison of 7th Grade Results for Students Completing an MCAS Essay Using Their Laptop or Traditional Paper/Pencil
# of students
Topic Score
Conventions Score
Word Count
Computer 310 7.2 5.6 388
Paper 141 6.6 5.3 302
Table 13 shows after two years of 1:1 computing in school, 7th graders participating in the computer writing study wrote both longer and more highly scored open response essays when using their laptops than stu-dents responding to the same prompt using traditional paper and pencil. To control for any pre-existing differences between the computer and paper students, seventh grade open response scores from the “official” paper/pencil ELA MCAS (Spring 2008) were used as a covariate to account for students writing ability in a traditional testing environment. Using a general linear model, we statistically controlled for paper-tested writing scores while evaluating the impact of computer use in testing conditions that allowed students to use their laptop and word processor rather than paper and pencil.
When controlling for students’ respective performances on the paper/pencil MCAS writing assessment, both the Topic Development and Standard English Conventions score difference observed between laptop students and paper/pencil students were found to be statistically signifi-cant. Specifically, after controlling for students’ Topic Development score on the 2008 paper/pencil MCAS, students’ Topic Development score was substantially higher for those students who completed the essay using their laptop than for the paper students (F = 4.79, sig. .029 Adjusted r2 = .203). After controlling for Standard English Conventions score on the 2008 paper-based MCAS, students’ Standard English Conventions score was also greater for those students who completed the essay using their laptop than for the paper students (F = 4.67, sig. .031, Adjusted r2 = .122). Given these results, it is clear that pilot students, after using a laptop across their sixth and seventh grade years of middle school, performed better across both writing scales when allowed to complete the writing assessment using their BWLI computers.
Lastly, after controlling for Standard English Conventions score on the 2008 paper MCAS (word count is not counted on the official MCAS), the number of words students composed was still found to be substantially greater for those who completed the essay using their laptop than using traditional paper and pencil (F = 19.95, sig. <.001, Adjusted r2 = .256). Specifically, students who completed the writing assessment using their

One to One Computing: A Summary of the Quantitative Results from BWLI Bebell & Kay
46
J·T·L·A
laptop produced an average of 388 words compared to 302 words for the essays composed on paper across all BWLI settings.
These results highlight the challenges of measuring the impact of stu-dents and schools where technology has been adopted and widely used. These results also suggest that increasingly tech-savvy students may be at a considerable disadvantage to demonstrate their writing ability on offi-cial state assessments, which are exclusively paper and pencil. Obviously, further complications are likely when the paper/pencil state test results are used to demonstrate the effectiveness of investments and programs involving computer based technologies.
DiscussionIn school, it is important to keep kids informed and ready for the real world and the work force, and computers are becoming a very important part of our world. It is important that we know how to use a computer so that when we reach the workforce and higher levels of education, we are not struggling to keep up. Also, using computers in school is a great way to keep kids focused and ready to learn, and keep people interested in the education they are receiving. Computers, especially laptops, are our links to an ever-expanding world of technology, and it is important to know how to connect to this world easily, which having laptops allows us to do.
–8th grade Female Student Herberg Middle School, Pittsfield, MA Comment on June 2008 student survey
As educational theorist and critic Larry Cuban and others have demon-strated, educational technology use in typical school environments (where technology resources are shared) has typically resulted in sporadic and limited use, particularly when considering teachers’ direct instructional use and students’ use (Cuban, 2001). Consequently perhaps, the impacts of various technologies in education have been slow to emerge. One of the earliest findings emerging from the pioneering 1:1 settings (the first 1:1 student laptop program was launched in 1989 in Sydney, Australia) was that teachers’ and students’ use of technology increased exponen-tially. This dramatic increase in computer use is obviously related to the increased access and resources when technology is no longer shared, as well as the leadership and vision of these early adopting educational set-tings. However, with technology actually being used with some regularity it is possible to begin to realistically assess how different uses may impact teaching and learning.

One to One Computing: A Summary of the Quantitative Results from BWLI Bebell & Kay
47
J·T·L·A
The purpose of the BWLI program and this subsequent research has been to determine the impacts of a 1:1 pilot program on reforming teaching and learning practices across five varied middle school settings. Although the implementation and outcomes across each participating school varied, it is clear from the current investigation that 1:1 computing holds major promise for impacting the lives of teachers and students in meaningful ways, which may lead to many positive outcomes. Specifically, the current investigation was principally concerned with documenting the four targeted program objectives identified before the pilot program was launched in 2005: fundamental shifts in teaching practices, enhanced stu-dent achievement, improved student engagement, and enhanced student research and collaboration. Of specific interest within our study has been the way teachers transformed their teaching practices to accommodate technology and how these changes enhanced student engagement and learning. Within this context, the various methodological approaches and subsequent statistical results reveal that teaching and learning were indeed impacted across the vast majority of pilot classrooms. However, as would be expected from any pilot program employed across dozens of classrooms in five unique middle school environments, the degree of adoption, use, and subsequent realization of positive outcomes varied across and within settings.
As summarized in the Introduction and Background sections of this paper, past research and evaluation on the impacts of 1:1 computing have generally focused on similar academic outcomes (Penuel, 2006). However, given that 1:1 computing is still in its infancy and that few of the largest programs have had serious resources invested in evaluation and research efforts, there is still a great deal to learn about 1:1 laptop computing pro-grams. Like studies in New Hampshire (Bebell, 2005), Maine (Silvernail, 2008), Texas (Shapleigh, 2008), and Colorado (Zucker and Hug, 2008), the Massachusetts results from the pilot program suggest that 1:1 computing can dramatically and radically change teaching and learning practices. There is little question that the student and teacher laptops, in addition to the increased professional development, support, and organizational structure provided through the Berkshire Wireless Learning Initiative, truly changed teaching and learning conditions for the majority of stu-dents and teachers in these settings. Specifically, after three years of imple-mentation we witnessed a marked change in teaching and learning in the participating schools. The consensus of the participants (school leaders, teachers, and students) was overwhelmingly positive towards these educa-tional opportunities afforded through increased educational technology. As observed years earlier in the New Hampshire pilot program, it was very soon in the deployment process that teachers and students began incor-porating technology into their lessons. This may suggest that 1) teachers

One to One Computing: A Summary of the Quantitative Results from BWLI Bebell & Kay
48
J·T·L·A
and students felt ready for change and 2) the majority viewed educational technology as an improvement over existing practices.
The proponents of educational technology and 1:1 programs believe there is potential to radically change the teaching and learning practices (and even classroom structure) via the adoption and use of 1:1 computing, much the same way other areas of our culture (communication, enter-tainment, etc) have been transformed through PCs, e-commerce, and the Internet. Indeed, many of the early visionaries of the 1:1 computing “movement” have pointed to outcomes and results that go well beyond the scope of most educational initiatives. Maine Governor Angus King, who launched the nation’s first statewide 1:1 laptop program, for example, promoted the Maine Learning Technology Initiative as an important com-ponent of Maine’s economic development initiative. Educational theo-rist and author Seymour Papert argued over 30 years ago that providing students with powerful technologies could and will change the nature of how students actually think and retain information. Similarly, today’s stu-dents, as evidenced by their frequency of home computer use, have quickly embraced computer technologies across numerous aspects of their lives. Indeed, students’ expectations for computers and their seemingly natural abilities to assimilate technology are so great that it can even be discon-certing to teachers and parents. For example, the recent explosion in pop-ularity of websites such as Facebook and mySpace for social networking and communication amongst middle and high school students cannot be exaggerated. Albeit the targeted objectives assessed in the current pilot program were somewhat more conservative by nature, 1:1 computing, given its ubiquitous nature and the ever-increasing power and adaptation of computing technologies, continues to represent a strong departure from the status quo and existing educational practices in most public middle schools. As documented specifically in the analyses of student and teacher practices and attitudes across the five pilot settings, not every teacher was willing or interested to experience a “radical shift” in their pedagogy and practices as the majority of their students seemed to be.
It is impossible to overstate the power of individual teachers in the success or failure of 1:1 computing. It is critically important to appreciate the pivotal role that classroom teachers play in the success of 1:1 com-puting. Looking across all of the available data, it is clear that teachers nearly always control how and when students access and use technology during the school day. In addition, teachers must make massive invest-ments in time and effort to adapt their teaching materials and practices to make the 1:1 environment effective and relevant. With the adoption of the BWLI program, teachers were asked to change their existing practices and integrate technology across all aspects of their professional lives. As such, these results suggest that the burden of change is often greater for teachers than for any other participants in a 1:1 initiative.

One to One Computing: A Summary of the Quantitative Results from BWLI Bebell & Kay
49
J·T·L·A
In each of the 1:1 settings, there remained a small number of teachers who were reluctant to change their “tried and true” pre-1:1 teaching prac-tices. In a few of these instances, school principals inferred that the BWLI program may have even led a few veteran teachers to decide to retire a little earlier than they may have originally scheduled. However, the potential changes in pedagogical approach and resources afforded by 1:1 computing also served to attract and excite both existing and incoming teachers. In nearly every pilot middle school, principals expressed pleasure at the excitement of incoming teacher applicants, many of whom commented specifically in their applications and job interviews that they were espe-cially attracted to the school for its 1:1 program. Although the emphasis in the current study was not to determine how and why the majority of teachers exhibited enthusiasm for 1:1 computing while others were decid-edly less inclined, further elucidation of the results are valuable.
Despite widespread increases in teacher and student technology use across the three years of the formal program implementation in the five par-ticipating 1:1 schools, there was no single subject area or grade level where technology uses were found to be universally more widespread or univer-sally unused. In other words, no single subject area received universal high or low use across more than a couple of schools. Similarly, although pilot students generally reported using computers to “find information on the Internet”, “take notes in class” and “access a teacher’s website” as among the most frequently occurring student uses in each setting, notable differ-ences were also observed across the student computer uses in each of the individual pilot settings. Furthermore, throughout a school day, a student during the second or third year of the program could easily go through the day without ever using their laptop if none of their teachers had a “laptop lesson” prepared. Similarly, a student in different classes with different teachers could use their laptop throughout the day within the same grade level and school setting. Taken collectively, we can conclude that it was fac-tors within each school setting which played a larger role in the adoption and use of technology than factors related to trends across subject areas or grade level. Survey data, as well as the additional qualitative data col-lected in these 1:1 schools, suggest that teachers’ adoption of technology is related to a number of factors. These factors include teachers’ beliefs and attitudes about pedagogy and the value of educational technology, ease of access to technology, quality and timeliness of technology support, pro-fessional development and training, as well as a school culture and leader-ship that values and promotes technology.
In previous research, it has been shown that teachers’ pedagogical phi-losophy and beliefs towards educational technology can strongly shape how likely teachers will be to adopt and use technology for different purposes in school (Bebell, Russell, & O’Dwyer, 2004; Russell, Bebell, O’Dwyer, &

One to One Computing: A Summary of the Quantitative Results from BWLI Bebell & Kay
50
J·T·L·A
O’Connor, 2003; Ravitz, Wong, & Becker, 1999). In every 1:1 pilot school there was a wide range of staff with varied beliefs and experiences con-cerning educational technology. Again, it was suggested that a minority of teachers reported to be very hesitant in changing what they regarded as their own time-tested and effective educational practices. However, just as we have collectively witnessed in popular culture over the past decade, the overwhelming sentiment towards the new technology was one of general acceptance and optimism. Again, as both the classroom observations and teacher survey data show, pilot teachers were very quick to begin making use of their BWLI laptops for a number of educational aims and purposes. Even before the student deployment had officially begun, the vast majority of pilot teachers had already incorporated a wide variety of regularly occurring new technology applications. The most frequent of these uses included preparing and researching lesson plans using the Internet and other computer-based resources. Teachers widely commented that they had suddenly and infinitely expanded their available curricular materials and teaching resources. Use of the new computers for communication also grew rapidly as teachers used email to communicate with leadership and other staff as well as with students and parents. Many teachers also devel-oped web sites for their classes, which typically served as repositories for student resources and digital curricular materials as well as organization and project based managerial sources for their classes. Teachers shared stories of assisting their students with homework via text/instant mes-saging.
Across most applications of technology, it was those teachers who adopted new uses for computers (particularly for direct instructional use), who also reported the most comfort and ability to use technology. In other words, across pilot settings, it was those teachers who adopted and frequently used technology for various aspects of their teaching who more highly rated the value of technology than those teachers who used technology with less frequency. Thus, if teachers do not value technology first and therefore make fewer attempts to use it, they may never realize the educational benefits that those teachers who more frequently use technology consistently cite. These cyclical results perhaps suggest that increased use of technology by teachers led to teachers’ increased valua-tions for technology while teachers who valued technology less, used it less, and therefore observed fewer positive outcomes. Hence, the impor-tance of professional development and support, both of which teachers reported were most beneficial when the focus was shared between tech-nology mechanics (i.e. learning new applications, software) and the inte-gration of meaningful technology into the curriculum.
There is also a fairly common assumption in education that new gen-erations of teachers will promote and master the use of educational tech-

One to One Computing: A Summary of the Quantitative Results from BWLI Bebell & Kay
51
J·T·L·A
nology in the classroom given their personal exposure to technology while growing up. Research from non-1:1 settings as well as observations across the pilot settings, suggests this assumption is only partially true. It was observed that in general the younger generation of teachers most quickly adopted and applied technology resources to support their teaching with widespread use of computers to research lesson plans and communicate with professional peers. However, teachers’ age was largely unrelated to use of technology for instructional purposes and with students in class, and we found that newly hired teachers often took a few years of acclima-tion before they were regularly using technology as a dominant instruc-tional tool and with their students.
Teachers’ access to technology resources also varied across the pilot settings in ways that likely impacted the frequency of teacher and student use as well as the program outcomes. Although all students and teachers were provided laptop computers and wireless learning environments, access to peripheral and supporting resources varied greatly across the three years of the project deployment and across the five school settings. The results suggest that in some cases, 1:1 student and teacher laptops were not always entirely adequate or sufficient for meeting the hardware and software needs of each teacher. For example, despite 1:1 student lap-tops, teachers noted obstacles when LCD projectors were not easily avail-able to them. Another example was a lack of printers available in some pilot schools. The point of such examples is that even when student and teacher computers were universally provided, there were numerous exam-ples when technology resources and equity issues still became obstacles in successfully transforming teaching and learning practices. Clearly, to those designing and managing 1:1 initiatives there are many consider-ations beyond teacher and student computers, all of which potentially impact the efficacy and outcomes of the program.
As the BWLI pilot program was implemented in five varied middle school environments, it is possible to consider the impacts of these dif-ferences on how the program was implemented as well as what outcomes were generated. Although the purpose of this paper does not allow for a definitive exploration of what factors were critical to the success of 1:1 computing, a number of naturally occurring differences across par-ticipating schools deserve greater scrutiny and attention. For example, school and district leadership led to differences in how the program was managed which seemed to then impact use and outcomes. For example, in one school, after the second year of implementation other priorities and obligations left the school without any clear leadership concerning the management and oversight of the pilot program. From a research perspec-tive, it was noted that this was also the same school where teacher and student technology use was regularly lowest in the student and teacher

One to One Computing: A Summary of the Quantitative Results from BWLI Bebell & Kay
52
J·T·L·A
surveys, underscoring the potential link between school-level leadership and 1:1 program outcomes.
As is the case with nearly all research of interesting and evolving edu-cational initiatives, perhaps as many questions are raised by the current examination as are answered. In describing his early enchantment and rich educational experiences resulting from his discovery of gears and trans-missions at age two, educational theorist and mathematician Seymour Papert warns of the challenge (or impossibility) of addressing and quanti-fying the potential educational effects and impacts of providing children with rich learning environments and tools. In the Preface to Mindstorms Papert writes: “If any ‘scientific’ educational psychologist had tried to “mea-sure” the effects of this encounter, he would probably have failed. It had pro-found consequences but, I conjecture, only many years later. A ‘pre- and post-‘ test at age two would have missed them” (Papert, 1993, p. xx). In many ways, the impacts of the rich learning environments afforded by the 1:1 pilot program are equally hard to consider and quantify, especially such a short time after the program was started. In both teacher surveys and principal interviews, the majority of faculty and leadership stated that the impacts of 1:1 computing may take many years to be realized.
It is especially important to consider that the current results are not without their own limitations. Given the exemplary participation rates for each year of data collection, the emphasis of the current investiga-tion relies upon quantitative data collection techniques (student surveys, teacher surveys, student achievement analyses) whereby it is possible to determine how representative or widespread any finding or result may be across all participants. The site visit data summarized in the current paper (classroom observations, teacher interviews and principal/school leader-ship interviews) does not provide much indication as to how widespread or universal the observations or the sentiments expressed in the inter-views may actually be across all the BWLI classrooms and schools. Thus, to maximize the validity of the evaluation results, multiple data sources were employed to address each of the targeted learning outcomes.
The response rates from the BWLI teacher and student surveys were generally excellent allowing us to place more confidence in the assertion that the data presented herein adequately and properly represents the use and beliefs of the BWLI students and teaching staff. However, when con-sidering the “final” Year 3 results, it is also important to remember that responding students in June 2008 had been in a 1:1 setting for only two years or less. Similarly, it is important to consider that for the majority of the teacher respondents, the final June 2008 teacher survey was com-pleted after less than two years of participation in 1:1 student computing. Only seventh grade teachers had more than two years of 1:1 experience
One to One Computing: A Summary of the Quantitative Results from BWLI Bebell & Kay
53
J·T·L·A
when the final rounds of the survey were collected. As such, it is important to remember that many of the teacher survey respondents may be drawing only on their initial experiences when addressing these issues. However, given that BWLI teachers are in one of the best positions to observe the effects of the program, they are equally one of the best sources of infor-mation for investigating its impact and current data provides an excellent examination of teachers’ beliefs and experiences in newly developed 1:1 settings.
As the opening quote in the Introduction by Papert warns, the long term impacts and effects of providing students with new learning tools and environments can be extremely difficult or impossible to quantify. Given the thirty-six month study timeline, only the immediate and short-term outcomes of the program can be addressed to suggest the possibility of the long-term impacts of providing teachers and students with tech-nology resources. These long-term effects, however, cannot be understood without the quantification and documentation of technology use in the short term. Again, before any of the proposed benefits of an educational technology can be explored, the research team must be able to document if technology use is actually occurring. While there is a strong desire to examine the impact of technology on student achievement, research sug-gests that the impacts on learning must first be placed in the context of teacher and student technology use (Bebell, Russell, & O’Dwyer, 2004). However, through the current pre/post comparison study of teaching and learning practices across BWLI schools, it is possible to begin to frame the potential long term impacts resulting for teachers and students from increased exposure to computer-based technologies.
Finally, one of the great challenges facing educators and policy makers with educational technology is the rapid pace at which technology resources are constantly evolving. For example, the cutting edge Apple iBooks pro-vided to all students and teachers at the beginning of the BWLI program, were showing the limitations of their age and amount of use by the second year of the program. Particularly for those teachers who became heavily invested in using their computer, the limitations of memory, hardware, and software were realized. In short, technology resources often have a particularly short shelf life compared to traditional educational resources. If the pilot program was replicated at the time of this publication (Fall 2009), project and school leadership would likely be investigating tech-nologies that were largely unheard of four years ago, such as interactive white boards, and web-based productivity software and resources such as google docs. Further, national rhetoric since Barack Obama’s election in November 2008 suggests a growing degree of federal interest and support for investments in educational technology resources while programs such as the One Laptop Per Child (OLPC) Foundation and Intel’s Classmate

54
One to One Computing: A Summary of the Quantitative Results from BWLI Bebell & Kay
J·T·L·A
PC have created considerable international attention for low energy, low cost student laptops as an educational and economic reform in some of the world’s emerging economies. Finally, we would be remiss to not men-tion that the increasing majority of students themselves in recent years have quickly adopted and widely employ technology across all aspects of their personal lives, from multi function cell phones to the emerging ways students are using Internet resources for communication, recreation, and entertainment. This increasing gap between students and educators has even led some to adopt the term “digital native” to describe just how dif-ferently today’s students relate, think, and apply technology to their world than those of prior generations who were not raised in a computer age (Prenksy, 2006).
For most participants and close observers of the initiative, the general observation has been that the program has had many far reaching and positive educational impacts, but not all of these impacts were realized universally across all participants and schools. As such, the results of this program do not address the actual potential of 1:1 computing as much as they speak to one specific implementation of a 1:1 program in five varied middle school settings. In other words, the study results should not be viewed as a definitive assessment of 1:1 computing and educational tech-nology, but an example of the potential of 1:1 computing as implemented through a program that brought 1:1 resources into five middle school set-tings from 2005 to 2008.
In conclusion, the current study found many positive educational impacts resulting from participation in 1:1 computing program. From these results, it is easy to conclude that the potential of 1:1 student and teacher computing holds major promises for transforming teaching and learning, although there are many clear and notable obstacles. It is also challenging to predict how technology itself will change in the future and how the educational needs of increasingly tech-savvy students will be met by future educators.

One to One Computing: A Summary of the Quantitative Results from BWLI Bebell & Kay
55
J·T·L·A
Endnotes1. Zucker and Light (2009) provide a recent summary of costs and expenses
associated with 1:1 laptop programs.
2. St Joseph represented a particularly unusual study site. After the beginning of the BWLI, the parochial schools of Pittsfield restructured their original participating school (St. Mark) so that all their 8th graders were moved to St. Joseph, an established 9–12 school. Given this late restructuring, the administration and faculty at St. Joseph were substantially less involved in the development and implementation of the 1:1 program than any of other original 1:1 schools.
ReferencesBaldwin, F. (1999). Taking the classroom home. Appalachia, 32(1), 10–15.
Bessette, H.J. (2008). Using students’ drawings to elicit general and special educators’ perceptions of co-teaching. Teaching and Teacher Education, 24 (1376–1396).
Bebell, D. (2008). Berkshire Wireless Learning Initiative: Year 2 Annual Report. Boston, MA: Technology and Assessment Study Collaborative, Boston College. Retrieved August 26, 2008 from: http://www.bc.edu/research/intasc/researchprojects/bwli/pdf/BWLI_Year2_Report.pdf.
Bebell, D. (2005). Technology Promoting Student Excellence: An Investigation of the first year of 1:1 computing in New Hampshire Middle Schools. Boston, MA: Technology and Assessment Study Collaborative, Boston College. Retrieved August 26, 2008 from: http://www.bc.edu/research/intasc/researchprojects/nhLaptop/nhtpse.shtml.
Bebell, D. (2001). 1000words: What can we learn from middle school students’ classroom drawings? Paper presented at the annual meeting of the New England Educational Research Organization, Northhampton, MA, April 2001.
Bebell, D. & Kay, R.E. (2009). Berkshire Wireless Learning Initiative: Final Evaluation Report. Boston, MA: Technology and Assessment Study Collaborative, Boston College. Retrieved June 15, 2009 from: http://www.bc.edu/research/intasc/researchprojects/bwli/pdf/BWLI_Year3Report.pdf.
Bebell, D. & Russell, M. (2006). Revised Evaluation Plan for Berkshire Wireless learning Initiative. Boston, MA: Boston College, Technology and Assessment Study Collaborative.
Bebell, D., Russell, H., & O’Dwyer, L.M. (2004). Measuring teachers’ technology uses: Why multiple-measures are more revealing. Journal of Research on Technology in Education, 37(1), 45–63.

One to One Computing: A Summary of the Quantitative Results from BWLI Bebell & Kay
56
J·T·L·A
Bull, G., Bull, G., Garofolo, J., & Harris, J. (2002). Grand Challenges: Preparing for the Technological Tipping Point. The International Society for Technology in Education (ISTE). Retrieved May 7, 2004, from: http://www.iste.org/L&L/29/8/featured-article/bull/index.htm.
Cromwell, S. (1999). Laptops change curriculum—and students. Education World. Retrieved November 6, 2003 from: http://www.education-world.com/a_curr/curr178.shtml.
Cuban, L. (2006, October 18). Commentary: The laptop revolution has no clothes. Education Week, p. 29.
Cuban, L. (2001). Oversold and Underused: Reforming Schools Through Technology, 1980–2000. Cambridge MA: Harvard University Press.
Dunleavy, M. & Heinecke, W.F. (2007). The impact of 1:1 laptop use on middle school math and science standardized test scores. Computers in the Schools, 24(3/4), 7–22.
eSchool News. (2006, May 1). 1-to-1 computing on the rise in schools. eSchool News Online. Retrieved June 1, 2006, from: http://www.eschoolnews.com/news/showstory.cfm?ArticleID=6278.
Guignon, A. (1998). Laptop computers for every student. Education World. Retrieved November 6, 2003, from: http://www.education-world.com/a_curr/curr048.shtml.
Gulek, J.C. & Demirtas, H. (2005). Learning with technology: The impact of laptop use on student achievement. Journal of Technology, Learning, and Assessment, 3(2).
Hayes, J. (2006). America’s digital schools; 2006: A five-year forecast. Retrieved April 9, 2006 from: http://www.ads2006.org/ads2006/ pdf/ADS2006KF.pdf.
Maine Education Policy Research Institute (MEPRI). (2003). The Maine Learning Technology Initiative: Teacher, Student, and School Perspectives Mid-Year Evaluation Report. Retrieved November 6, 2003 from: http://www.usm.maine.edu/cepare/pdf/ts/mlti.pdf.
Massachusetts Department of Education. (2008). Ensuring Technical Quality: Policies and Procedures Guiding the Development of the MCAS Tests. Malden, MA: Massachusetts Department of Elementary and Secondary Education. Accessed January 15, 2008 from: www.doe.mass.edu/mcas/2008/release/technical_quality.doc.
McNabb, M., Hawkes, M., & Rouk, U. (1999). Critical issues in evaluating the effectiveness of technology. Proceedings of the Secretary’s Conference on Educational Technology: Evaluating the Effectiveness of Technology. Retrieved January 10, 2003 from: http://www.ed.gov/Technology/TechConf/1999/confsum.html.

One to One Computing: A Summary of the Quantitative Results from BWLI Bebell & Kay
57
J·T·L·A
O’Dwyer, L.M., Russell, M., Bebell, D., & Tucker-Seeley, K.R. (2005). Examining the relationship between home and school computer use and students’ English/language arts test scores. Journal of Technology, Learning, and Assessment, 3(3). Retrieved September 27, 2008 from: http://www.jtla.org.
O’Dwyer, L.M., Russell, M., Bebell, D., & Seeley, K. (2008). Examining the Relationship between Students’ Mathematics Test Scores and Computer Use at Home and at School. Journal of Technology, Learning, and Assessment, 6(5). Retrieved September 27, 2008 from: http://www.jtla.org.
Oppenheimer, T. (2003). The flickering mind: The false promise of technology in the classroom and how learning can be saved. New York, NY: Random House.
Papert, S. (1992). The children’s machine. New York, NY: Harper Collins.
Papert, S. (1993). Mindstorms: Children, computers, and powerful ideas. 2nd ed. New York: Basic Books.
Papert, S. (1996). The connected family: Building the digital general gap. Atlanta, GA: Long Street Press.
Penuel, W.R. (2006). Implementation and effects of one-to-one computing initiatives: a research synthesis. Journal of Research on Technology in Education, 38(3).
Prensky, M. (2006). Don’t bother me mom, I’m learning! St. Paul, MN: Paragon House Publishers.
Ravitz, J., Wong, Y., & Becker, H. (1999). Teacher and teacher directed student use of computers and software. Irvine, CA: Center for Research on Information Technology and Organizations.
Rockman, S. (1998). Powerful tools for schooling: Second year study of the laptop program. San Francisco, CA: Author.
Russell, M. (1999). Testing Writing on Computers: A Follow-up Study Comparing Performance on Computer and on Paper. Education Policy Analysis Archives, 7(20). Available: http://epaa.asu.edu/epaa/v7n20/.
Russell, M., Bebell, D., Cowan, J., & Corbelli, M. (2003). An AlphaSmart for each student: Does teaching and learning change with full access to word processors? Computers and Composition. 20, 51–76.
Russell, M., Bebell, D., & Higgins, J. (2004). Laptop Learning: A comparison of teaching and learning in upper elementary equipped with shared carts of laptops and permanent 1:1 laptops. Journal of Educational Computing Research. 30(3), 313–330.

58
One to One Computing: A Summary of the Quantitative Results from BWLI Bebell & Kay
J·T·L·A
Russell, M., Bebell, D., O’Dwyer, L.M., & O’Connor, K.M. (2003) Examining teacher technology use: Implications for pre-service and in-service teacher preparation. Journal of Teacher Education 54(4), pp. 297–310.
Russell, M. & Haney, W. (1997). Testing writing on computers: an experiment comparing student performance on tests conducted via computer and via paper-and-pencil. Education Policy Analysis Archives, 5(3). Available: http://epaa.asu.edu/epaa/v5n3.html.
Russell, M., O’Brien, E., Bebell, D., & O’Dwyer, L. (2003). Students’ beliefs, access, and use of computers in school and at home. Boston, MA: Boston College, Technology and Assessment Study Collaborative.
Russell, M. & Plati, T. (2001). Mode of Administration Effects on MCAS Composition Performance for Grades Eight and Ten. Teachers College Record, [Online]. Available: http://www.tcrecord.org/Content.asp?ContentID=10709.
Sandstrom, M. Bartini, M. and Bebell, D. (1998). Gender and Grade Differences in Internet Aggression: Development of the eBehavior Scale. Presented at the March 2008 Annual Meeting of the Society for Research on Adolescence, Chicago IL.
Shapley, K. (2008). Evaluation of the Texas Technology Immersion Pilot (eTxTIP): Year 2.
Results. Paper presented at the 2008 Annual Meeting of the American Educational Research Association, New York, NY.
Silvernail, D. (2008). Maine’s Impact Study of Technology in Mathematics (MISTM). Paper presented at the 2008 Annual Meeting of the American Educational Research Association, New York, NY.
Silvernail, D.L. & Lane, D.M. (2004). The impact of Maine’s one-to-one laptop program on middle school teachers and students. Maine Education Policy Research Institute (MEPRI), University of Southern Maine.
Wenglinsky, H. (1998). Does it compute? The relationship between educational technology and student achievement in mathematics. Princeton, NJ: Educational Testing Service Policy Information Center.
Zucker, A. and Hug, S. (2008). Teaching and Learning Physics in a 1:1 Laptop School. Journal of Science Education Technology. Vol. 17, No. 6, pp.586–594.
Zucker, A. and Light, D. (2009). Laptop Programs for Students. Science. Vol. 323, No. 5910, pp. 82-85.

59
One to One Computing: A Summary of the Quantitative Results from BWLI Bebell & Kay
J·T·L·A
Author BiographiesDamian Bebell is an Assistant Research Professor at Boston College’s
Lynch School of Education and a Research Associate at the Technology and Assessment Study Collaborative. Damian has been actively involved in the study of measurement issues concerning teachers and student use of technology and the emergence of 1:1 computing environments. Damian Bebell may be reached via email at [email protected].
Rachel Kay is a doctoral candidate in the Educational Research, Measurement, and Evaluation program at Boston College’s Lynch School of Education and a Research Associate at the Technology and Assessment Study Collaborative. Rachel has participated in numerous studies of educational technology and may be reached via email at [email protected].

Technology and Assessment Study CollaborativeCaroline A. & Peter S. Lynch School of Education, Boston College
www.jtla.org
Editorial BoardMichael Russell, Editor Boston College
Allan Collins Northwestern University
Cathleen Norris University of North Texas
Edys S. Quellmalz SRI International
Elliot Soloway University of Michigan
George Madaus Boston College
Gerald A. Tindal University of Oregon
James Pellegrino University of Illinois at Chicago
Katerine Bielaczyc Museum of Science, Boston
Larry Cuban Stanford University
Lawrence M. Rudner Graduate Management Admission Council
Marshall S. Smith Stanford University
Paul Holland Educational Testing Service
Randy Elliot Bennett Educational Testing Service
Robert Dolan Pearson Education
Robert J. Mislevy University of Maryland
Ronald H. Stevens UCLA
Seymour A. Papert MIT
Terry P. Vendlinski UCLA
Walt Haney Boston College
Walter F. Heinecke University of Virginia
The Journal of Technology, Learning, and Assessment